UNITED STATES
SECURITIES AND EXCHANGE COMMISSION
Washington, D.C. 20549
FORM N-CSR
CERTIFIED SHAREHOLDER REPORT OF REGISTERED
MANAGEMENT INVESTMENT COMPANIES
Investment Company Act file number | 811-04852 |
|
Victory Portfolios |
(Exact name of registrant as specified in charter) |
|
4900 Tiedeman Road, 4th Floor, Brooklyn, Ohio | | 44144 |
(Address of principal executive offices) | | (Zip code) |
|
Citi Fund Services Ohio, Inc., 4400 Easton Commons, Suite 200, Columbus, Ohio 43219 |
(Name and address of agent for service) |
|
Registrant’s telephone number, including area code: | 800-539-3863 | |
|
Date of fiscal year end: | December 31 | |
|
Date of reporting period: | June 30, 2018 | |
| | | | | | | | |
Item 1. Reports to Stockholders.

June 30, 2018
Semi Annual Report
Victory INCORE Investment Quality Bond Fund
Victory INCORE Low Duration Bond Fund
Victory High Yield Fund
Victory Tax-Exempt Fund
Victory High Income Municipal Bond Fund
Victory Floating Rate Fund
Victory Strategic Income Fund
www.vcm.com
News, Information And Education 24 Hours A Day, 7 Days A Week
The Victory Funds site gives fund shareholders, prospective shareholders, and investment professionals a convenient way to access fund information, get guidance, and track fund performance anywhere they can access the Internet. The site includes:
• Detailed performance records
• Daily share prices
• The latest fund news
• Investment resources to help you become a better investor
• A section dedicated to investment professionals
Whether you're a potential investor searching for the fund that matches your investment philosophy, a seasoned investor interested in planning tools, or an investment professional, www.vcm.com has what you seek. Visit us anytime. We're always open.
Table of Contents
Financial Statements | |
The Victory Fixed Income Funds | |
Victory INCORE Investment Quality Bond Fund | |
Schedule of Portfolio Investments | | | 4 | | |
Statements of Assets and Liabilities | | | 42 | | |
Statements of Operations | | | 45 | | |
Statements of Changes in Net Assets | | | 48-50 | | |
Financial Highlights | | | 56-59 | | |
Victory INCORE Low Duration Bond Fund | |
Schedule of Portfolio Investments | | | 11 | | |
Statements of Assets and Liabilities | | | 42 | | |
Statements of Operations | | | 45 | | |
Statements of Changes in Net Assets | | | 48-50 | | |
Financial Highlights | | | 60-63 | | |
Victory High Yield Fund | |
Schedule of Portfolio Investments | | | 18 | | |
Statements of Assets and Liabilities | | | 42 | | |
Statements of Operations | | | 45 | | |
Statements of Changes in Net Assets | | | 48-50 | | |
Financial Highlights | | | 64-67 | | |
Victory Tax-Exempt Fund | |
Schedule of Portfolio Investments | | | 23 | | |
Statements of Assets and Liabilities | | | 43 | | |
Statements of Operations | | | 46 | | |
Statements of Changes in Net Assets | | | 51-53 | | |
Financial Highlights | | | 68-70 | | |
Victory High Income Municipal Bond Fund | |
Schedule of Portfolio Investments | | | 27 | | |
Statements of Assets and Liabilities | | | 43 | | |
Statements of Operations | | | 46 | | |
Statements of Changes in Net Assets | | | 51-53 | | |
Financial Highlights | | | 71-73 | | |
Victory Floating Rate Fund | |
Schedule of Portfolio Investments | | | 31 | | |
Statements of Assets and Liabilities | | | 43 | | |
Statements of Operations | | | 46 | | |
Statements of Changes in Net Assets | | | 51-53 | | |
Financial Highlights | | | 74-77 | | |
Victory Strategic Income Fund | |
Schedule of Portfolio Investments | | | 37 | | |
Statements of Assets and Liabilities | | | 44 | | |
Statements of Operations | | | 47 | | |
Statements of Changes in Net Assets | | | 54-55 | | |
Financial Highlights | | | 78-81 | | |
1
Table of Contents (continued)
Notes to Financial Statements | | | 82 | | |
Supplemental Information | | | 99 | | |
Trustee and Officer Information | | | 99 | | |
Proxy Voting and Form N-Q Information | | | 102 | | |
Expense Examples | | | 102 | | |
Portfolio Holdings | | | 105 | | |
Privacy Policy (inside back cover) | |
2
The Funds are distributed by Victory Capital Advisers, Inc. Victory Capital Management Inc. is the investment adviser to the Funds and receives fees from the Funds for performing services for the Funds.
This report is not authorized for distribution to prospective investors unless preceded or accompanied by a current prospectus of the Victory Funds.
For additional information about any Victory Fund, including fees, expenses, and risks, view our prospectus online at www.vcm.com or call 800-539-3863. Read it carefully before you invest or send money.
The information in this semi annual report is based on data obtained from recognized services and sources and is believed to be reliable. Any opinions, projections, or recommendations in this report are subject to change without notice and are not intended as individual investment advice. Past investment performance of the Funds, markets or securities mentioned herein should not be considered to be indicative of future results.
• NOT FDIC INSURED • NO BANK GUARANTEE • MAY LOSE VALUE

Call Victory at:
800-539-FUND (800-539-3863)
Visit our website at:
www.vcm.com
3
Victory Portfolios
Victory INCORE Investment Quality Bond Fund | | Schedule of Portfolio Investments
June 30, 2018 | |
(Unaudited)
Security Description | | Principal
Amount | | Value | |
Asset Backed Securities (5.3%) | |
AmeriCredit Automobile Receivables Trust, Series 2017-2, Class B,
2.40%, 5/18/22, Callable 11/18/20 @ 100 (a) | | $ | 255,000 | | | $ | 250,734 | | |
Drive Auto Receivables Trust, Series 2017-3, Class B, 2.30%, 5/17/21,
Callable 10/15/20 @ 100 | | | 115,000 | | | | 114,649 | | |
Drive Auto Receivables Trust, Series 2017-1, Class B, 2.36%, 3/15/21,
Callable 7/15/20 @ 100 | | | 185,000 | | | | 184,771 | | |
DT Auto Owner Trust, Series 2017-2A, Class B, 2.44%, 2/15/21,
Callable 9/15/20 @ 100 (b) | | | 230,000 | | | | 229,527 | | |
DT Auto Owner Trust, Series 2017-3A, Class B, 2.40%, 5/17/21,
Callable 2/15/21 @ 100 (b) | | | 130,000 | | | | 129,432 | | |
Fairway Outdoor Funding LLC, Series 2012-1A, Class A2, 4.21%, 10/15/42,
Callable 10/15/18 @ 100 (a) (b) | | | 419,277 | | | | 419,907 | | |
Santander Drive Auto Receivables Trust, Series 2017-2, Class B,
2.21%, 10/15/21, Callable 7/15/20 @ 100 | | | 300,000 | | | | 298,061 | | |
Santander Drive Auto Receivables Trust, Series 2017-3, Class B,
2.19%, 3/15/22, Callable 1/15/21 @ 100 | | | 235,000 | | | | 231,891 | | |
Santander Retail Auto Lease Trust, Series 2018-A, Class B, 3.20%, 4/20/22,
Callable 3/20/21 @ 100 (b) | | | 225,000 | | | | 223,392 | | |
Total Asset Backed Securities (Cost $2,094,156) | | | 2,082,364 | | |
Collateralized Mortgage Obligations (2.2%) | |
Commercial Mortgage Trust, Series 2012-CR4, Class B, 3.70%, 10/15/45 (b) | | | 305,000 | | | | 298,842 | | |
GS Mortgage Securities Trust, Series 2012-GC6, Class B,
5.84%, 1/10/45 (a) (b) (c) | | | 250,000 | | | | 265,613 | | |
WF-RBS Commercial Mortgage Trust, Series 2012-C6, Class B, 4.70%, 4/15/45 | | | 300,000 | | | | 308,257 | | |
Total Collateralized Mortgage Obligations (Cost $929,809) | | | 872,712 | | |
Residential Mortgage Backed Securities (1.5%) | |
Ameriquest Mortgage Securities, Inc., Series 2003-5, Class A6, 4.03%, 4/25/33,
Callable 7/25/18 @ 100 (c) | | | 59,452 | | | | 59,452 | | |
Countrywide Home Loans, Inc., Series 2002-19, Class 1A1, 6.25%, 11/25/32,
Callable 7/25/18 @ 100 | | | 66,417 | | | | 66,417 | | |
Credit Suisse First Boston Mortgage Securities Corp., Series 2002-HE16,
Class M1, 3.41%, (LIBOR01M+132bps), 10/25/32, Callable 7/25/18 @ 100 (d) | | | 101,781 | | | | 103,321 | | |
GSR Mortgage Loan Trust, Series 2004-10F, Class 6A1, 5.00%, 9/25/34,
Callable 7/25/18 @ 100 | | | 16,992 | | | | 16,992 | | |
JPMorgan Mortgage Trust, Series 2016-4, Class A5, 3.50%, 10/25/46,
Callable 5/25/35 @ 100 (a) (b) (c) | | | 144,885 | | | | 143,316 | | |
JPMorgan Mortgage Trust, Series 2004-S2, Class 1A3, 4.75%, 11/25/19,
Callable 4/25/19 @ 100 (a) | | | 26,815 | | | | 27,218 | | |
Prime Mortgage Trust, Series 2004-2, Class A3, 5.25%, 11/25/19,
Callable 7/25/18 @ 100 (a) | | | 7,886 | | | | 7,886 | | |
Residential Funding Mortgage Securities I, Inc., Series 2005-S3, Class A1,
4.75%, 3/25/20, Callable 7/25/18 @ 100 (a) | | | 30,820 | | | | 30,820 | | |
Structured Asset Securities Corp., Series 2004-21XS, Class 2A6A,
5.24%, 12/25/34, Callable 7/25/18 @ 100 (a) (c) | | | 688 | | | | 701 | | |
See notes to financial statements.
4
Victory Portfolios
Victory INCORE Investment Quality Bond Fund | | Schedule of Portfolio Investments — continued
June 30, 2018 | |
(Unaudited)
Security Description | | Principal
Amount | | Value | |
Wells Fargo Mortgage Backed Securities Trust, Series 2005-2, Class 2A1,
4.75%, 4/25/20, Callable 7/25/18 @ 100 (a) | | $ | 12,607 | | | $ | 12,607 | | |
Wells Fargo Mortgage Backed Securities Trust, Series 2004-Y, Class 3A1,
3.74%, 11/25/34, Callable 7/25/18 @ 100 (a) (c) | | | 138,268 | | | | 138,268 | | |
Total Residential Mortgage Backed Securities (Cost $608,929) | | | 606,998 | | |
Corporate Bonds (37.6%) | |
Consumer Discretionary (4.2%): | |
Best Buy Co., Inc., 5.50%, 3/15/21, Callable 12/15/20 @ 100 (e) | | | 200,000 | | | | 209,350 | | |
BorgWarner, Inc., 4.63%, 9/15/20 (a) | | | 500,000 | | | | 512,770 | | |
Darden Restaurants, Inc., 3.85%, 5/1/27, Callable 2/1/27 @ 100 | | | 105,000 | | | | 101,204 | | |
Hasbro, Inc., 6.35%, 3/15/40 | | | 115,000 | | | | 126,225 | | |
Lear Corp., 3.80%, 9/15/27, Callable 6/15/27 @ 100 | | | 175,000 | | | | 164,217 | | |
Magna International, Inc., 3.63%, 6/15/24, Callable 3/15/24 @ 100 | | | 245,000 | | | | 244,175 | | |
NIKE, Inc., 3.88%, 11/1/45, Callable 5/1/45 @ 100 | | | 145,000 | | | | 140,354 | | |
SES Global Americas Holdings GP, 5.30%, 3/25/44 (b) | | | 135,000 | | | | 117,117 | | |
| | | | 1,615,412 | | |
Consumer Staples (1.5%): | |
Altria Group, Inc., 4.25%, 8/9/42 | | | 55,000 | | | | 51,305 | | |
Estee Lauder Cos., Inc., 4.15%, 3/15/47, Callable 9/15/46 @ 100 | | | 70,000 | | | | 71,660 | | |
Kerry Group Finance Services, 3.20%, 4/9/23, Callable 1/9/23 @ 100 (b) | | | 95,000 | | | | 92,760 | | |
Mead Johnson Nutrition Co., 4.60%, 6/1/44, Callable 12/1/43 @ 100 (a) | | | 120,000 | | | | 124,792 | | |
Reynolds American, Inc., 5.70%, 8/15/35, Callable 2/15/35 @ 100 | | | 122,000 | | | | 131,248 | | |
Tyson Foods, Inc., 3.55%, 6/2/27, Callable 3/2/27 @ 100 | | | 108,000 | | | | 102,109 | | |
| | | | 573,874 | | |
Energy (2.1%): | |
Dolphin Energy Ltd., 5.89%, 6/15/19 (b) | | | 123,000 | | | | 124,760 | | |
Enable Midstream Partners LP, 4.40%, 3/15/27, Callable 12/15/26 @ 100 | | | 165,000 | | | | 156,600 | | |
EQT Midstream Partners LP, 5.50%, 7/15/28, Callable 4/15/28 @ 100 | | | 135,000 | | | | 135,061 | | |
Exxon Mobil Corp., 4.11%, 3/1/46, Callable 9/1/45 @ 100 | | | 40,000 | | | | 40,580 | | |
Marathon Petroleum Corp. | |
6.50%, 3/1/41, Callable 9/1/40 @ 100 | | | 65,000 | | | | 75,812 | | |
5.85%, 12/15/45, Callable 6/15/45 @ 100 | | | 50,000 | | | | 53,437 | | |
Statoil ASA, 3.95%, 5/15/43 | | | 65,000 | | | | 61,959 | | |
Valero Energy Corp., 6.63%, 6/15/37 | | | 140,000 | | | | 168,184 | | |
| | | | 816,393 | | |
Financials (10.5%): | |
Aflac, Inc., 2.88%, 10/15/26, Callable 7/15/26 @ 100 | | | 185,000 | | | | 173,525 | | |
Alleghany Corp., 4.90%, 9/15/44, Callable 3/15/44 @ 100 | | | 120,000 | | | | 121,992 | | |
Bank of America Corp. | |
2.33%, (LIBOR03M+63bps), 10/1/21, Callable 10/1/20 @ 100 (d) | | | 130,000 | | | | 126,965 | | |
2.50%, 10/21/22, Callable 10/21/21 @ 100, MTN (e) | | | 285,000 | | | | 272,990 | | |
BB&T Corp., 2.75%, 4/1/22, MTN, Callable 3/1/22 @ 100 | | | 260,000 | | | | 254,189 | | |
Capital One Financial Corp., 4.20%, 10/29/25, Callable 9/29/25 @ 100 (e) | | | 290,000 | | | | 281,866 | | |
Cincinnati Financial Corp., 6.13%, 11/1/34 | | | 135,000 | | | | 160,826 | | |
Citigroup, Inc. | |
4.50%, 1/14/22 (a) | | | 165,000 | | | | 169,940 | | |
3.88%, (LIBOR03M+117bps), 1/24/39, Callable 1/24/38 @ 100 (d) (e) | | | 100,000 | | | | 91,090 | | |
See notes to financial statements.
5
Victory Portfolios
Victory INCORE Investment Quality Bond Fund | | Schedule of Portfolio Investments — continued
June 30, 2018 | |
(Unaudited)
Security Description | | Principal
Amount | | Value | |
JPMorgan Chase & Co. | |
3.38%, 5/1/23 (a) | | $ | 205,000 | | | $ | 200,174 | | |
5.60%, 7/15/41 | | | 115,000 | | | | 130,324 | | |
5.40%, 1/6/42 | | | 75,000 | | | | 83,205 | | |
KeyBank NA, 2.25%, 3/16/20 | | | 580,000 | | | | 571,909 | | |
KeyCorp, 2.90%, 9/15/20, MTN | | | 45,000 | | | | 44,631 | | |
Morgan Stanley | |
3.75%, 2/25/23 (a) | | | 300,000 | | | | 300,398 | | |
3.13%, 7/27/26, MTN | | | 205,000 | | | | 190,798 | | |
| SVB Financial Group | |
5.38%, 9/15/20 | | | 105,000 | | | | 109,377 | | |
3.50%, 1/29/25 | | | 205,000 | | | | 198,569 | | |
Synovus Financial Corp., 3.13%, 11/1/22, Callable 10/1/22 @ 100 | | | 140,000 | | | | 134,051 | | |
The Goldman Sachs Group, Inc., 2.35%, 11/15/21, Callable 11/15/20 @ 100 | | | 115,000 | | | | 110,711 | | |
UBS Group Funding Switzerland AG, 2.95%, 9/24/20 (a) (b) | | | 250,000 | | | | 247,490 | | |
Unum Group, 3.00%, 5/15/21, Callable 4/15/21 @ 100 (a) | | | 125,000 | | | | 122,988 | | |
Wells Fargo & Co., 4.90%, 11/17/45 (a) | | | 80,000 | | | | 79,536 | | |
| | | | 4,177,544 | | |
Health Care (4.4%): | |
Agilent Technologies, Inc., 3.05%, 9/22/26, Callable 6/22/26 @ 100 | | | 205,000 | | | | 187,106 | | |
Amgen, Inc., 4.40%, 5/1/45, Callable 11/1/44 @ 100 | | | 70,000 | | | | 66,912 | | |
Celgene Corp. | |
2.75%, 2/15/23, Callable 1/15/23 @ 100 | | | 70,000 | | | | 66,882 | | |
3.90%, 2/20/28, Callable 11/20/27 @ 100 | | | 125,000 | | | | 118,718 | | |
DENTSPLY Sirona, Inc., 4.13%, 8/15/21, Callable 5/15/21 @ 100 | | | 195,000 | | | | 196,801 | | |
Edwards Lifesciences Corp., 4.30%, 6/15/28, Callable 3/15/28 @ 100 | | | 120,000 | | | | 119,752 | | |
Express Scripts Holding Co. | |
2.25%, 6/15/19 (a) (e) | | | 210,000 | | | | 208,424 | | |
4.80%, 7/15/46, Callable 1/15/46 @ 100 (e) | | | 70,000 | | | | 66,662 | | |
Gilead Sciences, Inc. | |
4.40%, 12/1/21, Callable 9/1/21 @ 100 (a) | | | 465,000 | | | | 480,614 | | |
4.80%, 4/1/44, Callable 10/1/43 @ 100 | | | 85,000 | | | | 88,259 | | |
Humana, Inc., 3.95%, 3/15/27, Callable 12/15/26 @ 100 (e) | | | 155,000 | | | | 152,463 | | |
| | | | 1,752,593 | | |
Industrials (3.5%): | |
AerCap Ireland Capital Ltd., 3.75%, 5/15/19 (a) | | | 400,000 | | | | 402,248 | | |
Canadian National Railway Co., 3.20%, 8/2/46, Callable 2/2/46 @ 100 | | | 60,000 | | | | 51,869 | | |
Carlisle Cos., Inc., 3.50%, 12/1/24, Callable 10/1/24 @ 100 | | | 120,000 | | | | 115,117 | | |
Hexcel Corp., 3.95%, 2/15/27, Callable 11/15/26 @ 100 | | | 80,000 | | | | 78,264 | | |
IDEX Corp., 4.20%, 12/15/21, Callable 9/15/21 @ 100 | | | 235,000 | | | | 237,171 | | |
Kansas City Southern, 4.95%, 8/15/45, Callable 2/15/45 @ 100 | | | 75,000 | | | | 75,074 | | |
Snap-on, Inc., 4.10%, 3/1/48, Callable 9/1/47 @ 100 | | | 70,000 | | | | 70,209 | | |
Southwest Airlines Co., 2.75%, 11/16/22, Callable 10/16/22 @ 100 | | | 150,000 | | | | 145,631 | | |
Valmont Industries, Inc., 5.00%, 10/1/44, Callable 4/1/44 @ 100 (a) | | | 167,000 | | | | 158,465 | | |
| | | | 1,334,048 | | |
Information Technology (3.9%): | |
Activision Blizzard, Inc. | |
2.30%, 9/15/21, Callable 8/15/21 @ 100 (e) | | | 180,000 | | | | 173,966 | | |
4.50%, 6/15/47, Callable 12/15/46 @ 100 | | | 80,000 | | | | 77,198 | | |
See notes to financial statements.
6
Victory Portfolios
Victory INCORE Investment Quality Bond Fund | | Schedule of Portfolio Investments — continued
June 30, 2018 | |
(Unaudited)
Security Description | | Principal
Amount | | Value | |
Apple, Inc., 4.65%, 2/23/46, Callable 8/23/45 @ 100 | | $ | 98,000 | | | $ | 105,457 | | |
Applied Materials, Inc., 5.10%, 10/1/35, Callable 4/1/35 @ 100 | | | 127,000 | | | | 141,249 | | |
Cadence Design Systems, Inc., 4.38%, 10/15/24, Callable 7/15/24 @ 100 | | | 58,000 | | | | 58,738 | | |
Electronic Arts, Inc., 3.70%, 3/1/21, Callable 2/1/21 @ 100 (a) | | | 395,000 | | | | 398,641 | | |
Juniper Networks, Inc., 5.95%, 3/15/41 | | | 70,000 | | | | 71,618 | | |
NVIDIA Corp., 2.20%, 9/16/21, Callable 8/16/21 @ 100 | | | 85,000 | | | | 82,529 | | |
VMware, Inc. | |
2.30%, 8/21/20 (a) | | | 290,000 | | | | 283,576 | | |
2.95%, 8/21/22, Callable 7/21/22 @ 100 | | | 174,000 | | | | 166,889 | | |
| | | | 1,559,861 | | |
Materials (2.8%): | |
Fresnillo PLC, 5.50%, 11/13/23 (b) | | | 200,000 | | | | 206,794 | | |
Lyondellbasell Industries NV, 5.00%, 4/15/19, Callable 1/15/19 @ 100 (a) | | | 490,000 | | | | 494,895 | | |
Newcrest Finance Pty Ltd., 5.75%, 11/15/41 (b) | | | 95,000 | | | | 99,256 | | |
Rio Tinto Finance USA Ltd. | |
3.75%, 6/15/25, Callable 3/15/25 @ 100 (e) | | | 80,000 | | | | 80,457 | | |
5.20%, 11/2/40 | | | 50,000 | | | | 56,510 | | |
Vale Overseas Ltd., 6.25%, 8/10/26 | | | 170,000 | | | | 184,460 | | |
| | | | 1,122,372 | | |
Real Estate (0.6%): | |
Lexington Realty Trust, 4.25%, 6/15/23, Callable 3/15/23 @ 100 | | | 145,000 | | | | 142,647 | | |
National Retail Properties, Inc., 3.60%, 12/15/26, Callable 9/15/26 @ 100 | | | 90,000 | | | | 85,249 | | |
| | | | 227,896 | | |
Telecommunication Services (1.8%): | |
AT&T, Inc. | |
2.30%, 3/11/19 (a) | | | 500,000 | | | | 498,085 | | |
5.15%, 11/15/46, Callable 5/15/46 @ 100 (a) (b) | | | 226,000 | | | | 213,285 | | |
| | | | 711,370 | | |
Utilities (2.3%): | |
Arizona Public Service Co., 2.95%, 9/15/27, Callable 6/15/27 @ 100 | | | 120,000 | | | | 112,778 | | |
Consolidated Edison, Inc., 6.30%, 8/15/37 | | | 110,000 | | | | 138,734 | | |
Empresa Nacional de Electricidad SA, 4.25%, 4/15/24, Callable 1/15/24 @ 100 | | | 315,000 | | | | 312,978 | | |
Iberdrola International BV | |
6.75%, 9/15/33 | | | 35,000 | | | | 40,884 | | |
6.75%, 7/15/36 | | | 70,000 | | | | 88,570 | | |
Oklahoma G&E Co., 5.25%, 5/15/41, Callable 11/15/40 @ 100 | | | 105,000 | | | | 119,477 | | |
Public Service Enterprise Group, Inc., 4.00%, 6/1/44, Callable 12/1/43 @ 100 | | | 115,000 | | | | 111,967 | | |
| | | | 925,388 | | |
Total Corporate Bonds (Cost $15,262,191) | | | 14,816,751 | | |
Government National Mortgage Association (0.1%) | |
Multi-family (0.1%): | |
Collateralized Mortgage Obligations (0.1%): | |
Government National Mortgage Association | |
6.00%, 12/15/33 | | | 24,071 | | | | 26,541 | | |
Total Government National Mortgage Association (Cost $24,700) | | | 26,541 | | |
See notes to financial statements.
7
Victory Portfolios
Victory INCORE Investment Quality Bond Fund | | Schedule of Portfolio Investments — continued
June 30, 2018 | |
(Unaudited)
Security Description | | Shares or
Principal
Amount | | Value | |
U.S. Government Mortgage Backed Agencies (38.9%) | |
Federal Home Loan Mortgage Corp. | |
5.00%, 6/15/23 (a) | | $ | 43,391 | | | $ | 44,895 | | |
Series 4139, Class DA1.25%, 12/15/27 | | | 587,184 | | | | 554,331 | | |
5.50%, 6/1/38 | | | 62,592 | | | | 68,323 | | |
7.00%, 9/1/38 (a) | | | 20,644 | | | | 23,432 | | |
Series 4320, Class AP3.50%, 7/15/39 – 11/1/47 (a) | | | 1,446,923 | | | | 1,442,067 | | |
Series 3713, Class PA2.00%, 2/15/40 – 3/15/40 (a) | | | 729,166 | | | | 709,527 | | |
4.50%, 1/1/41 – 7/1/44 (a) | | | 1,120,892 | | | | 1,176,791 | | |
Series 4049, Class AB2.75%, 12/15/41 | | | 115,886 | | | | 114,503 | | |
Series 4494, Class JA3.75%, 5/15/42 | | | 383,625 | | | | 389,293 | | |
| | | | 4,523,162 | | |
Federal Home Loan Mortgage Corp.,Structured Agency Credit Risk Debt Notes
4.29%, (LIBOR01M+220bps), 2/25/24 (a) | | | 372,338 | | | | 383,238 | | |
Federal National Mortgage Association | |
6.00%, 8/1/21 – 2/1/37 (a) | | | 291,354 | | | | 316,005 | | |
5.50%, 4/1/22 – 1/1/38 (a) | | | 173,334 | | | | 185,928 | | |
7.00%, 8/1/23 – 6/1/32 | | | 28,326 | | | | 31,528 | | |
7.50%, 12/1/29 – 2/1/31 | | | 29,299 | | | | 32,832 | | |
8.00%, 6/1/30 – 9/1/30 | | | 20,863 | | | | 23,794 | | |
5.00%, 12/1/34 – 11/1/36 | | | 14,865 | | | | 15,900 | | |
3.41%, (LIBOR12M+166bps), 12/1/36 (a) | | | 39,627 | | | | 41,382 | | |
4.50%, 12/1/38 – 6/1/40 (a) | | | 1,064,667 | | | | 1,110,876 | | |
Series 2013-33, Class UD2.50%, 4/25/39 – 12/25/47 | | | 436,071 | | | | 420,128 | | |
Series 2013-137, Class A3.50%, 3/25/40 – 10/1/47 (a) | | | 2,696,842 | | | | 2,689,814 | | |
Series 2011-101, Class LA3.00%, 10/25/40 – 8/1/46 (a) | | | 3,099,183 | | | | 3,011,022 | | |
Series 2013-81, Class KA2.75%, 9/25/42 | | | 418,664 | | | | 410,887 | | |
4.00%, 11/1/43 – 5/1/48 (a) | | | 2,017,241 | | | | 2,067,677 | | |
3.44%, (LIBOR12M+169bps), 8/1/46 (a) | | | 44,470 | | | | 46,881 | | |
| | | | 10,404,654 | | |
Total U.S. Government Mortgage Backed Agencies (Cost $15,764,373) | | | 15,311,054 | | |
U.S. Treasury Obligations (10.2%) | |
U.S. Treasury Bonds | |
2.88%, 5/15/43 (a) | | | 219,000 | | | | 215,048 | | |
3.00%, 2/15/48 | | | 714,000 | | | | 716,440 | | |
U.S. Treasury Notes | |
2.75%, 4/30/23 | | | 2,453,000 | | | | 2,455,499 | | |
2.00%, 8/15/25 (a) | | | 664,000 | | | | 629,139 | | |
Total U.S. Treasury Obligations (Cost $4,003,832) | | | 4,016,126 | | |
Collateral for Securities Loaned (3.0%) | |
BlackRock Liquidity Funds TempFund Portfolio, Institutional Class, 2.06% (f) | | | 157,660 | | | | 157,660 | | |
Fidelity Investments Prime Money Market Portfolio, Class I, 2.07% (f) | | | 143,332 | | | | 143,332 | | |
Fidelity Investments Money Market Government Portfolio, Class I, 1.81% (f) | | | 324,135 | | | | 324,135 | | |
Goldman Sachs Financial Square Prime Obligations Fund, Institutional
Class, 2.16% (f) | | | 71,658 | | | | 71,658 | | |
See notes to financial statements.
8
Victory Portfolios
Victory INCORE Investment Quality Bond Fund | | Schedule of Portfolio Investments — continued
June 30, 2018 | |
(Unaudited)
Security Description | | Shares | | Value | |
JPMorgan Prime Money Market Fund, Capital Class, 2.05% (f) | | | 372,610 | | | $ | 372,610 | | |
Morgan Stanley Institutional Liquidity Prime Portfolio, Institutional
Class, 2.12% (f) | | | 128,984 | | | | 128,984 | | |
Total Collateral for Securities Loaned (Cost $1,198,379) | | | 1,198,379 | | |
Total Investments (Cost $39,886,369) — 98.8% | | | 38,930,925 | | |
Other assets in excess of liabilities — 1.2% | | | 454,759 | | |
NET ASSETS — 100.00% | | $ | 39,385,684 | | |
(a) All or a portion of this security has been segregated as collateral for derivative instruments.
(b) Rule 144A security or other security that is restricted as to resale to institutional investors. The Fund's Adviser has deemed this security to be liquid based upon procedures approved by the Board of Trustees. As of June 30, 2018, the fair value of these securities was $2,811,491 and amounted to 7.1% of net assets.
(c) The rate for certain asset-backed and mortgage-backed securities may vary based on factors relating to the pool of assets underlying the security. The rate disclosed is the rate in effect at June 30, 2018.
(d) Variable or Floating-Rate Security. Rate disclosed is as of June 30, 2018.
(e) All or a portion of this security is on loan.
(f) Rate disclosed is the daily yield on June 30, 2018.
bps — Basis points
LIBOR — London InterBank Offered Rate
LIBOR01M — 1 Month US Dollar LIBOR, rate disclosed as of June 30, 2018, based on the last reset date of the security
LIBOR03M — 3 Month US Dollar LIBOR, rate disclosed as of June 30, 2018, based on the last reset date of the security
LIBOR12M — 12 Month US Dollar LIBOR, rate disclosed as of June 30, 2018, based on the last reset date of the security
LLC — Limited Liability Company
LP — Limited Partnership
MTN — Medium Term Note
PLC — Public Limited Company
Futures Contracts Purchased
| | | Number
of
Contracts | | Expiration
Date | | Notional
Amount | | Value | | Unrealized
Appreciation
(Depreciation) | |
10-Year U.S. Treasury Note Future | | | 14 | | | 9/19/18 | | $ | 1,673,813 | | | $ | 1,682,625 | | | $ | 8,812 | | |
5-Year U.S. Treasury Note Future | | | 29 | | | 9/28/18 | | | 3,290,138 | | | | 3,294,898 | | | | 4,760 | | |
| | | | | | | | | | | $ | 13,572 | | |
See notes to financial statements.
9
Victory Portfolios
Victory INCORE Investment Quality Bond Fund | | Schedule of Portfolio Investments — continued
June 30, 2018 | |
(Unaudited)
Futures Contracts Sold
| | | Number
of
Contracts | | Expiration
Date | | Notional
Amount | | Value | | Unrealized
Appreciation
(Depreciation) | |
2-Year U.S. Treasury Note Future | | | 6 | | | 9/28/18 | | $ | 1,271,417 | | | $ | 1,270,969 | | | $ | 448 | | |
Total unrealized appreciation | | | | | | | | | | $ | 14,020 | | |
Total unrealized depreciation | | | | | | | | | | | — | | |
Total net unrealized appreciation | | | | | | | | | | $ | 14,020 | | |
Centrally Cleared
Credit Default Swap Agreements — Sell Protection (a)
Underlying
Instrument | | Pay Fixed
Deal Rate | | Maturity
Date | | Payment
Frequency | | Implied
Credit
Spread at
June 30,
2018(b) | | Notional
Amount(c) | | Value | | Premiums
Paid
(Received) | | Unrealized
Appreciation
(Depreciation) | |
CDX North
America High
Yield Index;
Series 30 | | | 5.00 | % | | 6/20/23 | | Daily | | | 3.59 | % | | $ | 2,500,000 | | | $ | 147,673 | | | $ | 144,813 | | | $ | 2,860 | | |
(a) When a credit event occurs as defined under the terms of the swap agreement, the Fund as a seller of credit protection will either (i) pay to the buyer of protection an amount equal to the par value of the defaulted reference entity and take delivery of the reference entity or (ii) pay a net amount equal to the par value of the defaulted reference entity less its recovery value.
(b) Implied credit spread, represented in absolute terms, utilized in determining the value of the credit default swap agreements as of period end will serve as an indicator of the current status of the payment/performance risk and represent the likelihood or risk of default for the credit derivative. The implied credit spread of a referenced entity reflects the cost of buying/selling protection and may include payments required to be made to enter into the agreement. Generally, wider credit spreads represent a perceived deterioration of the referenced entity's credit soundness and a greater likelihood or risk of default or other credit event occurring as defined under the terms of the swap agreement.
(c) The notional amount represents the maximum potential amount the Fund could be required to pay as a seller of credit protection if a credit event occurs, as defined under the terms of the swap agreement, for each security included in the CDX North America High Yield Index.
See notes to financial statements.
10
Victory Portfolios
Victory INCORE Low Duration Bond Fund | | Schedule of Portfolio Investments
June 30, 2018 | |
(Unaudited)
Security Description | | Principal
Amount | | Value | |
Asset Backed Securities (16.4%) | |
Ally Auto Receivables Trust, Series 2014-2, Class B, 2.10%, 3/16/20,
Callable 7/15/18 @ 100 | | $ | 2,240,000 | | | $ | 2,239,357 | | |
American Express Credit Account Master Trust, Series 2014-1,
Class B, 2.57%, (LIBOR01M+50bps), 12/15/21 (a) (b) | | | 6,400,000 | | | | 6,411,159 | | |
AmeriCredit Automobile Receivables Trust, Series 2015-3, Class D,
3.34%, 8/8/21, Callable 12/8/19 @ 100 (b) | | | 2,600,000 | | | | 2,608,271 | | |
AmeriCredit Automobile Receivables Trust, Series 2018-1, Class B,
3.26%, 1/18/24, Callable 10/18/21 @ 100 | | | 3,200,000 | | | | 3,183,363 | | |
AmeriCredit Automobile Receivables Trust, Series 2016-3, Class C,
2.24%, 4/8/22, Callable 11/8/20 @ 100 (b) | | | 4,435,000 | | | | 4,363,277 | | |
AmeriCredit Automobile Receivables Trust, Series 2017-2, Class B,
2.40%, 5/18/22, Callable 11/18/20 @ 100 (b) | | | 2,715,000 | | | | 2,669,583 | | |
Avis Budget Rental Car Funding (AESOP) LLC, Series 2014-1, Class A,
2.46%, 7/20/20 (b) (c) | | | 2,000,000 | | | | 1,990,854 | | |
Avis Budget Rental Car Funding (AESOP) LLC, Series 2013-1A, Class A,
1.92%, 9/20/19 (b) (c) | | | 5,250,000 | | | | 5,243,863 | | |
Chrysler Capital Auto Receivables Trust, Series 2016-BA, Class B,
2.22%, 5/16/22, Callable 3/15/21 @ 100 (c) | | | 4,180,000 | | | | 4,092,759 | | |
CNH Equipment Trust, Series 2014-B, Class A4, 1.61%, 5/17/21,
Callable 7/15/18 @ 100 (b) | | | 1,604,197 | | | | 1,603,568 | | |
Drive Auto Receivables Trust, Series 2017-1, Class B, 2.36%, 3/15/21,
Callable 7/15/20 @ 100 | | | 1,985,000 | | | | 1,982,543 | | |
Drive Auto Receivables Trust, Series 2018-2, Class B, 3.22%, 4/15/22,
Callable 9/15/23 @ 100 | | | 5,140,000 | | | | 5,141,845 | | |
Drive Auto Receivables Trust, Series 2017-AA, Class C, 2.98%, 1/18/22,
Callable 9/15/20 @ 100 (c) | | | 2,115,000 | | | | 2,114,750 | | |
DT Auto Owner Trust, Series 2017-2A, Class B, 2.44%, 2/15/21,
Callable 9/15/20 @ 100 (c) | | | 2,420,000 | | | | 2,415,022 | | |
Santander Drive Auto Receivables Trust, Series 2017-2, Class B,
2.21%, 10/15/21, Callable 7/15/20 @ 100 | | | 3,125,000 | | | | 3,104,803 | | |
Santander Drive Auto Receivables Trust, Series 2017-3, Class B, 2.19%,
3/15/22, Callable 1/15/21 @ 100 | | | 2,540,000 | | | | 2,506,393 | | |
Santander Drive Auto Receivables Trust, Series 2016-3, Class C,
2.46%, 3/15/22, Callable 7/15/20 @ 100 (b) | | | 6,835,000 | | | | 6,790,751 | | |
Santander Retail Auto Lease Trust, Series 2018-A, Class B,
3.20%, 4/20/22, Callable 3/20/21 @ 100 (c) | | | 2,400,000 | | | | 2,382,845 | | |
World Financial Network Credit Card Master Trust, Series 2017-A,
Class A, 2.12%, 3/15/24 | | | 3,155,000 | | | | 3,101,077 | | |
Total Asset Backed Securities (Cost $64,365,706) | | | 63,946,083 | | |
Collateralized Mortgage Obligations (8.1%) | |
BX Trust, Series 2017-APPL, Class A, 2.95%, (LIBOR01M+88bps),
7/15/34 (a) (b) (c) | | | 4,069,680 | | | | 4,072,446 | | |
BX Trust, Series 2017-SLCT, Class B, 3.27%, (LIBOR01M+120bps),
7/15/34 (a) (b) (c) | | | 4,500,000 | | | | 4,508,902 | | |
COMM Mortgage Trust, Series 2014-CR15, Class A2, 2.93%, 2/10/47 (b) | | | 3,394,130 | | | | 3,395,077 | | |
Drive Auto Recievables Trust, Series 2016-CA, Class B, 2.37%, 11/16/20,
Callable 11/15/20 @ 100 (c) | | | 2,596,735 | | | | 2,595,660 | | |
See notes to financial statements.
11
Victory Portfolios
Victory INCORE Low Duration Bond Fund | | Schedule of Portfolio Investments — continued
June 30, 2018 | |
(Unaudited)
Security Description | | Principal
Amount | | Value | |
Galaxy CLO Ltd., Series 2017-24A, Class A, 2.75%, (LIBOR03M+112bps),
1/15/31, Callable 1/15/20 @ 100 (a) (c) | | $ | 2,000,000 | | | $ | 2,003,820 | | |
Great Wolf Trust, Series 2017-WOLF, Class A, 3.07%, (LIBOR01M+85bps),
9/15/34 (a) (b) (c) | | | 3,500,000 | | | | 3,504,094 | | |
GS Mortgage Securities Trust, Series 2012-GC6, Class B,
5.84%, 1/10/45 (b) (c) (d) | | | 3,500,000 | | | | 3,718,576 | | |
GS Mortgage Securities Trust, Series 2013-GC16, Class A2,
3.03%, 11/10/46 | | | 1,260,047 | | | | 1,260,256 | | |
JPMBB Commercial Mortgage Securities Trust, Series 2013-C15,
Class A2, 2.98%, 11/15/45 | | | 1,207,876 | | | | 1,207,867 | | |
JPMorgan Chase Commercial Mortgage Securities Trust,
Series 2013-C16, Class A2, 3.07%, 12/15/46 (b) | | | 701,953 | | | | 702,156 | | |
Steele Creek CLO Ltd., Series 2017-1A, Class A,
2.88%, (LIBOR03M+125bps), 1/15/30, Callable 1/15/20 @ 100 (a) (b) (c) | | | 2,825,000 | | | | 2,829,229 | | |
Voya CLO Ltd., Series 2017-4A, Class A1, 2.51%, (LIBOR03M+113bps),
10/15/30, Callable 10/15/19 @ 100 (a) (c) | | | 2,000,000 | | | | 2,001,900 | | |
Total Collateralized Mortgage Obligations (Cost $32,074,048) | | | 31,799,983 | | |
Residential Mortgage Backed Securities (6.1%) | |
Ameriquest Mortgage Securities, Inc., Series 2003-5, Class A6,
4.03%, 4/25/33, Callable 7/25/18 @ 100 (d) | | | 13,521 | | | | 13,521 | | |
Bear Stearns Alt-A Trust, Series 2003-3, Class 2A, 3.67%, 10/25/33,
Callable 7/25/18 @ 100 (b) (d) | | | 2,275,094 | | | | 2,275,094 | | |
Credit Suisse First Boston Mortgage Securities Corp., Series 2004-AR7,
Class 4A1, 3.86%, 11/25/34, Callable 7/25/18 @ 100 (b) (d) | | | 2,314,003 | | | | 2,314,003 | | |
Credit Suisse First Boston Mortgage Securities Corp., Series 2004-5,
Class 5A1, 5.00%, 8/25/19, Callable 10/25/18 @ 100 | | | 66,561 | | | | 66,147 | | |
Credit Suisse First Boston Mortgage Securities Corp., Series 2003-11,
Class 1A31, 5.50%, 6/25/33, Callable 7/25/18 @ 100 (b) | | | 209,539 | | | | 209,539 | | |
Credit Suisse First Boston Mortgage Securities Corp., Series 2003-23,
Class 2A8, 4.50%, 10/25/18 (b) | | | 16,107 | | | | 16,035 | | |
GSR Mortgage Loan Trust, Series 2004-15F, Class 5A1, 5.50%, 1/25/20,
Callable 2/25/34 @ 100 (b) | | | 103,231 | | | | 105,491 | | |
JPMorgan Mortgage Trust, Series 2016-4, Class A5, 3.50%, 10/25/46,
Callable 5/25/35 @ 100 (b) (c) (d) | | | 1,811,062 | | | | 1,791,438 | | |
JPMorgan Mortgage Trust, Series 2016-3, Class 1A3, 3.50%, 10/25/46,
Callable 4/25/39 @ 100 (b) (c) (d) | | | 1,050,448 | | | | 1,038,983 | | |
JPMorgan Mortgage Trust, Series 2017-1, Class A5, 3.50%, 1/25/47,
Callable 2/25/41 @ 100 (b) (c) (d) | | | 2,264,300 | | | | 2,254,747 | | |
JPMorgan Mortgage Trust, Series 2017-3, Class 2A2, 2.50%, 8/25/47,
Callable 6/25/29 @ 100 (b) (c) (d) | | | 2,630,063 | | | | 2,526,351 | | |
JPMorgan Mortgage Trust, Series 2004-S2, Class 1A3, 4.75%, 11/25/19,
Callable 4/25/19 @ 100 (b) | | | 48,543 | | | | 49,273 | | |
JPMorgan Mortgage Trust, Series 2004-S1, Class 1A7, 5.00%, 9/25/34,
Callable 7/25/18 @ 100 (b) | | | 135,714 | | | | 135,714 | | |
JPMorgan Mortgage Trust, Series 2014-5, Class A11, 3.00%, 10/25/29,
Callable 11/25/23 @ 100 (b) (c) (d) | | | 4,742,332 | | | | 4,652,212 | | |
JPMorgan Mortgage Trust, Series 2005-A1, Class 6T1, 3.98%, 2/25/35,
Callable 7/25/18 @ 100 (b) (d) | | | 254,706 | | | | 257,654 | | |
See notes to financial statements.
12
Victory Portfolios
Victory INCORE Low Duration Bond Fund | | Schedule of Portfolio Investments — continued
June 30, 2018 | |
(Unaudited)
Security Description | | Principal
Amount | | Value | |
Madison Park Funding Ltd., Series 2017-26A, Class AR,
3.56%, (LIBOR03M+120bps), 7/29/30, Callable 10/29/19 @ 100 (a) (c) | | $ | 2,250,000 | | | $ | 2,252,250 | | |
Morgan Stanley Mortgage Loan Trust, Series 2005-6AR, Class 1A1,
2.37%, (LIBOR01M+28bps), 11/25/35, Callable 7/25/18 @ 100 (a) (b) | | | 425,616 | | | | 423,108 | | |
Prime Mortgage Trust, Series 2004-2, Class A3, 5.25%, 11/25/19,
Callable 7/25/18 @ 100 (b) | | | 27,678 | | | | 27,678 | | |
Prime Mortgage Trust, Series 2004-2, Class A2, 4.75%, 11/25/19,
Callable 7/25/18 @ 100 (b) | | | 49,754 | | | | 49,754 | | |
Residential Funding Mortgage Securities I, Inc., Series 2005-S3,
Class A1, 4.75%, 3/25/20, Callable 7/25/18 @ 100 (b) | | | 112,212 | | | | 112,212 | | |
Structured Asset Securities Corp., Series 2004-21XS, Class 2A6A,
5.24%, 12/25/34, Callable 7/25/18 @ 100 (b) (d) | | | 3,569 | | | | 3,633 | | |
Wells Fargo Mortgage Backed Securities Trust, Series 2004-Z,
Class 2A2, 3.74%, 12/25/34, Callable 7/25/18 @ 100 (b) (d) | | | 691,341 | | | | 691,341 | | |
Wells Fargo Mortgage Backed Securities Trust, Series 2005-2,
Class 2A1, 4.75%, 4/25/20, Callable 7/25/18 @ 100 (b) | | | 18,540 | | | | 18,540 | | |
Wells Fargo Mortgage Backed Securities Trust, Series 2003-J,
Class 2A1, 3.48%, 10/25/33, Callable 7/25/18 @ 100 (b) (d) | | | 233,218 | | | | 233,218 | | |
Wells Fargo Mortgage Backed Securities Trust, Series 2004-O,
Class A1, 3.60%, 8/25/34, Callable 7/25/18 @ 100 (b) (d) | | | 795,046 | | | | 795,046 | | |
Wells Fargo Mortgage Backed Securities Trust, Series 2004-M,
Class A7, 3.64%, 8/25/34, Callable 7/25/18 @ 100 (b) (d) | | | 1,348,353 | | | | 1,348,353 | | |
Total Residential Mortgage Backed Securities (Cost $24,092,859) | | | 23,661,335 | | |
Corporate Bonds (44.4%) | |
Consumer Discretionary (2.7%): | |
Aptiv PLC, 3.15%, 11/19/20, Callable 10/19/20 @ 100 | | | 1,505,000 | | | | 1,496,256 | | |
Best Buy Co., Inc., 5.50%, 3/15/21, Callable 12/15/20 @ 100 | | | 3,055,000 | | | | 3,197,821 | | |
Hasbro, Inc., 3.15%, 5/15/21, Callable 3/15/21 @ 100 | | | 2,030,000 | | | | 2,010,431 | | |
O'Reilly Automotive, Inc., 4.88%, 1/14/21, Callable 10/14/20 @ 100 (b) | | | 3,750,000 | | | | 3,875,963 | | |
| | | | 10,580,471 | | |
Consumer Staples (2.4%): | |
Bat Capital Corp., 2.30%, 8/14/20 (c) (e) | | | 3,750,000 | | | | 3,668,625 | | |
Molson Coors Brewing Co., 1.45%, 7/15/19 | | | 3,750,000 | | | | 3,690,713 | | |
Pernod Ricard SA, 5.75%, 4/7/21 (c) | | | 2,176,000 | | | | 2,306,560 | | |
| | | | 9,665,898 | | |
Energy (5.0%): | |
Buckeye Partners LP, 2.65%, 11/15/18, Callable 10/15/18 @ 100 (b) | | | 3,230,000 | | | | 3,225,897 | | |
Enable Midstream Partner, 2.40%, 5/15/19, Callable 4/15/19 @ 100 (b) | | | 5,000,000 | | | | 4,966,549 | | |
LUKOIL International Finance BV, 6.13%, 11/9/20 (b) (c) | | | 5,185,000 | | | | 5,438,961 | | |
Marathon Petroleum Corp., 3.40%, 12/15/20, Callable 11/15/20 @ 100 | | | 1,850,000 | | | | 1,854,496 | | |
Pioneer Natural Resource Co., 7.50%, 1/15/20 (d) | | | 2,085,000 | | | | 2,217,356 | | |
Texas Gas Transmission LLC, 4.50%, 2/1/21, Callable 11/1/20 @ 100 (c) | | | 1,915,000 | | | | 1,939,397 | | |
| | | | 19,642,656 | | |
Financials (12.5%): | |
Bank of America Corp. | |
2.25%, 4/21/20, MTN | | | 2,000,000 | | | | 1,972,080 | | |
2.33%, (LIBOR03M+63bps), 10/1/21, Callable 10/1/20 @ 100 (a) | | | 1,391,000 | | | | 1,358,520 | | |
See notes to financial statements.
13
Victory Portfolios
Victory INCORE Low Duration Bond Fund | | Schedule of Portfolio Investments — continued
June 30, 2018 | |
(Unaudited)
Security Description | | Principal
Amount | | Value | |
Capital One Financial Corp. | |
2.45%, 4/24/19, Callable 3/24/19 @ 100 | | $ | 1,790,000 | | | $ | 1,784,290 | | |
2.50%, 5/12/20, Callable 4/12/20 @ 100 | | | 615,000 | | | | 605,757 | | |
3.45%, 4/30/21, Callable 3/30/21 @ 100 | | | 3,500,000 | | | | 3,492,090 | | |
3.08%, (LIBOR03M+72bps), 1/30/23, Callable 12/30/22 @ 100 (a) | | | 2,500,000 | | | | 2,483,350 | | |
Citigroup, Inc., 3.39%, (LIBOR03M+107bps), 12/8/21,
Callable 11/8/21 @ 100 (a) (b) (d) | | | 3,500,000 | | | | 3,560,129 | | |
Ford Motor Credit Co. LLC, 2.46%, 3/27/20 (b) | | | 3,585,000 | | | | 3,528,930 | | |
HSBC Holdings PLC, 3.82%, (LIBOR03M+150bps), 1/5/22 (a) (b) | | | 1,750,000 | | | | 1,801,608 | | |
JPMorgan Chase & Co., 3.59%, (LIBOR03M+123bps), 10/24/23,
Callable 10/24/22 @ 100 (a) (b) | | | 1,750,000 | | | | 1,784,773 | | |
Morgan Stanley | |
2.45%, 2/1/19 (b) (d) | | | 4,000,000 | | | | 3,993,040 | | |
3.76%, (LIBOR03M+140bps), 10/24/23, Callable 10/24/22 @ 100 (a) (b) | | | 1,750,000 | | | | 1,789,025 | | |
Regions Bank, 2.25%, 9/14/18, Callable 8/14/18 @ 100 (b) | | | 3,330,000 | | | | 3,328,302 | | |
SVB Financial Group, 5.38%, 9/15/20 | | | 2,573,000 | | | | 2,680,268 | | |
The Goldman Sachs Group, Inc. | |
2.90%, 7/19/18 (b) | | | 3,000,000 | | | | 3,000,600 | | |
3.51%, (LIBOR03M+117bps), 11/15/21, Callable 11/15/20 @ 100 (a) (b) | | | 3,500,000 | | | | 3,549,140 | | |
UBS Group Funding Switzerland AG, 2.95%, 9/24/20 (b) (c) | | | 3,825,000 | | | | 3,786,597 | | |
Unum Group, 3.00%, 5/15/21, Callable 4/15/21 @ 100 (b) | | | 4,000,000 | | | | 3,935,600 | | |
| | | | 48,434,099 | | |
Health Care (8.7%): | |
AbbVie, Inc., 2.00%, 11/6/18 (b) (d) | | | 5,000,000 | | | | 4,988,400 | | |
Amgen, Inc., 2.20%, 5/11/20 (b) (d) | | | 6,051,000 | | | | 5,954,486 | | |
Bayer US Finance II LLC, 3.50%, 6/25/21, Callable 5/25/21 @ 100 (c) (d) | | | 1,000,000 | | | | 1,002,300 | | |
Biogen, Inc., 2.90%, 9/15/20 (d) | | | 5,333,000 | | | | 5,304,628 | | |
Celgene Corp., 2.88%, 2/19/21 (d) | | | 4,345,000 | | | | 4,299,682 | | |
Edwards Lifesciences Corp., 2.88%, 10/15/18 | | | 3,825,000 | | | | 3,825,536 | | |
Express Scripts Holding Co., 2.25%, 6/15/19 (b) (d) | | | 4,057,000 | | | | 4,026,573 | | |
Universal Health Services, Inc., 3.75%, 8/1/19 (c) | | | 4,177,000 | | | | 4,178,044 | | |
| | | | 33,579,649 | | |
Industrials (2.3%): | |
Acuity Brands Lighting, Inc., 6.00%, 12/15/19 | | | 2,319,000 | | | | 2,408,421 | | |
Aercap Holdings NV, 4.63%, 10/30/20 (b) | | | 3,715,000 | | | | 3,785,994 | | |
IDEX Corp., 4.50%, 12/15/20, Callable 9/15/20 @ 100 | | | 2,565,000 | | | | 2,615,351 | | |
| | | | 8,809,766 | | |
Information Technology (4.6%): | |
Electronic Arts, Inc., 3.70%, 3/1/21, Callable 2/1/21 @ 100 (b) | | | 4,185,000 | | | | 4,223,586 | | |
Juniper Networks, Inc., 3.13%, 2/26/19 (b) | | | 7,120,000 | | | | 7,124,414 | | |
Lam Research Group, 2.80%, 6/15/21, Callable 5/15/21 @ 100 | | | 1,178,000 | | | | 1,157,456 | | |
NetApp, Inc., 2.00%, 9/27/19 | | | 1,875,000 | | | | 1,849,238 | | |
VMware, Inc., 2.30%, 8/21/20 (b) | | | 3,820,000 | | | | 3,735,387 | | |
| | | | 18,090,081 | | |
Materials (1.4%): | |
Anglo American Capital PLC, 4.13%, 4/15/21 (b) (c) | | | 5,725,000 | | | | 5,777,612 | | |
See notes to financial statements.
14
Victory Portfolios
Victory INCORE Low Duration Bond Fund | | Schedule of Portfolio Investments — continued
June 30, 2018 | |
(Unaudited)
Security Description | | Shares or
Principal
Amount | | Value | |
Real Estate (1.6%): | |
Healthcare Trust of America Holdings LP, 3.38%, 7/15/21,
Callable 5/15/21 @ 100 | | $ | 1,410,000 | | | $ | 1,404,346 | | |
Highwoods Realty LP, 3.20%, 6/15/21, Callable 4/15/21 @ 100 | | | 3,130,000 | | | | 3,083,206 | | |
Welltower, Inc., 6.13%, 4/15/20 (b) | | | 1,650,000 | | | | 1,727,435 | | |
| | | | 6,214,987 | | |
Telecommunication Services (1.0%): | |
AT&T, Inc., 2.45%, 6/30/20, Callable 5/30/20 @ 100 | | | 3,500,000 | | | | 3,445,225 | | |
Level 3 Financing, Inc., 5.38%, 1/15/24, Callable 1/15/19 @ 102.69 | | | 637,000 | | | | 623,152 | | |
| | | | 4,068,377 | | |
Utilities (2.2%): | |
Eversource Energy, 2.50%, 3/15/21, Callable 2/15/21 @ 100 | | | 2,900,000 | | | | 2,843,073 | | |
Iberdrola Finance Ireland Ltd., 5.00%, 9/11/19 (b) (c) | | | 6,027,000 | | | | 6,154,652 | | |
| | | | 8,997,725 | | |
Total Corporate Bonds (Cost $175,774,618) | | | 173,861,321 | | |
U.S. Government Mortgage Backed Agencies (13.1%) | |
Federal Home Loan Mortgage Corp. | |
5.00%, 6/15/23 – 8/1/40 (b) | | | 3,648,151 | | | | 3,882,193 | | |
5.50%, 10/25/23 (b) | | | 10,140 | | | | 10,578 | | |
Series 4430, Class NG2.50%, 2/15/38 | | | 3,377,234 | | | | 3,330,516 | | |
7.00%, 9/1/38 (b) | | | 9,909 | | | | 11,248 | | |
Series 4320, Class AP3.50%, 7/15/39 | | | 1,886,768 | | | | 1,892,684 | | |
Series 3713, Class PA2.00%, 2/15/40 – 3/15/40 (b) | | | 7,784,180 | | | | 7,574,566 | | |
Series 4049, Class AB2.75%, 12/15/41 | | | 1,244,506 | | | | 1,229,653 | | |
| | | | 17,931,438 | | |
Federal National Mortgage Association | |
6.00%, 2/1/37 (b) | | | 2,851,405 | | | | 3,104,929 | | |
Series 2013-83, Class CA3.50%, 10/25/37 – 3/25/40 | | | 5,283,726 | | | | 5,323,960 | | |
Series 2013-33, Class UD2.50%, 4/25/39 | | | 2,381,405 | | | | 2,305,474 | | |
Series 2011-21, Class PA4.50%, 5/25/40 (b) | | | 5,474,577 | | | | 5,668,233 | | |
Series 2011-101, Class LA3.00%, 10/25/40 | | | 2,184,002 | | | | 2,165,202 | | |
5.00%, 2/1/41 – 10/1/41 (b) | | | 13,904,459 | | | | 14,824,567 | | |
3.44%, (LIBOR12M+169bps), 8/1/46 (b) | | | 15,573 | | | | 16,417 | | |
| | | | 33,408,782 | | |
Total U.S. Government Mortgage Backed Agencies (Cost $52,893,197) | | | 51,340,220 | | |
U.S. Treasury Obligations (9.7%) | |
U.S. Treasury Bills, 1.66%, 8/2/18 (b) (f) | | | 17,195,000 | | | | 17,168,832 | | |
U.S. Treasury Notes | |
1.13%, 1/31/19 (b) | | | 5,429,000 | | | | 5,395,214 | | |
1.63%, 8/31/19 (b) | | | 6,590,000 | | | | 6,530,517 | | |
2.25%, 3/31/20 | | | 9,000,000 | | | | 8,959,598 | | |
Total U.S. Treasury Obligations (Cost $38,096,657) | | | 38,054,161 | | |
See notes to financial statements.
15
Victory Portfolios
Victory INCORE Low Duration Bond Fund | | Schedule of Portfolio Investments — continued
June 30, 2018 | |
(Unaudited)
Security Description | | Shares | | Value | |
Collateral for Securities Loaned (2.6%) | |
BlackRock Liquidity Funds TempFund Portfolio,
Institutional Class, 2.06% (g) | | | 1,320,385 | | | $ | 1,320,385 | | |
Fidelity Investments Prime Money Market Portfolio,
Class I, 2.07% (g) | | | 1,200,394 | | | | 1,200,394 | | |
Fidelity Investments Money Market Government Portfolio,
Class I, 1.81% (g) | | | 2,714,591 | | | | 2,714,591 | | |
Goldman Sachs Financial Square Prime Obligations Fund,
Institutional Class, 2.16% (g) | | | 600,126 | | | | 600,126 | | |
JPMorgan Prime Money Market Fund, Capital Class, 2.05% (g) | | | 3,120,570 | | | | 3,120,570 | | |
Morgan Stanley Institutional Liquidity Prime Portfolio,
Institutional Class, 2.12% (g) | | | 1,080,227 | | | | 1,080,227 | | |
Total Collateral for Securities Loaned (Cost $10,036,293) | | | 10,036,293 | | |
Total Investments (Cost $397,333,378) — 100.4% | | | 392,699,396 | | |
Liabilities in excess of other assets — (0.4)% | | | (1,662,839 | ) | |
NET ASSETS — 100.00% | | $ | 391,036,557 | | |
(a) Variable or Floating-Rate Security. Rate disclosed is as of June 30, 2018.
(b) All or a portion of this security has been segregated as collateral for derivative instruments.
(c) Rule 144A security or other security that is restricted as to resale to institutional investors. The Fund's Adviser has deemed this security to be liquid based upon procedures approved by the Board of Trustees. As of June 30, 2018, the fair value of these securities was $92,243,449 and amounted to 23.6% of net assets
(d) The rate for certain asset-backed and mortgage-backed securities may vary based on factors relating to the pool of assets underlying the security. The rate disclosed is the rate in effect at June 30, 2018.
(e) All or a portion of this security is on loan.
(f) Rate represents the effective yield at June 30, 2018.
(g) Rate disclosed is the daily yield on June 30, 2018.
bps — Basis points
LIBOR — London InterBank Offered Rate
LIBOR01M — 1 Month US Dollar LIBOR, rate disclosed as of June 30, 2018, based on the last reset date of the security
LIBOR03M — 3 Month US Dollar LIBOR, rate disclosed as of June 30, 2018, based on the last reset date of the security
LIBOR12M — 12 Month US Dollar LIBOR, rate disclosed as of June 30, 2018, based on the last reset date of the security
LLC — Limited Liability Company
LP — Limited Partnership
MTN — Medium Term Note
PLC — Public Limited Company
Futures Contracts Purchased
| | | Number
of
Contracts | | Expiration
Date | | Notional
Amount | | Value | | Unrealized
Appreciation
(Depreciation) | |
2-Year U.S. Treasury Note Future | | | 458 | | | 9/28/18 | | $ | 97,072,101 | | | $ | 97,017,281 | | | $ | (54,820 | ) | |
See notes to financial statements.
16
Victory Portfolios
Victory INCORE Low Duration Bond Fund | | Schedule of Portfolio Investments — continued
June 30, 2018 | |
(Unaudited)
Futures Contracts Sold
| | | Number
of
Contracts | | Expiration
Date | | Notional
Amount | | Value | | Unrealized
Appreciation
(Depreciation) | |
5-Year U.S. Treasury Note Future | | | 7 | | | 9/28/18 | | $ | 794,147 | | | $ | 795,320 | | | $ | (1,173 | ) | |
Total unrealized appreciation | | | | | | | | | | $ | — | | |
Total unrealized depreciation | | | | | | | | | | | (55,993 | ) | |
Total net unrealized depreciation | | | | | | | | | | $ | (55,993 | ) | |
Centrally Cleared
Credit Default Swap Agreements — Sell Protection (a)
Underlying
Instrument | | Fixed Deal
Receive
Rate | | Maturity
Date | | Payment
Frequency | | Implied
Credit
Spread at
June 30,
2018(b) | | Notional
Amount(c) | | Value | | Premiums
Paid
(Received) | | Unrealized
Appreciation
(Depreciation) | |
CDX North
America
Investment
Grade
5 Year
Index;
Series 30 | | | 1.00 | % | | 6/20/23 | | Daily | | | 0.67 | % | | $ | 21,000,000 | | | $ | 315,906 | | | $ | 375,115 | | | $ | (59,209 | ) | |
CDX North
America
High Yield
Index;
Series 30 | | | 5.00 | % | | 6/20/23 | | Daily | | | 3.60 | % | | | 26,650,000 | | | | 1,574,201 | | | | 1,543,701 | | | | 30,500 | | |
| | | $ | 1,890,107 | | | $ | 1,918,816 | | | $ | (28,709 | ) | |
(a) When a credit event occurs as defined under the terms of the swap agreement, the Fund as a seller of credit protection will either (i) pay to the buyer of protection an amount equal to the par value of the defaulted reference entity and take delivery of the reference entity or (ii) pay a net amount equal to the par value of the defaulted reference entity less its recovery value.
(b) Implied credit spread, represented in absolute terms, utilized in determining the value of the credit default swap agreements as of period end will serve as an indicator of the current status of the payment/performance risk and represent the likelihood or risk of default for the credit derivative. The implied credit spread of a referenced entity reflects the cost of buying/selling protection and may include payments required to be made to enter into the agreement. Generally, wider credit spreads represent a perceived deterioration of the referenced entity's credit soundness and a greater likelihood or risk of default or other credit event occurring as defined under the terms of the swap agreement.
(c) The notional amount represents the maximum potential amount the Fund could be required to pay as a seller of credit protection if a credit event occurs, as defined under the terms of the swap agreement, for each security included in the CDX North America High Yield Index or CDX North America Investment Grade 5 Year Index.
See notes to financial statements.
17
Victory Portfolios
Victory High Yield Fund | | Schedule of Portfolio Investments
June 30, 2018 | |
(Unaudited)
Security Description | | Shares or
Principal
Amount | | Value | |
Common Stocks (2.8%) | |
Consumer Discretionary (2.5%): | |
AMC Entertainment Holdings, Inc., Class A | | | 40,000 | | | $ | 636,000 | | |
AMC Networks, Inc., Class A (a) | | | 6,000 | | | | 373,200 | | |
TEGNA, Inc. (b) | | | 33,000 | | | | 358,050 | | |
Wynn Resorts Ltd. | | | 2,000 | | | | 334,680 | | |
| | | | 1,701,930 | | |
Energy (0.3%): | |
Sanchez Energy Corp. (a) (b) | | | 54,000 | | | | 244,080 | | |
Total Common Stocks (Cost $2,057,252) | | | 1,946,010 | | |
Senior Secured Loans (28.0%) | |
Ai Ladder Luxembourg Subco Sarl, 1st Lien Term Loan B,
7.02%, (LIBOR01M+450bps), 5/4/25 (c) (d) | | $ | 800,000 | | | | 795,664 | | |
Alphabet Holding Co., Inc., 2nd Lien Term Loan,
9.84%, (LIBOR01M+775bps), 8/15/25, Callable 8/3/18 @ 102 (c) | | | 1,450,000 | | | | 1,175,109 | | |
Avaya, Inc., 1st Lien Term Loan B, 6.32%, (LIBOR01M+425bps), 12/15/24,
Callable 8/3/18 @ 101 (c) | | | 646,750 | | | | 647,158 | | |
Bass Pro Group LLC, Term Loan B, 7.09%, (LIBOR01M+500bps), 12/16/23,
Callable 8/3/18 @ 100 (c) | | | 992,500 | | | | 993,126 | | |
BJ's Wholesale Club, Inc., 9.53%, (LIBOR01M+750bps), 1/27/25,
Callable 8/3/18 @ 101 (c) | | | 846,390 | | | | 853,796 | | |
Caesars Resort Collection LLC, 1st Lien Term Loan B, 4.84%,
(LIBOR01M+275bps), 10/2/24, Callable 8/3/18 @ 100 (c) | | | 995,000 | | | | 991,100 | | |
Chesapeake Energy Corp., 9.59%, (LIBOR01M+750bps), 8/23/21,
Callable 8/23/18 @ 104.25 (c) | | | 1,000,000 | | | | 1,045,210 | | |
Crown Finance US, Inc., 1st Lien Term Loan B, 4.59%, (LIBOR01M+250bps),
2/7/25, Callable 8/3/18 @ 101 (c) | | | 648,375 | | | | 643,039 | | |
Dayco Products LLC, 6.56%, (LIBOR03M+425bps), 5/19/24,
Callable 8/3/18 @ 101 (c) | | | 990,000 | | | | 987,525 | | |
Hertz Corp., Term Loan B1, 4.85%, (LIBOR01M+275bps), 6/30/23,
Callable 8/3/18 @ 100 (c) | | | 989,822 | | | | 981,942 | | |
Navistar, Inc., 1st Lien Term Loan B, 5.53%, (LIBOR01M+350bps), 11/2/24,
Callable 8/3/18 @ 100 (c) | | | 997,500 | | | | 996,882 | | |
Packaging Coordinators Midco, Inc., 2nd Lien Term Loan, 11.09%,
(LIBOR03M+875bps), 7/1/24, Callable 8/3/18 @ 100 (c) | | | 800,000 | | | | 796,000 | | |
PetSmart, Inc., 5.01%, (LIBOR01M+300bps), 3/10/22,
Callable 8/3/18 @ 100 (c) | | | 989,796 | | | | 816,206 | | |
Prospect Medical Holdings, Inc., 1st Lien Term Loan B,
7.50%, (LIBOR01M+550bps), 2/16/24, Callable 8/3/18 @ 101 (c) | | | 648,375 | | | | 646,750 | | |
Radiate Holdco LLC, 5.09%, (LIBOR01M+300bps), 2/1/24,
Callable 7/26/18 @ 100 (c) | | | 994,962 | | | | 979,841 | | |
Reynolds Group Holdings, Inc., 1st Lien Term Loan B,
4.84%, (LIBOR01M+275bps), 2/5/23, Callable 8/3/18 @ 100 (c) | | | 1,306,775 | | | | 1,302,949 | | |
Scientific Games International, Inc., 1st Lien Term Loan B5,
4.84%, (LIBOR01M+275bps), 8/14/24, Callable 8/3/18 @ 101 (c) | | | 191,637 | | | | 190,196 | | |
See notes to financial statements.
18
Victory Portfolios
Victory High Yield Fund | | Schedule of Portfolio Investments — continued
June 30, 2018 | |
(Unaudited)
Security Description | | Principal
Amount | | Value | |
Scientific Games International, Inc., 1st Lien Term Loan B5, 4.92%,
(LIBOR02M+275bps), 8/14/24, Callable 8/3/18 @ 101 (c) | | $ | 805,863 | | | $ | 799,804 | | |
SIWF Holdings, Inc., 10.57%, (LIBOR01M+850bps), 5/26/26 (c) | | | 1,000,000 | | | | 960,000 | | |
Sprint Communications, Inc., 1st Lien Term Loan B, 4.63%,
(LIBOR01M+250bps), 2/2/24, Callable 8/3/18 @ 100 (c) | | | 997,475 | | | | 992,055 | | |
Stars Group Holdings BV, 1st Lien Term Loan B, 5.83%,
(LIBOR02M+350bps), 7/29/25 (c) (d) | | | 1,000,000 | | | | 1,000,000 | | |
Utz Quality Foods LLC, 2nd Lien Term Loan, 9.34%, (LIBOR01M+725bps),
11/21/25, Callable 8/3/18 @ 102 (c) | | | 700,000 | | | | 703,500 | | |
Windstream Services LLC, 1st Lien Term Loan,
5.34%, (LIBOR01M+325bps), 2/8/24, Callable 8/3/18 @ 100 (c) | | | 494,925 | | | | 434,143 | | |
Total Senior Secured Loans (Cost $19,962,554) | | | 19,731,995 | | |
Corporate Bonds (63.9%) | |
Consumer Discretionary (14.0%): | |
AMC Entertainment Holdings, Inc., 5.75%, 6/15/25,
Callable 6/15/20 @ 102.88 (b) (e) | | | 1,000,000 | | | | 980,540 | | |
AMC Networks, Inc., 4.75%, 8/1/25, Callable 8/1/21 @ 102.38 | | | 600,000 | | | | 577,482 | | |
American Axle & Manufacturing, Inc., 6.63%, 10/15/22,
Callable 8/3/18 @ 103.31 | | | 299,000 | | | | 307,046 | | |
AV Homes, Inc., 6.63%, 5/15/22, Callable 5/15/19 @ 103.31 | | | 325,000 | | | | 335,231 | | |
Beazer Homes USA, Inc., 5.88%, 10/15/27, Callable 10/15/22 @ 102.94 (b) | | | 600,000 | | | | 522,606 | | |
Boyd Gaming Corp., 6.38%, 4/1/26, Callable 4/1/21 @ 103.19 | | | 610,000 | | | | 617,570 | | |
Cablevision Systems Corp., 5.88%, 9/15/22 (b) | | | 1,000,000 | | | | 991,710 | | |
Cequel Communications Holdings I LLC/Cequel Capital Corp.,
5.13%, 12/15/21, Callable 8/3/18 @ 101.28 (b) (f) | | | 600,000 | | | | 597,714 | | |
Downstream Development Authority of the Quapaw Tribe of Oklahoma,
10.50%, 2/15/23, Callable 2/15/20 @ 105.25 (f) | | | 1,000,000 | | | | 1,015,370 | | |
Golden Nugget, Inc., 8.75%, 10/1/25, Callable 10/1/20 @ 104.38 (f) | | | 1,000,000 | | | | 1,028,150 | | |
Stars Group Holdings BV/Stars Group US Co-Borrower LLC,
7.00%, 7/15/26, Callable 7/15/21 @ 103.5 (d) (f) | | | 500,000 | | | | 505,210 | | |
Titan Acquisition Ltd. / Titan Co-Borrower LLC, 7.75%, 4/15/26,
Callable 4/15/21 @ 103.88 (e) (f) | | | 1,000,000 | | | | 933,240 | | |
VOC Escrow Ltd., 5.00%, 2/15/28, Callable 2/15/23 @ 102.5 (f) | | | 650,000 | | | | 616,057 | | |
Yum! Brands, Inc., 5.35%, 11/1/43, Callable 5/1/43 @ 100 | | | 1,000,000 | | | | 880,620 | | |
| | | | 9,908,546 | | |
Consumer Staples (6.8%): | |
Albertsons Cos. LLC, 5.75%, 3/15/25, Callable 9/15/19 @ 104.31 | | | 1,000,000 | | | | 885,000 | | |
Apex Tool Group LLC /BC Mountain Finance, Inc., 9.00%, 2/15/23,
Callable 2/15/19 @ 102 (b) (f) | | | 1,000,000 | | | | 969,500 | | |
Cott Holdings, Inc., 5.50%, 4/1/25, Callable 4/1/20 @ 104.13 (e) (f) | | | 759,000 | | | | 738,871 | | |
Dole Food Co., Inc., 7.25%, 6/15/25, Callable 6/15/20 @ 103.63 (f) | | | 1,000,000 | | | | 995,070 | | |
JBS USA LUX SA / JBS USA Finance, Inc., 6.75%, 2/15/28,
Callable 2/15/23 @ 103.38 (b) (f) | | | 670,000 | | | | 632,909 | | |
Post Holdings, Inc., 5.00%, 8/15/26, Callable 8/15/21 @ 102.5 (f) | | | 600,000 | | | | 556,830 | | |
| | | | 4,778,180 | | |
See notes to financial statements.
19
Victory Portfolios
Victory High Yield Fund | | Schedule of Portfolio Investments — continued
June 30, 2018 | |
(Unaudited)
Security Description | | Principal
Amount | | Value | |
Energy (7.9%): | |
Diamond Offshore Drilling, Inc., 4.88%, 11/1/43, Callable 5/1/43 @ 100 | | $ | 1,400,000 | | | $ | 993,650 | | |
Endeavor Energy Resources LP/EER Finance, Inc., 5.50%, 1/30/26,
Callable 1/30/21 @ 104.13 (f) | | | 650,000 | | | | 630,500 | | |
Ensco PLC, 5.75%, 10/1/44, Callable 4/1/44 @ 100 (e) | | | 1,245,000 | | | | 883,502 | | |
Hornbeck Offshore Services, Inc., 5.00%, 3/1/21, Callable 8/3/18 @ 101.25 | | | 1,350,000 | | | | 885,074 | | |
Noble Holding International Ltd., 6.20%, 8/1/40 | | | 1,400,000 | | | | 1,021,286 | | |
Transocean, Inc., 6.80%, 3/15/38 (e) | | | 1,400,000 | | | | 1,162,686 | | |
| | | | 5,576,698 | | |
Financials (3.1%): | |
Algeco Global Finance 2 PLC, 10.00%, 8/15/23,
Callable 2/15/20 @ 105 (b) (e) (f) | | | 900,000 | | | | 908,297 | | |
ASP AMC Merger Sub, Inc., 8.00%, 5/15/25,
Callable 5/15/20 @ 104 (e) (f) | | | 440,000 | | | | 365,402 | | |
Compass Group Diversified Holdings LLC, 8.00%, 5/1/26,
Callable 5/1/21 @ 104 (e) (f) | | | 1,000,000 | | | | 976,720 | | |
| | | | 2,250,419 | | |
Health Care (10.9%): | |
Air Medical Group Holdings, Inc., 6.38%, 5/15/23,
Callable 8/3/18 @ 103.19 (b) (f) | | | 1,000,000 | | | | 930,920 | | |
Avantor, Inc., 9.00%, 10/1/25, Callable 10/1/20 @ 106.75 (b) (e) (f) | | | 1,000,000 | | | | 1,007,900 | | |
Ortho-Clinical Diagnostics, Inc., 6.63%, 5/15/22,
Callable 8/3/18 @ 101.66 (b) (e) (f) | | | 1,000,000 | | | | 986,510 | | |
Polaris Intermediate Corp., 8.50%, 12/1/22, Callable 6/1/19 @ 104 (e) (f) | | | 670,000 | | | | 691,038 | | |
Sotera Health Topco, Inc., 8.13%, 11/1/21, Callable 8/3/18 @ 102 (f) | | | 1,000,000 | | | | 1,011,870 | | |
Surgery Center Holdings, 6.75%, 7/1/25, Callable 7/1/20 @ 103.38 (b) (f) | | | 1,000,000 | | | | 953,180 | | |
Valeant Pharmaceuticals International, Inc., 5.88%, 5/15/23,
Callable 8/3/18 @ 102.94 (b) (e) (f) | | | 1,000,000 | | | | 938,920 | | |
Vizient, Inc., 10.38%, 3/1/24, Callable 3/1/19 @ 107.78 (f) | | | 1,000,000 | | | | 1,103,710 | | |
| | | | 7,624,048 | | |
Industrials (14.3%): | |
Ahern Rentals, Inc., 7.38%, 5/15/23, Callable 8/3/18 @ 105.53 (e) (f) | | | 1,000,000 | | | | 974,980 | | |
Beacon Escrow Corp., 4.88%, 11/1/25, Callable 11/1/20 @ 102.44 (b) (f) | | | 1,330,000 | | | | 1,225,501 | | |
BlueLine Rental Finance Corp./BlueLine Rental LLC, 9.25%, 3/15/24,
Callable 3/15/20 @ 104.63 (f) | | | 1,000,000 | | | | 1,063,590 | | |
Covanta Holding Corp., 5.88%, 7/1/25, Callable 7/1/20 @ 104.41 | | | 1,000,000 | | | | 965,280 | | |
Flexi-Van Leasing, Inc., 10.00%, 2/15/23, Callable 2/15/20 @ 107.5 (f) | | | 330,000 | | | | 312,398 | | |
Manitowoc Foodservice, Inc., 9.50%, 2/15/24, Callable 2/15/19 @ 107.13 | | | 800,000 | | | | 880,832 | | |
Pisces Midco, Inc., 8.00%, 4/15/26, Callable 4/15/21 @ 104 (b) (f) | | | 1,000,000 | | | | 961,410 | | |
SRS Distribution, Inc., 8.25%, 7/1/26, Callable 7/1/21 @ 104.13 (b) (e) (f) | | | 1,000,000 | | | | 996,050 | | |
Triumph Group, Inc., 4.88%, 4/1/21, Callable 8/3/18 @ 101.22 | | | 1,000,000 | | | | 969,440 | | |
W/S Packaging Holdings, Inc., 9.00%, 4/15/23,
Callable 4/15/20 @ 104.5 (e) (f) | | | 800,000 | | | | 810,008 | | |
XPO Logistics, Inc., 6.50%, 6/15/22, Callable 8/3/18 @ 103.25 (f) | | | 925,000 | | | | 947,006 | | |
| | | | 10,106,495 | | |
See notes to financial statements.
20
Victory Portfolios
Victory High Yield Fund | | Schedule of Portfolio Investments — continued
June 30, 2018 | |
(Unaudited)
Security Description | | Shares or
Principal
Amount | | Value | |
Information Technology (1.4%): | |
Hughes Satellite Systems Corp., 6.63%, 8/1/26 | | $ | 670,000 | | | $ | 620,541 | | |
Travelport Corporate Finance PLC, 6.00%, 3/15/26,
Callable 3/15/21 @ 103 (f) | | | 340,000 | | | | 342,428 | | |
| | | | 962,969 | | |
Materials (1.9%): | |
Plastipak Holdings, Inc., 6.25%, 10/15/25, Callable 10/15/20 @ 103.13 (f) | | | 670,000 | | | | 617,057 | | |
Reynolds Group Issuer, Inc., 7.00%, 7/15/24, Callable 7/15/19 @ 103.5 (b) (f) | | | 680,000 | | | | 694,239 | | |
| | | | 1,311,296 | | |
Telecommunication Services (3.6%): | |
Intelsat Jackson Holdings SA, 5.50%, 8/1/23, Callable 8/3/18 @ 102.75 | | | 1,250,000 | | | | 1,122,400 | | |
Telesat Canada/Telesat LLC, 8.88%, 11/15/24,
Callable 11/15/19 @ 106.66 (e) (f) | | | 1,000,000 | | | | 1,079,341 | | |
Windstream Services LLC/Windstream Finance Corp., 8.75%, 12/15/24,
Callable 12/15/22 @ 102.5 (e) (f) | | | 446,000 | | | | 283,241 | | |
| | | | 2,484,982 | | |
Total Corporate Bonds (Cost $45,304,499) | | | 45,003,633 | | |
Collateral for Securities Loaned (14.5%) | |
BlackRock Liquidity Funds TempFund Portfolio, Institutional Class,
2.06% (g) | | | 1,346,280 | | | | 1,346,280 | | |
Fidelity Investments Prime Money Market Portfolio, Class I, 2.07% (g) | | | 1,223,936 | | | | 1,223,936 | | |
Fidelity Investments Money Market Government Portfolio, Class I,
1.81% (g) | | | 2,767,829 | | | | 2,767,829 | | |
Goldman Sachs Financial Square Prime Obligations Fund,
Institutional Class, 2.16% (g) | | | 611,896 | | | | 611,896 | | |
JPMorgan Prime Money Market Fund, Capital Class, 2.05% (g) | | | 3,181,769 | | | | 3,181,769 | | |
Morgan Stanley Institutional Liquidity Prime Portfolio,
Institutional Class, 2.12% (g) | | | 1,101,412 | | | | 1,101,412 | | |
Total Collateral for Securities Loaned (Cost $10,233,122) | | | 10,233,122 | | |
Total Investments (Cost $77,557,427) — 109.2% | | | 76,914,760 | | |
Liabilities in excess of other assets — (9.2)% | | | (6,473,819 | ) | |
NET ASSETS — 100.00% | | $ | 70,440,941 | | |
(a) Non-income producing security.
(b) All or a portion of this security is on loan.
(c) Variable or Floating-Rate Security. Rate disclosed is as of June 30, 2018.
(d) Security purchased on a when-issued basis.
(e) All or a portion of this security has been segregated as collateral for securities purchased on a when-issued basis.
(f) Rule 144A security or other security that is restricted as to resale to institutional investors. The Fund's Adviser has deemed this security to be liquid based upon procedures approved by the Board of Trustees. As of June 30, 2018, the fair value of these securities was $29,401,137 and amounted to 41.7% of net assets.
(g) Rate disclosed is the daily yield on June 30, 2018.
See notes to financial statements.
21
Victory Portfolios
Victory High Yield Fund | | Schedule of Portfolio Investments — continued
June 30, 2018 | |
(Unaudited)
bps — Basis points
LIBOR — London InterBank Offered Rate
LIBOR01M — 1 Month US Dollar LIBOR, rate disclosed as of June 30, 2018, based on the last reset date of the security
LIBOR02M — 2 Month US Dollar LIBOR, rate disclosed as of June 30, 2018, based on the last reset date of the security
LIBOR03M — 3 Month US Dollar LIBOR, rate disclosed as of June 30, 2018, based on the last reset date of the security
LLC — Limited Liability Company
LP — Limited Partnership
PLC — Public Limited Company
See notes to financial statements.
22
Victory Portfolios
Victory Tax-Exempt Fund | | Schedule of Portfolio Investments
June 30, 2018 | |
(Unaudited)
Security Description | | Principal
Amount | | Value | |
Municipal Bonds (101.8%) | |
California (5.5%): | |
Golden State Tobacco Securitization Corp., Series A-1, 5.75%, 6/1/47,
Continuously Callable @ 100 | | $ | 4,355,000 | | | $ | 4,355,000 | | |
Connecticut (4.5%): | |
Connecticut Health and Educational Facilities Authority Revenue Bonds,
Series 2016CT, 5.00%, 12/1/41, Continuously Callable @ 100 | | | 3,185,000 | | | | 3,570,512 | | |
Delaware (3.9%): | |
Delaware State Economic Development Authority Revenue Bonds
1.67%, 4/1/23, KEYBANK, Continuously Callable @ 100 | | | 905,000 | | | | 905,000 | | |
5.00%, 11/15/48, Continuously Callable @ 103 | | | 2,000,000 | | | | 2,225,200 | | |
| | | | 3,130,200 | | |
District of Columbia (2.0%): | |
Metropolitan Washington Airports Authority Airport System Revenue
Refunding Bonds, Series 2011C, 5.00%, 10/1/28, Continuously
Callable @ 100 | | | 1,500,000 | | | | 1,620,495 | | |
Florida (2.8%): | |
Miami-Dade County Public Facilities Revenue & Revenue Refunding Bonds,
Series 2015A, 5.00%, 6/1/33, Continuously Callable @ 100 | | | 2,000,000 | | | | 2,249,080 | | |
Guam (1.4%): | |
Port Authority of Guam Revenue Bonds, 5.00%, 7/1/48, Continuously
Callable @ 100 (a) | | | 1,000,000 | | | | 1,104,510 | | |
Idaho (1.2%): | |
Idaho Fish & Wildlife Foundation, Inc Revenue Bonds | |
5.00%, 12/1/37, Continuously Callable @ 100 | | | 635,000 | | | | 728,751 | | |
5.00%, 12/1/41, Continuously Callable @ 100 | | | 240,000 | | | | 274,488 | | |
| | | | 1,003,239 | | |
Illinois (22.7%): | |
Chicago Board of Education Dedicated Capital Improvement,
6.00%, 4/1/46, Continuously Callable @ 100 (b) | | | 3,775,000 | | | | 4,427,849 | | |
Chicago General Obligation Refunding Bonds | |
Series A, 5.75%, 1/1/33, Continuously Callable @ 100 | | | 2,000,000 | | | | 2,201,680 | | |
Series A, 6.00%, 1/1/38, Continuously Callable @ 100 | | | 1,000,000 | | | | 1,127,340 | | |
Chicago Transit Authority Sales Tax Receipts Revenue Bonds,
Series 2014, 5.00%, 12/1/44, AGC, Continuously Callable @ 100 | | | 2,450,000 | | | | 2,661,680 | | |
Chicago Wastewater Transmission Revenue Bonds, Series A,
5.00%, 1/1/47, Continuously Callable @ 100 | | | 2,000,000 | | | | 2,152,760 | | |
Chicago Wastewater Transmission Revenue Refunding Bonds,
Series 2008C, 5.00%, 1/1/34, Continuously Callable @ 100 | | | 1,000,000 | | | | 1,082,180 | | |
Illinois General Obligation Bonds | |
Series 2013, 5.50%, 7/1/27, Continuously Callable @ 100 | | | 2,000,000 | | | | 2,138,300 | | |
Series D, 5.00%, 11/1/26 | | | 2,000,000 | | | | 2,126,240 | | |
| | | | 17,918,029 | | |
See notes to financial statements.
23
Victory Portfolios
Victory Tax-Exempt Fund | | Schedule of Portfolio Investments — continued
June 30, 2018 | |
(Unaudited)
Security Description | | Principal
Amount | | Value | |
Kansas (1.9%): | |
Kansas Development Finance Authority Hospital Revenue Bonds
5.50%, 11/15/29, PRE-REFUNDED/ESCROWED TO MATURITY,
Pre-refunded 11/15/19 @ 100 | | $ | 35,000 | | | $ | 36,783 | | |
5.50%, 11/15/29, Continuously Callable @ 100 | | | 1,465,000 | | | | 1,530,852 | | |
| | | | 1,567,635 | | |
Kentucky (0.6%): | |
Boone CO Kentucky Pollution Control Revenue Bonds, 1.55%, 8/1/27,
Callable 8/1/18 @ 100, Sumitomo Mitsui Banking Corp. | | | 500,000 | | | | 500,000 | | |
Massachusetts (1.4%): | |
University of Massachusetts Building Authority Project Revenue Bonds,
Series 2014-1, 5.00%, 11/1/39, Continuously Callable @ 100 | | | 1,000,000 | | | | 1,125,750 | | |
Missouri (2.7%): | |
Health & Educational Facilities Authority of the State of Missouri Revenue
Bonds, 4.25%, 12/1/42, Continuously Callable @ 100 (c) | | | 2,000,000 | | | | 1,966,860 | | |
Missouri Environmental Impact & Energy Resource Authority, Water
Pollution Control & Drinking Water Revenue, 5.75%, 1/1/29,
Continuously Callable @ 100 | | | 130,000 | | | | 132,725 | | |
| | | | 2,099,585 | | |
New Jersey (10.9%): | |
New Jersey Economic Development Authority Biomedical Research Facilities
Bonds, Series 2016A, 5.00%, 7/15/29, Continuously Callable @ 100 (b) | | | 885,000 | | | | 964,986 | | |
New Jersey Economic Development Authority School Facilities Construction
Bonds, Series 2015 WW, 5.25%, 6/15/32, Continuously
Callable @ 100 (b) | | | 3,000,000 | | | | 3,257,760 | | |
New Jersey Health Care Facilities Financing Authority Revenue &
Refunding Bonds, Series 2015A, 5.00%, 7/1/46, AGC, Continuously
Callable @ 100 (b) | | | 1,500,000 | | | | 1,650,060 | | |
New Jersey Transportation Trust Fund Authority, Federal Highway
Reimbursement Revenue Notes, 5.00%, 6/15/28, Continuously
Callable @ 100 | | | 1,000,000 | | | | 1,101,440 | | |
Tobacco Settlement Financing Corp., Revenue Bonds, Series 2018 A,
5.00%, 6/1/46, Continuously Callable @ 100 | | | 1,500,000 | | | | 1,646,820 | | |
| | | | 8,621,066 | | |
New York (11.4%): | |
Metropolitan Transportation Authority Dedicated Tax Green Fund Bonds,
Series 2016B-1, 5.00%, 11/15/56, Continuously Callable @ 100 | | | 1,545,000 | | | | 1,719,415 | | |
New York Counties Tobacco Trust II, Tobacco Settlement Pass-Through
Bonds, 5.75%, 6/1/43, Continuously Callable @ 100 | | | 200,000 | | | | 200,514 | | |
New York Utility Debt Securitization Authority Restructuring Bonds,
Series 2013 TE, 5.00%, 12/15/41, Continuously Callable @ 100 | | | 1,500,000 | | | | 1,672,290 | | |
Port Authority of New York & New Jersey Consolidated Bonds,
5.00%, 12/1/32, Continuously Callable @ 100 | | | 1,000,000 | | | | 1,109,330 | | |
Port Authority of New York and New Jersey Consolidated Bonds,
5.00%, 10/1/30, Continuously Callable @ 100 | | | 2,000,000 | | | | 2,169,920 | | |
TSASC, Inc. Tobacco Settlement Bonds, Series A, 5.00%, 6/1/41,
Continuously Callable @ 100 | | | 2,000,000 | | | | 2,170,780 | | |
| | | | 9,042,249 | | |
See notes to financial statements.
24
Victory Portfolios
Victory Tax-Exempt Fund | | Schedule of Portfolio Investments — continued
June 30, 2018 | |
(Unaudited)
Security Description | | Principal
Amount | | Value | |
Oregon (1.7%): | |
Oregon Department of Transportation Highway User Tax Revenue Bonds,
Series 2013A, 5.00%, 11/15/38, Continuously Callable @ 100 | | $ | 1,000,000 | | | $ | 1,122,420 | | |
Oregon State Lottery Revenue Bonds, Series A, 5.25%, 4/1/30,
Continuously Callable @ 100 | | | 205,000 | | | | 222,593 | | |
| | | | 1,345,013 | | |
Pennsylvania (10.9%): | |
Commonwealth Financing Authority Revenue Bonds, 5.00%, 6/1/35,
Continuously Callable @ 100 | | | 1,000,000 | | | | 1,123,440 | | |
Franklin County Industrial Development Authority, Fixed Rate Revenue
Bonds, Series 2010, 5.30%, 7/1/30, Continuously Callable @ 100 | | | 1,000,000 | | | | 1,056,230 | | |
Pennsylvania Higher Educational Facilities Authority Revenue Bonds,
Series 2010E, 5.00%, 5/15/31, Continuously Callable @ 100 | | | 1,000,000 | | | | 1,044,580 | | |
Pennsylvania Turnpike Commission Revenue Bonds, Series 2014 A,
5.00%, 12/1/44, Continuously Callable @ 100 | | | 2,000,000 | | | | 2,179,580 | | |
Philadelphia School District, General Obligation Bonds 5.00%, 9/1/38,
STATE AID WITHHOLDING, Continuously Callable @ 100 | | | 1,200,000 | | | | 1,331,796 | | |
Series 2016F, 5.00%, 9/1/37, Continuously Callable @ 100 | | | 1,815,000 | | | | 1,987,607 | | |
| | | | 8,723,233 | | |
Tennessee (2.0%): | |
Johnson City Health & Educational Facilities Board, Hospital Refunding
Revenue Bonds, Series 2010A, 5.63%, 7/1/30,
Pre-refunded 7/1/20 @ 100 | | | 1,500,000 | | | | 1,612,928 | | |
Texas (9.6%): | |
Canadian River Municipal Water Authority, Subordinate Lien Contract
Revenue Bonds, Series 2011, 5.00%, 2/15/26, Continuously
Callable @ 100 (b) | | | 2,000,000 | | | | 2,146,320 | | |
Fort Worth International Airport Joint Revenue Bonds, Series A,
5.00%, 11/1/38, Continuously Callable @ 100 | | | 1,000,000 | | | | 1,047,460 | | |
New Hope Cultural Education Facilities Finance Corp., Revenue Bonds
Series A, 5.00%, 4/1/37, Continuously Callable @ 100 | | | 1,500,000 | | | | 1,641,225 | | |
Serries A1, 5.00%, 7/1/47, Continuously Callable @ 102 | | | 500,000 | | | | 533,105 | | |
Texas Private Activity Bond Surface Transportation Corp., Revenue Bonds,
Series 2009, 6.88%, 12/31/39, Continuously Callable @ 100 (b) | | | 2,130,000 | | | | 2,264,147 | | |
| | | | 7,632,257 | | |
Utah (1.4%): | |
Utah Infrastructure Agency Revenue Bonds, Series A, 5.00%, 10/15/40,
Continuously Callable @ 100 | | | 1,000,000 | | | | 1,081,350 | | |
Washington (3.3%): | |
Richland Electric Utility Revenue Bonds, 5.00%, 11/1/41, Continuously
Callable @ 100 | | | 2,370,000 | | | | 2,633,449 | | |
Total Municipal Bonds (Cost $78,409,971) | | | 80,935,580 | | |
Total Investments (Cost $78,409,971) — 101.8% | | | 80,935,580 | | |
Liabilities in excess of other assets — (1.8)% | | | (1,449,707 | ) | |
NET ASSETS — 100.00% | | $ | 79,485,873 | | |
See notes to financial statements.
25
Victory Portfolios
Victory Tax-Exempt Fund | | Schedule of Portfolio Investments — continued
June 30, 2018 | |
(Unaudited)
(a) Security purchased on a when-issued basis.
(b) All or a portion of this security has been segregated as collateral for derivative instruments and/or securities purchased on a when-issued basis.
(c) Rule 144A security or other security that is restricted as to resale to institutional investors. The Fund's Adviser has deemed this security to be liquid based upon procedures approved by the Board of Trustees. As of June 30, 2018, the fair value of these securities was $1,966,860 and amounted to 2.5% of net assets.
See notes to financial statements.
26
Victory Portfolios
Victory High Income Municipal Bond Fund | | Schedule of Portfolio Investments
June 30, 2018 | |
(Unaudited)
Security Description | | Principal
Amount | | Value | |
Municipal Bonds (102.1%) | |
Arizona (1.0%): | |
Industrial Development Authority of the City of Phoenix/The Revenue Bonds,
5.00%, 7/1/42, Continuously Callable @ 100 | | $ | 500,000 | | | $ | 552,160 | | |
California (7.6%): | |
California Public Works Board, Lease Revenue Bonds, Series 2019 I-1,
6.63%, 11/1/34, Continuously Callable @ 100 | | | 30,000 | | | | 30,233 | | |
Golden State Tobacco Securitization Corp., Series A-1, 5.75%,
6/1/47, Continuously Callable @ 100 | | | 3,350,000 | | | | 3,349,999 | | |
Golden State Tobacco Securitization Corp., Revenue Bonds,
Series A-1, 5.00%, 6/1/47, Continuously Callable @ 100 | | | 1,000,000 | | | | 1,026,100 | | |
| | | | 4,406,332 | | |
Colorado (3.6%): | |
Regional Transportation District, Denver Transit Partners Eagle P3 Project,
Series 2010, 6.00%, 1/15/34, Continuously Callable @ 100 | | | 2,000,000 | | | | 2,092,600 | | |
District of Columbia (2.2%): | |
District of Columbia Tobacco Settlement Financing Corp.,
6.50%, 5/15/33 (a) | | | 1,115,000 | | | | 1,252,669 | | |
Florida (12.6%): | |
Osceola County Expressway System Revenue Bonds, Poinciana Parkway
Project, Series 2014A, 5.38%, 10/1/47, Continuously Callable @ 100 | | | 1,500,000 | | | | 1,626,495 | | |
Sumter County Village Community Development District No. 10
Special Assessment Revenue Bonds, Series 2014, 5.75%, 5/1/31,
Continuously Callable @ 100 | | | 1,340,000 | | | | 1,530,414 | | |
Sumter County Village Community Development District No. 8
Special Assessment Refunding Revenue Bonds, Series 2010,
6.13%, 5/1/39, Continuously Callable @ 100 | | | 1,905,000 | | | | 1,984,762 | | |
Sumter County Village Community Development District No. 8
Special Assessment Revenue Bonds, Series 2010, 6.13%, 5/1/40,
Continuously Callable @ 100 | | | 1,975,000 | | | | 2,057,239 | | |
| | | | 7,198,910 | | |
Illinois (16.7%): | |
Chicago Board of Education Dedicated Capital Improvement, 6.00%,
4/1/46, Continuously Callable @ 100 (a) | | | 2,500,000 | | | | 2,932,349 | | |
Chicago General Obligation Refunding Bonds | |
Series 2015C, 5.00%, 1/1/38, Continuously Callable @ 100 | | | 1,000,000 | | | | 1,034,790 | | |
Series A, 6.00%, 1/1/38, Continuously Callable @ 100 | | | 1,000,000 | | | | 1,127,340 | | |
Chicago O'Hare International Airport General Airport Third Lien
Revenue Bonds, 5.75%, 1/1/39, Continuously Callable @ 100 | | | 240,000 | | | | 259,582 | | |
Illinois Finance Authority Revenue Bonds | |
6.50%, 4/1/44, Pre-refunded 10/1/19 @ 100 | | | 295,000 | | | | 312,258 | | |
6.50%, 4/1/44, Continuously Callable @ 100 | | | 460,000 | | | | 477,480 | | |
Illinois General Obligation Bonds | |
Series June 2013, 5.50%, 7/1/25, Continuously Callable @ 100 | | | 1,000,000 | | | | 1,077,470 | | |
Series June 2013, 5.50%, 7/1/33, Continuously Callable @ 100 | | | 1,000,000 | | | | 1,057,110 | | |
Series June 2013, 5.50%, 7/1/38, Continuously Callable @ 100 | | | 1,250,000 | | | | 1,318,913 | | |
| | | | 9,597,292 | | |
See notes to financial statements.
27
Victory Portfolios
Victory High Income Municipal Bond Fund | | Schedule of Portfolio Investments — continued
June 30, 2018 | |
(Unaudited)
Security Description | | Principal
Amount | | Value | |
Massachusetts (3.0%): | |
Massachusetts Educational Financing Authority, Education Loan
Revenue Bonds, Issue J | |
Series 2011, 5.63%, 7/1/28, Continuously Callable @ 100 (a) | | $ | 455,000 | | | $ | 495,536 | | |
Series 2011, 5.63%, 7/1/29, Continuously Callable @ 100 (a) | | | 920,000 | | | | 999,065 | | |
Series 2011, 5.63%, 7/1/33, Continuously Callable @ 100 (a) | | | 230,000 | | | | 247,862 | | |
| | | | 1,742,463 | | |
Missouri (6.5%): | |
Health & Educational Facilities Authority of the State of Missouri
Revenue Bonds | |
4.25%, 12/1/42, Continuously Callable @ 100 (b) | | | 2,650,000 | | | | 2,606,089 | | |
Series A, 5.00%, 11/15/43, Continuously Callable @ 100 | | | 1,000,000 | | | | 1,131,790 | | |
| | | | 3,737,879 | | |
New Jersey (10.2%): | |
New Jersey Economic Development Authority School Facilities
Construction Bonds, Series 2015 WW, 5.25%, 6/15/32, Continuously
Callable @ 100 (a) | | | 1,000,000 | | | | 1,085,920 | | |
New Jersey Economic Development Motor Vehicle Surcharges
Subordinate Revenue Bonds, Series A, 5.00%, 7/1/33, Continuously
Callable @ 100 | | | 500,000 | | | | 542,735 | | |
New Jersey Higher Education Student Assistance Authority, Student Loan
Revenue Bonds, Series 2011-1, 5.75%, 12/1/28, Continuously
Callable @ 100 | | | 900,000 | | | | 963,594 | | |
South Jersey Port Corp., Revenue Bonds, Series B, 5.00%, 1/1/48,
Continuously Callable @ 100 | | | 1,500,000 | | | | 1,628,415 | | |
Tobacco Settlement Financing Corp., Revenue Bonds, Series 2018 A,
5.00%, 6/1/46, Continuously Callable @ 100 | | | 1,500,000 | | | | 1,646,820 | | |
| | | | 5,867,484 | | |
New York (2.9%): | |
Port Authority of New York & New Jersey Special Project Bonds, JFK
International Air Terminal LLC Project, Series 8, 6.00%, 12/1/36,
Continuously Callable @ 100 | | | 1,500,000 | | | | 1,641,240 | | |
North Dakota (2.5%): | |
Grand Forks, North Dakota Senior Housing and Nursing Facility
Revenue Bonds, 5.00%, 12/1/36, Continuously Callable @ 100 | | | 1,500,000 | | | | 1,460,430 | | |
Ohio (2.6%): | |
Richfield Joint Recreation District General Obligation Recreational
Facilities Improvement Bonds, Series 2015, 5.25%, 12/1/42,
Continuously Callable @ 100 | | | 1,500,000 | | | | 1,502,400 | | |
Oklahoma (2.3%): | |
Oklahoma Development Finance Authority Continuing Care Retirement
Community Revenue Refunding Bonds, Series 2012, 6.00%, 1/1/32,
Continuously Callable @ 100 (b) | | | 1,885,000 | | | | 1,307,325 | | |
Oregon (0.9%): | |
Clackamas County Hospital Facility Authority Revenue Bonds, Series A,
5.00%, 11/15/52, Continuously Callable @ 102 | | | 500,000 | | | | 544,425 | | |
See notes to financial statements.
28
Victory Portfolios
Victory High Income Municipal Bond Fund | | Schedule of Portfolio Investments — continued
June 30, 2018 | |
(Unaudited)
Security Description | | Principal
Amount | | Value | |
Pennsylvania (6.0%): | |
Commonwealth Financing Authority, Revenue Bonds, 5.00%, 6/1/34,
Continuously Callable @ 100 | | $ | 1,000,000 | | | $ | 1,127,180 | | |
Cumberland County Municipal Authority, Diakon Lutheran Social
Ministries Project Revenue Bonds, Series 2009, 6.13%, 1/1/29,
Continuously Callable @ 100 | | | 150,000 | | | | 152,903 | | |
Dauphin County General Authority Health Systems Revenue Bonds,
6.00%, 6/1/36, Continuously Callable @ 100 | | | 230,000 | | | | 238,098 | | |
Pennsylvania Turnpike Commission Turnpike Subordinate Revenue
Bonds, Series A, 5.63%, 12/1/31, Pre-refunded 12/1/20 @ 100 | | | 335,000 | | | | 365,368 | | |
Philadelphia School District, General Obligation Bonds, Series 2015A,
5.00%, 9/1/35, Continuously Callable @ 100 | | | 1,400,000 | | | | 1,526,588 | | |
| | | | 3,410,137 | | |
South Carolina (3.0%): | |
Lancaster County, Walnut Creek Improvement District Assessment
Refunding Revenue Bonds, Series 2016A-1, 5.00%, 12/1/37,
Continuously Callable @ 100 | | | 1,675,000 | | | | 1,716,289 | | |
South Dakota (1.7%): | |
Oglala Sioux Tribe, 5.00%, 10/1/22, Callable 8/3/18 @ 100 (b) | | | 1,000,000 | | | | 999,040 | | |
Tennessee (2.8%): | |
Johnson City Health & Educational Facilities Board, Hospital Refunding
Revenue Bonds, Series 2010A, 5.63%, 7/1/30, Pre-refunded
7/1/20 @ 100 | | | 1,500,000 | | | | 1,612,928 | | |
Texas (6.6%): | |
New Hope Cultural Education Facilities Finance Corp., Revenue Bonds | |
Series A, 5.00%, 4/1/42, Continuously Callable @ 100 | | | 1,500,000 | | | | 1,632,120 | | |
Series B, 5.00%, 7/1/47, Continuously Callable @ 102 | | | 1,000,000 | | | | 1,022,330 | | |
Texas Private Activity Bond Surface Transportation Corp. Revenue Bonds,
NTE Mobility Partners Segments 3 LLC — Segments 3A & 3B Facility,
Series 2013, 7.00%, 12/31/38, Continuously Callable @ 100 | | | 1,000,000 | | | | 1,175,260 | | |
| | | | 3,829,710 | | |
Utah (4.7%): | |
Utah Charter School Finance Authority Revenue Bonds, 5.00%, 4/15/37,
Continuously Callable @ 100 | | | 500,000 | | | | 554,610 | | |
Utah Infrastructure Agency Revevnue Bonds | |
Series A, 5.25%, 10/15/33, Continuously Callable @ 100 (c) | | | 750,000 | | | | 843,983 | | |
Series A, 5.38%, 10/15/40, Continuously Callable @ 100 (c) | | | 1,150,000 | | | | 1,285,332 | | |
| | | | 2,683,925 | | |
Washington (0.9%): | |
Kalispel Tribe of Indians Revenue Bonds, Series A, 5.25%, 1/1/38,
Continuously Callable @ 100 | | | 500,000 | | | | 503,180 | | |
See notes to financial statements.
29
Victory Portfolios
Victory High Income Municipal Bond Fund | | Schedule of Portfolio Investments — continued
June 30, 2018 | |
(Unaudited)
Security Description | | Principal
Amount | | Value | |
West Virginia (1.8%): | |
The Country Commission of Monongalia Country, WV Special District
Excise Tax Revenue, Refunding and Improvement Bonds,
Series 2017A, 5.75%, 6/1/43, Continuously Callable @ 100 (b) | | $ | 1,000,000 | | | $ | 1,045,410 | | |
Total Municipal Bonds (Cost $57,107,666) | | | 58,704,228 | | |
Total Investments (Cost $57,107,666) — 102.1% | | | 58,704,228 | | |
Liabilities in excess of other assets — (2.1)% | | | (1,230,844 | ) | |
NET ASSETS — 100.00% | | $ | 57,473,384 | | |
(a) All or a portion of this security has been segregated as collateral for securities purchased on a when-issued basis.
(b) Rule 144A security or other security that is restricted as to resale to institutional investors. The Fund's Adviser has deemed this security to be liquid based upon procedures approved by the Board of Trustees. As of June 30, 2018, the fair value of these securities was $5,957,864 and amounted to 10.4% of net assets.
(c) Security purchased on a when-issued basis.
LLC — Limited Liability Company
See notes to financial statements.
30
Victory Portfolios
Victory Floating Rate Fund | | Schedule of Portfolio Investments
June 30, 2018 | |
(Unaudited)
Security Description | | Principal
Amount | | Value | |
Senior Secured Loans (91.4%) | |
Acrisure LLC, 1st Lien Term Loan B, 6.61%, (LIBOR03M+425bps), 11/22/23,
Callable 8/3/18 @ 101(a) | | $ | 3,900,773 | | | $ | 3,883,684 | | |
Admi Corp., 1st Lien Term Loan B, 5.34%, (LIBOR01M+325bps), 4/30/25,
Callable 8/3/18 @ 101(a) | | | 8,000,000 | | | | 7,975,040 | | |
Advanced Disposal Services, Inc., 4.23%, (LIBOR01W+225bps), 11/10/23,
Callable 8/3/18 @ 100 (a) | | | 6,276,656 | | | | 6,255,972 | | |
Ai Ladder Luxembourg Subco Sarl, 1st Lien Term Loan B,
7.02%, (LIBOR01M+450bps), 5/4/25 (a) (b) | | | 6,000,000 | | | | 5,967,480 | | |
Air Methods Corp., 1st Lien Term Loan,
5.83%, (LIBOR03M+350bps), 4/13/24 (a) | | | 6,900,639 | | | | 6,605,223 | | |
Albertson's LLC, 1st Lien Term Loan B-5,
5.34%, (LIBOR03M+300bps), 12/21/22, Callable 8/3/18 @ 100 (a) | | | 4,883,193 | | | | 4,835,168 | | |
Alphabet Holding Co., Inc., 1st Lien Term Loan,
5.59%, (LIBOR01M+350bps), 8/15/24, Callable 8/3/18 @ 100 (a) | | | 5,558,000 | | | | 5,162,388 | | |
Alphabet Holding Co., Inc., 2nd Lien Term Loan,
9.84%, (LIBOR01M+775bps), 8/15/25, Callable 8/3/18 @ 102 (a) | | | 4,950,000 | | | | 4,011,579 | | |
American Renal Holdings, Inc., 5.23%-5.34%, (LIBOR01M+325bps),
6/15/24, Callable 8/3/18 @ 100 (a) | | | 7,128,000 | | | | 7,090,055 | | |
Amneal Pharmaceuticals LLC, 1st Lien Term Loan B,
5.63%, (LIBOR01M+350bps), 3/23/25, Callable 8/3/18 @ 101 (a) | | | 7,998,151 | | | | 7,975,676 | | |
AmWINS Group, Inc., 4.76%-4.84%, (LIBOR01M+275bps), 1/25/24,
Callable 8/3/18 @ 100 (a) | | | 7,880,000 | | | | 7,839,394 | | |
Apex Tool Group LLC, 1st Lien Term Loan B, 5.84%, (LIBOR01M+375bps),
2/1/22, Callable 8/3/18 @ 101 (a) | | | 7,187,006 | | | | 7,180,207 | | |
Asurion LLC, 5.08%, (LIBOR01M+300bps), 11/3/24 (a) (b) | | | 4,000,000 | | | | 3,985,000 | | |
ATS Consolidated, Inc., 2nd Lien Term Loan, 9.84%, (LIBOR01M+775bps),
2/23/26, Callable 8/3/18 @ 102 (a) | | | 2,000,000 | | | | 1,997,500 | | |
Avantor, Inc., 1st Lien Term Loan, 6.09%, (LIBOR01M+400bps), 9/22/24,
Callable 8/3/18 @ 101 (a) | | | 3,980,000 | | | | 3,996,638 | | |
Avaya, Inc., 1st Lien Term Loan B, 6.32%, (LIBOR01M+425bps), 12/15/24,
Callable 8/3/18 @ 101 (a) | | | 7,462,500 | | | | 7,467,213 | | |
Bass Pro Group LLC, Term Loan B, 7.09%, (LIBOR01M+500bps), 12/16/23,
Callable 8/3/18 @ 100 (a) | | | 7,443,750 | | | | 7,448,451 | | |
BJ's Wholesale Club, Inc., 9.53%, (LIBOR01M+750bps), 1/27/25,
Callable 8/3/18 @ 101 (a) | | | 4,291,697 | | | | 4,329,249 | | |
BJ's Wholesale Club, Inc., 5.53%, (LIBOR01M+350bps), 2/3/24,
Callable 8/3/18 @ 100 (a) | | | 8,835,891 | | | | 8,827,055 | | |
Blount International, Inc., 1st Lien Term Loan B,
6.23%, (LIBOR01M+425bps), 4/12/23, Callable 8/3/18 @ 100 (a) | | | 8,977,500 | | | | 9,016,821 | | |
Boyd Gaming Corp., 4.49%, (LIBOR01W+250bps), 9/15/23,
Callable 8/3/18 @ 100 (a) | | | 5,506,307 | | | | 5,513,906 | | |
Brand Energy & Infrastructure Services, Inc., 1st Lien Term Loan,
6.58%-6.61%, (LIBOR03M+425bps), 6/21/24, Callable 8/3/18 @ 100 (a) | | | 8,910,000 | | | | 8,916,699 | | |
Builders FirstSource, Inc., 5.33%, (LIBOR03M+300bps), 2/29/24,
Callable 8/3/18 @ 100 (a) | | | 7,676,667 | | | | 7,667,046 | | |
BW NHHC Holdco, Inc., 7.07%, (LIBOR01M+500bps), 5/16/25 (a) | | | 5,000,000 | | | | 4,934,400 | | |
BW NHHC Holdco, Inc., 11.07%, (LIBOR01M+900bps), 5/16/26 (a) | | | 3,000,000 | | | | 2,940,000 | | |
See notes to financial statements.
31
Victory Portfolios
Victory Floating Rate Fund | | Schedule of Portfolio Investments — continued
June 30, 2018 | |
(Unaudited)
Security Description | | Principal
Amount | | Value | |
Casa Systems, Inc., 6.09%, (LIBOR01M+400bps), 12/15/23,
Callable 8/3/18 @ 100 (a) | | $ | 8,865,000 | | | $ | 8,876,109 | | |
Change Healthcare LLC, 4.73-4.84%, (LIBOR01M+275bps), 3/1/24,
Callable 8/3/18 @ 100 (a) | | | 7,900,000 | | | | 7,869,033 | | |
Chassix, Inc., 7.88%, (LIBOR03M+550bps), 11/10/23,
Callable 8/3/18 @ 102 (a) | | | 2,956,667 | | | | 2,956,667 | | |
Chassix, Inc., 8%, (LIBOR06M+550bps), 11/10/23,
Callable 8/3/18 @ 102 (a) | | | 3,013,333 | | | | 3,013,333 | | |
Chesapeake Energy Corp., 9.59%, (LIBOR01M+750bps), 8/23/21,
Callable 8/23/18 @ 104.25 (a) | | | 10,500,000 | | | | 10,974,705 | | |
CIBT Solutions, Inc., 1st Lien Term Loan,
6.08%, (LIBOR03M+375bps), 6/1/24, Callable 8/3/18 @ 100 (a) | | | 5,940,000 | | | | 5,947,444 | | |
Concentra, Inc., 1st Lien Term Loan, 4.74%, (LIBOR01M+275bps), 6/1/22,
Callable 8/1/18 @ 100 (a) | | | 5,284,007 | | | | 5,277,402 | | |
Consolidated Communications, Inc., 1st Lien Term Loan B,
4.99%-5.10%, (LIBOR01M+300bps), 10/5/23, Callable 8/3/18 @ 100 (a) | | | 4,974,814 | | | | 4,895,863 | | |
CPI Holdco LLC, 1st Lien Term Loan, 5.59%, (LIBOR01M+350bps), 3/21/24,
Callable 8/3/18 @ 100 (a) | | | 6,912,526 | | | | 6,938,513 | | |
Crown Finance US, Inc., 1st Lien Term Loan B, 4.59%, (LIBOR01M+250bps),
2/7/25, Callable 8/3/18 @ 101 (a) | | | 8,977,500 | | | | 8,903,610 | | |
Dayco Products LLC, 6.56%, (LIBOR03M+425bps), 5/19/24,
Callable 8/3/18 @ 101 (a) | | | 7,920,000 | | | | 7,900,200 | | |
Dole Food Co., Inc., 4.78%-4.84%, (LIBOR01M+275bps), 3/24/24,
Callable 8/3/18 @ 101 (a) | | | 6,063,158 | | | | 6,027,217 | | |
Dole Food Co., Inc., 5.08%, (LIBOR03M+275bps), 3/24/24,
Callable 8/3/18 @ 101 (a) | | | 175,158 | | | | 174,120 | | |
Dole Food Co., Inc., 6.75%, (PRIME+175bps), 3/24/24,
Callable 8/3/18 @ 101 (a) | | | 1,684 | | | | 1,674 | | |
Eldorado Resorts, Inc., 4.38%, (LIBOR01M+225bps), 3/16/24,
Callable 8/3/18 @ 100 (a) | | | 1,780,064 | | | | 1,772,285 | | |
Eldorado Resorts, Inc., 4.38%, (LIBOR02M+225bps), 3/16/24,
Callable 8/3/18 @ 100 (a) | | | 2,488,298 | | | | 2,477,424 | | |
Engineered Machinery Holdings, Inc., 2nd Lien Term Loan,
9.58%, (LIBOR03M+725bps), 7/19/25, Callable 7/19/18 @ 101 (a) | | | 4,423,404 | | | | 4,428,934 | | |
First Data Corp., 1st Lien Term Loan, 4.09%, (LIBOR01M+200bps), 7/10/22,
Callable 8/3/18 @ 100 (a) | | | 4,297,968 | | | | 4,276,478 | | |
Gates Global LLC, 1st Lien Term Loan B2, 5.08%, (LIBOR03M+275bps),
3/31/24, Callable 8/3/18 @ 100 (a) | | | 7,544,720 | | | | 7,532,542 | | |
Genoa A Qol Healthcare Co. LLC, 1st Lien Term Loan,
5.34%, (LIBOR01M+325bps), 10/28/23, Callable 8/3/18 @ 100 (a) | | | 5,895,450 | | | | 5,888,062 | | |
Genoa Healthcare Co. LLC, 10.09%, (LIBOR01M+800bps), 10/28/24,
Callable 8/3/18 @ 101 (a) | | | 3,000,000 | | | | 3,022,500 | | |
Gentiva Health Services, Inc., 6.13%, (LIBOR02M+375bps), 6/21/25 (a) (b) | | | 3,076,923 | | | | 3,053,846 | | |
Gentive Health Services, Inc., 6.13%, (LIBOR02M+375bps), 6/21/25 (a) (b) | | | 1,923,077 | | | | 1,908,654 | | |
Gentive Health Services, Inc., 9.38%, (LIBOR02M+700bps), 6/21/26 (a) (b) | | | 2,250,000 | | | | 2,272,500 | | |
Golden Nugget, Inc., 1st Lien Term Loan,
4.80%-4.84%, (LIBOR01M+275bps), 10/4/23, Callable 8/3/18 @ 101 (a) | | | 6,996,294 | | | | 6,982,687 | | |
Greenway Health LLC, 6.08%, (LIBOR03M+375bps), 2/16/24,
Callable 8/3/18 @ 100 (a) | | | 5,940,000 | | | | 5,928,864 | | |
See notes to financial statements.
32
Victory Portfolios
Victory Floating Rate Fund | | Schedule of Portfolio Investments — continued
June 30, 2018 | |
(Unaudited)
Security Description | | Principal
Amount | | Value | |
GTT Communications, Inc., 1st Lien Term Loan B, 4.88%,
(LIBOR02M+275bps), 6/2/25, Callable 8/3/18 @ 101 (a) | | $ | 8,000,000 | | | $ | 7,874,000 | | |
Gulf Finance LLC, 1st Lien Term Loan B, 7.59%, (LIBOR03M+525bps),
8/25/23, Callable 8/3/18 @ 100 (a) | | | 8,870,048 | | | | 7,632,021 | | |
Hertz Corp., Term Loan B1, 4.85%, (LIBOR01M+275bps), 6/30/23,
Callable 8/3/18 @ 100 (a) | | | 7,819,132 | | | | 7,756,887 | | |
Hub International, Ltd., 1st Lien Term Loan B, 5.36%, (LIBOR01M+300bps),
4/25/25, Callable 8/3/18 @ 101 (a) | | | 7,500,000 | | | | 7,450,350 | | |
Infor(US), Inc., 1st Lien Term Loan B6, 4.84%, (LIBOR01M+275bps), 2/1/22,
Callable 8/3/18 @ 100 (a) | | | 8,612,285 | | | | 8,562,639 | | |
Intelsat Jackson Holdings SA, 1st Lien Term Loan B3, 5.85%,
(LIBOR01M+375bps), 6/30/19, Callable 8/3/18 @ 101 (a) | | | 10,000,000 | | | | 9,967,100 | | |
Janus International Group LLC, 1st Lien Term Loan, 5.09%,
(LIBOR01M+300bps), 2/9/25, Callable 8/3/18 @ 101 (a) | | | 2,992,500 | | | | 2,940,000 | | |
Janus International Group LLC, 2nd Lien Term Loan, 9.84%,
(LIBOR01M+775bps), 2/9/26, Callable 8/3/18 @ 102 (a) | | | 3,000,000 | | | | 2,964,990 | | |
Kindred Healthcare, Inc., 7.38%, (LIBOR01M+500bps), 6/21/25 (a) (b) | | | 6,000,000 | | | | 5,940,000 | | |
Kindred Healthcare, Inc., Term Loan B, 5.88%, (LIBOR03M+350bps), 4/9/21,
Callable 8/3/18 @ 100 (a) | | | 7,374,225 | | | | 7,364,983 | | |
LBM Borrower LLC, 1st Lien Term Loan C, 5.85%, (LIBOR01M+375bps),
8/20/22, Callable 8/3/18 @ 101 (a) | | | 7,866,528 | | | | 7,861,651 | | |
Leslie's Poolmart, Inc., Term Loan B, 5.59%, (LIBOR01M+350bps),
8/16/23, Callable 8/3/18 @ 101 (a) | | | 6,752,567 | | | | 6,739,028 | | |
Lifescan Global Corp., 11.43%, (LIBOR12M+950bps), 6/19/25 (a) (b) | | | 2,250,000 | | | | 2,154,375 | | |
Lifescan Global Corp., 7.93%, (LIBOR12M+600bps), 6/19/24 (a) (b) | | | 3,600,000 | | | | 3,483,000 | | |
Monitronics International, Inc., Term Loan B2, 7.83%,
(LIBOR03M+550bps), 9/30/22, Callable 8/3/18 @ 101 (a) | | | 5,158,125 | | | | 4,912,491 | | |
Navicure, Inc., 1st Lien Term Loan, 5.84%, (LIBOR01M+375bps), 11/1/24,
Callable 8/3/18 @ 100 (a) | | | 3,980,000 | | | | 3,960,050 | | |
Navicure, Inc., 2nd Lien Term Loan, 9.59%, (LIBOR01M+750bps), 11/1/25,
Callable 8/3/18 @ 102 (a) | | | 2,500,000 | | | | 2,500,000 | | |
Navistar, Inc., 1st Lien Term Loan B, 5.53%, (LIBOR01M+350bps), 11/2/24,
Callable 8/3/18 @ 100 (a) | | | 7,481,250 | | | | 7,476,612 | | |
nThrive, Inc., 1st Lien Term Loan B2, 6.59%, (LIBOR01M+450bps), 10/20/22,
Callable 8/3/18 @ 100 (a) | | | 9,800,000 | | | | 9,726,312 | | |
Ortho-Clinical Diagnostics SA, 1st Lien Term Loan B, 5.34%,
(LIBOR01M+325bps), 5/22/25, Callable 8/3/18 @ 101 (a) | | | 6,840,674 | | | | 6,810,781 | | |
Packaging Coordinators Midco, Inc., 2nd Lien Term Loan,
11.09%, (LIBOR03M+875bps), 7/1/24, Callable 8/3/18 @ 100 (a) | | | 6,800,000 | | | | 6,766,000 | | |
Perspecta, Inc., 1st Lien Term Loan B, 4.23-4.34%, (LIBOR01M+225bps),
4/28/25, Callable 8/3/18 @ 101 (a) | | | 6,500,000 | | | | 6,516,250 | | |
PetSmart, Inc., 5.01%, (LIBOR01M+300bps), 3/10/22,
Callable 8/3/18 @ 100 (a) | | | 8,154,710 | | | | 6,724,537 | | |
PharMerica Corp., 1st Lien Term Loan, 5.55%, (LIBOR01M+350bps), 9/26/24,
Callable 8/3/18 @ 100 (a) | | | 2,992,500 | | | | 2,985,930 | | |
PharMerica Corp., 2nd Lien Term Loan, 9.80%, (LIBOR01M+775bps), 9/26/25,
Callable 8/3/18 @ 102 (a) | | | 2,000,000 | | | | 1,997,500 | | |
Pisces Midco, Inc. 1st Lien Term Loan B, 6.09%, (LIBOR03M+375bps),
3/29/25 (a) | | | 4,000,000 | | | | 3,987,520 | | |
Prospect Medical Holdings, Inc., 1st Lien Term Loan B, 7.50%,
(LIBOR01M+550bps), 2/16/24, Callable 8/3/18 @ 101 (a) | | | 2,992,500 | | | | 2,985,000 | | |
See notes to financial statements.
33
Victory Portfolios
Victory Floating Rate Fund | | Schedule of Portfolio Investments — continued
June 30, 2018 | |
(Unaudited)
Security Description | | Principal
Amount | | Value | |
Radiate Holdco LLC, 5.09%, (LIBOR01M+300bps), 2/1/24,
Callable 7/26/18 @ 100 (a) | | $ | 7,900,000 | | | $ | 7,779,933 | | |
Reynolds Group Holdings, Inc., 1st Lien Term Loan B,
4.84%, (LIBOR01M+275bps), 2/5/23, Callable 8/3/18 @ 100 (a) | | | 9,079,670 | | | | 9,053,090 | | |
Robertshaw US Holding Corp., 1st Lien Term Loan,
10.13%, (LIBOR01M+350bps), 2/15/25, Callable 8/3/18 @ 101 (a) | | | 1,995,000 | | | | 1,990,000 | | |
Robertshaw US Holding Corp., 2nd Lien Term Loan,
5.63%, (LIBOR01M+800bps), 2/15/26, Callable 8/3/18 @ 102 (a) | | | 4,000,000 | | | | 3,940,000 | | |
Scientific Games International, Inc., 1st Lien Term Loan B5,
4.84%, (LIBOR01M+275bps), 8/14/24, Callable 8/3/18 @ 101 (a) | | �� | 477,894 | | | | 474,301 | | |
Scientific Games International, Inc., 1st Lien Term Loan B5,
4.92%, (LIBOR02M+275bps), 8/14/24, Callable 8/3/18 @ 101 (a) | | | 2,009,622 | | | | 1,994,512 | | |
Select Medical Corp., 4.80%, (LIBOR01M+275bps), 2/13/24,
Callable 8/3/18 @ 101 (a) | | | 5,398,353 | | | | 5,384,823 | | |
Select Medical Corp., 6.75%, (Prime+175bps), 2/13/24,
Callable 8/3/18 @ 101 (a) | | | 2,973 | | | | 2,965 | | |
SIWF Holdings, Inc., 6.32%, (LIBOR01M+425bps), 5/27/25 (a) | | | 4,000,000 | | | | 4,015,000 | | |
SIWF Holdings, Inc., 10.57%, (LIBOR01M+850bps) 5/26/26 (a) | | | 1,500,000 | | | | 1,440,000 | | |
Sprint Communications, Inc., 1st Lien Term Loan B,
4.63%, (LIBOR01M+250bps), 2/2/24, Callable 8/3/18 @ 100 (a) | | | 4,987,374 | | | | 4,960,274 | | |
SRS Distribution, Inc., 1st Lien Term Loan B, 5.58%, (LIBOR03M+325bps),
5/19/25, Callable 8/3/18 @ 101 (a) | | | 4,000,000 | | | | 3,936,680 | | |
StandardAero Aviation Holdings, Inc. 1st Lien Term Loan,
5.84%, (LIBOR01M+375bps), 7/7/22, Callable 8/3/18 @ 100 (a) | | | 7,780,000 | | | | 7,783,276 | | |
Station Casinos LLC, Term Loan B, 4.60%, (LIBOR01M+250bps), 6/8/23,
Callable 8/3/18 @ 100 (a) | | | 7,728,847 | | | | 7,692,273 | | |
Sterigenics-Nordion Holdings LLC, 5.33%, (LIBOR03M+300bps), 5/15/22 (a) | | | 7,857,664 | | | | 7,828,123 | | |
Tecomet, Inc., 1st Lien Term Loan B, 5.50%, (LIBOR01M+350bps), 4/18/24,
Callable 8/3/18 @ 100 (a) | | | 6,894,357 | | | | 6,872,792 | | |
Tecomet, Inc., 1st Lien Term Loan B, 7.50%, (Prime+250bps), 4/18/24,
Callable 8/3/18 @ 100 (a) | | | 35,643 | | | | 35,532 | | |
Telesat Canada, 4.84%, (LIBOR01M+250bps), 11/17/23,
Callable 8/3/18 @ 101 (a) | | | 10,582,484 | | | | 10,492,943 | | |
Tenneco, Inc., 4.77%, (LIBOR12M+280bps), 6/18/25 (a) (b) | | | 6,500,000 | | | | 6,430,970 | | |
TI Group Automotive Systems LLC, Term Loan B,
4.59%, (LIBOR01M+250bps), 6/30/22, Callable 8/3/18 @ 100 (a) | | | 4,009,248 | | | | 4,004,237 | | |
Titan Acquisition, Ltd., 5.09%, (LIBOR01M+300bps) 3/28/25 (a) | | | 6,982,500 | | | | 6,867,910 | | |
TKC Holdings, Inc., 2nd Lien Term Loan, 10.10%, (LIBOR01M+800bps),
2/1/24, Callable 8/3/18 @ 101 (a) | | | 7,850,000 | | | | 7,836,890 | | |
Tribune Media Co., 1st Lien Term C, 5.09%, (LIBOR01M+300bps), 1/27/24,
Callable 8/3/18 @ 100 (a) | | | 8,055,144 | | | | 8,035,006 | | |
Tribune Media Co., Term Loan B, 5.09%, (LIBOR01M+300bps), 12/27/20,
Callable 8/3/18 @ 100 (a) | | | 646,287 | | | | 646,287 | | |
Uniti Group, Inc. 1st Lien Term Loan B, 5.09%, (LIBOR01M+300bps),
10/24/22, Callable 8/3/18 @ 100 (a) | | | 10,584,855 | | | | 10,094,063 | | |
Univision Communications, 1st Lien Term Loan C5, 4.84%,
(LIBOR01M+275bps), 3/15/24, Callable 8/3/18 @ 100 (a) | | | 9,777,102 | | | | 9,439,010 | | |
See notes to financial statements.
34
Victory Portfolios
Victory Floating Rate Fund | | Schedule of Portfolio Investments — continued
June 30, 2018 | |
(Unaudited)
Security Description | | Principal
Amount | | Value | |
USI, Inc., 1st Lien Term Loan B, 5.33%, (LIBOR03M+300bps), 5/16/24,
Callable 8/3/18 @ 100 (a) | | $ | 8,932,500 | | | $ | 8,872,054 | | |
Vertex Aerospace Services Corp., 6.83%, (LIBOR01M+475bps),
6/14/25 (a) (b) | | | 3,000,000 | | | | 3,015,000 | | |
West Corp., 1st Lien Term Loan B1, 5.59%, (LIBOR01M+350bps), 10/10/24,
Callable 8/3/18 @ 101 (a) | | | 7,000,000 | | | | 6,938,750 | | |
Windstream Services LLC, 1st Lien Term Loan, 5.33%,
(LIBOR01M+325bps), 2/8/24, Callable 8/3/18 @ 100 (a) (b) | | | 2,000,000 | | | | 1,755,000 | | |
WP CPP Holdings LLC, 1st Lien Term Loan B, 6.28%, (LIBOR06M+375bps),
4/30/25, Callable 8/3/18 @ 101 (a) | | | 4,000,000 | | | | 4,014,000 | | |
WP CPP Holdings LLC, 2nd Lien Term Loan, 10.28%, (LIBOR06M+775bps),
4/30/26, Callable 8/3/18 @ 102 (a) | | | 2,000,000 | | | | 1,995,000 | | |
Total Senior Secured Loans (Cost $606,603,691) | | | 602,783,211 | | |
Corporate Bonds (8.9%) | |
Consumer Discretionary (1.6%): | |
Golden Nugget, Inc., 8.75%, 10/1/25, Callable 10/1/20 @ 104.38 (c) | | | 5,000,000 | | | | 5,140,750 | | |
PetSmart, Inc., 5.88%, 6/1/25, Callable 6/1/20 @ 102.94 (c) (d) | | | 1,000,000 | | | | 769,880 | | |
Titan Acquisition Ltd. / Titan Co-Borrower LLC, 7.75%, 4/15/26,
Callable 4/15/21 @ 103.88 (c) (d) | | | 5,000,000 | | | | 4,666,200 | | |
| | | | 10,576,830 | | |
Energy (0.4%): | |
Hornbeck Offshore Services, Inc., 5.00%, 3/1/21, Callable 8/3/18 @ 101.25 | | | 4,000,000 | | | | 2,622,440 | | |
Financials (1.7%): | |
Algeco Global Finance 2 PLC, 10.00%, 8/15/23,
Callable 2/15/20 @ 105 (c) (d) | | | 4,000,000 | | | | 4,036,880 | | |
ASP AMC Merger Sub, Inc., 8.00%, 5/15/25, Callable 5/15/20 @ 104 (c) (d) | | | 3,470,000 | | | | 2,881,696 | | |
Compass Group Diversified Holdings LLC, 8.00%, 5/1/26,
Callable 5/1/21 @ 104 (c) (d) | | | 5,000,000 | | | | 4,883,600 | | |
| | | | 11,802,176 | | |
Health Care (2.7%): | |
Avantor, Inc., 9.00%, 10/1/25, Callable 10/1/20 @ 106.75 (c) (d) | | | 3,000,000 | | | | 3,023,700 | | |
Ortho-Clinical Diagnostics, Inc., 6.63%, 5/15/22,
Callable 8/3/18 @ 101.66 (c) (d) | | | 6,000,000 | | | | 5,919,060 | | |
Polaris Intermediate Corp., 8.50%, 12/1/22, Callable 6/1/19 @ 104 (c) (d) | | | 4,000,000 | | | | 4,125,600 | | |
Valeant Pharmaceuticals International, Inc., 5.88%, 5/15/23,
Callable 8/3/18 @ 102.94 (c) (d) | | | 5,000,000 | | | | 4,694,600 | | |
| | | | 17,762,960 | | |
Industrials (1.2%): | |
Flexi-Van Leasing, Inc., 10.00%, 2/15/23, Callable 2/15/20 @ 107.5 (c) | | | 1,000,000 | | | | 946,660 | | |
SRS Distribution, Inc., 8.25%, 7/1/26, Callable 7/1/21 @ 104.13 (c) (d) | | | 3,000,000 | | | | 2,988,150 | | |
W/S Packaging Holdings, Inc., 9.00%, 4/15/23,
Callable 4/15/20 @ 104.5 (c) (d) | | | 3,800,000 | | | | 3,847,538 | | |
| | | | 7,782,348 | | |
See notes to financial statements.
35
Victory Portfolios
Victory Floating Rate Fund | | Schedule of Portfolio Investments — continued
June 30, 2018 | |
(Unaudited)
Security Description | | Principal
Amount | | Value | |
Telecommunication Services (1.3%): | |
Sprint Corp., 7.88%, 9/15/23 (d) | | $ | 6,500,000 | | | $ | 6,751,030 | | |
Windstream Services LLC/Windstream Finance Corp., 8.75%, 12/15/24,
Callable 12/15/22 @ 102.5 (c) (d) | | | 2,675,000 | | | | 1,698,811 | | |
| | | | 8,449,841 | | |
Total Corporate Bonds (Cost $58,667,086) | | | 58,996,595 | | |
Total Investments (Cost $665,270,777) — 100.3% | | | 661,779,806 | | |
Liabilities in excess of other assets — (0.3)% | | | (1,688,061 | ) | |
NET ASSETS — 100.00% | | $ | 660,091,745 | | |
(a) Variable or Floating-Rate Security. Rate disclosed is as of June 30, 2018.
(b) Security purchased on a when-issued basis.
(c) Rule 144A security or other security that is restricted as to resale to institutional investors. The Fund's Adviser has deemed this security to be liquid based upon procedures approved by the Board of Trustees. As of June 30, 2018, the fair value of these securities was $49,623,126 and amounted to 7.5% of net assets.
(d) All or a portion of this security has been segregated as collateral for securities purchased on a when-issued basis.
bps — Basis points
LIBOR — London InterBank Offered Rate
LIBOR01M — 1 Month US Dollar LIBOR, rate disclosed as of June 30, 2018, based on the last reset date of the security
LIBOR01W — 1 Week US Dollar LIBOR, rate disclosed as of June 30, 2018, based on the last reset date of the security
LIBOR02M — 2 Month US Dollar LIBOR, rate disclosed as of June 30, 2018, based on the last reset date of the security
LIBOR03M — 3 Month US Dollar LIBOR, rate disclosed as of June 30, 2018, based on the last reset date of the security
LIBOR06M — 6 Month US Dollar LIBOR, rate disclosed as of June 30, 2018, based on the last reset date of the security
LIBOR12M — 12 Month US Dollar LIBOR, rate disclosed as of June 30, 2018, based on the last reset date of the security
LLC — Limited Liability Company
PLC — Public Limited Company
See notes to financial statements.
36
Victory Portfolios
Victory Strategic Income Fund | | Schedule of Portfolio Investments
June 30, 2018 | |
(Unaudited)
Security Description | | Principal
Amount | | Value | |
Asset Backed Securities (8.6%) | |
AmeriCredit Automobile, SERIES: 2017-3, CLASS: A3, 1.90%, 3/18/22,
Callable 3/18/21 @ 100 (a) | | $ | 283,000 | | | $ | 278,908 | | |
Capital Automotive REIT, Series 2016-1A, Class A, 4.55%, 2/15/46 (a) (b) | | | 967,379 | | | | 966,063 | | |
Chesapeake Funding II LLC, SERIES: 2018-1A, CLASS: A1, 3.04%, 4/15/30,
Callable 4/15/21 @ 100 (a) (b) | | | 350,000 | | | | 348,631 | | |
Fairway Outdoor Funding LLC, Series 2012-1A, Class A2, 4.21%, 10/15/42,
Callable 10/15/18 @ 100 (a) (b) | | | 419,277 | | | | 419,907 | | |
Focus Brands Funding LLC, Series 2017-1A, Class A2I, 3.86%, 4/30/47,
Callable 4/30/20 @ 100 (a) (b) | | | 990,000 | | | | 989,551 | | |
Santander Drive Auto Receivables Trust, Series 2016-3, Class C,
2.46%, 3/15/22, Callable 7/15/20 @ 100 (a) | | | 500,000 | | | | 496,763 | | |
Verizon Owner Trust, Series 2017-3A, Class B, 2.38%, 4/20/22, Callable
12/20/20 @ 100 (a) (b) | | | 500,000 | | | | 489,144 | | |
Verizon Owner Trust, Series 2017-3A, Class A1A, 2.06%, 4/20/22, Callable
12/20/20 @ 100 (a) (b) | | | 500,000 | | | | 491,551 | | |
Total Asset Backed Securities (Cost $4,551,076) | | | 4,480,518 | | |
Residential Mortgage Backed Securities (2.2%) | |
Bank of America Funding Corp., Series 2004-2, Class 1CB1, 5.75%, 9/20/34,
Callable 4/20/26 @ 100 (a) | | | 106,430 | | | | 110,806 | | |
Bear Stearns Alt-A Trust, Series 2003-3, Class 2A, 3.67%, 10/25/33,
Callable 7/25/18 @ 100 (a) (c) | | | 181,794 | | | | 181,795 | | |
Countrywide Home Loans, Inc., Series 2004-5, Class 2A9, 5.25%, 5/25/34,
Callable 7/25/18 @ 100 (a) | | | 133,206 | | | | 133,206 | | |
Duetsche Alt-A Securities, Inc. Mortgage Loan Trust, Series 2007-AR3,
Class 2A2B, 2.33%, (LIBOR01M+24bps), 6/25/37,
Callable 4/25/21 @ 100 (a) (d) | | | 165,854 | | | | 159,989 | | |
GSR Mortgage Loan Trust, Series 2004-15F, Class 5A1, 5.50%, 1/25/20,
Callable 2/25/34 @ 100 (a) | | | 10,694 | | | | 10,928 | | |
JPMorgan Mortgage Trust, Series 2005-A1, Class 6T1, 3.98%, 2/25/35,
Callable 7/25/18 @ 100 (a) (c) | | | 44,951 | | | | 45,471 | | |
JPMorgan Mortgage Trust, Series 2004-S2, Class 1A3, 4.75%, 11/25/19,
Callable 4/25/19 @ 100 (a) | | | 9,490 | | | | 9,632 | | |
Prime Mortgage Trust, Series 2004-2, Class A2, 4.75%, 11/25/19,
Callable 7/25/18 @ 100 (a) | | | 8,445 | | | | 8,445 | | |
Residential Funding Mortgage Securities I, Inc., Series 2005-S3, Class A1,
4.75%, 3/25/20, Callable 7/25/18 @ 100 (a) | | | 6,335 | | | | 6,335 | | |
Structured Asset Securities Corp., Series 2004-21XS, Class 2A6A,
5.24%, 12/25/34, Callable 7/25/18 @ 100 (a) (c) | | | 327 | | | | 333 | | |
Wells Fargo Mortgage Backed Securities Trust, Series 2004-Y, Class 3A1,
3.74%, 11/25/34, Callable 7/25/18 @ 100 (a) (c) | | | 159,167 | | | | 159,167 | | |
Wells Fargo Mortgage Backed Securities Trust, Series 2005-2, Class 2A1,
4.75%, 4/25/20, Callable 7/25/18 @ 100 (a) | | | 9,452 | | | | 9,452 | | |
Wells Fargo Mortgage Backed Securities Trust, Series 2005-6, Class A4,
5.50%, 8/25/35, Callable 7/25/18 @ 100 (a) | | | 47,499 | | | | 47,499 | | |
Wells Fargo Mortgage Backed Securities Trust, Series 2004-EE, Class 2A1,
3.85%, 12/25/34, Callable 7/25/18 @ 100 (a) (c) | | | 106,045 | | | | 106,045 | | |
See notes to financial statements.
37
Victory Portfolios
Victory Strategic Income Fund | | Schedule of Portfolio Investments — continued
June 30, 2018 | |
(Unaudited)
Security Description | | Principal
Amount | | Value | |
Wells Fargo Mortgage Backed Securities Trust, Series 2004-W, Class A9,
3.72%, 11/25/34, Callable 7/25/18 @ 100 (a) (c) | | $ | 96,188 | | | $ | 96,188 | | |
Wells Fargo Mortgage Backed Securities Trust, Series 2004-R, Class 2A1,
3.60%, 9/25/34, Callable 7/25/18 @ 100 (a) (c) | | | 85,202 | | | | 85,202 | | |
Total Residential Mortgage Backed Securities (Cost $1,154,925) | | | 1,170,493 | | |
Senior Secured Loans (15.6%) | |
American Renal Holdings, Inc., 5.23%-5.34%, (LIBOR01M+325bps),
6/15/24, Callable 8/3/18 @ 100 (d) | | | 782,000 | | | | 777,824 | | |
Bass Pro Group LLC, Term Loan B, 7.09%, (LIBOR01M+500bps), 12/16/23,
Callable 8/3/18 @ 100 (d) | | | 985,000 | | | | 985,623 | | |
BJ's Wholesale Club, Inc., 9.53%, (LIBOR01M+750bps), 1/27/25,
Callable 8/3/18 @ 101 (d) | | | 1,692,781 | | | | 1,707,593 | | |
Brand Energy & Infrastructure Services, Inc., 1st Lien Term Loan,
6.58%-6.61%, (LIBOR03M+425bps), 6/21/24, Callable 8/3/18 @ 100 (d) | | | 980,000 | | | | 980,739 | | |
Chesapeake Energy Corp., 9.59%, (LIBOR01M+750bps), 8/23/21,
Callable 8/23/18 @ 104.25 (d) | | | 1,000,000 | | | | 1,045,210 | | |
PetSmart, Inc., 5.01%, (LIBOR01M+300bps), 3/10/22, Callable 8/3/18 @ 100 (d) | | | 979,592 | | | | 807,791 | | |
SRS Distribution, Inc., 1st Lien Term Loan B, 5.58%, (LIBOR03M+325bps),
5/19/25, Callable 8/3/18 @ 101 (c) (e) | | | 1,000,000 | | | | 984,170 | | |
Windstream Services LLC, 1st Lien Term Loan, 5.34%, (LIBOR01M+325bps),
2/8/24, Callable 8/3/18 @ 100 (d) | | | 989,851 | | | | 868,286 | | |
Total Senior Secured Loans (Cost $8,233,056) | | | 8,157,236 | | |
Corporate Bonds (34.2%) | |
Consumer Discretionary (0.9%): | |
Charter Communications Operating LLC/Capital, 4.20%, 3/15/28,
Callable 12/15/27 @ 100 | | | 500,000 | | | | 469,005 | | |
Consumer Staples (0.9%): | |
CVS Health Corp., 4.30%, 3/25/28, Callable 12/25/27 @ 100 (f) | | | 500,000 | | | | 493,130 | | |
Energy (11.5%): | |
Cenovus Energy, Inc., 4.25%, 4/15/27, Callable 1/15/27 @ 100 (a) (f) | | | 900,000 | | | | 867,447 | | |
Energy Transfer Partners LP, 4.95%, 6/15/28, Callable 3/15/28 @ 100 (a) | | | 900,000 | | | | 897,273 | | |
MPLX LP, 4.50%, 7/15/23, Callable 4/15/23 @ 100 (a) | | | 1,000,000 | | | | 1,020,320 | | |
Petroleos Mexicanos
5.50%, 2/4/19 (a) | | | 1,000,000 | | | | 1,016,300 | | |
3.50%, 1/30/23 (a) | | | 1,200,000 | | | | 1,136,184 | | |
Sabine Pass Liquefaction LLC, 5.00%, 3/15/27, Callable 9/15/26 @ 100 (a) | | | 1,000,000 | | | | 1,020,529 | | |
| | | | 5,958,053 | | |
Financials (9.0%): | |
Banco Santander SA, 3.13%, 2/23/23 (a) | | | 750,000 | | | | 711,383 | | |
E*TRADE Financial Corp., 4.50%, 6/20/28, Callable 3/20/28 @ 100 (a) (f) | | | 250,000 | | | | 250,793 | | |
Goldman Sachs Group, Inc.
3.20%, 2/23/23, Callable 1/23/23 @ 100 (a) | | | 1,000,000 | | | | 974,250 | | |
4.22%, (LIBOR03M+130bps), 5/1/29, Callable 5/1/28 @ 100 (a) (d) | | | 1,000,000 | | | | 985,709 | | |
Huntington Bancshares, Inc., 4.00%, 5/15/25, Callable 4/15/25 @ 100 (a) | | | 250,000 | | | | 250,948 | | |
See notes to financial statements.
38
Victory Portfolios
Victory Strategic Income Fund | | Schedule of Portfolio Investments — continued
June 30, 2018 | |
(Unaudited)
| Security Description | | Principal
Amount | | Value | |
Morgan Stanley
3.13%, 1/23/23 (a) | | $ | 500,000 | | | $ | 487,620 | | |
3.77%, (LIBOR03M+114bps), 1/24/29, Callable 1/24/28 @ 100 (a) (d) | | | 1,000,000 | | | | 964,240 | | |
| | | | 4,624,943 | | |
Health Care (3.1%): | |
Becton Dickinson and Co.
3.36%, 6/6/24, Callable 4/6/24 @ 100 (a) | | | 700,000 | | | | 672,182 | | |
4.69%, (12/15/44, Callable 6/15/44 @ 100 (a) | | | 1,000,000 | | | | 968,509 | | |
| | | | 1,640,691 | | |
Industrials (2.7%): | |
GE Capital International Funding Co. Unlimited Co., 4.42%, 11/15/35 | | | 500,000 | | | | 484,165 | | |
General Electric Capital Corp., 5.88%, 1/14/38 (a) | | | 500,000 | | | | 567,540 | | |
Navistar International Corp., 6.63%, 11/1/25, Callable
11/1/20 @ 103.31 (a) (b) (f) | | | 380,000 | | | | 391,290 | | |
| | | | 1,442,995 | | |
Information Technology (0.6%): | |
Qualcomm, Inc., 3.25%, 5/20/27, Callable 2/20/27 @ 100 (a) (f) | | | 350,000 | | | | 326,260 | | |
Materials (2.1%): | |
Lyondellbasell Industries NV, 5.00%, 4/15/19, Callable 1/15/19 @ 100 (a) | | | 90,000 | | | | 90,899 | | |
Vale Overseas Ltd., 4.38%, 1/11/22 (a) (f) | | | 1,000,000 | | | | 1,014,990 | | |
| | | | 1,105,889 | | |
Telecommunication Services (2.8%): | |
AT&T, Inc., 5.15%, 11/15/46, Callable 5/15/46 @ 100 (a) (b) | | | 500,000 | | | | 471,870 | | |
Vodafone Group PLC, 4.38%, 5/30/28 (f) | | | 1,000,000 | | | | 988,070 | | |
| | | | 1,459,940 | | |
Utilities (0.6%): | |
South Carolina Electric & Gas, 4.10%, 6/15/46, Callable 12/15/45 @ 100 | | | 370,000 | | | | 336,530 | | |
Total Corporate Bonds (Cost $18,064,113) | | | 17,857,436 | | |
U.S. Government Mortgage Backed Agencies (9.6%) | |
Federal National Mortgage Association
3.50%, 7/1/43 – 3/1/48 (a) | | | 5,030,037 | | | | 5,009,927 | | |
Total U.S. Government Mortgage Backed Agencies (Cost $5,024,647) | | | 5,009,927 | | |
U.S. Treasury Obligations (19.7%) | |
U.S. Treasury Bonds
2.75%, 11/15/47 (a) | | | 1,200,000 | | | | 1,145,011 | | |
3.00%, 2/15/48 | | | 360,000 | | | | 361,230 | | |
U.S. Treasury Notes
2.00%, 1/31/20 (a) | | | 3,750,000 | | | | 3,721,743 | | |
2.38%, 1/31/23 (a) | | | 2,805,000 | | | | 2,763,376 | | |
2.63%, 2/28/23 (a) | | | 460,000 | | | | 458,169 | | |
2.50%, 1/31/25 (a) | | | 1,900,000 | | | | 1,865,450 | | |
Total U.S. Treasury Obligations (Cost $10,323,307) | | | 10,314,979 | | |
See notes to financial statements.
39
Victory Portfolios
Victory Strategic Income Fund | | Schedule of Portfolio Investments — continued
June 30, 2018 | |
(Unaudited)
Security Description | | Shares | | Value | |
Collateral for Securities Loaned (4.5%) | |
BlackRock Liquidity Funds TempFund Portfolio, Institutional
Class, 2.06% (g) | | | 307,583 | | | $ | 307,583 | | |
Fidelity Investments Prime Money Market Portfolio, Class I, 2.07% (g) | | | 279,631 | | | | 279,631 | | |
Fidelity Investments Money Market Government Portfolio,
Class I, 1.81% (g) | | | 632,362 | | | | 632,362 | | |
Goldman Sachs Financial Square Prime Obligations Fund, Institutional
Class, 2.16% (g) | | | 139,799 | | | | 139,799 | | |
JPMorgan Prime Money Market Fund, Capital Class, 2.05% (f) | | | 726,935 | | | | 726,935 | | |
Morgan Stanley Institutional Liquidity Prime Portfolio, Institutional
Class, 2.12% (g) | | | 251,638 | | | | 251,638 | | |
Total Collateral for Securities Loaned (Cost $2,337,948) | | | 2,337,948 | | |
Total Investments (Cost $49,689,072) — 94.4% | | | 49,328,537 | | |
Other assets in excess of liabilities — 5.6% | | | 2,920,128 | | |
NET ASSETS — 100.00% | | $ | 52,248,665 | | |
(a) All or a portion of this security has been segregated as collateral for derivative instruments and/or securities purchased on a when-issued basis.
(b) Rule 144A security or other security that is restricted as to resale to institutional investors. The Fund's Adviser has deemed this security to be liquid based upon procedures approved by the Board of Trustees. As of June 30, 2018, the fair value of these securities was $4,568,007 and amounted to 8.7% of net assets.
(c) The rate for certain asset-backed and mortgage-backed securities may vary based on factors relating to the pool of assets underlying the security. The rate disclosed is the rate in effect at June 30, 2018.
(d) Variable or Floating-Rate Security. Rate disclosed is as of June 30, 2018.
(e) Security purchased on a when-issued basis.
(f) All or a portion of this security is on loan.
(g) Rate disclosed is the daily yield on June 30, 2018.
bps — Basis points
LIBOR — London InterBank Offered Rate
LIBOR01M — 1 Month US Dollar LIBOR, rate disclosed as of June 30, 2018, based on the last reset date of the security
LIBOR02M — 2 Month US Dollar LIBOR, rate disclosed as of June 30, 2018, based on the last reset date of the security
LIBOR03M — 3 Month US Dollar LIBOR, rate disclosed as of June 30, 2018, based on the last reset date of the security
LLC — Limited Liability Company
LP — Limited Partnership
PLC — Public Limited Company
REIT — Real Estate Investment Trust
See notes to financial statements.
40
Victory Portfolios
Victory Strategic Income Fund | | Schedule of Portfolio Investments — continued
June 30, 2018 | |
(Unaudited)
Futures Contracts Purchased
| | | Number of
Contracts | | Expiration
Date | | Notional
Amount | | Value | | Unrealized
Appreciation
(Depreciation) | |
2-Year U.S. Treasury Note Future | | | 23 | | | 9/28/18 | | $ | 4,882,915 | | | $ | 4,872,047 | | | $ | (10,868 | ) | |
30-Year U.S. Treasury Bond Future | | | 18 | | | 9/19/18 | | | 2,598,818 | | | | 2,610,000 | | | | 11,182 | | |
5-Year U.S. Treasury Note Future | | | 57 | | | 9/28/18 | | | 6,484,262 | | | | 6,476,180 | | | | (8,082 | ) | |
Ultra Long Term U.S. Treasury Bond Future | | | 10 | | | 9/19/18 | | | 1,602,220 | | | | 1,595,625 | | | | (6,595 | ) | |
| | | | | | | | | | | $ | (14,363 | ) | |
Futures Contracts Sold
| | | Number of
Contracts | | Expiration
Date | | Notional
Amount | | Value | | Unrealized
Appreciation
(Depreciation) | |
10-Year U.S. Treasury Note Future | | | 26 | | | 9/19/18 | | $ | 3,127,009 | | | $ | 3,124,875 | | | $ | 2,134 | | |
Total unrealized appreciation | | | | | | | | | | $ | 13,316 | | |
Total unrealized depreciation | | | | | | | | | | | (25,545 | ) | |
Total net unrealized depreciation | | | | | | | | | | $ | (12,229 | ) | |
Centrally Cleared
Credit Default Swap Agreements — Buy Protection (a)
Underlying
Instrument | | Fixed Deal
Day
Rate | | Maturity
Date | | Payment
Frequency | | Implied
Credit
Spread at
June 30,
2018(b) | | Notional
Amount(c) | | Value | | Premiums
Paid
(Received) | | Unrealized
Appreciation
(Depreciation) | |
CDX North
America
High Yield
5 Year
Index;
Series 30 | | | 5.00 | % | | 6/20/23 | | Daily | | | 3.63 | % | | $ | 5,000,000 | | | $ | (295,347 | ) | | $ | (280,250 | ) | | $ | (15,097 | ) | |
(a) When a credit event occurs as defined under the terms of the swap agreement, the Fund as a buyer of credit protection will either (i) receive from the seller of protection an amount equal to the par value of the defaulted reference entity and deliver the reference entity or (ii) receive a net amount equal to the par value of the defaulted reference entity less its recovery value.
(b) Implied credit spread, represented in absolute terms, utilized in determining the value of the credit default swap agreements as of period end will serve as an indicator of the current status of the payment/performance risk and represent the likelihood or risk of default for the credit derivative. The implied credit spread of a referenced entity reflects the cost of buying/selling protection and may include payments required to be made to enter into the agreement. Generally, wider credit spreads represent a perceived deterioration of the referenced entity's credit soundness and a greater likelihood or risk of default or other credit event occurring as defined under the terms of the swap agreement.
(c) The notional amount represents the maximum potential amount the Fund may receive as a buyer of credit protection if a credit event occurs, as defined under the terms of the swap agreement, for each security included in the CDX North America High Yield 5 Year Index.
See notes to financial statements.
41
Victory Portfolios | | Statements of Assets and Liabilities
June 30, 2018 | |
(Unaudited)
| | | Victory INCORE
Investment Quality
Bond Fund | | Victory INCORE
Low Duration
Bond Fund | | Victory High
Yield Fund | |
ASSETS: | |
Investments, at value (Cost $39,886,369,
$397,333,378 and $77,557,427) | | $ | 38,930,925 | (a) | | $ | 392,699,396 | (b) | | $ | 76,914,760 | (c) | |
Cash and cash equivalents | | | 943,113 | | | | 3,483,202 | | | | 5,535,683 | | |
Deposits with brokers for futures contracts | | | 153,913 | | | | 597,399 | | | | — | | |
Deposits with brokers for centrally cleared
swap agreements | | | 522,538 | | | | 3,204,784 | | | | — | | |
Interest and dividends receivable | | | 213,920 | | | | 2,016,276 | | | | 901,513 | | |
Receivable for capital shares issued | | | 3,342 | | | | 191,155 | | | | 2,619 | | |
Receivable for investments sold | | | — | | | | — | | | | 174,837 | | |
Variation margin receivable on open
futures contracts | | | 188 | | | | 164 | | | | — | | |
Variation margin receivable on centrally
cleared swap agreements | | | 1,986 | | | | 29,933 | | | | — | | |
Receivable from Adviser | | | 10,189 | | | | 25,948 | | | | 7,162 | | |
Prepaid expenses | | | 37,384 | | | | 47,162 | | | | 41,352 | | |
Total Assets | | | 40,817,498 | | | | 402,295,419 | | | | 83,577,926 | | |
LIABILITIES: | |
Securities lending collateral | | | 1,198,379 | | | | 10,036,293 | | | | 10,233,122 | | |
Distributions payable | | | 4,068 | | | | 116,908 | | | | 199,456 | | |
Payable for investments purchased | | | 178,274 | | | | — | | | | 2,441,000 | | |
Payable for capital shares redeemed | | | 7,316 | | | | 776,791 | | | | 192,905 | | |
Variation margin payable on open
futures contracts | | | 640 | | | | 14,313 | | | | — | | |
Accrued expenses and other payables: | |
Investment advisory fees | | | 16,240 | | | | 146,344 | | | | 34,874 | | |
Administration fees | | | 1,982 | | | | 19,841 | | | | 3,546 | | |
Custodian fees | | | 1,018 | | | | 4,288 | | | | 2,100 | | |
Transfer agent fees | | | 5,453 | | | | 49,854 | | | | 439 | | |
Chief Compliance Officer fees | | | 27 | | | | 297 | | | | 45 | | |
| 12b-1 fees | | | 5,377 | | | | 41,632 | | | | 14,958 | | |
Other accrued expenses | | | 13,040 | | | | 52,301 | | | | 14,540 | | |
Total Liabilities | | | 1,431,814 | | | | 11,258,862 | | | | 13,136,985 | | |
NET ASSETS: | |
Capital | | | 40,668,995 | | | | 424,354,118 | | | | 79,491,433 | | |
Accumulated net investment income (loss) | | | 39,340 | | | | (119,833 | ) | | | 3,383 | | |
Accumulated net realized gains (losses) from
investments | | | (384,087 | ) | | | (28,479,044 | ) | | | (8,411,208 | ) | |
Net unrealized appreciation (depreciation) on
investments | | | (938,564 | ) | | | (4,718,684 | ) | | | (642,667 | ) | |
Net Assets | | $ | 39,385,684 | | | $ | 391,036,557 | | | $ | 70,440,941 | | |
Net Assets | |
Class A Shares | | $ | 27,802,369 | | | $ | 115,567,093 | | | $ | 22,755,650 | | |
Class C Shares | | | 4,238,131 | | | | 71,330,033 | | | | 21,101,334 | | |
Class R Shares | | | 3,733,060 | | | | 1,636,486 | | | | 18,862,778 | | |
Class Y Shares | | | 3,612,124 | | | | 202,502,945 | | | | 7,721,179 | | |
Total | | $ | 39,385,684 | | | $ | 391,036,557 | | | $ | 70,440,941 | | |
Shares (unlimited number of shares authorized
with a par value of $0.001 per share): | |
Class A Shares | | | 2,987,259 | | | | 11,653,059 | | | | 3,510,226 | | |
Class C Shares | | | 455,756 | | | | 7,197,424 | | | | 3,248,201 | | |
Class R Shares | | | 400,167 | | | | 165,065 | | | | 2,901,985 | | |
Class Y Shares | | | 388,507 | | | | 20,413,501 | | | | 1,196,776 | | |
Total | | | 4,231,689 | | | | 39,429,049 | | | | 10,857,188 | | |
Net asset value, offering (except Class A Shares)
and redemption price per share: | |
Class A Shares | | $ | 9.31 | | | $ | 9.92 | | | $ | 6.48 | | |
Class C Shares (d) | | $ | 9.30 | | | $ | 9.91 | | | $ | 6.50 | | |
Class R Shares | | $ | 9.33 | | | $ | 9.91 | | | $ | 6.50 | | |
Class Y Shares | | $ | 9.30 | | | $ | 9.92 | | | $ | 6.45 | | |
Maximum Sales Charge — Class A Shares | | | 2.00 | % | | | 2.00 | % | | | 2.00 | % | |
Maximum offering price
(100%/(100%-maximum sales charge) of
net asset value adjusted to the nearest
cent) per share — Class A Shares | | $ | 9.50 | | | $ | 10.12 | | | $ | 6.61 | | |
(a) Includes $1,161,098 of securities on loan.
(b) Includes $9,759,779 of securities on loan.
(c) Includes $9,851,485 of securities on loan.
(d) Redemption price per share varies by the length of time shares are held.
See notes to financial statements.
42
Victory Portfolios | | Statements of Assets and Liabilities
June 30, 2018 | |
(Unaudited)
| | | Victory
Tax-Exempt
Fund | | Victory
High Income
Municipal Bond
Fund | | Victory
Floating
Rate Fund | |
ASSETS: | |
Investments, at value (Cost $78,409,971,
$57,107,666 and $665,270,777) | | $ | 80,935,580 | | | $ | 58,704,228 | | | $ | 661,779,806 | | |
Cash and cash equivalents | | | — | | | | — | | | | 34,517,681 | | |
Interest and dividends receivable | | | 845,693 | | | | 760,102 | | | | 2,405,552 | | |
Receivable for capital shares issued | | | 9,476 | | | | 7,288 | | | | 1,116,741 | | |
Receivable for investments sold | | | 782,271 | | | | 548,715 | | | | 4,052,120 | | |
Receivable from Adviser | | | 10,179 | | | | 11,154 | | | | 70,797 | | |
Prepaid expenses | | | 27,463 | | | | 17,343 | | | | 24,395 | | |
Total Assets | | | 82,610,662 | | | | 60,048,830 | | | | 703,967,092 | | |
LIABILITIES: | |
Payable for line of credit | | | 1,800,000 | | | | — | | | | — | | |
Distributions payable | | | 20,611 | | | | 18,706 | | | | 379,249 | | |
Payable to custodian | | | 27,382 | | | | 251,143 | | | | — | | |
Payable for investments purchased | | | 1,103,190 | | | | 2,115,787 | | | | 41,823,250 | | |
Payable for capital shares redeemed | | | 103,095 | | | | 139,863 | | | | 964,579 | | |
Accrued expenses and other payables: | |
Investment advisory fees | | | 32,841 | | | | 23,749 | | | | 351,295 | | |
Administration fees | | | 4,007 | | | | 2,898 | | | | 32,969 | | |
Custodian fees | | | 1,065 | | | | 781 | | | | 54,258 | | |
Transfer agent fees | | | 4,707 | | | | — | | | | 60,721 | | |
Chief Compliance Officer fees | | | 58 | | | | 45 | | | | 477 | | |
| 12b-1 fees | | | 12,739 | | | | 11,178 | | | | 113,296 | | |
Other accrued expenses | | | 15,094 | | | | 11,296 | | | | 95,253 | | |
Total Liabilities | | | 3,124,789 | | | | 2,575,446 | | | | 43,875,347 | | |
NET ASSETS: | |
Capital | | | 75,939,508 | | | | 56,136,356 | | | | 828,086,933 | | |
Accumulated net investment income (loss) | | | 20,348 | | | | 127,971 | | | | 129,594 | | |
Accumulated net realized gains (losses) from
investments | | | 1,000,408 | | | | (387,505 | ) | | | (164,633,811 | ) | |
Net unrealized appreciation (depreciation) on
investments | | | 2,525,609 | | | | 1,596,562 | | | | (3,490,971 | ) | |
Net Assets | | $ | 79,485,873 | | | $ | 57,473,384 | | | $ | 660,091,745 | | |
Net Assets | |
Class A Shares | | $ | 33,209,253 | | | $ | 20,910,898 | | | $ | 139,805,975 | | |
Class C Shares | | | 22,635,455 | | | | 21,943,797 | | | | 239,636,357 | | |
Class R Shares | | | — | | | | — | | | | 657,210 | | |
Class Y Shares | | | 23,641,165 | | | | 14,618,689 | | | | 279,992,203 | | |
Total | | $ | 79,485,873 | | | $ | 57,473,384 | | | $ | 660,091,745 | | |
Shares (unlimited number of shares authorized
with a par value of $0.001 per share): | |
Class A Shares | | | 3,412,359 | | | | 1,975,196 | | | | 14,664,053 | | |
Class C Shares | | | 2,326,697 | | | | 2,072,860 | | | | 25,118,979 | | |
Class R Shares | | | — | | | | — | | | | 68,939 | | |
Class Y Shares | | | 2,430,450 | | | | 1,380,748 | | | | 29,346,866 | | |
Total | | | 8,169,506 | | | | 5,428,804 | | | | 69,198,837 | | |
Net asset value, offering (except Class A Shares)
and redemption price per share: | |
Class A Shares | | $ | 9.73 | | | $ | 10.59 | | | $ | 9.53 | | |
Class C Shares (a) | | $ | 9.73 | | | $ | 10.59 | | | $ | 9.54 | | |
Class R Shares | | $ | — | | | $ | — | | | $ | 9.53 | | |
Class Y Shares | | $ | 9.73 | | | $ | 10.59 | | | $ | 9.54 | | |
Maximum Sales Charge — Class A Shares | | | 2.00 | % | | | 2.00 | % | | | 2.00 | % | |
Maximum offering price
(100%/(100%-maximum sales charge) of
net asset value adjusted to the nearest cent)
per share — Class A Shares | | $ | 9.93 | | | $ | 10.81 | | | $ | 9.72 | | |
(a) Redemption price per share varies by the length of time shares are held.
See notes to financial statements.
43
Victory Portfolios | | Statements of Assets and Liabilities
June 30, 2018 | |
(Unaudited)
| | | Victory
Strategic
Income Fund | |
ASSETS: | |
Investments, at value (Cost $49,689,072) | | $ | 49,328,537 | (a) | |
Cash and cash equivalents | | | 820,348 | | |
Deposits with brokers for futures contracts | | | 139,960 | | |
Deposits with brokers for centrally cleared swap agreements | | | 142,468 | | |
Interest and dividends receivable | | | 374,956 | | |
Receivable for capital shares issued | | | 1,870 | | |
Receivable for investments sold | | | 4,894,500 | | |
Variation margin receivable on open futures contracts | | | 6,627 | | |
Reclaims receivable | | | 564 | | |
Receivable from Adviser | | | 18,714 | | |
Prepaid expenses | | | 20,663 | | |
Total Assets | | | 55,749,207 | | |
LIABILITIES: | |
Securities lending collateral | | | 2,337,948 | | |
Distributions payable | | | 93,186 | | |
Payable for investments purchased | | | 991,250 | | |
Payable for capital shares redeemed | | | 12,280 | | |
Variation margin payable on open futures contracts | | | 8,536 | | |
Variation margin payable on centrally cleared swap agreements | | | 3,279 | | |
Accrued expenses and other payables: | |
Investment advisory fees | | | 25,794 | | |
Administration fees | | | 2,622 | | |
Custodian fees | | | 2,233 | | |
Transfer agent fees | | | 714 | | |
Chief Compliance Officer fees | | | 32 | | |
| 12b-1 fees | | | 8,602 | | |
Other accrued expenses | | | 14,066 | | |
Total Liabilities | | | 3,500,542 | | |
NET ASSETS: | |
Capital | | | 54,153,466 | | |
Accumulated net investment income (loss) | | | (36,886 | ) | |
Accumulated net realized gains (losses) from investments | | | (1,480,054 | ) | |
Net unrealized appreciation (depreciation) on investments | | | (387,861 | ) | |
Net Assets | | $ | 52,248,665 | | |
Net Assets | |
Class A Shares | | $ | 33,305,993 | | |
Class C Shares | | | 11,142,973 | | |
Class R Shares | | | 2,812,299 | | |
Class Y Shares | | | 4,987,400 | | |
Total | | $ | 52,248,665 | | |
Shares (unlimited number of shares authorized with a par value of $0.001 per share): | |
Class A Shares | | | 3,383,099 | | |
Class C Shares | | | 1,126,780 | | |
Class R Shares | | | 284,174 | | |
Class Y Shares | | | 509,481 | | |
Total | | | 5,303,534 | | |
Net asset value, offering (except Class A Shares) and redemption price per share: | |
Class A Shares | | $ | 9.84 | | |
Class C Shares (b) | | $ | 9.89 | | |
Class R Shares | | $ | 9.90 | | |
Class Y Shares | | $ | 9.79 | | |
Maximum Sales Charge — Class A Shares | | | 2.00 | % | |
Maximum offering price
(100%/(100%-maximum sales charge) of net asset value adjusted to the
nearest cent) per share — Class A Shares | | $ | 10.04 | | |
(a) Includes $2,273,185 of securities on loan.
(b) Redemption price per share varies by the length of time shares are held.
See notes to financial statements.
44
Victory Portfolios | | Statements of Operations
For the Six Months Ended June 30, 2018 | |
(Unaudited)
| | | Victory INCORE
Investment Quality
Bond Fund | | Victory INCORE
Low Duration
Bond Fund | | Victory High
Yield Fund | |
Investment Income: | |
Dividend income | | $ | — | | | $ | — | | | $ | 20,810 | | |
Interest income | | | 658,394 | | | | 5,323,189 | | | | 2,271,085 | | |
Securities lending income | | | 261 | | | | 10,113 | | | | 61,977 | | |
Total Income | | | 658,655 | | | | 5,333,302 | | | | 2,353,872 | | |
Expenses: | |
Investment advisory fees | | | 104,167 | | | | 983,637 | | | | 205,346 | | |
Administration fees | | | 12,816 | | | | 129,106 | | | | 20,850 | | |
12b-1 fees — Class A Shares | | | 36,164 | | | | 160,156 | | | | 27,053 | | |
12b-1 fees — Class C Shares | | | 24,991 | | | | 380,334 | | | | 108,154 | | |
12b-1 fees — Class R Shares | | | 9,540 | | | | 4,595 | | | | 47,154 | | |
Custodian fees | | | 2,251 | | | | 11,534 | | | | 6,974 | | |
Transfer agent fees | | | 2,217 | | | | 23,592 | | | | 2,503 | | |
Transfer agent fees — Class A Shares | | | 16,933 | | | | 52,682 | | | | 6,425 | | |
Transfer agent fees — Class C Shares | | | 3,309 | | | | 38,572 | | | | 3,236 | | |
Transfer agent fees — Class R Shares | | | 2,696 | | | | 1,723 | | | | 2,810 | | |
Transfer agent fees — Class Y Shares | | | 2,288 | | | | 124,537 | | | | 2,217 | | |
Trustees' fees | | | 1,756 | | | | 18,196 | | | | 2,638 | | |
Chief Compliance Officer fees | | | 167 | | | | 1,767 | | | | 259 | | |
Legal and audit fees | | | 8,229 | | | | 24,147 | | | | 10,011 | | |
State registration and filing fees | | | 24,116 | | | | 29,408 | | | | 21,892 | | |
Interest expense on interfund lending (See Note 6) | | | — | | | | 215 | | | | — | | |
Other expenses | | | 12,446 | | | | 40,354 | | | | 9,329 | | |
Total Expenses | | | 264,086 | | | | 2,024,555 | | | | 476,851 | | |
Expenses waived/reimbursed by Adviser | | | (52,117 | ) | | | (137,934 | ) | | | (34,852 | ) | |
Net Expenses | | | 211,969 | | | | 1,886,621 | | | | 441,999 | | |
Net Investment Income (Loss) | | | 446,686 | | | | 3,446,681 | | | | 1,911,873 | | |
Realized/Unrealized Gains (Losses) from
Investment Transactions: | |
Net realized gains (losses) from investment
transactions | | | (241,076 | ) | | | (178,069 | ) | | | 442,066 | | |
Net realized gains (losses) from futures
transactions | | | (153,589 | ) | | | (725,454 | ) | | | — | | |
Net realized gains (losses) from centrally cleared
swap transactions | | | 83,810 | | | | 1,030,806 | | | | — | | |
Net change in unrealized appreciation/depreciation
on investments | | | (964,727 | ) | | | (2,656,877 | ) | | | (1,324,540 | ) | |
Net change in unrealized appreciation/depreciation
on futures transactions | | | 21,323 | | | | 149,816 | | | | — | | |
Net change in unrealized appreciation/depreciation
on centrally cleared swap transactions | | | (6,673 | ) | | | (273,733 | ) | | | — | | |
Net realized/unrealized gains (losses) on
investments | | | (1,260,932 | ) | | | (2,653,511 | ) | | | (882,474 | ) | |
Change in net assets resulting from operations | | $ | (814,246 | ) | | $ | 793,170 | | | $ | 1,029,399 | | |
See notes to financial statements.
45
Victory Portfolios | | Statements of Operations
For the Six Months Ended June 30, 2018 | |
(Unaudited)
| | | Victory
Tax-Exempt
Fund | | Victory High Income
Municipal Bond
Fund | | Victory
Floating
Rate Fund | |
Investment Income: | |
Interest income | | $ | 1,880,950 | | | $ | 1,617,486 | | | $ | 20,788,612 | | |
Total Income | | | 1,880,950 | | | | 1,617,486 | | | | 20,788,612 | | |
Expenses: | |
Investment advisory fees | | | 209,244 | | | | 160,350 | | | | 2,161,777 | | |
Administration fees | | | 24,705 | | | | 19,196 | | | | 197,346 | | |
12b-1 fees — Class A Shares | | | 43,367 | | | | 28,274 | | | | 177,224 | | |
12b-1 fees — Class C Shares | | | 119,948 | | | | 115,719 | | | | 1,253,392 | | |
12b-1 fees — Class R Shares | | | — | | | | — | | | | 1,886 | | |
Custodian fees | | | 2,070 | | | | 1,844 | | | | 106,230 | | |
Transfer agent fees | | | 5,234 | | | | 4,252 | | | | 31,907 | | |
Transfer agent fees — Class A Shares | | | 9,068 | | | | 6,088 | | | | 52,293 | | |
Transfer agent fees — Class C Shares | | | 10,905 | | | | 9,075 | | | | 118,741 | | |
Transfer agent fees — Class R Shares | | | — | | | | — | | | | 532 | | |
Transfer agent fees — Class Y Shares | | | 10,272 | | | | 5,585 | | | | 110,087 | | |
Trustees' fees | | | 3,431 | | | | 2,770 | | | | 26,362 | | |
Chief Compliance Officer fees | | | 332 | | | | 263 | | | | 2,615 | | |
Legal and audit fees | | | 8,188 | | | | 7,784 | | | | 67,075 | | |
State registration and filing fees | | | 18,806 | | | | 21,070 | | | | 33,042 | | |
Interest expense on interfund lending (See Note 6) | | | 175 | | | | 909 | | | | — | | |
Other expenses | | | 8,957 | | | | 8,944 | | | | 90,132 | | |
Total Expenses | | | 474,702 | | | | 392,123 | | | | 4,430,641 | | |
Expenses waived/reimbursed by Adviser | | | (57,903 | ) | | | (67,120 | ) | | | (400,713 | ) | |
Net Expenses | | | 416,799 | | | | 325,003 | | | | 4,029,928 | | |
Net Investment Income (Loss) | | | 1,464,151 | | | | 1,292,483 | | | | 16,758,684 | | |
Realized/Unrealized Gains (Losses) from
Investment Transactions: | |
Net realized gains (losses) from investment
transactions | | | 456,257 | | | | 700,305 | | | | 71,474 | | |
Net change in unrealized appreciation/depreciation
on investments | | | (2,069,733 | ) | | | (2,208,046 | ) | | | (4,672,457 | ) | |
Net realized/unrealized gains (losses) on investments | | | (1,613,476 | ) | | | (1,507,741 | ) | | | (4,600,983 | ) | |
Change in net assets resulting from operations | | $ | (149,325 | ) | | $ | (215,258 | ) | | $ | 12,157,701 | | |
See notes to financial statements.
46
Victory Portfolios | | Statements of Operations
For the Six Months Ended June 30, 2018 | |
(Unaudited)
| | | Victory Strategic
Income Fund | |
Investment Income: | |
Dividend income | | $ | 3,098 | | |
Interest income | | | 1,230,456 | | |
Securities lending income | | | 12,401 | | |
Total Income | | | 1,245,955 | | |
Expenses: | |
Investment advisory fees | | | 160,345 | | |
Administration fees | | | 16,343 | | |
12b-1 fees — Class A Shares | | | 41,943 | | |
12b-1 fees — Class C Shares | | | 57,677 | | |
12b-1 fees — Class R Shares | | | 7,060 | | |
Custodian fees | | | 8,008 | | |
Transfer agent fees | | | 2,167 | | |
Transfer agent fees — Class A Shares | | | 3,870 | | |
Transfer agent fees — Class C Shares | | | 4,684 | | |
Transfer agent fees — Class R Shares | | | 353 | | |
Transfer agent fees — Class Y Shares | | | 2,316 | | |
Trustees' fees | | | 2,148 | | |
Chief Compliance Officer fees | | | 208 | | |
Legal and audit fees | | | 9,244 | | |
State registration and filing fees | | | 26,602 | | |
Other expenses | | | 7,971 | | |
Total Expenses | | | 350,939 | | |
Expenses waived/reimbursed by Adviser | | | (51,978 | ) | |
Net Expenses | | | 298,961 | | |
Net Investment Income (Loss) | | | 946,994 | | |
Realized/Unrealized Gains (Losses) from Investment Transactions: | |
Net realized gains (losses) from investment transactions | | | (612,235 | ) | |
Net realized gains (losses) from futures transactions | | | (329,056 | ) | |
Net realized gains (losses) from centrally cleared swap transactions | | | (102,741 | ) | |
Net change in unrealized appreciation/depreciation on investments | | | (619,175 | ) | |
Net change in unrealized appreciation/depreciation on futures transactions | | | (27,665 | ) | |
Net change in unrealized appreciation/depreciation on centrally cleared swap
transactions | | | (15,097 | ) | |
Net realized/unrealized gains (losses) on investments | | | (1,705,969 | ) | |
Change in net assets resulting from operations | | $ | (758,975 | ) | |
See notes to financial statements.
47
Victory Portfolios | | Statements of Changes in Net Assets | |
| | | Victory
INCORE Investment
Quality Bond Fund | | Victory
INCORE Low Duration
Bond Fund | | Victory
High Yield Fund | |
| | | Six Months
Ended
June 30,
2018 | | Year
Ended
December 31,
2017 | | Six Months
Ended
June 30,
2018 | | Year
Ended
December 31,
2017 | | Six Months
Ended
June 30,
2018 | | Year
Ended
December 31,
2017 | |
| | | (Unaudited) | | | | (Unaudited) | | | | (Unaudited) | | | |
From Investment Activities: | |
Operations: | |
Net investment income
(loss) | | $ | 446,686 | | | $ | 909,777 | | | $ | 3,446,681 | | | $ | 6,834,623 | | | $ | 1,911,873 | | | $ | 4,040,436 | | |
Net realized gains
(losses) from
investment
transactions | | | (310,855 | ) | | | 540,669 | | | | 127,283 | | | | 1,594,520 | | | | 442,066 | | | | 1,123,076 | | |
Net change in unrealized
appreciation/
depreciation on
investments | | | (950,077 | ) | | | 428,182 | | | | (2,780,794 | ) | | | (110,863 | ) | | | (1,324,540 | ) | | | 1,439,779 | | |
Change in net assets resulting
from operations | | | (814,246 | ) | | | 1,878,628 | | | | 793,170 | | | | 8,318,280 | | | | 1,029,399 | | | | 6,603,291 | | |
Distributions to Shareholders: | |
From net investment
income: | |
Class A Shares | | | (381,978 | ) | | | (851,750 | ) | | | (1,273,478 | ) | | | (2,975,964 | ) | | | (652,548 | ) | | | (1,403,226 | ) | |
Class C Shares | | | (44,063 | ) | | | (116,728 | ) | | | (465,477 | ) | | | (915,654 | ) | | | (573,598 | ) | | | (1,168,449 | ) | |
Class R Shares | | | (42,620 | ) | | | (84,062 | ) | | | (14,378 | ) | | | (31,139 | ) | | | (534,644 | ) | | | (1,059,549 | ) | |
Class Y Shares | | | (56,460 | ) | | | (137,124 | ) | | | (2,557,805 | ) | | | (5,811,142 | ) | | | (199,997 | ) | | | (361,401 | ) | |
Change in net assets resulting
from distributions to
shareholders | | | (525,121 | ) | | | (1,189,664 | ) | | | (4,311,138 | ) | | | (9,733,899 | ) | | | (1,960,787 | ) | | | (3,992,625 | ) | |
Change in net assets resulting
from capital transactions | | | (5,068,154 | ) | | | (14,930,156 | ) | | | (110,950,960 | ) | | | (162,872,205 | ) | | | 2,778,199 | | | | (7,725,222 | ) | |
Change in net assets | | | (6,407,521 | ) | | | (14,241,192 | ) | | | (114,468,928 | ) | | | (164,287,824 | ) | | | 1,846,811 | | | | (5,114,556 | ) | |
Net Assets: | |
Beginning of period | | | 45,793,205 | | | | 60,034,397 | | | | 505,505,485 | | | | 669,793,309 | | | | 68,594,130 | | | | 73,708,686 | | |
End of period | | $ | 39,385,684 | | | $ | 45,793,205 | | | $ | 391,036,557 | | | $ | 505,505,485 | | | $ | 70,440,941 | | | $ | 68,594,130 | | |
Accumulated net investment
income (loss) | | $ | 39,340 | | | $ | 117,775 | | | $ | (119,833 | ) | | $ | 744,624 | | | $ | 3,383 | | | $ | 52,297 | | |
(continues on next page)
See notes to financial statements.
48
Victory Portfolios | | Statements of Changes in Net Assets | |
(continued)
| | | Victory
INCORE Investment
Quality Bond Fund | | Victory
INCORE Low Duration
Bond Fund | | Victory
High Yield Fund | |
| | | Six Months
Ended
June 30,
2018 | | Year
Ended
December 31,
2017 | | Six Months
Ended
June 30,
2018 | | Year
Ended
December 31,
2017 | | Six Months
Ended
June 30,
2018 | | Year
Ended
December 31,
2017 | |
| | | (Unaudited) | | | | (Unaudited) | | | | (Unaudited) | | | |
Capital Transactions: | |
Class A Shares | |
Proceeds from shares
issued | | $ | 1,534,822 | | | $ | 2,831,599 | | | $ | 14,089,920 | | | $ | 46,832,529 | | | $ | 4,233,806 | | | $ | 1,861,235 | | |
Distributions reinvested | | | 365,899 | | | | 815,905 | | | | 1,069,477 | | | | 2,686,461 | | | | 395,584 | | | | 887,213 | | |
Cost of shares redeemed | | | (4,485,644 | ) | | | (13,321,140 | ) | | | (47,847,105 | ) | | | (114,718,707 | ) | | | (3,466,811 | ) | | | (7,281,276 | ) | |
Total Class A Shares | | $ | (2,584,923 | ) | | $ | (9,673,636 | ) | | $ | (32,687,708 | ) | | $ | (65,199,717 | ) | | $ | 1,162,579 | | | $ | (4,532,828 | ) | |
Class C Shares | |
Proceeds from shares
issued | | $ | 65,709 | | | $ | 258,405 | | | $ | 1,853,915 | | | $ | 4,237,252 | | | $ | 224,148 | | | $ | 547,795 | | |
Distributions reinvested | | | 38,807 | | | | 104,388 | | | | 393,361 | | | | 767,764 | | | | 166,813 | | | | 360,247 | | |
Cost of shares redeemed | | | (1,820,174 | ) | | | (3,247,616 | ) | | | (13,162,136 | ) | | | (39,487,104 | ) | | | (1,275,809 | ) | | | (1,937,517 | ) | |
Total Class C Shares | | $ | (1,715,658 | ) | | $ | (2,884,823 | ) | | $ | (10,914,860 | ) | | $ | (34,482,088 | ) | | $ | (884,848 | ) | | $ | (1,029,475 | ) | |
Class R Shares | |
Proceeds from shares
issued | | $ | 234,785 | | | $ | 744,251 | | | $ | 536,576 | | | $ | 497,363 | | | $ | 210,840 | | | $ | 400,156 | | |
Distributions reinvested | | | 42,409 | | | | 82,168 | | | | 13,502 | | | | 29,528 | | | | 71,915 | | | | 151,626 | | |
Cost of shares redeemed | | | (364,910 | ) | | | (1,419,639 | ) | | | (976,872 | ) | | | (1,025,220 | ) | | | (379,288 | ) | | | (766,727 | ) | |
Total Class R Shares | | $ | (87,716 | ) | | $ | (593,220 | ) | | $ | (426,794 | ) | | $ | (498,329 | ) | | $ | (96,533 | ) | | $ | (214,945 | ) | |
Class Y Shares | |
Proceeds from shares
issued | | $ | 466,347 | | | $ | 2,226,232 | | | $ | 40,856,178 | | | $ | 138,578,340 | | | $ | 4,424,959 | | | $ | 976,273 | | |
Distributions reinvested | | | 53,531 | | | | 121,080 | | | | 2,071,550 | | | | 4,600,750 | | | | 140,383 | | | | 228,090 | | |
Cost of shares redeemed | | | (1,199,735 | ) | | | (4,125,789 | ) | | | (109,849,326 | ) | | | (205,871,161 | ) | | | (1,968,341 | ) | | | (3,152,337 | ) | |
Total Class Y Shares | | $ | (679,857 | ) | | $ | (1,778,477 | ) | | $ | (66,921,598 | ) | | $ | (62,692,071 | ) | | $ | 2,597,001 | | | $ | (1,947,974 | ) | |
Change in net assets resulting
from capital transactions | | $ | (5,068,154 | ) | | $ | (14,930,156 | ) | | $ | (110,950,960 | ) | | $ | (162,872,205 | ) | | $ | 2,778,199 | | | $ | (7,725,222 | ) | |
(continues on next page)
See notes to financial statements.
49
Victory Portfolios | | Statements of Changes in Net Assets | |
(continued)
| | | Victory
INCORE Investment
Quality Bond Fund | | Victory
INCORE Low Duration
Bond Fund | | Victory
High Yield Fund | |
| | | Six Months
Ended
June 30,
2018 | | Year
Ended
December 31,
2017 | | Six Months
Ended
June 30,
2018 | | Year
Ended
December 31,
2017 | | Six Months
Ended
June 30,
2018 | | Year
Ended
December 31,
2017 | |
| | | (Unaudited) | | | | (Unaudited) | | | | (Unaudited) | | | |
Share Transactions: | |
Class A Shares | |
Issued | | | 162,506 | | | | 295,492 | | | | 1,417,361 | | | | 4,664,463 | | | | 650,995 | | | | 286,825 | | |
Reinvested | | | 39,062 | | | | 85,190 | | | | 107,669 | | | | 267,483 | | | | 60,704 | | | | 136,509 | | |
Redeemed | | | (478,547 | ) | | | (1,391,149 | ) | | | (4,810,986 | ) | | | (11,415,614 | ) | | | (531,354 | ) | | | (1,122,011 | ) | |
Total Class A Shares | | | (276,979 | ) | | | (1,010,467 | ) | | | (3,285,956 | ) | | | (6,483,668 | ) | | | 180,345 | | | | (698,677 | ) | |
Class C Shares | |
Issued | | | 6,837 | | | | 26,962 | | | | 186,717 | | | | 422,473 | | | | 34,130 | | | | 83,822 | | |
Reinvested | | | 4,146 | | | | 10,909 | | | | 39,624 | | | | 76,544 | | | | 25,523 | | | | 55,272 | | |
Redeemed | | | (194,587 | ) | | | (339,958 | ) | | | (1,325,041 | ) | | | (3,931,543 | ) | | | (195,450 | ) | | | (297,521 | ) | |
Total Class C Shares | | | (183,604 | ) | | | (302,087 | ) | | | (1,098,700 | ) | | | (3,432,526 | ) | | | (135,797 | ) | | | (158,427 | ) | |
Class R Shares | |
Issued | | | 24,734 | | | | 77,547 | | | | 53,836 | | | | 49,538 | | | | 32,064 | | | | 61,669 | | |
Reinvested | | | 4,518 | | | | 8,561 | | | | 1,360 | | | | 2,943 | | | | 11,003 | | | | 23,257 | | |
Redeemed | | | (38,903 | ) | | | (147,630 | ) | | | (98,180 | ) | | | (102,062 | ) | | | (57,778 | ) | | | (117,872 | ) | |
Total Class R Shares | | | (9,651 | ) | | | (61,522 | ) | | | (42,984 | ) | | | (49,581 | ) | | | (14,711 | ) | | | (32,946 | ) | |
Class Y Shares | |
Issued | | | 49,565 | | | | 233,209 | | | | 4,100,255 | | | | 13,783,498 | | | | 681,397 | | | | 151,429 | | |
Reinvested | | | 5,720 | | | | 12,655 | | | | 208,432 | | | | 457,942 | | | | 21,661 | | | | 35,243 | | |
Redeemed | | | (128,186 | ) | | | (432,356 | ) | | | (11,037,006 | ) | | | (20,479,175 | ) | | | (303,426 | ) | | | (489,738 | ) | |
Total Class Y Shares | | | (72,901 | ) | | | (186,492 | ) | | | (6,728,319 | ) | | | (6,237,735 | ) | | | 399,632 | | | | (303,066 | ) | |
Change in Shares | | | (543,135 | ) | | | (1,560,568 | ) | | | (11,155,959 | ) | | | (16,203,510 | ) | | | 429,469 | | | | (1,193,116 | ) | |
See notes to financial statements.
50
Victory Portfolios | | Statements of Changes in Net Assets | |
| | | Victory
Tax-Exempt Fund | | Victory
High Income
Municipal Bond Fund | | Victory
Floating Rate Fund | |
| | | Six Months
Ended
June 30,
2018 | | Year
Ended
December 31,
2017 | | Six Months
Ended
June 30,
2018 | | Year
Ended
December 31,
2017 | | Six Months
Ended
June 30,
2018 | | Year
Ended
December 31,
2017 | |
| | | (Unaudited) | | | | (Unaudited) | | | | (Unaudited) | | | |
From Investment Activities: | |
Operations: | |
Net investment income
(loss) | | $ | 1,464,151 | | | $ | 3,573,247 | | | $ | 1,292,483 | | | $ | 3,646,007 | | | $ | 16,758,684 | | | $ | 36,779,615 | | |
Net realized gains
(losses) from
investment
transactions | | | 456,257 | | | | 2,484,368 | | | | 700,305 | | | | 4,064,798 | | | | 71,474 | | | | 2,249,383 | | |
Net change in
unrealized
appreciation/
depreciation on
investments | | | (2,069,733 | ) | | | 1,527,664 | | | | (2,208,046 | ) | | | (371,458 | ) | | | (4,672,457 | ) | | | (11,511,519 | ) | |
Change in net assets
resulting from operations | | | (149,325 | ) | | | 7,585,279 | | | | (215,258 | ) | | | 7,339,347 | | | | 12,157,701 | | | | 27,517,479 | | |
Distributions to Shareholders: | |
From net investment
income: | |
Class A Shares | | | (641,002 | ) | | | (1,618,136 | ) | | | (480,108 | ) | | | (1,272,345 | ) | | | (3,749,440 | ) | | | (8,534,071 | ) | |
Class C Shares | | | (347,267 | ) | | | (846,088 | ) | | | (402,745 | ) | | | (948,489 | ) | | | (5,620,153 | ) | | | (12,145,762 | ) | |
Class R Shares | | | — | | | | — | | | | — | | | | — | | | | (17,726 | ) | | | (49,769 | ) | |
Class Y Shares | | | (475,902 | ) | | | (1,107,087 | ) | | | (409,641 | ) | | | (1,423,842 | ) | | | (7,488,394 | ) | | | (16,116,919 | ) | |
From net realized
gains: | |
Class A Shares | | | — | | | | (472,344 | ) | | | — | | | | — | | | | — | | | | — | | |
Class C Shares | | | — | | | | (324,611 | ) | | | — | | | | — | | | | — | | | | — | | |
Class Y Shares | | | — | | | | (334,405 | ) | | | — | | | | — | | | | — | | | | — | | |
Change in net assets resulting
from distributions to
shareholders | | | (1,464,171 | ) | | | (4,702,671 | ) | | | (1,292,494 | ) | | | (3,644,676 | ) | | | (16,875,713 | ) | | | (36,846,521 | ) | |
Change in net assets resulting
from capital transactions | | | (10,410,512 | ) | | | (31,160,715 | ) | | | (18,888,389 | ) | | | (24,933,574 | ) | | | (25,846,690 | ) | | | (233,559,554 | ) | |
Change in net assets | | | (12,024,008 | ) | | | (28,278,107 | ) | | | (20,396,141 | ) | | | (21,238,903 | ) | | | (30,564,702 | ) | | | (242,888,596 | ) | |
Net Assets: | |
Beginning of period | | | 91,509,881 | | | | 119,787,988 | | | | 77,869,525 | | | | 99,108,428 | | | | 690,656,447 | | | | 933,545,043 | | |
End of period | | $ | 79,485,873 | | | $ | 91,509,881 | | | $ | 57,473,384 | | | $ | 77,869,525 | | | $ | 660,091,745 | | | $ | 690,656,447 | | |
Accumulated net investment
income (loss) | | $ | 20,348 | | | $ | 20,368 | | | $ | 127,971 | | | $ | 127,982 | | | $ | 129,594 | | | $ | 246,623 | | |
(continues on next page)
See notes to financial statements.
51
Victory Portfolios | | Statements of Changes in Net Assets | |
(continued)
| | | Victory
Tax-Exempt Fund | | Victory
High Income
Municipal Bond Fund | | Victory
Floating Rate Fund | |
| | | Six Months
Ended
June 30,
2018 | | Year
Ended
December 31,
2017 | | Six Months
Ended
June 30,
2018 | | Year
Ended
December 31,
2017 | | Six Months
Ended
June 30,
2018 | | Year
Ended
December 31,
2017 | |
| | | (Unaudited) | | | | (Unaudited) | | | | (Unaudited) | | | |
Capital Transactions: | |
Class A Shares | |
Proceeds from shares
issued | | $ | 733,870 | | | $ | 3,102,632 | | | $ | 844,587 | | | $ | 1,513,159 | | | $ | 21,501,782 | | | $ | 12,625,716 | | |
Distributions reinvested | | | 602,111 | | | | 1,959,387 | | | | 431,733 | | | | 1,148,985 | | | | 3,355,199 | | | | 7,541,272 | | |
Cost of shares redeemed | | | (5,029,575 | ) | | | (23,412,655 | ) | | | (5,702,649 | ) | | | (11,021,906 | ) | | | (32,104,785 | ) | | | (91,072,678 | ) | |
Total Class A Shares | | $ | (3,693,594 | ) | | $ | (18,350,636 | ) | | $ | (4,426,329 | ) | | $ | (8,359,762 | ) | | $ | (7,247,804 | ) | | $ | (70,905,690 | ) | |
Class C Shares | |
Proceeds from shares
issued | | $ | 277,898 | | | $ | 811,966 | | | $ | 294,589 | | | $ | 996,790 | | | $ | 9,384,921 | | | $ | 10,440,111 | | |
Distributions reinvested | | | 287,272 | | | | 949,284 | | | | 351,099 | | | | 807,173 | | | | 4,752,088 | | | | 9,957,444 | | |
Cost of shares redeemed | | | (3,976,032 | ) | | | (9,424,559 | ) | | | (3,404,937 | ) | | | (7,318,721 | ) | | | (38,265,816 | ) | | | (92,529,564 | ) | |
Total Class C Shares | | $ | (3,410,862 | ) | | $ | (7,663,309 | ) | | $ | (2,759,249 | ) | | $ | (5,514,758 | ) | | $ | (24,128,807 | ) | | $ | (72,132,009 | ) | |
Class R Shares | |
Proceeds from shares
issued | | $ | — | | | $ | — | | | $ | — | | | $ | — | | | $ | 72,819 | | | $ | 209,448 | | |
Distributions reinvested | | | — | | | | — | | | | — | | | | — | | | | 13,197 | | | | 39,590 | | |
Cost of shares redeemed | | | — | | | | — | | | | — | | | | — | | | | (339,951 | ) | | | (637,529 | ) | |
Total Class R Shares | | $ | — | | | $ | — | | | $ | — | | | $ | — | | | $ | (253,935 | ) | | $ | (388,491 | ) | |
Class Y Shares | |
Proceeds from shares
issued | | $ | 1,886,898 | | | $ | 6,773,639 | | | $ | 1,177,457 | | | $ | 5,817,166 | | | $ | 43,870,648 | | | $ | 89,018,180 | | |
Distributions reinvested | | | 438,305 | | | | 1,254,269 | | | | 380,714 | | | | 1,310,190 | | | | 6,434,573 | | | | 13,612,952 | | |
Cost of shares redeemed | | | (5,631,259 | ) | | | (13,174,678 | ) | | | (13,260,982 | ) | | | (18,186,410 | ) | | | (44,521,365 | ) | | | (192,764,496 | ) | |
Total Class Y Shares | | $ | (3,306,056 | ) | | $ | (5,146,770 | ) | | $ | (11,702,811 | ) | | $ | (11,059,054 | ) | | $ | 5,783,856 | | | $ | (90,133,364 | ) | |
Change in net assets resulting
from capital transactions | | $ | (10,410,512 | ) | | $ | (31,160,715 | ) | | $ | (18,888,389 | ) | | $ | (24,933,574 | ) | | $ | (25,846,690 | ) | | $ | (233,559,554 | ) | |
(continues on next page)
See notes to financial statements.
52
Victory Portfolios | | Statements of Changes in Net Assets | |
(continued)
| | | Victory
Tax-Exempt Fund | | Victory
High Income
Municipal Bond Fund | | Victory
Floating Rate Fund | |
| | | Six Months
Ended
June 30,
2018 | | Year
Ended
December 31,
2017 | | Six Months
Ended
June 30,
2018 | | Year
Ended
December 31,
2017 | | Six Months
Ended
June 30,
2018 | | Year
Ended
December 31,
2017 | |
| | | (Unaudited) | | | | (Unaudited) | | | | (Unaudited) | | | |
Share Transactions: | |
Class A Shares | |
Issued | | | 75,304 | | | | 311,344 | | | | 79,959 | | | | 141,815 | | | | 2,240,853 | | | | 1,305,374 | | |
Reinvested | | | 61,964 | | | | 198,907 | | | | 40,896 | | | | 108,390 | | | | 349,774 | | | | 781,201 | | |
Redeemed | | | (517,110 | ) | | | (2,381,069 | ) | | | (540,406 | ) | | | (1,038,779 | ) | | | (3,345,040 | ) | | | (9,422,219 | ) | |
Total Class A Shares | | | (379,842 | ) | | | (1,870,818 | ) | | | (419,551 | ) | | | (788,574 | ) | | | (754,413 | ) | | | (7,335,644 | ) | |
Class C Shares | |
Issued | | | 28,548 | | | | 81,943 | | | | 27,815 | | | | 94,105 | | | | 977,267 | | | | 1,079,352 | | |
Reinvested | | | 29,580 | | | | 96,363 | | | | 33,256 | | | | 76,139 | | | | 495,004 | | | | 1,030,772 | | |
Redeemed | | | (409,254 | ) | | | (958,991 | ) | | | (322,203 | ) | | | (692,994 | ) | | | (3,982,517 | ) | | | (9,576,856 | ) | |
Total Class C Shares | | | (351,126 | ) | | | (780,685 | ) | | | (261,132 | ) | | | (522,750 | ) | | | (2,510,246 | ) | | | (7,466,732 | ) | |
Class R Shares | |
Issued | | | — | | | | — | | | | — | | | | — | | | | 7,584 | | | | 21,658 | | |
Reinvested | | | — | | | | — | | | | — | | | | — | | | | 1,375 | | | | 4,101 | | |
Redeemed | | | — | | | | — | | | | — | | | | — | | | | (35,377 | ) | | | (66,148 | ) | |
Total Class R Shares | | | — | | | | — | | | | — | | | | — | | | | (26,418 | ) | | | (40,389 | ) | |
Class Y Shares | |
Issued | | | 194,051 | | | | 689,033 | | | | 111,307 | | | | 552,773 | | | | 4,567,534 | | | | 9,198,088 | | |
Reinvested | | | 45,131 | | | | 127,339 | | | | 36,058 | | | | 123,607 | | | | 670,229 | | | | 1,409,028 | | |
Redeemed | | | (577,833 | ) | | | (1,339,687 | ) | | | (1,256,697 | ) | | | (1,722,680 | ) | | | (4,632,675 | ) | | | (19,933,369 | ) | |
Total Class Y Shares | | | (338,651 | ) | | | (523,315 | ) | | | (1,109,332 | ) | | | (1,046,300 | ) | | | 605,088 | | | | (9,326,253 | ) | |
Change in Shares | | | (1,069,619 | ) | | | (3,174,818 | ) | | | (1,790,015 | ) | | | (2,357,624 | ) | | | (2,685,989 | ) | | | (24,169,018 | ) | |
See notes to financial statements.
53
Victory Portfolios | | Statements of Changes in Net Assets | |
| | | Victory
Strategic Income Fund | |
| | | Six Months
Ended
June 30,
2018 | | Year
Ended
December 31,
2017 | |
| | | (Unaudited) | | | |
From Investment Activities: | |
Operations: | |
Net investment income (loss) | | $ | 946,994 | | | $ | 1,904,829 | | |
Net realized gains (losses) from investment transactions | | | (1,044,032 | ) | | | 998,362 | | |
Net change in unrealized appreciation/depreciation on investments | | | (661,937 | ) | | | 105,546 | | |
Change in net assets resulting from operations | | | (758,975 | ) | | | 3,008,737 | | |
Distributions to Shareholders: | |
From net investment income: | |
Class A Shares | | | (579,989 | ) | | | (1,253,807 | ) | |
Class C Shares | | | (152,144 | ) | | | (317,178 | ) | |
Class R Shares | | | (42,937 | ) | | | (91,356 | ) | |
Class Y Shares | | | (103,003 | ) | | | (405,899 | ) | |
Change in net assets resulting from distributions to shareholders | | | (878,073 | ) | | | (2,068,240 | ) | |
Change in net assets resulting from capital transactions | | | (5,850,199 | ) | | | (4,618,608 | ) | |
Change in net assets | | | (7,487,247 | ) | | | (3,678,111 | ) | |
Net Assets: | |
Beginning of period | | | 59,735,912 | | | | 63,414,023 | | |
End of period | | $ | 52,248,665 | | | $ | 59,735,912 | | |
Accumulated net investment income (loss) | | $ | (36,886 | ) | | $ | (105,807 | ) | |
(continues on next page)
See notes to financial statements.
54
Victory Portfolios | | Statements of Changes in Net Assets | |
(continued)
| | | Victory
Strategic Income Fund | |
| | | Six Months
Ended
June 30,
2018 | | Year
Ended
December 31,
2017 | |
| | | (Unaudited) | | | |
Capital Transactions: | |
Class A Shares | |
Proceeds from shares issued | | $ | 570,835 | | | $ | 754,116 | | |
Distributions reinvested | | | 105,117 | | | | 259,436 | | |
Cost of shares redeemed | | | (1,297,091 | ) | | | (3,726,856 | ) | |
Total Class A Shares | | $ | (621,139 | ) | | $ | (2,713,304 | ) | |
Class C Shares | |
Proceeds from shares issued | | $ | 885,127 | | | $ | 1,478,406 | | |
Distributions reinvested | | | 120,247 | | | | 249,788 | | |
Cost of shares redeemed | | | (1,179,169 | ) | | | (1,778,882 | ) | |
Total Class C Shares | | $ | (173,795 | ) | | $ | (50,688 | ) | |
Class R Shares | |
Proceeds from shares issued | | $ | 6,586 | | | $ | 17,575 | | |
Distributions reinvested | | | 6,893 | | | | 15,654 | | |
Cost of shares redeemed | | | (42,088 | ) | | | (129,893 | ) | |
Total Class R Shares | | $ | (28,609 | ) | | $ | (96,664 | ) | |
Class Y Shares | |
Proceeds from shares issued | | $ | 303,484 | | | $ | 2,676,340 | | |
Distributions reinvested | | | 58,417 | | | | 304,661 | | |
Cost of shares redeemed | | | (5,388,557 | ) | | | (4,738,953 | ) | |
Total Class Y Shares | | $ | (5,026,656 | ) | | $ | (1,757,952 | ) | |
Change in net assets resulting from capital transactions | | $ | (5,850,199 | ) | | $ | (4,618,608 | ) | |
Share Transactions: | |
Class A Shares | |
Issued | | | 57,157 | | | | 74,635 | | |
Reinvested | | | 10,590 | | | | 25,689 | | |
Redeemed | | | (130,672 | ) | | | (369,334 | ) | |
Total Class A Shares | | | (62,925 | ) | | | (269,010 | ) | |
Class C Shares | |
Issued | | | 88,110 | | | | 145,885 | | |
Reinvested | | | 12,058 | | | | 24,613 | | |
Redeemed | | | (118,786 | ) | | | (175,535 | ) | |
Total Class C Shares | | | (18,618 | ) | | | (5,037 | ) | |
Class R Shares | |
Issued | | | 660 | | | | 1,738 | | |
Reinvested | | | 691 | | | | 1,542 | | |
Redeemed | | | (4,240 | ) | | | (12,801 | ) | |
Total Class R Shares | | | (2,889 | ) | | | (9,521 | ) | |
Class Y Shares | |
Issued | | | 30,811 | | | | 267,549 | | |
Reinvested | | | 5,906 | | | | 30,331 | | |
Redeemed | | | (536,336 | ) | | | (472,927 | ) | |
Total Class Y Shares | | | (499,619 | ) | | | (175,047 | ) | |
Change in Shares | | | (584,051 | ) | | | (458,615 | ) | |
See notes to financial statements.
55
Victory Portfolios | | Financial Highlights | |
For a Share Outstanding Throughout Each Period
| | | Victory INCORE Investment Quality Bond Fund | |
| | | Class A Shares | |
| | | Six
Months
Ended
June 30,
2018 | | Year
Ended
December 31,
2017 | | Year
Ended
December 31,
2016 | | Year
Ended
December 31,
2015 | | Year
Ended
December 31,
2014 | | Year
Ended
December 31,
2013 | |
| | | (Unaudited) | | | | | | | | | | | |
Net Asset Value, Beginning of Period | | $ | 9.59 | | | $ | 9.48 | | | $ | 9.57 | | | $ | 10.16 | | | $ | 10.01 | | | $ | 10.50 | | |
Investment Activities: | |
Net investment income (loss) (a) | | | 0.11 | | | | 0.18 | | | | 0.22 | | | | 0.31 | | | | 0.30 | | | | 0.28 | | |
Net realized and unrealized
gains (losses) on investments | | | (0.27 | ) | | | 0.16 | | | | 0.16 | | | | (0.38 | ) | | | 0.26 | | | | (0.45 | ) | |
Total from Investment
Activities | | | (0.16 | ) | | | 0.34 | | | | 0.38 | | | | (0.07 | ) | | | 0.56 | | | | (0.17 | ) | |
Distributions to Shareholders: | |
Net investment income | | | (0.12 | ) | | | (0.23 | ) | | | (0.23 | ) | | | (0.30 | ) | | | (0.30 | ) | | | (0.28 | ) | |
Net realized gains
from investments | | | — | | | | — | | | | (0.24 | ) | | | (0.22 | ) | | | (0.11 | ) | | | (0.04 | ) | |
Total Distributions
to Shareholders | | | (0.12 | ) | | | (0.23 | ) | | | (0.47 | ) | | | (0.52 | ) | | | (0.41 | ) | | | (0.32 | ) | |
Net Asset Value, End of Period | | $ | 9.31 | | | $ | 9.59 | | | $ | 9.48 | | | $ | 9.57 | | | $ | 10.16 | | | $ | 10.01 | | |
Total Return (excludes sales
charge) (b) | | | (1.64 | )% | | | 3.62 | % | | | 4.01 | % | | | (0.74 | )% | | | 5.67 | % | | | (1.64 | )% | |
Ratios/Supplemental Data: | |
Net Assets at end of period (000) | | $ | 27,803 | | | $ | 31,306 | | | $ | 40,510 | | | $ | 51,747 | | | $ | 73,618 | | | $ | 80,139 | | |
Ratio of net expenses to average
net assets (c) | | | 0.90 | % | | | 0.90 | % | | | 0.90 | % | | | 0.90 | % | | | 0.88 | % | | | 0.85 | % | |
Ratio of net investment income (loss)
to average net assets (c) | | | 2.26 | % | | | 1.86 | % | | | 2.29 | % | | | 3.06 | % | | | 2.98 | % | | | 2.70 | % | |
Ratio of gross expenses to average
net assets (c) (d) | | | 1.12 | % | | | 1.07 | % | | | 1.14 | % | | | 1.07 | % | | | 1.05 | % | | | 1.01 | % | |
Portfolio turnover (b) (e) | | | 45 | % | | | 70 | % | | | 148 | % | | | 73 | % | | | 51 | % | | | 201 | % | |
(a) Per share net investment income (loss) has been calculated using the average daily shares method.
(b) Not annualized for periods less than one year.
(c) Annualized for periods less than one year.
(d) During the period, certain fees were reduced and/or reimbursed. If such fee reductions and/or reimbursements had not occurred, the ratios would have been as indicated.
(e) Portfolio turnover is calculated on the basis of the Fund as a whole without distinguishing between the classes of shares issued.
See notes to financial statements.
56
Victory Portfolios | | Financial Highlights — continued | |
For a Share Outstanding Throughout Each Period
| | | Victory INCORE Investment Quality Bond Fund | |
| | | Class C Shares | |
| | | Six
Months
Ended
June 30,
2018 | | Year
Ended
December 31,
2017 | | Year
Ended
December 31,
2016 | | Year
Ended
December 31,
2015 | | Year
Ended
December 31,
2014 | | Year
Ended
December 31,
2013 | |
| | | (Unaudited) | | | | | | | | | | | |
Net Asset Value, Beginning of Period | | $ | 9.58 | | | $ | 9.47 | | | $ | 9.56 | | | $ | 10.16 | | | $ | 10.01 | | | $ | 10.50 | | |
Investment Activities: | |
Net investment income (loss) (a) | | | 0.07 | | | | 0.10 | | | | 0.14 | | | | 0.22 | | | | 0.22 | | | | 0.20 | | |
Net realized and unrealized
gains (losses) on investments | | | (0.27 | ) | | | 0.16 | | | | 0.16 | | | | (0.38 | ) | | | 0.26 | | | | (0.45 | ) | |
Total from Investment
Activities | | | (0.20 | ) | | | 0.26 | | | | 0.30 | | | | (0.16 | ) | | | 0.48 | | | | (0.25 | ) | |
Distributions to Shareholders: | |
Net investment income | | | (0.08 | ) | | | (0.15 | ) | | | (0.15 | ) | | | (0.22 | ) | | | (0.22 | ) | | | (0.20 | ) | |
Net realized gains
from investments | | | — | | | | — | | | | (0.24 | ) | | | (0.22 | ) | | | (0.11 | ) | | | (0.04 | ) | |
Total Distributions
to Shareholders | | | (0.08 | ) | | | (0.15 | ) | | | (0.39 | ) | | | (0.44 | ) | | | (0.33 | ) | | | (0.24 | ) | |
Net Asset Value, End of Period | | $ | 9.30 | | | $ | 9.58 | | | $ | 9.47 | | | $ | 9.56 | | | $ | 10.16 | | | $ | 10.01 | | |
Total Return (excludes contingent
deferred sales charge) (b) | | | (2.06 | )% | | | 2.74 | % | | | 3.11 | % | | | (1.70 | )% | | | 4.81 | % | | | (2.37 | )% | |
Ratios/Supplemental Data: | |
Net Assets at end of period (000) | | $ | 4,238 | | | $ | 6,127 | | | $ | 8,915 | | | $ | 10,510 | | | $ | 15,377 | | | $ | 12,057 | | |
Ratio of net expenses to average
net assets (c) | | | 1.77 | % | | | 1.77 | % | | | 1.77 | % | | | 1.77 | % | | | 1.71 | % | | | 1.60 | % | |
Ratio of net investment income (loss)
to average net assets (c) | | | 1.41 | % | | | 0.99 | % | | | 1.42 | % | | | 2.19 | % | | | 2.16 | % | | | 1.92 | % | |
Ratio of gross expenses to average
net assets (c) (d) | | | 2.07 | % | | | 1.91 | % | | | 1.92 | % | | | 1.85 | % | | | 1.88 | % | | | 1.81 | % | |
Portfolio turnover (b) (e) | | | 45 | % | | | 70 | % | | | 148 | % | | | 73 | % | | | 51 | % | | | 201 | % | |
(a) Per share net investment income (loss) has been calculated using the average daily shares method.
(b) Not annualized for periods less than one year.
(c) Annualized for periods less than one year.
(d) During the period, certain fees were reduced and/or reimbursed. If such fee reductions and/or reimbursements had not occurred, the ratios would have been as indicated.
(e) Portfolio turnover is calculated on the basis of the Fund as a whole without distinguishing between the classes of shares issued.
See notes to financial statements.
57
Victory Portfolios | | Financial Highlights — continued | |
For a Share Outstanding Throughout Each Period
| | | Victory INCORE Investment Quality Bond Fund | |
| | | Class R Shares | |
| | | Six
Months
Ended
June 30,
2018 | | Year
Ended
December 31,
2017 | | Year
Ended
December 31,
2016 | | Year
Ended
December 31,
2015 | | Year
Ended
December 31,
2014 | | Year
Ended
December 31,
2013 | |
| | | (Unaudited) | | | | | | | | | | | |
Net Asset Value, Beginning of Period | | $ | 9.61 | | | $ | 9.50 | | | $ | 9.58 | | | $ | 10.18 | | | $ | 10.02 | | | $ | 10.51 | | |
Investment Activities: | |
Net investment income (loss) (a) | | | 0.09 | | | | 0.14 | | | | 0.19 | | | | 0.27 | | | | 0.26 | | | | 0.24 | | |
Net realized and unrealized
gains (losses) on investments | | | (0.27 | ) | | | 0.16 | | | | 0.17 | | | | (0.39 | ) | | | 0.27 | | | | (0.45 | ) | |
Total from Investment
Activities | | | (0.18 | ) | | | 0.30 | | | | 0.36 | | | | (0.12 | ) | | | 0.53 | | | | (0.21 | ) | |
Distributions to Shareholders: | |
Net investment income | | | (0.10 | ) | | | (0.19 | ) | | | (0.20 | ) | | | (0.26 | ) | | | (0.26 | ) | | | (0.24 | ) | |
Net realized gains
from investments | | | — | | | | — | | | | (0.24 | ) | | | (0.22 | ) | | | (0.11 | ) | | | (0.04 | ) | |
Total Distributions
to Shareholders | | | (0.10 | ) | | | (0.19 | ) | | | (0.44 | ) | | | (0.48 | ) | | | (0.37 | ) | | | (0.28 | ) | |
Net Asset Value, End of Period | | $ | 9.33 | | | $ | 9.61 | | | $ | 9.50 | | | $ | 9.58 | | | $ | 10.18 | | | $ | 10.02 | | |
Total Return (b) | | | (1.83 | )% | | | 3.16 | % | | | 3.71 | % | | | (1.24 | )% | | | 5.36 | % | | | (2.02 | )% | |
Ratios/Supplemental Data: | |
Net Assets at end of period (000) | | $ | 3,733 | | | $ | 3,940 | | | $ | 4,477 | | | $ | 5,568 | | | $ | 7,821 | | | $ | 7,287 | | |
Ratio of net expenses to average
net assets (c) | | | 1.30 | % | | | 1.30 | % | | | 1.30 | % | | | 1.30 | % | | | 1.28 | % | | | 1.25 | % | |
Ratio of net investment income (loss)
to average net assets (c) | | | 1.85 | % | | | 1.44 | % | | | 1.90 | % | | | 2.65 | % | | | 2.57 | % | | | 2.32 | % | |
Ratio of gross expenses to average
net assets (c) (d) | | | 1.58 | % | | | 1.65 | % | | | 1.44 | % | | | 1.45 | % | | | 1.46 | % | | | 1.41 | % | |
Portfolio turnover (b) (e) | | | 45 | % | | | 70 | % | | | 148 | % | | | 73 | % | | | 51 | % | | | 201 | % | |
(a) Per share net investment income (loss) has been calculated using the average daily shares method.
(b) Not annualized for periods less than one year.
(c) Annualized for periods less than one year.
(d) During the period, certain fees were reduced and/or reimbursed. If such fee reductions and/or reimbursements had not occurred, the ratios would have been as indicated.
(e) Portfolio turnover is calculated on the basis of the Fund as a whole without distinguishing between the classes of shares issued.
See notes to financial statements.
58
Victory Portfolios | | Financial Highlights — continued | |
For a Share Outstanding Throughout Each Period
| | | Victory INCORE Investment Quality Bond Fund | |
| | | Class Y Shares | |
| | | Six
Months
Ended
June 30,
2018 | | Year
Ended
December 31,
2017 | | Year
Ended
December 31,
2016 | | Year
Ended
December 31,
2015 | | Year
Ended
December 31,
2014 | | Year
Ended
December 31,
2013 | |
| | | (Unaudited) | | | | | | | | | | | |
Net Asset Value, Beginning of Period | | $ | 9.58 | | | $ | 9.47 | | | $ | 9.56 | | | $ | 10.17 | | | $ | 10.02 | | | $ | 10.50 | | |
Investment Activities: | |
Net investment income (loss) (a) | | | 0.12 | | | | 0.20 | | | | 0.25 | | | | 0.32 | | | | 0.33 | | | | 0.30 | | |
Net realized and unrealized
gains (losses) on investments | | | (0.27 | ) | | | 0.16 | | | | 0.16 | | | | (0.39 | ) | | | 0.26 | | | | (0.44 | ) | |
Total from Investment
Activities | | | (0.15 | ) | | | 0.36 | | | | 0.41 | | | | (0.07 | ) | | | 0.59 | | | | (0.14 | ) | |
Distributions to Shareholders: | |
Net investment income | | | (0.13 | ) | | | (0.25 | ) | | | (0.26 | ) | | | (0.32 | ) | | | (0.33 | ) | | | (0.30 | ) | |
Net realized gains
from investments | | | — | | | | — | | | | (0.24 | ) | | | (0.22 | ) | | | (0.11 | ) | | | (0.04 | ) | |
Total Distributions
to Shareholders | | | (0.13 | ) | | | (0.25 | ) | | | (0.50 | ) | | | (0.54 | ) | | | (0.44 | ) | | | (0.34 | ) | |
Net Asset Value, End of Period | | $ | 9.30 | | | $ | 9.58 | | | $ | 9.47 | | | $ | 9.56 | | | $ | 10.17 | | | $ | 10.02 | | |
Total Return (b) | | | (1.52 | )% | | | 3.87 | % | | | 4.26 | % | | | (0.73 | )% | | | 5.91 | % | | | (1.35 | )% | |
Ratios/Supplemental Data: | |
Net Assets at end of period (000) | | $ | 3,612 | | | $ | 4,421 | | | $ | 6,133 | | | $ | 5,557 | | | $ | 33,519 | | | $ | 34,568 | | |
Ratio of net expenses to average
net assets (c) | | | 0.66 | % | | | 0.66 | % | | | 0.66 | % | | | 0.66 | % | | | 0.66 | % | | | 0.66 | % | |
Ratio of net investment income (loss)
to average net assets (c) | | | 2.51 | % | | | 2.09 | % | | | 2.53 | % | | | 3.19 | % | | | 3.20 | % | | | 2.89 | % | |
Ratio of gross expenses to average
net assets (c) (d) | | | 1.06 | % | | | 0.98 | % | | | 0.94 | % | | | 0.86 | % | | | 0.78 | % | | | 0.72 | % | |
Portfolio turnover (b) (e) | | | 45 | % | | | 70 | % | | | 148 | % | | | 73 | % | | | 51 | % | | | 201 | % | |
(a) Per share net investment income (loss) has been calculated using the average daily shares method.
(b) Not annualized for periods less than one year.
(c) Annualized for periods less than one year.
(d) During the period, certain fees were reduced and/or reimbursed. If such fee reductions and/or reimbursements had not occurred, the ratios would have been as indicated.
(e) Portfolio turnover is calculated on the basis of the Fund as a whole without distinguishing between the classes of shares issued.
See notes to financial statements.
59
Victory Portfolios | | Financial Highlights | |
For a Share Outstanding Throughout Each Period
| | | Victory INCORE Low Duration Bond Fund | |
| | | Class A Shares | |
| | | Six
Months
Ended
June 30,
2018 | | Year
Ended
December 31,
2017 | | Year
Ended
December 31,
2016 | | Year
Ended
December 31,
2015 | | Year
Ended
December 31,
2014 | | Year
Ended
December 31,
2013 | |
| | | (Unaudited) | | | | | | | | | | | |
Net Asset Value, Beginning of Period | | $ | 9.99 | | | $ | 10.03 | | | $ | 9.95 | | | $ | 10.03 | | | $ | 10.13 | | | $ | 10.32 | | |
Investment Activities: | |
Net investment income (loss) (a) | | | 0.08 | | | | 0.12 | | | | 0.12 | | | | 0.14 | | | | 0.18 | | | | 0.18 | | |
Net realized and unrealized
gains (losses) on investments | | | (0.05 | ) | | | 0.02 | | | | 0.06 | | | | (0.09 | ) | | | (0.10 | ) | | | (0.19 | ) | |
Total from Investment
Activities | | | 0.03 | | | | 0.14 | | | | 0.18 | | | | 0.05 | | | | 0.08 | | | | (0.01 | ) | |
Distributions to Shareholders: | |
Net investment income | | | (0.10 | ) | | | (0.18 | ) | | | (0.10 | ) | | | (0.13 | ) | | | (0.18 | ) | | | (0.18 | ) | |
Total Distributions
to Shareholders | | | (0.10 | ) | | | (0.18 | ) | | | (0.10 | ) | | | (0.13 | ) | | | (0.18 | ) | | | (0.18 | ) | |
Capital Contributions from Prior
Custodian, Net (See Note 8) | | | — | | | | — | | | | — | (b) | | | — | | | | — | | | | — | | |
Net Asset Value, End of Period | | $ | 9.92 | | | $ | 9.99 | | | $ | 10.03 | | | $ | 9.95 | | | $ | 10.03 | | | $ | 10.13 | | |
Total Return (excludes sales
charge) (c) | | | 0.19 | % | | | 1.47 | % | | | 1.80 | %(d) | | | 0.52 | % | | | 0.74 | % | | | (0.07 | )% | |
Ratios/Supplemental Data: | |
Net Assets at end of period (000) | | $ | 115,567 | | | $ | 149,287 | | | $ | 214,825 | | | $ | 314,347 | | | $ | 373,706 | | | $ | 580,942 | | |
Ratio of net expenses to average
net assets (e) | | | 0.85 | % | | | 0.85 | % | | | 0.85 | % | | | 0.84 | % | | | 0.90 | % | | | 0.83 | % | |
Ratio of net investment income (loss)
to average net assets (e) | | | 1.59 | % | | | 1.21 | % | | | 1.21 | % | | | 1.38 | % | | | 1.75 | % | | | 1.76 | % | |
Ratio of gross expenses to average
net assets (e) (f) | | | 0.91 | % | | | 0.90 | % | | | 0.89 | % | | | 0.85 | % | | | 0.90 | % | | | 0.84 | % | |
Portfolio turnover (c) (g) | | | 17 | % | | | 62 | % | | | 49 | % | | | 36 | % | | | 38 | % | | | 74 | % | |
(a) Per share net investment income (loss) has been calculated using the average daily shares method.
(b) Amount is less than $0.005 per share.
(c) Not annualized for periods less than one year.
(d) The Fund received monies related to a nonrecurring refund from the prior Custodian. The corresponding impact to the total return was less than 0.005% for the period shown. (See Note 8)
(e) Annualized for periods less than one year.
(f) During the period, certain fees were reduced and/or reimbursed. If such fee reductions and/or reimbursements had not occurred, the ratios would have been as indicated.
(g) Portfolio turnover is calculated on the basis of the Fund as a whole without distinguishing between the classes of shares issued.
See notes to financial statements.
60
Victory Portfolios | | Financial Highlights — continued | |
For a Share Outstanding Throughout Each Period
| | | Victory INCORE Low Duration Bond Fund | |
| | | Class C Shares | |
| | | Six
Months
Ended
June 30,
2018 | | Year
Ended
December 31,
2017 | | Year
Ended
December 31,
2016 | | Year
Ended
December 31,
2015 | | Year
Ended
December 31,
2014 | | Year
Ended
December 31,
2013 | |
| | | (Unaudited) | | | | | | | | | | | |
Net Asset Value, Beginning of Period | | $ | 9.99 | | | $ | 10.02 | | | $ | 9.95 | | | $ | 10.03 | | | $ | 10.13 | | | $ | 10.32 | | |
Investment Activities: | |
Net investment income (loss) (a) | | | 0.04 | | | | 0.04 | | | | 0.04 | | | | 0.06 | | | | 0.10 | | | | 0.10 | | |
Net realized and unrealized
gains (losses) on investments | | | (0.06 | ) | | | 0.03 | | | | 0.05 | | | | (0.08 | ) | | | (0.10 | ) | | | (0.19 | ) | |
Total from Investment
Activities | | | (0.02 | ) | | | 0.07 | | | | 0.09 | | | | (0.02 | ) | | | — | | | | (0.09 | ) | |
Distributions to Shareholders: | |
Net investment income | | | (0.06 | ) | | | (0.10 | ) | | | (0.02 | ) | | | (0.06 | ) | | | (0.10 | ) | | | (0.10 | ) | |
Total Distributions
to Shareholders | | | (0.06 | ) | | | (0.10 | ) | | | (0.02 | ) | | | (0.06 | ) | | | (0.10 | ) | | | (0.10 | ) | |
Capital Contributions from Prior
Custodian, Net (See Note 8) | | | — | | | | — | | | | — | (b) | | | — | | | | — | | | | — | | |
Net Asset Value, End of Period | | $ | 9.91 | | | $ | 9.99 | | | $ | 10.02 | | | $ | 9.95 | | | $ | 10.03 | | | $ | 10.13 | | |
Total Return (excludes contingent
deferred sales charge) (c) | | | (0.19 | )% | | | 0.70 | % | | | 0.94 | %(d) | | | (0.20 | )% | | | — | %(e) | | | (0.85 | )% | |
Ratios/Supplemental Data: | |
Net Assets at end of period (000) | | $ | 71,330 | | | $ | 82,847 | | | $ | 117,544 | | | $ | 154,056 | | | $ | 191,970 | | | $ | 268,237 | | |
Ratio of net expenses to average
net assets (f) | | | 1.62 | % | | | 1.62 | % | | | 1.62 | % | | | 1.61 | % | | | 1.64 | % | | | 1.61 | % | |
Ratio of net investment income (loss)
to average net assets (f) | | | 0.82 | % | | | 0.44 | % | | | 0.44 | % | | | 0.62 | % | | | 1.00 | % | | | 0.98 | % | |
Ratio of gross expenses to average
net assets (f) (g) | | | 1.69 | % | | | 1.65 | % | | | 1.65 | % | | | 1.62 | % | | | 1.64 | % | | | 1.63 | % | |
Portfolio turnover (c) (h) | | | 17 | % | | | 62 | % | | | 49 | % | | | 36 | % | | | 38 | % | | | 74 | % | |
(a) Per share net investment income (loss) has been calculated using the average daily shares method.
(b) Amount is less than $0.005 per share.
(c) Not annualized for periods less than one year.
(d) The Fund received monies related to a nonrecurring refund from the prior Custodian. The corresponding impact to the total return was less than 0.005% for the period shown. (See Note 8)
(e) Amount is less than 0.005%.
(f) Annualized for periods less than one year.
(g) During the period, certain fees were reduced and/or reimbursed. If such fee reductions and/or reimbursements had not occurred, the ratios would have been as indicated.
(h) Portfolio turnover is calculated on the basis of the Fund as a whole without distinguishing between the classes of shares issued.
See notes to financial statements.
61
Victory Portfolios | | Financial Highlights — continued | |
For a Share Outstanding Throughout Each Period
| | | Victory INCORE Low Duration Bond Fund | |
| | | Class R Shares | |
| | | Six
Months
Ended
June 30,
2018 | | Year
Ended
December 31,
2017 | | Year
Ended
December 31,
2016 | | Year
Ended
December 31,
2015 | | Year
Ended
December 31,
2014 | | Year
Ended
December 31,
2013 | |
| | | (Unaudited) | | | | | | | | | | | |
Net Asset Value, Beginning of Period | | $ | 9.99 | | | $ | 10.02 | | | $ | 9.95 | | | $ | 10.03 | | | $ | 10.13 | | | $ | 10.32 | | |
Investment Activities: | |
Net investment income (loss) (a) | | | 0.06 | | | | 0.08 | | | | 0.08 | | | | 0.10 | | | | 0.13 | | | | 0.14 | | |
Net realized and unrealized
gains (losses) on investments | | | (0.06 | ) | | | 0.03 | | | | 0.05 | | | | (0.09 | ) | | | (0.10 | ) | | | (0.19 | ) | |
Total from Investment
Activities | | | — | | | | 0.11 | | | | 0.13 | | | | 0.01 | | | | 0.03 | | | | (0.05 | ) | |
Distributions to Shareholders: | |
Net investment income | | | (0.08 | ) | | | (0.14 | ) | | | (0.06 | ) | | | (0.09 | ) | | | (0.13 | ) | | | (0.14 | ) | |
Total Distributions
to Shareholders | | | (0.08 | ) | | | (0.14 | ) | | | (0.06 | ) | | | (0.09 | ) | | | (0.13 | ) | | | (0.14 | ) | |
Capital Contributions from Prior
Custodian, Net (See Note 8) | | | — | | | | — | | | | — | (b) | | | — | | | | — | | | | — | | |
Net Asset Value, End of Period | | $ | 9.91 | | | $ | 9.99 | | | $ | 10.02 | | | $ | 9.95 | | | $ | 10.03 | | | $ | 10.13 | | |
Total Return (c) | | | (0.02 | )% | | | 1.05 | % | | | 1.33 | %(d) | | | 0.12 | % | | | 0.31 | % | | | (0.50 | )% | |
Ratios/Supplemental Data: | |
Net Assets at end of period (000) | | $ | 1,636 | | | $ | 2,078 | | | $ | 2,583 | | | $ | 3,925 | | | $ | 5,001 | | | $ | 5,894 | | |
Ratio of net expenses to average
net assets (e) | | | 1.27 | % | | | 1.27 | % | | | 1.23 | % | | | 1.26 | % | | | 1.33 | % | | | 1.26 | % | |
Ratio of net investment income (loss)
to average net assets (e) | | | 1.18 | % | | | 0.79 | % | | | 0.83 | % | | | 0.96 | % | | | 1.31 | % | | | 1.34 | % | |
Ratio of gross expenses to average
net assets (e) (f) | | | 1.83 | % | | | 1.68 | % | | | 1.25 | % | | | 1.27 | % | | | 1.33 | % | | | 1.30 | % | |
Portfolio turnover (c) (g) | | | 17 | % | | | 62 | % | | | 49 | % | | | 36 | % | | | 38 | % | | | 74 | % | |
(a) Per share net investment income (loss) has been calculated using the average daily shares method.
(b) Amount is less than $0.005 per share.
(c) Not annualized for periods less than one year.
(d) The Fund received monies related to a nonrecurring refund from the prior Custodian. The corresponding impact to the total return was less than 0.005% for the period shown. (See Note 8)
(e) Annualized for periods less than one year.
(f) During the period, certain fees were reduced and/or reimbursed. If such fee reductions and/or reimbursements had not occurred, the ratios would have been as indicated.
(g) Portfolio turnover is calculated on the basis of the Fund as a whole without distinguishing between the classes of shares issued.
See notes to financial statements.
62
Victory Portfolios | | Financial Highlights — continued | |
For a Share Outstanding Throughout Each Period
| | | Victory INCORE Low Duration Bond Fund | |
| | | Class Y Shares | |
| | | Six
Months
Ended
June 30,
2018 | | Year
Ended
December 31,
2017 | | Year
Ended
December 31,
2016 | | Year
Ended
December 31,
2015 | | Year
Ended
December 31,
2014 | | Year
Ended
December 31,
2013 | |
| | | (Unaudited) | | | | | | | | | | | |
Net Asset Value, Beginning of Period | | $ | 10.00 | | | $ | 10.03 | | | $ | 9.95 | | | $ | 10.03 | | | $ | 10.13 | | | $ | 10.32 | | |
Investment Activities: | |
Net investment income (loss) (a) | | | 0.09 | | | | 0.15 | | | | 0.14 | | | | 0.16 | | | | 0.20 | | | | 0.20 | | |
Net realized and unrealized
gains (losses) on investments | | | (0.06 | ) | | | 0.02 | | | | 0.06 | | | | (0.08 | ) | | | (0.10 | ) | | | (0.19 | ) | |
Total from Investment
Activities | | | 0.03 | | | | 0.17 | | | | 0.20 | | | | 0.08 | | | | 0.10 | | | | 0.01 | | |
Distributions to Shareholders: | |
Net investment income | | | (0.11 | ) | | | (0.20 | ) | | | (0.12 | ) | | | (0.16 | ) | | | (0.20 | ) | | | (0.20 | ) | |
Total Distributions
to Shareholders | | | (0.11 | ) | | | (0.20 | ) | | | (0.12 | ) | | | (0.16 | ) | | | (0.20 | ) | | | (0.20 | ) | |
Capital Contributions from Prior
Custodian, Net (See Note 8) | | | — | | | | — | | | | — | (b) | | | — | | | | — | | | | — | | |
Net Asset Value, End of Period | | $ | 9.92 | | | $ | 10.00 | | | $ | 10.03 | | | $ | 9.95 | | | $ | 10.03 | | | $ | 10.13 | | |
Total Return (c) | | | 0.30 | % | | | 1.71 | % | | | 2.04 | %(d) | | | 0.74 | % | | | 1.04 | % | | | 0.15 | % | |
Ratios/Supplemental Data: | |
Net Assets at end of period (000) | | $ | 202,504 | | | $ | 271,294 | | | $ | 334,841 | | | $ | 367,112 | | | $ | 407,382 | | | $ | 471,093 | | |
Ratio of net expenses to average
net assets (e) | | | 0.62 | % | | | 0.62 | % | | | 0.60 | % | | | 0.61 | % | | | 0.61 | % | | | 0.61 | % | |
Ratio of net investment income (loss)
to average net assets (e) | | | 1.83 | % | | | 1.44 | % | | | 1.42 | % | | | 1.60 | % | | | 2.02 | % | | | 1.98 | % | |
Ratio of gross expenses to average
net assets (e) (f) | | | 0.68 | % | | | 0.65 | % | | | 0.63 | % | | | 0.62 | % | | | 0.61 | % | | | 0.61 | % | |
Portfolio turnover (c) (g) | | | 17 | % | | | 62 | % | | | 49 | % | | | 36 | % | | | 38 | % | | | 74 | % | |
(a) Per share net investment income (loss) has been calculated using the average daily shares method.
(b) Amount is less than $0.005 per share.
(c) Not annualized for periods less than one year.
(d) The Fund received monies related to a nonrecurring refund from the prior Custodian. The corresponding impact to the total return was less than 0.005% for the period shown. (See Note 8)
(e) Annualized for periods less than one year.
(f) During the period, certain fees were reduced and/or reimbursed. If such fee reductions and/or reimbursements had not occurred, the ratios would have been as indicated.
(g) Portfolio turnover is calculated on the basis of the Fund as a whole without distinguishing between the classes of shares issued.
See notes to financial statements.
63
Victory Portfolios | | Financial Highlights | |
For a Share Outstanding Throughout Each Period
| | | Victory High Yield Fund | |
| | | Class A Shares | |
| | | Six
Months
Ended
June 30,
2018 | | Year
Ended
December 31,
2017 | | Year
Ended
December 31,
2016 | | Year
Ended
December 31,
2015 | | Year
Ended
December 31,
2014 | | Year
Ended
December 31,
2013 | |
| | | (Unaudited) | | | | | | | | | | | |
Net Asset Value, Beginning of Period | | $ | 6.57 | | | $ | 6.34 | | | $ | 5.85 | | | $ | 6.52 | | | $ | 7.31 | | | $ | 7.25 | | |
Investment Activities: | |
Net investment income (loss) (a) | | | 0.19 | | | | 0.39 | | | | 0.38 | | | | 0.40 | | | | 0.41 | | | | 0.43 | | |
Net realized and unrealized
gains (losses) on investments | | | (0.08 | ) | | | 0.22 | | | | 0.49 | | | | (0.67 | ) | | | (0.47 | ) | | | 0.07 | | |
Total from Investment
Activities | | | 0.11 | | | | 0.61 | | | | 0.87 | | | | (0.27 | ) | | | (0.06 | ) | | | 0.50 | | |
Distributions to Shareholders: | |
Net investment income | | | (0.20 | ) | | | (0.38 | ) | | | (0.38 | ) | | | (0.40 | ) | | | (0.41 | ) | | | (0.44 | ) | |
Net realized gains
from investments | | | — | | | | — | | | | — | | | | — | | | | (0.32 | ) | | | — | | |
Total Distributions
to Shareholders | | | (0.20 | ) | | | (0.38 | ) | | | (0.38 | ) | | | (0.40 | ) | | | (0.73 | ) | | | (0.44 | ) | |
Net Asset Value, End of Period | | $ | 6.48 | | | $ | 6.57 | | | $ | 6.34 | | | $ | 5.85 | | | $ | 6.52 | | | $ | 7.31 | | |
Total Return (excludes sales
charge) (b) | | | 1.62 | % | | | 9.93 | % | | | 15.40 | % | | | (4.51 | )% | | | (1.01 | )% | | | 7.05 | % | |
Ratios/Supplemental Data: | |
Net Assets at end of period (000) | | $ | 22,756 | | | $ | 21,882 | | | $ | 25,530 | | | $ | 26,608 | | | $ | 34,339 | | | $ | 42,329 | | |
Ratio of net expenses to average
net assets (c) | | | 1.00 | % | | | 1.00 | % | | | 1.00 | % | | | 1.00 | % | | | 0.98 | % | | | 0.95 | % | |
Ratio of net investment income (loss)
to average net assets (c) | | | 5.88 | % | | | 5.99 | % | | | 6.32 | % | | | 6.16 | % | | | 5.52 | % | | | 5.72 | % | |
Ratio of gross expenses to average
net assets (c) (d) | | | 1.12 | % | | | 1.13 | % | | | 1.18 | % | | | 1.16 | % | | | 1.16 | % | | | 1.11 | % | |
Portfolio turnover (b) (e) | | | 58 | % | | | 174 | % | | | 165 | % | | | 151 | % | | | 221 | % | | | 96 | % | |
(a) Per share net investment income (loss) has been calculated using the average daily shares method.
(b) Not annualized for periods less than one year.
(c) Annualized for periods less than one year.
(d) During the period, certain fees were reduced and/or reimbursed. If such fee reductions and/or reimbursements had not occurred, the ratios would have been as indicated.
(e) Portfolio turnover is calculated on the basis of the Fund as a whole without distinguishing between the classes of shares issued.
See notes to financial statements.
64
Victory Portfolios | | Financial Highlights — continued | |
For a Share Outstanding Throughout Each Period
| | | Victory High Yield Fund | |
| | | Class C Shares | |
| | | Six
Months
Ended
June 30,
2018 | | Year
Ended
December 31,
2017 | | Year
Ended
December 31,
2016 | | Year
Ended
December 31,
2015 | | Year
Ended
December 31,
2014 | | Year
Ended
December 31,
2013 | |
| | | (Unaudited) | | | | | | | | | | | |
Net Asset Value, Beginning of Period | | $ | 6.58 | | | $ | 6.35 | | | $ | 5.86 | | | $ | 6.53 | | | $ | 7.32 | | | $ | 7.25 | | |
Investment Activities: | |
Net investment income (loss) (a) | | | 0.17 | | | | 0.34 | | | | 0.34 | | | | 0.35 | | | | 0.36 | | | | 0.36 | | |
Net realized and unrealized
gains (losses) on investments | | | (0.08 | ) | | | 0.23 | | | | 0.49 | | | | (0.67 | ) | | | (0.47 | ) | | | 0.07 | | |
Total from Investment
Activities | | | 0.09 | | | | 0.57 | | | | 0.83 | | | | (0.32 | ) | | | (0.11 | ) | | | 0.43 | | |
Distributions to Shareholders: | |
Net investment income | | | (0.17 | ) | | | (0.34 | ) | | | (0.34 | ) | | | (0.35 | ) | | | (0.36 | ) | | | (0.36 | ) | |
Net realized gains
from investments | | | — | | | | — | | | | — | | | | — | | | | (0.32 | ) | | | — | | |
Total Distributions
to Shareholders | | | (0.17 | ) | | | (0.34 | ) | | | (0.34 | ) | | | (0.35 | ) | | | (0.68 | ) | | | (0.36 | ) | |
Net Asset Value, End of Period | | $ | 6.50 | | | $ | 6.58 | | | $ | 6.35 | | | $ | 5.86 | | | $ | 6.53 | | | $ | 7.32 | | |
Total Return (excludes contingent
deferred sales charge) (b) | | | 1.42 | % | | | 9.19 | % | | | 14.58 | % | | | (5.16 | )% | | | (1.70 | )% | | | 6.10 | % | |
Ratios/Supplemental Data: | |
Net Assets at end of period (000) | | $ | 21,101 | | | $ | 22,283 | | | $ | 22,498 | | | $ | 22,138 | | | $ | 27,780 | | | $ | 37,733 | | |
Ratio of net expenses to average
net assets (c) | | | 1.70 | % | | | 1.70 | % | | | 1.70 | % | | | 1.70 | % | | | 1.70 | % | | | 1.70 | % | |
Ratio of net investment income (loss)
to average net assets (c) | | | 5.17 | % | | | 5.27 | % | | | 5.61 | % | | | 5.47 | % | | | 4.85 | % | | | 4.97 | % | |
Ratio of gross expenses to average
net assets (c) (d) | | | 1.84 | % | | | 1.84 | % | | | 1.91 | % | | | 1.90 | % | | | 1.90 | % | | | 1.87 | % | |
Portfolio turnover (b) (e) | | | 58 | % | | | 174 | % | | | 165 | % | | | 151 | % | | | 221 | % | | | 96 | % | |
(a) Per share net investment income (loss) has been calculated using the average daily shares method.
(b) Not annualized for periods less than one year.
(c) Annualized for periods less than one year.
(d) During the period, certain fees were reduced and/or reimbursed. If such fee reductions and/or reimbursements had not occurred, the ratios would have been as indicated.
(e) Portfolio turnover is calculated on the basis of the Fund as a whole without distinguishing between the classes of shares issued.
See notes to financial statements.
65
Victory Portfolios | | Financial Highlights — continued | |
For a Share Outstanding Throughout Each Period
| | | Victory High Yield Fund | |
| | | Class R Shares | |
| | | Six
Months
Ended
June 30,
2018 | | Year
Ended
December 31,
2017 | | Year
Ended
December 31,
2016 | | Year
Ended
December 31,
2015 | | Year
Ended
December 31,
2014 | | Year
Ended
December 31,
2013 | |
| | | (Unaudited) | | | | | | | | | | | |
Net Asset Value, Beginning of Period | | $ | 6.59 | | | $ | 6.35 | | | $ | 5.87 | | | $ | 6.54 | | | $ | 7.33 | | | $ | 7.25 | | |
Investment Activities: | |
Net investment income (loss) (a) | | | 0.18 | | | | 0.37 | | | | 0.36 | | | | 0.37 | | | | 0.38 | | | | 0.39 | | |
Net realized and unrealized
gains (losses) on investments | | | (0.09 | ) | | | 0.23 | | | | 0.48 | | | | (0.66 | ) | | | (0.47 | ) | | | 0.08 | | |
Total from Investment
Activities | | | 0.09 | | | | 0.60 | | | | 0.84 | | | | (0.29 | ) | | | (0.09 | ) | | | 0.47 | | |
Distributions to Shareholders: | |
Net investment income | | | (0.18 | ) | | | (0.36 | ) | | | (0.36 | ) | | | (0.38 | ) | | | (0.38 | ) | | | (0.39 | ) | |
Net realized gains
from investments | | | — | | | | — | | | | — | | | | — | | | | (0.32 | ) | | | — | | |
Total Distributions
to Shareholders | | | (0.18 | ) | | | (0.36 | ) | | | (0.36 | ) | | | (0.38 | ) | | | (0.70 | ) | | | (0.39 | ) | |
Net Asset Value, End of Period | | $ | 6.50 | | | $ | 6.59 | | | $ | 6.35 | | | $ | 5.87 | | | $ | 6.54 | | | $ | 7.33 | | |
Total Return (b) | | | 1.45 | % | | | 9.64 | % | | | 14.78 | % | | | (4.82 | )% | | | (1.35 | )% | | | 6.62 | % | |
Ratios/Supplemental Data: | |
Net Assets at end of period (000) | | $ | 18,863 | | | $ | 19,217 | | | $ | 18,742 | | | $ | 18,042 | | | $ | 21,109 | | | $ | 23,036 | | |
Ratio of net expenses to average
net assets (c) | | | 1.34 | % | | | 1.35 | % | | | 1.35 | % | | | 1.35 | % | | | 1.35 | % | | | 1.35 | % | |
Ratio of net investment income (loss)
to average net assets (c) | | | 5.53 | % | | | 5.61 | % | | | 5.96 | % | | | 5.82 | % | | | 5.20 | % | | | 5.32 | % | |
Ratio of gross expenses to average
net assets (c) (d) | | | 1.34 | % | | | 1.36 | % | | | 1.45 | % | | | 1.51 | % | | | 1.52 | % | | | 1.49 | % | |
Portfolio turnover (b) (e) | | | 58 | % | | | 174 | % | | | 165 | % | | | 151 | % | | | 221 | % | | | 96 | % | |
(a) Per share net investment income (loss) has been calculated using the average daily shares method.
(b) Not annualized for periods less than one year.
(c) Annualized for periods less than one year.
(d) During the period, certain fees were reduced and/or reimbursed. If such fee reductions and/or reimbursements had not occurred, the ratios would have been as indicated.
(e) Portfolio turnover is calculated on the basis of the Fund as a whole without distinguishing between the classes of shares issued.
See notes to financial statements.
66
Victory Portfolios | | Financial Highlights — continued | |
For a Share Outstanding Throughout Each Period
| | | Victory High Yield Fund | |
| | | Class Y Shares | |
| | | Six
Months
Ended
June 30,
2018 | | Year
Ended
December 31,
2017 | | Year
Ended
December 31,
2016 | | Year
Ended
December 31,
2015 | | Year
Ended
December 31,
2014 | | Year
Ended
December 31,
2013 | |
| | | (Unaudited) | | | | | | | | | | | |
Net Asset Value, Beginning of Period | | $ | 6.54 | | | $ | 6.31 | | | $ | 5.82 | | | $ | 6.49 | | | $ | 7.27 | | | $ | 7.24 | | |
Investment Activities: | |
Net investment income (loss) (a) | | | 0.20 | | | | 0.40 | | | | 0.39 | | | | 0.41 | | | | 0.44 | | | | 0.43 | | |
Net realized and unrealized
gains (losses) on investments | | | (0.09 | ) | | | 0.23 | | | | 0.49 | | | | (0.67 | ) | | | (0.48 | ) | | | 0.07 | | |
Total from Investment
Activities | | | 0.11 | | | | 0.63 | | | | 0.88 | | | | (0.26 | ) | | | (0.04 | ) | | | 0.50 | | |
Distributions to Shareholders: | |
Net investment income | | | (0.20 | ) | | | (0.40 | ) | | | (0.39 | ) | | | (0.41 | ) | | | (0.42 | ) | | | (0.47 | ) | |
Net realized gains
from investments | | | — | | | | — | | | | — | | | | — | | | | (0.32 | ) | | | — | | |
Total Distributions
to Shareholders | | | (0.20 | ) | | | (0.40 | ) | | | (0.39 | ) | | | (0.41 | ) | | | (0.74 | ) | | | (0.47 | ) | |
Net Asset Value, End of Period | | $ | 6.45 | | | $ | 6.54 | | | $ | 6.31 | | | $ | 5.82 | | | $ | 6.49 | | | $ | 7.27 | | |
Total Return (b) | | | 1.75 | % | | | 10.24 | % | | | 15.72 | % | | | (4.34 | )% | | | (0.63 | )% | | | 7.14 | % | |
Ratios/Supplemental Data: | |
Net Assets at end of period (000) | | $ | 7,721 | | | $ | 5,213 | | | $ | 6,938 | | | $ | 6,047 | | | $ | 13,830 | | | $ | 9,464 | | |
Ratio of net expenses to average
net assets (c) | | | 0.76 | % | | | 0.76 | % | | | 0.76 | % | | | 0.76 | % | | | 0.76 | % | | | 0.76 | % | |
Ratio of net investment income (loss)
to average net assets (c) | | | 6.16 | % | | | 6.27 | % | | | 6.54 | % | | | 6.36 | % | | | 5.90 | % | | | 5.88 | % | |
Ratio of gross expenses to average
net assets (c) (d) | | | 0.99 | % | | | 1.04 | % | | | 1.00 | % | | | 0.95 | % | | | 0.90 | % | | | 0.85 | % | |
Portfolio turnover (b) (e) | | | 58 | % | | | 174 | % | | | 165 | % | | | 151 | % | | | 221 | % | | | 96 | % | |
(a) Per share net investment income (loss) has been calculated using the average daily shares method.
(b) Not annualized for periods less than one year.
(c) Annualized for periods less than one year.
(d) During the period, certain fees were reduced and/or reimbursed. If such fee reductions and/or reimbursements had not occurred, the ratios would have been as indicated.
(e) Portfolio turnover is calculated on the basis of the Fund as a whole without distinguishing between the classes of shares issued.
See notes to financial statements.
67
Victory Portfolios | | Financial Highlights | |
For a Share Outstanding Throughout Each Period
| | | Victory Tax-Exempt Fund | |
| | | Class A Shares | |
| | | Six
Months
Ended
June 30,
2018 | | Year
Ended
December 31,
2017 | | Year
Ended
December 31,
2016 | | Year
Ended
December 31,
2015 | | Year
Ended
December 31,
2014 | | Year
Ended
December 31,
2013 | |
| | | (Unaudited) | | | | | | | | | | | |
Net Asset Value, Beginning of Period | | $ | 9.91 | | | $ | 9.65 | | | $ | 10.53 | | | $ | 10.83 | | | $ | 10.30 | | | $ | 11.13 | | |
Investment Activities: | |
Net investment income (loss) (a) | | | 0.18 | | | | 0.36 | | | | 0.35 | | | | 0.35 | | | | 0.33 | | | | 0.31 | | |
Net realized and unrealized
gains (losses) on investments | | | (0.18 | ) | | | 0.39 | | | | (0.49 | ) | | | (0.05 | ) | | | 0.53 | | | | (0.83 | ) | |
Total from Investment
Activities | | | — | | | | 0.75 | | | | (0.14 | ) | | | 0.30 | | | | 0.86 | | | | (0.52 | ) | |
Distributions to Shareholders: | |
Net investment income | | | (0.18 | ) | | | (0.37 | ) | | | (0.35 | ) | | | (0.35 | ) | | | (0.33 | ) | | | (0.31 | ) | |
Net realized gains
from investments | | | — | | | | (0.12 | ) | | | (0.39 | ) | | | (0.25 | ) | | | — | | | | — | | |
Total Distributions
to Shareholders | | | (0.18 | ) | | | (0.49 | ) | | | (0.74 | ) | | | (0.60 | ) | | | (0.33 | ) | | | (0.31 | ) | |
Net Asset Value, End of Period | | $ | 9.73 | | | $ | 9.91 | | | $ | 9.65 | | | $ | 10.53 | | | $ | 10.83 | | | $ | 10.30 | | |
Total Return (excludes sales
charge) (b) | | | — | %(c) | | | 7.89 | % | | | (1.40 | )% | | | 2.76 | % | | | 8.39 | % | | | (4.67 | )% | |
Ratios/Supplemental Data: | |
Net Assets at end of period (000) | | $ | 33,210 | | | $ | 37,570 | | | $ | 54,658 | | | $ | 90,301 | | | $ | 102,716 | | | $ | 152,992 | | |
Ratio of net expenses to average
net assets (d) | | | 0.80 | % | | | 0.80 | % | | | 0.80 | % | | | 0.80 | % | | | 0.80 | % | | | 0.80 | % | |
Ratio of net investment income (loss)
to average net assets (d) | | | 3.70 | % | | | 3.70 | % | | | 3.30 | % | | | 3.22 | % | | | 3.05 | % | | | 2.92 | % | |
Ratio of gross expenses to average
net assets (d) (e) | | | 0.97 | % | | | 0.96 | % | | | 0.95 | % | | | 0.93 | % | | | 0.96 | % | | | 0.93 | % | |
Portfolio turnover (b) (f) | | | 21 | % | | | 84 | % | | | 39 | % | | | 39 | % | | | 14 | % | | | 26 | % | |
(a) Per share net investment income (loss) has been calculated using the average daily shares method.
(b) Not annualized for periods less than one year.
(c) Amount is less than 0.005%.
(d) Annualized for periods less than one year.
(e) During the period, certain fees were reduced and/or reimbursed. If such fee reductions and/or reimbursements had not occurred, the ratios would have been as indicated.
(f) Portfolio turnover is calculated on the basis of the Fund as a whole without distinguishing between the classes of shares issued.
See notes to financial statements.
68
Victory Portfolios | | Financial Highlights — continued | |
For a Share Outstanding Throughout Each Period
| | | Victory Tax-Exempt Fund | |
| | | Class C Shares | |
| | | Six
Months
Ended
June 30,
2018 | | Year
Ended
December 31,
2017 | | Year
Ended
December 31,
2016 | | Year
Ended
December 31,
2015 | | Year
Ended
December 31,
2014 | | Year
Ended
December 31,
2013 | |
| | | (Unaudited) | | | | | | | | | | | |
Net Asset Value, Beginning of Period | | $ | 9.90 | | | $ | 9.65 | | | $ | 10.53 | | | $ | 10.82 | | | $ | 10.30 | | | $ | 11.12 | | |
Investment Activities: | |
Net investment income (loss) (a) | | | 0.14 | | | | 0.29 | | | | 0.26 | | | | 0.26 | | | | 0.24 | | | | 0.23 | | |
Net realized and unrealized
gains (losses) on investments | | | (0.17 | ) | | | 0.37 | | | | (0.48 | ) | | | (0.04 | ) | | | 0.52 | | | | (0.82 | ) | |
Total from Investment
Activities | | | (0.03 | ) | | | 0.66 | | | | (0.22 | ) | | | 0.22 | | | | 0.76 | | | | (0.59 | ) | |
Distributions to Shareholders: | |
Net investment income | | | (0.14 | ) | | | (0.29 | ) | | | (0.27 | ) | | | (0.26 | ) | | | (0.24 | ) | | | (0.23 | ) | |
Net realized gains
from investments | | | — | | | | (0.12 | ) | | | (0.39 | ) | | | (0.25 | ) | | | — | | | | — | | |
Total Distributions
to Shareholders | | | (0.14 | ) | | | (0.41 | ) | | | (0.66 | ) | | | (0.51 | ) | | | (0.24 | ) | | | (0.23 | ) | |
Net Asset Value, End of Period | | $ | 9.73 | | | $ | 9.90 | | | $ | 9.65 | | | $ | 10.53 | | | $ | 10.82 | | | $ | 10.30 | | |
Total Return (excludes contingent
deferred sales charge) (b) | | | (0.29 | )% | | | 6.92 | % | | | (2.19 | )% | | | 2.04 | % | | | 7.44 | % | | | (5.35 | )% | |
Ratios/Supplemental Data: | |
Net Assets at end of period (000) | | $ | 22,635 | | | $ | 26,520 | | | $ | 33,369 | | | $ | 43,404 | | | $ | 53,042 | | | $ | 64,061 | | |
Ratio of net expenses to average
net assets (c) | | | 1.60 | % | | | 1.60 | % | | | 1.60 | % | | | 1.60 | % | | | 1.60 | % | | | 1.60 | % | |
Ratio of net investment income (loss)
to average net assets (c) | | | 2.90 | % | | | 2.89 | % | | | 2.51 | % | | | 2.43 | % | | | 2.26 | % | | | 2.12 | % | |
Ratio of gross expenses to average
net assets (c) (d) | | | 1.77 | % | | | 1.74 | % | | | 1.71 | % | | | 1.70 | % | | | 1.72 | % | | | 1.69 | % | |
Portfolio turnover (b) (e) | | | 21 | % | | | 84 | % | | | 39 | % | | | 39 | % | | | 14 | % | | | 26 | % | |
(a) Per share net investment income (loss) has been calculated using the average daily shares method.
(b) Not annualized for periods less than one year.
(c) Annualized for periods less than one year.
(d) During the period, certain fees were reduced and/or reimbursed. If such fee reductions and/or reimbursements had not occurred, the ratios would have been as indicated.
(e) Portfolio turnover is calculated on the basis of the Fund as a whole without distinguishing between the classes of shares issued.
See notes to financial statements.
69
Victory Portfolios | | Financial Highlights — continued | |
For a Share Outstanding Throughout Each Period
| | | Victory Tax-Exempt Fund | |
| | | Class Y Shares | |
| | | Six
Months
Ended
June 30,
2018 | | Year
Ended
December 31,
2017 | | Year
Ended
December 31,
2016 | | Year
Ended
December 31,
2015 | | Year
Ended
December 31,
2014 | | Year
Ended
December 31,
2013 | |
| | | (Unaudited) | | | | | | | | | | | |
Net Asset Value, Beginning of Period | | $ | 9.90 | | | $ | 9.65 | | | $ | 10.52 | | | $ | 10.82 | | | $ | 10.29 | | | $ | 11.12 | | |
Investment Activities: | |
Net investment income (loss) (a) | | | 0.18 | | | | 0.37 | | | | 0.36 | | | | 0.36 | | | | 0.34 | | | | 0.33 | | |
Net realized and unrealized
gains (losses) on investments | | | (0.17 | ) | | | 0.38 | | | | (0.48 | ) | | | (0.05 | ) | | | 0.53 | | | | (0.83 | ) | |
Total from Investment
Activities | | | 0.01 | | | | 0.75 | | | | (0.12 | ) | | | 0.31 | | | | 0.87 | | | | (0.50 | ) | |
Distributions to Shareholders: | |
Net investment income | | | (0.18 | ) | | | (0.38 | ) | | | (0.36 | ) | | | (0.36 | ) | | | (0.34 | ) | | | (0.33 | ) | |
Net realized gains
from investments | | | — | | | | (0.12 | ) | | | (0.39 | ) | | | (0.25 | ) | | | — | | | | — | | |
Total Distributions
to Shareholders | | | (0.18 | ) | | | (0.50 | ) | | | (0.75 | ) | | | (0.61 | ) | | | (0.34 | ) | | | (0.33 | ) | |
Net Asset Value, End of Period | | $ | 9.73 | | | $ | 9.90 | | | $ | 9.65 | | | $ | 10.52 | | | $ | 10.82 | | | $ | 10.29 | | |
Total Return (b) | | | 0.16 | % | | | 7.90 | % | | | (1.20 | )% | | | 2.87 | % | | | 8.53 | % | | | (4.57 | )% | |
Ratios/Supplemental Data: | |
Net Assets at end of period (000) | | $ | 23,641 | | | $ | 27,420 | | | $ | 31,762 | | | $ | 52,012 | | | $ | 75,047 | | | $ | 62,916 | | |
Ratio of net expenses to average
net assets (c) | | | 0.69 | % | | | 0.69 | % | | | 0.69 | % | | | 0.69 | % | | | 0.69 | % | | | 0.69 | % | |
Ratio of net investment income (loss)
to average net assets (c) | | | 3.81 | % | | | 3.80 | % | | | 3.41 | % | | | 3.33 | % | | | 3.18 | % | | | 3.03 | % | |
Ratio of gross expenses to average
net assets (c) (d) | | | 0.75 | % | | | 0.73 | % | | | 0.71 | % | | | 0.71 | % | | | 0.69 | % | | | 0.69 | % | |
Portfolio turnover (b) (e) | | | 21 | % | | | 84 | % | | | 39 | % | | | 39 | % | | | 14 | % | | | 26 | % | |
(a) Per share net investment income (loss) has been calculated using the average daily shares method.
(b) Not annualized for periods less than one year.
(c) Annualized for periods less than one year.
(d) During the period, certain fees were reduced and/or reimbursed. If such fee reductions and/or reimbursements had not occurred, the ratios would have been as indicated.
(e) Portfolio turnover is calculated on the basis of the Fund as a whole without distinguishing between the classes of shares issued.
See notes to financial statements.
70
Victory Portfolios | | Financial Highlights | |
For a Share Outstanding Throughout Each Period
| | | Victory High Income Municipal Bond Fund | |
| | | Class A Shares | |
| | | Six
Months
Ended
June 30,
2018 | | Year
Ended
December 31,
2017 | | Year
Ended
December 31,
2016 | | Year
Ended
December 31,
2015 | | Year
Ended
December 31,
2014 | | Year
Ended
December 31,
2013 | |
| | | (Unaudited) | | | | | | | | | | | |
Net Asset Value, Beginning of Period | | $ | 10.79 | | | $ | 10.35 | | | $ | 10.89 | | | $ | 10.84 | | | $ | 10.00 | | | $ | 11.19 | | |
Investment Activities: | |
Net investment income (loss) (a) | | | 0.22 | | | | 0.46 | | | | 0.44 | | | | 0.43 | | | | 0.45 | | | | 0.45 | | |
Net realized and unrealized
gains (losses) on investments | | | (0.20 | ) | | | 0.44 | | | | (0.54 | ) | | | 0.05 | | | | 0.84 | | | | (1.19 | ) | |
Total from Investment
Activities | | | 0.02 | | | | 0.90 | | | | (0.10 | ) | | | 0.48 | | | | 1.29 | | | | (0.74 | ) | |
Distributions to Shareholders: | |
Net investment income | | | (0.22 | ) | | | (0.46 | ) | | | (0.44 | ) | | | (0.43 | ) | | | (0.45 | ) | | | (0.45 | ) | |
Total Distributions
to Shareholders | | | (0.22 | ) | | | (0.46 | ) | | | (0.44 | ) | | | (0.43 | ) | | | (0.45 | ) | | | (0.45 | ) | |
Net Asset Value, End of Period | | $ | 10.59 | | | $ | 10.79 | | | $ | 10.35 | | | $ | 10.89 | | | $ | 10.84 | | | $ | 10.00 | | |
Total Return (excludes sales
charge) (b) | | | 0.24 | % | | | 8.85 | % | | | (1.04 | )% | | | 4.51 | % | | | 13.09 | % | | | (6.74 | )% | |
Ratios/Supplemental Data: | |
Net Assets at end of period (000) | | $ | 20,911 | | | $ | 25,831 | | | $ | 32,943 | | | $ | 48,485 | | | $ | 50,341 | | | $ | 54,603 | | |
Ratio of net expenses to average
net assets (c) | | | 0.80 | % | | | 0.80 | % | | | 0.80 | % | | | 0.80 | % | | | 0.78 | % | | | 0.73 | % | |
Ratio of net investment income (loss)
to average net assets (c) | | | 4.25 | % | | | 4.31 | % | | | 4.02 | % | | | 3.96 | % | | | 4.26 | % | | | 4.17 | % | |
Ratio of gross expenses to average
net assets (c) (d) | | | 1.01 | % | | | 0.96 | % | | | 0.96 | % | | | 0.95 | % | | | 1.02 | % | | | 0.95 | % | |
Portfolio turnover (b) (e) | | | 26 | % | | | 66 | % | | | 49 | % | | | 53 | % | | | 25 | % | | | 19 | % | |
(a) Per share net investment income (loss) has been calculated using the average daily shares method.
(b) Not annualized for periods less than one year.
(c) Annualized for periods less than one year.
(d) During the period, certain fees were reduced and/or reimbursed. If such fee reductions and/or reimbursements had not occurred, the ratios would have been as indicated.
(e) Portfolio turnover is calculated on the basis of the Fund as a whole without distinguishing between the classes of shares issued.
See notes to financial statements.
71
Victory Portfolios | | Financial Highlights — continued | |
For a Share Outstanding Throughout Each Period
| | | Victory High Income Municipal Bond Fund | |
| | | Class C Shares | |
| | | Six
Months
Ended
June 30,
2018 | | Year
Ended
December 31,
2017 | | Year
Ended
December 31,
2016 | | Year
Ended
December 31,
2015 | | Year
Ended
December 31,
2014 | | Year
Ended
December 31,
2013 | |
| | | (Unaudited) | | | | | | | | | | | |
Net Asset Value, Beginning of Period | | $ | 10.79 | | | $ | 10.35 | | | $ | 10.89 | | | $ | 10.84 | | | $ | 10.00 | | | $ | 11.19 | | |
Investment Activities: | |
Net investment income (loss) (a) | | | 0.18 | | | | 0.38 | | | | 0.36 | | | | 0.35 | | | | 0.37 | | | | 0.37 | | |
Net realized and unrealized
gains (losses) on investments | | | (0.20 | ) | | | 0.44 | | | | (0.54 | ) | | | 0.05 | | | | 0.84 | | | | (1.19 | ) | |
Total from Investment
Activities | | | (0.02 | ) | | | 0.82 | | | | (0.18 | ) | | | 0.40 | | | | 1.21 | | | | (0.82 | ) | |
Distributions to Shareholders: | |
Net investment income | | | (0.18 | ) | | | (0.38 | ) | | | (0.36 | ) | | | (0.35 | ) | | | (0.37 | ) | | | (0.37 | ) | |
Total Distributions
to Shareholders | | | (0.18 | ) | | | (0.38 | ) | | | (0.36 | ) | | | (0.35 | ) | | | (0.37 | ) | | | (0.37 | ) | |
Net Asset Value, End of Period | | $ | 10.59 | | | $ | 10.79 | | | $ | 10.35 | | | $ | 10.89 | | | $ | 10.84 | | | $ | 10.00 | | |
Total Return (excludes contingent
deferred sales charge) (b) | | | (0.14 | )% | | | 8.01 | % | | | (1.79 | )% | | | 3.71 | % | | | 12.22 | % | | | (7.47 | )% | |
Ratios/Supplemental Data: | |
Net Assets at end of period (000) | | $ | 21,943 | | | $ | 25,175 | | | $ | 29,563 | | | $ | 36,190 | | | $ | 35,996 | | | $ | 36,049 | | |
Ratio of net expenses to average
net assets (c) | | | 1.57 | % | | | 1.57 | % | | | 1.57 | % | | | 1.57 | % | | | 1.55 | % | | | 1.52 | % | |
Ratio of net investment income (loss)
to average net assets (c) | | | 3.48 | % | | | 3.54 | % | | | 3.26 | % | | | 3.19 | % | | | 3.50 | % | | | 3.40 | % | |
Ratio of gross expenses to average
net assets (c) (d) | | | 1.78 | % | | | 1.73 | % | | | 1.73 | % | | | 1.73 | % | | | 1.77 | % | | | 1.73 | % | |
Portfolio turnover (b) (e) | | | 26 | % | | | 66 | % | | | 49 | % | | | 53 | % | | | 25 | % | | | 19 | % | |
(a) Per share net investment income (loss) has been calculated using the average daily shares method.
(b) Not annualized for periods less than one year.
(c) Annualized for periods less than one year.
(d) During the period, certain fees were reduced and/or reimbursed. If such fee reductions and/or reimbursements had not occurred, the ratios would have been as indicated.
(e) Portfolio turnover is calculated on the basis of the Fund as a whole without distinguishing between the classes of shares issued.
See notes to financial statements.
72
Victory Portfolios | | Financial Highlights — continued | |
For a Share Outstanding Throughout Each Period
| | | Victory High Income Municipal Bond Fund | |
| | | Class Y Shares | |
| | | Six
Months
Ended
June 30,
2018 | | Year
Ended
December 31,
2017 | | Year
Ended
December 31,
2016 | | Year
Ended
December 31,
2015 | | Year
Ended
December 31,
2014 | | Year
Ended
December 31,
2013 | |
| | | (Unaudited) | | | | | | | | | | | |
Net Asset Value, Beginning of Period | | $ | 10.79 | | | $ | 10.35 | | | $ | 10.89 | | | $ | 10.84 | | | $ | 10.00 | | | $ | 11.19 | | |
Investment Activities: | |
Net investment income (loss) (a) | | | 0.23 | | | | 0.48 | | | | 0.47 | | | | 0.45 | | | | 0.47 | | | | 0.47 | | |
Net realized and unrealized
gains (losses) on investments | | | (0.19 | ) | | | 0.44 | | | | (0.54 | ) | | | 0.05 | | | | 0.84 | | | | (1.19 | ) | |
Total from Investment
Activities | | | 0.04 | | | | 0.92 | | | | (0.07 | ) | | | 0.50 | | | | 1.31 | | | | (0.72 | ) | |
Distributions to Shareholders: | |
Net investment income | | | (0.24 | ) | | | (0.48 | ) | | | (0.47 | ) | | | (0.45 | ) | | | (0.47 | ) | | | (0.47 | ) | |
Total Distributions
to Shareholders | | | (0.24 | ) | | | (0.48 | ) | | | (0.47 | ) | | | (0.45 | ) | | | (0.47 | ) | | | (0.47 | ) | |
Net Asset Value, End of Period | | $ | 10.59 | | | $ | 10.79 | | | $ | 10.35 | | | $ | 10.89 | | | $ | 10.84 | | | $ | 10.00 | | |
Total Return (b) | | | 0.36 | % | | | 9.10 | % | | | (0.81 | )% | | | 4.75 | % | | | 13.37 | % | | | (6.54 | )% | |
Ratios/Supplemental Data: | |
Net Assets at end of period (000) | | $ | 14,619 | | | $ | 26,864 | | | $ | 36,603 | | | $ | 43,024 | | | $ | 34,630 | | | $ | 27,286 | | |
Ratio of net expenses to average
net assets (c) | | | 0.57 | % | | | 0.57 | % | | | 0.57 | % | | | 0.57 | % | | | 0.54 | % | | | 0.50 | % | |
Ratio of net investment income (loss)
to average net assets (c) | | | 4.47 | % | | | 4.55 | % | | | 4.26 | % | | | 4.18 | % | | | 4.49 | % | | | 4.39 | % | |
Ratio of gross expenses to average
net assets (c) (d) | | | 0.79 | % | | | 0.73 | % | | | 0.72 | % | | | 0.73 | % | | | 0.73 | % | | | 0.71 | % | |
Portfolio turnover (b) (e) | | | 26 | % | | | 66 | % | | | 49 | % | | | 53 | % | | | 25 | % | | | 19 | % | |
(a) Per share net investment income (loss) has been calculated using the average daily shares method.
(b) Not annualized for periods less than one year.
(c) Annualized for periods less than one year.
(d) During the period, certain fees were reduced and/or reimbursed. If such fee reductions and/or reimbursements had not occurred, the ratios would have been as indicated.
(e) Portfolio turnover is calculated on the basis of the Fund as a whole without distinguishing between the classes of shares issued.
See notes to financial statements.
73
Victory Portfolios | | Financial Highlights | |
For a Share Outstanding Throughout Each Period
| | | Victory Floating Rate Fund | |
| | | Class A Shares | |
| | | Six
Months
Ended
June 30,
2018 | | Year
Ended
December 31,
2017 | | Year
Ended
December 31,
2016 | | Year
Ended
December 31,
2015 | | Year
Ended
December 31,
2014 | | Year
Ended
December 31,
2013 | |
| | | (Unaudited) | | | | | | | | | | | |
Net Asset Value, Beginning of Period | | $ | 9.60 | | | $ | 9.71 | | | $ | 9.08 | | | $ | 9.82 | | | $ | 10.34 | | | $ | 10.27 | | |
Investment Activities: | |
Net investment income (loss) (a) | | | 0.25 | | | | 0.46 | | | | 0.46 | | | | 0.46 | | | | 0.42 | | | | 0.44 | | |
Net realized and unrealized
gains (losses) on investments | | | (0.07 | ) | | | (0.10 | ) | | | 0.63 | | | | (0.74 | ) | | | (0.52 | ) | | | 0.07 | | |
Total from Investment
Activities | | | 0.18 | | | | 0.36 | | | | 1.09 | | | | (0.28 | ) | | | (0.10 | ) | | | 0.51 | | |
Distributions to Shareholders: | |
Net investment income | | | (0.25 | ) | | | (0.47 | ) | | | (0.46 | ) | | | (0.46 | ) | | | (0.42 | ) | | | (0.44 | ) | |
Total Distributions
to Shareholders | | | (0.25 | ) | | | (0.47 | ) | | | (0.46 | ) | | | (0.46 | ) | | | (0.42 | ) | | | (0.44 | ) | |
Net Asset Value, End of Period | | $ | 9.53 | | | $ | 9.60 | | | $ | 9.71 | | | $ | 9.08 | | | $ | 9.82 | | | $ | 10.34 | | |
Total Return (excludes sales
charge) (b) | | | 1.91 | % | | | 3.76 | % | | | 12.35 | % | | | (3.03 | )% | | | (1.09 | )% | | | 5.10 | % | |
Ratios/Supplemental Data: | |
Net Assets at end of period (000) | | $ | 139,806 | | | $ | 148,060 | | | $ | 221,022 | | | $ | 227,240 | | | $ | 335,081 | | | $ | 854,291 | | |
Ratio of net expenses to average
net assets (c) | | | 1.00 | % | | | 1.00 | % | | | 1.00 | % | | | 1.00 | % | | | 0.99 | % | | | 0.94 | % | |
Ratio of net investment income (loss)
to average net assets (c) | | | 5.26 | % | | | 4.76 | % | | | 4.95 | % | | | 4.71 | % | | | 4.02 | % | | | 4.29 | % | |
Ratio of gross expenses to average
net assets (c) (d) | | | 1.14 | % | | | 1.10 | % | | | 1.11 | % | | | 1.06 | % | | | 1.08 | % | | | 1.06 | % | |
Portfolio turnover (b) (e) | | | 31 | % | | | 57 | % | | | 56 | % | | | 29 | % | | | 39 | % | | | 30 | % | |
(a) Per share net investment income (loss) has been calculated using the average daily shares method.
(b) Not annualized for periods less than one year.
(c) Annualized for periods less than one year.
(d) During the period, certain fees were reduced and/or reimbursed. If such fee reductions and/or reimbursements had not occurred, the ratios would have been as indicated.
(e) Portfolio turnover is calculated on the basis of the Fund as a whole without distinguishing between the classes of shares issued.
See notes to financial statements.
74
Victory Portfolios | | Financial Highlights — continued | |
For a Share Outstanding Throughout Each Period
| | | Victory Floating Rate Fund | |
| | | Class C Shares | |
| | | Six
Months
Ended
June 30,
2018 | | Year
Ended
December 31,
2017 | | Year
Ended
December 31,
2016 | | Year
Ended
December 31,
2015 | | Year
Ended
December 31,
2014 | | Year
Ended
December 31,
2013 | |
| | | (Unaudited) | | | | | | | | | | | |
Net Asset Value, Beginning of Period | | $ | 9.61 | | | $ | 9.72 | | | $ | 9.08 | | | $ | 9.83 | | | $ | 10.34 | | | $ | 10.27 | | |
Investment Activities: | |
Net investment income (loss) (a) | | | 0.21 | | | | 0.38 | | | | 0.39 | | | | 0.38 | | | | 0.34 | | | | 0.36 | | |
Net realized and unrealized
gains (losses) on investments | | | (0.07 | ) | | | (0.10 | ) | | | 0.64 | | | | (0.75 | ) | | | (0.51 | ) | | | 0.07 | | |
Total from Investment
Activities | | | 0.14 | | | | 0.28 | | | | 1.03 | | | | (0.37 | ) | | | (0.17 | ) | | | 0.43 | | |
Distributions to Shareholders: | |
Net investment income | | | (0.21 | ) | | | (0.39 | ) | | | (0.39 | ) | | | (0.38 | ) | | | (0.34 | ) | | | (0.36 | ) | |
Total Distributions
to Shareholders | | | (0.21 | ) | | | (0.39 | ) | | | (0.39 | ) | | | (0.38 | ) | | | (0.34 | ) | | | (0.36 | ) | |
Net Asset Value, End of Period | | $ | 9.54 | | | $ | 9.61 | | | $ | 9.72 | | | $ | 9.08 | | | $ | 9.83 | | | $ | 10.34 | | |
Total Return (excludes contingent
deferred sales charge) (b) | | | 1.50 | % | | | 2.93 | % | | | 11.57 | % | | | (3.91 | )% | | | (1.76 | )% | | | 4.27 | % | |
Ratios/Supplemental Data: | |
Net Assets at end of period (000) | | $ | 239,636 | | | $ | 265,486 | | | $ | 341,169 | | | $ | 399,361 | | | $ | 585,818 | | | $ | 800,072 | | |
Ratio of net expenses to average
net assets (c) | | | 1.80 | % | | | 1.80 | % | | | 1.80 | % | | | 1.80 | % | | | 1.79 | % | | | 1.73 | % | |
Ratio of net investment income (loss)
to average net assets (c) | | | 4.45 | % | | | 3.97 | % | | | 4.18 | % | | | 3.92 | % | | | 3.28 | % | | | 3.48 | % | |
Ratio of gross expenses to average
net assets (c) (d) | | | 1.91 | % | | | 1.87 | % | | | 1.89 | % | | | 1.85 | % | | | 1.85 | % | | | 1.85 | % | |
Portfolio turnover (b) (e) | | | 31 | % | | | 57 | % | | | 56 | % | | | 29 | % | | | 39 | % | | | 30 | % | |
(a) Per share net investment income (loss) has been calculated using the average daily shares method.
(b) Not annualized for periods less than one year.
(c) Annualized for periods less than one year.
(d) During the period, certain fees were reduced and/or reimbursed. If such fee reductions and/or reimbursements had not occurred, the ratios would have been as indicated.
(e) Portfolio turnover is calculated on the basis of the Fund as a whole without distinguishing between the classes of shares issued.
See notes to financial statements.
75
Victory Portfolios | | Financial Highlights — continued | |
For a Share Outstanding Throughout Each Period
| | | Victory Floating Rate Fund | |
| | | Class R Shares | |
| | | Six
Months
Ended
June 30,
2018 | | Year
Ended
December 31,
2017 | | Year
Ended
December 31,
2016 | | Year
Ended
December 31,
2015 | | Year
Ended
December 31,
2014 | | Year
Ended
December 31,
2013 | |
| | | (Unaudited) | | | | | | | | | | | |
Net Asset Value, Beginning of Period | | $ | 9.60 | | | $ | 9.72 | | | $ | 9.08 | | | $ | 9.83 | | | $ | 10.34 | | | $ | 10.26 | | |
Investment Activities: | |
Net investment income (loss) (a) | | | 0.22 | | | | 0.41 | | | | 0.42 | | | | 0.41 | | | | 0.36 | | | | 0.40 | | |
Net realized and unrealized
gains (losses) on investments | | | (0.06 | ) | | | (0.12 | ) | | | 0.63 | | | | (0.75 | ) | | | (0.51 | ) | | | 0.08 | | |
Total from Investment
Activities | | | 0.16 | | | | 0.29 | | | | 1.05 | | | | (0.34 | ) | | | (0.15 | ) | | | 0.48 | | |
Distributions to Shareholders: | |
Net investment income | | | (0.23 | ) | | | (0.41 | ) | | | (0.41 | ) | | | (0.41 | ) | | | (0.36 | ) | | | (0.40 | ) | |
Total Distributions
to Shareholders | | | (0.23 | ) | | | (0.41 | ) | | | (0.41 | ) | | | (0.41 | ) | | | (0.36 | ) | | | (0.40 | ) | |
Net Asset Value, End of Period | | $ | 9.53 | | | $ | 9.60 | | | $ | 9.72 | | | $ | 9.08 | | | $ | 9.83 | | | $ | 10.34 | | |
Total Return (b) | | | 1.63 | % | | | 3.07 | % | | | 11.88 | % | | | (3.62 | )% | | | (1.50 | )% | | | 4.72 | % | |
Ratios/Supplemental Data: | |
Net Assets at end of period (000) | | $ | 657 | | | $ | 916 | | | $ | 1,319 | | | $ | 1,920 | | | $ | 2,340 | | | $ | 2,773 | | |
Ratio of net expenses to average
net assets (c) | | | 1.56 | % | | | 1.56 | % | | | 1.53 | % | | | 1.52 | % | | | 1.55 | % | | | 1.38 | % | |
Ratio of net investment income (loss)
to average net assets (c) | | | 4.67 | % | | | 4.20 | % | | | 4.48 | % | | | 4.22 | % | | | 3.52 | % | | | 3.85 | % | |
Ratio of gross expenses to average
net assets (c) (d) | | | 2.99 | % | | | 2.26 | % | | | 1.53 | % | | | 1.52 | % | | | 1.58 | % | | | 1.50 | % | |
Portfolio turnover (b) (e) | | | 31 | % | | | 57 | % | | | 56 | % | | | 29 | % | | | 39 | % | | | 30 | % | |
(a) Per share net investment income (loss) has been calculated using the average daily shares method.
(b) Not annualized for periods less than one year.
(c) Annualized for periods less than one year.
(d) During the period, certain fees were reduced and/or reimbursed. If such fee reductions and/or reimbursements had not occurred, the ratios would have been as indicated.
(e) Portfolio turnover is calculated on the basis of the Fund as a whole without distinguishing between the classes of shares issued.
See notes to financial statements.
76
Victory Portfolios | | Financial Highlights — continued | |
For a Share Outstanding Throughout Each Period
| | | Victory Floating Rate Fund | |
| | | Class Y Shares | |
| | | Six
Months
Ended
June 30,
2018 | | Year
Ended
December 31,
2017 | | Year
Ended
December 31,
2016 | | Year
Ended
December 31,
2015 | | Year
Ended
December 31,
2014 | | Year
Ended
December 31,
2013 | |
| | | (Unaudited) | | | | | | | | | | | |
Net Asset Value, Beginning of Period | | $ | 9.61 | | | $ | 9.72 | | | $ | 9.08 | | | $ | 9.83 | | | $ | 10.34 | | | $ | 10.27 | | |
Investment Activities: | |
Net investment income (loss) (a) | | | 0.26 | | | | 0.48 | | | | 0.49 | | | | 0.48 | | | | 0.44 | | | | 0.47 | | |
Net realized and unrealized
gains (losses) on investments | | | (0.07 | ) | | | (0.10 | ) | | | 0.63 | | | | (0.75 | ) | | | (0.51 | ) | | | 0.07 | | |
Total from Investment
Activities | | | 0.19 | | | | 0.38 | | | | 1.12 | | | | (0.27 | ) | | | (0.07 | ) | | | 0.54 | | |
Distributions to Shareholders: | |
Net investment income | | | (0.26 | ) | | | (0.49 | ) | | | (0.48 | ) | | | (0.48 | ) | | | (0.44 | ) | | | (0.47 | ) | |
Total Distributions
to Shareholders | | | (0.26 | ) | | | (0.49 | ) | | | (0.48 | ) | | | (0.48 | ) | | | (0.44 | ) | | | (0.47 | ) | |
Net Asset Value, End of Period | | $ | 9.54 | | | $ | 9.61 | | | $ | 9.72 | | | $ | 9.08 | | | $ | 9.83 | | | $ | 10.34 | | |
Total Return (b) | | | 2.02 | % | | | 3.98 | % | | | 12.71 | % | | | (2.91 | )% | | | (0.75 | )% | | | 5.34 | % | |
Ratios/Supplemental Data: | |
Net Assets at end of period (000) | | $ | 279,993 | | | $ | 276,195 | | | $ | 370,035 | | | $ | 471,827 | | | $ | 927,644 | | | $ | 1,186,456 | | |
Ratio of net expenses to average
net assets (c) | | | 0.78 | % | | | 0.78 | % | | | 0.78 | % | | | 0.78 | % | | | 0.77 | % | | | 0.72 | % | |
Ratio of net investment income (loss)
to average net assets (c) | | | 5.47 | % | | | 4.99 | % | | | 5.21 | % | | | 4.91 | % | | | 4.31 | % | | | 4.47 | % | |
Ratio of gross expenses to average
net assets (c) (d) | | | 0.90 | % | | | 0.88 | % | | | 0.88 | % | | | 0.84 | % | | | 0.82 | % | | | 0.83 | % | |
Portfolio turnover (b) (e) | | | 31 | % | | | 57 | % | | | 56 | % | | | 29 | % | | | 39 | % | | | 30 | % | |
(a) Per share net investment income (loss) has been calculated using the average daily shares method.
(b) Not annualized for periods less than one year.
(c) Annualized for periods less than one year.
(d) During the period, certain fees were reduced and/or reimbursed. If such fee reductions and/or reimbursements had not occurred, the ratios would have been as indicated.
(e) Portfolio turnover is calculated on the basis of the Fund as a whole without distinguishing between the classes of shares issued.
See notes to financial statements.
77
Victory Portfolios | | Financial Highlights | |
For a Share Outstanding Throughout Each Period
| | | Victory Strategic Income Fund | |
| | | Class A Shares | |
| | | Six
Months
Ended
June 30,
2018 | | Year
Ended
December 31,
2017 | | Year
Ended
December 31,
2016 | | Year
Ended
December 31,
2015 | | Year
Ended
December 31,
2014 | | Year
Ended
December 31,
2013 | |
| | | (Unaudited) | | | | | | | | | | | |
Net Asset Value, Beginning of Period | | $ | 10.14 | | | $ | 9.99 | | | $ | 9.68 | | | $ | 10.10 | | | $ | 10.33 | | | $ | 10.64 | | |
Investment Activities: | |
Net investment income (loss) (a) | | | 0.18 | | | | 0.33 | | | | 0.23 | | | | 0.31 | | | | 0.31 | | | | 0.35 | | |
Net realized and unrealized
gains (losses) on investments | | | (0.31 | ) | | | 0.17 | | | | 0.36 | | | | (0.40 | ) | | | (0.10 | ) | | | (0.28 | ) | |
Total from Investment
Activities | | | (0.13 | ) | | | 0.50 | | | | 0.59 | | | | (0.09 | ) | | | 0.21 | | | | 0.07 | | |
Distributions to Shareholders: | |
Net investment income | | | (0.17 | ) | | | (0.35 | ) | | | (0.27 | ) | | | (0.32 | ) | | | (0.33 | ) | | | (0.38 | ) | |
Net realized gains
from investments | | | — | | | | — | | | | — | | | | (0.01 | ) | | | (0.11 | ) | | | — | | |
Return of capital | | | — | | | | — | | | | (0.01 | ) | | | — | | | | — | | | | — | | |
Total Distributions
to Shareholders | | | (0.17 | ) | | | (0.35 | ) | | | (0.28 | ) | | | (0.33 | ) | | | (0.44 | ) | | | (0.38 | ) | |
Net Asset Value, End of Period | | $ | 9.84 | | | $ | 10.14 | | | $ | 9.99 | | | $ | 9.68 | | | $ | 10.10 | | | $ | 10.33 | | |
Total Return (excludes sales
charge) (b) | | | (1.29 | )% | | | 5.12 | % | | | 6.20 | % | | | (0.93 | )% | | | 2.03 | % | | | 0.71 | % | |
Ratios/Supplemental Data: | |
Net Assets at end of period (000) | | $ | 33,307 | | | $ | 34,957 | | | $ | 37,121 | | | $ | 37,845 | | | $ | 48,790 | | | $ | 53,615 | | |
Ratio of net expenses to average
net assets (c) | | | 0.95 | % | | | 0.95 | % | | | 0.95 | % | | | 0.95 | % | | | 0.92 | % | | | 0.81 | % | |
Ratio of net investment income (loss)
to average net assets (c) | | | 3.72 | % | | | 3.24 | % | | | 2.28 | % | | | 3.05 | % | | | 3.08 | % | | | 3.40 | % | |
Ratio of gross expenses to average
net assets (c) (d) | | | 1.09 | % | | | 1.07 | % | | | 1.17 | % | | | 1.16 | % | | | 1.14 | % | | | 1.18 | % | |
Portfolio turnover (b) (e) | | | 68 | % | | | 138 | % | | | 79 | % | | | 41 | % | | | 87 | % | | | 133 | % | |
(a) Per share net investment income (loss) has been calculated using the average daily shares method.
(b) Not annualized for periods less than one year.
(c) Annualized for periods less than one year.
(d) During the period, certain fees were reduced and/or reimbursed. If such fee reductions and/or reimbursements had not occurred, the ratios would have been as indicated.
(e) Portfolio turnover is calculated on the basis of the Fund as a whole without distinguishing between the classes of shares issued.
See notes to financial statements.
78
Victory Portfolios | | Financial Highlights — continued | |
For a Share Outstanding Throughout Each Period
| | | Victory Strategic Income Fund | |
| | | Class C Shares | |
| | | Six
Months
Ended
June 30,
2018 | | Year
Ended
December 31,
2017 | | Year
Ended
December 31,
2016 | | Year
Ended
December 31,
2015 | | Year
Ended
December 31,
2014 | | Year
Ended
December 31,
2013 | |
| | | (Unaudited) | | | | | | | | | | | |
Net Asset Value, Beginning of Period | | $ | 10.19 | | | $ | 10.04 | | | $ | 9.72 | | | $ | 10.15 | | | $ | 10.38 | | | $ | 10.66 | | |
Investment Activities: | |
Net investment income (loss) (a) | | | 0.14 | | | | 0.25 | | | | 0.15 | | | | 0.23 | | | | 0.24 | | | | 0.27 | | |
Net realized and unrealized
gains (losses) on investments | | | (0.31 | ) | | | 0.17 | | | | 0.38 | | | | (0.40 | ) | | | (0.11 | ) | | | (0.28 | ) | |
Total from Investment
Activities | | | (0.17 | ) | | | 0.42 | | | | 0.53 | | | | (0.17 | ) | | | 0.13 | | | | (0.01 | ) | |
Distributions to Shareholders: | |
Net investment income | | | (0.13 | ) | | | (0.27 | ) | | | (0.20 | ) | | | (0.25 | ) | | | (0.25 | ) | | | (0.27 | ) | |
Net realized gains
from investments | | | — | | | | — | | | | — | | | | (0.01 | ) | | | (0.11 | ) | | | — | | |
Return of capital | | | — | | | | — | | | | (0.01 | ) | | | — | | | | — | | | | — | | |
Total Distributions
to Shareholders | | | (0.13 | ) | | | (0.27 | ) | | | (0.21 | ) | | | (0.26 | ) | | | (0.36 | ) | | | (0.27 | ) | |
Net Asset Value, End of Period | | $ | 9.89 | | | $ | 10.19 | | | $ | 10.04 | | | $ | 9.72 | | | $ | 10.15 | | | $ | 10.38 | | |
Total Return (excludes contingent
deferred sales charge) (b) | | | (1.67 | )% | | | 4.27 | % | | | 5.46 | % | | | (1.79 | )% | | | 1.23 | % | | | (0.03 | )% | |
Ratios/Supplemental Data: | |
Net Assets at end of period (000) | | $ | 11,143 | | | $ | 11,671 | | | $ | 11,547 | | | $ | 12,940 | | | $ | 12,974 | | | $ | 12,691 | | |
Ratio of net expenses to average
net assets (c) | | | 1.74 | % | | | 1.74 | % | | | 1.74 | % | | | 1.74 | % | | | 1.70 | % | | | 1.64 | % | |
Ratio of net investment income (loss)
to average net assets (c) | | | 2.90 | % | | | 2.44 | % | | | 1.49 | % | | | 2.25 | % | | | 2.29 | % | | | 2.58 | % | |
Ratio of gross expenses to average
net assets (c) (d) | | | 1.96 | % | | | 1.89 | % | | | 2.00 | % | | | 1.97 | % | | | 1.96 | % | | | 1.99 | % | |
Portfolio turnover (b) (e) | | | 68 | % | | | 138 | % | | | 79 | % | | | 41 | % | | | 87 | % | | | 133 | % | |
(a) Per share net investment income (loss) has been calculated using the average daily shares method.
(b) Not annualized for periods less than one year.
(c) Annualized for periods less than one year.
(d) During the period, certain fees were reduced and/or reimbursed. If such fee reductions and/or reimbursements had not occurred, the ratios would have been as indicated.
(e) Portfolio turnover is calculated on the basis of the Fund as a whole without distinguishing between the classes of shares issued.
See notes to financial statements.
79
Victory Portfolios | | Financial Highlights — continued | |
For a Share Outstanding Throughout Each Period
| | | Victory Strategic Income Fund | |
| | | Class R Shares | |
| | | Six
Months
Ended
June 30,
2018 | | Year
Ended
December 31,
2017 | | Year
Ended
December 31,
2016 | | Year
Ended
December 31,
2015 | | Year
Ended
December 31,
2014 | | Year
Ended
December 31,
2013 | |
| | | (Unaudited) | | | | | | | | | | | |
Net Asset Value, Beginning of Period | | $ | 10.20 | | | $ | 10.04 | | | $ | 9.73 | | | $ | 10.16 | | | $ | 10.38 | | | $ | 10.67 | | |
Investment Activities: | |
Net investment income (loss) (a) | | | 0.16 | | | | 0.29 | | | | 0.19 | | | | 0.27 | | | | 0.28 | | | | 0.30 | | |
Net realized and unrealized
gains (losses) on investments | | | (0.31 | ) | | | 0.18 | | | | 0.37 | | | | (0.40 | ) | | | (0.10 | ) | | | (0.28 | ) | |
Total from Investment
Activities | | | (0.15 | ) | | | 0.47 | | | | 0.56 | | | | (0.13 | ) | | | 0.18 | | | | 0.02 | | |
Distributions to Shareholders: | |
Net investment income | | | (0.15 | ) | | | (0.31 | ) | | | (0.24 | ) | | | (0.29 | ) | | | (0.29 | ) | | | (0.31 | ) | |
Net realized gains
from investments | | | — | | | | — | | | | — | | | | (0.01 | ) | | | (0.11 | ) | | | — | | |
Return of capital | | | — | | | | — | | | | (0.01 | ) | | | — | | | | — | | | | — | | |
Total Distributions
to Shareholders | | | (0.15 | ) | | | (0.31 | ) | | | (0.25 | ) | | | (0.30 | ) | | | (0.40 | ) | | | (0.31 | ) | |
Net Asset Value, End of Period | | $ | 9.90 | | | $ | 10.20 | | | $ | 10.04 | | | $ | 9.73 | | | $ | 10.16 | | | $ | 10.38 | | |
Total Return (b) | | | (1.47 | )% | | | 4.78 | % | | | 5.77 | % | | | (1.39 | )% | | | 1.72 | % | | | 0.27 | % | |
Ratios/Supplemental Data: | |
Net Assets at end of period (000) | | $ | 2,812 | | | $ | 2,927 | | | $ | 2,979 | | | $ | 3,338 | | | $ | 3,661 | | | $ | 3,806 | | |
Ratio of net expenses to average
net assets (c) | | | 1.34 | % | | | 1.34 | % | | | 1.34 | % | | | 1.34 | % | | | 1.31 | % | | | 1.25 | % | |
Ratio of net investment income (loss)
to average net assets (c) | | | 3.31 | % | | | 2.83 | % | | | 1.89 | % | | | 2.64 | % | | | 2.69 | % | | | 2.97 | % | |
Ratio of gross expenses to average
net assets (c) (d) | | | 1.71 | % | | | 1.61 | % | | | 1.53 | % | | | 1.58 | % | | | 1.57 | % | | | 1.59 | % | |
Portfolio turnover (b) (e) | | | 68 | % | | | 138 | % | | | 79 | % | | | 41 | % | | | 87 | % | | | 133 | % | |
(a) Per share net investment income (loss) has been calculated using the average daily shares method.
(b) Not annualized for periods less than one year.
(c) Annualized for periods less than one year.
(d) During the period, certain fees were reduced and/or reimbursed. If such fee reductions and/or reimbursements had not occurred, the ratios would have been as indicated.
(e) Portfolio turnover is calculated on the basis of the Fund as a whole without distinguishing between the classes of shares issued.
See notes to financial statements.
80
Victory Portfolios | | Financial Highlights — continued | |
For a Share Outstanding Throughout Each Period
| | | Victory Strategic Income Fund | |
| | | Class Y Shares | |
| | | Six
Months
Ended
June 30,
2018 | | Year
Ended
December 31,
2017 | | Year
Ended
December 31,
2016 | | Year
Ended
December 31,
2015 | | Year
Ended
December 31,
2014 | | Year
Ended
December 31,
2013 | |
| | | (Unaudited) | | | | | | | | | | | |
Net Asset Value, Beginning of Period | | $ | 10.09 | | | $ | 9.94 | | | $ | 9.63 | | | $ | 10.05 | | | $ | 10.27 | | | $ | 10.62 | | |
Investment Activities: | |
Net investment income (loss) (a) | | | 0.19 | | | | 0.35 | | | | 0.25 | | | | 0.32 | | | | 0.36 | | | | 0.38 | | |
Net realized and unrealized
gains (losses) on investments | | | (0.31 | ) | | | 0.18 | | | | 0.36 | | | | (0.39 | ) | | | (0.12 | ) | | | (0.29 | ) | |
Total from Investment
Activities | | | (0.12 | ) | | | 0.53 | | | | 0.61 | | | | (0.07 | ) | | | 0.24 | | | | 0.09 | | |
Distributions to Shareholders: | |
Net investment income | | | (0.18 | ) | | | (0.38 | ) | | | (0.29 | ) | | | (0.34 | ) | | | (0.35 | ) | | | (0.44 | ) | |
Net realized gains
from investments | | | — | | | | — | | | | — | | | | (0.01 | ) | | | (0.11 | ) | | | — | | |
Return of capital | | | — | | | | — | | | | (0.01 | ) | | | — | | | | — | | | | — | | |
Total Distributions
to Shareholders | | | (0.18 | ) | | | (0.38 | ) | | | (0.30 | ) | | | (0.35 | ) | | | (0.46 | ) | | | (0.44 | ) | |
Net Asset Value, End of Period | | $ | 9.79 | | | $ | 10.09 | | | $ | 9.94 | | | $ | 9.63 | | | $ | 10.05 | | | $ | 10.27 | | |
Total Return (b) | | | (1.19 | )% | | | 5.38 | % | | | 6.45 | % | | | (0.74 | )% | | | 2.34 | % | | | 0.88 | % | |
Ratios/Supplemental Data: | |
Net Assets at end of period (000) | | $ | 4,987 | | | $ | 10,180 | | | $ | 11,768 | | | $ | 13,217 | | | $ | 18,035 | | | $ | 8,411 | | |
Ratio of net expenses to average
net assets (c) | | | 0.74 | % | | | 0.74 | % | | | 0.74 | % | | | 0.74 | % | | | 0.71 | % | | | 0.57 | % | |
Ratio of net investment income (loss)
to average net assets (c) | | | 3.98 | % | | | 3.46 | % | | | 2.50 | % | | | 3.24 | % | | | 3.28 | % | | | 3.62 | % | |
Ratio of gross expenses to average
net assets (c) (d) | | | 1.12 | % | | | 0.95 | % | | | 0.99 | % | | | 0.98 | % | | | 0.87 | % | | | 0.91 | % | |
Portfolio turnover (b) (e) | | | 68 | % | | | 138 | % | | | 79 | % | | | 41 | % | | | 87 | % | | | 133 | % | |
(a) Per share net investment income (loss) has been calculated using the average daily shares method.
(b) Not annualized for periods less than one year.
(c) Annualized for periods less than one year.
(d) During the period, certain fees were reduced and/or reimbursed. If such fee reductions and/or reimbursements had not occurred, the ratios would have been as indicated.
(e) Portfolio turnover is calculated on the basis of the Fund as a whole without distinguishing between the classes of shares issued.
See notes to financial statements.
81
Victory Portfolios | | Notes to Financial Statements
June 30, 2018 | |
(Unaudited)
1. Organization:
Victory Portfolios (the "Trust") was organized on December 6, 1995 as a Delaware statutory trust as a successor to a company of the same name organized as a Massachusetts business trust on February 5, 1986. The Trust is registered under the Investment Company Act of 1940, as amended (the "1940 Act"), as an open-end management investment company. The Trust is comprised of 42 funds and is authorized to issue an unlimited number of shares, which are units of beneficial interest with a par value of $0.001 per share. The accompanying financial statements are those of the following Funds (collectively, the "Funds" and individually, a "Fund").
Funds | | Investment Share
Classes Offered | | Investment Objectives | |
Victory INCORE
Investment Quality
Bond Fund ("Investment
Quality Bond Fund") | | Classes A, C, R and Y
| | Seeks to provide a high level of current income
and capital appreciation without undue risk
to principal
| |
Victory INCORE Low
Duration Bond Fund
("Low Duration Bond
Fund") | | Classes A, C, R and Y
| | Seeks to provide a high level of current income
consistent with preservation of capital
| |
Victory High Yield Fund
("High Yield Fund") | | Classes A, C, R and Y
| | Seeks to provide current income with capital
appreciation as a secondary objective | |
Victory Tax-Exempt
Fund ("Tax-Exempt
Fund") | | Classes A, C and Y
| | Seeks to maximize current income exempt
from federal income taxes, consistent with the
preservation of capital. | |
Victory High Income
Municipal Bond Fund
("High Income Municipal
Bond Fund") | | Classes A, C and Y
| | Seeks to provide a high current income exempt
from federal income taxes with a secondary
objective of capital appreciation
| |
Victory Floating Rate
Fund ("Floating Rate
Fund") | | Classes A, C, R and Y
| | Seeks to provide a high level of current income
| |
Victory Strategic Income
Fund ("Strategic Income
Fund") | | Classes A, C, R and Y
| | Seeks to provide a high current income with a
secondary objective of capital appreciation
| |
Each class of shares of a Fund has substantially identical rights and privileges except with respect to sales charges, fees paid under distribution plans, expenses allocable exclusively to each class of shares, voting rights on matters solely affecting a single class of shares, and the exchange privilege of each class of shares.
Under the Trust's organizational documents, its officers and trustees are indemnified against certain liabilities arising out of the performance of their duties to the Funds. In addition, in the normal course of business, the Funds enter into contracts with their vendors and others that provide for general indemnifications. The Funds' maximum exposure under these arrangements is unknown, as this would involve future claims that may be made against the Funds. However, based on experience, the Funds expect that risk of loss to be remote.
2. Significant Accounting Policies:
The following is a summary of significant accounting policies followed by the Trust in the preparation of its financial statements. The policies are in conformity with accounting principles generally accepted in the United States of America ("GAAP"). The preparation of financial statements in accordance with GAAP requires management to make estimates and assumptions that affect the reported amounts of assets and liabilities and disclosure of contingent assets and liabilities at the date of the financial statements and the reported amounts of income and expenses for the period. Actual results could differ from those estimates. The Funds follow the specialized accounting and reporting requirements under GAAP that are applicable to investment companies.
82
Victory Portfolios | | Notes to Financial Statements — continued
June 30, 2018 | |
(Unaudited)
Investment Valuation:
The Funds record investments at fair value. Fair value is defined as the price that would be received to sell an asset or paid to transfer a liability in an orderly transaction between market participants at the measurement date.
The valuation techniques described below maximize the use of observable inputs and minimize the use of unobservable inputs in determining fair value. The inputs used for valuing the Funds' investments are summarized in the three broad levels listed below:
• Level 1 — quoted prices in active markets for identical securities
• Level 2 — other significant observable inputs (including quoted prices for similar securities or interest rates applicable to those securities, etc.)
• Level 3 — significant unobservable inputs (including the Funds' own assumptions in determining the fair value of investments)
Changes in valuation techniques may result in transfers in or out of an assigned level within the disclosure hierarchy. The Trust determines transfers between fair value hierarchy levels at the reporting period end. The inputs or methodologies used for valuation techniques are not necessarily an indication of the risk associated with entering into those investments.
Portfolio securities listed or traded on securities exchanges, including exchange-traded funds ("ETFs"), American Depositary Receipts ("ADRs") and Rights, are valued at the closing price on the exchange or system where the security is principally traded, if available or at the Nasdaq Official Closing Price. If there have been no sales for that day on the exchange or system, then a security is valued at the last available bid quotation on the exchange or system where the security is principally traded. In each of these situations, valuations are typically categorized as Level 1 in the fair value hierarchy.
Investments in open-end investment companies are valued at net asset value. These valuations are typically categorized as Level 1 in the fair value hierarchy.
Futures contracts are valued at the settlement price established each day by the board of trade or an exchange on which they are traded. These valuations are typically categorized as Level 1 in the fair value hierarchy.
Swap agreements, are valued at the last quoted sales price or, in the absence of a sale, at the mean between the current bid and ask prices. In each of these situations, valuations are typically categorized as Level 2 in the fair value hierarchy.
Debt securities of United States ("U.S.") issuers (other than short-term investments maturing in 60 days or less), including corporate and municipal securities, are valued on the basis of bid valuations provided by dealers or an independent pricing service approved by the Trust's Board of Trustees (the "Board"). Short-term investments maturing in 60 days or less may be valued at amortized cost, which approximates market value. Under the amortized cost method, premium or discount, if any, is amortized or accreted, respectively, on a constant basis to the maturity of the security. In each of these situations, valuations are typically categorized as Level 2 in the fair value hierarchy.
Investments for which there are no such quotations, or for which quotations do not appear reliable, are valued at fair value in accordance with procedures established by and under the general supervision and responsibility of the Board. These valuations are typically categorized as Level 2 or Level 3 in the fair value hierarchy, based on the observability of inputs used to determine the fair value.
For the six months ended June 30, 2018, there were no Level 3 investments for which significant unobservable inputs were used to determine fair value.
83
Victory Portfolios | | Notes to Financial Statements — continued
June 30, 2018 | |
(Unaudited)
A summary of the valuations as of June 30, 2018, based upon the three levels defined above, is included in the table below while the breakdown, by category, of investments is disclosed in the Schedules of Portfolio Investments:
| | | LEVEL 1 —
Quoted Prices | | LEVEL 2 —
Other Significant
Observable Inputs | | Total | |
| | | Investments
in
Securities | | Other
Financial
Investments^ | | Investments
in
Securities | | Other
Financial
Investments^ | | Investments
in
Securities | | Other
Financial
Investments^ | |
INCORE Investment Quality
Bond Fund | |
Asset Backed Securities | | $ | — | | | $ | — | | | $ | 2,082,364 | | | $ | — | | | $ | 2,082,364 | | | $ | — | | |
Collateralized Mortgage
Obligations | | | — | | | | — | | | | 872,712 | | | | — | | | | 872,712 | | | | — | | |
Residential Mortgage
Backed Securities | | | — | | | | — | | | | 606,998 | | | | — | | | | 606,998 | | | | — | | |
Corporate Bonds | | | — | | | | — | | | | 14,816,751 | | | | — | | | | 14,816,751 | | | | — | | |
Government National
Mortgage Association | | | — | | | | — | | | | 26,541 | | | | — | | | | 26,541 | | | | — | | |
U.S. Government
Mortgage Backed
Agencies | | | — | | | | — | | | | 15,311,054 | | | | — | | | | 15,311,054 | | | | — | | |
U.S. Treasury
Obligations | | | — | | | | — | | | | 4,016,126 | | | | — | | | | 4,016,126 | | | | — | | |
Collateral for Securities
Loaned | | | 1,198,379 | | | | — | | | | — | | | | — | | | | 1,198,379 | | | | — | | |
Futures Contracts | | | — | | | | 14,020 | | | | — | | | | — | | | | — | | | | 14,020 | | |
Credit Default Swap
Agreements | | | — | | | | — | | | | — | | | | 2,860 | | | | — | | | | 2,860 | | |
Total | | | 1,198,379 | | | | 14,020 | | | | 37,732,546 | | | | 2,860 | | | | 38,930,925 | | | | 16,880 | | |
INCORE Low Duration
Bond Fund | |
Asset Backed Securities | | | — | | | | — | | | | 63,946,083 | | | | — | | | | 63,946,083 | | | | — | | |
Collateralized Mortgage
Obligations | | | — | | | | — | | | | 31,799,983 | | | | — | | | | 31,799,983 | | | | — | | |
Residential Mortgage
Backed Securities | | | — | | | | — | | | | 23,661,335 | | | | — | | | | 23,661,335 | | | | — | | |
Corporate Bonds | | | — | | | | — | | | | 173,861,321 | | | | — | | | | 173,861,321 | | | | — | | |
U.S. Government Mortgage
Backed Agencies | | | — | | | | — | | | | 51,340,220 | | | | — | | | | 51,340,220 | | | | — | | |
U.S. Treasury Obligations | | | — | | | | — | | | | 38,054,161 | | | | — | | | | 38,054,161 | | | | — | | |
Collateral for Securities
Loaned | | | 10,036,293 | | | | — | | | | — | | | | — | | | | 10,036,293 | | | | — | | |
Futures Contracts | | | — | | | | (55,993 | ) | | | — | | | | — | | | | — | | | | (55,993 | ) | |
Credit Default Swaps
Agreements | | | — | | | | — | | | | — | | | | (28,709 | ) | | | — | | | | (28,709 | ) | |
Total | | | 10,036,293 | | | | (55,993 | ) | | | 382,663,103 | | | | (28,709 | ) | | | 392,699,396 | | | | (84,702 | ) | |
High Yield Fund | |
Common Stocks | | | 1,946,010 | | | | — | | | | — | | | | — | | | | 1,946,010 | | | | — | | |
Senior Secured Loans | | | — | | | | — | | | | 19,731,995 | | | | — | | | | 19,731,995 | | | | — | | |
Corporate Bonds | | | — | | | | — | | | | 45,003,633 | | | | — | | | | 45,003,633 | | | | — | | |
Collateral for Securities
Loaned | | | 10,233,122 | | | | — | | | | — | | | | — | | | | 10,233,122 | | | | — | | |
Total | | | 12,179,132 | | | | — | | | | 64,735,628 | | | | — | | | | 76,914,760 | | | | — | | |
84
Victory Portfolios | | Notes to Financial Statements — continued
June 30, 2018 | |
(Unaudited)
| | | LEVEL 1 —
Quoted Prices | | LEVEL 2 —
Other Significant
Observable Inputs | | Total | |
| | | Investments
in
Securities | | Other
Financial
Investments^ | | Investments
in
Securities | | Other
Financial
Investments^ | | Investments
in
Securities | | Other
Financial
Investments^ | |
Tax-Exempt Fund | |
Municipal Bonds | | $ | — | | | $ | — | | | $ | 80,935,580 | | | $ | — | | | $ | 80,935,580 | | | $ | — | | |
Total | | | — | | | | — | | | | 80,935,580 | | | | — | | | | 80,935,580 | | | | — | | |
High Income Municipal Bond Fund | |
Municipal Bonds | | | — | | | | — | | | | 58,704,228 | | | | — | | | | 58,704,228 | | | | — | | |
Total | | | — | | | | — | | | | 58,704,228 | | | | — | | | | 58,704,228 | | | | — | | |
Floating Rate Fund | |
Senior Secured Loans | | | — | | | | — | | | | 602,783,211 | | | | — | | | | 602,783,211 | | | | — | | |
Corporate Bonds | | | — | | | | — | | | | 58,996,595 | | | | — | | | | 58,996,595 | | | | — | | |
Total | | | — | | | | — | | | | 661,779,806 | | | | — | | | | 661,779,806 | | | | — | | |
Strategic Income Fund | |
Asset Backed Securities | | | — | | | | — | | | | 4,480,518 | | | | — | | | | 4,480,518 | | | | — | | |
Residential Mortgage
Backed Securities | | | — | | | | — | | | | 1,170,493 | | | | — | | | | 1,170,493 | | | | — | | |
Senior Secured Loans | | | — | | | | — | | | | 8,157,236 | | | | — | | | | 8,157,236 | | | | — | | |
Corporate Bonds | | | — | | | | — | | | | 17,857,436 | | | | — | | | | 17,857,436 | | | | — | | |
U.S. Government Mortgage
Backed Agencies | | | — | | | | — | | | | 5,009,927 | | | | — | | | | 5,009,927 | | | | — | | |
U.S. Treasury Obligations | | | — | | | | — | | | | 10,314,979 | | | | — | | | | 10,314,979 | | | | — | | |
Collateral for Securities
Loaned | | | 2,337,948 | | | | — | | | | — | | | | — | | | | 2,337,948 | | | | — | | |
Futures Contracts | | | — | | | | (12,229 | ) | | | — | | | | — | | | | — | | | | (12,229 | ) | |
Credit Default Swap
Agreements | | | — | | | | — | | | | — | | | | (15,097 | ) | | | — | | | | (15,097 | ) | |
Total | | | 2,337,948 | | | | (12,229 | ) | | | 46,990,589 | | | | (15,097 | ) | | | 49,328,537 | | | | (27,326 | ) | |
^ Other Financial investments include any derivative instruments not reflected in the Schedule of Portfolio Investments as investment securities, such as futures contracts and swap agreements. These instruments are generally recorded in the financial statements at the unrealized gain or loss on the investment.
There were no transfers among any levels during the six months ended June 30, 2018.
Securities Purchased on a When-Issued Basis:
The Funds may purchase securities on a when-issued basis. When-issued securities are securities purchased for delivery beyond normal settlement periods at a stated price and/or yield, thereby involving the risk that the price and/or yield obtained may be more or less than those available in the market when delivery takes place. At the time a Fund makes the commitment to purchase a security on a when-issued basis, the Fund records the transaction and reflects the value of the security in determining net asset value. No interest accrues to the Fund until the transaction settles and payment takes place. Normally, the settlement date occurs within one month of the purchase. A segregated account is established and the Fund maintains cash and/or marketable securities at least equal in value to commitments for when-issued securities. If a Fund owns when-issued securities, these values are included in "Payable for investments purchased" on the accompanying Statements of Assets and Liabilities. As of June 30, 2018, the Funds had outstanding when-issued purchase commitments covered by the segregated assets as identified in the Schedules of Portfolio Investments.
85
Victory Portfolios | | Notes to Financial Statements — continued
June 30, 2018 | |
(Unaudited)
Municipal Obligations:
The values of municipal obligations can fluctuate and may be affected by adverse tax, legislative, or political changes, and by financial developments affecting municipal issuers. Payment of municipal obligations may depend on a relatively limited source of revenue, resulting in greater credit risk. Future changes in federal tax laws or the activity of an issuer may adversely affect the tax-exempt status of municipal obligations.
Mortgage- and Asset-Backed Securities:
The values of some mortgage-related or asset-backed securities may be particularly sensitive to changes in prevailing interest rates. Early repayment of principal on some mortgage-related securities may expose a Fund to a lower rate of return upon reinvestment of principal. The values of mortgage and asset-backed securities depend in part on the credit quality and adequacy of the underlying assets or collateral and may fluctuate in response to the market's perception of these factors as well as current and future repayment rates. Some mortgage-backed securities are backed by the full faith and credit of the U.S. government (e.g., mortgage-backed securities issued by the Government National Mortgage Association, commonly known as "Ginnie Mae"), while other mortgage-backed securities (e.g., mortgage-backed securities issued by the Federal National Mortgage Association and the Federal Home Loan Mortgage Corporation, commonly known as "Fannie Mae" and "Freddie Mac"), are backed only by the credit of the government entity issuing them. In addition, some mortgage-backed securities are issued by private entities and, as such, are not guaranteed by the U.S. government or any agency or instrumentality of the U.S. government.
Loans:
Floating rate loans in which a Fund invest are primarily "senior" loans. Senior floating rate loans typically hold a senior position in the capital structure of the borrower, are typically secured by specific collateral, and have a claim on the assets and/or stock of the borrower that is senior to that held by subordinated debtholders and stockholders of the borrower. While these protections may reduce risk, these investments still present significant credit risk. A significant portion of a Fund's floating rate investments may be issued in connection with highly leveraged transactions such as leveraged buyouts, leveraged recapitalization loans, and other types of acquisition financing. Obligations in these types of transactions are subject to greater credit risk (including default and bankruptcy) than many other investments and may be, or become, illiquid. See the note below regarding below investment grade securities.
A Fund may purchase second lien loans (secured loans with a claim on collateral subordinate to a senior lender's claim on such collateral), fixed rate loans, unsecured loans, and other debt obligations.
Transactions in loans often settle on a delayed basis, and a Fund may not receive the proceeds from the sale of a loan or pay for a loan purchase for a substantial period of time after entering into the transactions.
Below Investment Grade Securities:
Certain Funds may invest in below investment grade securities (i.e. lower-quality, "junk" debt), which are subject to various risks. Lower-quality debt is considered to be speculative because it is less certain that the issuer will be able to pay interest or repay the principal than in the case of investment grade debt. These securities can involve a substantially greater risk of default than higher-rated securities, and their values can decline significantly over short periods of time. Lower-quality debt securities tend to be more sensitive to adverse news about their issuers, the market and the economy in general, than higher-quality debt securities.
The market for these securities can be less liquid, especially during periods of recession or general market decline.
86
Victory Portfolios | | Notes to Financial Statements — continued
June 30, 2018 | |
(Unaudited)
Investment Companies:
Exchange-Traded Funds:
The Funds may invest in ETFs. ETFs are a type of index fund, the shares of which are bought and sold on a securities exchange. An ETF trades like common stock and represents a fixed portfolio of securities designed to track the performance and dividend yield of a particular domestic or foreign market index. A Fund may purchase shares of an ETF to temporarily gain exposure to a portion of the U.S. or a foreign market while awaiting purchase of underlying securities. The risks of owning an ETF generally reflect the risks of owning the underlying securities they are designed to track, although the lack of liquidity on an ETF could result in it being more volatile. Additionally, ETFs have fees and expenses that reduce their value.
Open-End Funds:
The Funds may invest in portfolios of open-end investment companies. These investment companies value securities in their portfolios for which market quotations are readily available at their market values (generally the last reported sale price) and all other securities and assets at their fair value by the methods established by the board of directors of the underlying funds.
Derivative Instruments:
Futures Contracts:
The Funds may enter into contracts for the future delivery of securities or foreign currencies and futures contracts based on a specific security, class of securities, foreign currency or an index, and purchase or sell options on any such futures contracts. A futures contract on a securities index is an agreement obligating either party to pay, and entitling the other party to receive, while the contract is outstanding, cash payments based on the level of a specified securities index. No physical delivery of the underlying asset is made. A Fund may enter into futures contracts in an effort to hedge against market risks. The acquisition of put and call options on futures contracts will give the Fund the right (but not the obligation), for a specified price, to sell or to purchase the underlying futures contract, upon exercise of the option, at any time during the option period. Futures transactions involve brokerage costs and require the Fund to segregate assets to cover contracts that would require it to purchase securities or currencies. A good faith margin deposit, known as initial margin, of cash or government securities with a broker or custodian is required to initiate and maintain open positions in futures contracts. Subsequent payments, known as variation margin, are made or received by the Fund based on the change in the market value of the position and are recorded as unrealized appreciation or depreciation until the contract is closed out, at which time the gain or loss is realized. A Fund may lose the expected benefit of futures transactions if interest rates, exchange rates or securities prices change in an unanticipated manner. Such unanticipated changes may also result in lower overall performance than if the Fund had not entered into any futures transactions. In addition, the value of a Fund's futures positions may not prove to be perfectly or even highly correlated with the value of its portfolio securities or foreign currencies, limiting a Fund's ability to hedge effectively against interest rate, exchange rate and/or market risk and giving rise to additional risks. There is no assurance of liquidity in the secondary market for purposes of closing out futures positions. The collateral held by the Funds is presented on the Statements of Assets and Liabilities under Deposit with broker for futures contracts.
Credit Derivatives:
The Funds may enter into credit derivatives, including centrally-cleared credit default swaps on individual obligations or credit indices. The Funds may use these investments (i) as alternatives to direct long or short investment in a particular security or securities, (ii) to adjust a Fund's asset allocation or risk exposure, or (iii) for hedging purposes. The use by a Fund of credit default
87
Victory Portfolios | | Notes to Financial Statements — continued
June 30, 2018 | |
(Unaudited)
swaps may have the effect of creating a short position in a security. Credit derivatives can create investment leverage and may create additional investment risks that may subject a Fund to greater volatility than investments in more traditional securities, as described in the Funds' Statement of Additional Information.
Credit default swap ("CDS") agreements on credit indices involve one party making a stream of payments (referred to as the buyer of protection) to another party (the seller of protection) in exchange for the right to receive a specified return in the event of a write-down, principal shortfall, interest shortfall or default of all or part of the referenced entities comprising the credit index. A credit index is a basket of credit instruments or exposures designed to be representative of a specific sector of the credit market as a whole. These indices are made up of reference credits that are judged by a poll of dealers to be the most liquid entities in the CDS.
The counterparty risk for cleared swap agreements is generally lower than uncleared over-the-counter swap agreements because generally a clearing organization becomes substituted for each counterparty to a cleared swap agreement and, in effect, guarantees each party's performance under the contract as each party to a trade looks only to the clearing organization for performance of financial obligations. However, there can be no assurance that the clearing organization, or its members, will satisfy its obligations to the Funds.
The Funds may enter into CDS agreements either as a buyer or seller. The Funds may buy protection under a CDS to attempt to mitigate the risk of default or credit quality deterioration in one or more individual holdings or in a segment of the fixed income securities market. The Funds may sell protection under a CDS in an attempt to gain exposure to an underlying issuer's credit quality characteristics without investing directly in that issuer. For swaps entered with an individual counterparty, the Funds bear the risk of loss of the uncollateralized amount expected to be received under a CDS agreement in the event of the default or bankruptcy of the counterparty. CDS agreements are generally valued at a price at which the counterparty to such agreement would terminate the agreement. The Funds may also enter into cleared swaps.
Upon entering into a cleared CDS, the Funds may be required to deposit with the broker an amount of cash or cash equivalents in the range of approximately 3% to 6% of the notional amount for CDS on high yield debt issuers (this amount is subject to change by the clearing organization that clears the trade). This amount, known as "initial margin," is in the nature of a performance bond or good faith deposit on the CDS and is returned to the Funds upon termination of the CDS, assuming all contractual obligations have been satisfied. Subsequent payments, known as "variation margin," to and from the broker will be made daily as the price of the CDS fluctuates, making the long and short positions in the CDS contract more or less valuable, a process known as "marking-to-market." The premium (discount) payments are built into the daily price of the CDS and thus are amortized through the variation margin. The variation margin payment also includes the daily portion of the periodic payment stream.
The maximum potential amount of future payments (undiscounted) that the Fund as a seller of protection could be required to make under a CDS agreement equals the notional amount of the agreement. Notional amounts of each individual CDS agreement outstanding as of period end for which a Fund is the seller of protection are disclosed in the Schedule of Portfolio Investments. These potential amounts would be partially offset by any recovery values of the respective referenced obligations, upfront payments received upon entering into the agreement, periodic interest payments, or net amounts received from the settlement of buy protection CDS agreements entered into by the Funds for the same referenced entity or entities.
As of June 30, 2018, the INCORE Investment Quality Bond Fund, INCORE Low Duration Bond Fund and Strategic Income Fund entered into centrally cleared CDS agreements primarily for the strategy of asset allocation and risk exposure management.
88
Victory Portfolios | | Notes to Financial Statements — continued
June 30, 2018 | |
(Unaudited)
Summary of Derivative Instruments:
The following table summarizes the fair values of derivative instruments on the Statements of Assets and Liabilities, categorized by risk exposure, as of June, 30, 2018:
| | | Assets | | Liabilities | |
Fund | | Variation
Margin
Receivable
on Open
Futures
Contracts* | | Variation
Margin
Receivable
on Centrally
Cleared
Swap
Agreements* | | Variation
Margin
Payable
on Open
Futures
Contracts* | | Variation
Margin
Payable on
Centrally
Cleared
Swap
Agreements* | |
Credit Risk Exposure: | |
INCORE Investment Quality Bond
Fund | | $ | — | | | $ | 2,860 | | | $ | — | | | $ | — | | |
INCORE Low Duration Bond Fund | | | — | | | | 30,500 | | | | — | | | | 59,209 | | |
Strategic Income Fund | | | — | | | | — | | | | — | | | | 15,097 | | |
Interest Rate Risk Exposure: | |
INCORE Investment Quality Bond
Fund | | | 14,020 | | | | — | | | | — | | | | — | | |
INCORE Low Duration Bond Fund | | | — | | | | — | | | | 55,993 | | | | — | | |
Strategic Income Fund | | | 13,316 | | | | — | | | | 25,545 | | | | — | | |
* Includes cumulative appreciation (depreciation) of futures contracts and centrally cleared swap agreements as reported on the Schedules of Portfolio Investments. Only current day's variation margin for both futures contracts and centrally cleared swap agreements are reported within the Statements of Assets and Liabilities.
The following table presents the effect of derivative instruments on the Statements of Operations, categorized by risk exposure, for the six months ended June 30, 2018.
| | | Net Realized Gains (Losses)
on Derivatives Recognized
as a Result from Operations | | Net Change in Unrealized
Appreciation/Depreciation
on Derivatives Recognized
as a Result of Operations | |
| | | Net Realized
Gains (Losses)
from Futures
Contracts | | Net Realized
Gains (Losses)
from Centrally
Cleared Swap
Transactions | | Net Change
in Unrealized
Appreciation/
Depreciation
on Futures
Contracts | | Net Change
in Unrealized
Appreciation/
Depreciation
on Centrally
Cleared Swap
Transactions | |
Credit Risk Exposure: | |
INCORE Investment Quality Bond
Fund | | $ | — | | | $ | 83,810 | | | $ | — | | | $ | (6,673 | ) | |
INCORE Low Duration Bond Fund | | | — | | | | 1,030,806 | | | | — | | | | (273,733 | ) | |
Strategic Income Fund | | | — | | | | (102,741 | ) | | | — | | | | (15,097 | ) | |
Interest Rate Risk Exposure: | |
INCORE Investment Quality Bond
Fund | | | (153,589 | ) | | | — | | | | 21,323 | | | | — | | |
INCORE Low Duration Bond Fund | | | (725,454 | ) | | | — | | | | 149,816 | | | | — | | |
Strategic Income Fund | | | (329,056 | ) | | | — | | | | (27,665 | ) | | | — | | |
All open derivative positions at period end are reflected on the Fund's Schedule of Portfolio Investments. The underlying face value of open derivative positions relative to the Fund's net assets at period end is generally representative of the notional amount of open positions to net assets throughout the period.
89
Victory Portfolios | | Notes to Financial Statements — continued
June 30, 2018 | |
(Unaudited)
Investment Transactions and Related Income:
Changes in holdings of investments are accounted for no later than one business day following the trade date. For financial reporting purposes, however, investment transactions are accounted for on trade date on the last business day of the reporting period. Interest income is recognized on an accrual basis and includes, where applicable, the amortization of premium or accretion of discount. Dividend income is recorded on the ex-dividend date. Gains or losses realized on sales of securities are determined by comparing the identified cost of the security lot sold with the net sales proceeds.
Certain Funds may receive other income from investment in loan assignments and/or unfunded commitments, including amendment fees, consent fees, and commitment fees. These fees are recorded as income when received by the Fund. These amounts are included in Interest Income in the Statements of Operations.
Withholding taxes on interest, dividends and gains as a result of certain investments in ADRs by the Funds have been provided for in accordance with each investment's applicable country's tax rules and rates.
Securities Lending:
The Trust has entered into a Master Securities Lending Agreement ("MSLA") with Citibank, N.A. ("Citibank" or the "Agent"). Under the terms of the MSLA, the Funds may lend securities to certain broker-dealers and banks in exchange for collateral in the amount of at least 102% of the value of U.S. securities loaned or at least 105% of the value of non-U.S. securities loaned, marked-to-market daily. Any collateral shortfalls associated with increases in the valuation of the securities loaned are adjusted the next business day. The collateral can be received in the form of cash collateral and/or non-cash collateral. Non-cash collateral can include U.S. Government Securities, letters of credit and certificates of deposit. The cash collateral is invested in short-term instruments or cash equivalents as noted in the Funds' Schedules of Portfolio Investments. The Trust does not have effective control of the non-cash collateral and therefore it is not disclosed in the Funds' Schedules of Portfolio Investments. The Funds continue to benefit from interest or dividends on the securities loaned and may also earn a return from the collateral. The Funds pay various fees in connection with the investment of cash collateral. The Funds pay the Agent fees based on the investment income received from securities lending activities. Securities lending income is disclosed on the Statements of Operations. Although risk is mitigated by the collateral, the Funds could experience a delay in recovering their securities and possible loss of income or value if the borrower fails to return them.
Securities lending transactions are entered into by a Fund under the MSLA, which permits the Fund, under certain circumstances such as an event of default, to offset amounts payable by the Fund to the same counterparty against amounts receivable from the counterparty to create a net payment due to or from the Fund.
The following table is a summary of the Funds' securities lending transactions which are subject to offset under the MSLA as of June 30, 2018. These transactions are accounted for as secured borrowings with an overnight and continuous contractual maturity.
| | | Gross
Amount of
Recognized
Assets
(Value of
Securities
on Loan) | | Value of
Cash
Collateral
Received | | Net Amount | |
INCORE Investment Quality Bond Fund | | $ | 1,161,098 | | | $ | 1,198,379 | | | $ | 37,281 | | |
INCORE Low Duration Bond Fund | | | 9,759,779 | | | | 10,036,293 | | | | 276,514 | | |
High Yield Fund | | | 9,851,485 | | | | 10,233,122 | | | | 381,637 | | |
Strategic Income Fund | | | 2,273,185 | | | | 2,337,948 | | | | 64,763 | | |
90
Victory Portfolios | | Notes to Financial Statements — continued
June 30, 2018 | |
(Unaudited)
Foreign Currency Translations:
The accounting records of the Funds are maintained in U.S. dollars. Investment securities and other assets and liabilities of a Fund denominated in a foreign currency are translated into U.S. dollars at current exchange rates. Purchases and sales of securities, income receipts and expense payments are translated into U.S. dollars at the exchange rates on the date of the transactions. The Funds do not isolate the portion of the results of operations resulting from changes in foreign exchange rates on investments from fluctuations arising from changes in market prices of securities held. Such fluctuations are disclosed as net change in unrealized appreciation/depreciation on investments and foreign currency translations on the Statements of Operations. Any realized gains or losses from these fluctuations are disclosed as net realized gains or losses from investments and foreign currency translations on the Statements of Operations.
Foreign Taxes:
The Funds may be subject to foreign taxes related to foreign income received (a portion of which may be reclaimable), capital gains on the sale of securities, and certain foreign currency transactions. All foreign taxes are recorded in accordance with the applicable regulations and rates that exist in the foreign jurisdictions in which the Funds invest.
Dividends to Shareholders:
Dividends from net investment income, if any, are declared and paid monthly for the Funds. Distributable net realized gains, if any, are declared and distributed at least annually.
The amounts of dividends from net investment income and distributions from net realized gains are determined in accordance with federal income tax regulations, which may differ from GAAP. These "book/tax" differences are either considered temporary or permanent in nature (e.g., reclass of market discounts and premiums and paydown gains or losses), such amounts are reclassified within the components of net assets based on their federal tax-basis treatment; temporary differences (e.g., wash sales) do not require reclassification. To the extent dividends and distributions exceed net investment income and net realized gains for tax purposes, they are reported as distributions of capital. Net investment losses incurred by a Fund may be reclassified as an offset to capital on the accompanying Statements of Assets and Liabilities.
Federal Income Taxes:
It is the policy of each Fund to continue to qualify as a regulated investment company by complying with the provisions available to certain investment companies, as defined in applicable sections of the Internal Revenue Code, and to make distributions of net investment income and net realized gains sufficient to relieve it from all, or substantially all, federal income taxes. Accordingly, no provision for federal income taxes is required in the financial statements. The Funds have a tax year end of December 31.
Management of the Funds has reviewed tax positions taken in tax years that remain subject to examination by all major tax jurisdictions, including federal (i.e., the last four tax year ends and the interim tax period since then). Management believes that there is no tax liability resulting from unrecognized tax benefits related to uncertain tax positions taken.
Allocations:
Expenses directly attributable to a Fund are charged to the Fund, while expenses which are attributable to more than one fund in the Trust, or jointly with an affiliated trust, are allocated among the respective funds in the Trust and/or affiliated trust based upon net assets or another appropriate basis.
Income, expenses (other than class specific expenses such as transfer agent fees, state registration fees, printing and 12b-1 fees), and realized and unrealized gains or losses on investments are allocated to each class of shares based on its relative net assets on the date income is earned or expenses and realized and unrealized gains and losses are incurred.
91
Victory Portfolios | | Notes to Financial Statements — continued
June 30, 2018 | |
(Unaudited)
Affiliated Securities Transactions:
Pursuant to Rule 17a-7 under the 1940 Act, the Funds may engage in securities transactions with affiliated investment companies and advisory accounts managed by the Adviser and any applicable sub-adviser. Any such purchase or sale transaction must be effected without brokerage commission or other remuneration, except for customary transfer fees. The transaction must be effected at the current market price, which is either the security's last sale price on an exchange or, if there are no transactions in the security that day, at the average of the highest bid and lowest asked price. For the six months ended June 30, 2018, the Funds did not engage in any Rule 17a-7 transactions under the 1940 Act.
3. Purchases and Sales of Securities:
Purchases and sales of securities (excluding securities maturing less than one year from acquisition) for the six months ended June 30, 2018 were as follows:
| | | Purchases
(excluding U.S.
Government
Securities) | | Sales
(excluding U.S.
Government
Securities) | | Purchases
of U.S.
Government
Securities | | Sales
of U.S.
Government
Securities | |
INCORE Investment Quality
Bond Fund | | $ | 1,797,123 | | | $ | 9,832,896 | | | $ | 16,392,623 | | | $ | 13,329,486 | | |
INCORE Low Duration Bond
Fund | | | 37,695,091 | | | | 102,351,061 | | | | 31,680,871 | | | | 67,737,213 | | |
High Yield Fund | | | 40,569,159 | | | | 37,840,948 | | | | — | | | | — | | |
Tax-Exempt Fund | | | 18,342,125 | | | | 27,294,897 | | | | — | | | | — | | |
High Income Municipal Bond
Fund | | | 16,600,696 | | | | 32,731,633 | | | | — | | | | — | | |
Floating Rate Fund | | | 202,504,902 | | | | 210,045,951 | | | | — | | | | — | | |
Strategic Income Fund | | | 10,580,298 | | | | 35,474,147 | | | | 22,863,281 | | | | 6,822,729 | | |
4. Fees and Transactions with Affiliates and Related Parties:
Investment advisory services are provided to the Funds by Victory Capital Management Inc. ("VCM" or the "Adviser"), a New York corporation registered as an investment adviser with the Securities and Exchange Commission ("SEC"). The Adviser is a wholly-owned indirect subsidiary of Victory Capital Holdings Inc., a publicly traded Delaware corporation and a wholly-owned direct subsidiary of Victory Capital Operating, LLC.
VCM has entered into a Sub-Advisory Agreement with Park Avenue Institutional Advisers LLC ("Park Avenue"). Park Avenue is responsible for providing day-to-day investment advisory services to the Funds, subject to the oversight of the Board of Trustees of the Trust. Sub-investment advisory fees are paid by VCM to Park Avenue and do not represent a separate or additional expense to the Funds.
Under the terms of the Investment Advisory Agreement, the Adviser is entitled to receive fees based on a percentage of the average daily net assets of each Fund. The rates at which the Adviser is paid by each Fund are included in the table below. The Adviser may use its resources to assist with the Funds' distribution and marketing expenses.
| | | Adviser Fee Rate | |
INCORE Investment Quality Bond Fund | | | 0.50 | % | |
INCORE Low Duration Bond Fund* | | | 0.45 | % | |
High Yield Fund | | | 0.60 | % | |
Tax-Exempt Fund | | | 0.50 | % | |
High Income Municipal Bond Fund | | | 0.50 | % | |
Floating Rate Fund | | | 0.65 | % | |
Strategic Income Fund | | | 0.60 | % | |
* A voluntary investment advisory fee percentage of 0.42% was in effect from September 1, 2015 through June 30, 2018.
92
Victory Portfolios | | Notes to Financial Statements — continued
June 30, 2018 | |
(Unaudited)
VCM also serves as the Funds' administrator and fund accountant. Under an Administration and Fund Accounting Agreement, VCM is paid for its services an annual fee at a rate of 0.08% of the first $15 billion in average daily net assets of the Trust, Victory Variable Insurance Funds and Victory Portfolios II (collectively, the "Trusts"), 0.05% of the average daily net assets above $15 billion to $30 billion of the Trusts and 0.04% of the average daily net assets over $30 billion of the Trusts.
Citi Fund Services Ohio, Inc. ("Citi"), an affiliate of Citibank, N.A., acts as sub-administrator and sub-fund accountant to the Funds pursuant to a Sub-Administration and Sub-Fund Accounting Services Agreement between VCM and Citi. VCM pays Citi a fee for providing these services. The Trust reimburses VCM and Citi for all of their reasonable out-of-pocket expenses incurred in providing these services.
FIS Investor Services, LLC ("FIS") serves as the Funds' transfer agent. Under the Transfer Agent Agreement, the Trust pays FIS a fee for its services and reimburses FIS for all of their reasonable out-of-pocket expenses incurred in providing these services.
The Chief Compliance Officer ("CCO") is an employee of the Adviser, which pays the compensation of the CCO and his support staff. The Trust has entered into an Agreement to provide compliance services with the Adviser, pursuant to which the Adviser furnishes its compliance personnel, including the services of the CCO, and other resources reasonably necessary to provide the Trust with compliance oversight services related to the design, administration and oversight of a compliance program for the Trust in accordance with Rule 38a-1 under the 1940 Act. The Funds in the Victory Funds complex, in the aggregate, compensate the Adviser for these services.
The Trusts pay an annual retainer to each Independent Trustee, plus an additional annual retainer to the Chairman of the Board. The aggregate amount of the fees and expenses of the Independent Trustees are allocated amongst all the funds in the Trusts and are presented in the Statements of Operations.
Shearman & Sterling LLP provides legal services to the Trust.
Victory Capital Advisers, Inc. (the "Distributor"), an affiliate of the Adviser, serves as distributor for the continuous offering of the shares of the Funds pursuant to a Distribution Agreement between the Distributor and the Trust.
Pursuant to the Distribution and Service Plans adopted in accordance with Rule 12b-1 under the 1940 Act, the Distributor may receive a monthly distribution and service fee, at an annual rate of up to 0.25% of the average daily net assets of Class A Shares, at an annual rate of up to 0.50% of the average daily net assets of Class R Shares and 1.00% of the average daily net assets of Class C Shares of the Funds. The distribution and service fees paid to the Distributor may be used by the Distributor to pay for activities primarily intended to result in the sale of Class A, Class R or Class C Shares of the Funds.
In addition, the Distributor and FIS are entitled to receive commissions on sales of the Class A Shares and redemptions of Class C Shares, respectively, of the Funds. For the six months ended June 30, 2018, the Distributor received approximately $20,168 from commissions earned on sales of Class A Shares and FIS received $7,446 from redemptions of Class C Shares of the Funds.
The Adviser has entered into expense limitation agreements with certain Funds. Under the terms of the agreements, to the extent that ordinary operating expenses incurred by certain classes of a Fund in any fiscal year exceed the expense limit for such classes of the Fund, such excess amount will be the liability of the Adviser. Interest, taxes, brokerage commissions, other expenditures which are capitalized in accordance with GAAP, and other extraordinary expenses not incurred in the ordinary course of a Fund's business are excluded from the expense limitation agreement. As of June 30, 2018, the expense limits (excluding voluntary waivers) are as follows:
| | | Class | | Expense Limit(a) | |
INCORE Investment Quality Bond Fund | | Class A Shares | | | 0.90 | % | |
INCORE Investment Quality Bond Fund | | Class C Shares | | | 1.77 | % | |
INCORE Investment Quality Bond Fund | | Class R Shares | | | 1.30 | % | |
INCORE Investment Quality Bond Fund | | Class Y Shares | | | 0.66 | % | |
93
Victory Portfolios | | Notes to Financial Statements — continued
June 30, 2018 | |
(Unaudited)
| | | Class | | Expense Limit(a) | |
INCORE Low Duration Bond Fund | | Class A Shares | | | 0.85 | % | |
INCORE Low Duration Bond Fund | | Class C Shares | | | 1.62 | % | |
INCORE Low Duration Bond Fund | | Class R Shares | | | 1.27 | % | |
INCORE Low Duration Bond Fund | | Class Y Shares | | | 0.62 | % | |
High Yield Fund | | Class A Shares | | | 1.00 | % | |
High Yield Fund | | Class C Shares | | | 1.70 | % | |
High Yield Fund | | Class R Shares | | | 1.35 | % | |
High Yield Fund | | Class Y Shares | | | 0.76 | % | |
Tax-Exempt Fund | | Class A Shares | | | 0.80 | % | |
Tax-Exempt Fund | | Class C Shares | | | 1.60 | % | |
Tax-Exempt Fund | | Class Y Shares | | | 0.69 | % | |
High Income Municipal Bond Fund | | Class A Shares | | | 0.80 | % | |
High Income Municipal Bond Fund | | Class C Shares | | | 1.57 | % | |
High Income Municipal Bond Fund | | Class Y Shares | | | 0.57 | % | |
Floating Rate Fund | | Class A Shares | | | 1.00 | % | |
Floating Rate Fund | | Class C Shares | | | 1.80 | % | |
Floating Rate Fund | | Class R Shares | | | 1.56 | % | |
Floating Rate Fund | | Class Y Shares | | | 0.78 | % | |
Strategic Income Fund | | Class A Shares | | | 0.95 | % | |
Strategic Income Fund | | Class C Shares | | | 1.74 | % | |
Strategic Income Fund | | Class R Shares | | | 1.34 | % | |
Strategic Income Fund | | Class Y Shares | | | 0.74 | % | |
(a) In effect until at least April 30, 2019.
The Funds have agreed to repay fees and expenses that were waived or reimbursed by the Adviser for a period up to three fiscal years after such waiver or reimbursement was made to the extent such payments or repayments would not cause the expenses of a class to exceed the original expense limitation in place at the time of the waiver or reimbursement or any expense limitation agreement in place at the time of repayment. Amounts repaid to the Adviser during the six months ended, if any, are reflected on the Statements of Operations as "Recoupment of prior expenses waived/reimbursed by Adviser".
As of June 30, 2018, the following amounts are available to be repaid to the Adviser.
| | | Expires
12/31/19 | | Expires
12/31/20 | | Expires
12/31/21 | | Total | |
INCORE Investment Quality Bond Fund | | $ | 60,680 | | | $ | 102,291 | | | $ | 52,117 | | | $ | 215,088 | | |
INCORE Low Duration Bond Fund | | | 119,520 | | | | 217,933 | | | | 72,359 | | | | 409,812 | | |
High Yield Fund | | | 41,383 | | | | 80,774 | | | | 34,852 | | | | 157,009 | | |
Tax-Exempt Fund | | | 70,950 | | | | 122,100 | | | | 57,903 | | | | 250,953 | | |
High Income Municipal Bond Fund | | | 86,281 | | | | 139,397 | | | | 67,120 | | | | 292,798 | | |
Floating Rate Fund | | | 368,104 | | | | 718,769 | | | | 400,713 | | | | 1,487,586 | | |
Strategic Income Fund | | | 71,800 | | | | 90,313 | | | | 51,978 | | | | 214,091 | | |
The Adviser may voluntarily waive or reimburse additional fees to assist the Funds in maintaining competitive expense ratios. Voluntary waivers and reimbursements applicable to the Funds are not available to be recouped at a future time. The Adviser voluntarily waived $65,575 for the six months ended June 30, 2018 for the INCORE Low Duration Bond Fund.
Certain officers and/or interested trustees of the Funds are also officers and/or employees of the Adviser, Administrator and Fund Accountant, Sub-Administrator and Sub-Fund Accountant, and Legal.
94
Victory Portfolios | | Notes to Financial Statements — continued
June 30, 2018 | |
(Unaudited)
5. Risks:
Each Fund may be subject to other risks in addition to these identified risks.
An investment in the Funds' shares represents an indirect investment in the securities owned by the Funds, some of which will be traded on a national securities exchange or in the over-the-counter markets. The value of the securities in which the Funds invest, like other market investments, may move up or down, sometimes rapidly and unpredictably. The value of the securities in which the Funds invest may affect the value of the Funds' shares. An investment in the Funds' shares at any point in time may be worth less than the original investment, even after taking into account the reinvestment of the Funds' distributions.
The Funds will be subject to credit risk with respect to the amount each expects to receive from counterparties for financial instruments entered into by the Funds. The Funds may be negatively impacted if a counterparty becomes bankrupt or otherwise fails to perform its obligations due to financial difficulties. The Funds may experience significant delays in obtaining any recovery in bankruptcy or other reorganization proceeding and the Funds may obtain only limited recovery or may obtain no recovery in such circumstances. The Funds typically enter into transactions with counterparties whose credit ratings are investment grade, as determined by a nationally recognized statistical rating organization or, if unrated, judged by the Adviser to be of comparable quality.
6. Borrowing and Interfund Lending:
Line of Credit:
The Trusts participate in a short-term, demand note "Line of Credit" agreement with Citibank. Under the agreement with Citibank as of July 28, 2017, the Trusts may borrow up to $250 million, of which $100 million is committed and $150 million is uncommitted. $40 million of the Line of Credit is reserved for use by the RS Floating Rate Fund with that Fund paying the related commitment fees for that amount. The purpose of the agreement is to meet temporary or emergency cash needs, including redemption requests that might otherwise require the untimely disposition of securities. The agreement was subsequently amended on July 27, 2018 with a new termination date of July 26, 2019. Citibank receives an annual commitment fee of 0.15% on $100 million for providing the Line of Credit. For the six months ended June 30, 2018, Citibank earned approximately $74,384 in commitment fees from the Trusts. Each fund in the Trusts pays a pro-rata portion of the commitment fees plus any interest on amounts borrowed. As of June 30, 2018, the interest rate on outstanding borrowings was 3.10%.
The average borrowing and lending loans for the days outstanding and average interest rate for each Fund during the six months ended June 30, 2018 were as follows:
Fund | | Amount
Outstanding at
June 30, 2018 | | Average
Borrowing* | | Days
Borrowings
Outstanding | | Average
Interest
Rate | | Maximum
Borrowing
During
the Period | |
Tax-Exempt Fund | | $ | 1,800,000 | | | $ | 1,800,000 | | | | 2 | | | | 3.10 | % | | $ | 1,800,000 | | |
* For the six months ended June 30, 2018, based on the number of days borrowings were outstanding.
Interfund Lending:
The Trust and Adviser rely on an exemptive order granted by the SEC in March 2017 (the "Order"), permitting the establishment and operation of an Interfund Lending Facility (the "Facility"). The Facility allows the Funds to directly lend and borrow money to or from any other Victory Fund relying upon the Order at rates beneficial to both the borrowing and lending funds. Advances under the Facility are allowed for temporary or emergency purposes, including the meeting of redemption requests that otherwise might require the untimely disposition of securities, and are subject to each Fund's borrowing restrictions. The interfund loan rate is determined, as specified in the Order, by averaging the current repurchase agreement rate and the current bank loan rate. Interest
95
Victory Portfolios | | Notes to Financial Statements — continued
June 30, 2018 | |
(Unaudited)
paid by each Fund during the period are presented on the Statements of Operations under Interest Expense on Interfund Lending.
The average borrowing and lending for the days outstanding and average interest rate for each Fund during the six months ended June 30, 2018 were as follows:
Fund | | Borrower
or Lender | | Amount
Outstanding at
June 30, 2018 | | Average
Borrowing/
Lending* | | Days
Borrowing/
Lending
Outstanding | | Average
Interest
Rate | | Maximum
Borrowing
During the
Period | |
INCORE Low Duration Bond
Fund | | Borrower | | $ | — | | | $ | 3,283,000 | | | | 1 | | | | 2.35 | % | | $ | 3,283,000 | | |
Tax-Exempt Fund | | Borrower | | | — | | | | 763,750 | | | | 4 | | | | 2.05 | % | | | 1,189,000 | | |
High Income Municipal Bond
Fund | | Borrower | | | — | | | | 1,951,875 | | | | 8 | | | | 2.11 | % | | | 2,772,000 | | |
* For the six months ended June 30, 2018, based on the number of days borrowings were outstanding.
7. Federal Income Tax Information:
The tax character of distributions paid and the tax basis of current components of accumulated earnings (deficit) will be determined at the end of the current tax year ending December 31, 2018.
The tax character of distributions paid during the most recent tax year ended December 31, 2017, were as follows (total distributions paid may differ from the Statements of Changes in Net Assets because, for tax purposes, dividends are recognized when actually paid):
| | | Year Ended December 31, 2017 | |
| | | Distributions paid from | | | | | | | |
| | | Ordinary
Income | | Net
Long-Term
Capital Gains | | Total
Taxable
Distributions | | Tax-Exempt
Distributions | | Total
Distributions
Paid | |
INCORE Investment Quality Bond
Fund | | $ | 1,190,617 | | | $ | — | | | $ | 1,190,617 | | | $ | — | | | $ | 1,190,617 | | |
INCORE Low Duration Bond Fund | | | 9,778,838 | | | | — | | | | 9,778,838 | | | | — | | | | 9,778,838 | | |
High Yield Fund | | | 3,992,625 | | | | — | | | | 3,992,625 | | | | — | | | | 3,992,625 | | |
Tax-Exempt Fund | | | 9,671 | | | | 1,131,359 | | | | 1,141,030 | | | | 3,561,641 | | | | 4,702,671 | | |
High Income Municipal Bond Fund | | | 40,100 | | | | — | | | | 40,100 | | | | 3,604,576 | | | | 3,644,676 | | |
Floating Rate Fund | | | 36,846,521 | | | | — | | | | 36,846,521 | | | | — | | | | 36,846,521 | | |
Strategic Income Fund | | | 2,091,036 | | | | — | | | | 2,091,036 | | | | — | | | | 2,091,036 | | |
As of the most recent tax year ended December 31, 2017, the components of accumulated earnings (deficit) on a tax basis were as follows:
| | | Undistributed
Tax Exempt
Income | | Undistributed
Ordinary
Income | | Undistributed
Long-Term
Capital Gains | | Accumulated
Earnings | | Distributions
Payable | | Accumulated
Capital and
Other
Losses | | Unrealized
Appreciation
(Depreciation)* | | Other
Temporary
Differences | | Total
Accumulated
Earnings
(Deficit) | |
INCORE
Investment
Quality
Bond
Fund | | $ | — | | | $ | 125,765 | | | $ | — | | | $ | 125,765 | | | $ | — | | | $ | (61,636 | ) | | $ | (8,073 | ) | | $ | — | | | $ | 56,056 | | |
INCORE
Low
Duration
Bond
Fund | | | — | | | | 953,601 | | | | — | | | | 953,601 | | | | — | | | | (28,774,644 | ) | | | (1,978,550 | ) | | | — | | | | (29,799,593 | ) | |
High
Yield
Fund | | | — | | | | 52,295 | | | | — | | | | 52,295 | | | | — | | | | (8,853,272 | ) | | | 681,873 | | | | — | | | | (8,119,104 | ) | |
96
Victory Portfolios | | Notes to Financial Statements — continued
June 30, 2018 | |
(Unaudited)
| | | Undistributed
Tax Exempt
Income | | Undistributed
Ordinary
Income | | Undistributed
Long-Term
Capital Gains | | Accumulated
Earnings | | Distributions
Payable | | Accumulated
Capital and
Other
Losses | | Unrealized
Appreciation
(Depreciation)* | | Other
Temporary
Differences | | Total
Accumulated
Earnings
(Deficit) | |
Tax-Exempt
Fund | | $ | 20,369 | | | $ | — | | | $ | 544,150 | | | $ | 564,519 | | | $ | — | | | $ | — | | | $ | 4,595,342 | | | $ | — | | | $ | 5,159,861 | | |
High
Income
Municipal
Bond
Fund | | | 155,563 | | | | — | | | | — | | | | 155,563 | | | | — | | | | (1,087,810 | ) | | | 3,804,608 | | | | (27,581 | ) | | | 2,844,780 | | |
Floating
Rate
Fund | | | — | | | | 274,541 | | | | — | | | | 274,541 | | | | — | | | | (164,679,591 | ) | | | 1,155,792 | | | | (27,918 | ) | | | (163,277,176 | ) | |
Strategic
Income
Fund | | | — | | | | — | | | | — | | | | — | | | | (78,226 | ) | | | (420,587 | ) | | | 258,640 | | | | (27,580 | ) | | | (267,753 | ) | |
* The difference between the book-basis and tax-basis of unrealized appreciation (depreciation) is attributable primarily
As of the most recent tax year ended December 31, 2017, the following Funds had net capital loss carryforwards ("CLCFs") as summarized in the tables below. CLCFs subject to expiration are applied as short-term capital loss regardless of whether the originating capital loss was short-term or long-term. CLCFs that are not subject to expiration are applied as either short-term or long-term depending on the originating capital loss and must be utilized before those that are subject to expiration.
CLCFs not subject to expiration:
| | | Short-Term
Amount | | Long-Term
Amount | | Total | |
INCORE Investment Quality Bond Fund | | $ | — | | | $ | 61,636 | | | $ | 61,636 | | |
INCORE Low Duration Bond Fund | | | 11,395,485 | | | | 17,379,159 | | | | 28,774,644 | | |
High Yield Fund | | | 3,152,113 | | | | 5,701,159 | | | | 8,853,272 | | |
High Income Municipal Bond Fund | | | 1,087,810 | | | | — | | | | 1,087,810 | | |
Floating Rate Fund | | | 26,992,083 | | | | 137,687,508 | | | | 164,679,591 | | |
Strategic Income Fund | | | — | | | | 420,587 | | | | 420,587 | | |
During the most recent tax year ended December 31, 2017, the High Yield Fund, High Income Municipal Bond Fund, Floating Rate Fund and Strategic Income Fund utilized $1,118,816, $4,064,798, $1,973,767 and $954,257, respectively, of capital loss carryforward.
At June 30, 2018, the cost basis for federal income tax purposes, gross unrealized appreciation, gross unrealized depreciation and net unrealized appreciation (depreciation) for investments and derivatives were as follows:
| | Cost of
Investments
for Federal
Tax Purposes | | Gross
Unrealized
Appreciation | | Gross
Unrealized
Depreciation | | Net
Unrealized
Appreciation
(Depreciation) | |
INCORE Investment Quality
Bond Fund | | $ | 39,900,506 | | | $ | 118,483 | | | $ | (1,071,184 | ) | | $ | (952,701 | ) | |
INCORE Low Duration
Bond Fund | | | 397,351,082 | | | | 355,608 | | | | (5,091,996 | ) | | | (4,736,388 | ) | |
High Yield Fund | | | 77,557,427 | | | | 1,143,568 | | | | (1,786,235 | ) | | | (642,667 | ) | |
Tax-Exempt Fund | | | 78,409,971 | | | | 2,861,964 | | | | (336,355 | ) | | | 2,525,609 | | |
High Income Municipal
Bond Fund | | | 57,107,666 | | | | 2,312,064 | | | | (715,502 | ) | | | 1,596,562 | | |
Floating Rate Fund | | | 665,296,155 | | | | 3,950,514 | | | | (7,466,863 | ) | | | (3,516,349 | ) | |
Strategic Income Fund | | | 49,689,072 | | | | 205,981 | | | | (593,842 | ) | | | (387,861 | ) | |
97
Victory Portfolios | | Notes to Financial Statements — continued
June 30, 2018 | |
(Unaudited)
8. Capital Contribution from Prior Custodian:
During 2016, certain Funds received notification from their prior custodian, State Street Bank and Trust ("State Street"), related to over-billing on certain categories of expenses during the approximately 16-year period from 1998 through October 31, 2014. The over-billing primarily related to categories of expenses that involved an allocation of general costs among multiple clients.
State Street paid the refunded amounts during January 2017. Based on billing information received during 2016 from State Street and an analysis of any expense limitation agreements that were in place during the period of the over-billing, including the application of any recoupment provisions in such agreements, the Adviser received a portion of the refund.
The portion of the refund retained by the Funds was accounted for as a capital contribution and is reflected on the Financial Highlights as "Capital Contribution from Prior Custodian, Net".
9. Fund Ownership:
Ownership of more than 25% of the voting securities of a fund creates presumptions of control of the fund, under section 2(a)(9) of the 1940 Act. As of June 30, 2018, the shareholders listed below held more than 25% of the shares outstanding of the Funds and may be deemed to control those Funds.
Shareholder | | Fund | | Percent | |
Guardian Life Insurance | | High Yield Fund | | | 53.7 | % | |
Morgan Stanley | | Floating Rate Fund | | | 25.9 | % | |
Guardian Life Insurance | | Strategic Income Fund | | | 66.1 | % | |
10. Recent Accounting Pronouncements:
In October 2016, the SEC released its Final Rules on Investment Company Reporting Modernization (the ``Rules''). The Rules introduced two new regulatory reporting forms for investment companies, Form N-PORT and Form N-CEN. The Funds' compliance date for Form N-PORT is June 1, 2018, and the Funds will make their initial filing with the SEC on Form N-PORT for the period ending March 31, 2019. Effective with the period ended June 30, 2018, the Funds will be required to maintain, and make available to the SEC upon request, the information required to be included in Form N-PORT. Form N-PORT will replace Form N-Q filings effective with the requirement to file the Form N-PORT with the SEC for the period ending March 31, 2019. The Funds' compliance date for Form N-CEN is June 1, 2018, and the Funds will make their initial filing on Form N-CEN for the period ending December 31, 2018. Form N-CEN will replace Form N-SAR filings. The Funds' adoption of these amendments have no effect on the Funds' net assets or results of operations.
In March 2017, the FASB issued Accounting Standards Update No. 2017-08 "Premium Amortization on Purchased Callable Debt Securities" ("ASU 2017-08"), which shortens the premium amortization period for purchased non-contingently callable debt securities. ASU 2017-08 specifies that the premium amortization period ends at the earliest call date, for purchased non-contingently callable debt securities. ASU 2017-08 is effective for fiscal years, and interim periods within those fiscal years, beginning after December 15, 2018.
Management is currently evaluating the implications of ASU 2017-08 and its impact on the financial statements and related disclosures has not yet been determined.
11. Subsequent Events:
The Funds have evaluated the need for additional disclosures or adjustments resulting from subsequent events through the date these financial statements were issued. Based on this evaluation, there were no subsequent events to report that would have a material impact on the Funds' financial statements.
98
Victory Portfolios | | Supplemental Information
June 30, 2018 | |
(Unaudited)
Trustee and Officer Information
Board of Trustees:
Overall responsibility for management of the Trust rests with the Board. The Trust is managed by the Board in accordance with the laws of the State of Delaware. There are currently ten Trustees, nine of whom are not "interested persons" of the Trust within the meaning of that term under the 1940 Act ("Independent Trustees") and one of whom is an "interested person" of the Trust within the meaning of that term under the 1940 Act ("Interested Trustee"). The Trustees, in turn, elect the officers of the Trust to actively supervise its day-to-day operations.
The following tables list the Trustees, their ages, position with the Trust, commencement of service, principal occupations during the past five years and any directorships of other investment companies or companies whose securities are registered under the Securities Exchange Act of 1934, as amended, or who file reports under that Act. Each Trustee oversees 42 portfolios in the Trust, nine portfolios in Victory Variable Insurance Funds, one portfolio in Victory Institutional Funds and 20 portfolios in Victory Portfolios II, each a registered investment company that, together with the Trust, comprise the Victory Fund Complex. Each Trustee's address is c/o Victory Portfolios, 4900 Tiedeman Road, 4th Floor, Brooklyn, Ohio 44144. Each Trustee has an indefinite term.
Name and Age | | Position
Held with
the Trust | | Date
Commenced
Service | | Principal Occupation
During Past 5 Years | | Other
Directorships
Held During
Past 5 Years | |
Independent Trustees. | |
David Brooks Adcock, 66 | | Trustee | | May 2005 | | Consultant (since 2006). | | Chair and Trustee, Turner Funds (December 2016-December 2017). | |
Nigel D. T. Andrews, 71 | | Vice Chair and Trustee | | August 2002 | | Retired. | | Director, TCG BDC II, Inc. (since 2017); Director, TCG BDC I, Inc. (formerly Carlyle GMS Finance, Inc.) (since 2012); Director, Old Mutual US Asset Management (2002-2014). | |
E. Lee Beard, 67* | | Trustee | | May 2005 | | Retired (since 2015); Consultant, The Henlee Group, LLC (consulting) (2005-2015). | | None. | |
Dennis M. Bushe, 74 | | Trustee | | July 2016 | | Retired. | | Trustee, RS Investment Trust and RS Variable Products Trust (November 2011-July 2016). | |
99
Victory Portfolios | | Supplemental Information — continued
June 30, 2018 | |
(Unaudited)
Name and Age | | Position
Held with
the Trust | | Date
Commenced
Service | | Principal Occupation
During Past 5 Years | | Other
Directorships
Held During
Past 5 Years | |
Sally M. Dungan, 64 | | Trustee | | February 2011 | | Chief Investment Officer, Tufts University (since 2002). | | None. | |
John L. Kelly, 65 | | Trustee | | February 2015 | | Partner, McCarvill Capital Partners (September 2016-September 2017); Advisor (January 2016-April 2016); and Managing Partner (August 2014-January 2016), Endgate Commodities LLC; Chief Operating Officer, Liquidnet Holdings, Inc. (2011-2014). | | Director, Caledonia Mining Corporation (since May 2012). | |
David L. Meyer, 61* | | Trustee | | December 2008 | | Retired. | | None. | |
Gloria S. Nelund, 57 | | Trustee | | July 2016 | | Chair, CEO and Co-Founder of TriLinc Global, LLC, an investment firm. | | TriLinc Global Impact Fund, LLC (since 2012); Trustee, RS Investment Trust and RS Variable Products Trust (November 2007-July 2016). | |
Leigh A. Wilson, 73 | | Chair and Trustee | | November 1994 | | Private Investor. | | Chair (since 2013), Caledonia Mining Corporation. | |
Interested Trustee. | |
David C. Brown, 46** | | Trustee | | May 2008 | | Chairman and Chief Executive Officer (since August 2013), Co-Chief Executive Officer (2011-2013), the Adviser; Chairman and Chief Executive Officer, Victory Capital Holdings, Inc. (since 2013). | | None. | |
* The Board has designated Mr. Meyer and Ms. Beard as its Audit Committee Financial Experts.
** Mr. Brown is an "Interested Person" by reason of his relationship with the Adviser.
The Statement of Additional Information includes additional information about the Trustees of the Trust and is available, without charge, by calling 800-539-3863.
100
Victory Portfolios | | Supplemental Information — continued
June 30, 2018 | |
(Unaudited)
Officers:
The officers of the Trust, their ages, commencement of service and their principal occupations during the past five years, are detailed in the following table. Each officer serves until the earlier of his or her resignation, removal, retirement, death, or the election of a successor. The mailing address of each officer of the Trust is 4900 Tiedeman Road, 4th Floor, Brooklyn, Ohio 44144. The officers of the Trust receive no compensation directly from the Trust for performing the duties of their offices.
Name and Age | | Position with
the Trust | | Date
Commenced
Service | | Principal Occupation During Past 5 Years | |
Christopher K. Dyer, 56 | | President | | February 2006* | | Director of Mutual Fund Administration, the Adviser. | |
Scott A. Stahorsky, 49 | | Vice President | | December 2014 | | Manager, Fund Administration, the Adviser (since 2015); Senior Analyst, Fund Administration, the Adviser (prior to 2015). | |
Erin G. Wagner, 44 | | Secretary | | December 2014 | | Associate General Counsel, the Adviser (since 2013). | |
Allan Shaer, 53 | | Treasurer | | May 2017 | | Senior Vice President, Financial Administration, Citi Fund Services Ohio, Inc. (since 2016); Vice President, Mutual Fund Administration, JP Morgan Chase (2011-2016). | |
Christopher A. Ponte, 34 | | Assistant Treasurer | | December 2017 | | Manager, Fund Administration, the Adviser (since 2017); Senior Analyst, Fund Administration, the Adviser (prior to 2017). Chief Financial Officer, Victory Capital Advisers, Inc. (since 2018). | |
Colin Kinney, 44 | | Chief Compliance Officer | | July 2017 | | Chief Compliance Officer (since 2013) and Chief Risk Officer (2009-2017), the Adviser. | |
Chuck Booth, 58 | | Anti-Money Laundering Compliance Officer and Identity Theft Officer | | May 2015 | | Director, Regulatory Administration and CCO Support Services, Citi Fund Services Ohio, Inc. | |
Jay G. Baris, 64 | | Assistant Secretary | | December 1997 | | Partner, Shearman & Sterling LLP (since 2018); Partner, Morrison & Foerster LLP (2011-2017). | |
* On December 3, 2014, Mr. Dyer resigned as Secretary of the Trust and accepted the position of President.
101
Victory Portfolios | | Supplemental Information — continued
June 30, 2018 | |
(Unaudited)
Proxy Voting and Form N-Q Information
Proxy Voting:
Information regarding the policies and procedures that the Funds use to determine how to vote proxies relating to portfolio securities is available without charge, upon request, by calling 800-539-3863. The information is also included in the Funds' Statement of Additional Information, which is available on the SEC's website at www.sec.gov.
Information relating to how the Funds voted proxies relating to portfolio securities held during the most recent twelve months ended June 30 is available on the SEC's website at www.sec.gov.
Availability of Schedules of Portfolio Investments:
The Trust files a complete list of Schedules of Portfolio Investments with the SEC for the first and third quarters of each fiscal year on Form N-Q. Forms N-Q are available on the SEC's website at www.sec.gov. You may also review or, for a fee, copy those documents by visiting the SEC's Public Reference Room in Washington, D.C. Information on the operation of the Public Reference Room can be obtained by calling the SEC at 202-551-8090.
Expense Examples
As a shareholder of the Funds, you may incur two types of costs: (1) transaction costs, including sales charges (loads) on purchases; and (2) ongoing costs, including management fees, distribution and service (12b-1) fees, and other Fund expenses. These examples are intended to help you understand your ongoing costs (in dollars) of investing in the Funds and to compare these costs with the ongoing costs of investing in other mutual funds.
These examples are based on an investment of $1,000 invested at the beginning of the period and held for the entire period from January 1, 2018 through June 30, 2018.
Actual Expenses:
The table below provides information about actual account values and actual expenses. You may use the information below, together with the amount you invested, to estimate the expenses that you paid over the period. Simply divide your account value by $1,000 (for example, an $8,600 account value divided by $1,000 = 8.6), then multiply the result by the number in the table under the heading entitled "Expenses Paid During Period" to estimate the expenses you paid on your account during this period.
| | | Beginning
Account Value
1/1/18 | | Ending
Account Value
6/30/18 | | Expenses Paid
During Period
1/1/18-6/30/18* | | Annualized Net
Expense Ratio
During Period
1/1/18-6/30/18 | |
INCORE Investment Quality Bond Fund | |
Class A Shares | | $ | 1,000.00 | | | $ | 983.60 | | | $ | 4.43 | | | | 0.90 | % | |
Class C Shares | | | 1,000.00 | | | | 979.40 | | | | 8.69 | | | | 1.77 | % | |
Class R Shares | | | 1,000.00 | | | | 981.70 | | | | 6.39 | | | | 1.30 | % | |
Class Y Shares | | | 1,000.00 | | | | 984.80 | | | | 3.25 | | | | 0.66 | % | |
INCORE Low Duration Bond Fund | |
Class A Shares | | | 1,000.00 | | | | 1,001.90 | | | | 4.22 | | | | 0.85 | % | |
Class C Shares | | | 1,000.00 | | | | 998.10 | | | | 8.03 | | | | 1.62 | % | |
Class R Shares | | | 1,000.00 | | | | 999.80 | | | | 6.30 | | | | 1.27 | % | |
Class Y Shares | | | 1,000.00 | | | | 1,003.00 | | | | 3.08 | | | | 0.62 | % | |
High Yield Fund | |
Class A Shares | | | 1,000.00 | | | | 1,016.20 | | | | 5.00 | | | | 1.00 | % | |
Class C Shares | | | 1,000.00 | | | | 1,014.20 | | | | 8.49 | | | | 1.70 | % | |
Class R Shares | | | 1,000.00 | | | | 1,014.50 | | | | 6.69 | | | | 1.34 | % | |
Class Y Shares | | | 1,000.00 | | | | 1,017.50 | | | | 3.80 | | | | 0.76 | % | |
* Expenses are equal to the average account value multiplied by the Fund's annualized expense ratio multiplied by 181/365 (the number of days in the most recent fiscal half-year divided by the number of days in the fiscal year).
102
Victory Portfolios | | Supplemental Information — continued
June 30, 2018 | |
(Unaudited)
| | | Beginning
Account Value
1/1/18 | | Ending
Account Value
6/30/18 | | Expenses Paid
During Period
1/1/18-6/30/18* | | Annualized Net
Expense Ratio
During Period
1/1/18-6/30/18 | |
Tax-Exempt Fund | |
Class A Shares | | $ | 1,000.00 | | | $ | 1,000.00 | | | $ | 3.97 | | | | 0.80 | % | |
Class C Shares | | | 1,000.00 | | | | 997.10 | | | | 7.92 | | | | 1.60 | % | |
Class Y Shares | | | 1,000.00 | | | | 1,001.60 | | | | 3.42 | | | | 0.69 | % | |
High Income Municipal Bond Fund | |
Class A Shares | | | 1,000.00 | | | | 1,002.40 | | | | 3.97 | | | | 0.80 | % | |
Class C Shares | | | 1,000.00 | | | | 998.60 | | | | 7.78 | | | | 1.57 | % | |
Class Y Shares | | | 1,000.00 | | | | 1,003.60 | | | | 2.83 | | | | 0.57 | % | |
Floating Rate Fund | |
Class A Shares | | | 1,000.00 | | | | 1,019.10 | | | | 5.01 | | | | 1.00 | % | |
Class C Shares | | | 1,000.00 | | | | 1,015.00 | | | | 8.99 | | | | 1.80 | % | |
Class R Shares | | | 1,000.00 | | | | 1,016.30 | | | | 7.80 | | | | 1.56 | % | |
Class Y Shares | | | 1,000.00 | | | | 1,020.20 | | | | 3.91 | | | | 0.78 | % | |
Strategic Income Fund | |
Class A Shares | | | 1,000.00 | | | | 987.10 | | | | 4.68 | | | | 0.95 | % | |
Class C Shares | | | 1,000.00 | | | | 983.30 | | | | 8.56 | | | | 1.74 | % | |
Class R Shares | | | 1,000.00 | | | | 985.30 | | | | 6.60 | | | | 1.34 | % | |
Class Y Shares | | | 1,000.00 | | | | 988.10 | | | | 3.65 | | | | 0.74 | % | |
* Expenses are equal to the average account value multiplied by the Fund's annualized expense ratio multiplied by 181/365 (the number of days in the most recent fiscal half-year divided by the number of days in the fiscal year).
103
Victory Portfolios | | Supplemental Information — continued
June 30, 2018 | |
(Unaudited)
Hypothetical Example for Comparison Purposes:
The table below provides information about hypothetical account values and hypothetical expenses based on each Fund's actual expense ratio and an assumed rate of return of 5% per year before expenses, which is not the Fund's actual return. The hypothetical account values and expenses may not be used to estimate the actual ending account balance or expenses you paid for the period. You may use this information to compare this 5% hypothetical example with the 5% hypothetical examples that appear in the shareholder reports of other funds.
Please note that the expenses shown in the table are meant to highlight your ongoing costs only and do not reflect any transactional costs. Therefore, the table is useful in comparing ongoing costs only, and will not help you determine the relative total costs of owning different funds. In addition, if these transactional costs were included, your costs would have been higher.
| | | Beginning
Account Value
1/1/18 | | Ending
Account Value
6/30/18 | | Expenses Paid
During Period
1/1/18-6/30/18* | | Annualized
Expense Ratio
During Period
1/1/18-6/30/18 | |
INCORE Investment Quality Bond Fund | |
Class A Shares | | $ | 1,000.00 | | | $ | 1,020.33 | | | $ | 4.51 | | | | 0.90 | % | |
Class C Shares | | | 1,000.00 | | | | 1,016.02 | | | | 8.85 | | | | 1.77 | % | |
Class R Shares | | | 1,000.00 | | | | 1,018.35 | | | | 6.51 | | | | 1.30 | % | |
Class Y Shares | | | 1,000.00 | | | | 1,021.52 | | | | 3.31 | | | | 0.66 | % | |
INCORE Low Duration Bond Fund | |
Class A Shares | | | 1,000.00 | | | | 1,020.58 | | | | 4.26 | | | | 0.85 | % | |
Class C Shares | | | 1,000.00 | | | | 1,016.76 | | | | 8.10 | | | | 1.62 | % | |
Class R Shares | | | 1,000.00 | | | | 1,018.50 | | | | 6.36 | | | | 1.27 | % | |
Class Y Shares | | | 1,000.00 | | | | 1,021.72 | | | | 3.11 | | | | 0.62 | % | |
High Yield Fund | |
Class A Shares | | | 1,000.00 | | | | 1,019.84 | | | | 5.01 | | | | 1.00 | % | |
Class C Shares | | | 1,000.00 | | | | 1,016.36 | | | | 8.50 | | | | 1.70 | % | |
Class R Shares | | | 1,000.00 | | | | 1,018.15 | | | | 6.71 | | | | 1.34 | % | |
Class Y Shares | | | 1,000.00 | | | | 1,021.03 | | | | 3.81 | | | | 0.76 | % | |
Tax-Exempt Fund | |
Class A Shares | | | 1,000.00 | | | | 1,020.83 | | | | 4.01 | | | | 0.80 | % | |
Class C Shares | | | 1,000.00 | | | | 1,016.86 | | | | 8.00 | | | | 1.60 | % | |
Class Y Shares | | | 1,000.00 | | | | 1,021.37 | | | | 3.46 | | | | 0.69 | % | |
High Income Municipal Bond Fund | |
Class A Shares | | | 1,000.00 | | | | 1,020.83 | | | | 4.01 | | | | 0.80 | % | |
Class C Shares | | | 1,000.00 | | | | 1,017.01 | | | | 7.85 | | | | 1.57 | % | |
Class Y Shares | | | 1,000.00 | | | | 1,021.97 | | | | 2.86 | | | | 0.57 | % | |
Floating Rate Fund | |
Class A Shares | | | 1,000.00 | | | | 1,019.84 | | | | 5.01 | | | | 1.00 | % | |
Class C Shares | | | 1,000.00 | | | | 1,015.87 | | | | 9.00 | | | | 1.80 | % | |
Class R Shares | | | 1,000.00 | | | | 1,017.06 | | | | 7.80 | | | | 1.56 | % | |
Class Y Shares | | | 1,000.00 | | | | 1,020.93 | | | | 3.91 | | | | 0.78 | % | |
Strategic Income Fund | |
Class A Shares | | | 1,000.00 | | | | 1,020.08 | | | | 4.76 | | | | 0.95 | % | |
Class C Shares | | | 1,000.00 | | | | 1,016.17 | | | | 8.70 | | | | 1.74 | % | |
Class R Shares | | | 1,000.00 | | | | 1,018.15 | | | | 6.71 | | | | 1.34 | % | |
Class Y Shares | | | 1,000.00 | | | | 1,021.12 | | | | 3.71 | | | | 0.74 | % | |
* Expenses are equal to the average account value multiplied by the Fund's annualized expense ratio multiplied by 181/365 (the number of days in the most recent fiscal half-year divided by the number of days in the fiscal year).
104
Victory Portfolios | | Supplemental Information — continued
June 30, 2018 | |
(Unaudited)
Portfolio Holdings:
(As a Percentage of Total Investments)
Investment Quality Bond Fund | | Low Duration Bond Fund | |

| | 
| |
High Yield Fund | | Tax-Exempt Fund | |
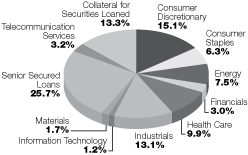
| | 
| |
High Income Municipal Bond Fund | | Floating Rate Fund | |

| | 
| |
105
Victory Portfolios | | Supplemental Information — continued
June 30, 2018 | |
(Unaudited)
Strategic Income Fund | | | |
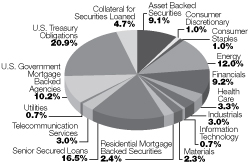
| | | |
106
Privacy Policy
Protecting the Privacy of Information
The Trust respects your right to privacy. We also know that you expect us to conduct and process your business in an accurate and efficient manner. To do so, we must collect and maintain certain personal information about you. This is the information we collect from you on applications or other forms, and from the transactions you make with us or third parties. It may include your name, address, social security number, account transactions and balances, and information about investment goals and risk tolerance.
We do not disclose any information about you or about former customers to anyone except as permitted or required by law. Specifically, we may disclose the information we collect to companies that perform services on our behalf, such as the transfer agent that processes shareholder accounts and printers and mailers that assist us in the distribution of investor materials. We may also disclose this information to companies that perform marketing services on our behalf. This allows us to continue to offer you Victory investment products and services that meet your investing needs, and to effect transactions that you request or authorize. These companies will use this information only in connection with the services for which we hired them. They are not permitted to use or share this information for any other purpose.
To protect your personal information internally, we permit access only by authorized employees and maintain physical, electronic and procedural safeguards to guard your personal information.*
*You may have received communications regarding information about privacy policies from other financial institutions which gave you the opportunity to "opt-out" of certain information sharing with companies which are not affiliated with that financial institution. The Trust does not share information with other companies for purposes of marketing solicitations for products other than the Trust. Therefore, the Trust does not provide opt-out options to their shareholders.
Victory Funds
P.O. Box 182593
Columbus, Ohio 43218-2593

Visit our website at: | | Call Victory at: | |
www.vcm.com | | 800-539-FUND (800-539-3863) | |

June 30, 2018
Semi Annual Report
Victory RS Small Cap Growth Fund
Victory RS Select Growth Fund
Victory RS Mid Cap Growth Fund
Victory RS Growth Fund
Victory RS Science and Technology Fund
Victory RS Small Cap Equity Fund
www.vcm.com
News, Information And Education 24 Hours A Day, 7 Days A Week
The Victory Funds site gives fund shareholders, prospective shareholders, and investment professionals a convenient way to access fund information, get guidance, and track fund performance anywhere they can access the Internet. The site includes:
• Detailed performance records
• Daily share prices
• The latest fund news
• Investment resources to help you become a better investor
• A section dedicated to investment professionals
Whether you're a potential investor searching for the fund that matches your investment philosophy, a seasoned investor interested in planning tools, or an investment professional, www.vcm.com has what you seek. Visit us anytime. We're always open.
Victory Portfolios
Table of Contents
Financial Statements | |
The Victory Growth Funds | |
Victory RS Small Cap Growth Fund | |
Schedule of Portfolio Investments | | | 3 | | |
Statements of Assets and Liabilities | | | 22 | | |
Statements of Operations | | | 24 | | |
Statements of Changes in Net Assets | | | 26-28 | | |
Financial Highlights | | | 32-36 | | |
Victory RS Select Growth Fund | |
Schedule of Portfolio Investments | | | 7 | | |
Statements of Assets and Liabilities | | | 22 | | |
Statements of Operations | | | 24 | | |
Statements of Changes in Net Assets | | | 26-28 | | |
Financial Highlights | | | 37-41 | | |
Victory RS Mid Cap Growth Fund | |
Schedule of Portfolio Investments | | | 10 | | |
Statements of Assets and Liabilities | | | 22 | | |
Statements of Operations | | | 24 | | |
Statements of Changes in Net Assets | | | 26-28 | | |
Financial Highlights | | | 42-46 | | |
Victory RS Growth Fund | |
Schedule of Portfolio Investments | | | 13 | | |
Statements of Assets and Liabilities | | | 23 | | |
Statements of Operations | | | 25 | | |
Statements of Changes in Net Assets | | | 29-31 | | |
Financial Highlights | | | 47-50 | | |
Victory RS Science and Technology Fund | |
Schedule of Portfolio Investments | | | 15 | | |
Statements of Assets and Liabilities | | | 23 | | |
Statements of Operations | | | 25 | | |
Statements of Changes in Net Assets | | | 29-31 | | |
Financial Highlights | | | 51-54 | | |
Victory RS Small Cap Equity Fund | |
Schedule of Portfolio Investments | | | 19 | | |
Statements of Assets and Liabilities | | | 23 | | |
Statements of Operations | | | 25 | | |
Statements of Changes in Net Assets | | | 29-31 | | |
Financial Highlights | | | 55-58 | | |
Notes to Financial Statements | | | 59 | | |
Supplemental Information | | | 71 | | |
Trustee and Officer Information | | | 71 | | |
Proxy Voting and Form N-Q Information | | | 75 | | |
Expense Examples | | | 75 | | |
Portfolio Holdings | | | 78 | | |
Privacy Policy (inside back cover) | |
1
The Funds are distributed by Victory Capital Advisers, Inc. Victory Capital Management Inc. is the investment adviser to the Funds and receives fees from the Funds for performing services for the Funds.
This report is not authorized for distribution to prospective investors unless preceded or accompanied by a current prospectus of the Victory Funds.
For additional information about any Victory Fund, including fees, expenses, and risks, view our prospectus online at www.vcm.com or call 800-539-3863. Read it carefully before you invest or send money.
The information in this semi annual report is based on data obtained from recognized services and sources and is believed to be reliable. Any opinions, projections, or recommendations in this report are subject to change without notice and are not intended as individual investment advice. Past investment performance of the Funds, markets or securities mentioned herein should not be considered to be indicative of future results.
• NOT FDIC INSURED • NO BANK GUARANTEE • MAY LOSE VALUE

Call Victory at:
800-539-FUND (800-539-3863)
Visit our website at:
www.vcm.com
2
Victory Portfolios
Victory RS Small Cap Growth Fund | | Schedule of Portfolio Investments
June 30, 2018 | |
(Unaudited)
Security Description | | Shares | | Value | |
Common Stocks (98.3%) | |
Biotechnology (15.7%): | |
Aimmune Therapeutics, Inc. (a) (b) | | | 349,710 | | | $ | 9,403,702 | | |
Amicus Therapeutics, Inc. (a) (b) | | | 1,836,215 | | | | 28,681,678 | | |
Apellis Pharmaceuticals, Inc. (a) (b) | | | 382,270 | | | | 8,409,940 | | |
Aptinyx, Inc. (a) | | | 363,440 | | | | 8,784,345 | | |
Audentes Therapeutics, Inc. (a) (b) | | | 362,377 | | | | 13,846,425 | | |
Bluebird Bio, Inc. (a) | | | 140,509 | | | | 22,052,888 | | |
Blueprint Medicines Corp. (a) (b) | | | 227,298 | | | | 14,428,877 | | |
Celyad SA, ADR (a) (b) | | | 297,571 | | | | 9,221,725 | | |
Exact Sciences Corp. (a) | | | 412,040 | | | | 24,635,872 | | |
Five Prime Therapeutics, Inc. (a) (b) | | | 563,832 | | | | 8,914,184 | | |
Immunomedics, Inc. (a) (b) | | | 1,116,220 | | | | 26,420,927 | | |
Iovance Biotherapeutics, Inc. (a) (b) | | | 1,241,765 | | | | 15,894,592 | | |
Kura Oncology, Inc. (a) | | | 746,700 | | | | 13,589,940 | | |
Ligand Pharmaceuticals, Inc., Class B (a) (b) | | | 132,765 | | | | 27,504,925 | | |
Loxo Oncology, Inc. (a) (b) | | | 176,833 | | | | 30,676,988 | | |
Madrigal Pharmaceuticals, Inc. (a) (b) | | | 85,660 | | | | 23,958,245 | | |
Sage Therapeutics, Inc. (a) (b) | | | 143,750 | | | | 22,501,188 | | |
Vital Therapies, Inc. (a) (b) | | | 1,730,793 | | | | 11,855,932 | | |
| | | | 320,782,373 | | |
Communications Equipment (0.9%): | |
Lumentum Holdings, Inc. (a) (b) | | | 330,814 | | | | 19,154,131 | | |
Consumer Discretionary (17.5%): | |
At Home Group, Inc. (a) (b) | | | 646,960 | | | | 25,328,484 | | |
Burlington Stores, Inc. (a) | | | 67,318 | | | | 10,133,379 | | |
Delphi Technologies PLC | | | 430,060 | | | | 19,550,528 | | |
Dineequity, Inc. (b) | | | 366,170 | | | | 27,389,516 | | |
Eldorado Resorts, Inc. (a) (b) | | | 482,480 | | | | 18,864,968 | | |
Grand Canyon Education, Inc. (a) | | | 276,244 | | | | 30,831,593 | | |
Lithia Motors, Inc. | | | 197,669 | | | | 18,693,557 | | |
Monro Muffler Brake, Inc. (b) | | | 294,990 | | | | 17,138,919 | | |
Ollie's Bargain Outlet Holdings, Inc. (a) (b) | | | 247,006 | | | | 17,907,935 | | |
Planet Fitness, Inc., Class A (a) (b) | | | 787,950 | | | | 34,622,522 | | |
Red Rock Resorts, Inc., Class A | | | 500,700 | | | | 16,773,450 | | |
Steven Madden Ltd. | | | 521,555 | | | | 27,694,571 | | |
The Wendy's Co. (b) | | | 1,585,400 | | | | 27,237,172 | | |
Topbuild Corp. (a) | | | 245,690 | | | | 19,247,355 | | |
Weight Watchers International, Inc. (a) (b) | | | 304,840 | | | | 30,819,324 | | |
Wingstop, Inc. (b) | | | 299,790 | | | | 15,625,055 | | |
| | | | 357,858,328 | | |
Consumer Staples (2.3%): | |
Nomad Foods Ltd. (a) (b) | | | 2,501,230 | | | | 47,998,603 | | |
Electronic Equipment, Instruments & Components (1.1%): | |
Littelfuse, Inc. | | | 98,656 | | | | 22,511,326 | | |
See notes to financial statements.
3
Victory Portfolios
Victory RS Small Cap Growth Fund | | Schedule of Portfolio Investments — continued
June 30, 2018 | |
(Unaudited)
Security Description | | Shares | | Value | |
Energy (1.5%): | |
Newpark Resources, Inc. (a) (b) | | | 2,031,200 | | | $ | 22,038,520 | | |
SRC Energy, Inc. (a) (b) | | | 773,660 | | | | 8,525,733 | | |
| | | | 30,564,253 | | |
Financials (4.8%): | |
LendingTree, Inc. (a) (b) | | | 60,187 | | | | 12,867,981 | | |
Primerica, Inc. (b) | | | 146,499 | | | | 14,591,300 | | |
Texas Capital Bancshares, Inc. (a) | | | 254,090 | | | | 23,249,235 | | |
Walker & Dunlop, Inc. | | | 255,325 | | | | 14,208,836 | | |
Western Alliance BanCorp (a) | | | 353,755 | | | | 20,026,071 | | |
WisdomTree Investments, Inc. (b) | | | 1,470,020 | | | | 13,347,782 | | |
| | | | 98,291,205 | | |
Health Care Equipment & Supplies (5.1%): | |
Globus Medical, Inc., Class A (a) | | | 520,940 | | | | 26,286,632 | | |
Insulet Corp. (a) (b) | | | 273,870 | | | | 23,470,659 | | |
Irhythm Technologies, Inc. (a) (b) | | | 137,810 | | | | 11,180,525 | | |
Masimo Corp. (a) | | | 246,440 | | | | 24,064,866 | | |
Penumbra, Inc. (a) | | | 145,510 | | | | 20,102,207 | | |
| | | | 105,104,889 | | |
Health Care Providers & Services (3.0%): | |
Diplomat Pharmacy, Inc. (a) (b) | | | 732,780 | | | | 18,729,857 | | |
HealthEquity, Inc. (a) (b) | | | 233,740 | | | | 17,553,874 | | |
Teladoc, Inc. (a) (b) | | | 429,707 | | | | 24,944,491 | | |
| | | | 61,228,222 | | |
Industrials (13.8%): | |
Altra Industrial Motion Corp. (b) | | | 584,020 | | | | 25,171,262 | | |
Azul SA, ADR (a) (b) | | | 967,300 | | | | 15,825,028 | | |
Beacon Roofing Supply, Inc. (a) (b) | | | 419,140 | | | | 17,863,747 | | |
H&E Equipment Services, Inc. | | | 762,240 | | | | 28,667,847 | | |
Harsco Corp. (a) | | | 1,262,720 | | | | 27,906,112 | | |
Hexcel Corp. (b) | | | 184,024 | | | | 12,215,513 | | |
Kennametal, Inc. (b) | | | 774,400 | | | | 27,800,960 | | |
Proto Labs, Inc. (a) (b) | | | 125,610 | | | | 14,941,310 | | |
Saia, Inc. (a) | | | 335,950 | | | | 27,161,558 | | |
Simpson Manufacturing Co., Inc. | | | 322,220 | | | | 20,038,862 | | |
Siteone Landscape Supply, Inc. (a) (b) | | | 331,420 | | | | 27,829,337 | | |
The Brink's Co. | | | 133,820 | | | | 10,672,145 | | |
Welbilt, Inc. (a) (b) | | | 1,240,436 | | | | 27,674,127 | | |
| | | | 283,767,808 | | |
Internet Software & Services (8.3%): | |
Cornerstone OnDemand, Inc. (a) (b) | | | 438,028 | | | | 20,775,668 | | |
Coupa Software, Inc. (a) | | | 345,390 | | | | 21,497,074 | | |
Envestnet, Inc. (a) | | | 277,956 | | | | 15,273,682 | | |
LogMeIn, Inc. | | | 268,965 | | | | 27,770,636 | | |
Mindbody, Inc. (a) (b) | | | 801,010 | | | | 30,918,986 | | |
See notes to financial statements.
4
Victory Portfolios
Victory RS Small Cap Growth Fund | | Schedule of Portfolio Investments — continued
June 30, 2018 | |
(Unaudited)
Security Description | | Shares | | Value | |
Q2 Holdings, Inc. (a) | | | 284,330 | | | $ | 16,221,027 | | |
Wix.com Ltd. (a) (b) | | | 352,600 | | | | 35,365,780 | | |
| | | | 167,822,853 | | |
IT Services (7.1%): | |
Black Knight, Inc. (a) | | | 703,777 | | | | 37,687,258 | | |
Euronet Worldwide, Inc. (a) (b) | | | 373,726 | | | | 31,307,027 | | |
InterXion Holding NV (a) | | | 470,783 | | | | 29,386,275 | | |
WEX, Inc. (a) | | | 101,950 | | | | 19,419,436 | | |
WNS Holdings Ltd., ADR (a) | | | 567,087 | | | | 29,590,600 | | |
| | | | 147,390,596 | | |
Materials (4.0%): | |
Allegheny Technologies, Inc. (a) | | | 1,090,920 | | | | 27,403,910 | | |
Ashland Global Holdings, Inc. | | | 331,450 | | | | 25,912,761 | | |
Ferro Corp. (a) (b) | | | 1,420,078 | | | | 29,608,626 | | |
| | | | 82,925,297 | | |
Pharmaceuticals (1.3%): | |
GW Pharmaceuticals PLC, ADR (a) (b) | | | 159,937 | | | | 22,317,609 | | |
Sienna Biopharmaceuticals, Inc. (a) (b) | | | 300,660 | | | | 4,567,025 | | |
| | | | 26,884,634 | | |
Semiconductors & Semiconductor Equipment (5.6%): | |
Advanced Energy Industries, Inc. (a) | | | 157,080 | | | | 9,124,777 | | |
Cypress Semiconductor Corp. (b) | | | 903,740 | | | | 14,080,269 | | |
Integrated Device Technology, Inc. (a) (b) | | | 615,940 | | | | 19,636,167 | | |
MKS Instruments, Inc. | | | 207,440 | | | | 19,852,009 | | |
Monolithic Power Systems, Inc. | | | 135,421 | | | | 18,101,725 | | |
Tower Semiconductor Ltd. (a) (b) | | | 679,618 | | | | 14,958,392 | | |
Versum Materials, Inc. | | | 504,909 | | | | 18,757,369 | | |
| | | | 114,510,708 | | |
Software (6.3%): | |
Fair Isaac Corp. (a) | | | 116,910 | | | | 22,601,041 | | |
HubSpot, Inc. (a) (b) | | | 149,430 | | | | 18,738,522 | | |
Proofpoint, Inc. (a) (b) | | | 240,747 | | | | 27,760,537 | | |
RingCentral, Inc., Class A (a) | | | 859,598 | | | | 60,472,719 | | |
| | | | 129,572,819 | | |
Total Common Stocks (Cost $1,439,590,282) | | | 2,016,368,045 | | |
Collateral for Securities Loaned (17.5%) | |
BlackRock Liquidity Funds TempFund Portfolio, Institutional Class,
2.06% (c) | | | 47,342,693 | | | | 47,342,693 | | |
Fidelity Investments Prime Money Market Portfolio, Class I, 2.07% (c) | | | 43,040,368 | | | | 43,040,368 | | |
Fidelity Investments Money Market Government Portfolio, Class I,
1.81% (c) | | | 97,332,227 | | | | 97,332,227 | | |
Goldman Sachs Financial Square Prime Obligations Fund, Institutional
Class, 2.16% (c) | | | 21,517,646 | | | | 21,517,646 | | |
See notes to financial statements.
5
Victory Portfolios
Victory RS Small Cap Growth Fund | | Schedule of Portfolio Investments — continued
June 30, 2018 | |
(Unaudited)
Security Description | | Shares | | Value | |
JPMorgan Prime Money Market Fund, Capital Class, 2.05% (c) | | | 111,888,662 | | | $ | 111,888,662 | | |
Morgan Stanley Institutional Liquidity Prime Portfolio, Institutional Class,
2.12% (c) | | | 38,731,763 | | | | 38,731,763 | | |
Total Collateral for Securities Loaned (Cost $359,853,359) | | | 359,853,359 | | |
Total Investments (Cost $1,799,443,641) — 115.8% | | | 2,376,221,404 | | |
Liabilities in excess of other assets — (15.8)% | | | (324,292,075 | ) | |
NET ASSETS — 100.00% | | $ | 2,051,929,329 | | |
(a) Non-income producing security.
(b) All or a portion of this security is on loan.
(c) Rate disclosed is the daily yield on June 30, 2018.
ADR — American Depositary Receipt
PLC — Public Limited Company
See notes to financial statements.
6
Victory Portfolios
Victory RS Select Growth Fund | | Schedule of Portfolio Investments
June 30, 2018 | |
(Unaudited)
Security Description | | Shares | | Value | |
Common Stocks (98.0%) | |
Communications Equipment (2.9%): | |
Lumentum Holdings, Inc. (a) (b) | | | 91,150 | | | $ | 5,277,585 | | |
Viavi Solutions, Inc. (a) (b) | | | 580,060 | | | | 5,939,814 | | |
| | | | 11,217,399 | | |
Consumer Discretionary (17.2%): | |
At Home Group, Inc. (a) (b) | | | 164,890 | | | | 6,455,443 | | |
Bright Horizons Family Solutions, Inc. (a) | | | 52,750 | | | | 5,407,930 | | |
Brunswick Corp. | | | 80,560 | | | | 5,194,509 | | |
Five Below, Inc. (a) | | | 37,750 | | | | 3,688,553 | | |
Hilton Grand Vacations, Inc. (a) | | | 186,880 | | | | 6,484,736 | | |
International Game Technology PLC (b) | | | 228,660 | | | | 5,314,058 | | |
Lululemon athletica, Inc. (a) | | | 36,448 | | | | 4,550,533 | | |
Six Flags Entertainment Corp. (b) | | | 84,840 | | | | 5,943,042 | | |
The Wendy's Co. | | | 434,220 | | | | 7,459,900 | | |
Vail Resorts, Inc. | | | 44,090 | | | | 12,089,037 | | |
Wingstop, Inc. (b) | | | 72,520 | | | | 3,779,742 | | |
| | | | 66,367,483 | | |
Consumer Staples (0.6%): | |
The Simply Good Foods Co. (a) | | | 172,000 | | | | 2,483,680 | | |
Electronic Equipment, Instruments & Components (4.5%): | |
II-VI, Inc. (a) (b) | | | 110,030 | | | | 4,780,804 | | |
Littelfuse, Inc. | | | 34,571 | | | | 7,888,410 | | |
Trimble Navigation Ltd. (a) | | | 142,490 | | | | 4,679,372 | | |
| | | | 17,348,586 | | |
Energy (1.5%): | |
Diamondback Energy, Inc. | | | 44,616 | | | | 5,870,127 | | |
Financials (4.6%): | |
East West Bancorp, Inc. | | | 99,680 | | | | 6,499,136 | | |
LendingTree, Inc. (a) (b) | | | 17,127 | | | | 3,661,753 | | |
Western Alliance BanCorp (a) | | | 130,170 | | | | 7,368,924 | | |
| | | | 17,529,813 | | |
Health Care (18.3%): | |
athenahealth, Inc. (a) (b) | | | 23,940 | | | | 3,809,812 | | |
Dexcom, Inc. (a) (b) | | | 51,500 | | | | 4,891,470 | | |
Eagle Pharmaceuticals, Inc. (a) (b) | | | 169,310 | | | | 12,809,995 | | |
Globus Medical, Inc., Class A (a) | | | 110,910 | | | | 5,596,519 | | |
HealthEquity, Inc. (a) | | | 73,080 | | | | 5,488,308 | | |
Ligand Pharmaceuticals, Inc., Class B (a) (b) | | | 80,520 | | | | 16,681,327 | | |
The Cooper Co., Inc. (b) | | | 18,560 | | | | 4,369,952 | | |
Veeva Systems, Inc. (a) | | | 70,670 | | | | 5,431,696 | | |
West Pharmaceutical Services, Inc. (b) | | | 114,066 | | | | 11,325,613 | | |
| | | | 70,404,692 | | |
Industrials (17.5%): | |
Azul SA, ADR (a) (b) | | | 277,030 | | | | 4,532,211 | | |
Gardner Denver Holdings, Inc. (a) | | | 158,580 | | | | 4,660,666 | | |
See notes to financial statements.
7
Victory Portfolios
Victory RS Select Growth Fund | | Schedule of Portfolio Investments — continued
June 30, 2018 | |
(Unaudited)
Security Description | | Shares | | Value | |
HEICO Corp., Class A | | | 85,954 | | | $ | 5,238,881 | | |
Herc Holdings, Inc. (a) | | | 104,630 | | | | 5,894,854 | | |
Hexcel Corp. | | | 95,052 | | | | 6,309,552 | | |
Kennametal, Inc. | | | 184,230 | | | | 6,613,857 | | |
Knight-Swift Transportation Holdings, Inc. (b) | | | 140,410 | | | | 5,365,066 | | |
Siteone Landscape Supply, Inc. (a) (b) | | | 80,600 | | | | 6,767,982 | | |
Teledyne Technologies, Inc. (a) | | | 30,790 | | | | 6,129,057 | | |
TransUnion | | | 66,660 | | | | 4,775,522 | | |
Trex Co., Inc. (a) | | | 92,640 | | | | 5,798,338 | | |
XPO Logistics, Inc. (a) | | | 52,090 | | | | 5,218,376 | | |
| | | | 67,304,362 | | |
Internet Software & Services (6.9%): | |
GoDaddy, Inc., Class A (a) | | | 104,477 | | | | 7,376,076 | | |
InterActive Corp. (a) | | | 39,960 | | | | 6,093,500 | | |
LogMeIn, Inc. | | | 84,620 | | | | 8,737,016 | | |
Yelp, Inc. (a) | | | 106,550 | | | | 4,174,629 | | |
| | | | 26,381,221 | | |
IT Services (9.2%): | |
Black Knight, Inc. (a) | | | 226,919 | | | | 12,151,513 | | |
Euronet Worldwide, Inc. (a) (b) | | | 116,442 | | | | 9,754,346 | | |
InterXion Holding NV (a) | | | 106,230 | | | | 6,630,877 | | |
WEX, Inc. (a) | | | 35,700 | | | | 6,800,136 | | |
| | | | 35,336,872 | | |
Materials (5.4%): | |
Ashland Global Holdings, Inc. (b) | | | 100,990 | | | | 7,895,398 | | |
KMG Chemicals, Inc. | | | 104,370 | | | | 7,700,419 | | |
The Chemours Co. | | | 115,730 | | | | 5,133,783 | | |
| | | | 20,729,600 | | |
Semiconductors & Semiconductor Equipment (3.1%): | |
Cypress Semiconductor Corp. (b) | | | 318,670 | | | | 4,964,879 | | |
Monolithic Power Systems, Inc. | | | 52,905 | | | | 7,071,811 | | |
| | | | 12,036,690 | | |
Software (4.9%): | |
Paycom Software, Inc. (a) (b) | | | 43,235 | | | | 4,272,915 | | |
Take-Two Interactive Software, Inc. (a) | | | 62,790 | | | | 7,431,825 | | |
The Ultimate Software Group, Inc. (a) | | | 27,824 | | | | 7,159,393 | | |
| | | | 18,864,133 | | |
Telecommunication Services (1.4%): | |
Boingo Wireless, Inc. (a) (b) | | | 238,170 | | | | 5,380,260 | | |
Total Common Stocks (Cost $265,140,699) | | | 377,254,918 | | |
Collateral for Securities Loaned (11.9%) | |
BlackRock Liquidity Funds TempFund Portfolio, Institutional Class, 2.06% (c) | | | 6,037,938 | | | | 6,037,938 | | |
Fidelity Investments Prime Money Market Portfolio, Class I, 2.07% (c) | | | 5,489,234 | | | | 5,489,234 | | |
Fidelity Investments Money Market Government Portfolio, Class I, 1.81% (c) | | | 12,413,446 | | | | 12,413,446 | | |
See notes to financial statements.
8
Victory Portfolios
Victory RS Select Growth Fund | | Schedule of Portfolio Investments — continued
June 30, 2018 | |
(Unaudited)
Security Description | | Shares | | Value | |
Goldman Sachs Financial Square Prime Obligations Fund, Institutional Class,
2.16% (c) | | | 2,744,293 | | | $ | 2,744,293 | | |
JPMorgan Prime Money Market Fund, Capital Class, 2.05% (c) | | | 14,269,929 | | | | 14,269,929 | | |
Morgan Stanley Institutional Liquidity Prime Portfolio, Institutional Class,
2.12% (c) | | | 4,939,728 | | | | 4,939,728 | | |
Total Collateral for Securities Loaned (Cost $45,894,568) | | | 45,894,568 | | |
Total Investments (Cost $311,035,267) — 109.9% | | | 423,149,486 | | |
Liabilities in excess of other assets — (9.9)% | | | (38,270,200 | ) | |
NET ASSETS — 100.00% | | $ | 384,879,286 | | |
(a) Non-income producing security.
(b) All or a portion of this security is on loan.
(c) Rate disclosed is the daily yield on June 30, 2018.
ADR — American Depositary Receipt
PLC — Public Limited Company
See notes to financial statements.
9
Victory Portfolios
Victory RS Mid Cap Growth Fund | | Schedule of Portfolio Investments
June 30, 2018 | |
(Unaudited)
Security Description | | Shares | | Value | |
Common Stocks (98.1%) | |
Consumer Discretionary (19.8%): | |
Brunswick Corp. | | | 55,520 | | | $ | 3,579,930 | | |
Burlington Stores, Inc. (a) | | | 28,510 | | | | 4,291,610 | | |
Dollar Tree, Inc. (a) | | | 35,280 | | | | 2,998,800 | | |
Ferrari NV (b) | | | 34,620 | | | | 4,674,046 | | |
Hilton Worldwide Holdings, Inc. | | | 75,210 | | | | 5,953,624 | | |
Norwegian Cruise Line Holdings Ltd. (a) (b) | | | 82,380 | | | | 3,892,455 | | |
Six Flags Entertainment Corp. (b) | | | 69,180 | | | | 4,846,059 | | |
The Wendy's Co. (b) | | | 353,520 | | | | 6,073,473 | | |
Tiffany & Co. | | | 51,450 | | | | 6,770,821 | | |
Topbuild Corp. (a) | | | 51,830 | | | | 4,060,362 | | |
Ulta Salon, Cosmetics & Fragrance, Inc. (a) | | | 14,540 | | | | 3,394,508 | | |
Under Armour, Inc., Class C (a) | | | 58,070 | | | | 1,224,116 | | |
Vail Resorts, Inc. | | | 29,080 | | | | 7,973,444 | | |
Yum China Holdings, Inc. | | | 60,010 | | | | 2,307,985 | | |
| | | | 62,041,233 | | |
Electronic Equipment, Instruments & Components (2.2%): | |
TE Connectivity Ltd. | | | 38,990 | | | | 3,511,439 | | |
Trimble Navigation Ltd. (a) | | | 107,200 | | | | 3,520,448 | | |
| | | | 7,031,887 | | |
Energy (2.3%): | |
Concho Resources, Inc. (a) (b) | | | 20,435 | | | | 2,827,182 | | |
Diamondback Energy, Inc. | | | 32,380 | | | | 4,260,237 | | |
| | | | 7,087,419 | | |
Financials (8.2%): | |
East West Bancorp, Inc. (b) | | | 58,360 | | | | 3,805,072 | | |
Kemper Corp. (b) | | | 39,000 | | | | 2,950,350 | | |
LendingTree, Inc. (a) (b) | | | 14,010 | | | | 2,995,338 | | |
MSCI, Inc. | | | 19,450 | | | | 3,217,614 | | |
SVB Financial Group (a) | | | 9,850 | | | | 2,844,286 | | |
The Progressive Corp. | | | 91,980 | | | | 5,440,617 | | |
Western Alliance BanCorp (a) | | | 73,870 | | | | 4,181,781 | | |
| | | | 25,435,058 | | |
Health Care (15.9%): | |
Align Technology, Inc. (a) | | | 17,420 | | | | 5,960,078 | | |
BeiGene Ltd., ADR (a) (b) | | | 13,940 | | | | 2,142,996 | | |
Bluebird Bio, Inc. (a) | | | 23,410 | | | | 3,674,200 | | |
Dexcom, Inc. (a) (b) | | | 35,060 | | | | 3,329,999 | | |
Edwards Lifesciences Corp. (a) | | | 25,160 | | | | 3,662,541 | | |
Exact Sciences Corp. (a) | | | 57,820 | | | | 3,457,058 | | |
Illumina, Inc. (a) | | | 24,950 | | | | 6,968,286 | | |
Intuitive Surgical, Inc. (a) | | | 8,040 | | | | 3,846,979 | | |
Neurocrine Biosciences, Inc. (a) | | | 37,680 | | | | 3,701,683 | | |
Sage Therapeutics, Inc. (a) | | | 20,370 | | | | 3,188,516 | | |
See notes to financial statements.
10
Victory Portfolios
Victory RS Mid Cap Growth Fund | | Schedule of Portfolio Investments — continued
June 30, 2018 | |
(Unaudited)
Security Description | | Shares | | Value | |
The Cooper Co., Inc. | | | 15,510 | | | $ | 3,651,830 | | |
WellCare Health Plans, Inc. (a) | | | 24,520 | | | | 6,037,805 | | |
| | | | 49,621,971 | | |
Industrials (12.1%): | |
BWX Technologies, Inc. | | | 26,700 | | | | 1,663,944 | | |
Gardner Denver Holdings, Inc. (a) | | | 129,730 | | | | 3,812,765 | | |
Hexcel Corp. | | | 76,750 | | | | 5,094,665 | | |
Knight-Swift Transportation Holdings, Inc. | | | 114,540 | | | | 4,376,573 | | |
Parker-Hannifin Corp. | | | 22,260 | | | | 3,469,221 | | |
Roper Technologies, Inc. | | | 13,460 | | | | 3,713,749 | | |
Teledyne Technologies, Inc. (a) | | | 22,510 | | | | 4,480,841 | | |
TransUnion | | | 54,120 | | | | 3,877,157 | | |
United Rentals, Inc. (a) | | | 20,280 | | | | 2,993,734 | | |
XPO Logistics, Inc. (a) | | | 42,770 | | | | 4,284,699 | | |
| | | | 37,767,348 | | |
Internet Software & Services (7.1%): | |
Dropbox, Inc. (a) | | | 58,840 | | | | 1,907,593 | | |
GoDaddy, Inc., Class A (a) | | | 48,150 | | | | 3,399,390 | | |
InterActive Corp. (a) | | | 25,440 | | | | 3,879,345 | | |
LogMeIn, Inc. | | | 34,550 | | | | 3,567,287 | | |
Wix.com Ltd. (a) | | | 64,830 | | | | 6,502,449 | | |
Yelp, Inc. (a) | | | 74,590 | | | | 2,922,436 | | |
| | | | 22,178,500 | | |
IT Services (9.8%): | |
Black Knight, Inc. (a) | | | 184,144 | | | | 9,860,910 | | |
Euronet Worldwide, Inc. (a) (b) | | | 87,671 | | | | 7,344,199 | | |
Global Payments, Inc. | | | 33,740 | | | | 3,761,673 | | |
Square, Inc., Class A (a) (b) | | | 27,770 | | | | 1,711,743 | | |
WEX, Inc. (a) | | | 20,550 | | | | 3,914,364 | | |
Worldpay, Inc. (a) | | | 48,210 | | | | 3,942,614 | | |
| | | | 30,535,503 | | |
Materials (5.7%): | |
Allegheny Technologies, Inc. (a) (b) | | | 193,950 | | | | 4,872,024 | | |
Celanese Corp., Series A | | | 45,590 | | | | 5,063,225 | | |
Steel Dynamics, Inc. | | | 91,820 | | | | 4,219,129 | | |
The Chemours Co. | | | 83,130 | | | | 3,687,647 | | |
| | | | 17,842,025 | | |
Semiconductors & Semiconductor Equipment (7.8%): | |
Lam Research Corp. | | | 21,180 | | | | 3,660,963 | | |
Marvell Technology Group Ltd. (b) | | | 432,100 | | | | 9,264,224 | | |
Maxim Integrated Products, Inc. | | | 92,170 | | | | 5,406,692 | | |
Microchip Technology, Inc. (b) | | | 63,950 | | | | 5,816,253 | | |
| | | | 24,148,132 | | |
Software (7.2%): | |
Activision Blizzard, Inc. | | | 35,950 | | | | 2,743,704 | | |
Red Hat, Inc. (a) | | | 28,260 | | | | 3,797,296 | | |
See notes to financial statements.
11
Victory Portfolios
Victory RS Mid Cap Growth Fund | | Schedule of Portfolio Investments — continued
June 30, 2018 | |
(Unaudited)
Security Description | | Shares | | Value | |
ServiceNow, Inc. (a) (b) | | | 27,700 | | | $ | 4,777,419 | | |
Take-Two Interactive Software, Inc. (a) (b) | | | 47,080 | | | | 5,572,388 | | |
The Ultimate Software Group, Inc. (a) | | | 21,070 | | | | 5,421,522 | | |
| | | | 22,312,329 | | |
Total Common Stocks (Cost $257,433,421) | | | 306,001,405 | | |
Collateral for Securities Loaned (9.0%) | |
BlackRock Liquidity Funds TempFund Portfolio, Institutional Class, 2.06% (c) | | | 3,689,124 | | | | 3,689,124 | | |
Fidelity Investments Prime Money Market Portfolio, Class I, 2.07% (c) | | | 3,353,870 | | | | 3,353,870 | | |
Fidelity Investments Money Market Government Portfolio, Class I, 1.81% (c) | | | 7,584,500 | | | | 7,584,500 | | |
Goldman Sachs Financial Square Prime Obligations Fund, Institutional Class,
2.16% (c) | | | 1,676,738 | | | | 1,676,738 | | |
JPMorgan Prime Money Market Fund, Capital Class, 2.05% (c) | | | 8,718,793 | | | | 8,718,793 | | |
Morgan Stanley Institutional Liquidity Prime Portfolio, Institutional Class,
2.12% (c) | | | 3,018,128 | | | | 3,018,128 | | |
Total Collateral for Securities Loaned (Cost $28,041,153) | | | 28,041,153 | | |
Total Investments (Cost $285,474,574) — 107.1% | | | 334,042,558 | | |
Liabilities in excess of other assets — (7.1)% | | | (22,033,941 | ) | |
NET ASSETS — 100.00% | | $ | 312,008,617 | | |
(a) Non-income producing security.
(b) All or a portion of this security is on loan.
(c) Rate disclosed is the daily yield on June 30, 2018.
ADR — American Depositary Receipt
See notes to financial statements.
12
Victory Portfolios
Victory RS Growth Fund | | Schedule of Portfolio Investments
June 30, 2018 | |
(Unaudited)
Security Description | | Shares | | Value | |
Common Stocks (96.0%) | |
Consumer Discretionary (24.3%): | |
Amazon.com, Inc. (a) | | | 10,850 | | | $ | 18,442,829 | | |
Dollar Tree, Inc. (a) | | | 35,860 | | | | 3,048,100 | | |
Ferrari NV (b) | | | 39,630 | | | | 5,350,446 | | |
Hilton Worldwide Holdings, Inc. | | | 71,900 | | | | 5,691,604 | | |
Las Vegas Sands Corp. (b) | | | 76,321 | | | | 5,827,871 | | |
Netflix, Inc. (a) | | | 22,830 | | | | 8,936,347 | | |
The Home Depot, Inc. (b) | | | 44,815 | | | | 8,743,407 | | |
Tiffany & Co. | | | 50,190 | | | | 6,605,004 | | |
Yum China Holdings, Inc. | | | 64,880 | | | | 2,495,285 | | |
| | | | 65,140,893 | | |
Electronic Equipment, Instruments & Components (1.8%): | |
TE Connectivity Ltd. | | | 53,300 | | | | 4,800,198 | | |
Energy (1.5%): | |
EOG Resources, Inc. | | | 31,975 | | | | 3,978,649 | | |
Financials (6.3%): | |
MSCI, Inc. | | | 31,650 | | | | 5,235,860 | | |
The Charles Schwab Corp. | | | 72,300 | | | | 3,694,530 | | |
The Progressive Corp. | | | 137,450 | | | | 8,130,168 | | |
| | | | 17,060,558 | | |
Health Care (12.6%): | |
BeiGene Ltd., ADR (a) | | | 11,730 | | | | 1,803,253 | | |
Bluebird Bio, Inc. (a) | | | 22,860 | | | | 3,587,878 | | |
Edwards Lifesciences Corp. (a) | | | 21,960 | | | | 3,196,717 | | |
Illumina, Inc. (a) | | | 24,820 | | | | 6,931,978 | | |
Intuitive Surgical, Inc. (a) | | | 8,940 | | | | 4,277,611 | | |
Neurocrine Biosciences, Inc. (a) | | | 30,960 | | | | 3,041,510 | | |
Sage Therapeutics, Inc. (a) | | | 15,970 | | | | 2,499,784 | | |
UnitedHealth Group, Inc. | | | 33,390 | | | | 8,191,903 | | |
| | | | 33,530,634 | | |
Industrials (7.5%): | |
Parker-Hannifin Corp. | | | 30,300 | | | | 4,722,255 | | |
Roper Technologies, Inc. | | | 11,440 | | | | 3,156,410 | | |
The Boeing Co. | | | 22,640 | | | | 7,595,946 | | |
XPO Logistics, Inc. (a) | | | 45,620 | | | | 4,570,212 | | |
| | | | 20,044,823 | | |
Internet Software & Services (9.4%): | |
Alphabet, Inc., Class C (a) | | | 9,261 | | | | 10,332,035 | | |
Facebook, Inc., Class A (a) | | | 74,340 | | | | 14,445,748 | | |
| | | | 24,777,783 | | |
IT Services (7.8%): | |
PayPal Holdings, Inc. (a) | | | 80,610 | | | | 6,712,395 | | |
Visa, Inc., Class A | | | 105,787 | | | | 14,011,488 | | |
| | | | 20,723,883 | | |
See notes to financial statements.
13
Victory Portfolios
Victory RS Growth Fund | | Schedule of Portfolio Investments — continued
June 30, 2018 | |
(Unaudited)
Security Description | | Shares | | Value | |
Materials (6.2%): | |
DowDuPont, Inc. | | | 79,020 | | | $ | 5,208,998 | | |
Ecolab, Inc. | | | 47,210 | | | | 6,624,980 | | |
Steel Dynamics, Inc. | | | 103,960 | | | | 4,776,962 | | |
| | | | 16,610,940 | | |
Semiconductors & Semiconductor Equipment (7.5%): | |
Broadcom, Inc. | | | 15,960 | | | | 3,872,534 | | |
Lam Research Corp. | | | 11,970 | | | | 2,069,015 | | |
Marvell Technology Group Ltd. (b) | | | 309,390 | | | | 6,633,322 | | |
Micron Technology, Inc. (a) | | | 68,450 | | | | 3,589,518 | | |
Nvidia Corp. | | | 16,380 | | | | 3,880,422 | | |
| | | | 20,044,811 | | |
Software (5.6%): | |
Activision Blizzard, Inc. | | | 90,720 | | | | 6,923,750 | | |
Salesforce.com, Inc. (a) | | | 59,860 | | | | 8,164,904 | | |
| | | | 15,088,654 | | |
Technology Hardware, Storage & Peripherals (5.5%): | |
Apple, Inc. | | | 79,927 | | | | 14,795,287 | | |
Total Common Stocks (Cost $169,448,613) | | | 256,597,113 | | |
Collateral for Securities Loaned (2.1%) | |
BlackRock Liquidity Funds TempFund Portfolio, Institutional Class, 2.06% (c) | | | 747,000 | | | | 747,000 | | |
Fidelity Investments Prime Money Market Portfolio, Class I, 2.07% (c) | | | 679,115 | | | | 679,115 | | |
Fidelity Investments Money Market Government Portfolio, Class I, 1.81% (c) | | | 1,535,762 | | | | 1,535,762 | | |
Goldman Sachs Financial Square Prime Obligations Fund, Institutional Class,
2.16% (c) | | | 339,517 | | | | 339,517 | | |
JPMorgan Prime Money Market Fund, Capital Class, 2.05% (c) | | | 1,765,442 | | | | 1,765,442 | | |
Morgan Stanley Institutional Liquidity Prime Portfolio, Institutional Class,
2.12% (c) | | | 611,131 | | | | 611,131 | | |
Total Collateral for Securities Loaned (Cost $5,677,967) | | | 5,677,967 | | |
Total Investments (Cost $175,126,580) — 98.1% | | | 262,275,080 | | |
Other assets in excess of liabilities — 1.9% | | | 5,163,025 | | |
NET ASSETS — 100.00% | | $ | 267,438,105 | | |
(a) Non-income producing security.
(b) All or a portion of this security is on loan.
(c) Rate disclosed is the daily yield on June 30, 2018.
ADR — American Depositary Receipt
See notes to financial statements.
14
Victory Portfolios
Victory RS Science and Technology Fund | | Schedule of Portfolio Investments
June 30, 2018 | |
(Unaudited)
Security Description | | Shares | | Value | |
Common Stocks (95.4%) | |
Biotechnology (32.2%): | |
Adverum Biotechnologies, Inc. (a) | | | 64,350 | | | $ | 341,055 | | |
Aimmune Therapeutics, Inc. (a) (b) | | | 43,680 | | | | 1,174,555 | | |
Albireo Pharma, Inc. (a) | | | 22,570 | | | | 801,235 | | |
Alpine Immune Sciences, Inc. (a) | | | 29,987 | | | | 227,002 | | |
Amicus Therapeutics, Inc. (a) (b) | | | 219,070 | | | | 3,421,873 | | |
Apellis Pharmaceuticals, Inc. (a) (b) | | | 122,483 | | | | 2,694,626 | | |
Aptinyx, Inc. (a) (b) | | | 39,990 | | | | 966,558 | | |
Arbutus Biopharma Corp. (a) (b) | | | 72,510 | | | | 529,323 | | |
Ascendis Pharma A/S, ADR (a) | | | 11,090 | | | | 737,707 | | |
Audentes Therapeutics, Inc. (a) | | | 56,110 | | | | 2,143,963 | | |
Autolus Therapeutics PLC, ADR (a) | | | 48,070 | | | | 1,287,795 | | |
BeiGene Ltd., ADR (a) (b) | | | 12,370 | | | | 1,901,640 | | |
BioMarin Pharmaceutical, Inc. (a) | | | 16,150 | | | | 1,521,330 | | |
Bluebird Bio, Inc. (a) | | | 27,130 | | | | 4,258,054 | | |
Blueprint Medicines Corp. (a) | | | 24,900 | | | | 1,580,652 | | |
Celyad SA, ADR (a) (b) | | | 61,610 | | | | 1,909,294 | | |
Chimerix, Inc. (a) | | | 123,270 | | | | 586,765 | | |
CRISPR Therapeutics AG (a) (b) | | | 16,790 | | | | 986,580 | | |
Cytomx Therapeutics, Inc. (a) (b) | | | 48,790 | | | | 1,115,339 | | |
Eagle Pharmaceuticals, Inc. (a) (b) | | | 19,690 | | | | 1,489,745 | | |
Editas Medicine, Inc. (a) (b) | | | 20,400 | | | | 730,932 | | |
Evlo Biosciences, Inc. (a) (b) | | | 40,000 | | | | 472,000 | | |
Fate Therapeutics, Inc. (a) (b) | | | 213,720 | | | | 2,423,585 | | |
Five Prime Therapeutics, Inc. (a) | | | 67,830 | | | | 1,072,392 | | |
G1 Therapeutics, Inc. (a) (b) | | | 19,970 | | | | 867,896 | | |
Galapagos NV, ADR (a) | | | 8,670 | | | | 799,201 | | |
Halozyme Therapeutics, Inc. (a) | | | 55,530 | | | | 936,791 | | |
Homology Medicines, Inc. (a) (b) | | | 39,950 | | | | 814,980 | | |
Immunomedics, Inc. (a) (b) | | | 83,120 | | | | 1,967,450 | | |
Invitae Corp. (a) (b) | | | 105,675 | | | | 776,711 | | |
Iovance Biotherapeutics, Inc. (a) | | | 104,420 | | | | 1,336,576 | | |
Kezar Life Sciences, Inc. (a) (b) | | | 179,956 | | | | 3,113,239 | | |
Kiniksa Pharmaceuticals, Ltd., Class A (a) | | | 58,750 | | | | 1,019,313 | | |
Kura Oncology, Inc. (a) | | | 96,170 | | | | 1,750,294 | | |
Lexicon Pharmaceuticals (a) (b) | | | 34,140 | | | | 409,680 | | |
Ligand Pharmaceuticals, Inc., Class B (a) | | | 7,810 | | | | 1,617,998 | | |
Loxo Oncology, Inc. (a) | | | 26,990 | | | | 4,682,225 | | |
MacroGenics, Inc. (a) (b) | | | 70,750 | | | | 1,460,988 | | |
Madrigal Pharmaceuticals, Inc. (a) (b) | | | 16,946 | | | | 4,739,627 | | |
MeiraGTx Holdings PLC (a) (b) | | | 39,500 | | | | 452,670 | | |
Neurocrine Biosciences, Inc. (a) | | | 8,280 | | | | 813,427 | | |
Pfenex, Inc. (a) (b) | | | 191,870 | | | | 1,038,017 | | |
REGENXBIO, Inc. (a) | | | 27,410 | | | | 1,966,668 | | |
Sage Therapeutics, Inc. (a) | | | 16,710 | | | | 2,615,616 | | |
Scholar Rock Holding Corp. (a) | | | 39,160 | | | | 610,896 | | |
Surface Oncology, Inc. (a) | | | 241,000 | | | | 3,930,710 | | |
See notes to financial statements.
15
Victory Portfolios
Victory RS Science and Technology Fund | | Schedule of Portfolio Investments — continued
June 30, 2018 | |
(Unaudited)
Security Description | | Shares | | Value | |
Tocagen, Inc. (a) | | | 46,910 | | | $ | 438,139 | | |
UNIQURE N.V. (a) | | | 22,040 | | | | 833,112 | | |
Verastem, Inc. (a) (b) | | | 101,830 | | | | 700,590 | | |
Vital Therapies, Inc. (a) (b) | | | 249,560 | | | | 1,709,486 | | |
Voyager Therapeutics, Inc. (a) (b) | | | 33,420 | | | | 653,027 | | |
Xencor, Inc. (a) | | | 14,790 | | | | 547,378 | | |
| | | | 76,976,705 | | |
Communications Equipment (5.9%): | |
Finisar Corp. (a) (b) | | | 135,570 | | | | 2,440,260 | | |
Lumentum Holdings, Inc. (a) (b) | | | 58,250 | | | | 3,372,675 | | |
Quantenna Communications, Inc. (a) | | | 314,680 | | | | 4,890,127 | | |
Viavi Solutions, Inc. (a) (b) | | | 317,340 | | | | 3,249,562 | | |
| | | | 13,952,624 | | |
Consumer Discretionary (5.8%): | |
Amazon.com, Inc. (a) | | | 6,010 | | | | 10,215,798 | | |
Netflix, Inc. (a) | | | 9,060 | | | | 3,546,356 | | |
| | | | 13,762,154 | | |
Electronic Equipment, Instruments & Components (1.4%): | |
II-VI, Inc. (a) | | | 74,630 | | | | 3,242,674 | | |
Health Care Technology (1.1%): | |
Veeva Systems, Inc. (a) | | | 34,260 | | | | 2,633,224 | | |
Internet Software & Services (17.3%): | |
ANGI Homeservices, Inc., Class A (a) (b) | | | 109,980 | | | | 1,691,492 | | |
Cornerstone OnDemand, Inc. (a) | | | 50,930 | | | | 2,415,610 | | |
Coupa Software, Inc. (a) | | | 53,550 | | | | 3,332,952 | | |
Dropbox, Inc. (a) | | | 68,770 | | | | 2,229,523 | | |
Facebook, Inc., Class A (a) | | | 48,450 | | | | 9,414,803 | | |
GoDaddy, Inc., Class A (a) | | | 50,600 | | | | 3,572,360 | | |
LogMeIn, Inc. | | | 30,014 | | | | 3,098,946 | | |
Match Group, Inc. (a) (b) | | | 67,640 | | | | 2,620,374 | | |
Mindbody, Inc. (a) (b) | | | 69,850 | | | | 2,696,210 | | |
SendGrid, Inc. (a) (b) | | | 78,270 | | | | 2,075,720 | | |
Wix.com Ltd. (a) (b) | | | 40,430 | | | | 4,055,129 | | |
Yelp, Inc. (a) | | | 99,860 | | | | 3,912,515 | | |
| | | | 41,115,634 | | |
Life Sciences Tools & Services (0.9%): | |
Illumina, Inc. (a) | | | 7,800 | | | | 2,178,462 | | |
Materials (0.6%): | |
Codexis, Inc. (a) | | | 100,000 | | | | 1,440,000 | | |
Pharmaceuticals (4.0%): | |
Aclaris Therapeutics, Inc. (a) (b) | | | 35,365 | | | | 706,239 | | |
Assembly Biosciences, Inc. (a) (b) | | | 48,150 | | | | 1,887,962 | | |
GW Pharmaceuticals PLC, ADR (a) | | | 15,100 | | | | 2,107,054 | | |
Jazz Pharmaceuticals PLC (a) | | | 4,720 | | | | 813,256 | | |
Kala Pharmaceuticals, Inc. (a) (b) | | | 22,500 | | | | 308,925 | | |
See notes to financial statements.
16
Victory Portfolios
Victory RS Science and Technology Fund | | Schedule of Portfolio Investments — continued
June 30, 2018 | |
(Unaudited)
Security Description | | Shares | | Value | |
KemPharm, Inc. (a) | | | 77,930 | | | $ | 506,545 | | |
MyoKardia, Inc. (a) | | | 26,720 | | | | 1,326,648 | | |
Odonate Therapeutics, Inc. (a) | | | 34,080 | | | | 752,486 | | |
Revance Therapeutics, Inc. (a) (b) | | | 25,510 | | | | 700,250 | | |
Sienna Biopharmaceuticals, Inc. (a) (b) | | | 22,470 | | | | 341,319 | | |
| | | | 9,450,684 | | |
Semiconductors & Semiconductor Equipment (13.9%): | |
Cypress Semiconductor Corp. | | | 211,580 | | | | 3,296,416 | | |
Integrated Device Technology, Inc. (a) (b) | | | 82,290 | | | | 2,623,405 | | |
Ma-Com Technology Solutions Holdings, Inc. (a) (b) | | | 269,180 | | | | 6,201,907 | | |
Marvell Technology Group Ltd. | | | 350,200 | | | | 7,508,288 | | |
MaxLinear, Inc., Class A (a) (b) | | | 85,670 | | | | 1,335,595 | | |
Mellanox Technologies Ltd. (a) | | | 29,990 | | | | 2,528,157 | | |
Micron Technology, Inc. (a) | | | 59,240 | | | | 3,106,546 | | |
Monolithic Power Systems, Inc. | | | 14,910 | | | | 1,993,020 | | |
Semtech Corp. (a) | | | 55,290 | | | | 2,601,395 | | |
Tower Semiconductor Ltd. (a) | | | 83,711 | | | | 1,842,479 | | |
| | | | 33,037,208 | | |
Software (10.4%): | |
Activision Blizzard, Inc. | | | 50,870 | | | | 3,882,398 | | |
Avalara, Inc. (a) (b) | | | 1,560 | | | | 83,257 | | |
Paycom Software, Inc. (a) (b) | | | 23,650 | | | | 2,337,330 | | |
Proofpoint, Inc. (a) | | | 21,229 | | | | 2,447,916 | | |
RingCentral, Inc., Class A (a) | | | 139,910 | | | | 9,842,668 | | |
Snap, Inc. (a) (b) | | | 110,590 | | | | 1,447,623 | | |
Take-Two Interactive Software, Inc. (a) | | | 22,860 | | | | 2,705,710 | | |
The Ultimate Software Group, Inc. (a) | | | 7,810 | | | | 2,009,591 | | |
| | | | 24,756,493 | | |
Technology Hardware, Storage & Peripherals (1.1%): | |
Cray, Inc. (a) | | | 107,320 | | | | 2,640,072 | | |
Telecommunication Services (0.8%): | |
Boingo Wireless, Inc. (a) (b) | | | 86,530 | | | | 1,954,713 | | |
Total Common Stocks (Cost $148,167,705) | | | 227,140,647 | | |
Collateral for Securities Loaned (21.1%) | |
BlackRock Liquidity Funds TempFund Portfolio, Institutional Class, 2.06% (c) | | | 6,620,272 | | | | 6,620,272 | | |
Fidelity Investments Prime Money Market Portfolio, Class I, 2.07% (c) | | | 6,018,647 | | | | 6,018,647 | | |
Fidelity Investments Money Market Government Portfolio, Class I, 1.81% (c) | | | 13,610,671 | | | | 13,610,671 | | |
Goldman Sachs Financial Square Prime Obligations Fund, Institutional Class,
2.16% (c) | | | 3,008,968 | | | | 3,008,969 | | |
JPMorgan Prime Money Market Fund, Capital Class, 2.05% (c) | | | 15,646,203 | | | | 15,646,203 | | |
See notes to financial statements.
17
Victory Portfolios
Victory RS Science and Technology Fund | | Schedule of Portfolio Investments — continued
June 30, 2018 | |
(Unaudited)
Security Description | | Shares | | Value | |
Morgan Stanley Institutional Liquidity Prime Portfolio, Institutional Class,
2.12% (c) | | | 5,416,143 | | | $ | 5,416,143 | | |
Total Collateral for Securities Loaned (Cost $50,320,905) | | | 50,320,905 | | |
Total Investments (Cost $198,488,610) — 116.5% | | | 277,461,552 | | |
Liabilities in excess of other assets — (16.5)% | | | (39,259,396 | ) | |
NET ASSETS — 100.00% | | $ | 238,202,156 | | |
(a) Non-income producing security.
(b) All or a portion of this security is on loan.
(c) Rate disclosed is the daily yield on June 30, 2018.
ADR — American Depositary Receipt
PLC — Public Limited Company
See notes to financial statements.
18
Victory Portfolios
Victory RS Small Cap Equity Fund | | Schedule of Portfolio Investments
June 30, 2018 | |
(Unaudited)
Security Description | | Shares | | Value | |
Common Stocks (99.1%) | |
Communications Equipment (1.0%): | |
Lumentum Holdings, Inc. (a) (b) | | | 12,771 | | | $ | 739,441 | | |
Consumer Discretionary (17.7%): | |
At Home Group, Inc. (a) | | | 24,120 | | | | 944,299 | | |
Burlington Stores, Inc. (a) | | | 2,512 | | | | 378,131 | | |
Delphi Technologies PLC | | | 16,120 | | | | 732,815 | | |
Dineequity, Inc. (b) | | | 13,750 | | | | 1,028,500 | | |
Eldorado Resorts, Inc. (a) (b) | | | 18,250 | | | | 713,575 | | |
Grand Canyon Education, Inc. (a) | | | 10,451 | | | | 1,166,436 | | |
Lithia Motors, Inc. | | | 7,499 | | | | 709,180 | | |
Monro Muffler Brake, Inc. (b) | | | 11,160 | | | | 648,396 | | |
Ollie's Bargain Outlet Holdings, Inc. (a) (b) | | | 9,211 | | | | 667,798 | | |
Planet Fitness, Inc., Class A (a) | | | 29,660 | | | | 1,303,261 | | |
Red Rock Resorts, Inc., Class A | | | 18,872 | | | | 632,212 | | |
Steven Madden Ltd. | | | 19,823 | | | | 1,052,601 | | |
The Wendy's Co. (b) | | | 59,980 | | | | 1,030,456 | | |
Topbuild Corp. (a) (b) | | | 9,130 | | | | 715,244 | | |
Weight Watchers International, Inc. (a) (b) | | | 11,560 | | | | 1,168,716 | | |
Wingstop, Inc. (b) | | | 11,220 | | | | 584,786 | | |
| | | | 13,476,406 | | |
Consumer Staples (2.3%): | |
Nomad Foods Ltd. (a) | | | 93,670 | | | | 1,797,527 | | |
Electronic Equipment, Instruments & Components (1.1%): | |
Littelfuse, Inc. | | | 3,677 | | | | 839,018 | | |
Energy (1.5%): | |
Newpark Resources, Inc. (a) | | | 76,080 | | | | 825,468 | | |
SRC Energy, Inc. (a) (b) | | | 28,830 | | | | 317,707 | | |
| | | | 1,143,175 | | |
Financials (4.8%): | |
LendingTree, Inc. (a) (b) | | | 2,259 | | | | 482,974 | | |
Primerica, Inc. | | | 5,560 | | | | 553,776 | | |
Texas Capital Bancshares, Inc. (a) | | | 9,570 | | | | 875,655 | | |
Walker & Dunlop, Inc. | | | 9,570 | | | | 532,571 | | |
Western Alliance BanCorp (a) | | | 13,191 | | | | 746,743 | | |
WisdomTree Investments, Inc. | | | 55,050 | | | | 499,854 | | |
| | | | 3,691,573 | | |
Health Care (25.0%): | |
Aimmune Therapeutics, Inc. (a) (b) | | | 13,290 | | | | 357,368 | | |
Amicus Therapeutics, Inc. (a) | | | 68,424 | | | | 1,068,783 | | |
Apellis Pharmaceuticals, Inc. (a) (b) | | | 14,520 | | | | 319,440 | | |
Aptinyx, Inc. (a) | | | 13,560 | | | | 327,745 | | |
Audentes Therapeutics, Inc. (a) | | | 13,580 | | | | 518,892 | | |
Bluebird Bio, Inc. (a) | | | 5,497 | | | | 862,754 | | |
Blueprint Medicines Corp. (a) | | | 8,528 | | | | 541,357 | | |
Celyad SA, ADR (a) (b) | | | 9,976 | | | | 309,156 | | |
Exact Sciences Corp. (a) | | | 15,429 | | | | 922,500 | | |
See notes to financial statements.
19
Victory Portfolios
Victory RS Small Cap Equity Fund | | Schedule of Portfolio Investments — continued
June 30, 2018 | |
(Unaudited)
Security Description | | Shares | | Value | |
Five Prime Therapeutics, Inc. (a) | | | 21,895 | | | $ | 346,160 | | |
Immunomedics, Inc. (a) (b) | | | 41,590 | | | | 984,435 | | |
Iovance Biotherapeutics, Inc. (a) | | | 48,012 | | | | 614,554 | | |
Kura Oncology, Inc. (a) | | | 27,830 | | | | 506,506 | | |
Ligand Pharmaceuticals, Inc., Class B (a) | | | 4,957 | | | | 1,026,942 | | |
Loxo Oncology, Inc. (a) | | | 6,586 | | | | 1,142,539 | | |
Madrigal Pharmaceuticals, Inc. (a) (b) | | | 3,170 | | | | 886,617 | | |
Sage Therapeutics, Inc. (a) | | | 5,521 | | | | 864,202 | | |
Vital Therapies, Inc. (a) (b) | | | 46,697 | | | | 319,874 | | |
Globus Medical, Inc., Class A (a) | | | 19,860 | | | | 1,002,135 | | |
Insulet Corp. (a) | | | 10,450 | | | | 895,565 | | |
Irhythm Technologies, Inc. (a) | | | 3,820 | | | | 309,917 | | |
Masimo Corp. (a) | | | 9,510 | | | | 928,652 | | |
Penumbra, Inc. (a) | | | 5,500 | | | | 759,825 | | |
Diplomat Pharmacy, Inc. (a) | | | 27,450 | | | | 701,622 | | |
HealthEquity, Inc. (a) | | | 8,830 | | | | 663,133 | | |
Teladoc, Inc. (a) (b) | | | 16,520 | | | | 958,986 | | |
GW Pharmaceuticals PLC, ADR (a) | | | 6,070 | | | | 847,008 | | |
Sienna Biopharmaceuticals, Inc. (a) (b) | | | 7,990 | | | | 121,368 | | |
| | | | 19,108,035 | | |
Industrials (13.9%): | |
Altra Industrial Motion Corp. (b) | | | 21,590 | | | | 930,529 | | |
Azul SA, ADR (a) | | | 36,360 | | | | 594,850 | | |
Beacon Roofing Supply, Inc. (a) (b) | | �� | 16,110 | | | | 686,608 | | |
H&E Equipment Services, Inc. | | | 29,130 | | | | 1,095,580 | | |
Harsco Corp. (a) | | | 46,910 | | | | 1,036,711 | | |
Hexcel Corp. | | | 6,864 | | | | 455,632 | | |
Kennametal, Inc. | | | 29,510 | | | | 1,059,409 | | |
Proto Labs, Inc. (a) | | | 4,760 | | | | 566,202 | | |
Saia, Inc. (a) | | | 12,560 | | | | 1,015,476 | | |
Simpson Manufacturing Co., Inc. | | | 11,970 | | | | 744,414 | | |
Siteone Landscape Supply, Inc. (a) (b) | | | 12,630 | | | | 1,060,541 | | |
The Brink's Co. (b) | | | 4,990 | | | | 397,953 | | |
Welbilt, Inc. (a) | | | 45,860 | | | | 1,023,137 | | |
| | | | 10,667,042 | | |
Internet Software & Services (8.5%): | |
Cornerstone OnDemand, Inc. (a) | | | 16,442 | | | | 779,844 | | |
Coupa Software, Inc. (a) | | | 12,980 | | | | 807,875 | | |
Envestnet, Inc. (a) | | | 10,410 | | | | 572,030 | | |
LogMeIn, Inc. | | | 11,050 | | | | 1,140,913 | | |
Mindbody, Inc. (a) (b) | | | 30,520 | | | | 1,178,071 | | |
Q2 Holdings, Inc. (a) | | | 10,670 | | | | 608,724 | | |
Wix.com Ltd. (a) | | | 13,430 | | | | 1,347,029 | | |
| | | | 6,434,486 | | |
IT Services (7.2%): | |
Black Knight, Inc. (a) | | | 26,325 | | | | 1,409,704 | | |
Euronet Worldwide, Inc. (a) | | | 14,137 | | | | 1,184,256 | | |
InterXion Holding NV (a) | | | 17,994 | | | | 1,123,185 | | |
See notes to financial statements.
20
Victory Portfolios
Victory RS Small Cap Equity Fund | | Schedule of Portfolio Investments — continued
June 30, 2018 | |
(Unaudited)
Security Description | | Shares | | Value | |
WEX, Inc. (a) | | | 3,800 | | | $ | 723,824 | | |
WNS Holdings Ltd., ADR (a) | | | 21,168 | | | | 1,104,546 | | |
| | | | 5,545,515 | | |
Materials (4.1%): | |
Allegheny Technologies, Inc. (a) | | | 41,490 | | | | 1,042,229 | | |
Ashland Global Holdings, Inc. | | | 12,640 | | | | 988,195 | | |
Ferro Corp. (a) | | | 52,290 | | | | 1,090,247 | | |
| | | | 3,120,671 | | |
Semiconductors & Semiconductor Equipment (5.6%): | |
Advanced Energy Industries, Inc. (a) | | | 6,090 | | | | 353,768 | | |
Cypress Semiconductor Corp. (b) | | | 33,700 | | | | 525,046 | | |
Integrated Device Technology, Inc. (a) | | | 23,120 | | | | 737,066 | | |
MKS Instruments, Inc. | | | 7,840 | | | | 750,288 | | |
Monolithic Power Systems, Inc. | | | 5,048 | | | | 674,766 | | |
Tower Semiconductor Ltd. (a) | | | 25,933 | | | | 570,785 | | |
Versum Materials, Inc. | | | 18,880 | | | | 701,392 | | |
| | | | 4,313,111 | | |
Software (6.4%): | |
Fair Isaac Corp. (a) | | | 4,380 | | | | 846,742 | | |
HubSpot, Inc. (a) (b) | | | 5,570 | | | | 698,478 | | |
Proofpoint, Inc. (a) | | | 9,197 | | | | 1,060,506 | | |
RingCentral, Inc., Class A (a) | | | 32,519 | | | | 2,287,711 | | |
| | | | 4,893,437 | | |
Total Common Stocks (Cost $56,693,861) | | | 75,769,437 | | |
Collateral for Securities Loaned (15.5%) | |
BlackRock Liquidity Funds TempFund Portfolio, Institutional Class, 2.06% (c) | | | 1,561,783 | | | | 1,561,783 | | |
Fidelity Investments Prime Money Market Portfolio, Class I, 2.07% (c) | | | 1,419,854 | | | | 1,419,854 | | |
Fidelity Investments Money Market Government Portfolio, Class I, 1.81% (c) | | | 3,210,883 | | | | 3,210,883 | | |
Goldman Sachs Financial Square Prime Obligations Fund, Institutional Class,
2.16% (c) | | | 709,843 | | | | 709,843 | | |
JPMorgan Prime Money Market Fund, Capital Class, 2.05% (c) | | | 3,691,083 | | | | 3,691,083 | | |
Morgan Stanley Institutional Liquidity Prime Portfolio, Institutional Class,
2.12% (c) | | | 1,277,718 | | | | 1,277,718 | | |
Total Collateral for Securities Loaned (Cost $11,871,164) | | | 11,871,164 | | |
Total Investments (Cost $68,565,025) — 114.6% | | | 87,640,601 | | |
Liabilities in excess of other assets — (14.6)% | | | (11,157,712 | ) | |
NET ASSETS — 100.00% | | $ | 76,482,889 | | |
(a) Non-income producing security.
(b) All or a portion of this security is on loan.
(c) Rate disclosed is the daily yield on June 30, 2018.
ADR — American Depositary Receipt
PLC — Public Limited Company
See notes to financial statements.
21
Victory Portfolios | | Statements of Assets and Liabilities
June 30, 2018 | |
(Unaudited)
| | | Victory
RS Small Cap
Growth Fund | | Victory
RS Select
Growth Fund | | Victory
RS Mid Cap
Growth Fund | |
ASSETS: | |
Investments, at value (Cost $1,799,443,641,
$311,035,267 and $285,474,574) | | $ | 2,376,221,404 | (a) | | $ | 423,149,486 | (b) | | $ | 334,042,558 | (c) | |
Cash and cash equivalents | | | 33,570,969 | | | | 11,545,304 | | | | 10,402,383 | | |
Interest and dividends receivable | | | 619,559 | | | | 183,392 | | | | 139,292 | | |
Receivable for capital shares issued | | | 3,391,170 | | | | 101,226 | | | | 193,464 | | |
Receivable for investments sold | | | 22,738,489 | | | | — | | | | — | | |
Receivable from Adviser | | | 60,189 | | | | 31,951 | | | | 31,554 | | |
Prepaid expenses | | | 76,263 | | | | 40,800 | | | | 40,899 | | |
Total Assets | | | 2,436,678,043 | | | | 435,052,159 | | | | 344,850,150 | | |
LIABILITIES: | |
Securities lending collateral | | | 359,853,359 | | | | 45,894,568 | | | | 28,041,153 | | |
Payable for investments purchased | | | 19,822,395 | | | | 2,994,704 | | | | 4,276,790 | | |
Payable for capital shares redeemed | | | 2,822,152 | | | | 792,922 | | | | 193,615 | | |
Accrued expenses and other payables: | |
Investment advisory fees | | | 1,633,904 | | | | 326,046 | | | | 225,251 | | |
Administration fees | | | 104,884 | | | | 19,888 | | | | 16,164 | | |
Custodian fees | | | 5,095 | | | | 3,454 | | | | 2,832 | | |
Transfer agent fees | | | 232,513 | | | | 62,460 | | | | 30,178 | | |
Chief Compliance Officer fees | | | 1,340 | | | | 286 | | | | 214 | | |
| 12b-1 fees | | | 78,813 | | | | 36,251 | | | | 20,269 | | |
Other accrued expenses | | | 194,259 | | | | 42,294 | | | | 35,067 | | |
Total Liabilities | | | 384,748,714 | | | | 50,172,873 | | | | 32,841,533 | | |
NET ASSETS: | |
Capital | | | 1,260,747,246 | | | | 187,283,176 | | | | 208,334,147 | | |
Accumulated net investment income (loss) | | | (6,970,098 | ) | | | (1,381,208 | ) | | | (601,719 | ) | |
Accumulated net realized gains (losses) from
investments | | | 221,374,418 | | | | 86,863,099 | | | | 55,708,205 | | |
Net unrealized appreciation (depreciation)
on investments | | | 576,777,763 | | | | 112,114,219 | | | | 48,567,984 | | |
Net Assets | | $ | 2,051,929,329 | | | $ | 384,879,286 | | | $ | 312,008,617 | | |
Net Assets | |
Class A Shares | | $ | 657,136,390 | | | $ | 142,804,320 | | | $ | 99,126,096 | | |
Class C Shares | | | 16,228,761 | | | | 49,467,726 | | | | 22,224,481 | | |
Class R Shares | | | 11,157,495 | | | | 967,829 | | | | 1,621,214 | | |
Class R6 Shares | | | 73,404,902 | | | | 205,281 | | | | 2,401,405 | | |
Class Y Shares | | | 1,294,001,781 | | | | 191,434,130 | | | | 186,635,421 | | |
Total | | $ | 2,051,929,329 | | | $ | 384,879,286 | | | $ | 312,008,617 | | |
Shares (unlimited number of shares authorized
with a par value of $0.001 per share): | |
Class A Shares | | | 7,211,031 | | | | 2,867,254 | | | | 3,629,455 | | |
Class C Shares | | | 201,860 | | | | 1,124,731 | | | | 907,331 | | |
Class R Shares | | | 131,495 | | | | 21,839 | | | | 63,553 | | |
Class R6 Shares | | | 778,166 | | | | 3,985 | | | | 85,242 | | |
Class Y Shares | | | 13,727,263 | | | | 3,721,759 | | | | 6,628,098 | | |
Total | | | 22,049,815 | | | | 7,739,568 | | | | 11,313,679 | | |
Net asset value, offering (except Class A Shares)
and redemption price per share: | |
Class A Shares | | $ | 91.13 | | | $ | 49.81 | | | $ | 27.31 | | |
Class C Shares (d) | | $ | 80.40 | | | $ | 43.98 | | | $ | 24.49 | | |
Class R Shares | | $ | 84.85 | | | $ | 44.32 | | | $ | 25.51 | | |
Class R6 Shares | | $ | 94.33 | | | $ | 51.51 | | | $ | 28.17 | | |
Class Y Shares | | $ | 94.27 | | | $ | 51.44 | | | $ | 28.16 | | |
Maximum Sales Charge — Class A Shares | | | 5.75 | % | | | 5.75 | % | | | 5.75 | % | |
Maximum offering price
(100%/(100%-maximum sales charge) of
net asset value adjusted to the nearest cent)
per share — Class A Shares | | $ | 96.69 | | | $ | 52.85 | | | $ | 28.98 | | |
(a) Includes $351,301,918 of securities on loan.
(b) Includes $44,679,372 of securities on loan.
(c) Includes $27,476,242 of securities on loan.
(d) Redemption price per share varies by the length of time shares are held.
See notes to financial statements.
22
Victory Portfolios | | Statements of Assets and Liabilities
June 30, 2018 | |
(Unaudited)
| | | Victory
RS Growth Fund | | Victory
RS Science and
Technology Fund | | Victory
RS Small Cap
Equity Fund | |
ASSETS: | |
Investments, at value (Cost $175,126,580,
$198,488,610 and $68,565,025) | | $ | 262,275,080 | (a) | | $ | 277,461,552 | (b) | | $ | 87,640,601 | (c) | |
Cash and cash equivalents | | | 13,353,537 | | | | 13,912,045 | | | | 502,808 | | |
Interest and dividends receivable | | | 117,394 | | | | 63,143 | | | | 22,417 | | |
Receivable for capital shares issued | | | 10,165 | | | | 288,150 | | | | 1,447 | | |
Receivable for investments sold | | | — | | | | — | | | | 1,051,717 | | |
Receivable from Adviser | | | 25,463 | | | | 3,427 | | | | 2,585 | | |
Prepaid expenses | | | 29,139 | | | | 27,437 | | | | 38,289 | | |
Total Assets | | | 275,810,778 | | | | 291,755,754 | | | | 89,259,864 | | |
LIABILITIES: | |
Securities lending collateral | | | 5,677,967 | | | | 50,320,905 | | | | 11,871,164 | | |
Payable for investments purchased | | | 2,366,161 | | | | 2,761,732 | | | | 785,240 | | |
Payable for capital shares redeemed | | | 78,629 | | | | 198,180 | | | | 42,412 | | |
Accrued expenses and other payables: | |
Investment advisory fees | | | 169,196 | | | | 197,958 | | | | 48,484 | | |
Administration fees | | | 13,760 | | | | 12,071 | | | | 3,943 | | |
Custodian fees | | | 2,627 | | | | 1,538 | | | | 788 | | |
Transfer agent fees | | | 13,252 | | | | 17,267 | | | | 6,243 | | |
Chief Compliance Officer fees | | | 161 | | | | 121 | | | | 45 | | |
| 12b-1 fees | | | 26,923 | | | | 24,008 | | | | 8,358 | | |
Other accrued expenses | | | 23,997 | | | | 19,818 | | | | 10,298 | | |
Total Liabilities | | | 8,372,673 | | | | 53,553,598 | | | | 12,776,975 | | |
NET ASSETS: | |
Capital | | | 153,983,176 | | | | 133,500,689 | | | | 42,050,557 | | |
Accumulated net investment income (loss) | | | (213,903 | ) | | | (1,536,463 | ) | | | (283,525 | ) | |
Accumulated net realized gains (losses) from
investments | | | 26,520,332 | | | | 27,264,988 | | | | 15,640,281 | | |
Net unrealized appreciation (depreciation) on
investments | | | 87,148,500 | | | | 78,972,942 | | | | 19,075,576 | | |
Net Assets | | $ | 267,438,105 | | | $ | 238,202,156 | | | $ | 76,482,889 | | |
Net Assets | |
Class A Shares | | $ | 228,482,425 | | | $ | 172,328,939 | | | $ | 69,801,482 | | |
Class C Shares | | | 6,504,631 | | | | 13,159,775 | | | | 404,483 | | |
Class R Shares | | | 896,964 | | | | 1,905,952 | | | | 3,805,284 | | |
Class Y Shares | | | 31,554,085 | | | | 50,807,490 | | | | 2,471,640 | | |
Total | | $ | 267,438,105 | | | $ | 238,202,156 | | | $ | 76,482,889 | | |
Shares (unlimited number of shares authorized
with a par value of $0.001 per share): | |
Class A Shares | | | 10,299,256 | | | | 6,776,016 | | | | 3,277,643 | | |
Class C Shares | | | 338,767 | | | | 631,636 | | | | 37,478 | | |
Class R Shares | | | 43,471 | | | | 85,279 | | | | 210,416 | | |
Class Y Shares | | | 1,378,287 | | | | 1,879,015 | | | | 114,063 | | |
Total | | | 12,059,781 | | | | 9,371,946 | | | | 3,639,600 | | |
Net asset value, offering (except Class A Shares)
and redemption price per share: | |
Class A Shares | | $ | 22.18 | | | $ | 25.43 | | | $ | 21.30 | | |
Class C Shares (d) | | $ | 19.20 | | | $ | 20.83 | | | $ | 10.79 | | |
Class R Shares | | $ | 20.63 | | | $ | 22.35 | | | $ | 18.08 | | |
Class Y Shares | | $ | 22.89 | | | $ | 27.04 | | | $ | 21.67 | | |
Maximum Sales Charge — Class A Shares | | | 5.75 | % | | | 5.75 | % | | | 5.75 | % | |
Maximum offering price
(100%/(100%-maximum sales charge) of
net asset value adjusted to the nearest cent)
per share — Class A Shares | | $ | 23.53 | | | $ | 26.98 | | | $ | 22.60 | | |
(a) Includes $5,521,228 of securities on loan.
(b) Includes $49,142,689 of securities on loan.
(c) Includes $11,567,766 of securities on loan.
(d) Redemption price per share varies by the length of time shares are held.
See notes to financial statements.
23
Victory Portfolios | | Statements of Operations
For the Six Months Ended June 30, 2018 | |
(Unaudited)
| | | Victory
RS Small Cap
Growth Fund | | Victory
RS Select
Growth Fund | | Victory
RS Mid Cap
Growth Fund | |
Investment Income: | |
Dividend income | | $ | 3,945,620 | | | $ | 1,354,679 | | | $ | 1,375,557 | | |
Interest income | | | 211,941 | | | | 31,133 | | | | 17,376 | | |
Securities lending income | | | 371,101 | | | | 49,050 | | | | 19,118 | | |
Total Income | | | 4,528,662 | | | | 1,434,862 | | | | 1,412,051 | | |
Expenses: | |
Investment advisory fees | | | 8,880,394 | | | | 2,070,866 | | | | 1,561,916 | | |
Administration fees | | | 555,082 | | | | 122,749 | | | | 108,880 | | |
12b-1 fees — Class A Shares | | | 769,992 | | | | 182,030 | | | | 126,820 | | |
12b-1 fees — Class C Shares | | | 74,288 | | | | 253,732 | | | | 116,062 | | |
12b-1 fees — Class R Shares | | | 21,246 | | | | 2,559 | | | | 4,098 | | |
Custodian fees | | | 52,509 | | | | 9,614 | | | | 9,019 | | |
Transfer agent fees | | | 61,672 | | | | 18,209 | | | | 13,128 | | |
Transfer agent fees — Class A Shares | | | 402,110 | | | | 95,702 | | | | 63,700 | | |
Transfer agent fees — Class C Shares | | | 7,007 | | | | 27,526 | | | | 10,822 | | |
Transfer agent fees — Class R Shares | | | 5,671 | | | | 2,545 | | | | 1,750 | | |
Transfer agent fees — Class R6 Shares | | | 767 | | | | 28 | | | | 48 | | |
Transfer agent fees — Class Y Shares | | | 594,499 | | | | 118,135 | | | | 83,662 | | |
Trustees' fees | | | 68,061 | | | | 16,682 | | | | 15,162 | | |
Chief Compliance Officer fees | | | 6,954 | | | | 1,639 | | | | 1,481 | | |
Legal and audit fees | | | 76,356 | | | | 21,349 | | | | 19,568 | | |
State registration and filing fees | | | 61,803 | | | | 35,967 | | | | 37,618 | | |
Interest expense on interfund lending (See Note 6) | | | — | | | | 180 | | | | 3,382 | | |
Other expenses | | | 131,142 | | | | 29,290 | | | | 26,645 | | |
Total Expenses | | | 11,769,553 | | | | 3,008,802 | | | | 2,203,761 | | |
Expenses waived/reimbursed by Adviser | | | (270,793 | ) | | | (192,732 | ) | | | (189,991 | ) | |
Net Expenses | | | 11,498,760 | | | | 2,816,070 | | | | 2,013,770 | | |
Net Investment Income (Loss) | | | (6,970,098 | ) | | | (1,381,208 | ) | | | (601,719 | ) | |
Realized/Unrealized Gains (Losses) from
Investment Transactions: | |
Net realized gains (losses) from investment
transactions | | | 191,467,162 | | | | 54,079,977 | | | | 53,880,117 | | |
Net change in unrealized appreciation/depreciation
on investments | | | 32,076,940 | | | | (19,731,699 | ) | | | (27,960,927 | ) | |
Net realized/unrealized gains (losses)
on investments | | | 223,544,102 | | | | 34,348,278 | | | | 25,919,190 | | |
Change in net assets resulting from operations | | $ | 216,574,004 | | | $ | 32,967,070 | | | $ | 25,317,471 | | |
See notes to financial statements.
24
Victory Portfolios | | Statements of Operations
For the Six Months Ended June 30, 2018 | |
(Unaudited)
| | | Victory
RS Growth Fund | | Victory
RS Science and
Technology Fund | | Victory
RS Small Cap
Equity Fund | |
Investment Income: | |
Dividend income | | $ | 1,195,511 | | | $ | 171,724 | | | $ | 158,240 | | |
Interest income | | | 25,684 | | | | 29,728 | | | | 4,813 | | |
Securities lending income | | | 3,007 | | | | 122,531 | | | | 13,615 | | |
Total Income | | | 1,224,202 | | | | 323,983 | | | | 176,668 | | |
Expenses: | |
Investment advisory fees | | | 988,047 | | | | 1,081,007 | | | | 279,212 | | |
Administration fees | | | 78,350 | | | | 64,763 | | | | 22,600 | | |
12b-1 fees — Class A Shares | | | 280,563 | | | | 199,475 | | | | 85,201 | | |
12b-1 fees — Class C Shares | | | 34,071 | | | | 61,017 | | | | 2,409 | | |
12b-1 fees — Class R Shares | | | 2,193 | | | | 4,526 | | | | 9,087 | | |
Custodian fees | | | 5,639 | | | | 5,153 | | | | 2,288 | | |
Transfer agent fees | | | 8,395 | | | | 4,648 | | | | 1,900 | | |
Transfer agent fees — Class A Shares | | | 89,591 | | | | 72,884 | | | | 23,102 | | |
Transfer agent fees — Class C Shares | | | 4,045 | | | | 5,442 | | | | 211 | | |
Transfer agent fees — Class R Shares | | | 980 | | | | 1,688 | | | | 3,166 | | |
Transfer agent fees — Class Y Shares | | | 10,449 | | | | 17,181 | | | | 1,476 | | |
Trustees' fees | | | 9,747 | | | | 7,601 | | | | 2,786 | | |
Chief Compliance Officer fees | | | 979 | | | | 768 | | | | 274 | | |
Legal and audit fees | | | 15,043 | | | | 13,007 | | | | 7,963 | | |
State registration and filing fees | | | 31,616 | | | | 32,570 | | | | 25,096 | | |
Interest expense on interfund lending (See Note 6) | | | — | | | | 424 | | | | — | | |
Other expenses | | | 15,886 | | | | 18,409 | | | | 6,233 | | |
Total Expenses | | | 1,575,594 | | | | 1,590,563 | | | | 473,004 | | |
Expenses waived/reimbursed by Adviser | | | (137,489 | ) | | | (8,230 | ) | | | (12,811 | ) | |
Net Expenses | | | 1,438,105 | | | | 1,582,333 | | | | 460,193 | | |
Net Investment Income (Loss) | | | (213,903 | ) | | | (1,258,350 | ) | | | (283,525 | ) | |
Realized/Unrealized Gains (Losses) from
Investment Transactions: | |
Net realized gains (losses) from investment
transactions | | | 22,124,421 | | | | 23,849,618 | | | | 10,082,311 | | |
Net change in unrealized appreciation/depreciation
on investments | | | (2,349,613 | ) | | | 11,419,962 | | | | (834,434 | ) | |
Net realized/unrealized gains (losses) on
investments | | | 19,774,808 | | | | 35,269,580 | | | | 9,247,877 | | |
Change in net assets resulting from operations | | $ | 19,560,905 | | | $ | 34,011,230 | | | $ | 8,964,352 | | |
See notes to financial statements.
25
Victory Portfolios | | Statements of Changes in Net Assets | |
| | | Victory
RS Small Cap Growth Fund | | Victory
RS Select Growth Fund | | Victory
RS Mid Cap Growth Fund | |
| | | Six
Months
Ended
June 30,
2018 | | Year
Ended
December 31,
2017 | | Six
Months
Ended
June 30,
2018 | | Year
Ended
December 31,
2017 | | Six
Months
Ended
June 30,
2018 | | Year
Ended
December 31,
2017 | |
| | | (Unaudited) | | | | (Unaudited) | | | | (Unaudited) | | | |
From Investment
Activities: | |
Operations: | |
Net investment
income (loss) | | $ | (6,970,098 | ) | | $ | (15,059,481 | ) | | $ | (1,381,208 | ) | | $ | (3,994,055 | ) | | $ | (601,719 | ) | | $ | (1,594,930 | ) | |
Net realized gains
(losses) from
investment
transactions | | | 191,467,162 | | | | 475,862,680 | | | | 54,079,977 | | | | 71,609,721 | | | | 53,880,117 | | | | 31,949,511 | | |
Net change in
unrealized
appreciation/
depreciation
on investments | | | 32,076,940 | | | | 140,791,987 | | | | (19,731,699 | ) | | | 9,320,604 | | | | (27,960,927 | ) | | | 52,556,387 | | |
Change in net assets
resulting from
operations | | | 216,574,004 | | | | 601,595,186 | | | | 32,967,070 | | | | 76,936,270 | | | | 25,317,471 | | | | 82,910,968 | | |
Distributions to
Shareholders: | |
From net realized
gains: | |
Class A Shares | | | — | | | | (51,979,281 | ) | | | — | | | | (19,166,693 | ) | | | — | | | | — | | |
Class C Shares | | | — | | | | (1,398,397 | ) | | | — | | | | (7,474,242 | ) | | | — | | | | — | | |
Class R Shares | | | — | | | | (690,275 | ) | | | — | | | | (181,019 | ) | | | — | | | | — | | |
Class R6
Shares | | | — | | | | (662,464 | ) | | | — | | | | (18,825 | ) | | | — | | | | — | | |
Class Y Shares | | | — | | | | (139,921,555 | ) | | | — | | | | (31,006,290 | ) | | | — | | | | — | | |
Change in net assets
resulting from
distributions to
shareholders | | | — | | | | (194,651,972 | ) | | | — | | | | (57,847,069 | ) | | | — | | | | — | | |
Change in net assets
resulting from
capital transactions | | | 131,819,581 | | | | (582,607,616 | ) | | | (92,681,559 | ) | | | (98,622,177 | ) | | | (158,711,454 | ) | | | (63,665,136 | ) | |
Change in net assets | | | 348,393,585 | | | | (175,664,402 | ) | | | (59,714,489 | ) | | | (79,532,976 | ) | | | (133,393,983 | ) | | | 19,245,832 | | |
Net Assets: | |
Beginning of period | | | 1,703,535,744 | | | | 1,879,200,146 | | | | 444,593,775 | | | | 524,126,751 | | | | 445,402,600 | | | | 426,156,768 | | |
End of period | | $ | 2,051,929,329 | | | $ | 1,703,535,744 | | | $ | 384,879,286 | | | $ | 444,593,775 | | | $ | 312,008,617 | | | $ | 445,402,600 | | |
Accumulated net
investment income
(loss) | | $ | (6,970,098 | ) | | $ | — | | | $ | (1,381,208 | ) | | $ | — | | | $ | (601,719 | ) | | $ | — | | |
(continues on next page)
See notes to financial statements.
26
Victory Portfolios | | Statements of Changes in Net Assets | |
(continued)
| | | Victory
RS Small Cap Growth Fund | | Victory
RS Select Growth Fund | | Victory
RS Mid Cap Growth Fund | |
| | | Six
Months
Ended
June 30,
2018 | | Year
Ended
December 31,
2017 | | Six
Months
Ended
June 30,
2018 | | Year
Ended
December 31,
2017 | | Six
Months
Ended
June 30,
2018 | | Year
Ended
December 31,
2017 | |
| | | (Unaudited) | | | | (Unaudited) | | | | (Unaudited) | | | |
Capital Transactions: | |
Class A Shares | |
Proceeds from
shares issued | | $ | 60,672,520 | | | $ | 68,607,881 | | | $ | 7,744,252 | | | $ | 12,794,002 | | | $ | 3,687,181 | | | $ | 27,239,168 | | |
Distributions
reinvested | | | — | | | | 49,372,130 | | | | — | | | | 18,348,046 | | | | — | | | | — | | |
Cost of shares
redeemed | | | (50,332,757 | ) | | | (134,202,144 | ) | | | (24,111,980 | ) | | | (60,178,865 | ) | | | (19,287,136 | ) | | | (185,499,130 | ) | |
Total Class A
Shares | | $ | 10,339,763 | | | $ | (16,222,133 | ) | | $ | (16,367,728 | ) | | $ | (29,036,817 | ) | | $ | (15,599,955 | ) | | $ | (158,259,962 | ) | |
Class C Shares | |
Proceeds from
shares issued | | $ | 3,153,052 | | | $ | 1,033,799 | | | $ | 2,143,690 | | | $ | 2,757,248 | | | $ | 673,187 | | | $ | 2,068,738 | | |
Distributions
reinvested | | | — | | | | 1,201,107 | | | | — | | | | 6,949,911 | | | | — | | | | — | | |
Cost of shares
redeemed | | | (2,217,969 | ) | | | (4,271,975 | ) | | | (7,710,934 | ) | | | (23,560,380 | ) | | | (2,990,959 | ) | | | (7,732,712 | ) | |
Total Class C
Shares | | $ | 935,083 | | | $ | (2,037,069 | ) | | $ | (5,567,244 | ) | | $ | (13,853,221 | ) | | $ | (2,317,772 | ) | | $ | (5,663,974 | ) | |
Class R Shares | |
Proceeds from
shares issued | | $ | 4,440,980 | | | $ | 2,364,474 | | | $ | 56,724 | | | $ | 515,966 | | | $ | 146,956 | | | $ | 199,723 | | |
Distributions
reinvested | | | — | | | | 690,275 | | | | — | | | | 71,655 | | | | — | | | | — | | |
Cost of shares
redeemed | | | (1,863,165 | ) | | | (1,984,120 | ) | | | (180,229 | ) | | | (1,046,651 | ) | | | (307,357 | ) | | | (288,199 | ) | |
Total Class R
Shares | | $ | 2,577,815 | | | $ | 1,070,629 | | | $ | (123,505 | ) | | $ | (459,030 | ) | | $ | (160,401 | ) | | $ | (88,476 | ) | |
Class R6 Shares | |
Proceeds from
shares issued | | $ | 50,843,020 | | | $ | 25,546,617 | | | $ | 38,761 | | | $ | 88,323 | | | $ | 200,950 | | | $ | 1,802,840 | | |
Distributions
reinvested | | | — | | | | 662,464 | | | | — | | | | 18,825 | | | | — | | | | — | | |
Cost of shares
redeemed | | | (7,090,510 | ) | | | (1,185,236 | ) | | | — | | | | — | | | | (62,969 | ) | | | (9,180 | ) | |
Total Class R6
Shares | | $ | 43,752,510 | | | $ | 25,023,845 | | | $ | 38,761 | | | $ | 107,148 | | | $ | 137,981 | | | $ | 1,793,660 | | |
Class Y Shares | |
Proceeds from
shares issued | | $ | 222,101,057 | | | $ | 355,563,216 | | | $ | 14,219,497 | | | $ | 42,855,011 | | | $ | 30,342,763 | | | $ | 177,263,802 | | |
Distributions
reinvested | | | — | | | | 134,559,639 | | | | — | | | | 28,405,490 | | | | — | | | | — | | |
Cost of shares
redeemed | | | (147,886,647 | ) | | | (1,080,565,743 | ) | | | (84,881,340 | ) | | | (126,640,758 | ) | | | (171,114,070 | ) | | | (78,710,186 | ) | |
Total Class Y
Shares | | $ | 74,214,410 | | | $ | (590,442,888 | ) | | $ | (70,661,843 | ) | | $ | (55,380,257 | ) | | $ | (140,771,307 | ) | | $ | 98,553,616 | | |
Change in net assets
resulting from capital
transactions | | $ | 131,819,581 | | | $ | (582,607,616 | ) | | $ | (92,681,559 | ) | | $ | (98,622,177 | ) | | $ | (158,711,454 | ) | | $ | (63,665,136 | ) | |
(continues on next page)
See notes to financial statements.
27
Victory Portfolios | | Statements of Changes in Net Assets | |
(continued)
| | | Victory
RS Small Cap Growth Fund | | Victory
RS Select Growth Fund | | Victory
RS Mid Cap Growth Fund | |
| | | Six
Months
Ended
June 30,
2018 | | Year
Ended
December 31,
2017 | | Six
Months
Ended
June 30,
2018 | | Year
Ended
December 31,
2017 | | Six
Months
Ended
June 30,
2018 | | Year
Ended
December 31,
2017 | |
| | | (Unaudited) | | | | (Unaudited) | | | | (Unaudited) | | | |
Share Transactions: | |
Class A Shares | |
Issued | | | 687,127 | | | | 898,907 | | | | 160,921 | | | | 266,308 | | | | 135,742 | | | | 1,178,614 | | |
Reinvested | | | — | | | | 649,625 | | | | — | | | | 396,800 | | | | — | | | | — | | |
Redeemed | | | (580,839 | ) | | | (1,811,083 | ) | | | (498,911 | ) | | | (1,250,714 | ) | | | (707,476 | ) | | | (7,817,745 | ) | |
Total Class A
Shares | | | 106,288 | | | | (262,551 | ) | | | (337,990 | ) | | | (587,606 | ) | | | (571,734 | ) | | | (6,639,131 | ) | |
Class C Shares | |
Issued | | | 40,303 | | | | 15,059 | | | | 49,942 | | | | 63,931 | | | | 27,710 | | | | 98,514 | | |
Reinvested | | | — | | | | 17,778 | | | | — | | | | 169,510 | | | | — | | | | — | | |
Redeemed | | | (28,587 | ) | | | (63,729 | ) | | | (180,180 | ) | | | (539,624 | ) | | | (122,361 | ) | | | (366,911 | ) | |
Total Class C
Shares | | | 11,716 | | | | (30,892 | ) | | | (130,238 | ) | | | (306,183 | ) | | | (94,651 | ) | | | (268,397 | ) | |
Class R Shares | |
Issued | | | 52,877 | | | | 33,057 | | | | 1,316 | | | | 11,914 | | | | 5,806 | | | | 9,093 | | |
Reinvested | | | — | | | | 9,692 | | | | — | | | | 1,737 | | | | — | | | | — | | |
Redeemed | | | (23,273 | ) | | | (28,013 | ) | | | (4,177 | ) | | | (24,059 | ) | | | (12,047 | ) | | | (13,262 | ) | |
Total Class R
Shares | | | 29,604 | | | | 14,736 | | | | (2,861 | ) | | | (10,408 | ) | | | (6,241 | ) | | | (4,169 | ) | |
Class R6 Shares | |
Issued | | | 549,181 | | | | 311,689 | | | | 798 | | | | 1,687 | | | | 7,127 | | | | 77,929 | | |
Reinvested | | | — | | | | 7,921 | | | | — | | | | 394 | | | | — | | | | — | | |
Redeemed | | | (76,405 | ) | | | (14,220 | ) | | | — | | | | — | | | | (2,192 | ) | | | (371 | ) | |
Total Class R6
Shares | | | 472,776 | | | | 305,390 | | | | 798 | | | | 2,081 | | | | 4,935 | | | | 77,558 | | |
Class Y Shares | |
Issued | | | 2,443,893 | | | | 4,621,156 | | | | 287,934 | | | | 870,381 | | | | 1,083,466 | | | | 7,235,933 | | |
Reinvested | | | — | | | | 1,731,408 | | | | — | | | | 595,628 | | | | — | | | | — | | |
Redeemed | | | (1,646,536 | ) | | | (13,989,414 | ) | | | (1,720,277 | ) | | | (2,551,259 | ) | | | (6,138,893 | ) | | | (3,267,979 | ) | |
Total Class Y
Shares | | | 797,357 | | | | (7,636,850 | ) | | | (1,432,343 | ) | | | (1,085,250 | ) | | | (5,055,427 | ) | | | 3,967,954 | | |
Change in Shares | | | 1,417,741 | | | | (7,610,167 | ) | | | (1,902,634 | ) | | | (1,987,366 | ) | | | (5,723,118 | ) | | | (2,866,185 | ) | |
See notes to financial statements.
28
Victory Portfolios | | Statements of Changes in Net Assets | |
| | | Victory
RS Growth Fund | | Victory
RS Science and
Technology Fund | | Victory
RS Small Cap Equity Fund | |
| | | Six
Months
Ended
June 30,
2018 | | Year
Ended
December 31,
2017 | | Six
Months
Ended
June 30,
2018 | | Year
Ended
December 31,
2017 | | Six
Months
Ended
June 30,
2018 | | Year
Ended
December 31,
2017 | |
| | | (Unaudited) | | | | (Unaudited) | | | | (Unaudited) | | | |
From Investment Activities: | |
Operations: | |
Net investment
income (loss) | | $ | (213,903 | ) | | $ | (226,537 | ) | | $ | (1,258,350 | ) | | $ | (2,010,100 | ) | | $ | (283,525 | ) | | $ | (568,164 | ) | |
Net realized gains
(losses) from
investment
transactions | | | 22,124,421 | | | | 21,223,743 | | | | 23,849,618 | | | | 30,267,179 | | | | 10,082,311 | | | | 11,338,570 | | |
Net change in
unrealized
appreciation/
depreciation on
investments | | | (2,349,613 | ) | | | 45,536,185 | | | | 11,419,962 | | | | 32,448,835 | | | | (834,434 | ) | | | 9,907,721 | | |
Change in net assets resulting
from operations | | | 19,560,905 | | | | 66,533,391 | | | | 34,011,230 | | | | 60,705,914 | | | | 8,964,352 | | | | 20,678,127 | | |
Distributions to Shareholders: | |
From net realized
gains: | |
Class A Shares | | | — | | | | (10,776,472 | ) | | | — | | | | (21,685,805 | ) | | | — | | | | (3,143,304 | ) | |
Class C Shares | | | — | | | | (392,949 | ) | | | — | | | | (2,079,352 | ) | | | — | | | | (47,723 | ) | |
Class R Shares | | | — | | | | (43,485 | ) | | | — | | | | (278,523 | ) | | | — | | | | (187,965 | ) | |
Class Y Shares | | | — | | | | (1,451,934 | ) | | | — | | | | (4,622,430 | ) | | | — | | | | (302,697 | ) | |
Change in net assets resulting
from distributions to
shareholders | | | — | | | | (12,664,840 | ) | | | — | | | | (28,666,110 | ) | | | — | | | | (3,681,689 | ) | |
Change in net assets resulting
from capital transactions | | | (8,473,389 | ) | | | (22,086,756 | ) | | | 12,606,358 | | | | 23,443,993 | | | | (8,307,407 | ) | | | 1,556,442 | | |
Change in net assets | | | 11,087,516 | | | | 31,781,795 | | | | 46,617,588 | | | | 55,483,797 | | | | 656,945 | | | | 18,552,880 | | |
Net Assets: | |
Beginning of period | | | 256,350,589 | | | | 224,568,794 | | | | 191,584,568 | | | | 136,100,771 | | | | 75,825,944 | | | | 57,273,064 | | |
End of period | | $ | 267,438,105 | | | $ | 256,350,589 | | | $ | 238,202,156 | | | $ | 191,584,568 | | | $ | 76,482,889 | | | $ | 75,825,944 | | |
Accumulated net
investment income
(loss) | | $ | (213,903 | ) | | $ | — | | | $ | (1,536,463 | ) | | $ | (278,113 | ) | | $ | (283,525 | ) | | $ | — | | |
(continues on next page)
See notes to financial statements.
29
Victory Portfolios | | Statements of Changes in Net Assets | |
(continued)
| | | Victory
RS Growth Fund | | Victory
RS Science and
Technology Fund | | Victory
RS Small Cap Equity Fund | |
| | | Six
Months
Ended
June 30,
2018 | | Year
Ended
December 31,
2017 | | Six
Months
Ended
June 30,
2018 | | Year
Ended
December 31,
2017 | | Six
Months
Ended
June 30,
2018 | | Year
Ended
December 31,
2017 | |
| | | (Unaudited) | | | | (Unaudited) | | | | (Unaudited) | | | |
Capital Transactions: | |
Class A Shares | |
Proceeds from shares
issued | | $ | 3,731,838 | | | $ | 6,079,169 | | | $ | 20,489,914 | | | $ | 20,793,071 | | | $ | 1,527,971 | | | $ | 3,700,782 | | |
Distributions reinvested | | | — | | | | 10,508,652 | | | | — | | | | 21,027,140 | | | | — | | | | 3,104,349 | | |
Cost of shares redeemed | | | (10,149,584 | ) | | | (34,048,087 | ) | | | (19,925,526 | ) | | | (25,387,510 | ) | | | (5,426,017 | ) | | | (8,905,490 | ) | |
Total Class A Shares | | $ | (6,417,746 | ) | | $ | (17,460,266 | ) | | $ | 564,388 | | | $ | 16,432,701 | | | $ | (3,898,046 | ) | | $ | (2,100,359 | ) | |
Class C Shares | |
Proceeds from shares
issued | | $ | 494,124 | | | $ | 744,039 | | | $ | 1,064,833 | | | $ | 946,759 | | | $ | 163,106 | | | $ | 45,855 | | |
Distributions reinvested | | | — | | | | 322,627 | | | | — | | | | 1,841,237 | | | | — | | | | 47,051 | | |
Cost of shares redeemed | | | (1,447,316 | ) | | | (4,271,007 | ) | | | (1,711,596 | ) | | | (3,300,552 | ) | | | (342,589 | ) | | | (65,480 | ) | |
Total Class C Shares | | $ | (953,192 | ) | | $ | (3,204,341 | ) | | $ | (646,763 | ) | | $ | (512,556 | ) | | $ | (179,483 | ) | | $ | 27,426 | | |
Class R Shares | |
Proceeds from shares
issued | | $ | 126,931 | | | $ | 199,868 | | | $ | 147,550 | | | $ | 231,685 | | | $ | 163,106 | | | $ | 403,870 | | |
Distributions reinvested | | | — | | | | 43,485 | | | | — | | | | 278,523 | | | | — | | | | 187,965 | | |
Cost of shares redeemed | | | (119,545 | ) | | | (687,634 | ) | | | (243,858 | ) | | | (501,293 | ) | | | (162,385 | ) | | | (1,007,770 | ) | |
Total Class R Shares | | $ | 7,386 | | | $ | (444,281 | ) | | $ | (96,308 | ) | | $ | 8,915 | | | $ | 721 | | | $ | (415,935 | ) | |
Class Y Shares | |
Proceeds from shares
issued | | $ | 1,924,890 | | | $ | 7,534,466 | | | $ | 26,883,013 | | | $ | 13,145,394 | | | $ | 821,534 | | | $ | 4,530,016 | | |
Distributions reinvested | | | — | | | | 1,315,590 | | | | — | | | | 4,113,118 | | | | — | | | | 287,256 | | |
Cost of shares redeemed | | | (3,034,727 | ) | | | (9,827,924 | ) | | | (14,097,972 | ) | | | (9,743,579 | ) | | | (5,052,133 | ) | | | (771,962 | ) | |
Total Class Y Shares | | $ | (1,109,837 | ) | | $ | (977,868 | ) | | $ | 12,785,041 | | | $ | 7,514,933 | | | $ | (4,230,599 | ) | | $ | 4,045,310 | | |
Change in net assets resulting
from capital transactions | | $ | (8,473,389 | ) | | $ | (22,086,756 | ) | | $ | 12,606,358 | | | $ | 23,443,993 | | | $ | (8,307,407 | ) | | $ | 1,556,442 | | |
(continues on next page)
See notes to financial statements.
30
Victory Portfolios | | Statements of Changes in Net Assets | |
(continued)
| | | Victory
RS Growth Fund | | Victory
RS Science and
Technology Fund | | Victory
RS Small Cap Equity Fund | |
| | | Six
Months
Ended
June 30,
2018 | | Year
Ended
December 31,
2017 | | Six
Months
Ended
June 30,
2018 | | Year
Ended
December 31,
2017 | | Six
Months
Ended
June 30,
2018 | | Year
Ended
December 31,
2017 | |
| | | (Unaudited) | | | | (Unaudited) | | | | (Unaudited) | | | |
Share Transactions: | |
Class A Shares | |
Issued | | | 172,998 | | | | 318,962 | | | | 838,683 | | | | 966,693 | | | | 75,178 | | | | 215,116 | | |
Reinvested | | | — | | | | 508,155 | | | | — | | | | 983,956 | | | | — | | | | 164,338 | | |
Redeemed | | | (467,867 | ) | | | (1,782,555 | ) | | | (834,655 | ) | | | (1,184,710 | ) | | | (267,557 | ) | | | (522,845 | ) | |
Total Class A Shares | | | (294,869 | ) | | | (955,438 | ) | | | 4,028 | | | | 765,939 | | | | (192,379 | ) | | | (143,391 | ) | |
Class C Shares | |
Issued | | | 26,374 | | | | 43,982 | | | | 52,391 | | | | 51,487 | | | | 15,026 | | | | 5,111 | | |
Reinvested | | | — | | | | 17,963 | | | | — | | | | 104,794 | | | | — | | | | 4,891 | | |
Redeemed | | | (77,172 | ) | | | (257,070 | ) | | | (87,882 | ) | | | (179,801 | ) | | | (32,990 | ) | | | (7,470 | ) | |
Total Class C Shares | | | (50,798 | ) | | | (195,125 | ) | | | (35,491 | ) | | | (23,520 | ) | | | (17,964 | ) | | | 2,532 | | |
Class R Shares | |
Issued | | | 6,316 | | | | 11,331 | | | | 7,130 | | | | 12,309 | | | | 9,377 | | | | 28,179 | | |
Reinvested | | | — | | | | 2,253 | | | | — | | | | 14,799 | | | | — | | | | 11,682 | | |
Redeemed | | | (6,052 | ) | | | (38,454 | ) | | | (11,623 | ) | | | (25,622 | ) | | | (9,288 | ) | | | (67,107 | ) | |
Total Class R Shares | | | 264 | | | | (24,870 | ) | | | (4,493 | ) | | | 1,486 | | | | 89 | | | | (27,246 | ) | |
Class Y Shares | |
Issued | | | 86,130 | | | | 399,493 | | | | 1,043,204 | | | | 597,609 | | | | 39,097 | | | | 238,255 | | |
Reinvested | | | — | | | | 61,736 | | | | — | | | | 181,275 | | | | — | | | | 14,953 | | |
Redeemed | | | (135,464 | ) | | | (521,271 | ) | | | (563,841 | ) | | | (431,893 | ) | | | (258,247 | ) | | | (45,406 | ) | |
Total Class Y Shares | | | (49,334 | ) | | | (60,042 | ) | | | 479,363 | | | | 346,991 | | | | (219,150 | ) | | | 207,802 | | |
Change in Shares | | | (394,737 | ) | | | (1,235,475 | ) | | | 443,407 | | | | 1,090,896 | | | | (429,404 | ) | | | 39,697 | | |
See notes to financial statements.
31
Victory Portfolios | | Financial Highlights | |
For a Share Outstanding Throughout Each Period
| | | Victory RS Small Cap Growth Fund | |
| | | Class A Shares | |
| | | Six
Months
Ended
June 30,
2018 | | Year
Ended
December 31,
2017 | | Year
Ended
December 31,
2016 | | Year
Ended
December 31,
2015 | | Year
Ended
December 31,
2014 | | Year
Ended
December 31,
2013 | |
| | | (Unaudited) | | | | | | | | | | | |
Net Asset Value, Beginning of Period | | $ | 80.96 | | | $ | 65.31 | | | $ | 64.73 | | | $ | 65.53 | | | $ | 63.68 | | | $ | 46.71 | | |
Investment Activities: | |
Net investment income (loss) (a) | | | (0.40 | ) | | | (0.75 | ) | | | (0.55 | ) | | | (0.74 | ) | | | (0.71 | ) | | | (0.64 | ) | |
Net realized and unrealized
gains (losses) on investments | | | 10.57 | | | | 24.13 | | | | 1.13 | | | | 0.80 | | | | 6.64 | | | | 23.37 | | |
Total from Investment
Activities | | | 10.17 | | | | 23.38 | | | | 0.58 | | | | 0.06 | | | | 5.93 | | | | 22.73 | | |
Distributions to Shareholders: | |
Net investment income | | | — | | | | — | | | | — | | | | — | | | | (0.57 | ) | | | (0.86 | ) | |
Net realized gains
from investments | | | — | | | | (7.73 | ) | | | — | | | | (0.86 | ) | | | (3.51 | ) | | | (4.90 | ) | |
Total Distributions to
Shareholders | | | — | | | | (7.73 | ) | | | — | | | | (0.86 | ) | | | (4.08 | ) | | | (5.76 | ) | |
Net Asset Value, End of Period | | $ | 91.13 | | | $ | 80.96 | | | $ | 65.31 | | | $ | 64.73 | | | $ | 65.53 | | | $ | 63.68 | | |
Total Return (excludes sales
charge) (b) | | | 12.55 | % | | | 36.86 | % | | | 0.90 | % | | | 0.08 | % | | | 9.36 | % | | | 49.22 | % | |
Ratios/Supplemental Data: | |
Net Assets at end of period (000) | | $ | 657,136 | | | $ | 575,227 | | | $ | 481,125 | | | $ | 767,304 | | | $ | 618,656 | | | $ | 499,282 | | |
Ratio of net expenses to average
net assets (c) | | | 1.40 | % | | | 1.40 | % | | | 1.40 | % | | | 1.40 | % | | | 1.38 | % | | | 1.35 | % | |
Ratio of net investment income
(loss) to average net assets (c) | | | (0.92 | )% | | | (1.00 | )% | | | (0.92 | )% | | | (1.07 | )% | | | (1.12 | )% | | | (1.12 | )% | |
Ratio of gross expenses to average
net assets (c) (d) | | | 1.43 | % | | | 1.44 | % | | | 1.45 | % | | | 1.41 | % | | | 1.42 | % | | | 1.41 | % | |
Portfolio turnover (b) (e) | | | 38 | % | | | 107 | % | | | 91 | % | | | 94 | % | | | 104 | % | | | 115 | % | |
(a) Per share net investment income (loss) has been calculated using the average daily shares method.
(b) Not annualized for periods less than one year.
(c) Annualized for periods less than one year.
(d) During the period, certain fees were reduced and/or reimbursed. If such fee reductions and/or reimbursements had not occurred, the ratios would have been as indicated.
(e) Portfolio turnover is calculated on the basis of the Fund as a whole without distinguishing between the classes of shares issued.
See notes to financial statements.
32
Victory Portfolios | | Financial Highlights — continued | |
For a Share Outstanding Throughout Each Period
| | | Victory RS Small Cap Growth Fund | |
| | | Class C Shares | |
| | | Six
Months
Ended
June 30,
2018 | | Year
Ended
December 31,
2017 | | Year
Ended
December 31,
2016 | | Year
Ended
December 31,
2015 | | Year
Ended
December 31,
2014 | | Year
Ended
December 31,
2013 | |
| | | (Unaudited) | | | | | | | | | | | |
Net Asset Value, Beginning of Period | | $ | 71.70 | | | $ | 58.97 | | | $ | 58.90 | | | $ | 60.15 | | | $ | 58.84 | | | $ | 43.78 | | |
Investment Activities: | |
Net investment income (loss) (a) | | | (0.64 | ) | | | (1.18 | ) | | | (0.90 | ) | | | (1.15 | ) | | | (1.09 | ) | | | (1.09 | ) | |
Net realized and unrealized
gains (losses) on investments | | | 9.34 | | | | 21.64 | | | | 0.97 | | | | 0.76 | | | | 6.08 | | | | 21.79 | | |
Total from Investment
Activities | | | 8.70 | | | | 20.46 | | | | 0.07 | | | | (0.39 | ) | | | 4.99 | | | | 20.70 | | |
Distributions to Shareholders: | |
Net investment income | | | — | | | | — | | | | — | | | | — | | | | (0.17 | ) | | | (0.74 | ) | |
Net realized gains
from investments | | | — | | | | (7.73 | ) | | | — | | | | (0.86 | ) | | | (3.51 | ) | | | (4.90 | ) | |
Total Distributions to
Shareholders | | | — | | | | (7.73 | ) | | | — | | | | (0.86 | ) | | | (3.68 | ) | | | (5.64 | ) | |
Net Asset Value, End of Period | | $ | 80.40 | | | $ | 71.70 | | | $ | 58.97 | | | $ | 58.90 | | | $ | 60.15 | | | $ | 58.84 | | |
Total Return (excludes contingent
deferred sales charge) (b) | | | 12.12 | % | | | 35.84 | % | | | 0.12 | % | | | (0.67 | )% | | | 8.52 | % | | | 47.86 | % | |
Ratios/Supplemental Data: | |
Net Assets at end of period (000) | | $ | 16,229 | | | $ | 13,633 | | | $ | 13,035 | | | $ | 20,878 | | | $ | 11,792 | | | $ | 6,608 | | |
Ratio of net expenses to average
net assets (c) | | | 2.16 | % | | | 2.16 | % | | | 2.16 | % | | | 2.16 | % | | | 2.15 | % | | | 2.27 | % | |
Ratio of net investment income
(loss) to average net assets (c) | | | (1.68 | )% | | | (1.75 | )% | | | (1.67 | )% | | | (1.67 | )% | | | (1.88 | )% | | | (1.98 | )% | |
Ratio of gross expenses to average
net assets (c) (d) | | | 2.24 | % | | | 2.23 | % | | | 2.22 | % | | | 2.22 | % | | | 2.29 | % | | | 2.32 | % | |
Portfolio turnover (b) (e) | | | 38 | % | | | 107 | % | | | 91 | % | | | 94 | % | | | 104 | % | | | 115 | % | |
(a) Per share net investment income (loss) has been calculated using the average daily shares method.
(b) Not annualized for periods less than one year.
(c) Annualized for periods less than one year.
(d) During the period, certain fees were reduced and/or reimbursed. If such fee reductions and/or reimbursements had not occurred, the ratios would have been as indicated.
(e) Portfolio turnover is calculated on the basis of the Fund as a whole without distinguishing between the classes of shares issued.
See notes to financial statements.
33
Victory Portfolios | | Financial Highlights — continued | |
For a Share Outstanding Throughout Each Period
| | | Victory RS Small Cap Growth Fund | |
| | | Class R Shares | |
| | | Six
Months
Ended
June 30,
2018 | | Year
Ended
December 31,
2017 | | Year
Ended
December 31,
2016 | | Year
Ended
December 31,
2015 | | Year
Ended
December 31,
2014 | | Year
Ended
December 31,
2013 | |
| | | (Unaudited) | | | | | | | | | | | |
Net Asset Value, Beginning of Period | | $ | 75.55 | | | $ | 61.63 | | | $ | 61.27 | | | $ | 62.28 | | | $ | 60.77 | | | $ | 44.85 | | |
Investment Activities: | |
Net investment income (loss) (a) | | | (0.55 | ) | | | (1.04 | ) | | | (0.68 | ) | | | (0.93 | ) | | | (0.94 | ) | | | (0.90 | ) | |
Net realized and unrealized
gains (losses) on investments | | | 9.85 | | | | 22.69 | | | | 1.04 | | | | 0.78 | | | | 6.29 | | | | 22.38 | | |
Total from Investment
Activities | | | 9.30 | | | | 21.65 | | | | 0.36 | | | | (0.15 | ) | | | 5.35 | | | | 21.48 | | |
Distributions to Shareholders: | |
Net investment income | | | — | | | | — | | | | — | | | | — | | | | (0.33 | ) | | | (0.66 | ) | |
Net realized gains
from investments | | | — | | | | (7.73 | ) | | | — | | | | (0.86 | ) | | | (3.51 | ) | | | (4.90 | ) | |
Total Distributions to
Shareholders | | | — | | | | (7.73 | ) | | | — | | | | (0.86 | ) | | | (3.84 | ) | | | (5.56 | ) | |
Net Asset Value, End of Period | | $ | 84.85 | | | $ | 75.55 | | | $ | 61.63 | | | $ | 61.27 | | | $ | 62.28 | | | $ | 60.77 | | |
Total Return (b) | | | 12.31 | % | | | 36.24 | % | | | 0.59 | % | | | (0.26 | )% | | | 8.86 | % | | | 48.45 | % | |
Ratios/Supplemental Data: | |
Net Assets at end of period (000) | | $ | 11,157 | | | $ | 7,698 | | | $ | 5,371 | | | $ | 5,241 | | | $ | 2,621 | | | $ | 1,782 | | |
Ratio of net expenses to
average net assets (c) | | | 1.85 | % | | | 1.86 | % | | | 1.70 | % | | | 1.75 | % | | | 1.84 | % | | | 1.87 | % | |
Ratio of net investment income (loss)
to average net assets (c) | | | (1.37 | )% | | | (1.46 | )% | | | (1.20 | )% | | | (1.41 | )% | | | (1.58 | )% | | | (1.62 | )% | |
Ratio of gross expenses to
average net assets (c) (d) | | | 1.85 | % | | | 1.94 | % | | | 1.70 | % | | | 1.75 | % | | | 1.88 | % | | | 1.92 | % | |
Portfolio turnover (b) (e) | | | 38 | % | | | 107 | % | | | 91 | % | | | 94 | % | | | 104 | % | | | 115 | % | |
(a) Per share net investment income (loss) has been calculated using the average daily shares method.
(b) Not annualized for periods less than one year.
(c) Annualized for periods less than one year.
(d) During the period, certain fees were reduced and/or reimbursed. If such fee reductions and/or reimbursements had not occurred, the ratios would have been as indicated.
(e) Portfolio turnover is calculated on the basis of the Fund as a whole without distinguishing between the classes of shares issued.
See notes to financial statements.
34
Victory Portfolios | | Financial Highlights — continued | |
For a Share Outstanding Throughout Each Period
| | | Victory RS Small Cap Growth Fund | |
| | | Class R6 Shares | |
| | | Six
Months
Ended
June 30,
2018 | | Period
Ended
December 31,
2017(a) | |
| | | (Unaudited) | | | |
Net Asset Value, Beginning of Period | | $ | 83.67 | | | $ | 79.23 | | |
Investment Activities: | |
Net investment income (loss) (b) | | | (0.25 | ) | | | (0.41 | ) | |
Net realized and unrealized gains (losses) on investments | | | 10.91 | | | | 12.58 | | |
Total from Investment Activities | | | 10.66 | | | | 12.17 | | |
Distributions to Shareholders: | |
Net realized gains from investments | | | — | | | | (7.73 | ) | |
Total Distributions to Shareholders | | | — | | | | (7.73 | ) | |
Net Asset Value, End of Period | | $ | 94.33 | | | $ | 83.67 | | |
Total Return (c) | | | 12.74 | % | | | 16.23 | % | |
Ratios/Supplemental Data: | |
Net Assets at end of period (000) | | $ | 73,405 | | | $ | 25,551 | | |
Ratio of net expenses to average net assets (d) | | | 1.06 | % | | | 1.06 | % | |
Ratio of net investment income (loss) to average net assets (d) | | | (0.56 | )% | | | (1.03 | )% | |
Ratio of gross expenses to average net assets (d) (e) | | | 1.11 | % | | | 1.41 | % | |
Portfolio turnover (c) (f) | | | 38 | % | | | 107 | % | |
(a) Class R6 Shares commenced operations on July 12, 2017.
(b) Per share net investment income (loss) has been calculated using the average daily shares method.
(c) Not annualized for periods less than one year.
(d) Annualized for periods less than one year.
(e) During the period, certain fees were reduced and/or reimbursed. If such fee reductions and/or reimbursements had not occurred, the ratios would have been as indicated.
(f) Portfolio turnover is calculated on the basis of the Fund as a whole without distinguishing between the classes of shares issued.
See notes to financial statements.
35
Victory Portfolios | | Financial Highlights — continued | |
For a Share Outstanding Throughout Each Period
| | | Victory RS Small Cap Growth Fund | |
| | | Class Y Shares | |
| | | Six
Months
Ended
June 30,
2018 | | Year
Ended
December 31,
2017 | | Year
Ended
December 31,
2016 | | Year
Ended
December 31,
2015 | | Year
Ended
December 31,
2014 | | Year
Ended
December 31,
2013 | |
| | | (Unaudited) | | | | | | | | | | | |
Net Asset Value, Beginning of
Period | | $ | 83.64 | | | $ | 67.08 | | | $ | 66.32 | | | $ | 67.04 | | | $ | 65.06 | | | $ | 47.65 | | |
Investment Activities: | |
Net investment income
(loss) (a) | | | (0.29 | ) | | | (0.53 | ) | | | (0.39 | ) | | | (0.56 | ) | | | (0.54 | ) | | | (0.52 | ) | |
Net realized and unrealized
gains (losses) on
investments | | | 10.92 | | | | 24.82 | | | | 1.16 | | | | 0.81 | | | | 6.79 | | | | 23.90 | | |
Total from Investment
Activities | | | 10.63 | | | | 24.29 | | | | 0.77 | | | | 0.25 | | | | 6.25 | | | | 23.38 | | |
Distributions to Shareholders: | |
Net investment income | | | — | | | | — | | | | (0.01 | ) | | | (0.11 | ) | | | (0.76 | ) | | | (1.07 | ) | |
Net realized gains
from investments | | | — | | | | (7.73 | ) | | | — | | | | (0.86 | ) | | | (3.51 | ) | | | (4.90 | ) | |
Total Distributions to
Shareholders | | | — | | | | (7.73 | ) | | | (0.01 | ) | | | (0.97 | ) | | | (4.27 | ) | | | (5.97 | ) | |
Net Asset Value, End of Period | | $ | 94.27 | | | $ | 83.64 | | | $ | 67.08 | | | $ | 66.32 | | | $ | 67.04 | | | $ | 65.06 | | |
Total Return (b) | | | 12.71 | % | | | 37.23 | % | | | 1.16 | % | | | 0.36 | % | | | 9.65 | % | | | 49.63 | % | |
Ratios/Supplemental Data: | |
Net Assets at end of period (000) | | $ | 1,294,002 | | | $ | 1,081,427 | | | $ | 1,379,669 | | | $ | 1,576,927 | | | $ | 504,974 | | | $ | 285,659 | | |
Ratio of net expenses to
average net assets (c) | | | 1.13 | % | | | 1.13 | % | | | 1.13 | % | | | 1.13 | % | | | 1.11 | % | | | 1.11 | % | |
Ratio of net investment income (loss)
to average net assets (c) | | | (0.65 | )% | | | (0.68 | )% | | | (0.64 | )% | | | (0.79 | )% | | | (0.84 | )% | | | (0.85 | )% | |
Ratio of gross expenses to
average net assets (c) (d) | | | 1.16 | % | | | 1.17 | % | | | 1.21 | % | | | 1.18 | % | | | 1.13 | % | | | 1.17 | % | |
Portfolio turnover (d) (e) | | | 38 | % | | | 107 | % | | | 91 | % | | | 94 | % | | | 104 | % | | | 115 | % | |
(a) Per share net investment income (loss) has been calculated using the average daily shares method.
(b) Not annualized for periods less than one year.
(c) Annualized for periods less than one year.
(d) During the period, certain fees were reduced and/or reimbursed. If such fee reductions and/or reimbursements had not occurred, the ratios would have been as indicated.
(e) Portfolio turnover is calculated on the basis of the Fund as a whole without distinguishing between the classes of shares issued.
See notes to financial statements.
36
Victory Portfolios | | Financial Highlights | |
For a Share Outstanding Throughout Each Period
| | | Victory RS Select Growth Fund | |
| | | Class A Shares | |
| | | Six
Months
Ended
June 30,
2018 | | Year
Ended
December 31,
2017 | | Year
Ended
December 31,
2016 | | Year
Ended
December 31,
2015 | | Year
Ended
December 31,
2014 | | Year
Ended
December 31,
2013 | |
| | | (Unaudited) | | | | | | | | | | | |
Net Asset Value, Beginning of Period | | $ | 46.03 | | | $ | 45.04 | | | $ | 43.54 | | | $ | 47.80 | | | $ | 49.57 | | | $ | 36.52 | | |
Investment Activities: | |
Net investment income (loss) (a) | | | (0.17 | ) | | | (0.43 | ) | | | (0.32 | ) | | | (0.41 | ) | | | (0.52 | ) | | | (0.50 | ) | |
Net realized and unrealized
gains (losses) on
investments | | | 3.95 | | | | 8.16 | | | | 3.30 | | | | 0.24 | | | | 1.08 | | | | 14.27 | | |
Total from Investment
Activities | | | 3.78 | | | | 7.73 | | | | 2.98 | | | | (0.17 | ) | | | 0.56 | | | | 13.77 | | |
Distributions to Shareholders: | |
Net realized gains from
investments | | | — | | | | (6.74 | ) | | | (1.48 | ) | | | (4.09 | ) | | | (2.33 | ) | | | (0.72 | ) | |
Total Distributions to
Shareholders | | | — | | | | (6.74 | ) | | | (1.48 | ) | | | (4.09 | ) | | | (2.33 | ) | | | (0.72 | ) | |
Net Asset Value, End of Period | | $ | 49.81 | | | $ | 46.03 | | | $ | 45.04 | | | $ | 43.54 | | | $ | 47.80 | | | $ | 49.57 | | |
Total Return (excludes sales
charge) (b) | | | 8.21 | % | | | 17.10 | % | | | 6.85 | % | | | (0.38 | )% | | | 1.16 | % | | | 37.79 | % | |
Ratios/Supplemental Data: | |
Net Assets at end of period (000) | | $ | 142,804 | | | $ | 147,531 | | | $ | 170,825 | | | $ | 237,899 | | | $ | 284,499 | | | $ | 438,084 | | |
Ratio of net expenses to
average net assets (c) | | | 1.40 | % | | | 1.40 | % | | | 1.40 | % | | | 1.40 | % | | | 1.38 | % | | | 1.35 | % | |
Ratio of net investment income (loss)
to average net assets (c) | | | (0.71 | )% | | | (0.88 | )% | | | (0.74 | )% | | | (0.84 | )% | | | (1.08 | )% | | | (1.14 | )% | |
Ratio of gross expenses to
average net assets (c) (d) | | | 1.50 | % | | | 1.49 | % | | | 1.47 | % | | | 1.44 | % | | | 1.43 | % | | | 1.45 | % | |
Portfolio turnover (b) (e) | | | 35 | % | | | 69 | % | | | 89 | % | | | 86 | % | | | 96 | % | | | 105 | % | |
(a) Per share net investment income (loss) has been calculated using the average daily shares method.
(b) Not annualized for periods less than one year.
(c) Annualized for periods less than one year.
(d) During the period, certain fees were reduced and/or reimbursed. If such fee reductions and/or reimbursements had not occurred, the ratios would have been as indicated.
(e) Portfolio turnover is calculated on the basis of the Fund as a whole without distinguishing between the classes of shares issued.
See notes to financial statements.
37
Victory Portfolios | | Financial Highlights — continued | |
For a Share Outstanding Throughout Each Period
| | | Victory RS Select Growth Fund | |
| | | Class C Shares | |
| | | Six
Months
Ended
June 30,
2018 | | Year
Ended
December 31,
2017 | | Year
Ended
December 31,
2016 | | Year
Ended
December 31,
2015 | | Year
Ended
December 31,
2014 | | Year
Ended
December 31,
2013 | |
| | | (Unaudited) | | | | | | | | | | | |
Net Asset Value, Beginning of Period | | $ | 40.80 | | | $ | 40.89 | | | $ | 39.97 | | | $ | 44.57 | | | $ | 46.73 | | | $ | 34.74 | | |
Investment Activities: | |
Net investment income (loss) (a) | | | (0.32 | ) | | | (0.73 | ) | | | (0.60 | ) | | | (0.74 | ) | | | (0.83 | ) | | | (0.82 | ) | |
Net realized and unrealized
gains (losses) on investments | | | 3.50 | | | | 7.38 | | | | 3.00 | | | | 0.23 | | | | 1.00 | | | | 13.53 | | |
Total from Investment
Activities | | | 3.18 | | | | 6.65 | | | | 2.40 | | | | (0.51 | ) | | | 0.17 | | | | 12.71 | | |
Distributions to Shareholders: | |
Net realized gains from
investments | | | — | | | | (6.74 | ) | | | (1.48 | ) | | | (4.09 | ) | | | (2.33 | ) | | | (0.72 | ) | |
Total Distributions
to Shareholders | | | — | | | | (6.74 | ) | | | (1.48 | ) | | | (4.09 | ) | | | (2.33 | ) | | | (0.72 | ) | |
Net Asset Value, End of Period | | $ | 43.98 | | | $ | 40.80 | | | $ | 40.89 | | | $ | 39.97 | | | $ | 44.57 | | | $ | 46.73 | | |
Total Return (excludes contingent
deferred sales charge) (b) | | | 7.77 | % | | | 16.19 | % | | | 6.04 | % | | | (1.17 | )% | | | 0.39 | % | | | 36.67 | % | |
Ratios/Supplemental Data: | |
Net Assets at end of period (000) | | $ | 49,468 | | | $ | 51,208 | | | $ | 63,841 | | | $ | 82,838 | | | $ | 86,025 | | | $ | 88,208 | | |
Ratio of net expenses to average
net assets (c) | | | 2.18 | % | | | 2.18 | % | | | 2.18 | % | | | 2.18 | % | | | 2.16 | % | | | 2.16 | % | |
Ratio of net investment income
(loss) to average net assets (c) | | | (1.49 | )% | | | (1.66 | )% | | | (1.52 | )% | | | (1.62 | )% | | | (1.85 | )% | | | (1.94 | )% | |
Ratio of gross expenses to average
net assets (c) (d) | | | 2.25 | % | | | 2.24 | % | | | 2.23 | % | | | 2.20 | % | | | 2.25 | % | | | 2.26 | % | |
Portfolio turnover (b) (e) | | | 35 | % | | | 69 | % | | | 89 | % | | | 86 | % | | | 96 | % | | | 105 | % | |
(a) Per share net investment income (loss) has been calculated using the average daily shares method.
(b) Not annualized for periods less than one year.
(c) Annualized for periods less than one year.
(d) During the period, certain fees were reduced and/or reimbursed. If such fee reductions and/or reimbursements had not occurred, the ratios would have been as indicated.
(e) Portfolio turnover is calculated on the basis of the Fund as a whole without distinguishing between the classes of shares issued.
See notes to financial statements.
38
Victory Portfolios | | Financial Highlights — continued | |
For a Share Outstanding Throughout Each Period
| | | Victory RS Select Growth Fund | |
| | | Class R Shares | |
| | | Six
Months
Ended
June 30,
2018 | | Year
Ended
December 31,
2017 | | Year
Ended
December 31,
2016 | | Year
Ended
December 31,
2015 | | Year
Ended
December 31,
2014 | | Year
Ended
December 31,
2013 | |
| | | (Unaudited) | | | | | | | | | | | |
Net Asset Value, Beginning of Period | | $ | 41.06 | | | $ | 41.00 | | | $ | 39.93 | | | $ | 44.40 | | | $ | 46.38 | | | $ | 34.43 | | |
Investment Activities: | |
Net investment income (loss) (a) | | | (0.26 | ) | | | (0.61 | ) | | | (0.46 | ) | | | (0.59 | ) | | | (0.71 | ) | | | (0.71 | ) | |
Net realized and unrealized
gains (losses) on investments | | | 3.52 | | | | 7.41 | | | | 3.01 | | | | 0.21 | | | | 1.06 | | | | 13.38 | | |
Total from Investment
Activities | | | 3.26 | | | | 6.80 | | | | 2.55 | | | | (0.38 | ) | | | — | | | | 12.67 | | |
Distributions to Shareholders: | |
Net realized gains from
investments | | | — | | | | (6.74 | ) | | | (1.48 | ) | | | (4.09 | ) | | | (2.33 | ) | | | (0.72 | ) | |
Total Distributions
to Shareholders | | | — | | | | (6.74 | ) | | | (1.48 | ) | | | (4.09 | ) | | | (2.33 | ) | | | (0.72 | ) | |
Net Asset Value, End of Period | | $ | 44.32 | | | $ | 41.06 | | | $ | 41.00 | | | $ | 39.93 | | | $ | 44.40 | | | $ | 46.38 | | |
Total Return (b) | | | 7.94 | % | | | 16.51 | % | | | 6.39 | % | | | (0.88 | )% | | | 0.78 | % | | | 36.89 | % | |
Ratios/Supplemental Data: | |
Net Assets at end of period (000) | | $ | 968 | | | $ | 1,014 | | | $ | 1,440 | | | $ | 1,843 | | | $ | 1,239 | | | $ | 1,052 | | |
Ratio of net expenses to average
net assets (c) | | | 1.91 | % | | | 1.91 | % | | | 1.82 | % | | | 1.90 | % | | | 1.89 | % | | | 1.92 | % | |
Ratio of net investment income
(loss) to average net assets (c) | | | (1.22 | )% | | | (1.39 | )% | | | (1.17 | )% | | | (1.30 | )% | | | (1.57 | )% | | | (1.71 | )% | |
Ratio of gross expenses to average
net assets (c) (d) | | | 3.51 | % | | | 2.90 | % | | | 1.82 | % | | | 1.90 | % | | | 1.97 | % | | | 2.02 | % | |
Portfolio turnover (b) (e) | | | 35 | % | | | 69 | % | | | 89 | % | | | 86 | % | | | 96 | % | | | 105 | % | |
(a) Per share net investment income (loss) has been calculated using the average daily shares method.
(b) Not annualized for periods less than one year.
(c) Annualized for periods less than one year.
(d) During the period, certain fees were reduced and/or reimbursed. If such fee reductions and/or reimbursements had not occurred, the ratios would have been as indicated.
(e) Portfolio turnover is calculated on the basis of the Fund as a whole without distinguishing between the classes of shares issued.
See notes to financial statements.
39
Victory Portfolios | | Financial Highlights — continued | |
For a Share Outstanding Throughout Each Period
| | | Victory RS Select Growth Fund | |
| | | Class R6 Shares | |
| | | Six
Months
Ended
June 30,
2018 | | Year
Ended
December 31,
2017 | | Period
Ended
December 31,
2016(a) | |
| | | (Unaudited) | | | | | |
Net Asset Value, Beginning of Period | | $ | 47.53 | | | $ | 46.16 | | | $ | 46.65 | | |
Investment Activities: | |
Net investment income (loss) (b) | | | (0.09 | ) | | | (0.28 | ) | | | (0.03 | ) | |
Net realized and unrealized gains
(losses) on investments | | | 4.07 | | | | 8.39 | | | | 1.02 | | |
Total from Investment Activities | | | 3.98 | | | | 8.11 | | | | 0.99 | | |
Distributions to Shareholders: | |
Net realized gains from investments | | | — | | | | (6.74 | ) | | | (1.48 | ) | |
Total Distributions to Shareholders | | | — | | | | (6.74 | ) | | | (1.48 | ) | |
Net Asset Value, End of Period | | $ | 51.51 | | | $ | 47.53 | | | $ | 46.16 | | |
Total Return (c) | | | 8.39 | % | | | 17.48 | % | | | 2.15 | % | |
Ratios/Supplemental Data: | |
Net Assets at end of period (000) | | $ | 205 | | | $ | 151 | | | $ | 51 | | |
Ratio of net expenses to average net assets (d) | | | 1.06 | % | | | 1.06 | % | | | 1.06 | % | |
Ratio of net investment income (loss) to
average net assets (d) | | | (0.38 | )% | | | (0.55 | )% | | | (0.43 | )% | |
Ratio of gross expenses to average net assets (d) (e) | | | 7.75 | % | | | 27.47 | % | | | 26.37 | % | |
Portfolio turnover (c) (f) | | | 35 | % | | | 69 | % | | | 89 | % | |
(a) Class R6 Shares commenced operations on November 15, 2016.
(b) Per share net investment income (loss) has been calculated using the average daily shares method.
(c) Not annualized for periods less than one year.
(d) Annualized for periods less than one year.
(e) During the period, certain fees were reduced and/or reimbursed. If such fee reductions and/or reimbursements had not occurred, the ratios would have been as indicated.
(f) Portfolio turnover is calculated on the basis of the Fund as a whole without distinguishing between the classes of shares issued.
See notes to financial statements.
40
Victory Portfolios | | Financial Highlights — continued | |
For a Share Outstanding Throughout Each Period
| | | Victory RS Select Growth Fund | |
| | | Class Y Shares | |
| | | Six
Months
Ended
June 30,
2018 | | Year
Ended
December 31,
2017 | | Year
Ended
December 31,
2016 | | Year
Ended
December 31,
2015 | | Year
Ended
December 31,
2014 | | Year
Ended
December 31,
2013 | |
| | | (Unaudited) | | | | | | | | | | | |
Net Asset Value, Beginning of Period | | $ | 47.47 | | | $ | 46.15 | | | $ | 44.47 | | | $ | 48.61 | | | $ | 50.24 | | | $ | 36.90 | | |
Investment Activities: | |
Net investment income (loss) (a) | | | (0.11 | ) | | | (0.31 | ) | | | (0.21 | ) | | | (0.29 | ) | | | (0.39 | ) | | | (0.39 | ) | |
Net realized and unrealized
gains (losses) on
investments | | | 4.08 | | | | 8.37 | | | | 3.37 | | | | 0.24 | | | | 1.09 | | | | 14.45 | | |
Total from Investment
Activities | | | 3.97 | | | | 8.06 | | | | 3.16 | | | | (0.05 | ) | | | 0.70 | | | | 14.06 | | |
Distributions to Shareholders: | |
Net realized gains from
investments | | | — | | | | (6.74 | ) | | | (1.48 | ) | | | (4.09 | ) | | | (2.33 | ) | | | (0.72 | ) | |
Total Distributions to
Shareholders | | | — | | | | (6.74 | ) | | | (1.48 | ) | | | (4.09 | ) | | | (2.33 | ) | | | (0.72 | ) | |
Net Asset Value, End of Period | | $ | 51.44 | | | $ | 47.47 | | | $ | 46.15 | | | $ | 44.47 | | | $ | 48.61 | | | $ | 50.24 | | |
Total Return (b) | | | 8.34 | % | | | 17.40 | % | | | 7.13 | % | | | (0.12 | )% | | | 1.42 | % | | | 38.19 | % | |
Ratios/Supplemental Data: | |
Net Assets at end of period (000) | | $ | 191,434 | | | $ | 244,689 | | | $ | 287,970 | | | $ | 402,965 | | | $ | 474,596 | | | $ | 462,256 | | |
Ratio of net expenses to
average net assets (c) | | | 1.14 | % | | | 1.14 | % | | | 1.14 | % | | | 1.14 | % | | | 1.12 | % | | | 1.09 | % | |
Ratio of net investment income (loss)
to average net assets (c) | | | (0.44 | )% | | | (0.62 | )% | | | (0.49 | )% | | | (0.58 | )% | | | (0.81 | )% | | | (0.87 | )% | |
Ratio of gross expenses to
average net assets (c) (d) | | | 1.22 | % | | | 1.20 | % | | | 1.20 | % | | | 1.18 | % | | | 1.18 | % | | | 1.19 | % | |
Portfolio turnover (b) (e) | | | 35 | % | | | 69 | % | | | 89 | % | | | 86 | % | | | 96 | % | | | 105 | % | |
(a) Per share net investment income (loss) has been calculated using the average daily shares method.
(b) Not annualized for periods less than one year.
(c) Annualized for periods less than one year.
(d) During the period, certain fees were reduced and/or reimbursed. If such fee reductions and/or reimbursements had not occurred, the ratios would have been as indicated.
(e) Portfolio turnover is calculated on the basis of the Fund as a whole without distinguishing between the classes of shares issued.
See notes to financial statements.
41
Victory Portfolios | | Financial Highlights | |
For a Share Outstanding Throughout Each Period
| | | Victory RS Mid Cap Growth Fund | |
| | | Class A Shares | |
| | | Six
Months
Ended
June 30,
2018 | | Year
Ended
December 31,
2017 | | Year
Ended
December 31,
2016 | | Year
Ended
December 31,
2015 | | Year
Ended
December 31,
2014 | | Year
Ended
December 31,
2013 | |
| | | (Unaudited) | | | | | | | | | | | |
Net Asset Value, Beginning of Period | | $ | 25.77 | | | $ | 21.32 | | | $ | 20.29 | | | $ | 20.14 | | | $ | 18.83 | | | $ | 13.07 | | |
Investment Activities: | |
Net investment income (loss) (a) | | | (0.06 | ) | | | (0.10 | ) | | | (0.07 | ) | | | (0.08 | ) | | | (0.15 | ) | | | (0.12 | ) | |
Net realized and unrealized
gains (losses) on
investments | | | 1.60 | | | | 4.55 | | | | 1.10 | | | | 0.23 | | | | 1.46 | | | | 5.88 | | |
Total from Investment
Activities | | | 1.54 | | | | 4.45 | | | | 1.03 | | | | 0.15 | | | | 1.31 | | | | 5.76 | | |
Net Asset Value, End of Period | | $ | 27.31 | | | $ | 25.77 | | | $ | 21.32 | | | $ | 20.29 | | | $ | 20.14 | | | $ | 18.83 | | |
Total Return (excludes
sales charge) (b) | | | 5.98 | % | | | 20.87 | % | | | 5.08 | % | | | 0.74 | % | | | 6.96 | % | | | 44.07 | % | |
Ratios/Supplemental Data: | |
Net Assets at end of period (000) | | $ | 99,126 | | | $ | 108,271 | | | $ | 231,056 | | | $ | 196,437 | | | $ | 104,407 | | | $ | 78,612 | | |
Ratio of net expenses to
average net assets (c) | | | 1.20 | % | | | 1.20 | % | | | 1.20 | % | | | 1.23 | % | | | 1.29 | % | | | 1.28 | % | |
Ratio of net investment income (loss)
to average net assets (c) | | | (0.45 | )% | | | (0.44 | )% | | | (0.35 | )% | | | (0.39 | )% | | | (0.81 | )% | | | (0.78 | )% | |
Ratio of gross expenses to
average net assets (c) (d) | | | 1.35 | % | | | 1.29 | % | | | 1.27 | % | | | 1.31 | % | | | 1.38 | % | | | 1.45 | % | |
Portfolio turnover (b) (e) | | | 42 | % | | | 86 | % | | | 138 | % | | | 120 | % | | | 154 | % | | | 119 | % | |
(a) Per share net investment income (loss) has been calculated using the average daily shares method.
(b) Not annualized for periods less than one year.
(c) Annualized for periods less than one year.
(d) During the period, certain fees were reduced and/or reimbursed. If such fee reductions and/or reimbursements had not occurred, the ratios would have been as indicated.
(e) Portfolio turnover is calculated on the basis of the Fund as a whole without distinguishing between the classes of shares issued.
See notes to financial statements.
42
Victory Portfolios | | Financial Highlights — continued | |
For a Share Outstanding Throughout Each Period
| | | Victory RS Mid Cap Growth Fund | |
| | | Class C Shares | |
| | | Six
Months
Ended
June 30,
2018 | | Year
Ended
December 31,
2017 | | Year
Ended
December 31,
2016 | | Year
Ended
December 31,
2015 | | Year
Ended
December 31,
2014 | | Year
Ended
December 31,
2013 | |
| | | (Unaudited) | | | | | | | | | | | |
Net Asset Value, Beginning of Period | | $ | 23.22 | | | $ | 19.38 | | | $ | 18.61 | | | $ | 18.64 | | | $ | 17.56 | | | $ | 12.30 | | |
Investment Activities: | |
Net investment income (loss) (a) | | | (0.16 | ) | | | (0.28 | ) | | | (0.23 | ) | | | (0.25 | ) | | | (0.28 | ) | | | (0.24 | ) | |
Net realized and unrealized
gains (losses) on investments | | | 1.43 | | | | 4.12 | | | | 1.00 | | | | 0.22 | | | | 1.36 | | | | 5.50 | | |
Total from Investment
Activities | | | 1.27 | | | | 3.84 | | | | 0.77 | | | | (0.03 | ) | | | 1.08 | | | | 5.26 | | |
Net Asset Value, End of Period | | $ | 24.49 | | | $ | 23.22 | | | $ | 19.38 | | | $ | 18.61 | | | $ | 18.64 | | | $ | 17.56 | | |
Total Return (excludes contingent
deferred sales charge) (b) | | | 5.51 | % | | | 19.81 | % | | | 4.14 | % | | | (0.16 | )% | | | 6.15 | % | | | 42.76 | % | |
Ratios/Supplemental Data: | |
Net Assets at end of period (000) | | $ | 22,224 | | | $ | 23,264 | | | $ | 24,618 | | | $ | 26,793 | | | $ | 13,040 | | | $ | 4,851 | | |
Ratio of net expenses to average
net assets (c) | | | 2.11 | % | | | 2.10 | % | | | 2.11 | % | | | 2.11 | % | | | 2.10 | % | | | 2.14 | % | |
Ratio of net investment income
(loss) to average net assets (c) | | | (1.35 | )% | | | (1.33 | )% | | | (1.25 | )% | | | (1.30 | )% | | | (1.61 | )% | | | (1.63 | )% | |
Ratio of gross expenses to average
net assets (c) (d) | | | 2.11 | % | | | 2.10 | % | | | 2.11 | % | | | 2.11 | % | | | 2.22 | % | | | 2.31 | % | |
Portfolio turnover (b) (e) | | | 42 | % | | | 86 | % | | | 138 | % | | | 120 | % | | | 154 | % | | | 119 | % | |
(a) Per share net investment income (loss) has been calculated using the average daily shares method.
(b) Not annualized for periods less than one year.
(c) Annualized for periods less than one year.
(d) During the period, certain fees were reduced and/or reimbursed. If such fee reductions and/or reimbursements had not occurred, the ratios would have been as indicated.
(e) Portfolio turnover is calculated on the basis of the Fund as a whole without distinguishing between the classes of shares issued.
See notes to financial statements.
43
Victory Portfolios | | Financial Highlights — continued | |
For a Share Outstanding Throughout Each Period
| | | Victory RS Mid Cap Growth Fund | |
| | | Class R Shares | |
| | | Six
Months
Ended
June 30,
2018 | | Year
Ended
December 31,
2017 | | Year
Ended
December 31,
2016 | | Year
Ended
December 31,
2015 | | Year
Ended
December 31,
2014 | | Year
Ended
December 31,
2013 | |
| | | (Unaudited) | | | | | | | | | | | |
Net Asset Value, Beginning of Period | | $ | 24.14 | | | $ | 20.09 | | | $ | 19.22 | | | $ | 19.18 | | | $ | 18.01 | | | $ | 12.56 | | |
Investment Activities: | |
Net investment income (loss) (a) | | | (0.13 | ) | | | (0.23 | ) | | | (0.16 | ) | | | (0.18 | ) | | | (0.24 | ) | | | (0.19 | ) | |
Net realized and unrealized
gains (losses) on investments | | | 1.50 | | | | 4.28 | | | | 1.03 | | | | 0.22 | | | | 1.41 | | | | 5.64 | | |
Total from Investment
Activities | | | 1.37 | | | | 4.05 | | | | 0.87 | | | | 0.04 | | | | 1.17 | | | | 5.45 | | |
Net Asset Value, End of Period | | $ | 25.51 | | | $ | 24.14 | | | $ | 20.09 | | | $ | 19.22 | | | $ | 19.18 | | | $ | 18.01 | | |
Total Return (b) | | | 5.63 | % | | | 20.21 | % | | | 4.53 | % | | | 0.21 | % | | | 6.50 | % | | | 43.39 | % | |
Ratios/Supplemental Data: | |
Net Assets at end of period (000) | | $ | 1,621 | | | $ | 1,685 | | | $ | 1,486 | | | $ | 1,740 | | | $ | 1,681 | | | $ | 1,451 | | |
Ratio of net expenses to average
net assets (c) | | | 1.80 | % | | | 1.80 | % | | | 1.69 | % | | | 1.74 | % | | | 1.79 | % | | | 1.77 | % | |
Ratio of net investment income
(loss) to average net assets (c) | | | (1.04 | )% | | | (1.03 | )% | | | (0.84 | )% | | | (0.93 | )% | | | (1.31 | )% | | | (1.27 | )% | |
Ratio of gross expenses to average
net assets (c) (d) | | | 2.57 | % | | | 2.43 | % | | | 1.69 | % | | | 1.74 | % | | | 1.85 | % | | | 1.94 | % | |
Portfolio turnover (b) (e) | | | 42 | % | | | 86 | % | | | 138 | % | | | 120 | % | | | 154 | % | | | 119 | % | |
(a) Per share net investment income (loss) has been calculated using the average daily shares method.
(b) Not annualized for periods less than one year.
(c) Annualized for periods less than one year.
(d) During the period, certain fees were reduced and/or reimbursed. If such fee reductions and/or reimbursements had not occurred, the ratios would have been as indicated.
(e) Portfolio turnover is calculated on the basis of the Fund as a whole without distinguishing between the classes of shares issued.
See notes to financial statements.
44
Victory Portfolios | | Financial Highlights — continued | |
For a Share Outstanding Throughout Each Period
| | | Victory RS Mid Cap Growth Fund | |
| | | Class R6 Shares | |
| | | Six
Months
Ended
June 30,
2018 | | Year
Ended
December 31,
2017 | | Period
Ended
December 31,
2016(a) | |
| | | (Unaudited) | | | | | |
Net Asset Value, Beginning of Period | | $ | 26.55 | | | $ | 21.90 | | | $ | 21.30 | | |
Investment Activities: | |
Net investment income (loss) (b) | | | (0.02 | ) | | | (0.04 | ) | | | — | (c) | |
Net realized and unrealized gains
(losses) on investments | | | 1.64 | | | | 4.69 | | | | 0.60 | | |
Total from Investment Activities | | | 1.62 | | | | 4.65 | | | | 0.60 | | |
Net Asset Value, End of Period | | $ | 28.17 | | | $ | 26.55 | | | $ | 21.90 | | |
Total Return (d) | | | 6.10 | % | | | 21.23 | % | | | 2.82 | % | |
Ratios/Supplemental Data: | |
Net Assets at end of period (000) | | $ | 2,401 | | | $ | 2,132 | | | $ | 60 | | |
Ratio of net expenses to average net assets (e) | | | 0.94 | % | | | 0.94 | % | | | 0.94 | % | |
Ratio of net investment income
(loss) to average net assets (e) | | | (0.18 | )% | | | (0.17 | )% | | | (0.02 | )% | |
Ratio of gross expenses to average net assets (e) (f) | | | 1.47 | % | | | 2.26 | % | | | 25.90 | % | |
Portfolio turnover (d) (g) | | | 42 | % | | | 86 | % | | | 138 | % | |
(a) Class R6 Shares commenced operations on November 15, 2016.
(b) Per share net investment income (loss) has been calculated using the average daily shares method.
(c) Amount is less than $0.005 per share.
(d) Not annualized for periods less than one year.
(e) Annualized for periods less than one year.
(f) During the period, certain fees were reduced and/or reimbursed. If such fee reductions and/or reimbursements had not occurred, the ratios would have been as indicated.
(g) Portfolio turnover is calculated on the basis of the Fund as a whole without distinguishing between the classes of shares issued.
See notes to financial statements.
45
Victory Portfolios | | Financial Highlights — continued | |
For a Share Outstanding Throughout Each Period
| | | Victory RS Mid Cap Growth Fund | |
| | | Class Y Shares | |
| | | Six
Months
Ended
June 30,
2018 | | Year
Ended
December 31,
2017 | | Year
Ended
December 31,
2016 | | Year
Ended
December 31,
2015 | | Year
Ended
December 31,
2014 | | Year
Ended
December 31,
2013 | |
| | | (Unaudited) | | | | | | | | | | | |
Net Asset Value, Beginning of Period | | $ | 26.54 | | | $ | 21.90 | | | $ | 20.79 | | | $ | 20.58 | | | $ | 19.19 | | | $ | 13.29 | | |
Investment Activities: | |
Net investment income (loss) (a) | | | (0.02 | ) | | | (0.04 | ) | | | (0.02 | ) | | | (0.03 | ) | | | (0.10 | ) | | | (0.09 | ) | |
Net realized and unrealized
gains (losses) on investments | | | 1.64 | | | | 4.68 | | | | 1.13 | | | | 0.24 | | | | 1.49 | | | | 5.99 | | |
Total from Investment
Activities | | | 1.62 | | | | 4.64 | | | | 1.11 | | | | 0.21 | | | | 1.39 | | | | 5.90 | | |
Net Asset Value, End of Period | | $ | 28.16 | | | $ | 26.54 | | | $ | 21.90 | | | $ | 20.79 | | | $ | 20.58 | | | $ | 19.19 | | |
Total Return (b) | | | 6.10 | % | | | 21.19 | % | | | 5.34 | % | | | 1.02 | % | | | 7.24 | % | | | 44.39 | % | |
Ratios/Supplemental Data: | |
Net Assets at end of period (000) | | $ | 186,637 | | | $ | 310,050 | | | $ | 168,936 | | | $ | 173,629 | | | $ | 73,672 | | | $ | 18,814 | | |
Ratio of net expenses to average
net assets (c) | | | 0.95 | % | | | 0.95 | % | | | 0.95 | % | | | 0.97 | % | | | 1.04 | % | | | 1.05 | % | |
Ratio of net investment income (loss)
to average net assets (c) | | | (0.17 | )% | | | (0.18 | )% | | | (0.10 | )% | | | (0.15 | )% | | | (0.53 | )% | | | (0.55 | )% | |
Ratio of gross expenses to average
net assets (c) (d) | | | 1.04 | % | | | 1.06 | % | | | 1.05 | % | | | 1.08 | % | | | 1.11 | % | | | 1.23 | % | |
Portfolio turnover (b) (e) | | | 42 | % | | | 86 | % | | | 138 | % | | | 120 | % | | | 154 | % | | | 119 | % | |
(a) Per share net investment income (loss) has been calculated using the average daily shares method.
(b) Not annualized for periods less than one year.
(c) Annualized for periods less than one year.
(d) During the period, certain fees were reduced and/or reimbursed. If such fee reductions and/or reimbursements had not occurred, the ratios would have been as indicated.
(e) Portfolio turnover is calculated on the basis of the Fund as a whole without distinguishing between the classes of shares issued.
See notes to financial statements.
46
Victory Portfolios | | Financial Highlights | |
For a Share Outstanding Throughout Each Period
| | | Victory RS Growth Fund | |
| | | Class A Shares | |
| | | Six
Months
Ended
June 30,
2018 | | Year
Ended
December 31,
2017 | | Year
Ended
December 31,
2016 | | Year
Ended
December 31,
2015 | | Year
Ended
December 31,
2014 | | Year
Ended
December 31,
2013 | |
| | | (Unaudited) | | | | | | | | | | | |
Net Asset Value, Beginning of Period | | $ | 20.60 | | | $ | 16.44 | | | $ | 17.49 | | | $ | 18.01 | | | $ | 19.33 | | | $ | 13.46 | | |
Investment Activities: | |
Net investment income (loss) | | | (0.02 | )(a) | | | (0.02 | )(a) | | | (0.02 | )(a) | | | (0.03 | )(a) | | | (0.07 | ) | | | (0.07 | ) | |
Net realized and unrealized
gains (losses) on investments | | | 1.60 | | | | 5.24 | | | | 0.36 | | | | 0.74 | | | | 2.02 | | | | 5.94 | | |
Total from Investment
Activities | | | 1.58 | | | | 5.22 | | | | 0.34 | | | | 0.71 | | | | 1.95 | | | | 5.87 | | |
Distributions to Shareholders: | |
Net realized gains
from investments | | | — | | | | (1.06 | ) | | | (1.39 | ) | | | (1.23 | ) | | | (3.27 | ) | | | — | | |
Total Distributions to
Shareholders | | | — | | | | (1.06 | ) | | | (1.39 | ) | | | (1.23 | ) | | | (3.27 | ) | | | — | | |
Net Asset Value, End of Period | | $ | 22.18 | | | $ | 20.60 | | | $ | 16.44 | | | $ | 17.49 | | | $ | 18.01 | | | $ | 19.33 | | |
Total Return (excludes sales
charge) (b) | | | 7.67 | % | | | 31.75 | % | | | 1.86 | % | | | 3.94 | % | | | 9.98 | % | | | 43.61 | % | |
Ratios/Supplemental Data: | |
Net Assets at end of period (000) | | $ | 228,482 | | | $ | 218,238 | | | $ | 189,921 | | | $ | 204,027 | | | $ | 210,508 | | | $ | 208,309 | | |
Ratio of net expenses to
average net assets (c) | | | 1.10 | % | | | 1.10 | % | | | 1.10 | % | | | 1.10 | % | | | 1.14 | % | | | 1.26 | % | |
Ratio of net investment income (loss)
to average net assets (c) | | | (0.17 | )% | | | (0.09 | )% | | | (0.09 | )% | | | (0.18 | )% | | | (0.39 | )% | | | (0.49 | )% | |
Ratio of gross expenses to
average net assets (c) (d) | | | 1.19 | % | | | 1.20 | % | | | 1.20 | % | | | 1.19 | % | | | 1.21 | % | | | 1.26 | % | |
Portfolio turnover (b) (e) | | | 51 | % | | | 74 | % | | | 123 | % | | | 105 | % | | | 136 | % | | | 101 | % | |
(a) Per share net investment income (loss) has been calculated using the average daily shares method.
(b) Not annualized for periods less than one year.
(c) Annualized for periods less than one year.
(d) During the period, certain fees were reduced and/or reimbursed. If such fee reductions and/or reimbursements had not occurred, the ratios would have been as indicated.
(e) Portfolio turnover is calculated on the basis of the Fund as a whole without distinguishing between the classes of shares issued.
See notes to financial statements.
47
Victory Portfolios | | Financial Highlights — continued | |
For a Share Outstanding Throughout Each Period
| | | Victory RS Growth Fund | |
| | | Class C Shares | |
| | | Six
Months
Ended
June 30,
2018 | | Year
Ended
December 31,
2017 | | Year
Ended
December 31,
2016 | | Year
Ended
December 31,
2015 | | Year
Ended
December 31,
2014 | | Year
Ended
December 31,
2013 | |
| | | (Unaudited) | | | | | | | | | | | |
Net Asset Value, Beginning of Period | | $ | 17.90 | | | $ | 14.51 | | | $ | 15.73 | | | $ | 16.45 | | | $ | 18.06 | | | $ | 12.70 | | |
Investment Activities: | |
Net investment income (loss) | | | (0.09 | )(a) | | | (0.15 | )(a) | | | (0.14 | )(a) | | | (0.17 | )(a) | | | (0.15 | ) | | | 0.20 | | |
Net realized and unrealized
gains (losses) on investments | | | 1.39 | | | | 4.60 | | | | 0.31 | | | | 0.68 | | | | 1.81 | | | | 5.16 | | |
Total from Investment
Activities | | | 1.30 | | | | 4.45 | | | | 0.17 | | | | 0.51 | | | | 1.66 | | | | 5.36 | | |
Distributions to Shareholders: | |
Net realized gains
from investments | | | — | | | | (1.06 | ) | | | (1.39 | ) | | | (1.23 | ) | | | (3.27 | ) | | | — | | |
Total Distributions to
Shareholders | | | — | | | | (1.06 | ) | | | (1.39 | ) | | | (1.23 | ) | | | (3.27 | ) | | | — | | |
Net Asset Value, End of Period | | $ | 19.20 | | | $ | 17.90 | | | $ | 14.51 | | | $ | 15.73 | | | $ | 16.45 | | | $ | 18.06 | | |
Total Return (excludes contingent
deferred sales charge) (b) | | | 7.26 | % | | | 30.57 | % | | | 1.05 | % | | | 3.09 | % | | | 9.07 | % | | | 42.20 | % | |
Ratios/Supplemental Data: | |
Net Assets at end of period (000) | | $ | 6,505 | | | $ | 6,974 | | | $ | 8,487 | | | $ | 11,553 | | | $ | 13,300 | | | $ | 10,415 | | |
Ratio of net expenses to average
net assets (c) | | | 1.93 | % | | | 1.93 | % | | | 1.93 | % | | | 1.93 | % | | | 1.97 | % | | | 2.15 | % | |
Ratio of net investment income (loss)
to average net assets (c) | | | (1.00 | )% | | | (0.92 | )% | | | (0.93 | )% | | | (1.02 | )% | | | (1.21 | )% | | | (1.39 | )% | |
Ratio of gross expenses to average
net assets (c) (d) | | | 2.20 | % | | | 2.10 | % | | | 2.06 | % | | | 2.02 | % | | | 2.06 | % | | | 2.16 | % | |
Portfolio turnover (b) (e) | | | 51 | % | | | 74 | % | | | 123 | % | | | 105 | % | | | 136 | % | | | 101 | % | |
(a) Per share net investment income (loss) has been calculated using the average daily shares method.
(b) Not annualized for periods less than one year.
(c) Annualized for periods less than one year.
(d) During the period, certain fees were reduced and/or reimbursed. If such fee reductions and/or reimbursements had not occurred, the ratios would have been as indicated.
(e) Portfolio turnover is calculated on the basis of the Fund as a whole without distinguishing between the classes of shares issued.
See notes to financial statements.
48
Victory Portfolios | | Financial Highlights — continued | |
For a Share Outstanding Throughout Each Period
| | | Victory RS Growth Fund | |
| | | Class R Shares | |
| | | Six
Months
Ended
June 30,
2018 | | Year
Ended
December 31,
2017 | | Year
Ended
December 31,
2016 | | Year
Ended
December 31,
2015 | | Year
Ended
December 31,
2014 | | Year
Ended
December 31,
2013 | |
| | | (Unaudited) | | | | | | | | | | | |
Net Asset Value, Beginning of Period | | $ | 19.22 | | | $ | 15.49 | | | $ | 16.65 | | | $ | 17.31 | | | $ | 18.80 | | | $ | 13.18 | | |
Investment Activities: | |
Net investment income (loss) | | | (0.08 | )(a) | | | (0.13 | )(a) | | | (0.11 | )(a) | | | (0.14 | )(a) | | | (0.17 | ) | | | (0.10 | ) | |
Net realized and unrealized
gains (losses) on investments | | | 1.49 | | | | 4.92 | | | | 0.34 | | | | 0.71 | | | | 1.95 | | | | 5.72 | | |
Total from Investment
Activities | | | 1.41 | | | | 4.79 | | | | 0.23 | | | | 0.57 | | | | 1.78 | | | | 5.62 | | |
Distributions to Shareholders: | |
Net realized gains
from investments | | | — | | | | (1.06 | ) | | | (1.39 | ) | | | (1.23 | ) | | | (3.27 | ) | | | — | | |
Total Distributions to
Shareholders | | | — | | | | (1.06 | ) | | | (1.39 | ) | | | (1.23 | ) | | | (3.27 | ) | | | — | | |
Net Asset Value, End of Period | | $ | 20.63 | | | $ | 19.22 | | | $ | 15.49 | | | $ | 16.65 | | | $ | 17.31 | | | $ | 18.80 | | |
Total Return (b) | | | 7.34 | % | | | 30.92 | % | | | 1.29 | % | | | 3.28 | % | | | 9.36 | % | | | 42.64 | % | |
Ratios/Supplemental Data: | |
Net Assets at end of period (000) | | $ | 897 | | | $ | 830 | | | $ | 1,054 | | | $ | 979 | | | $ | 1,249 | | | $ | 1,340 | | |
Ratio of net expenses to average
net assets (c) | | | 1.71 | % | | | 1.71 | % | | | 1.71 | % | | | 1.71 | % | | | 1.71 | % | | | 1.74 | % | |
Ratio of net investment income (loss)
to average net assets (c) | | | (0.78 | )% | | | (0.70 | )% | | | (0.69 | )% | | | (0.80 | )% | | | (0.97 | )% | | | (1.11 | )% | |
Ratio of gross expenses to average
net assets (c) (d) | | | 3.26 | % | | | 2.72 | % | | | 1.77 | % | | | 1.79 | % | | | 1.81 | % | | | 1.84 | % | |
Portfolio turnover (b) (e) | | | 51 | % | | | 74 | % | | | 123 | % | | | 105 | % | | | 136 | % | | | 101 | % | |
(a) Per share net investment income (loss) has been calculated using the average daily shares method.
(b) Not annualized for periods less than one year.
(c) Annualized for periods less than one year.
(d) During the period, certain fees were reduced and/or reimbursed. If such fee reductions and/or reimbursements had not occurred, the ratios would have been as indicated.
(e) Portfolio turnover is calculated on the basis of the Fund as a whole without distinguishing between the classes of shares issued.
See notes to financial statements.
49
Victory Portfolios | | Financial Highlights — continued | |
For a Share Outstanding Throughout Each Period
| | | Victory RS Growth Fund | |
| | | Class Y Shares | |
| | | Six
Months
Ended
June 30,
2018 | | Year
Ended
December 31,
2017 | | Year
Ended
December 31,
2016 | | Year
Ended
December 31,
2015 | | Year
Ended
December 31,
2014 | | Year
Ended
December 31,
2013 | |
| | | (Unaudited) | | | | | | | | | | | |
Net Asset Value, Beginning of Period | | $ | 21.23 | | | $ | 16.88 | | | $ | 17.87 | | | $ | 18.33 | | | $ | 19.56 | | | $ | 13.60 | | |
Investment Activities: | |
Net investment income (loss) | | | 0.01 | (a) | | | 0.03 | (a) | | | 0.03 | (a) | | | 0.02 | (a) | | | (0.04 | ) | | | (0.09 | ) | |
Net realized and unrealized
gains (losses) on investments | | | 1.65 | | | | 5.38 | | | | 0.37 | | | | 0.75 | | | | 2.08 | | | | 6.05 | | |
Total from Investment
Activities | | | 1.66 | | | | 5.41 | | | | 0.40 | | | | 0.77 | | | | 2.04 | | | | 5.96 | | |
Distributions to Shareholders: | |
Net realized gains
from investments | | | — | | | | (1.06 | ) | | | (1.39 | ) | | | (1.23 | ) | | | (3.27 | ) | | | — | | |
Total Distributions to
Shareholders | | | — | | | | (1.06 | ) | | | (1.39 | ) | | | (1.23 | ) | | | (3.27 | ) | | | — | | |
Net Asset Value, End of Period | | $ | 22.89 | | | $ | 21.23 | | | $ | 16.88 | | | $ | 17.87 | | | $ | 18.33 | | | $ | 19.56 | | |
Total Return (b) | | | 7.82 | % | | | 32.05 | % | | | 2.16 | % | | | 4.20 | % | | | 10.33 | % | | | 43.82 | % | |
Ratios/Supplemental Data: | |
Net Assets at end of period (000) | | $ | 31,554 | | | $ | 30,309 | | | $ | 25,107 | | | $ | 38,301 | | | $ | 37,757 | | | $ | 25,968 | | |
Ratio of net expenses to average
net assets (c) | | | 0.83 | % | | | 0.83 | % | | | 0.83 | % | | | 0.83 | % | | | 0.86 | % | | | 0.98 | % | |
Ratio of net investment income (loss)
to average net assets (c) | | | 0.10 | % | | | 0.17 | % | | | 0.17 | % | | | 0.10 | % | | | (0.10 | )% | | | (0.24 | )% | |
Ratio of gross expenses to average
net assets (c) (d) | | | 0.97 | % | | | 0.97 | % | | | 0.95 | % | | | 0.95 | % | | | 0.91 | % | | | 0.98 | % | |
Portfolio turnover (b) (e) | | | 51 | % | | | 74 | % | | | 123 | % | | | 105 | % | | | 136 | % | | | 101 | % | |
(a) Per share net investment income (loss) has been calculated using the average daily shares method.
(b) Not annualized for periods less than one year.
(c) Annualized for periods less than one year.
(d) During the period, certain fees were reduced and/or reimbursed. If such fee reductions and/or reimbursements had not occurred, the ratios would have been as indicated.
(e) Portfolio turnover is calculated on the basis of the Fund as a whole without distinguishing between the classes of shares issued.
See notes to financial statements.
50
Victory Portfolios | | Financial Highlights | |
For a Share Outstanding Throughout Each Period
| | | Victory RS Science and Technology Fund | |
| | | Class A Shares | |
| | | Six
Months
Ended
June 30,
2018 | | Year
Ended
December 31,
2017 | | Year
Ended
December 31,
2016 | | Year
Ended
December 31,
2015 | | Year
Ended
December 31,
2014 | | Year
Ended
December 31,
2013 | |
| | | (Unaudited) | | | | | | | | | | | |
Net Asset Value, Beginning of
Period | | $ | 21.56 | | | $ | 17.49 | | | $ | 17.35 | | | $ | 18.13 | | | $ | 20.38 | | | $ | 16.95 | | |
Investment Activities: | |
Net investment income
(loss) (a) | | | (0.14 | ) | | | (0.25 | ) | | | (0.22 | ) | | | (0.19 | ) | | | (0.24 | ) | | | (0.23 | ) | |
Net realized and unrealized
gains (losses) on
investments | | | 4.01 | | | | 8.04 | | | | 2.64 | | | | 1.26 | | | | 1.30 | | | | 7.76 | | |
Total from Investment
Activities | | | 3.87 | | | | 7.79 | | | | 2.42 | | | | 1.07 | | | | 1.06 | | | | 7.53 | | |
Distributions to Shareholders: | |
Net investment income | | | — | | | | — | | | | — | | | | — | | | | — | | | | (0.04 | ) | |
Net realized gains
from investments | | | — | | | | (3.72 | ) | | | (2.28 | ) | | | (1.85 | ) | | | (3.31 | ) | | | (4.06 | ) | |
Total Distributions to
Shareholders | | | — | | | | (3.72 | ) | | | (2.28 | ) | | | (1.85 | ) | | | (3.31 | ) | | | (4.10 | ) | |
Capital Contributions from Prior
Custodian, Net (See Note 8) | | | — | | | | — | | | | — | (b) | | | — | | | | — | | | | — | | |
Net Asset Value, End of Period | | $ | 25.43 | | | $ | 21.56 | | | $ | 17.49 | | | $ | 17.35 | | | $ | 18.13 | | | $ | 20.38 | | |
Total Return (excludes sales
charge) (c) | | | 17.95 | % | | | 44.74 | % | | | 13.80 | %(d) | | | 5.89 | % | | | 5.26 | % | | | 45.59 | % | |
Ratios/Supplemental Data: | |
Net Assets at end of period (000) | | $ | 172,329 | | | $ | 146,002 | | | $ | 105,041 | | | $ | 109,201 | | | $ | 134,534 | | | $ | 156,011 | | |
Ratio of net expenses to average
net assets (e) | | | 1.46 | % | | | 1.49 | % | | | 1.51 | % | | | 1.49 | % | | | 1.51 | % | | | 1.49 | % | |
Ratio of net investment income (loss)
to average net assets (e) | | | (1.16 | )% | | | (1.18 | )% | | | (1.24 | )% | | | (1.01 | )% | | | (1.21 | )% | | | (1.15 | )% | |
Ratio of gross expenses to average
net assets (e) (f) | | | 1.46 | % | | | 1.49 | % | | | 1.52 | % | | | 1.49 | % | | | 1.51 | % | | | 1.49 | % | |
Portfolio turnover (c) (g) | | | 47 | % | | | 89 | % | | | 114 | % | | | 119 | % | | | 146 | % | | | 141 | % | |
(a) Per share net investment income (loss) has been calculated using the average daily shares method.
(b) Amount is less than $0.005 per share.
(c) Not annualized for periods less than one year.
(d) The Fund received monies related to a nonrecurring refund from the prior Custodian. The corresponding impact to the total return was less than 0.005% for the period shown. (See Note 8)
(e) Annualized for periods less than one year.
(f) During the period, certain fees were reduced and/or reimbursed. If such fee reductions and/or reimbursements had not occurred, the ratios would have been as indicated.
(g) Portfolio turnover is calculated on the basis of the Fund as a whole without distinguishing between the classes of shares issued.
See notes to financial statements.
51
Victory Portfolios | | Financial Highlights — continued | |
For a Share Outstanding Throughout Each Period
| | | Victory RS Science and Technology Fund | |
| | | Class C Shares | |
| | | Six
Months
Ended
June 30,
2018 | | Year
Ended
December 31,
2017 | | Year
Ended
December 31,
2016 | | Year
Ended
December 31,
2015 | | Year
Ended
December 31,
2014 | | Year
Ended
December 31,
2013 | |
| | | (Unaudited) | | | | | | | | | | | |
Net Asset Value, Beginning of Period | | $ | 17.73 | | | $ | 14.96 | | | $ | 15.25 | | | $ | 16.27 | | | $ | 18.77 | | | $ | 15.96 | | |
Investment Activities: | |
Net investment income (loss) (a) | | | (0.19 | ) | | | (0.36 | ) | | | (0.31 | ) | | | (0.29 | ) | | | (0.37 | ) | | | (0.37 | ) | |
Net realized and unrealized
gains (losses) on investments | | | 3.29 | | | | 6.85 | | | | 2.30 | | | | 1.12 | | | | 1.18 | | | | 7.24 | | |
Total from Investment
Activities | | | 3.10 | | | | 6.49 | | | | 1.99 | | | | 0.83 | | | | 0.81 | | | | 6.87 | | |
Distributions to Shareholders: | |
Net investment income | | | — | | | | — | | | | — | | | | — | | | | — | | | | — | | |
Net realized gains
from investments | | | — | | | | (3.72 | ) | | | (2.28 | ) | | | (1.85 | ) | | | (3.31 | ) | | | (4.06 | ) | |
Total Distributions to
Shareholders | | | — | | | | (3.72 | ) | | | (2.28 | ) | | | (1.85 | ) | | | (3.31 | ) | | | (4.06 | ) | |
Capital Contributions from Prior
Custodian, Net (See Note 8) | | | — | | | | — | | | | — | (b) | | | — | | | | — | | | | — | | |
Net Asset Value, End of Period | | $ | 20.83 | | | $ | 17.73 | | | $ | 14.96 | | | $ | 15.25 | | | $ | 16.27 | | | $ | 18.77 | | |
Total Return (excludes contingent
deferred sales charge) (c) | | | 17.47 | % | | | 43.70 | % | | | 12.87 | %(d) | | | 5.08 | % | | | 4.38 | % | | | 44.30 | % | |
Ratios/Supplemental Data: | |
Net Assets at end of period (000) | | $ | 13,160 | | | $ | 11,831 | | | $ | 10,332 | | | $ | 11,160 | | | $ | 12,745 | | | $ | 16,402 | | |
Ratio of net expenses to average
net assets (e) | | | 2.28 | % | | | 2.28 | % | | | 2.32 | % | | | 2.28 | % | | | 2.36 | % | | | 2.34 | % | |
Ratio of net investment income (loss)
to average net assets (e) | | | (1.98 | )% | | | (1.97 | )% | | | (2.05 | )% | | | (1.79 | )% | | | (2.06 | )% | | | (2.00 | )% | |
Ratio of gross expenses to average
net assets (e) (f) | | | 2.32 | % | | | 2.31 | % | | | 2.32 | % | | | 2.28 | % | | | 2.36 | % | | | 2.34 | % | |
Portfolio turnover (c) (g) | | | 47 | % | | | 89 | % | | | 114 | % | | | 119 | % | | | 146 | % | | | 141 | % | |
(a) Per share net investment income (loss) has been calculated using the average daily shares method.
(b) Amount is less than $0.005 per share.
(c) Not annualized for periods less than one year.
(d) The Fund received monies related to a nonrecurring refund from the prior Custodian. The corresponding impact to the total return was less than 0.005% for the period shown. (See Note 8)
(e) Annualized for periods less than one year.
(f) During the period, certain fees were reduced and/or reimbursed. If such fee reductions and/or reimbursements had not occurred, the ratios would have been as indicated.
(g) Portfolio turnover is calculated on the basis of the Fund as a whole without distinguishing between the classes of shares issued.
See notes to financial statements.
52
Victory Portfolios | | Financial Highlights — continued | |
For a Share Outstanding Throughout Each Period
| | | Victory RS Science and Technology Fund | |
| | | Class R Shares | |
| | | Six
Months
Ended
June 30,
2018 | | Year
Ended
December 31,
2017 | | Year
Ended
December 31,
2016 | | Year
Ended
December 31,
2015 | | Year
Ended
December 31,
2014 | | Year
Ended
December 31,
2013 | |
| | | (Unaudited) | | | | | | | | | | | |
Net Asset Value, Beginning of Period | | $ | 18.99 | | | $ | 15.78 | | | $ | 15.91 | | | $ | 16.85 | | | $ | 19.26 | | | $ | 16.24 | | |
Investment Activities: | |
Net investment income (loss) (a) | | | (0.17 | ) | | | (0.31 | ) | | | (0.26 | ) | | | (0.25 | ) | | | (0.32 | ) | | | (0.32 | ) | |
Net realized and unrealized
gains (losses) on investments | | | 3.53 | | | | 7.24 | | | | 2.41 | | | | 1.16 | | | | 1.22 | | | | 7.40 | | |
Total from Investment
Activities | | | 3.36 | | | | 6.93 | | | | 2.15 | | | | 0.91 | | | | 0.90 | | | | 7.08 | | |
Distributions to Shareholders: | |
Net investment income | | | — | | | | — | | | | — | | | | — | | | | — | | | | — | | |
Net realized gains
from investments | | | — | | | | (3.72 | ) | | | (2.28 | ) | | | (1.85 | ) | | | (3.31 | ) | | | (4.06 | ) | |
Total Distributions to
Shareholders | | | — | | | | (3.72 | ) | | | (2.28 | ) | | | (1.85 | ) | | | (3.31 | ) | | | (4.06 | ) | |
Capital Contributions from Prior
Custodian, Net (See Note 8) | | | — | | | | — | | | | — | (b) | | | — | | | | — | | | | — | | |
Net Asset Value, End of Period | | $ | 22.35 | | | $ | 18.99 | | | $ | 15.78 | | | $ | 15.91 | | | $ | 16.85 | | | $ | 19.26 | | |
Total Return (c) | | | 17.69 | % | | | 44.05 | % | | | 13.41 | %(d) | | | 5.38 | % | | | 4.74 | % | | | 44.82 | % | |
Ratios/Supplemental Data: | |
Net Assets at end of period (000) | | $ | 1,906 | | | $ | 1,705 | | | $ | 1,394 | | | $ | 1,281 | | | $ | 1,367 | | | $ | 1,438 | | |
Ratio of net expenses to average
net assets (e) | | | 1.93 | % | | | 1.93 | % | | | 1.91 | % | | | 1.93 | % | | | 2.03 | % | | | 2.02 | % | |
Ratio of net investment income (loss)
to average net assets (e) | | | (1.64 | )% | | | (1.62 | )% | | | (1.63 | )% | | | (1.45 | )% | | | (1.73 | )% | | | (1.68 | )% | |
Ratio of gross expenses to average
net assets (e) (f) | | | 2.60 | % | | | 2.54 | % | | | 1.91 | % | | | 1.93 | % | | | 2.03 | % | | | 2.02 | % | |
Portfolio turnover (c) (g) | | | 47 | % | | | 89 | % | | | 114 | % | | | 119 | % | | | 146 | % | | | 141 | % | |
(a) Per share net investment income (loss) has been calculated using the average daily shares method.
(b) Amount is less than $0.005 per share.
(c) Not annualized for periods less than one year.
(d) The Fund received monies related to a nonrecurring refund from the prior Custodian. The corresponding impact to the total return was less than 0.005% for the period shown. (See Note 8)
(e) Annualized for periods less than one year.
(f) During the period, certain fees were reduced and/or reimbursed. If such fee reductions and/or reimbursements had not occurred, the ratios would have been as indicated.
(g) Portfolio turnover is calculated on the basis of the Fund as a whole without distinguishing between the classes of shares issued.
See notes to financial statements.
53
Victory Portfolios | | Financial Highlights — continued | |
For a Share Outstanding Throughout Each Period
| | | Victory RS Science and Technology Fund | |
| | | Class Y Shares | |
| | | Six
Months
Ended
June 30,
2018 | | Year
Ended
December 31,
2017 | | Year
Ended
December 31,
2016 | | Year
Ended
December 31,
2015 | | Year
Ended
December 31,
2014 | | Year
Ended
December 31,
2013 | |
| | | (Unaudited) | | | | | | | | | | | |
Net Asset Value, Beginning of Period | | $ | 22.90 | | | $ | 18.37 | | | $ | 18.08 | | | $ | 18.78 | | | $ | 20.93 | | | $ | 17.32 | | |
Investment Activities: | |
Net investment income (loss) (a) | | | (0.12 | ) | | | (0.21 | ) | | | (0.18 | ) | | | (0.14 | ) | | | (0.19 | ) | | | (0.18 | ) | |
Net realized and unrealized
gains (losses) on investments | | | 4.26 | | | | 8.46 | | | | 2.75 | | | | 1.29 | | | | 1.35 | | | | 7.94 | | |
Total from Investment
Activities | | | 4.14 | | | | 8.25 | | | | 2.57 | | | | 1.15 | | | | 1.16 | | | | 7.76 | | |
Distributions to Shareholders: | |
Net investment income | | | — | | | | — | | | | — | | | | — | | | | — | | | | (0.09 | ) | |
Net realized gains
from investments | | | — | | | | (3.72 | ) | | | (2.28 | ) | | | (1.85 | ) | | | (3.31 | ) | | | (4.06 | ) | |
Total Distributions to
Shareholders | | | — | | | | (3.72 | ) | | | (2.28 | ) | | | (1.85 | ) | | | (3.31 | ) | | | (4.15 | ) | |
Capital Contributions from Prior
Custodian, Net (See Note 8) | | | — | | | | — | | | | — | (b) | | | — | | | | — | | | | — | | |
Net Asset Value, End of Period | | $ | 27.04 | | | $ | 22.90 | | | $ | 18.37 | | | $ | 18.08 | | | $ | 18.78 | | | $ | 20.93 | | |
Total Return (c) | | | 18.08 | % | | | 45.11 | % | | | 14.07 | %(d) | | | 6.11 | % | | | 5.61 | % | | | 46.00 | % | |
Ratios/Supplemental Data: | |
Net Assets at end of period (000) | | $ | 50,807 | | | $ | 32,047 | | | $ | 19,335 | | | $ | 27,416 | | | $ | 48,368 | | | $ | 40,337 | | |
Ratio of net expenses to average
net assets (e) | | | 1.22 | % | | | 1.24 | % | | | 1.28 | % | | | 1.24 | % | | | 1.22 | % | | | 1.22 | % | |
Ratio of net investment income (loss)
to average net assets (e) | | | (0.92 | )% | | | (0.92 | )% | | | (1.01 | )% | | | (0.74 | )% | | | (0.91 | )% | | | (0.88 | )% | |
Ratio of gross expenses to average
net assets (e) (f) | | | 1.22 | % | | | 1.26 | % | | | 1.29 | % | | | 1.24 | % | | | 1.22 | % | | | 1.22 | % | |
Portfolio turnover (c) (g) | | | 47 | % | | | 89 | % | | | 114 | % | | | 119 | % | | | 146 | % | | | 141 | % | |
(a) Per share net investment income (loss) has been calculated using the average daily shares method.
(b) Amount is less than $0.005 per share.
(c) Not annualized for periods less than one year.
(d) The Fund received monies related to a nonrecurring refund from the prior Custodian. The corresponding impact to the total return was less than 0.005% for the period shown. (See Note 8)
(e) Annualized for periods less than one year.
(f) During the period, certain fees were reduced and/or reimbursed. If such fee reductions and/or reimbursements had not occurred, the ratios would have been as indicated.
(g) Portfolio turnover is calculated on the basis of the Fund as a whole without distinguishing between the classes of shares issued.
See notes to financial statements.
54
Victory Portfolios | | Financial Highlights | |
For a Share Outstanding Throughout Each Period
| | | Victory RS Small Cap Equity Fund | |
| | | Class A Shares | |
| | | Six
Months
Ended
June 30,
2018 | | Year
Ended
December 31,
2017 | | Year
Ended
December 31,
2016 | | Year
Ended
December 31,
2015 | | Year
Ended
December 31,
2014 | | Year
Ended
December 31,
2013 | |
| | | (Unaudited) | | | | | | | | | | | |
Net Asset Value, Beginning of Period | | $ | 18.88 | | | $ | 14.41 | | | $ | 14.24 | | | $ | 19.81 | | | $ | 21.46 | | | $ | 17.12 | | |
Investment Activities: | |
Net investment income (loss) (a) | | | (0.07 | ) | | | (0.14 | ) | | | (0.12 | ) | | | (0.20 | ) | | | (0.21 | ) | | | (0.22 | ) | |
Net realized and unrealized
gains (losses) on investments | | | 2.49 | | | | 5.55 | | | | 0.28 | | | | 0.38 | | | | 2.32 | | | | 8.51 | | |
Total from Investment
Activities | | | 2.42 | | | | 5.41 | | | | 0.16 | | | | 0.18 | | | | 2.11 | | | | 8.29 | | |
Distributions to Shareholders: | |
Net realized gains
from investments | | | — | | | | (0.94 | ) | | | — | | | | (5.75 | ) | | | (3.76 | ) | | | (3.95 | ) | |
Total Distributions to
Shareholders | | | — | | | | (0.94 | ) | | | — | | | | (5.75 | ) | | | (3.76 | ) | | | (3.95 | ) | |
Capital Contributions from Prior
Custodian, Net (See Note 8) | | | — | | | | — | | | | 0.01 | | | | — | | | | — | | | | — | | |
Net Asset Value, End of Period | | $ | 21.30 | | | $ | 18.88 | | | $ | 14.41 | | | $ | 14.24 | | | $ | 19.81 | | | $ | 21.46 | | |
Total Return (excludes sales
charge) (b) | | | 12.82 | % | | | 37.57 | % | | | 1.19 | %(c) | | | 0.61 | % | | | 10.00 | % | | | 49.48 | % | |
Ratios/Supplemental Data: | |
Net Assets at end of period (000) | | $ | 69,802 | | | $ | 65,514 | | | $ | 52,075 | | | $ | 65 | | | $ | 68,785 | | | $ | 72,843 | | |
Ratio of net expenses to average
net assets (d) | | | 1.21 | % | | | 1.25 | % | | | 1.35 | % | | | 1.30 | % | | | 1.27 | % | | | 1.29 | % | |
Ratio of net investment income (loss)
to average net assets (d) | | | (0.73 | )% | | | (0.84 | )% | | | (0.88 | )% | | | 0.97 | % | | | (0.99 | )% | | | (1.03 | )% | |
Ratio of gross expenses to average
net assets (d) (e) | | | 1.21 | % | | | 1.25 | % | | | 1.36 | % | | | 1.30 | % | | | 1.27 | % | | | 1.29 | % | |
Portfolio turnover (b) (f) | | | 35 | % | | | 79 | % | | | 86 | % | | | 98 | % | | | 93 | % | | | 107 | % | |
(a) Per share net investment income (loss) has been calculated using the average daily shares method.
(b) Not annualized for periods less than one year.
(c) The Fund received monies related to a nonrecurring refund from the prior Custodian. The corresponding impact to the total return was 0.05% for the period shown. (See Note 8)
(d) Annualized for periods less than one year.
(e) During the period, certain fees were reduced and/or reimbursed. If such fee reductions and/or reimbursements had not occurred, the ratios would have been as indicated.
(f) Portfolio turnover is calculated on the basis of the Fund as a whole without distinguishing between the classes of shares issued.
See notes to financial statements.
55
Victory Portfolios | | Financial Highlights — continued | |
For a Share Outstanding Throughout Each Period
| | | Victory RS Small Cap Equity Fund | |
| | | Class C Shares | |
| | | Six
Months
Ended
June 30,
2018 | | Year
Ended
December 31,
2017 | | Year
Ended
December 31,
2016 | | Year
Ended
December 31,
2015 | | Year
Ended
December 31,
2014 | | Year
Ended
December 31,
2013 | |
| | | (Unaudited) | | | | | | | | | | | |
Net Asset Value, Beginning of Period | | $ | 9.61 | | | $ | 7.74 | | | $ | 7.71 | | | $ | 13.42 | | | $ | 15.79 | | | $ | 13.43 | | |
Investment Activities: | |
Net investment income (loss) (a) | | | (0.08 | ) | | | (0.15 | ) | | | (0.12 | ) | | | (0.25 | ) | | | (0.29 | ) | | | (0.30 | ) | |
Net realized and unrealized
gains (losses) on investments | | | 1.26 | | | | 2.96 | | | | 0.14 | | | | 0.29 | | | | 1.68 | | | | 6.61 | | |
Total from Investment
Activities | | | 1.18 | | | | 2.81 | | | | 0.02 | | | | 0.04 | | | | 1.39 | | | | 6.31 | | |
Distributions to Shareholders: | |
Net realized gains
from investments | | | — | | | | (0.94 | ) | | | — | | | | (5.75 | ) | | | (3.76 | ) | | | (3.95 | ) | |
Total Distributions to
Shareholders | | | — | | | | (0.94 | ) | | | — | | | | (5.75 | ) | | | (3.76 | ) | | | (3.95 | ) | |
Capital Contributions from Prior
Custodian, Net (See Note 8) | | | — | | | | — | | | | 0.01 | | | | — | | | | — | | | | — | | |
Net Asset Value, End of Period | | $ | 10.79 | | | $ | 9.61 | | | $ | 7.74 | | | $ | 7.71 | | | $ | 13.42 | | | $ | 15.79 | | |
Total Return (excludes contingent
deferred sales charge) (b) | | | 12.28 | % | | | 36.34 | % | | | 0.39 | %(c) | | | (0.17 | )% | | | 9.02 | % | | | 48.32 | % | |
Ratios/Supplemental Data: | |
Net Assets at end of period (000) | | $ | 404 | | | $ | 533 | | | $ | 410 | | | $ | 1 | | | $ | 593 | | | $ | 1,091 | | |
Ratio of net expenses to average
net assets (d) | | | 2.10 | % | | | 2.10 | % | | | 2.10 | % | | | 2.10 | % | | | 2.15 | % | | | 2.08 | % | |
Ratio of net investment income (loss)
to average net assets (d) | | | (1.65 | )% | | | (1.69 | )% | | | (1.64 | )% | | | 1.77 | % | | | (1.90 | )% | | | (1.85 | )% | |
Ratio of gross expenses to average
net assets (d) (e) | | | 4.17 | % | | | 3.87 | % | | | 3.14 | % | | | 2.39 | % | | | 2.37 | % | | | 2.08 | % | |
Portfolio turnover (b) (f) | | | 35 | % | | | 79 | % | | | 86 | % | | | 98 | % | | | 93 | % | | | 107 | % | |
(a) Per share net investment income (loss) has been calculated using the average daily shares method.
(b) Not annualized for periods less than one year.
(c) The Fund received monies related to a nonrecurring refund from the prior Custodian. The corresponding impact to the total return was 0.05% for the period shown. (See Note 8)
(d) Annualized for periods less than one year.
(e) During the period, certain fees were reduced and/or reimbursed. If such fee reductions and/or reimbursements had not occurred, the ratios would have been as indicated.
(f) Portfolio turnover is calculated on the basis of the Fund as a whole without distinguishing between the classes of shares issued.
See notes to financial statements.
56
Victory Portfolios | | Financial Highlights — continued | |
For a Share Outstanding Throughout Each Period
| | | Victory RS Small Cap Equity Fund | |
| | | Class R Shares | |
| | | Six
Months
Ended
June 30,
2018 | | Year
Ended
December 31,
2017 | | Year
Ended
December 31,
2016 | | Year
Ended
December 31,
2015 | | Year
Ended
December 31,
2014 | | Year
Ended
December 31,
2013 | |
| | | (Unaudited) | | | | | | | | | | | |
Net Asset Value, Beginning of Period | | $ | 16.08 | | | $ | 12.44 | | | $ | 12.33 | | | $ | 17.99 | | | $ | 19.88 | | | $ | 16.12 | | |
Investment Activities: | |
Net investment income (loss) (a) | | | (0.11 | ) | | | (0.20 | ) | | | (0.14 | ) | | | (0.26 | ) | | | (0.27 | ) | | | (0.27 | ) | |
Net realized and unrealized
gains (losses) on investments | | | 2.11 | | | | 4.78 | | | | 0.24 | | | | 0.35 | | | | 2.14 | | | | 7.98 | | |
Total from Investment
Activities | | | 2.00 | | | | 4.58 | | | | 0.10 | | | | 0.09 | | | | 1.87 | | | | 7.71 | | |
Distributions to Shareholders: | |
Net realized gains
from investments | | | — | | | | (0.94 | ) | | | — | | | | (5.75 | ) | | | (3.76 | ) | | | (3.95 | ) | |
Total Distributions to
Shareholders | | | — | | | | (0.94 | ) | | | — | | | | (5.75 | ) | | | (3.76 | ) | | | (3.95 | ) | |
Capital Contributions from Prior
Custodian, Net (See Note 8) | | | — | | | | — | | | | 0.01 | | | | — | | | | — | | | | — | | |
Net Asset Value, End of Period | | $ | 18.08 | | | $ | 16.08 | | | $ | 12.44 | | | $ | 12.33 | | | $ | 17.99 | | | $ | 19.88 | | |
Total Return (b) | | | 12.50 | % | | | 36.84 | % | | | 0.89 | %(c) | | | 0.16 | % | | | 9.58 | % | | | 48.95 | % | |
Ratios/Supplemental Data: | |
Net Assets at end of period (000) | | $ | 3,805 | | | $ | 3,381 | | | $ | 2,954 | | | $ | 3,662 | | | $ | 4,455 | | | $ | 4,898 | | |
Ratio of net expenses to average
net assets (d) | | | 1.75 | % | | | 1.75 | % | | | 1.70 | % | | | 1.71 | % | | | 1.67 | % | | | 1.60 | % | |
Ratio of net investment income (loss)
to average net assets (d) | | | (1.27 | )% | | | (1.34 | )% | | | (1.24 | )% | | | (1.39 | )% | | | (1.39 | )% | | | (1.35 | )% | |
Ratio of gross expenses to average
net assets (d) (e) | | | 1.81 | % | | | 1.97 | % | | | 1.70 | % | | | 1.71 | % | | | 1.71 | % | | | 1.69 | % | |
Portfolio turnover (b) (f) | | | 35 | % | | | 79 | % | | | 86 | % | | | 98 | % | | | 93 | % | | | 107 | % | |
(a) Per share net investment income (loss) has been calculated using the average daily shares method.
(b) Not annualized for periods less than one year.
(c) The Fund received monies related to a nonrecurring refund from the prior Custodian. The corresponding impact to the total return was 0.05% for the period shown. (See Note 8)
(d) Annualized for periods less than one year.
(e) During the period, certain fees were reduced and/or reimbursed. If such fee reductions and/or reimbursements had not occurred, the ratios would have been as indicated.
(f) Portfolio turnover is calculated on the basis of the Fund as a whole without distinguishing between the classes of shares issued.
See notes to financial statements.
57
Victory Portfolios | | Financial Highlights — continued | |
For a Share Outstanding Throughout Each Period
| | | Victory RS Small Cap Equity Fund | |
| | | Class Y Shares | |
| | | Six
Months
Ended
June 30,
2018 | | Year
Ended
December 31,
2017 | | Year
Ended
December 31,
2016 | | Year
Ended
December 31,
2015 | | Year
Ended
December 31,
2014 | | Year
Ended
December 31,
2013 | |
| | | (Unaudited) | | | | | | | | | | | |
Net Asset Value, Beginning of Period | | $ | 19.20 | | | $ | 14.62 | | | $ | 14.39 | | | $ | 20.04 | | | $ | 21.60 | | | $ | 17.17 | | |
Investment Activities: | |
Net investment income (loss) (a) | | | (0.06 | ) | | | (0.14 | ) | | | (0.08 | ) | | | (0.16 | ) | | | (0.16 | ) | | | (0.16 | ) | |
Net realized and unrealized
gains (losses) on investments | | | 2.53 | | | | 5.66 | | | | 0.30 | | | | 0.26 | | | | 2.36 | | | | 8.54 | | |
Total from Investment
Activities | | | 2.47 | | | | 5.52 | | | | 0.22 | | | | 0.10 | | | | 2.20 | | | | 8.38 | | |
Distributions to Shareholders: | |
Net realized gains
from investments | | | — | | | | (0.94 | ) | | | — | | | | (5.75 | ) | | | (3.76 | ) | | | (3.95 | ) | |
Total Distributions to
Shareholders | | | — | | | | (0.94 | ) | | | — | | | | (5.75 | ) | | | (3.76 | ) | | | (3.95 | ) | |
Capital Contributions from Prior
Custodian, Net (See Note 8) | | | — | | | | — | | | | 0.01 | | | | — | | | | — | | | | — | | |
Net Asset Value, End of Period | | $ | 21.67 | | | $ | 19.20 | | | $ | 14.62 | | | $ | 14.39 | | | $ | 20.04 | | | $ | 21.60 | | |
Total Return (b) | | | 12.86 | % | | | 37.78 | % | | | 1.60 | %(c) | | | 0.18 | % | | | 10.35 | % | | | 49.84 | % | |
Ratios/Supplemental Data: | |
Net Assets at end of period (000) | | $ | 2,472 | | | $ | 6,398 | | | $ | 1,834 | | | $ | 3,804 | | | $ | 48,597 | | | $ | 51,794 | | |
Ratio of net expenses to average
net assets (d) | | | 1.10 | % | | | 1.10 | % | | | 1.10 | % | | | 1.07 | % | | | 1.01 | % | | | 10.00 | % | |
Ratio of net investment income (loss)
to average net assets (d) | | | (0.63 | )% | | | (0.78 | )% | | | (0.64 | )% | | | (0.76 | )% | | | (0.74 | )% | | | (0.74 | )% | |
Ratio of gross expenses to average
net assets (d) (e) | | | 1.73 | % | | | 1.34 | % | | | 1.24 | % | | | 1.07 | % | | | 1.01 | % | | | 10.00 | % | |
Portfolio turnover (b) (f) | | | 35 | % | | | 79 | % | | | 86 | % | | | 98 | % | | | 93 | % | | | 107 | % | |
(a) Per share net investment income (loss) has been calculated using the average daily shares method.
(b) Not annualized for periods less than one year.
(c) The Fund received monies related to a nonrecurring refund from the prior Custodian. The corresponding impact to the total return was 0.05% for the period shown. (See Note 8)
(d) Annualized for periods less than one year.
(e) During the period, certain fees were reduced and/or reimbursed. If such fee reductions and/or reimbursements had not occurred, the ratios would have been as indicated.
(f) Portfolio turnover is calculated on the basis of the Fund as a whole without distinguishing between the classes of shares issued.
See notes to financial statements.
58
Victory Portfolios | | Notes to Financial Statements
June 30, 2018 | |
(Unaudited)
1. Organization:
Victory Portfolios (the "Trust") was organized on December 6, 1995 as a Delaware statutory trust as a successor to a company of the same name organized as a Massachusetts business trust on February 5, 1986. The Trust is registered under the Investment Company Act of 1940, as amended (the "1940 Act"), as an open-end management investment company. The Trust is comprised of 42 funds and is authorized to issue an unlimited number of shares, which are units of beneficial interest with a par value of $0.001 per share.
The accompanying financial statements are those of the following Funds (collectively, the "Funds" and individually, a "Fund").
Funds | | Investment Share
Classes Offered | | Investment Objectives | |
Victory RS Small Cap Growth Fund
("RS Small Cap Growth Fund") | | Classes A, C, R, R6 and Y
| | Seeks to provide long-term
capital growth | |
Victory RS Select Growth Fund
("RS Select Growth Fund") | | Classes A, C, R, R6 and Y
| | Seeks to provide long-term
capital growth | |
Victory RS Mid Cap Growth Fund
("RS Mid Cap Growth Fund") | | Classes A, C, R, R6 and Y
| | Seeks to provide long-term
capital growth | |
Victory RS Growth Fund
("RS Growth Fund") | | Classes A, C, R and Y
| | Seeks to provide long-term
capital growth | |
Victory RS Science and
Technology Fund
("RS Science and Technology Fund") | | Classes A, C, R and Y
| | Seeks to provide long-term
capital growth
| |
Victory RS Small Cap Equity Fund
("RS Small Cap Equity Fund") | | Classes A, C, R and Y
| | Seeks to provide long-term
capital growth | |
Each class of shares of a Fund has substantially identical rights and privileges except with respect to sales charges, fees paid under distribution plans, expenses allocable exclusively to each class of shares, voting rights on matters solely affecting a single class of shares, and the exchange privilege of each class of shares.
Under the Trust's organizational documents, its officers and trustees are indemnified against certain liabilities arising out of the performance of their duties to the Funds. In addition, in the normal course of business, the Funds enter into contracts with their vendors and others that provide for general indemnifications. The Funds' maximum exposure under these arrangements is unknown, as this would involve future claims that may be made against the Funds. However, based on experience, the Funds expect that risk of loss to be remote.
2. Significant Accounting Policies:
The following is a summary of significant accounting policies followed by the Trust in the preparation of its financial statements. The policies are in conformity with accounting principles generally accepted in the United States of America ("GAAP"). The preparation of financial statements in accordance with GAAP requires management to make estimates and assumptions that affect the reported amounts of assets and liabilities and disclosure of contingent assets and liabilities at the date of the financial statements and the reported amounts of income and expenses for the period. Actual results could differ from those estimates. The Funds follow the specialized accounting and reporting requirements under GAAP that are applicable to investment companies.
Investment Valuation:
The Funds record investments at fair value. Fair value is defined as the price that would be received to sell an asset or paid to transfer a liability in an orderly transaction between market participants at the measurement date.
59
Victory Portfolios | | Notes to Financial Statements — continued
June 30, 2018 | |
(Unaudited)
The valuation techniques described below maximize the use of observable inputs and minimize the use of unobservable inputs in determining fair value. The inputs used for valuing the Funds' investments are summarized in the three broad levels listed below:
• Level 1 — quoted prices in active markets for identical securities
• Level 2 — other significant observable inputs (including quoted prices for similar securities or interest rates applicable to those securities, etc.)
• Level 3 — significant unobservable inputs (including the Funds' own assumptions in determining the fair value of investments)
Changes in valuation techniques may result in transfers in or out of an assigned level within the disclosure hierarchy. The Trust determines transfers between fair value hierarchy levels at the reporting period end. The inputs or methodologies used for valuation techniques are not necessarily an indication of the risk associated with entering into those investments.
Portfolio securities listed or traded on securities exchanges, including exchange-traded funds ("ETFs"), American Depositary Receipts ("ADRs") and Rights, are valued at the closing price on the exchange or system where the security is principally traded, if available, or at the Nasdaq Official Closing Price. If there have been no sales for that day on the exchange or system, then a security is valued at the last available bid quotation on the exchange or system where the security is principally traded. In each of these situations, valuations are typically categorized as Level 1 in the fair value hierarchy.
Investments in open-end investment companies are valued at net asset value. These valuations are typically categorized as Level 1 in the fair value hierarchy.
Debt securities of United States ("U.S.") issuers (other than short-term investments maturing in 60 days or less), including corporate and municipal securities, are valued on the basis of bid valuations provided by dealers or an independent pricing service approved by the Trust's Board of Trustees (the "Board"). Short-term investments maturing in 60 days or less may be valued at amortized cost, which approximates market value. Under the amortized cost method, premium or discount, if any, is amortized or accreted, respectively, on a constant basis to the maturity of the security. In each of these situations, valuations are typically categorized as Level 2 in the fair value hierarchy.
Investments for which there are no such quotations, or for which quotations do not appear reliable, are valued at fair value in accordance with procedures established by and under the general supervision and responsibility of the Board. These valuations are typically categorized as Level 2 or Level 3 in the fair value hierarchy, based on the observability of inputs used to determine the fair value.
For the six months ended June 30, 2018, there were no Level 3 investments for which significant unobservable inputs were used to determine fair value.
60
Victory Portfolios | | Notes to Financial Statements — continued
June 30, 2018 | |
(Unaudited)
A summary of the valuations as of June 30, 2018, based upon the three levels defined above, is included in the table below while the breakdown, by category, of investments is disclosed in the Schedules of Portfolio Investments:
| | | LEVEL 1 —
Quoted Prices | | Total | |
| | | Investments
in
Securities | | Investments
in
Securities | |
RS Small Cap Growth Fund | |
Common Stocks | | $ | 2,016,368,045 | | | $ | 2,016,368,045 | | |
Collateral for Securities Loaned | | | 359,853,359 | | | | 359,853,359 | | |
Total | | | 2,376,221,404 | | | | 2,376,221,404 | | |
RS Select Growth Fund | |
Common Stocks | | | 377,254,918 | | | | 377,254,918 | | |
Collateral for Securities Loaned | | | 45,894,568 | | | | 45,894,568 | | |
Total | | | 423,149,486 | | | | 423,149,486 | | |
RS Mid Cap Growth Fund | |
Common Stocks | | | 306,001,405 | | | | 306,001,405 | | |
Collateral for Securities Loaned | | | 28,041,153 | | | | 28,041,153 | | |
Total | | | 334,042,558 | | | | 334,042,558 | | |
RS Growth Fund | |
Common Stocks | | | 256,597,113 | | | | 256,597,113 | | |
Collateral for Securities Loaned | | | 5,677,967 | | | | 5,677,967 | | |
Total | | | 262,275,080 | | | | 262,275,080 | | |
RS Science and Technology Fund | |
Common Stocks | | | 227,140,647 | | | | 227,140,647 | | |
Collateral for Securities Loaned | | | 50,320,905 | | | | 50,320,905 | | |
Total | | | 277,461,552 | | | | 277,461,552 | | |
RS Small Cap Equity Fund | |
Common Stocks | | | 75,769,437 | | | | 75,769,437 | | |
Collateral for Securities Loaned | | | 11,871,164 | | | | 11,871,164 | | |
Total | | | 87,640,601 | | | | 87,640,601 | | |
There were no transfers among any levels during the six months ended June 30, 2018.
Securities Purchased on a When-Issued Basis:
The Funds may purchase securities on a when-issued basis. When-issued securities are securities purchased for delivery beyond normal settlement periods at a stated price and/or yield, thereby involving the risk that the price and/or yield obtained may be more or less than those available in the market when delivery takes place. At the time a Fund makes the commitment to purchase a security on a when-issued basis, the Fund records the transaction and reflects the value of the security in determining net asset value. No interest accrues to the Fund until the transaction settles and payment takes place. Normally, the settlement date occurs within one month of the purchase. A segregated account is established and the Fund maintains cash and marketable securities at least equal in value to commitments for when-issued securities. If a Fund owns when-issued securities, these values are included in "Payable for investments purchased" on the accompanying Statements of Assets and Liabilities. As of June 30, 2018, the Funds had no outstanding when-issued purchase commitments.
61
Victory Portfolios | | Notes to Financial Statements — continued
June 30, 2018 | |
(Unaudited)
Real Estate Investment Trusts ("REITS"):
The Funds may invest in REITS which report information on the source of their distributions annually. REITS are pooled investment vehicles that invest primarily in income-producing real estate or real estate related loans or interests (such as mortgages). Certain distributions received from REITS during the year are recorded as realized gains or return of capital when such information becomes known.
Investment Companies:
Exchange-Traded Funds:
The Funds may invest in ETFs. ETFs are a type of index fund, the shares of which are bought and sold on a securities exchange. An ETF trades like common stock and represents a fixed portfolio of securities designed to track the performance and dividend yield of a particular domestic or foreign market index. A Fund may purchase shares of an ETF to temporarily gain exposure to a portion of the U.S. or a foreign market while awaiting purchase of underlying securities. The risks of owning an ETF generally reflect the risks of owning the underlying securities they are designed to track, although the lack of liquidity on an ETF could result in it being more volatile. Additionally, ETFs have fees and expenses that reduce their value.
Open-End Funds:
The Funds may invest in portfolios of open-end investment companies. These investment companies value securities in their portfolios for which market quotations are readily available at their market values (generally the last reported sale price) and all other securities and assets at their fair value by the methods established by the board of directors of the underlying funds.
Investment Transactions and Related Income:
Changes in holdings of investments are accounted for no later than one business day following the trade date. For financial reporting purposes, however, investment transactions are accounted for on trade date on the last business day of the reporting period. Interest income is recognized on an accrual basis and includes, where applicable, the amortization of premium or accretion of discount. Dividend income is recorded on the ex-dividend date. Gains or losses realized on sales of securities are determined by comparing the identified cost of the security lot sold with the net sales proceeds.
Withholding taxes on interest, dividends and gains as a result of certain investments in ADRs by the Funds have been provided for in accordance with each investment's applicable country's tax rules and rates.
Securities Lending:
The Trust has entered into a Master Securities Lending Agreement ("MSLA") with Citibank, N.A. ("Citibank" or the "Agent"). Under the terms of the MSLA, the Funds may lend securities to certain broker-dealers and banks in exchange for collateral in the amount of at least 102% of the value of U.S. securities loaned or at least 105% of the value of non-U.S. securities loaned, marked-to-market daily. Any collateral shortfalls associated with increases in the valuation of the securities loaned are adjusted the next business day. The collateral can be received in the form of cash collateral and/or non-cash collateral. Non-cash collateral can include U.S. Government Securities, letters of credit and certificates of deposit. The cash collateral is invested in short-term instruments or cash equivalents as noted in the Funds' Schedules of Portfolio Investments. The Trust does not have effective control of the non-cash collateral and therefore it is not disclosed in the Funds' Schedules of Portfolio Investments. The Funds continue to benefit from interest or dividends on the securities loaned and may also earn a return from the collateral. The Funds pay various fees in connection with the investment of cash collateral. The Funds pay the Agent fees based on the
62
Victory Portfolios | | Notes to Financial Statements — continued
June 30, 2018 | |
(Unaudited)
investment income received from securities lending activities. Securities lending income is disclosed on the Statements of Operations. Although risk is mitigated by the collateral, the Funds could experience a delay in recovering their securities and possible loss of income or value if the borrower fails to return them.
Securities lending transactions are entered into by a Fund under the MSLA, which permits the Fund, under certain circumstances such as an event of default, to offset amounts payable by the Fund to the same counterparty against amounts receivable from the counterparty to create a net payment due to or from the Fund.
The following table is a summary of the Funds' securities lending transactions which are subject to offset under the MSLA as of June 30, 2018. These transactions are accounted for as secured borrowings with an overnight and continuous contractual maturity.
| | | Gross
Amount of
Recognized
Assets
(Value of
Securities
on Loan) | | Value of
Cash
Collateral
Received | | Net Amount | |
RS Small Cap Growth Fund | | $ | 351,301,918 | | | $ | 359,853,359 | | | $ | 8,551,441 | | |
RS Select Growth Fund | | | 44,679,372 | | | | 45,894,568 | | | | 1,215,196 | | |
RS Mid Cap Growth Fund | | | 27,476,242 | | | | 28,041,153 | | | | 564,911 | | |
RS Growth Fund | | | 5,521,228 | | | | 5,677,967 | | | | 156,739 | | |
RS Science and Technology Fund | | | 49,142,689 | | | | 50,320,905 | | | | 1,178,216 | | |
RS Small Cap Equity Fund | | | 11,567,766 | | | | 11,871,164 | | | | 303,398 | | |
Foreign Currency Translations:
The accounting records of the Funds are maintained in U.S. dollars. Investment securities and other assets and liabilities of a Fund denominated in a foreign currency are translated into U.S. dollars at current exchange rates. Purchases and sales of securities, income receipts and expense payments are translated into U.S. dollars at the exchange rates on the date of the transactions. The Funds do not isolate the portion of the results of operations resulting from changes in foreign exchange rates on investments from fluctuations arising from changes in market prices of securities held. Such fluctuations are disclosed as net change in unrealized appreciation/depreciation on investments and foreign currency translations on the Statements of Operations. Any realized gains or losses from these fluctuations are disclosed as net realized gains or losses from investment transactions and foreign currency translations on the Statements of Operations.
Foreign Taxes:
The Funds may be subject to foreign taxes related to foreign income received (a portion of which may be reclaimable), capital gains on the sale of securities, and certain foreign currency transactions. All foreign taxes are recorded in accordance with the applicable regulations and rates that exist in the foreign jurisdictions in which the Funds invest.
Dividends to Shareholders:
Dividends from net investment income, if any, are declared and paid annually for the Funds. Distributable net realized gains, if any, are declared and distributed at least annually.
The amounts of dividends from net investment income and distributions from net realized gains are determined in accordance with federal income tax regulations, which may differ from GAAP. These "book/tax" differences are either considered temporary or permanent in nature (e.g., reclass of market discounts and premiums and paydown gains or losses), such amounts are reclassified within the components of net assets based on their federal tax-basis treatment; temporary differences (e.g., wash sales) do not require reclassification. To the extent dividends and
63
Victory Portfolios | | Notes to Financial Statements — continued
June 30, 2018 | |
(Unaudited)
distributions exceed net investment income and net realized gains for tax purposes, they are reported as distributions of capital. Net investment losses incurred by a Fund may be reclassified as an offset to capital on the accompanying Statements of Assets and Liabilities.
Federal Income Taxes:
It is the policy of each Fund to continue to qualify as a regulated investment company by complying with the provisions available to certain investment companies, as defined in applicable sections of the Internal Revenue Code, and to make distributions of net investment income and net realized gains sufficient to relieve it from all, or substantially all, federal income taxes. Accordingly, no provision for federal income taxes is required in the financial statements. The Funds have a tax year end of December 31.
Management of the Funds has reviewed tax positions taken in tax years that remain subject to examination by all major tax jurisdictions, including federal (i.e., the last four tax year ends and the interim tax period since then). Management believes that there is no tax liability resulting from unrecognized tax benefits related to uncertain tax positions taken.
Allocations:
Expenses directly attributable to a Fund are charged to the Fund, while expenses which are attributable to more than one fund in the Trust, or jointly with an affiliated trust, are allocated among the respective funds in the Trust and/or affiliated trust based upon net assets or another appropriate basis.
Income, expenses (other than class specific expenses such as transfer agent fees, state registration fees, printing and 12b-1 fees), and realized and unrealized gains or losses on investments are allocated to each class of shares based on its relative net assets on the date income is earned or expenses and realized and unrealized gains and losses are incurred.
Affiliated Securities Transactions:
Pursuant to Rule 17a-7 under the 1940 Act, the Funds may engage in securities transactions with affiliated investment companies and advisory accounts managed by the Adviser and any applicable sub-adviser. Any such purchase or sale transaction must be effected without brokerage commission or other remuneration, except for customary transfer fees. The transaction must be effected at the current market price, which is either the security's last sale price on an exchange or, if there are no transactions in the security that day, at the average of the highest bid and lowest asked price. For the six months ended June 30, 2018, the Funds did not engage in any Rule 17a-7 transactions under the 1940 Act.
3. Purchases and Sales of Securities:
Purchases and sales of securities (excluding securities maturing less than one year from acquisition) for the six months ended June 30, 2018 were as follows:
| | | Purchases | | Sales | |
RS Small Cap Growth Fund | | $ | 785,894,125 | | | $ | 688,090,649 | | |
RS Select Growth Fund | | | 141,552,772 | | | | 237,208,735 | | |
RS Mid Cap Growth Fund | | | 154,714,193 | | | | 319,063,561 | | |
RS Growth Fund | | | 132,515,578 | | | | 149,520,862 | | |
RS Science and Technology Fund | | | 100,318,945 | | | | 99,239,893 | | |
RS Small Cap Equity Fund | | | 25,916,861 | | | | 34,866,213 | | |
For the six months ended June 30, 2018, there were no purchases or sales of U.S. Government Securities.
64
Victory Portfolios | | Notes to Financial Statements — continued
June 30, 2018 | |
(Unaudited)
4. Fees and Transactions with Affiliates and Related Parties:
Investment advisory services are provided to the Funds by Victory Capital Management Inc. ("VCM" or the "Adviser"), a New York corporation registered as an investment adviser with the Securities and Exchange Commission ("SEC"). The Adviser is a wholly-owned indirect subsidiary of Victory Capital Holdings Inc., a publicly traded Delaware corporation and a wholly-owned direct subsidiary of Victory Capital Operating, LLC.
Under the terms of the Investment Advisory Agreement, the Adviser is entitled to receive fees based on a percentage of the average daily net assets of each Fund. The rates at which the Adviser is paid by each Fund are included in the table below. The Adviser may use its resources to assist with the Funds' distribution and marketing expenses.
| | | Adviser Fee Rate | |
RS Small Cap Growth Fund | | | 0.95 | % | |
RS Select Growth Fund | | | 1.00 | % | |
RS Mid Cap Growth Fund | | | 0.85 | % | |
RS Growth Fund | | | 0.75 | % | |
RS Science and Technology Fund | | | 1.00 | % | |
RS Small Cap Equity Fund | | | 0.75 | % | |
VCM also serves as the Funds' administrator and fund accountant. Under an Administration and Fund Accounting Agreement, VCM is paid for its services an annual fee at a rate of 0.08% of the first $15 billion in average daily net assets of the Trust, Victory Variable Insurance Funds and Victory Portfolios II (collectively, the "Trusts"), 0.05% of the average daily net assets above $15 billion to $30 billion of the Trusts and 0.04% of the average daily net assets over $30 billion of the Trusts.
Citi Fund Services Ohio, Inc. ("Citi"), an affiliate of Citibank, N.A., acts as sub-administrator and sub-fund accountant to the Funds pursuant to a Sub-Administration and Sub-Fund Accounting Services Agreement between VCM and Citi. VCM pays Citi a fee for providing these services. The Trust reimburses VCM and Citi for all of their reasonable out-of-pocket expenses incurred in providing these services.
FIS Investor Services, LLC ("FIS") serves as the Funds' transfer agent. Under the Transfer Agent Agreement, the Trust pays FIS a fee for its services and reimburses FIS for all of their reasonable out-of-pocket expenses incurred in providing these services.
The Chief Compliance Officer ("CCO") is an employee of the Adviser, which pays the compensation of the CCO and his support staff. The Trust has entered into an Agreement to provide compliance services with the Adviser, pursuant to which the Adviser furnishes its compliance personnel, including the services of the CCO, and other resources reasonably necessary to provide the Trust with compliance oversight services related to the design, administration and oversight of a compliance program for the Trust in accordance with Rule 38a-1 under the 1940 Act. The Funds in the Victory Funds complex, in the aggregate, compensate the Adviser for these services.
The Trusts pay an annual retainer to each Independent Trustee, plus an additional annual retainer to the Chairman of the Board. The aggregate amount of the fees and expenses of the Independent Trustees are allocated amongst all the funds in the Trusts and are presented in the Statements of Operations.
Shearman & Sterling LLP provides legal services to the Trust.
Victory Capital Advisers, Inc. (the "Distributor"), an affiliate of the Adviser, serves as distributor for the continuous offering of the shares of the Funds pursuant to a Distribution Agreement between the Distributor and the Trust.
Pursuant to the Distribution and Service Plans adopted in accordance with Rule 12b-1 under the 1940 Act, the Distributor may receive a monthly distribution and service fee, at an annual rate of up to 0.25% of the average daily net assets of Class A Shares, at an annual rate of up to 0.50% of the average daily net assets of Class R Shares and 1.00% of the average daily net assets of Class C
65
Victory Portfolios | | Notes to Financial Statements — continued
June 30, 2018 | |
(Unaudited)
Shares of the Funds. The distribution and service fees paid to the Distributor may be used by the Distributor to pay for activities primarily intended to result in the sale of Class A, Class R or Class C Shares of the Funds.
In addition, the Distributor and FIS are entitled to receive commissions on sales of the Class A Shares and redemptions of Class C Shares, respectively, of the Funds. For the six months ended June 30, 2018, the Distributor received approximately $40,224 from commissions earned on sales of Class A Shares and FIS received $2,824 from redemptions of Class C Shares of the Funds.
The Adviser has entered into expense limitation agreements with certain Funds. Under the terms of the agreements, to the extent that ordinary operating expenses incurred by certain classes of a Fund in any fiscal year exceed the expense limit for such classes of the Fund, such excess amount will be the liability of the Adviser. Interest, taxes, brokerage commissions, other expenditures which are capitalized in accordance with GAAP, and other extraordinary expenses not incurred in the ordinary course of a Fund's business are excluded from the expense limitation agreement. As of June 30, 2018, the expense limits (excluding voluntary waivers) are as follows:
| | | Class | | Expense Limit(a) | |
RS Small Cap Growth Fund | | Class A Shares | | | 1.40 | % | |
RS Small Cap Growth Fund | | Class C Shares | | | 2.16 | % | |
RS Small Cap Growth Fund | | Class R Shares | | | 1.86 | % | |
RS Small Cap Growth Fund | | Class R6 Shares | | | 1.06 | % | |
RS Small Cap Growth Fund | | Class Y Shares | | | 1.13 | % | |
RS Select Growth Fund | | Class A Shares | | | 1.40 | % | |
RS Select Growth Fund | | Class C Shares | | | 2.18 | % | |
RS Select Growth Fund | | Class R Shares | | | 1.91 | % | |
RS Select Growth Fund | | Class R6 Shares | | | 1.06 | % | |
RS Select Growth Fund | | Class Y Shares | | | 1.14 | % | |
RS Mid Cap Growth Fund | | Class A Shares | | | 1.20 | % | |
RS Mid Cap Growth Fund | | Class C Shares | | | 2.11 | % | |
RS Mid Cap Growth Fund | | Class R Shares | | | 1.80 | % | |
RS Mid Cap Growth Fund | | Class R6 Shares | | | 0.94 | % | |
RS Mid Cap Growth Fund | | Class Y Shares | | | 0.95 | % | |
RS Growth Fund | | Class A Shares | | | 1.10 | % | |
RS Growth Fund | | Class C Shares | | | 1.93 | % | |
RS Growth Fund | | Class R Shares | | | 1.71 | % | |
RS Growth Fund | | Class Y Shares | | | 0.83 | % | |
RS Science and Technology Fund | | Class A Shares | | | 1.49 | % | |
RS Science and Technology Fund | | Class C Shares | | | 2.28 | % | |
RS Science and Technology Fund | | Class R Shares | | | 1.93 | % | |
RS Science and Technology Fund | | Class Y Shares | | | 1.24 | % | |
RS Small Cap Equity Fund | | Class A Shares | | | 1.35 | % | |
RS Small Cap Equity Fund | | Class C Shares | | | 2.10 | % | |
RS Small Cap Equity Fund | | Class R Shares | | | 1.75 | % | |
RS Small Cap Equity Fund | | Class Y Shares | | | 1.10 | % | |
(a) In effect until at least April 30, 2019.
The Funds have agreed to repay fees and expenses that were waived or reimbursed by the Adviser for a period up to three fiscal years after such waiver or reimbursement was made to the extent such payments or repayments would not cause the expenses of a class to exceed the original expense limitation in place at time of the waiver or reimbursement or any expense limitation agreement in place at the time of repayment. Amounts repaid to the Adviser during the six months ended, if any, are reflected on the Statements of Operations as "Recoupment of prior expenses waived/reimbursed by Adviser".
66
Victory Portfolios | | Notes to Financial Statements — continued
June 30, 2018 | |
(Unaudited)
As of June 30, 2018, the following amounts are available to be repaid to the Adviser.
| | | Expires
12/31/19 | | Expires
12/31/20 | | Expires
12/31/21 | | Total | |
RS Small Cap Growth Fund | | $ | 542,236 | | | $ | 745,744 | | | $ | 270,793 | | | $ | 1,558,773 | | |
RS Select Growth Fund | | | 93,780 | | | | 384,612 | | | | 192,732 | | | | 671,124 | | |
RS Mid Cap Growth Fund | | | 138,565 | | | | 419,215 | | | | 189,991 | | | | 747,771 | | |
RS Growth Fund | | | 111,652 | | | | 278,667 | | | | 137,489 | | | | 527,808 | | |
RS Science and Technology Fund | | | 9,502 | | | | 18,803 | | | | 8,230 | | | | 36,535 | | |
RS Small Cap Equity Fund | | | — | | | | 22,386 | | | | 12,811 | | | | 35,197 | | |
The Adviser may voluntarily waive or reimburse additional fees to assist the Funds in maintaining competitive expense ratios. Voluntary waivers and reimbursements applicable to the Funds are not available to be recouped at a future time. There were no voluntary waivers or reimbursements for the six months ended June 30, 2018.
Certain officers and/or interested trustees of the Funds are also officers and/or employees of the Adviser, Administrator and Fund Accountant, Sub-Administrator and Sub-Fund Accountant, and Legal.
5. Risks:
Each Fund may be subject to other risks in addition to these identified risks.
An investment in the Funds' shares represents an indirect investment in the securities owned by the Funds, some of which will be traded on a national securities exchange or in the over-the-counter markets. The value of the securities in which the Funds invest, like other market investments, may move up or down, sometimes rapidly and unpredictably. The value of the securities in which the Funds invest may affect the value of the Funds' shares. An investment in the Funds' shares at any point in time may be worth less than the original investment, even after taking into account the reinvestment of the Funds' distributions.
The Funds will be subject to credit risk with respect to the amount each expects to receive from counterparties for financial instruments entered into by the Funds. The Funds may be negatively impacted if a counterparty becomes bankrupt or otherwise fails to perform its obligations due to financial difficulties. The Funds may experience significant delays in obtaining any recovery in bankruptcy or other reorganization proceeding and the Funds may obtain only limited recovery or may obtain no recovery in such circumstances. The Funds typically enter into transactions with counterparties whose credit ratings are investment grade, as determined by a nationally recognized statistical rating organization or, if unrated, judged by the Adviser to be of comparable quality.
6. Borrowing and Interfund Lending:
Line of Credit:
The Trusts participate in a short-term, demand note "Line of Credit" agreement with Citibank. Under the agreement with Citibank as of July 28, 2017, the Trusts may borrow up to $250 million, of which $100 million is committed and $150 million is uncommitted. $40 million of the Line of Credit is reserved for use by the Victory RS Floating Rate Fund, another series of the Trust, with that Fund paying the related commitment fees for that amount. The purpose of the agreement is to meet temporary or emergency cash needs, including redemption requests that might otherwise require the untimely disposition of securities. The agreement was subsequently amended on July 27, 2018 with a new termination date of July 26, 2019. Citibank receives an annual commitment fee of 0.15% on $100 million for providing the Line of Credit. For the six months ended June 30, 2018, Citibank earned approximately $74,384 in commitment fees from the Trusts. Each fund in the Trusts pays a pro-rata portion of the commitment fees plus any interest on amounts borrowed. As of June 30, 2018, the interest rate on outstanding borrowings was 3.10%.
67
Victory Portfolios | | Notes to Financial Statements — continued
June 30, 2018 | |
(Unaudited)
The average loans for the days outstanding and average interest rate for each Fund during the six months ended June 30, 2018 were as follows:
Fund | | Amount
Outstanding
at June 30,
2018 | | Average
Borrowings* | | Days
Outstanding | | Average
Rate* | | Maximum
Borrowing
During
the Period | |
RS Growth Fund | | $ | — | | | $ | 1,000,000 | | | | 1 | | | | 2.55 | % | | $ | 1,000,000 | | |
* For the six months ended June 30, 2018, based on the number of days borrowings were outstanding.
Interfund Lending:
The Trust and Adviser rely on an exemptive order granted by the SEC in March 2017 (the "Order"), permitting the establishment and operation of an Interfund Lending Facility (the "Facility").The Facility allows the Funds to directly lend and borrow money to or from any other Victory Fund relying upon the Order at rates beneficial to both the borrowing and lending funds. Advances under the Facility are allowed for temporary or emergency purposes, including the meeting of redemption requests that otherwise might require the untimely disposition of securities, and are subject to each Fund's borrowing restrictions. The interfund loan rate is determined, as specified in the Order, by averaging the current repurchase agreement rate and the current bank loan rate. Interest paid by each Fund during the period is presented on the Statements of Operations under Interest expense on Interfund Lending.
The average borrowing and lending for the days outstanding and average interest rate for each Fund during the six months ended June 30, 2018 were as follows:
| | | Borrower
or
Lender | | Amount
Outstanding
at June 30,
2018 | | Average
Borrowings* | | Days
Borrowing
Outstanding | | Average
Interest
Rate* | | Maximum
Borrowing
During
the
Period | |
RS Select Growth Fund | | Borrower | | $ | — | | | $ | 2,632,000 | | | | 1 | | | | 2.47 | % | | $ | 2,632,000 | | |
RS Mid Cap Growth Fund | | Borrower | | | — | | | | 14,621,750 | | | | 4 | | | | 2.14 | % | | | 18,607,000 | | |
RS Science and
Technology Fund | | Borrower | | | — | | | | 2,231,333 | | | | 3 | | | | 2.21 | % | | | 3,038,000 | | |
* For the six months ended June 30, 2018, based on the number of days borrowings were outstanding.
7. Federal Income Tax Information:
The tax character of distributions paid and the tax basis of current components of accumulated earnings (deficit) will be determined at the end of the current tax year ending December 31, 2018.
The tax character of distributions paid during the most recent tax year ended December 31, 2017, were as follows (total distributions paid may differ from the Statements of Changes in Net Assets because, for tax purposes, dividends are recognized when actually paid):
| | | Year Ended December 31, 2017 | |
| | | Distributions paid from | |
| | | Ordinary
Income | | Net
Long-Term
Capital Gains | | Total
Taxable
Distributions | | Total
Distributions
Paid | |
RS Small Cap Growth Fund | | $ | — | | | $ | 194,651,972 | | | $ | 194,651,972 | | | $ | 194,651,972 | | |
RS Select Growth Fund | | | — | | | | 57,847,069 | | | | 57,847,069 | | | | 57,847,069 | | |
RS Growth Fund | | | 1,743,634 | | | | 10,921,206 | | | | 12,664,840 | | | | 12,664,840 | | |
RS Science and Technology Fund | | | 9,363,273 | | | | 19,302,837 | | | | 28,666,110 | | | | 28,666,110 | | |
RS Small Cap Equity Fund | | | — | | | | 3,681,689 | | | | 3,681,689 | | | | 3,681,689 | | |
68
Victory Portfolios | | Notes to Financial Statements — continued
June 30, 2018 | |
(Unaudited)
As of the most recent tax year ended December 31, 2017, the components of accumulated earnings (deficit) on a tax basis were as follows:
| | | Undistributed
Ordinary
Income | | Undistributed
Long-Term
Capital Gains | | Accumulated
Earnings | | Unrealized
Appreciation
(Depreciation)* | | Total
Accumulated
Earnings
(Deficit) | |
RS Small Cap Growth Fund | | $ | — | | | $ | 41,311,492 | | | $ | 41,311,492 | | | $ | 533,296,587 | | | $ | 574,608,079 | | |
RS Select Growth Fund | | | — | | | | 34,457,236 | | | | 34,457,236 | | | | 130,171,804 | | | | 164,629,040 | | |
RS Mid Cap Growth Fund | | | — | | | | 2,135,028 | | | | 2,135,028 | | | | 76,221,971 | | | | 78,356,999 | | |
RS Growth Fund | | | 704,443 | | | | 4,222,911 | | | | 4,927,354 | | | | 88,966,670 | | | | 93,894,024 | | |
RS Science and Technology Fund | | | 1,229,529 | | | | 3,006,407 | | | | 4,235,936 | | | | 66,454,301 | | | | 70,690,237 | | |
RS Small Cap Equity Fund | | | — | | | | 6,073,201 | | | | 6,073,201 | | | | 19,394,779 | | | | 25,467,980 | | |
*The difference between the book-basis and tax-basis of unrealized appreciation (depreciation) is attributable primarily to tax deferral of losses on wash sales and mark to market adjustments on passive foreign investment companies.
During the most recent tax year ended December 31, 2017, the RS Small Cap Growth Fund, RS Mid Cap Growth Fund and RS Small Cap Equity Fund utilized $221,404,712, $28,116,490 and $1,152,248, respectively, of capital loss carryforwards.
At June 30, 2018, the cost basis for federal income tax purposes, gross unrealized appreciation, gross unrealized depreciation and net unrealized appreciation (depreciation) for investments were as follows:
| | Cost of
Investments
for Federal
Tax Purposes | | Gross
Unrealized
Appreciation | | Gross
Unrealized
Depreciation | | Net
Unrealized
Appreciation
(Depreciation) | |
RS Small Cap Growth Fund | | $ | 1,809,252,088 | | | $ | 626,096,337 | | | $ | (59,127,021 | ) | | $ | 566,969,316 | | |
RS Select Growth Fund | | | 312,403,057 | | | | 120,521,425 | | | | (9,774,996 | ) | | | 110,746,429 | | |
RS Mid Cap Growth Fund | | | 285,861,804 | | | | 54,014,787 | | | | (5,834,033 | ) | | | 48,180,754 | | |
RS Growth Fund | | | 175,823,914 | | | | 88,763,967 | | | | (2,312,801 | ) | | | 86,451,166 | | |
RS Science and Technology Fund | | | 199,990,770 | | | | 85,724,921 | | | | (8,254,139 | ) | | | 77,470,782 | | |
RS Small Cap Equity Fund | | | 69,023,181 | | | | 21,054,334 | | | | (2,436,914 | ) | | | 18,617,420 | | |
8. Capital Contribution from Prior Custodian:
During 2016, certain Funds received notification from their prior custodian, State Street Bank and Trust ("State Street"), related to over-billing on certain categories of expenses during the approximately 16-year period from 1998 through October 31, 2014. The over-billing primarily related to categories of expenses that involved an allocation of general costs among multiple clients.
State Street paid the refunded amounts during January 2017. Based on billing information received during 2016 from State Street and an analysis of any expense limitation agreements that were in place during the period of the over-billing, including the application of any recoupment provisions in such agreements, the Adviser received a portion of the refund.
The portion of the refund retained by the Funds was accounted for as a capital contribution and is reflected on the Financial Highlights as "Capital Contribution from Prior Custodian, Net".
9. Fund Ownership:
Ownership of more than 25% of the voting securities of a fund creates presumptions of control of the fund, under section 2(a)(9) of the 1940 Act. As of June 30, 2018, no shareholder held more than 25% of shares outstanding of any Fund.
69
Victory Portfolios | | Notes to Financial Statements — continued
June 30, 2018 | |
(Unaudited)
10. Recent Accounting Pronouncements:
In October 2016, the SEC released its Final Rules on Investment Company Reporting Modernization (the "Rules"). The Rules introduced two new regulatory reporting forms for investment companies, Form N-PORT and Form N-CEN. The Funds' compliance date for Form N-PORT is June 1, 2018, and the Funds will make their initial filing with the SEC on Form N-PORT for the period ending March 31, 2019. Effective with the period ended June 30, 2018, the Funds will be required to maintain, and make available to the SEC upon request, the information required to be included in Form N-PORT. Form N-PORT will replace Form N-Q filings effective with the requirement to file the Form N-PORT with the SEC for the period ending March 31, 2019. The Funds' compliance date for Form N-CEN is June 1, 2018, and the Funds will make their initial filing on Form N-CEN for the period ending December 31, 2018. Form N-CEN will replace Form N-SAR filings. The Funds' adoption of these amendments have no effect on the Funds' net assets or results of operations.
In March 2017, the FASB issued Accounting Standards Update No. 2017-08 "Premium Amortization on Purchased Callable Debt Securities" ("ASU 2017-08"), which shortens the premium amortization period for purchased non-contingently callable debt securities. ASU 2017-08 specifies that the premium amortization period ends at the earliest call date, for purchased non-contingently callable debt securities. ASU 2017-08 is effective for fiscal years, and interim periods within those fiscal years, beginning after December 15, 2018. Management is currently evaluating the implications of ASU 2017-08 and its impact on the financial statements and related disclosures has not yet been determined.
11. Subsequent Events:
The Funds have evaluated the need for additional disclosures or adjustments resulting from subsequent events through the date these financial statements were issued. Based on this evaluation, there were no subsequent events to report that would have a material impact on the Funds' financial statements.
70
Victory Portfolios | | Supplemental Information
June 30, 2018 | |
(Unaudited)
Trustee and Officer Information
Board of Trustees:
Overall responsibility for management of the Trust rests with the Board. The Trust is managed by the Board in accordance with the laws of the State of Delaware. There are currently ten Trustees, nine of whom are not "interested persons" of the Trust within the meaning of that term under the 1940 Act ("Independent Trustees") and one of whom is an "interested person" of the Trust within the meaning of that term under the 1940 Act ("Interested Trustee"). The Trustees, in turn, elect the officers of the Trust to actively supervise its day-to-day operations.
The following tables list the Trustees, their ages, position with the Trust, commencement of service, principal occupations during the past five years and any directorships of other investment companies or companies whose securities are registered under the Securities Exchange Act of 1934, as amended, or who file reports under that Act. Each Trustee oversees 42 portfolios in the Trust, nine portfolios in Victory Variable Insurance Funds, one portfolio in Victory Institutional Funds and 20 portfolios in Victory Portfolios II, each a registered investment company that, together with the Trust, comprise the Victory Fund Complex. Each Trustee's address is c/o Victory Portfolios, 4900 Tiedeman Road, 4th Floor, Brooklyn, Ohio 44144. Each Trustee has an indefinite term.
Name and Age | | Position
Held with
the Trust | | Date
Commenced
Service | | Principal Occupation
During Past 5 Years | | Other
Directorships
Held During
Past 5 Years | |
Independent Trustees. | |
David Brooks Adcock, 66 | | Trustee | | May 2005 | | Consultant (since 2006). | | Chair and Trustee, Turner Funds (December 2016-December 2017). | |
Nigel D. T. Andrews, 71 | | Vice Chair and Trustee | | August 2002 | | Retired. | | Director, TCG BDC II, Inc. (since 2017); Director, TCG BDC I, Inc. (formerly Carlyle GMS Finance, Inc.)(since 2012); Director, Old Mutual US Asset Management (2002-2014). | |
E. Lee Beard, 67* | | Trustee | | May 2005 | | Retired (since 2015); Consultant, The Henlee Group, LLC (consulting) (2005-2015). | | None. | |
71
Victory Portfolios | | Supplemental Information — continued
June 30, 2018 | |
(Unaudited)
Name and Age | | Position
Held with
the Trust | | Date
Commenced
Service | | Principal Occupation
During Past 5 Years | | Other
Directorships
Held During
Past 5 Years | |
Dennis M. Bushe, 74 | | Trustee | | July 2016 | | Retired. | | Trustee, RS Investment Trust and RS Variable Products Trust (November 2011-July 2016). | |
Sally M. Dungan, 64 | | Trustee | | February 2011 | | Chief Investment Officer, Tufts University (since 2002). | | None. | |
John L. Kelly, 65 | | Trustee | | February 2015 | | Partner, McCarvill Capital Partners (September 2016-September 2017); Advisor (January 2016-April 2016); and Managing Partner (August 2014-January 2016), Endgate Commodities LLC; Chief Operating Officer, Liquidnet Holdings, Inc.
(2011-2014). | | Director, Caledonia Mining Corporation (since May 2012). | |
David L. Meyer, 61* | | Trustee | | December 2008 | | Retired. | | None. | |
Gloria S. Nelund, 57 | | Trustee | | July 2016 | | Chair, CEO and Co-Founder of TriLinc Global, LLC, an investment firm. | | TriLinc Global Impact Fund, LLC (since 2012); Trustee, RS Investment Trust and RS Variable Products Trust (November 2007-July 2016). | |
Leigh A. Wilson, 73 | | Chair and Trustee | | November 1994 | | Private Investor. | | Chair (since 2013, Caledonia Mining Corporation. | |
72
Victory Portfolios | | Supplemental Information — continued
June 30, 2018 | |
(Unaudited)
Name and Age | | Position
Held with
the Trust | | Date
Commenced
Service | | Principal Occupation
During Past 5 Years | | Other
Directorships
Held During
Past 5 Years | |
Interested Trustee. | |
David C. Brown, 46** | | Trustee | | May 2008 | | Chairman and Chief Executive Officer (since August 2013), Co-Chief Executive Officer (2011-2013), the Adviser; Chairman and Chief Executive Officer, Victory Capital Holdings, Inc. (since 2013). | | None. | |
* The Board has designated Mr. Meyer and Ms. Beard as its Audit Committee Financial Experts.
** Mr. Brown is an "Interested Person" by reason of his relationship with the Adviser.
The Statement of Additional Information includes additional information about the Trustees of the Trust and is available, without charge, by calling 800-539-3863.
73
Victory Portfolios | | Supplemental Information — continued
June 30, 2018 | |
(Unaudited)
Officers:
The officers of the Trust, their ages, commencement of service and their principal occupations during the past five years, are detailed in the following table. Each officer serves until the earlier of his or her resignation, removal, retirement, death, or the election of a successor. The mailing address of each officer of the Trust is 4900 Tiedeman Road, 4th Floor, Brooklyn, Ohio 44144. The officers of the Trust receive no compensation directly from the Trust for performing the duties of their offices.
Name and Age | | Position with
the Trust | | Date
Commenced
Service | | Principal Occupation During Past 5 Years | |
Christopher K. Dyer, 56 | | President | | February 2006* | | Director of Mutual Fund Administration, the Adviser. | |
Scott A. Stahorsky, 49 | | Vice President | | December 2014 | | Manager, Fund Administration, the Adviser (since 2015); Senior Analyst, Fund Administration, the Adviser (prior to 2015). | |
Erin G. Wagner, 44 | | Secretary | | December 2014 | | Associate General Counsel, the Adviser (since 2013). | |
Allan Shaer, 53 | | Treasurer | | May 2017 | | Senior Vice President, Financial Administration, Citi Fund Services Ohio, Inc. (since 2016); Vice President, Mutual Fund Administration, JP Morgan Chase (2011-2016). | |
Christopher A. Ponte, 34 | | Assistant Treasurer | | December 2017 | | Manager, Fund Administration, the Adviser (since 2017); Senior Analyst, Fund Administration, the Adviser (prior to 2017). Chief Financial Officer, Victory Capital Advisers, Inc. (since 2018). | |
Colin Kinney, 44 | | Chief Compliance Officer | | July 2017 | | Chief Compliance Officer (since 2013) and Chief Risk Officer (2009-2017), the Adviser. | |
Chuck Booth, 58 | | Anti-Money Laundering Compliance Officer and Identity Theft Officer | | May 2015 | | Director, Regulatory Administration and CCO Support Services, Citi Fund Services Ohio, Inc. | |
Jay G. Baris, 64 | | Assistant Secretary | | December 1997 | | Partner, Shearman & Sterling LLP (since 2018); Partner, Morrison & Foerster LLP (2011-2017). | |
* On December 3, 2014, Mr. Dyer resigned as Secretary of the Trust and accepted the position of President.
74
Victory Portfolios | | Supplemental Information — continued
June 30, 2018 | |
(Unaudited)
Proxy Voting and Form N-Q Information
Proxy Voting:
Information regarding the policies and procedures that the Funds use to determine how to vote proxies relating to portfolio securities is available without charge, upon request, by calling 800-539-3863. The information is also included in the Funds' Statement of Additional Information, which is available on the SEC's website at www.sec.gov.
Information relating to how the Funds voted proxies relating to portfolio securities held during the most recent twelve months ended June 30 is available on the SEC's website at www.sec.gov.
Availability of Schedules of Portfolio Investments:
The Trust files a complete list of Schedules of Portfolio Investments with the SEC for the first and third quarters of each fiscal year on Form N-Q. Forms N-Q are available on the SEC's website at www.sec.gov. You may also review or, for a fee, copy those documents by visiting the SEC's Public Reference Room in Washington, D.C. Information on the operation of the Public Reference Room can be obtained by calling the SEC at 202-551-8090.
Expense Examples
As a shareholder of the Funds, you may incur two types of costs: (1) transaction costs, including sales charges (loads) on purchases; and (2) ongoing costs, including management fees, distribution and service (12b-1) fees, and other Fund expenses. These examples are intended to help you understand your ongoing costs (in dollars) of investing in the Funds and to compare these costs with the ongoing costs of investing in other mutual funds.
These examples are based on an investment of $1,000 invested at the beginning of the period and held for the entire period from January 1, 2018 through June 30, 2018.
Actual Expenses:
The table below provides information about actual account values and actual expenses. You may use the information below, together with the amount you invested, to estimate the expenses that you paid over the period. Simply divide your account value by $1,000 (for example, an $8,600 account value divided by $1,000 = 8.6), then multiply the result by the number in the table under the heading entitled "Expenses Paid During Period" to estimate the expenses you paid on your account during this period.
| | | Beginning
Account Value
1/1/18 | | Ending
Account Value
6/30/18 | | Expenses Paid
During Period*
1/1/18-6/30/18 | | Annualized Net
Expense Ratio
During Period
1/1/18-6/30/18 | |
RS Small Cap Growth Fund | |
Class A Shares | | $ | 1,000.00 | | | $ | 1,125.50 | | | $ | 7.38 | | | | 1.40 | % | |
Class C Shares | | | 1,000.00 | | | | 1,121.20 | | | | 11.36 | | | | 2.16 | % | |
Class R Shares | | | 1,000.00 | | | | 1,123.10 | | | | 9.74 | | | | 1.85 | % | |
Class R6 Shares | | | 1,000.00 | | | | 1,127.40 | | | | 5.59 | | | | 1.06 | % | |
Class Y Shares | | | 1,000.00 | | | | 1,127.10 | | | | 5.96 | | | | 1.13 | % | |
RS Select Growth Fund | |
Class A Shares | | | 1,000.00 | | | | 1,082.10 | | | | 7.23 | | | | 1.40 | % | |
Class C Shares | | | 1,000.00 | | | | 1,077.70 | | | | 11.23 | | | | 2.18 | % | |
Class R Shares | | | 1,000.00 | | | | 1,079.40 | | | | 9.85 | | | | 1.91 | % | |
Class R6 Shares | | | 1,000.00 | | | | 1,083.90 | | | | 5.48 | | | | 1.06 | % | |
Class Y Shares | | | 1,000.00 | | | | 1,083.40 | | | | 5.89 | | | | 1.14 | % | |
* Expenses are equal to the average account value multiplied by the Fund's annualized expense ratio multiplied by 181/365 (the number of days in the most recent fiscal half-year divided by the number of days in the fiscal year).
75
Victory Portfolios | | Supplemental Information — continued
June 30, 2018 | |
(Unaudited)
| | | Beginning
Account Value
1/1/18 | | Ending
Account Value
6/30/18 | | Expenses Paid
During Period*
1/1/18-6/30/18 | | Annualized Net
Expense Ratio
During Period
1/1/18-6/30/18 | |
RS Mid Cap Growth Fund | |
Class A Shares | | $ | 1,000.00 | | | $ | 1,059.80 | | | $ | 6.13 | | | | 1.20 | % | |
Class C Shares | | | 1,000.00 | | | | 1,055.10 | | | | 10.75 | | | | 2.11 | % | |
Class R Shares | | | 1,000.00 | | | | 1,056.30 | | | | 9.18 | | | | 1.80 | % | |
Class R6 Shares | | | 1,000.00 | | | | 1,061.00 | | | | 4.80 | | | | 0.94 | % | |
Class Y Shares | | | 1,000.00 | | | | 1,061.00 | | | | 4.85 | | | | 0.95 | % | |
RS Growth Fund | |
Class A Shares | | | 1,000.00 | | | | 1,076.70 | | | | 5.66 | | | | 1.10 | % | |
Class C Shares | | | 1,000.00 | | | | 1,072.60 | | | | 9.92 | | | | 1.93 | % | |
Class R Shares | | | 1,000.00 | | | | 1,073.40 | | | | 8.79 | | | | 1.71 | % | |
Class Y Shares | | | 1,000.00 | | | | 1,078.20 | | | | 4.28 | | | | 0.83 | % | |
RS Science and Technology Fund | |
Class A Shares | | | 1,000.00 | | | | 1,179.50 | | | | 7.89 | | | | 1.46 | % | |
Class C Shares | | | 1,000.00 | | | | 1,174.70 | | | | 12.29 | | | | 2.28 | % | |
Class R Shares | | | 1,000.00 | | | | 1,176.90 | | | | 10.42 | | | | 1.93 | % | |
Class Y Shares | | | 1,000.00 | | | | 1,180.80 | | | | 6.60 | | | | 1.22 | % | |
RS Small Cap Equity Fund | |
Class A Shares | | | 1,000.00 | | | | 1,128.20 | | | | 6.38 | | | | 1.21 | % | |
Class C Shares | | | 1,000.00 | | | | 1,122.80 | | | | 11.05 | | | | 2.10 | % | |
Class R Shares | | | 1,000.00 | | | | 1,125.00 | | | | 9.22 | | | | 1.75 | % | |
Class Y Shares | | | 1,000.00 | | | | 1,128.60 | | | | 5.81 | | | | 1.10 | % | |
* Expenses are equal to the average account value multiplied by the Fund's annualized expense ratio multiplied by 181/365 (the number of days in the most recent fiscal half-year divided by the number of days in the fiscal year).
76
Victory Portfolios | | Supplemental Information — continued
June 30, 2018 | |
(Unaudited)
Hypothetical Example for Comparison Purposes:
The table below provides information about hypothetical account values and hypothetical expenses based on each Fund's actual expense ratio and an assumed rate of return of 5% per year before expenses, which is not the Fund's actual return. The hypothetical account values and expenses may not be used to estimate the actual ending account balance or expenses you paid for the period. You may use this information to compare this 5% hypothetical example with the 5% hypothetical examples that appear in the shareholder reports of other funds.
Please note that the expenses shown in the table are meant to highlight your ongoing costs only and do not reflect any transactional costs. Therefore, the table is useful in comparing ongoing costs only, and will not help you determine the relative total costs of owning different funds. In addition, if these transactional costs were included, your costs would have been higher.
| | | Beginning
Account Value
1/1/18 | | Ending
Account Value
6/30/18 | | Expenses Paid
During Period*
1/1/18-6/30/18 | | Annualized Net
Expense Ratio
During Period
1/1/18-6/30/18 | |
RS Small Cap Growth Fund | |
Class A Shares | | $ | 1,000.00 | | | $ | 1,017.85 | | | $ | 7.00 | | | | 1.40 | % | |
Class C Shares | | | 1,000.00 | | | | 1,014.08 | | | | 10.79 | | | | 2.16 | % | |
Class R Shares | | | 1,000.00 | | | | 1,015.62 | | | | 9.25 | | | | 1.85 | % | |
Class R6 Shares | | | 1,000.00 | | | | 1,019.54 | | | | 5.31 | | | | 1.06 | % | |
Class Y Shares | | | 1,000.00 | | | | 1,019.19 | | | | 5.66 | | | | 1.13 | % | |
RS Select Growth Fund | |
Class A Shares | | | 1,000.00 | | | | 1,017.85 | | | | 7.00 | | | | 1.40 | % | |
Class C Shares | | | 1,000.00 | | | | 1,013.98 | | | | 10.89 | | | | 2.18 | % | |
Class R Shares | | | 1,000.00 | | | | 1,015.32 | | | | 9.54 | | | | 1.91 | % | |
Class R6 Shares | | | 1,000.00 | | | | 1,019.54 | | | | 5.31 | | | | 1.06 | % | |
Class Y Shares | | | 1,000.00 | | | | 1,019.14 | | | | 5.71 | | | | 1.14 | % | |
RS Mid Cap Growth Fund | |
Class A Shares | | | 1,000.00 | | | | 1,018.84 | | | | 6.01 | | | | 1.20 | % | |
Class C Shares | | | 1,000.00 | | | | 1,014.33 | | | | 10.54 | | | | 2.11 | % | |
Class R Shares | | | 1,000.00 | | | | 1,015.87 | | | | 9.00 | | | | 1.80 | % | |
Class R6 Shares | | | 1,000.00 | | | | 1,020.13 | | | | 4.71 | | | | 0.94 | % | |
Class Y Shares | | | 1,000.00 | | | | 1,020.08 | | | | 4.76 | | | | 0.95 | % | |
RS Growth Fund | |
Class A Shares | | | 1,000.00 | | | | 1,019.34 | | | | 5.51 | | | | 1.10 | % | |
Class C Shares | | | 1,000.00 | | | | 1,015.22 | | | | 9.64 | | | | 1.93 | % | |
Class R Shares | | | 1,000.00 | | | | 1,016.31 | | | | 8.55 | | | | 1.71 | % | |
Class Y Shares | | | 1,000.00 | | | | 1,020.68 | | | | 4.16 | | | | 0.83 | % | |
RS Science and Technology Fund | |
Class A Shares | | | 1,000.00 | | | | 1,017.55 | | | | 7.30 | | | | 1.46 | % | |
Class C Shares | | | 1,000.00 | | | | 1,013.49 | | | | 11.38 | | | | 2.28 | % | |
Class R Shares | | | 1,000.00 | | | | 1,015.22 | | | | 9.64 | | | | 1.93 | % | |
Class Y Shares | | | 1,000.00 | | | | 1,018.74 | | | | 6.11 | | | | 1.22 | % | |
RS Small Cap Equity Fund | |
Class A Shares | | | 1,000.00 | | | | 1,018.79 | | | | 6.06 | | | | 1.21 | % | |
Class C Shares | | | 1,000.00 | | | | 1,014.38 | | | | 10.49 | | | | 2.10 | % | |
Class R Shares | | | 1,000.00 | | | | 1,016.12 | | | | 8.75 | | | | 1.75 | % | |
Class Y Shares | | | 1,000.00 | | | | 1,019.34 | | | | 5.51 | | | | 1.10 | % | |
* Expenses are equal to the average account value multiplied by the Fund's annualized expense ratio multiplied by 181/365 (the number of days in the most recent fiscal half-year divided by the number of days in the fiscal year).
77
Victory Portfolios | | Supplemental Information — continued
June 30, 2018 | |
(Unaudited)
Portfolio Holdings:
(As a Percentage of Total Investments)
RS Small Cap Growth Fund | | RS Select Growth Fund | |
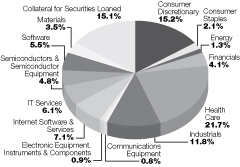
| | 
| |
RS Mid Cap Growth Fund | | RS Growth Fund | |
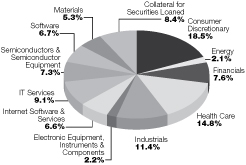
| | 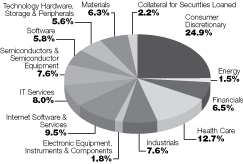
| |
RS Science and Technology Fund | | RS Small Cap Equity Fund | |

| | 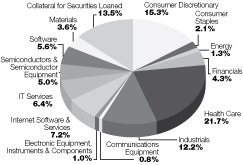
| |
78
Privacy Policy
Protecting the Privacy of Information
The Trust respects your right to privacy. We also know that you expect us to conduct and process your business in an accurate and efficient manner. To do so, we must collect and maintain certain personal information about you. This is the information we collect from you on applications or other forms, and from the transactions you make with us or third parties. It may include your name, address, social security number, account transactions and balances, and information about investment goals and risk tolerance.
We do not disclose any information about you or about former customers to anyone except as permitted or required by law. Specifically, we may disclose the information we collect to companies that perform services on our behalf, such as the transfer agent that processes shareholder accounts and printers and mailers that assist us in the distribution of investor materials. We may also disclose this information to companies that perform marketing services on our behalf. This allows us to continue to offer you Victory investment products and services that meet your investing needs, and to effect transactions that you request or authorize. These companies will use this information only in connection with the services for which we hired them. They are not permitted to use or share this information for any other purpose.
To protect your personal information internally, we permit access only by authorized employees and maintain physical, electronic and procedural safeguards to guard your personal information.*
*You may have received communications regarding information about privacy policies from other financial institutions which gave you the opportunity to "opt-out" of certain information sharing with companies which are not affiliated with that financial institution. The Trust does not share information with other companies for purposes of marketing solicitations for products other than the Trust. Therefore, the Trust does not provide opt-out options to their shareholders.
Victory Funds
P.O. Box 182593
Columbus, Ohio 43218-2593

Visit our website at: | | Call Victory at: | |
www.vcm.com | | 800-539-FUND (800-539-3863) | |

June 30, 2018
Semi Annual Report
Victory RS International Fund
Victory RS Global Fund
Victory Sophus Emerging Markets Fund
Victory Sophus Emerging Markets Small Cap Fund
www.vcm.com
News, Information And Education 24 Hours A Day, 7 Days A Week
The Victory Funds site gives fund shareholders, prospective shareholders, and investment professionals a convenient way to access fund information, get guidance, and track fund performance anywhere they can access the Internet. The site includes:
• Detailed performance records
• Daily share prices
• The latest fund news
• Investment resources to help you become a better investor
• A section dedicated to investment professionals
Whether you're a potential investor searching for the fund that matches your investment philosophy, a seasoned investor interested in planning tools, or an investment professional, www.vcm.com has what you seek. Visit us anytime. We're always open.
Victory Portfolios
Table of Contents
Financial Statements | |
The Victory International Funds | |
Victory RS International Fund | |
Schedule of Portfolio Investments | | | 3 | | |
Statements of Assets and Liabilities | | | 27 | | |
Statements of Operations | | | 29 | | |
Statements of Changes in Net Assets | | | 31-35 | | |
Financial Highlights | | | 36-39 | | |
Victory RS Global Fund | |
Schedule of Portfolio Investments | | | 8 | | |
Statements of Assets and Liabilities | | | 27 | | |
Statements of Operations | | | 29 | | |
Statements of Changes in Net Assets | | | 31-32 | | |
Financial Highlights | | | 40-43 | | |
Victory Sophus Emerging Markets Fund | |
Schedule of Portfolio Investments | | | 14 | | |
Statements of Assets and Liabilities | | | 28 | | |
Statements of Operations | | | 30 | | |
Statements of Changes in Net Assets | | | 33-35 | | |
Financial Highlights | | | 44-48 | | |
Victory Sophus Emerging Markets Small Cap Fund | |
Schedule of Portfolio Investments | | | 21 | | |
Statements of Assets and Liabilities | | | 28 | | |
Statements of Operations | | | 30 | | |
Statements of Changes in Net Assets | | | 33-35 | | |
Financial Highlights | | | 49-51 | | |
Notes to Financial Statements | | | 52 | | |
Supplemental Information | | | 64 | | |
Trustee and Officer Information | | | 64 | | |
Proxy Voting and Form N-Q Information | | | 68 | | |
Expense Examples | | | 68 | | |
Portfolio Holdings | | | 71 | | |
Privacy Policy (inside back cover) | | | |
1
The Funds are distributed by Victory Capital Advisers, Inc. Victory Capital Management Inc. is the investment adviser to the Funds and receives fees from the Funds for performing services for the Funds.
This report is not authorized for distribution to prospective investors unless preceded or accompanied by a current prospectus of the Victory Funds.
For additional information about any Victory Fund, including fees, expenses, and risks, view our prospectus online at www.vcm.com or call 800-539-3863. Read it carefully before you invest or send money.
The information in this semi annual report is based on data obtained from recognized services and sources and is believed to be reliable. Any opinions, projections, or recommendations in this report are subject to change without notice and are not intended as individual investment advice. Past investment performance of the Funds, markets or securities mentioned herein should not be considered to be indicative of future results.
• NOT FDIC INSURED • NO BANK GUARANTEE • MAY LOSE VALUE

Call Victory at:
800-539-FUND (800-539-3863)
Visit our website at:
www.vcm.com
2
Victory Portfolios
Victory RS International Fund | | Schedule of Portfolio Investments
June 30, 2018 | |
(Unaudited)
Security Description | | Shares | | Fair
Value(a) | |
Common Stocks (95.0%) | |
Australia (6.3%): | |
Financials (1.6%): | |
Macquarie Group Ltd. | | | 4,186 | | | $ | 381,420 | | |
Health Care (1.6%): | |
CSL Ltd. | | | 2,719 | | | | 386,954 | | |
Materials (1.9%): | |
BHP Billiton Ltd. | | | 17,359 | | | | 434,271 | | |
Real Estate (1.2%): | |
Scentre Group | | | 86,824 | | | | 282,039 | | |
| | | | 1,484,684 | | |
Belgium (1.0%): | |
Information Technology (1.0%): | |
Melexis NV | | | 2,527 | | | | 233,922 | | |
China (0.9%): | |
Information Technology (0.9%): | |
Tencent Holdings Ltd. | | | 4,400 | | | | 220,953 | | |
Denmark (2.8%): | |
Consumer Staples (2.8%): | |
Royal Unibrew A/S | | | 8,231 | | | | 654,188 | | |
France (8.6%): | |
Consumer Discretionary (2.7%): | |
Cie Generale des Etablissements Michelin | | | 1,896 | | | | 229,356 | | |
LVMH Moet Hennessy Louis Vuitton SA | | | 1,188 | | | | 394,407 | | |
| | | | 623,763 | | |
Energy (1.5%): | |
Total SA | | | 5,855 | | | | 355,521 | | |
Financials (1.4%): | |
AXA SA | | | 13,729 | | | | 335,424 | | |
Information Technology (1.7%): | |
Cap Gemini SA | | | 3,020 | | | | 404,677 | | |
Materials (1.3%): | |
Arkema SA | | | 2,552 | | | | 301,113 | | |
| | | | 2,020,498 | | |
Germany (8.4%): | |
Consumer Discretionary (0.9%): | |
Daimler AG, Registered Shares | | | 3,369 | | | | 215,791 | | |
Financials (2.0%): | |
Allianz SE | | | 2,304 | | | | 474,712 | | |
See notes to financial statements.
3
Victory Portfolios
Victory RS International Fund | | Schedule of Portfolio Investments �� continued
June 30, 2018 | |
(Unaudited)
Security Description | | Shares | | Fair
Value(a) | |
Health Care (1.1%): | |
Bayer AG | | | 2,332 | | | $ | 256,088 | | |
Industrials (1.8%): | |
Siemens AG | | | 1,627 | | | | 214,350 | | |
Washtec AG | | | 2,260 | | | | 199,211 | | |
| | | | 413,561 | | |
Information Technology (1.6%): | |
SAP SE | | | 3,261 | | | | 376,347 | | |
Real Estate (1.0%): | |
Vonovia SE | | | 4,843 | | | | 230,166 | | |
| | | | 1,966,665 | | |
Greece (0.5%): | |
Energy (0.5%): | |
Motor Oil (Hellas) Corinth Refineries SA | | | 5,560 | | | | 111,618 | | |
Hong Kong (3.7%): | |
Financials (2.1%): | |
AIA Group Ltd. | | | 25,600 | | | | 223,018 | | |
BOC Hong Kong Holdings Ltd. | | | 58,500 | | | | 274,953 | | |
| | | | 497,971 | | |
Real Estate (1.3%): | |
CK Asset Holdings Ltd. | | | 37,500 | | | | 296,869 | | |
Utilities (0.3%): | |
HK Electric Investments & HK Electric Investments Ltd. (b) | | | 70,500 | | | | 67,212 | | |
| | | | 862,052 | | |
Ireland (1.0%): | |
Industrials (1.0%): | |
Experian PLC | | | 9,298 | | | | 229,326 | | |
Italy (3.4%): | |
Financials (0.7%): | |
Banca Generali SpA | | | 6,766 | | | | 167,922 | | |
Health Care (1.3%): | |
Recordati SpA | | | 7,682 | | | | 304,376 | | |
Utilities (1.4%): | |
Enel SpA | | | 56,372 | | | | 312,342 | | |
| | | | 784,640 | | |
Japan (21.6%): | |
Consumer Discretionary (2.5%): | |
Toyota Motor Corp. | | | 9,000 | | | | 582,100 | | |
Consumer Staples (1.5%): | |
Matsumotokiyoshi Holdings Co. Ltd. | | | 7,800 | | | | 350,063 | | |
See notes to financial statements.
4
Victory Portfolios
Victory RS International Fund | | Schedule of Portfolio Investments — continued
June 30, 2018 | |
(Unaudited)
Security Description | | Shares | | Fair
Value(a) | |
Financials (2.8%): | |
Jafco Co. Ltd. | | | 4,300 | | | $ | 174,331 | | |
Mitsubishi UFJ Financial Group, Inc. | | | 39,200 | | | | 222,093 | | |
Tokio Marine Holdings, Inc. | | | 5,300 | | | | 247,985 | | |
| | | | 644,409 | | |
Health Care (2.2%): | |
Hoya Corp. | | | 4,800 | | | | 272,336 | | |
Shionogi & Co. Ltd. | | | 4,900 | | | | 251,472 | | |
| | | | 523,808 | | |
Industrials (7.1%): | |
EN-Japan, Inc. | | | 4,500 | | | | 226,482 | | |
Fuji Electric Co. Ltd. | | | 43,000 | | | | 326,677 | | |
Hitachi Construction Machinery Co. Ltd. | | | 5,300 | | | | 171,849 | | |
ITOCHU Corp. | | | 14,800 | | | | 267,707 | | |
Kyowa Exeo Corp. | | | 11,000 | | | | 287,900 | | |
Okuma Corp. | | | 2,600 | | | | 137,114 | | |
Sanwa Holdings Corp. | | | 23,700 | | | | 250,484 | | |
| | | | 1,668,213 | | |
Information Technology (1.8%): | |
Fujitsu Ltd. | | | 14,000 | | | | 84,733 | | |
Oracle Corp. Japan | | | 3,100 | | | | 252,700 | | |
Ulvac, Inc. | | | 2,100 | | | | 80,119 | | |
| | | | 417,552 | | |
Materials (0.6%): | |
DIC Corp. | | | 4,800 | | | | 149,717 | | |
Real Estate (0.8%): | |
Sumitomo Realty & Development | | | 5,000 | | | | 184,150 | | |
Telecommunication Services (1.3%): | |
Nippon Telegraph & Telephone Corp. | | | 6,400 | | | | 290,779 | | |
Utilities (1.0%): | |
Chubu Electric Power Co., Inc. | | | 16,100 | | | | 241,442 | | |
| | | | 5,052,233 | | |
Macau (0.8%): | |
Consumer Discretionary (0.8%): | |
Wynn Macau Ltd. | | | 60,400 | | | | 193,566 | | |
Netherlands (4.0%): | |
Financials (0.8%): | |
ING Groep NV | | | 12,703 | | | | 182,331 | | |
Industrials (1.7%): | |
Wolters Kluwer NV | | | 7,051 | | | | 396,070 | | |
Telecommunication Services (1.5%): | |
Koninklijke KPN NV | | | 127,993 | | | | 348,008 | | |
| | | | 926,409 | | |
See notes to financial statements.
5
Victory Portfolios
Victory RS International Fund | | Schedule of Portfolio Investments — continued
June 30, 2018 | |
(Unaudited)
Security Description | | Shares | | Fair
Value(a) | |
Norway (1.9%): | |
Energy (0.7%): | |
Aker BP ASA | | | 4,404 | | | $ | 162,058 | | |
Financials (1.2%): | |
SpareBank 1 SMN | | | 28,126 | | | | 291,412 | | |
| | | | 453,470 | | |
Russian Federation (0.7%): | |
Materials (0.7%): | |
Evraz PLC | | | 24,909 | | | | 166,222 | | |
Singapore (0.8%): | |
Financials (0.8%): | |
DBS Group Holdings Ltd. | | | 9,400 | | | | 182,842 | | |
Spain (1.9%): | |
Financials (0.9%): | |
Banco Santander SA | | | 36,617 | | | | 195,682 | | |
Telecommunication Services (1.0%): | |
Telefonica SA | | | 28,147 | | | | 238,877 | | |
| | | | 434,559 | | |
Sweden (1.8%): | |
Industrials (1.8%): | |
Atlas Copco AB, Class B | | | 11,624 | | | | 302,926 | | |
Epiroc AB, Class B (c) | | | 11,624 | | | | 106,454 | | |
| | | | 409,380 | | |
Switzerland (7.0%): | |
Consumer Staples (2.3%): | |
Nestle SA, Registered Shares | | | 6,887 | | | | 533,964 | | |
Financials (0.4%): | |
UBS Group AG, Registered Shares | | | 6,234 | | | | 95,608 | | |
Health Care (4.3%): | |
Novartis AG | | | 6,348 | | | | 481,062 | | |
Roche Holding AG | | | 2,319 | | | | 514,697 | | |
| | | | 995,759 | | |
| | | | 1,625,331 | | |
United Kingdom (17.9%): | |
Consumer Discretionary (0.7%): | |
Next PLC | | | 2,198 | | | | 174,926 | | |
Consumer Staples (4.3%): | |
Britvic PLC | | | 21,133 | | | | 216,656 | | |
Diageo PLC | | | 13,115 | | | | 471,081 | | |
Unilever PLC | | | 5,673 | | | | 313,321 | | |
| | | | 1,001,058 | | |
See notes to financial statements.
6
Victory Portfolios
Victory RS International Fund | | Schedule of Portfolio Investments — continued
June 30, 2018 | |
(Unaudited)
Security Description | | Shares | | Fair
Value(a) | |
Energy (2.9%): | |
| BP PLC | | | 26,662 | | | $ | 202,820 | | |
Royal Dutch Shell PLC, Class A | | | 13,865 | | | | 479,764 | | |
| | | | 682,584 | | |
Financials (3.5%): | |
Close Brothers Group PLC | | | 12,981 | | | | 253,366 | | |
HSBC Holdings PLC | | | 43,281 | | | | 404,358 | | |
Prudential PLC | | | 7,473 | | | | 170,325 | | |
| | | | 828,049 | | |
Health Care (1.5%): | |
Smith & Nephew PLC | | | 18,635 | | | | 343,199 | | |
Industrials (1.5%): | |
RELX PLC | | | 16,562 | | | | 353,615 | | |
Materials (3.5%): | |
Croda International PLC | | | 4,028 | | | | 254,430 | | |
Rio Tinto PLC | | | 10,066 | | | | 554,720 | | |
| | | | 809,150 | | |
| | | | 4,192,581 | | |
Total Common Stocks (Cost $19,225,710) | | | 22,205,139 | | |
Preferred Stocks (1.5%) | |
Japan (1.5%): | |
Consumer Staples (1.5%): | |
Ito En Ltd. | | | 15,600 | | | | 364,719 | | |
Total Preferred Stocks (Cost $254,255) | | | 364,719 | | |
Exchange-Traded Funds (1.1%) | |
United States (1.1%): | |
iShares MSCI EAFE ETF | | | 3,703 | | | | 247,990 | | |
Total Exchange-Traded Funds (Cost $256,829) | | | 247,990 | | |
Total Investments (Cost $19,736,794) — 97.6% | | | 22,817,848 | | |
Other assets in excess of liabilities — 2.4% | | | 564,870 | | |
NET ASSETS — 100.00% | | $ | 23,382,718 | | |
(a) All securities, except those traded on exchanges in the United States, were fair valued at June 30, 2018. See Note 2 for further information.
(b) Rule 144A security or other security that is restricted as to resale to institutional investors. The Fund's Adviser has deemed this security to be liquid based upon procedures approved by the Board of Trustees. As of June 30, 2018, the fair value of these securities was $67,212 and amounted to 0.3% of net assets.
(c) Non-income producing security.
ETF — Exchange-Traded Fund
PLC — Public Limited Company
See notes to financial statements.
7
Victory Portfolios
Victory RS Global Fund | | Schedule of Portfolio Investments
June 30, 2018 | |
(Unaudited)
Security Description | | Shares | | Fair
Value(a) | |
Common Stocks (95.9%) | |
Australia (2.7%): | |
Financials (1.1%): | |
Macquarie Group Ltd. | | | 4,056 | | | $ | 369,575 | | |
Health Care (1.6%): | |
CSL Ltd. | | | 3,696 | | | | 525,995 | | |
| | | | 895,570 | | |
Belgium (0.7%): | |
Information Technology (0.7%): | |
Melexis NV | | | 2,589 | | | | 239,662 | | |
Bermuda (0.5%): | |
Industrials (0.5%): | |
Triton International, Ltd./Ber | | | 5,394 | | | | 165,380 | | |
Canada (0.8%): | |
Energy (0.4%): | |
Canadian Natural Resources Ltd. | | | 3,534 | | | | 127,568 | | |
Financials (0.4%): | |
The Bank of Nova Scotia (b) | | | 2,625 | | | | 148,654 | | |
| | | | 276,222 | | |
China (2.4%): | |
Financials (1.1%): | |
Industrial & Commercial Bank of China Ltd. | | | 499,000 | | | | 372,184 | | |
Information Technology (1.3%): | |
Tencent Holdings Ltd. | | | 8,600 | | | | 431,863 | | |
| | | | 804,047 | | |
Denmark (2.0%): | |
Consumer Staples (1.3%): | |
Royal Unibrew A/S | | | 5,382 | | | | 427,754 | | |
Financials (0.7%): | |
Danske Bank A/S | | | 8,139 | | | | 253,595 | | |
| | | | 681,349 | | |
France (3.5%): | |
Consumer Discretionary (1.5%): | |
Cie Generale des Etablissements Michelin | | | 1,840 | | | | 222,582 | | |
LVMH Moet Hennessy Louis Vuitton SA | | | 884 | | | | 293,481 | | |
| | | | 516,063 | | |
Energy (0.7%): | |
Total SA | | | 3,816 | | | | 231,711 | | |
Financials (0.5%): | |
BNP Paribas SA | | | 2,509 | | | | 155,187 | | |
See notes to financial statements.
8
Victory Portfolios
Victory RS Global Fund | | Schedule of Portfolio Investments — continued
June 30, 2018 | |
(Unaudited)
Security Description | | Shares | | Fair
Value(a) | |
Materials (0.8%): | |
Arkema SA | | | 2,450 | | | $ | 289,077 | | |
| | | | 1,192,038 | | |
Germany (2.1%): | |
Consumer Discretionary (0.6%): | |
Daimler AG, Registered Shares | | | 3,284 | | | | 210,346 | | |
Financials (0.7%): | |
Hannover Rueck SE | | | 1,809 | | | | 224,880 | | |
Industrials (0.8%): | |
Washtec AG | | | 2,970 | | | | 261,795 | | |
| | | | 697,021 | | |
Greece (0.5%): | |
Energy (0.5%): | |
Motor Oil (Hellas) Corinth Refineries SA | | | 7,833 | | | | 157,248 | | |
Hong Kong (1.7%): | |
Energy (1.3%): | |
CNOOC Ltd. | | | 264,957 | | | | 454,027 | | |
Financials (0.4%): | |
BOC Hong Kong Holdings Ltd. | | | 27,000 | | | | 126,902 | | |
| | | | 580,929 | | |
India (0.8%): | |
Consumer Staples (0.8%): | |
Nestle India Ltd. | | | 1,864 | | | | 266,840 | | |
Indonesia (0.4%): | |
Telecommunication Services (0.4%): | |
PT Telekomunikasi Indonesia Persero TBK | | | 546,900 | | | | 143,280 | | |
Ireland (1.1%): | |
Industrials (1.1%): | |
Eaton Corp. PLC | | | 4,957 | | | | 370,486 | | |
Italy (2.0%): | |
Financials (0.4%): | |
Banca Generali SpA | | | 4,906 | | | | 121,759 | | |
Health Care (1.0%): | |
Recordati SpA | | | 8,231 | | | | 326,128 | | |
Utilities (0.6%): | |
Enel SpA | | | 39,466 | | | | 218,671 | | |
| | | | 666,558 | | |
Japan (6.9%): | |
Consumer Discretionary (1.0%): | |
Toyota Motor Corp. | | | 5,100 | | | | 329,856 | | |
See notes to financial statements.
9
Victory Portfolios
Victory RS Global Fund | | Schedule of Portfolio Investments — continued
June 30, 2018 | |
(Unaudited)
Security Description | | Shares | | Fair
Value(a) | |
Financials (1.1%): | |
Jafco Co. Ltd. | | | 3,900 | | | $ | 158,114 | | |
Resona Holdings, Inc. | | | 37,796 | | | | 201,472 | | |
| | | | 359,586 | | |
Health Care (1.8%): | |
As One Corp. | | | 4,579 | | | | 317,589 | | |
Hoya Corp. | | | 5,100 | | | | 289,357 | | |
| | | | 606,946 | | |
Industrials (2.5%): | |
EN-Japan, Inc. | | | 4,900 | | | | 246,614 | | |
Hitachi Construction Machinery Co. Ltd. | | | 3,900 | | | | 126,455 | | |
Kyowa Exeo Corp. | | | 11,400 | | | | 298,369 | | |
Okuma Corp. | | | 2,900 | | | | 152,934 | | |
| | | | 824,372 | | |
Information Technology (0.3%): | |
Ulvac, Inc. | | | 2,800 | | | | 106,826 | | |
Materials (0.2%): | |
DIC Corp. | | | 2,700 | | | | 84,216 | | |
| | | | 2,311,802 | | |
Korea, Republic Of (1.1%): | |
Information Technology (1.1%): | |
Samsung Electronics Co. Ltd. | | | 9,227 | | | | 386,550 | | |
Macau (0.5%): | |
Consumer Discretionary (0.5%): | |
Wynn Macau Ltd. | | | 52,000 | | | | 166,646 | | |
Malaysia (0.4%): | |
Financials (0.4%): | |
Malayan Banking Berhad | | | 54,000 | | | | 120,314 | | |
Mexico (0.5%): | |
Industrials (0.5%): | |
Promotora y Operadora de Infraestructura SAB de CV | | | 19,345 | | | | 172,878 | | |
Netherlands (0.8%): | |
Industrials (0.8%): | |
Wolters Kluwer NV | | | 4,935 | | | | 277,210 | | |
Norway (1.6%): | |
Energy (0.7%): | |
Aker BP ASA | | | 6,011 | | | | 221,192 | | |
Financials (0.9%): | |
SpareBank 1 SMN | | | 30,092 | | | | 311,782 | | |
| | | | 532,974 | | |
See notes to financial statements.
10
Victory Portfolios
Victory RS Global Fund | | Schedule of Portfolio Investments — continued
June 30, 2018 | |
(Unaudited)
Security Description | | Shares | | Fair
Value(a) | |
Russian Federation (0.6%): | |
Materials (0.6%): | |
Evraz PLC | | | 28,407 | | | $ | 189,565 | | |
Singapore (0.7%): | |
Financials (0.7%): | |
Singapore Exchange Ltd. | | | 44,400 | | | | 233,369 | | |
South Africa (0.6%): | |
Consumer Staples (0.6%): | |
Avi Ltd. | | | 25,043 | | | | 197,912 | | |
Sweden (1.7%): | |
Industrials (1.7%): | |
Atlas Copco AB, Class B | | | 7,997 | | | | 208,405 | | |
Epiroc AB, Class B (c) | | | 7,997 | | | | 73,237 | | |
Nolato AB | | | 3,576 | | | | 287,842 | | |
| | | | 569,484 | | |
Switzerland (1.6%): | |
Health Care (1.6%): | |
Roche Holding AG | | | 2,377 | | | | 527,570 | | |
Taiwan (0.8%): | |
Financials (0.8%): | |
Cathay Financial Holding Co. Ltd. | | | 158,000 | | | | 278,361 | | |
United Kingdom (6.3%): | |
Consumer Discretionary (0.5%): | |
Next PLC | | | 1,887 | | | | 150,175 | | |
Consumer Staples (2.2%): | |
Britvic PLC | | | 25,057 | | | | 256,885 | | |
Diageo PLC | | | 7,038 | | | | 252,800 | | |
Unilever PLC | | | 4,300 | | | | 237,490 | | |
| | | | 747,175 | | |
Financials (1.1%): | |
Close Brothers Group PLC | | | 13,298 | | | | 259,553 | | |
HSBC Holdings PLC | | | 11,505 | | | | 107,487 | | |
| | | | 367,040 | | |
Industrials (0.8%): | |
RELX PLC | | | 13,110 | | | | 279,911 | | |
Materials (1.3%): | |
Croda International PLC | | | 2,055 | | | | 129,805 | | |
Rio Tinto PLC | | | 5,730 | | | | 315,770 | | |
| | | | 445,575 | | |
Utilities (0.4%): | |
Severn Trent PLC | | | 5,643 | | | | 147,107 | | |
| | | | 2,136,983 | | |
See notes to financial statements.
11
Victory Portfolios
Victory RS Global Fund | | Schedule of Portfolio Investments — continued
June 30, 2018 | |
(Unaudited)
Security Description | | Shares | | Fair
Value(a) | |
United States (50.6%): | |
Consumer Discretionary (6.4%): | |
Amazon.com, Inc. (c) | | | 400 | | | $ | 679,920 | | |
McDonald's Corp. | | | 2,461 | | | | 385,614 | | |
Ross Stores, Inc. | | | 5,859 | | | | 496,550 | | |
The TJX Co., Inc. | | | 6,220 | | | | 592,020 | | |
| | | | 2,154,104 | | |
Consumer Staples (3.5%): | |
Colgate-Palmolive Co. | | | 9,334 | | | | 604,936 | | |
PepsiCo, Inc. | | | 5,362 | | | | 583,761 | | |
| | | | 1,188,697 | | |
Energy (2.1%): | |
ConocoPhillips | | | 4,852 | | | | 337,796 | | |
Phillips 66 | | | 3,239 | | | | 363,772 | | |
| | | | 701,568 | | |
Financials (7.4%): | |
Bank of America Corp. | | | 9,714 | | | | 273,838 | | |
CME Group, Inc. | | | 1,710 | | | | 280,303 | | |
JPMorgan Chase & Co. | | | 6,823 | | | | 710,957 | | |
MSCI, Inc. | | | 3,618 | | | | 598,526 | | |
The PNC Financial Services Group, Inc. | | | 2,185 | | | | 295,193 | | |
The Progressive Corp. | | | 5,552 | | | | 328,401 | | |
| | | | 2,487,218 | | |
Health Care (6.0%): | |
Aetna, Inc. | | | 2,534 | | | | 464,989 | | |
Amgen, Inc. | | | 2,946 | | | | 543,802 | | |
Celgene Corp. (c) | | | 2,674 | | | | 212,369 | | |
Eli Lilly & Co. | | | 6,215 | | | | 530,326 | | |
Johnson & Johnson | | | 2,163 | | | | 262,459 | | |
| | | | 2,013,945 | | |
Industrials (3.1%): | |
3M Co. | | | 1,831 | | | | 360,194 | | |
HD Supply Holdings, Inc. (c) | | | 6,840 | | | | 293,368 | | |
Honeywell International, Inc. | | | 2,783 | | | | 400,891 | | |
| | | | 1,054,453 | | |
Information Technology (15.7%): | |
Alphabet, Inc., Class C (c) | | | 496 | | | | 553,362 | | |
Apple, Inc. | | | 5,187 | | | | 960,166 | | |
Cisco Systems, Inc. | | | 13,948 | | | | 600,182 | | |
Facebook, Inc., Class A (c) | | | 3,153 | | | | 612,691 | | |
Mastercard, Inc., Class A | | | 4,449 | | | | 874,317 | | |
Microsoft Corp. | | | 10,780 | | | | 1,063,016 | | |
Texas Instruments, Inc. | | | 5,414 | | | | 596,894 | | |
| | | | 5,260,628 | | |
See notes to financial statements.
12
Victory Portfolios
Victory RS Global Fund | | Schedule of Portfolio Investments — continued
June 30, 2018 | |
(Unaudited)
Security Description | | Shares | | Fair
Value(a) | |
Materials (1.4%): | |
The Chemours Co. | | | 5,399 | | | $ | 239,500 | | |
Westlake Chemical Corp. | | | 2,100 | | | | 226,023 | | |
| | | | 465,523 | | |
Real Estate (1.5%): | |
Liberty Property Trust | | | 11,712 | | | | 519,193 | | |
Telecommunication Services (2.0%): | |
Verizon Communications, Inc. | | | 13,299 | | | | 669,073 | | |
Utilities (1.5%): | |
MGE Energy, Inc. | | | 8,047 | | | | 507,363 | | |
| | | | 17,021,765 | | |
Total Common Stocks (Cost $24,969,241) | | | 32,260,013 | | |
Preferred Stocks (0.6%) | |
Brazil (0.6%): | |
Financials (0.6%): | |
Itau Unibanco Holding S.A. | | | 18,310 | | | | 190,613 | | |
Total Preferred Stocks (Cost $168,305) | | | 190,613 | | |
Collateral for Securities Loaned (0.5%) | |
United States (0.5%): | |
BlackRock Liquidity Funds TempFund Portfolio, Institutional Class, 2.06% (d) | | | 20,954 | | | | 20,954 | | |
Fidelity Investments Prime Money Market Portfolio, Class I, 2.07% (d) | | | 19,050 | | | | 19,050 | | |
Fidelity Investments Money Market Government Portfolio, Class I, 1.81% (d) | | | 43,080 | | | | 43,080 | | |
Goldman Sachs Financial Square Prime Obligations Fund, Institutional
Class, 2.16% (d) | | | 9,524 | | | | 9,524 | | |
JPMorgan Prime Money Market Fund, Capital Class, 2.05% (d) | | | 49,522 | | | | 49,522 | | |
Morgan Stanley Institutional Liquidity Prime Portfolio, Institutional
Class, 2.12% (d) | | | 17,143 | | | | 17,143 | | |
Total Collateral for Securities Loaned (Cost $159,273) | | | 159,273 | | |
Total Investments (Cost $25,296,819) — 97.0% | | | 32,609,899 | | |
Other assets in excess of liabilities — 3.0% | | | 1,010,024 | | |
NET ASSETS — 100.00% | | $ | 33,619,923 | | |
(a) All securities, except those traded on exchanges in the United States, Bermuda, Brazil, Canada, Ireland and Mexico were fair valued at June 30, 2018. See Note 2 for further information.
(b) All or a portion of this security is on loan.
(c) Non-income producing security.
(d) Rate disclosed is the daily yield on June 30, 2018.
PLC — Public Limited Company
See notes to financial statements.
13
Victory Portfolios
Victory Sophus Emerging Markets Fund | | Schedule of Portfolio Investments
June 30, 2018 | |
(Unaudited)
Security Description | | Shares | | Fair
Value(a) | |
Common Stocks (97.6%) | |
Argentina (0.6%): | |
Financials (0.4%): | |
Banco Macro SA, ADR | | | 20,046 | | | $ | 1,178,504 | | |
Utilities (0.2%): | |
Pampa Energia SA, ADR (b) | | | 23,818 | | | | 851,970 | | |
| | | | 2,030,474 | | |
Austria (0.6%): | |
Financials (0.6%): | |
Erste Group Bank AG | | | 43,133 | | | | 1,798,066 | | |
Brazil (4.4%): | |
Financials (1.1%): | |
Banco Bradesco SA, ADR | | | 229,188 | | | | 1,572,230 | | |
Banco BTG Pactual SA | | | 391,600 | | | | 1,869,574 | | |
| | | | 3,441,804 | | |
Materials (2.2%): | |
Suzano Papel e Celulose SA | | | 190,700 | | | | 2,213,104 | | |
Vale SA, ADR | | | 376,508 | | | | 4,826,833 | | |
| | | | 7,039,937 | | |
Telecommunication Services (0.4%): | |
TIM Participacoes SA | | | 435,200 | | | | 1,480,242 | | |
Utilities (0.7%): | |
Energisa SA | | | 76,600 | | | | 578,206 | | |
Engie Brasil Energia SA | | | 188,800 | | | | 1,667,774 | | |
| | | | 2,245,980 | | |
| | | | 14,207,963 | | |
Chile (0.4%): | |
Energy (0.4%): | |
Geopark Ltd. (b) | | | 61,712 | | | | 1,273,736 | | |
China (28.4%): | |
Consumer Discretionary (1.1%): | |
JNBY Design Ltd. | | | 644,500 | | | | 1,472,499 | | |
Tianneng Power International Ltd. | | | 1,430,000 | | | | 2,219,769 | | |
| | | | 3,692,268 | | |
Consumer Staples (1.8%): | |
Ausnutria Dairy Corp. Ltd. | | | 1,067,000 | | | | 1,160,664 | | |
Chlitina Holding Ltd. | | | 215,000 | | | | 2,090,892 | | |
Want Want China Holdings Ltd. | | | 2,776,000 | | | | 2,468,560 | | |
| | | | 5,720,116 | | |
See notes to financial statements.
14
Victory Portfolios
Victory Sophus Emerging Markets Fund | | Schedule of Portfolio Investments — continued
June 30, 2018 | |
(Unaudited)
Security Description | | Shares | | Fair
Value(a) | |
Energy (1.9%): | |
China Petroleum & Chemical Corp., Class H | | | 3,412,000 | | | $ | 3,054,218 | | |
PetroChina Co. Ltd. | | | 4,054,000 | | | | 3,088,476 | | |
| | | | 6,142,694 | | |
Financials (6.3%): | |
China Construction Bank Corp. | | | 8,667,857 | | | | 7,931,650 | | |
Industrial & Commercial Bank of China Ltd. | | | 6,508,000 | | | | 4,854,052 | | |
Ping An Insurance Group Co. of China Ltd. | | | 818,500 | | | | 7,495,747 | | |
| | | | 20,281,449 | | |
Health Care (0.4%): | |
3SBio, Inc. (c) | | | 531,500 | | | | 1,201,043 | | |
Industrials (0.5%): | |
Lonking Holdings Ltd. | | | 3,900,000 | | | | 1,786,154 | | |
Information Technology (15.1%): | |
AAC Technologies Holdings, Inc. (d) | | | 143,500 | | | | 2,015,257 | | |
Alibaba Group Holding Ltd., ADR (b) (d) | | | 85,690 | | | | 15,898,066 | | |
Baidu, Inc., ADR (b) | | | 29,282 | | | | 7,115,526 | | |
Chinasoft International Ltd. | | | 2,308,000 | | | | 1,794,611 | | |
Tencent Holdings Ltd. | | | 367,515 | | | | 18,455,384 | | |
Weibo Corp., ADR (b) (d) | | | 20,972 | | | | 1,861,475 | | |
YY, Inc., ADR (b) | | | 13,437 | | | | 1,350,015 | | |
| | | | 48,490,334 | | |
Materials (0.6%): | |
Anhui Conch Cement Co. Ltd. | | | 313,500 | | | | 1,787,905 | | |
Real Estate (0.7%): | |
China Sce Property Holdings | | | 4,526,000 | | | | 2,138,747 | | |
| | | | 91,240,710 | | |
Colombia (0.6%): | |
Financials (0.6%): | |
Banco Davivienda SA | | | 161,135 | | | | 2,035,331 | | |
Cyprus (0.6%): | |
Industrials (0.6%): | |
Global Trans, Registered Shares, GDR | | | 199,091 | | | | 2,029,930 | | |
Hong Kong (5.9%): | |
Consumer Discretionary (3.5%): | |
China Maple Leaf Educational Systems Ltd. | | | 1,082,000 | | | | 1,943,020 | | |
Haier Electronics Group Co. Ltd. | | | 738,000 | | | | 2,517,912 | | |
Melco International Development Ltd. | | | 728,000 | | | | 2,233,271 | | |
Shangri-La Asia Ltd. | | | 1,146,000 | | | | 2,146,994 | | |
Xinyi Glass Holdings Ltd. | | | 1,978,000 | | | | 2,399,263 | | |
| | | | 11,240,460 | | |
Health Care (0.8%): | |
Sino Biopharmaceutical Ltd. | | | 1,767,000 | | | | 2,698,644 | | |
See notes to financial statements.
15
Victory Portfolios
Victory Sophus Emerging Markets Fund | | Schedule of Portfolio Investments — continued
June 30, 2018 | |
(Unaudited)
Security Description | | Shares | | Fair
Value(a) | |
Materials (0.5%): | |
Nine Dragons Paper Holdings Ltd. (d) | | | 1,305,000 | | | $ | 1,655,839 | | |
Real Estate (1.1%): | |
Shimao Property Holdings Ltd. | | | 1,337,000 | | | | 3,485,916 | | |
| | | | 19,080,859 | | |
Hungary (0.6%): | |
Financials (0.6%): | |
OTP Bank Public Co. Ltd. | | | 56,820 | | | | 2,055,918 | | |
India (8.3%): | |
Consumer Discretionary (1.5%): | |
Apollo Tyres Ltd. | | | 371,609 | | | | 1,382,484 | | |
Mahindra & Mahindra Ltd. | | | 270,821 | | | | 3,549,446 | | |
| | | | 4,931,930 | | |
Energy (0.6%): | |
Indian Oil Corp. Ltd. | | | 836,361 | | | | 1,910,373 | | |
Financials (2.3%): | |
Edelweiss Financial Services Ltd. | | | 459,840 | | | | 1,976,277 | | |
Shriram Transport Finance Co. Ltd. | | | 88,604 | | | | 1,681,546 | | |
Yes Bank Ltd. | | | 731,866 | | | | 3,636,932 | | |
| | | | 7,294,755 | | |
Health Care (0.9%): | |
Cipla Ltd. | | | 317,684 | | | | 2,853,872 | | |
Industrials (1.3%): | |
Larsen & Toubro Ltd. | | | 218,178 | | | | 4,062,352 | | |
Information Technology (0.6%): | |
HCL Technologies Ltd. | | | 142,679 | | | | 1,928,030 | | |
Real Estate (0.4%): | |
Sobha Ltd. | | | 206,193 | | | | 1,329,637 | | |
Utilities (0.7%): | |
Power Grid Corp. of India Ltd. | | | 849,496 | | | | 2,317,914 | | |
| | | | 26,628,863 | | |
Indonesia (2.7%): | |
Consumer Discretionary (0.6%): | |
PT Sri Rejeki Isman TBK | | | 77,147,300 | | | | 1,849,547 | | |
Energy (0.7%): | |
PT United Tractors TBK | | | 1,050,400 | | | | 2,313,697 | | |
Financials (1.0%): | |
PT Bank Negara Indonesia Persero TBK | | | 3,542,400 | | | | 1,741,202 | | |
PT Bank Tabungan Negara Persero TBK | | | 9,204,000 | | | | 1,571,362 | | |
| | | | 3,312,564 | | |
Materials (0.4%): | |
PT Indah Kiat Pulp & Paper Corp. TBK (b) | | | 841,200 | | | | 1,091,178 | | |
| | | | 8,566,986 | | |
See notes to financial statements.
16
Victory Portfolios
Victory Sophus Emerging Markets Fund | | Schedule of Portfolio Investments — continued
June 30, 2018 | |
(Unaudited)
Security Description | | Shares | | Fair
Value(a) | |
Korea, Republic Of (14.4%): | |
Consumer Discretionary (2.1%): | |
LG Electronics, Inc. | | | 36,692 | | | $ | 2,732,156 | | |
Lotte Himart Co. Ltd. | | | 42,204 | | | | 2,986,783 | | |
Modetour Network, Inc. (d) | | | 42,076 | | | | 1,026,288 | | |
| | | | 6,745,227 | | |
Consumer Staples (0.8%): | |
Orion Corp. | | | 18,919 | | | | 2,526,188 | | |
Energy (1.2%): | |
SK Innovation Co. Ltd. | | | 20,685 | | | | 3,746,976 | | |
Financials (2.0%): | |
KB Financial Group, Inc. | | | 79,108 | | | | 3,724,088 | | |
Korea Investment Holdings Co. Ltd. | | | 37,246 | | | | 2,808,586 | | |
| | | | 6,532,674 | | |
Industrials (0.5%): | |
Doosan Infracore Co. Ltd. (b) (d) | | | 175,015 | | | | 1,516,079 | | |
Information Technology (4.9%): | |
Samsung Electronics Co. Ltd. | | | 261,794 | | | | 10,967,425 | | |
SK Hynix, Inc. | | | 64,660 | | | | 4,963,699 | | |
| | | | 15,931,124 | | |
Materials (2.9%): | |
LG Chem Ltd. | | | 8,786 | | | | 2,629,961 | | |
Lotte Fine Chemical Co. Ltd. | | | 31,304 | | | | 1,824,624 | | |
POSCO, ADR | | | 40,074 | | | | 2,970,285 | | |
SKC Kolon PI, Inc. | | | 43,622 | | | | 1,935,353 | | |
| | | | 9,360,223 | | |
| | | | 46,358,491 | | |
Luxembourg (1.0%): | |
Materials (1.0%): | |
Ternium SA, ADR | | | 93,119 | | | | 3,242,404 | | |
Malaysia (1.2%): | |
Financials (0.7%): | |
CIMB Group Holdings Berhad | | | 1,531,000 | | | | 2,064,917 | | |
Industrials (0.5%): | |
Malaysia Airports Holdings Berhad | | | 747,400 | | | | 1,628,801 | | |
| | | | 3,693,718 | | |
Mexico (1.9%): | |
Financials (0.8%): | |
Banco del Bajio SA (c) | | | 1,280,391 | | | | 2,665,829 | | |
Industrials (0.5%): | |
Promotora y Operadora de Infraestructura SAB de CV | | | 189,223 | | | | 1,691,004 | | |
See notes to financial statements.
17
Victory Portfolios
Victory Sophus Emerging Markets Fund | | Schedule of Portfolio Investments — continued
June 30, 2018 | |
(Unaudited)
Security Description | | Shares | | Fair
Value(a) | |
Materials (0.6%): | |
Grupo Cementos de Chihuahua SAB de CV | | | 276,235 | | | $ | 1,792,595 | | |
| | | | 6,149,428 | | |
Philippines (0.6%): | |
Consumer Discretionary (0.6%): | |
Bloomberry Resorts Corp. | | | 10,915,500 | | | | 1,993,283 | | |
Poland (0.7%): | |
Financials (0.7%): | |
Bank Pekao SA | | | 72,035 | | | | 2,169,347 | | |
Russian Federation (3.6%): | |
Energy (2.0%): | |
LUKOIL PJSC, ADR | | | 92,137 | | | | 6,303,101 | | |
| | | | 6,303,101 | | |
Financials (1.1%): | |
Sberbank of Russia PJSC, ADR | | | 247,445 | | | | 3,546,169 | | |
| | | | 3,546,169 | | |
Utilities (0.5%): | |
Inter RAO UES PJSC | | | 23,618,000 | | | | 1,548,246 | | |
| | | | 11,397,516 | | |
South Africa (5.9%): | |
Consumer Discretionary (2.5%): | |
Naspers Ltd. | | | 32,022 | | | | 8,078,567 | | |
Consumer Staples (0.4%): | |
Astral Foods Ltd. | | | 63,414 | | | | 1,320,575 | | |
Financials (1.6%): | |
Barclays Africa Group Ltd. | | | 255,161 | | | | 2,964,476 | | |
Capitec Bank Holdings Ltd. | | | 35,173 | | | | 2,217,173 | | |
| | | | 5,181,649 | | |
Industrials (0.6%): | |
KAP Industrial Holdings Ltd. | | | 3,438,669 | | | | 1,871,952 | | |
Materials (0.8%): | |
Mondi Ltd. | | | 43,715 | | | | 1,184,736 | | |
PPC Ltd. (b) | | | 2,423,088 | | | | 1,280,870 | | |
| | | | 2,465,606 | | |
| | | | 18,918,349 | | |
Taiwan (10.0%): | |
Consumer Staples (0.5%): | |
TCI Co. Ltd. | | | 101,839 | | | | 1,569,653 | | |
Financials (2.3%): | |
Cathay Financial Holding Co. Ltd. | | | 2,394,000 | | | | 4,217,698 | | |
CTBC Financial Holding Co. Ltd. | | | 4,456,000 | | | | 3,202,398 | | |
| | | | 7,420,096 | | |
See notes to financial statements.
18
Victory Portfolios
Victory Sophus Emerging Markets Fund | | Schedule of Portfolio Investments — continued
June 30, 2018 | |
(Unaudited)
Security Description | | Shares | | Fair
Value(a) | |
Information Technology (6.2%): | |
ASPEED Technology, Inc. | | | 93,000 | | | $ | 2,435,409 | | |
Globalwafers Co. Ltd. | | | 70,000 | | | | 1,159,163 | | |
Largan Precision Co. Ltd. | | | 13,000 | | | | 1,910,204 | | |
MediaTek, Inc. | | | 354,000 | | | | 3,475,637 | | |
Taiwan Semiconductor Manufacturing Co. Ltd. | | | 1,316,998 | | | | 9,354,102 | | |
Win Semiconductors Corp. | | | 190,000 | | | | 1,360,809 | | |
| | | | 19,695,324 | | |
Telecommunication Services (1.0%): | |
Far EasTone Telecommunications Co. Ltd. | | | 1,268,000 | | | | 3,276,151 | | |
| | | | 31,961,224 | | |
Thailand (1.7%): | |
Energy (0.4%): | |
Banpu PCL | | | 2,427,800 | | | | 1,428,449 | | |
Materials (0.4%): | |
Indorama Ventures | | | 737,600 | | | | 1,218,292 | | |
Real Estate (0.9%): | |
Quality Houses PCL, Series F | | | 29,603,300 | | | | 2,748,735 | | |
| | | | 5,395,476 | | |
Turkey (1.6%): | |
Consumer Discretionary (0.4%): | |
Yatas Yatak ve Yorgan Sanayi ve Ticaret AS (b) | | | 258,906 | | | | 1,201,802 | | |
Financials (0.7%): | |
Turkiye Garanti Bankasi AS | | | 1,170,846 | | | | 2,137,221 | | |
Industrials (0.3%): | |
Pegasus Hava Tasimaciligi AS (b) | | | 183,950 | | | | 987,880 | | |
Materials (0.2%): | |
Anadolu Cam Sanayii AS | | | 1,203,044 | | | | 754,474 | | |
| | | | 5,081,377 | | |
United Arab Emirates (0.6%): | |
Financials (0.6%): | |
National Bank of Abu Dhabi PJSC | | | 593,283 | | | | 1,963,649 | | |
United Kingdom (1.3%): | |
Materials (1.3%): | |
Anglo American PLC | | | 188,116 | | | | 4,175,576 | | |
Total Common Stocks (Cost $295,328,564) | | | 313,448,674 | | |
Collateral for Securities Loaned (4.4%) | |
United States (4.4%): | |
BlackRock Liquidity Funds TempFund Portfolio, Institutional Class, 2.06% (e) | | | 1,840,384 | | | | 1,840,384 | | |
Fidelity Investments Prime Money Market Portfolio, Class I, 2.07% (e) | | | 1,673,137 | | | | 1,673,137 | | |
Fidelity Investments Money Market Government Portfolio, Class I, 1.81% (e) | | | 3,783,660 | | | | 3,783,660 | | |
See notes to financial statements.
19
Victory Portfolios
Victory Sophus Emerging Markets Fund | | Schedule of Portfolio Investments — continued
June 30, 2018 | |
(Unaudited)
Security Description | | Shares | | Fair
Value(a) | |
Goldman Sachs Financial Square Prime Obligations Fund, Institutional
Class, 2.16% (e) | | | 836,470 | | | $ | 836,470 | | |
JPMorgan Prime Money Market Fund, Capital Class, 2.05% (e) | | | 4,349,521 | | | | 4,349,521 | | |
Morgan Stanley Institutional Liquidity Prime Portfolio, Institutional
Class, 2.12% (e) | | | 1,505,645 | | | | 1,505,645 | | |
Total Collateral for Securities Loaned (Cost $13,988,817) | | | 13,988,817 | | |
Total Investments (Cost $309,317,381) — 102.0% | | | 327,437,491 | | |
Liabilities in excess of other assets — (2.0)% | | | (6,418,173 | ) | |
NET ASSETS — 100.00% | | | | $ | 321,019,318 | | |
(a) All securities, except those traded on exchanges in the United States (including ADRs), Brazil, Chile, Columbia and Mexico were fair valued at June 30, 2018. See Note 2 for further information.
(b) Non-income producing security.
(c) Rule 144A security or other security that is restricted as to resale to institutional investors. The Fund's Adviser has deemed this security to be liquid based upon procedures approved by the Board of Trustees. As of June 30, 2018, the fair value of these securities was $3,866,872 and amounted to 1.2% of net assets.
(d) All or a portion of this security is on loan.
(e) Rate disclosed is the daily yield on June 30, 2018.
ADR — American Depositary Receipt
GDR — Global Depository Receipt
PCL — Public Company Limited
PLC — Public Limited Company
See notes to financial statements.
20
Victory Portfolios
Victory Sophus Emerging Markets Small Cap Fund | | Schedule of Portfolio Investments
June 30, 2018 | |
(Unaudited)
Security Description | | Shares | | Fair
Value(a) | |
Common Stocks (98.1%) | |
Argentina (0.7%): | |
Utilities (0.7%): | |
Pampa Energia SA, ADR (b) | | | 985 | | | $ | 35,233 | | |
Brazil (3.2%): | |
Financials (0.7%): | |
Banco BTG Pactual SA | | | 7,700 | | | | 36,761 | | |
Materials (1.1%): | |
Bradespar SA | | | 7,900 | | | | 59,591 | | |
Utilities (1.4%): | |
Energisa SA | | | 3,200 | | | | 24,155 | | |
Engie Brasil Energia SA | | | 5,600 | | | | 49,468 | | |
| | | | 73,623 | | |
| | | | 169,975 | | |
Chile (0.8%): | |
Energy (0.8%): | |
Geopark Ltd. (b) | | | 2,127 | | | | 43,901 | | |
China (13.7%): | |
Consumer Discretionary (2.8%): | |
China Meidong Auto Holdings Ltd. | | | 86,000 | | | | 38,848 | | |
JNBY Design Ltd. | | | 10,000 | | | | 22,847 | | |
Tianneng Power International Ltd. | | | 30,000 | | | | 46,568 | | |
Xin Point Holdings Ltd. | | | 60,000 | | | | 39,552 | | |
| | | | 147,815 | | |
Consumer Staples (3.0%): | |
Ausnutria Dairy Corp. Ltd. (c) | | | 43,000 | | | | 46,775 | | |
Chlitina Holding Ltd. | | | 6,000 | | | | 58,351 | | |
Tianyun International Holdings Ltd. | | | 340,000 | | | | 54,901 | | |
| | | | 160,027 | | |
Health Care (0.8%): | |
Luye Pharma Group Ltd. | | | 41,500 | | | | 42,404 | | |
Industrials (0.9%): | |
Lonking Holdings Ltd. | | | 103,000 | | | | 47,173 | | |
Information Technology (3.9%): | |
Chinasoft International Ltd. | | | 72,000 | | | | 55,984 | | |
Hua Hong Semiconductor Ltd. (d) | | | 16,000 | | | | 54,687 | | |
Yangtze Optical Fibre and Cable Joint Stock Co. Ltd. (b) (c) (d) | | | 12,500 | | | | 50,363 | | |
YY, Inc., ADR (b) | | | 414 | | | | 41,595 | | |
| | | | 202,629 | | |
Materials (0.9%): | |
Maanshan Iron & Steel, Series H (b) | | | 104,000 | | | | 46,019 | | |
See notes to financial statements.
21
Victory Portfolios
Victory Sophus Emerging Markets Small Cap Fund | | Schedule of Portfolio Investments — continued
June 30, 2018 | |
(Unaudited)
Security Description | | Shares | | Fair
Value(a) | |
Real Estate (1.4%): | |
China Sce Property Holdings | | | 110,000 | | | $ | 51,980 | | |
Times Property Holdings Ltd. | | | 15,000 | | | | 22,143 | | |
| | | | 74,123 | | |
| | | | 720,190 | | |
Colombia (1.3%): | |
Financials (1.3%): | |
Banco Davivienda SA | | | 5,322 | | | | 67,223 | | |
Cyprus (1.0%): | |
Industrials (1.0%): | |
Global Trans, Registered Shares, GDR | | | 5,028 | | | | 51,265 | | |
Hong Kong (3.8%): | |
Consumer Discretionary (2.0%): | |
China Maple Leaf Educational Systems Ltd. | | | 28,000 | | | | 50,281 | | |
Haier Electronics Group Co. Ltd. | | | 16,000 | | | | 54,589 | | |
| | | | 104,870 | | |
Health Care (0.7%): | |
Lee's Pharmaceutical Holdings | | | 26,000 | | | | 33,798 | | |
Real Estate (1.1%): | |
Yuexiu Property Co. Ltd. | | | 304,000 | | | | 57,888 | | |
| | | | 196,556 | | |
India (15.3%): | |
Consumer Discretionary (3.1%): | |
Apollo Tyres Ltd. | | | 15,768 | | | | 58,661 | | |
Trident Ltd. | | | 38,707 | | | | 31,827 | | |
V-Mart Retail Ltd. | | | 1,956 | | | | 70,870 | | |
| | | | 161,358 | | |
Financials (2.3%): | |
Edelweiss Financial Services Ltd. | | | 15,049 | | | | 64,677 | | |
Shriram Transport Finance Co. Ltd. | | | 2,867 | | | | 54,410 | | |
| | | | 119,087 | | |
Health Care (1.7%): | |
Caplin Point Laboratories Ltd. | | | 5,065 | | | | 31,566 | | |
Jubilant Life Sciences Ltd. | | | 5,517 | | | | 56,400 | | |
| | | | 87,966 | | |
Industrials (2.1%): | |
Escorts Ltd. | | | 4,466 | | | | 56,886 | | |
NRB Bearings Ltd. | | | 22,100 | | | | 55,428 | | |
| | | | 112,314 | | |
Materials (4.0%): | |
Meghmani Organics Ltd. | | | 45,185 | | | | 54,245 | | |
MOIL Ltd. | | | 20,833 | | | | 52,766 | | |
See notes to financial statements.
22
Victory Portfolios
Victory Sophus Emerging Markets Small Cap Fund | | Schedule of Portfolio Investments — continued
June 30, 2018 | |
(Unaudited)
Security Description | | Shares | | Fair
Value(a) | |
Phillips Carbon Black Ltd. | | | 18,312 | | | $ | 58,515 | | |
West Coast Paper Mills Ltd. | | | 11,609 | | | | 44,437 | | |
| | | | 209,963 | | |
Real Estate (1.0%): | |
Sobha Ltd. | | | 8,015 | | | | 51,685 | | |
Utilities (1.1%): | |
CESC Ltd. | | | 4,562 | | | | 60,816 | | |
| | | | 803,189 | | |
Indonesia (3.1%): | |
Energy (0.9%): | |
PT Indo Tambangraya Megah TBK | | | 31,400 | | | | 48,993 | | |
Financials (0.8%): | |
PT Bank Tabungan Negara Persero TBK | | | 247,900 | | | | 42,323 | | |
Industrials (0.7%): | |
PT Pembangunan Perumahan Persero TBK | | | 268,800 | | | | 37,293 | | |
Materials (0.7%): | |
PT Indah Kiat Pulp & Paper Corp. TBK (b) | | | 27,500 | | | | 35,672 | | |
| | | | 164,281 | | |
Korea, Republic Of (16.4%): | |
Consumer Discretionary (2.3%): | |
Lotte Himart Co. Ltd. | | | 1,040 | | | | 73,601 | | |
Modetour Network, Inc. | | | 1,838 | | | | 44,831 | | |
| | | | 118,432 | | |
Consumer Staples (2.3%): | |
Hyundai Greenfood Co. Ltd. | | | 4,279 | | | | 54,634 | | |
Orion Corp. | | | 493 | | | | 65,828 | | |
| | | | 120,462 | | |
Financials (1.1%): | |
Korea Investment Holdings Co. Ltd. | | | 770 | | | | 58,063 | | |
Health Care (3.7%): | |
Caregen Co. Ltd. | | | 704 | | | | 50,784 | | |
Green Cross Corp. | | | 290 | | | | 53,755 | | |
Interojo Co. Ltd. | | | 1,287 | | | | 40,037 | | |
Rayence Co. Ltd. | | | 2,825 | | | | 50,027 | | |
| | | | 194,603 | | |
Industrials (1.3%): | |
Doosan Infracore Co. Ltd. (b) | | | 7,868 | | | | 68,157 | | |
Information Technology (3.3%): | |
DuzonBizon Co. Ltd. | | | 1,441 | | | | 80,088 | | |
Eugene Technology Co. Ltd. | | | 3,936 | | | | 55,518 | | |
Tokai Carbon Korea Co. Ltd. | | | 681 | | | | 39,597 | | |
| | | | 175,203 | | |
See notes to financial statements.
23
Victory Portfolios
Victory Sophus Emerging Markets Small Cap Fund | | Schedule of Portfolio Investments — continued
June 30, 2018 | |
(Unaudited)
Security Description | | Shares | | Fair
Value(a) | |
Materials (2.4%): | |
Lotte Fine Chemical Co. Ltd. | | | 973 | | | $ | 56,714 | | |
SKC Kolon PI, Inc. | | | 1,556 | | | | 69,034 | | |
| | | | 125,748 | | |
| | | | 860,668 | | |
Luxembourg (1.1%): | |
Materials (1.1%): | |
Ternium SA, ADR | | | 1,617 | | | | 56,304 | | |
Malaysia (2.9%): | |
Financials (1.0%): | |
RHB Capital Berhad | | | 38,500 | | | | 51,953 | | |
Health Care (1.3%): | |
Supermax Corp. Berhad | | | 64,600 | | | | 66,684 | | |
Industrials (0.6%): | |
Malaysia Airports Holdings Berhad | | | 15,000 | | | | 32,689 | | |
| | | | 151,326 | | |
Mexico (3.9%): | |
Financials (2.2%): | |
Banco del Bajio SA (d) | | | 28,667 | | | | 59,686 | | |
Credito Real Sab de CV | | | 44,951 | | | | 52,409 | | |
| | | | 112,095 | | |
Industrials (0.6%): | |
Promotora y Operadora de Infraestructura SAB de CV | | | 3,636 | | | | 32,494 | | |
Materials (1.1%): | |
Grupo Cementos de Chihuahua SAB de CV | | | 9,050 | | | | 58,729 | | |
| | | | 203,318 | | |
Philippines (0.8%): | |
Consumer Discretionary (0.8%): | |
Bloomberry Resorts Corp. | | | 218,800 | | | | 39,955 | | |
Poland (0.9%): | |
Consumer Staples (0.9%): | |
Dino Polska SA (b) (d) | | | 1,711 | | | | 47,268 | | |
Russian Federation (1.0%): | |
Financials (1.0%): | |
Bank St Petersburg PJSC | | | 67,890 | | | | 54,151 | | |
South Africa (4.6%): | |
Consumer Staples (1.9%): | |
Astral Foods Ltd. | | | 2,660 | | | | 55,393 | | |
Clover Industries Ltd. | | | 35,004 | | | | 41,901 | | |
| | | | 97,294 | | |
See notes to financial statements.
24
Victory Portfolios
Victory Sophus Emerging Markets Small Cap Fund | | Schedule of Portfolio Investments — continued
June 30, 2018 | |
(Unaudited)
Security Description | | Shares | | Fair
Value(a) | |
Industrials (0.8%): | |
KAP Industrial Holdings Ltd. | | | 82,100 | | | $ | 44,694 | | |
Materials (1.9%): | |
African Rainbow Minerals Ltd. | | | 7,776 | | | | 61,776 | | |
PPC Ltd. (b) | | | 71,026 | | | | 37,545 | | |
| | | | 99,321 | | |
| | | | 241,309 | | |
Taiwan (17.9%): | |
Consumer Discretionary (0.9%): | |
Samebest Co. Ltd. | | | 5,000 | | | | 48,408 | | |
Consumer Staples (1.1%): | |
TCI Co. Ltd. | | | 3,680 | | | | 56,720 | | |
Financials (1.1%): | |
King's Town Bank Co. Ltd. | | | 53,000 | | | | 56,832 | | |
Industrials (3.4%): | |
Sinmag Equipment Corp. | | | 9,066 | | | | 45,357 | | |
United Integrated Services Co. Ltd. | | | 29,000 | | | | 63,126 | | |
Xxentria Technology Material | | | 27,000 | | | | 69,747 | | |
| | | | 178,230 | | |
Information Technology (9.3%): | |
ASPEED Technology, Inc. | | | 2,000 | | | | 52,374 | | |
Chipbond Technology Corp. | | | 27,000 | | | | 55,877 | | |
Chroma ATE, Inc. | | | 15,000 | | | | 80,553 | | |
Ennoconn Corp. (b) | | | 4,000 | | | | 57,958 | | |
Epistar Corp. (b) | | | 35,000 | | | | 43,707 | | |
Parade Technologies Ltd. | | | 3,000 | | | | 50,191 | | |
Sino-American Silicon Products, Inc. | | | 19,000 | | | | 76,315 | | |
Taiwan Union Technology Corp. | | | 21,000 | | | | 73,988 | | |
| | | | 490,963 | | |
Materials (1.2%): | |
Grand Pacific Petrochemical | | | 65,000 | | | | 62,374 | | |
Real Estate (0.9%): | |
Huaku Development Co. Ltd. | | | 21,000 | | | | 45,610 | | |
| | | | 939,137 | | |
Thailand (2.7%): | |
Consumer Discretionary (0.7%): | |
Beauty Community PCL | | | 109,500 | | | | 40,277 | | |
Consumer Staples (0.9%): | |
Haad Thip PCL | | | 78,500 | | | | 45,689 | | |
Real Estate (1.1%): | |
Quality Houses PCL, Series F | | | 618,300 | | | | 57,411 | | |
| | | | 143,377 | | |
See notes to financial statements.
25
Victory Portfolios
Victory Sophus Emerging Markets Small Cap Fund | | Schedule of Portfolio Investments — continued
June 30, 2018 | |
(Unaudited)
Security Description | | Shares | | Fair
Value(a) | |
Turkey (3.0%): | |
Consumer Discretionary (0.7%): | |
Yatas Yatak ve Yorgan Sanayi ve Ticaret AS (b) | | | 8,321 | | | $ | 38,625 | | |
Financials (1.2%): | |
Yapi ve Kredi Bankasi AS (b) | | | 117,857 | | | | 63,470 | | |
Industrials (0.5%): | |
Pegasus Hava Tasimaciligi AS (b) | | | 4,737 | | | | 25,439 | | |
Materials (0.6%): | |
Anadolu Cam Sanayii AS | | | 45,153 | | | | 28,318 | | |
| | | | 155,852 | | |
Total Common Stocks (Cost $5,074,945) | | | 5,144,478 | | |
Collateral for Securities Loaned (0.7%) | |
United States (0.7%): | |
BlackRock Liquidity Funds TempFund Portfolio, Institutional Class, 2.06% (e) | | | 4,826 | | | | 4,826 | | |
Fidelity Investments Prime Money Market Portfolio, Class I, 2.07% (e) | | | 4,388 | | | | 4,388 | | |
Fidelity Investments Money Market Government Portfolio, Class I, 1.81% (e) | | | 9,923 | | | | 9,923 | | |
Goldman Sachs Financial Square Prime Obligations Fund, Institutional
Class, 2.16% (e) | | | 2,194 | | | | 2,194 | | |
JPMorgan Prime Money Market Fund, Capital Class, 2.05% (e) | | | 11,406 | | | | 11,406 | | |
Morgan Stanley Institutional Liquidity Prime Portfolio, Institutional
Class, 2.12% (e) | | | 3,949 | | | | 3,949 | | |
Total Collateral for Securities Loaned (Cost $36,686) | | | 36,686 | | |
Total Investments (Cost $5,111,631) — 98.8% | | | 5,181,164 | | |
Other assets in excess of liabilities — 1.2% | | | 61,082 | | |
NET ASSETS — 100.00% | | $ | 5,242,246 | | |
(a) All securities, except those traded on exchanges in the United States (including ADRs), Brazil, Chile, Columbia and Mexico were fair valued at June 30, 2018. See Note 2 for further information.
(b) Non-income producing security.
(c) All or a portion of this security is on loan.
(d) Rule 144A security or other security that is restricted as to resale to institutional investors. The Fund's Adviser has deemed this security to be liquid based upon procedures approved by the Board of Trustees. As of June 30, 2018, the fair value of these securities was $212,004 and amounted to 4.0% of net assets.
(e) Rate disclosed is the daily yield on June 30, 2018.
ADR — American Depositary Receipt
GDR — Global Depository Receipt
PCL — Public Company Limited
See notes to financial statements.
26
Victory Portfolios | | Statements of Assets and Liabilities
June 30, 2018 | |
(Unaudited)
| | | Victory RS
International Fund | | Victory RS
Global Fund | |
ASSETS: | |
Investments, at value (Cost $19,736,794 and $25,296,819) | | $ | 22,817,848 | | | $ | 32,609,899 | (a) | |
Foreign currency, at value (Cost $13,104 and $7,423) | | | 13,130 | | | | 7,424 | | |
Cash and cash equivalents | | | 440,497 | | | | 917,614 | | |
Interest and dividends receivable | | | 45,420 | | | | 66,118 | | |
Receivable for capital shares issued | | | 2,112 | | | | 125,979 | | |
Reclaims receivable | | | 82,571 | | | | 40,849 | | |
Receivable from Adviser | | | 12,483 | | | | 19,476 | | |
Prepaid expenses | | | 33,636 | | | | 41,492 | | |
Total Assets | | | 23,447,697 | | | | 33,828,851 | | |
LIABILITIES: | |
Securities lending collateral | | | — | | | | 159,273 | | |
Payable for capital shares redeemed | | | 18,953 | | | | 137 | | |
Accrued foreign capital gains taxes | | | — | | | | 2,802 | | |
Accrued expenses and other payables: | |
Investment advisory fees | | | 15,625 | | | | 22,113 | | |
Administration fees | | | 1,192 | | | | 1,686 | | |
Custodian fees | | | 4,911 | | | | 4,973 | | |
Transfer agent fees | | | 6,135 | | | | 2,941 | | |
Chief Compliance Officer fees | | | 17 | | | | 22 | | |
Trustees' fees | | | — | | | | 18 | | |
| 12b-1 fees | | | 2,602 | | | | 1,609 | | |
Other accrued expenses | | | 15,544 | | | | 13,354 | | |
Total Liabilities | | | 64,979 | | | | 208,928 | | |
NET ASSETS: | |
Capital | | | 20,240,760 | | | | 25,322,474 | | |
Accumulated net investment income (loss) | | | 744,448 | | | | 284,948 | | |
Accumulated net realized gains (losses) from investments,
net of taxes | | | (682,107 | ) | | | 703,122 | | |
Net unrealized appreciation (depreciation) on investments,
net of taxes | | | 3,079,617 | | | | 7,309,379 | | |
Net Assets | | $ | 23,382,718 | | | $ | 33,619,923 | | |
Net Assets | |
Class A Shares | | $ | 17,075,602 | | | $ | 3,590,140 | | |
Class C Shares | | | 804,995 | | | | 2,233,193 | | |
Class R Shares | | | 2,421,958 | | | | 1,589,580 | | |
Class Y Shares | | | 3,080,163 | | | | 26,207,010 | | |
Total | | $ | 23,382,718 | | | $ | 33,619,923 | | |
Shares (unlimited number of shares authorized
with a par value of $0.001 per share): | |
Class A Shares | | | 1,429,646 | | | | 276,645 | | |
Class C Shares | | | 92,222 | | | | 177,856 | | |
Class R Shares | | | 216,849 | | | | 99,178 | | |
Class Y Shares | | | 261,668 | | | | 2,035,220 | | |
Total | | | 2,000,385 | | | | 2,588,899 | | |
Net asset value, offering (except Class A Shares)
and redemption price per share: | |
Class A Shares | | $ | 11.94 | | | $ | 12.98 | | |
Class C Shares (b) | | $ | 8.73 | | | $ | 12.56 | | |
Class R Shares | | $ | 11.17 | | | $ | 16.03 | | |
Class Y Shares | | $ | 11.77 | | | $ | 12.88 | | |
Maximum Sales Charge — Class A Shares | | | 5.75 | % | | | 5.75 | % | |
Maximum offering price
(100%/(100%-maximum sales charge) of net asset value
adjusted to the nearest cent) per share — Class A Shares | | $ | 12.67 | | | $ | 13.77 | | |
(a) Includes $147,124 of securities on loan.
(b) Redemption price per share varies by the length of time shares are held.
See notes to financial statements.
27
Victory Portfolios | | Statements of Assets and Liabilities
June 30, 2018 | |
(Unaudited)
| | | Victory Sophus
Emerging Markets
Fund | | Victory Sophus
Emerging Markets
Small Cap Fund | |
ASSETS: | |
Investments, at value (Cost $309,317,381 and $5,111,631) | | $ | 327,437,491 | (a) | | $ | 5,181,164 | (b) | |
Foreign currency, at value (Cost $123,194 and $6,900) | | | 136,612 | | | | 6,264 | | |
Cash and cash equivalents | | | 7,103,053 | | | | 122,156 | | |
Interest and dividends receivable | | | 1,495,174 | | | | 11,715 | | |
Receivable for capital shares issued | | | 404,512 | | | | 27,089 | | |
Receivable for investments sold | | | 4,457,986 | | | | 54,321 | | |
Reclaims receivable | | | 2,629 | | | | 424 | | |
Receivable from Adviser | | | 71,195 | | | | 10,580 | | |
Prepaid expenses | | | 44,857 | | | | 20,429 | | |
Total Assets | | | 341,153,509 | | | | 5,434,142 | | |
LIABILITIES: | |
Securities lending collateral | | | 13,988,817 | | | | 36,686 | | |
Payable for investments purchased | | | 4,796,384 | | | | 132,250 | | |
Payable for capital shares redeemed | | | 935,054 | | | | — | | |
Accrued foreign capital gains taxes | | | 21,505 | | | | 256 | | |
Accrued expenses and other payables: | |
Investment advisory fees | | | 267,648 | | | | 5,571 | | |
Administration fees | | | 16,322 | | | | 272 | | |
Custodian fees | | | 20,176 | | | | 9,773 | | |
Transfer agent fees | | | 29,016 | | | | — | | |
Chief Compliance Officer fees | | | 163 | | | | 14 | | |
Trustees' fees | | | — | | | | 111 | | |
| 12b-1 fees | | | 16,980 | | | | 97 | | |
Other accrued expenses | | | 42,126 | | | | 6,866 | | |
Total Liabilities | | | 20,134,191 | | | | 191,896 | | |
NET ASSETS: | |
Capital | | | 279,090,989 | | | | 3,961,780 | | |
Accumulated net investment income (loss) | | | 1,489,530 | | | | (20,830 | ) | |
Accumulated net realized gains (losses) from investments,
net of taxes | | | 22,351,117 | | | | 1,232,260 | | |
Net unrealized appreciation (depreciation) on investments,
net of taxes | | | 18,087,682 | | | | 69,036 | | |
Net Assets | | $ | 321,019,318 | | | $ | 5,242,246 | | |
Net Assets | |
Class A Shares | | $ | 71,117,391 | | | $ | 465,891 | | |
Class C Shares | | | 13,922,679 | | | | 152,491 | | |
Class R Shares | | | 16,896,347 | | | | — | | |
Class R6 Shares | | | 21,619,160 | | | | — | | |
Class Y Shares | | | 197,463,741 | | | | 4,623,864 | | |
Total | | $ | 321,019,318 | | | $ | 5,242,246 | | |
Shares (unlimited number of shares authorized
with a par value of $0.001 per share): | |
Class A Shares | | | 3,311,749 | | | | 48,973 | | |
Class C Shares | | | 858,648 | | | | 17,146 | | |
Class R Shares | | | 837,754 | | | | — | | |
Class R6 Shares | | | 992,075 | | | | — | | |
Class Y Shares | | | 9,133,726 | | | | 487,929 | | |
Total | | | 15,133,952 | | | | 554,048 | | |
Net asset value, offering (except Class A Shares)
and redemption price per share: | |
Class A Shares | | $ | 21.47 | | | $ | 9.51 | | |
Class C Shares (c) | | $ | 16.21 | | | $ | 8.89 | | |
Class R Shares | | $ | 20.17 | | | $ | — | | |
Class R6 Shares | | $ | 21.79 | | | $ | — | | |
Class Y Shares | | $ | 21.62 | | | $ | 9.48 | | |
Maximum Sales Charge — Class A Shares | | | 5.75 | % | | | 5.75 | % | |
Maximum offering price
(100%/(100%-maximum sales charge) of net asset value
adjusted to the nearest cent) per share — Class A Shares | | $ | 22.78 | | | $ | 10.09 | | |
(a) Includes $13,891,408 of securities on loan.
(b) Includes $76,401 of securities on loan.
(c) Redemption price per share varies by the length of time shares are held.
See notes to financial statements.
28
Victory Portfolios | | Statements of Operations
For the Six Months Ended June 30, 2018 | |
(Unaudited)
| | | Victory RS
International Fund | | Victory RS
Global Fund | |
Investment Income: | |
Dividend income | | $ | 545,661 | | | $ | 524,303 | | |
Interest income | | | 1,659 | | | | 2,118 | | |
Securities lending income | | | 2,701 | | | | 1,068 | | |
Foreign tax withholding | | | (60,034 | ) | | | (43,479 | ) | |
Total Income | | | 489,987 | | | | 484,010 | | |
Expenses: | |
Investment advisory fees | | | 97,820 | | | | 131,136 | | |
Administration fees | | | 7,798 | | | | 9,884 | | |
12b-1 fees — Class A Shares | | | 22,437 | | | | 4,514 | | |
12b-1 fees — Class C Shares | | | 4,761 | | | | 11,432 | | |
12b-1 fees — Class R Shares | | | 6,182 | | | | 4,395 | | |
Custodian fees | | | 5,066 | | | | 8,198 | | |
Transfer agent fees | | | 804 | | | | 936 | | |
Transfer agent fees — Class A Shares | | | 15,474 | | | | 2,887 | | |
Transfer agent fees — Class C Shares | | | 712 | | | | 1,004 | | |
Transfer agent fees — Class R Shares | | | 2,541 | | | | 1,388 | | |
Transfer agent fees — Class Y Shares | | | 1,780 | | | | 9,524 | | |
Trustees' fees | | | 988 | | | | 1,231 | | |
Chief Compliance Officer fees | | | 93 | | | | 124 | | |
Legal and audit fees | | | 6,285 | | | | 9,055 | | |
State registration and filing fees | | | 27,205 | | | | 21,139 | | |
Interest expense on interfund lending (See Note 6) | | | 16 | | | | 37 | | |
Other expenses | | | 14,116 | | | | 11,061 | | |
Total Expenses | | | 214,078 | | | | 227,945 | | |
Expenses waived/reimbursed by Adviser | | | (73,141 | ) | | | (76,474 | ) | |
Net Expenses | | | 140,937 | | | | 151,471 | | |
Net Investment Income (Loss) | | | 349,050 | | | | 332,539 | | |
Realized/Unrealized Gains (Losses) from
Investment Transactions: | |
Net realized gains (losses) from investment transactions and
foreign currency translations | | | 797,752 | | | | 886,247 | | |
Net change in unrealized appreciation/depreciation
on investments and foreign currency translations | | | (1,496,012 | ) | | | (616,048 | ) | |
Net change in accrued foreign taxes on unrealized gains | | | — | | | | (2,802 | ) | |
Net realized/unrealized gains (losses) on investments | | | (698,260 | ) | | | 267,397 | | |
Change in net assets resulting from operations | | $ | (349,210 | ) | | $ | 599,936 | | |
See notes to financial statements.
29
Victory Portfolios | | Statements of Operations
For the Six Months Ended June 30, 2018 | |
(Unaudited)
| | | Victory Sophus
Emerging Markets
Fund | | Victory Sophus
Emerging Markets
Small Cap Fund | |
Investment Income: | |
Dividend income | | $ | 3,803,111 | | | $ | 69,056 | | |
Interest income | | | 33,751 | | | | 486 | | |
Securities lending income | | | 20,603 | | | | 1,517 | | |
Foreign tax withholding | | | (412,627 | ) | | | (7,122 | ) | |
Total Income | | | 3,444,838 | | | | 63,937 | | |
Expenses: | |
Investment advisory fees | | | 1,416,221 | | | | 38,835 | | |
Administration fees | | | 83,547 | | | | 2,199 | | |
12b-1 fees — Class A Shares | | | 102,320 | | | | 1,002 | | |
12b-1 fees — Class C Shares | | | 80,162 | | | | 514 | | |
12b-1 fees — Class R Shares | | | 46,165 | | | | — | | |
Custodian fees | | | 77,855 | | | | 23,259 | | |
Transfer agent fees | | | 5,609 | | | | 702 | | |
Transfer agent fees — Class A Shares | | | 54,368 | | | | 917 | | |
Transfer agent fees — Class C Shares | | | 9,391 | | | | 57 | | |
Transfer agent fees — Class R Shares | | | 14,836 | | | | — | | |
Transfer agent fees — Class R6 Shares | | | 89 | | | | — | | |
Transfer agent fees — Class Y Shares | | | 45,087 | | | | 378 | | |
Trustees' fees | | | 9,637 | | | | 399 | | |
Chief Compliance Officer fees | | | 986 | | | | 32 | | |
Legal and audit fees | | | 19,843 | | | | 10,588 | | |
State registration and filing fees | | | 33,706 | | | | 20,361 | | |
Interest expense on interfund lending (See Note 6) | | | — | | | | 119 | | |
Other expenses | | | 41,274 | | | | 14,387 | | |
Total Expenses | | | 2,041,096 | | | | 113,749 | | |
Expenses waived/reimbursed by Adviser | | | (357,184 | ) | | | (65,601 | ) | |
Net Expenses | | | 1,683,912 | | | | 48,148 | | |
Net Investment Income (Loss) | | | 1,760,926 | | | | 15,789 | | |
Realized/Unrealized Gains (Losses) from
Investment Transactions: | |
Net realized gains (losses) from investment transactions and
foreign currency translations | | | 13,554,846 | | | | 839,613 | | |
Foreign taxes on realized gains | | | (180,817 | ) | | | (13,327 | ) | |
Net change in unrealized appreciation/depreciation
on investments and foreign currency translations | | | (33,760,643 | ) | | | (1,154,132 | ) | |
Net change in accrued foreign taxes on unrealized gains | | | 98,027 | | | | 4,627 | | |
Net realized/unrealized gains (losses) on investments | | | (20,288,587 | ) | | | (323,219 | ) | |
Change in net assets resulting from operations | | $ | (18,527,661 | ) | | $ | (307,430 | ) | |
See notes to financial statements.
30
Victory Portfolios | | Statements of Changes in Net Assets | |
| | | Victory RS
International Fund | | Victory RS Global Fund | |
| | | Six
Months
Ended
June 30,
2018 | | Year
Ended
December 31,
2017 | | Six
Months
Ended
June 30,
2018 | | Year
Ended
December 31,
2017 | |
| | | (Unaudited) | | | | (Unaudited) | | | |
From Investment Activities: | |
Operations: | |
Net investment income (loss) | | $ | 349,050 | | | $ | 401,339 | | | $ | 332,539 | | | $ | 405,880 | | |
Net realized gains (losses) from
investment transactions | | | 797,752 | | | | 1,791,820 | | | | 886,247 | | | | 2,548,077 | | |
Net change in unrealized
appreciation/depreciation
on investments | | | (1,496,012 | ) | | | 3,271,207 | | | | (618,850 | ) | | | 3,951,915 | | |
Change in net assets
resulting from operations | | | (349,210 | ) | | | 5,464,366 | | | | 599,936 | | | | 6,905,872 | | |
Distributions to Shareholders: | |
From net investment income: | |
Class A Shares | | | — | | | | (307,863 | ) | | | — | | | | — | | |
Class C Shares | | | — | | | | (15,363 | ) | | | — | | | | — | | |
Class R Shares | | | — | | | | (37,846 | ) | | | — | | | | — | | |
Class Y Shares | | | — | | | | (60,563 | ) | | | — | | | | — | | |
From net realized gains: | |
Class A Shares | | | — | | | | — | | | | — | | | | (543,276 | ) | |
Class C Shares | | | — | | | | — | | | | — | | | | (156,755 | ) | |
Class R Shares | | | — | | | | — | | | | — | | | | (67,741 | ) | |
Class Y Shares | | | — | | | | — | | | | — | | | | (2,464,785 | ) | |
From return of capital: | |
Class A Shares | | | — | | | | — | | | | — | | | | (24,057 | ) | |
Class C Shares | | | — | | | | — | | | | — | | | | (15,460 | ) | |
Class R Shares | | | — | | | | — | | | | — | | | | (9,829 | ) | |
Class Y Shares | | | — | | | | — | | | | — | | | | (172,663 | ) | |
Change in net assets resulting from
distributions to shareholders | | | — | | | | (421,635 | ) | | | — | | | | (3,454,566 | ) | |
Change in net assets resulting from
capital transactions | | | (1,490,195 | ) | | | (2,752,912 | ) | | | 459,245 | | | | (168,624 | ) | |
Change in net assets | | | (1,839,405 | ) | | | 2,289,819 | | | | 1,059,181 | | | | 3,282,682 | | |
Net Assets: | |
Beginning of period | | | 25,222,123 | | | | 22,932,304 | | | | 32,560,742 | | | | 29,278,060 | | |
End of period | | $ | 23,382,718 | | | $ | 25,222,123 | | | $ | 33,619,923 | | | $ | 32,560,742 | | |
Accumulated net investment
income (loss) | | $ | 744,448 | | | $ | 395,398 | | | $ | 284,948 | | | $ | (47,591 | ) | |
See notes to financial statements.
31
Victory Portfolios | | Statements of Changes in Net Assets | |
(continued)
| | | Victory RS
International Fund | | Victory RS Global Fund | |
| | | Six
Months
Ended
June 30,
2018 | | Year
Ended
December 31,
2017 | | Six
Months
Ended
June 30,
2018 | | Year
Ended
December 31,
2017 | |
| | | (Unaudited) | | | | (Unaudited) | | | |
Capital Transactions: | |
Class A Shares | |
Proceeds from shares issued | | $ | 730,463 | | | $ | 1,345,259 | | | $ | 1,098,064 | | | $ | 1,476,336 | | |
Distributions reinvested | | | — | | | | 303,958 | | | | — | | | | 299,166 | | |
Cost of shares redeemed | | | (1,914,982 | ) | | | (3,555,832 | ) | | | (1,033,419 | ) | | | (4,335,139 | ) | |
Total Class A Shares | | $ | (1,184,519 | ) | | $ | (1,906,615 | ) | | $ | 64,645 | | | $ | (2,559,637 | ) | |
Class C Shares | |
Proceeds from shares issued | | $ | 76,551 | | | $ | 226,561 | | | $ | 433,380 | | | $ | 883,436 | | |
Distributions reinvested | | | — | | | | 15,271 | | | | — | | | | 160,643 | | |
Cost of shares redeemed | | | (322,295 | ) | | | (651,693 | ) | | | (395,455 | ) | | | (336,156 | ) | |
Total Class C Shares | | $ | (245,744 | ) | | $ | (409,861 | ) | | $ | 37,925 | | | $ | 707,923 | | |
Class R Shares | |
Proceeds from shares issued | | $ | 125,719 | | | $ | 284,156 | | | $ | 347,809 | | | $ | 2,569,832 | | |
Distributions reinvested | | | — | | | | 37,846 | | | | — | | | | 77,532 | | |
Cost of shares redeemed | | | (185,353 | ) | | | (580,176 | ) | | | (1,082,533 | ) | | | (10,029,938 | ) | |
Total Class R Shares | | $ | (59,634 | ) | | $ | (258,174 | ) | | $ | (734,724 | ) | | $ | (7,382,574 | ) | |
Class Y Shares | |
Proceeds from shares issued | | $ | 279,849 | | | $ | 969,642 | | | $ | 2,758,261 | | | $ | 22,829,087 | | |
Distributions reinvested | | | — | | | | 59,974 | | | | — | | | | 1,560,504 | | |
Cost of shares redeemed | | | (280,147 | ) | | | (1,207,878 | ) | | | (1,666,862 | ) | | | (15,323,927 | ) | |
Total Class Y Shares | | $ | (298 | ) | | $ | (178,262 | ) | | $ | 1,091,399 | | | $ | 9,065,664 | | |
Change in net assets resulting from
capital transactions | | $ | (1,490,195 | ) | | $ | (2,752,912 | ) | | $ | 459,245 | | | $ | (168,624 | ) | |
Share Transactions: | |
Class A Shares | |
Issued | | | 59,287 | | | | 120,481 | | | | 84,668 | | | | 120,545 | | |
Reinvested | | | — | | | | 25,183 | | | | — | | | | 24,663 | | |
Redeemed | | | (156,629 | ) | | | (325,652 | ) | | | (79,144 | ) | | | (354,909 | ) | |
Total Class A Shares | | | (97,342 | ) | | | (179,988 | ) | | | 5,524 | | | | (209,701 | ) | |
Class C Shares | |
Issued | | | 8,594 | | | | 27,427 | | | | 34,194 | | | | 73,426 | | |
Reinvested | | | — | | | | 1,725 | | | | — | | | | 13,614 | | |
Redeemed | | | (36,199 | ) | | | (78,607 | ) | | | (31,403 | ) | | | (27,946 | ) | |
Total Class C Shares | | | (27,605 | ) | | | (49,455 | ) | | | 2,791 | | | | 59,094 | | |
Class R Shares | |
Issued | | | 11,032 | | | | 27,454 | | | | 21,240 | | | | 170,015 | | |
Reinvested | | | — | | | | 3,349 | | | | — | | | | 5,165 | | |
Redeemed | | | (16,368 | ) | | | (55,683 | ) | | | (66,762 | ) | | | (706,954 | ) | |
Total Class R Shares | | | (5,336 | ) | | | (24,880 | ) | | | (45,522 | ) | | | (531,774 | ) | |
Class Y Shares | |
Issued | | | 23,376 | | | | 92,834 | | | | 212,415 | | | | 1,869,856 | | |
Reinvested | | | — | | | | 5,048 | | | | — | | | | 129,913 | | |
Redeemed | | | (23,323 | ) | | | (107,225 | ) | | | (129,245 | ) | | | (1,264,469 | ) | |
Total Class Y Shares | | | 53 | | | | (9,343 | ) | | | 83,170 | | | | 735,300 | | |
Change in Shares | | | (130,230 | ) | | | (263,666 | ) | | | 45,963 | | | | 52,919 | | |
See notes to financial statements.
32
Victory Portfolios | | Statements of Changes in Net Assets | |
| | | Victory Sophus Emerging
Markets Fund | | Victory Sophus Emerging
Markets Small Cap Fund | |
| | | Six
Months
Ended
June 30,
2018 | | Year
Ended
December 31,
2017 | | Six
Months
Ended
June 30,
2018 | | Year
Ended
December 31,
2017 | |
| | | (Unaudited) | | | | (Unaudited) | | | |
From Investment Activities: | |
Operations: | |
Net investment income (loss) | | $ | 1,760,926 | | | $ | 1,686,452 | | | $ | 15,789 | | | $ | 259,221 | | |
Net realized gains (losses) from
investment transactions | | | 13,374,029 | | | | 30,635,213 | | | | 826,286 | | | | 6,453,418 | | |
Net change in unrealized
appreciation/depreciation
on investments | | | (33,662,616 | ) | | | 32,531,177 | | | | (1,149,505 | ) | | | 730,976 | | |
Change in net assets
resulting from operations | | | (18,527,661 | ) | | | 64,852,842 | | | | (307,430 | ) | | | 7,443,615 | | |
Distributions to Shareholders: | |
From net investment income: | |
Class A Shares | | | — | | | | (594,980 | ) | | | — | | | | (17,106 | ) | |
Class C Shares | | | — | | | | (68,358 | ) | | | — | | | | (797 | ) | |
Class R Shares | | | — | | | | (98,067 | ) | | | — | | | | — | | |
Class R6 Shares | | | — | | | | (210,158 | ) | | | — | | | | — | | |
Class Y Shares | | | — | | | | (1,012,266 | ) | | | — | | | | (118,026 | ) | |
From net realized gains: | |
Class A Shares | | | — | | | | — | | | | — | | | | (825,260 | ) | |
Class C Shares | | | — | | | | — | | | | — | | | | (23,128 | ) | |
Class Y Shares | | | — | | | | — | | | | — | | | | (4,317,635 | ) | |
Change in net assets resulting from
distributions to shareholders | | | — | | | | (1,983,829 | ) | | | — | | | | (5,301,952 | ) | |
Change in net assets resulting from
capital transactions | | | 109,669,407 | | | | 16,704,818 | | | | (1,689,706 | ) | | | (14,739,226 | ) | |
Change in net assets | | | 91,141,746 | | | | 79,573,831 | | | | (1,997,136 | ) | | | (12,597,563 | ) | |
Net Assets: | |
Beginning of period | | | 229,877,572 | | | | 150,303,741 | | | | 7,239,382 | | | | 19,836,945 | | |
End of period | | $ | 321,019,318 | | | $ | 229,877,572 | | | $ | 5,242,246 | | | $ | 7,239,382 | | |
Accumulated net investment
income (loss) | | $ | 1,489,530 | | | $ | (271,396 | ) | | $ | (20,830 | ) | | $ | (36,619 | ) | |
See notes to financial statements.
33
Victory Portfolios | | Statements of Changes in Net Assets | |
(continued)
| | | Victory Sophus Emerging
Markets Fund | | Victory Sophus Emerging
Markets Small Cap Fund | |
| | | Six
Months
Ended
June 30,
2018 | | Year
Ended
December 31,
2017 | | Six
Months
Ended
June 30,
2018 | | Year
Ended
December 31,
2017 | |
| | | (Unaudited) | | | | (Unaudited) | | | |
Capital Transactions: | |
Class A Shares | |
Proceeds from shares issued | | $ | 25,353,923 | | | $ | 20,837,049 | | | $ | 261,790 | | | $ | 1,276,676 | | |
Distributions reinvested | | | — | | | | 584,720 | | | | — | | | | 357,781 | | |
Cost of shares redeemed | | | (26,984,825 | ) | | | (30,515,779 | ) | | | (1,206,271 | ) | | | (2,905,000 | ) | |
Total Class A Shares | | $ | (1,630,902 | ) | | $ | (9,094,010 | ) | | $ | (944,481 | ) | | $ | (1,270,543 | ) | |
Class C Shares | |
Proceeds from shares issued | | $ | 2,082,635 | | | $ | 1,966,975 | | | $ | 109,713 | | | $ | 72,090 | | |
Distributions reinvested | | | — | | | | 65,677 | | | | — | | | | 16,457 | | |
Cost of shares redeemed | | | (3,285,844 | ) | | | (3,118,915 | ) | | | (48,905 | ) | | | (3,538 | ) | |
Total Class C Shares | | $ | (1,203,209 | ) | | $ | (1,086,263 | ) | | $ | 60,808 | | | $ | 85,009 | | |
Class R Shares | |
Proceeds from shares issued | | $ | 2,039,264 | | | $ | 2,791,073 | | | $ | — | | | $ | — | | |
Distributions reinvested | | | — | | | | 97,665 | | | | — | | | | — | | |
Cost of shares redeemed | | | (2,143,195 | ) | | | (6,899,965 | ) | | | — | | | | — | | |
Total Class R Shares | | $ | (103,931 | ) | | $ | (4,011,227 | ) | | $ | — | | | $ | — | | |
Class R6 Shares | |
Proceeds from shares issued | | $ | 6,682,684 | | | $ | 17,691,890 | | | $ | — | | | $ | — | | |
Distributions reinvested | | | — | | | | 210,158 | | | | — | | | | — | | |
Cost of shares redeemed | | | (2,753,974 | ) | | | (2,432,331 | ) | | | — | | | | — | | |
Total Class R6 Shares | | $ | 3,928,710 | | | $ | 15,469,717 | | | $ | — | | | $ | — | | |
Class Y Shares | |
Proceeds from shares issued | | $ | 128,844,999 | | | $ | 59,171,528 | | | $ | 4,404,104 | | | $ | 907,791 | | |
Distributions reinvested | | | — | | | | 982,783 | | | | — | | | | 164,526 | | |
Cost of shares redeemed | | | (20,166,260 | ) | | | (44,727,710 | ) | | | (5,210,137 | ) | | | (14,626,009 | ) | |
Total Class Y Shares | | $ | 108,678,739 | | | $ | 15,426,601 | | | $ | (806,033 | ) | | $ | (13,553,692 | ) | |
Change in net assets resulting from
capital transactions | | $ | 109,669,407 | | | $ | 16,704,818 | | | $ | (1,689,706 | ) | | $ | (14,739,226 | ) | |
(continues on next page)
See notes to financial statements.
34
Victory Portfolios | | Statements of Changes in Net Assets | |
(continued)
| | | Victory Sophus Emerging
Markets Fund | | Victory Sophus Emerging
Markets Small Cap Fund | |
| | | Six
Months
Ended
June 30,
2018 | | Year
Ended
December 31,
2017 | | Six
Months
Ended
June 30,
2018 | | Year
Ended
December 31,
2017 | |
| | | (Unaudited) | | | | (Unaudited) | | | |
Share Transactions: | |
Class A Shares | |
Issued | | | 1,082,759 | | | | 1,030,403 | | | | 24,796 | | | | 108,129 | | |
Reinvested | | | — | | | | 26,315 | | | | — | | | | 34,350 | | |
Redeemed | | | (1,166,791 | ) | | | (1,527,262 | ) | | | (119,487 | ) | | | (260,693 | ) | |
Total Class A Shares | | | (84,032 | ) | | | (470,544 | ) | | | (94,691 | ) | | | (118,214 | ) | |
Class C Shares | |
Issued | | | 117,726 | | | | 129,894 | | | | 11,670 | | | | 6,492 | | |
Reinvested | | | — | | | | 3,899 | | | | — | | | | 1,705 | | |
Redeemed | | | (187,604 | ) | | | (213,961 | ) | | | (4,912 | ) | | | (328 | ) | |
Total Class C Shares | | | (69,878 | ) | | | (80,168 | ) | | | 6,758 | | | | 7,869 | | |
Class R Shares | |
Issued | | | 92,009 | | | | 152,502 | | | | — | | | | — | | |
Reinvested | | | — | | | | 4,675 | | | | — | | | | — | | |
Redeemed | | | (98,227 | ) | | | (372,484 | ) | | | — | | | | — | | |
Total Class R Shares | | | (6,218 | ) | | | (215,307 | ) | | | — | | | | — | | |
Class R6 Shares | |
Issued | | | 284,857 | | | | 924,676 | | | | — | | | | — | | |
Reinvested | | | — | | | | 9,340 | | | | — | | | | — | | |
Redeemed | | | (115,478 | ) | | | (115,292 | ) | | | — | | | | — | | |
Total Class R6 Shares | | | 169,379 | | | | 818,724 | | | | — | | | | — | | |
Class Y Shares | |
Issued | | | 5,533,430 | | | | 2,896,397 | | | | 422,707 | | | | 85,217 | | |
Reinvested | | | — | | | | 44,012 | | | | — | | | | 15,771 | | |
Redeemed | | | (857,348 | ) | | | (2,238,279 | ) | | | (498,766 | ) | | | (1,307,165 | ) | |
Total Class Y Shares | | | 4,676,082 | | | | 702,130 | | | | (76,059 | ) | | | (1,206,177 | ) | |
Change in Shares | | | 4,685,333 | | | | 754,835 | | | | (163,992 | ) | | | (1,316,522 | ) | |
See notes to financial statements.
35
Victory Portfolios | | Financial Highlights | |
For a Share Outstanding Throughout Each Period
| | | Victory RS International Fund | |
| | | Class A Shares | |
| | | Six
Months
Ended
June 30,
2018 | | Year
Ended
December 31,
2017 | | Year
Ended
December 31,
2016 | | Year
Ended
December 31,
2015 | | Year
Ended
December 31,
2014 | | Year
Ended
December 31,
2013 | |
| | | (Unaudited) | | | | | | | | | | | |
Net Asset Value, Beginning of Period | | $ | 12.12 | | | $ | 9.84 | | | $ | 9.78 | | | $ | 9.87 | | | $ | 13.24 | | | $ | 18.08 | | |
Investment Activities: | |
Net investment income (loss) (a) | | | 0.17 | | | | 0.19 | | | | 0.16 | | | | 0.15 | | | | 0.23 | | | | 0.23 | | |
Net realized and unrealized
gains (losses) on investments | | | (0.35 | ) | | | 2.29 | | | | (0.07 | ) | | | (0.09 | ) | | | (0.98 | ) | | | 1.91 | | |
Total from Investment
Activities | | | (0.18 | ) | | | 2.48 | | | | 0.09 | | | | 0.06 | | | | (0.75 | ) | | | 2.14 | | |
Distributions to Shareholders: | |
Net investment income | | | — | | | | (0.20 | ) | | | (0.17 | ) | | | (0.15 | ) | | | (0.21 | ) | | | (0.87 | ) | |
Net realized gains
from investments | | | — | | | | — | | | | — | | | | — | | | | (2.41 | ) | | | (6.11 | ) | |
Total Distributions to
Shareholders | | | — | | | | (0.20 | ) | | | (0.17 | ) | | | (0.15 | ) | | | (2.62 | ) | | | (6.98 | ) | |
Capital Contributions from Prior
Custodian, Net (See Note 8) | | | — | | | | — | | | | 0.14 | | | | — | | | | — | | | | — | | |
Net Asset Value, End of Period | | $ | 11.94 | | | $ | 12.12 | | | $ | 9.84 | | | $ | 9.78 | | | $ | 9.87 | | | $ | 13.24 | | |
Total Return (excludes sales
charge) (b) | | | (1.49 | )% | | | 25.26 | % | | | 2.41 | %(c) | | | 0.64 | % | | | (5.80 | )% | | | 15.55 | % | |
Ratios/Supplemental Data: | |
Net Assets at end of period (000) | | $ | 17,076 | | | $ | 18,512 | | | $ | 16,799 | | | $ | 19,416 | | | $ | 22,388 | | | $ | 31,483 | | |
Ratio of net expenses to average
net assets (d) | | | 1.13 | % | | | 1.20 | % | | | 1.40 | % | | | 1.40 | % | | | 1.40 | % | | | 1.40 | % | |
Ratio of net investment income (loss)
to average net assets (d) | | | 2.88 | % | | | 1.66 | % | | | 1.64 | % | | | 1.49 | % | | | 1.74 | % | | | 1.46 | % | |
Ratio of gross expenses
to average net assets (d) (e) | | | 1.60 | % | | | 1.81 | % | | | 1.95 | % | | | 1.89 | % | | | 1.81 | % | | | 1.61 | % | |
Portfolio turnover (b) (f) | | | 23 | % | | | 60 | % | | | 103 | % | | | 117 | % | | | 186 | % | | | 41 | % | |
(a) Per share net investment income (loss) has been calculated using the average daily shares method.
(b) Not annualized for periods less than one year.
(c) The Fund received monies related to a nonrecurring refund from the prior Custodian. The corresponding impact to the total return was 1.45% for the period shown. (See Note 8)
(d) Annualized for periods less than one year.
(e) During the period, certain fees were reduced and/or reimbursed. If such fee reductions and/or reimbursements had not occurred, the ratios would have been as indicated.
(f) Portfolio turnover is calculated on the basis of the Fund as a whole without distinguishing between the classes of shares issued.
See notes to financial statements.
36
Victory Portfolios | | Financial Highlights — continued | |
For a Share Outstanding Throughout Each Period
| | | Victory RS International Fund | |
| | | Class C Shares | |
| | | Six
Months
Ended
June 30,
2018 | | Year
Ended
December 31,
2017 | | Year
Ended
December 31,
2016 | | Year
Ended
December 31,
2015 | | Year
Ended
December 31,
2014 | | Year
Ended
December 31,
2013 | |
| | | (Unaudited) | | | | | | | | | | | |
Net Asset Value, Beginning of Period | | $ | 8.89 | | | $ | 7.26 | | | $ | 7.26 | | | $ | 7.36 | | | $ | 10.62 | | | $ | 15.85 | | |
Investment Activities: | |
Net investment income (loss) (a) | | | 0.09 | | | | 0.08 | | | | 0.07 | | | | 0.05 | | | | 0.06 | | | | 0.04 | | |
Net realized and unrealized
gains (losses) on investments | | | (0.25 | ) | | | 1.68 | | | | (0.08 | ) | | | (0.07 | ) | | | (0.78 | ) | | | 1.59 | | |
Total from Investment
Activities | | | (0.16 | ) | | | 1.76 | | | | (0.01 | ) | | | (0.02 | ) | | | (0.72 | ) | | | 1.63 | | |
Distributions to Shareholders: | |
Net investment income | | | — | | | | (0.13 | ) | | | (0.13 | ) | | | (0.08 | ) | | | (0.13 | ) | | | (0.75 | ) | |
Net realized gains
from investments | | | — | | | | — | | | | — | | | | — | | | | (2.41 | ) | | | (6.11 | ) | |
Total Distributions to
Shareholders | | | — | | | | (0.13 | ) | | | (0.13 | ) | | | (0.08 | ) | | | (2.54 | ) | | | (6.86 | ) | |
Capital Contributions from Prior
Custodian, Net (See Note 8) | | | — | | | | — | | | | 0.14 | | | | — | | | | — | | | | — | | |
Net Asset Value, End of Period | | $ | 8.73 | | | $ | 8.89 | | | $ | 7.26 | | | $ | 7.26 | | | $ | 7.36 | | | $ | 10.62 | | |
Total Return (excludes contingent
deferred sales charge) (b) | | | (1.80 | )% | | | 24.25 | % | | | 1.77 | %(c) | | | (0.27 | )% | | | (6.90 | )% | | | 14.24 | % | |
Ratios/Supplemental Data: | |
Net Assets at end of period (000) | | $ | 805 | | | $ | 1,066 | | | $ | 1,228 | | | $ | 1,969 | | | $ | 2,418 | | | $ | 2,390 | | |
Ratio of net expenses to average
net assets (d) | | | 1.88 | % | | | 1.95 | % | | | 2.15 | % | | | 2.27 | % | | | 2.55 | % | | | 2.55 | % | |
Ratio of net investment income (loss)
to average net assets (d) | | | 2.04 | % | | | 0.92 | % | | | 0.97 | % | | | 0.65 | % | | | 0.54 | % | | | 0.29 | % | |
Ratio of gross expenses
to average net assets (d) (e) | | | 3.37 | % | | | 3.26 | % | | | 3.05 | % | | | 2.82 | % | | | 2.75 | % | | | 2.55 | % | |
Portfolio turnover (b) (f) | | | 23 | % | | | 60 | % | | | 103 | % | | | 117 | % | | | 186 | % | | | 41 | % | |
(a) Per share net investment income (loss) has been calculated using the average daily shares method.
(b) Not annualized for periods less than one year.
(c) The Fund received monies related to a nonrecurring refund from the prior Custodian. The corresponding impact to the total return was 1.45% for the period shown. (See Note 8)
(d) Annualized for periods less than one year.
(e) During the period, certain fees were reduced and/or reimbursed. If such fee reductions and/or reimbursements had not occurred, the ratios would have been as indicated.
(f) Portfolio turnover is calculated on the basis of the Fund as a whole without distinguishing between the classes of shares issued.
See notes to financial statements.
37
Victory Portfolios | | Financial Highlights — continued | |
For a Share Outstanding Throughout Each Period
| | | Victory RS International Fund | |
| | | Class R Shares | |
| | | Six
Months
Ended
June 30,
2018 | | Year
Ended
December 31,
2017 | | Year
Ended
December 31,
2016 | | Year
Ended
December 31,
2015 | | Year
Ended
December 31,
2014 | | Year
Ended
December 31,
2013 | |
| | | (Unaudited) | | | | | | | | | | | |
Net Asset Value, Beginning of Period | | $ | 11.35 | | | $ | 9.23 | | | $ | 9.18 | | | $ | 9.27 | | | $ | 12.63 | | | $ | 17.58 | | |
Investment Activities: | |
Net investment income (loss) (a) | | | 0.15 | | | | 0.15 | | | | 0.11 | | | | 0.11 | | | | 0.15 | | | | 0.14 | | |
Net realized and unrealized
gains (losses) on investments | | | (0.33 | ) | | | 2.14 | | | | (0.06 | ) | | | (0.09 | ) | | | (0.94 | ) | | | 1.83 | | |
Total from Investment
Activities | | | (0.18 | ) | | | 2.29 | | | | 0.05 | | | | 0.02 | | | | (0.79 | ) | | | 1.97 | | |
Distributions to Shareholders: | |
Net investment income | | | — | | | | (0.17 | ) | | | (0.14 | ) | | | (0.11 | ) | | | (0.16 | ) | | | (0.81 | ) | |
Net realized gains
from investments | | | — | | | | — | | | | — | | | | — | | | | (2.41 | ) | | | (6.11 | ) | |
Total Distributions to
Shareholders | | | — | | | | (0.17 | ) | | | (0.14 | ) | | | (0.11 | ) | | | (2.57 | ) | | | (6.92 | ) | |
Capital Contributions from Prior
Custodian, Net (See Note 8) | | | — | | | | — | | | | 0.14 | | | | — | | | | — | | | | — | | |
Net Asset Value, End of Period | | $ | 11.17 | | | $ | 11.35 | | | $ | 9.23 | | | $ | 9.18 | | | $ | 9.27 | | | $ | 12.63 | | |
Total Return (b) | | | (1.59 | )% | | | 24.85 | % | | | 2.06 | %(c) | | | 0.22 | % | | | (6.37 | )% | | | 14.93 | % | |
Ratios/Supplemental Data: | |
Net Assets at end of period (000) | | $ | 2,422 | | | $ | 2,522 | | | $ | 2,279 | | | $ | 2,707 | | | $ | 3,403 | | | $ | 4,479 | | |
Ratio of net expenses to average
net assets (d) | | | 1.38 | % | | | 1.48 | % | | | 1.80 | % | | | 1.86 | % | | | 1.96 | % | | | 1.96 | % | |
Ratio of net investment income (loss)
to average net assets (d) | | | 2.63 | % | | | 1.39 | % | | | 1.26 | % | | | 1.10 | % | | | 1.20 | % | | | 0.91 | % | |
Ratio of gross expenses
to average net assets (d) (e) | | | 2.22 | % | | | 2.48 | % | | | 2.29 | % | | | 2.28 | % | | | 2.19 | % | | | 1.99 | % | |
Portfolio turnover (b) (f) | | | 23 | % | | | 60 | % | | | 103 | % | | | 117 | % | | | 186 | % | | | 41 | % | |
(a) Per share net investment income (loss) has been calculated using the average daily shares method.
(b) Not annualized for periods less than one year.
(c) The Fund received monies related to a nonrecurring refund from the prior Custodian. The corresponding impact to the total return was 1.45% for the period shown. (See Note 8)
(d) Annualized for periods less than one year.
(e) During the period, certain fees were reduced and/or reimbursed. If such fee reductions and/or reimbursements had not occurred, the ratios would have been as indicated.
(f) Portfolio turnover is calculated on the basis of the Fund as a whole without distinguishing between the classes of shares issued.
See notes to financial statements.
38
Victory Portfolios | | Financial Highlights — continued | |
For a Share Outstanding Throughout Each Period
| | | Victory RS International Fund | |
| | | Class Y Shares | |
| | | Six
Months
Ended
June 30,
2018 | | Year
Ended
December 31,
2017 | | Year
Ended
December 31,
2016 | | Year
Ended
December 31,
2015 | | Year
Ended
December 31,
2014 | | Year
Ended
December 31,
2013 | |
| | | (Unaudited) | | | | | | | | | | | |
Net Asset Value, Beginning of Period | | $ | 11.93 | | | $ | 9.69 | | | $ | 9.62 | | | $ | 9.70 | | | $ | 13.08 | | | $ | 18.04 | | |
Investment Activities: | |
Net investment income (loss) (a) | | | 0.19 | | | | 0.22 | | | | 0.18 | | | | 0.18 | | | | 0.25 | | | | 0.37 | | |
Net realized and unrealized
gains (losses) on investments | | | (0.35 | ) | | | 2.26 | | | | (0.06 | ) | | | (0.09 | ) | | | (0.96 | ) | | | 1.86 | | |
Total from Investment
Activities | | | (0.16 | ) | | | 2.48 | | | | 0.12 | | | | 0.09 | | | | (0.71 | ) | | | 2.23 | | |
Distributions to Shareholders: | |
Net investment income | | | — | | | | (0.24 | ) | | | (0.19 | ) | | | (0.17 | ) | | | (0.26 | ) | | | (1.08 | ) | |
Net realized gains
from investments | | | — | | | | — | | | | — | | | | — | | | | (2.41 | ) | | | (6.11 | ) | |
Total Distributions to
Shareholders | | | — | | | | (0.24 | ) | | | (0.19 | ) | | | (0.17 | ) | | | (2.67 | ) | | | (7.19 | ) | |
Capital Contributions from Prior
Custodian, Net (See Note 8) | | | — | | | | — | | | | 0.14 | | | | — | | | | — | | | | — | | |
Net Asset Value, End of Period | | $ | 11.77 | | | $ | 11.93 | | | $ | 9.69 | | | $ | 9.62 | | | $ | 9.70 | | | $ | 13.08 | | |
Total Return (b) | | | (1.34 | )% | | | 25.56 | % | | | 2.69 | %(c) | | | 0.92 | % | | | (5.60 | )% | | | 16.29 | % | |
Ratios/Supplemental Data: | |
Net Assets at end of period (000) | | $ | 3,080 | | | $ | 3,122 | | | $ | 2,626 | | | $ | 3,904 | | | $ | 4,221 | | | $ | 7,232 | | |
Ratio of net expenses to average
net assets (d) | | | 0.88 | % | | | 0.94 | % | | | 1.15 | % | | | 1.15 | % | | | 1.15 | % | | | 1.01 | % | |
Ratio of net investment income (loss)
to average net assets (d) | | | 3.14 | % | | | 1.98 | % | | | 1.93 | % | | | 1.76 | % | | | 1.95 | % | | | 1.96 | % | |
Ratio of gross expenses
to average net assets (d) (e) | | | 1.75 | % | | | 1.85 | % | | | 1.80 | % | | | 1.75 | % | | | 1.51 | % | | | 1.01 | % | |
Portfolio turnover (b) (f) | | | 23 | % | | | 60 | % | | | 103 | % | | | 117 | % | | | 186 | % | | | 41 | % | |
(a) Per share net investment income (loss) has been calculated using the average daily shares method.
(b) Not annualized for periods less than one year.
(c) The Fund received monies related to a nonrecurring refund from the prior Custodian. The corresponding impact to the total return was 1.45% for the period shown. (See Note 8)
(d) Annualized for periods less than one year.
(e) During the period, certain fees were reduced and/or reimbursed. If such fee reductions and/or reimbursements had not occurred, the ratios would have been as indicated.
(f) Portfolio turnover is calculated on the basis of the Fund as a whole without distinguishing between the classes of shares issued.
See notes to financial statements.
39
Victory Portfolios | | Financial Highlights | |
For a Share Outstanding Throughout Each Period
| | | Victory RS Global Fund | |
| | | Class A Shares | |
| | | Six
Months
Ended
June 30,
2018 | | Year
Ended
December 31,
2017 | | Year
Ended
December 31,
2016 | | Year
Ended
December 31,
2015 | | Year
Ended
December 31,
2014 | | Year
Ended
December 31,
2013 | |
| | | (Unaudited) | | | | | | | | | | | |
Net Asset Value, Beginning of Period | | $ | 12.75 | | | $ | 11.16 | | | $ | 11.56 | | | $ | 11.56 | | | $ | 11.65 | | | $ | 10.26 | | |
Investment Activities: | |
Net investment income (loss) (a) | | | 0.12 | | | | 0.15 | | | | 0.13 | | | | 0.11 | | | | 0.10 | | | | 0.06 | | |
Net realized and unrealized
gains (losses) on investments | | | 0.11 | | | | 2.53 | | | | 0.65 | | | | 0.32 | | | | 0.45 | | | | 2.87 | | |
Total from Investment
Activities | | | 0.23 | | | | 2.68 | | | | 0.78 | | | | 0.43 | | | | 0.55 | | | | 2.93 | | |
Distributions to Shareholders: | |
Net investment income | | | — | | | | — | | | | (0.03 | ) | | | (0.11 | ) | | | (0.08 | ) | | | (0.13 | ) | |
Net realized gains
from investments | | | — | | | | (1.00 | ) | | | (1.15 | ) | | | (0.32 | ) | | | (0.56 | ) | | | (1.41 | ) | |
Return of capital | | | — | | | | (0.09 | ) | | | — | | | | — | | | | — | | | | — | | |
Total Distributions to
Shareholders | | | — | | | | (1.09 | ) | | | (1.18 | ) | | | (0.43 | ) | | | (0.64 | ) | | | (1.54 | ) | |
Net Asset Value, End of Period | | $ | 12.98 | | | $ | 12.75 | | | $ | 11.16 | | | $ | 11.56 | | | $ | 11.56 | | | $ | 11.65 | | |
Total Return (excludes sales
charge) (b) | | | 1.80 | % | | | 24.48 | % | | | 6.67 | % | | | 3.68 | % | | | 4.70 | % | | | 29.02 | % | |
Ratios/Supplemental Data: | |
Net Assets at end of period (000) | | $ | 3,590 | | | $ | 3,456 | | | $ | 5,366 | | | $ | 13,857 | | | $ | 13,015 | | | $ | 12,539 | | |
Ratio of net expenses to average
net assets (c) | | | 1.05 | % | | | 1.17 | % | | | 1.40 | % | | | 1.36 | % | | | 1.40 | % | | | 1.40 | % | |
Ratio of net investment income (loss)
to average net assets (c) | | | 1.92 | % | | | 1.24 | % | | | 1.12 | % | | | 0.90 | % | | | 0.85 | % | | | 0.50 | % | |
Ratio of gross expenses
to average net assets (c) (d) | | | 1.75 | % | | | 1.90 | % | | | 1.71 | % | | | 1.57 | % | | | 1.63 | % | | | 1.67 | % | |
Portfolio turnover (b) (e) | | | 32 | % | | | 187 | % | | | 184 | % | | | 90 | % | | | 130 | % | | | 137 | % | |
(a) Per share net investment income (loss) has been calculated using the average daily shares method.
(b) Not annualized for periods less than one year.
(c) Annualized for periods less than one year.
(d) During the period, certain fees were reduced and/or reimbursed. If such fee reductions and/or reimbursements had not occurred, the ratios would have been as indicated.
(e) Portfolio turnover is calculated on the basis of the Fund as a whole without distinguishing between the classes of shares issued.
See notes to financial statements.
40
Victory Portfolios | | Financial Highlights — continued | |
For a Share Outstanding Throughout Each Period
| | | Victory RS Global Fund | |
| | | Class C Shares | |
| | | Six
Months
Ended
June 30,
2018 | | Year
Ended
December 31,
2017 | | Year
Ended
December 31,
2016 | | Year
Ended
December 31,
2015 | | Year
Ended
December 31,
2014 | | Year
Ended
December 31,
2013 | |
| | | (Unaudited) | | | | | | | | | | | |
Net Asset Value, Beginning of Period | | $ | 12.38 | | | $ | 10.95 | | | $ | 11.42 | | | $ | 11.43 | | | $ | 11.54 | | | $ | 10.19 | | |
Investment Activities: | |
Net investment income (loss) (a) | | | 0.07 | | | | 0.05 | | | | 0.05 | | | | 0.01 | | | | 0.01 | | | | (0.03 | ) | |
Net realized and unrealized
gains (losses) on investments | | | 0.11 | | | | 2.47 | | | | 0.63 | | | | 0.32 | | | | 0.44 | | | | 2.84 | | |
Total from Investment
Activities | | | 0.18 | | | | 2.52 | | | | 0.68 | | | | 0.33 | | | | 0.45 | | | | 2.81 | | |
Distributions to Shareholders: | |
Net investment income | | | — | | | | — | | | | — | | | | (0.02 | ) | | | — | | | | (0.05 | ) | |
Net realized gains
from investments | | | — | | | | (1.00 | ) | | | (1.15 | ) | | | (0.32 | ) | | | (0.56 | ) | | | (1.41 | ) | |
Return of capital | | | — | | | | (0.09 | ) | | | — | | | | — | | | | — | | | | — | | |
Total Distributions to
Shareholders | | | — | | | | (1.09 | ) | | | (1.15 | ) | | | (0.34 | ) | | | (0.56 | ) | | | (1.46 | ) | |
Net Asset Value, End of Period | | $ | 12.56 | | | $ | 12.38 | | | $ | 10.95 | | | $ | 11.42 | | | $ | 11.43 | | | $ | 11.54 | | |
Total Return (excludes contingent
deferred sales charge) (b) | | | 1.45 | % | | | 23.47 | % | | | 5.92 | % | | | 2.85 | % | | | 3.87 | % | | | 28.04 | % | |
Ratios/Supplemental Data: | |
Net Assets at end of period (000) | | $ | 2,233 | | | $ | 2,167 | | | $ | 1,270 | | | $ | 7,367 | | | $ | 6,538 | | | $ | 5,997 | | |
Ratio of net expenses to average
net assets (c) | | | 1.80 | % | | | 1.91 | % | | | 2.16 | % | | | 2.17 | % | | | 2.17 | % | | | 2.15 | % | |
Ratio of net investment income (loss)
to average net assets (c) | | | 1.14 | % | | | 0.41 | % | | | 0.41 | % | | | 0.11 | % | | | 0.10 | % | | | (0.26 | )% | |
Ratio of gross expenses
to average net assets (c) (d) | | | 2.55 | % | | | 3.00 | % | | | 2.44 | % | | | 2.38 | % | | | 2.43 | % | | | 2.42 | % | |
Portfolio turnover (b) (e) | | | 32 | % | | | 187 | % | | | 184 | % | | | 90 | % | | | 130 | % | | | 137 | % | |
(a) Per share net investment income (loss) has been calculated using the average daily shares method.
(b) Not annualized for periods less than one year.
(c) Annualized for periods less than one year.
(d) During the period, certain fees were reduced and/or reimbursed. If such fee reductions and/or reimbursements had not occurred, the ratios would have been as indicated.
(e) Portfolio turnover is calculated on the basis of the Fund as a whole without distinguishing between the classes of shares issued.
See notes to financial statements.
41
Victory Portfolios | | Financial Highlights — continued | |
For a Share Outstanding Throughout Each Period
| | | Victory RS Global Fund | |
| | | Class R Shares | |
| | | Six
Months
Ended
June 30,
2018 | | Year
Ended
December 31,
2017 | | Year
Ended
December 31,
2016 | | Year
Ended
December 31,
2015 | | Year
Ended
December 31,
2014 | | Year
Ended
December 31,
2013 | |
| | | (Unaudited) | | | | | | | | | | | |
Net Asset Value, Beginning of Period | | $ | 15.76 | | | $ | 13.62 | | | $ | 11.50 | | | $ | 11.50 | | | $ | 11.59 | | | $ | 10.22 | | |
Investment Activities: | |
Net investment income (loss) (a) | | | 0.12 | | | | 0.05 | | | | 0.09 | | | | 0.06 | | | | 0.06 | | | | 0.01 | | |
Net realized and unrealized
gains (losses) on investments | | | 0.15 | | | | 3.18 | | | | 3.43 | | | | 0.32 | | | | 0.44 | | | | 2.86 | | |
Total from Investment
Activities | | | 0.27 | | | | 3.23 | | | | 3.52 | | | | 0.38 | | | | 0.50 | | | | 2.87 | | |
Distributions to Shareholders: | |
Net investment income | | | — | | | | — | | | | (0.25 | ) | | | (0.06 | ) | | | (0.03 | ) | | | (0.09 | ) | |
Net realized gains
from investments | | | — | | | | (1.00 | ) | | | (1.15 | ) | | | (0.32 | ) | | | (0.56 | ) | | | (1.41 | ) | |
Return of capital | | | — | | | | (0.09 | ) | | | — | | | | — | | | | — | | | | — | | |
Total Distributions to
Shareholders | | | — | | | | (1.09 | ) | | | (1.40 | ) | | | (0.38 | ) | | | (0.59 | ) | | | (1.50 | ) | |
Net Asset Value, End of Period | | $ | 16.03 | | | $ | 15.76 | | | $ | 13.62 | | | $ | 11.50 | | | $ | 11.50 | | | $ | 11.59 | | |
Total Return (b) | | | 1.71 | % | | | 24.09 | % | | | 30.57 | %(c) | | | 3.23 | % | | | 4.25 | % | | | 28.47 | % | |
Ratios/Supplemental Data: | |
Net Assets at end of period (000) | | $ | 1,590 | | | $ | 2,281 | | | $ | 9,213 | | | $ | 5,265 | | | $ | 5,272 | | | $ | 5,311 | | |
Ratio of net expenses to average
net assets (d) | | | 1.30 | % | | | 1.61 | % | | | 1.68 | % | | | 1.78 | % | | | 1.80 | % | | | 1.79 | % | |
Ratio of net investment income (loss)
to average net assets (d) | | | 1.55 | % | | | 0.38 | % | | | 0.74 | % | | | 0.50 | % | | | 0.47 | % | | | 0.10 | % | |
Ratio of gross expenses
to average net assets (d) (e) | | | 2.25 | % | | | 2.76 | % | | | 1.81 | % | | | 2.00 | % | | | 2.04 | % | | | 2.06 | % | |
Portfolio turnover (b) (f) | | | 32 | % | | | 187 | % | | | 184 | % | | | 90 | % | | | 130 | % | | | 137 | % | |
(a) Per share net investment income (loss) has been calculated using the average daily shares method.
(b) Not annualized for periods less than one year.
(c) During the period, the share class recognized certain expense reimbursements and due to the fluctuation in average net assets during the same period the total return reflected is significantly higher than the other share classes of the Fund. The total return would have been 6.39% had the expense reimbursements not occurred.
(d) Annualized for periods less than one year.
(e) During the period, certain fees were reduced and/or reimbursed. If such fee reductions and/or reimbursements had not occurred, the ratios would have been as indicated.
(f) Portfolio turnover is calculated on the basis of the Fund as a whole without distinguishing between the classes of shares issued.
See notes to financial statements.
42
Victory Portfolios | | Financial Highlights — continued | |
For a Share Outstanding Throughout Each Period
| | | Victory RS Global Fund | |
| | | Class Y Shares | |
| | | Six
Months
Ended
June 30,
2018 | | Year
Ended
December 31,
2017 | | Year
Ended
December 31,
2016 | | Year
Ended
December 31,
2015 | | Year
Ended
December 31,
2014 | | Year
Ended
December 31,
2013 | |
| | | (Unaudited) | | | | | | | | | | | |
Net Asset Value, Beginning of Period | | $ | 12.63 | | | $ | 11.04 | | | $ | 11.60 | | | $ | 11.59 | | | $ | 11.67 | | | $ | 10.27 | | |
Investment Activities: | |
Net investment income (loss) (a) | | | 0.14 | | | | 0.18 | | | | 0.15 | | | | 0.15 | | | | 0.14 | | | | 0.10 | | |
Net realized and unrealized
gains (losses) on investments | | | 0.11 | | | | 2.50 | | | | 0.67 | | | | 0.31 | | | | 0.45 | | | | 2.88 | | |
Total from Investment
Activities | | | 0.25 | | | | 2.68 | | | | 0.82 | | | | 0.46 | | | | 0.59 | | | | 2.98 | | |
Distributions to Shareholders: | |
Net investment income | | | — | | | | — | | | | (0.23 | ) | | | (0.13 | ) | | | (0.11 | ) | | | (0.17 | ) | |
Net realized gains
from investments | | | — | | | | (1.00 | ) | | | (1.15 | ) | | | (0.32 | ) | | | (0.56 | ) | | | (1.41 | ) | |
Return of capital | | | — | | | | (0.09 | ) | | | — | | | | — | | | | — | | | | — | | |
Total Distributions to
Shareholders | | | — | | | | (1.09 | ) | | | (1.38 | ) | | | (0.45 | ) | | | (0.67 | ) | | | (1.58 | ) | |
Net Asset Value, End of Period | | $ | 12.88 | | | $ | 12.63 | | | $ | 11.04 | | | $ | 11.60 | | | $ | 11.59 | | | $ | 11.67 | | |
Total Return (b) | | | 1.98 | % | | | 24.75 | % | | | 7.01 | % | | | 3.96 | % | | | 5.04 | % | | | 29.50 | % | |
Ratios/Supplemental Data: | |
Net Assets at end of period (000) | | $ | 26,207 | | | $ | 24,657 | | | $ | 13,430 | | | $ | 15,871 | | | $ | 15,334 | | | $ | 13,364 | | |
Ratio of net expenses to average
net assets (c) | | | 0.80 | % | | | 0.88 | % | | | 1.09 | % | | | 1.09 | % | | | 1.09 | % | | | 1.05 | % | |
Ratio of net investment income (loss)
to average net assets (c) | | | 2.16 | % | | | 1.44 | % | | | 1.30 | % | | | 1.21 | % | | | 1.17 | % | | | 0.85 | % | |
Ratio of gross expenses
to average net assets (c) (d) | | | 1.17 | % | | | 1.32 | % | | | 1.36 | % | | | 1.36 | % | | | 1.33 | % | | | 1.32 | % | |
Portfolio turnover (b) (e) | | | 32 | % | | | 187 | % | | | 184 | % | | | 90 | % | | | 130 | % | | | 137 | % | |
(a) Per share net investment income (loss) has been calculated using the average daily shares method.
(b) Not annualized for periods less than one year.
(c) Annualized for periods less than one year.
(d) During the period, certain fees were reduced and/or reimbursed. If such fee reductions and/or reimbursements had not occurred, the ratios would have been as indicated.
(e) Portfolio turnover is calculated on the basis of the Fund as a whole without distinguishing between the classes of shares issued.
See notes to financial statements.
43
Victory Portfolios | | Financial Highlights | |
For a Share Outstanding Throughout Each Period
| | | Victory Sophus Emerging Markets Fund | |
| | | Class A Shares | |
| | | Six
Months
Ended
June 30,
2018 | | Year
Ended
December 31,
2017 | | Year
Ended
December 31,
2016 | | Year
Ended
December 31,
2015 | | Year
Ended
December 31,
2014 | | Year
Ended
December 31,
2013 | |
| | | (Unaudited) | | | | | | | | | | | |
Net Asset Value, Beginning of Period | | $ | 22.52 | | | $ | 15.98 | | | $ | 14.60 | | | $ | 17.22 | | | $ | 19.34 | | | $ | 23.88 | | |
Investment Activities: | |
Net investment income (loss) (a) | | | 0.10 | | | | 0.16 | | | | 0.11 | | | | 0.10 | | | | 0.12 | | | | 0.09 | | |
Net realized and unrealized
gains (losses) on investments | | | (1.15 | ) | | | 6.55 | | | | 1.38 | | | | (2.33 | ) | | | (0.82 | ) | | | (1.37 | ) | |
Total from Investment
Activities | | | (1.05 | ) | | | 6.71 | | | | 1.49 | | | | (2.23 | ) | | | (0.70 | ) | | | (1.28 | ) | |
Distributions to Shareholders: | |
Net investment income | | | — | | | | (0.17 | ) | | | (0.15 | ) | | | — | | | | (0.17 | ) | | | (0.01 | ) | |
Net realized gains
from investments | | | — | | | | — | | | | — | | | | (0.39 | ) | | | (1.25 | ) | | | (3.39 | ) | |
Total Distributions to
Shareholders | | | — | | | | (0.17 | ) | | | (0.15 | ) | | | (0.39 | ) | | | (1.42 | ) | | | (3.40 | ) | |
Capital Contributions from Prior
Custodian, Net (See Note 8) | | | — | | | | — | | | | 0.04 | | | | — | | | | — | | | | — | | |
Increase from Contribution
by Adviser | | $ | — | | | $ | — | | | $ | — | | | $ | — | | | $ | — | | | $ | 0.14 | | |
Net Asset Value, End of Period | | $ | 21.47 | | | $ | 22.52 | | | $ | 15.98 | | | $ | 14.60 | | | $ | 17.22 | | | $ | 19.34 | | |
Total Return (excludes sales
charge) (b) | | | (4.66 | )% | | | 42.08 | % | | | 10.50 | %(c) | | | (12.94 | )% | | | (3.54 | )% | | | (4.74 | )% | |
Ratios/Supplemental Data: | |
Net Assets at end of period (000) | | $ | 71,117 | | | $ | 76,485 | | | $ | 61,767 | | | $ | 74,837 | | | $ | 123,778 | | | $ | 225,463 | | |
Ratio of net expenses to average
net assets (d) | | | 1.34 | % | | | 1.54 | % | | | 1.65 | % | | | 1.57 | % | | | 1.65 | % | | | 1.65 | % | |
Ratio of net investment income (loss)
to average net assets (d) | | | 0.90 | % | | | 0.80 | % | | | 0.73 | % | | | 0.60 | % | | | 0.62 | % | | | 0.42 | % | |
Ratio of gross expenses
to average net assets (d) (e) | | | 1.57 | % | | | 1.66 | % | | | 1.67 | % | | | 1.57 | % | | | 1.69 | % | | | 1.65 | % | |
Portfolio turnover (b) (f) | | | 44 | % | | | 113 | % | | | 120 | % | | | 111 | % | | | 138 | % | | | 224 | % | |
(a) Per share net investment income (loss) has been calculated using the average daily shares method.
(b) Not annualized for periods less than one year.
(c) The Fund received monies related to a nonrecurring refund from the prior Custodian. The corresponding impact to the total return was 1.45% for the period shown. (See Note 8)
(d) Annualized for periods less than one year.
(e) During the period, certain fees were reduced and/or reimbursed. If such fee reductions and/or reimbursements had not occurred, the ratios would have been as indicated.
(f) Portfolio turnover is calculated on the basis of the Fund as a whole without distinguishing between the classes of shares issued.
See notes to financial statements.
44
Victory Portfolios | | Financial Highlights — continued | |
For a Share Outstanding Throughout Each Period
| | | Victory Sophus Emerging Markets Fund | |
| | | Class C Shares | |
| | | Six
Months
Ended
June 30,
2018 | | Year
Ended
December 31,
2017 | | Year
Ended
December 31,
2016 | | Year
Ended
December 31,
2015 | | Year
Ended
December 31,
2014 | | Year
Ended
December 31,
2013 | |
| | | (Unaudited) | | | | | | | | | | | |
Net Asset Value, Beginning of Period | | $ | 17.07 | | | $ | 12.17 | | | $ | 11.20 | | | $ | 13.43 | | | $ | 15.43 | | | $ | 19.90 | | |
Investment Activities: | |
Net investment income (loss) (a) | | | 0.01 | | | | — | (b) | | | (0.01 | ) | | | (0.02 | ) | | | (0.03 | ) | | | (0.03 | ) | |
Net realized and unrealized
gains (losses) on investments | | | (0.87 | ) | | | 4.97 | | | | 1.05 | | | | (1.82 | ) | | | (0.64 | ) | | | (1.16 | ) | |
Total from Investment
Activities | | | (0.86 | ) | | | 4.97 | | | | 1.04 | | | | (1.84 | ) | | | (0.67 | ) | | | (1.19 | ) | |
Distributions to Shareholders: | |
Net investment income | | | — | | | | (0.07 | ) | | | (0.11 | ) | | | — | | | | (0.08 | ) | | | — | | |
Net realized gains
from investments | | | — | | | | — | | | | — | | | | (0.39 | ) | | | (1.25 | ) | | | (3.39 | ) | |
Total Distributions to
Shareholders | | | — | | | | (0.07 | ) | | | (0.11 | ) | | | (0.39 | ) | | | (1.33 | ) | | | (3.39 | ) | |
Capital Contributions from Prior
Custodian, Net (See Note 8) | | | — | | | | — | | | | 0.04 | | | | — | | | | — | | | | — | | |
Increase from Contribution
by Adviser | | $ | — | | | $ | — | | | $ | — | | | $ | — | | | $ | — | | | $ | 0.11 | | |
Net Asset Value, End of Period | | $ | 16.21 | | | $ | 17.07 | | | $ | 12.17 | | | $ | 11.20 | | | $ | 13.43 | | | $ | 15.43 | | |
Total Return (excludes contingent
deferred sales charge) (c) | | | (5.04 | )% | | | 40.96 | % | | | 9.62 | %(d) | | | (13.68 | )% | | | (4.25 | )% | | | (5.46 | )% | |
Ratios/Supplemental Data: | |
Net Assets at end of period (000) | | $ | 13,923 | | | $ | 15,854 | | | $ | 12,273 | | | $ | 15,096 | | | $ | 21,416 | | | $ | 31,349 | | |
Ratio of net expenses to average
net assets (e) | | | 2.14 | % | | | 2.34 | % | | | 2.45 | % | | | 2.38 | % | | | 2.45 | % | | | 2.43 | % | |
Ratio of net investment income (loss)
to average net assets (e) | | | 0.09 | % | | | — | %(f) | | | (0.09 | )% | | | (0.19 | )% | | | (0.18 | )% | | | (0.21 | )% | |
Ratio of gross expenses
to average net assets (e) (g) | | | 2.36 | % | | | 2.46 | % | | | 2.48 | % | | | 2.38 | % | | | 2.45 | % | | | 2.43 | % | |
Portfolio turnover (c) (h) | | | 44 | % | | | 113 | % | | | 120 | % | | | 111 | % | | | 138 | % | | | 224 | % | |
(a) Per share net investment income (loss) has been calculated using the average daily shares method.
(b) Amount is less than $0.005 per share.
(c) Not annualized for periods less than one year.
(d) The Fund received monies related to a nonrecurring refund from the prior Custodian. The corresponding impact to the total return was 1.45% for the period shown. (See Note 8)
(e) Annualized for periods less than one year.
(f) Amount is less than 0.005%.
(g) During the period, certain fees were reduced and/or reimbursed. If such fee reductions and/or reimbursements had not occurred, the ratios would have been as indicated.
(h) Portfolio turnover is calculated on the basis of the Fund as a whole without distinguishing between the classes of shares issued.
See notes to financial statements.
45
Victory Portfolios | | Financial Highlights — continued | |
For a Share Outstanding Throughout Each Period
| | | Victory Sophus Emerging Markets Fund | |
| | | Class R Shares | |
| | | Six
Months
Ended
June 30,
2018 | | Year
Ended
December 31,
2017 | | Year
Ended
December 31,
2016 | | Year
Ended
December 31,
2015 | | Year
Ended
December 31,
2014 | | Year
Ended
December 31,
2013 | |
| | | (Unaudited) | | | | | | | | | | | |
Net Asset Value, Beginning of Period | | $ | 21.18 | | | $ | 15.03 | | | $ | 13.76 | | | $ | 16.31 | | | $ | 18.44 | | | $ | 22.97 | | |
Investment Activities: | |
Net investment income (loss) (a) | | | 0.07 | | | | 0.09 | | | | 0.07 | | | | 0.05 | | | | 0.07 | | | | 0.07 | | |
Net realized and unrealized
gains (losses) on investments | | | (1.08 | ) | | | 6.17 | | | | 1.30 | | | | (2.21 | ) | | | (0.79 | ) | | | (1.34 | ) | |
Total from Investment
Activities | | | (1.01 | ) | | | 6.26 | | | | 1.37 | | | | (2.16 | ) | | | (0.72 | ) | | | (1.27 | ) | |
Distributions to Shareholders: | |
Net investment income | | | — | | | | (0.11 | ) | | | (0.14 | ) | | | — | | | | (0.16 | ) | | | — | | |
Net realized gains
from investments | | | — | | | | — | | | | — | | | | (0.39 | ) | | | (1.25 | ) | | | (3.39 | ) | |
Total Distributions to
Shareholders | | | — | | | | (0.11 | ) | | | (0.14 | ) | | | (0.39 | ) | | | (1.41 | ) | | | (3.39 | ) | |
Capital Contributions from Prior
Custodian, Net (See Note 8) | | | — | | | | — | | | | 0.04 | | | | — | | | | — | | | | — | | |
Increase from Contribution
by Adviser | | $ | — | | | $ | — | | | $ | — | | | $ | — | | | $ | — | | | $ | 0.13 | | |
Net Asset Value, End of Period | | $ | 20.17 | | | $ | 21.18 | | | $ | 15.03 | | | $ | 13.76 | | | $ | 16.31 | | | $ | 18.44 | | |
Total Return (b) | | | (4.77 | )% | | | 41.69 | % | | | 10.26 | %(c) | | | (13.23 | )% | | | (3.81 | )% | | | (4.95 | )% | |
Ratios/Supplemental Data: | |
Net Assets at end of period (000) | | $ | 16,896 | | | $ | 17,875 | | | $ | 15,923 | | | $ | 18,648 | | | $ | 24,143 | | | $ | 28,038 | | |
Ratio of net expenses to average
net assets (d) | | | 1.58 | % | | | 1.83 | % | | | 1.87 | % | | | 1.87 | % | | | 1.94 | % | | | 1.90 | % | |
Ratio of net investment income (loss)
to average net assets (d) | | | 0.68 | % | | | 0.50 | % | | | 0.50 | % | | | 0.33 | % | | | 0.36 | % | | | 0.37 | % | |
Ratio of gross expenses
to average net assets (d) (e) | | | 1.87 | % | | | 2.00 | % | | | 1.87 | % | | | 1.87 | % | | | 1.94 | % | | | 1.90 | % | |
Portfolio turnover (b) (f) | | | 44 | % | | | 113 | % | | | 120 | % | | | 111 | % | | | 138 | % | | | 224 | % | |
(a) Per share net investment income (loss) has been calculated using the average daily shares method.
(b) Not annualized for periods less than one year.
(c) The Fund received monies related to a nonrecurring refund from the prior Custodian. The corresponding impact to the total return was 1.45% for the period shown. (See Note 8)
(d) Annualized for periods less than one year.
(e) During the period, certain fees were reduced and/or reimbursed. If such fee reductions and/or reimbursements had not occurred, the ratios would have been as indicated.
(f) Portfolio turnover is calculated on the basis of the Fund as a whole without distinguishing between the classes of shares issued.
See notes to financial statements.
46
Victory Portfolios | | Financial Highlights — continued | |
For a Share Outstanding Throughout Each Period
| | | Victory Sophus Emerging Markets Fund | |
| | | Class R6 Shares | |
| | | Six
Months
Ended
June 30,
2018 | | Year
Ended
December 31,
2017 | | Period
Ended
December 31,
2016(a) | |
| | | (Unaudited) | | | | | |
Net Asset Value, Beginning of Period | | $ | 22.81 | | | $ | 16.16 | | | $ | 15.91 | | |
Investment Activities: | |
Net investment income (loss) (b) | | | 0.17 | | | | 0.34 | | | | 0.04 | | |
Net realized and unrealized gains
(losses) on investments | | | (1.19 | ) | | | 6.57 | | | | 0.25 | | |
Total from Investment Activities | | | (1.02 | ) | | | 6.91 | | | | 0.29 | | |
Distributions to Shareholders: | |
Net investment income | | | — | | | | (0.26 | ) | | | (0.04 | ) | |
Total Distributions to Shareholders | | | — | | | | (0.26 | ) | | | (0.04 | ) | |
Net Asset Value, End of Period | | $ | 21.79 | | | $ | 22.81 | | | $ | 16.16 | | |
Total Return (c) | | | (4.47 | )% | | | 42.77 | % | | | 1.81 | % | |
Ratios/Supplemental Data: | |
Net Assets at end of period (000) | | $ | 21,619 | | | $ | 18,762 | | | $ | 64 | | |
Ratio of net expenses to average net assets (d) | | | 0.89 | % | | | 1.03 | % | | | 1.16 | % | |
Ratio of net investment income
(loss) to average net assets (d) | | | 1.47 | % | | | 1.66 | % | | | 1.79 | % | |
Ratio of gross expenses to average
net assets (d) (e) | | | 1.23 | % | | | 1.39 | % | | | 21.70 | % | |
Portfolio turnover (c) (f) | | | 44 | % | | | 113 | % | | | 120 | % | |
(a) Class R6 Shares commenced operations on November 15, 2016.
(b) Per share net investment income (loss) has been calculated using the average daily shares method.
(c) Not annualized for periods less than one year.
(d) Annualized for periods less than one year.
(e) During the period, certain fees were reduced and/or reimbursed. If such fee reductions and/or reimbursements had not occurred, the ratios would have been as indicated.
(f) Portfolio turnover is calculated on the basis of the Fund as a whole without distinguishing between the classes of shares issued.
See notes to financial statements.
47
Victory Portfolios | | Financial Highlights — continued | |
For a Share Outstanding Throughout Each Period
| | | Victory Sophus Emerging Markets Fund | |
| | | Class Y Shares | |
| | | Six
Months
Ended
June 30,
2018 | | Year
Ended
December 31,
2017 | | Year
Ended
December 31,
2016 | | Year
Ended
December 31,
2015 | | Year
Ended
December 31,
2014 | | Year
Ended
December 31,
2013 | |
| | | (Unaudited) | | | | | | | | | | | |
Net Asset Value, Beginning of Period | | $ | 22.64 | | | $ | 16.05 | | | $ | 14.61 | | | $ | 17.22 | | | $ | 19.38 | | | $ | 23.92 | | |
Investment Activities: | |
Net investment income (loss) (a) | | | 0.18 | | | | 0.21 | | | | 0.18 | | | | 0.15 | | | | 0.20 | | | | 0.10 | | |
Net realized and unrealized
gains (losses) on investments | | | (1.20 | ) | | | 6.62 | | | | 1.37 | | | | (2.34 | ) | | | (0.83 | ) | | | (1.30 | ) | |
Total from Investment
Activities | | | (1.02 | ) | | | 6.83 | | | | 1.55 | | | | (2.19 | ) | | | (0.63 | ) | | | (1.20 | ) | |
Distributions to Shareholders: | |
Net investment income | | | — | | | | (0.24 | ) | | | (0.15 | ) | | | (0.03 | ) | | | (0.28 | ) | | | (0.09 | ) | |
Net realized gains
from investments | | | — | | | | — | | | | — | | | | (0.39 | ) | | | (1.25 | ) | | | (3.39 | ) | |
Total Distributions to
Shareholders | | | — | | | | (0.24 | ) | | | (0.15 | ) | | | (0.42 | ) | | | (1.53 | ) | | | (3.48 | ) | |
Capital Contributions from Prior
Custodian, Net (See Note 8) | | | — | | | | — | | | | 0.04 | | | | — | | | | — | | | | — | | |
Increase from Contribution
by Adviser | | $ | — | | | $ | — | | | $ | — | | | $ | — | | | $ | — | | | $ | 0.14 | | |
Net Asset Value, End of Period | | $ | 21.62 | | | $ | 22.64 | | | $ | 16.05 | | | $ | 14.61 | | | $ | 17.22 | | | $ | 19.38 | | |
Total Return (b) | | | (4.51 | )% | | | 42.59 | % | | | 10.86 | %(c) | | | (12.73 | )% | | | (3.18 | )% | | | (4.32 | )% | |
Ratios/Supplemental Data: | |
Net Assets at end of period (000) | | $ | 197,464 | | | $ | 100,902 | | | $ | 60,277 | | | $ | 98,634 | | | $ | 124,357 | | | $ | 192,620 | | |
Ratio of net expenses to average
net assets (d) | | | 0.99 | % | | | 1.18 | % | | | 1.32 | % | | | 1.30 | % | | | 1.31 | % | | | 1.31 | % | |
Ratio of net investment income (loss)
to average net assets (d) | | | 1.59 | % | | | 1.07 | % | | | 1.17 | % | | | 0.89 | % | | | 1.03 | % | | | 0.46 | % | |
Ratio of gross expenses to average
net assets (d) (e) | | | 1.24 | % | | | 1.33 | % | | | 1.38 | % | | | 1.30 | % | | | 1.31 | % | | | 1.31 | % | |
Portfolio turnover (b) (f) | | | 44 | % | | | 113 | % | | | 120 | % | | | 111 | % | | | 138 | % | | | 224 | % | |
(a) Per share net investment income (loss) has been calculated using the average daily shares method.
(b) Not annualized for periods less than one year.
(c) The Fund received monies related to a nonrecurring refund from the prior Custodian. The corresponding impact to the total return was 1.45% for the period shown. (See Note 8)
(d) Annualized for periods less than one year.
(e) During the period, certain fees were reduced and/or reimbursed. If such fee reductions and/or reimbursements had not occurred, the ratios would have been as indicated.
(f) Portfolio turnover is calculated on the basis of the Fund as a whole without distinguishing between the classes of shares issued.
See notes to financial statements.
48
Victory Portfolios | | Financial Highlights | |
For a Share Outstanding Throughout Each Period
| | | Victory Sophus Emerging Markets Small Cap Fund | |
| | | Class A Shares | |
| | | Six
Months
Ended
June 30,
2018 | | Year
Ended
December 31,
2017 | | Year
Ended
December 31,
2016 | | Year
Ended
December 31,
2015 | | Period
Ended
December 31,
2014(a) | |
| | | (Unaudited) | | | | | | | | | |
Net Asset Value, Beginning of Period | | $ | 10.13 | | | $ | 9.75 | | | $ | 9.69 | | | $ | 10.31 | | | $ | 10.00 | | |
Investment Activities: | |
Net investment income (loss) (b) | | | — | (c) | | | 0.12 | | | | 0.04 | | | | 0.01 | | | | 0.03 | | |
Net realized and unrealized gains
(losses) on investments | | | (0.62 | ) | | | 3.86 | | | | 0.02 | | | | (0.63 | ) | | | 0.28 | | |
Total from Investment
Activities | | | (0.62 | ) | | | 3.98 | | | | 0.06 | | | | (0.62 | ) | | | 0.31 | | |
Distributions to Shareholders: | |
Net investment income | | | — | | | | (0.12 | ) | | | — | | | | — | | | | — | | |
Net realized gains from investments | | | — | | | | (3.48 | ) | | | — | | | | — | | | | — | | |
Total Distributions to
Shareholders | | | — | | | | (3.60 | ) | | | — | | | | — | | | | — | | |
Net Asset Value, End of Period | | $ | 9.51 | | | $ | 10.13 | | | $ | 9.75 | | | $ | 9.69 | | | $ | 10.31 | | |
Total Return (excludes sales charge) (d) | | | (6.12 | )% | | | 42.55 | % | | | 0.62 | % | | | (6.01 | )% | | | 3.10 | % | |
Ratios/Supplemental Data: | |
Net Assets at end of period (000) | | $ | 466 | | | $ | 1,456 | | | $ | 2,552 | | | $ | 5,083 | | | $ | 6,808 | | |
Ratio of net expenses to average
net assets (e) | | | 1.75 | % | | | 1.75 | % | | | 1.75 | % | | | 1.92 | % | | | 1.88 | % | |
Ratio of net investment income (loss) to
average net assets (e) | | | 0.03 | % | | | 1.07 | % | | | 0.44 | % | | | 0.08 | % | | | 0.30 | % | |
Ratio of gross expenses to average
net assets (e) (f) | | | 4.98 | % | | | 2.94 | % | | | 2.29 | % | | | 2.44 | % | | | 2.29 | % | |
Portfolio turnover (d) (g) | | | 103 | % | | | 227 | %(h) | | | 141 | % | | | 107 | % | | | 110 | % | |
(a) Class A Shares commenced operations on January 31, 2014.
(b) Per share net investment income (loss) has been calculated using the average daily shares method.
(c) Amount is less than $0.005 per share.
(d) Not annualized for periods less than one year.
(e) Annualized for periods less than one year.
(f) During the period, certain fees were reduced and/or reimbursed. If such fee reductions and/or reimbursements had not occurred, the ratios would have been as indicated.
(g) Portfolio turnover is calculated on the basis of the Fund as a whole without distinguishing between the classes of shares issued.
(h) Portfolio turnover increase/decrease due to change within the portfolio holdings during the year.
See notes to financial statements.
49
Victory Portfolios | | Financial Highlights — continued | |
For a Share Outstanding Throughout Each Period
| | | Victory Sophus Emerging Markets Small Cap Fund | |
| | | Class C Shares | |
| | | Six
Months
Ended
June 30,
2018 | | Year
Ended
December 31,
2017 | | Year
Ended
December 31,
2016 | | Year
Ended
December 31,
2015 | | Period
Ended
December 31,
2014(a) | |
| | | (Unaudited) | | | | | | | | | |
Net Asset Value, Beginning of Period | | $ | 9.51 | | | $ | 9.34 | | | $ | 9.56 | | | $ | 10.23 | | | $ | 10.00 | | |
Investment Activities: | |
Net investment income (loss) (b) | | | (0.01 | ) | | | (0.02 | ) | | | (0.02 | ) | | | (0.05 | ) | | | (0.04 | ) | |
Net realized and unrealized
gains (losses) on investments | | | (0.61 | ) | | | 3.75 | | | | (0.20 | ) | | | (0.62 | ) | | | 0.27 | | |
Total from Investment
Activities | | | (0.62 | ) | | | 3.73 | | | | (0.22 | ) | | | (0.67 | ) | | | 0.23 | | |
Distributions to Shareholders: | |
Net investment income | | | — | | | | (0.08 | ) | | | — | | | | — | | | | — | | |
Net realized gains from investments | | | — | | | | (3.48 | ) | | | — | | | | — | | | | — | | |
Total Distributions to
Shareholders | | | — | | | | (3.56 | ) | | | — | | | | — | | | | — | | |
Net Asset Value, End of Period | | $ | 8.89 | | | $ | 9.51 | | | $ | 9.34 | | | $ | 9.56 | | | $ | 10.23 | | |
Total Return (excludes contingent
deferred sales charge) (c) | | | (6.52 | )% | | | 41.68 | % | | | (2.30 | )% | | | (6.55 | )% | | | 2.30 | % | |
Ratios/Supplemental Data: | |
Net Assets at end of period (000) | | $ | 152 | | | $ | 99 | | | $ | 24 | | | $ | 2,617 | | | $ | 2,586 | | |
Ratio of net expenses to average
net assets (d) | | | 2.50 | % | | | 2.50 | % | | | 2.50 | % | | | 2.54 | % | | | 2.69 | % | |
Ratio of net investment income (loss) to
average net assets (d) | | | (0.16 | )% | | | (0.21 | )% | | | (0.18 | )% | | | (0.50 | )% | | | (0.43 | )% | |
Ratio of gross expenses to average
net assets (d)(e) | | | 15.27 | % | | | 32.34 | % | | | 3.12 | % | | | 3.05 | % | | | 3.10 | % | |
Portfolio turnover (c) (f) | | | 103 | % | | | 227 | %(g) | | | 141 | % | | | 107 | % | | | 110 | % | |
(a) Class C Shares commenced operations on January 31, 2014.
(b) Per share net investment income (loss) has been calculated using the average daily shares method.
(c) Not annualized for periods less than one year.
(d) Annualized for periods less than one year.
(e) During the period, certain fees were reduced and/or reimbursed. If such fee reductions and/or reimbursements had not occurred, the ratios would have been as indicated.
(f) Portfolio turnover is calculated on the basis of the Fund as a whole without distinguishing between the classes of shares issued.
(g) Portfolio turnover increase/decrease due to change within the portfolio holdings during the year.
See notes to financial statements.
50
Victory Portfolios | | Financial Highlights — continued | |
For a Share Outstanding Throughout Each Period
| | | Victory Sophus Emerging Markets Small Cap Fund | |
| | | Class Y Shares | |
| | | Six
Months
Ended
June 30,
2018 | | Year
Ended
December 31,
2017 | | Year
Ended
December 31,
2016 | | Year
Ended
December 31,
2015 | | Period
Ended
December 31,
2014(a) | |
| | | (Unaudited) | | | | | | | | | |
Net Asset Value, Beginning of Period | | $ | 10.08 | | | $ | 9.75 | | | $ | 9.74 | | | $ | 10.32 | | | $ | 10.00 | | |
Investment Activities: | |
Net investment income (loss) (b) | | | 0.03 | | | | 0.15 | | | | 0.06 | | | | 0.06 | | | | 0.08 | | |
Net realized and unrealized
gains (losses) on investments | | | (0.63 | ) | | | 3.87 | | | | 0.02 | | | | (0.64 | ) | | | 0.26 | | |
Total from Investment
Activities | | | (0.60 | ) | | | 4.02 | | | | 0.08 | | | | (0.58 | ) | | | 0.34 | | |
Distributions to Shareholders: | |
Net investment income | | | — | | | | (0.21 | ) | | | (0.07 | ) | | | — | | | | (0.02 | ) | |
Net realized gains from investments | | | — | | | | (3.48 | ) | | | — | | | | — | | | | — | | |
Return of Capital | | | — | | | | — | | | | — | | | | — | | | | — | (c) | |
Total Distributions to
Shareholders | | | — | | | | (3.69 | ) | | | (0.07 | ) | | | — | | | | (0.02 | ) | |
Net Asset Value, End of Period | | $ | 9.48 | | | $ | 10.08 | | | $ | 9.75 | | | $ | 9.74 | | | $ | 10.32 | | |
Total Return (d) | | | (5.95 | )% | | | 43.02 | % | | | 0.79 | % | | | (5.62 | )% | | | 3.45 | % | |
Ratios/Supplemental Data: | |
Net Assets at end of period (000) | | $ | 4,624 | | | $ | 5,685 | | | $ | 17,261 | | | $ | 17,581 | | | $ | 18,440 | | |
Ratio of net expenses to average
net assets (e) | | | 1.50 | % | | | 1.50 | % | | | 1.50 | % | | | 1.50 | % | | | 1.50 | % | |
Ratio of net investment income (loss) to
average net assets (e) | | | 0.59 | % | | | 1.32 | % | | | 0.62 | % | | | 0.53 | % | | | 0.76 | % | |
Ratio of gross expenses to average
net assets (e) (f) | | | 3.25 | % | | | 2.13 | % | | | 1.98 | % | | | 2.01 | % | | | 1.91 | % | |
Portfolio turnover (d) (g) | | | 103 | % | | | 227 | %(h) | | | 141 | % | | | 107 | % | | | 110 | % | |
(a) Class Y Shares commenced operations on January 31,2014.
(b) Per share net investment income (loss) has been calculated using the average daily shares method.
(c) Amount is less than $0.005 per share.
(d) Not annualized for periods less than one year.
(e) Annualized for periods less than one year.
(f) During the period, certain fees were reduced and/or reimbursed. If such fee reductions and/or reimbursements had not occurred, the ratios would have been as indicated.
(g) Portfolio turnover is calculated on the basis of the Fund as a whole without distinguishing between the classes of shares issued.
(h) Portfolio turnover increase/decrease due to change within the portfolio holdings during the year.
See notes to financial statements.
51
Victory Portfolios | | Notes to Financial Statements
June 30, 2018 | |
(Unaudited)
1. Organization:
Victory Portfolios (the "Trust") was organized on December 6, 1995 as a Delaware statutory trust as a successor to a company of the same name organized as a Massachusetts business trust on February 5, 1986. The Trust is registered under the Investment Company Act of 1940, as amended (the "1940 Act"), as an open-end management investment company. The Trust is comprised of 42 funds and is authorized to issue an unlimited number of shares, which are units of beneficial interest with a par value of $0.001 per share.
The accompanying financial statements are those of the following Funds (collectively, the "Funds" and individually, a "Fund").
Funds | | Investment Share
Classes Offered | | Investment Objectives | |
Victory RS International Fund
("RS International Fund") | | Classes A, C, R and Y
| | Seeks to provide long-term
capital appreciation | |
Victory RS Global Fund
("RS Global Fund") | | Classes A, C, R and Y
| | Seeks to provide long-term
capital appreciation | |
Victory Sophus Emerging
Markets Fund ("Sophus
Emerging Markets Fund") | | Classes A, C, R, R6 and Y
| | Seeks to provide long-term
capital appreciation
| |
Victory Sophus Emerging
Markets Small Cap Fund
("Sophus Emerging Markets
Small Cap Fund") | | Classes A, C and Y
| | Seeks to provide long-term
capital appreciation
| |
Each class of shares of a Fund has substantially identical rights and privileges except with respect to sales charges, fees paid under distribution plans, expenses allocable exclusively to each class of shares, voting rights on matters solely affecting a single class of shares, and the exchange privilege of each class of shares.
Under the Trust's organizational documents, its officers and trustees are indemnified against certain liabilities arising out of the performance of their duties to the Funds. In addition, in the normal course of business, the Funds enter into contracts with their vendors and others that provide for general indemnifications. The Funds' maximum exposure under these arrangements is unknown, as this would involve future claims that may be made against the Funds. However, based on experience, the Funds expect that risk of loss to be remote.
2. Significant Accounting Policies:
The following is a summary of significant accounting policies followed by the Trust in the preparation of its financial statements. The policies are in conformity with accounting principles generally accepted in the United States of America ("GAAP"). The preparation of financial statements in accordance with GAAP requires management to make estimates and assumptions that affect the reported amounts of assets and liabilities and disclosure of contingent assets and liabilities at the date of the financial statements and the reported amounts of income and expenses for the period. Actual results could differ from those estimates. The Funds follow the specialized accounting and reporting requirements under GAAP that are applicable to investment companies.
Investment Valuation:
The Funds record investments at fair value. Fair value is defined as the price that would be received to sell an asset or paid to transfer a liability in an orderly transaction between market participants at the measurement date.
The valuation techniques described below maximize the use of observable inputs and minimize the use of unobservable inputs in determining fair value. The inputs used for valuing the Funds' investments are summarized in the three broad levels listed below:
• Level 1 — quoted prices in active markets for identical securities
• Level 2 — other significant observable inputs (including quoted prices for similar securities or interest rates applicable to those securities, etc.)
52
Victory Portfolios | | Notes to Financial Statements — continued
June 30, 2018 | |
(Unaudited)
• Level 3 — significant unobservable inputs (including the Funds' own assumptions in determining the fair value of investments)
Changes in valuation techniques may result in transfers in or out of an assigned level within the disclosure hierarchy. The Trust determines transfers between fair value hierarchy levels at the reporting period end. The inputs or methodologies used for valuation techniques are not necessarily an indication of the risk associated with entering into those investments.
Portfolio securities listed or traded on securities exchanges, including exchange-traded funds ("ETFs"), American Depositary Receipts ("ADRs") and Rights, are valued at the closing price on the exchange or system where the security is principally traded, if available, or at the Nasdaq Official Closing Price. If there have been no sales for that day on the exchange or system, then a security is valued at the last available bid quotation on the exchange or system where the security is principally traded. In each of these situations, valuations are typically categorized as Level 1 in the fair value hierarchy.
Investments in open-end investment companies are valued at net asset value. These valuations are typically categorized as Level 1 in the fair value hierarchy.
Debt securities of United States ("U.S.") issuers (other than short-term investments maturing in 60 days or less), including corporate and municipal securities, are valued on the basis of bid valuations provided by dealers or an independent pricing service approved by the Trust's Board of Trustees (the "Board"). Short-term investments maturing in 60 days or less may be valued at amortized cost, which approximates market value. Under the amortized cost method, premium or discount, if any, is amortized or accreted, respectively, on a constant basis to the maturity of the security. In each of these situations, valuations are typically categorized as Level 2 in the fair value hierarchy.
Investments for which there are no such quotations, or for which quotations do not appear reliable, are valued at fair value in accordance with procedures established by and under the general supervision and responsibility of the Board. These valuations are typically categorized as Level 2 or Level 3 in the fair value hierarchy, based on the observability of inputs used to determine the fair value.
In accordance with procedures adopted by the Board, fair value pricing may be used if events materially affecting the value of foreign securities occur between the time the exchange on which they are traded closes and the time the Funds' net asset values are calculated. The Funds use a systematic valuation model, provided daily by an independent third party to fair value their international equity securities. These valuations are considered as Level 2 in the fair value hierarchy.
For the six months ended June 30, 2018, there were no Level 3 investments for which significant unobservable inputs were used to determine fair value.
A summary of the valuations as of June 30, 2018, based upon the three levels defined above, is included in the table below while the breakdown, by category, of investments is disclosed in the Schedules of Portfolio Investments:
| | | LEVEL 1 —
Quoted Prices | | LEVEL 2 —
Other Significant
Observable Inputs | | Total | |
| | | Investments
in
Securities | | Investments
in
Securities | | Investments
in
Securities | |
RS International Fund | |
Common Stocks | | $ | — | | | $ | 22,205,139 | | | $ | 22,205,139 | | |
Preferred Stocks | | | — | | | | 364,719 | | | | 364,719 | | |
Exchange-Traded Funds | | | 247,990 | | | | — | | | | 247,990 | | |
Total | | | 247,990 | | | | 22,569,858 | | | | 22,817,848 | | |
RS Global Fund | |
Common Stocks | | | 18,006,730 | (a) | | | 14,253,283 | | | | 32,260,013 | | |
Preferred Stocks | | | 190,613 | | | | — | | | | 190,613 | | |
Collateral for Securities Loaned | | | 159,273 | | | | — | | | | 159,273 | | |
Total | | | 18,356,616 | | | | 14,253,283 | | | | 32,609,899 | | |
53
Victory Portfolios | | Notes to Financial Statements — continued
June 30, 2018 | |
(Unaudited)
| | | LEVEL 1 —
Quoted Prices | | LEVEL 2 —
Other Significant
Observable Inputs | | Total | |
| | | Investments
in
Securities | | Investments
in
Securities | | Investments
in
Securities | |
Sophus Emerging Markets Fund | |
Common Stocks | | $ | 62,371,605 | (b) | | $ | 251,077,069 | | | $ | 313,448,674 | | |
Collateral for Securities Loaned | | | 13,988,817 | | | | — | | | | 13,988,817 | | |
Total | | | 76,360,422 | | | | 251,077,069 | | | | 327,437,491 | | |
Sophus Emerging Markets Small Cap Fund | |
Common Stocks | | | 617,549 | (c) | | | 4,526,929 | | | | 5,144,478 | | |
Collateral for Securities Loaned | | | 36,686 | | | | — | | | | 36,686 | | |
Total | | | 654,235 | | | | 4,526,929 | | | | 5,181,164 | | |
(a) All securities categorized as United States, Bermuda, Brazil, Canada, Ireland and Mexico.
(b) All securities categorized as Brazil, Chile, Colombia, Mexico and all ADRs.
(c) All securities categorized as Brazil, Chile, Colombia, Mexico and all ADRs.
As of June 30, 2018, the following transfers between Level 1 and Level 2 are due to application of evaluated bid prices for certain portfolio holdings:
RS Global Fund | | Transfers from
Level 2 to Level 1 | |
Preferred Stocks | | $ | 190,613 | | |
Real Estate Investment Trusts ("REITS"):
The Funds may invest in REITS which report information on the source of their distributions annually. REITS are pooled investment vehicles that invest primarily in income-producing real estate or real estate related loans or interests (such as mortgages). Certain distributions received from REITS during the year are recorded as realized gains or return of capital when such information becomes known.
Investment Companies:
Exchange-Traded Funds:
The Funds may invest in ETFs. ETFs are a type of index fund, the shares of which are bought and sold on a securities exchange. An ETF trades like common stock and represents a fixed portfolio of securities designed to track the performance and dividend yield of a particular domestic or foreign market index. A Fund may purchase shares of an ETF to temporarily gain exposure to a portion of the U.S. or a foreign market while awaiting purchase of underlying securities. The risks of owning an ETF generally reflect the risks of owning the underlying securities they are designed to track, although the lack of liquidity on an ETF could result in it being more volatile. Additionally, ETFs have fees and expenses that reduce their value.
Open-End Funds:
The Funds may invest in portfolios of open-end investment companies. These investment companies value securities in their portfolios for which market quotations are readily available at their market values (generally the last reported sale price) and all other securities and assets at their fair value by the methods established by the board of directors of the underlying funds.
54
Victory Portfolios | | Notes to Financial Statements — continued
June 30, 2018 | |
(Unaudited)
Foreign Exchange Currency Contracts:
The Funds may enter into foreign exchange currency contracts to convert U.S. dollars to and from various foreign currencies. A foreign exchange currency contract is an obligation by a Fund to purchase or sell a specific currency at a future date at a price (in U.S. dollars) set at the time of the contract. The Funds do not engage in "cross-currency" foreign exchange contracts (i.e., contracts to purchase or sell one foreign currency in exchange for another foreign currency). The Funds' foreign exchange currency contracts might be considered spot contracts (typically a contract of one week or less) or forward contracts (typically a contract term over one week). A spot contract is entered into for purposes of hedging against foreign currency fluctuations relating to a specific portfolio transaction, such as the delay between a security transaction trade date and settlement date. Forward contracts are entered into for purposes of hedging portfolio holdings or concentrations of such holdings. Each foreign exchange currency contract is adjusted daily by the prevailing spot or forward rate of the underlying currency, and any appreciation or depreciation is recorded for financial statement purposes as unrealized until the contract settlement date, at which time the Fund records realized gains or losses equal to the difference between the value of a contract at the time it was opened and the value at the time it was closed. A Fund could be exposed to risk if a counterparty is unable to meet the terms of a foreign exchange currency contract or if the value of the foreign currency changes unfavorably. In addition, the use of foreign exchange currency contracts does not eliminate fluctuations in the underlying prices of the securities. As of June 30, 2018, the Funds had no open forward foreign exchange currency contracts.
Investment Transactions and Related Income:
Changes in holdings of investments are accounted for no later than one business day following the trade date. For financial reporting purposes, however, investment transactions are accounted for on trade date on the last business day of the reporting period. Interest income is recognized on an accrual basis and includes, where applicable, the amortization of premium or accretion of discount. Dividend income is recorded on the ex-dividend date. Gains or losses realized on sales of securities are determined by comparing the identified cost of the security lot sold with the net sales proceeds.
Withholding taxes on interest, dividends and gains as a result of certain investments in ADRs by the Funds have been provided for in accordance with each investment's applicable country's tax rules and rates.
Securities Lending:
The Trust has entered into a Master Securities Lending Agreement ("MSLA") with Citibank, N.A. ("Citibank" or the "Agent"). Under the terms of the MSLA, the Funds may lend securities to certain broker-dealers and banks in exchange for collateral in the amount of at least 102% of the value of U.S. securities loaned or at least 105% of the value of non-U.S. securities loaned, marked-to-market daily. Any collateral shortfalls associated with increases in the valuation of the securities loaned are adjusted the next business day. The collateral can be received in the form of cash collateral and/or non-cash collateral. Non-cash collateral can include U.S. Government Securities, letters of credit and certificates of deposit. The cash collateral is invested in short-term instruments or cash equivalents as noted in the Funds' Schedules of Portfolio Investments. The Trust does not have effective control of the non-cash collateral and therefore it is not disclosed in the Funds' Schedules of Portfolio Investments. The Funds continue to benefit from interest or dividends on the securities loaned and may also earn a return from the collateral. The Funds pay various fees in connection with the investment of cash collateral. The Funds pay the Agent fees based on the investment income received from securities lending activities. Securities lending income is disclosed on the Statements of Operations. Although risk is mitigated by the collateral, the Funds could experience a delay in recovering their securities and possible loss of income or value if the borrower fails to return them.
55
Victory Portfolios | | Notes to Financial Statements — continued
June 30, 2018 | |
(Unaudited)
Securities lending transactions are entered into by a Fund under the MSLA, which permits the Fund, under certain circumstances such as an event of default, to offset amounts payable by the Fund to the same counterparty against amounts receivable from the counterparty to create a net payment due to or from the Fund.
The following table is a summary of the Funds' securities lending transactions which are subject to offset under the MSLA as of June 30, 2018. These transactions are accounted for as secured borrowings with an overnight and continuous contractual maturity for cash collateral, and greater than overnight and continuous contractual maturity for non-cash collateral.
| | | Gross
Amount of
Recognized
Assets
(Value of | | Value of
Cash | | Value of Non-cash
Collateral Received by Maturity | | | |
| | | Securities
on Loan) | | Collateral
Received | |
<30 Days | | Between
30 & 90 Days | |
>90 Days | |
Net Amount | |
RS Global Fund | | $ | 147,124 | | | $ | 159,273 | | | $ | — | | | $ | — | | | $ | — | | | $ | 12,149 | | |
Sophus Emerging
Markets Fund | | | 13,891,408 | | | | 13,988,817 | | | | — | | | | — | | | | — | | | | 97,409 | | |
Sophus Emerging Markets
Small Cap Fund | | | 76,401 | | | | 36,686 | | | | — | | | | 41,938 | | | | 4,696 | | | | 6,919 | | |
Foreign Currency Translations:
The accounting records of the Funds are maintained in U.S. dollars. Investment securities and other assets and liabilities of a Fund denominated in a foreign currency are translated into U.S. dollars at current exchange rates. Purchases and sales of securities, income receipts and expense payments are translated into U.S. dollars at the exchange rates on the date of the transactions. The Funds do not isolate the portion of the results of operations resulting from changes in foreign exchange rates on investments from fluctuations arising from changes in market prices of securities held. Such fluctuations are disclosed as net change in unrealized appreciation/depreciation on investments and foreign currency translations on the Statements of Operations. Any realized gains or losses from these fluctuations are disclosed as net realized gains or losses from investment transactions and foreign currency translations on the Statements of Operations.
Foreign Taxes:
The Funds may be subject to foreign taxes related to foreign income received (a portion of which may be reclaimable), capital gains on the sale of securities, and certain foreign currency transactions. All foreign taxes are recorded in accordance with the applicable regulations and rates that exist in the foreign jurisdictions in which the Funds invest.
Dividends to Shareholders:
Dividends from net investment income, if any, are declared and paid annually for the Funds. Distributable net realized gains, if any, are declared and distributed at least annually.
The amounts of dividends from net investment income and distributions from net realized gains are determined in accordance with federal income tax regulations, which may differ from GAAP. These "book/tax" differences are either considered temporary or permanent in nature (e.g., reclass of market discounts and premiums and paydown gains or losses), such amounts are reclassified within the components of net assets based on their federal tax-basis treatment; temporary differences (e.g., wash sales) do not require reclassification. To the extent dividends and distributions exceed net investment income and net realized gains for tax purposes, they are reported as distributions of capital. Net investment losses incurred by a Fund may be reclassified as an offset to capital on the accompanying Statements of Assets and Liabilities.
56
Victory Portfolios | | Notes to Financial Statements — continued
June 30, 2018 | |
(Unaudited)
Federal Income Taxes:
It is the policy of each Fund to continue to qualify as a regulated investment company by complying with the provisions available to certain investment companies, as defined in applicable sections of the Internal Revenue Code, and to make distributions of net investment income and net realized gains sufficient to relieve it from all, or substantially all, federal income taxes. Accordingly, no provision for federal income taxes is required in the financial statements. The Funds have a tax year end of December 31.
Management of the Funds has reviewed tax positions taken in tax years that remain subject to examination by all major tax jurisdictions, including federal (i.e., the last four tax year ends and the interim tax period since then). Management believes that there is no tax liability resulting from unrecognized tax benefits related to uncertain tax positions taken.
Allocations:
Expenses directly attributable to a Fund are charged to the Fund, while expenses which are attributable to more than one fund in the Trust, or jointly with an affiliated trust, are allocated among the respective funds in the Trust and/or affiliated trust based upon net assets or another appropriate basis.
Income, expenses (other than class specific expenses such as transfer agent fees, state registration fees, printing and 12b-1 fees), and realized and unrealized gains or losses on investments are allocated to each class of shares based on its relative net assets on the date income is earned or expenses and realized and unrealized gains and losses are incurred.
Affiliated Securities Transactions:
Pursuant to Rule 17a-7 under the 1940 Act, the Funds may engage in securities transactions with affiliated investment companies and advisory accounts managed by the Adviser and any applicable sub-adviser. Any such purchase or sale transaction must be effected without brokerage commission or other remuneration, except for customary transfer fees. The transaction must be effected at the current market price, which is either the security's last sale price on an exchange or, if there are no transactions in the security that day, at the average of the highest bid and lowest asked price. For the six months ended June 30, 2018, the Funds did not engage in any Rule 17a-7 transactions under the 1940 Act.
3. Purchases and Sales of Securities:
Purchases and sales of securities (excluding securities maturing less than one year from acquisition) for the six months ended June 30, 2018 were as follows:
| | | Purchases | | Sales | |
RS International Fund | | $ | 5,574,222 | | | $ | 6,920,677 | | |
RS Global Fund | | | 11,020,137 | | | | 10,448,234 | | |
Sophus Emerging Markets Fund | | | 228,598,263 | | | | 120,438,447 | | |
Sophus Emerging Markets Small Cap Fund | | | 6,287,612 | | | | 7,849,014 | | |
For the six months ended June 30, 2018, there were no purchases or sales of U.S. Government Securities.
4. Fees and Transactions with Affiliates and Related Parties:
Investment advisory services are provided to the Funds by Victory Capital Management Inc. ("VCM" or the "Adviser"), a New York corporation registered as an investment adviser with the Securities and Exchange Commission ("SEC"). The Adviser is a wholly-owned indirect subsidiary of Victory Capital Holdings Inc., a publicly traded Delaware corporation and a wholly-owned direct subsidiary of Victory Capital Operating, LLC.
Under the terms of the Investment Advisory Agreement, the Adviser is entitled to receive fees based on a percentage of the average daily net assets of each Fund. The rates at which the Adviser
57
Victory Portfolios | | Notes to Financial Statements — continued
June 30, 2018 | |
(Unaudited)
is paid by each Fund are included in the table below. The Adviser may use its resources to assist with the Funds' distribution and marketing expenses.
| | | Adviser Fee
Rate | |
RS International Fund | | | 0.80 | % | |
RS Global Fund | | | 0.80 | % | |
Sophus Emerging Markets Fund | | | 1.00 | % | |
Sophus Emerging Markets Small Cap Fund | | | 1.25 | % | |
VCM also serves as the Funds' administrator and fund accountant. Under an Administration and Fund Accounting Agreement, VCM is paid for its services an annual fee at a rate of 0.08% of the first $15 billion in average daily net assets of the Trust, Victory Variable Insurance Funds and Victory Portfolios II (collectively, the "Trusts"), 0.05% of the average daily net assets above $15 billion to $30 billion of the Trusts and 0.04% of the average daily net assets over $30 billion of the Trusts.
Citi Fund Services Ohio, Inc. ("Citi"), an affiliate of Citibank, N.A., acts as sub-administrator and sub-fund accountant to the Funds pursuant to a Sub-Administration and Sub-Fund Accounting Services Agreement between VCM and Citi. VCM pays Citi a fee for providing these services. The Trust reimburses VCM and Citi for all of their reasonable out-of-pocket expenses incurred in providing these services.
FIS Investor Services, LLC ("FIS") serves as the Funds' transfer agent. Under the Transfer Agent Agreement, the Trust pays FIS a fee for its services and reimburses FIS for all of their reasonable out-of-pocket expenses incurred in providing these services.
The Chief Compliance Officer ("CCO") is an employee of the Adviser, which pays the compensation of the CCO and his support staff. The Trust has entered into an Agreement to provide compliance services with the Adviser, pursuant to which the Adviser furnishes its compliance personnel, including the services of the CCO, and other resources reasonably necessary to provide the Trust with compliance oversight services related to the design, administration and oversight of a compliance program for the Trust in accordance with Rule 38a-1 under the 1940 Act. The Funds in the Victory Funds complex, in the aggregate, compensate the Adviser for these services.
The Trusts pay an annual retainer to each Independent Trustee, plus an additional annual retainer to the Chairman of the Board. The aggregate amount of the fees and expenses of the Independent Trustees are allocated amongst all the funds in the Trusts and are presented in the Statements of Operations.
Shearman & Sterling LLP provides legal services to the Trust.
Victory Capital Advisers, Inc. (the "Distributor"), an affiliate of the Adviser, serves as distributor for the continuous offering of the shares of the Funds pursuant to a Distribution Agreement between the Distributor and the Trust.
Pursuant to the Distribution and Service Plans adopted in accordance with Rule 12b-1 under the 1940 Act, the Distributor may receive a monthly distribution and service fee, at an annual rate of up to 0.25% of the average daily net assets of Class A Shares, at an annual rate of up to 0.50% of the average daily net assets of Class R Shares and 1.00% of the average daily net assets of Class C Shares of the Funds. The distribution and service fees paid to the Distributor may be used by the Distributor to pay for activities primarily intended to result in the sale of Class A, Class R or Class C Shares of the Funds.
In addition, the Distributor and FIS are entitled to receive commissions on sales of the Class A Shares and redemptions of Class C Shares, respectively, of the Funds. For the six months ended June 30, 2018, the Distributor received approximately $14,355 from commissions earned on sales of Class A Shares and FIS received $676 from redemptions of Class C Shares of the Funds.
The Adviser has entered into expense limitation agreements with certain Funds. Under the terms of the agreements, to the extent that ordinary operating expenses incurred by certain classes of a Fund in any fiscal year exceed the expense limit for such classes of the Fund, such excess
58
Victory Portfolios | | Notes to Financial Statements — continued
June 30, 2018 | |
(Unaudited)
amount will be the liability of the Adviser. Interest, taxes, brokerage commissions, other expenditures which are capitalized in accordance with GAAP, and other extraordinary expenses not incurred in the ordinary course of a Fund's business are excluded from the expense limitation agreement. As of June 30, 2018, the expense limits (excluding voluntary waivers) are as follows:
| | | Class | | Expense Limit(a) | | Expense Limit | |
RS International Fund | | Class A Shares | | | 1.13 | % | | | N/A | | |
RS International Fund | | Class C Shares | | | 1.88 | % | | | N/A | | |
RS International Fund | | Class R Shares | | | 1.38 | % | | | N/A | | |
RS International Fund | | Class Y Shares | | | 0.88 | % | | | N/A | | |
RS Global Fund | | Class A Shares | | | 0.85 | % | | | 1.09 | %(c) | |
RS Global Fund | | Class C Shares | | | 1.60 | % | | | 1.84 | %(c) | |
RS Global Fund | | Class R Shares | | | 1.10 | % | | | 1.34 | %(c) | |
RS Global Fund | | Class Y Shares | | | 0.60 | % | | | 0.84 | %(c) | |
Sophus Emerging Markets Fund | | Class A Shares | | | 1.34 | %(b) | | | N/A | | |
Sophus Emerging Markets Fund | | Class C Shares | | | 2.14 | %(b) | | | N/A | | |
Sophus Emerging Markets Fund | | Class R Shares | | | 1.58 | %(b) | | | N/A | | |
Sophus Emerging Markets Fund | | Class R6 Shares | | | 0.89 | %(b) | | | N/A | | |
Sophus Emerging Markets Fund | | Class Y Shares | | | 0.99 | %(b) | | | N/A | | |
Sophus Emerging Markets
Small Cap Fund | | Class A Shares | | | 1.75 | % | | | N/A | | |
Sophus Emerging Markets
Small Cap Fund | | Class C Shares | | | 2.50 | % | | | N/A | | |
Sophus Emerging Markets
Small Cap Fund | | Class Y Shares | | | 1.50 | % | | | N/A | | |
(a) In effect until at least April 30, 2019 (unless otherwise noted).
(b) In effect until at least July 31, 2019.
(c) Was in effect until May 31, 2018.
The Funds have agreed to repay fees and expenses that were waived or reimbursed by the Adviser for a period up to three fiscal years after such waiver or reimbursement was made to the extent such payments or repayments would not cause the expenses of a class to exceed the original expense limitation in place at time of the waiver or reimbursement or any expense limitation agreement in place at the time of repayment. Amounts repaid to the Adviser during the six months ended, if any, are reflected on the Statements of Operations as "Recoupment of prior expenses waived/reimbursed by Adviser".
As of June 30, 2018, the following amounts are available to be repaid to the Adviser.
| | | Expires
12/31/2019 | | Expires
12/31/2020 | | Expires
12/31/2021 | | Total | |
RS International Fund | | $ | 54,419 | | | $ | 178,334 | | | $ | 73,141 | | | $ | 305,894 | | |
RS Global Fund | | | 40,586 | | | | 181,379 | | | | 76,474 | | | | 298,439 | | |
Sophus Emerging Markets Fund | | | 54,398 | | | | 287,244 | | | | 357,184 | | | | 698,826 | | |
Sophus Emerging Markets
Small Cap Fund | | | 41,003 | | | | 157,277 | | | | 65,601 | | | | 263,881 | | |
The Adviser may voluntarily waive or reimburse additional fees to assist the Funds in maintaining competitive expense ratios. Voluntary waivers and reimbursements applicable to the Funds are not available to be recouped at a future time. There were no voluntary waivers or reimbursements for the six months ended June 30, 2018.
Certain officers and/or interested trustees of the Funds are also officers and/or employees of the Adviser, Administrator and Fund Accountant, Sub-Administrator and Sub-Fund Accountant, and Legal.
59
Victory Portfolios | | Notes to Financial Statements — continued
June 30, 2018 | |
(Unaudited)
5. Risks:
Each Fund may be subject to other risks in addition to these identified risks.
An investment in the Funds' shares represents an indirect investment in the securities owned by the Funds, some of which will be traded on a national securities exchange or in the over-the-counter markets. The value of the securities in which the Funds invest, like other market investments, may move up or down, sometimes rapidly and unpredictably. The value of the securities in which the Funds invest may affect the value of the Funds' shares. An investment in the Funds' shares at any point in time may be worth less than the original investment, even after taking into account the reinvestment of the Funds' distributions.
The Funds will be subject to credit risk with respect to the amount each expects to receive from counterparties for financial instruments entered into by the Funds. The Funds may be negatively impacted if a counterparty becomes bankrupt or otherwise fails to perform its obligations due to financial difficulties. The Funds may experience significant delays in obtaining any recovery in bankruptcy or other reorganization proceeding and the Funds may obtain only limited recovery or may obtain no recovery in such circumstances. The Funds typically enter into transactions with counterparties whose credit ratings are investment grade, as determined by a nationally recognized statistical rating organization or, if unrated, judged by the Adviser to be of comparable quality.
6. Borrowing and Interfund Lending:
Line of Credit:
The Trusts participate in a short-term, demand note "Line of Credit" agreement with Citibank. Under the agreement with Citibank as of July 28, 2017, the Trusts may borrow up to $250 million, of which $100 million is committed and $150 million is uncommitted. $40 million of the Line of Credit is reserved for use by the Victory RS Floating Rate Fund, another series of the Trust, with that Fund paying the related commitment fees for that amount. The purpose of the agreement is to meet temporary or emergency cash needs, including redemption requests that might otherwise require the untimely disposition of securities. The agreement was subsequently amended on July 27, 2018 with a new termination date of July 26, 2019. Citibank receives an annual commitment fee of 0.15% on $100 million for providing the Line of Credit. For the six months ended June 30, 2018, Citibank earned approximately $74,384 in commitment fees from the Trusts. Each fund in the Trusts pays a pro-rata portion of the commitment fees plus any interest on amounts borrowed. As of June 30, 2018, the interest rate on outstanding borrowings was 3.10%.
The average loans for the days outstanding and average interest rate for each Fund during the six months ended June 30, 2018 were as follows:
Fund | | Amount
Outstanding at
June 30, 2018 | | Average
Borrowing* | | Days
Borrowings
Outstanding | | Average
Interest
Rate | | Maximum
Borrowing
During
the Period | |
Sophus Emerging Markets
Small Cap Fund | | $ | — | | | $ | 663,636 | | | | 11 | | | | 2.67 | % | | $ | 900,000 | | |
* For the six months ended June 30, 2018, based on the number of days borrowings were outstanding.
Interfund Lending:
The Trust and Adviser rely on an exemptive order granted by the SEC in March 2017 (the "Order"), permitting the establishment and operation of an Interfund Lending Facility (the "Facility"). The Facility allows the Funds to directly lend and borrow money to or from any other Victory Fund relying upon the Order at rates beneficial to both the borrowing and lending funds. Advances under the Facility are allowed for temporary or emergency purposes, including the meeting of redemption requests that otherwise might require the untimely disposition of securities, and are subject to each Fund's borrowing restrictions. The interfund loan rate is determined, as specified in the Order, by averaging the current repurchase agreement rate and the current bank loan rate. Interest paid
60
Victory Portfolios | | Notes to Financial Statements — continued
June 30, 2018 | |
(Unaudited)
by each Fund during the period is presented on the Statements of Operations under Interest expense on Interfund Lending.
The average borrowing and lending for the days outstanding and average interest rate for each Fund during the six months ended June 30, 2018 were as follows:
Fund | | Borrower or
Lender | | Amount
Outstanding at
June 30, 2018 | | Average
Borrowing/
Lending* | | Days
Borrowing/
Lending
Outstanding | | Average
Interest
Rate | | Maximum
Borrowing
During the
Period | |
RS International
Fund | | Borrower | | $ | — | | | $ | 87,000 | | | $ | 3 | | | | 2.19 | % | | $ | 87,000 | | |
RS Global Fund | | Borrower | | | — | | | | 202,000 | | | | 3 | | | | 2.19 | % | | | 202,000 | | |
Sophus Emerging
Markets Small
Cap Fund | | Borrower | | | — | | | | 335,667 | | | | 6 | | | | 2.16 | % | | | 608,000 | | |
* For the six months ended June 30, 2018, based on the number of days borrowings were outstanding.
7. Federal Income Tax Information:
The tax character of distributions paid and the tax basis of current components of accumulated earnings/(deficit) will be determined at the end of the current tax year ending December 31, 2018.
The tax character of distributions paid during the most recent tax year ended December 31, 2017, were as follows (total distributions paid may differ from the Statements of Changes in Net Assets because, for tax purposes, dividends are recognized when actually paid):
| | | Year Ended December 31, 2017 | |
| | | Distributions paid from | | | | | | | |
| | | Ordinary
Income | | Net
Long-Term
Capital
Gains | | Total
Taxable
Distributions | | Return of
Capital | | Total
Distributions
Paid | |
RS International Fund | | $ | 421,635 | | | $ | — | | | $ | 421,635 | | | $ | — | | | $ | 421,635 | | |
RS Global Fund | | | 2,099,092 | | | | 1,133,465 | | | | 3,232,557 | | | | 222,009 | | | | 3,454,566 | | |
Sophus Emerging Markets Fund | | | 1,983,829 | | | | — | | | | 1,983,829 | | | | — | | | | 1,983,829 | | |
Sophus Emerging Markets
Small Cap Fund | | | 2,808,292 | | | | 2,493,660 | | | | 5,301,952 | | | | — | | | | 5,301,952 | | |
As of the most recent tax year ended December 31, 2017, the components of accumulated earnings (deficit) on a tax basis were as follows:
| | | Undistributed
Ordinary
Income | | Undistributed
Long-Term
Capital Gains | | Accumulated
Earnings | | Accumulated
Capital and
Other
Losses | | Qualified
Late-Year
Losses* | | Unrealized
Appreciation
(Depreciation)** | | Total
Accumulated
Earnings
(Deficit) | |
RS International Fund | | $ | 451,537 | | | $ | — | | | $ | 451,537 | | | $ | (1,020,470 | ) | | $ | — | | | $ | 4,060,101 | | | $ | 3,491,168 | | |
RS Global Fund | | | — | | | | — | | | | — | | | | — | | | | — | | | | 7,697,513 | | | | 7,697,513 | | |
Sophus Emerging
Markets Fund | | | — | | | | 9,802,010 | | | | 9,802,010 | | | | — | | | | (215,117 | ) | | | 50,869,097 | | | | 60,455,990 | | |
Sophus Emerging
Markets Small
Cap Fund | | | 339,761 | | | | 121,333 | | | | 461,094 | | | | — | | | | — | | | | 1,126,802 | | | | 1,587,896 | | |
* Late-year ordinary specified losses are comprised of post-October specified losses and post-October capital losses incurred after October 31, 2017. These losses are deemed to arise on the first day of the Fund's next taxable year.
** The difference between the book-basis and tax-basis unrealized appreciation (depreciation) is attributable primarily to tax deferral of losses on wash sales and mark to market adjustments on passive foreign investment companies.
61
Victory Portfolios | | Notes to Financial Statements — continued
June 30, 2018 | |
(Unaudited)
As of the most recent tax year ended December 31, 2017, the following Funds had net capital loss carryforwards ("CLCFs") as summarized in the tables below. CLCFs subject to expiration are applied as short-term capital loss regardless of whether the originating capital loss was short-term or long-term. CLCFs that are not subject to expiration are applied as either short-term or long-term depending on the originating capital loss and must be utilized before those that are subject to expiration.
CLCFs not subject to expiration:
| | | Short-Term
Amount | | Long-Term
Amount | | Total | |
RS International Fund | | $ | 1,020,470 | | | $ | — | | | $ | 1,020,470 | | |
During the most recent tax year ended December 31, 2017, the RS International Fund, Sophus Emerging Markets Fund and Sophus Emerging Markets Small Cap Fund utilized $1,544,260, $20,997,703 and $974,997, respectively, of capital loss carryforwards.
At June 30, 2018, the cost basis for federal income tax purposes, gross unrealized appreciation, gross unrealized depreciation and net unrealized appreciation (depreciation) for investments were as follows:
| | Cost of
Investments
for Federal
Tax Purposes | | Gross
Unrealized
Appreciation | | Gross
Unrealized
Depreciation | | Net
Unrealized
Appreciation
(Depreciation) | |
RS International Fund | | $ | 20,143,484 | | | $ | 3,810,454 | | | $ | (1,136,090 | ) | | $ | 2,674,364 | | |
RS Global Fund | | | 25,494,220 | | | | 7,801,768 | | | | (686,089 | ) | | | 7,115,679 | | |
Sophus Emerging Markets Fund | | | 310,143,371 | | | | 36,526,529 | | | | (19,232,409 | ) | | | 17,294,120 | | |
Sophus Emerging Markets Small
Cap Fund | | | 5,180,254 | | | | 555,093 | | | | (554,183 | ) | | | 910 | | |
8. Capital Contribution from Prior Custodian:
During 2016, certain Funds received notification from their prior custodian, State Street Bank and Trust ("State Street"), related to over-billing on certain categories of expenses during the approximately 16-year period from 1998 through October 31, 2014. The over-billing primarily related to categories of expenses that involved an allocation of general costs among multiple clients.
State Street paid the refunded amounts during January 2017. Based on billing information received during 2016 from State Street and an analysis of any expense limitation agreements that were in place during the period of the over-billing, including the application of any recoupment provisions in such agreements, the Adviser received a portion of the refund.
The portion of the refund retained by the Funds was accounted for as a capital contribution and is reflected on the Financial Highlights as "Capital Contribution from Prior Custodian, Net".
9. Fund Ownership:
Ownership of more than 25% of the voting securities of a fund creates presumptions of control of the fund, under section 2(a)(9) of the 1940 Act. As of June 30, 2018, the shareholders listed below held more than 25% of the shares outstanding of the Funds and may be deemed to control those Funds.
Shareholder | | Fund | | Percent | |
Gerlach Nominee and Co LLC | | RS Global Fund | | | 34.8 | % | |
Gerlach Nominee and Co LLC | | Sophus Emerging Markets Small Cap Fund | | | 54.5 | % | |
10. Recent Accounting Pronouncements:
In October 2016, the SEC released its Final Rules on Investment Company Reporting Modernization (the "Rules''). The Rules introduced two new regulatory reporting forms for investment companies,
62
Victory Portfolios | | Notes to Financial Statements — continued
June 30, 2018 | |
(Unaudited)
Form N-PORT and Form N-CEN. The Funds' compliance date for Form N-PORT is June 1, 2018, and the Funds will make their initial filing with the SEC on Form N-PORT for the period ending March 31, 2019. Effective with the period ended June 30, 2018, the Funds will be required to maintain, and make available to the SEC upon request, the information required to be included in Form N-PORT. Form N-PORT will replace Form N-Q filings effective with the requirement to file the Form N-PORT with the SEC for the period ending March 31, 2019. The Funds' compliance date for Form N-CEN is June 1, 2018, and the Funds will make their initial filing on Form N-CEN for the period ending December 31, 2018. Form N-CEN will replace Form N-SAR filings. The Funds' adoption of these amendments have no effect on the Funds' net assets or results of operations.
In March 2017, the FASB issued Accounting Standards Update No. 2017-08 "Premium Amortization on Purchased Callable Debt Securities" ("ASU 2017-08"), which shortens the premium amortization period for purchased non-contingently callable debt securities. ASU 2017-08 specifies that the premium amortization period ends at the earliest call date, for purchased non-contingently callable debt securities. ASU 2017-08 is effective for fiscal years, and interim periods within those fiscal years, beginning after December 15, 2018. Management is currently evaluating the implications of ASU 2017-08 and its impact on the financial statements and related disclosures has not yet been determined.
11. Subsequent Events:
The Funds have evaluated the need for additional disclosures or adjustments resulting from subsequent events through the date these financial statements were issued. Based on this evaluation, there were no subsequent events to report that would have a material impact on the Funds' financial statements.
63
Victory Portfolios | | Supplemental Information
June 30, 2018 | |
(Unaudited)
Trustee and Officer Information
Board of Trustees:
Overall responsibility for management of the Trust rests with the Board. The Trust is managed by the Board in accordance with the laws of the State of Delaware. There are currently ten Trustees, nine of whom are not "interested persons" of the Trust within the meaning of that term under the 1940 Act ("Independent Trustees") and one of whom is an "interested person" of the Trust within the meaning of that term under the 1940 Act ("Interested Trustee"). The Trustees, in turn, elect the officers of the Trust to actively supervise its day-to-day operations.
The following tables list the Trustees, their ages, position with the Trust, commencement of service, principal occupations during the past five years and any directorships of other investment companies or companies whose securities are registered under the Securities Exchange Act of 1934, as amended, or who file reports under that Act. Each Trustee oversees 42 portfolios in the Trust, nine portfolios in Victory Variable Insurance Funds, one portfolio in Victory Institutional Funds and 20 portfolios in Victory Portfolios II, each a registered investment company that, together with the Trust, comprise the Victory Fund Complex. Each Trustee's address is c/o Victory Portfolios, 4900 Tiedeman Road, 4th Floor, Brooklyn, Ohio 44144. Each Trustee has an indefinite term.
Name and Age | | Position
Held with
the Trust | | Date
Commenced
Service | | Principal Occupation
During Past 5 Years | | Other
Directorships
Held During
Past 5 Years | |
Independent Trustees. | |
David Brooks Adcock, 66 | | Trustee | | May 2005 | | Consultant (since 2006). | | Chair and Trustee, Turner Funds (December 2016-December 2017). | |
Nigel D. T. Andrews, 71 | | Vice Chair and Trustee | | August 2002 | | Retired. | | Director, TCG BDC II, Inc. (since 2017); Director, TCG BDC I, Inc. (formerly Carlyle GMS Finance, Inc.)(since 2012); Director, Old Mutual US Asset Management (2002-2014). | |
E. Lee Beard, 67* | | Trustee | | May 2005 | | Retired (since 2015); Consultant, The Henlee Group, LLC (consulting) (2005-2015). | | None. | |
64
Victory Portfolios | | Supplemental Information — continued
June 30, 2018 | |
(Unaudited)
Name and Age | | Position
Held with
the Trust | | Date
Commenced
Service | | Principal Occupation
During Past 5 Years | | Other
Directorships
Held During
Past 5 Years | |
Dennis M. Bushe, 74 | | Trustee | | July 2016 | | Retired. | | Trustee, RS Investment Trust and RS Variable Products Trust (November 2011-July 2016). | |
Sally M. Dungan, 64 | | Trustee | | February 2011 | | Chief Investment Officer, Tufts University (since 2002). | | None. | |
John L. Kelly, 65 | | Trustee | | February 2015 | | Partner, McCarvill Capital Partners (September 2016-September 2017); Advisor (January 2016-April 2016); and Managing Partner (August 2014-January 2016) Endgate Commodities LLC; Chief Operating Officer, Liquidnet Holdings, Inc. (2011-2014). | | Director, Caledonia Mining Corporation (since May 2012). | |
David L. Meyer, 61* | | Trustee | | December 2008 | | Retired. | | None. | |
Gloria S. Nelund, 57 | | Trustee | | July 2016 | | Chair, CEO and Co-Founder of TriLinc Global, LLC, an investment firm. | | TriLinc Global Impact Fund, LLC (since 2012); Trustee, RS Investment Trust and RS Variable Products Trust (November 2007-July 2016). | |
Leigh A. Wilson, 73 | | Chair and Trustee | | November 1994 | | Private Investor. | | Chair (since 2013), Caledonia Mining Corporation. | |
65
Victory Portfolios | | Supplemental Information — continued
June 30, 2018 | |
(Unaudited)
Name and Age | | Position
Held with
the Trust | | Date
Commenced
Service | | Principal Occupation
During Past 5 Years | | Other
Directorships
Held During
Past 5 Years | |
Interested Trustee. | |
David C. Brown, 46** | | Trustee | | May 2008 | | Chairman and Chief Executive Officer (since August 2013), Co-Chief Executive Officer (2011-2013), the Adviser; Chairman and Chief Executive Officer, Victory Capital Holdings, Inc. (since 2013). | | | None. | | |
* The Board has designated Mr. Meyer and Ms. Beard as its Audit Committee Financial Experts.
** Mr. Brown is an "Interested Person" by reason of his relationship with the Adviser.
The Statement of Additional Information includes additional information about the Trustees of the Trust and is available, without charge, by calling 800-539-3863.
66
Victory Portfolios | | Supplemental Information — continued
June 30, 2018 | |
(Unaudited)
Officers:
The officers of the Trust, their ages, commencement of service and their principal occupations during the past five years, are detailed in the following table. Each officer serves until the earlier of his or her resignation, removal, retirement, death, or the election of a successor. The mailing address of each officer of the Trust is 4900 Tiedeman Road, 4th Floor, Brooklyn, Ohio 44144. The officers of the Trust receive no compensation directly from the Trust for performing the duties of their offices.
Name and Age | | Position with
the Trust | | Date
Commenced
Service | | Principal Occupation During Past 5 Years | |
Christopher K. Dyer, 56 | | President | | February 2006* | | Director of Mutual Fund Administration, the Adviser. | |
Scott A. Stahorsky, 49 | | Vice President | | December 2014 | | Manager, Fund Administration, the Adviser (since 2015); Senior Analyst, Fund Administration, the Adviser (prior to 2015). | |
Erin G. Wagner, 44 | | Secretary | | December 2014 | | Associate General Counsel, the Adviser (since 2013). | |
Allan Shaer, 53 | | Treasurer | | May 2017 | | Senior Vice President, Financial Administration, Citi Fund Services Ohio, Inc. (since 2016); Vice President, Mutual Fund Administration, JP Morgan Chase (2011-2016). | |
Christopher A. Ponte, 34 | | Assistant Treasurer | | December 2017 | | Manager, Fund Administration, the Adviser (since 2017); Senior Analyst, Fund Administration, the Adviser (prior to 2017). Chief Financial Officer, Victory Capital Advisers, Inc. (since 2018). | |
Colin Kinney, 44 | | Chief Compliance Officer | | July 2017 | | Chief Compliance Officer (since 2013) and Chief Risk Officer (2009-2017), the Adviser. | |
Chuck Booth, 58 | | Anti-Money Laundering Compliance Officer and Identity Theft Officer | | May 2015 | | Director, Regulatory Administration and CCO Support Services, Citi Fund Services Ohio, Inc. | |
Jay G. Baris, 64 | | Assistant Secretary | | December 1997 | | Partner, Shearman & Sterling LLP (since 2018); Partner, Morrison & Foerster LLP (2011-2017). | |
* On December 3, 2014, Mr. Dyer resigned as Secretary of the Trust and accepted the position of President.
67
Victory Portfolios | | Supplemental Information — continued
June 30, 2018 | |
(Unaudited)
Proxy Voting and Form N-Q Information
Proxy Voting:
Information regarding the policies and procedures that the Funds use to determine how to vote proxies relating to portfolio securities is available without charge, upon request, by calling 800-539-3863. The information is also included in the Funds' Statement of Additional Information, which is available on the SEC's website at www.sec.gov.
Information relating to how the Funds voted proxies relating to portfolio securities held during the most recent twelve months ended June 30 is available on the SEC's website at www.sec.gov.
Availability of Schedules of Portfolio Investments:
The Trust files a complete list of Schedules of Portfolio Investments with the SEC for the first and third quarters of each fiscal year on Form N-Q. Forms N-Q are available on the SEC's website at www.sec.gov. You may also review or, for a fee, copy those documents by visiting the SEC's Public Reference Room in Washington, D.C. Information on the operation of the Public Reference Room can be obtained by calling the SEC at 202-551-8090.
Expense Examples
As a shareholder of the Funds, you may incur two types of costs: (1) transaction costs, including sales charges (loads) on purchases; and (2) ongoing costs, including management fees, distribution and service (12b-1) fees, and other Fund expenses. These examples are intended to help you understand your ongoing costs (in dollars) of investing in the Funds and to compare these costs with the ongoing costs of investing in other mutual funds.
These examples are based on an investment of $1,000 invested at the beginning of the period and held for the entire period from January 1, 2018 through June 30, 2018.
Actual Expenses:
The table below provides information about actual account values and actual expenses. You may use the information below, together with the amount you invested, to estimate the expenses that you paid over the period. Simply divide your account value by $1,000 (for example, an $8,600 account value divided by $1,000 = 8.6), then multiply the result by the number in the table under the heading entitled "Expenses Paid During Period" to estimate the expenses you paid on your account during this period.
| | | Beginning
Account Value
1/1/18 | | Ending
Account Value
6/30/18 | | Expenses Paid
During Period
1/1/18-6/30/18* | | Annualized Net
Expense Ratio
During Period
1/1/18-6/30/18 | |
RS International Fund | |
Class A Shares | | $ | 1,000.00 | | | $ | 985.10 | | | $ | 5.56 | | | | 1.13 | % | |
Class C Shares | | | 1,000.00 | | | | 982.00 | | | | 9.24 | | | | 1.88 | % | |
Class R Shares | | | 1,000.00 | | | | 984.10 | | | | 6.79 | | | | 1.38 | % | |
Class Y Shares | | | 1,000.00 | | | | 986.60 | | | | 4.33 | | | | 0.88 | % | |
RS Global Fund | |
Class A Shares | | | 1,000.00 | | | | 1,018.00 | | | | 5.25 | | | | 1.05 | % | |
Class C Shares | | | 1,000.00 | | | | 1,014.50 | | | | 8.99 | | | | 1.80 | % | |
Class R Shares | | | 1,000.00 | | | | 1,017.10 | | | | 6.50 | | | | 1.30 | % | |
Class Y Shares | | | 1,000.00 | | | | 1,019.80 | | | | 4.01 | | | | 0.80 | % | |
Sophus Emerging Markets Fund | |
Class A Shares | | | 1,000.00 | | | | 953.40 | | | | 6.49 | | | | 1.34 | % | |
Class C Shares | | | 1,000.00 | | | | 949.60 | | | | 10.34 | | | | 2.14 | % | |
Class R Shares | | | 1,000.00 | | | | 952.30 | | | | 7.65 | | | | 1.58 | % | |
Class R6 Shares | | | 1,000.00 | | | | 955.30 | | | | 4.31 | | | | 0.89 | % | |
Class Y Shares | | | 1,000.00 | | | | 954.90 | | | | 4.80 | | | | 0.99 | % | |
* Expenses are equal to the average account value multiplied by the Fund's annualized expense ratio multiplied by 181/365 (the number of days in the most recent fiscal half-year divided by the number of days in the fiscal year).
68
Victory Portfolios | | Supplemental Information — continued
June 30, 2018 | |
(Unaudited)
| | | Beginning
Account Value
1/1/18 | | Ending
Account Value
6/30/18 | | Expenses Paid
During Period
1/1/18-6/30/18* | | Annualized Net
Expense Ratio
During Period
1/1/18-6/30/18 | |
Sophus Emerging Markets Small Cap Fund | |
Class A Shares | | $ | 1,000.00 | | | $ | 938.80 | | | $ | 8.41 | | | | 1.75 | % | |
Class C Shares | | | 1,000.00 | | | | 934.80 | | | | 11.99 | | | | 2.50 | % | |
Class Y Shares | | | 1,000.00 | | | | 940.50 | | | | 7.22 | | | | 1.50 | % | |
* Expenses are equal to the average account value multiplied by the Fund's annualized expense ratio multiplied by 181/365 (the number of days in the most recent fiscal half-year divided by the number of days in the fiscal year).
69
Victory Portfolios | | Supplemental Information — continued
June 30, 2018 | |
(Unaudited)
Hypothetical Example for Comparison Purposes:
The table below provides information about hypothetical account values and hypothetical expenses based on each Fund's actual expense ratio and an assumed rate of return of 5% per year before expenses, which is not the Fund's actual return. The hypothetical account values and expenses may not be used to estimate the actual ending account balance or expenses you paid for the period. You may use this information to compare this 5% hypothetical example with the 5% hypothetical examples that appear in the shareholder reports of other funds.
Please note that the expenses shown in the table are meant to highlight your ongoing costs only and do not reflect any transactional costs. Therefore, the table is useful in comparing ongoing costs only, and will not help you determine the relative total costs of owning different funds. In addition, if these transactional costs were included, your costs would have been higher.
| | | Beginning
Account Value
1/1/18 | | Ending
Account Value
6/30/18 | | Expenses Paid
During Period
1/1/18-6/30/18* | | Annualized
Expense Ratio
During Period
1/1/18-6/30/18 | |
RS International Fund | |
Class A Shares | | $ | 1,000.00 | | | $ | 1,019.19 | | | $ | 5.66 | | | | 1.13 | % | |
Class C Shares | | | 1,000.00 | | | | 1,015.47 | | | | 9.39 | | | | 1.88 | % | |
Class R Shares | | | 1,000.00 | | | | 1,017.95 | | | | 6.90 | | | | 1.38 | % | |
Class Y Shares | | | 1,000.00 | | | | 1,020.43 | | | | 4.41 | | | | 0.88 | % | |
RS Global Fund | |
Class A Shares | | | 1,000.00 | | | | 1,019.59 | | | | 5.26 | | | | 1.05 | % | |
Class C Shares | | | 1,000.00 | | | | 1,015.87 | | | | 9.00 | | | | 1.80 | % | |
Class R Shares | | | 1,000.00 | | | | 1,018.35 | | | | 6.51 | | | | 1.30 | % | |
Class Y Shares | | | 1,000.00 | | | | 1,020.83 | | | | 4.01 | | | | 0.80 | % | |
Sophus Emerging Markets Fund | |
Class A Shares | | | 1,000.00 | | | | 1,018.15 | | | | 6.71 | | | | 1.34 | % | |
Class C Shares | | | 1,000.00 | | | | 1,014.18 | | | | 10.69 | | | | 2.14 | % | |
Class R Shares | | | 1,000.00 | | | | 1,016.96 | | | | 7.90 | | | | 1.58 | % | |
Class R6 Shares | | | 1,000.00 | | | | 1,020.38 | | | | 4.46 | | | | 0.89 | % | |
Class Y Shares | | | 1,000.00 | | | | 1,019.89 | | | | 4.96 | | | | 0.99 | % | |
Sophus Emerging Markets Small Cap Fund | |
Class A Shares | | | 1,000.00 | | | | 1,016.12 | | | | 8.75 | | | | 1.75 | % | |
Class C Shares | | | 1,000.00 | | | | 1,012.40 | | | | 12.47 | | | | 2.50 | % | |
Class Y Shares | | | 1,000.00 | | | | 1,017.36 | | | | 7.50 | | | | 1.50 | % | |
* Expenses are equal to the average account value multiplied by the Fund's annualized expense ratio multiplied by 181/365 (the number of days in the most recent fiscal half-year divided by the number of days in the fiscal year).
70
Victory Portfolios | | Supplemental Information — continued
June 30, 2018 | |
(Unaudited)
Portfolio Holdings:
(As a Percentage of Total Investments)
RS International Fund | | RS Global Fund | |

| | 
| |
Sophus Emerging Markets Fund | | Sophus Emerging Markets Small Cap Fund | |
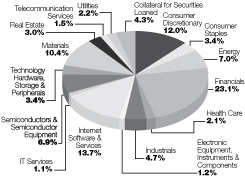
| | 
| |
71
Privacy Policy
Protecting the Privacy of Information
The Trust respects your right to privacy. We also know that you expect us to conduct and process your business in an accurate and efficient manner. To do so, we must collect and maintain certain personal information about you. This is the information we collect from you on applications or other forms, and from the transactions you make with us or third parties. It may include your name, address, social security number, account transactions and balances, and information about investment goals and risk tolerance.
We do not disclose any information about you or about former customers to anyone except as permitted or required by law. Specifically, we may disclose the information we collect to companies that perform services on our behalf, such as the transfer agent that processes shareholder accounts and printers and mailers that assist us in the distribution of investor materials. We may also disclose this information to companies that perform marketing services on our behalf. This allows us to continue to offer you Victory investment products and services that meet your investing needs, and to effect transactions that you request or authorize. These companies will use this information only in connection with the services for which we hired them. They are not permitted to use or share this information for any other purpose.
To protect your personal information internally, we permit access only by authorized employees and maintain physical, electronic and procedural safeguards to guard your personal information.*
*You may have received communications regarding information about privacy policies from other financial institutions which gave you the opportunity to "opt-out" of certain information sharing with companies which are not affiliated with that financial institution. The Trust does not share information with other companies for purposes of marketing solicitations for products other than the Trust. Therefore, the Trust does not provide opt-out options to their shareholders.
Victory Funds
P.O. Box 182593
Columbus, Ohio 43218-2593

Visit our website at: | | Call Victory at: | |
www.vcm.com | | 800-539-FUND (800-539-3863) | |

June 30, 2018
Semi Annual Report
Victory RS Partners Fund
Victory RS Value Fund
Victory RS Large Cap Alpha Fund
Victory RS Investors Fund
Victory Global Natural Resources Fund
www.vcm.com
News, Information And Education 24 Hours A Day, 7 Days A Week
The Victory Funds site gives fund shareholders, prospective shareholders, and investment professionals a convenient way to access fund information, get guidance, and track fund performance anywhere they can access the Internet. The site includes:
• Detailed performance records
• Daily share prices
• The latest fund news
• Investment resources to help you become a better investor
• A section dedicated to investment professionals
Whether you're a potential investor searching for the fund that matches your investment philosophy, a seasoned investor interested in planning tools, or an investment professional, www.vcm.com has what you seek. Visit us anytime. We're always open.
Victory Portfolios
Table of Contents
Financial Statements | |
The Victory Value Funds | |
Victory RS Partners Fund | |
Schedule of Portfolio Investments | | | 3 | | |
Statements of Assets and Liabilities | | | 16 | | |
Statements of Operations | | | 18 | | |
Statements of Changes in Net Assets | | | 20-22 | | |
Financial Highlights | | | 25-27 | | |
Victory RS Value Fund | |
Schedule of Portfolio Investments | | | 6 | | |
Statements of Assets and Liabilities | | | 16 | | |
Statements of Operations | | | 18 | | |
Statements of Changes in Net Assets | | | 20-22 | | |
Financial Highlights | | | 28-31 | | |
Victory RS Large Cap Alpha Fund | |
Schedule of Portfolio Investments | | | 9 | | |
Statements of Assets and Liabilities | | | 16 | | |
Statements of Operations | | | 18 | | |
Statements of Changes in Net Assets | | | 20-22 | | |
Financial Highlights | | | 32-35 | | |
Victory RS Investors Fund | |
Schedule of Portfolio Investments | | | 12 | | |
Statements of Assets and Liabilities | | | 17 | | |
Statements of Operations | | | 19 | | |
Statements of Changes in Net Assets | | | 23-24 | | |
Financial Highlights | | | 36-39 | | |
Victory Global Natural Resources Fund | |
Schedule of Portfolio Investments | | | 14 | | |
Statements of Assets and Liabilities | | | 17 | | |
Statements of Operations | | | 19 | | |
Statements of Changes in Net Assets | | | 23-24 | | |
Financial Highlights | | | 40-43 | | |
Notes to Financial Statements | | | 44 | | |
Supplemental Information | | | 56 | | |
Trustee and Officer Information | | | 56 | | |
Proxy Voting and Form N-Q Information | | | 59 | | |
Expense Examples | | | 59 | | |
Portfolio Holdings | | | 62 | | |
Privacy Policy (inside back cover) | |
1
The Funds are distributed by Victory Capital Advisers, Inc. Victory Capital Management Inc. is the investment adviser to the Funds and receives fees from the Funds for performing services for the Funds.
This report is not authorized for distribution to prospective investors unless preceded or accompanied by a current prospectus of the Victory Funds.
For additional information about any Victory Fund, including fees, expenses, and risks, view our prospectus online at www.vcm.com or call 800-539-3863. Read it carefully before you invest or send money.
The information in this semi annual report is based on data obtained from recognized services and sources and is believed to be reliable. Any opinions, projections, or recommendations in this report are subject to change without notice and are not intended as individual investment advice. Past investment performance of the Funds, markets or securities mentioned herein should not be considered to be indicative of future results.
• NOT FDIC INSURED • NO BANK GUARANTEE • MAY LOSE VALUE

Call Victory at:
800-539-FUND (800-539-3863)
Visit our website at:
www.vcm.com
2
Victory Portfolios
Victory RS Partners Fund | | Schedule of Portfolio Investments
June 30, 2018 | |
(Unaudited)
Security Description | | Shares | | Value | |
Common Stocks (97.0%) | |
Banks (16.6%): | |
Associated Banc-Corp. | | | 775,887 | | | $ | 21,181,714 | | |
Chemical Financial Corp. (a) | | | 117,165 | | | | 6,522,576 | | |
Columbia Banking System, Inc. (a) | | | 183,876 | | | | 7,520,528 | | |
First Horizon National Corp. | | | 554,944 | | | | 9,900,200 | | |
Hancock Holding Co. | | | 97,527 | | | | 4,549,635 | | |
Independent Bank Group, Inc. | | | 94,390 | | | | 6,305,252 | | |
Renasant Corp. (a) | | | 145,013 | | | | 6,600,992 | | |
South State Corp. | | | 66,430 | | | | 5,729,588 | | |
Synovus Financial Corp. | | | 175,069 | | | | 9,248,895 | | |
UMB Financial Corp. (a) | | | 89,482 | | | | 6,821,213 | | |
Union Bankshares Corp. (a) | | | 200,490 | | | | 7,795,051 | | |
| | | | 92,175,644 | | |
Capital Markets (0.9%): | |
Federated Investors, Inc., Class B (a) | | | 214,912 | | | | 5,011,748 | | |
Consumer Discretionary (9.9%): | |
Cooper-Standard Holding (b) | | | 56,220 | | | | 7,346,267 | | |
Jack in the Box, Inc. | | | 121,740 | | | | 10,362,509 | | |
Liberty Expedia Holdings, Inc., Class A (b) | | | 513,287 | | | | 22,553,831 | | |
Penske Automotive Group, Inc. | | | 304,941 | | | | 14,286,486 | | |
| | | | 54,549,093 | | |
Consumer Staples (3.7%): | |
Hostess Brands, Inc. (a) (b) | | | 627,541 | | | | 8,534,558 | | |
Nomad Foods Ltd. (b) | | | 140,840 | | | | 2,702,720 | | |
Performance Food Group Co. (b) | | | 256,535 | | | | 9,414,835 | | |
| | | | 20,652,113 | | |
Energy (6.7%): | |
Energen Corp. (b) | | | 103,867 | | | | 7,563,595 | | |
Kosmos Energy Ltd. (a) (b) | | | 1,390,637 | | | | 11,500,568 | | |
Peyto Exploration & Development Corp. (a) | | | 753,790 | | | | 5,803,237 | | |
RPC, Inc. (a) | | | 308,180 | | | | 4,490,183 | | |
SRC Energy, Inc. (a) (b) | | | 758,854 | | | | 8,362,571 | | |
| | | | 37,720,154 | | |
Health Care (4.7%): | |
Allscripts Healthcare Solutions, Inc. (b) | | | 706,330 | | | | 8,475,960 | | |
NuVasive, Inc. (a) (b) | | | 197,240 | | | | 10,280,149 | | |
Qurate Retail, Inc. (b) | | | 357,618 | | | | 7,588,654 | | |
| | | | 26,344,763 | | |
See notes to financial statements.
3
Victory Portfolios
Victory RS Partners Fund | | Schedule of Portfolio Investments — continued
June 30, 2018 | |
(Unaudited)
Security Description | | Shares | | Value | |
Industrials (9.3%): | |
Advanced Disposal Services, Inc. (b) | | | 442,143 | | | $ | 10,956,304 | | |
Atkore International Group, Inc. (b) | | | 538,540 | | | | 11,185,476 | | |
Azul SA, ADR (a) (b) | | | 292,929 | | | | 4,792,318 | | |
H&E Equipment Services, Inc. | | | 24,890 | | | | 936,113 | | |
Regal Beloit Corp. (a) | | | 89,918 | | | | 7,355,292 | | |
Rexnord Corp. (b) | | | 124,930 | | | | 3,630,466 | | |
Rush Enterprises, Inc., Class A (b) | | | 128,870 | | | | 5,590,381 | | |
SkyWest, Inc. | | | 130,610 | | | | 6,778,659 | | |
| | | | 51,225,009 | | |
Information Technology (13.9%): | |
Belden, Inc. (a) | | | 197,709 | | | | 12,083,974 | | |
CommVault Systems, Inc. (b) | | | 205,023 | | | | 13,500,764 | | |
Cray, Inc. (a) (b) | | | 469,930 | | | | 11,560,278 | | |
Euronet Worldwide, Inc. (a) (b) | | | 255,420 | | | | 21,396,533 | | |
Verint Systems, Inc. (b) | | | 425,690 | | | | 18,879,351 | | |
| | | | 77,420,900 | | |
Insurance (8.9%): | |
Axis Capital Holdings Ltd. | | | 154,380 | | | | 8,586,616 | | |
Hanover Insurance Group, Inc. | | | 33,160 | | | | 3,964,610 | | |
Primerica, Inc. | | | 83,543 | | | | 8,320,883 | | |
Torchmark Corp. | | | 169,080 | | | | 13,764,802 | | |
United Fire Group, Inc. | | | 64,080 | | | | 3,493,001 | | |
White Mountains Insurance Group Ltd. | | | 12,610 | | | | 11,432,352 | | |
| | | | 49,562,264 | | |
Materials (5.7%): | |
Commercial Metals Co. | | | 202,388 | | | | 4,272,411 | | |
Compass Minerals International, Inc. (a) | | | 124,876 | | | | 8,210,597 | | |
Crown Holdings, Inc. (a) (b) | | | 192,060 | | | | 8,596,606 | | |
Silgan Holdings, Inc. | | | 53,480 | | | | 1,434,868 | | |
Summit Materials, Inc., Class A (b) | | | 360,707 | | | | 9,468,559 | | |
| | | | 31,983,041 | | |
Mortgage Real Estate Investment Trusts (1.0%): | |
Redwood Trust, Inc. | | | 348,280 | | | | 5,736,172 | | |
Real Estate (7.5%): | |
Corporate Office Properties Trust | | | 49,570 | | | | 1,437,034 | | |
Education Realty Trust, Inc. | | | 169,850 | | | | 7,048,775 | | |
Equity Commonwealth (b) | | | 739,941 | | | | 23,308,141 | | |
Spirit MTA (b) | | | 46,817 | | | | 482,215 | | |
Spirit Realty Capital, Inc. | | | 1,023,810 | | | | 8,221,194 | | |
Terreno Realty Corp. | | | 37,140 | | | | 1,399,064 | | |
| | | | 41,896,423 | | |
Thrifts & Mortgage Finance (3.2%): | |
Essent Group Ltd. (b) | | | 490,552 | | | | 17,571,573 | | |
See notes to financial statements.
4
Victory Portfolios
Victory RS Partners Fund | | Schedule of Portfolio Investments — continued
June 30, 2018 | |
(Unaudited)
Security Description | | Shares | | Value | |
Utilities (5.0%): | |
Black Hills Corp. (a) | | | 194,335 | | | $ | 11,895,245 | | |
El Paso Electric Co. | | | 128,100 | | | | 7,570,710 | | |
South Jersey Industries, Inc. (a) | | | 247,560 | | | | 8,285,833 | | |
| | | | 27,751,788 | | |
Total Common Stocks (Cost $432,587,176) | | | 539,600,685 | | |
Preferred Stocks (0.3%) | |
Health Care (0.3%): | |
WellDoc, Inc. (c) (d) | | | 1,587,483 | | | | 1,942,920 | | |
Total Preferred Stock (Cost $1,942,920) | | | 1,942,920 | | |
Collateral for Securities Loaned (9.9%) | |
BlackRock Liquidity Funds TempFund Portfolio, Institutional Class, 2.06% (e) | | | 7,216,482 | | | | 7,216,482 | | |
Fidelity Investments Prime Money Market Portfolio, Class I, 2.07% (e) | | | 6,560,675 | | | | 6,560,675 | | |
Fidelity Investments Money Market Government Portfolio, Class I, 1.81% (e) | | | 14,836,423 | | | | 14,836,423 | | |
Goldman Sachs Financial Square Prime Obligations Fund, Institutional
Class, 2.16% (e) | | | 3,279,951 | | | | 3,279,951 | | |
JPMorgan Prime Money Market Fund, Capital Class, 2.05% (e) | | | 17,055,271 | | | | 17,055,271 | | |
Morgan Stanley Institutional Liquidity Prime Portfolio, Institutional
Class, 2.12% (e) | | | 5,903,911 | | | | 5,903,911 | | |
Total Collateral for Securities Loaned (Cost $54,852,713) | | | 54,852,713 | | |
Total Investments (Cost $489,382,809) — 107.2% | | | 596,396,318 | | |
Liabilities in excess of other assets — (7.2)% | | | (40,229,134 | ) | |
NET ASSETS — 100.00% | | $ | 556,167,184 | | |
(a) All or a portion of this security is on loan.
(b) Non-income producing security.
(c) The Fund's Adviser has deemed this security to be illiquid based upon procedures approved by the Board of Trustees. As of June 30, 2018, illiquid securities were 0.3% of the Fund's net assets.
(d) Security was fair valued based upon procedures approved by the Board of Trustees and represents 0.3% of the Fund's net assets as of June 30, 2018. This security is classified as Level 3 within the fair value hierarchy. (See Note 2)
(e) Rate disclosed is the daily yield on June 30, 2018.
ADR — American Depositary Receipt
See notes to financial statements.
5
Victory Portfolios
Victory RS Value Fund | | Schedule of Portfolio Investments
June 30, 2018 | |
(Unaudited)
Security Description | | Shares | | Value | |
Common Stocks (96.6%) | |
Consumer Discretionary (12.6%): | |
Aramark | | | 267,765 | | | $ | 9,934,081 | | |
Delphi Technologies PLC | | | 114,780 | | | | 5,217,899 | | |
Expedia, Inc. | | | 132,620 | | | | 15,939,598 | | |
LKQ Corp. (a) | | | 368,820 | | | | 11,765,358 | | |
MGM Resorts International | | | 336,490 | | | | 9,768,305 | | |
Penske Automotive Group, Inc. | | | 105,520 | | | | 4,943,612 | | |
| | | | 57,568,853 | | |
Consumer Staples (4.1%): | |
Performance Food Group Co. (a) | | | 122,710 | | | | 4,503,457 | | |
Post Holdings, Inc. (a) (b) | | | 161,840 | | | | 13,921,477 | | |
| | | | 18,424,934 | | |
Energy (7.8%): | |
Devon Energy Corp. | | | 211,633 | | | | 9,303,387 | | |
Energen Corp. (a) | | | 80,238 | | | | 5,842,931 | | |
Noble Energy, Inc. (b) | | | 249,735 | | | | 8,810,651 | | |
Range Resources Corp. (b) | | | 379,610 | | | | 6,350,875 | | |
RPC, Inc. (b) | | | 385,770 | | | | 5,620,669 | | |
| | | | 35,928,513 | | |
Financials (21.8%): | |
American International Group, Inc. | | | 248,690 | | | | 13,185,544 | | |
Brown & Brown, Inc. | | | 461,840 | | | | 12,806,823 | | |
Capital One Financial Corp. | | | 120,320 | | | | 11,057,408 | | |
Comerica, Inc. | | | 142,493 | | | | 12,955,464 | | |
E*TRADE Financial Corp. (a) | | | 171,500 | | | | 10,488,940 | | |
KeyCorp | | | 513,480 | | | | 10,033,399 | | |
Renaissancere Holdings Ltd. | | | 111,170 | | | | 13,375,974 | | |
Unum Group | | | 178,390 | | | | 6,598,646 | | |
Voya Financial, Inc. (b) | | | 189,890 | | | | 8,924,830 | | |
| | | | 99,427,028 | | |
Health Care (7.7%): | |
Allergan PLC | | | 93,080 | | | | 15,518,298 | | |
NuVasive, Inc. (a) (b) | | | 70,680 | | | | 3,683,842 | | |
Qurate Retail, Inc. (a) (b) | | | 297,950 | | | | 6,322,499 | | |
Zimmer Biomet Holdings, Inc. (b) | | | 84,400 | | | | 9,405,536 | | |
| | | | 34,930,175 | | |
Industrials (6.5%): | |
Azul SA, ADR (a) (b) | | | 266,970 | | | | 4,367,629 | | |
Crane Co. | | | 81,190 | | | | 6,505,755 | | |
Sensata Technologies Holding PLC (a) | | | 119,350 | | | | 5,678,673 | | |
Southwest Airlines Co. | | | 134,230 | | | | 6,829,622 | | |
Timken Co. (b) | | | 132,900 | | | | 5,787,795 | | |
| | | | 29,169,474 | | |
See notes to financial statements.
6
Victory Portfolios
Victory RS Value Fund | | Schedule of Portfolio Investments — continued
June 30, 2018 | |
(Unaudited)
Security Description | | Shares | | Value | |
Information Technology (12.3%): | |
Belden, Inc. (b) | | | 85,940 | | | $ | 5,252,653 | | |
Cognizant Technology Solutions Corp., Class A | | | 114,581 | | | | 9,050,753 | | |
CommVault Systems, Inc. (a) | | | 24,140 | | | | 1,589,619 | | |
Euronet Worldwide, Inc. (a) (b) | | | 192,923 | | | | 16,161,160 | | |
FleetCor Technologies, Inc. (a) | | | 36,360 | | | | 7,659,234 | | |
NCR Corp. (a) | | | 243,350 | | | | 7,295,633 | | |
Verint Systems, Inc. (a) | | | 200,120 | | | | 8,875,322 | | |
| | | | 55,884,374 | | |
Materials (8.4%): | |
Ball Corp. (b) | | | 391,230 | | | | 13,908,226 | | |
Compass Minerals International, Inc. (b) | | | 49,830 | | | | 3,276,323 | | |
Crown Holdings, Inc. (a) | | | 103,020 | | | | 4,611,175 | | |
Sealed Air Corp. (b) | | | 296,020 | | | | 12,566,048 | | |
WestRock Co. | | | 71,580 | | | | 4,081,492 | | |
| | | | 38,443,264 | | |
Real Estate (9.7%): | |
Equity Commonwealth (a) | | | 543,493 | | | | 17,120,029 | | |
Invitation Homes, Inc. (b) | | | 507,900 | | | | 11,712,174 | | |
MGM Growth Properties LLC, Series A (b) | | | 221,530 | | | | 6,747,804 | | |
Spirit MTA (a) | | | 96,561 | | | | 994,578 | | |
Spirit Realty Capital, Inc. | | | 965,610 | | | | 7,753,848 | | |
| | | | 44,328,433 | | |
Utilities (5.7%): | |
AES Corp. | | | 454,730 | | | | 6,097,929 | | |
Atmos Energy Corp. | | | 61,069 | | | | 5,504,760 | | |
DTE Energy Co. (b) | | | 46,005 | | | | 4,767,498 | | |
WEC Energy Group, Inc. | | | 77,635 | | | | 5,019,103 | | |
Xcel Energy, Inc. | | | 112,425 | | | | 5,135,574 | | |
| | | | 26,524,864 | | |
Total Common Stocks (Cost $394,023,615) | | | 440,629,912 | | |
See notes to financial statements.
7
Victory Portfolios
Victory RS Value Fund | | Schedule of Portfolio Investments — continued
June 30, 2018 | |
(Unaudited)
Security Description | | Shares | | Value | |
Collateral for Securities Loaned (10.9%) | |
BlackRock Liquidity Funds TempFund Portfolio, Institutional Class, 2.06% (c) | | | 6,513,938 | | | $ | 6,513,938 | | |
Fidelity Investments Prime Money Market Portfolio, Class I, 2.07% (c) | | | 5,921,976 | | | | 5,921,976 | | |
Fidelity Investments Money Market Government Portfolio, Class I, 1.81% (c) | | | 13,392,058 | | | | 13,392,058 | | |
Goldman Sachs Financial Square Prime Obligations Fund, Institutional
Class, 2.16% (c) | | | 2,960,639 | | | | 2,960,639 | | |
JPMorgan Prime Money Market Fund, Capital Class, 2.05% (c) | | | 15,394,896 | | | | 15,394,896 | | |
Morgan Stanley Institutional Liquidity Prime Portfolio, Institutional
Class, 2.12% (c) | | | 5,329,150 | | | | 5,329,150 | | |
Total Collateral for Securities Loaned (Cost $49,512,657) | | | 49,512,657 | | |
Total Investments (Cost $443,536,272) — 107.5% | | | 490,142,569 | | |
Liabilities in excess of other assets — (7.5)% | | | (34,359,164 | ) | |
NET ASSETS — 100.00% | | $ | 455,783,405 | | |
(a) Non-income producing security.
(b) All or a portion of this security is on loan.
(c) Rate disclosed is the daily yield on June 30, 2018.
ADR — American Depositary Receipt
LLC — Limited Liability Company
PLC — Public Limited Company
See notes to financial statements.
8
Victory Portfolios
Victory RS Large Cap Alpha Fund | | Schedule of Portfolio Investments
June 30, 2018 | |
(Unaudited)
Security Description | | Shares | | Value | |
Common Stocks (98.1%) | |
Banks (10.1%): | |
Comerica, Inc. | | | 189,260 | | | $ | 17,207,519 | | |
JPMorgan Chase & Co. | | | 174,360 | | | | 18,168,312 | | |
The PNC Financial Services Group, Inc. | | | 100,950 | | | | 13,638,345 | | |
U.S. Bancorp | | | 198,900 | | | | 9,948,978 | | |
| | | | 58,963,154 | | |
Capital Markets (2.0%): | |
E*TRADE Financial Corp. (a) | | | 187,410 | | | | 11,461,996 | | |
Consumer Discretionary (6.3%): | |
Aramark | | | 174,370 | | | | 6,469,127 | | |
Booking Holdings, Inc. (a) | | | 4,720 | | | | 9,567,865 | | |
LKQ Corp. (a) | | | 231,600 | | | | 7,388,040 | | |
MGM Resorts International | | | 460,000 | | | | 13,353,800 | | |
| | | | 36,778,832 | | |
Consumer Finance (1.9%): | |
Capital One Financial Corp. | | | 122,540 | | | | 11,261,426 | | |
Consumer Staples (8.4%): | |
CVS Health Corp. | | | 226,545 | | | | 14,578,171 | | |
Mondelez International, Inc., Class A | | | 478,760 | | | | 19,629,160 | | |
Post Holdings, Inc. (a) (b) | | | 173,160 | | | | 14,895,223 | | |
| | | | 49,102,554 | | |
Energy (11.8%): | |
Chevron Corp. | | | 106,125 | | | | 13,417,383 | | |
Devon Energy Corp. | | | 273,928 | | | | 12,041,875 | | |
Enterprise Products Partners LP (b) | | | 455,730 | | | | 12,610,049 | | |
EQT Corp. | | | 225,120 | | | | 12,422,122 | | |
Helmerich & Payne, Inc. | | | 91,030 | | | | 5,804,073 | | |
Noble Energy, Inc. (b) | | | 364,704 | | | | 12,866,757 | | |
| | | | 69,162,259 | | |
Health Care (8.9%): | |
Allergan PLC | | | 117,234 | | | | 19,545,252 | | |
Qurate Retail, Inc. (a) | | | 390,721 | | | | 8,291,100 | | |
UnitedHealth Group, Inc. | | | 46,775 | | | | 11,475,778 | | |
Zimmer Biomet Holdings, Inc. | | | 108,530 | | | | 12,094,583 | | |
| | | | 51,406,713 | | |
Industrials (6.4%): | |
Eaton Corp. PLC | | | 116,460 | | | | 8,704,220 | | |
Sensata Technologies Holding PLC (a) (b) | | | 179,490 | | | | 8,540,134 | | |
Southwest Airlines Co. | | | 227,300 | | | | 11,565,024 | | |
Union Pacific Corp. | | | 57,250 | | | | 8,111,180 | | |
| | | | 36,920,558 | | |
See notes to financial statements.
9
Victory Portfolios
Victory RS Large Cap Alpha Fund | | Schedule of Portfolio Investments — continued
June 30, 2018 | |
(Unaudited)
Security Description | | Shares | | Value | |
Information Technology (14.1%): | |
Alphabet, Inc., Class A (a) | | | 23,090 | | | $ | 26,072,997 | | |
Cognizant Technology Solutions Corp., Class A | | | 146,577 | | | | 11,578,117 | | |
FleetCor Technologies, Inc. (a) | | | 51,400 | | | | 10,827,410 | | |
Microsoft Corp. | | | 114,370 | | | | 11,278,026 | | |
Visa, Inc., Class A | | | 167,040 | | | | 22,124,448 | | |
| | | | 81,880,998 | | |
Insurance (14.1%): | |
Aflac, Inc. | | | 262,400 | | | | 11,288,448 | | |
American International Group, Inc. | | | 378,770 | | | | 20,082,386 | | |
Arch Capital Group Ltd. (a) | | | 455,640 | | | | 12,056,234 | | |
Brown & Brown, Inc. | | | 638,640 | | | | 17,709,488 | | |
Cincinnati Financial Corp. | | | 165,810 | | | | 11,086,057 | | |
Unum Group | | | 276,590 | | | | 10,231,064 | | |
| | | | 82,453,677 | | |
Materials (6.5%): | |
Ball Corp. (b) | | | 478,760 | | | | 17,019,918 | | |
Lyondellbasell Industries NV, Class A | | | 40,349 | | | | 4,432,338 | | |
Sealed Air Corp. | | | 376,780 | | | | 15,994,311 | | |
| | | | 37,446,567 | | |
Real Estate (4.3%): | |
Equity Commonwealth (a) | | | 392,220 | | | | 12,354,930 | | |
Invitation Homes, Inc. | | | 547,790 | | | | 12,632,037 | | |
| | | | 24,986,967 | | |
Utilities (3.3%): | |
Duke Energy Corp. | | | 133,920 | | | | 10,590,394 | | |
Exelon Corp. | | | 196,350 | | | | 8,364,510 | | |
| | | | 18,954,904 | | |
Total Common Stocks (Cost $476,714,428) | | | 570,780,605 | | |
See notes to financial statements.
10
Victory Portfolios
Victory RS Large Cap Alpha Fund | | Schedule of Portfolio Investments — continued
June 30, 2018 | |
(Unaudited)
Security Description | | Shares | | Value | |
Collateral for Securities Loaned (6.0%) | |
BlackRock Liquidity Funds TempFund Portfolio, Institutional Class, 2.06% (c) | | | 4,585,098 | | | $ | 4,585,098 | | |
Fidelity Investments Prime Money Market Portfolio, Class I, 2.07% (c) | | | 4,168,422 | | | | 4,168,422 | | |
Fidelity Investments Money Market Government Portfolio, Class I, 1.81% (c) | | | 9,426,540 | | | | 9,426,540 | | |
Goldman Sachs Financial Square Prime Obligations Fund, Institutional
Class, 2.16% (c) | | | 2,083,965 | | | | 2,083,965 | | |
JPMorgan Prime Money Market Fund, Capital Class, 2.05% (c) | | | 10,836,318 | | | | 10,836,318 | | |
Morgan Stanley Institutional Liquidity Prime Portfolio, Institutional
Class, 2.12% (c) | | | 3,751,137 | | | | 3,751,137 | | |
Total Collateral for Securities Loaned (Cost $34,851,480) | | | 34,851,480 | | |
Total Investments (Cost $511,565,908) — 104.1% | | | 605,632,085 | | |
Liabilities in excess of other assets — (4.1)% | | | (23,688,515 | ) | |
NET ASSETS — 100.00% | | $ | 581,943,570 | | |
(a) Non-income producing security.
(b) All or a portion of this security is on loan.
(c) Rate disclosed is the daily yield on June 30, 2018.
LP — Limited Partnership
PLC — Public Limited Company
See notes to financial statements.
11
Victory Portfolios
Victory RS Investors Fund | | Schedule of Portfolio Investments
June 30, 2018 | |
(Unaudited)
Security Description | | Shares | | Value | |
Common Stocks (97.7%) | |
Banks (7.8%): | |
Associated Banc-Corp. | | | 68,920 | | | $ | 1,881,516 | | |
Comerica, Inc. | | | 21,910 | | | | 1,992,057 | | |
| | | | 3,873,573 | | |
Capital Markets (2.8%): | |
E*TRADE Financial Corp. (a) | | | 22,895 | | | | 1,400,258 | | |
Consumer Discretionary (9.9%): | |
Liberty Expedia Holdings, Inc., Class A (a) | | | 64,830 | | | | 2,848,631 | | |
LKQ Corp. (a) | | | 62,740 | | | | 2,001,406 | | |
| | | | 4,850,037 | | |
Consumer Staples (12.9%): | |
CVS Health Corp. | | | 23,570 | | | | 1,516,730 | | |
Mondelez International, Inc., Class A | | | 54,600 | | | | 2,238,600 | | |
Post Holdings, Inc. (a) (b) | | | 31,090 | | | | 2,674,361 | | |
| | | | 6,429,691 | | |
Energy (9.4%): | |
Energen Corp. (a) | | | 20,920 | | | | 1,523,394 | | |
EQT Corp. (b) | | | 22,000 | | | | 1,213,960 | | |
Noble Energy, Inc. | | | 54,012 | | | | 1,905,544 | | |
| | | | 4,642,898 | | |
Health Care (7.3%): | |
Allergan PLC | | | 14,873 | | | | 2,479,627 | | |
Allscripts Healthcare Solutions, Inc. (a) | | | 96,400 | | | | 1,156,800 | | |
| | | | 3,636,427 | | |
Information Technology (17.1%): | |
Alphabet, Inc., Class A (a) | | | 2,112 | | | | 2,384,849 | | |
CommVault Systems, Inc. (a) | | | 6,835 | | | | 450,085 | | |
Euronet Worldwide, Inc. (a) (b) | | | 27,460 | | | | 2,300,324 | | |
NCR Corp. (a) | | | 45,490 | | | | 1,363,790 | | |
Verint Systems, Inc. (a) | | | 43,050 | | | | 1,909,267 | | |
| | | | 8,408,315 | | |
Insurance (11.0%): | |
American International Group, Inc. (b) | | | 25,700 | | | | 1,362,614 | | |
Brown & Brown, Inc. | | | 84,680 | | | | 2,348,176 | | |
Renaissancere Holdings Ltd. | | | 14,430 | | | | 1,736,218 | | |
| | | | 5,447,008 | | |
Materials (9.9%): | |
Ball Corp. (b) | | | 58,240 | | | | 2,070,432 | | |
Compass Minerals International, Inc. (b) | | | 14,596 | | | | 959,687 | | |
Sealed Air Corp. | | | 44,410 | | | | 1,885,205 | | |
| | | | 4,915,324 | | |
Real Estate (5.9%): | |
Equity Commonwealth (a) | | | 92,220 | | | | 2,904,930 | | |
See notes to financial statements.
12
Victory Portfolios
Victory RS Investors Fund | | Schedule of Portfolio Investments — continued
June 30, 2018 | |
(Unaudited)
Security Description | | Shares | | Value | |
Thrifts & Mortgage Finance (3.7%): | |
Essent Group Ltd. (a) | | | 50,400 | | | $ | 1,805,328 | | |
Total Common Stocks (Cost $42,903,860) | | | 48,313,789 | | |
Collateral for Securities Loaned (10.8%) | |
BlackRock Liquidity Funds TempFund Portfolio, Institutional Class, 2.06% (c) | | | 698,988 | | | | 698,988 | | |
Fidelity Investments Prime Money Market Portfolio, Class I, 2.07% (c) | | | 635,467 | | | | 635,467 | | |
Fidelity Investments Money Market Government Portfolio, Class I, 1.81% (c) | | | 1,437,056 | | | | 1,437,056 | | |
Goldman Sachs Financial Square Prime Obligations Fund, Institutional
Class, 2.16% (c) | | | 317,696 | | | | 317,696 | | |
JPMorgan Prime Money Market Fund, Capital Class, 2.05% (c) | | | 1,651,974 | | | | 1,651,974 | | |
Morgan Stanley Institutional Liquidity Prime Portfolio, Institutional
Class, 2.12% (c) | | | 571,853 | | | | 571,853 | | |
Total Collateral for Securities Loaned (Cost $5,313,034) | | | 5,313,034 | | |
Total Investments (Cost $48,216,894) — 108.5% | | | 53,626,823 | | |
Liabilities in excess of other assets — (8.5)% | | | (4,217,717 | ) | |
NET ASSETS — 100.00% | | $ | 49,409,106 | | |
(a) Non-income producing security.
(b) All or a portion of this security is on loan.
(c) Rate disclosed is the daily yield on June 30, 2018.
PLC — Public Limited Company
See notes to financial statements.
13
Victory Portfolios
Victory Global Natural Resources Fund | | Schedule of Portfolio Investments
June 30, 2018 | |
(Unaudited)
Security Description | | Shares | | Value | |
Common Stocks (91.4%) | |
Energy Equipment & Services (2.7%): | |
Covia Holdings Corp. (a) (b) | | | 988,104 | | | $ | 18,339,210 | | |
U.S. Silica Holdings, Inc. (b) | | | 655,225 | | | | 16,832,730 | | |
| | | | 35,171,940 | | |
Materials (23.0%): | |
First Quantum Minerals Ltd. | | | 6,761,356 | | | | 99,632,914 | | |
HudBay Minerals, Inc. | | | 168,065 | | | | 937,175 | | |
Taseko Mines Ltd. (a) | | | 3,836,051 | | | | 4,142,935 | | |
Turquoise Hill Resources Ltd. (a) (b) | | | 67,369,596 | | | | 191,329,653 | | |
| | | | 296,042,677 | | |
Oil, Gas & Consumable Fuels (65.7%): | |
Antero Resources Corp. (a) (b) | | | 5,543,399 | | | | 118,351,570 | | |
ARC Resources Ltd. (b) | | | 1,241,410 | | | | 12,824,913 | | |
Centennial Resource Development, Inc. (a) (b) | | | 2,624,242 | | | | 47,393,810 | | |
Denbury Resources, Inc. (a) (b) | | | 9,418,587 | | | | 45,303,403 | | |
EOG Resources, Inc. | | | 116,400 | | | | 14,483,652 | | |
EQT Corp. (b) | | | 471,471 | | | | 26,015,770 | | |
Kosmos Energy Ltd. (a) (b) | | | 1,869,314 | | | | 15,459,227 | | |
Laredo Petroleum, Inc. (a) (b) | | | 9,803,879 | | | | 94,313,316 | | |
Noble Energy, Inc. | | | 1,726,023 | | | | 60,894,091 | | |
Occidental Petroleum Corp. | | | 740,200 | | | | 61,939,936 | | |
Ophir Energy PLC (a) | | | 7,078,557 | | | | 4,716,796 | | |
Peyto Exploration & Development Corp. (b) | | | 5,743,296 | | | | 44,216,170 | | |
Range Resources Corp. (b) | | | 7,926,745 | | | | 132,614,445 | | |
SRC Energy, Inc. (a) (b) | | | 5,648,718 | | | | 62,248,872 | | |
Tourmaline Oil Corp. | | | 2,676,570 | | | | 47,830,072 | | |
Whitecap Resources, Inc. | | | 8,710,023 | | | | 59,038,649 | | |
| | | | 847,644,692 | | |
Total Common Stocks (Cost $1,269,074,143) | | | 1,178,859,309 | | |
See notes to financial statements.
14
Victory Portfolios
Victory Global Natural Resources Fund | | Schedule of Portfolio Investments — continued
June 30, 2018 | |
(Unaudited)
Security Description | | Shares | | Value | |
Collateral for Securities Loaned (14.8%) | |
BlackRock Liquidity Funds TempFund Portfolio, Institutional Class, 2.06% (c) | | | 25,078,389 | | | $ | 25,078,389 | | |
Fidelity Investments Prime Money Market Portfolio, Class I, 2.07% (c) | | | 22,799,360 | | | | 22,799,360 | | |
Fidelity Investments Money Market Government Portfolio, Class I, 1.81% (c) | | | 51,558,864 | | | | 51,558,864 | | |
Goldman Sachs Financial Square Prime Obligations Fund, Institutional
Class, 2.16% (c) | | | 11,398,335 | | | | 11,398,335 | | |
JPMorgan Prime Money Market Fund, Capital Class, 2.05% (c) | | | 59,269,704 | | | | 59,269,704 | | |
Morgan Stanley Institutional Liquidity Prime Portfolio, Institutional
Class, 2.12% (c) | | | 20,517,004 | | | | 20,517,004 | | |
Total Collateral for Securities Loaned (Cost $190,621,656) | | | 190,621,656 | | |
Total Investments (Cost $1,459,695,799) — 106.2% | | | 1,369,480,965 | | |
Liabilities in excess of other assets — (6.2)% | | | (80,004,498 | ) | |
NET ASSETS — 100.00% | | $ | 1,289,476,467 | | |
(a) Non-income producing security.
(b) All or a portion of this security is on loan.
(c) Rate disclosed is the daily yield on June 30, 2018.
PLC — Public Limited Company
See notes to financial statements.
15
Victory Portfolios | | Statements of Assets and Liabilities
June 30, 2018 | |
(Unaudited)
| | | Victory
RS Partners
Fund | | Victory
RS Value
Fund | | Victory
RS Large
Cap Alpha
Fund | |
ASSETS: | |
Investments, at value (Cost $489,382,809,
$443,536,272 and $511,565,908) | | $ | 596,396,318 | (a) | | $ | 490,142,569 | (b) | | $ | 605,632,085 | (c) | |
Cash and cash equivalents | | | 15,788,534 | | | | 15,773,579 | | | | 12,732,282 | | |
Interest and dividends receivable | | | 596,992 | | | | 451,328 | | | | 364,468 | | |
Receivable for capital shares issued | | | 168,254 | | | | 78,681 | | | | 67,974 | | |
Receivable for investments sold | | | 3,832,316 | | | | 2,729,302 | | | | — | | |
Receivable from Adviser | | | 36,485 | | | | 9,259 | | | | 24,104 | | |
Prepaid expenses | | | 33,618 | | | | 40,657 | | | | 38,700 | | |
Total Assets | | | 616,852,517 | | | | 509,225,375 | | | | 618,859,613 | | |
LIABILITIES: | |
Securities lending collateral | | | 54,852,713 | | | | 49,512,657 | | | | 34,851,480 | | |
Payable for investments purchased | | | 4,538,641 | | | | 2,798,472 | | | | 634,349 | | |
Payable for capital shares redeemed | | | 647,786 | | | | 587,913 | | | | 1,004,182 | | |
Accrued expenses and other payables: | |
Investment advisory fees | | | 467,510 | | | | 325,252 | | | | 244,575 | | |
Administration fees | | | 28,518 | | | | 23,343 | | | | 29,764 | | |
Custodian fees | | | 1,994 | | | | 979 | | | | 4,011 | | |
Transfer agent fees | | | 54,058 | | | | 110,093 | | | | 32,948 | | |
Chief Compliance Officer fees | | | 414 | | | | 320 | | | | 371 | | |
| 12b-1 fees | | | 24,829 | | | | 28,798 | | | | 66,797 | | |
Other accrued expenses | | | 68,870 | | | | 54,143 | | | | 47,566 | | |
Total Liabilities | | | 60,685,333 | | | | 53,441,970 | | | | 36,916,043 | | |
NET ASSETS: | |
Capital | | | 391,764,390 | | | | 365,723,564 | | | | 418,709,590 | | |
Accumulated net investment income (loss) | | | 323,195 | | | | 1,177,916 | | | | 5,939,176 | | |
Accumulated net realized gains (losses) from
investments | | | 57,065,830 | | | | 42,275,628 | | | | 63,228,627 | | |
Net unrealized appreciation (depreciation) on
investments | | | 107,013,769 | | | | 46,606,297 | | | | 94,066,177 | | |
Net Assets | | $ | 556,167,184 | | | $ | 455,783,405 | | | $ | 581,943,570 | | |
Net Assets | |
Class A Shares | | $ | 232,774,317 | | | $ | 220,337,233 | | | $ | 520,654,341 | | |
Class C Shares | | | — | | | | 13,094,518 | | | | 24,305,372 | | |
Class R Shares | | | 2,081,528 | | | | 1,399,579 | | | | 9,108,596 | | |
Class Y Shares | | | 321,311,339 | | | | 220,952,075 | | | | 27,875,261 | | |
Total | | $ | 556,167,184 | | | $ | 455,783,405 | | | $ | 581,943,570 | | |
Shares (unlimited number of shares authorized
with a par value of $0.001 per share): | |
Class A Shares | | | 7,960,630 | | | | 8,454,391 | | | | 9,110,367 | | |
Class C Shares | | | — | | | | 556,300 | | | | 488,306 | | |
Class R Shares | | | 76,885 | | | | 56,276 | | | | 160,410 | | |
Class Y Shares | | | 10,448,351 | | | | 8,289,284 | | | | 489,160 | | |
Total | | | 18,485,866 | | | | 17,356,251 | | | | 10,248,243 | | |
Net asset value, offering (except Class A Shares)
and redemption price per share: | |
Class A Shares | | $ | 29.24 | | | $ | 26.06 | | | $ | 57.15 | | |
Class C Shares (d) | | $ | — | | | $ | 23.54 | | | $ | 49.77 | | |
Class R Shares | | $ | 27.07 | | | $ | 24.87 | | | $ | 56.78 | | |
Class Y Shares | | $ | 30.75 | | | $ | 26.66 | | | $ | 56.99 | | |
Maximum Sales Charge — Class A Shares | | | 5.75 | % | | | 5.75 | % | | | 5.75 | % | |
Maximum offering price (100%/(100%-maximum
sales charge) of net asset value adjusted to the
nearest cent) per share — Class A Shares | | $ | 31.02 | | | $ | 27.65 | | | $ | 60.64 | | |
(a) Includes $53,815,483 of securities on loan.
(b) Includes $48,120,227 of securities on loan.
(c) Includes $34,055,242 of securities on loan.
(d) Redemption price per share varies by the length of time shares are held.
See notes to financial statements.
16
Victory Portfolios | | Statements of Assets and Liabilities
June 30, 2018 | |
(Unaudited)
| | | Victory
RS Investors
Fund | | Victory
Global Natural
Resources
Fund | |
ASSETS: | |
Investments, at value (Cost $48,216,894 and $1,459,695,799) | | $ | 53,626,823 | (a) | | $ | 1,369,480,965 | (b) | |
Cash and cash equivalents | | | 1,224,379 | | | | 105,914,185 | | |
Interest and dividends receivable | | | 21,575 | | | | 1,179,920 | | |
Receivable for capital shares issued | | | 11,786 | | | | 229,974 | | |
Receivable for investments sold | | | — | | | | 8,892,299 | | |
Receivable from Adviser | | | 14,803 | | | | 48,493 | | |
Prepaid expenses | | | 24,775 | | | | 38,679 | | |
Total Assets | | | 54,924,141 | | | | 1,485,784,515 | | |
LIABILITIES: | |
Securities lending collateral | | | 5,313,034 | | | | 190,621,656 | | |
Payable to custodian | | | — | | | | 10,671 | | |
Payable for investments purchased | | | — | | | | 2,806,737 | | |
Payable for capital shares redeemed | | | 129,182 | | | | 1,459,758 | | |
Accrued expenses and other payables: | |
Investment advisory fees | | | 42,029 | | | | 1,067,820 | | |
Administration fees | | | 2,564 | | | | 64,632 | | |
Custodian fees | | | 1,646 | | | | 17,161 | | |
Transfer agent fees | | | 8,882 | | | | 117,422 | | |
Chief Compliance Officer fees | | | 44 | | | | 993 | | |
| 12b-1 fees | | | 6,252 | | | | 31,846 | | |
Other accrued expenses | | | 11,402 | | | | 109,352 | | |
Total Liabilities | | | 5,515,035 | | | | 196,308,048 | | |
NET ASSETS: | |
Capital | | | 39,212,938 | | | | 2,691,814,844 | | |
Accumulated net investment income (loss) | | | (173,691 | ) | | | (3,197,984 | ) | |
Accumulated net realized gains (losses) from investments | | | 4,959,930 | | | | (1,308,929,331 | ) | |
Net unrealized appreciation (depreciation) on investments | | | 5,409,929 | | | | (90,211,062 | ) | |
Net Assets | | $ | 49,409,106 | | | $ | 1,289,476,467 | | |
Net Assets | |
Class A Shares | | $ | 18,501,233 | | | $ | 243,029,758 | | |
Class C Shares | | | 9,416,698 | | | | 16,554,656 | | |
Class R Shares | | | 1,322,412 | | | | 2,315,631 | | |
Class Y Shares | | | 20,168,763 | | | | 1,027,576,422 | | |
Total | | $ | 49,409,106 | | | $ | 1,289,476,467 | | |
Shares (unlimited number of shares authorized with a
par value of $0.001 per share): | |
Class A Shares | | | 1,322,041 | | | | 10,385,133 | | |
Class C Shares | | | 737,854 | | | | 779,074 | | |
Class R Shares | | | 102,521 | | | | 104,280 | | |
Class Y Shares | | | 1,414,104 | | | | 42,283,138 | | |
Total | | | 3,576,520 | | | | 53,551,625 | | |
Net asset value, offering (except Class A Shares) and
redemption price per share: | |
Class A Shares | | $ | 13.99 | | | $ | 23.40 | | |
Class C Shares (c) | | $ | 12.76 | | | $ | 21.25 | | |
Class R Shares | | $ | 12.90 | | | $ | 22.21 | | |
Class Y Shares | | $ | 14.26 | | | $ | 24.30 | | |
Maximum Sales Charge — Class A Shares | | | 5.75 | % | | | 5.75 | % | |
Maximum offering price (100%/(100%-maximum
sales charge) of net asset value adjusted to the
nearest cent) per share — Class A Shares | | $ | 14.84 | | | $ | 24.83 | | |
(a) Includes $5,165,180 of securities on loan.
(b) Includes $186,097,704 of securities on loan.
(c) Redemption price per share varies by the length of time shares are held.
See notes to financial statements.
17
Victory Portfolios | | Statements of Operations
For the Six Months Ended June 30, 2018 | |
(Unaudited)
| | | Victory
RS Partners
Fund | | Victory
RS Value
Fund | | Victory
RS Large
Cap Alpha
Fund | |
Investment Income: | |
Dividend income | | $ | 3,842,713 | | | $ | 3,906,473 | | | $ | 4,290,411 | | |
Interest income | | | 70,286 | | | | 42,721 | | | | 31,188 | | |
Securities lending income | | | 56,797 | | | | 81,250 | | | | 25,293 | | |
Foreign tax withholding | | | (24,563 | ) | | | — | | | | — | | |
Total Income | | | 3,945,233 | | | | 4,030,444 | | | | 4,346,892 | | |
Expenses: | |
Investment advisory fees | | | 2,871,050 | | | | 2,035,246 | | | | 1,499,865 | | |
Administration fees | | | 170,330 | | | | 135,781 | | | | 177,653 | | |
12b-1 fees — Class A Shares | | | 303,898 | | | | 286,186 | | | | 664,379 | | |
12b-1 fees — Class C Shares | | | — | | | | 76,876 | | | | 137,909 | | |
12b-1 fees — Class R Shares | | | 5,208 | | | | 3,815 | | | | 25,037 | | |
Custodian fees | | | 16,443 | | | | 15,695 | | | | 13,415 | | |
Transfer agent fees | | | 25,899 | | | | 19,103 | | | | 19,038 | | |
Transfer agent fees — Class A Shares | | | 188,468 | | | | 144,936 | | | | 198,753 | | |
Transfer agent fees — Class C Shares | | | — | | | | 8,313 | | | | 14,930 | | |
Transfer agent fees — Class R Shares | | | 2,364 | | | | 1,669 | | | | 8,782 | | |
Transfer agent fees — Class Y Shares | | | 114,650 | | | | 62,945 | | | | 14,017 | | |
Trustees' fees | | | 22,710 | | | | 18,683 | | | | 22,610 | | |
Chief Compliance Officer fees | | | 2,252 | | | | 1,861 | | | | 2,284 | | |
Legal and audit fees | | | 27,712 | | | | 24,773 | | | | 27,737 | | |
State registration and filing fees | | | 27,466 | | | | 36,681 | | | | 29,581 | | |
Other expenses | | | 59,242 | | | | 39,582 | | | | 25,861 | | |
Total Expenses | | | 3,837,692 | | | | 2,912,145 | | | | 2,881,851 | | |
Expenses waived/reimbursed by Adviser | | | (215,654 | ) | | | (59,617 | ) | | | (116,487 | ) | |
Net Expenses | | | 3,622,038 | | | | 2,852,528 | | | | 2,765,364 | | |
Net Investment Income (Loss) | | | 323,195 | | | | 1,177,916 | | | | 1,581,528 | | |
Realized/Unrealized Gains (Losses) from
Investment Transactions: | |
Net realized gains (losses) from investment
transactions and foreign currency translations | | | 47,522,978 | | | | 36,792,172 | | | | 51,550,372 | | |
Net change in unrealized appreciation/depreciation
on investments and foreign currency translations | | | (46,665,494 | ) | | | (40,122,523 | ) | | | (47,022,078 | ) | |
Net realized/unrealized gains (losses) on investments | | | 857,484 | | | | (3,330,351 | ) | | | 4,528,294 | | |
Change in net assets resulting from operations | | $ | 1,180,679 | | | $ | (2,152,435 | ) | | $ | 6,109,822 | | |
See notes to financial statements.
18
Victory Portfolios | | Statements of Operations
For the Six Months Ended June 30, 2018 | |
(Unaudited)
| | | Victory
RS Investors
Fund | | Victory
Global Natural
Resources
Fund | |
Investment Income: | |
Dividend income | | $ | 187,147 | | | $ | 4,781,393 | | |
Interest income | | | 5,759 | | | | 505,340 | | |
Securities lending income | | | 3,588 | | | | 259,905 | | |
Foreign tax withholding | | | — | | | | (501,622 | ) | |
Total Income | | | 196,494 | | | | 5,045,016 | | |
Expenses: | |
Investment advisory fees | | | 271,337 | | | | 6,563,670 | | |
Administration fees | | | 16,024 | | | | 386,080 | | |
12b-1 fees — Class A Shares | | | 24,107 | | | | 307,653 | | |
12b-1 fees — Class C Shares | | | 51,579 | | | | 87,409 | | |
12b-1 fees — Class R Shares | | | 3,356 | | | | 5,893 | | |
Custodian fees | | | 1,111 | | | | 40,270 | | |
Transfer agent fees | | | 3,182 | | | | 60,919 | | |
Transfer agent fees — Class A Shares | | | 11,857 | | | | 204,339 | | |
Transfer agent fees — Class C Shares | | | 6,399 | | | | 15,025 | | |
Transfer agent fees — Class R Shares | | | 1,292 | | | | 1,724 | | |
Transfer agent fees — Class Y Shares | | | 16,848 | | | | 466,870 | | |
Trustees' fees | | | 2,307 | | | | 52,665 | | |
Chief Compliance Officer fees | | | 224 | | | | 5,198 | | |
Legal and audit fees | | | 7,468 | | | | 56,144 | | |
State registration and filing fees | | | 30,572 | | | | 46,156 | | |
Other expenses | | | 8,092 | | | | 74,836 | | |
Total Expenses | | | 455,755 | | | | 8,374,851 | | |
Expenses waived/reimbursed by Adviser | | | (85,570 | ) | | | (317,740 | ) | |
Net Expenses | | | 370,185 | | | | 8,057,111 | | |
Net Investment Income (Loss) | | | (173,691 | ) | | | (3,012,095 | ) | |
Realized/Unrealized Gains (Losses) from
Investment Transactions: | |
Net realized gains (losses) from investment transactions and
foreign currency translations | | | 4,057,806 | | | | (27,594,273 | ) | |
Net change in unrealized appreciation/depreciation on investments
and foreign currency translations | | | (3,448,871 | ) | | | 8,730,680 | | |
Net realized/unrealized gains (losses) on investments | | | 608,935 | | | | (18,863,593 | ) | |
Change in net assets resulting from operations | | $ | 435,244 | | | $ | (21,875,688 | ) | |
See notes to financial statements.
19
Victory Portfolios | | Statements of Changes in Net Assets | |
| | | Victory RS Partners
Fund | | Victory RS Value
Fund | | Victory RS Large Cap Alpha
Fund | |
| | | Six
Months
Ended
June 30,
2018 | | Year
Ended
December 31,
2017 | | Six
Months
Ended
June 30,
2018 | | Year
Ended
December 31,
2017 | | Six
Months
Ended
June 30,
2018 | | Year
Ended
December 31,
2017 | |
| | | (Unaudited) | | | | (Unaudited) | | | | (Unaudited) | | | |
From Investment Activities: | |
Operations: | |
Net investment
income (loss) | | $ | 323,195 | | | $ | (2,666,762 | ) | | $ | 1,177,916 | | | $ | 674,698 | | | $ | 1,581,528 | | | $ | 3,870,090 | | |
Net realized gains
(losses) from
investment
transactions | | | 47,522,978 | | | | 95,849,751 | | | | 36,792,172 | | | | 91,362,245 | | | | 51,550,372 | | | | 63,181,719 | | |
Net change in
unrealized
appreciation/
depreciation
on investments | | | (46,665,494 | ) | | | (1,930,817 | ) | | | (40,122,523 | ) | | | (6,815,039 | ) | | | (47,022,078 | ) | | | 33,189,053 | | |
Change in net assets resulting
from operations | | | 1,180,679 | | | | 91,252,172 | | | | (2,152,435 | ) | | | 85,221,904 | | | | 6,109,822 | | | | 100,240,862 | | |
Distributions to Shareholders: | |
From net investment
income: | |
Class A Shares | | | — | | | | — | | | | — | | | | (370,126 | ) | | | — | | | | (39,112 | ) | |
Class Y Shares | | | — | | | | — | | | | — | | | | (981,896 | ) | | | — | | | | (67,960 | ) | |
From net realized gains: | |
Class A Shares | | | — | | | | (50,359,167 | ) | | | — | | | | (48,912,432 | ) | | | — | | | | (41,971,815 | ) | |
Class C Shares | | | — | | | | — | | | | — | | | | (3,813,181 | ) | | | — | | | | (2,617,170 | ) | |
Class R Shares | | | — | | | | (440,838 | ) | | | — | | | | (338,056 | ) | | | — | | | | (793,543 | ) | |
Class Y Shares | | | — | | | | (65,199,804 | ) | | | — | | | | (49,520,081 | ) | | | — | | | | (2,643,367 | ) | |
Change in net assets resulting
from distributions to
shareholders | | | — | | | | (115,999,809 | ) | | | — | | | | (103,935,772 | ) | | | — | | | | (48,132,967 | ) | |
Change in net assets resulting
from capital transactions | | | (55,253,244 | ) | | | (124,431,017 | ) | | | (48,126,920 | ) | | | (26,633,183 | ) | | | (38,566,210 | ) | | | (31,573,989 | ) | |
Change in net assets | | | (54,072,565 | ) | | | (149,178,654 | ) | | | (50,279,355 | ) | | | (45,347,051 | ) | | | (32,456,388 | ) | | | 20,533,906 | | |
Net Assets: | |
Beginning of period | | | 610,239,749 | | | | 759,418,403 | | | | 506,062,760 | | | | 551,409,811 | | | | 614,399,958 | | | | 593,866,052 | | |
End of period | | $ | 556,167,184 | | | $ | 610,239,749 | | | $ | 455,783,405 | | | $ | 506,062,760 | | | $ | 581,943,570 | | | $ | 614,399,958 | | |
Accumulated net investment
income (loss) | | $ | 323,195 | | | $ | — | | | $ | 1,177,916 | | | $ | — | | | $ | 5,939,176 | | | $ | 4,357,648 | | |
(continues on next page)
See notes to financial statements.
20
Victory Portfolios | | Statements of Changes in Net Assets | |
(continued)
| | | Victory RS Partners
Fund | | Victory RS Value
Fund | | Victory RS Large Cap Alpha
Fund | |
| | | Six
Months
Ended
June 30,
2018 | | Year
Ended
December 31,
2017 | | Six
Months
Ended
June 30,
2018 | | Year
Ended
December 31,
2017 | | Six
Months
Ended
June 30,
2018 | | Year
Ended
December 31,
2017 | |
| | | (Unaudited) | | | | (Unaudited) | | | | (Unaudited) | | | |
Capital Transactions: | |
Class A Shares | |
Proceeds from
shares issued | | $ | 5,628,157 | | | $ | 27,816,168 | | | $ | 8,041,393 | | | $ | 15,791,674 | | | $ | 13,763,165 | | | $ | 17,381,089 | | |
Distributions reinvested | | | — | | | | 49,467,795 | | | | — | | | | 47,583,328 | | | | — | | | | 40,852,487 | | |
Cost of shares redeemed | | | (32,134,524 | ) | | | (187,960,196 | ) | | | (26,471,107 | ) | | | (83,696,511 | ) | | | (39,265,697 | ) | | | (86,332,344 | ) | |
Total Class A Shares | | $ | (26,506,367 | ) | | $ | (110,676,233 | ) | | $ | (18,429,714 | ) | | $ | (20,321,509 | ) | | $ | (25,502,532 | ) | | $ | (28,098,768 | ) | |
Class C Shares | |
Proceeds from
shares issued | | $ | — | | | $ | — | | | $ | 499,186 | | | $ | 856,132 | | | $ | 1,535,145 | | | $ | 1,727,822 | | |
Distributions reinvested | | | — | | | | — | | | | — | | | | 3,617,282 | | | | — | | | | 2,463,458 | | |
Cost of shares redeemed | | | — | | | | — | | | | (4,189,259 | ) | | | (6,543,062 | ) | | | (7,190,080 | ) | | | (5,288,644 | ) | |
Total Class C Shares | | $ | — | | | $ | — | | | $ | (3,690,073 | ) | | $ | (2,069,648 | ) | | $ | (5,654,935 | ) | | $ | (1,097,364 | ) | |
Class R Shares | |
Proceeds from
shares issued | | $ | 110,637 | | | $ | 458,817 | | | $ | 129,943 | | | $ | 228,630 | | | $ | 661,232 | | | $ | 1,980,973 | | |
Distributions reinvested | | | — | | | | 440,838 | | | | — | | | | 338,056 | | | | — | | | | 769,813 | | |
Cost of shares redeemed | | | (195,239 | ) | | | (1,085,034 | ) | | | (341,297 | ) | | | (535,254 | ) | | | (1,858,471 | ) | | | (4,096,155 | ) | |
Total Class R Shares | | $ | (84,602 | ) | | $ | (185,379 | ) | | $ | (211,354 | ) | | $ | 31,432 | | | $ | (1,197,239 | ) | | $ | (1,345,369 | ) | |
Class Y Shares | |
Proceeds from
shares issued | | $ | 16,735,828 | | | $ | 138,140,587 | | | $ | 7,972,523 | | | $ | 34,306,548 | | | $ | 3,275,663 | | | $ | 11,952,380 | | |
Distributions reinvested | | | — | | | | 64,075,032 | | | | — | | | | 48,632,714 | | | | — | | | | 2,311,482 | | |
Cost of shares redeemed | | | (45,398,103 | ) | | | (215,785,024 | ) | | | (33,768,302 | ) | | | (87,212,720 | ) | | | (9,487,167 | ) | | | (15,296,350 | ) | |
Total Class Y Shares | | $ | (28,662,275 | ) | | $ | (13,569,405 | ) | | $ | (25,795,779 | ) | | $ | (4,273,458 | ) | | $ | (6,211,504 | ) | | $ | (1,032,488 | ) | |
Change in net assets resulting
from capital transactions | | $ | (55,253,244 | ) | | $ | (124,431,017 | ) | | $ | (48,126,920 | ) | | $ | (26,633,183 | ) | | $ | (38,566,210 | ) | | $ | (31,573,989 | ) | |
(continues on next page)
See notes to financial statements.
21
Victory Portfolios | | Statements of Changes in Net Assets | |
(continued)
| | | Victory RS Partners
Fund | | Victory RS Value
Fund | | Victory RS Large Cap Alpha
Fund | |
| | | Six
Months
Ended
June 30,
2018 | | Year
Ended
December 31,
2017 | | Six
Months
Ended
June 30,
2018 | | Year
Ended
December 31,
2017 | | Six
Months
Ended
June 30,
2018 | | Year
Ended
December 31,
2017 | |
| | | (Unaudited) | | | | (Unaudited) | | | | (Unaudited) | | | |
Share Transactions: | |
Class A Shares | |
Issued | | | 193,298 | | | | 857,483 | | | | 303,853 | | | | 524,665 | | | | 239,621 | | | | 312,670 | | |
Reinvested | | | — | | | | 1,683,722 | | | | — | | | | 1,820,975 | | | | — | | | | 724,203 | | |
Redeemed | | | (1,101,130 | ) | | | (5,664,163 | ) | | | (1,006,986 | ) | | | (2,816,929 | ) | | | (682,460 | ) | | | (1,560,715 | ) | |
Total Class A Shares | | | (907,832 | ) | | | (3,122,958 | ) | | | (703,133 | ) | | | (471,289 | ) | | | (442,839 | ) | | | (523,842 | ) | |
Class C Shares | |
Issued | | | — | | | | — | | | | 21,043 | | | | 31,786 | | | | 30,907 | | | | 35,274 | | |
Reinvested | | | — | | | | — | | | | — | | | | 152,886 | | | | — | | | | 49,940 | | |
Redeemed | | | — | | | | — | | | | (176,738 | ) | | | (239,348 | ) | | | (144,066 | ) | | | (106,918 | ) | |
Total Class C Shares | | | — | | | | — | | | | (155,695 | ) | | | (54,676 | ) | | | (113,159 | ) | | | (21,704 | ) | |
Class R Shares | |
Issued | | | 4,093 | | | | 14,827 | | | | 5,186 | | | | 7,830 | | | | 11,611 | | | | 36,154 | | |
Reinvested | | | — | | | | 16,178 | | | | — | | | | 13,549 | | | | — | | | | 13,710 | | |
Redeemed | | | (7,215 | ) | | | (33,182 | ) | | | (13,761 | ) | | | (18,308 | ) | | | (32,747 | ) | | | (73,440 | ) | |
Total Class R Shares | | | (3,122 | ) | | | (2,177 | ) | | | (8,575 | ) | | | 3,071 | | | | (21,136 | ) | | | (23,576 | ) | |
Class Y Shares | |
Issued | | | 544,942 | | | | 4,029,215 | | | | 297,355 | | | | 1,152,281 | | | | 57,038 | | | | 217,438 | | |
Reinvested | | | — | | | | 2,077,660 | | | | — | | | | 1,817,340 | | | | — | | | | 41,059 | | |
Redeemed | | | (1,476,442 | ) | | | (6,276,480 | ) | | | (1,255,482 | ) | | | (2,905,983 | ) | | | (164,460 | ) | | | (278,284 | ) | |
Total Class Y Shares | | | (931,500 | ) | | | (169,605 | ) | | | (958,127 | ) | | | 63,638 | | | | (107,422 | ) | | | (19,787 | ) | |
Change in Shares | | | (1,842,454 | ) | | | (3,294,740 | ) | | | (1,825,530 | ) | | | (459,256 | ) | | | (684,556 | ) | | | (588,909 | ) | |
See notes to financial statements.
22
Victory Portfolios | | Statements of Changes in Net Assets | |
| | | Victory RS Investors
Fund | | Victory Global Natural Resources
Fund | |
| | | Six
Months
Ended
June 30,
2018 | | Year
Ended
December 31,
2017 | | Six
Months
Ended
June 30,
2018 | | Year
Ended
December 31,
2017 | |
| | | (Unaudited) | | | | (Unaudited) | | | |
From Investment Activities: | |
Operations: | |
Net investment income (loss) | | $ | (173,691 | ) | | $ | (168,319 | ) | | $ | (3,012,095 | ) | | $ | (10,674,097 | ) | |
Net realized gains (losses)
from investment
transactions | | | 4,057,806 | | | | 16,847,020 | | | | (27,594,273 | ) | | | (111,929,288 | ) | |
Net change in unrealized
appreciation/depreciation
on investments | | | (3,448,871 | ) | | | (4,331,652 | ) | | | 8,730,680 | | | | 132,782,374 | | |
Change in net assets resulting
from operations | | | 435,244 | | | | 12,347,049 | | | | (21,875,688 | ) | | | 10,178,989 | | |
Distributions to Shareholders: | |
From net realized gains: | |
Class A Shares | | | — | | | | (2,732,575 | ) | | | — | | | | — | | |
Class C Shares | | | — | | | | (1,649,923 | ) | | | — | | | | — | | |
Class R Shares | | | — | | | | (187,011 | ) | | | — | | | | — | | |
Class Y Shares | | | — | | | | (5,262,110 | ) | | | — | | | | — | | |
Change in net assets resulting from
distributions to shareholders | | | — | | | | (9,831,619 | ) | | | — | | | | — | | |
Change in net assets resulting from
capital transactions | | | (11,104,502 | ) | | | (36,302,592 | ) | | | (100,504,700 | ) | | | (479,524,465 | ) | |
Change in net assets | | | (10,669,258 | ) | | | (33,787,162 | ) | | | (122,380,388 | ) | | | (469,345,476 | ) | |
Net Assets: | |
Beginning of period | | | 60,078,364 | | | | 93,865,526 | | | | 1,411,856,855 | | | | 1,881,202,331 | | |
End of period | | $ | 49,409,106 | | | $ | 60,078,364 | | | $ | 1,289,476,467 | | | $ | 1,411,856,855 | | |
Accumulated net investment
income (loss) | | $ | (173,691 | ) | | $ | — | | | $ | (3,197,984 | ) | | $ | (185,889 | ) | |
(continues on next page)
See notes to financial statements.
23
Victory Portfolios | | Statements of Changes in Net Assets | |
(continued)
| | | Victory RS Investors
Fund | | Victory Global Natural Resources
Fund | |
| | | Six
Months
Ended
June 30,
2018 | | Year
Ended
December 31,
2017 | | Six
Months
Ended
June 30,
2018 | | Year
Ended
December 31,
2017 | |
| | | (Unaudited) | | | | (Unaudited) | | | |
Capital Transactions: | |
Class A Shares | |
Proceeds from shares issued | | $ | 776,144 | | | $ | 950,600 | | | $ | 35,838,721 | | | $ | 43,819,672 | | |
Distributions reinvested | | | — | | | | 2,613,392 | | | | — | | | | — | | |
Cost of shares redeemed | | | (2,893,877 | ) | | | (11,890,167 | ) | | | (49,916,675 | ) | | | (326,648,803 | ) | |
Total Class A Shares | | $ | (2,117,733 | ) | | $ | (8,326,175 | ) | | $ | (14,077,954 | ) | | $ | (282,829,131 | ) | |
Class C Shares | |
Proceeds from shares issued | | $ | 205,596 | | | $ | 692,749 | | | $ | 438,499 | | | $ | 1,115,478 | | |
Distributions reinvested | | | — | | | | 1,406,731 | | | | — | | | | — | | |
Cost of shares redeemed | | | (1,994,876 | ) | | | (5,632,510 | ) | | | (3,887,232 | ) | | | (11,146,974 | ) | |
Total Class C Shares | | $ | (1,789,280 | ) | | $ | (3,533,030 | ) | | $ | (3,448,733 | ) | | $ | (10,031,496 | ) | |
Class R Shares | |
Proceeds from shares issued | | $ | 69,931 | | | $ | 353,328 | | | $ | 329,539 | | | $ | 573,574 | | |
Distributions reinvested | | | — | | | | 187,011 | | | | — | | | | — | | |
Cost of shares redeemed | | | (133,841 | ) | | | (484,294 | ) | | | (408,873 | ) | | | (2,799,009 | ) | |
Total Class R Shares | | $ | (63,910 | ) | | $ | 56,045 | | | $ | (79,334 | ) | | $ | (2,225,435 | ) | |
Class Y Shares | |
Proceeds from shares issued | | $ | 946,825 | | | $ | 7,489,738 | | | $ | 135,464,902 | | | $ | 259,295,341 | | |
Distributions reinvested | | | — | | | | 3,173,837 | | | | — | | | | — | | |
Cost of shares redeemed | | | (8,080,404 | ) | | | (35,163,007 | ) | | | (218,363,581 | ) | | | (443,733,744 | ) | |
Total Class Y Shares | | $ | (7,133,579 | ) | | $ | (24,499,432 | ) | | $ | (82,898,679 | ) | | $ | (184,438,403 | ) | |
Change in net assets resulting
from capital transactions | | $ | (11,104,502 | ) | | $ | (36,302,592 | ) | | $ | (100,504,700 | ) | | $ | (479,524,465 | ) | |
Share Transactions: | |
Class A Shares | |
Issued | | | 56,410 | | | | 66,635 | | | | 1,517,300 | | | | 1,875,836 | | |
Reinvested | | | — | | | | 185,542 | | | | — | | | | — | | |
Redeemed | | | (207,932 | ) | | | (831,562 | ) | | | (2,191,676 | ) | | | (14,049,152 | ) | |
Total Class A Shares | | | (151,522 | ) | | | (579,385 | ) | | | (674,376 | ) | | | (12,173,316 | ) | |
Class C Shares | |
Issued | | | 16,466 | | | | 53,033 | | | | 21,341 | | | | 52,334 | | |
Reinvested | | | — | | | | 108,732 | | | | — | | | | — | | |
Redeemed | | | (157,620 | ) | | | (423,002 | ) | | | (186,528 | ) | | | (534,322 | ) | |
Total Class C Shares | | | (141,154 | ) | | | (261,237 | ) | | | (165,187 | ) | | | (481,988 | ) | |
Class R Shares | |
Issued | | | 5,445 | | | | 26,464 | | | | 15,373 | | | | 25,907 | | |
Reinvested | | | — | | | | 14,318 | | | | — | | | | — | | |
Redeemed | | | (10,537 | ) | | | (35,596 | ) | | | (19,317 | ) | | | (123,330 | ) | |
Total Class R Shares | | | (5,092 | ) | | | 5,186 | | | | (3,944 | ) | | | (97,423 | ) | |
Class Y Shares | |
Issued | | | 66,192 | | | | 518,463 | | | | 5,745,734 | | | | 10,892,838 | | |
Reinvested | | | — | | | | 221,600 | | | | — | | | | — | | |
Redeemed | | | (576,007 | ) | | | (2,434,445 | ) | | | (9,248,877 | ) | | | (18,659,862 | ) | |
Total Class Y Shares | | | (509,815 | ) | | | (1,694,382 | ) | | | (3,503,143 | ) | | | (7,767,024 | ) | |
Change in Shares | | | (807,583 | ) | | | (2,529,818 | ) | | | (4,346,650 | ) | | | (20,519,751 | ) | |
See notes to financial statements.
24
Victory Portfolios | | Financial Highlights | |
For a Share Outstanding Throughout Each Period
| | | Victory RS Partners Fund | |
| | | Class A Shares | |
| | | Six
Months
Ended
June 30,
2018 | | Year
Ended
December 31,
2017 | | Year
Ended
December 31,
2016 | | Year
Ended
December 31,
2015 | | Year
Ended
December 31,
2014 | | Year
Ended
December 31,
2013 | |
| | | (Unaudited) | | | | | | | | | | | |
Net Asset Value, Beginning of Period | | $ | 29.21 | | | $ | 31.58 | | | $ | 26.89 | | | $ | 31.08 | | | $ | 40.09 | | | $ | 31.93 | | |
Investment Activities: | |
Net investment income (loss) | | | (0.01 | )(a) | | | (0.25 | )(a) | | | (0.12 | )(a) | | | (0.11 | )(a) | | | (0.14 | )(a) | | | (0.15 | ) | |
Net realized and unrealized
gains (losses) on
investments | | | 0.04 | | | | 4.78 | | | | 6.59 | | | | (3.22 | ) | | | (1.52 | ) | | | 13.48 | | |
Total from Investment
Activities | | | 0.03 | | | | 4.53 | | | | 6.47 | | | | (3.33 | ) | | | (1.66 | ) | | | 13.33 | | |
Distributions to Shareholders: | |
Net realized gains
from investments | | | — | | | | (6.90 | ) | | | (1.78 | ) | | | (0.86 | ) | | | (7.35 | ) | | | (5.17 | ) | |
Total Distributions to
Shareholders | | | — | | | | (6.90 | ) | | | (1.78 | ) | | | (0.86 | ) | | | (7.35 | ) | | | (5.17 | ) | |
Net Asset Value, End of Period | | $ | 29.24 | | | $ | 29.21 | | | $ | 31.58 | | | $ | 26.89 | | | $ | 31.08 | | | $ | 40.09 | | |
Total Return (excludes sales
charge) (b) | | | 0.10 | % | | | 14.21 | % | | | 24.04 | % | | | (10.74 | )% | | | (3.85 | )% | | | 42.15 | % | |
Ratios/Supplemental Data: | |
Net Assets at end of period (000) | | $ | 232,774 | | | $ | 259,050 | | | $ | 378,695 | | | $ | 475,722 | | | $ | 827,108 | | | $ | 1,335,819 | | |
Ratio of net expenses to average
net assets (c) | | | 1.45 | % | | | 1.45 | % | | | 1.45 | % | | | 1.42 | % | | | 1.45 | % | | | 1.45 | % | |
Ratio of net investment income (loss)
to average net assets (c) | | | (0.08 | )% | | | (0.75 | )% | | | (0.44 | )% | | | (0.35 | )% | | | (0.35 | )% | | | (0.39 | )% | |
Ratio of gross expenses to average
net assets (c) (d) | | | 1.53 | % | | | 1.50 | % | | | 1.53 | % | | | 1.42 | % | | | 1.55 | % | | | 1.51 | % | |
Portfolio turnover (b) (e) | | | 33 | % | | | 38 | % | | | 60 | % | | | 42 | % | | | 47 | % | | | 49 | % | |
(a) Per share net investment income (loss) has been calculated using the average daily shares method.
(b) Not annualized for periods less than one year.
(c) Annualized for periods less than one year.
(d) During the period, certain fees were reduced and/or reimbursed. If such fee reductions and/or reimbursements had not occurred, the ratios would have been as indicated.
(e) Portfolio turnover is calculated on the basis of the Fund as a whole without distinguishing between the classes of shares issued.
See notes to financial statements.
25
Victory Portfolios | | Financial Highlights — continued | |
For a Share Outstanding Throughout Each Period
| | | Victory RS Partners Fund | |
| | | Class R Shares | |
| | | Six
Months
Ended
June 30,
2018 | | Year
Ended
December 31,
2017 | | Year
Ended
December 31,
2016 | | Year
Ended
December 31,
2015 | | Year
Ended
December 31,
2014 | | Year
Ended
December 31,
2013 | |
| | | (Unaudited) | | | | | | | | | | | |
Net Asset Value, Beginning of Period | | $ | 27.09 | | | $ | 29.84 | | | $ | 25.57 | | | $ | 29.72 | | | $ | 38.82 | | | $ | 31.14 | | |
Investment Activities: | |
Net investment income (loss) | | | (0.06 | )(a) | | | (0.44 | )(a) | | | (0.21 | )(a) | | | (0.21 | )(a) | | | (0.25 | )(a) | | | (0.18 | ) | |
Net realized and unrealized
gains (losses) on
investments | | | 0.04 | | | | 4.59 | | | | 6.26 | | | | (3.08 | ) | | | (1.50 | ) | | | 13.03 | | |
Total from Investment
Activities | | | (0.02 | ) | | | 4.15 | | | | 6.05 | | | | (3.29 | ) | | | (1.75 | ) | | | 12.85 | | |
Distributions to Shareholders: | |
Net realized gains
from investments | | | — | | | | (6.90 | ) | | | (1.78 | ) | | | (0.86 | ) | | | (7.35 | ) | | | (5.17 | ) | |
Total Distributions to
Shareholders | | | — | | | | (6.90 | ) | | | (1.78 | ) | | | (0.86 | ) | | | (7.35 | ) | | | (5.17 | ) | |
Net Asset Value, End of Period | | $ | 27.07 | | | $ | 27.09 | | | $ | 29.84 | | | $ | 25.57 | | | $ | 29.72 | | | $ | 38.82 | | |
Total Return (b) | | | (0.11 | )% | | | 13.81 | % | | | 23.64 | % | | | (11.09 | )% | | | (4.21 | )% | | | 41.68 | % | |
Ratios/Supplemental Data: | |
Net Assets at end of period (000) | | $ | 2,082 | | | $ | 2,168 | | | $ | 2,452 | | | $ | 2,365 | | | $ | 4,321 | | | $ | 4,920 | | |
Ratio of net expenses to average
net assets (c) | | | 1.81 | % | | | 1.81 | % | | | 1.81 | % | | | 1.81 | % | | | 1.80 | % | | | 1.79 | % | |
Ratio of net investment income (loss)
to average net assets (c) | | | (0.43 | )% | | | (1.40 | )% | | | (0.78 | )% | | | (0.74 | )% | | | (0.66 | )% | | | (0.73 | )% | |
Ratio of gross expenses to average
net assets (c) (d) | | | 2.36 | % | | | 2.28 | % | | | 1.81 | % | | | 1.81 | % | | | 1.88 | % | | | 1.85 | % | |
Portfolio turnover (b) (e) | | | 33 | % | | | 38 | % | | | 60 | % | | | 42 | % | | | 47 | % | | | 49 | % | |
(a) Per share net investment income (loss) has been calculated using the average daily shares method.
(b) Not annualized for periods less than one year.
(c) Annualized for periods less than one year.
(d) During the period, certain fees were reduced and/or reimbursed. If such fee reductions and/or reimbursements had not occurred, the ratios would have been as indicated.
(e) Portfolio turnover is calculated on the basis of the Fund as a whole without distinguishing between the classes of shares issued.
See notes to financial statements.
26
Victory Portfolios | | Financial Highlights — continued | |
For a Share Outstanding Throughout Each Period
| | | Victory RS Partners Fund | |
| | | Class Y Shares | |
| | | Six
Months
Ended
June 30,
2018 | | Year
Ended
December 31,
2017 | | Year
Ended
December 31,
2016 | | Year
Ended
December 31,
2015 | | Year
Ended
December 31,
2014 | | Year
Ended
December 31,
2013 | |
| | | (Unaudited) | | | | | | | | | | | |
Net Asset Value, Beginning of Period | | $ | 30.67 | | | $ | 32.75 | | | $ | 27.75 | | | $ | 31.95 | | | $ | 40.86 | | | $ | 32.38 | | |
Investment Activities: | |
Net investment income (loss) | | | 0.04 | (a) | | | (0.04 | )(a) | | | (0.03 | )(a) | | | (0.02 | )(a) | | | 0.01 | (a) | | | (0.06 | ) | |
Net realized and unrealized
gains (losses) on
investments | | | 0.04 | | | | 4.86 | | | | 6.81 | | | | (3.32 | ) | | | (1.57 | ) | | | 13.75 | | |
Total from Investment
Activities | | | 0.08 | | | | 4.82 | | | | 6.78 | | | | (3.34 | ) | | | (1.56 | ) | | | 13.69 | | |
Distributions to Shareholders: | |
Net investment income | | | — | | | | — | | | | — | | | | — | | | | — | | | | (0.04 | ) | |
Net realized gains
from investments | | | — | | | | (6.90 | ) | | | (1.78 | ) | | | (0.86 | ) | | | (7.35 | ) | | | (5.17 | ) | |
Total Distributions to
Shareholders | | | — | | | | (6.90 | ) | | | (1.78 | ) | | | (0.86 | ) | | | (7.35 | ) | | | (5.21 | ) | |
Net Asset Value, End of Period | | $ | 30.75 | | | $ | 30.67 | | | $ | 32.75 | | | $ | 27.75 | | | $ | 31.95 | | | $ | 40.86 | | |
Total Return (b) | | | 0.26 | % | | | 14.59 | % | | | 24.41 | % | | | (10.47 | )% | | | (3.53 | )% | | | 42.68 | % | |
Ratios/Supplemental Data: | |
Net Assets at end of period (000) | | $ | 321,311 | | | $ | 349,022 | | | $ | 378,271 | | | $ | 542,595 | | | $ | 903,833 | | | $ | 969,934 | | |
Ratio of net expenses to average
net assets (c) | | | 1.12 | % | | | 1.12 | % | | | 1.12 | % | | | 1.12 | % | | | 1.11 | % | | | 1.11 | % | |
Ratio of net investment income
(loss) to average net assets (c) | | | 0.26 | % | | | (0.11 | )% | | | (0.11 | )% | | | (0.05 | )% | | | 0.04 | % | | | (0.04 | )% | |
Ratio of gross expenses to average
net assets (c) (d) | | | 1.19 | % | | | 1.21 | % | | | 1.22 | % | | | 1.18 | % | | | 1.18 | % | | | 1.17 | % | |
Portfolio turnover (b) (e) | | | 33 | % | | | 38 | % | | | 60 | % | | | 42 | % | | | 47 | % | | | 49 | % | |
(a) Per share net investment income (loss) has been calculated using the average daily shares method.
(b) Not annualized for periods less than one year.
(c) Annualized for periods less than one year.
(d) During the period, certain fees were reduced and/or reimbursed. If such fee reductions and/or reimbursements had not occurred, the ratios would have been as indicated.
(e) Portfolio turnover is calculated on the basis of the Fund as a whole without distinguishing between the classes of shares issued.
See notes to financial statements.
27
Victory Portfolios | | Financial Highlights | |
For a Share Outstanding Throughout Each Period
| | | Victory RS Value Fund | |
| | | Class A Shares | |
| | | Six
Months
Ended
June 30,
2018 | | Year
Ended
December 31,
2017 | | Year
Ended
December 31,
2016 | | Year
Ended
December 31,
2015 | | Year
Ended
December 31,
2014 | | Year
Ended
December 31,
2013 | |
| | | (Unaudited) | | | | | | | | | | | |
Net Asset Value, Beginning of Period | | $ | 26.21 | | | $ | 27.94 | | | $ | 28.33 | | | $ | 33.04 | | | $ | 34.76 | | | $ | 25.93 | | |
Investment Activities: | |
Net investment income (loss) | | | 0.05 | (a) | | | 0.03 | (a) | | | — | (a)(b) | | | (0.08 | )(a) | | | 0.25 | (a) | | | (0.07 | ) | |
Net realized and unrealized
gains (losses) on
investments | | | (0.20 | ) | | | 4.80 | | | | 3.09 | | | | (1.98 | ) | | | 3.71 | | | | 9.82 | | |
Total from Investment
Activities | | | (0.15 | ) | | | 4.83 | | | | 3.09 | | | | (2.06 | ) | | | 3.96 | | | | 9.75 | | |
Distributions to Shareholders: | |
Net investment income | | | — | | | | (0.04 | ) | | | (0.13 | ) | | | — | (b) | | | (0.36 | ) | | | (0.06 | ) | |
Net realized gains
from investments | | | — | | | | (6.52 | ) | | | (3.35 | ) | | | (2.65 | ) | | | (5.32 | ) | | | (0.86 | ) | |
Total Distributions to
Shareholders | | | — | | | | (6.56 | ) | | | (3.48 | ) | | | (2.65 | ) | | | (5.68 | ) | | | (0.92 | ) | |
Capital Contributions from Prior
Custodian, Net (See Note 8) | | | — | | | | — | | | | — | (b) | | | — | | | | — | | | | — | | |
Net Asset Value, End of Period | | $ | 26.06 | | | $ | 26.21 | | | $ | 27.94 | | | $ | 28.33 | | | $ | 33.04 | | | $ | 34.76 | | |
Total Return (excludes sales
charge) (c) | | | (0.57 | )% | | | 17.41 | % | | | 10.92 | %(d) | | | (6.18 | )% | | | 11.60 | % | | | 37.68 | % | |
Ratios/Supplemental Data: | |
Net Assets at end of period (000) | | $ | 220,337 | | | $ | 239,994 | | | $ | 268,979 | | | $ | 352,205 | | | $ | 432,082 | | | $ | 642,364 | | |
Ratio of net expenses to average
net assets (e) | | | 1.30 | % | | | 1.30 | % | | | 1.30 | % | | | 1.26 | % | | | 1.29 | % | | | 1.28 | % | |
Ratio of net investment income (loss)
to average net assets (e) | | | 0.39 | % | | | 0.09 | % | | | (0.01 | )% | | | (0.24 | )% | | | 0.71 | % | | | (0.17 | )% | |
Ratio of gross expenses to average
net assets (e) (f) | | | 1.34 | % | | | 1.33 | % | | | 1.35 | % | | | 1.26 | % | | | 1.35 | % | | | 1.35 | % | |
Portfolio turnover (c) (g) | | | 36 | % | | | 64 | % | | | 67 | % | | | 55 | % | | | 56 | % | | | 48 | % | |
(a) Per share net investment income (loss) has been calculated using the average daily shares method.
(b) Amount is less than $0.005 per share.
(c) Not annualized for periods less than one year.
(d) The Fund received monies related to a non-recurring refund from the prior Custodian. The corresponding impact to the total return was less 0.005% for the period shown. (See Note 8)
(e) Annualized for periods less than one year.
(f) During the period, certain fees were reduced and/or reimbursed. If such fee reductions and/or reimbursements had not occurred, the ratios would have been as indicated.
(g) Portfolio turnover is calculated on the basis of the Fund as a whole without distinguishing between the classes of shares issued.
See notes to financial statements.
28
Victory Portfolios | | Financial Highlights — continued | |
For a Share Outstanding Throughout Each Period
| | | Victory RS Value Fund | |
| | | Class C Shares | |
| | | Six
Months
Ended
June 30,
2018 | | Year
Ended
December 31,
2017 | | Year
Ended
December 31,
2016 | | Year
Ended
December 31,
2015 | | Year
Ended
December 31,
2014 | | Year
Ended
December 31,
2013 | |
| | | (Unaudited) | | | | | | | | | | | |
Net Asset Value, Beginning of Period | | $ | 23.76 | | | $ | 26.01 | | | $ | 26.69 | | | $ | 31.54 | | | $ | 33.47 | | | $ | 25.13 | | |
Investment Activities: | |
Net investment income (loss) | | | (0.05 | )(a) | | | (0.08 | )(a) | | | (0.21 | )(a) | | | (0.32 | )(a) | | | — | (a)(b) | | | (0.35 | ) | |
Net realized and unrealized
gains (losses) on
investments | | | (0.17 | ) | | | 4.35 | | | | 2.88 | | | | (1.88 | ) | | | 3.52 | | | | 9.55 | | |
Total from Investment
Activities | | | (0.22 | ) | | | 4.27 | | | | 2.67 | | | | (2.20 | ) | | | 3.52 | | | | 9.20 | | |
Distributions to Shareholders: | |
Net investment income | | | — | | | | — | | | | — | | | | — | | | | (0.13 | ) | | | — | | |
Net realized gains
from investments | | | — | | | | (6.52 | ) | | | (3.35 | ) | | | (2.65 | ) | | | (5.32 | ) | | | (0.86 | ) | |
Total Distributions to
Shareholders | | | — | | | | (6.52 | ) | | | (3.35 | ) | | | (2.65 | ) | | | (5.45 | ) | | | (0.86 | ) | |
Capital Contributions from Prior
Custodian, Net (See Note 8) | | | — | | | | — | | | | — | (b) | | | — | | | | — | | | | — | | |
Net Asset Value, End of Period | | $ | 23.54 | | | $ | 23.76 | | | $ | 26.01 | | | $ | 26.69 | | | $ | 31.54 | | | $ | 33.47 | | |
Total Return (excludes contingent
deferred sales charge) (c) | | | (0.93 | )% | | | 16.53 | % | | | 10.01 | %(d) | | | (6.92 | )% | | | 10.75 | % | | | 36.69 | % | |
Ratios/Supplemental Data: | |
Net Assets at end of period (000) | | $ | 13,095 | | | $ | 16,916 | | | $ | 19,943 | | | $ | 24,714 | | | $ | 30,568 | | | $ | 30,534 | | |
Ratio of net expenses to average
net assets (e) | | | 2.07 | % | | | 2.07 | % | | | 2.07 | % | | | 2.04 | % | | | 2.06 | % | | | 2.03 | % | |
Ratio of net investment income (loss)
to average net assets (e) | | | (0.44 | )% | | | (0.30 | )% | | | (0.78 | )% | | | (1.03 | )% | | | — | %(f) | | | (0.92 | )% | |
Ratio of gross expenses to average
net assets (e) (g) | | | 2.15 | % | | | 2.08 | % | | | 2.13 | % | | | 2.04 | % | | | 2.11 | % | | | 2.11 | % | |
Portfolio turnover (c) (h) | | | 36 | % | | | 64 | % | | | 67 | % | | | 55 | % | | | 56 | % | | | 48 | % | |
(a) Per share net investment income (loss) has been calculated using the average daily shares method.
(b) Amount is less than $0.005 per share.
(c) Not annualized for periods less than one year.
(d) The Fund received monies related to a non-recurring refund from the prior Custodian. The corresponding impact to the total return was less 0.005% for the period shown. (See Note 8)
(e) Annualized for periods less than one year.
(f) Amount is less than 0.005%.
(g) During the period, certain fees were reduced and/or reimbursed. If such fee reductions and/or reimbursements had not occurred, the ratios would have been as indicated.
(h) Portfolio turnover is calculated on the basis of the Fund as a whole without distinguishing between the classes of shares issued.
See notes to financial statements.
29
Victory Portfolios | | Financial Highlights — continued | |
For a Share Outstanding Throughout Each Period
| | | Victory RS Value Fund | |
| | | Class R Shares | |
| | | Six
Months
Ended
June 30,
2018 | | Year
Ended
December 31,
2017 | | Year
Ended
December 31,
2016 | | Year
Ended
December 31,
2015 | | Year
Ended
December 31,
2014 | | Year
Ended
December 31,
2013 | |
| | | (Unaudited) | | | | | | | | | | | |
Net Asset Value, Beginning of Period | | $ | 25.06 | | | $ | 27.03 | | | $ | 27.51 | | | $ | 32.29 | | | $ | 34.15 | | | $ | 25.54 | | |
Investment Activities: | |
Net investment income (loss) | | | — | (a)(b) | | | (0.03 | )(b) | | | (0.09 | )(b) | | | (0.21 | )(b) | | | 0.13 | (b) | | | (0.31 | ) | |
Net realized and unrealized
gains (losses) on
investments | | | (0.19 | ) | | | 4.58 | | | | 2.96 | | | | (1.92 | ) | | | 3.60 | | | | 9.78 | | |
Total from Investment
Activities | | | (0.19 | ) | | | 4.55 | | | | 2.87 | | | | (2.13 | ) | | | 3.73 | | | | 9.47 | | |
Distributions to Shareholders: | |
Net investment income | | | — | | | | — | | | | — | | | | — | | | | (0.27 | ) | | | — | | |
Net realized gains
from investments | | | — | | | | (6.52 | ) | | | (3.35 | ) | | | (2.65 | ) | | | (5.32 | ) | | | (0.86 | ) | |
Total Distributions to
Shareholders | | | — | | | | (6.52 | ) | | | (3.35 | ) | | | (2.65 | ) | | | (5.59 | ) | | | (0.86 | ) | |
Capital Contributions from Prior
Custodian, Net (See Note 8) | | | — | | | | — | | | | — | (a) | | | — | | | | — | | | | — | | |
Net Asset Value, End of Period | | $ | 24.87 | | | $ | 25.06 | | | $ | 27.03 | | | $ | 27.51 | | | $ | 32.29 | | | $ | 34.15 | | |
Total Return (c) | | | (0.76 | )% | | | 16.95 | % | | | 10.45 | %(d) | | | (6.54 | )% | | | 11.15 | % | | | 37.16 | % | |
Ratios/Supplemental Data: | |
Net Assets at end of period (000) | | $ | 1,400 | | | $ | 1,625 | | | $ | 1,670 | | | $ | 3,456 | | | $ | 4,412 | | | $ | 3,948 | | |
Ratio of net expenses to average
net assets (e) | | | 1.69 | % | | | 1.69 | % | | | 1.69 | % | | | 1.65 | % | | | 1.69 | % | | | 1.68 | % | |
Ratio of net investment income (loss)
to average net assets (e) | | | (0.01 | )% | | | (0.11 | )% | | | (0.34 | )% | | | (0.64 | )% | | | 0.37 | % | | | (0.55 | )% | |
Ratio of gross expenses to average
net assets (e) (f) | | | 2.63 | % | | | 2.29 | % | | | 1.80 | % | | | 1.65 | % | | | 1.73 | % | | | 1.70 | % | |
Portfolio turnover (c) (g) | | | 36 | % | | | 64 | % | | | 67 | % | | | 55 | % | | | 56 | % | | | 48 | % | |
(a) Amount is less than $0.005 per share.
(b) Per share net investment income (loss) has been calculated using the average daily shares method.
(c) Not annualized for periods less than one year.
(d) The Fund received monies related to a non-recurring refund from the prior Custodian. The corresponding impact to the total return was less 0.005% for the period shown. (See Note 8)
(e) Annualized for periods less than one year.
(f) During the period, certain fees were reduced and/or reimbursed. If such fee reductions and/or reimbursements had not occurred, the ratios would have been as indicated.
(g) Portfolio turnover is calculated on the basis of the Fund as a whole without distinguishing between the classes of shares issued.
See notes to financial statements.
30
Victory Portfolios | | Financial Highlights — continued | |
For a Share Outstanding Throughout Each Period
| | | Victory RS Value Fund | |
| | | Class Y Shares | |
| | | Six
Months
Ended
June 30,
2018 | | Year
Ended
December 31,
2017 | | Year
Ended
December 31,
2016 | | Year
Ended
December 31,
2015 | | Year
Ended
December 31,
2014 | | Year
Ended
December 31,
2013 | |
| | | (Unaudited) | | | | | | | | | | | |
Net Asset Value, Beginning of Period | | $ | 26.77 | | | $ | 28.40 | | | $ | 28.57 | | | $ | 33.23 | | | $ | 34.99 | | | $ | 26.09 | | |
Investment Activities: | |
Net investment income (loss) | | | 0.09 | (a) | | | 0.06 | (a) | | | 0.08 | (a) | | | (0.02 | )(a) | | | 0.38 | (a) | | | 0.02 | | |
Net realized and unrealized
gains (losses) on
investments | | | (0.20 | ) | | | 4.94 | | | | 3.10 | | | | (1.99 | ) | | | 3.69 | | | | 9.88 | | |
Total from Investment
Activities | | | (0.11 | ) | | | 5.00 | | | | 3.18 | | | | (2.01 | ) | | | 4.07 | | | | 9.90 | | |
Distributions to Shareholders: | |
Net investment income | | | — | | | | (0.11 | ) | | | — | | | | — | | | | (0.51 | ) | | | (0.14 | ) | |
Net realized gains
from investments | | | — | | | | (6.52 | ) | | | (3.35 | ) | | | (2.65 | ) | | | (5.32 | ) | | | (0.86 | ) | |
Total Distributions to
Shareholders | | | — | | | | (6.63 | ) | | | (3.35 | ) | | | (2.65 | ) | | | (5.83 | ) | | | (1.00 | ) | |
Capital Contributions from Prior
Custodian, Net (See Note 8) | | | — | | | | — | | | | — | (b) | | | — | | | | — | | | | — | | |
Net Asset Value, End of Period | | $ | 26.66 | | | $ | 26.77 | | | $ | 28.40 | | | $ | 28.57 | | | $ | 33.23 | | | $ | 34.99 | | |
Total Return (c) | | | (0.41 | )% | | | 17.71 | % | | | 11.14 | %(d) | | | (5.99 | )% | | | 11.85 | % | | | 38.05 | % | |
Ratios/Supplemental Data: | |
Net Assets at end of period (000) | | $ | 220,951 | | | $ | 247,528 | | | $ | 260,818 | | | $ | 724,715 | | | $ | 821,479 | | | $ | 643,582 | | |
Ratio of net expenses to average
net assets (e) | | | 1.02 | % | | | 1.06 | % | | | 1.06 | % | | | 1.06 | % | | | 1.05 | % | | | 1.03 | % | |
Ratio of net investment income (loss)
to average net assets (e) | | | 0.66 | % | | | 0.20 | % | | | 0.26 | % | | | (0.05 | )% | | | 1.05 | % | | | 0.08 | % | |
Ratio of gross expenses to average
net assets (e) (f) | | | 1.02 | % | | | 1.06 | % | | | 1.19 | % | | | 1.11 | % | | | 1.11 | % | | | 1.14 | % | |
Portfolio turnover (c) (g) | | | 36 | % | | | 64 | % | | | 67 | % | | | 55 | % | | | 56 | % | | | 48 | % | |
(a) Per share net investment income (loss) has been calculated using the average daily shares method.
(b) Amount is less than $0.005 per share.
(c) Not annualized for periods less than one year.
(d) The Fund received monies related to a non-recurring refund from the prior Custodian. The corresponding impact to the total return was less 0.005% for the period shown. (See Note 8)
(e) Annualized for periods less than one year.
(f) During the period, certain fees were reduced and/or reimbursed. If such fee reductions and/or reimbursements had not occurred, the ratios would have been as indicated.
(g) Portfolio turnover is calculated on the basis of the Fund as a whole without distinguishing between the classes of shares issued.
See notes to financial statements.
31
Victory Portfolios | | Financial Highlights | |
For a Share Outstanding Throughout Each Period
| | | Victory RS Large Cap Alpha Fund | |
| | | Class A Shares | |
| | | Six
Months
Ended
June 30,
2018 | | Year
Ended
December 31,
2017 | | Year
Ended
December 31,
2016 | | Year
Ended
December 31,
2015 | | Year
Ended
December 31,
2014 | | Year
Ended
December 31,
2013 | |
| | | (Unaudited) | | | | | | | | | | | |
Net Asset Value, Beginning of Period | | $ | 56.61 | | | $ | 51.86 | | | $ | 50.98 | | | $ | 59.25 | | | $ | 59.06 | | | $ | 43.95 | | |
Investment Activities: | |
Net investment income
(loss) (a) | | | 0.16 | | | | 0.38 | | | | 0.40 | | | | 0.50 | | | | 0.55 | | | | 0.45 | | |
Net realized and unrealized
gains (losses) on
investments | | | 0.38 | | | | 9.10 | | | | 4.01 | | | | (1.74 | ) | | | 7.13 | | | | 16.28 | | |
Total from Investment
Activities | | | 0.54 | | | | 9.48 | | | | 4.41 | | | | (1.24 | ) | | | 7.68 | | | | 16.73 | | |
Distributions to Shareholders: | |
Net investment income | | | — | | | | — | (b) | | | (0.42 | ) | | | (0.57 | ) | | | (0.55 | ) | | | (0.47 | ) | |
Net realized gains
from investments | | | — | | | | (4.73 | ) | | | (3.12 | ) | | | (6.46 | ) | | | (6.94 | ) | | | (1.15 | ) | |
Total Distributions to
Shareholders | | | — | | | | (4.73 | ) | | | (3.54 | ) | | | (7.03 | ) | | | (7.49 | ) | | | (1.62 | ) | |
Capital Contributions from Prior
Custodian, Net (See Note 8) | | | — | | | | — | | | | 0.01 | | | | — | | | | — | | | | — | | |
Net Asset Value, End of Period | | $ | 57.15 | | | $ | 56.61 | | | $ | 51.86 | | | $ | 50.98 | | | $ | 59.25 | | | $ | 59.06 | | |
Total Return (excludes sales
charge) (c) | | | 0.95 | % | | | 18.32 | % | | | 8.67 | %(d) | | | (2.03 | )% | | | 13.08 | % | | | 38.17 | % | |
Ratios/Supplemental Data: | |
Net Assets at end of period (000) | | $ | 520,655 | | | $ | 540,762 | | | $ | 522,593 | | | $ | 556,204 | | | $ | 630,654 | | | $ | 618,893 | | |
Ratio of net expenses to average
net assets (e) | | | 0.89 | % | | | 0.89 | % | | | 0.89 | % | | | 0.89 | % | | | 0.92 | % | | | 0.92 | % | |
Ratio of net investment income (loss)
to average net assets (e) | | | 0.56 | % | | | 0.68 | % | | | 0.79 | % | | | 0.86 | % | | | 0.89 | % | | | 0.86 | % | |
Ratio of gross expenses to average
net assets (e) (f) | | | 0.93 | % | | | 0.94 | % | | | 0.92 | % | | | 0.89 | % | | | 0.92 | % | | | 0.92 | % | |
Portfolio turnover (c) (g) | | | 27 | % | | | 55 | % | | | 79 | % | | | 39 | % | | | 60 | % | | | 48 | % | |
(a) Per share net investment income (loss) has been calculated using the average daily shares method.
(b) Amount is less than $0.005 per share.
(c) Not annualized for periods less than one year.
(d) The Fund received monies related to a nonrecurring refund from the prior Custodian. The corresponding impact to the total return was 0.01% for the period shown. (See Note 8)
(e) Annualized for periods less than one year.
(f) During the period, certain fees were reduced and/or reimbursed. If such fee reductions and/or reimbursements had not occurred, the ratios would have been as indicated.
(g) Portfolio turnover is calculated on the basis of the Fund as a whole without distinguishing between the classes of shares issued.
See notes to financial statements.
32
Victory Portfolios | | Financial Highlights — continued | |
For a Share Outstanding Throughout Each Period
| | | Victory RS Large Cap Alpha Fund | |
| | | Class C Shares | |
| | | Six
Months
Ended
June 30,
2018 | | Year
Ended
December 31,
2017 | | Year
Ended
December 31,
2016 | | Year
Ended
December 31,
2015 | | Year
Ended
December 31,
2014 | | Year
Ended
December 31,
2013 | |
| | | (Unaudited) | | | | | | | | | | | |
Net Asset Value, Beginning of Period | | $ | 49.50 | | | $ | 46.22 | | | $ | 45.80 | | | $ | 53.96 | | | $ | 54.43 | | | $ | 40.66 | | |
Investment Activities: | |
Net investment income
(loss) (a) | | | (0.06 | ) | | | (0.04 | ) | | | — | (b) | | | 0.03 | | | | 0.04 | | | | 0.02 | | |
Net realized and unrealized
gains (losses) on
investments | | | 0.33 | | | | 8.05 | | | | 3.57 | | | | (1.58 | ) | | | 6.53 | | | | 15.01 | | |
Total from Investment
Activities | | | 0.27 | | | | 8.01 | | | | 3.57 | | | | (1.55 | ) | | | 6.57 | | | | 15.03 | | |
Distributions to Shareholders: | |
Net investment income | | | — | | | | — | | | | (0.04 | ) | | | (0.15 | ) | | | (0.10 | ) | | | (0.11 | ) | |
Net realized gains
from investments | | | — | | | | (4.73 | ) | | | (3.12 | ) | | | (6.46 | ) | | | (6.94 | ) | | | (1.15 | ) | |
Total Distributions to
Shareholders | | | — | | | | (4.73 | ) | | | (3.16 | ) | | | (6.61 | ) | | | (7.04 | ) | | | (1.26 | ) | |
Capital Contributions from Prior
Custodian, Net (See Note 8) | | | — | | | | — | | | | 0.01 | | | | — | | | | — | | | | — | | |
Net Asset Value, End of Period | | $ | 49.77 | | | $ | 49.50 | | | $ | 46.22 | | | $ | 45.80 | | | $ | 53.96 | | | $ | 54.43 | | |
Total Return (excludes contingent
deferred sales charge) (c) | | | 0.57 | % | | | 17.36 | % | | | 7.80 | %(d) | | | (2.80 | )% | | | 12.15 | % | | | 37.06 | % | |
Ratios/Supplemental Data: | |
Net Assets at end of period (000) | | $ | 24,305 | | | $ | 29,771 | | | $ | 28,801 | | | $ | 33,608 | | | $ | 36,868 | | | $ | 34,506 | | |
Ratio of net expenses to average
net assets (e) | | | 1.69 | % | | | 1.69 | % | | | 1.69 | % | | | 1.69 | % | | | 1.73 | % | | | 1.74 | % | |
Ratio of net investment income (loss)
to average net assets (e) | | | (0.25 | )% | | | (0.08 | )% | | | (0.01 | )% | | | 0.06 | % | | | 0.08 | % | | | 0.04 | % | |
Ratio of gross expenses to average
net assets (e) (f) | | | 1.75 | % | | | 1.71 | % | | | 1.71 | % | | | 1.69 | % | | | 1.73 | % | | | 1.74 | % | |
Portfolio turnover (c) (g) | | | 27 | % | | | 55 | % | | | 79 | % | | | 39 | % | | | 60 | % | | | 48 | % | |
(a) Per share net investment income (loss) has been calculated using the average daily shares method.
(b) Amount is less than $0.005 per share.
(c) Not annualized for periods less than one year.
(d) The Fund received monies related to a nonrecurring refund from the prior Custodian. The corresponding impact to the total return was 0.01% for the period shown. (See Note 8)
(e) Annualized for periods less than one year.
(f) During the period, certain fees were reduced and/or reimbursed. If such fee reductions and/or reimbursements had not occurred, the ratios would have been as indicated.
(g) Portfolio turnover is calculated on the basis of the Fund as a whole without distinguishing between the classes of shares issued.
See notes to financial statements.
33
Victory Portfolios | | Financial Highlights — continued | |
For a Share Outstanding Throughout Each Period
| | | Victory RS Large Cap Alpha Fund | |
| | | Class R Shares | |
| | | Six
Months
Ended
June 30,
2018 | | Year
Ended
December 31,
2017 | | Year
Ended
December 31,
2016 | | Year
Ended
December 31,
2015 | | Year
Ended
December 31,
2014 | | Year
Ended
December 31,
2013 | |
| | | (Unaudited) | | | | | | | | | | | |
Net Asset Value, Beginning of Period | | $ | 56.35 | | | $ | 51.83 | | | $ | 50.93 | | | $ | 59.15 | | | $ | 58.97 | | | $ | 43.88 | | |
Investment Activities: | |
Net investment income
(loss) (a) | | | 0.05 | | | | 0.18 | | | | 0.23 | | | | 0.29 | | | | 0.31 | | | | 0.25 | | |
Net realized and unrealized
gains (losses) on
investments | | | 0.38 | | | | 9.07 | | | | 3.99 | | | | (1.74 | ) | | | 7.09 | | | | 16.23 | | |
Total from Investment
Activities | | | 0.43 | | | | 9.25 | | | | 4.22 | | | | (1.45 | ) | | | 7.40 | | | | 16.48 | | |
Distributions to Shareholders: | |
Net investment income | | | — | | | | — | | | | (0.21 | ) | | | (0.31 | ) | | | (0.28 | ) | | | (0.24 | ) | |
Net realized gains
from investments | | | — | | | | (4.73 | ) | | | (3.12 | ) | | | (6.46 | ) | | | (6.94 | ) | | | (1.15 | ) | |
Total Distributions to
Shareholders | | | — | | | | (4.73 | ) | | | (3.33 | ) | | | (6.77 | ) | | | (7.22 | ) | | | (1.39 | ) | |
Capital Contributions from Prior
Custodian, Net (See Note 8) | | | — | | | | — | | | | 0.01 | | | | — | | | | — | | | | — | | |
Net Asset Value, End of Period | | $ | 56.78 | | | $ | 56.35 | | | $ | 51.83 | | | $ | 50.93 | | | $ | 59.15 | | | $ | 58.97 | | |
Total Return (b) | | | 0.76 | % | | | 17.87 | % | | | 8.30 | %(c) | | | (2.38 | )% | | | 12.62 | % | | | 37.66 | % | |
Ratios/Supplemental Data: | |
Net Assets at end of period (000) | | $ | 9,109 | | | $ | 10,229 | | | $ | 10,631 | | | $ | 12,402 | | | $ | 16,458 | | | $ | 16,785 | | |
Ratio of net expenses to average
net assets (d) | | | 1.26 | % | | | 1.26 | % | | | 1.23 | % | | | 1.26 | % | | | 1.31 | % | | | 1.31 | % | |
Ratio of net investment income (loss)
to average net assets (d) | | | 0.19 | % | | | 0.33 | % | | | 0.45 | % | | | 0.49 | % | | | 0.50 | % | | | 0.48 | % | |
Ratio of gross expenses to average
net assets (d) (e) | | | 1.37 | % | | | 1.42 | % | | | 1.23 | % | | | 1.26 | % | | | 1.31 | % | | | 1.31 | % | |
Portfolio turnover (b) (f) | | | 27 | % | | | 55 | % | | | 79 | % | | | 39 | % | | | 60 | % | | | 48 | % | |
(a) Per share net investment income (loss) has been calculated using the average daily shares method.
(b) Not annualized for periods less than one year.
(c) The Fund received monies related to a nonrecurring refund from the prior Custodian. The corresponding impact to the total return was 0.01% for the period shown. (See Note 8)
(d) Annualized for periods less than one year.
(e) During the period, certain fees were reduced and/or reimbursed. If such fee reductions and/or reimbursements had not occurred, the ratios would have been as indicated.
(f) Portfolio turnover is calculated on the basis of the Fund as a whole without distinguishing between the classes of shares issued.
See notes to financial statements.
34
Victory Portfolios | | Financial Highlights — continued | |
For a Share Outstanding Throughout Each Period
| | | Victory RS Large Cap Alpha Fund | |
| | | Class Y Shares | |
| | | Six
Months
Ended
June 30,
2018 | | Year
Ended
December 31,
2017 | | Year
Ended
December 31,
2016 | | Year
Ended
December 31,
2015 | | Year
Ended
December 31,
2014 | | Year
Ended
December 31,
2013 | |
| | | (Unaudited) | | | | | | | | | | | |
Net Asset Value, Beginning of Period | | $ | 56.38 | | | $ | 51.66 | | | $ | 50.82 | | | $ | 59.08 | | | $ | 58.92 | | | $ | 43.83 | | |
Investment Activities: | |
Net investment income (loss) (a) | | | 0.21 | | | | 0.49 | | | | 0.51 | | | | 0.62 | | | | 0.71 | | | | 0.59 | | |
Net realized and unrealized
gains (losses) on investments | | | 0.40 | | | | 9.07 | | | | 4.00 | | | | (1.74 | ) | | | 7.10 | | | | 16.27 | | |
Total from Investment
Activities | | | 0.61 | | | | 9.56 | | | | 4.51 | | | | (1.12 | ) | | | 7.81 | | | | 16.86 | | |
Distributions to Shareholders: | |
Net investment income | | | — | | | | (0.11 | ) | | | (0.56 | ) | | | (0.68 | ) | | | (0.71 | ) | | | (0.62 | ) | |
Net realized gains
from investments | | | — | | | | (4.73 | ) | | | (3.12 | ) | | | (6.46 | ) | | | (6.94 | ) | | | (1.15 | ) | |
Total Distributions
to Shareholders | | | — | | | | (4.84 | ) | | | (3.68 | ) | | | (7.14 | ) | | | (7.65 | ) | | | (1.77 | ) | |
Capital Contributions from Prior
Custodian, Net (See Note 8) | | | — | | | | — | | | | 0.01 | | | | — | | | | — | | | | — | | |
Net Asset Value, End of Period | | $ | 56.99 | | | $ | 56.38 | | | $ | 51.66 | | | $ | 50.82 | | | $ | 59.08 | | | $ | 58.92 | | |
Total Return (b) | | | 1.06 | % | | | 18.56 | % | | | 8.89 | %(c) | | | (1.82 | )% | | | 13.34 | % | | | 38.58 | % | |
Ratios/Supplemental Data: | |
Net Assets at end of period (000) | | $ | 27,875 | | | $ | 33,638 | | | $ | 31,840 | | | $ | 31,662 | | | $ | 189,850 | | | $ | 175,475 | | |
Ratio of net expenses to average
net assets (d) | | | 0.68 | % | | | 0.68 | % | | | 0.68 | % | | | 0.68 | % | | | 0.66 | % | | | 0.65 | % | |
Ratio of net investment income (loss)
to average net assets (d) | | | 0.76 | % | | | 0.88 | % | | | 1.00 | % | | | 1.05 | % | | | 1.16 | % | | | 1.13 | % | |
Ratio of gross expenses to average
net assets (d) (e) | | | 0.74 | % | | | 0.72 | % | | | 0.69 | % | | | 0.68 | % | | | 0.66 | % | | | 0.65 | % | |
Portfolio turnover (b) (f) | | | 27 | % | | | 55 | % | | | 79 | % | | | 39 | % | | | 60 | % | | | 48 | % | |
(a) Per share net investment income (loss) has been calculated using the average daily shares method.
(b) Not annualized for periods less than one year.
(c) The Fund received monies related to a nonrecurring refund from the prior Custodian. The corresponding impact to the total return was 0.01% for the period shown. (See Note 8)
(d) Annualized for periods less than one year.
(e) During the period, certain fees were reduced and/or reimbursed. If such fee reductions and/or reimbursements had not occurred, the ratios would have been as indicated.
(f) Portfolio turnover is calculated on the basis of the Fund as a whole without distinguishing between the classes of shares issued.
See notes to financial statements.
35
Victory Portfolios | | Financial Highlights | |
For a Share Outstanding Throughout Each Period
| | | Victory RS Investors Fund | |
| | | Class A Shares | |
| | | Six
Months
Ended
June 30,
2018 | | Year
Ended
December 31,
2017 | | Year
Ended
December 31,
2016 | | Year
Ended
December 31,
2015 | | Year
Ended
December 31,
2014 | | Year
Ended
December 31,
2013 | |
| | | (Unaudited) | | | | | | | | | | | |
Net Asset Value, Beginning of Period | | $ | 13.86 | | | $ | 13.65 | | | $ | 12.42 | | | $ | 12.95 | | | $ | 13.02 | | | $ | 8.96 | | |
Investment Activities: | |
Net investment income (loss) (a) | | | (0.04 | ) | | | (0.03 | ) | | | — | (b) | | | (0.04 | ) | | | 0.14 | | | | (0.02 | ) | |
Net realized and unrealized
gains (losses) on investments | | | 0.17 | | | | 2.23 | | | | 1.23 | | | | (0.49 | ) | | | 0.42 | | | | 4.14 | | |
Total from Investment
Activities | | | 0.13 | | | | 2.20 | | | | 1.23 | | | | (0.53 | ) | | | 0.56 | | | | 4.12 | | |
Distributions to Shareholders: | |
Net investment income | | | — | | | | — | | | | — | | | | — | | | | (0.12 | ) | | | — | | |
Net realized gains
from investments | | | — | | | | (1.99 | ) | | | — | | | | — | | | | (0.51 | ) | | | (0.06 | ) | |
Total Distributions
to Shareholders | | | — | | | | (1.99 | ) | | | — | | | | — | | | | (0.63 | ) | | | (0.06 | ) | |
Net Asset Value, End of Period | | $ | 13.99 | | | $ | 13.86 | | | $ | 13.65 | | | $ | 12.42 | | | $ | 12.95 | | | $ | 13.02 | | |
Total Return (excludes sales
charge) (c) | | | 0.94 | % | | | 16.28 | % | | | 9.90 | % | | | (4.09 | )% | | | 4.39 | % | | | 46.04 | % | |
Ratios/Supplemental Data: | |
Net Assets at end of period (000) | | $ | 18,501 | | | $ | 20,419 | | | $ | 28,022 | | | $ | 41,556 | | | $ | 67,364 | | | $ | 35,159 | | |
Ratio of net expenses to average
net assets (d) | | | 1.33 | % | | | 1.33 | % | | | 1.33 | % | | | 1.33 | % | | | 1.32 | % | | | 1.30 | % | |
Ratio of net investment income (loss)
to average net assets (d) | | | (0.60 | )% | | | (0.24 | )% | | | 0.02 | % | | | (0.28 | )% | | | 1.04 | % | | | (0.23 | )% | |
Ratio of gross expenses to average
net assets (d) (e) | | | 1.58 | % | | | 1.54 | % | | | 1.56 | % | | | 1.51 | % | | | 1.52 | % | | | 1.89 | % | |
Portfolio turnover (c) (f) | | | 30 | % | | | 80 | % | | | 92 | % | | | 50 | % | | | 83 | % | | | 128 | % | |
(a) Per share net investment income (loss) has been calculated using the average daily shares method.
(b) Amount is less than $0.005 per share.
(c) Not annualized for periods less than one year.
(d) Annualized for periods less than one year.
(e) During the period, certain fees were reduced and/or reimbursed. If such fee reductions and/or reimbursements had not occurred, the ratios would have been as indicated.
(f) Portfolio turnover is calculated on the basis of the Fund as a whole without distinguishing between the classes of shares issued.
See notes to financial statements.
36
Victory Portfolios | | Financial Highlights — continued | |
For a Share Outstanding Throughout Each Period
| | | Victory RS Investors Fund | |
| | | Class C Shares | |
| | | Six
Months
Ended
June 30,
2018 | | Year
Ended
December 31,
2017 | | Year
Ended
December 31,
2016 | | Year
Ended
December 31,
2015 | | Year
Ended
December 31,
2014 | | Year
Ended
December 31,
2013 | |
| | | (Unaudited) | | | | | | | | | | | |
Net Asset Value, Beginning of Period | | $ | 12.68 | | | $ | 12.73 | | | $ | 11.67 | | | $ | 12.26 | | | $ | 12.40 | | | $ | 8.60 | | |
Investment Activities: | |
Net investment income (loss) (a) | | | (0.08 | ) | | | (0.19 | ) | | | (0.09 | ) | | | (0.12 | ) | | | 0.02 | | | | (0.11 | ) | |
Net realized and unrealized
gains (losses) on investments | | | 0.16 | | | | 2.13 | | | | 1.15 | | | | (0.47 | ) | | | 0.42 | | | | 3.97 | | |
Total from Investment
Activities | | | 0.08 | | | | 1.94 | | | | 1.06 | | | | (0.59 | ) | | | 0.44 | | | | 3.86 | | |
Distributions to Shareholders: | |
Net investment income | | | — | | | | — | | | | — | | | | — | | | | (0.07 | ) | | | — | | |
Net realized gains
from investments | | | — | | | | (1.99 | ) | | | — | | | | — | | | | (0.51 | ) | | | (0.06 | ) | |
Total Distributions
to Shareholders | | | — | | | | (1.99 | ) | | | — | | | | — | | | | (0.58 | ) | | | (0.06 | ) | |
Net Asset Value, End of Period | | $ | 12.76 | | | $ | 12.68 | | | $ | 12.73 | | | $ | 11.67 | | | $ | 12.26 | | | $ | 12.40 | | |
Total Return (excludes contingent
deferred sales charge) (b) | | | 0.55 | % | | | 15.48 | % | | | 9.08 | % | | | (4.81 | )% | | | 3.63 | % | | | 44.94 | % | |
Ratios/Supplemental Data: | |
Net Assets at end of period (000) | | $ | 9,417 | | | $ | 11,149 | | | $ | 14,517 | | | $ | 21,654 | | | $ | 31,819 | | | $ | 6,473 | | |
Ratio of net expenses to average
net assets (c) | | | 2.07 | % | | | 2.07 | % | | | 2.07 | % | | | 2.07 | % | | | 2.07 | % | | | 2.05 | % | |
Ratio of net investment income (loss)
to average net assets (c) | | | (1.35 | )% | | | (1.42 | )% | | | (0.72 | )% | | | (1.01 | )% | | | 0.18 | % | | | (0.99 | )% | |
Ratio of gross expenses to average
net assets (c) (d) | | | 2.42 | % | | | 2.35 | % | | | 2.35 | % | | | 2.29 | % | | | 2.29 | % | | | 2.66 | % | |
Portfolio turnover (b) (e) | | | 30 | % | | | 80 | % | | | 92 | % | | | 50 | % | | | 83 | % | | | 128 | % | |
(a) Per share net investment income (loss) has been calculated using the average daily shares method.
(b) Not annualized for periods less than one year.
(c) Annualized for periods less than one year.
(d) During the period, certain fees were reduced and/or reimbursed. If such fee reductions and/or reimbursements had not occurred, the ratios would have been as indicated.
(e) Portfolio turnover is calculated on the basis of the Fund as a whole without distinguishing between the classes of shares issued.
See notes to financial statements.
37
Victory Portfolios | | Financial Highlights — continued | |
For a Share Outstanding Throughout Each Period
| | | Victory RS Investors Fund | |
| | | Class R Shares | |
| | | Six
Months
Ended
June 30,
2018 | | Year
Ended
December 31,
2017 | | Year
Ended
December 31,
2016 | | Year
Ended
December 31,
2015 | | Year
Ended
December 31,
2014 | | Year
Ended
December 31,
2013 | |
| | | (Unaudited) | | | | | | | | | | | |
Net Asset Value, Beginning of Period | | $ | 12.81 | | | $ | 12.83 | | | $ | 11.73 | | | $ | 12.30 | | | $ | 12.43 | | | $ | 8.59 | | |
Investment Activities: | |
Net investment income (loss) (a) | | | (0.08 | ) | | | (0.17 | ) | | | (0.06 | ) | | | (0.09 | ) | | | 0.06 | | | | (0.07 | ) | |
Net realized and unrealized
gains (losses) on investments | | | 0.17 | | | | 2.14 | | | | 1.16 | | | | (0.48 | ) | | | 0.42 | | | | 3.97 | | |
Total from Investment
Activities | | | 0.09 | | | | 1.97 | | | | 1.10 | | | | (0.57 | ) | | | 0.48 | | | | 3.90 | | |
Distributions to Shareholders: | |
Net investment income | | | — | | | | — | | | | — | | | | — | | | | (0.10 | ) | | | — | | |
Net realized gains
from investments | | | — | | | | (1.99 | ) | | | — | | | | — | | | | (0.51 | ) | | | (0.06 | ) | |
Total Distributions
to Shareholders | | | — | | | | (1.99 | ) | | | — | | | | — | | | | (0.61 | ) | | | (0.06 | ) | |
Net Asset Value, End of Period | | $ | 12.90 | | | $ | 12.81 | | | $ | 12.83 | | | $ | 11.73 | | | $ | 12.30 | | | $ | 12.43 | | |
Total Return (b) | | | 0.70 | % | | | 15.50 | % | | | 9.38 | % | | | (4.63 | )% | | | 3.90 | % | | | 45.46 | % | |
Ratios/Supplemental Data: | |
Net Assets at end of period (000) | | $ | 1,322 | | | $ | 1,379 | | | $ | 1,314 | | | $ | 1,771 | | | $ | 2,077 | | | $ | 628 | | |
Ratio of net expenses to average
net assets (c) | | | 1.95 | % | | | 1.95 | % | | | 1.92 | % | | | 1.84 | % | | | 1.91 | % | | | 1.70 | % | |
Ratio of net investment income (loss)
to average net assets (c) | | | (1.22 | )% | | | (1.27 | )% | | | (0.50 | )% | | | (0.78 | )% | | | 0.47 | % | | | (0.66 | )% | |
Ratio of gross expenses to average
net assets (c) (d) | | | 2.93 | % | | | 2.72 | % | | | 1.92 | % | | | 1.90 | % | | | 1.97 | % | | | 2.56 | % | |
Portfolio turnover (b) (e) | | | 30 | % | | | 80 | % | | | 92 | % | | | 50 | % | | | 83 | % | | | 128 | % | |
(a) Per share net investment income (loss) has been calculated using the average daily shares method.
(b) Not annualized for periods less than one year.
(c) Annualized for periods less than one year.
(d) During the period, certain fees were reduced and/or reimbursed. If such fee reductions and/or reimbursements had not occurred, the ratios would have been as indicated.
(e) Portfolio turnover is calculated on the basis of the Fund as a whole without distinguishing between the classes of shares issued.
See notes to financial statements.
38
Victory Portfolios | | Financial Highlights — continued | |
For a Share Outstanding Throughout Each Period
| | | Victory RS Investors Fund | |
| | | Class Y Shares | |
| | | Six
Months
Ended
June 30,
2018 | | Year
Ended
December 31,
2017 | | Year
Ended
December 31,
2016 | | Year
Ended
December 31,
2015 | | Year
Ended
December 31,
2014 | | Year
Ended
December 31,
2013 | |
| | | (Unaudited) | | | | | | | | | | | |
Net Asset Value, Beginning of Period | | $ | 14.10 | | | $ | 13.82 | | | $ | 12.55 | | | $ | 13.05 | | | $ | 13.12 | | | $ | 9.01 | | |
Investment Activities: | |
Net investment income (loss) (a) | | | (0.02 | ) | | | 0.03 | | | | 0.04 | | | | — | | | | 0.20 | | | | 0.01 | | |
Net realized and unrealized
gains (losses) on investments | | | 0.18 | | | | 2.24 | | | | 1.24 | | | | (0.50 | ) | | | 0.41 | | | | 4.17 | | |
Total from Investment
Activities | | | 0.16 | | | | 2.27 | | | | 1.28 | | | | (0.50 | ) | | | 0.61 | | | | 4.18 | | |
Distributions to Shareholders: | |
Net investment income | | | — | | | | — | | | | (0.01 | ) | | | — | | | | (0.17 | ) | | | (0.01 | ) | |
Net realized gains
from investments | | | — | | | | (1.99 | ) | | | — | | | | — | | | | (0.51 | ) | | | (0.06 | ) | |
Total Distributions
to Shareholders | | | — | | | | (1.99 | ) | | | (0.01 | ) | | | — | | | | (0.68 | ) | | | (0.07 | ) | |
Net Asset Value, End of Period | | $ | 14.26 | | | $ | 14.10 | | | $ | 13.82 | | | $ | 12.55 | | | $ | 13.05 | | | $ | 13.12 | | |
Total Return (b) | | | 1.13 | % | | | 16.59 | % | | | 10.17 | % | | | (3.83 | )% | | | 4.72 | % | | | 46.45 | % | |
Ratios/Supplemental Data: | |
Net Assets at end of period (000) | | $ | 20,169 | | | $ | 27,131 | | | $ | 50,013 | | | $ | 80,290 | | | $ | 142,623 | | | $ | 71,743 | | |
Ratio of net expenses to average
net assets (c) | | | 1.05 | % | | | 1.05 | % | | | 1.05 | % | | | 1.05 | % | | | 1.05 | % | | | 1.05 | % | |
Ratio of net investment income (loss)
to average net assets (c) | | | (0.33 | )% | | | 0.19 | % | | | 0.28 | % | | | (0.01 | )% | | | 1.49 | % | | | 0.04 | % | |
Ratio of gross expenses to average
net assets (c) (d) | | | 1.37 | % | | | 1.25 | % | | | 1.24 | % | | | 1.21 | % | | | 1.17 | % | | | 1.44 | % | |
Portfolio turnover (b) (e) | | | 30 | % | | | 80 | % | | | 92 | % | | | 50 | % | | | 83 | % | | | 128 | % | |
(a) Per share net investment income (loss) has been calculated using the average daily shares method.
(b) Not annualized for periods less than one year.
(c) Annualized for periods less than one year.
(d) During the period, certain fees were reduced and/or reimbursed. If such fee reductions and/or reimbursements had not occurred, the ratios would have been as indicated.
(e) Portfolio turnover is calculated on the basis of the Fund as a whole without distinguishing between the classes of shares issued.
See notes to financial statements.
39
Victory Portfolios | | Financial Highlights | |
For a Share Outstanding Throughout Each Period
| | | Victory Global Natural Resources Fund | |
| | | Class A Shares | |
| | | Six
Months
Ended
June 30,
2018 | | Year
Ended
December 31,
2017 | | Year
Ended
December 31,
2016 | | Year
Ended
December 31,
2015 | | Year
Ended
December 31,
2014 | | Year
Ended
December 31,
2013 | |
| | | (Unaudited) | | | | | | | | | | | |
Net Asset Value, Beginning of Period | | $ | 23.73 | | | $ | 23.49 | | | $ | 15.34 | | | $ | 24.81 | | | $ | 35.02 | | | $ | 36.60 | | |
Investment Activities: | |
Net investment income
(loss) (a) | | | (0.08 | ) | | | (0.22 | ) | | | (0.10 | ) | | | (0.11 | ) | | | (0.04 | ) | | | (0.07 | ) | |
Net realized and unrealized
gains (losses) on
investments | | | (0.25 | ) | | | 0.46 | | | | 8.25 | | | | (9.36 | ) | | | (7.97 | ) | | | (0.20 | ) | |
Total from Investment
Activities | | | (0.33 | ) | | | 0.24 | | | | 8.15 | | | | (9.47 | ) | | | (8.01 | ) | | | (0.27 | ) | |
Distributions to Shareholders: | |
Net investment income | | | — | | | | — | | | | — | | | | — | | | | (0.01 | ) | | | — | | |
Net realized gains
from investments | | | — | | | | — | | | | — | | | | — | | | | (2.19 | ) | | | (1.31 | ) | |
Total Distributions
to Shareholders | | | — | | | | — | | | | — | | | | — | | | | (2.20 | ) | | | (1.31 | ) | |
Capital Contributions from Prior
Custodian, Net (See Note 8) | | | — | | | | — | | | | — | (b) | | | — | | | | — | | | | — | | |
Net Asset Value, End of Period | | $ | 23.40 | | | $ | 23.73 | | | $ | 23.49 | | | $ | 15.34 | | | $ | 24.81 | | | $ | 35.02 | | |
Total Return (excludes sales
charge) (c) | | | (1.39 | )% | | | 1.02 | % | | | 53.13 | %(d) | | | (38.17 | )% | | | (22.84 | )% | | | (0.60 | )% | |
Ratios/Supplemental Data: | |
Net Assets at end of period (000) | | $ | 243,030 | | | $ | 262,455 | | | $ | 545,778 | | | $ | 332,598 | | | $ | 620,030 | | | $ | 1,254,213 | | |
Ratio of net expenses to average
net assets (e) | | | 1.48 | % | | | 1.48 | % | | | 1.48 | % | | | 1.45 | % | | | 1.47 | % | | | 1.43 | % | |
Ratio of net investment income (loss)
to average net assets (e) | | | (0.71 | )% | | | (0.93 | )% | | | (0.51 | )% | | | (0.52 | )% | | | (0.10 | )% | | | (0.18 | )% | |
Ratio of gross expenses to average
net assets (e) (f) | | | 1.53 | % | | | 1.55 | % | | | 1.48 | % | | | 1.45 | % | | | 1.48 | % | | | 1.46 | % | |
Portfolio turnover (c) (g) | | | 15 | % | | | 57 | %(h) | | | 29 | % | | | 33 | % | | | 34 | % | | | 39 | % | |
(a) Per share net investment income (loss) has been calculated using the average daily shares method.
(b) Amount is less than $0.005 per share.
(c) Not annualized for periods less than one year.
(d) The Fund received monies related to a nonrecurring refund from the prior Custodian. The corresponding impact to the total return was less than 0.005% for the period shown. (See Note 8)
(e) Annualized for periods less than one year.
(f) During the period, certain fees were reduced and/or reimbursed. If such fee reductions and/or reimbursements had not occurred, the ratios would have been as indicated.
(g) Portfolio turnover is calculated on the basis of the Fund as a whole without distinguishing between the classes of shares issued.
(h) Portfolio turnover increase/decrease due to change within the portfolio holdings during the year.
See notes to financial statements.
40
Victory Portfolios | | Financial Highlights — continued | |
For a Share Outstanding Throughout Each Period
| | | Victory Global Natural Resources Fund | |
| | | Class C Shares | |
| | | Six
Months
Ended
June 30,
2018 | | Year
Ended
December 31,
2017 | | Year
Ended
December 31,
2016 | | Year
Ended
December 31,
2015 | | Year
Ended
December 31,
2014 | | Year
Ended
December 31,
2013 | |
| | | (Unaudited) | | | | | | | | | | | |
Net Asset Value, Beginning of Period | | $ | 21.63 | | | $ | 21.59 | | | $ | 14.21 | | | $ | 23.17 | | | $ | 33.14 | | | $ | 34.98 | | |
Investment Activities: | |
Net investment income (loss) (a) | | | (0.16 | ) | | | (0.36 | ) | | | (0.24 | ) | | | (0.27 | ) | | | (0.29 | ) | | | (0.34 | ) | |
Net realized and unrealized
gains (losses) on investments | | | (0.22 | ) | | | 0.40 | | | | 7.62 | | | | (8.69 | ) | | | (7.48 | ) | | | (0.19 | ) | |
Total from Investment
Activities | | | (0.38 | ) | | | 0.04 | | | | 7.38 | | | | (8.96 | ) | | | (7.77 | ) | | | (0.53 | ) | |
Distributions to Shareholders: | |
Net investment income | | | — | | | | — | | | | — | | | | — | | | | (0.01 | ) | | | — | | |
Net realized gains
from investments | | | — | | | | — | | | | — | | | | — | | | | (2.19 | ) | | | (1.31 | ) | |
Total Distributions
to Shareholders | | | — | | | | — | | | | — | | | | — | | | | (2.20 | ) | | | (1.31 | ) | |
Capital Contributions from Prior
Custodian, Net (See Note 8) | | | — | | | | — | | | | — | (b) | | | — | | | | — | | | | — | | |
Net Asset Value, End of Period | | $ | 21.25 | | | $ | 21.63 | | | $ | 21.59 | | | $ | 14.21 | | | $ | 23.17 | | | $ | 33.14 | | |
Total Return (excludes contingent
deferred sales charge) (c) | | | (1.80 | )% | | | 0.23 | % | | | 51.94 | %(d) | | | (38.67 | )% | | | (23.41 | )% | | | (1.37 | )% | |
Ratios/Supplemental Data: | |
Net Assets at end of period (000) | | $ | 16,555 | | | $ | 20,428 | | | $ | 30,789 | | | $ | 26,501 | | | $ | 63,193 | | | $ | 128,948 | | |
Ratio of net expenses to average
net assets (e) | | | 2.28 | % | | | 2.28 | % | | | 2.28 | % | | | 2.25 | % | | | 2.23 | % | | | 2.21 | % | |
Ratio of net investment income (loss)
to average net assets (e) | | | (1.52 | )% | | | (1.72 | )% | | | (1.32 | )% | | | (1.33 | )% | | | (0.86 | )% | | | (0.95 | )% | |
Ratio of gross expenses to average
net assets (e) (f) | | | 2.37 | % | | | 2.35 | % | | | 2.31 | % | | | 2.25 | % | | | 2.24 | % | | | 2.24 | % | |
Portfolio turnover (c) (g) | | | 15 | % | | | 57 | %(h) | | | 29 | % | | | 33 | % | | | 34 | % | | | 39 | % | |
(a) Per share net investment income (loss) has been calculated using the average daily shares method.
(b) Amount is less than $0.005 per share.
(c) Not annualized for periods less than one year.
(d) The Fund received monies related to a nonrecurring refund from the prior Custodian. The corresponding impact to the total return was less than 0.005% for the period shown. (See Note 8)
(e) Annualized for periods less than one year.
(f) During the period, certain fees were reduced and/or reimbursed. If such fee reductions and/or reimbursements had not occurred, the ratios would have been as indicated.
(g) Portfolio turnover is calculated on the basis of the Fund as a whole without distinguishing between the classes of shares issued.
(h) Portfolio turnover increase/decrease due to change within the portfolio holdings during the year.
See notes to financial statements.
41
Victory Portfolios | | Financial Highlights — continued | |
For a Share Outstanding Throughout Each Period
| | | Victory Global Natural Resources Fund | |
| | | Class R Shares | |
| | | Six
Months
Ended
June 30,
2018 | | Year
Ended
December 31,
2017 | | Year
Ended
December 31,
2016 | | Year
Ended
December 31,
2015 | | Year
Ended
December 31,
2014 | | Year
Ended
December 31,
2013 | |
| | | (Unaudited) | | | | | | | | | | | |
Net Asset Value, Beginning of Period | | $ | 22.56 | | | $ | 22.42 | | | $ | 14.68 | | | $ | 23.82 | | | $ | 33.86 | | | $ | 35.57 | | |
Investment Activities: | |
Net investment income
(loss) (a) | | | (0.12 | ) | | | (0.29 | ) | | | (0.15 | ) | | | (0.18 | ) | | | (0.16 | ) | | | (0.18 | ) | |
Net realized and unrealized
gains (losses) on
investments | | | (0.23 | ) | | | 0.43 | | | | 7.89 | | | | (8.96 | ) | | | (7.68 | ) | | | (0.22 | ) | |
Total from Investment
Activities | | | (0.35 | ) | | | 0.14 | | | | 7.74 | | | | (9.14 | ) | | | (7.84 | ) | | | (0.40 | ) | |
Distributions to Shareholders: | |
Net investment income | | | — | | | | — | | | | — | | | | — | | | | (0.01 | ) | | | — | | |
Net realized gains
from investments | | | — | | | | — | | | | — | | | | — | | | | (2.19 | ) | | | (1.31 | ) | |
Total Distributions to
Shareholders | | | — | | | | — | | | | — | | | | — | | | | (2.20 | ) | | | (1.31 | ) | |
Capital Contributions from Prior
Custodian, Net (See Note 8) | | | — | | | | — | | | | — | (b) | | | — | | | | — | | | | — | | |
Net Asset Value, End of Period | | $ | 22.21 | | | $ | 22.56 | | | $ | 22.42 | | | $ | 14.68 | | | $ | 23.82 | | | $ | 33.86 | | |
Total Return (c) | | | (1.55 | )% | | | 0.62 | % | | | 52.72 | %(d) | | | (38.37 | )% | | | (23.12 | )% | | | (0.98 | )% | |
Ratios/Supplemental Data: | |
Net Assets at end of period (000) | | $ | 2,316 | | | $ | 2,442 | | | $ | 4,611 | | | $ | 3,427 | | | $ | 4,929 | | | $ | 7,596 | | |
Ratio of net expenses to average
net assets (e) | | | 1.86 | % | | | 1.86 | % | | | 1.74 | % | | | 1.78 | % | | | 1.84 | % | | | 1.79 | % | |
Ratio of net investment income (loss)
to average net assets (e) | | | (1.09 | )% | | | (1.31 | )% | | | (0.80 | )% | | | (0.85 | )% | | | (0.47 | )% | | | (0.51 | )% | |
Ratio of gross expenses to average
net assets (e) (f) | | | 2.36 | % | | | 2.20 | % | | | 1.74 | % | | | 1.78 | % | | | 1.85 | % | | | 1.82 | % | |
Portfolio turnover (c) (g) | | | 15 | % | | | 57 | %(h) | | | 29 | % | | | 33 | % | | | 34 | % | | | 39 | % | |
(a) Per share net investment income (loss) has been calculated using the average daily shares method.
(b) Amount is less than $0.005 per share.
(c) Not annualized for periods less than one year.
(d) The Fund received monies related to a nonrecurring refund from the prior Custodian. The corresponding impact to the total return was less than 0.005% for the period shown. (See Note 8)
(e) Annualized for periods less than one year.
(f) During the period, certain fees were reduced and/or reimbursed. If such fee reductions and/or reimbursements had not occurred, the ratios would have been as indicated.
(g) Portfolio turnover is calculated on the basis of the Fund as a whole without distinguishing between the classes of shares issued.
(h) Portfolio turnover increase/decrease due to change within the portfolio holdings during the year.
See notes to financial statements.
42
Victory Portfolios | | Financial Highlights — continued | |
For a Share Outstanding Throughout Each Period
| | | Victory Global Natural Resources Fund | |
| | | Class Y Shares | |
| | | Six
Months
Ended
June 30,
2018 | | Year
Ended
December 31,
2017 | | Year
Ended
December 31,
2016 | | Year
Ended
December 31,
2015 | | Year
Ended
December 31,
2014 | | Year
Ended
December 31,
2013 | |
| | | (Unaudited) | | | | | | | | | | | |
Net Asset Value, Beginning of
Period | | $ | 24.60 | | | $ | 24.28 | | | $ | 15.80 | | | $ | 25.48 | | | $ | 35.76 | | | $ | 37.23 | | |
Investment Activities: | |
Net investment income
(loss) (a) | | | (0.04 | ) | | | (0.14 | ) | | | (0.04 | ) | | | (0.05 | ) | | | 0.09 | | | | 0.06 | | |
Net realized and
unrealized gains
(losses) on
investments | | | (0.26 | ) | | | 0.46 | | | | 8.52 | | | | (9.63 | ) | | | (8.17 | ) | | | (0.22 | ) | |
Total from
Investment
Activities | | | (0.30 | ) | | | 0.32 | | | | 8.48 | | | | (9.68 | ) | | | (8.08 | ) | | | (0.16 | ) | |
Distributions to Shareholders: | |
Net investment income | | | — | | | | — | | | | — | | | | — | | | | (0.01 | ) | | | — | | |
Net realized gains from
investments | | | — | | | | — | | | | — | | | | — | | | | (2.19 | ) | | | (1.31 | ) | |
Total Distributions
to Shareholders | | | — | | | | — | | | | — | | | | — | | | | (2.20 | ) | | | (1.31 | ) | |
Capital Contributions from Prior
Custodian, Net (See Note 8) | | | — | | | | — | | | | — | (b) | | | — | | | | — | | | | — | | |
Net Asset Value, End of Period | | $ | 24.30 | | | $ | 24.60 | | | $ | 24.28 | | | $ | 15.80 | | | $ | 25.48 | | | $ | 35.76 | | |
Total Return (c) | | | (1.26 | )% | | | 1.36 | % | | | 53.67 | %(d) | | | (37.99 | )% | | | (22.56 | )% | | | (0.29 | )% | |
Ratios/Supplemental Data: | |
Net Assets at end of period (000) | | $ | 1,027,575 | | | $ | 1,126,533 | | | $ | 1,300,024 | | | $ | 1,174,590 | | | $ | 2,230,527 | | | $ | 3,396,743 | | |
Ratio of net expenses to average
net assets (e) | | | 1.15 | % | | | 1.15 | % | | | 1.15 | % | | | 1.14 | % | | | 1.13 | % | | | 1.12 | % | |
Ratio of net investment income
(loss) to average net assets (e) | | | (0.38 | )% | | | (0.58 | )% | | | (0.19 | )% | | | (0.21 | )% | | | 0.24 | % | | | 0.14 | % | |
Ratio of gross expenses to
average net assets (e) (f) | | | 1.20 | % | | | 1.19 | % | | | 1.17 | % | | | 1.14 | % | | | 1.14 | % | | | 1.15 | % | |
Portfolio turnover (c) (g) | | | 15 | % | | | 57 | %(h) | | | 29 | % | | | 33 | % | | | 34 | % | | | 39 | % | |
(a) Per share net investment income (loss) has been calculated using the average daily shares method.
(b) Amount is less than $0.005 per share.
(c) Not annualized for periods less than one year.
(d) The Fund received monies related to a nonrecurring refund from the prior Custodian. The corresponding impact to the total return was less than 0.005% for the period shown. (See Note 8)
(e) Annualized for periods less than one year.
(f) During the period, certain fees were reduced and/or reimbursed. If such fee reductions and/or reimbursements had not occurred, the ratios would have been as indicated.
(g) Portfolio turnover is calculated on the basis of the Fund as a whole without distinguishing between the classes of shares issued.
(h) Portfolio turnover increase/decrease due to change within the portfolio holdings during the year.
See notes to financial statements.
43
Victory Portfolios | | Notes to Financial Statements
June 30, 2018 | |
(Unaudited)
1. Organization:
Victory Portfolios (the "Trust") was organized on December 6, 1995 as a Delaware statutory trust as a successor to a company of the same name organized as a Massachusetts business trust on February 5, 1986. The Trust is registered under the Investment Company Act of 1940, as amended (the "1940 Act"), as an open-end management investment company. The Trust is comprised of 42 funds and is authorized to issue an unlimited number of shares, which are units of beneficial interest with a par value of $0.001 per share.
The accompanying financial statements are those of the following Funds (collectively, the "Funds" and individually, a "Fund").
Funds | | Investment Share
Classes Offered | | Investment Objectives | |
Victory RS Partners Fund
("RS Partners Fund") | | Classes A, R and Y
| | Seeks to provide long-term capital
appreciation | |
Victory RS Value Fund
("RS Value Fund") | | Classes A, C, R and Y
| | Seeks to provide long-term capital
appreciation | |
Victory RS Large Cap
Alpha Fund
("RS Large Cap Alpha Fund") | | Classes A, C, R and Y
| | Seeks to provide long-term capital
appreciation
| |
Victory RS Investors Fund
("RS Investors Fund") | | Classes A, C, R and Y
| | Seeks to provide long-term capital
appreciation | |
Victory Global Natural
Resources Fund
("Global Natural
Resources Fund") | | Classes A, C, R and Y
| | Seeks to provide long-term capital
appreciation
| |
Each class of shares of a Fund has substantially identical rights and privileges except with respect to sales charges, fees paid under distribution plans, expenses allocable exclusively to each class of shares, voting rights on matters solely affecting a single class of shares, and the exchange privilege of each class of shares.
Under the Trust's organizational documents, its officers and trustees are indemnified against certain liabilities arising out of the performance of their duties to the Funds. In addition, in the normal course of business, the Funds enter into contracts with their vendors and others that provide for general indemnifications. The Funds' maximum exposure under these arrangements is unknown, as this would involve future claims that may be made against the Funds. However, based on experience, the Funds expect that risk of loss to be remote.
2. Significant Accounting Policies:
The following is a summary of significant accounting policies followed by the Trust in the preparation of its financial statements. The policies are in conformity with accounting principles generally accepted in the United States of America ("GAAP"). The preparation of financial statements in accordance with GAAP requires management to make estimates and assumptions that affect the reported amounts of assets and liabilities and disclosure of contingent assets and liabilities at the date of the financial statements and the reported amounts of income and expenses for the period. Actual results could differ from those estimates. The Funds follow the specialized accounting and reporting requirements under GAAP that are applicable to investment companies.
Investment Valuation:
The Funds record investments at fair value. Fair value is defined as the price that would be received to sell an asset or paid to transfer a liability in an orderly transaction between market participants at the measurement date.
The valuation techniques described below maximize the use of observable inputs and minimize the use of unobservable inputs in determining fair value. The inputs used for valuing the Funds' investments are summarized in the three broad levels listed below:
• Level 1 — quoted prices in active markets for identical securities
44
Victory Portfolios | | Notes to Financial Statements — continued
June 30, 2018 | |
(Unaudited)
• Level 2 — other significant observable inputs (including quoted prices for similar securities or interest rates applicable to those securities, etc.)
• Level 3 — significant unobservable inputs (including the Funds' own assumptions in determining the fair value of investments)
Changes in valuation techniques may result in transfers in or out of an assigned level within the disclosure hierarchy. The Trust determines transfers between fair value hierarchy levels at the reporting period end. The inputs or methodologies used for valuation techniques are not necessarily an indication of the risk associated with entering into those investments.
Portfolio securities listed or traded on securities exchanges, including exchange-traded funds ("ETFs"), American Depositary Receipts ("ADRs") and Rights, are valued at the closing price on the exchange or system where the security is principally traded, if available, or at the Nasdaq Official Closing Price. If there have been no sales for that day on the exchange or system, then a security is valued at the last available bid quotation on the exchange or system where the security is principally traded. In each of these situations, valuations are typically categorized as Level 1 in the fair value hierarchy.
Investments in open-end investment companies are valued at net asset value. These valuations are typically categorized as Level 1 in the fair value hierarchy.
Debt securities of United States ("U.S.") issuers (other than short-term investments maturing in 60 days or less), including corporate and municipal securities, are valued on the basis of bid valuations provided by dealers or an independent pricing service approved by the Trust's Board of Trustees (the "Board"). Short-term investments maturing in 60 days or less may be valued at amortized cost, which approximates market value. Under the amortized cost method, premium or discount, if any, is amortized or accreted, respectively, on a constant basis to the maturity of the security. In each of these situations, valuations are typically categorized as Level 2 in the fair value hierarchy.
Investments for which there are no such quotations, or for which quotations do not appear reliable, are valued at fair value in accordance with procedures established by and under the general supervision and responsibility of the Board. These valuations are typically categorized as Level 2 or Level 3 in the fair value hierarchy, based on the observability of inputs used to determine the fair value.
A summary of the valuations as of June 30, 2018, based upon the three levels defined above, is included in the table below while the breakdown, by category, of investments is disclosed in the Schedules of Portfolio Investments:
| | | LEVEL 1 —
Quoted Prices | | LEVEL 2 —
Other Significant
Observable Inputs | | LEVEL 3 —
Other Significant
Unobservable Inputs | | Total | |
| | | Investments
in
Securities | | Investments
in
Securities | | Investments
in
Securities | | Investments
in
Securities | |
RS Partners Fund | |
Common Stocks | | $ | 539,600,685 | | | $ | — | | | $ | — | | | $ | 539,600,685 | | |
Preferred Stocks | | | — | | | | — | | | | 1,942,920 | | | | 1,942,920 | | |
Collateral for Securities Loaned | | | 54,852,713 | | | | — | | | | — | | | | 54,852,713 | | |
Total | | | 594,453,398 | | | | — | | | | 1,942,920 | | | | 596,396,318 | | |
RS Value Fund | |
Common Stocks | | | 440,629,912 | | | | — | | | | — | | | | 440,629,912 | | |
Collateral for Securities Loaned | | | 49,512,657 | | | | — | | | | — | | | | 49,512,657 | | |
Total | | | 490,142,569 | | | | — | | | | — | | | | 490,142,569 | | |
RS Large Cap Alpha Fund | |
Common Stocks | | | 570,780,605 | | | | — | | | | — | | | | 570,780,605 | | |
Collateral for Securities Loaned | | | 34,851,480 | | | | — | | | | — | | | | 34,851,480 | | |
Total | | | 605,632,085 | | | | — | | | | — | | | | 605,632,085 | | |
45
Victory Portfolios | | Notes to Financial Statements — continued
June 30, 2018 | |
(Unaudited)
| | | LEVEL 1 —
Quoted Prices | | LEVEL 2 —
Other Significant
Observable Inputs | | LEVEL 3 —
Other Significant
Unobservable Inputs | | Total | |
| | | Investments
in
Securities | | Investments
in
Securities | | Investments
in
Securities | | Investments
in
Securities | |
RS Investors Fund | |
Common Stocks | | $ | 48,313,789 | | | $ | — | | | $ | — | | | $ | 48,313,789 | | |
Collateral for Securities Loaned | | | 5,313,034 | | | | — | | | | — | | | | 5,313,034 | | |
Total | | | 53,626,823 | | | | — | | | | — | | | | 53,626,823 | | |
Global Natural Resources Fund | |
Common Stocks | | | 1,174,142,513 | | | | 4,716,796 | (a) | | | — | | | | 1,178,859,309 | | |
Collateral for Securities Loaned | | | 190,621,656 | | | | — | | | | — | | | | 190,621,656 | | |
Total | | | 1,364,764,169 | | | | 4,716,796 | | | | | | | | 1,369,480,965 | | |
(a) Consists of holdings: Ophir Energy PLC categorized as Oil, Gas & Consumable Fuels.
There were no transfers among any levels during the six months ended June 30, 2018.
The following is a reconciliation of assets in which significant unobservable inputs (Level 3) were used in determining fair value:
Investment in Securities | | RS Partners Fund | |
Balance as of December 31, 2017 | | $ | 1,942,920 | | |
Accrued discount (premium) | | | — | | |
Realized Gains (Losses) | | | — | | |
Change in Unrealized Appreciation/Depreciation | | | — | | |
Purchases | | | — | | |
Sales Proceeds | | | — | | |
Transfers into Level 3 | | | — | | |
Transfers out of Level 3 | | | — | | |
Balance as of June 30, 2018 | | $ | 1,942,920 | | |
The following is a summary of quantitative information about Level 3 Fair Value Measurements:
RS Partners Fund | | Fair Value as of
June 30, 2018* | | Valuation
Techniques | | Unobservable
Input | | Input Values | | Impact to
valuation from an
increase to input | |
Common Stocks
| | |
$
| 1,942,920 | |
Market
| |
Premium / Discount
| |
Market Transactions
| | Any change to the
premium or discount
would result in direct
and proportional
changes in the fair
value of the security. | |
* Level 3 securities are typically valued by the Adviser. The appropriateness of fair values for these securities is monitored on an ongoing basis, by the Adviser, which may include back testing, results of vendor due diligence, unchanged price review and consideration of market and/or sector events.
Real Estate Investment Trusts ("REITS"):
The Funds may invest in REITS which report information on the source of their distributions annually. REITS are pooled investment vehicles that invest primarily in income-producing real estate or real estate related loans or interests (such as mortgages). Certain distributions received from REITS during the year are recorded as realized gains or return of capital when such information becomes known.
46
Victory Portfolios | | Notes to Financial Statements — continued
June 30, 2018 | |
(Unaudited)
Investment Companies:
Exchange-Traded Funds:
The Funds may invest in ETFs. ETFs are a type of index fund, the shares of which are bought and sold on a securities exchange. An ETF trades like common stock and represents a fixed portfolio of securities designed to track the performance and dividend yield of a particular domestic or foreign market index. A Fund may purchase shares of an ETF to temporarily gain exposure to a portion of the U.S. or a foreign market while awaiting purchase of underlying securities. The risks of owning an ETF generally reflect the risks of owning the underlying securities they are designed to track, although the lack of liquidity on an ETF could result in it being more volatile. Additionally, ETFs have fees and expenses that reduce their value.
Open-End Funds:
The Funds may invest in portfolios of open-end investment companies. These investment companies value securities in their portfolios for which market quotations are readily available at their market values (generally the last reported sale price) and all other securities and assets at their fair value by the methods established by the board of directors of the underlying funds.
Foreign Currency Contracts:
The Funds may enter into foreign exchange currency contracts to convert U.S. dollars to and from various foreign currencies. A foreign exchange currency contract is an obligation by a Fund to purchase or sell a specific currency at a future date at a price (in U.S. dollars) set at the time of the contract. The Funds do not engage in "cross-currency" foreign exchange contracts (i.e., contracts to purchase or sell one foreign currency in exchange for another foreign currency). The Funds' foreign exchange currency contracts might be considered spot contracts (typically a contract of one week or less) or forward contracts (typically a contract term over one week). A spot contract is entered into for purposes of hedging against foreign currency fluctuations relating to a specific portfolio transaction, such as the delay between a security transaction trade date and settlement date. Forward contracts are entered into for purposes of hedging portfolio holdings or concentrations of such holdings. Each foreign exchange currency contract is adjusted daily by the prevailing spot or forward rate of the underlying currency, and any appreciation or depreciation is recorded for financial statement purposes as unrealized until the contract settlement date, at which time the Fund records realized gains or losses equal to the difference between the value of a contract at the time it was opened and the value at the time it was closed. A Fund could be exposed to risk if a counterparty is unable to meet the terms of a foreign exchange currency contract or if the value of the foreign currency changes unfavorably. In addition, the use of foreign exchange currency contracts does not eliminate fluctuations in the underlying prices of the securities. As of June 30, 2018, the Funds had no open forward foreign exchange currency contracts.
Investment Transactions and Related Income:
Changes in holdings of investments are accounted for no later than one business day following the trade date. For financial reporting purposes, however, investment transactions are accounted for on trade date on the last business day of the reporting period. Interest income is recognized on an accrual basis and includes, where applicable, the amortization of premium or accretion of discount. Dividend income is recorded on the ex-dividend date. Gains or losses realized on sales of securities are determined by comparing the identified cost of the security lot sold with the net sales proceeds.
Withholding taxes on interest, dividends and gains as a result of certain investments in ADRs by the Funds have been provided for in accordance with each investment's applicable country's tax rules and rates.
47
Victory Portfolios | | Notes to Financial Statements — continued
June 30, 2018 | |
(Unaudited)
Securities Lending:
The Trust has entered into a Master Securities Lending Agreement ("MSLA") with Citibank, N.A. ("Citibank" or the "Agent"). Under the terms of the MSLA, the Funds may lend securities to certain broker-dealers and banks in exchange for collateral in the amount of at least 102% of the value of U.S. securities loaned or at least 105% of the value of non-U.S. securities loaned, marked-to-market daily. Any collateral shortfalls associated with increases in the valuation of the securities loaned are adjusted the next business day. The collateral can be received in the form of cash collateral and/or non-cash collateral. Non-cash collateral can include U.S. Government Securities, letters of credit and certificates of deposit. The cash collateral is invested in short-term instruments or cash equivalents as noted in the Funds' Schedules of Portfolio Investments. The Trust does not have effective control of the non-cash collateral and therefore it is not disclosed in the Funds' Schedules of Portfolio Investments. The Funds continue to benefit from interest or dividends on the securities loaned and may also earn a return from the collateral. The Funds pay various fees in connection with the investment of cash collateral. The Funds pay the Agent fees based on the investment income received from securities lending activities. Securities lending income is disclosed on the Statements of Operations. Although risk is mitigated by the collateral, the Funds could experience a delay in recovering their securities and possible loss of income or value if the borrower fails to return them.
Securities lending transactions are entered into by a Fund under the MSLA, which permits the Fund, under certain circumstances such as an event of default, to offset amounts payable by the Fund to the same counterparty against amounts receivable from the counterparty to create a net payment due to or from the Fund.
The following table is a summary of the Funds' securities lending transactions which are subject to offset under the MSLA as of June 30, 2018. These transactions are accounted for as secured borrowings with an overnight and continuous contractual maturity.
| | | Gross Amount
of
Recognized Assets
(Value of
Securities on Loan) | | Value of
Cash
Collateral
Received | | Net Amount | |
RS Partners Fund | | $ | 53,815,483 | | | $ | 54,852,713 | | | $ | 1,037,230 | | |
RS Value Fund | | | 48,120,227 | | | | 49,512,657 | | | | 1,392,430 | | |
RS Large Cap Alpha Fund | | | 34,055,242 | | | | 34,851,480 | | | | 796,238 | | |
RS Investors Fund | | | 5,165,180 | | | | 5,313,034 | | | | 147,854 | | |
Global Natural Resources Fund | | | 186,097,704 | | | | 190,621,656 | | | | 4,523,952 | | |
Foreign Currency Translations:
The accounting records of the Funds are maintained in U.S. dollars. Investment securities and other assets and liabilities of a Fund denominated in a foreign currency are translated into U.S. dollars at current exchange rates. Purchases and sales of securities, income receipts and expense payments are translated into U.S. dollars at the exchange rates on the date of the transactions. The Funds do not isolate the portion of the results of operations resulting from changes in foreign exchange rates on investments from fluctuations arising from changes in market prices of securities held. Such fluctuations are disclosed as net change in unrealized appreciation/depreciation on investments and foreign currency translations on the Statements of Operations. Any realized gains or losses from these fluctuations are disclosed as net realized gains or losses from investment transactions and foreign currency translations on the Statements of Operations.
Foreign Taxes:
The Funds may be subject to foreign taxes related to foreign income received (a portion of which may be reclaimable), capital gains on the sale of securities, and certain foreign currency
48
Victory Portfolios | | Notes to Financial Statements — continued
June 30, 2018 | |
(Unaudited)
transactions. All foreign taxes are recorded in accordance with the applicable regulations and rates that exist in the foreign jurisdictions in which the Funds invest.
Dividends to Shareholders:
Dividends from net investment income, if any, are declared and paid annually for the Funds. Distributable net realized gains, if any, are declared and distributed at least annually.
The amounts of dividends from net investment income and distributions from net realized gains are determined in accordance with federal income tax regulations, which may differ from GAAP. These "book/tax" differences are either considered temporary or permanent in nature (e.g., reclass of market discounts and premiums and paydown gains or losses), such amounts are reclassified within the components of net assets based on their federal tax-basis treatment; temporary differences (e.g., wash sales) do not require reclassification. To the extent dividends and distributions exceed net investment income and net realized gains for tax purposes, they are reported as distributions of capital. Net investment losses incurred by a Fund may be reclassified as an offset to capital on the accompanying Statements of Assets and Liabilities.
Federal Income Taxes:
It is the policy of each Fund to continue to qualify as a regulated investment company by complying with the provisions available to certain investment companies, as defined in applicable sections of the Internal Revenue Code, and to make distributions of net investment income and net realized gains sufficient to relieve it from all, or substantially all, federal income taxes. Accordingly, no provision for federal income taxes is required in the financial statements. The Funds have a tax year end of December 31.
Management of the Funds has reviewed tax positions taken in tax years that remain subject to examination by all major tax jurisdictions, including federal (i.e., the last four tax year ends and the interim tax period since then). Management believes that there is no tax liability resulting from unrecognized tax benefits related to uncertain tax positions taken.
Allocations:
Expenses directly attributable to a Fund are charged to the Fund, while expenses which are attributable to more than one fund in the Trust, or jointly with an affiliated trust, are allocated among the respective funds in the Trust and/or affiliated trust based upon net assets or another appropriate basis.
Income, expenses (other than class specific expenses such as transfer agent fees, state registration fees, printing and 12b-1 fees), and realized and unrealized gains or losses on investments are allocated to each class of shares based on its relative net assets on the date income is earned or expenses and realized and unrealized gains and losses are incurred.
Affiliated Securities Transactions:
Pursuant to Rule 17a-7 under the 1940 Act, the Funds may engage in securities transactions with affiliated investment companies and advisory accounts managed by the Adviser and any applicable sub-adviser. Any such purchase or sale transaction must be effected without brokerage commission or other remuneration, except for customary transfer fees. The transaction must be effected at the current market price, which is either the security's last sale price on an exchange or, if there are no transactions in the security that day, at the average of the highest bid and lowest asked price. For the six months ended June 30, 2018, the Funds did not engage in any Rule 17a-7 transactions under the 1940 Act.
49
Victory Portfolios | | Notes to Financial Statements — continued
June 30, 2018 | |
(Unaudited)
3. Purchases and Sales of Securities:
Purchases and sales of securities (excluding securities maturing less than one year from acquisition) for the six months ended June 30, 2018 were as follows:
| | | Purchases | | Sales | |
RS Partners Fund | | $ | 182,941,747 | | | $ | 240,465,873 | | |
RS Value Fund | | | 167,833,768 | | | | 223,484,372 | | |
RS Large Cap Alpha Fund | | | 158,088,464 | | | | 198,439,550 | | |
RS Investors Fund | | | 15,764,985 | | | | 26,829,710 | | |
Global Natural Resources Fund | | | 178,216,040 | | | | 279,252,539 | | |
For the six months ended June 30, 2018, there were no purchases or sales of U.S. Government Securities.
4. Fees and Transactions with Affiliates and Related Parties:
Investment advisory services are provided to the Funds by Victory Capital Management Inc. ("VCM" or the "Adviser"), a New York corporation registered as an investment adviser with the Securities and Exchange Commission ("SEC"). The Adviser is a wholly-owned indirect subsidiary of Victory Capital Holdings, Inc., a publicly traded Delaware corporation and a wholly-owned direct subsidiary of Victory Capital Operating, LLC.
VCM has entered into a Sub-Advisory Agreement with SailingStone Capital Partners LLC ("SailingStone"). SailingStone is responsible for providing day-to-day investment advisory services to the Global Natural Resources Fund, subject to the oversight of the Board of Trustees of the Trust. Sub-investment advisory fees are paid by VCM to SailingStone and do not represent a separate or additional expense to the Funds.
Under the terms of the Investment Advisory Agreement, the Adviser is entitled to receive fees based on a percentage of the average daily net assets of each Fund. The rates at which the Adviser is paid by each Fund are included in the table below. The Adviser may use its resources to assist with the Funds' distribution and marketing expenses.
| | | Adviser Fee Rate | |
RS Partners Fund | | | 1.00 | % | |
RS Value Fund | | | 0.85 | % | |
RS Large Cap Alpha Fund | | | 0.50 | % | |
RS Investors Fund | | | 1.00 | % | |
Global Natural Resources Fund | | | 1.00 | % | |
VCM also serves as the Funds' administrator and fund accountant. Under an Administration and Fund Accounting Agreement, VCM is paid for its services an annual fee at a rate of 0.08% of the first $15 billion in average daily net assets of the Trust, Victory Variable Insurance Funds and Victory Portfolios II (collectively, the "Trusts"), 0.05% of the average daily net assets above $15 billion to $30 billion of the Trusts and 0.04% of the average daily net assets over $30 billion of the Trusts.
Citi Fund Services Ohio, Inc. ("Citi"), an affiliate of Citibank, N.A., acts as sub-administrator and sub-fund accountant to the Funds pursuant to a Sub-Administration and Sub-Fund Accounting Services Agreement between VCM and Citi. VCM pays Citi a fee for providing these services. The Trust reimburses VCM and Citi for all of their reasonable out-of-pocket expenses incurred in providing these services.
FIS Investor Services, LLC ("FIS") serves as the Funds' transfer agent. Under the Transfer Agent Agreement, the Trust pays FIS a fee for its services and reimburses FIS for all of their reasonable out-of-pocket expenses incurred in providing these services.
The Chief Compliance Officer ("CCO") is an employee of the Adviser, which pays the compensation of the CCO and his support staff. The Trust has entered into an Agreement to provide compliance services with the Adviser, pursuant to which the Adviser furnishes its compliance personnel, including the services of the CCO, and other resources reasonably necessary to provide the Trust with compliance oversight services related to the design, administration and oversight of a
50
Victory Portfolios | | Notes to Financial Statements — continued
June 30, 2018 | |
(Unaudited)
compliance program for the Trust in accordance with Rule 38a-1 under the 1940 Act. The Funds in the Victory Funds complex, in the aggregate, compensate the Adviser for these services.
The Trusts pay an annual retainer to each Independent Trustee, plus an additional annual retainer to the Chairman of the Board. The aggregate amount of the fees and expenses of the Independent Trustees are allocated amongst all the funds in the Trusts and are presented in the Statements of Operations.
Shearman & Sterling LLP provides legal services to the Trust.
Victory Capital Advisers, Inc. (the "Distributor"), an affiliate of the Adviser, serves as distributor for the continuous offering of the shares of the Funds pursuant to a Distribution Agreement between the Distributor and the Trust.
Pursuant to the Distribution and Service Plans adopted in accordance with Rule 12b-1 under the 1940 Act, the Distributor may receive a monthly distribution and service fee, at an annual rate of up to 0.25% of the average daily net assets of Class A Shares, at an annual rate of up to 0.50% of the average daily net assets of Class R Shares and 1.00% of the average daily net assets of Class C Shares of the Funds. The distribution and service fees paid to the Distributor may be used by the Distributor to pay for activities primarily intended to result in the sale of Class A, Class R or Class C Shares of the Funds.
In addition, the Distributor and FIS are entitled to receive commissions on sales of the Class A Shares and redemptions of Class C Shares, respectively, of the Funds. For the six months ended June 30, 2018, the Distributor received approximately $15,473 from commissions earned on sales of Class A Shares and FIS received $1,435 from redemptions of Class C Shares of the Funds.
The Adviser has entered into expense limitation agreements with certain Funds. Under the terms of the agreements, to the extent that ordinary operating expenses incurred by certain classes of a Fund in any fiscal year exceed the expense limit for such classes of the Fund, such excess amount will be the liability of the Adviser. Interest, taxes, brokerage commissions, other expenditures which are capitalized in accordance with GAAP, and other extraordinary expenses not incurred in the ordinary course of a Fund's business are excluded from the expense limitation agreement. As of June 30, 2018, the expense limits (excluding voluntary waivers) are as follows:
| | | Class | | Expense Limit(a) | |
RS Partners Fund | | Class A Shares | | | 1.45 | % | |
RS Partners Fund | | Class R Shares | | | 1.81 | % | |
RS Partners Fund | | Class Y Shares | | | 1.12 | % | |
RS Value Fund | | Class A Shares | | | 1.30 | % | |
RS Value Fund | | Class C Shares | | | 2.07 | % | |
RS Value Fund | | Class R Shares | | | 1.69 | % | |
RS Value Fund | | Class Y Shares | | | 1.06 | % | |
RS Large Cap Alpha Fund | | Class A Shares | | | 0.89 | % | |
RS Large Cap Alpha Fund | | Class C Shares | | | 1.69 | % | |
RS Large Cap Alpha Fund | | Class R Shares | | | 1.26 | % | |
RS Large Cap Alpha Fund | | Class Y Shares | | | 0.68 | % | |
RS Investors Fund | | Class A Shares | | | 1.33 | % | |
RS Investors Fund | | Class C Shares | | | 2.07 | % | |
RS Investors Fund | | Class R Shares | | | 1.95 | % | |
RS Investors Fund | | Class Y Shares | | | 1.05 | % | |
Global Natural Resources Fund | | Class A Shares | | | 1.48 | % | |
Global Natural Resources Fund | | Class C Shares | | | 2.28 | % | |
Global Natural Resources Fund | | Class R Shares | | | 1.86 | % | |
Global Natural Resources Fund | | Class Y Shares | | | 1.15 | % | |
(a) In effect until at least April 30, 2019.
51
Victory Portfolios | | Notes to Financial Statements — continued
June 30, 2018 | |
(Unaudited)
The Funds have agreed to repay fees and expenses that were waived or reimbursed by the Adviser for a period up to three fiscal years after such waiver or reimbursement was made to the extent such payments or repayments would not cause the expenses of a class to exceed the original expense limitation in place at time of the waiver or reimbursement or any expense limitation agreement in place at the time of repayment. Amounts repaid to the Adviser during the six months ended, if any, are reflected on the Statements of Operations as "Recoupment of prior expenses waived/reimbursed by Adviser".
As of June 30, 2018, the following amounts are available to be repaid to the Adviser.
| | | Expires
12/31/19 | | Expires
12/31/20 | | Expires
12/31/21 | | Total | |
RS Partners Fund | | $ | 243,315 | | | $ | 487,905 | | | $ | 215,654 | | | $ | 946,874 | | |
RS Value Fund | | | 295,499 | | | | 94,907 | | | | 59,617 | | | | 450,023 | | |
RS Large Cap Alpha Fund | | | 137,276 | | | | 283,005 | | | | 116,487 | | | | 536,768 | | |
RS Investors Fund | | | 86,542 | | | | 179,335 | | | | 85,570 | | | | 351,447 | | |
Global Natural Resources Fund | | | 118,930 | | | | 697,524 | | | | 317,740 | | | | 1,134,194 | | |
The Adviser may voluntarily waive or reimburse additional fees to assist the Funds in maintaining competitive expense ratios. Voluntary waivers and reimbursements applicable to the Funds are not available to be recouped at a future time. There were no voluntary waivers or reimbursements for the six months ended June 30, 2018.
Certain officers and/or interested trustees of the Funds are also officers and/or employees of the Adviser, Administrator and Fund Accountant, Sub-Administrator and Sub-Fund Accountant, and Legal.
5. Risks:
Each Fund may be subject to other risks in addition to these identified risks.
An investment in the Funds' shares represents an indirect investment in the securities owned by the Funds, some of which will be traded on a national securities exchange or in the over-the-counter markets. The value of the securities in which the Funds invest, like other market investments, may move up or down, sometimes rapidly and unpredictably. The value of the securities in which the Funds invest may affect the value of the Funds' shares. An investment in the Funds' shares at any point in time may be worth less than the original investment, even after taking into account the reinvestment of the Funds' distributions.
The Funds will be subject to credit risk with respect to the amount each expects to receive from counterparties for financial instruments entered into by the Funds. The Funds may be negatively impacted if a counterparty becomes bankrupt or otherwise fails to perform its obligations due to financial difficulties. The Funds may experience significant delays in obtaining any recovery in bankruptcy or other reorganization proceeding and the Funds may obtain only limited recovery or may obtain no recovery in such circumstances. The Funds typically enter into transactions with counterparties whose credit ratings are investment grade, as determined by a nationally recognized statistical rating organization or, if unrated, judged by the Adviser to be of comparable quality.
6. Borrowing and Interfund Lending:
Line of Credit:
The Trusts participate in a short-term, demand note "Line of Credit" agreement with Citibank. Under the agreement with Citibank as of July 28, 2017, the Trusts may borrow up to $250 million, of which $100 million is committed and $150 million is uncommitted. $40 million of the Line of Credit is reserved for use by the Victory RS Floating Rate Fund, another series of the Trust, with that Fund paying the related commitment fees for that amount. The purpose of the agreement is to meet temporary or emergency cash needs, including redemption requests that might otherwise require the untimely disposition of securities. The agreement was subsequently amended on July 27, 2018 with a new termination date of July 26, 2019. Citibank receives an annual
52
Victory Portfolios | | Notes to Financial Statements — continued
June 30, 2018 | |
(Unaudited)
commitment fee of 0.15% on $100 million for providing the Line of Credit. For the six months ended June 30, 2018, Citibank earned approximately $74,384 in commitment fees from the Trusts. Each fund in the Trusts pays a pro-rata portion of the commitment fees plus any interest on amounts borrowed. As of June 30, 2018, the interest rate on outstanding borrowings was 3.10%.
The Funds did not utilize or participate in the Line of Credit during the six months ended June 30, 2018.
Interfund Lending:
The Trust and Adviser rely on an exemptive order granted by the SEC in March 2017 (the "Order"), permitting the establishment and operation of an Interfund Lending Facility (the "Facility").The Facility allows the Funds to directly lend and borrow money to or from any other Victory Fund relying upon the Order at rates beneficial to both the borrowing and lending funds. Advances under the Facility are allowed for temporary or emergency purposes, including the meeting of redemption requests that otherwise might require the untimely disposition of securities, and are subject to each Fund's borrowing restrictions. The interfund loan rate is determined, as specified in the Order, by averaging the current repurchase agreement rate and the current bank loan rate.
The Funds did not utilize or participate in the Facility during the six months ended June 30, 2018.
7. Federal Income Tax Information:
The tax character of distributions paid and the tax basis of current components of accumulated earnings-(deficit) will be determined at the end of the current tax year ending December 31, 2018.
The tax character of distributions paid during the most recent tax year ended December 31, 2017, were as follows (total distributions paid may differ from the Statements of Changes in Net Assets because, for tax purposes, dividends are recognized when actually paid):
| | | Year Ended December 31, 2017 | |
| | | Distributions paid from | | | | | |
| | | Ordinary
Income | | Net
Long-Term
Capital Gains | | Total
Taxable
Distributions | | Total
Distributions
Paid | |
RS Partners Fund | | $ | 27,885,158 | | | $ | 88,114,651 | | | $ | 115,999,809 | | | $ | 115,999,809 | | |
RS Value Fund | | | 22,401,444 | | | | 81,534,328 | | | | 103,935,772 | | | | 103,935,772 | | |
RS Large Cap Alpha Fund | | | 5,230,241 | | | | 42,902,726 | | | | 48,132,967 | | | | 48,132,967 | | |
RS Investors Fund | | | 2,473,494 | | | | 7,358,125 | | | | 9,831,619 | | | | 9,831,619 | | |
As of the most recent tax year ended December 31, 2017, the components of accumulated earnings (deficit) on a tax basis were as follows:
| | | Undistributed
Ordinary
Income | | Undistributed
Long-Term
Capital Gains | | Accumulated
Earnings | | Accumulated
Capital and
Other
Losses | | Qualified
Late-Year
Losses* | | Unrealized
Appreciation
(Depreciation)** | | Total
Accumulated
Earnings
(Deficit) | |
RS Partners
Fund | | $ | — | | | $ | 9,848,611 | | | $ | 9,848,611 | | | $ | — | | | $ | — | | | $ | 153,373,504 | | | $ | 163,222,115 | | |
RS Value Fund | | | 5,000,384 | | | | 4,680,811 | | | | 9,681,195 | | | | — | | | | — | | | | 82,531,081 | | | | 92,212,276 | | |
RS Large Cap
Alpha Fund | | | 9,035,726 | | | | 6,616,617 | | | | 15,652,343 | | | | — | | | | — | | | | 141,471,815 | | | | 157,124,158 | | |
RS Investors
Fund | | | 626,175 | | | | 349,939 | | | | 976,114 | | | | — | | | | — | | | | 8,784,810 | | | | 9,760,924 | | |
Global Natural
Resources
Fund | | | — | | | | — | | | | — | | | | (1,166,591,799 | ) | | | (8,323 | ) | | | (213,862,567 | ) | | | (1,380,462,689 | ) | |
* Late-year ordinary specified losses are comprised of post-October specified losses and post-October capital losses incurred after October 31, 2017. These losses are deemed to arise on the first day of the Fund's next taxable year.
53
Victory Portfolios | | Notes to Financial Statements — continued
June 30, 2018 | |
(Unaudited)
** The difference between the book-basis and tax-basis of unrealized appreciation (depreciation) is attributable primarily to tax deferral of losses on wash sales and mark to market adjustments on passive foreign investment companies.
Capital loss carry forwards ("CLCFs") subject to expiration are applied as short-term capital loss regardless of whether the originating capital loss was short-term or long-term. CLCFs that are not subject to expiration are applied as either short-term or long-term depending on the originating capital loss and must be utilized before those that are subject to expiration.
As of the most recent tax year ended December 31, 2017, the following Funds had net capital loss carryforwards ("CLCFs") as summarized in the tables below. CLCFs subject to expiration are applied as short-term capital loss regardless of whether the originating capital loss was short-term or long-term. CLCFs that are not subject to expiration are applied as either short-term or long-term depending on the originating capital loss and must be utilized before those that are subject to expiration.
CLCFs not subject to expiration:
| | | Short-Term
Amount | | Long-Term
Amount | | Total | |
Global Natural Resources Fund | | $ | — | | | $ | 1,166,591,799 | | | $ | 1,166,591,799 | | |
During the most recent tax year ended December 31, 2017, the RS Investors Fund utilized $5,461,962 of capital loss carryforwards.
At June 30, 2018, the cost basis for federal income tax purposes, gross unrealized appreciation, gross unrealized depreciation and net unrealized appreciation (depreciation) for investments were as follows:
| | Cost of
Investments
for Federal
Tax Purposes | | Gross
Unrealized
Appreciation | | Gross
Unrealized
Depreciation | | Net
Unrealized
Appreciation
(Depreciation) | |
RS Partners Fund | | $ | 489,775,957 | | | $ | 115,116,510 | | | $ | (8,496,149 | ) | | $ | 106,620,361 | | |
RS Value Fund | | | 446,682,137 | | | | 58,720,311 | | | | (15,259,879 | ) | | | 43,460,432 | | |
RS Large Cap Alpha Fund | | | 510,719,836 | | | | 107,704,483 | | | | (12,792,234 | ) | | | 94,912,249 | | |
RS Investors Fund | | | 48,290,885 | | | | 6,253,293 | | | | (917,355 | ) | | | 5,335,938 | | |
Global Natural
Resources Fund | | | 1,569,823,282 | | | | 153,143,414 | | | | (353,485,731 | ) | | | (200,342,317 | ) | |
8. Capital Contribution from Prior Custodian:
During 2016, certain Funds received notification from their prior custodian, State Street Bank and Trust ("State Street"), related to over-billing on certain categories of expenses during the approximately 16-year period from 1998 through October 31, 2014. The over-billing primarily related to categories of expenses that involved an allocation of general costs among multiple clients.
State Street paid the refunded amounts during January 2017. Based on billing information received during 2016 from State Street and an analysis of any expense limitation agreements that were in place during the period of the over-billing, including the application of any recoupment provisions in such agreements, the Adviser received a portion of the refund.
The portion of the refund retained by the Funds was accounted for as a capital contribution and is reflected on the Financial Highlights as "Capital Contribution from Prior Custodian, Net".
54
Victory Portfolios | | Notes to Financial Statements — continued
June 30, 2018 | |
(Unaudited)
9. Fund Ownership:
Ownership of more than 25% of the voting securities of a fund creates presumptions of control of the fund, under section 2(a)(9) of the 1940 Act. As of June 30, 2018, the shareholders listed below held more than 25% of the shares outstanding of the Funds and may be deemed to control those Funds.
Shareholder | | Fund | | Percent | |
National Financial Services LLC | | RS Partners Fund | | | 25.8 | % | |
National Financial Services LLC | | Global Natural Resources Fund | | | 34.3 | % | |
10. Recent Accounting Pronouncements:
In October 2016, the SEC released its Final Rules on Investment Company Reporting Modernization (the "Rules"). The Rules introduced two new regulatory reporting forms for investment companies, Form N-PORT and Form N-CEN. The Funds' compliance date for Form N-PORT is June 1, 2018, and the Funds will make their initial filing with the SEC on Form N-PORT for the period ending March 31, 2019. Effective with the period ended June 30, 2018, the Funds will be required to maintain, and make available to the SEC upon request, the information required to be included in Form N-PORT. Form N-PORT will replace Form N-Q filings effective with the requirement to file the Form N-PORT with the SEC for the period ending March 31, 2019. The Funds' compliance date for Form N-CEN is June 1, 2018, and the Funds will make their initial filing on Form N-CEN for the period ending December 31, 2018. Form N-CEN will replace Form N-SAR filings. The Funds' adoption of these amendments have no effect on the Funds' net assets or results of operations.
In March 2017, the FASB issued Accounting Standards Update No. 2017-08 "Premium Amortization on Purchased Callable Debt Securities" ("ASU 2017-08"), which shortens the premium amortization period for purchased non-contingently callable debt securities. ASU 2017-08 specifies that the premium amortization period ends at the earliest call date, for purchased non-contingently callable debt securities. ASU 2017-08 is effective for fiscal years, and interim periods within those fiscal years, beginning after December 15, 2018. Management is currently evaluating the implications of ASU 2017-08 and its impact on the financial statements and related disclosures has not yet been determined.
11. Subsequent Events:
The Funds have evaluated the need for additional disclosures or adjustments resulting from subsequent events through the date these financial statements were issued. Based on this evaluation, there were no subsequent events to report that would have a material impact on the Funds' financial statements.
55
Victory Portfolios | | Supplemental Information
June 30, 2018 | |
(Unaudited)
Trustee and Officer Information
Board of Trustees:
Overall responsibility for management of the Trust rests with the Board. The Trust is managed by the Board in accordance with the laws of the State of Delaware. There are currently ten Trustees, nine of whom are not "interested persons" of the Trust within the meaning of that term under the 1940 Act ("Independent Trustees") and one of whom is an "interested person" of the Trust within the meaning of that term under the 1940 Act ("Interested Trustee"). The Trustees, in turn, elect the officers of the Trust to actively supervise its day-to-day operations.
The following tables list the Trustees, their ages, position with the Trust, commencement of service, principal occupations during the past five years and any directorships of other investment companies or companies whose securities are registered under the Securities Exchange Act of 1934, as amended, or who file reports under that Act. Each Trustee oversees 42 portfolios in the Trust, nine portfolios in Victory Variable Insurance Funds, one portfolio in Victory Institutional Funds and 20 portfolios in Victory Portfolios II, each a registered investment company that, together with the Trust, comprise the Victory Fund Complex. Each Trustee's address is c/o Victory Portfolios, 4900 Tiedeman Road, 4th Floor, Brooklyn, Ohio 44144. Each Trustee has an indefinite term.
Name and Age | | Position
Held with
the Trust | | Date
Commenced
Service | | Principal Occupation
During Past 5 Years | | Other
Directorships
Held During
Past 5 Years | |
Independent Trustees. | |
David Brooks Adcock, 66 | | Trustee | | May 2005 | | Consultant (since 2006). | | Chair and Trustee, Turner Funds (December 2016-December 2017). | |
Nigel D. T. Andrews, 71 | | Vice Chair and Trustee | | August 2002 | | Retired. | | Director, TCG BDC II, Inc. (since 2017); Director, TCG BDC I, Inc. (formerly Carlyle GMS Finance, Inc.) (since 2012); Director, Old Mutual US Asset Management (2002-2014). | |
E. Lee Beard, 67* | | Trustee | | May 2005 | | Retired (since 2015); Consultant, The Henlee Group, LLC (consulting) (2005-2015). | | None. | |
Dennis M. Bushe, 74 | | Trustee | | July 2016 | | Retired. | | Trustee, RS Investment Trust and RS Variable Products Trust (November 2011-July 2016). | |
56
Victory Portfolios | | Supplemental Information — continued
June 30, 2018 | |
(Unaudited)
Name and Age | | Position
Held with
the Trust | | Date
Commenced
Service | | Principal Occupation
During Past 5 Years | | Other
Directorships
Held During
Past 5 Years | |
Sally M. Dungan, 64 | | Trustee | | February 2011 | | Chief Investment Officer, Tufts University (since 2002). | | None. | |
John L. Kelly, 65 | | Trustee | | February 2015 | | Partner, McCarvill Capital Partners (September 2016-September 2017); Advisor (January 2016-April 2016); and Managing Partner (August 2014-January 2016), Endgate Commodities LLC; Chief Operating Officer, Liquidnet Holdings, Inc. (2011-2014). | | Director, Caledonia Mining Corporation (since May 2012). | |
David L. Meyer, 61* | | Trustee | | December 2008 | | Retired. | | None. | |
Gloria S. Nelund, 57 | | Trustee | | July 2016 | | Chair, CEO and Co-Founder of TriLinc Global, LLC, an investment firm. | | TriLinc Global Impact Fund, LLC (since 2012); Trustee, RS Investment Trust and RS Variable Products Trust (November 2007-July 2016). | |
Leigh A. Wilson, 73 | | Chair and Trustee | | November 1994 | | Private Investor. | | Chair (since 2013), Caledonia Mining Corporation. | |
Interested Trustee. | |
David C. Brown, 46** | | Trustee | | May 2008 | | Chairman and Chief Executive Officer (since August 2013), Co-Chief Executive Officer (2011-2013), the Adviser; Chairman and Chief Executive Officer, Victory Capital Holdings, Inc. (since 2013). | | None. | |
* The Board has designated Mr. Meyer and Ms. Beard as its Audit Committee Financial Experts.
** Mr. Brown is an "Interested Person" by reason of his relationship with the Adviser.
The Statement of Additional Information includes additional information about the Trustees of the Trust and is available, without charge, by calling 800-539-3863.
57
Victory Portfolios | | Supplemental Information — continued
June 30, 2018 | |
(Unaudited)
Officers:
The officers of the Trust, their ages, commencement of service and their principal occupations during the past five years, are detailed in the following table. Each officer serves until the earlier of his or her resignation, removal, retirement, death, or the election of a successor. The mailing address of each officer of the Trust is 4900 Tiedeman Road, 4th Floor, Brooklyn, Ohio 44144. The officers of the Trust receive no compensation directly from the Trust for performing the duties of their offices.
Name and Age | | Position with
the Trust | | Date
Commenced
Service | | Principal Occupation During Past 5 Years | |
Christopher K. Dyer, 56 | | President | | February 2006* | | Director of Mutual Fund Administration, the Adviser. | |
Scott A. Stahorsky, 49 | | Vice President | | December 2014 | | Manager, Fund Administration, the Adviser (since 2015); Senior Analyst, Fund Administration, the Adviser (prior to 2015). | |
Erin G. Wagner, 44 | | Secretary | | December 2014 | | Associate General Counsel, the Adviser (since 2013). | |
Allan Shaer, 53 | | Treasurer | | May 2017 | | Senior Vice President, Financial Administration, Citi Fund Services Ohio, Inc. (since 2016); Vice President, Mutual Fund Administration, JP Morgan Chase (2011-2016). | |
Christopher A. Ponte, 34 | | Assistant Treasurer | | December 2017 | | Manager, Fund Administration, the Adviser (since 2017); Senior Analyst, Fund Administration, the Adviser (prior to 2017). Chief Financial Officer, Victory Capital Advisers, Inc. (since 2018). | |
Colin Kinney, 44 | | Chief Compliance Officer | | July 2017 | | Chief Compliance Officer (since 2013) and Chief Risk Officer (2009-2017), the Adviser. | |
Chuck Booth, 58 | | Anti-Money Laundering Compliance Officer and Identity Theft Officer | | May 2015 | | Director, Regulatory Administration and CCO Support Services, Citi Fund Services Ohio, Inc. | |
Jay G. Baris, 64 | | Assistant Secretary | | December 1997 | | Partner, Shearman & Sterling LLP (since 2018); Partner, Morrison & Foerster LLP (2011-2017). | |
* On December 3, 2014, Mr. Dyer resigned as Secretary of the Trust and accepted the position of President.
58
Victory Portfolios | | Supplemental Information — continued
June 30, 2018 | |
(Unaudited)
Proxy Voting and Form N-Q Information
Proxy Voting:
Information regarding the policies and procedures that the Funds use to determine how to vote proxies relating to portfolio securities is available without charge, upon request, by calling 800-539-3863. The information is also included in the Funds' Statement of Additional Information, which is available on the SEC's website at www.sec.gov.
Information relating to how the Funds voted proxies relating to portfolio securities held during the most recent twelve months ended June 30 is available on the SEC's website at www.sec.gov.
Availability of Schedules of Portfolio Investments:
The Trust files a complete list of Schedules of Portfolio Investments with the SEC for the first and third quarters of each fiscal year on Form N-Q. Forms N-Q are available on the SEC's website at www.sec.gov. You may also review or, for a fee, copy those documents by visiting the SEC's Public Reference Room in Washington, D.C. Information on the operation of the Public Reference Room can be obtained by calling the SEC at 202-551-8090.
Expense Examples
As a shareholder of the Funds, you may incur two types of costs: (1) transaction costs, including sales charges (loads) on purchases; and (2) ongoing costs, including management fees, distribution and service (12b-1) fees, and other Fund expenses. These examples are intended to help you understand your ongoing costs (in dollars) of investing in the Funds and to compare these costs with the ongoing costs of investing in other mutual funds.
These examples are based on an investment of $1,000 invested at the beginning of the period and held for the entire period from January 1, 2018 through June 30, 2018.
Actual Expenses:
The table below provides information about actual account values and actual expenses. You may use the information below, together with the amount you invested, to estimate the expenses that you paid over the period. Simply divide your account value by $1,000 (for example, an $8,600 account value divided by $1,000 = 8.6), then multiply the result by the number in the table under the heading entitled "Expenses Paid During Period" to estimate the expenses you paid on your account during this period.
| | | Beginning
Account Value
1/1/18 | | Ending
Account Value
6/30/18 | | Expenses Paid
During Period*
1/1/18-6/30/18 | | Annualized Net
Expense Ratio
During Period
1/1/18-6/30/18 | |
RS Partners Fund | |
Class A Shares | | $ | 1,000.00 | | | $ | 1,001.00 | | | $ | 7.19 | | | | 1.45 | % | |
Class R Shares | | | 1,000.00 | | | | 998.90 | | | | 8.97 | | | | 1.81 | % | |
Class Y Shares | | | 1,000.00 | | | | 1,002.60 | | | | 5.56 | | | | 1.12 | % | |
RS Value Fund | |
Class A Shares | | | 1,000.00 | | | | 994.30 | | | | 6.43 | | | | 1.30 | % | |
Class C Shares | | | 1,000.00 | | | | 990.70 | | | | 10.22 | | | | 2.07 | % | |
Class R Shares | | | 1,000.00 | | | | 992.40 | | | | 8.35 | | | | 1.69 | % | |
Class Y Shares | | | 1,000.00 | | | | 995.90 | | | | 5.05 | | | | 1.02 | % | |
RS Large Cap Alpha Fund | |
Class A Shares | | | 1,000.00 | | | | 1,009.50 | | | | 4.43 | | | | 0.89 | % | |
Class C Shares | | | 1,000.00 | | | | 1,005.70 | | | | 8.40 | | | | 1.69 | % | |
Class R Shares | | | 1,000.00 | | | | 1,007.60 | | | | 6.27 | | | | 1.26 | % | |
Class Y Shares | | | 1,000.00 | | | | 1,010.60 | | | | 3.39 | | | | 0.68 | % | |
* Expenses are equal to the average account value multiplied by the Fund's annualized expense ratio multiplied by 181/365 (the number of days in the most recent fiscal half-year divided by the number of days in the fiscal year).
59
Victory Portfolios | | Supplemental Information — continued
June 30, 2018 | |
(Unaudited)
| | | Beginning
Account Value
1/1/18 | | Ending
Account Value
6/30/18 | | Expenses Paid
During Period*
1/1/18-6/30/18 | | Annualized Net
Expense Ratio
During Period
1/1/18-6/30/18 | |
RS Investors Fund | |
Class A Shares | | $ | 1,000.00 | | | $ | 1,009.40 | | | $ | 6.63 | | | | 1.33 | % | |
Class C Shares | | | 1,000.00 | | | | 1,005.50 | | | | 10.29 | | | | 2.07 | % | |
Class R Shares | | | 1,000.00 | | | | 1,007.00 | | | | 9.70 | | | | 1.95 | % | |
Class Y Shares | | | 1,000.00 | | | | 1,011.30 | | | | 5.24 | | | | 1.05 | % | |
RS Global Natural Resources Fund | |
Class A Shares | | | 1,000.00 | | | | 986.10 | | | | 7.29 | | | | 1.48 | % | |
Class C Shares | | | 1,000.00 | | | | 982.00 | | | | 11.20 | | | | 2.28 | % | |
Class R Shares | | | 1,000.00 | | | | 984.50 | | | | 9.15 | | | | 1.86 | % | |
Class Y Shares | | | 1,000.00 | | | | 987.40 | | | | 5.67 | | | | 1.15 | % | |
* Expenses are equal to the average account value multiplied by the Fund's annualized expense ratio multiplied by 181/365 (the number of days in the most recent fiscal half-year divided by the number of days in the fiscal year).
60
Victory Portfolios | | Supplemental Information — continued
June 30, 2018 | |
(Unaudited)
Hypothetical Example for Comparison Purposes:
The table below provides information about hypothetical account values and hypothetical expenses based on each Fund's actual expense ratio and an assumed rate of return of 5% per year before expenses, which is not the Fund's actual return. The hypothetical account values and expenses may not be used to estimate the actual ending account balance or expenses you paid for the period. You may use this information to compare this 5% hypothetical example with the 5% hypothetical examples that appear in the shareholder reports of other funds.
Please note that the expenses shown in the table are meant to highlight your ongoing costs only and do not reflect any transactional costs. Therefore, the table is useful in comparing ongoing costs only, and will not help you determine the relative total costs of owning different funds. In addition, if these transactional costs were included, your costs would have been higher.
| | | Beginning
Account Value
1/1/18 | | Ending
Account Value
6/30/18 | | Expenses Paid
During Period*
1/1/18-6/30/18 | | Annualized Net
Expense Ratio
During Period
1/1/18-6/30/18 | |
RS Partners Fund | |
Class A Shares | | $ | 1,000.00 | | | $ | 1,017.60 | | | $ | 7.25 | | | | 1.45 | % | |
Class Y Shares | | | 1,000.00 | | | | 1,015.82 | | | | 9.05 | | | | 1.81 | % | |
Class R Shares | | | 1,000.00 | | | | 1,019.24 | | | | 5.61 | | | | 1.12 | % | |
RS Value Fund | |
Class A Shares | | | 1,000.00 | | | | 1,018.35 | | | | 6.51 | | | | 1.30 | % | |
Class C Shares | | | 1,000.00 | | | | 1,014.53 | | | | 10.34 | | | | 2.07 | % | |
Class R Shares | | | 1,000.00 | | | | 1,016.41 | | | | 8.45 | | | | 1.69 | % | |
Class Y Shares | | | 1,000.00 | | | | 1,019.74 | | | | 5.11 | | | | 1.02 | % | |
RS Large Cap Alpha Fund | |
Class A Shares | | | 1,000.00 | | | | 1,020.38 | | | | 4.46 | | | | 0.89 | % | |
Class C Shares | | | 1,000.00 | | | | 1,016.41 | | | | 8.45 | | | | 1.69 | % | |
Class R Shares | | | 1,000.00 | | | | 1,018.55 | | | | 6.31 | | | | 1.26 | % | |
Class Y Shares | | | 1,000.00 | | | | 1,021.42 | | | | 3.41 | | | | 0.68 | % | |
RS Investors Fund | |
Class A Shares | | | 1,000.00 | | | | 1,018.20 | | | | 6.66 | | | | 1.33 | % | |
Class C Shares | | | 1,000.00 | | | | 1,014.53 | | | | 10.34 | | | | 2.07 | % | |
Class R Shares | | | 1,000.00 | | | | 1,015.12 | | | | 9.74 | | | | 1.95 | % | |
Class Y Shares | | | 1,000.00 | | | | 1,019.59 | | | | 5.26 | | | | 1.05 | % | |
RS Global Natural Resources Fund | |
Class A Shares | | | 1,000.00 | | | | 1,017.46 | | | | 7.40 | | | | 1.48 | % | |
Class C Shares | | | 1,000.00 | | | | 1,013.49 | | | | 11.38 | | | | 2.28 | % | |
Class R Shares | | | 1,000.00 | | | | 1,015.57 | | | | 9.30 | | | | 1.86 | % | |
Class Y Shares | | | 1,000.00 | | | | 1,019.09 | | | | 5.76 | | | | 1.15 | % | |
* Expenses are equal to the average account value multiplied by the Fund's annualized expense ratio multiplied by 181/365 (the number of days in the most recent fiscal half-year divided by the number of days in the fiscal year).
61
Victory Portfolios | | Supplemental Information — continued
June 30, 2018 | |
(Unaudited)
Portfolio Holdings:
(As a Percentage of Total Investments)
RS Partners Fund | | RS Value Fund | |

| | 
| |
RS Large Cap Alpha Fund | | RS Investors Fund | |

| | 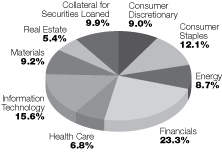
| |
Global Natural Resources Fund | |

| | | |
62
Privacy Policy
Protecting the Privacy of Information
The Trust respects your right to privacy. We also know that you expect us to conduct and process your business in an accurate and efficient manner. To do so, we must collect and maintain certain personal information about you. This is the information we collect from you on applications or other forms, and from the transactions you make with us or third parties. It may include your name, address, social security number, account transactions and balances, and information about investment goals and risk tolerance.
We do not disclose any information about you or about former customers to anyone except as permitted or required by law. Specifically, we may disclose the information we collect to companies that perform services on our behalf, such as the transfer agent that processes shareholder accounts and printers and mailers that assist us in the distribution of investor materials. We may also disclose this information to companies that perform marketing services on our behalf. This allows us to continue to offer you Victory investment products and services that meet your investing needs, and to effect transactions that you request or authorize. These companies will use this information only in connection with the services for which we hired them. They are not permitted to use or share this information for any other purpose.
To protect your personal information internally, we permit access only by authorized employees and maintain physical, electronic and procedural safeguards to guard your personal information.*
*You may have received communications regarding information about privacy policies from other financial institutions which gave you the opportunity to "opt-out" of certain information sharing with companies which are not affiliated with that financial institution. The Trust does not share information with other companies for purposes of marketing solicitations for products other than the Trust. Therefore, the Trust does not provide opt-out options to their shareholders.
Victory Funds
P.O. Box 182593
Columbus, Ohio 43218-2593

Visit our website at: | | Call Victory at: | |
www.vcm.com | | 800-539-FUND (800-539-3863) | |
Item 2. Code of Ethics.
Not applicable — only for annual reports.
Item 3. Audit Committee Financial Expert.
Not applicable — only for annual reports.
Item 4. Principal Accountant Fees and Services.
Not applicable — only for annual reports.
Item 5. Audit Committee of Listed Registrants.
Not applicable.
Item 6. Investments.
(a) Not applicable.
(b) Not applicable.
Item 7. Disclosure of Proxy Voting Policies and Procedures for Closed-End Management Investment Companies.
Not applicable.
Item 8. Portfolio Managers of Closed-End Management Investment Companies.
Not applicable.
Item 9. Purchases of Equity Securities by Closed-End Management Investment Company and Affiliated Purchasers.
Not applicable.
Item 10. Submission of Matters to a Vote of Security Holders.
Not applicable.
Item 11. Controls and Procedures.
(a) The registrant’s principal executive officer and principal financial officer have concluded, based on their evaluation of the registrant’s disclosure controls and procedures as conducted within 90 days of the filing date of this report, that these disclosure controls and procedures are adequately designed and are operating effectively to ensure that information required to be disclosed by the registrant on Form N-CSR is recorded, processed, summarized and reported within the time periods specified in the Securities and Exchange Commission’s rules and forms.
(b) There were no changes in the registrant’s internal control over financial reporting (as defined in Rule 30a-3(d) under the Investment Company Act of 1940 (17 CFR 270.30a-3(d)) that occurred during the period covered by this report that have materially affected or are reasonably likely to materially affect, the registrant’s internal control over financial reporting.
Item 12. Disclosure of Securities Lending Activities for Closed-End Management Investment Companies.
(a)(1) Not applicable.
(a)(2) Not applicable.
(a)(3) Not applicable.
(a)(4) Not applicable.
(b) Not applicable.
Item 13. Exhibits.
(a)(1) Not applicable.
(a)(2) Certifications pursuant to Rule 30a-2(a) are attached hereto.
(a)(3) Not applicable.
(b) Certifications pursuant to Rule 30a-2(b) are furnished herewith.
SIGNATURES
Pursuant to the requirements of the Securities Exchange Act of 1934 and the Investment Company Act of 1940, the registrant has duly caused this report to be signed on its behalf by the undersigned, thereunto duly authorized.
(Registrant) | Victory Portfolios | |
| | |
By (Signature and Title)* | /s/ Allan Shaer | |
| Allan Shaer, Principal Financial Officer | |
Date | August 24, 2018 | |
| | | | | |
Pursuant to the requirements of the Securities Exchange Act of 1934 and the Investment Company Act of 1940, this report has been signed below by the following persons on behalf of the registrant and in the capacities and on the dates indicated.
By (Signature and Title)* | /s/ Christopher K. Dyer | |
| Christopher K. Dyer, Principal Executive Officer | |
Date | August 24, 2018 | |
| | |
By (Signature and Title)* | /s/ Allan Shaer | |
| Allan Shaer, Principal Financial Officer | |
Date | August 24, 2018 | |
| | | |