UNITED STATES
SECURITIES AND EXCHANGE COMMISSION
Washington, D.C. 20549
FORM N-CSR
CERTIFIED SHAREHOLDER REPORT OF REGISTERED
MANAGEMENT INVESTMENT COMPANIES
Investment Company Act file number | 811-04852 |
|
Victory Portfolios |
(Exact name of registrant as specified in charter) |
|
4900 Tiedeman Road, 4th Floor, Brooklyn, Ohio | | 44144 |
(Address of principal executive offices) | | (Zip code) |
|
Citi Fund Services Ohio, Inc., 4400 Easton Commons, Suite 200, Columbus, Ohio 43219 |
(Name and address of agent for service) |
|
Registrant’s telephone number, including area code: | 800-539-3863 | |
|
Date of fiscal year end: | December 31 | |
|
Date of reporting period: | June 30, 2019 | |
| | | | | | | | |
Item 1. Reports to Stockholders.

June 30, 2019
Semi Annual Report
Victory INCORE Investment Quality Bond Fund
Victory INCORE Low Duration Bond Fund
Victory High Yield Fund
Victory Tax-Exempt Fund
Victory High Income Municipal Bond Fund
Victory Floating Rate Fund
Victory Strategic Income Fund
Beginning on January 1, 2021, as permitted by regulations adopted by the Securities and Exchange Commission, paper copies of the Victory Funds' shareholder reports will no longer be sent by mail, unless you specifically request paper copies of the reports from the Victory Funds or from your financial intermediary, such as a broker-dealer or bank. Instead, the reports will be made available on www.VictoryFunds.com, and you will be notified by mail each time a report is posted and provided with a website link to access the report. If you already elected to receive shareholder reports electronically, you will not be affected by this change, and you need not take any action.
You may elect to receive shareholder reports and other communications from the Victory Funds or your financial intermediary electronically sooner than January 1, 2021 by notifying your financial intermediary directly or, if you are a direct investor, by calling 800-539-3863 or by sending an e-mail request to TA.Processing@FISGlobal.com.
You may elect to receive all future reports in paper free of charge. If you invest through a financial intermediary, you can contact your financial intermediary to request that you continue to receive paper copies of your reports. If you invest directly with the Victory Funds, you can call 800-539-3863 or send an e-mail request to TA.Processing@FISGlobal.com. Your election to receive reports in paper will apply to all Victory Funds you hold directly or through your financial intermediary.
www.vcm.com
News, Information And Education 24 Hours A Day, 7 Days A Week
The Victory Funds site gives fund shareholders, prospective shareholders, and investment professionals a convenient way to access fund information, get guidance, and track fund performance anywhere they can access the Internet. The site includes:
• Detailed performance records
• Daily share prices
• The latest fund news
• Investment resources to help you become a better investor
• A section dedicated to investment professionals
Whether you're a potential investor searching for the fund that matches your investment philosophy, a seasoned investor interested in planning tools, or an investment professional, www.vcm.com has what you seek. Visit us anytime. We're always open.
Table of Contents
Financial Statements | |
The Victory Fixed Income Funds | |
Victory INCORE Investment Quality Bond Fund | |
Investment Objectives & Portfolio Holdings | | | 5 | | |
Schedule of Portfolio Investments | | | 7 | | |
Statements of Assets and Liabilities | | | 42 | | |
Statements of Operations | | | 45 | | |
Statements of Changes in Net Assets | | | 48-50 | | |
Financial Highlights | | | 56-57 | | |
Victory INCORE Low Duration Bond Fund | |
Investment Objectives & Portfolio Holdings | | | 5 | | |
Schedule of Portfolio Investments | | | 13 | | |
Statements of Assets and Liabilities | | | 42 | | |
Statements of Operations | | | 45 | | |
Statements of Changes in Net Assets | | | 48-50 | | |
Financial Highlights | | | 58-61 | | |
Victory High Yield Fund | |
Investment Objectives & Portfolio Holdings | | | 5 | | |
Schedule of Portfolio Investments | | | 20 | | |
Statements of Assets and Liabilities | | | 42 | | |
Statements of Operations | | | 45 | | |
Statements of Changes in Net Assets | | | 48-50 | | |
Financial Highlights | | | 62-63 | | |
Victory Tax-Exempt Fund | |
Investment Objectives & Portfolio Holdings | | | 5 | | |
Schedule of Portfolio Investments | | | 25 | | |
Statements of Assets and Liabilities | | | 43 | | |
Statements of Operations | | | 46 | | |
Statements of Changes in Net Assets | | | 51-53 | | |
Financial Highlights | | | 64-65 | | |
Victory High Income Municipal Bond Fund | |
Investment Objectives & Portfolio Holdings | | | 6 | | |
Schedule of Portfolio Investments | | | 28 | | |
Statements of Assets and Liabilities | | | 43 | | |
Statements of Operations | | | 46 | | |
Statements of Changes in Net Assets | | | 51-53 | | |
Financial Highlights | | | 66-67 | | |
Victory Floating Rate Fund | |
Investment Objectives & Portfolio Holdings | | | 6 | | |
Schedule of Portfolio Investments | | | 31 | | |
Statements of Assets and Liabilities | | | 43 | | |
Statements of Operations | | | 46 | | |
Statements of Changes in Net Assets | | | 51-53 | | |
Financial Highlights | | | 68-69 | | |
1
Table of Contents (continued)
Victory Strategic Income Fund | |
Investment Objectives & Portfolio Holdings | | | 6 | | |
Schedule of Portfolio Investments | | | 37 | | |
Statement of Assets and Liabilities | | | 44 | | |
Statement of Operations | | | 47 | | |
Statements of Changes in Net Assets | | | 54-55 | | |
Financial Highlights | | | 70-73 | | |
Notes to Financial Statements | | | 74 | | |
Supplemental Information | | | 91 | | |
Trustee and Officer Information | | | 91 | | |
Proxy Voting and Portfolio Holdings Information | | | 94 | | |
Expense Examples | | | 94 | | |
Privacy Policy (inside back cover) | |
2
The Funds are distributed by Victory Capital Advisers, Inc. Victory Capital Management Inc. is the investment adviser to the Funds and receives fees from the Funds for performing services for the Funds.
This report is not authorized for distribution to prospective investors unless preceded or accompanied by a current prospectus of the Victory Funds.
For additional information about any Victory Fund, including fees, expenses, and risks, view our prospectus online at www.vcm.com or call 800-539-3863. Read it carefully before you invest or send money.
The information in this semi annual report is based on data obtained from recognized services and sources and is believed to be reliable. Any opinions, projections, or recommendations in this report are subject to change without notice and are not intended as individual investment advice. Past investment performance of the Funds, markets or securities mentioned herein should not be considered to be indicative of future results.
• NOT FDIC INSURED • NO BANK GUARANTEE • MAY LOSE VALUE

Call Victory at:
800-539-FUND (800-539-3863)
Visit our website at:
www.vcm.com
3
This page is intentionally left blank.
4
Victory Portfolios | | June 30, 2019 | |
(Unaudited)
Investment Objectives & Portfolio Holdings:
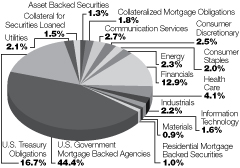
Victory INCORE Investment Quality Bond Fund
Seeks to provide a high level of current income
and capital appreciation without undue risk to principal.
Portfolio Holdings
As a Percentage of Total Investments
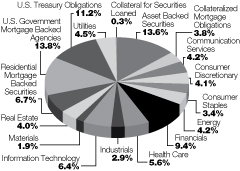
Victory INCORE Low Duration Bond Fund
Seeks to provide a high level of current income
consistent with preservation of capital.
Portfolio Holdings
As a Percentage of Total Investments
Victory High Yield Fund
Seeks to provide current income. Capital
appreciation is a secondary objective.
Portfolio Holdings
As a Percentage of Total Investments

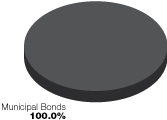
Victory Tax-Exempt Fund
Seeks to maximize current income exempt from
federal income taxes, consistent with the
preservation of capital.
Portfolio Holdings
As a Percentage of Total Investments
5
Victory Portfolios | | June 30, 2019 | |
(Unaudited)
Investment Objectives & Portfolio Holdings: (continued)
Victory High Income Municipal Bond Fund
Seeks to provide a high current income exempt
from federal income taxes with a secondary
objective of capital appreciation.
Portfolio Holdings
As a Percentage of Total Investments

Victory Floating Rate Fund
Seeks to provide a high level of current income.
Portfolio Holdings
As a Percentage of Total Investments

Victory Strategic Income Fund
Seeks to provide a high current income with a
secondary objective of capital appreciation.
Portfolio Holdings
As a Percentage of Total Investments

6
Victory Portfolios
Victory INCORE Investment Quality Bond Fund | | Schedule of Portfolio Investments
June 30, 2019 | |
(Unaudited)
Security Description | | Principal
Amount | | Value | |
Asset Backed Securities (1.3%) | |
Santander Drive Auto Receivables Trust, Series 2017-3, Class B,
2.19%, 3/15/22, Callable 4/15/21 @ 100 (a) | | $ | 213,152 | | | $ | 213,003 | | |
Santander Retail Auto Lease Trust, Series 2018-A, Class B, 3.20%, 4/20/22,
Callable 3/20/21 @ 100 (a) (b) | | | 225,000 | | | | 226,634 | | |
Total Asset Backed Securities (Cost $438,122) | | | 439,637 | | |
Collateralized Mortgage Obligations (1.7%) | |
GS Mortgage Securities Trust, Series 2012-GC6, Class B,
5.84%, 1/10/45 (a) (b) (c) | | | 250,000 | | | | 266,440 | | |
WF-RBS Commercial Mortgage Trust, Series 2012-C6, Class B, 4.70%, 4/15/45 | | | 300,000 | | | | 314,000 | | |
Total Collateralized Mortgage Obligations (Cost $616,966) | | | 580,440 | | |
Corporate Bonds (32.8%) | |
Communication Services (2.7%): | |
AT&T, Inc. | |
3.20%, 3/1/22, Callable 2/1/22 @ 100 (a) | | | 158,000 | | | | 161,299 | | |
4.25%, 3/1/27, Callable 12/1/26 @ 100 (a) | | | 146,000 | | | | 156,398 | | |
5.15%, 11/15/46, Callable 5/15/46 @ 100 (a) | | | 226,000 | | | | 249,805 | | |
SES Global Americas Holdings GP, 5.30%, 3/25/44 (b) | | | 135,000 | | | | 130,591 | | |
Verizon Communications, Inc. | |
5.15%, 9/15/23 (a) | | | 92,000 | | | | 102,818 | | |
3.38%, 2/15/25 | | | 92,000 | | | | 96,040 | | |
| | | | 896,951 | | |
Consumer Discretionary (2.5%): | |
Best Buy Co., Inc., 4.45%, 10/1/28, Callable 7/1/28 @ 100 (a) | | | 130,000 | | | | 137,258 | | |
General Motors Co., 4.88%, 10/2/23 (a) | | | 112,000 | | | | 118,804 | | |
Hasbro, Inc., 6.35%, 3/15/40 (d) | | | 115,000 | | | | 136,574 | | |
Magna International, Inc., 3.63%, 6/15/24, Callable 3/15/24 @ 100 | | | 245,000 | | | | 255,843 | | |
NIKE, Inc., 3.88%, 11/1/45, Callable 5/1/45 @ 100 | | | 100,000 | | | | 107,632 | | |
Ross Stores, Inc., 3.38%, 9/15/24, Callable 6/15/24 @ 100 | | | 70,000 | | | | 72,829 | | |
| | | | 828,940 | | |
Consumer Staples (1.9%): | |
Altria Group, Inc., 4.40%, 2/14/26, Callable 12/14/25 @ 100 (a) | | | 168,000 | | | | 179,772 | | |
Constellation Brands, Inc., 4.65%, 11/15/28, Callable 8/15/28 @ 100 (a) | | | 79,000 | | | | 88,222 | | |
Estee Lauder Cos., Inc., 4.15%, 3/15/47, Callable 9/15/46 @ 100 (d) | | | 52,000 | | | | 58,248 | | |
Mead Johnson Nutrition Co., 4.60%, 6/1/44, Callable 12/1/43 @ 100 (a) (d) | | | 105,000 | | | | 121,035 | | |
Reynolds American, Inc., 5.70%, 8/15/35, Callable 2/15/35 @ 100 | | | 92,000 | | | | 101,164 | | |
Tyson Foods, Inc., 5.10%, 9/28/48, Callable 3/28/48 @ 100 | | | 70,000 | | | | 79,027 | | |
| | | | 627,468 | | |
Energy (2.2%): | |
Continental Resources, 4.50%, 4/15/23, Callable 1/15/23 @ 100 (a) | | | 151,000 | | | | 158,568 | | |
Ecopetrol SA, 5.88%, 9/18/23 (a) | | | 103,000 | | | | 114,045 | | |
Exxon Mobil Corp., 4.11%, 3/1/46, Callable 9/1/45 @ 100 | | | 40,000 | | | | 46,017 | | |
See notes to financial statements.
7
Victory Portfolios
Victory INCORE Investment Quality Bond Fund | | Schedule of Portfolio Investments — continued
June 30, 2019 | |
(Unaudited)
Security Description | | Principal
Amount | | Value | |
Marathon Petroleum Corp. | |
6.50%, 3/1/41, Callable 9/1/40 @ 100 | | $ | 65,000 | | | $ | 80,928 | | |
5.85%, 12/15/45, Callable 6/15/45 @ 100 | | | 50,000 | | | | 55,226 | | |
Statoil ASA, 3.95%, 5/15/43 | | | 20,000 | | | | 21,666 | | |
Valero Energy Corp. | |
4.00%, 4/1/29, Callable 1/1/29 @ 100 (a) | | | 91,000 | | | | 95,373 | | |
6.63%, 6/15/37 | | | 140,000 | | | | 176,931 | | |
| | | | 748,754 | | |
Financials (12.7%): | |
Aflac, Inc. | |
2.88%, 10/15/26, Callable 7/15/26 @ 100 (d) | | | 185,000 | | | | 186,517 | | |
4.75%, 1/15/49, Callable 7/15/48 @ 100 | | | 20,000 | | | | 23,510 | | |
Alleghany Corp., 4.90%, 9/15/44, Callable 3/15/44 @ 100 | | | 89,000 | | | | 96,970 | | |
Bank of America Corp. | |
2.33%(LIBOR03M+63bps), 10/1/21, Callable 10/1/20 @ 100 (a) (e) | | | 130,000 | | | | 129,763 | | |
2.50%, 10/21/22, Callable 10/21/21 @ 100, MTN | | | 285,000 | | | | 285,689 | | |
4.20%, 8/26/24 (a) | | | 204,000 | | | | 216,834 | | |
3.25%, 10/21/27, Callable 10/21/26 @ 100, MTN | | | 100,000 | | | | 102,365 | | |
BB&T Corp., 2.75%, 4/1/22, MTN, Callable 3/1/22 @ 100 | | | 260,000 | | | | 263,179 | | |
Capital One Financial Corp., 3.30%, 10/30/24, Callable 9/30/24 @ 100 (a) | | | 191,000 | | | | 195,888 | | |
Cincinnati Financial Corp., 6.13%, 11/1/34 | | | 135,000 | | | | 171,601 | | |
Citigroup, Inc. | |
2.75%, 4/25/22, Callable 3/25/22 @ 100 | | | 175,000 | | | | 176,635 | | |
4.45%, 9/29/27 (a) | | | 122,000 | | | | 131,449 | | |
3.88%(LIBOR03M+117bps), 1/24/39, Callable 1/24/38 @ 100 (e) | | | 100,000 | | | | 104,146 | | |
Fifth Third Bancorp, 3.65%, 1/25/24, Callable 12/25/23 @ 100 (a) | | | 220,000 | | | | 231,139 | | |
JPMorgan Chase & Co. | |
2.95%, 10/1/26, Callable 7/1/26 @ 100 | | | 170,000 | | | | 172,394 | | |
5.60%, 7/15/41 | | | 90,000 | | | | 116,841 | | |
KeyBank NA, 2.25%, 3/16/20 | | | 580,000 | | | | 579,552 | | |
Morgan Stanley | |
4.88%, 11/1/22 (a) | | | 192,000 | | | | 205,379 | | |
3.75%, 2/25/23 (a) | | | 300,000 | | | | 313,275 | | |
3.13%, 7/27/26, MTN | | | 205,000 | | | | 208,637 | | |
Newcrest Finance Pty Ltd., 5.75%, 11/15/41 (b) | | | 95,000 | | | | 105,812 | | |
The Goldman Sachs Group, Inc., 2.35%, 11/15/21, Callable 11/15/20 @ 100 | | | 115,000 | | | | 114,773 | | |
Wells Fargo & Co., 4.90%, 11/17/45 (a) | | | 80,000 | | | | 92,621 | | |
| | | | 4,224,969 | | |
Health Care (4.1%): | |
Abbott Laboratories, 2.90%, 11/30/21, Callable 10/30/21 @ 100 (a) | | | 267,000 | | | | 271,331 | | |
AbbVie, Inc., 2.30%, 5/14/21, Callable 4/14/21 @ 100 (a) | | | 311,000 | | | | 310,145 | | |
Amgen, Inc., 4.40%, 5/1/45, Callable 11/1/44 @ 100 | | | 70,000 | | | | 74,337 | | |
Bristol-Myers Squibb Co., 3.40%, 7/26/29, Callable 4/26/29 @ 100 (b) | | | 220,000 | | | | 230,465 | | |
Gilead Sciences, Inc., 4.40%, 12/1/21, Callable 9/1/21 @ 100 (a) | | | 465,000 | | | | 486,287 | | |
| | | | 1,372,565 | | |
Industrials (2.2%): | |
Canadian National Railway Co., 3.20%, 8/2/46, Callable 2/2/46 @ 100 | | | 60,000 | | | | 58,705 | | |
Kansas City Southern, 4.95%, 8/15/45, Callable 2/15/45 @ 100 | | | 75,000 | | | | 85,101 | | |
Northrop Grumman Corp., 2.93%, 1/15/25, Callable 11/15/24 @ 100 (a) | | | 195,000 | | | | 198,535 | | |
See notes to financial statements.
8
Victory Portfolios
Victory INCORE Investment Quality Bond Fund | | Schedule of Portfolio Investments — continued
June 30, 2019 | |
(Unaudited)
Security Description | | Principal
Amount | | Value | |
Rockwell Automation, Inc. | |
3.50%, 3/1/29, Callable 12/1/28 @ 100 | | $ | 65,000 | | | $ | 69,233 | | |
6.25%, 12/1/37 | | | 60,000 | | | | 80,835 | | |
Snap-on, Inc., 4.10%, 3/1/48, Callable 9/1/47 @ 100 | | | 56,000 | | | | 60,730 | | |
Valmont Industries, Inc., 5.00%, 10/1/44, Callable 4/1/44 @ 100 (a) | | | 137,000 | | | | 136,731 | | |
| | | | 689,870 | | |
Information Technology (1.6%): | |
Apple, Inc., 4.65%, 2/23/46, Callable 8/23/45 @ 100 | | | 53,000 | | | | 62,886 | | |
Broadcom Corp., 3.00%, 1/15/22, Callable 12/15/21 @ 100 (a) | | | 118,000 | | | | 118,349 | | |
Lam Research Corp., 4.00%, 3/15/29, Callable 12/15/28 @ 100 | | | 114,000 | | | | 121,483 | | |
NVIDIA Corp., 2.20%, 9/16/21, Callable 8/16/21 @ 100 | | | 85,000 | | | | 84,711 | | |
Texas Instruments, Inc., 4.15%, 5/15/48, Callable 11/15/47 @ 100 | | | 95,000 | | | | 107,803 | | |
Tyco Electronics Group SA, 7.13%, 10/1/37 | | | 34,000 | | | | 46,124 | | |
| | | | 541,356 | | |
Materials (0.9%): | |
LYB International Finance II BV, 3.50%, 3/2/27, Callable 12/2/26 @ 100 (a) | | | 121,000 | | | | 123,123 | | |
Rio Tinto Finance USA Ltd. | |
3.75%, 6/15/25, Callable 3/15/25 @ 100 | | | 80,000 | | | | 85,880 | | |
5.20%, 11/2/40 (d) | | | 50,000 | | | | 62,388 | | |
| | | | 271,391 | | |
Utilities (2.0%): | |
Arizona Public Service Co., 2.95%, 9/15/27, Callable 6/15/27 @ 100 | | | 120,000 | | | | 121,426 | | |
Consolidated Edison, Inc., 6.30%, 8/15/37 | | | 110,000 | | | | 146,835 | | |
Exelon Corp. | |
3.95%, 6/15/25, Callable 3/15/25 @ 100 (a) | | | 102,000 | | | | 108,590 | | |
3.40%, 4/15/26, Callable 1/15/26 @ 100 | | | 59,000 | | | | 60,558 | | |
Iberdrola International BV | |
6.75%, 9/15/33 | | | 35,000 | | | | 42,410 | | |
6.75%, 7/15/36 (d) | | | 28,000 | | | | 36,967 | | |
Oklahoma G&E Co., 5.25%, 5/15/41, Callable 11/15/40 @ 100 | | | 105,000 | | | | 120,005 | | |
Public Service Enterprise Group, Inc., 4.00%, 6/1/44, Callable 12/1/43 @ 100 | | | 65,000 | | | | 68,357 | | |
| | | | 705,148 | | |
Total Corporate Bonds (Cost $10,660,301) | | | 10,907,412 | | |
Residential Mortgage Backed Securities (1.0%) | |
Credit Suisse First Boston Mortgage Securities Corp., Series 2002-HE16,
Class M1, 3.72% (LIBOR01M+132bps), 10/25/32, Callable 7/25/19 @ 100 (e) | | | 88,450 | | | | 88,482 | | |
JPMorgan Mortgage Trust, Series 2004-S2, Class 1A3, 4.75%, 11/25/19,
Callable 7/25/19 @ 100 (a) | | | 7,503 | | | | 7,503 | | |
JPMorgan Mortgage Trust, Series 2016-4, Class A5, 3.50%, 10/25/46,
Callable 10/25/39 @ 100 (a) (b) (c) | | | 123,514 | | | | 125,315 | | |
Residential Funding Mortgage Securities I, Inc., Series 2005-S3, Class A1,
4.75%, 3/25/20, Callable 7/25/19 @ 100 (a) | | | 8,761 | | | | 8,761 | | |
Wells Fargo Mortgage Backed Securities Trust, Series 2004-Y, Class 3A1,
4.91%, 11/25/34, Callable 7/25/19 @ 100 (a) (c) | | | 91,504 | | | | 91,504 | | |
Wells Fargo Mortgage Backed Securities Trust, Series 2005-2, Class 2A1,
4.75%, 4/25/20, Callable 7/25/19 @ 100 (a) | | | 3,176 | | | | 3,176 | | |
Total Residential Mortgage Backed Securities (Cost $323,430) | | | 324,741 | | |
See notes to financial statements.
9
Victory Portfolios
Victory INCORE Investment Quality Bond Fund | | Schedule of Portfolio Investments — continued
June 30, 2019 | |
(Unaudited)
Security Description | | Principal
Amount | | Value | |
U.S. Government Mortgage Backed Agencies (43.7%) | |
Federal Home Loan Mortgage Corp. | |
5.00%, 6/15/23 (a) | | $ | 31,500 | | | $ | 32,491 | | |
Series 4139, Class DA, 1.25%, 12/15/27 (a) | | | 466,465 | | | | 455,505 | | |
Series 4395, Class PA, 2.50%, 4/15/37 (a) | | | 155,765 | | | | 156,265 | | |
5.50%, 6/1/38 | | | 52,752 | | | | 57,869 | | |
7.00%, 9/1/38 (a) | | | 17,854 | | | | 21,617 | | |
Series 4320, Class AP, 3.50%, 7/15/39 – 3/1/49 (a) | | | 2,357,024 | | | | 2,434,268 | | |
Series 3713, Class PA, 2.00%, 2/15/40 – 3/15/40 (a) | | | 561,596 | | | | 554,443 | | |
4.50%, 1/1/41 – 7/1/44 (a) | | | 620,944 | | | | 663,266 | | |
Series 4049, Class AB, 2.75%, 12/15/41 (a) | | | 92,206 | | | | 92,739 | | |
Series 4494, Class JA, 3.75%, 5/15/42 (a) | | | 310,528 | | | | 320,837 | | |
| | | | 4,789,300 | | |
Federal National Mortgage Association | |
6.00%, 8/1/21 – 2/1/37 (a) | | | 251,463 | | | | 292,871 | | |
5.50%, 4/1/22 – 1/1/38 (a) | | | 163,005 | | | | 177,684 | | |
7.00%, 8/1/23 – 6/1/32 (a) | | | 23,039 | | | | 26,688 | | |
7.50%, 12/1/29 – 2/1/31 (a) | | | 24,577 | | | | 28,361 | | |
8.00%, 6/1/30 – 9/1/30 (a) | | | 17,765 | | | | 21,069 | | |
5.00%, 12/1/34 – 11/1/36 | | | 11,653 | | | | 12,591 | | |
4.63%(LIBOR12M+166bps), 12/1/36 (a) (e) | | | 38,241 | | | | 39,483 | | |
4.50%, 12/1/38 – 5/25/40 (a) | | | 525,251 | | | | 549,784 | | |
Series 2013-33, Class UD, 2.50%, 4/25/39 – 12/25/47 (a) | | | 357,536 | | | | 359,233 | | |
Series 2013-137, Class A, 3.50%, 3/25/40 – 12/25/50 (a) | | | 1,979,531 | | | | 2,030,669 | | |
Series 2011-101, Class LA, 3.00%, 10/25/40 – 2/25/49 (a) | | | 2,595,530 | | | | 2,630,971 | | |
Series 2013-81, Class KA, 2.75%, 9/25/42 (a) | | | 350,848 | | | | 353,767 | | |
Series 2013-44, Class PB, 1.75%, 1/25/43 (a) | | | 320,296 | | | | 310,544 | | |
4.00%, 11/1/43 – 10/1/48 (a) | | | 2,022,266 | | | | 2,117,546 | | |
| | | | 8,951,261 | | |
Government National Mortgage Association | |
Series 2016-116, Class GA, 1.75%, 11/20/44 (a) | | | 629,092 | | | | 612,583 | | |
4.50%, 2/20/49 | | | 138,030 | | | | 144,024 | | |
| | | | 756,607 | | |
Multi-family (0.1%): | |
Collateralized Mortgage Obligations (0.1%): | |
Government National Mortgage Association | |
6.00%, 12/15/33 (a) | | | 21,607 | | | | 24,957 | | |
Total U.S. Government Mortgage Backed Agencies (Cost $14,372,400) | | | 14,522,125 | | |
U.S. Treasury Obligations (16.4%) | |
U.S. Treasury Bills | |
2.14%, 11/14/19 (a) (f) | | | 1,689,000 | | | | 1,676,056 | | |
2.01%, 1/2/20 (a) (f) | | | 1,200,000 | | | | 1,187,679 | | |
U.S. Treasury Bonds | |
3.00%, 2/15/48 (a) | | | 1,245,000 | | | | 1,363,664 | | |
3.00%, 2/15/49 (a) | | | 450,000 | | | | 494,297 | | |
See notes to financial statements.
10
Victory Portfolios
Victory INCORE Investment Quality Bond Fund | | Schedule of Portfolio Investments — continued
June 30, 2019 | |
(Unaudited)
Security Description | | Shares or
Principal
Amount | | Value | |
U.S. Treasury Notes | |
2.38%, 2/29/24 | | $ | 43,000 | | | $ | 44,213 | | |
2.00%, 8/15/25 (a) | | | 110,000 | | | | 111,048 | | |
2.88%, 8/15/28 (a) | | | 469,000 | | | | 504,028 | | |
2.63%, 2/15/29 | | | 71,000 | | | | 74,872 | | |
Total U.S. Treasury Obligations (Cost $5,171,990) | | | 5,455,857 | | |
Collateral for Securities Loaned^ (1.5%) | |
BlackRock Liquidity Funds TempFund Portfolio, Institutional Class, 2.43% (g) | | | 105,568 | | | | 105,568 | | |
Fidelity Investments Money Market Government Portfolio, Class I, 2.28% (g) | | | 135,984 | | | | 135,984 | | |
Fidelity Investments Prime Money Market Portfolio, Class I, 2.39% (g) | | | 3,532 | | | | 3,532 | | |
Goldman Sachs Financial Square Prime Obligations Fund, Institutional Class,
2.48% (g) | | | 58,055 | | | | 58,055 | | |
JPMorgan Prime Money Market Fund, Capital Class, 2.41% (g) | | | 79,164 | | | | 79,164 | | |
Morgan Stanley Institutional Liquidity Prime Portfolio, Institutional Class,
2.42% (g) | | | 123,149 | | | | 123,149 | | |
Total Collateral for Securities Loaned (Cost $505,452) | | | 505,452 | | |
Total Investments (Cost $32,088,661) — 98.4% | | | 32,735,664 | | |
Other assets in excess of liabilities — 1.6% | | | 523,525 | | |
NET ASSETS — 100.00% | | $ | 33,259,189 | | |
^ Purchased with cash collateral from securities on loan.
(a) All or a portion of this security has been segregated as collateral for derivative instruments.
(b) Rule 144A security or other security that is restricted as to resale to institutional investors. The Fund's Adviser has deemed this security to be liquid based upon procedures approved by the Board of Trustees. As of June 30, 2019, the fair value of these securities was $1,085,257 and amounted to 3.3% of net assets.
(c) The rate for certain asset-backed and mortgage backed securities may vary based on factors relating to the pool of assets underlying the security. The rate disclosed is the rate in effect at June 30, 2019.
(d) All or a portion of this security is on loan.
(e) Variable or Floating-Rate Security. Rate disclosed is as of June 30, 2019.
(f) Rate represents the effective yield at June 30, 2019.
(g) Rate disclosed is the daily yield on June 30, 2019.
bps — Basis points
LIBOR — London InterBank Offered Rate
LIBOR01M — 1 Month US Dollar LIBOR, rate disclosed as of June 30, 2019, based on the last reset date of the security
LIBOR03M — 3 Month US Dollar LIBOR, rate disclosed as of June 30, 2019, based on the last reset date of the security
LIBOR12M — 12 Month US Dollar LIBOR, rate disclosed as of June 30, 2019, based on the last reset date of the security
MTN — Medium Term Note
See notes to financial statements.
11
Victory Portfolios
Victory INCORE Investment Quality Bond Fund | | Schedule of Portfolio Investments — continued
June 30, 2019 | |
(Unaudited)
Futures Contracts Purchased
| | | Number of
Contracts | | Expiration
Date | | Notional
Amount | | Value | | Unrealized
Appreciation
(Depreciation) | |
10-Year U.S. Treasury Note Future | | | 22 | | | 9/19/19 | | $ | 2,792,550 | | | $ | 2,815,314 | | | $ | 22,764 | | |
Futures Contracts Sold
| | | Number of
Contracts | | Expiration
Date | | Notional
Amount | | Value | | Unrealized
Appreciation
(Depreciation) | |
2-Year U.S. Treasury Note Future | | | 2 | | | 9/30/19 | | $ | 430,337 | | | $ | 430,359 | | | $ | (22 | ) | |
5-Year U.S. Treasury Note Future | | | 15 | | | 9/30/19 | | | 1,772,175 | | | | 1,772,345 | | | | (170 | ) | |
| | | | | | | | | | | $ | (192 | ) | |
| | | Total unrealized appreciation | | | | | | | | $ | 22,764 | | |
| | | Total unrealized depreciation | | | | | | | | | (192 | ) | |
| | | Total net unrealized appreciation | | | | | | | | $ | 22,572 | | |
Centrally Cleared
Credit Default Swap Agreements — Sell Protection (a)
Underlying
Instrument | | Fixed
Deal
Pay
Rate | | Maturity
Date | | Payment
Frequency | | Implied
Credit
Spread at
June 30,
2019 (b) | | Notional
Amount (c) | | Value | | Premiums
Paid
(Received) | | Unrealized
Appreciation
(Depreciation) | |
CDX North
America High
Yield Index;
Series 32 | | | 5.00 | % | | 6/20/24 | | Monthly | | | 3.21 | % | | $ | 2,100,000 | | | $ | 158,900 | | | $ | 117,180 | | | $ | 41,720 | | |
(a) When a credit event occurs as defined under the terms of the swap agreement, the Fund as a seller of credit protection will either (i) pay to the buyer of protection an amount equal to the par value of the defaulted reference entity and take delivery of the reference entity or (ii) pay a net amount equal to the par value of the defaulted reference entity less its recovery value.
(b) Implied credit spread, represented in absolute terms, utilized in determining the value of the credit default swap agreements as of period end will serve as an indicator of the current status of the payment/performance risk and represent the likelihood or risk of default for the credit derivative. The implied credit spread of a referenced entity reflects the cost of buying/selling protection and may include payments required to be made to enter into the agreement. Generally, wider credit spreads represent a perceived deterioration of the referenced entity's credit soundness and a greater likelihood or risk of default or other credit event occurring as defined under the terms of the swap agreement.
(c) The notional amount represents the maximum potential amount the Fund could be required to pay as a seller of credit protection if a credit event occurs, as defined under the terms of the swap agreement, for each security included in the CDX North America High Yield Index.
See notes to financial statements.
12
Victory Portfolios
Victory INCORE Low Duration Bond Fund | | Schedule of Portfolio Investments
June 30, 2019 | |
(Unaudited)
Security Description | | Principal
Amount | | Value | |
Asset Backed Securities (13.2%) | |
AmeriCredit Automobile Receivables Trust, Series 2016-3, Class C, 2.24%, 4/8/22,
Callable 12/8/20 @ 100 (a) | | $ | 4,435,000 | | | $ | 4,425,137 | | |
AmeriCredit Automobile Receivables Trust, Series 2017-2, Class B, 2.40%,
5/18/22, Callable 8/18/21 @ 100 (a) | | | 2,715,000 | | | | 2,715,413 | | |
AmeriCredit Automobile Receivables Trust, Series 2015-3, Class D, 3.34%,
8/8/21, Callable 2/8/20 @ 100 (a) | | | 2,600,000 | | | | 2,613,148 | | |
AmeriCredit Automobile Receivables Trust, Series 2018-1, Class B, 3.26%,
1/18/24, Callable 4/18/22 @ 100 (a) | | | 3,200,000 | | | | 3,249,974 | | |
Avis Budget Rental Car Funding (AESOP) LLC, Series 2014-1, Class A,
2.46%, 7/20/20 (a) (b) | | | 333,333 | | | | 333,250 | | |
Chrysler Capital Auto Receivables Trust, Series 2016-BA, Class B, 2.22%,
5/16/22, Callable 6/15/21 @ 100 (a) (b) | | | 4,180,000 | | | | 4,169,671 | | |
Drive Auto Receivables Trust, Series 2017-AA, Class C, 2.98%, 1/18/22,
Callable 12/15/20 @ 100 (a) (b) | | | 933,681 | | | | 934,461 | | |
Drive Auto Receivables Trust, Series 2018-2, Class B, 3.22%, 4/15/22,
Callable 6/15/21 @ 100 (a) | | | 4,595,602 | | | | 4,602,900 | | |
Santander Drive Auto Receivables Trust, Series 2016-3, Class C, 2.46%,
3/15/22, Callable 11/15/20 @ 100 (a) | | | 6,386,429 | | | | 6,385,330 | | |
Santander Drive Auto Receivables Trust, Series 2017-3, Class B, 2.19%,
3/15/22, Callable 4/15/21 @ 100 (a) | | | 2,303,860 | | | | 2,302,243 | | |
Santander Drive Auto Receivables Trust, Series 2017-2, Class B, 2.21%,
10/15/21, Callable 3/15/21 @ 100 (a) | | | 584,999 | | | | 584,827 | | |
Santander Retail Auto Lease Trust, Series 2018-A, Class B, 3.20%, 4/20/22,
Callable 3/20/21 @ 100 (a) (b) | | | 2,400,000 | | | | 2,417,431 | | |
World Financial Network Credit Card Master Trust, Series 2017-A, Class A,
2.12%, 3/15/24 (a) | | | 3,155,000 | | | | 3,147,283 | | |
Total Asset Backed Securities (Cost $37,852,565) | | | 37,881,068 | | |
Collateralized Mortgage Obligations (3.7%) | |
Galaxy CLO Ltd., Series 2017-24A, Class A, 3.72% (LIBOR03M+112bps),
1/15/31, Callable 1/15/20 @ 100 (a) (b) (c) | | | 2,000,000 | | | | 1,983,176 | | |
GS Mortgage Securities Trust, Series 2012-GC6, Class B, 5.84%,
1/10/45 (a) (b) (d) | | | 3,500,000 | | | | 3,730,162 | | |
Steele Creek CLO Ltd., Series 2017-1A, Class A, 3.85% (LIBOR03M+125bps),
1/15/30, Callable 1/15/20 @ 100 (a) (b) (c) | | | 2,825,000 | | | | 2,817,988 | | |
Voya CLO Ltd., Series 2017-4A, Class A1, 3.73% (LIBOR03M+113bps),
10/15/30, Callable 10/15/19 @ 100 (a) (b) (c) | | | 2,000,000 | | | | 1,993,542 | | |
Total Collateralized Mortgage Obligations (Cost $10,641,518) | | | 10,524,868 | | |
Corporate Bonds (48.9%) | |
Communication Services (4.1%): | |
AT&T, Inc.
2.45%, 6/30/20, Callable 5/30/20 @ 100 (a) | | | 3,500,000 | | | | 3,496,710 | | |
3.20%, 3/1/22, Callable 2/1/22 @ 100 (a) | | | 967,000 | | | | 987,191 | | |
4.25%, 3/1/27, Callable 12/1/26 @ 100 (a) | | | 913,000 | | | | 978,024 | | |
See notes to financial statements.
13
Victory Portfolios
Victory INCORE Low Duration Bond Fund | | Schedule of Portfolio Investments — continued
June 30, 2019 | |
(Unaudited)
Security Description | | Principal
Amount | | Value | |
Electronic Arts, Inc., 3.70%, 3/1/21, Callable 2/1/21 @ 100 (a) | | $ | 4,185,000 | | | $ | 4,263,134 | | |
Verizon Communications, Inc.
5.15%, 9/15/23 (a) | | | 661,000 | | | | 738,727 | | |
3.38%, 2/15/25 | | | 483,000 | | | | 504,209 | | |
3.62%(LIBOR03M+110bps), 5/15/25, Callable 3/15/25 @ 100 (a) (c) | | | 827,000 | | | | 837,486 | | |
| | | | 11,805,481 | | |
Consumer Discretionary (4.1%): | |
Best Buy Co., Inc.
5.50%, 3/15/21, Callable 12/15/20 @ 100 (a) (e) | | | 3,055,000 | | | | 3,183,494 | | |
4.45%, 10/1/28, Callable 7/1/28 @ 100 (a) | | | 756,000 | | | | 798,207 | | |
General Motors Co., 4.88%, 10/2/23 (a) | | | 691,000 | | | | 732,978 | | |
Hasbro, Inc., 3.15%, 5/15/21, Callable 3/15/21 @ 100 (a) | | | 3,380,000 | | | | 3,421,033 | | |
NVR, Inc., 3.95%, 9/15/22, Callable 6/15/22 @ 100 (a) | | | 3,283,000 | | | | 3,401,418 | | |
| | | | 11,537,130 | | |
Consumer Staples (3.3%): | |
Altria Group, Inc., 4.40%, 2/14/26, Callable 12/14/25 @ 100 (a) | | | 1,097,000 | | | | 1,173,867 | | |
BAT Capital Corp., 2.30%, 8/14/20 (a) | | | 3,250,000 | | | | 3,242,980 | | |
Constellation Brands, Inc.
3.22%(LIBOR03M+70bps), 11/15/21, Callable 10/30/19 @ 100 (a) (c) | | | 2,500,000 | | | | 2,500,076 | | |
4.65%, 11/15/28, Callable 8/15/28 @ 100 (a) | | | 521,000 | | | | 581,816 | | |
Molson Coors Brewing Co., 1.45%, 7/15/19 (a) | | | 2,063,000 | | | | 2,062,154 | | |
| | | | 9,560,893 | | |
Energy (4.0%): | |
Continental Resources, 4.50%, 4/15/23, Callable 1/15/23 @ 100 (a) | | | 940,000 | | | | 987,113 | | |
Ecopetrol SA, 5.88%, 9/18/23 (a) | | | 654,000 | | | | 724,128 | | |
LUKOIL International Finance BV, 6.13%, 11/9/20 (a) (b) | | | 5,185,000 | | | | 5,394,578 | | |
Marathon Petroleum Corp., 3.40%, 12/15/20, Callable 11/15/20 @ 100 (a) | | | 1,850,000 | | | | 1,873,107 | | |
Pioneer Natural Resource Co., 7.50%, 1/15/20 (a) | | | 2,085,000 | | | | 2,138,876 | | |
Valero Energy Corp., 4.00%, 4/1/29, Callable 1/1/29 @ 100 (a) | | | 503,000 | | | | 527,169 | | |
| | | | 11,644,971 | | |
Financials (9.1%): | |
Bank of America Corp.
2.25%, 4/21/20, MTN (a) | | | 2,000,000 | | | | 2,000,160 | | |
2.33%(LIBOR03M+63bps), 10/1/21, Callable 10/1/20 @ 100 (a) (c) | | | 1,391,000 | | | | 1,388,468 | | |
4.20%, 8/26/24 (a) | | | 1,287,000 | | | | 1,367,965 | | |
Capital One Financial Corp.
2.50%, 5/12/20, Callable 4/12/20 @ 100 (a) | | | 615,000 | | | | 615,603 | | |
3.45%, 4/30/21, Callable 3/30/21 @ 100 (a) | | | 3,500,000 | | | | 3,563,384 | | |
3.30%, 10/30/24, Callable 9/30/24 @ 100 (a) | | | 1,252,000 | | | | 1,284,039 | | |
Citigroup, Inc., 4.45%, 9/29/27 (a) | | | 730,000 | | | | 786,539 | | |
Fifth Third Bancorp, 3.65%, 1/25/24, Callable 12/25/23 @ 100 (a) | | | 1,392,000 | | | | 1,462,477 | | |
Level 3 Financing, Inc., 5.38%, 1/15/24, Callable 8/5/19 @ 102.69 (a) | | | 637,000 | | | | 651,186 | | |
Marsh & McLennan Cos., Inc., 2.35%, 3/6/20, Callable 2/6/20 @ 100 (a) | | | 420,000 | | | | 419,798 | | |
Morgan Stanley, 4.88%, 11/1/22 (a) | | | 1,187,000 | | | | 1,269,710 | | |
Newcrest Finance Pty Ltd., 4.20%, 10/1/22 (a) (b) | | | 2,214,000 | | | | 2,306,589 | | |
SVB Financial Group, 5.38%, 9/15/20 (a) (e) | | | 2,573,000 | | | | 2,659,968 | | |
Unum Group, 3.00%, 5/15/21, Callable 4/15/21 @ 100 (a) | | | 3,200,000 | | | | 3,225,280 | | |
See notes to financial statements.
14
Victory Portfolios
Victory INCORE Low Duration Bond Fund | | Schedule of Portfolio Investments — continued
June 30, 2019 | |
(Unaudited)
Security Description | | Principal
Amount | | Value | |
ZB NA, 3.50%, 8/27/21 (a) | | $ | 1,785,000 | | | $ | 1,821,414 | | |
Zions Bancorp NA, 3.35%, 3/4/22, Callable 2/4/22 @ 100 (a) | | | 1,090,000 | | | | 1,109,031 | | |
| | | | 25,931,611 | | |
Health Care (5.4%): | |
Abbott Laboratories, 2.90%, 11/30/21, Callable 10/30/21 @ 100 (a) | | | 1,968,000 | | | | 1,999,921 | | |
AbbVie, Inc., 2.30%, 5/14/21, Callable 4/14/21 @ 100 (a) | | | 2,292,000 | | | | 2,285,697 | | |
Amgen, Inc., 2.20%, 5/11/20 (a) | | | 3,301,000 | | | | 3,294,530 | | |
Biogen, Inc., 2.90%, 9/15/20 (a) | | | 3,333,000 | | | | 3,349,565 | | |
Celgene Corp., 2.88%, 2/19/21 (a) | | | 4,345,000 | | | | 4,380,195 | | |
| | | | 15,309,908 | | |
Industrials (2.8%): | |
Acuity Brands Lighting, Inc., 6.00%, 12/15/19 (a) | | | 2,319,000 | | | | 2,352,904 | | |
Aercap Holdings NV, 4.63%, 10/30/20 (a) | | | 2,065,000 | | | | 2,119,433 | | |
IDEX Corp., 4.50%, 12/15/20, Callable 9/15/20 @ 100 (a) | | | 2,565,000 | | | | 2,624,021 | | |
Northrop Grumman Corp., 2.93%, 1/15/25, Callable 11/15/24 @ 100 (a) | | | 1,154,000 | | | | 1,174,922 | | |
| | | | 8,271,280 | | |
Information Technology (6.0%): | |
Broadcom Corp., 3.00%, 1/15/22, Callable 12/15/21 @ 100 (a) | | | 3,768,000 | | | | 3,779,153 | | |
FLIR Systems, Inc., 3.13%, 6/15/21, Callable 5/15/21 @ 100 (a) | | | 2,375,000 | | | | 2,389,131 | | |
Lam Research Corp., 4.00%, 3/15/29, Callable 12/15/28 @ 100 | | | 651,000 | | | | 693,732 | | |
Lam Research Group, 2.80%, 6/15/21, Callable 5/15/21 @ 100 (a) | | | 3,328,000 | | | | 3,353,725 | | |
NetApp, Inc.
2.00%, 9/27/19 (a) (e) | | | 1,875,000 | | | | 1,872,150 | | |
3.38%, 6/15/21, Callable 4/15/21 @ 100 (a) | | | 1,605,000 | | | | 1,624,501 | | |
VMware, Inc., 2.30%, 8/21/20 (a) | | | 3,820,000 | | | | 3,809,648 | | |
| | | | 17,522,040 | | |
Materials (1.9%): | |
Anglo American Capital PLC, 4.13%, 4/15/21 (a) (b) | | | 3,525,000 | | | | 3,607,168 | | |
LYB International Finance II BV, 3.50%, 3/2/27, Callable 12/2/26 @ 100 (a) | | | 728,000 | | | | 740,776 | | |
Lyondellbasell Industries NV, 6.00%, 11/15/21, Callable 8/17/21 @ 100 (a) | | | 800,000 | | | | 857,840 | | |
| | | | 5,205,784 | | |
Real Estate (3.8%): | |
CubeSmart, LP, 4.80%, 7/15/22, Callable 4/15/22 @ 100 (a) | | | 3,470,000 | | | | 3,657,240 | | |
Healthcare Trust of America Holdings LP, 3.38%, 7/15/21,
Callable 5/15/21 @ 100 (a) | | | 1,410,000 | | | | 1,426,328 | | |
Highwoods Realty LP, 3.20%, 6/15/21, Callable 4/15/21 @ 100 (a) | | | 3,130,000 | | | | 3,153,319 | | |
Ventas Realty, LP, 4.25%, 3/1/22, Callable 12/1/21 @ 100 (a) | | | 2,650,000 | | | | 2,765,037 | | |
| | | | 11,001,924 | | |
Utilities (4.4%): | |
Eversource Energy, 2.50%, 3/15/21, Callable 2/15/21 @ 100 (a) (e) | | | 2,900,000 | | | | 2,907,424 | | |
Exelon Corp.
3.50%, 6/1/22, Callable 5/1/22 @ 100 (a) | | | 2,681,000 | | | | 2,745,880 | | |
3.95%, 6/15/25, Callable 3/15/25 @ 100 (a) | | | 680,000 | | | | 723,935 | | |
3.40%, 4/15/26, Callable 1/15/26 @ 100 | | | 335,000 | | | | 343,847 | | |
Iberdrola Finance Ireland Ltd., 5.00%, 9/11/19 (a) (b) | | | 6,027,000 | | | | 6,052,073 | | |
| | | | 12,773,159 | | |
Total Corporate Bonds (Cost $139,508,638) | | | 140,564,181 | | |
See notes to financial statements.
15
Victory Portfolios
Victory INCORE Low Duration Bond Fund | | Schedule of Portfolio Investments — continued
June 30, 2019 | |
(Unaudited)
Security Description | | Principal
Amount | | Value | |
Residential Mortgage Backed Securities (6.5%) | |
Bear Stearns Alt-A Trust, Series 2003-3, Class 2A, 4.45%, 10/25/33,
Callable 7/25/19 @ 100 (a) (d) | | $ | 1,842,567 | | | $ | 1,842,567 | | |
Credit Suisse First Boston Mortgage Securities Corp., Series 2003-23,
Class 2A8, 4.50%, 12/31/49 (a) | | | 13,676 | | | | 14,091 | | |
Credit Suisse First Boston Mortgage Securities Corp., Series 2004-AR7,
Class 4A1, 4.40%, 11/25/34, Callable 7/25/19 @ 100 (a) (d) | | | 1,534,457 | | | | 1,534,457 | | |
GSR Mortgage Loan Trust, Series 2004-15F, Class 5A1, 5.50%, 1/25/20,
Callable 2/25/24 @ 100 (a) | | | 33,370 | | | | 28,892 | | |
JPMorgan Mortgage Trust, Series 2017-1, Class A5, 3.50%, 1/25/47,
Callable 4/25/34 @ 100 (a) (b) (d) | | | 1,976,650 | | | | 2,007,024 | | |
JPMorgan Mortgage Trust, Series 2017-3, Class 2A2, 2.50%, 8/25/47,
Callable 9/25/29 @ 100 (a) (b) (d) | | | 2,258,738 | | | | 2,247,230 | | |
JPMorgan Mortgage Trust, Series 2016-3, Class 1A3, 3.50%, 10/25/46,
Callable 3/25/28 @ 100 (a) (b) (d) | | | 918,346 | | | | 931,745 | | |
JPMorgan Mortgage Trust, Series 2016-4, Class A5, 3.50%, 10/25/46,
Callable 10/25/39 @ 100 (a) (b) (d) | | | 1,543,921 | | | | 1,566,447 | | |
JPMorgan Mortgage Trust, Series 2004-S2, Class 1A3, 4.75%, 11/25/19,
Callable 7/25/19 @ 100 (a) | | | 13,582 | | | | 13,582 | | |
JPMorgan Mortgage Trust, Series 2004-S1, Class 1A7, 5.00%, 9/25/34,
Callable 7/25/19 @ 100 (a) | | | 67,760 | | | | 67,760 | | |
JPMorgan Mortgage Trust, Series 2014-5, Class A11, 2.98%, 10/25/29,
Callable 12/25/24 @ 100 (a) (b) (d) | | | 4,025,329 | | | | 4,046,421 | | |
Madison Park Funding Ltd., Series 2017-26A, Class AR, 3.78%
(LIBOR03M+120bps), 7/29/30, Callable 10/29/19 @ 100 (a) (b) (c) | | | 2,250,000 | | | | 2,249,162 | | |
Morgan Stanley Mortgage Loan Trust, Series 2005-6AR, Class 1A1, 2.68%
(LIBOR01M+28bps), 11/25/35, Callable 7/25/19 @ 100 (a) (c) | | | 173,353 | | | | 173,275 | | |
Residential Funding Mortgage Securities I, Inc., Series 2005-S3, Class A1, 4.75%,
3/25/20, Callable 7/25/19 @ 100 (a) | | | 31,898 | | | | 31,898 | | |
Wells Fargo Mortgage Backed Securities Trust, Series 2004-Z, Class 2A2, 4.97%,
12/25/34, Callable 7/25/19 @ 100 (a) (d) | | | 413,403 | | | | 413,403 | | |
Wells Fargo Mortgage Backed Securities Trust, Series 2004-O, Class A1, 4.71%,
8/25/34, Callable 7/25/19 @ 100 (a) (d) | | | 600,577 | | | | 600,577 | | |
Wells Fargo Mortgage Backed Securities Trust, Series 2004-M, Class A7, 4.70%,
8/25/34, Callable 7/25/19 @ 100 (a) (d) | | | 976,462 | | | | 976,462 | | |
Wells Fargo Mortgage Backed Securities Trust, Series 2005-2, Class 2A1, 4.75%,
4/25/20, Callable 7/25/19 @ 100 (a) | | | 4,670 | | | | 4,670 | | |
Total Residential Mortgage Backed Securities (Cost $18,840,319) | | | 18,749,663 | | |
U.S. Government Mortgage Backed Agencies (13.4%) | |
Federal Home Loan Mortgage Corp.
5.00%, 6/15/23 – 8/1/40 (a) | | | 1,171,306 | | | | 1,260,462 | | |
5.50%, 10/25/23 (a) | | | 7,131 | | | | 7,453 | | |
Series 4430, Class NG, 2.50%, 2/15/38 (a) | | | 2,611,864 | | | | 2,620,185 | | |
7.00%, 9/1/38 (a) | | | 8,570 | | | | 10,376 | | |
Series 4320, Class AP, 3.50%, 7/15/39 (a) | | | 1,546,968 | | | | 1,600,479 | | |
See notes to financial statements.
16
Victory Portfolios
Victory INCORE Low Duration Bond Fund | | Schedule of Portfolio Investments — continued
June 30, 2019 | |
(Unaudited)
Security Description | | Shares or
Principal
Amount | | Value | |
Series 3713, Class PA, 2.00%, 2/15/40 – 4/15/44 (a) | | $ | 9,676,177 | | | $ | 9,571,353 | | |
Series 4049, Class AB, 2.75%, 12/15/41 (a) | | | 990,207 | | | | 995,926 | | |
| | | | 16,066,234 | | |
Federal National Mortgage Association
6.00%, 2/1/37 (a) | | | 1,437,532 | | | | 1,685,549 | | |
Series 2013-83, Class CA, 3.50%, 10/25/37 – 3/25/44 (a) | | | 6,534,280 | | | | 6,632,785 | | |
Series 2013-33, Class UD, 2.50%, 4/25/39 (a) | | | 1,943,265 | | | | 1,963,153 | | |
Series 2011-21, Class PA, 4.50%, 5/25/40 (a) | | | 4,277,635 | | | | 4,444,047 | | |
Series 2011-101, Class LA, 3.00%, 10/25/40 (a) | | | 1,709,394 | | | | 1,724,945 | | |
5.00%, 2/1/41 – 10/1/41 (a) | | | 4,273,754 | | | | 4,595,463 | | |
| | | | 21,045,942 | | |
Government National Mortgage Association
Series 2018-22, Class JA, 3.00%, 1/20/44 (a) | | | 1,343,912 | | | | 1,361,438 | | |
Total U.S. Government Mortgage Backed Agencies (Cost $38,649,325) | | | 38,473,614 | | |
U.S. Treasury Obligations (10.9%) | |
U.S. Treasury Bills
2.14%, 11/14/19 (a) (f) | | | 31,333,000 | | | | 31,092,864 | | |
2.01%, 1/2/20 (a) (f) | | | 200,000 | | | | 197,947 | | |
Total U.S. Treasury Obligations (Cost $31,256,765) | | | 31,290,811 | | |
Collateral for Securities Loaned^ (0.3%) | |
BlackRock Liquidity Funds TempFund Portfolio, Institutional Class, 2.43% (g) | | | 187,145 | | | | 187,145 | | |
Fidelity Investments Money Market Government Portfolio, Class I, 2.28% (g) | | | 241,064 | | | | 241,064 | | |
Fidelity Investments Prime Money Market Portfolio, Class I, 2.39% (g) | | | 6,261 | | | | 6,261 | | |
Goldman Sachs Financial Square Prime Obligations Fund, Institutional Class,
2.48% (g) | | | 102,916 | | | | 102,916 | | |
JPMorgan Prime Money Market Fund, Capital Class, 2.41% (g) | | | 140,337 | | | | 140,337 | | |
Morgan Stanley Institutional Liquidity Prime Portfolio, Institutional Class,
2.42% (g) | | | 218,310 | | | | 218,310 | | |
Total Collateral for Securities Loaned (Cost $896,033) | | | 896,033 | | |
Total Investments (Cost $277,645,163) — 96.9% | | | 278,380,238 | | |
Other assets in excess of liabilities — 3.1% | | | 8,788,711 | | |
NET ASSETS — 100.00% | | $ | 287,168,949 | | |
^ Purchased with cash collateral from securities on loan.
(a) All or a portion of this security has been segregated as collateral for derivative instruments.
(b) Rule 144A security or other security that is restricted as to resale to institutional investors. The Fund's Adviser has deemed this security to be liquid based upon procedures approved by the Board of Trustees. As of June 30, 2019, the fair value of these securities was $48,788,118 and amounted to 17.0% of net assets.
(c) Variable or Floating-Rate Security. Rate disclosed is as of June 30, 2019.
(d) The rate for certain asset-backed and mortgage backed securities may vary based on factors relating to the pool of assets underlying the security. The rate disclosed is the rate in effect at June 30, 2019.
(e) All or a portion of this security is on loan.
See notes to financial statements.
17
Victory Portfolios
Victory INCORE Low Duration Bond Fund | | Schedule of Portfolio Investments — continued
June 30, 2019 | |
(Unaudited)
(f) Rate represents the effective yield at June 30, 2019.
(g) Rate disclosed is the daily yield on June 30, 2019.
bps — Basis points
LIBOR — London InterBank Offered Rate
LIBOR01M — 1 Month US Dollar LIBOR, rate disclosed as of June 30, 2019, based on the last reset date of the security
LIBOR03M — 3 Month US Dollar LIBOR, rate disclosed as of June 30, 2019, based on the last reset date of the security
LLC — Limited Liability Company
LP — Limited Partnership
MTN — Medium Term Note
PLC — Public Limited Company
Futures Contracts Purchased
| | | Number of
Contracts | | Expiration
Date | | Notional
Amount | | Value | | Unrealized
Appreciation
(Depreciation) | |
2-Year U.S. Treasury Note Future | | | 554 | | | 9/30/19 | | $ | 118,465,462 | | | $ | 119,209,498 | | | $ | 744,036 | | |
Futures Contracts Sold
| | | Number of
Contracts | | Expiration
Date | | Notional
Amount | | Value | | Unrealized
Appreciation
(Depreciation) | |
10-Year U.S. Treasury Note Future | | | 68 | | | 9/19/19 | | $ | 8,699,639 | | | $ | 8,701,878 | | | $ | (2,239 | ) | |
5-Year U.S. Treasury Note Future | | | 314 | | | 9/30/19 | | | 36,841,864 | | | | 37,101,078 | | | | (259,214 | ) | |
| | | | | | | | | | | $ | (261,453 | ) | |
| | | Total unrealized appreciation | | | | | | | | $ | 744,036 | | |
| | | Total unrealized depreciation | | | | | | | | | (261,453 | ) | |
| | | Total net unrealized appreciation | | | | | | | | $ | 482,583 | | |
Centrally Cleared
Credit Default Swap Agreements — Sell Protection (a)
Underlying
Instrument | | Fixed
Deal
Pay
Rate | | Maturity
Date | | Payment
Frequency | | Implied
Credit
Spread at
June 30,
2019 (b) | | Notional
Amount (c) | | Value | | Premiums
Paid
(Received) | | Unrealized
Appreciation
(Depreciation) | |
CDX North
America
High Yield Index;
Series 32 | | | 5.00 | % | | 6/20/24 | | Daily | | | 3.21 | % | | $ | 18,000,000 | | | $ | 1,362,000 | | | $ | 1,014,038 | | | $ | 347,962 | | |
See notes to financial statements.
18
Victory Portfolios
Victory INCORE Low Duration Bond Fund | | Schedule of Portfolio Investments — continued
June 30, 2019 | |
(Unaudited)
(a) When a credit event occurs as defined under the terms of the swap agreement, the Fund as a seller of credit protection will either (i) pay to the buyer of protection an amount equal to the par value of the defaulted reference entity and take delivery of the reference entity or (ii) pay a net amount equal to the par value of the defaulted reference entity less its recovery value.
(b) Implied credit spread, represented in absolute terms, utilized in determining the value of the credit default swap agreements as of period end will serve as an indicator of the current status of the payment/performance risk and represent the likelihood or risk of default for the credit derivative. The implied credit spread of a referenced entity reflects the cost of buying/selling protection and may include payments required to be made to enter into the agreement. Generally, wider credit spreads represent a perceived deterioration of the referenced entity's credit soundness and a greater likelihood or risk of default or other credit event occurring as defined under the terms of the swap agreement.
(c) The notional amount represents the maximum potential amount the Fund could be required to pay as a seller of credit protection if a credit event occurs, as defined under the terms of the swap agreement, for each security included in the CDX North America High Yield Index.
See notes to financial statements.
19
Victory Portfolios
Victory High Yield Fund | | Schedule of Portfolio Investments
June 30, 2019 | |
(Unaudited)
Security Description | | Shares or
Principal
Amount | | Value | |
Common Stocks (1.1%) | |
Communication Services (0.8%): | |
AMC Networks, Inc., Class A (a) | | | 6,000 | | | $ | 326,940 | | |
Cinemark Holdings, Inc. | | | 10,000 | | | | 361,000 | | |
TEGNA, Inc. | | | 33,000 | | | | 499,950 | | |
| | | | 1,187,890 | | |
Consumer Discretionary (0.3%): | |
Wynn Resorts Ltd. | | | 4,000 | | | | 495,960 | | |
Total Common Stocks (Cost $1,652,535) | | | 1,683,850 | | |
Senior Secured Loans (22.4%) | |
1011778 B.C. ULC, 4.65% (LIBOR01M+225bps), 2/17/24 (b) (c) | | $ | 2,000,000 | | | | 1,983,339 | | |
Ai Ladder Luxembourg Subco Sarl, 1st Lien Term Loan B, 6.83%
(LIBOR03M+450bps), 5/4/25 (b) | | | 789,685 | | | | 766,650 | | |
Alphabet Holding Co., Inc., 2nd Lien Term Loan, 10.15%
(LIBOR01M+775bps), 8/15/25, Callable 8/4/19 @ 101 (b) | | | 1,500,000 | | | | 1,324,995 | | |
Avaya, Inc., 1st Lien Term Loan B, 6.65%
(LIBOR01M+425bps), 12/15/24, Callable 8/4/19 @ 100 (b) | | | 640,250 | | | | 611,439 | | |
Bass Pro Group LLC, Term Loan B, 7.40%
(LIBOR01M+500bps), 12/16/23, Callable 8/4/19 @ 100 (b) | | | 982,500 | | | | 936,853 | | |
Blount International, Inc., 1st Lien Term Loan B, 6.15%
(LIBOR01M+375bps), 4/12/23, Callable 8/4/19 @ 100 (b) | | | 997,494 | | | | 995,629 | | |
Caesars Resort Collection LLC, 1st Lien Term Loan B, 5.15%
(LIBOR01M+275bps), 10/2/24, Callable 8/4/19 @ 100 (b) | | | 985,000 | | | | 967,556 | | |
CommScope, Inc, 1st Lien term Loan, 5.65%
(LIBOR01M+325bps), 4/6/26, Callable 8/4/19 @ 101 (b) | | | 1,000,000 | | | | 996,000 | | |
CPM Holdings, Inc., 1st Lien Term Loan, 6.15%
(LIBOR01M+375bps), 11/17/25, Callable 8/4/19 @ 100 (b) | | | 796,000 | | | | 784,721 | | |
Crown Finance US, Inc., 1st Lien Term Loan B, 4.65%
(LIBOR01M+225bps), 2/7/25, Callable 8/4/19 @ 100 (b) | | | 534,356 | | | | 525,171 | | |
Dayco Products LLC, 6.77%
(LIBOR03M+425bps), 5/19/24, Callable 8/4/19 @ 100 (b) | | | 979,474 | | | | 947,641 | | |
Dynasty Acquisition Co., Inc., 1st Lien Term Loan, 1/24/26 (b) (c) (h) | | | 650,350 | | | | 652,671 | | |
Gates Global LLC, 1st Lien Term Loan B2, 5.15%
(LIBOR01M+275bps), 3/31/24, Callable 8/4/19 @ 100 (b) | | | 994,937 | | | | 987,922 | | |
Hertz Corp., Term Loan B1, 5.16% (LIBOR01M+275bps), 6/30/23,
Callable 8/4/19 @ 100 (b) | | | 969,466 | | | | 964,919 | | |
Holley Purchaser, Inc., 1st Lien Term Loan, 7.58%
(LIBOR03M+500bps), 10/24/25, Callable 8/4/19 @ 101 (b) | | | 995,000 | | | | 965,150 | | |
II-VI Inc, 1st Lien Term Loan, 5/8/26 (b) (c) (h) | | | 1,750,000 | | | | 1,722,664 | | |
Leslie's Poolmart, Inc., Term Loan B, 5.98%
(LIBOR02M+350bps), 8/16/23, Callable 8/4/19 @ 100 (b) | | | 994,950 | | | | 938,367 | | |
LifeScan Global Corp., 1st Lien Term Loan, 8.66%
(LIBOR06M+600bps), 6/19/24, Callable 8/4/19 @ 101 (b) | | | 965,000 | | | | 919,163 | | |
See notes to financial statements.
20
Victory Portfolios
Victory High Yield Fund | | Schedule of Portfolio Investments — continued
June 30, 2019 | |
(Unaudited)
Security Description | | Principal
Amount | | Value | |
Navistar, Inc., 1st Lien Term Loan B, 5.91%
(LIBOR01M+350bps), 11/2/24, Callable 8/4/19 @ 100 (b) | | $ | 987,500 | | | $ | 984,103 | | |
Nexstar Broadcasting, Inc., 1st Lien Term Loan, 6/20/26 (b) (c) (h) | | | 1,750,000 | | | | 1,743,437 | | |
Packaging Coordinators Midco, Inc., 2nd Lien Term Loan, 11.08%
(LIBOR03M+875bps), 7/1/24, Callable 8/4/19 @ 100 (b) | | | 500,000 | | | | 497,500 | | |
Radiate Holdco LLC, 5.40%
(LIBOR01M+300bps), 2/1/24, Callable 8/4/19 @ 100 (b) | | | 984,887 | | | | 960,934 | | |
Reynolds Group Holdings, Inc., 1st Lien Term Loan B, 5.15%
(LIBOR01M+275bps), 2/5/23, Callable 8/4/19 @ 100 (b) | | | 1,792,229 | | | | 1,777,354 | | |
Sinclair Television Group, Inc., 1st Lien Term Loan B, 4.66%
(LIBOR01M+225bps), 1/3/24, Callable 8/4/19 @ 100 (b) | | | 994,898 | | | | 981,218 | | |
SIWF Holdings, Inc., 10.90% (LIBOR01M+850bps), 5/26/26 (b) | | | 1,000,000 | | | | 950,000 | | |
Specialty Building Products Holdings LLC, 1st Lien Term Loan, 8.15%
(LIBOR01M+575bps), 10/1/25, Callable 8/4/19 @ 101 (b) | | | 997,500 | | | | 990,019 | | |
Sprint Communications, Inc., 1st Lien Term Loan B, 4.94%
(LIBOR01M+250bps), 2/2/24, Callable 8/4/19 @ 100 (b) | | | 987,374 | | | | 971,329 | | |
StandardAero, Ltd., 1st Lien Term Loan, 1/24/26 (b) (c) (h) | | | 349,650 | | | | 350,899 | | |
Stars Group Holdings BV, 5.83%
(LIBOR03M+350bps), 6/27/25, Callable 8/4/19 @ 100 (b) | | | 893,353 | | | | 892,888 | | |
Station Casinos LLC, Term Loan B, 4.91%
(LIBOR01M+250bps), 6/8/23, Callable 8/4/19 @ 100 (b) | | | 994,827 | | | | 989,673 | | |
Tenneco, Inc., 1st Lien Term Loan B, 5.40%
(LIBOR01M+300bps), 6/18/25, Callable 8/4/19 @ 100 (b) | | | 995,000 | | | | 917,141 | | |
Tribune Media Co., 1st Lien Term C, 5.40%
(LIBOR01M+300bps), 1/27/24, Callable 8/4/19 @ 100 (b) | | | 1,000,000 | | | | 997,710 | | |
Univision Communications, 1st Lien Term Loan C5, 5.15%
(LIBOR01M+275bps), 3/15/24, Callable 8/4/19 @ 100 (b) | | | 972,594 | | | | 924,879 | | |
Utz Quality Foods LLC, 2nd Lien Term Loan, 9.65%
(LIBOR01M+725bps), 11/21/25, Callable 8/4/19 @ 101 (b) | | | 700,000 | | | | 693,000 | | |
Wynn Resorts Ltd., 1st Lien Term Loan B, 4.69%
(LIBOR01M+225bps), 10/30/24, Callable 8/4/19 @ 100 (b) | | | 997,500 | | | | 988,493 | | |
Total Senior Secured Loans (Cost $34,965,737) | | | 34,601,427 | | |
Corporate Bonds (74.2%) | |
Communication Services (11.2%): | |
AMC Entertainment Holdings, Inc., 6.13%, 5/15/27,
Callable 5/15/22 @ 103.06 (d) | | | 2,000,000 | | | | 1,787,600 | | |
AMC Networks, Inc., 4.75%, 8/1/25, Callable 8/1/21 @ 102.38 | | | 2,000,000 | | | | 2,033,560 | | |
Cablevision Systems Corp., 5.88%, 9/15/22 | | | 2,000,000 | | | | 2,116,040 | | |
CCO Holdings LLC/CCO Holdings Capital Corp., 5.00%, 2/1/28,
Callable 8/1/22 @ 102.5 (e) | | | 2,000,000 | | | | 2,041,360 | | |
Hughes Satellite Systems Corp., 6.63%, 8/1/26 (d) | | | 1,390,000 | | | | 1,459,792 | | |
Netflix, Inc., 5.88%, 11/15/28 | | | 2,000,000 | | | | 2,216,080 | | |
Sirius XM Radio, Inc., 5.50%, 7/1/29, Callable 7/1/24 @ 102.75 (e) (f) | | | 2,000,000 | | | | 2,050,620 | | |
Telesat Canada/Telesat LLC, 8.88%, 11/15/24, Callable 11/15/19 @ 106.66 (e) (f) | | | 1,500,000 | | | | 1,627,035 | | |
T-Mobile USA, Inc., 4.75%, 2/1/28, Callable 2/1/23 @ 102.38 | | | 2,000,000 | | | | 2,060,540 | | |
| | | | 17,392,627 | | |
See notes to financial statements.
21
Victory Portfolios
Victory High Yield Fund | | Schedule of Portfolio Investments — continued
June 30, 2019 | |
(Unaudited)
Security Description | | Principal
Amount | | Value | |
Consumer Discretionary (10.6%): | |
AV Homes, Inc., 6.63%, 5/15/22, Callable 8/5/19 @ 103.31 | | $ | 325,000 | | | $ | 336,664 | | |
Beazer Homes USA, Inc., 5.88%, 10/15/27, Callable 10/15/22 @ 102.94 (d) | | | 2,000,000 | | | | 1,737,520 | | |
Boyd Gaming Corp., 6.38%, 4/1/26, Callable 4/1/21 @ 103.19 | | | 2,000,000 | | | | 2,113,719 | | |
Churchill Downs, Inc., 5.50%, 4/1/27, Callable 4/1/22 @ 102.75 (e) | | | 850,000 | | | | 891,021 | | |
Eldorado Resorts, Inc., 6.00%, 9/15/26, Callable 9/15/21 @ 104.5 | | | 1,750,000 | | | | 1,910,388 | | |
Enterprise Development Authority/The, 12.00%, 7/15/24,
Callable 7/15/21 @ 109 (e) | | | 1,200,000 | | | | 1,301,544 | | |
Golden Nugget, Inc., 8.75%, 10/1/25, Callable 10/1/20 @ 104.38 (e) | | | 1,250,000 | | | | 1,312,700 | | |
MGM Resorts International, 5.50%, 4/15/27, Callable 1/15/27 @ 100 | | | 2,000,000 | | | | 2,097,119 | | |
Panther BF Aggregator 2 LP/Panther Finance Co., Inc., 8.50%, 5/15/27,
Callable 5/15/22 @ 104.25 (e) | | | 1,750,000 | | | | 1,798,388 | | |
Scientific Games International, Inc., 8.25%, 3/15/26,
Callable 3/15/22 @ 104.13 (e) | | | 1,750,000 | | | | 1,834,123 | | |
Yum! Brands, Inc., 5.35%, 11/1/43, Callable 5/1/43 @ 100 | | | 1,000,000 | | | | 901,790 | | |
| | | | 16,234,976 | | |
Consumer Staples (6.4%): | |
Albertsons Cos. LLC, 5.75%, 3/15/25, Callable 9/15/19 @ 104.31 | | | 2,000,000 | | | | 2,018,280 | | |
B&G Foods, Inc., 5.25%, 4/1/25, Callable 4/1/20 @ 103.94 | | | 1,750,000 | | | | 1,768,043 | | |
Cott Holdings, Inc., 5.50%, 4/1/25, Callable 4/1/20 @ 104.13 (e) (f) | | | 1,750,000 | | | | 1,783,058 | | |
Dole Food Co., Inc., 7.25%, 6/15/25, Callable 6/15/20 @ 103.63 (e) | | | 1,250,000 | | | | 1,212,888 | | |
Post Holdings, Inc., 5.00%, 8/15/26, Callable 8/15/21 @ 102.5 (d) (e) | | | 1,750,000 | | | | 1,777,124 | | |
Simmons Foods, Inc., 7.75%, 1/15/24, Callable 1/15/21 @ 103.88 (d) (e) | | | 1,250,000 | | | | 1,346,688 | | |
| | | | 9,906,081 | | |
Financials (8.3%): | |
Acrisure LLC/Acrisure Finance, Inc., 8.13%, 2/15/24,
Callable 2/15/21 @ 104.06 (e) | | | 1,775,000 | | | | 1,832,084 | | |
Compass Group Diversified Holdings LLC, 8.00%, 5/1/26,
Callable 5/1/21 @ 104 (e) (f) | | | 1,000,000 | | | | 1,042,440 | | |
Downstream Development Authority of the Quapaw Tribe of Oklahoma,
10.50%, 2/15/23, Callable 2/15/20 @ 105.25 (e) | | | 1,000,000 | | | | 1,054,650 | | |
Eagle Holding Co. II LLC, 7.75%, 5/15/22, Callable 8/5/19 @ 101 (e) | | | 1,750,000 | | | | 1,773,363 | | |
Gray Escrow, Inc., 7.00%, 5/15/27, Callable 5/15/22 @ 105.25 (e) | | | 2,000,000 | | | | 2,168,580 | | |
Intelsat Jackson Holdings SA, 5.50%, 8/1/23, Callable 8/5/19 @ 101.83 | | | 2,000,000 | | | | 1,830,240 | | |
LABL Escrow Issuer LLC, 10.50%, 7/15/27, Callable 7/15/22 @ 105.25 (c) (e) | | | 1,750,000 | | | | 1,754,060 | | |
Resideo Funding, Inc., 6.13%, 11/1/26, Callable 11/1/21 @ 104.59 (e) | | | 1,330,000 | | | | 1,381,311 | | |
| | | | 12,836,728 | | |
Health Care (12.9%): | |
Air Medical Group Holdings, Inc., 6.38%, 5/15/23,
Callable 8/5/19 @ 101.59 (d) (e) | | | 1,750,000 | | | | 1,566,268 | | |
Avantor, Inc., 9.00%, 10/1/25, Callable 10/1/20 @ 106.75 (e) (f) | | | 1,000,000 | | | | 1,113,700 | | |
Bausch Health Cos., Inc., 6.13%, 4/15/25, Callable 4/15/20 @ 103.06 (e) | | | 2,000,000 | | | | 2,043,740 | | |
BCPE Cycle Merger Sub II, Inc., 10.63%, 7/15/27, Callable 7/15/22 @ 105.31 (e) | | | 1,500,000 | | | | 1,525,770 | | |
Endo Finance LLC, 6.00%, 2/1/25, Callable 2/1/20 @ 103 (e) | | | 2,000,000 | | | | 1,344,620 | | |
HCA, Inc., 5.38%, 2/1/25 | | | 2,000,000 | | | | 2,158,459 | | |
Ortho-Clinical Diagnostics, Inc., 6.63%, 5/15/22, Callable 8/5/19 @ 100 (e) (f) | | | 1,500,000 | | | | 1,447,635 | | |
Polaris Intermediate Corp., 8.50%, 12/1/22, Callable 7/16/19 @ 104 (e) (f) | | | 1,500,000 | | | | 1,324,290 | | |
RegionalCare Hospital Partners Holdings, Inc./LifePoint Health, Inc.,
9.75%, 12/1/26, Callable 12/1/21 @ 104.88 (d) (e) | | | 2,000,000 | | | | 2,094,719 | | |
See notes to financial statements.
22
Victory Portfolios
Victory High Yield Fund | | Schedule of Portfolio Investments — continued
June 30, 2019 | |
(Unaudited)
Security Description | | Principal
Amount | | Value | |
Surgery Center Holdings, Inc., 10.00%, 4/15/27, Callable 4/15/22 @ 105 (e) | | $ | 1,750,000 | | | $ | 1,745,433 | | |
Tenet Healthcare Corp., 6.75%, 6/15/23 | | | 2,000,000 | | | | 2,010,820 | | |
Verscend Escrow Corp., 9.75%, 8/15/26, Callable 8/15/21 @ 104.88 (e) | | | 1,750,000 | | | | 1,820,193 | | |
| | | | 20,195,647 | | |
Industrials (19.2%): | |
Ahern Rentals, Inc., 7.38%, 5/15/23, Callable 8/5/19 @ 103.69 (e) (f) | | | 1,750,000 | | | | 1,564,028 | | |
Algeco Global Finance 2 PLC, 10.00%, 8/15/23, Callable 2/15/20 @ 105 (e) (f) | | | 900,000 | | | | 910,368 | | |
Allison Transmission, Inc., 5.88%, 6/1/29, Callable 6/1/24 @ 102.94 (d) (e) | | | 850,000 | | | | 894,880 | | |
Apex Tool Group LLC/BC Mountain Finance, Inc., 9.00%, 2/15/23,
Callable 8/5/19 @ 102 (e) | | | 1,750,000 | | | | 1,571,413 | | |
Aramark Services, Inc., 5.00%, 2/1/28, Callable 2/1/23 @ 102.5 (e) | | | 2,000,000 | | | | 2,056,880 | | |
Beacon Escrow Corp., 4.88%, 11/1/25, Callable 11/1/20 @ 102.44 (d) (e) | | | 1,330,000 | | | | 1,316,620 | | |
Bombardier, Inc., 7.88%, 4/15/27, Callable 4/15/22 @ 103.94 (e) | | | 2,000,000 | | | | 2,002,440 | | |
Clean Harbors, Inc.
4.88%, 7/15/27, Callable 7/15/22 @ 102.44 (c) (e) | | | 875,000 | | | | 889,184 | | |
5.13%, 7/15/29, Callable 7/15/24 @ 102.56 (c) (e) | | | 875,000 | | | | 893,891 | | |
Covanta Holding Corp., 5.88%, 7/1/25, Callable 7/1/20 @ 104.41 | | | 1,000,000 | | | | 1,039,980 | | |
IAA, Inc., 5.50%, 6/15/27, Callable 6/15/22 @ 102.75 (d) (e) | | | 850,000 | | | | 884,077 | | |
Manitowoc Foodservice, Inc., 9.50%, 2/15/24, Callable 8/5/19 @ 107.13 | | | 800,000 | | | | 866,880 | | |
Navistar International Corp., 6.63%, 11/1/25, Callable 11/1/20 @ 103.31 (e) (f) | | | 1,250,000 | | | | 1,309,100 | | |
Nielsen Finance LLC /Nielsen Finance Co., 5.00%, 4/15/22,
Callable 8/5/19 @ 101.25 (e) | | | 2,000,000 | | | | 1,999,800 | | |
Pisces Midco, Inc., 8.00%, 4/15/26, Callable 4/15/21 @ 104 (d) (e) | | | 1,000,000 | | | | 971,730 | | |
SRS Distribution, Inc., 8.25%, 7/1/26, Callable 7/1/21 @ 104.13 (d) (e) (f) | | | 1,000,000 | | | | 979,960 | | |
Stevens Holding Co. Inc., 6.13%, 10/1/26, Callable 10/1/23 @ 101.53 (e) | | | 1,000,000 | | | | 1,053,390 | | |
TransDigm, Inc., 6.50%, 7/15/24, Callable 8/5/19 @ 103.25 | | | 2,000,000 | | | | 2,024,520 | | |
Triumph Group, Inc., 4.88%, 4/1/21, Callable 8/5/19 @ 100 | | | 1,250,000 | | | | 1,234,450 | | |
United Rentals, Inc., 6.50%, 12/15/26, Callable 12/15/21 @ 103.25 (d) | | | 2,000,000 | | | | 2,163,220 | | |
W/S Packaging Holdings, Inc., 9.00%, 4/15/23 (e) (f) | | | 800,000 | | | | 875,360 | | |
XPO Logistics, Inc., 6.75%, 8/15/24, Callable 8/15/21 @ 103.38 (e) | | | 2,000,000 | | | | 2,132,220 | | |
| | | | 29,634,391 | | |
Materials (5.6%): | |
Ardagh Packaging Finance PLC/Holdings USA, Inc., 6.00%, 2/15/25,
Callable 2/15/20 @ 104.5 (e) | | | 2,000,000 | | | | 2,074,339 | | |
Greif, Inc., 6.50%, 3/1/27, Callable 3/1/22 @ 103.25 (e) | | | 2,000,000 | | | | 2,065,000 | | |
Intertape Polymer Group, Inc., 7.00%, 10/15/26, Callable 10/15/21 @ 103.5 (e) | | | 1,330,000 | | | | 1,374,568 | | |
Plastipak Holdings, Inc., 6.25%, 10/15/25, Callable 10/15/20 @ 103.13 (d) (e) | | | 1,500,000 | | | | 1,387,530 | | |
Summit Materials LLC/Summit Materials Finance Corp., 6.50%, 3/15/27,
Callable 3/15/22 @ 103.25 (e) | | | 870,000 | | | | 909,890 | | |
Titan Acquisition Ltd./Titan Co-Borrower LLC, 7.75%, 4/15/26,
Callable 4/15/21 @ 103.88 (d) (e) (f) | | | 1,000,000 | | | | 903,620 | | |
| | | | 8,714,947 | | |
Total Corporate Bonds (Cost $113,383,705) | | | 114,915,397 | | |
See notes to financial statements.
23
Victory Portfolios
Victory High Yield Fund | | Schedule of Portfolio Investments — continued
June 30, 2019 | |
(Unaudited)
Security Description | | Shares | | Value | |
Collateral for Securities Loaned^ (10.0%) | |
BlackRock Liquidity Funds TempFund Portfolio, Institutional Class, 2.43% (g) | | | 3,228,143 | | | $ | 3,228,143 | | |
| Fidelity Investments Money Market Government Portfolio, Class I, 2.28% (g) | | | 4,158,218 | | | | 4,158,218 | | |
Fidelity Investments Prime Money Market Portfolio, Class I, 2.39% (g) | | | 107,988 | | | | 107,988 | | |
Goldman Sachs Financial Square Prime Obligations Fund, Institutional Class,
2.48% (g) | | | 1,775,242 | | | | 1,775,242 | | |
JPMorgan Prime Money Market Fund, Capital Class, 2.41% (g) | | | 2,420,731 | | | | 2,420,731 | | |
Morgan Stanley Institutional Liquidity Prime Portfolio, Institutional Class,
2.42% (g) | | | 3,765,719 | | | | 3,765,719 | | |
Total Collateral for Securities Loaned (Cost $15,456,041) | | | 15,456,041 | | |
Total Investments (Cost $165,458,018) — 107.7% | | | 166,656,715 | | |
Liabilities in excess of other assets — (7.7)% | | | (11,843,777 | ) | |
NET ASSETS — 100.00% | | $ | 154,812,938 | | |
^ Purchased with cash collateral from securities on loan.
(a) Non-income producing security.
(b) Variable or Floating-Rate Security. Rate disclosed is as of June 30, 2019.
(c) Security purchased on a when-issued basis.
(d) All or a portion of this security is on loan.
(e) Rule 144A security or other security that is restricted as to resale to institutional investors. The Fund's Adviser has deemed this security to be liquid based upon procedures approved by the Board of Trustees. As of June 30, 2019, the fair value of these securities was $77,029,694 and amounted to 49.8% of net assets.
(f) All or a portion of this security has been segregated as collateral for securities purchased on a when-issued basis.
(g) Rate disclosed is the daily yield on June 30, 2019.
(h) The rates for this senior secured loan will be known on settlement date of the loan, subsequent to this report date. Senior secured loans have rates that will fluctuate over time in line with prevailing interest rates.
bps — Basis points
LIBOR — London InterBank Offered Rate
LIBOR01M — 1 Month US Dollar LIBOR, rate disclosed as of June 30, 2019, based on the last reset date of the security
LIBOR02M — 2 Month US Dollar LIBOR, rate disclosed as of June 30, 2019, based on the last reset date of the security
LIBOR03M — 3 Month US Dollar LIBOR, rate disclosed as of June 30, 2019, based on the last reset date of the security
LIBOR06M — 6 Month US Dollar LIBOR, rate disclosed as of June 30, 2019, based on the last reset date of the security
LLC — Limited Liability Company
LP — Limited Partnership
PLC — Public Limited Company
ULC — Unlimited Liability Co.
See notes to financial statements.
24
Victory Portfolios
Victory Tax-Exempt Fund | | Schedule of Portfolio Investments
June 30, 2019 | |
(Unaudited)
Security Description | | Principal
Amount | | Value | |
Municipal Bonds (99.3%) | |
California (8.2%): | |
California Educational Facilities Authority Revenue Bonds, 5.00%, 5/1/49 | | $ | 1,500,000 | | | $ | 2,206,140 | | |
Gilroy Unified School District General Obligation Bonds, 4.00%, 8/1/48,
Continuously Callable @ 100 | | | 1,750,000 | | | | 1,886,378 | | |
Golden State Tobacco Securitization Corp. Revenue Bonds, Series A2, 5.00%,
6/1/47, Continuously Callable @ 100 | | | 1,500,000 | | | | 1,498,140 | | |
| | | | 5,590,658 | | |
Connecticut (3.4%): | |
Connecticut Health and Educational Facilities Authority Revenue Bonds,
Series 2016 CT, 5.00%, 12/1/41, Continuously Callable @ 100 | | | 2,000,000 | | | | 2,314,420 | | |
Florida (5.6%): | |
County of Broward Revenue Bonds, Series B, 2.00%, 12/1/48, Continuously
Callable @ 100 | | | 1,500,000 | | | | 1,500,000 | | |
Miami-Dade County Public Facilities Revenue & Revenue Refunding Bonds,
Series 2015 A, 5.00%, 6/1/33, Continuously Callable @ 100 | | | 2,000,000 | | | | 2,331,440 | | |
| | | | 3,831,440 | | |
Guam (1.7%): | |
Port Authority of Guam Revenue Bonds, 5.00%, 7/1/48, Continuously
Callable @ 100 | | | 1,000,000 | | | | 1,127,650 | | |
Illinois (23.6%): | |
Chicago Board of Education Dedicated Capital Improvement, 6.00%, 4/1/46,
Continuously Callable @ 100 | | | 2,275,000 | | | | 2,627,875 | | |
Chicago General Obligation Refunding Bonds
Series A, 5.75%, 1/1/33, Continuously Callable @ 100 | | | 2,000,000 | | | | 2,313,940 | | |
Series A, 6.00%, 1/1/38, Continuously Callable @ 100 | | | 1,000,000 | | | | 1,161,930 | | |
Chicago Transit Authority Sales Tax Receipts Revenue Bonds,
Series 2014, 5.00%, 12/1/44, AGC, Continuously Callable @ 100 | | | 2,450,000 | | | | 2,735,768 | | |
Chicago Wastewater Transmission Revenue Bonds,
Series A, 5.00%, 1/1/47, Continuously Callable @ 100 | | | 1,000,000 | | | | 1,104,730 | | |
Chicago Wastewater Transmission Revenue Refunding Bonds,
Series 2008 C, 5.00%, 1/1/34, Continuously Callable @ 100 | | | 1,000,000 | | | | 1,115,840 | | |
City of Chicago General Obligation Bonds, Series A, 5.50%, 1/1/49,
Continuously Callable @ 100 | | | 1,000,000 | | | | 1,133,200 | | |
Illinois General Obligation Bonds, Series 2013, 5.50%, 7/1/27,
Continuously Callable @ 100 | | | 2,000,000 | | | | 2,203,020 | | |
Sales Tax Securitization Corp., Series 2018 C, 5.00%, 1/1/43,
Continuously Callable @ 100 | | | 1,500,000 | | | | 1,699,575 | | |
| | | | 16,095,878 | | |
Indiana (0.9%): | |
Duke Energy Indiana LLC, 1.93%, 12/1/39, Callable 8/1/19 @ 100,
Sumitomo Mitsui Banking Corp. | | | 600,000 | | | | 600,000 | | |
Kansas (2.3%): | |
Kansas Development Finance Authority Hospital Revenue Bonds
5.50%, 11/15/29, Pre-refunded 11/15/19 @ 100 | | | 35,000 | | | | 35,532 | | |
5.50%, 11/15/29, Continuously Callable @ 100 | | | 1,465,000 | | | | 1,485,730 | | |
| | | | 1,521,262 | | |
See notes to financial statements.
25
Victory Portfolios
Victory Tax-Exempt Fund | | Schedule of Portfolio Investments — continued
June 30, 2019 | |
(Unaudited)
Security Description | | Principal
Amount | | Value | |
Massachusetts (1.7%): | |
University of Massachusetts Building Authority Project Revenue Bonds,
Series 2014 1, 5.00%, 11/1/39, Continuously Callable @ 100 | | $ | 1,000,000 | | | $ | 1,155,470 | | |
Missouri (1.7%): | |
Health & Educational Facilities Authority of the State of Missouri
Revenue Bonds, 4.25%, 12/1/42, Continuously Callable @ 100 (a) | | | 1,150,000 | | | | 1,168,308 | | |
New Jersey (12.7%): | |
New Jersey Economic Development Authority Biomedical Research Facilities
Bonds, Series 2016 A, 5.00%, 7/15/29, Continuously Callable @ 100 | | | 885,000 | | | | 1,018,387 | | |
New Jersey Economic Development Authority School Facilities Construction
Bonds, Series 2015 WW, 5.25%, 6/15/32, Continuously Callable @ 100 | | | 3,000,000 | | | | 3,398,429 | | |
New Jersey Health Care Facilities Financing Authority Revenue & Refunding
Bonds, Series 2015 A, 5.00%, 7/1/46, AGC, Continuously Callable @ 100 | | | 1,300,000 | | | | 1,449,968 | | |
New Jersey Transportation Trust Fund Authority, Federal Highway
Reimbursement Revenue Bonds, 5.00%, 6/15/28, Continuously Callable @ 100 | | | 1,000,000 | | | | 1,174,150 | | |
Tobacco Settlement Financing Corp., Revenue Bonds,
Series 2018 A, 5.00%, 6/1/46, Continuously Callable @ 100 | | | 1,500,000 | | | | 1,672,560 | | |
| | | | 8,713,494 | | |
New York (13.6%): | |
Metropolitan Transportation Authority Dedicated Tax Green Fund Bonds,
Series 2016 B1, 5.00%, 11/15/56, Continuously Callable @ 100 | | | 1,545,000 | | | | 1,827,998 | | |
New York Counties Tobacco Trust II, Tobacco Settlement Pass-Through
Bonds, 5.75%, 6/1/43, Continuously Callable @ 100 | | | 200,000 | | | | 200,464 | | |
New York Utility Debt Securitization Authority Restructuring Bonds,
Series 2013 TE, 5.00%, 12/15/41, Continuously Callable @ 100 | | | 1,500,000 | | | | 1,697,805 | | |
Port Authority of New York & New Jersey Consolidated Bonds
5.00%, 10/1/30, Continuously Callable @ 100 | | | 2,000,000 | | | | 2,176,500 | | |
5.00%, 12/1/32, Continuously Callable @ 100 | | | 1,000,000 | | | | 1,132,610 | | |
TSASC, Inc. Tobacco Settlement Bonds, Series A, 5.00%, 6/1/41,
Continuously Callable @ 100 | | | 2,000,000 | | | | 2,182,400 | | |
| | | | 9,217,777 | | |
North Carolina (2.8%): | |
City of Charlotte, 4.00%, 6/1/49, Continuously Callable @ 100 | | | 1,770,000 | | | | 1,918,503 | | |
Ohio (2.4%): | |
Logan Elm Local School District General Obligation Bonds, 4.00%, 11/1/55,
Continuously Callable @ 100 | | | 1,500,000 | | | | 1,610,595 | | |
Oregon (0.3%): | |
Oregon State Lottery Revenue Bonds, Series A, 5.25%, 4/1/30,
Continuously Callable @ 100 | | | 205,000 | | | | 218,534 | | |
Pennsylvania (3.6%): | |
Pennsylvania Higher Educational Facilities Authority Revenue Bonds,
Series 2010 E, 5.00%, 5/15/31, Continuously Callable @ 100 | | | 1,000,000 | | | | 1,028,990 | | |
Philadelphia School District, General Obligation Bonds, 5.00%, 9/1/38,
Continuously Callable @ 100 | | | 1,200,000 | | | | 1,415,436 | | |
| | | | 2,444,426 | | |
See notes to financial statements.
26
Victory Portfolios
Victory Tax-Exempt Fund | | Schedule of Portfolio Investments — continued
June 30, 2019 | |
(Unaudited)
Security Description | | Principal
Amount | | Value | |
Texas (7.0%): | |
Canadian River Municipal Water Authority, Subordinate Lien Contract
Revenue Bonds, Series 2011, 5.00%, 2/15/26, Continuously Callable @ 100 | | $ | 1,000,000 | | | $ | 1,056,140 | | |
Fort Worth International Airport Joint Revenue Bonds, Series A, 5.00%,
11/1/38, Continuously Callable @ 100 | | | 1,000,000 | | | | 1,037,250 | | |
New Hope Cultural Education Facilities Finance Corp., Revenue Bonds,
Series A1, 5.00%, 7/1/47, Continuously Callable @ 102 | | | 500,000 | | | | 548,895 | | |
Texas Private Activity Bond Surface Transportation Corp., Revenue Bonds,
Series 2009, 6.88%, 12/31/39, Continuously Callable @ 100 | | | 2,130,000 | | | | 2,184,507 | | |
| | | | 4,826,792 | | |
Utah (1.6%): | |
Utah Infrastructure Agency Revenue Bonds, Series A, 5.00%, 10/15/40,
Continuously Callable @ 100 | | | 1,000,000 | | | | 1,096,100 | | |
Washington (3.9%): | |
Richland Electric Utility Revenue Bonds, 5.00%, 11/1/41,
Continuously Callable @ 100 | | | 2,370,000 | | | | 2,752,305 | | |
Wisconsin (2.3%): | |
Ashwaubenon Community Development Authority, Brown County Expo Center
Project Revenue Bonds, 3.00%, 6/1/44, Continuously Callable @ 100 | | | 1,600,000 | | | | 1,575,344 | | |
Total Municipal Bonds (Cost $64,003,582) | | | 67,778,956 | | |
Total Investments (Cost $64,003,582) — 99.3% | | | 67,778,956 | | |
Other assets in excess of liabilities — 0.7% | | | 455,195 | | |
NET ASSETS — 100.00% | | $ | 68,234,151 | | |
(a) Rule 144A security or other security that is restricted as to resale to institutional investors. The Fund's Adviser has deemed this security to be liquid based upon procedures approved by the Board of Trustees. As of June 30, 2019, the fair value of these securities was $1,168,308 and amounted to 1.7% of net assets.
LLC — Limited Liability Company
See notes to financial statements.
27
Victory Portfolios
Victory High Income Municipal Bond Fund | | Schedule of Portfolio Investments
June 30, 2019 | |
(Unaudited)
Security Description | | Principal
Amount | | Value | |
Municipal Bonds (98.8%) | |
California (5.4%): | |
California Educational Facilities Authority Revenue Bonds, 5.00%, 5/1/49 | | $ | 1,000,000 | | | $ | 1,470,760 | | |
Golden State Tobacco Securitization Corp. Revenue Bonds, Series A2, 5.00%,
6/1/47, Continuously Callable @ 100 | | | 1,000,000 | | | | 998,760 | | |
| | | | 2,469,520 | | |
Colorado (4.4%): | |
Regional Transportation District, Denver Transit Partners Eagle P3 Project,
Series 2010, 6.00%, 1/15/34, Continuously Callable @ 100 (a) | | | 2,000,000 | | | | 2,045,779 | | |
Delaware (3.4%): | |
The Delaware Municipal Electric Corp. Revenue Bonds, 5.00%, 10/1/44,
Continuously Callable @ 100 | | | 1,290,000 | | | | 1,523,103 | | |
District of Columbia (2.3%): | |
District of Columbia Tobacco Settlement Financing Corp., 6.50%, 5/15/33 | | | 915,000 | | | | 1,023,858 | | |
Florida (16.7%): | |
County of Broward Revenue Bonds, Series B, 2.00%, 12/1/48, Continuously
Callable @ 100 | | | 1,100,000 | | | | 1,100,000 | | |
Osceola County Expressway System Revenue Bonds, Poinciana Parkway Project,
Series 2014 A, 5.38%, 10/1/47, Continuously Callable @ 100 | | | 1,000,000 | | | | 1,088,980 | | |
Sumter County Village Community Development District No. 10 Special
Assessment Revenue Bonds, Series 2014, 5.75%, 5/1/31,
Continuously Callable @ 100 | | | 1,330,000 | | | | 1,525,191 | | |
Sumter County Village Community Development District No. 8 Special
Assessment Refunding Revenue Bonds, Series 2010, 6.13%, 5/1/39,
Continuously Callable @ 100 | | | 1,865,000 | | | | 1,917,835 | | |
Sumter County Village Community Development District No. 8 Special
Assessment Revenue Bonds, Series 2010, 6.13%, 5/1/40,
Continuously Callable @ 100 | | | 1,940,000 | | | | 1,994,048 | | |
| | | | 7,626,054 | | |
Illinois (19.8%): | |
Chicago Board of Education Dedicated Capital Improvement, 6.00%, 4/1/46,
Continuously Callable @ 100 | | | 1,500,000 | | | | 1,732,665 | | |
Chicago General Obligation Refunding Bonds
Series 2015 C, 5.00%, 1/1/38, Continuously Callable @ 100 | | | 1,000,000 | | | | 1,075,170 | | |
Series A, 6.00%, 1/1/38, Continuously Callable @ 100 | | | 1,000,000 | | | | 1,161,930 | | |
Chicago O'Hare International Airport General Airport Third Lien Revenue
Bonds, 5.75%, 1/1/39, Continuously Callable @ 100 | | | 240,000 | | | | 252,845 | | |
City of Chicago General Obligation Bonds, Series A, 5.50%, 1/1/49,
Continuously Callable @ 100 | | | 1,000,000 | | | | 1,133,200 | | |
Illinois General Obligation Bonds
Series June 2013, 5.50%, 7/1/25, Continuously Callable @ 100 | | | 1,000,000 | | | | 1,112,720 | | |
Series June 2013, 5.50%, 7/1/33, Continuously Callable @ 100 | | | 1,000,000 | | | | 1,095,370 | | |
Series June 2013, 5.50%, 7/1/38, Continuously Callable @ 100 | | | 1,250,000 | | | | 1,359,538 | | |
| | | | 8,923,438 | | |
See notes to financial statements.
28
Victory Portfolios
Victory High Income Municipal Bond Fund | | Schedule of Portfolio Investments — continued
June 30, 2019 | |
(Unaudited)
Security Description | | Principal
Amount | | Value | |
Massachusetts (3.2%): | |
Massachusetts Educational Financing Authority,
Education Loan Revenue Bonds, Issue J
Series 2011, 5.63%, 7/1/28, Continuously Callable @ 100 | | $ | 385,000 | | | $ | 408,562 | | |
Series 2011, 5.63%, 7/1/29, Continuously Callable @ 100 | | | 775,000 | | | | 821,810 | | |
Series 2011, 5.63%, 7/1/33, Continuously Callable @ 100 | | | 195,000 | | | | 206,390 | | |
| | | | 1,436,762 | | |
Mississippi (2.6%): | |
Mississippi Development Bank Revenue Bonds, 5.00%, 3/1/48,
Continuously Callable @ 100 | | | 1,000,000 | | | | 1,188,790 | | |
Missouri (1.1%): | |
Health & Educational Facilities Authority of the State of Missouri
Revenue Bonds, 4.25%, 12/1/42, Continuously Callable @ 100 (b) | | | 500,000 | | | | 507,960 | | |
New Jersey (9.0%): | |
New Jersey Economic Development Authority School Facilities
Construction Bonds, Series 2015 WW, 5.25%, 6/15/32, Continuously
Callable @ 100 | | | 1,000,000 | | | | 1,132,810 | | |
New Jersey Economic Development Motor Vehicle Surcharges
Subordinate Revenue Bonds, Series A, 5.00%, 7/1/33,
Continuously Callable @ 100 | | | 500,000 | | | | 559,295 | | |
New Jersey Higher Education Student Assistance Authority,
Student Loan Revenue Bonds, Series 2011-1, 5.75%, 12/1/28,
Continuously Callable @ 100 | | | 675,000 | | | | 715,770 | | |
Tobacco Settlement Financing Corp., Revenue Bonds,
Series 2018 A, 5.00%, 6/1/46, Continuously Callable @ 100 | | | 1,500,000 | | | | 1,672,560 | | |
| | | | 4,080,435 | | |
New York (3.5%): | |
Port Authority of New York & New Jersey Special Project Bonds,
JFK International Air Terminal LLC Project, Series 8, 6.00%, 12/1/36,
Continuously Callable @ 100 | | | 1,500,000 | | | | 1,578,615 | | |
North Dakota (2.3%): | |
Grand Forks, North Dakota Senior Housing and Nursing Facility Revenue Bonds,
5.00%, 12/1/36, Continuously Callable @ 100 | | | 1,000,000 | | | | 1,045,300 | | |
Ohio (2.3%): | |
Logan Elm Local School District General Obligation Bonds, 4.00%, 11/1/55,
Continuously Callable @ 100 | | | 975,000 | | | | 1,046,887 | | |
Oklahoma (2.7%): | |
Oklahoma Development Finance Authority Continuing Care Retirement
Community Revenue Refunding Bonds, Series 2012, 6.00%, 1/1/32,
Continuously Callable @ 100 (a) | | | 1,885,000 | | | | 1,228,660 | | |
Oregon (1.2%): | |
Clackamas County Hospital Facility Authority Revenue Bonds,
Series A, 5.00%, 11/15/52, Continuously Callable @ 102 | | | 500,000 | | | | 558,555 | | |
South Carolina (3.9%): | |
Lancaster County, Walnut Creek Improvement District Assessment Refunding
Revenue Bonds, Series 2016 A-1, 5.00%, 12/1/37,
Continuously Callable @ 100 | | | 1,675,000 | | | | 1,757,695 | | |
See notes to financial statements.
29
Victory Portfolios
Victory High Income Municipal Bond Fund | | Schedule of Portfolio Investments — continued
June 30, 2019 | |
(Unaudited)
Security Description | | Principal
Amount | | Value | |
South Dakota (1.8%): | |
Oglala Sioux Tribe, 5.00%, 10/1/22, Callable 8/5/19 @ 100 (b) | | $ | 800,000 | | | $ | 800,888 | | |
Texas (4.9%): | |
New Hope Cultural Education Facilities Finance Corp. Revenue Bonds,
Series B, 5.00%, 7/1/47, Continuously Callable @ 102 | | | 1,000,000 | | | | 1,038,680 | | |
Texas Private Activity Bond Surface Transportation Corp. Revenue Bonds,
NTE Mobility Partners Segments 3 LLC — Segments 3A & 3B Facility,
Series 2013, 7.00%, 12/31/38, Continuously Callable @ 100 | | | 1,000,000 | | | | 1,194,440 | | |
| | | | 2,233,120 | | |
Utah (4.2%): | |
Utah Charter School Finance Authority Revenue Bonds, 5.00%, 4/15/37,
Continuously Callable @ 100 | | | 500,000 | | | | 575,405 | | |
Utah Infrastructure Agency Revevnue Bonds, Series A, 5.38%, 10/15/40,
Continuously Callable @ 100 | | | 1,150,000 | | | | 1,294,210 | | |
| | | | 1,869,615 | | |
West Virginia (2.4%): | |
The Country Commission of Monongalia Country, WV Special District
Excise Tax Revenue, Refunding and Improvement Bonds,
Series 2017 A, 5.75%, 6/1/43, Continuously Callable @ 100 (b) | | | 1,000,000 | | | | 1,082,080 | | |
Wisconsin (1.7%): | |
Ashwaubenon Community Development Authority, Brown County
Expo Center Project Revenue Bonds, 3.00%, 6/1/44,
Continuously Callable @ 100 | | | 800,000 | | | | 787,672 | | |
Total Municipal Bonds (Cost $43,121,817) | | | 44,814,786 | | |
Total Investments (Cost $43,121,817) — 98.8% | | | 44,814,786 | | |
Other assets in excess of liabilities — 1.2% | | | 526,571 | | |
NET ASSETS — 100.00% | | $ | 45,341,357 | | |
(a) Defaulted security.
(b) Rule 144A security or other security that is restricted as to resale to institutional investors. The Fund's Adviser has deemed this security to be liquid based upon procedures approved by the Board of Trustees. As of June 30, 2019, the fair value of these securities was $2,390,928 and amounted to 5.3% of net assets.
LLC — Limited Liability Company
See notes to financial statements.
30
Victory Portfolios
Victory Floating Rate Fund | | Schedule of Portfolio Investments
June 30, 2019 | |
(Unaudited)
Security Description | | Principal
Amount | | Value | |
Senior Secured Loans (82.5%) | |
1199169 BC ULC, 6.33%
(LIBOR03M+400bps), 4/6/26, Callable 8/4/19 @ 101 (a) | | $ | 1,958,042 | | | $ | 1,965,032 | | |
Acrisure LLC, 1st Lien Term Loan B, 6.77%
(LIBOR03M+425bps), 11/22/23, Callable 8/4/19 @ 100 (a) | | | 6,831,244 | | | | 6,791,418 | | |
Ai Ladder Luxembourg Subco Sarl, 1st Lien Term Loan B, 6.83%
(LIBOR03M+450bps), 5/4/25 (a) | | | 5,922,641 | | | | 5,749,878 | | |
Air Medical Group Holdings, Inc., 6.65%
(LIBOR01M+425bps), 3/14/25, Callable 8/4/19 @ 100 (a) | | | 5,000,000 | | | | 4,690,000 | | |
Air Methods Corp, 5.83% (LIBOR03M+350bps), 4/21/24 (a) | | | 3,989,822 | | | | 3,223,457 | | |
Alphabet Holding Co., Inc., 1st Lien Term Loan, 5.90%
(LIBOR01M+350bps), 8/15/24, Callable 8/4/19 @ 100 (a) | | | 5,502,000 | | | | 5,182,884 | | |
Alphabet Holding Co., Inc., 2nd Lien Term Loan, 10.15%
(LIBOR01M+775bps), 8/15/25, Callable 8/4/19 @ 101 (a) | | | 4,950,000 | | | | 4,372,484 | | |
American Axle & Manufacturing, Inc., 1st Lien Term Loan B, 4.66%
(LIBOR01M+225bps), 4/6/24 | | | 5,305,538 | | | | 5,184,519 | | |
American Axle & Manufacturing, Inc., 1st Lien Term Loan B, 4.84%
(LIBOR03M+225bps), 4/6/24, Callable 8/4/19 @ 100 (a) | | | 2,691,898 | | | | 2,630,495 | | |
American Renal Holdings, Inc., 7.90%
(LIBOR01M+550bps), 6/15/24, Callable 8/4/19 @ 100 (a) | | | 5,066,152 | | | | 5,058,249 | | |
Amneal Pharmaceuticals LLC, 1st Lien Term Loan B, 5.94%
(LIBOR01M+350bps), 3/23/25, Callable 8/4/19 @ 100 (a) | | | 7,918,151 | | | | 7,850,529 | | |
AmWINS Group, Inc., 5.15%-5.17%
(LIBOR01M+275bps), 1/25/24, Callable 8/4/19 @ 100 (a) | | | 7,800,000 | | | | 7,738,224 | | |
AppLovin Corp., 1st Lien Term Loan B, 5.90%
(LIBOR01M+350bps), 8/15/25 (a) | | | 5,970,000 | | | | 5,951,374 | | |
Asurion LLC, 1st Lien Term Loan B7, 5.40%
(LIBOR01M+300bps), 11/4/24, Callable 8/4/19 @ 100 (a) | | | 6,930,000 | | | | 6,912,675 | | |
Avaya, Inc., 1st Lien Term Loan B, 6.65%
(LIBOR01M+425bps), 12/15/24, Callable 8/4/19 @ 100 (a) | | | 7,387,500 | | | | 7,055,063 | | |
Bass Pro Group LLC, Term Loan B, 7.40%
(LIBOR01M+500bps), 12/16/23, Callable 8/4/19 @ 100 (a) | | | 9,353,598 | | | | 8,919,030 | | |
Blount International, Inc., 1st Lien Term Loan B, 6.15%
(LIBOR01M+375bps), 4/12/23, Callable 8/4/19 @ 100 (a) | | | 5,925,225 | | | | 5,914,145 | | |
Boyd Gaming Corp., 4.62% (LIBOR01W+225bps), 9/15/23,
Callable 8/4/19 @ 100 (a) | | | 2,208,686 | | | | 2,194,639 | | |
Brand Energy & Infrastructure Services, Inc., 1st Lien Term Loan, 6.73%
(LIBOR02M+425bps), 6/21/24 | | | 4,123,673 | | | | 3,981,076 | | |
Brand Energy & Infrastructure Services, Inc., 1st Lien Term Loan, 6.58%-6.84%
(LIBOR03M+425bps), 6/21/24, Callable 8/4/19 @ 100 (a) | | | 4,696,327 | | | | 4,533,928 | | |
Builders FirstSource, Inc., 5.33% (LIBOR03M+300bps), 2/29/24,
Callable 8/4/19 @ 100 (a) | | | 2,617,917 | | | | 2,606,476 | | |
BW NHHC Holdco, Inc., 11.40% (LIBOR01M+900bps), 5/15/26,
Callable 8/4/19 @ 101 (a) | | | 3,000,000 | | | | 2,790,000 | | |
BW NHHC Holdco, Inc., 7.40% (LIBOR01M+500bps), 5/16/25 (a) | | | 4,950,000 | | | | 4,566,375 | | |
Change Healthcare LLC, 5.15% (LIBOR01M+275bps), 3/1/24,
Callable 8/4/19 @ 100 (a) | | | 3,731,795 | | | | 3,700,560 | | |
See notes to financial statements.
31
Victory Portfolios
Victory Floating Rate Fund | | Schedule of Portfolio Investments — continued
June 30, 2019 | |
(Unaudited)
Security Description | | Principal
Amount | | Value | |
Chassx, Inc., 8.06%
(LIBOR01M+550bps), 11/10/23, Callable 8/4/19 @ 101 (a) | | $ | 3,925,113 | | | $ | 3,910,394 | | |
CIBT Solutions, Inc., 1st Lien Term Loan, 6.08%
(LIBOR03M+375bps), 6/1/24 | | | 5,197,945 | | | | 5,106,981 | | |
CIBT Solutions, Inc., 1st Lien Term Loan, 6.43%
(LIBOR06M+375bps), 6/1/24, Callable 8/4/19 @ 100 (a) | | | 682,055 | | | | 670,119 | | |
Cole-Parmer, 6.08%
(LIBOR03M+350bps), 3/21/24, Callable 8/4/19 @ 100 (a) | | | 6,842,526 | | | | 6,825,419 | | |
Concrete Pumping Holdings, Inc., 8.60%
(LIBOR03M+600bps), 11/14/25, Callable 8/4/19 @ 101 (a) | | | 5,925,000 | | | | 5,806,500 | | |
Consolidated Communications, Inc., 1st Lien Term Loan B, 5.41%
(LIBOR01M+300bps), 10/5/23, Callable 8/4/19 @ 100 (a) | | | 4,924,441 | | | | 4,702,053 | | |
CPM Holdings, Inc., 1st Lien Term Loan, 6.15%
(LIBOR01M+375bps), 11/17/25, Callable 8/4/19 @ 100 (a) | | | 2,985,000 | | | | 2,942,703 | | |
CPM Holdings, Inc., 2nd Lien Term Loan, 10.65%
(LIBOR01M+825bps), 11/16/26, Callable 8/4/19 @ 102 (a) | | | 2,000,000 | | | | 1,966,660 | | |
Crown Finance US, Inc., 1st Lien Term Loan B, 4.65%
(LIBOR01M+225bps), 2/7/25, Callable 8/4/19 @ 100 (a) | | | 4,788,668 | | | | 4,706,351 | | |
Dawn Acquisition LLC, 1st Lien Term Loan B, 6.08%
(LIBOR03M+375bps), 10/25/25, Callable 8/4/19 @ 100 (a) | | | 3,482,500 | | | | 3,417,203 | | |
Dayco Products LLC, 6.77%
(LIBOR03M+425bps), 5/19/24, Callable 8/4/19 @ 100 (a) | | | 7,835,789 | | | | 7,581,127 | | |
Dole Food Co., Inc., 5.15%
(LIBOR01M+275bps), 3/24/24, Callable 8/4/19 @ 100 (a) | | | 6,080,000 | | | | 5,929,884 | | |
Dynasty Acquisition Co., Inc., 6.33%
(LIBOR03M+400bps), 4/6/26, Callable 8/4/19 @ 101 (a) | | | 3,641,958 | | | | 3,654,960 | | |
Eldorado Resorts, Inc., 4.69%
(LIBOR01M+225bps), 3/16/24, Callable 8/4/19 @ 100 (a) | | | 4,268,362 | | | | 4,248,343 | | |
Endo International PLC, 1st Lien Term Loan B, 6.69%
(LIBOR01M+425bps), 4/29/24, Callable 8/4/19 @ 100 (a) | | | 4,974,619 | | | | 4,659,577 | | |
Engineered Machinery Holdings, Inc., 1st Lien Term Loan, 5.58%
(LIBOR03M+325bps), 7/19/24, Callable 8/4/19 @ 100 (a) | | | 3,800,802 | | | | 3,696,280 | | |
Forterra Finance LLC, 1st Lien Term Loan, 5.40%
(LIBOR01M+300bps), 10/25/23, Callable 8/4/19 @ 100 (a) | | | 5,954,082 | | | | 5,486,031 | | |
Gates Global LLC, 1st Lien Term Loan B2, 5.15%
(LIBOR01M+275bps), 3/31/24, Callable 8/4/19 @ 100 (a) | | | 7,468,703 | | | | 7,416,047 | | |
Gentiva Health Services, Inc., 2.44% (LIBOR01M+375bps),
7/2/25 (a) (b) | | | 1,000,000 | | | | 1,000,000 | | |
Gentiva Health Services, Inc., 1st Lien Term Loan, 6.19%
(LIBOR01M+375bps), 7/2/25, Callable 8/4/19 @ 100 (a) | | | 4,850,226 | | | | 4,850,226 | | |
Gentiva Health Services, Inc., 2nd Lien Term Loan, 11.50%
(Prime+600bps), 7/2/26, Callable 8/4/19 @ 101 (a) | | | 2,250,000 | | | | 2,272,500 | | |
Greenway Health LLC, 6.08%
(LIBOR03M+375bps), 2/16/24, Callable 8/4/19 @ 100 (a) | | | 5,880,000 | | | | 5,145,000 | | |
GTT Communications, Inc., 1st Lien Term Loan B, 5.15%
(LIBOR01M+275bps), 6/2/25, Callable 8/4/19 @ 100 (a) | | | 7,920,000 | | | | 7,078,500 | | |
Gulf Finance LLC, 1st Lien Term Loan B, 7.58%
(LIBOR03M+525bps), 8/25/23 | | | 1,512,371 | | | | 1,231,947 | | |
Gulf Finance LLC, 1st Lien Term Loan B, 7.69%
(LIBOR01M+525bps), 8/25/23, Callable 8/4/19 @ 100 (a) | | | 2,543,217 | | | | 2,071,654 | | |
See notes to financial statements.
32
Victory Portfolios
Victory Floating Rate Fund | | Schedule of Portfolio Investments — continued
June 30, 2019 | |
(Unaudited)
Security Description | | Principal
Amount | | Value | |
Hertz Corp., Term Loan B1, 5.16%
(LIBOR01M+275bps), 6/30/23, Callable 8/4/19 @ 100 (a) | | $ | 7,658,328 | | | $ | 7,622,410 | | |
Holley Purchaser, Inc., 1st Lien Term Loan, 7.58%
(LIBOR03M+500bps), 10/24/25, Callable 8/4/19 @ 101 (a) | | | 4,378,000 | | | | 4,246,660 | | |
Hub International, Ltd., 1st Lien Term Loan B, 5.59%
(LIBOR03M+300bps), 4/25/25, Callable 8/4/19 @ 100 (a) | | | 7,425,000 | | | | 7,233,435 | | |
II-VI Inc, 1st Lien Term Loan, 5/8/26 (a) (b) (e) | | | 5,000,000 | | | | 4,921,900 | | |
Infor(US), Inc., 1st Lien Term Loan B6, 5.08%
(LIBOR03M+275bps), 2/1/22, Callable 8/4/19 @ 100 (a) | | | 8,514,882 | | | | 8,487,549 | | |
Janus International Group LLC, 1st Lien Term Loan, 5.40%
(LIBOR01M+300bps), 2/9/25, Callable 8/4/19 @ 100 (a) | | | 2,962,500 | | | | 2,932,875 | | |
Janus International Group LLC, 2nd Lien Term Loan, 10.15%
(LIBOR01M+775bps), 2/9/26, Callable 8/4/19 @ 101 (a) | | | 2,000,000 | | | | 1,960,000 | | |
Kindred Healthcare LLC, 1st Lien Term Loan B, 7.44%
(LIBOR01M+500bps), 7/2/25, Callable 8/4/19 @ 100 (a) | | | 5,955,000 | | | | 5,865,675 | | |
Leslie's Poolmart, Inc., Term Loan B, 5.98%
(LIBOR02M+350bps), 8/16/23, Callable 8/4/19 @ 100 (a) | | | 6,684,702 | | | | 6,304,543 | | |
LifeScan Global Corp., 1st Lien Term Loan, 8.66%
(LIBOR06M+600bps), 6/19/24, Callable 8/4/19 @ 101 (a) | | | 3,474,000 | | | | 3,308,985 | | |
LifeScan Global Corp., 2nd Lien Term Loan, 12.20%
(LIBOR03M+950bps), 6/19/25, Callable 10/1/19 @ 102 (a) | | | 2,250,000 | | | | 2,036,250 | | |
Navicure, Inc., 1st Lien Term Loan, 6.15%
(LIBOR01M+375bps), 11/1/24, Callable 8/4/19 @ 100 (a) | | | 3,940,000 | | | | 3,905,525 | | |
Navicure, Inc., 2nd Lien Term Loan, 9.90%
(LIBOR01M+750bps), 11/1/25, Callable 8/4/19 @ 101 (a) | | | 2,500,000 | | | | 2,462,500 | | |
Navistar, Inc., 1st Lien Term Loan B, 5.91%
(LIBOR01M+350bps), 11/2/24, Callable 8/4/19 @ 100 (a) | | | 7,406,250 | | | | 7,380,773 | | |
NCI Building Systems, Inc., 1st Lien Term Loan B, 6.35%
(LIBOR03M+375bps), 4/14/25, Callable 8/4/19 @ 100 (a) | | | 7,929,925 | | | | 7,692,027 | | |
Ortho-Clinical Diagnostics SA, 1st Lien Term Loan B, 5.68%
(LIBOR01M+325bps), 5/22/25, Callable 8/4/19 @ 100 (a) | | | 3,669,657 | | | | 3,524,412 | | |
Packaging Coordinators Midco, Inc., 2nd Lien Term Loan, 11.08%
(LIBOR03M+875bps), 7/1/24, Callable 8/4/19 @ 100 (a) | | | 4,250,000 | | | | 4,228,750 | | |
Panther BF Aggregator 2 LP, 5.90%
(LIBOR01M+350bps), 4/30/26, Callable 8/4/19 @ 101 (a) | | | 7,000,000 | | | | 6,943,160 | | |
Pluto Acquisition I, Inc., 7.38%
(LIBOR01M+500bps), 6/18/26 (a) (b) | | | 5,500,000 | | | | 5,445,000 | | |
Precyse Acquisition Corp., 6.90%
(LIBOR01M+450bps), 10/20/22, Callable 8/4/19 @ 100 (a) | | | 6,723,018 | | | | 6,344,848 | | |
Radiate Holdco LLC, 5.40%
(LIBOR01M+300bps), 2/1/24, Callable 8/4/19 @ 100 (a) | | | 7,820,000 | | | | 7,629,818 | | |
Regionalcare Hospital Partners Holdings, Inc., 6.90%
(LIBOR01M+450bps), 11/16/25, Callable 8/4/19 @ 101 (a) | | | 6,467,500 | | | | 6,424,750 | | |
Reynolds Group Holdings, Inc., 1st Lien Term Loan B, 5.15%
(LIBOR01M+275bps), 2/5/23, Callable 8/4/19 @ 100 (a) | | | 6,010,391 | | | | 5,960,505 | | |
Robertshaw US Holding Corp., 1st Lien Term Loan, 5.94%
(LIBOR01M+350bps), 2/15/25, Callable 8/4/19 @ 100 (a) | | | 1,975,000 | | | | 1,817,000 | | |
Robertshaw US Holding Corp., 2nd Lien Term Loan, 10.44%
(LIBOR01M+800bps), 2/15/26, Callable 8/4/19 @ 101 (a) | | | 4,000,000 | | | | 3,430,000 | | |
See notes to financial statements.
33
Victory Portfolios
Victory Floating Rate Fund | | Schedule of Portfolio Investments — continued
June 30, 2019 | |
(Unaudited)
Security Description | | Principal
Amount | | Value | |
Scientific Games International, Inc., 1st Lien Term Loan B5, 5.15%
(LIBOR01M+275bps), 8/14/24 | | $ | 1,055,693 | | | $ | 1,038,834 | | |
Scientific Games International, Inc., 1st Lien Term Loan B5, 5.23%
(LIBOR02M+275bps), 8/14/24, Callable 8/4/19 @ 100 (a) | | | 4,384,272 | | | | 4,314,255 | | |
SIWF Holdings, Inc., 6.65%
(LIBOR01M+425bps), 5/27/25 (a) | | | 3,960,000 | | | | 3,920,400 | | |
SIWF Holdings, Inc., 10.90%
(LIBOR01M+850bps), 5/26/26 (a) | | | 1,500,000 | | | | 1,425,000 | | |
Specialty Building Products Holdings LLC, 1st Lien Term Loan, 8.15%
(LIBOR01M+575bps), 10/1/25, Callable 8/4/19 @ 101 (a) | | | 6,982,500 | | | | 6,930,131 | | |
Sprint Communications, Inc., 1st Lien Term Loan B, 4.94%
(LIBOR01M+250bps), 2/2/24, Callable 8/4/19 @ 100 (a) | | | 4,936,869 | | | | 4,856,645 | | |
Sprint Communications, Inc., 1st Lien Term Loan B, 5.44%
(LIBOR01M+300bps), 2/3/24, Callable 8/4/19 @ 100 (a) | | | 8,457,500 | | | | 8,370,303 | | |
SRS Distribution, Inc., 1st Lien Term Loan B, 5.65%
(LIBOR01M+325bps), 5/19/25, Callable 8/4/19 @ 100 (a) | | | 3,970,000 | | | | 3,802,109 | | |
Station Casinos LLC, Term Loan B, 4.91%
(LIBOR01M+250bps), 6/8/23, Callable 8/4/19 @ 100 (a) | | | 7,649,292 | | | | 7,609,670 | | |
Tailwind Smith Cooper Intermediate Corp., 7.33%
(LIBOR03M+500bps), 5/28/26, Callable 8/4/19 @ 101 (a) | | | 5,000,000 | | | | 4,887,500 | | |
Tailwind Smith Cooper Intermediate Corp., 11.33%
(LIBOR01M+900bps), 5/28/27, Callable 8/4/19 @ 102 (a) | | | 3,000,000 | | | | 2,842,500 | | |
Tecomet, Inc., 1st Lien Term Loan B, 5.91%
(LIBOR01M+350bps), 4/18/24, Callable 8/4/19 @ 100 (a) | | | 6,859,999 | | | | 6,817,124 | | |
Telesat Canada, 4.83%
(LIBOR03M+250bps), 11/17/23, Callable 8/4/19 @ 100 (a) | | | 6,506,544 | | | | 6,427,945 | | |
Tenneco, Inc., 1st Lien Term Loan B, 5.40%
(LIBOR01M+300bps), 6/18/25, Callable 8/4/19 @ 100 (a) | | | 6,467,500 | | | | 5,961,418 | | |
Thor Industries, Inc., 1st Lien Term Loan B, 6.25%
(LIBOR01M+375bps), 2/1/26, Callable 8/4/19 @ 101 (a) | | | 4,780,070 | | | | 4,705,406 | | |
Titan Acquisition, Ltd., 5.40%
(LIBOR01M+300bps), 3/28/25, Callable 8/4/19 @ 100 (a) | | | 4,917,551 | | | | 4,689,425 | | |
Tribune Media Co., 1st Lien Term C, 5.40%
(LIBOR01M+300bps), 1/27/24, Callable 8/4/19 @ 100 (a) | | | 8,055,144 | | | | 8,036,697 | | |
Univision Communications, 1st Lien Term Loan C5, 5.15%
(LIBOR01M+275bps), 3/15/24, Callable 8/4/19 @ 100 (a) | | | 6,547,508 | | | | 6,226,288 | | |
US Lbm Borrower LLC, 6.15%
(LIBOR01M+375bps), 8/20/22, Callable 8/4/19 @ 100 (a) | | | 7,827,683 | | | | 7,806,470 | | |
USI, Inc., 1st Lien Term Loan B, 5.33%
(LIBOR03M+300bps), 5/16/24, Callable 8/4/19 @ 100 (a) | | | 8,842,500 | | | | 8,610,384 | | |
Utz Quality Foods LLC, 1st Lien Term Loan, 5.90%
(LIBOR01M+350bps), 11/14/24, Callable 8/4/19 @ 100 (a) | | | 4,979,785 | | | | 4,923,763 | | |
Verscend Holding Corp., 6.90%
(LIBOR01M+450bps), 8/10/25, Callable 8/4/19 @ 101 (a) | | | 5,955,000 | | | | 5,951,308 | | |
Vertex Aerospace Services Corp., 1st Lien Term Loan B, 6.90%
(LIBOR01M+450bps), 6/16/25, Callable 8/4/19 @ 100 (a) | | | 2,970,000 | | | | 2,975,584 | | |
West Corp., 1st Lien Term Loan B1, 6.02%
(LIBOR01M+350bps), 10/10/24, Callable 8/4/19 @ 100 (a) | | | 6,930,000 | | | | 6,358,275 | | |
WP CPP Holdings LLC, 1st Lien Term Loan B, 6.34%
(LIBOR03M+375bps), 4/30/25, Callable 8/4/19 @ 100 (a) | | | 3,970,000 | | | | 3,960,075 | | |
See notes to financial statements.
34
Victory Portfolios
Victory Floating Rate Fund | | Schedule of Portfolio Investments — continued
June 30, 2019 | |
(Unaudited)
Security Description | | Principal
Amount | | Value | |
WP CPP Holdings LLC, 2nd Lien Term Loan, 10.34%
(LIBOR03M+775bps), 4/30/26, Callable 8/4/19 @ 101 (a) | | $ | 2,000,000 | | | $ | 1,987,500 | | |
Wynn Resorts Ltd., 1st Lien Term Loan B, 4.69%
(LIBOR01M+225bps), 10/30/24, Callable 8/4/19 @ 100 (a) | | | 4,239,375 | | | | 4,201,093 | | |
Total Senior Secured Loans (Cost $504,452,397) | | | 493,684,421 | | |
Corporate Bonds (12.2%) | |
Communication Services (0.7%): | |
AMC Entertainment Holdings, Inc., 6.13%, 5/15/27,
Callable 5/15/22 @ 103.06 | | | 5,000,000 | | | | 4,469,000 | | |
Consumer Discretionary (3.2%): | |
Enterprise Development Authority/The, 12.00%, 7/15/24,
Callable 7/15/21 @ 109 (c) | | | 5,000,000 | | | | 5,423,100 | | |
Golden Nugget, Inc., 8.75%, 10/1/25, Callable 10/1/20 @ 104.38 (c) | | | 7,000,000 | | | | 7,351,120 | | |
Scientific Games International, Inc., 8.25%, 3/15/26,
Callable 3/15/22 @ 104.13 (c) | | | 6,000,000 | | | | 6,288,420 | | |
| | | | 19,062,640 | | |
Financials (2.8%): | |
Compass Group Diversified Holdings LLC, 8.00%, 5/1/26,
Callable 5/1/21 @ 104 (c) (d) | | | 5,000,000 | | | | 5,212,200 | | |
Eagle Holding Co. II LLC, 7.75%, 5/15/22, Callable 8/5/19 @ 101 (c) | | | 5,000,000 | | | | 5,066,750 | | |
LABL Escrow Issuer LLC, 10.50%, 7/15/27, Callable 7/15/22 @ 105.25 (b) (c) | | | 6,500,000 | | | | 6,515,080 | | |
| | | | 16,794,030 | | |
Health Care (2.6%): | |
BCPE Cycle Merger Sub II, Inc., 10.63%, 7/15/27, Callable 7/15/22 @ 105.31 (c) | | | 4,200,000 | | | | 4,272,156 | | |
Change Health/Finance, Inc., 5.75%, 3/1/25, Callable 3/1/20 @ 102.88 (c) | | | 3,000,000 | | | | 3,043,830 | | |
Endo Finance LLC, 6.00%, 2/1/25, Callable 2/1/20 @ 103 (c) | | | 3,000,000 | | | | 2,016,930 | | |
Ortho-Clinical Diagnostics, Inc., 6.63%, 5/15/22, Callable 8/5/19 @ 100 (c) (d) | | | 3,000,000 | | | | 2,895,270 | | |
Polaris Intermediate Corp., 8.50%, 12/1/22, Callable 7/16/19 @ 104 (c) (d) | | | 4,000,000 | | | | 3,531,440 | | |
| | | | 15,759,626 | | |
Industrials (2.5%): | |
Algeco Global Finance 2 PLC, 10.00%, 8/15/23, Callable 2/15/20 @ 105 (c) (d) | | | 4,000,000 | | | | 4,046,080 | | |
Apex Tool Group LLC/BC Mountain Finance, Inc., 9.00%, 2/15/23,
Callable 8/5/19 @ 102 (c) | | | 4,000,000 | | | | 3,591,800 | | |
SRS Distribution, Inc., 8.25%, 7/1/26, Callable 7/1/21 @ 104.13 (c) (d) | | | 3,000,000 | | | | 2,939,880 | | |
W/S Packaging Holdings, Inc., 9.00%, 4/15/23 (c) (d) | | | 3,800,000 | | | | 4,157,960 | | |
| | | | 14,735,720 | | |
Materials (0.4%): | |
Titan Acquisition Ltd./Titan Co-Borrower LLC, 7.75%, 4/15/26,
Callable 4/15/21 @ 103.88 (c) (d) | | | 2,500,000 | | | | 2,259,050 | | |
Total Corporate Bonds (Cost $72,008,834) | | | 73,080,066 | | |
Total Investments (Cost $576,461,231) — 94.7% | | | 566,764,487 | | |
Other assets in excess of liabilities — 5.3% | | | 31,525,499 | | |
NET ASSETS — 100.00% | | $ | 598,289,986 | | |
See notes to financial statements.
35
Victory Portfolios
Victory Floating Rate Fund | | Schedule of Portfolio Investments — continued
June 30, 2019 | |
(Unaudited)
(a) Variable or Floating-Rate Security. Rate disclosed is as of June 30, 2019.
(b) Security purchased on a when-issued basis.
(c) Rule 144A security or other security that is restricted as to resale to institutional investors. The Fund's Adviser has deemed this security to be liquid based upon procedures approved by the Board of Trustees. As of June 30, 2019, the fair value of these securities was $68,611,066 and amounted to 11.5% of net assets.
(d) All or a portion of this security has been segregated as collateral for securities purchased on a when-issued basis.
(e) The rates for this senior secured loan will be known on settlement date of the loan, subsequent to this report date. Senior secured loans have rates that will fluctuate over time in line with prevailing interest rates.
bps — Basis points
LIBOR — London InterBank Offered Rate
LIBOR01M — 1 Month US Dollar LIBOR, rate disclosed as of June 30, 2019, based on the last reset date of the security
LIBOR01W — 1 Week US Dollar LIBOR, rate disclosed as of June 30, 2019, based on the last reset date of the security
LIBOR02M — 2 Month US Dollar LIBOR, rate disclosed as of June 30, 2019, based on the last reset date of the security
LIBOR03M — 3 Month US Dollar LIBOR, rate disclosed as of June 30, 2019, based on the last reset date of the security
LIBOR06M — 6 Month US Dollar LIBOR, rate disclosed as of June 30, 2019, based on the last reset date of the security
LLC — Limited Liability Company
LP — Limited Partnership
PLC — Public Limited Company
PRIME — U.S. Prime Rate
ULC — Unlimited Liability Co.
See notes to financial statements.
36
Victory Portfolios
Victory Strategic Income Fund | | Schedule of Portfolio Investments
June 30, 2019 | |
(Unaudited)
Security Description | | Principal
Amount | | Value | |
Asset Backed Securities (9.8%) | |
Ally Master Owner Trust, Series 2017-3, Class A1, 2.82%
(LIBOR01M+43bps), 6/15/22 (a) (b) | | $ | 250,000 | | | $ | 250,328 | | |
AmeriCredit Automobile, Series 2017-3, Class A3, 1.90%, 3/18/22,
Callable 10/18/21 @ 100 (b) | | | 266,450 | | | | 265,840 | | |
Applebee's Funding LLC / IHOP Funding LLC, Series 2019-1A,
Class A2I, 4.19%, 6/7/49, Callable 6/5/22 @ 100 (c) | | | 500,000 | | | | 507,344 | | |
Capital Automotive REIT, Series 2016-A1, Class A, 4.55%, 2/15/46 (b) (c) | | | 723,571 | | | | 757,688 | | |
Chesapeake Funding II LLC, Series 2018-A1, Class A1, 3.04%, 4/15/30 (b) (c) | | | 278,920 | | | | 281,682 | | |
Focus Brands Funding LLC, Series 2017-1A, Class A2I, 3.86%, 4/30/47,
Callable 4/30/20 @ 100 (b) (c) | | | 980,000 | | | | 985,581 | | |
Mercedes-Benz Master Owner Trust, Series 2017-BA, Class A, 2.81%
(LIBOR01M+42bps), 5/16/22 (a) (c) | | | 500,000 | | | | 500,746 | | |
Santander Drive Auto Receivables Trust, Series 2016-3,
Class C, 2.46%, 3/15/22, Callable 11/15/20 @ 100 (b) | | | 467,186 | | | | 467,105 | | |
Verizon Owner Trust, Series 2017-3A, Class A1A, 2.06%, 4/20/22,
Callable 12/20/20 @ 100 (b) (c) | | | 500,000 | | | | 499,365 | | |
Verizon Owner Trust, Series 2017-3A, Class B, 2.38%, 4/20/22,
Callable 12/20/20 @ 100 (b) (c) | | | 500,000 | | | | 500,465 | | |
Total Asset Backed Securities (Cost $5,001,235) | | | 5,016,144 | | |
Collateralized Mortgage Obligations (1.5%) | |
COMM Mortgage Trust, Series 2015-PC1, Class A5, 3.90%, 7/10/50 (b) | | | 250,000 | | | | 267,506 | | |
Four Times Square Trust, Series 2006-4TS, Class A, 5.40%, 12/13/28 (c) | | | 470,059 | | | | 487,408 | | |
Total Collateralized Mortgage Obligations (Cost $738,489) | | | 754,914 | | |
Corporate Bonds (58.7%) | |
Communication Services (9.4%): | |
AT&T, Inc., 4.50%, 3/9/48, Callable 9/9/47 @ 100 | | | 250,000 | | | | 255,188 | | |
Charter Communications Operating LLC/Capital, 4.20%, 3/15/28,
Callable 12/15/27 @ 100 (b) | | | 1,000,000 | | | | 1,038,639 | | |
Comcast Corp.
4.15%, 10/15/28, Callable 7/15/28 @ 100 (b) | | | 850,000 | | | | 936,471 | | |
3.97%, 11/1/47, Callable 5/1/47 @ 100 | | | 300,000 | | | | 314,280 | | |
Discovery Communications LLC, 3.95%, 3/20/28, Callable 12/20/27 @ 100 | | | 500,000 | | | | 514,655 | | |
Verizon Communications, 4.33%, 9/21/28 | | | 500,000 | | | | 553,774 | | |
Verizon Communications, Inc., 4.52%, 9/15/48 (b) | | | 250,000 | | | | 279,928 | | |
Vodafone Group PLC, 4.38%, 5/30/28 (b) | | | 800,000 | | | | 864,776 | | |
| | | | 4,757,711 | | |
Consumer Staples (8.7%): | |
Altria Group, Inc., 4.80%, 2/14/29, Callable 11/14/28 @ 100 | | | 1,000,000 | | | | 1,078,300 | | |
Anheuser-Busch InBev Worldwide, Inc.
4.75%, 1/23/29, Callable 10/23/28 @ 100 | | | 1,500,000 | | | | 1,700,880 | | |
5.55%, 1/23/49, Callable 7/23/48 @ 100 | | | 500,000 | | | | 611,335 | | |
Bacardi, Ltd., 4.70%, 5/15/28, Callable 2/15/28 @ 100 (c) | | | 250,000 | | | | 267,258 | | |
ConAgra Brands, Inc., 5.40%, 11/1/48, Callable 5/1/48 @ 100 | | | 500,000 | | | | 548,725 | | |
Constellation Brands, Inc., 4.10%, 2/15/48, Callable 8/15/47 @ 100 | | | 250,000 | | | | 248,213 | | |
| | | | 4,454,711 | | |
See notes to financial statements.
37
Victory Portfolios
Victory Strategic Income Fund | | Schedule of Portfolio Investments — continued
June 30, 2019 | |
(Unaudited)
Security Description | | Principal
Amount | | Value | |
Energy (11.5%): | |
Anadarko Petroleum Corp., 5.55%, 3/15/26, Callable 12/15/25 @ 100 | | $ | 250,000 | | | $ | 280,628 | | |
Boardwalk Pipelines LP, 4.80%, 5/3/29, Callable 2/3/29 @ 100 (d) | | | 500,000 | | | | 522,005 | | |
Cenovus Energy, Inc., 4.25%, 4/15/27, Callable 1/15/27 @ 100 (b) | | | 300,000 | | | | 310,635 | | |
Energy Transfer Partners, 6.00%, 6/15/48, Callable 12/15/47 @ 100 (b) | | | 450,000 | | | | 514,224 | | |
Hess Corp., 4.30%, 4/1/27, Callable 1/1/27 @ 100 | | | 250,000 | | | | 259,185 | | �� |
Marathon Petroleum Corp., 3.80%, 4/1/28, Callable 1/1/28 @ 100 | | | 500,000 | | | | 508,695 | | |
MPLX LP, 4.50%, 7/15/23, Callable 4/15/23 @ 100 (b) | | | 1,000,000 | | | | 1,060,409 | | |
Newfield Exploration Co., 5.38%, 1/1/26, Callable 10/1/25 @ 100 | | | 300,000 | | | | 328,329 | | |
Noble Energy, Inc., 3.85%, 1/15/28, Callable 10/15/27 @ 100 (d) | | | 250,000 | | | | 254,943 | | |
Rockies Express Pipeline LLC, 4.95%, 7/15/29, Callable 4/15/29 @ 100 (c) | | | 200,000 | | | | 206,632 | | |
Sabine Pass Liquefaction LLC, 5.00%, 3/15/27, Callable 9/15/26 @ 100 (b) | | | 1,000,000 | | | | 1,096,889 | | |
Williams Partners LP, 4.00%, 11/15/21, Callable 8/15/21 @ 100 (b) | | | 500,000 | | | | 515,920 | | |
| | | | 5,858,494 | | |
Financials (13.9%): | |
Banco Santander SA, 3.13%, 2/23/23 (b) | | | 750,000 | | | | 761,130 | | |
Brighthouse Financial, Inc., 3.70%, 6/22/27, Callable 3/22/27 @ 100 (b) | | | 800,000 | | | | 760,432 | | |
Citigroup, Inc., 4.08% (LIBOR03M +119bps), 4/23/29,
Callable 4/23/28 @ 100 (a) (b) | | | 250,000 | | | | 268,585 | | |
Credit Suisse Group AG, 3.87% (LIBOR03M +141bps), 1/12/29,
Callable 1/12/28 @ 100 (a) (c) | | | 500,000 | | | | 514,755 | | |
E*TRADE Financial Corp., 4.50%, 6/20/28,
Callable 3/20/28 @ 100 (b) (d) | | | 250,000 | | | | 264,733 | | |
Goldman Sachs Group, Inc.
3.20%, 2/23/23, Callable 1/23/23 @ 100 (b) | | | 500,000 | | | | 511,795 | | |
4.22% (LIBOR03M +130bps), 5/1/29, Callable 5/1/28 @ 100 (a) (b) | | | 750,000 | | | | 802,717 | | |
Jefferies GRP LLC / Capital, 4.85%, 1/15/27 | | | 500,000 | | | | 517,305 | | |
John Deere Capital Corp., 3.65%, 10/12/23 (b) (d) | | | 500,000 | | | | 526,750 | | |
Morgan Stanley, 3.13%, 1/23/23 (b) | | | 500,000 | | | | 511,260 | | |
New York Life Insurance Co., 4.45%, 5/15/69, Callable 11/15/68 @ 100 (c) | | | 100,000 | | | | 110,308 | | |
NXP BV / NXP Funding LLC, 4.88%, 3/1/24, Callable 2/1/24 @ 100 (b) (c) | | | 700,000 | | | | 750,875 | | |
PartnerRe Finance B LLC, 3.70%, 7/2/29, Callable 4/2/29 @ 100 | | | 350,000 | | | | 355,670 | | |
UBS Group Funding Switze, 4.25%, 3/23/28, Callable 3/23/27 @ 100 (c) | | | 450,000 | | | | 483,660 | | |
| | | | 7,139,975 | | |
Health Care (5.9%): | |
Becton Dickinson and Co., 3.36%, 6/6/24, Callable 4/6/24 @ 100 (b) | | | 850,000 | | | | 877,277 | | |
Celgene Corp., 3.90%, 2/20/28, Callable 11/20/27 @ 100 (d) | | | 1,000,000 | | | | 1,074,510 | | |
CVS Health Corp., 4.30%, 3/25/28, Callable 12/25/27 @ 100 (b) | | | 1,000,000 | | | | 1,054,740 | | |
| | | | 3,006,527 | | |
Industrials (2.4%): | |
United Technologies Corp.
4.13%, 11/16/28, Callable 8/16/28 @ 100 (b) | | | 350,000 | | | | 384,307 | | |
3.75%, 11/1/46, Callable 5/1/46 @ 100 | | | 250,000 | | | | 254,305 | | |
Waste Connections, Inc., 3.50%, 5/1/29, Callable 2/1/29 @ 100 | | | 600,000 | | | | 624,126 | | |
| | | | 1,262,738 | | |
Information Technology (0.5%): | |
Fiserv, Inc., 3.50%, 7/1/29, Callable 4/1/29 @ 100 (b) | | | 250,000 | | | | 256,975 | | |
See notes to financial statements.
38
Victory Portfolios
Victory Strategic Income Fund | | Schedule of Portfolio Investments — continued
June 30, 2019 | |
(Unaudited)
Security Description | | Principal
Amount | | Value | |
Materials (3.9%): | |
DuPont de Nemours, Inc., 4.21%, 11/15/23, Callable 10/15/23 @ 100 | | $ | 1,000,000 | | | $ | 1,070,810 | | |
LYB International Finance II BV, 3.50%, 3/2/27, Callable 12/2/26 @ 100 (b) | | | 250,000 | | | | 254,388 | | |
WRKCo, Inc., 4.90%, 3/15/29, Callable 12/15/28 @ 100 (d) | | | 600,000 | | | | 657,204 | | |
| | | | 1,982,402 | | |
Real Estate (1.0%): | |
Simon Property Group, LP, 3.75%, 2/1/24, Callable 11/1/23 @ 100 | | | 500,000 | | | | 525,850 | | |
Utilities (1.5%): | |
Avangrid, Inc., 3.80%, 6/1/29, Callable 3/1/29 @ 100 | | | 750,000 | | | | 784,800 | | |
Total Corporate Bonds (Cost $28,613,567) | | | 30,030,183 | | |
Residential Mortgage Backed Securities (1.5%) | |
Bank of America Funding Corp., Series 2004-2,
Class 1CB1, 5.75%, 9/20/34, Callable 4/20/24 @ 100 (b) | | | 91,452 | | | | 96,729 | | |
Bear Stearns Alt-A Trust, Series 2003-3, Class 2A, 4.45%, 10/25/33,
Callable 7/25/19 @ 100 (b) (e) | | | 147,232 | | | | 147,231 | | |
Countrywide Home Loans, Inc., Series 2004-5, Class 2A9, 5.25%, 5/25/34,
Callable 7/25/19 @ 100 (b) | | | 119,109 | | | | 119,109 | | |
GSR Mortgage Loan Trust, Series 2004-15F, Class 5A1, 5.50%, 1/25/20,
Callable 2/25/24 @ 100 (b) | | | 3,457 | | | | 2,993 | | |
JPMorgan Mortgage Trust, Series 2004-S2, Class 1A3, 4.75%, 11/25/19,
Callable 7/25/19 @ 100 (b) | | | 2,655 | | | | 2,655 | | |
JPMorgan Mortgage Trust, Series 2005-A1, Class 6T1, 4.72%, 2/25/35,
Callable 7/25/19 @ 100 (b) (e) | | | 36,037 | | | | 36,037 | | |
Prime Mortgage Trust, Series 2004-2, Class A2, 4.75%, 11/25/19,
Callable 7/25/19 @ 100 (b) | | | 2,672 | | | | 2,672 | | |
Residential Funding Mortgage Securities I, Inc., Series 2005-S3,
Class A1, 4.75%, 3/25/20, Callable 7/25/19 @ 100 (b) | | | 1,801 | | | | 1,801 | | |
Wells Fargo Mortgage Backed Securities Trust, Series 2004-EE,
Class 2A1, 4.96%, 12/25/34, Callable 7/25/19 @ 100 (b) (e) | | | 80,099 | | | | 80,099 | | |
Wells Fargo Mortgage Backed Securities Trust, Series 2004-W,
Class A9, 4.85%, 11/25/34, Callable 7/25/19 @ 100 (b) (e) | | | 68,536 | | | | 68,536 | | |
Wells Fargo Mortgage Backed Securities Trust, Series 2004-R,
Class 2A1, 4.73%, 9/25/34, Callable 7/25/19 @ 100 (b) (e) | | | 68,500 | | | | 68,500 | | |
Wells Fargo Mortgage Backed Securities Trust, Series 2004-Y,
Class 3A1, 4.91%, 11/25/34, Callable 7/25/19 @ 100 (b) (e) | | | 105,334 | | | | 105,334 | | |
Wells Fargo Mortgage Backed Securities Trust, Series 2005-2,
Class 2A1, 4.75%, 4/25/20, Callable 7/25/19 @ 100 (b) | | | 2,381 | | | | 2,381 | | |
Wells Fargo Mortgage Backed Securities Trust, Series 2005-6,
Class A4, 5.50%, 8/25/35, Callable 7/25/19 @ 100 (b) | | | 35,685 | | | | 35,685 | | |
Total Residential Mortgage Backed Securities (Cost $771,563) | | | 769,762 | | |
U.S. Government Mortgage Backed Agencies (0.3%) | |
Federal National Mortgage Association
Series 2018-M1, Class A2, 3.09%, 12/25/27 | | | 65,000 | | | | 67,461 | | |
3.50%, 7/1/43 (b) | | | 91,365 | | | | 94,553 | | |
| | | | 162,014 | | |
Total U.S. Government Mortgage Backed Agencies (Cost $155,680) | | | 162,014 | | |
See notes to financial statements.
39
Victory Portfolios
Victory Strategic Income Fund | | Schedule of Portfolio Investments — continued
June 30, 2019 | |
(Unaudited)
Security Description | | Shares or
Principal
Amount | | Value | |
U.S. Treasury Obligations (18.6%) | |
U.S. Treasury Bonds
2.75%, 11/15/47 (b) | | $ | 1,200,000 | | | $ | 1,252,500 | | |
3.00%, 2/15/48 (b) | | | 140,000 | | | | 153,344 | | |
U.S. Treasury Notes
2.25%, 3/31/20 (b) | | | 400,000 | | | | 400,672 | | |
2.13%, 5/31/21 | | | 1,000,000 | | | | 1,006,836 | | |
2.38%, 1/31/23 (b) | | | 805,000 | | | | 822,987 | | |
2.63%, 2/28/23 (b) | | | 460,000 | | | | 474,555 | | |
2.88%, 11/30/23 (b) | | | 3,500,000 | | | | 3,667,890 | | |
2.50%, 1/31/25 (b) | | | 1,650,000 | | | | 1,711,101 | | |
Total U.S. Treasury Obligations (Cost $9,065,947) | | | 9,489,885 | | |
Exchange-Traded Funds (8.3%) | |
iShares iBoxx High Yield Corporate Bond ETF (b) | | | 23,900 | | | | 2,083,602 | | |
SPDR Bloomberg Barclays High Yield Bond ETF (b) | | | 19,999 | | | | 2,178,691 | | |
Total Exchange-Traded Funds (Cost $4,243,078) | | | 4,262,293 | | |
Collateral for Securities Loaned^ (5.0%) | |
BlackRock Liquidity Funds TempFund Portfolio, Institutional Class, 2.43% (f) | | | 535,757 | | | | 535,757 | | |
Fidelity Investments Money Market Government Portfolio, Class I, 2.28% (f) | | | 690,116 | | | | 690,116 | | |
Fidelity Investments Prime Money Market Portfolio, Class I, 2.39% (f) | | | 17,922 | | | | 17,922 | | |
Goldman Sachs Financial Square Prime Obligations Fund,
Institutional Class, 2.48% (f) | | | 294,627 | | | | 294,627 | | |
JPMorgan Prime Money Market Fund, Capital Class, 2.41% (f) | | | 401,755 | | | | 401,755 | | |
Morgan Stanley Institutional Liquidity Prime Portfolio,
Institutional Class, 2.42% (f) | | | 624,975 | | | | 624,975 | | |
Total Collateral for Securities Loaned (Cost $2,565,152) | | | 2,565,152 | | |
Total Investments (Cost $51,154,711) — 103.7% | | | 53,050,347 | | |
Liabilities in excess of other assets — (3.7)% | | | (1,876,861 | ) | |
NET ASSETS — 100.00% | | $ | 51,173,486 | | |
^ Purchased with cash collateral from securities on loan.
(a) Variable or Floating-Rate Security. Rate disclosed is as of June 30, 2019.
(b) All or a portion of this security has been segregated as collateral for derivative instruments.
(c) Rule 144A security or other security that is restricted as to resale to institutional investors. The Fund's Adviser has deemed this security to be liquid based upon procedures approved by the Board of Trustees. As of June 30, 2019, the fair value of these securities was $6,853,767 and amounted to 13.4% of net assets.
(d) All or a portion of this security is on loan.
(e) The rate for certain asset-backed and mortgage backed securities may vary based on factors relating to the pool of assets underlying the security. The rate disclosed is the rate in effect at June 30, 2019.
(f) Rate disclosed is the daily yield on June 30, 2019.
bps — Basis points
ETF — Exchange-Traded Fund
See notes to financial statements.
40
Victory Portfolios
Victory Strategic Income Fund | | Schedule of Portfolio Investments — continued
June 30, 2019 | |
(Unaudited)
LIBOR — London InterBank Offered Rate
LIBOR01M — 1 Month US Dollar LIBOR, rate disclosed as of June 30, 2019, based on the last reset date of the security
LIBOR03M — 3 Month US Dollar LIBOR, rate disclosed as of June 30, 2019, based on the last reset date of the security
LLC — Limited Liability Company
LP — Limited Partnership
PLC — Public Limited Company
REIT — Real Estate Investment Trust
Futures Contracts Purchased
| | | Number of
Contracts | | Expiration
Date | | Notional
Amount | | Value | | Unrealized
Appreciation
(Depreciation) | |
2-Year U.S. Treasury Note Future | | | 20 | | | 9/30/19 | | $ | 4,298,724 | | | $ | 4,303,592 | | | $ | 4,868 | | |
30-Year U.S. Treasury Bond Future | | | 15 | | | 9/19/19 | | | 2,271,150 | | | | 2,333,907 | | | | 62,757 | | |
Ultra Long Term U.S. Treasury Bond Future | | | 10 | | | 9/19/19 | | | 1,720,506 | | | | 1,775,625 | | | | 55,119 | | |
| | | | | | | | | | | $ | 122,744 | | |
Futures Contracts Sold
| | | Number of
Contracts | | Expiration
Date | | Notional
Amount | | Value | | Unrealized
Appreciation
(Depreciation) | |
10-Year U.S. Treasury Note Future | | | 15 | | | 9/19/19 | | $ | 1,885,960 | | | $ | 1,919,532 | | | $ | (33,572 | ) | |
10-Year U.S. Treasury Note Future | | | 52 | | | 9/19/19 | | | 7,041,624 | | | | 7,182,500 | | | | (140,876 | ) | |
5-Year U.S. Treasury Note Future | | | 25 | | | 9/30/19 | | | 2,948,161 | | | | 2,953,908 | | | | (5,747 | ) | |
| | | | | | | | | | | $ | (180,195 | ) | |
| | | Total unrealized appreciation | | | | | | | | $ | 122,744 | | |
| | | Total unrealized depreciation | | | | | | | | | (180,195 | ) | |
| | | Total net unrealized depreciation | | | | | | | | $ | (57,451 | ) | |
See notes to financial statements.
41
Victory Portfolios | | Statements of Assets and Liabilities
June 30, 2019 | |
(Unaudited)
| | | Victory INCORE
Investment Quality
Bond Fund | | Victory INCORE
Low Duration
Bond Fund | | Victory High
Yield Fund | |
ASSETS: | |
Investments, at value (Cost $32,088,661,
$277,645,163 and $165,458,018) | | $ | 32,735,664 | (a) | | $ | 278,380,238 | (b) | | $ | 166,656,715 | (c) | |
Cash and cash equivalents | | | 357,457 | | | | 5,325,861 | | | | 11,364,948 | | |
Deposits with brokers for futures contracts | | | 224,132 | | | | 1,606,319 | | | | — | | |
Deposits with brokers for centrally cleared
swap agreements | | | 284,321 | | | | 2,570,083 | | | | — | | |
Interest and dividends receivable | | | 190,411 | | | | 1,507,639 | | | | 1,894,233 | | |
Receivable for capital shares issued | | | 46,137 | | | | 124,109 | | | | 431,935 | | |
Receivable for investments sold | | | 783,375 | | | | 5,938,490 | | | | 10,586,232 | | |
Variation margin receivable on open
swap agreements | | | 2,349 | | | | 20,136 | | | | — | | |
Receivable from Adviser | | | 29,759 | | | | 55,774 | | | | 25,139 | | |
Prepaid expenses | | | 34,873 | | | | 51,159 | | | | 43,420 | | |
Total Assets | | | 34,688,478 | | | | 295,579,808 | | | | 191,002,622 | | |
LIABILITIES: | |
Payables: | |
Collateral received on loaned securities | | | 505,452 | | | | 896,033 | | | | 15,456,041 | | |
Distributions | | | 1,849 | | | | 87,753 | | | | 213,667 | | |
Investments purchased | | | 870,644 | | | | 6,551,845 | | | | 20,137,312 | | |
Capital shares redeemed | | | 12,952 | | | | 617,025 | | | | 282,649 | | |
Variation margin payable on open
futures contracts | | | 216 | | | | 24,220 | | | | — | | |
Accrued expenses and other payables: | |
Investment advisory fees | | | 13,560 | | | | 106,040 | | | | 68,160 | | |
Administration fees | | | 1,660 | | | | 14,376 | | | | 7,047 | | |
Custodian fees | | | 946 | | | | 3,531 | | | | 2,614 | | |
Transfer agent fees | | | 7,798 | | | | 53,677 | | | | — | | |
Chief Compliance Officer fees | | | 21 | | | | 199 | | | | 77 | | |
Trustees' fees | | | — | | | | 30 | | | | — | | |
| 12b-1 fees | | | 4,391 | | | | 26,264 | | | | 15,193 | | |
Other accrued expenses | | | 9,800 | | | | 29,866 | | | | 6,924 | | |
Total Liabilities | | | 1,429,289 | | | | 8,410,859 | | | | 36,189,684 | | |
NET ASSETS: | |
Capital | | | 33,608,404 | | | | 318,747,198 | | | | 161,537,553 | | |
Total distributable earnings/(loss) | | | (349,215 | ) | | | (31,578,249 | ) | | | (6,724,615 | ) | |
Net Assets | | $ | 33,259,189 | | | $ | 287,168,949 | | | $ | 154,812,938 | | |
Net Assets | |
Class A Shares | | $ | 23,488,411 | | | $ | 69,533,857 | | | $ | 30,879,870 | | |
Class C Shares | | | 3,217,513 | | | | 45,593,260 | | | | 20,163,985 | | |
Class R Shares | | | 3,321,232 | | | | 1,381,677 | | | | 18,405,564 | | |
Class Y Shares | | | 3,232,033 | | | | 170,660,155 | | | | 85,363,519 | | |
Total | | $ | 33,259,189 | | | $ | 287,168,949 | | | $ | 154,812,938 | | |
Shares (unlimited number of shares authorized
with a par value of $0.001 per share): | |
Class A Shares | | | 2,449,253 | | | | 6,963,687 | | | | 4,688,544 | | |
Class C Shares | | | 335,731 | | | | 4,568,608 | | | | 3,055,006 | | |
Class R Shares | | | 345,493 | | | | 138,396 | | | | 2,787,154 | | |
Class Y Shares | | | 337,381 | | | | 17,083,857 | | | | 13,026,629 | | |
Total | | | 3,467,858 | | | | 28,754,548 | | | | 23,557,333 | | |
Net asset value, offering (except Class A Shares)
and redemption price per share: | |
Class A Shares | | $ | 9.59 | | | $ | 9.99 | | | $ | 6.59 | | |
Class C Shares (d) | | | 9.58 | | | | 9.98 | | | | 6.60 | | |
Class R Shares | | | 9.61 | | | | 9.98 | | | | 6.60 | | |
Class Y Shares | | | 9.58 | | | | 9.99 | | | | 6.55 | | |
Maximum Sales Charge — Class A Shares | | | 2.00 | % | | | 2.00 | % | | | 2.00 | % | |
Maximum offering price
(100%/(100%-maximum sales charge) of
net asset value adjusted to the nearest cent)
per share — Class A Shares | | $ | 9.79 | | | $ | 10.19 | | | $ | 6.72 | | |
(a) Includes $492,224 of securities on loan.
(b) Includes $871,253 of securities on loan.
(c) Includes $14,936,633 of securities on loan.
(d) Redemption price per share varies by the length of time shares are held.
See notes to financial statements.
42
Victory Portfolios | | Statements of Assets and Liabilities
June 30, 2019 | |
(Unaudited)
| | | Victory
Tax-Exempt
Fund | | Victory
High Income
Municipal Bond
Fund | | Victory
Floating
Rate Fund | |
ASSETS: | |
Investments, at value (Cost $64,003,582,
$43,121,817 and $576,461,231) | | $ | 67,778,956 | | | $ | 44,814,786 | | | $ | 566,764,487 | | |
Cash and cash equivalents | | | 179,061 | | | | 94,512 | | | | 31,143,135 | | |
Interest and dividends receivable | | | 712,325 | | | | 536,834 | | | | 2,879,329 | | |
Receivable for capital shares issued | | | 86,927 | | | | 15,156 | | | | 561,699 | | |
Receivable for investments sold | | | 1,591,205 | | | | — | | | | 22,736,261 | | |
Receivable from Adviser | | | 30,819 | | | | 28,626 | | | | 211,677 | | |
Prepaid expenses | | | 27,803 | | | | 18,161 | | | | 30,144 | | |
Total Assets | | | 70,407,096 | | | | 45,508,075 | | | | 624,326,732 | | |
LIABILITIES: | |
Payables: | |
Distributions | | | 11,910 | | | | 12,526 | | | | 417,973 | | |
Affiliated interfund lending | | | 221,000 | | | | — | | | | — | | |
Investments purchased | | | 1,591,205 | | | | — | | | | 20,851,267 | | |
Capital shares redeemed | | | 289,113 | | | | 113,954 | | | | 4,131,427 | | |
Accrued expenses and other payables: | |
Investment advisory fees | | | 28,355 | | | | 18,720 | | | | 321,537 | | |
Administration fees | | | 3,475 | | | | 2,291 | | | | 30,198 | | |
Custodian fees | | | 845 | | | | 213 | | | | 32,187 | | |
Transfer agent fees | | | 7,468 | | | | 2,023 | | | | 84,735 | | |
Chief Compliance Officer fees | | | 45 | | | | 30 | | | | 370 | | |
Trustees' fees | | | — | | | | — | | | | 408 | | |
| 12b-1 fees | | | 9,103 | | | | 8,125 | | | | 84,723 | | |
Other accrued expenses | | | 10,426 | | | | 8,836 | | | | 81,921 | | |
Total Liabilities | | | 2,172,945 | | | | 166,718 | | | | 26,036,746 | | |
NET ASSETS: | |
Capital | | | 64,103,464 | | | | 43,538,008 | | | | 776,368,646 | | |
Total distributable earnings/(loss) | | | 4,130,687 | | | | 1,803,349 | | | | (178,078,660 | ) | |
Net Assets | | $ | 68,234,151 | | | $ | 45,341,357 | | | $ | 598,289,986 | | |
Net Assets | |
Class A Shares | | $ | 33,647,941 | | | $ | 19,326,279 | | | $ | 150,446,971 | | |
Class C Shares | | | 13,608,280 | | | | 14,955,568 | | | | 167,230,817 | | |
Class R Shares | | | — | | | | — | | | | 572,139 | | |
Class Y Shares | | | 20,977,930 | | | | 11,059,510 | | | | 280,040,059 | | |
Total | | $ | 68,234,151 | | | $ | 45,341,357 | | | $ | 598,289,986 | | |
Shares (unlimited number of shares authorized
with a par value of $0.001 per share): | |
Class A Shares | | | 3,424,131 | | | | 1,800,957 | | | | 16,017,099 | | |
Class C Shares | | | 1,385,335 | | | | 1,393,522 | | | | 17,790,524 | | |
Class R Shares | | | — | | | | — | | | | 60,921 | | |
Class Y Shares | | | 2,135,812 | | | | 1,030,433 | | | | 29,795,646 | | |
Total | | | 6,945,278 | | | | 4,224,912 | | | | 63,664,190 | | |
Net asset value, offering (except Class A Shares)
and redemption price per share: | |
Class A Shares | | $ | 9.83 | | | $ | 10.73 | | | $ | 9.39 | | |
Class C Shares (a) | | | 9.82 | | | | 10.73 | | | | 9.40 | | |
Class R Shares | | | — | | | | — | | | | 9.39 | | |
Class Y Shares | | | 9.82 | | | | 10.73 | | | | 9.40 | | |
Maximum Sales Charge — Class A Shares | | | 2.00 | % | | | 2.00 | % | | | 2.00 | % | |
Maximum offering price
(100%/(100%-maximum sales charge) of
net asset value adjusted to the nearest cent)
per share — Class A Shares | | $ | 10.03 | | | $ | 10.95 | | | $ | 9.58 | | |
(a) Redemption price per share varies by the length of time shares are held.
See notes to financial statements.
43
Victory Portfolios | | Statement of Assets and Liabilities
June 30, 2019 | |
(Unaudited)
| | | Victory
Strategic
Income Fund | |
ASSETS: | |
Investments, at value (Cost $51,154,711) | | $ | 53,050,347 | (a) | |
Cash and cash equivalents | | | 296,443 | | |
Deposits with brokers for futures contracts | | | 139,960 | | |
Interest and dividends receivable | | | 390,643 | | |
Receivable for capital shares issued | | | 3,091 | | |
Receivable from Adviser | | | 24,136 | | |
Prepaid expenses | | | 22,006 | | |
Total Assets | | | 53,926,626 | | |
LIABILITIES: | |
Payables: | |
Collateral received on loaned securities | | | 2,565,152 | | |
Distributions | | | 103,896 | | |
Capital shares redeemed | | | 27,874 | | |
Variation margin payable on open futures contracts | | | 6,626 | | |
Accrued expenses and other payables: | |
Investment advisory fees | | | 25,009 | | |
Administration fees | | | 2,552 | | |
Custodian fees | | | 2,260 | | |
Transfer agent fees | | | 2,176 | | |
Chief Compliance Officer fees | | | 31 | | |
| 12b-1 fees | | | 7,960 | | |
Other accrued expenses | | | 9,604 | | |
Total Liabilities | | | 2,753,140 | | |
NET ASSETS: | |
Capital | | | 51,013,625 | | |
Total distributable earnings/(loss) | | | 159,861 | | |
Net Assets | | $ | 51,173,486 | | |
Net Assets | |
Class A Shares | | $ | 33,887,682 | | |
Class C Shares | | | 9,564,532 | | |
Class R Shares | | | 2,835,393 | | |
Class Y Shares | | | 4,885,879 | | |
Total | | $ | 51,173,486 | | |
Shares (unlimited number of shares authorized with a par value of $0.001 per share): | |
Class A Shares | | | 3,302,004 | | |
Class C Shares | | | 927,885 | | |
Class R Shares | | | 274,853 | | |
Class Y Shares | | | 478,780 | | |
Total | | | 4,983,522 | | |
Net asset value, offering (except Class A Shares) and redemption price per share: | |
Class A Shares | | $ | 10.26 | | |
Class C Shares (b) | | | 10.31 | | |
Class R Shares | | | 10.32 | | |
Class Y Shares | | | 10.20 | | |
Maximum Sales Charge — Class A Shares | | | 2.00 | % | |
Maximum offering price
(100%/(100%-maximum sales charge) of net asset value adjusted to the nearest
cent) per share — Class A Shares | | $ | 10.47 | | |
(a) Includes $2,496,876 of securities on loan.
(b) Redemption price per share varies by the length of time shares are held.
See notes to financial statements.
44
Victory Portfolios | | Statements of Operations
For the Six Months Ended June 30, 2019 | |
(Unaudited)
| | | Victory INCORE
Investment Quality
Bond Fund | | Victory
INCORE
Low Duration
Bond Fund | | Victory
High
Yield Fund | |
Investment Income: | |
Dividends | | $ | — | | | $ | — | | | $ | 18,420 | | |
Interest | | | 526,956 | | | | 4,344,671 | | | | 3,860,174 | | |
Securities lending (net of fees) | | | 156 | | | | 992 | | | | 42,890 | | |
Total Income | | | 527,112 | | | | 4,345,663 | | | | 3,921,484 | | |
Expenses: | |
Investment advisory fees | | | 82,723 | | | | 686,492 | | | | 345,855 | | |
Administration fees | | | 10,455 | | | | 96,442 | | | | 36,385 | | |
12b-1 fees — Class A Shares | | | 29,219 | | | | 104,046 | | | | 33,245 | | |
12b-1 fees — Class C Shares | | | 16,934 | | | | 278,687 | | | | 100,420 | | |
12b-1 fees — Class R Shares | | | 7,951 | | | | 3,598 | | | | 45,655 | | |
Custodian fees | | | 4,125 | | | | 10,309 | | | | 11,038 | | |
Transfer agent fees | | | 2,217 | | | | 23,592 | | | | 2,503 | | |
Transfer agent fees — Class A Shares | | | 19,889 | | | | 46,330 | | | | 9,284 | | |
Transfer agent fees — Class C Shares | | | 2,148 | | | | 29,681 | | | | 2,939 | | |
Transfer agent fees — Class R Shares | | | 3,337 | | | | 1,208 | | | | 2,516 | | |
Transfer agent fees — Class Y Shares | | | 1,896 | | | | 97,458 | | | | 16,889 | | |
Trustees' fees | | | 1,527 | | | | 13,933 | | | | 4,418 | | |
Chief Compliance Officer fees | | | 136 | | | | 1,287 | | | | 426 | | |
Legal and audit fees | | | 6,674 | | | | 17,967 | | | | 9,878 | | |
State registration and filing fees | | | 27,828 | | | | 32,071 | | | | 29,684 | | |
Interfund lending fees | | | — | | | | 24 | | | | — | | |
Other expenses | | | 8,611 | | | | 27,243 | | | | 10,734 | | |
Total Expenses | | | 225,670 | | | | 1,470,368 | | | | 661,869 | | |
Expenses waived/reimbursed by Adviser | | | (59,486 | ) | | | (147,124 | ) | | | (43,683 | ) | |
Net Expenses | | | 166,184 | | | | 1,323,244 | | | | 618,186 | | |
Net Investment Income (Loss) | | | 360,928 | | | | 3,022,419 | | | | 3,303,298 | | |
Realized/Unrealized Gains (Losses) from
Investments: | |
Net realized gains (losses) from investment securities | | | 400,740 | | | | 306,621 | | | | 181,242 | | |
Net realized gains (losses) from futures contracts | | | (100,609 | ) | | | 462,695 | | | | — | | |
Net realized gains (losses) from swap agreements | | | (331,102 | ) | | | (3,124,490 | ) | | | — | | |
Net change in unrealized appreciation/depreciation
on investment securities | | | 943,133 | | | | 4,485,212 | | | | 5,808,829 | | |
Net change in unrealized appreciation/depreciation
on futures contracts | | | 73,723 | | | | (271,198 | ) | | | — | | |
Net change in unrealized appreciation/depreciation
on swap agreements | | | 211,527 | | | | 2,168,929 | | | | — | | |
Net realized/unrealized gains (losses) on investments | | | 1,197,412 | | | | 4,027,769 | | | | 5,990,071 | | |
Change in net assets resulting from operations | | $ | 1,558,340 | | | $ | 7,050,188 | | | $ | 9,293,369 | | |
See notes to financial statements.
45
Victory Portfolios | | Statements of Operations
For the Six Months Ended June 30, 2019 | |
(Unaudited)
| | | Victory
Tax-Exempt
Fund | | Victory
High Income
Municipal Bond
Fund | | Victory
Floating
Rate Fund | |
Investment Income: | |
Interest | | $ | 1,247,457 | | | $ | 946,360 | | | $ | 21,311,770 | | |
Total Income | | | 1,247,457 | | | | 946,360 | | | | 21,311,770 | | |
Expenses: | |
Investment advisory fees | | | 170,035 | | | | 114,181 | | | | 1,989,760 | | |
Administration fees | | | 21,488 | | | | 14,432 | | | | 193,453 | | |
12b-1 fees — Class A Shares | | | 38,368 | | | | 20,756 | | | | 155,876 | | |
12b-1 fees — Class C Shares | | | 83,706 | | | | 88,384 | | | | 1,014,929 | | |
12b-1 fees — Class R Shares | | | — | | | | — | | | | 1,573 | | |
Custodian fees | | | 1,917 | | | | 1,782 | | | | 110,377 | | |
Transfer agent fees | | | 5,235 | | | | 4,252 | | | | 31,907 | | |
Transfer agent fees — Class A Shares | | | 10,758 | | | | 5,828 | | | | 53,741 | | |
Transfer agent fees — Class C Shares | | | 7,182 | | | | 5,993 | | | | 99,301 | | |
Transfer agent fees — Class R Shares | | | — | | | | — | | | | 475 | | |
Transfer agent fees — Class Y Shares | | | 11,057 | | | | 3,728 | | | | 128,620 | | |
Trustees' fees | | | 3,042 | | | | 2,115 | | | | 27,147 | | |
Chief Compliance Officer fees | | | 278 | | | | 190 | | | | 2,511 | | |
Legal and audit fees | | | 7,195 | | | | 6,392 | | | | 48,109 | | |
State registration and filing fees | | | 21,915 | | | | 20,865 | | | | 36,492 | | |
Line of credit fees | | | 32 | | | | — | | | | — | | |
Interfund lending fees | | | 78 | | | | 11 | | | | 283 | | |
Other expenses | | | 7,543 | | | | 6,624 | | | | 86,430 | | |
Total Expenses | | | 389,829 | | | | 295,533 | | | | 3,980,984 | | |
Expenses waived/reimbursed by Adviser | | | (62,117 | ) | | | (58,004 | ) | | | (419,504 | ) | |
Net Expenses | | | 327,712 | | | | 237,529 | | | | 3,561,480 | | |
Net Investment Income (Loss) | | | 919,745 | | | | 708,831 | | | | 17,750,290 | | |
Realized/Unrealized Gains (Losses) from
Investments: | |
Net realized gains (losses) from investment securities | | | 653,410 | | | | 363,212 | | | | (1,417,712 | ) | |
Net change in unrealized appreciation/depreciation
on investment securities | | | 2,128,245 | | | | 1,231,837 | | | | 19,114,488 | | |
Net realized/unrealized gains (losses) on investments | | | 2,781,655 | | | | 1,595,049 | | | | 17,696,776 | | |
Change in net assets resulting from operations | | $ | 3,701,400 | | | $ | 2,303,880 | | | $ | 35,447,066 | | |
See notes to financial statements.
46
Victory Portfolios | | Statement of Operations
For the Six Months Ended June 30, 2019 | |
(Unaudited)
| | | Victory
Strategic
Income Fund | |
Investment Income: | |
Dividends | | $ | 36,994 | | |
Interest | | | 933,031 | | |
Securities lending (net of fees) | | | 2,590 | | |
Total Income | | | 972,615 | | |
Expenses: | |
Investment advisory fees | | | 149,118 | | |
Administration fees | | | 15,704 | | |
12b-1 fees — Class A Shares | | | 40,540 | | |
12b-1 fees — Class C Shares | | | 49,064 | | |
12b-1 fees — Class R Shares | | | 6,854 | | |
Custodian fees | | | 6,852 | | |
Transfer agent fees | | | 2,167 | | |
Transfer agent fees — Class A Shares | | | 4,372 | | |
Transfer agent fees — Class C Shares | | | 3,467 | | |
Transfer agent fees — Class R Shares | | | 304 | | |
Transfer agent fees — Class Y Shares | | | 1,285 | | |
Trustees' fees | | | 2,211 | | |
Chief Compliance Officer fees | | | 201 | | |
Legal and audit fees | | | 7,814 | | |
State registration and filing fees | | | 26,842 | | |
Other expenses | | | 7,431 | | |
Total Expenses | | | 324,226 | | |
Expenses waived/reimbursed by Adviser | | | (48,950 | ) | |
Net Expenses | | | 275,276 | | |
Net Investment Income (Loss) | | | 697,339 | | |
Realized/Unrealized Gains (Losses) from Investments: | |
Net realized gains (losses) from investment securities | | | 305,834 | | |
Net realized gains (losses) from futures contracts | | | 152,815 | | |
Net change in unrealized appreciation/depreciation on investment securities | | | 2,445,730 | | |
Net change in unrealized appreciation/depreciation on futures contracts | | | (251,525 | ) | |
Net realized/unrealized gains (losses) on investments | | | 2,652,854 | | |
Change in net assets resulting from operations | | $ | 3,350,193 | | |
See notes to financial statements.
47
Victory Portfolios | | Statements of Changes in Net Assets | |
| | | Victory
INCORE Investment
Quality Bond Fund | | Victory
INCORE Low Duration
Bond Fund | | Victory
High Yield Fund | |
| | | Six
Months
Ended
June 30,
2019 | | Year
Ended
December 31,
2018 | | Six
Months
Ended
June 30,
2019 | | Year
Ended
December 31,
2018 | | Six
Months
Ended
June 30,
2019 | | Year
Ended
December 31,
2018 | |
| | | (Unaudited) | | | | (Unaudited) | | | | (Unaudited) | | | |
From Investment Activities: | |
Operations: | |
Net investment
income (loss) | | $ | 360,928 | | | $ | 845,565 | | | $ | 3,022,419 | | | $ | 6,485,110 | | | $ | 3,303,298 | | | $ | 4,157,311 | | |
Net realized gains
(losses) from
investments | | | (30,971 | ) | | | (885,327 | ) | | | (2,355,174 | ) | | | (851,374 | ) | | | 181,242 | | | | 762,754 | | |
Net change in
unrealized
appreciation/
depreciation on
investments | | | 1,228,383 | | | | (528,601 | ) | | | 6,382,943 | | | | (2,879,432 | ) | | | 5,808,829 | | | | (5,292,005 | ) | |
Change in net assets resulting
from operations | | | 1,558,340 | | | | (568,363 | ) | | | 7,050,188 | | | | 2,754,304 | | | | 9,293,369 | | | | (371,940 | ) | |
Distributions to Shareholders: | |
Class A Shares | | | (284,906 | ) | | | (736,699 | ) | | | (888,946 | ) | | | (2,446,294 | ) | | | (772,294 | ) | | | (1,373,046 | ) | |
Class C Shares | | | (26,134 | ) | | | (80,797 | ) | | | (380,485 | ) | | | (961,618 | ) | | | (510,460 | ) | | | (1,141,547 | ) | |
Class R Shares | | | (32,123 | ) | | | (85,278 | ) | | | (12,393 | ) | | | (29,001 | ) | | | (497,664 | ) | | | (1,084,151 | ) | |
Class Y Shares | | | (42,278 | ) | | | (107,033 | ) | | | (1,953,350 | ) | | | (4,911,061 | ) | | | (1,534,016 | ) | | | (613,768 | ) | |
Change in net assets resulting
from distributions to
shareholders | | | (385,441 | ) | | | (1,009,807 | ) | | | (3,235,174 | ) | | | (8,347,974 | ) | | | (3,314,434 | ) | | | (4,212,512 | ) | |
Change in net assets resulting
from capital transactions | | | (2,053,890 | ) | | | (10,074,855 | ) | | | (56,547,082 | ) | | | (160,010,798 | ) | | | 66,949,547 | | | | 17,874,778 | | |
Change in net assets | | | (880,991 | ) | | | (11,653,025 | ) | | | (52,732,068 | ) | | | (165,604,468 | ) | | | 72,928,482 | | | | 13,290,326 | | |
Net Assets: | |
Beginning of period | | | 34,140,180 | | | | 45,793,205 | | | | 339,901,017 | | | | 505,505,485 | | | | 81,884,456 | | | | 68,594,130 | | |
End of period | | $ | 33,259,189 | | | $ | 34,140,180 | | | $ | 287,168,949 | | | $ | 339,901,017 | | | $ | 154,812,938 | | | $ | 81,884,456 | | |
(continues on next page)
See notes to financial statements.
48
Victory Portfolios | | Statements of Changes in Net Assets | |
(continued)
| | | Victory
INCORE Investment
Quality Bond Fund | | Victory
INCORE Low Duration
Bond Fund | | Victory
High Yield Fund | |
| | | Six
Months
Ended
June 30,
2019 | | Year
Ended
December 31,
2018 | | Six
Months
Ended
June 30,
2019 | | Year
Ended
December 31,
2018 | | Six
Months
Ended
June 30,
2019 | | Year
Ended
December 31,
2018 | |
| | | (Unaudited) | | | | (Unaudited) | | | | (Unaudited) | | | |
Capital Transactions: | |
Class A Shares | |
Proceeds from shares
issued | | $ | 1,042,601 | | | $ | 2,431,100 | | | $ | 20,964,548 | | | $ | 30,744,375 | | | $ | 7,192,454 | | | $ | 8,578,195 | | |
Distributions reinvested | | | 279,122 | | | | 708,767 | | | | 821,759 | | | | 2,128,032 | | | | 498,385 | | | | 837,993 | | |
Cost of shares redeemed | | | (2,712,826 | ) | | | (9,305,764 | ) | | | (49,436,102 | ) | | | (84,318,228 | ) | | | (2,125,414 | ) | | | (6,155,194 | ) | |
Total Class A Shares | | $ | (1,391,103 | ) | | $ | (6,165,897 | ) | | $ | (27,649,795 | ) | | $ | (51,445,821 | ) | | $ | 5,565,425 | | | $ | 3,260,994 | | |
Class C Shares | |
Proceeds from shares
issued | | $ | 63,335 | | | $ | 115,170 | | | $ | 497,765 | | | $ | 5,049,809 | | | $ | 878,092 | | | $ | 467,260 | | |
Distributions reinvested | | | 21,996 | | | | 70,118 | | | | 320,247 | | | | 815,577 | | | | 123,911 | | | | 318,084 | | |
Cost of shares redeemed | | | (617,732 | ) | | | (2,479,459 | ) | | | (18,023,207 | ) | | | (25,622,129 | ) | | | (1,471,824 | ) | | | (2,448,114 | ) | |
Total Class C Shares | | $ | (532,401 | ) | | $ | (2,294,171 | ) | | $ | (17,205,195 | ) | | $ | (19,756,743 | ) | | $ | (469,821 | ) | | $ | (1,662,770 | ) | |
Class R Shares | |
Proceeds from shares
issued | | $ | 116,143 | | | $ | 381,014 | | | $ | 74,995 | | | $ | 720,436 | | | $ | 135,813 | | | $ | 493,060 | | |
Distributions reinvested | | | 32,079 | | | | 84,899 | | | | 11,665 | | | | 27,842 | | | | 55,197 | | | | 147,473 | | |
Cost of shares redeemed | | | (133,862 | ) | | | (1,072,079 | ) | | | (277,163 | ) | | | (1,248,707 | ) | | | (470,092 | ) | | | (1,182,114 | ) | |
Total Class R Shares | | $ | 14,360 | | | $ | (606,166 | ) | | $ | (190,503 | ) | | $ | (500,429 | ) | | $ | (279,082 | ) | | $ | (541,581 | ) | |
Class Y Shares | |
Proceeds from shares
issued | | $ | 223,638 | | | $ | 669,922 | | | $ | 47,762,599 | | | $ | 89,186,215 | | | $ | 72,685,536 | | | $ | 21,430,313 | | |
Distributions reinvested | | | 41,151 | | | | 102,539 | | | | 1,604,136 | | | | 4,002,004 | | | | 1,366,384 | | | | 485,679 | | |
Cost of shares redeemed | | | (409,535 | ) | | | (1,781,082 | ) | | | (60,868,324 | ) | | | (181,496,024 | ) | | | (11,918,895 | ) | | | (5,097,857 | ) | |
Total Class Y Shares | | $ | (144,746 | ) | | $ | (1,008,621 | ) | | $ | (11,501,589 | ) | | $ | (88,307,805 | ) | | $ | 62,133,025 | | | $ | 16,818,135 | | |
Change in net assets resulting
from capital transactions | | $ | (2,053,890 | ) | | $ | (10,074,855 | ) | | $ | (56,547,082 | ) | | $ | (160,010,798 | ) | | $ | 66,949,547 | | | $ | 17,874,778 | | |
(continues on next page)
See notes to financial statements.
49
Victory Portfolios | | Statements of Changes in Net Assets | |
(continued)
| | | Victory
INCORE Investment
Quality Bond Fund | | Victory
INCORE Low Duration
Bond Fund | | Victory
High Yield Fund | |
| | | Six
Months
Ended
June 30,
2019 | | Year
Ended
December 31,
2018 | | Six
Months
Ended
June 30,
2019 | | Year
Ended
December 31,
2018 | | Six
Months
Ended
June 30,
2019 | | Year
Ended
December 31,
2018 | |
| | | (Unaudited) | | | | (Unaudited) | | | | (Unaudited) | | | |
Share Transactions: | |
Class A Shares | |
Issued | | | 111,656 | | | | 259,560 | | | | 2,116,285 | | | | 3,106,607 | | | | 1,102,537 | | | | 1,324,722 | | |
Reinvested | | | 29,721 | | | | 76,253 | | | | 82,913 | | | | 214,752 | | | | 76,439 | | | | 129,433 | | |
Redeemed | | | (290,627 | ) | | | (1,001,548 | ) | | | (4,995,022 | ) | | | (8,500,863 | ) | | | (328,090 | ) | | | (946,378 | ) | |
Total Class A Shares | | | (149,250 | ) | | | (665,735 | ) | | | (2,795,824 | ) | | | (5,179,504 | ) | | | 850,886 | | | | 507,777 | | |
Class C Shares | |
Issued | | | 6,670 | | | | 12,218 | | | | 50,363 | | | | 511,435 | | | | 134,708 | | | | 71,687 | | |
Reinvested | | | 2,345 | | | | 7,545 | | | | 32,325 | | | | 82,367 | | | | 18,972 | | | | 48,947 | | |
Redeemed | | | (66,217 | ) | | | (266,190 | ) | | | (1,817,852 | ) | | | (2,586,154 | ) | | | (225,743 | ) | | | (377,563 | ) | |
Total Class C Shares | | | (57,202 | ) | | | (246,427 | ) | | | (1,735,164 | ) | | | (1,992,352 | ) | | | (72,063 | ) | | | (256,929 | ) | |
Class R Shares | |
Issued | | | 12,413 | | | | 40,562 | | | | 7,573 | | | | 72,503 | | | | 20,917 | | | | 75,414 | | |
Reinvested | | | 3,406 | | | | 9,118 | | | | 1,177 | | | | 2,811 | | | | 8,449 | | | | 22,696 | | |
Redeemed | | | (14,389 | ) | | | (115,435 | ) | | | (28,011 | ) | | | (125,706 | ) | | | (72,126 | ) | | | (184,892 | ) | |
Total Class R Shares | | | 1,430 | | | | (65,755 | ) | | | (19,261 | ) | | | (50,392 | ) | | | (42,760 | ) | | | (86,782 | ) | |
Class Y Shares | |
Issued | | | 23,976 | | | | 71,550 | | | | 4,816,234 | | | | 9,003,632 | | | | 11,232,462 | | | | 3,334,887 | | |
Reinvested | | | 4,386 | | | | 11,041 | | | | 161,759 | | | | 403,649 | | | | 210,290 | | | | 75,911 | | |
Redeemed | | | (44,065 | ) | | | (190,915 | ) | | | (6,151,712 | ) | | | (18,291,525 | ) | | | (1,829,025 | ) | | | (795,040 | ) | |
Total Class Y Shares | | | (15,703 | ) | | | (108,324 | ) | | | (1,173,719 | ) | | | (8,884,244 | ) | | | 9,613,727 | | | | 2,615,758 | | |
Change in Shares | | | (220,725 | ) | | | (1,086,241 | ) | | | (5,723,968 | ) | | | (16,106,492 | ) | | | 10,349,790 | | | | 2,779,824 | | |
See notes to financial statements.
50
Victory Portfolios | | Statements of Changes in Net Assets | |
| | | Victory
Tax-Exempt Fund | | Victory
High Income
Municipal Bond Fund | | Victory
Floating Rate Fund | |
| | | Six
Months
Ended
June 30,
2019 | | Year
Ended
December 31,
2018 | | Six
Months
Ended
June 30,
2019 | | Year
Ended
December 31,
2018 | | Six
Months
Ended
June 30,
2019 | | Year
Ended
December 31,
2018 | |
| | | (Unaudited) | | | | (Unaudited) | | | | (Unaudited) | | | |
From Investment Activities: | |
Operations: | |
Net investment
income (loss) | | $ | 919,745 | | | $ | 2,744,685 | | | $ | 708,831 | | | $ | 2,264,029 | | | $ | 17,750,290 | | | $ | 34,678,316 | | |
Net realized gains
(losses) from
investments | | | 653,410 | | | | 441,470 | | | | 363,212 | | | | 825,294 | | | | (1,417,712 | ) | | | (2,188,784 | ) | |
Net change in
unrealized
appreciation/
depreciation on
investments | | | 2,128,245 | | | | (2,948,214 | ) | | | 1,231,837 | | | | (3,343,476 | ) | | | 19,114,488 | | | | (29,992,718 | ) | |
Change in net assets resulting
from operations | | | 3,701,400 | | | | 237,941 | | | | 2,303,880 | | | | (254,153 | ) | | | 35,447,066 | | | | 2,496,814 | | |
Distributions to Shareholders: | |
Class A Shares | | | (544,707 | ) | | | (1,674,030 | ) | | | (320,665 | ) | | | (833,535 | ) | | | (3,729,307 | ) | | | (7,767,897 | ) | |
Class C Shares | | | (230,476 | ) | | | (927,398 | ) | | | (273,357 | ) | | | (737,053 | ) | | | (5,222,419 | ) | | | (11,211,612 | ) | |
Class R Shares | | | — | | | | — | | | | — | | | | — | | | | (16,989 | ) | | | (34,879 | ) | |
Class Y Shares | | | (376,660 | ) | | | (1,215,244 | ) | | | (233,071 | ) | | | (693,477 | ) | | | (8,783,837 | ) | | | (15,978,424 | ) | |
Change in net assets resulting
from distributions to
shareholders | | | (1,151,843 | ) | | | (3,816,672 | ) | | | (827,093 | ) | | | (2,264,065 | ) | | | (17,752,552 | ) | | | (34,992,812 | ) | |
Change in net assets resulting
from capital transactions | | | (2,554,390 | ) | | | (19,692,166 | ) | | | (3,583,016 | ) | | | (27,903,721 | ) | | | (31,799,746 | ) | | | (45,765,231 | ) | |
Change in net assets | | | (4,833 | ) | | | (23,270,897 | ) | | | (2,106,229 | ) | | | (30,421,939 | ) | | | (14,105,232 | ) | | | (78,261,229 | ) | |
Net Assets: | |
Beginning of period | | | 68,238,984 | | | | 91,509,881 | | | | 47,447,586 | | | | 77,869,525 | | | | 612,395,218 | | | | 690,656,447 | | |
End of period | | $ | 68,234,151 | | | $ | 68,238,984 | | | $ | 45,341,357 | | | $ | 47,447,586 | | | $ | 598,289,986 | | | $ | 612,395,218 | | |
(continues on next page)
See notes to financial statements.
51
Victory Portfolios | | Statements of Changes in Net Assets | |
(continued)
| | | Victory
Tax-Exempt Fund | | Victory
High Income
Municipal Bond Fund | | Victory
Floating Rate Fund | |
| | | Six
Months
Ended
June 30,
2019 | | Year
Ended
December 31,
2018 | | Six
Months
Ended
June 30,
2019 | | Year
Ended
December 31,
2018 | | Six
Months
Ended
June 30,
2019 | | Year
Ended
December 31,
2018 | |
| | | (Unaudited) | | | | (Unaudited) | | | | (Unaudited) | | | |
Capital Transactions: | |
Class A Shares | |
Proceeds from shares
issued | | $ | 3,438,912 | | | $ | 3,746,017 | | | $ | 3,666,499 | | | $ | 1,462,753 | | | $ | 42,764,582 | | | $ | 45,834,320 | | |
Distributions reinvested | | | 518,756 | | | | 1,587,635 | | | | 283,764 | | | | 744,985 | | | | 3,253,513 | | | | 6,719,663 | | |
Cost of shares redeemed | | | (1,441,034 | ) | | | (11,426,401 | ) | | | (1,632,605 | ) | | | (10,719,172 | ) | | | (17,587,193 | ) | | | (75,051,508 | ) | |
Total Class A Shares | | $ | 2,516,634 | | | $ | (6,092,749 | ) | | $ | 2,317,658 | | | $ | (8,511,434 | ) | | $ | 28,430,902 | | | $ | (22,497,525 | ) | |
Class C Shares | |
Proceeds from shares
issued | | $ | 139,058 | | | $ | 479,938 | | | $ | 207,886 | | | $ | 599,566 | | | $ | 3,929,961 | | | $ | 19,574,341 | | |
Distributions reinvested | | | 193,921 | | | | 767,834 | | | | 240,755 | | | | 647,618 | | | | 4,415,858 | | | | 9,501,754 | | |
Cost of shares redeemed | | | (5,348,333 | ) | | | (8,753,995 | ) | | | (5,356,640 | ) | | | (6,270,846 | ) | | | (58,780,230 | ) | | | (71,921,531 | ) | |
Total Class C Shares | | $ | (5,015,354 | ) | | $ | (7,506,223 | ) | | $ | (4,907,999 | ) | | $ | (5,023,662 | ) | | $ | (50,434,411 | ) | | $ | (42,845,436 | ) | |
Class R Shares | |
Proceeds from shares
issued | | $ | — | | | $ | — | | | $ | — | | | $ | — | | | $ | 94,689 | | | $ | 218,439 | | |
Distributions reinvested | | | — | | | | — | | | | — | | | | — | | | | 12,094 | | | | 25,934 | | |
Cost of shares redeemed | | | — | | | | — | | | | — | | | | — | | | | (269,901 | ) | | | (408,718 | ) | |
Total Class R Shares | | $ | — | | | $ | — | | | $ | — | | | $ | — | | | $ | (163,118 | ) | | $ | (164,345 | ) | |
Class Y Shares | |
Proceeds from shares
issued | | $ | 1,502,557 | | | $ | 4,360,518 | | | $ | 489,345 | | | $ | 1,879,873 | | | $ | 51,998,577 | | | $ | 133,354,896 | | |
Distributions reinvested | | | 365,914 | | | | 1,153,505 | | | | 225,391 | | | | 657,063 | | | | 7,477,200 | | | | 13,787,041 | | |
Cost of shares redeemed | | | (1,924,141 | ) | | | (11,607,217 | ) | | | (1,707,411 | ) | | | (16,905,561 | ) | | | (69,108,896 | ) | | | (127,399,862 | ) | |
Total Class Y Shares | | $ | (55,670 | ) | | $ | (6,093,194 | ) | | $ | (992,675 | ) | | $ | (14,368,625 | ) | | $ | (9,633,119 | ) | | $ | 19,742,075 | | |
Change in net assets resulting
from capital transactions | | $ | (2,554,390 | ) | | $ | (19,692,166 | ) | | $ | (3,583,016 | ) | | $ | (27,903,721 | ) | | $ | (31,799,746 | ) | | $ | (45,765,231 | ) | |
(continues on next page)
See notes to financial statements.
52
Victory Portfolios | | Statements of Changes in Net Assets | |
(continued)
| | | Victory
Tax-Exempt Fund | | Victory
High Income
Municipal Bond Fund | | Victory
Floating Rate Fund | |
| | | Six
Months
Ended
June 30,
2019 | | Year
Ended
December 31,
2018 | | Six
Months
Ended
June 30,
2019 | | Year
Ended
December 31,
2018 | | Six
Months
Ended
June 30,
2019 | | Year
Ended
December 31,
2018 | |
| | | (Unaudited) | | | | (Unaudited) | | | | (Unaudited) | | | |
Share Transactions: | |
Class A Shares | |
Issued | | | 352,109 | | | | 392,511 | | | | 343,584 | | | | 138,669 | | | | 4,541,791 | | | | 4,791,356 | | |
Reinvested | | | 53,628 | | | | 165,480 | | | | 26,803 | | | | 70,896 | | | | 346,197 | | | | 705,288 | | |
Redeemed | | | (149,143 | ) | | | (1,182,655 | ) | | | (155,683 | ) | | | (1,018,059 | ) | | | (1,869,473 | ) | | | (7,916,526 | ) | |
Total Class A Shares | | | 256,594 | | | | (624,664 | ) | | | 214,704 | | | | (808,494 | ) | | | 3,018,515 | | | | (2,419,882 | ) | |
Class C Shares | |
Issued | | | 14,261 | | | | 49,729 | | | | 19,580 | | | | 57,162 | | | | 418,291 | | | | 2,060,999 | | |
Reinvested | | | 20,074 | | | | 80,097 | | | | 22,776 | | | | 61,664 | | | | 469,610 | | | | 996,600 | | |
Redeemed | | | (549,112 | ) | | | (907,537 | ) | | | (504,441 | ) | | | (597,211 | ) | | | (6,244,448 | ) | | | (7,539,753 | ) | |
Total Class C Shares | | | (514,777 | ) | | | (777,711 | ) | | | (462,085 | ) | | | (478,385 | ) | | | (5,356,547 | ) | | | (4,482,154 | ) | |
Class R Shares | |
Issued | | | — | | | | — | | | | — | | | | — | | | | 10,108 | | | | 22,917 | | |
Reinvested | | | — | | | | — | | | | — | | | | — | | | | 1,288 | | | | 2,724 | | |
Redeemed | | | — | | | | — | | | | — | | | | — | | | | (28,854 | ) | | | (42,619 | ) | |
Total Class R Shares | | | — | | | | — | | | | — | | | | — | | | | (17,458 | ) | | | (16,978 | ) | |
Class Y Shares | |
Issued | | | 156,277 | | | | 453,041 | | | | 46,743 | | | | 178,749 | | | | 5,533,764 | | | | 14,061,221 | | |
Reinvested | | | 37,846 | | | | 120,245 | | | | 21,306 | | | | 62,531 | | | | 795,275 | | | | 1,447,068 | | |
Redeemed | | | (198,955 | ) | | | (1,201,743 | ) | | | (161,788 | ) | | | (1,607,188 | ) | | | (7,351,473 | ) | | | (13,431,987 | ) | |
Total Class Y Shares | | | (4,832 | ) | | | (628,457 | ) | | | (93,739 | ) | | | (1,365,908 | ) | | | (1,022,434 | ) | | | 2,076,302 | | |
Change in Shares | | | (263,015 | ) | | | (2,030,832 | ) | | | (341,120 | ) | | | (2,652,787 | ) | | | (3,377,924 | ) | | | (4,842,712 | ) | |
See notes to financial statements.
53
Victory Portfolios | | Statements of Changes in Net Assets | |
| | | Victory
Strategic Income Fund | |
| | | Six
Months
Ended
June 30,
2019 | | Year
Ended
December 31,
2018 | |
| | | (Unaudited) | | | |
From Investment Activities: | |
Operations: | |
Net investment income (loss) | | $ | 697,339 | | | $ | 1,727,890 | | |
Net realized gains (losses) from investments | | | 458,649 | | | | (1,587,023 | ) | |
Net change in unrealized appreciation/depreciation on investments | | | 2,194,205 | | | | (630,096 | ) | |
Change in net assets resulting from operations | | | 3,350,193 | | | | (489,229 | ) | |
Distributions to Shareholders: | |
Class A Shares | | | (508,118 | ) | | | (1,129,828 | ) | |
Class C Shares | | | (115,701 | ) | | | (288,258 | ) | |
Class R Shares | | | (37,565 | ) | | | (83,778 | ) | |
Class Y Shares | | | (79,202 | ) | | | (191,276 | ) | |
Change in net assets resulting from distributions to shareholders | | | (740,586 | ) | | | (1,693,140 | ) | |
Change in net assets resulting from capital transactions | | | (1,269,431 | ) | | | (7,720,233 | ) | |
Change in net assets | | | 1,340,176 | | | | (9,902,602 | ) | |
Net Assets: | |
Beginning of period | | | 49,833,310 | | | | 59,735,912 | | |
End of period | | $ | 51,173,486 | | | $ | 49,833,310 | | |
(continues on next page)
See notes to financial statements.
54
Victory Portfolios | | Statements of Changes in Net Assets | |
(continued)
| | | Victory
Strategic Income Fund | |
| | | Six
Months
Ended
June 30,
2019 | | Year
Ended
December 31,
2018 | |
| | | (Unaudited) | | | |
Capital Transactions: | |
Class A Shares | |
Proceeds from shares issued | | $ | 658,354 | | | $ | 675,278 | | |
Distributions reinvested | | | 78,140 | | | | 198,500 | | |
Cost of shares redeemed | | | (610,080 | ) | | | (2,400,693 | ) | |
Total Class A Shares | | $ | 126,414 | | | $ | (1,526,915 | ) | |
Class C Shares | |
Proceeds from shares issued | | $ | 189,496 | | | $ | 1,070,368 | | |
Distributions reinvested | | | 87,229 | | | | 226,185 | | |
Cost of shares redeemed | | | (1,442,069 | ) | | | (2,276,130 | ) | |
Total Class C Shares | | $ | (1,165,344 | ) | | $ | (979,577 | ) | |
Class R Shares | |
Proceeds from shares issued | | $ | 5,419 | | | $ | 9,743 | | |
Distributions reinvested | | | 4,941 | | | | 13,196 | | |
Cost of shares redeemed | | | (80,368 | ) | | | (73,239 | ) | |
Total Class R Shares | | $ | (70,008 | ) | | $ | (50,300 | ) | |
Class Y Shares | |
Proceeds from shares issued | | $ | 158,184 | | | $ | 412,952 | | |
Distributions reinvested | | | 38,514 | | | | 103,535 | | |
Cost of shares redeemed | | | (357,191 | ) | | | (5,679,928 | ) | |
Total Class Y Shares | | $ | (160,493 | ) | | $ | (5,163,441 | ) | |
Change in net assets resulting from capital transactions | | $ | (1,269,431 | ) | | $ | (7,720,233 | ) | |
Share Transactions: | |
Class A Shares | |
Issued | | | 65,318 | | | | 67,828 | | |
Reinvested | | | 7,803 | | | | 20,169 | | |
Redeemed | | | (61,117 | ) | | | (244,021 | ) | |
Total Class A Shares | | | 12,004 | | | | (156,024 | ) | |
Class C Shares | |
Issued | | | 19,089 | | | | 106,921 | | |
Reinvested | | | 8,670 | | | | 22,876 | | |
Redeemed | | | (144,119 | ) | | | (230,950 | ) | |
Total Class C Shares | | | (116,360 | ) | | | (101,153 | ) | |
Class R Shares | |
Issued | | | 542 | | | | 982 | | |
Reinvested | | | 491 | | | | 1,334 | | |
Redeemed | | | (8,111 | ) | | | (7,448 | ) | |
Total Class R Shares | | | (7,078 | ) | | | (5,132 | ) | |
Class Y Shares | |
Issued | | | 15,846 | | | | 42,123 | | |
Reinvested | | | 3,869 | | | | 10,562 | | |
Redeemed | | | (36,174 | ) | | | (566,546 | ) | |
Total Class Y Shares | | | (16,459 | ) | | | (513,861 | ) | |
Change in Shares | | | (127,893 | ) | | | (776,170 | ) | |
See notes to financial statements.
55
Victory Portfolios | | Financial Highlights | |
For a Share Outstanding Throughout Each Period
| | | | Investment Activities | | Distributions to
Shareholders From | |
| | | Net Asset
Value,
Beginning of
Period | | Net
Investment
Income
(Loss)(a) | | Net Realized
and Unrealized
Gains (Losses)
on Investments | | Total from
Investment
Activities | | Net
Investment
Income | | Net Realized
Gains from
Investments | |
Victory INCORE Investment Quality Bond Fund | |
Class A | |
Six Months Ended
6/30/19 (unaudited) | | $ | 9.26 | | | | 0.11 | | | | 0.33 | | | | 0.44 | | | | (0.11 | ) | | | — | | |
Year Ended 12/31/18 | | $ | 9.59 | | | | 0.21 | | | | (0.29 | ) | | | (0.08 | ) | | | (0.25 | ) | | | — | | |
Year Ended 12/31/17 | | $ | 9.48 | | | | 0.18 | | | | 0.16 | | | | 0.34 | | | | (0.23 | ) | | | — | | |
Year Ended 12/31/16 | | $ | 9.57 | | | | 0.22 | | | | 0.16 | | | | 0.38 | | | | (0.23 | ) | | | (0.24 | ) | |
Year Ended 12/31/15 | | $ | 10.16 | | | | 0.31 | | | | (0.38 | ) | | | (0.07 | ) | | | (0.30 | ) | | | (0.22 | ) | |
Year Ended 12/31/14 | | $ | 10.01 | | | | 0.30 | | | | 0.26 | | | | 0.56 | | | | (0.30 | ) | | | (0.11 | ) | |
Class C | |
Six Months Ended
6/30/19 (unaudited) | | $ | 9.25 | | | | 0.07 | | | | 0.33 | | | | 0.40 | | | | (0.07 | ) | | | — | | |
Year Ended 12/31/18 | | $ | 9.58 | | | | 0.13 | | | | (0.29 | ) | | | (0.16 | ) | | | (0.17 | ) | | | — | | |
Year Ended 12/31/17 | | $ | 9.47 | | | | 0.10 | | | | 0.16 | | | | 0.26 | | | | (0.15 | ) | | | — | | |
Year Ended 12/31/16 | | $ | 9.56 | | | | 0.14 | | | | 0.16 | | | | 0.30 | | | | (0.15 | ) | | | (0.24 | ) | |
Year Ended 12/31/15 | | $ | 10.16 | | | | 0.22 | | | | (0.38 | ) | | | (0.16 | ) | | | (0.22 | ) | | | (0.22 | ) | |
Year Ended 12/31/14 | | $ | 10.01 | | | | 0.22 | | | | 0.26 | | | | 0.48 | | | | (0.22 | ) | | | (0.11 | ) | |
Class R | |
Six Months Ended
6/30/19 (unaudited) | | $ | 9.28 | | | | 0.09 | | | | 0.33 | | | | 0.42 | | | | (0.09 | ) | | | — | | |
Year Ended 12/31/18 | | $ | 9.61 | | | | 0.18 | | | | (0.30 | ) | | | (0.12 | ) | | | (0.21 | ) | | | — | | |
Year Ended 12/31/17 | | $ | 9.50 | | | | 0.14 | | | | 0.16 | | | | 0.30 | | | | (0.19 | ) | | | — | | |
Year Ended 12/31/16 | | $ | 9.58 | | | | 0.19 | | | | 0.17 | | | | 0.36 | | | | (0.20 | ) | | | (0.24 | ) | |
Year Ended 12/31/15 | | $ | 10.18 | | | | 0.27 | | | | (0.39 | ) | | | (0.12 | ) | | | (0.26 | ) | | | (0.22 | ) | |
Year Ended 12/31/14 | | $ | 10.02 | | | | 0.26 | | | | 0.27 | | | | 0.53 | | | | (0.26 | ) | | | (0.11 | ) | |
Class Y | |
Six Months Ended
6/30/19 (unaudited) | | $ | 9.25 | | | | 0.12 | | | | 0.33 | | | | 0.45 | | | | (0.12 | ) | | | — | | |
Year Ended 12/31/18 | | $ | 9.58 | | | | 0.23 | | | | (0.29 | ) | | | (0.06 | ) | | | (0.27 | ) | | | — | | |
Year Ended 12/31/17 | | $ | 9.47 | | | | 0.20 | | | | 0.16 | | | | 0.36 | | | | (0.25 | ) | | | — | | |
Year Ended 12/31/16 | | $ | 9.56 | | | | 0.25 | | | | 0.16 | | | | 0.41 | | | | (0.26 | ) | | | (0.24 | ) | |
Year Ended 12/31/15 | | $ | 10.17 | | | | 0.32 | | | | (0.39 | ) | | | (0.07 | ) | | | (0.32 | ) | | | (0.22 | ) | |
Year Ended 12/31/14 | | $ | 10.02 | | | | 0.33 | | | | 0.26 | | | | 0.59 | | | | (0.33 | ) | | | (0.11 | ) | |
(a) Per share net investment income (loss) has been calculated using the average daily shares method.
(b) Not annualized for periods less than one year.
(c) Annualized for periods less than one year.
(d) During the period, certain fees were reduced and/or reimbursed. If such fee reductions and/or reimbursements had not occurred, the ratios would have been as indicated.
(e) Portfolio turnover is calculated on the basis of the Fund as a whole without distinguishing between the classes of shares issued.
See notes to financial statements.
56
Victory Portfolios | | Financial Highlights — continued | |
For a Share Outstanding Throughout Each Period
| | | | Ratios to Average Net Assets | | Supplemental Data | |
| | | Total
Distributions
to
Shareholders | | Net Asset
Value,
End of
Period | | Total
Return
(Excludes
Sales
Charge)(b) | | Net
Expenses(c) | | Net
Investment
Income
(Loss)(c) | | Gross
Expenses(c)(d) | | Net Assets,
End of
Period
(000's) | | Portfolio
Turnover(b)(e) | |
Victory INCORE Investment Quality Bond Fund | |
Class A | |
Six Months Ended
6/30/19 (unaudited) | | | (0.11 | ) | | $ | 9.59 | | | | 4.82 | % | | | 0.90 | % | | | 2.29 | % | | | 1.20 | % | | $ | 23,488 | | | | 56 | % | |
Year Ended 12/31/18 | | | (0.25 | ) | | $ | 9.26 | | | | (0.80 | )% | | | 0.90 | % | | | 2.27 | % | | | 1.13 | % | | $ | 24,049 | | | | 115 | % | |
Year Ended 12/31/17 | | | (0.23 | ) | | $ | 9.59 | | | | 3.62 | % | | | 0.90 | % | | | 1.86 | % | | | 1.07 | % | | $ | 31,306 | | | | 70 | % | |
Year Ended 12/31/16 | | | (0.47 | ) | | $ | 9.48 | | | | 4.01 | % | | | 0.90 | % | | | 2.29 | % | | | 1.14 | % | | $ | 40,510 | | | | 148 | % | |
Year Ended 12/31/15 | | | (0.52 | ) | | $ | 9.57 | | | | (0.74 | )% | | | 0.90 | % | | | 3.06 | % | | | 1.07 | % | | $ | 51,747 | | | | 73 | % | |
Year Ended 12/31/14 | | | (0.41 | ) | | $ | 10.16 | | | | 5.67 | % | | | 0.88 | % | | | 2.98 | % | | | 1.05 | % | | $ | 73,618 | | | | 51 | % | |
Class C | |
Six Months Ended
6/30/19 (unaudited) | | | (0.07 | ) | | $ | 9.58 | | | | 4.37 | % | | | 1.77 | % | | | 1.42 | % | | | 2.20 | % | | $ | 3,218 | | | | 56 | % | |
Year Ended 12/31/18 | | | (0.17 | ) | | $ | 9.25 | | | | (1.66 | )% | | | 1.77 | % | | | 1.42 | % | | | 2.10 | % | | $ | 3,634 | | | | 115 | % | |
Year Ended 12/31/17 | | | (0.15 | ) | | $ | 9.58 | | | | 2.74 | % | | | 1.77 | % | | | 0.99 | % | | | 1.91 | % | | $ | 6,127 | | | | 70 | % | |
Year Ended 12/31/16 | | | (0.39 | ) | | $ | 9.47 | | | | 3.11 | % | | | 1.77 | % | | | 1.42 | % | | | 1.92 | % | | $ | 8,915 | | | | 148 | % | |
Year Ended 12/31/15 | | | (0.44 | ) | | $ | 9.56 | | | | (1.70 | )% | | | 1.77 | % | | | 2.19 | % | | | 1.85 | % | | $ | 10,510 | | | | 73 | % | |
Year Ended 12/31/14 | | | (0.33 | ) | | $ | 10.16 | | | | 4.81 | % | | | 1.71 | % | | | 2.16 | % | | | 1.88 | % | | $ | 15,377 | | | | 51 | % | |
Class R | |
Six Months Ended
6/30/19 (unaudited) | | | (0.09 | ) | | $ | 9.61 | | | | 4.59 | % | | | 1.30 | % | | | 1.88 | % | | | 1.84 | % | | $ | 3,321 | | | | 56 | % | |
Year Ended 12/31/18 | | | (0.21 | ) | | $ | 9.28 | | | | (1.20 | )% | | | 1.30 | % | | | 1.88 | % | | | 1.69 | % | | $ | 3,192 | | | | 115 | % | |
Year Ended 12/31/17 | | | (0.19 | ) | | $ | 9.61 | | | | 3.16 | % | | | 1.30 | % | | | 1.44 | % | | | 1.65 | % | | $ | 3,940 | | | | 70 | % | |
Year Ended 12/31/16 | | | (0.44 | ) | | $ | 9.50 | | | | 3.71 | % | | | 1.30 | % | | | 1.90 | % | | | 1.44 | % | | $ | 4,477 | | | | 148 | % | |
Year Ended 12/31/15 | | | (0.48 | ) | | $ | 9.58 | | | | (1.24 | )% | | | 1.30 | % | | | 2.65 | % | | | 1.45 | % | | $ | 5,568 | | | | 73 | % | |
Year Ended 12/31/14 | | | (0.37 | ) | | $ | 10.18 | | | | 5.36 | % | | | 1.28 | % | | | 2.57 | % | | | 1.46 | % | | $ | 7,821 | | | | 51 | % | |
Class Y | |
Six Months Ended
6/30/19 (unaudited) | | | (0.12 | ) | | $ | 9.58 | | | | 4.95 | % | | | 0.66 | % | | | 2.53 | % | | | 1.22 | % | | $ | 3,232 | | | | 56 | % | |
Year Ended 12/31/18 | | | (0.27 | ) | | $ | 9.25 | | | | (0.56 | )% | | | 0.66 | % | | | 2.51 | % | | | 1.12 | % | | $ | 3,265 | | | | 115 | % | |
Year Ended 12/31/17 | | | (0.25 | ) | | $ | 9.58 | | | | 3.87 | % | | | 0.66 | % | | | 2.09 | % | | | 0.98 | % | | $ | 4,421 | | | | 70 | % | |
Year Ended 12/31/16 | | | (0.50 | ) | | $ | 9.47 | | | | 4.26 | % | | | 0.66 | % | | | 2.53 | % | | | 0.94 | % | | $ | 6,133 | | | | 148 | % | |
Year Ended 12/31/15 | | | (0.54 | ) | | $ | 9.56 | | | | (0.73 | )% | | | 0.66 | % | | | 3.19 | % | | | 0.86 | % | | $ | 5,557 | | | | 73 | % | |
Year Ended 12/31/14 | | | (0.44 | ) | | $ | 10.17 | | | | 5.91 | % | | | 0.66 | % | | | 3.20 | % | | | 0.78 | % | | $ | 33,519 | | | | 51 | % | |
See notes to financial statements.
57
Victory Portfolios | | Financial Highlights | |
For a Share Outstanding Throughout Each Period
| | | | Investment Activities | | Distributions to
Shareholders From | |
| | | Net Asset
Value,
Beginning of
Period | | Net
Investment
Income
(Loss)(a) | | Net
Realized and
Unrealized
Gains
(Losses) on
Investments | | Total from
Investment
Activities | | Net
Investment
Income | | Net Realized
Gains from
Investments | | Total
Distributions
to
Shareholders | |
Victory INCORE Low Duration Bond Fund | |
Class A | |
Six Months
Ended
6/30/19
(unaudited) | | $ | 9.86 | | | | 0.10 | | | | 0.13 | | | | 0.23 | | | | (0.10 | ) | | | — | | | | (0.10 | ) | |
Year Ended
12/31/18 | | $ | 9.99 | | | | 0.16 | | | | (0.08 | ) | | | 0.08 | | | | (0.21 | ) | | | — | | | | (0.21 | ) | |
Year Ended
12/31/17 | | $ | 10.03 | | | | 0.12 | | | | 0.02 | | | | 0.14 | | | | (0.18 | ) | | | — | | | | (0.18 | ) | |
Year Ended
12/31/16 | | $ | 9.95 | | | | 0.12 | | | | 0.06 | | | | 0.18 | | | | (0.10 | ) | | | — | | | | (0.10 | ) | |
Year Ended
12/31/15 | | $ | 10.03 | | | | 0.14 | | | | (0.09 | ) | | | 0.05 | | | | (0.13 | ) | | | — | | | | (0.13 | ) | |
Year Ended
12/31/14 | | $ | 10.13 | | | | 0.18 | | | | (0.10 | ) | | | 0.08 | | | | (0.18 | ) | | | — | | | | (0.18 | ) | |
Class C | |
Six Months
Ended
6/30/19
(unaudited) | | $ | 9.85 | | | | 0.06 | | | | 0.14 | | | | 0.20 | | | | (0.07 | ) | | | — | | | | (0.07 | ) | |
Year Ended
12/31/18 | | $ | 9.99 | | | | 0.09 | | | | (0.09 | ) | | | — | (f) | | | (0.14 | ) | | | — | | | | (0.14 | ) | |
Year Ended
12/31/17 | | $ | 10.02 | | | | 0.04 | | | | 0.03 | | | | 0.07 | | | | (0.10 | ) | | | — | | | | (0.10 | ) | |
Year Ended
12/31/16 | | $ | 9.95 | | | | 0.04 | | | | 0.05 | | | | 0.09 | | | | (0.02 | ) | | | — | | | | (0.02 | ) | |
Year Ended
12/31/15 | | $ | 10.03 | | | | 0.06 | | | | (0.08 | ) | | | (0.02 | ) | | | (0.06 | ) | | | — | | | | (0.06 | ) | |
Year Ended
12/31/14 | | $ | 10.13 | | | | 0.10 | | | | (0.10 | ) | | | — | (f) | | | (0.10 | ) | | | — | | | | (0.10 | ) | |
(a) Per share net investment income (loss) has been calculated using the average daily shares method.
(b) Not annualized for periods less than one year.
(c) Annualized for periods less than one year.
(d) During the period, certain fees were reduced and/or reimbursed. If such fee reductions and/or reimbursements had not occurred, the ratios would have been as indicated.
(e) Portfolio turnover is calculated on the basis of the Fund as a whole without distinguishing between the classes of shares issued.
(f) Amount is less than $0.005 per share.
(g) The Fund received monies related to a nonrecurring refund from the prior Custodian. The corresponding impact to the total return was less than 0.005% for the period shown. (See Note 8)
(h) Amount is less than 0.005%.
See notes to financial statements.
58
Victory Portfolios | | Financial Highlights — continued | |
For a Share Outstanding Throughout Each Period
| | | | Ratios to Average Net Assets | | Supplemental Data | |
| | | Capital
Contributions
from Prior
Custodian,
Net (See
Note 8) | | Net Asset
Value,
End of
Period | | Total
Return
(Excludes
Sales
Charge)(b) | | Net
Expenses(c) | | Net
Investment
Income
(Loss)(c) | | Gross
Expenses(c)(d) | | Net Assets,
End of
Period
(000's) | | Portfolio
Turnover(b)(e) | |
Victory INCORE Low Duration Bond Fund | |
Class A | |
Six Months
Ended
6/30/19
(unaudited) | | | — | | | $ | 9.99 | | | | 2.30 | % | | | 0.85 | % | | | 2.02 | % | | | 0.96 | % | | $ | 69,534 | | | | 16 | % | |
Year Ended
12/31/18 | | | — | | | $ | 9.86 | | | | 0.73 | % | | | 0.85 | % | | | 1.66 | % | | | 0.90 | % | | $ | 96,210 | | | | 45 | % | |
Year Ended
12/31/17 | | | — | | | $ | 9.99 | | | | 1.47 | % | | | 0.85 | % | | | 1.21 | % | | | 0.90 | % | | $ | 149,287 | | | | 62 | % | |
Year Ended
12/31/16 | | | — | (f) | | $ | 10.03 | | | | 1.80 | %(g) | | | 0.85 | % | | | 1.21 | % | | | 0.89 | % | | $ | 214,825 | | | | 49 | % | |
Year Ended
12/31/15 | | | — | | | $ | 9.95 | | | | 0.52 | % | | | 0.84 | % | | | 1.38 | % | | | 0.85 | % | | $ | 314,347 | | | | 36 | % | |
Year Ended
12/31/14 | | | — | | | $ | 10.03 | | | | 0.74 | % | | | 0.90 | % | | | 1.75 | % | | | 0.90 | % | | $ | 373,706 | | | | 38 | % | |
Class C | |
Six Months
Ended
6/30/19
(unaudited) | | | — | | | $ | 9.98 | | | | 2.02 | % | | | 1.62 | % | | | 1.25 | % | | | 1.71 | % | | $ | 45,593 | | | | 16 | % | |
Year Ended
12/31/18 | | | — | | | $ | 9.85 | | | | (0.04 | )% | | | 1.62 | % | | | 0.88 | % | | | 1.68 | % | | $ | 62,103 | | | | 45 | % | |
Year Ended
12/31/17 | | | — | | | $ | 9.99 | | | | 0.70 | % | | | 1.62 | % | | | 0.44 | % | | | 1.65 | % | | $ | 82,847 | | | | 62 | % | |
Year Ended
12/31/16 | | | — | (f) | | $ | 10.02 | | | | 0.94 | %(g) | | | 1.62 | % | | | 0.44 | % | | | 1.65 | % | | $ | 117,544 | | | | 49 | % | |
Year Ended
12/31/15 | | | — | | | $ | 9.95 | | | | (0.20 | )% | | | 1.61 | % | | | 0.62 | % | | | 1.62 | % | | $ | 154,056 | | | | 36 | % | |
Year Ended
12/31/14 | | | — | | | $ | 10.03 | | | | — | (h) | | | 1.64 | % | | | 1.00 | % | | | 1.64 | % | | $ | 191,970 | | | | 38 | % | |
(continues on next page)
See notes to financial statements.
59
Victory Portfolios | | Financial Highlights | |
For a Share Outstanding Throughout Each Period
| | | | Investment Activities | | Distributions to
Shareholders From | |
| | | Net Asset
Value,
Beginning of
Period | | Net
Investment
Income
(Loss)(a) | | Net
Realized and
Unrealized
Gains
(Losses) on
Investments | | Total from
Investment
Activities | | Net
Investment
Income | | Net Realized
Gains from
Investments | | Total
Distributions
to
Shareholders | |
Victory INCORE Low Duration Bond Fund | |
Class R | |
Six Months
Ended
6/30/19
(unaudited) | | $ | 9.86 | | | | 0.08 | | | | 0.12 | | | | 0.20 | | | | (0.08 | ) | | | — | | | | (0.08 | ) | |
Year Ended
12/31/18 | | $ | 9.99 | | | | 0.12 | | | | (0.08 | ) | | | 0.04 | | | | (0.17 | ) | | | — | | | | (0.17 | ) | |
Year Ended
12/31/17 | | $ | 10.02 | | | | 0.08 | | | | 0.03 | | | | 0.11 | | | | (0.14 | ) | | | — | | | | (0.14 | ) | |
Year Ended
12/31/16 | | $ | 9.95 | | | | 0.08 | | | | 0.05 | | | | 0.13 | | | | (0.06 | ) | | | — | | | | (0.06 | ) | |
Year Ended
12/31/15 | | $ | 10.03 | | | | 0.10 | | | | (0.09 | ) | | | 0.01 | | | | (0.09 | ) | | | — | | | | (0.09 | ) | |
Year Ended
12/31/14 | | $ | 10.13 | | | | 0.13 | | | | (0.10 | ) | | | 0.03 | | | | (0.13 | ) | | | — | | | | (0.13 | ) | |
Class Y | |
Six Months
Ended
6/30/19
(unaudited) | | $ | 9.86 | | | | 0.11 | | | | 0.14 | | | | 0.25 | | | | (0.12 | ) | | | — | | | | (0.12 | ) | |
Year Ended
12/31/18 | | $ | 10.00 | | | | 0.19 | | | | (0.10 | ) | | | 0.09 | | | | (0.23 | ) | | | — | | | | (0.23 | ) | |
Year Ended
12/31/17 | | $ | 10.03 | | | | 0.15 | | | | 0.02 | | | | 0.17 | | | | (0.20 | ) | | | — | | | | (0.20 | ) | |
Year Ended
12/31/16 | | $ | 9.95 | | | | 0.14 | | | | 0.06 | | | | 0.20 | | | | (0.12 | ) | | | — | | | | (0.12 | ) | |
Year Ended
12/31/15 | | $ | 10.03 | | | | 0.16 | | | | (0.08 | ) | | | 0.08 | | | | (0.16 | ) | | | — | | | | (0.16 | ) | |
Year Ended
12/31/14 | | $ | 10.13 | | | | 0.20 | | | | (0.10 | ) | | | 0.10 | | | | (0.20 | ) | | | — | | | | (0.20 | ) | |
(a) Per share net investment income (loss) has been calculated using the average daily shares method.
(b) Not annualized for periods less than one year.
(c) Annualized for periods less than one year.
(d) During the period, certain fees were reduced and/or reimbursed. If such fee reductions and/or reimbursements had not occurred, the ratios would have been as indicated.
(e) Portfolio turnover is calculated on the basis of the Fund as a whole without distinguishing between the classes of shares issued.
(f) Amount is less than $0.005 per share.
(g) The Fund received monies related to a nonrecurring refund from the prior Custodian. The corresponding impact to the total return was less than 0.005% for the period shown. (See Note 8)
(h) Amount is less than 0.005%.
See notes to financial statements.
60
Victory Portfolios | | Financial Highlights — continued | |
For a Share Outstanding Throughout Each Period (continued)
| | | | Ratios to Average Net Assets | | Supplemental Data | |
| | | Capital
Contributions
from Prior
Custodian,
Net (See
Note 8) | | Net Asset
Value,
End of
Period | | Total
Return
(Excludes
Sales
Charge)(b) | | Net
Expenses(c) | | Net
Investment
Income
(Loss)(c) | | Gross
Expenses(c)(d) | | Net Assets,
End of
Period
(000's) | | Portfolio
Turnover(b)(e) | |
Victory INCORE Low Duration Bond Fund | |
Class R | |
Six Months
Ended
6/30/19
(unaudited) | | | — | | | $ | 9.98 | | | | 2.19 | % | | | 1.27 | % | | | 1.58 | % | | | 2.04 | % | | $ | 1,382 | | | | 16 | % | |
Year Ended
12/31/18 | | | — | | | $ | 9.85 | | | | 0.31 | % | | | 1.27 | % | | | 1.20 | % | | | 1.87 | % | | $ | 1,554 | | | | 45 | % | |
Year Ended
12/31/17 | | | — | | | $ | 9.99 | | | | 1.05 | % | | | 1.27 | % | | | 0.79 | % | | | 1.68 | % | | $ | 2,078 | | | | 62 | % | |
Year Ended
12/31/16 | | | — | (f) | | $ | 10.02 | | | | 1.33 | %(g) | | | 1.23 | % | | | 0.83 | % | | | 1.25 | % | | $ | 2,583 | | | | 49 | % | |
Year Ended
12/31/15 | | | — | | | $ | 9.95 | | | | 0.12 | % | | | 1.26 | % | | | 0.96 | % | | | 1.27 | % | | $ | 3,925 | | | | 36 | % | |
Year Ended
12/31/14 | | | — | | | $ | 10.03 | | | | 0.31 | % | | | 1.33 | % | | | 1.31 | % | | | 1.33 | % | | $ | 5,001 | | | | 38 | % | |
Class Y | |
Six Months
Ended
6/30/19
(unaudited) | | | — | | | $ | 9.99 | | | | 2.52 | % | | | 0.62 | % | | | 2.22 | % | | | 0.71 | % | | $ | 170,660 | | | | 16 | % | |
Year Ended
12/31/18 | | | — | | | $ | 9.86 | | | | 0.96 | % | | | 0.62 | % | | | 1.87 | % | | | 0.68 | % | | $ | 180,035 | | | | 45 | % | |
Year Ended
12/31/17 | | | — | | | $ | 10.00 | | | | 1.71 | % | | | 0.62 | % | | | 1.44 | % | | | 0.65 | % | | $ | 271,294 | | | | 62 | % | |
Year Ended
12/31/16 | | | — | (f) | | $ | 10.03 | | | | 2.04 | %(g) | | | 0.60 | % | | | 1.42 | % | | | 0.63 | % | | $ | 334,841 | | | | 49 | % | |
Year Ended
12/31/15 | | | — | | | $ | 9.95 | | | | 0.74 | % | | | 0.61 | % | | | 1.60 | % | | | 0.62 | % | | $ | 367,112 | | | | 36 | % | |
Year Ended
12/31/14 | | | — | | | $ | 10.03 | | | | 1.04 | % | | | 0.61 | % | | | 2.02 | % | | | 0.61 | % | | $ | 407,382 | | | | 38 | % | |
See notes to financial statements.
61
Victory Portfolios | | Financial Highlights | |
For a Share Outstanding Throughout Each Period
| | | | Investment Activities | | Distributions to
Shareholders From | |
| | | Net Asset
Value,
Beginning of
Period | | Net
Investment
Income
(Loss)(a) | | Net Realized
and Unrealized
Gains (Losses)
on Investments | | Total from
Investment
Activities | | Net
Investment
Income | | Net Realized
Gains from
Investments | |
Victory High Yield Fund | |
Class A | |
Six Months Ended
6/30/19 (unaudited) | | $ | 6.20 | | | | 0.19 | | | | 0.39 | | | | 0.58 | | | | (0.19 | ) | | | — | | |
Year Ended 12/31/18 | | $ | 6.57 | | | | 0.39 | | | | (0.37 | ) | | | 0.02 | | | | (0.39 | ) | | | — | | |
Year Ended 12/31/17 | | $ | 6.34 | | | | 0.39 | | | | 0.22 | | | | 0.61 | | | | (0.38 | ) | | | — | | |
Year Ended 12/31/16 | | $ | 5.85 | | | | 0.38 | | | | 0.49 | | | | 0.87 | | | | (0.38 | ) | | | — | | |
Year Ended 12/31/15 | | $ | 6.52 | | | | 0.40 | | | | (0.67 | ) | | | (0.27 | ) | | | (0.40 | ) | | | — | | |
Year Ended 12/31/14 | | $ | 7.31 | | | | 0.41 | | | | (0.47 | ) | | | (0.06 | ) | | | (0.41 | ) | | | (0.32 | ) | |
Class C | |
Six Months Ended
6/30/19 (unaudited) | | $ | 6.21 | | | | 0.16 | | | | 0.39 | | | | 0.55 | | | | (0.16 | ) | | | — | | |
Year Ended 12/31/18 | | $ | 6.58 | | | | 0.34 | | | | (0.36 | ) | | | (0.02 | ) | | | (0.35 | ) | | | — | | |
Year Ended 12/31/17 | | $ | 6.35 | | | | 0.34 | | | | 0.23 | | | | 0.57 | | | | (0.34 | ) | | | — | | |
Year Ended 12/31/16 | | $ | 5.86 | | | | 0.34 | | | | 0.49 | | | | 0.83 | | | | (0.34 | ) | | | — | | |
Year Ended 12/31/15 | | $ | 6.53 | | | | 0.35 | | | | (0.67 | ) | | | (0.32 | ) | | | (0.35 | ) | | | — | | |
Year Ended 12/31/14 | | $ | 7.32 | | | | 0.36 | | | | (0.47 | ) | | | (0.11 | ) | | | (0.36 | ) | | | (0.32 | ) | |
Class R | |
Six Months Ended
6/30/19 (unaudited) | | $ | 6.22 | | | | 0.18 | | | | 0.38 | | | | 0.56 | | | | (0.18 | ) | | | — | | |
Year Ended 12/31/18 | | $ | 6.59 | | | | 0.37 | | | | (0.37 | ) | | | — | (f) | | | (0.37 | ) | | | — | | |
Year Ended 12/31/17 | | $ | 6.35 | | | | 0.37 | | | | 0.23 | | | | 0.60 | | | | (0.36 | ) | | | — | | |
Year Ended 12/31/16 | | $ | 5.87 | | | | 0.36 | | | | 0.48 | | | | 0.84 | | | | (0.36 | ) | | | — | | |
Year Ended 12/31/15 | | $ | 6.54 | | | | 0.37 | | | | (0.66 | ) | | | (0.29 | ) | | | (0.38 | ) | | | — | | |
Year Ended 12/31/14 | | $ | 7.33 | | | | 0.38 | | | | (0.47 | ) | | | (0.09 | ) | | | (0.38 | ) | | | (0.32 | ) | |
Class Y | |
Six Months Ended
6/30/19 (unaudited) | | $ | 6.17 | | | | 0.19 | | | | 0.38 | | | | 0.57 | | | | (0.19 | ) | | | — | | |
Year Ended 12/31/18 | | $ | 6.54 | | | | 0.41 | | | | (0.37 | ) | | | 0.04 | | | | (0.41 | ) | | | — | | |
Year Ended 12/31/17 | | $ | 6.31 | | | | 0.40 | | | | 0.23 | | | | 0.63 | | | | (0.40 | ) | | | — | | |
Year Ended 12/31/16 | | $ | 5.82 | | | | 0.39 | | | | 0.49 | | | | 0.88 | | | | (0.39 | ) | | | — | | |
Year Ended 12/31/15 | | $ | 6.49 | | | | 0.41 | | | | (0.67 | ) | | | (0.26 | ) | | | (0.41 | ) | | | — | | |
Year Ended 12/31/14 | | $ | 7.27 | | | | 0.44 | | | | (0.48 | ) | | | (0.04 | ) | | | (0.42 | ) | | | (0.32 | ) | |
(a) Per share net investment income (loss) has been calculated using the average daily shares method.
(b) Not annualized for periods less than one year.
(c) Annualized for periods less than one year.
(d) During the period, certain fees were reduced and/or reimbursed. If such fee reductions and/or reimbursements had not occurred, the ratios would have been as indicated.
(e) Portfolio turnover is calculated on the basis of the Fund as a whole without distinguishing between the classes of shares issued.
(f) Amount is less than $0.005 per share.
See notes to financial statements.
62
Victory Portfolios | | Financial Highlights — continued | |
For a Share Outstanding Throughout Each Period
| | | | Ratios to Average Net Assets | | Supplemental Data | |
| | | Total
Distributions
to
Shareholders | | Net Asset
Value,
End of
Period | | Total
Return
(Excludes
Sales
Charge)(b) | | Net
Expenses(c) | | Net
Investment
Income
(Loss)(c) | | Gross
Expenses(c)(d) | | Net Assets,
End of
Period
(000's) | | Portfolio
Turnover(b)(e) | |
Victory High Yield Fund | |
Class A | |
Six Months Ended
6/30/19 (unaudited) | | | (0.19 | ) | | $ | 6.59 | | | | 9.21 | % | | | 1.00 | % | | | 5.78 | % | | | 1.10 | % | | $ | 30,880 | | | | 54 | % | |
Year Ended 12/31/18 | | | (0.39 | ) | | $ | 6.20 | | | | 0.28 | % | | | 1.00 | % | | | 6.01 | % | | | 1.12 | % | | $ | 23,797 | | | | 87 | % | |
Year Ended 12/31/17 | | | (0.38 | ) | | $ | 6.57 | | | | 9.93 | % | | | 1.00 | % | | | 5.99 | % | | | 1.13 | % | | $ | 21,882 | | | | 174 | % | |
Year Ended 12/31/16 | | | (0.38 | ) | | $ | 6.34 | | | | 15.40 | % | | | 1.00 | % | | | 6.32 | % | | | 1.18 | % | | $ | 25,530 | | | | 165 | % | |
Year Ended 12/31/15 | | | (0.40 | ) | | $ | 5.85 | | | | (4.51 | )% | | | 1.00 | % | | | 6.16 | % | | | 1.16 | % | | $ | 26,608 | | | | 151 | % | |
Year Ended 12/31/14 | | | (0.73 | ) | | $ | 6.52 | | | | (1.01 | )% | | | 0.98 | % | | | 5.52 | % | | | 1.16 | % | | $ | 34,339 | | | | 221 | % | |
Class C | |
Six Months Ended
6/30/19 (unaudited) | | | (0.16 | ) | | $ | 6.60 | | | | 8.98 | % | | | 1.70 | % | | | 5.06 | % | | | 1.82 | % | | $ | 20,164 | | | | 54 | % | |
Year Ended 12/31/18 | | | (0.35 | ) | | $ | 6.21 | | | | (0.43 | )% | | | 1.70 | % | | | 5.29 | % | | | 1.84 | % | | $ | 19,432 | | | | 87 | % | |
Year Ended 12/31/17 | | | (0.34 | ) | | $ | 6.58 | | | | 9.19 | % | | | 1.70 | % | | | 5.27 | % | | | 1.84 | % | | $ | 22,283 | | | | 174 | % | |
Year Ended 12/31/16 | | | (0.34 | ) | | $ | 6.35 | | | | 14.58 | % | | | 1.70 | % | | | 5.61 | % | | | 1.91 | % | | $ | 22,498 | | | | 165 | % | |
Year Ended 12/31/15 | | | (0.35 | ) | | $ | 5.86 | | | | (5.16 | )% | | | 1.70 | % | | | 5.47 | % | | | 1.90 | % | | $ | 22,138 | | | | 151 | % | |
Year Ended 12/31/14 | | | (0.68 | ) | | $ | 6.53 | | | | (1.70 | )% | | | 1.70 | % | | | 4.85 | % | | | 1.90 | % | | $ | 27,780 | | | | 221 | % | |
Class R | |
Six Months Ended
6/30/19 (unaudited) | | | (0.18 | ) | | $ | 6.60 | | | | 9.00 | % | | | 1.33 | % | | | 5.43 | % | | | 1.33 | % | | $ | 18,406 | | | | 54 | % | |
Year Ended 12/31/18 | | | (0.37 | ) | | $ | 6.22 | | | | (0.07 | )% | | | 1.35 | % | | | 5.64 | % | | | 1.35 | % | | $ | 17,595 | | | | 87 | % | |
Year Ended 12/31/17 | | | (0.36 | ) | | $ | 6.59 | | | | 9.64 | % | | | 1.35 | % | | | 5.61 | % | | | 1.36 | % | | $ | 19,217 | | | | 174 | % | |
Year Ended 12/31/16 | | | (0.36 | ) | | $ | 6.35 | | | | 14.78 | % | | | 1.35 | % | | | 5.96 | % | | | 1.45 | % | | $ | 18,742 | | | | 165 | % | |
Year Ended 12/31/15 | | | (0.38 | ) | | $ | 5.87 | | | | (4.82 | )% | | | 1.35 | % | | | 5.82 | % | | | 1.51 | % | | $ | 18,042 | | | | 151 | % | |
Year Ended 12/31/14 | | | (0.70 | ) | | $ | 6.54 | | | | (1.35 | )% | | | 1.35 | % | | | 5.20 | % | | | 1.52 | % | | $ | 21,109 | | | | 221 | % | |
Class Y | |
Six Months Ended
6/30/19 (unaudited) | | | (0.19 | ) | | $ | 6.55 | | | | 9.38 | % | | | 0.76 | % | | | 6.03 | % | | | 0.83 | % | | $ | 85,363 | | | | 54 | % | |
Year Ended 12/31/18 | | | (0.41 | ) | | $ | 6.17 | | | | 0.52 | % | | | 0.76 | % | | | 6.32 | % | | | 0.97 | % | | $ | 21,060 | | | | 87 | % | |
Year Ended 12/31/17 | | | (0.40 | ) | | $ | 6.54 | | | | 10.24 | % | | | 0.76 | % | | | 6.27 | % | | | 1.04 | % | | $ | 5,213 | | | | 174 | % | |
Year Ended 12/31/16 | | | (0.39 | ) | | $ | 6.31 | | | | 15.72 | % | | | 0.76 | % | | | 6.54 | % | | | 1.00 | % | | $ | 6,938 | | | | 165 | % | |
Year Ended 12/31/15 | | | (0.41 | ) | | $ | 5.82 | | | | (4.34 | )% | | | 0.76 | % | | | 6.36 | % | | | 0.95 | % | | $ | 6,047 | | | | 151 | % | |
Year Ended 12/31/14 | | | (0.74 | ) | | $ | 6.49 | | | | (0.63 | )% | | | 0.76 | % | | | 5.90 | % | | | 0.90 | % | | $ | 13,830 | | | | 221 | % | |
See notes to financial statements.
63
Victory Portfolios | | Financial Highlights | |
For a Share Outstanding Throughout Each Period
| | | | Investment Activities | | Distributions to
Shareholders From | |
| | | Net Asset
Value,
Beginning of
Period | | Net
Investment
Income
(Loss)(a) | | Net Realized
and Unrealized
Gains (Losses)
on Investments | | Total from
Investment
Activities | | Net
Investment
Income | | Net Realized
Gains from
Investments | |
Victory Tax-Exempt Fund | |
Class A | |
Six Months Ended
6/30/19 (unaudited) | | $ | 9.47 | | | | 0.13 | | | | 0.40 | | | | 0.53 | | | | (0.17 | ) | | | — | | |
Year Ended 12/31/18 | | $ | 9.91 | | | | 0.36 | | | | (0.30 | ) | | | 0.06 | | | | (0.36 | ) | | | (0.14 | ) | |
Year Ended 12/31/17 | | $ | 9.65 | | | | 0.36 | | | | 0.39 | | | | 0.75 | | | | (0.37 | ) | | | (0.12 | ) | |
Year Ended 12/31/16 | | $ | 10.53 | | | | 0.35 | | | | (0.49 | ) | | | (0.14 | ) | | | (0.35 | ) | | | (0.39 | ) | |
Year Ended 12/31/15 | | $ | 10.83 | | | | 0.35 | | | | (0.05 | ) | | | 0.30 | | | | (0.35 | ) | | | (0.25 | ) | |
Year Ended 12/31/14 | | $ | 10.30 | | | | 0.33 | | | | 0.53 | | | | 0.86 | | | | (0.33 | ) | | | — | | |
Class C | |
Six Months Ended
6/30/19 (unaudited) | | $ | 9.47 | | | | 0.11 | | | | 0.37 | | | | 0.48 | | | | (0.13 | ) | | | — | | |
Year Ended 12/31/18 | | $ | 9.90 | | | | 0.28 | | | | (0.29 | ) | | | (0.01 | ) | | | (0.28 | ) | | | (0.14 | ) | |
Year Ended 12/31/17 | | $ | 9.65 | | | | 0.29 | | | | 0.37 | | | | 0.66 | | | | (0.29 | ) | | | (0.12 | ) | |
Year Ended 12/31/16 | | $ | 10.53 | | | | 0.26 | | | | (0.48 | ) | | | (0.22 | ) | | | (0.27 | ) | | | (0.39 | ) | |
Year Ended 12/31/15 | | $ | 10.82 | | | | 0.26 | | | | (0.04 | ) | | | 0.22 | | | | (0.26 | ) | | | (0.25 | ) | |
Year Ended 12/31/14 | | $ | 10.30 | | | | 0.24 | | | | 0.52 | | | | 0.76 | | | | (0.24 | ) | | | — | | |
Class Y | |
Six Months Ended
6/30/19 (unaudited) | | $ | 9.46 | | | | 0.14 | | | | 0.39 | | | | 0.53 | | | | (0.17 | ) | | | — | | |
Year Ended 12/31/18 | | $ | 9.90 | | | | 0.37 | | | | (0.30 | ) | | | 0.07 | | | | (0.37 | ) | | | (0.14 | ) | |
Year Ended 12/31/17 | | $ | 9.65 | | | | 0.37 | | | | 0.38 | | | | 0.75 | | | | (0.38 | ) | | | (0.12 | ) | |
Year Ended 12/31/16 | | $ | 10.52 | | | | 0.36 | | | | (0.48 | ) | | | (0.12 | ) | | | (0.36 | ) | | | (0.39 | ) | |
Year Ended 12/31/15 | | $ | 10.82 | | | | 0.36 | | | | (0.05 | ) | | | 0.31 | | | | (0.36 | ) | | | (0.25 | ) | |
Year Ended 12/31/14 | | $ | 10.29 | | | | 0.34 | | | | 0.53 | | | | 0.87 | | | | (0.34 | ) | | | — | | |
(a) Per share net investment income (loss) has been calculated using the average daily shares method.
(b) Not annualized for periods less than one year.
(c) Annualized for periods less than one year.
(d) During the period, certain fees were reduced and/or reimbursed. If such fee reductions and/or reimbursements had not occurred, the ratios would have been as indicated.
(e) Portfolio turnover is calculated on the basis of the Fund as a whole without distinguishing between the classes of shares issued.
See notes to financial statements.
64
Victory Portfolios | | Financial Highlights — continued | |
For a Share Outstanding Throughout Each Period
| | | | Ratios to Average Net Assets | | Supplemental Data | |
| | | Total
Distributions
to
Shareholders | | Net Asset
Value,
End of
Period | | Total
Return
(Excludes
Sales
Charge)(b) | | Net
Expenses(c) | | Net
Investment
Income
(Loss)(c) | | Gross
Expenses(c)(d) | | Net Assets,
End of
Period
(000's) | | Portfolio
Turnover(b)(e) | |
Victory Tax-Exempt Fund | |
Class A | |
Six Months Ended
6/30/19 (unaudited) | | | (0.17 | ) | | $ | 9.83 | | | | 5.53 | % | | | 0.80 | % | | | 2.80 | % | | | 1.01 | % | | $ | 33,648 | | | | 48 | % | |
Year Ended 12/31/18 | | | (0.50 | ) | | $ | 9.47 | | | | 0.69 | % | | | 0.80 | % | | | 3.68 | % | | | 0.97 | % | | $ | 29,993 | | | | 42 | % | |
Year Ended 12/31/17 | | | (0.49 | ) | | $ | 9.91 | | | | 7.89 | % | | | 0.80 | % | | | 3.70 | % | | | 0.96 | % | | $ | 37,570 | | | | 84 | % | |
Year Ended 12/31/16 | | | (0.74 | ) | | $ | 9.65 | | | | (1.40 | )% | | | 0.80 | % | | | 3.30 | % | | | 0.95 | % | | $ | 54,658 | | | | 39 | % | |
Year Ended 12/31/15 | | | (0.60 | ) | | $ | 10.53 | | | | 2.76 | % | | | 0.80 | % | | | 3.22 | % | | | 0.93 | % | | $ | 90,301 | | | | 39 | % | |
Year Ended 12/31/14 | | | (0.33 | ) | | $ | 10.83 | | | | 8.39 | % | | | 0.80 | % | | | 3.05 | % | | | 0.96 | % | | $ | 102,716 | | | | 14 | % | |
Class C | |
Six Months Ended
6/30/19 (unaudited) | | | (0.13 | ) | | $ | 9.82 | | | | 5.12 | % | | | 1.60 | % | | | 2.20 | % | | | 1.81 | % | | $ | 13,608 | | | | 48 | % | |
Year Ended 12/31/18 | | | (0.42 | ) | | $ | 9.47 | | | | (0.01 | )% | | | 1.60 | % | | | 2.88 | % | | | 1.78 | % | | $ | 17,986 | | | | 42 | % | |
Year Ended 12/31/17 | | | (0.41 | ) | | $ | 9.90 | | | | 6.92 | % | | | 1.60 | % | | | 2.89 | % | | | 1.74 | % | | $ | 26,520 | | | | 84 | % | |
Year Ended 12/31/16 | | | (0.66 | ) | | $ | 9.65 | | | | (2.19 | )% | | | 1.60 | % | | | 2.51 | % | | | 1.71 | % | | $ | 33,369 | | | | 39 | % | |
Year Ended 12/31/15 | | | (0.51 | ) | | $ | 10.53 | | | | 2.04 | % | | | 1.60 | % | | | 2.43 | % | | | 1.70 | % | | $ | 43,404 | | | | 39 | % | |
Year Ended 12/31/14 | | | (0.24 | ) | | $ | 10.82 | | | | 7.44 | % | | | 1.60 | % | | | 2.26 | % | | | 1.72 | % | | $ | 53,042 | | | | 14 | % | |
Class Y | |
Six Months Ended
6/30/19 (unaudited) | | | (0.17 | ) | | $ | 9.82 | | | | 5.70 | % | | | 0.69 | % | | | 2.97 | % | | | 0.82 | % | | $ | 20,978 | | | | 48 | % | |
Year Ended 12/31/18 | | | (0.51 | ) | | $ | 9.46 | | | | 0.80 | % | | | 0.69 | % | | | 3.79 | % | | | 0.77 | % | | $ | 20,260 | | | | 42 | % | |
Year Ended 12/31/17 | | | (0.50 | ) | | $ | 9.90 | | | | 7.90 | % | | | 0.69 | % | | | 3.80 | % | | | 0.73 | % | | $ | 27,420 | | �� | | 84 | % | |
Year Ended 12/31/16 | | | (0.75 | ) | | $ | 9.65 | | | | (1.20 | )% | | | 0.69 | % | | | 3.41 | % | | | 0.71 | % | | $ | 31,762 | | | | 39 | % | |
Year Ended 12/31/15 | | | (0.61 | ) | | $ | 10.52 | | | | 2.87 | % | | | 0.69 | % | | | 3.33 | % | | | 0.71 | % | | $ | 52,012 | | | | 39 | % | |
Year Ended 12/31/14 | | | (0.34 | ) | | $ | 10.82 | | | | 8.53 | % | | | 0.69 | % | | | 3.18 | % | | | 0.69 | % | | $ | 75,047 | | | | 14 | % | |
See notes to financial statements.
65
Victory Portfolios | | Financial Highlights | |
For a Share Outstanding Throughout Each Period
| | | | Investment Activities | | Distributions to
Shareholders From | | | |
| | | Net Asset
Value,
Beginning of
Period | | Net
Investment
Income
(Loss)(a) | | Net Realized
and Unrealized
Gains (Losses)
on Investments | | Total from
Investment
Activities | | Net
Investment
Income | | Total
Distributions
to
Shareholders | | Net Asset
Value,
End of
Period | | Total
Return
(Excludes
Sales
Charge)(b) | |
Victory High Income Municipal Bond Fund | |
Class A | |
Six Months Ended
6/30/19 (unaudited) | | $ | 10.39 | | | | 0.17 | | | | 0.37 | | | | 0.54 | | | | (0.20 | ) | | | (0.20 | ) | | $ | 10.73 | | | | 5.26 | % | |
Year Ended 12/31/18 | | $ | 10.79 | | | | 0.43 | | | | (0.40 | ) | | | 0.03 | | | | (0.43 | ) | | | (0.43 | ) | | $ | 10.39 | | | | 0.34 | % | |
Year Ended 12/31/17 | | $ | 10.35 | | | | 0.46 | | | | 0.44 | | | | 0.90 | | | | (0.46 | ) | | | (0.46 | ) | | $ | 10.79 | | | | 8.85 | % | |
Year Ended 12/31/16 | | $ | 10.89 | | | | 0.44 | | | | (0.54 | ) | | | (0.10 | ) | | | (0.44 | ) | | | (0.44 | ) | | $ | 10.35 | | | | (1.04 | )% | |
Year Ended 12/31/15 | | $ | 10.84 | | | | 0.43 | | | | 0.05 | | | | 0.48 | | | | (0.43 | ) | | | (0.43 | ) | | $ | 10.89 | | | | 4.51 | % | |
Year Ended 12/31/14 | | $ | 10.00 | | | | 0.45 | | | | 0.84 | | | | 1.29 | | | | (0.45 | ) | | | (0.45 | ) | | $ | 10.84 | | | | 13.09 | % | |
Class C | |
Six Months Ended
6/30/19 (unaudited) | | $ | 10.39 | | | | 0.14 | | | | 0.36 | | | | 0.50 | | | | (0.16 | ) | | | (0.16 | ) | | $ | 10.73 | | | | 4.86 | % | |
Year Ended 12/31/18 | | $ | 10.79 | | | | 0.35 | | | | (0.40 | ) | | | (0.05 | ) | | | (0.35 | ) | | | (0.35 | ) | | $ | 10.39 | | | | (0.43 | )% | |
Year Ended 12/31/17 | | $ | 10.35 | | | | 0.38 | | | | 0.44 | | | | 0.82 | | | | (0.38 | ) | | | (0.38 | ) | | $ | 10.79 | | | | 8.01 | % | |
Year Ended 12/31/16 | | $ | 10.89 | | | | 0.36 | | | | (0.54 | ) | | | (0.18 | ) | | | (0.36 | ) | | | (0.36 | ) | | $ | 10.35 | | | | (1.79 | )% | |
Year Ended 12/31/15 | | $ | 10.84 | | | | 0.35 | | | | 0.05 | | | | 0.40 | | | | (0.35 | ) | | | (0.35 | ) | | $ | 10.89 | | | | 3.71 | % | |
Year Ended 12/31/14 | | $ | 10.00 | | | | 0.37 | | | | 0.84 | | | | 1.21 | | | | (0.37 | ) | | | (0.37 | ) | | $ | 10.84 | | | | 12.22 | % | |
Class Y | |
Six Months Ended
6/30/19 (unaudited) | | $ | 10.39 | | | | 0.19 | | | | 0.36 | | | | 0.55 | | | | (0.21 | ) | | | (0.21 | ) | | $ | 10.73 | | | | 5.38 | % | |
Year Ended 12/31/18 | | $ | 10.79 | | | | 0.46 | | | | (0.40 | ) | | | 0.06 | | | | (0.46 | ) | | | (0.46 | ) | | $ | 10.39 | | | | 0.57 | % | |
Year Ended 12/31/17 | | $ | 10.35 | | | | 0.48 | | | | 0.44 | | | | 0.92 | | | | (0.48 | ) | | | (0.48 | ) | | $ | 10.79 | | | | 9.10 | % | |
Year Ended 12/31/16 | | $ | 10.89 | | | | 0.47 | | | | (0.54 | ) | | | (0.07 | ) | | | (0.47 | ) | | | (0.47 | ) | | $ | 10.35 | | | | (0.81 | )% | |
Year Ended 12/31/15 | | $ | 10.84 | | | | 0.45 | | | | 0.05 | | | | 0.50 | | | | (0.45 | ) | | | (0.45 | ) | | $ | 10.89 | | | | 4.75 | % | |
Year Ended 12/31/14 | | $ | 10.00 | | | | 0.47 | | | | 0.84 | | | | 1.31 | | | | (0.47 | ) | | | (0.47 | ) | | $ | 10.84 | | | | 13.37 | % | |
(a) Per share net investment income (loss) has been calculated using the average daily shares method.
(b) Not annualized for periods less than one year.
(c) Annualized for periods less than one year.
(d) During the period, certain fees were reduced and/or reimbursed. If such fee reductions and/or reimbursements had not occurred, the ratios would have been as indicated.
(e) Portfolio turnover is calculated on the basis of the Fund as a whole without distinguishing between the classes of shares issued.
See notes to financial statements.
66
Victory Portfolios | | Financial Highlights — continued | |
For a Share Outstanding Throughout Each Period
| | Ratios to Average Net Assets | | Supplemental Data | |
| | | Net
Expenses(c) | | Net
Investment
Income
(Loss)(c) | | Gross
Expenses(c)(d) | | Net Assets,
End of
Period
(000's) | | Portfolio
Turnover(b)(e) | |
Victory High Income Municipal Bond Fund | |
Class A | |
Six Months Ended
6/30/19 (unaudited) | | | 0.80 | % | | | 3.25 | % | | | 1.06 | % | | $ | 19,325 | | | | 29 | % | |
Year Ended 12/31/18 | | | 0.80 | % | | | 4.13 | % | | | 1.02 | % | | $ | 16,483 | | | | 48 | % | |
Year Ended 12/31/17 | | | 0.80 | % | | | 4.31 | % | | | 0.96 | % | | $ | 25,831 | | | | 66 | % | |
Year Ended 12/31/16 | | | 0.80 | % | | | 4.02 | % | | | 0.96 | % | | $ | 32,943 | | | | 49 | % | |
Year Ended 12/31/15 | | | 0.80 | % | | | 3.96 | % | | | 0.95 | % | | $ | 48,485 | | | | 53 | % | |
Year Ended 12/31/14 | | | 0.78 | % | | | 4.26 | % | | | 1.02 | % | | $ | 50,341 | | | | 25 | % | |
Class C | |
Six Months Ended
6/30/19 (unaudited) | | | 1.57 | % | | | 2.65 | % | | | 1.81 | % | | $ | 14,956 | | | | 29 | % | |
Year Ended 12/31/18 | | | 1.57 | % | | | 3.35 | % | | | 1.78 | % | | $ | 19,282 | | | | 48 | % | |
Year Ended 12/31/17 | | | 1.57 | % | | | 3.54 | % | | | 1.73 | % | | $ | 25,175 | | | | 66 | % | |
Year Ended 12/31/16 | | | 1.57 | % | | | 3.26 | % | | | 1.73 | % | | $ | 29,563 | | | | 49 | % | |
Year Ended 12/31/15 | | | 1.57 | % | | | 3.19 | % | | | 1.73 | % | | $ | 36,190 | | | | 53 | % | |
Year Ended 12/31/14 | | | 1.55 | % | | | 3.50 | % | | | 1.77 | % | | $ | 35,996 | | | | 25 | % | |
Class Y | |
Six Months Ended
6/30/19 (unaudited) | | | 0.57 | % | | | 3.59 | % | | | 0.84 | % | | $ | 11,060 | | | | 29 | % | |
Year Ended 12/31/18 | | | 0.57 | % | | | 4.36 | % | | | 0.78 | % | | $ | 11,683 | | | | 48 | % | |
Year Ended 12/31/17 | | | 0.57 | % | | | 4.55 | % | | | 0.73 | % | | $ | 26,864 | | | | 66 | % | |
Year Ended 12/31/16 | | | 0.57 | % | | | 4.26 | % | | | 0.72 | % | | $ | 36,603 | | | | 49 | % | |
Year Ended 12/31/15 | | | 0.57 | % | | | 4.18 | % | | | 0.73 | % | | $ | 43,024 | | | | 53 | % | |
Year Ended 12/31/14 | | | 0.54 | % | | | 4.49 | % | | | 0.73 | % | | $ | 34,630 | | | | 25 | % | |
See notes to financial statements.
67
Victory Portfolios | | Financial Highlights | |
For a Share Outstanding Throughout Each Period
| | | | Investment Activities | | Distributions to
Shareholders From | | | |
| | | Net Asset
Value,
Beginning of
Period | | Net
Investment
Income
(Loss)(a) | | Net Realized
and Unrealized
Gains (Losses)
on Investments | | Total from
Investment
Activities | | Net
Investment
Income | | Total
Distributions
to
Shareholders | | Net Asset
Value,
End of
Period | | Total
Return
(Excludes
Sales
Charge)(b) | |
Victory Floating Rate Fund | |
Class A | |
Six Months Ended
6/30/19 (unaudited) | | $ | 9.13 | | | | 0.28 | | | | 0.26 | | | | 0.54 | | | | (0.28 | ) | | | (0.28 | ) | | $ | 9.39 | | | | 5.92 | % | |
Year Ended 12/31/18 | | $ | 9.60 | | | | 0.52 | | | | (0.47 | ) | | | 0.05 | | | | (0.52 | ) | | | (0.52 | ) | | $ | 9.13 | | | | 0.43 | % | |
Year Ended 12/31/17 | | $ | 9.71 | | | | 0.46 | | | | (0.10 | ) | | | 0.36 | | | | (0.47 | ) | | | (0.47 | ) | | $ | 9.60 | | | | 3.76 | % | |
Year Ended 12/31/16 | | $ | 9.08 | | | | 0.46 | | | | 0.63 | | | | 1.09 | | | | (0.46 | ) | | | (0.46 | ) | | $ | 9.71 | | | | 12.35 | % | |
Year Ended 12/31/15 | | $ | 9.82 | | | | 0.46 | | | | (0.74 | ) | | | (0.28 | ) | | | (0.46 | ) | | | (0.46 | ) | | $ | 9.08 | | | | (3.03 | )% | |
Year Ended 12/31/14 | | $ | 10.34 | | | | 0.42 | | | | (0.52 | ) | | | (0.10 | ) | | | (0.42 | ) | | | (0.42 | ) | | $ | 9.82 | | | | (1.09 | )% | |
Class C | |
Six Months Ended
6/30/19 (unaudited) | | $ | 9.14 | | | | 0.24 | | | | 0.26 | | | | 0.50 | | | | (0.24 | ) | | | (0.24 | ) | | $ | 9.40 | | | | 5.51 | % | |
Year Ended 12/31/18 | | $ | 9.61 | | | | 0.44 | | | | (0.47 | ) | | | (0.03 | ) | | | (0.44 | ) | | | (0.44 | ) | | $ | 9.14 | | | | (0.38 | )% | |
Year Ended 12/31/17 | | $ | 9.72 | | | | 0.38 | | | | (0.10 | ) | | | 0.28 | | | | (0.39 | ) | | | (0.39 | ) | | $ | 9.61 | | | | 2.93 | % | |
Year Ended 12/31/16 | | $ | 9.08 | | | | 0.39 | | | | 0.64 | | | | 1.03 | | | | (0.39 | ) | | | (0.39 | ) | | $ | 9.72 | | | | 11.57 | % | |
Year Ended 12/31/15 | | $ | 9.83 | | | | 0.38 | | | | (0.75 | ) | | | (0.37 | ) | | | (0.38 | ) | | | (0.38 | ) | | $ | 9.08 | | | | (3.91 | )% | |
Year Ended 12/31/14 | | $ | 10.34 | | | | 0.34 | | | | (0.51 | ) | | | (0.17 | ) | | | (0.34 | ) | | | (0.34 | ) | | $ | 9.83 | | | | (1.76 | )% | |
Class R | |
Six Months Ended
6/30/19 (unaudited) | | $ | 9.13 | | | | 0.25 | | | | 0.26 | | | | 0.51 | | | | (0.25 | ) | | | (0.25 | ) | | $ | 9.39 | | | | 5.63 | % | |
Year Ended 12/31/18 | | $ | 9.60 | | | | 0.46 | | | | (0.46 | ) | | | — | (f) | | | (0.47 | ) | | | (0.47 | ) | | $ | 9.13 | | | | (0.13 | )% | |
Year Ended 12/31/17 | | $ | 9.72 | | | | 0.41 | | | | (0.12 | ) | | | 0.29 | | | | (0.41 | ) | | | (0.41 | ) | | $ | 9.60 | | | | 3.07 | % | |
Year Ended 12/31/16 | | $ | 9.08 | | | | 0.42 | | | | 0.63 | | | | 1.05 | | | �� | (0.41 | ) | | | (0.41 | ) | | $ | 9.72 | | | | 11.88 | % | |
Year Ended 12/31/15 | | $ | 9.83 | | | | 0.41 | | | | (0.75 | ) | | | (0.34 | ) | | | (0.41 | ) | | | (0.41 | ) | | $ | 9.08 | | | | (3.62 | )% | |
Year Ended 12/31/14 | | $ | 10.34 | | | | 0.36 | | | | (0.51 | ) | | | (0.15 | ) | | | (0.36 | ) | | | (0.36 | ) | | $ | 9.83 | | | | (1.50 | )% | |
Class Y | |
Six Months Ended
6/30/19 (unaudited) | | $ | 9.14 | | | | 0.29 | | | | 0.26 | | | | 0.55 | | | | (0.29 | ) | | | (0.29 | ) | | $ | 9.40 | | | | 5.93 | % | |
Year Ended 12/31/18 | | $ | 9.61 | | | | 0.54 | | | | (0.47 | ) | | | 0.07 | | | | (0.54 | ) | | | (0.54 | ) | | $ | 9.14 | | | | 0.64 | % | |
Year Ended 12/31/17 | | $ | 9.72 | | | | 0.48 | | | | (0.10 | ) | | | 0.38 | | | | (0.49 | ) | | | (0.49 | ) | | $ | 9.61 | | | | 3.98 | % | |
Year Ended 12/31/16 | | $ | 9.08 | | | | 0.49 | | | | 0.63 | | | | 1.12 | | | | (0.48 | ) | | | (0.48 | ) | | $ | 9.72 | | | | 12.71 | % | |
Year Ended 12/31/15 | | $ | 9.83 | | | | 0.48 | | | | (0.75 | ) | | | (0.27 | ) | | | (0.48 | ) | | | (0.48 | ) | | $ | 9.08 | | | | (2.91 | )% | |
Year Ended 12/31/14 | | $ | 10.34 | | | | 0.44 | | | | (0.51 | ) | | | (0.07 | ) | | | (0.44 | ) | | | (0.44 | ) | | $ | 9.83 | | | | (0.75 | )% | |
(a) Per share net investment income (loss) has been calculated using the average daily shares method.
(b) Not annualized for periods less than one year.
(c) Annualized for periods less than one year.
(d) During the period, certain fees were reduced and/or reimbursed. If such fee reductions and/or reimbursements had not occurred, the ratios would have been as indicated.
(e) Portfolio turnover is calculated on the basis of the Fund as a whole without distinguishing between the classes of shares issued.
(f) Amount is less than $0.005 per share.
See notes to financial statements.
68
Victory Portfolios | | Financial Highlights — continued | |
For a Share Outstanding Throughout Each Period
| | Ratios to Average Net Assets | | Supplemental Data | |
| | | Net
Expenses(c) | | Net
Investment
Income
(Loss)(c) | | Gross
Expenses(c)(d) | | Net Assets,
End of
Period
(000's) | | Portfolio
Turnover(b)(e) | |
Victory Floating Rate Fund | |
Class A | |
Six Months Ended
6/30/19 (unaudited) | | | 1.00 | % | | | 5.98 | % | | | 1.16 | % | | $ | 150,447 | | | | 17 | % | |
Year Ended 12/31/18 | | | 1.00 | % | | | 5.41 | % | | | 1.14 | % | | $ | 118,672 | | | | 48 | % | |
Year Ended 12/31/17 | | | 1.00 | % | | | 4.76 | % | | | 1.10 | % | | $ | 148,060 | | | | 57 | % | |
Year Ended 12/31/16 | | | 1.00 | % | | | 4.95 | % | | | 1.11 | % | | $ | 221,022 | | | | 56 | % | |
Year Ended 12/31/15 | | | 1.00 | % | | | 4.71 | % | | | 1.06 | % | | $ | 227,240 | | | | 29 | % | |
Year Ended 12/31/14 | | | 0.99 | % | | | 4.02 | % | | | 1.08 | % | | $ | 335,081 | | | | 39 | % | |
Class C | |
Six Months Ended
6/30/19 (unaudited) | | | 1.80 | % | | | 5.15 | % | | | 1.92 | % | | $ | 167,231 | | | | 17 | % | |
Year Ended 12/31/18 | | | 1.80 | % | | | 4.60 | % | | | 1.90 | % | | $ | 211,462 | | | | 48 | % | |
Year Ended 12/31/17 | | | 1.80 | % | | | 3.97 | % | | | 1.87 | % | | $ | 265,486 | | | | 57 | % | |
Year Ended 12/31/16 | | | 1.80 | % | | | 4.18 | % | | | 1.89 | % | | $ | 341,169 | | | | 56 | % | |
Year Ended 12/31/15 | | | 1.80 | % | | | 3.92 | % | | | 1.85 | % | | $ | 399,361 | | | | 29 | % | |
Year Ended 12/31/14 | | | 1.79 | % | | | 3.28 | % | | | 1.85 | % | | $ | 585,818 | | | | 39 | % | |
Class R | |
Six Months Ended
6/30/19 (unaudited) | | | 1.56 | % | | | 5.41 | % | | | 3.30 | % | | $ | 572 | | | | 17 | % | |
Year Ended 12/31/18 | | | 1.56 | % | | | 4.84 | % | | | 2.99 | % | | $ | 716 | | | | 48 | % | |
Year Ended 12/31/17 | | | 1.56 | % | | | 4.20 | % | | | 2.26 | % | | $ | 916 | | | | 57 | % | |
Year Ended 12/31/16 | | | 1.53 | % | | | 4.48 | % | | | 1.53 | % | | $ | 1,319 | | | | 56 | % | |
Year Ended 12/31/15 | | | 1.52 | % | | | 4.22 | % | | | 1.52 | % | | $ | 1,920 | | | | 29 | % | |
Year Ended 12/31/14 | | | 1.55 | % | | | 3.52 | % | | | 1.58 | % | | $ | 2,340 | | | | 39 | % | |
Class Y | |
Six Months Ended
6/30/19 (unaudited) | | | 0.78 | % | | | 6.18 | % | | | 0.91 | % | | $ | 280,040 | | | | 17 | % | |
Year Ended 12/31/18 | | | 0.78 | % | | | 5.64 | % | | | 0.89 | % | | $ | 281,545 | | | | 48 | % | |
Year Ended 12/31/17 | | | 0.78 | % | | | 4.99 | % | | | 0.88 | % | | $ | 276,195 | | | | 57 | % | |
Year Ended 12/31/16 | | | 0.78 | % | | | 5.21 | % | | | 0.88 | % | | $ | 370,035 | | | | 56 | % | |
Year Ended 12/31/15 | | | 0.78 | % | | | 4.91 | % | | | 0.84 | % | | $ | 471,827 | | | | 29 | % | |
Year Ended 12/31/14 | | | 0.77 | % | | | 4.31 | % | | | 0.82 | % | | $ | 927,644 | | | | 39 | % | |
See notes to financial statements.
69
Victory Portfolios | | Financial Highlights | |
For a Share Outstanding Throughout Each Period
| | | | Investment Activities | | Distributions to
Shareholders From | |
| | | Net Asset
Value,
Beginning of
Period | | Net
Investment
Income
(Loss)(a) | | Net
Realized and
Unrealized
Gains
(Losses) on
Investments | | Total from
Investment
Activities | | Net
Investment
Income | | Net Realized
Gains from
Investments | | Return of
Capital | |
Victory Strategic Income Fund | |
Class A | |
Six Months
Ended
6/30/19
(unaudited) | | $ | 9.74 | | | | 0.15 | | | | 0.52 | | | | 0.67 | | | | (0.15 | ) | | | — | | | | — | | |
Year Ended
12/31/18 | | $ | 10.14 | | | | 0.34 | | | | (0.41 | ) | | | (0.07 | ) | | | (0.33 | ) | | | — | | | | — | | |
Year Ended
12/31/17 | | $ | 9.99 | | | | 0.33 | | | | 0.17 | | | | 0.50 | | | | (0.35 | ) | | | — | | | | — | | |
Year Ended
12/31/16 | | $ | 9.68 | | | | 0.23 | | | | 0.36 | | | | 0.59 | | | | (0.27 | ) | | | — | | | | (0.01 | ) | |
Year Ended
12/31/15 | | $ | 10.10 | | | | 0.31 | | | | (0.40 | ) | | | (0.09 | ) | | | (0.32 | ) | | | (0.01 | ) | | | — | | |
Year Ended
12/31/14 | | $ | 10.33 | | | | 0.31 | | | | (0.10 | ) | | | 0.21 | | | | (0.33 | ) | | | (0.11 | ) | | | — | | |
Class C | |
Six Months
Ended
6/30/19
(unaudited) | | $ | 9.79 | | | | 0.11 | | | | 0.53 | | | | 0.64 | | | | (0.12 | ) | | | — | | | | — | | |
Year Ended
12/31/18 | | $ | 10.19 | | | | 0.26 | | | | (0.41 | ) | | | (0.15 | ) | | | (0.25 | ) | | | — | | | | — | | |
Year Ended
12/31/17 | | $ | 10.04 | | | | 0.25 | | | | 0.17 | | | | 0.42 | | | | (0.27 | ) | | | — | | | | — | | |
Year Ended
12/31/16 | | $ | 9.72 | | | | 0.15 | | | | 0.38 | | | | 0.53 | | | | (0.20 | ) | | | — | | | | (0.01 | ) | |
Year Ended
12/31/15 | | $ | 10.15 | | | | 0.23 | | | | (0.40 | ) | | | (0.17 | ) | | | (0.25 | ) | | | (0.01 | ) | | | — | | |
Year Ended
12/31/14 | | $ | 10.38 | | | | 0.24 | | | | (0.11 | ) | | | 0.13 | | | | (0.25 | ) | | | (0.11 | ) | | | — | | |
(a) Per share net investment income (loss) has been calculated using the average daily shares method.
(b) Not annualized for periods less than one year.
(c) Annualized for periods less than one year.
(d) During the period, certain fees were reduced and/or reimbursed. If such fee reductions and/or reimbursements had not occurred, the ratios would have been as indicated.
(e) Portfolio turnover is calculated on the basis of the Fund as a whole without distinguishing between the classes of shares issued.
See notes to financial statements.
70
Victory Portfolios | | Financial Highlights — continued | |
For a Share Outstanding Throughout Each Period
| | | | Ratios to Average Net Assets | | Supplemental Data | |
| | | Total
Distributions
to
Shareholders | | Net Asset
Value,
End of
Period | | Total
Return
(Excludes
Sales
Charge)(b) | | Net
Expenses(c) | | Net
Investment
Income
(Loss)(c) | | Gross
Expenses(c)(d) | | Net Assets,
End of
Period
(000's) | | Portfolio
Turnover(b)(e) | |
Victory Strategic Income Fund | |
Class A | |
Six Months
Ended
6/30/19
(unaudited) | | | (0.15 | ) | | $ | 10.26 | | | | 6.98 | % | | | 0.95 | % | | | 2.96 | % | | | 1.10 | % | | $ | 33,887 | | | | 64 | % | |
Year Ended
12/31/18 | | | (0.33 | ) | | $ | 9.74 | | | | (0.66 | )% | | | 0.95 | % | | | 3.46 | % | | | 1.09 | % | | $ | 32,053 | | | | 115 | % | |
Year Ended
12/31/17 | | | (0.35 | ) | | $ | 10.14 | | | | 5.12 | % | | | 0.95 | % | | | 3.24 | % | | | 1.07 | % | | $ | 34,957 | | | | 138 | % | |
Year Ended
12/31/16 | | | (0.28 | ) | | $ | 9.99 | | | | 6.20 | % | | | 0.95 | % | | | 2.28 | % | | | 1.17 | % | | $ | 37,121 | | | | 79 | % | |
Year Ended
12/31/15 | | | (0.33 | ) | | $ | 9.68 | | | | (0.93 | )% | | | 0.95 | % | | | 3.05 | % | | | 1.16 | % | | $ | 37,845 | | | | 41 | % | |
Year Ended
12/31/14 | | | (0.44 | ) | | $ | 10.10 | | | | 2.03 | % | | | 0.92 | % | | | 3.08 | % | | | 1.14 | % | | $ | 48,790 | | | | 87 | % | |
Class C | |
Six Months
Ended
6/30/19
(unaudited) | | | (0.12 | ) | | $ | 10.31 | | | | 6.55 | % | | | 1.74 | % | | | 2.17 | % | | | 1.98 | % | | $ | 9,565 | | | | 64 | % | |
Year Ended
12/31/18 | | | (0.25 | ) | | $ | 9.79 | | | | (1.45 | )% | | | 1.74 | % | | | 2.65 | % | | | 1.97 | % | | $ | 10,221 | | | | 115 | % | |
Year Ended
12/31/17 | | | (0.27 | ) | | $ | 10.19 | | | | 4.27 | % | | | 1.74 | % | | | 2.44 | % | | | 1.89 | % | | $ | 11,671 | | | | 138 | % | |
Year Ended
12/31/16 | | | (0.21 | ) | | $ | 10.04 | | | | 5.46 | % | | | 1.74 | % | | | 1.49 | % | | | 2.00 | % | | $ | 11,547 | | | | 79 | % | |
Year Ended
12/31/15 | | | (0.26 | ) | | $ | 9.72 | | | | (1.79 | )% | | | 1.74 | % | | | 2.25 | % | | | 1.97 | % | | $ | 12,940 | | | | 41 | % | |
Year Ended
12/31/14 | | | (0.36 | ) | | $ | 10.15 | | | | 1.23 | % | | | 1.70 | % | | | 2.29 | % | | | 1.96 | % | | $ | 12,974 | | | | 87 | % | |
(continues on next page)
See notes to financial statements.
71
Victory Portfolios | | Financial Highlights | |
For a Share Outstanding Throughout Each Period
| | | | Investment Activities | | Distributions to
Shareholders From | |
| | | Net Asset
Value,
Beginning of
Period | | Net
Investment
Income
(Loss)(a) | | Net
Realized and
Unrealized
Gains
(Losses) on
Investments | | Total from
Investment
Activities | | Net
Investment
Income | | Net Realized
Gains from
Investments | | Return of
Capital | |
Victory Strategic Income Fund | |
Class R | |
Six Months
Ended
6/30/19
(unaudited) | | $ | 9.79 | | | | 0.13 | | | | 0.53 | | | | 0.66 | | | | (0.13 | ) | | | — | | | | — | | |
Year Ended
12/31/18 | | $ | 10.20 | | | | 0.30 | | | | (0.42 | ) | | | (0.12 | ) | | | (0.29 | ) | | | — | | | | — | | |
Year Ended
12/31/17 | | $ | 10.04 | | | | 0.29 | | | | 0.18 | | | | 0.47 | | | | (0.31 | ) | | | — | | | | — | | |
Year Ended
12/31/16 | | $ | 9.73 | | | | 0.19 | | | | 0.37 | | | | 0.56 | | | | (0.24 | ) | | | — | | | | (0.01 | ) | |
Year Ended
12/31/15 | | $ | 10.16 | | | | 0.27 | | | | (0.40 | ) | | | (0.13 | ) | | | (0.29 | ) | | | (0.01 | ) | | | — | | |
Year Ended
12/31/14 | | $ | 10.38 | | | | 0.28 | | | | (0.10 | ) | | | 0.18 | | | | (0.29 | ) | | | (0.11 | ) | | | — | | |
Class Y | |
Six Months
Ended
6/30/19
(unaudited) | | $ | 9.69 | | | | 0.16 | | | | 0.51 | | | | 0.67 | | | | (0.16 | ) | | | — | | | | — | | |
Year Ended
12/31/18 | | $ | 10.09 | | | | 0.36 | | | | (0.41 | ) | | | (0.05 | ) | | | (0.35 | ) | | | — | | | | — | | |
Year Ended
12/31/17 | | $ | 9.94 | | | | 0.35 | | | | 0.18 | | | | 0.53 | | | | (0.38 | ) | | | — | | | | — | | |
Year Ended
12/31/16 | | $ | 9.63 | | | | 0.25 | | | | 0.36 | | | | 0.61 | | | | (0.29 | ) | | | — | | | | (0.01 | ) | |
Year Ended
12/31/15 | | $ | 10.05 | | | | 0.32 | | | | (0.39 | ) | | | (0.07 | ) | | | (0.34 | ) | | | (0.01 | ) | | | — | | |
Year Ended
12/31/14 | | $ | 10.27 | | | | 0.36 | | | | (0.12 | ) | | | 0.24 | | | | (0.35 | ) | | | (0.11 | ) | | | — | | |
(a) Per share net investment income (loss) has been calculated using the average daily shares method.
(b) Not annualized for periods less than one year.
(c) Annualized for periods less than one year.
(d) During the period, certain fees were reduced and/or reimbursed. If such fee reductions and/or reimbursements had not occurred, the ratios would have been as indicated.
(e) Portfolio turnover is calculated on the basis of the Fund as a whole without distinguishing between the classes of shares issued.
See notes to financial statements.
72
Victory Portfolios | | Financial Highlights — continued | |
For a Share Outstanding Throughout Each Period (continued)
| | | | Ratios to Average Net Assets | | Supplemental Data | |
| | | Total
Distributions
to
Shareholders | | Net Asset
Value,
End of
Period | | Total
Return
(Excludes
Sales
Charge)(b) | | Net
Expenses(c) | | Net
Investment
Income
(Loss)(c) | | Gross
Expenses(c)(d) | | Net Assets,
End of
Period
(000's) | | Portfolio
Turnover(b)(e) | |
Victory Strategic Income Fund | |
Class R | |
Six Months
Ended
6/30/19
(unaudited) | | | (0.13 | ) | | $ | 10.32 | | | | 6.74 | % | | | 1.34 | % | | | 2.55 | % | | | 1.72 | % | | $ | 2,835 | | | | 64 | % | |
Year Ended
12/31/18 | | | (0.29 | ) | | $ | 9.79 | | | | (1.15 | )% | | | 1.34 | % | | | 3.05 | % | | | 1.70 | % | | $ | 2,761 | | | | 115 | % | |
Year Ended
12/31/17 | | | (0.31 | ) | | $ | 10.20 | | | | 4.78 | % | | | 1.34 | % | | | 2.83 | % | | | 1.61 | % | | $ | 2,927 | | | | 138 | % | |
Year Ended
12/31/16 | | | (0.25 | ) | | $ | 10.04 | | | | 5.77 | % | | | 1.34 | % | | | 1.89 | % | | | 1.53 | % | | $ | 2,979 | | | | 79 | % | |
Year Ended
12/31/15 | | | (0.30 | ) | | $ | 9.73 | | | | (1.39 | )% | | | 1.34 | % | | | 2.64 | % | | | 1.58 | % | | $ | 3,338 | | | | 41 | % | |
Year Ended
12/31/14 | | | (0.40 | ) | | $ | 10.16 | | | | 1.72 | % | | | 1.31 | % | | | 2.69 | % | | | 1.57 | % | | $ | 3,661 | | | | 87 | % | |
Class Y | |
Six Months
Ended
6/30/19
(unaudited) | | | (0.16 | ) | | $ | 10.20 | | | | 7.02 | % | | | 0.74 | % | | | 3.20 | % | | | 1.09 | % | | $ | 4,886 | | | | 64 | % | |
Year Ended
12/31/18 | | | (0.35 | ) | | $ | 9.69 | | | | (0.45 | )% | | | 0.74 | % | | | 3.72 | % | | | 1.06 | % | | $ | 4,798 | | | | 115 | % | |
Year Ended
12/31/17 | | | (0.38 | ) | | $ | 10.09 | | | | 5.38 | % | | | 0.74 | % | | | 3.46 | % | | | 0.95 | % | | $ | 10,180 | | | | 138 | % | |
Year Ended
12/31/16 | | | (0.30 | ) | | $ | 9.94 | | | | 6.45 | % | | | 0.74 | % | | | 2.50 | % | | | 0.99 | % | | $ | 11,768 | | | | 79 | % | |
Year Ended
12/31/15 | | | (0.35 | ) | | $ | 9.63 | | | | (0.74 | )% | | | 0.74 | % | | | 3.24 | % | | | 0.98 | % | | $ | 13,217 | | | | 41 | % | |
Year Ended
12/31/14 | | | (0.46 | ) | | $ | 10.05 | | | | 2.34 | % | | | 0.71 | % | | | 3.28 | % | | | 0.87 | % | | $ | 18,035 | | | | 87 | % | |
See notes to financial statements.
73
Victory Portfolios | | Notes to Financial Statements
June 30, 2019 | |
(Unaudited)
1. Organization:
Victory Portfolios (the "Trust") was organized on December 6, 1995 as a Delaware statutory trust as a successor to a company named "The Victory Portfolios," which was organized as a Massachusetts business trust on February 5, 1986. The Trust is registered under the Investment Company Act of 1940, as amended (the "1940 Act"), as an open-end investment company. The Trust is comprised of 42 funds and is authorized to issue an unlimited number of shares, which are units of beneficial interest with a par value of $0.001 per share. Each Fund is classified as diversified under the 1940 Act.
The accompanying financial statements are those of the following seven Funds (collectively, the "Funds" and individually, a "Fund").
Funds (Legal Name) | | Funds (Short Name) | | Investment Share
Classes Offered | |
Victory INCORE Investment
Quality Bond Fund | | Investment Quality
Bond Fund | | Classes A, C, R and Y
| |
Victory INCORE Low Duration
Bond Fund | | Low Duration
Bond Fund | | Classes A, C, R and Y
| |
Victory High Yield Fund | | High Yield Fund | | Classes A, C, R and Y | |
Victory Tax-Exempt Fund | | Tax-Exempt Fund | | Classes A, C and Y | |
Victory High Income Municipal
Bond Fund | | High Income Municipal
Bond Fund | | Classes A, C and Y
| |
Victory Floating Rate Fund | | Floating Rate Fund | | Classes A, C, R and Y | |
Victory Strategic Income Fund | | Strategic Income Fund | | Classes A, C, R and Y | |
Each class of shares of a Fund has substantially identical rights and privileges except with respect to sales charges, fees paid under distribution plans, expenses allocable exclusively to each class of shares, voting rights on matters solely affecting a single class of shares, and the exchange privilege of each class of shares.
Under the Trust's organizational documents, its officers and trustees are indemnified against certain liabilities arising out of the performance of their duties to the Funds. In addition, in the normal course of business, the Funds enter into contracts with their vendors and others that provide for general indemnifications. The Funds' maximum exposure under these arrangements is unknown, as this would involve future claims that may be made against the Funds. However, based on experience, the Funds expect that risk of loss to be remote.
2. Significant Accounting Policies:
The following is a summary of significant accounting policies followed by the Trust in the preparation of its financial statements. The policies are in conformity with accounting principles generally accepted in the United States of America ("GAAP"). The preparation of financial statements in accordance with GAAP requires management to make estimates and assumptions that affect the reported amounts of assets and liabilities and disclosure of contingent assets and liabilities at the date of the financial statements and the reported amounts of income and expenses for the period. Actual results could differ from those estimates. The Funds follow the specialized accounting and reporting requirements under GAAP that are applicable to investment companies.
Investment Valuation:
The Funds record investments at fair value. Fair value is defined as the price that would be received to sell an asset or paid to transfer a liability in an orderly transaction between market participants at the measurement date.
The valuation techniques described below maximize the use of observable inputs and minimize the use of unobservable inputs in determining fair value. The inputs used for valuing the Funds' investments are summarized in the three broad levels listed below:
• Level 1 — quoted prices in active markets for identical securities
• Level 2 — other significant observable inputs (including quoted prices for similar securities or interest rates applicable to those securities, etc.)
74
Victory Portfolios | | Notes to Financial Statements — continued
June 30, 2019 | |
(Unaudited)
• Level 3 — significant unobservable inputs (including the Funds' own assumptions in determining the fair value of investments)
Changes in valuation techniques may result in transfers in or out of an assigned level within the disclosure hierarchy. The inputs or methodologies used for valuation techniques are not necessarily an indication of the risk associated with entering into those investments.
Portfolio securities listed or traded on securities exchanges, including American Depositary Receipts ("ADRs") and Rights, are valued at the closing price on the exchange or system where the security is principally traded, if available, or at the Nasdaq Official Closing Price. If there have been no sales for that day on the exchange or system, then a security is valued at the last available bid quotation on the exchange or system where the security is principally traded. In each of these situations, valuations are typically categorized as Level 1 in the fair value hierarchy.
Futures contracts are valued at the settlement price established each day by the board of trade or an exchange on which they are traded. These valuations are typically categorized as Level 1 in the fair value hierarchy.
Swap agreements are valued at the mean between the current bid and ask prices. These valuations are typically categorized as Level 2 in the fair value hierarchy.
Debt securities of United States ("U.S.") issuers (other than short-term investments maturing in 60 days or less), including corporate and municipal securities, are valued on the basis of bid valuations provided by dealers or an independent pricing service approved by the Trust's Board of Trustees (the "Board"). Short-term investments maturing in 60 days or less may be valued at amortized cost, which approximates market value. Under the amortized cost method, premium or discount, if any, is amortized or accreted, respectively, on a constant basis to the maturity of the security. In each of these situations, valuations are typically categorized as Level 2 in the fair value hierarchy.
Investments for which there are no such quotations, or for which quotations do not appear reliable, are valued at fair value in accordance with procedures established by and under the general supervision and responsibility of the Board. These valuations are typically categorized as Level 2 or Level 3 in the fair value hierarchy, based on the observability of inputs used to determine the fair value.
A summary of the valuations as of June 30, 2019, based upon the three levels defined above, is included in the table below while the breakdown, by category, of investments is disclosed in the Schedules of Portfolio Investments :
| | | LEVEL 1 —
Quoted Prices | | LEVEL 2 —
Other Significant
Observable Inputs | | Total | |
| | | Investments
in
Securities | | Other
Financial
Investments^ | | Investments
in
Securities | | Other
Financial
Investments^ | | Investments
in
Securities | | Other
Financial
Investments^ | |
INCORE Investment Quality
Bond Fund | |
Asset Backed Securities | | $ | — | | | $ | — | | | $ | 439,637 | | | $ | — | | | $ | 439,637 | | | $ | — | | |
Collateralized Mortgage Obligations | | | — | | | | — | | | | 580,440 | | | | — | | | | 580,440 | | | | — | | |
Corporate Bonds | | | — | | | | — | | | | 10,907,412 | | | | — | | | | 10,907,412 | | | | — | | |
Residential Mortgage Backed
Securities | | | — | | | | — | | | | 324,741 | | | | — | | | | 324,741 | | | | — | | |
U.S. Government Mortgage Backed
Agencies | | | — | | | | — | | | | 14,522,125 | | | | — | | | | 14,522,125 | | | | — | | |
U.S. Treasury Obligations | | | — | | | | — | | | | 5,455,857 | | | | — | | | | 5,455,857 | | | | — | | |
Collateral for Securities Loaned | | | 505,452 | | | | — | | | | — | | | | — | | | | 505,452 | | | | — | | |
Other Financial Instruments | |
Assets: | |
Futures Contracts | | | — | | | | 22,764 | | | | — | | | | — | | | | — | | | | 22,764 | | |
Credit Default Swap Agreements | | | — | | | | — | | | | — | | | | 41,720 | | | | — | | | | 41,720 | | |
Liabilities: | |
Futures Contracts | | | — | | | | (192 | ) | | | — | | | | — | | | | — | | | | (192 | ) | |
Total | | | 505,452 | | | | 22,572 | | | | 32,230,212 | | | | 41,720 | | | | 32,735,664 | | | | 64,292 | | |
75
Victory Portfolios | | Notes to Financial Statements — continued
June 30, 2019 | |
(Unaudited)
| | | LEVEL 1 —
Quoted Prices | | LEVEL 2 —
Other Significant
Observable Inputs | | Total | |
| | | Investments
in
Securities | | Other
Financial
Investments^ | | Investments
in
Securities | | Other
Financial
Investments^ | | Investments
in
Securities | | Other
Financial
Investments^ | |
INCORE Low Duration Bond Fund | |
Asset Backed Securities | | $ | — | | | $ | — | | | $ | 37,881,068 | | | $ | — | | | $ | 37,881,068 | | | $ | — | | |
Collateralized Mortgage Obligations | | | — | | | | — | | | | 10,524,868 | | | | — | | | | 10,524,868 | | | | — | | |
Corporate Bonds | | | — | | | | — | | | | 140,564,181 | | | | — | | | | 140,564,181 | | | | — | | |
Residential Mortgage Backed
Securities | | | — | | | | — | | | | 18,749,663 | | | | — | | | | 18,749,663 | | | | — | | |
U.S. Government Mortgage Backed
Agencies | | | — | | | | — | | | | 38,473,614 | | | | — | | | | 38,473,614 | | | | — | | |
U.S. Treasury Obligations | | | — | | | | — | | | | 31,290,811 | | | | — | | | | 31,290,811 | | | | — | | |
Collateral for Securities Loaned | | | 896,033 | | | | — | | | | — | | | | — | | | | 896,033 | | | | — | | |
Other Financial Instruments | |
| Assets: | |
Futures Contracts | | | — | | | | 744,036 | | | | — | | | | — | | | | — | | | | 744,036 | | |
Credit Default Swap Agreements | | | — | | | | — | | | | — | | | | 347,962 | | | | — | | | | 347,962 | | |
Liabilities: | |
Futures Contracts | | | — | | | | (261,453 | ) | | | — | | | | — | | | | — | | | | (261,453 | ) | |
Total | | | 896,033 | | | | 482,583 | | | | 277,484,205 | | | | 347,962 | | | | 278,380,238 | | | | 830,545 | | |
High Yield Fund | |
Common Stocks | | | 1,683,850 | | | | — | | | | — | | | | — | | | | 1,683,850 | | | | — | | |
Senior Secured Loans | | | — | | | | — | | | | 34,601,427 | | | | — | | | | 34,601,427 | | | | — | | |
Corporate Bonds | | | — | | | | — | | | | 114,915,397 | | | | — | | | | 114,915,397 | | | | — | | |
Collateral for Securities Loaned | | | 15,456,041 | | | | — | | | | — | | | | — | | | | 15,456,041 | | | | — | | |
Total | | | 17,139,891 | | | | — | | | | 149,516,824 | | | | — | | | | 166,656,715 | | | | — | | |
Tax-Exempt Fund | |
Municipal Bonds | | | — | | | | — | | | | 67,778,956 | | | | — | | | | 67,778,956 | | | | — | | |
Total | | | — | | | | — | | | | 67,778,956 | | | | — | | | | 67,778,956 | | | | — | | |
High Income Municipal Bond Fund | |
Municipal Bonds | | | — | | | | — | | | | 44,814,786 | | | | — | | | | 44,814,786 | | | | — | | |
Total | | | — | | | | — | | | | 44,814,786 | | | | — | | | | 44,814,786 | | | | — | | |
Floating Rate Fund | |
Senior Secured Loans | | | — | | | | — | | | | 493,684,421 | | | | — | | | | 493,684,421 | | | | — | | |
Corporate Bonds | | | — | | | | — | | | | 73,080,066 | | | | — | | | | 73,080,066 | | | | — | | |
Total | | | — | | | | — | | | | 566,764,487 | | | | — | | | | 566,764,487 | | | | — | | |
Strategic Income Fund | |
Asset Backed Securities | | | — | | | | — | | | | 5,016,144 | | | | — | | | | 5,016,144 | | | | — | | |
Collateralized Mortgage Obligations | | | — | | | | — | | | | 754,914 | | | | — | | | | 754,914 | | | | — | | |
Corporate Bonds | | | — | | | | — | | | | 30,030,183 | | | | — | | | | 30,030,183 | | | | — | | |
Residential Mortgage Backed
Securities | | | — | | | | — | | | | 769,762 | | | | — | | | | 769,762 | | | | — | | |
U.S. Government Mortgage Backed
Agencies | | | — | | | | — | | | | 162,014 | | | | — | | | | 162,014 | | | | — | | |
U.S. Treasury Obligations | | | — | | | | — | | | | 9,489,885 | | | | — | | | | 9,489,885 | | | | — | | |
Exchange-Traded Funds | | | 4,262,293 | | | | — | | | | — | | | | — | | | | 4,262,293 | | | | — | | |
Collateral for Securities Loaned | | | 2,565,152 | | | | — | | | | — | | | | — | | | | 2,565,152 | | | | — | | |
Other Financial Instruments | |
Assets: | |
Futures Contracts | | | — | | | | 122,744 | | | | — | | | | — | | | | — | | | | 122,744 | | |
Liabilities: | |
Futures Contracts | | | — | | | | (180,195 | ) | | | — | | | | — | | | | — | | | | (180,195 | ) | |
Total | | | 6,827,445 | | | | (57,451 | ) | | | 46,222,902 | | | | — | | | | 53,050,347 | | | | (57,451 | ) | |
^ Other Financial investments include any derivative instruments not reflected in the Schedule of Portfolio Investments as investment securities, such as futures contracts and swap agreements. These investments are generally recorded in the financial statements at the unrealized gain or loss on the investment.
76
Victory Portfolios | | Notes to Financial Statements — continued
June 30, 2019 | |
(Unaudited)
For the six months ended June 30, 2019, there were no Level 3 investments for which significant unobservable inputs were used to determine fair value.
Securities Purchased on a When-Issued Basis:
The Funds may purchase securities on a when-issued basis. When-issued securities are securities purchased for delivery beyond normal settlement periods at a stated price and/or yield, thereby involving the risk that the price and/or yield obtained may be more or less than those available in the market when delivery takes place. At the time a Fund makes the commitment to purchase a security on a when-issued basis, the Fund records the transaction and reflects the value of the security in determining net asset value. No interest accrues to the Fund until the transaction settles and payment takes place. Normally, the settlement date occurs within one month of the purchase. A segregated account is established and the Fund maintains cash and/or marketable securities at least equal in value to commitments for when-issued securities. If a Fund owns when-issued securities, these values are included in "Payable for investments purchased" on the accompanying Statements of Assets and Liabilities and segregated assets are identified in the Schedules of Portfolio Investments.
Municipal Obligations:
The values of municipal obligations can fluctuate and may be affected by adverse tax, legislative, or political changes, and by financial developments affecting municipal issuers. Payment of municipal obligations may depend on a relatively limited source of revenue, resulting in greater credit risk. Future changes in federal tax laws or the activity of an issuer may adversely affect the tax-exempt status of municipal obligations.
Mortgage- and Asset-Backed Securities:
The values of some mortgage-related or asset-backed securities may be particularly sensitive to changes in prevailing interest rates. Early repayment of principal on some mortgage-related securities may expose a Fund to a lower rate of return upon reinvestment of principal. The values of mortgage and asset-backed securities depend in part on the credit quality and adequacy of the underlying assets or collateral and may fluctuate in response to the market's perception of these factors as well as current and future repayment rates. Some mortgage-backed securities are backed by the full faith and credit of the U.S. government (e.g., mortgage-backed securities issued by the Government National Mortgage Association, commonly known as "Ginnie Mae"), while other mortgage-backed securities (e.g., mortgage-backed securities issued by the Federal National Mortgage Association and the Federal Home Loan Mortgage Corporation, commonly known as "Fannie Mae" and "Freddie Mac"), are backed only by the credit of the government entity issuing them. In addition, some mortgage-backed securities are issued by private entities and, as such, are not guaranteed by the U.S. government or any agency or instrumentality of the U.S. government.
Loans:
Floating rate loans in which a Fund invest are primarily "senior" loans. Senior floating rate loans typically hold a senior position in the capital structure of the borrower, are typically secured by specific collateral, and have a claim on the assets and/or stock of the borrower that is senior to that held by subordinated debtholders and stockholders of the borrower. While these protections may reduce risk, these investments still present significant credit risk. A significant portion of a Fund's floating rate investments may be issued in connection with highly leveraged transactions such as leveraged buyouts, leveraged recapitalization loans, and other types of acquisition financing. Obligations in these types of transactions are subject to greater credit risk (including default and bankruptcy) than many other investments and may be, or become, illiquid. See the note below regarding below investment grade securities.
A Fund may purchase second lien loans (secured loans with a claim on collateral subordinate to a senior lender's claim on such collateral), fixed rate loans, unsecured loans, and other debt obligations.
Transactions in loans often settle on a delayed basis, and a Fund may not receive the proceeds from the sale of a loan or pay for a loan purchase for a substantial period of time after entering into the transactions.
77
Victory Portfolios | | Notes to Financial Statements — continued
June 30, 2019 | |
(Unaudited)
Below Investment Grade Securities:
Certain Funds may invest in below investment grade securities (i.e. lower-quality, "junk" debt), which are subject to various risks. Lower-quality debt is considered to be speculative because it is less certain that the issuer will be able to pay interest or repay the principal than in the case of investment grade debt. These securities can involve a substantially greater risk of default than higher-rated securities, and their values can decline significantly over short periods of time. Lower-quality debt securities tend to be more sensitive to adverse news about their issuers, the market and the economy in general, than higher-quality debt securities.
The market for these securities can be less liquid, especially during periods of recession or general market decline.
Real Estate Investment Trusts ("REITS"):
The Funds may invest in REITS which report information on the source of their distributions annually. REITS are pooled investment vehicles that invest primarily in income producing real estate or real estate related loans or interests (such as mortgages). Certain distributions received from REITS during the year are recorded as realized gains or return of capital as estimated by the Funds or when such information becomes known.
Derivative Instruments:
Futures Contracts:
The Funds may enter into contracts for the future delivery of securities or foreign currencies and futures contracts based on a specific security, class of securities, foreign currency or an index, and purchase or sell options on any such futures contracts. A futures contract on a securities index is an agreement obligating either party to pay, and entitling the other party to receive, while the contract is outstanding, cash payments based on the level of a specified securities index. No physical delivery of the underlying asset is made. A Fund may enter into futures contracts in an effort to hedge against market risks. The acquisition of put and call options on futures contracts will give the Fund the right (but not the obligation), for a specified price, to sell or to purchase the underlying futures contract, upon exercise of the option, at any time during the option period. Futures transactions involve brokerage costs and require the Fund to segregate assets to cover contracts that would require it to purchase securities or currencies. A good faith margin deposit, known as initial margin, of cash or government securities with a broker or custodian is required to initiate and maintain open positions in futures contracts. Subsequent payments, known as variation margin, are made or received by the Fund based on the change in the market value of the position and are recorded as unrealized appreciation or depreciation until the contract is closed out, at which time the gain or loss is realized. A Fund may lose the expected benefit of futures transactions if interest rates, exchange rates or securities prices change in an unanticipated manner. Such unanticipated changes may also result in lower overall performance than if the Fund had not entered into any futures transactions. In addition, the value of a Fund's futures positions may not prove to be perfectly or even highly correlated with the value of its portfolio securities or foreign currencies, limiting a Fund's ability to hedge effectively against interest rate, exchange rate and/or market risk and giving rise to additional risks. There is no assurance of liquidity in the secondary market for purposes of closing out futures positions. The collateral held by the Funds is presented on the Statements of Assets and Liabilities under Deposit with broker for futures contracts.
During the six months ended June 30, 2019, the INCORE Investment Quality Bond Fund, INCORE Low Duration Bond Fund and Strategic Income Fund entered into futures contracts primarily for the strategy of hedging or other purposes, including but not limited to, providing liquidity and equitizing cash.
Credit Derivatives:
The Funds may enter into credit derivatives, including centrally-cleared credit default swaps on individual obligations or credit indices. The Funds may use these investments (i) as alternatives to direct long or short investment in a particular security or securities, (ii) to adjust a Fund's asset allocation or risk exposure, or (iii) for hedging purposes. The use by a Fund of centrally-cleared credit default swaps may have the effect of creating a short position in a security. Credit derivatives can
78
Victory Portfolios | | Notes to Financial Statements — continued
June 30, 2019 | |
(Unaudited)
create investment leverage and may create additional investment risks that may subject a Fund to greater volatility than investments in more traditional securities, as described in the Funds' Statement of Additional Information.
Centrally-cleared credit default swap ("CDS") agreements on credit indices involve one party making a stream of payments (referred to as the buyer of protection) to another party (the seller of protection) in exchange for the right to receive a specified return in the event of a write-down, principal shortfall, interest shortfall or default of all or part of the referenced entities comprising the credit index. A credit index is a basket of credit instruments or exposures designed to be representative of a specific sector of the credit market as a whole. These indices are made up of reference credits that are judged by a poll of dealers to be the most liquid entities in the CDS.
The counterparty risk for cleared swap agreements is generally lower than uncleared over-the-counter swap agreements because generally a clearing organization becomes substituted for each counterparty to a centrally cleared swap agreement and, in effect, guarantees each party's performance under the contract as each party to a trade looks only to the clearing organization for performance of financial obligations. However, there can be no assurance that the clearing organization, or its members, will satisfy its obligations to the Funds.
The Funds may enter into CDS agreements either as a buyer or seller. The Funds may buy protection under a CDS to attempt to mitigate the risk of default or credit quality deterioration in one or more individual holdings or in a segment of the fixed income securities market. The Funds may sell protection under a CDS in an attempt to gain exposure to an underlying issuer's credit quality characteristics without investing directly in that issuer. For swaps entered with an individual counterparty, the Funds bear the risk of loss of the uncollateralized amount expected to be received under a CDS agreement in the event of the default or bankruptcy of the counterparty. CDS agreements are generally valued at a price at which the counterparty to such agreement would terminate the agreement. The Funds may also enter into cleared swaps.
Upon entering into a cleared CDS, the Funds may be required to deposit with the broker an amount of cash or cash equivalents in the range of approximately 3% to 6% of the notional amount for CDS on high yield debt issuers (this amount is subject to change by the clearing organization that clears the trade). This amount, known as "initial margin," is in the nature of a performance bond or good faith deposit on the CDS and is returned to the Funds upon termination of the CDS, assuming all contractual obligations have been satisfied. Subsequent payments, known as "variation margin," to and from the broker will be made daily as the price of the CDS fluctuates, making the long and short positions in the CDS contract more or less valuable, a process known as "marking-to-market." The premium (discount) payments are built into the daily price of the CDS and thus are amortized through the variation margin. The variation margin payment also includes the daily portion of the periodic payment stream.
The maximum potential amount of future payments (undiscounted) that the Fund as a seller of protection could be required to make under a CDS agreement equals the notional amount of the agreement. Notional amounts of each individual CDS agreement outstanding as of period end for which a Fund is the seller of protection are disclosed in the Schedule of Portfolio Investments. These potential amounts would be partially offset by any recovery values of the respective referenced obligations, upfront payments received upon entering into the agreement, periodic interest payments, or net amounts received from the settlement of buy protection CDS agreements entered into by the Funds for the same referenced entity or entities. The collateral held by the Funds is presented on the Statements of Assets and Liabilities under Deposit with broker for swap agreements.
During the six months ended June 30, 2019, the INCORE Investment Quality Bond Fund and INCORE Low Duration Bond Fund entered into centrally cleared CDS agreements primarily for the strategy of asset allocation and risk exposure management.
Offsetting of Financial Assets and Derivatives Assets:
The Funds are subject to various Master Netting Arrangements, which govern the terms of certain transactions with select counterparties. The Master Netting Arrangements allow the Funds to close out and net total exposure to a counterparty in the event of a default with respect to all the transactions governed under a single agreement with a counterparty. The Master Netting Arrangements also specify collateral posting arrangements at pre-arranged exposure levels. Under the Master Netting
79
Victory Portfolios | | Notes to Financial Statements — continued
June 30, 2019 | |
(Unaudited)
Arrangements, collateral is routinely transferred if the total net exposure to certain transactions (net of existing collateral already in place) governed under the relevant Master Netting Arrangement with a counterparty in a given account exceeds a specified threshold depending on the counterparty and the type of Master Netting Arrangement.
The table below, as of June 30, 2019, discloses both gross information and net information about instruments and transactions eligible for offset in the Statements of Assets and Liabilities and instruments and transactions that are subject to an agreement similar to a master netting agreement as well as amounts related to collateral held at clearing brokers and counterparties.
| | Gross
Amounts of
Recognized
Assets | | Gross
Amounts
Available
for Offset | | Net Amounts
Presented in
the Statements
of Assets and
Liabilities | | Cash
Collateral
Received | | Net
Amount | |
INCORE Investment Quality Bond Fund | |
Futures-Goldman Sachs & Co. | | $ | 237 | | | $ | (237 | ) | | $ | — | | | $ | — | | | $ | — | | |
| | Gross
Amounts of
Recognized
Liabilities | | Gross
Amounts
Available
for Offset | | Net Amounts
Presented in
the Statements
of Assets and
Liabilities | | Cash
Collateral
Pledged* | | Net
Amount | |
INCORE Investment Quality Bond Fund | |
Futures-Goldman Sachs & Co. | | $ | 453 | | | $ | (237 | ) | | $ | 216 | | | $ | (216 | ) | | $ | — | | |
INCORE Low Duration Bond Fund | |
Futures-Goldman Sachs & Co. | | | 24,220 | | | | — | | | | 24,220 | | | | (24,220 | ) | | | — | | |
Strategic Income Fund | |
Futures-Goldman Sachs & Co. | | | 6,626 | | | | — | | | | 6,626 | | | | (6,626 | ) | | | — | | |
* Cash collateral pledged may be in excess of the amounts shown in the table. The total cash collateral pledged by each Fund is disclosed in the Statements of Assets and Liabilities.
Summary of Derivative Instruments:
The following table summarizes the fair values of derivative instruments on the Statements of Assets and Liabilities, categorized by risk exposure, as of June 30, 2019:
| | | Assets | | Liabilities | |
| | | Variation
Margin
Receivable
on Open
Futures
Contracts* | | Variation
Margin
Receivable on
Centrally
Cleared
Swap
Agreements* | | Variation
Margin
Payable
on Open
Futures
Contracts* | |
Credit Risk Exposure: | |
INCORE Investment Quality Bond Fund | | $ | — | | | $ | 41,720 | | | $ | — | | |
INCORE Low Duration Bond Fund | | | — | | | | 347,962 | | | | — | | |
Interest Rate Risk Exposure: | |
INCORE Investment Quality Bond Fund | | | 22,764 | | | | — | | | | 192 | | |
INCORE Low Duration Bond Fund | | | 744,036 | | | | — | | | | 261,453 | | |
Strategic Income Fund | | | 122,744 | | | | — | | | | 180,195 | | |
* Includes cumulative appreciation (depreciation) of futures contracts and centrally cleared swap agreements as reported on the Schedules of Portfolio Investments. Only current day's variation margin for both futures contracts and centrally cleared swap agreements are reported within the Statements of Assets and Liabilities.
80
Victory Portfolios | | Notes to Financial Statements — continued
June 30, 2019 | |
(Unaudited)
The following table presents the effect of derivative instruments on the Statements of Operations, categorized by risk exposure, for the six months ended June 30, 2019:
| | | Net Realized Gains (Losses) on
Derivatives Recognized as
a Result from Operations | | Net Change in Unrealized
Appreciation/Depreciation
on Derivatives Recognized
as a Result of Operations | |
| | | Net Realized
Gains (Losses)
from Futures
Contracts | | Net Realized
Gains (Losses)
from Swap
Agreements | | Net Change in
Unrealized
Appreciation/
Depreciation
on Futures
Contracts | | Net Change in
Unrealized
Appreciation/
Depreciation
on Swap
Agreements | |
Credit Risk Exposure: | |
INCORE Investment Quality
Bond Fund | | $ | — | | | $ | (331,102 | ) | | $ | — | | | $ | 211,527 | | |
INCORE Low Duration Bond Fund | | | — | | | | (3,124,490 | ) | | | — | | | | 2,168,929 | | |
| Strategic Income Fund | | | — | | | | — | | | | — | | | | — | | |
Interest Rate Risk Exposure: | |
INCORE Investment Quality Bond Fund | | | (100,609 | ) | | | — | | | | 73,723 | | | | — | | |
INCORE Low Duration Bond Fund | | | 462,695 | | | | — | | | | (271,198 | ) | | | — | | |
| Strategic Income Fund | | | 152,815 | | | | — | | | | (251,525 | ) | | | — | | |
All open derivative positions at period end are reflected in each respective Fund's Schedule of Portfolio Investments. The underlying face value of open derivative positions relative to each Fund's net assets at period end is generally representative of the notional amount of open positions to net assets throughout the period.
Investment Transactions and Related Income:
Changes in holdings of investments are accounted for no later than one business day following the trade date. For financial reporting purposes, however, investment transactions are accounted for on trade date on the last business day of the reporting period. Interest income is determined on the basis of coupon interest accrued using the effective interest method which adjusts, where applicable, the amortization of premiums or accretion of discounts. Dividend income is recorded on the ex-dividend date. Gains or losses realized on sales of securities are determined by comparing the identified cost of the security lot sold with the net sales proceeds.
Certain Funds may receive other income from investment in loan assignments and/or unfunded commitments, including amendment fees, consent fees, and commitment fees. These fees are recorded as income when received by the Fund. These amounts are included in Interest Income in the Statements of Operations.
Withholding taxes on interest, dividends and gains as a result of certain investments in ADRs by the Funds have been provided for in accordance with each investment's applicable country's tax rules and rates.
Securities Lending:
The Trust has entered into a Master Securities Lending Agreement ("MSLA") with Citibank, N.A. ("Citibank" or the "Agent"). Under the terms of the MSLA, the Funds may lend securities to certain broker-dealers and banks in exchange for collateral in the amount of at least 102% of the value of U.S. securities loaned or at least 105% of the value of non-U.S. securities loaned, marked-to-market daily. Any collateral shortfalls associated with increases in the valuation of the securities loaned are adjusted the next business day. The collateral can be received in the form of cash collateral and/or non-cash collateral. Non-cash collateral can include U.S. Government Securities, letters of credit and certificates of deposit. The cash collateral is invested in short-term instruments or cash equivalents, primarily open-end investment companies, as noted in the Funds' Schedules of Portfolio Investments. The Trust does not have effective control of the non-cash collateral and therefore it is not disclosed in
81
Victory Portfolios | | Notes to Financial Statements — continued
June 30, 2019 | |
(Unaudited)
the Funds' Schedules of Portfolio Investments. During the time portfolio securities are on loan, the borrower will pay the Funds any dividends or interest paid on such securities plus any fee negotiated between the parties to the lending agreement. The Funds also earn a return from the collateral. The Funds pay the Agent various fees in connection with the investment of cash collateral and fees based on the investment income received from securities lending activities. Securities lending income (net of these fees) is disclosed on the Statements of Operations. Although risk is mitigated by the collateral, the Funds could experience a delay in recovering their securities and possible loss of income or value if the borrower fails to return them.
Securities lending transactions are entered into by a Fund under the MSLA, which permits the Fund, under certain circumstances such as an event of default, to offset amounts payable by the Fund to the same counterparty against amounts receivable from the counterparty to create a net payment due to or from the Fund.
The following table is a summary of the Funds' securities lending transactions which are subject to offset under the MSLA as of June 30, 2019. These transactions are accounted for as secured borrowings with an overnight and continuous contractual maturity for cash collateral, and greater than overnight and continuous contractual maturity for non-cash collateral.
| | | Gross
Amount of
Recognized
Assets
(Value of | | Value of
Cash | | Value of Non-cash Collateral
Received by Maturity | | | |
| | | Securities
on Loan) | | Collateral
Received* | | <30 Days | | Between
30 & 90 days | | >90 Days | | Net Amount | |
INCORE Investment
Quality Bond Fund | | $ | 492,224 | | | $ | 492,224 | | | $ | — | | | $ | — | | | $ | — | | | $ | — | | |
INCORE Low Duration
Bond Fund | | | 871,253 | | | | 871,253 | | | | — | | | | — | | | | — | | | | — | | |
High Yield Fund | | | 14,936,633 | | | | 14,936,633 | | | | — | | | | — | | | | — | | | | — | | |
Strategic Income Fund | | | 2,496,876 | | | | 2,496,876 | | | | — | | | | — | | | | — | | | | — | | |
* Collateral received in excess of the market value of securities on loan is not presented in this table. The total cash collateral received by each Fund is disclosed in the Statements of Assets and Liabilities.
Foreign Currency Translations:
The accounting records of the Funds are maintained in U.S. dollars. Investment securities and other assets and liabilities of a Fund denominated in a foreign currency are translated into U.S. dollars at current exchange rates. Purchases and sales of securities, income receipts and expense payments are translated into U.S. dollars at the exchange rates on the date of the transactions. The Funds do not isolate the portion of the results of operations resulting from changes in foreign exchange rates on investments from fluctuations arising from changes in market prices of securities held. Such fluctuations are disclosed as net change in unrealized appreciation/depreciation on investments and foreign currency translations on the Statements of Operations. Any realized gains or losses from these fluctuations are disclosed as net realized gains or losses from investment securities and foreign currency translations on the Statements of Operations.
Foreign Taxes:
The Funds may be subject to foreign taxes related to foreign income received (a portion of which may be reclaimable), capital gains on the sale of securities, and certain foreign currency transactions. All foreign taxes are recorded in accordance with the applicable regulations and rates that exist in the foreign jurisdictions in which the Funds invest.
82
Victory Portfolios | | Notes to Financial Statements — continued
June 30, 2019 | |
(Unaudited)
Distributions to Shareholders:
Dividends from net investment income, if any, are declared and paid monthly for the Funds. Distributable net realized gains, if any, are declared and distributed at least annually from each Fund.
The amounts of dividends from net investment income and distributions from net realized gains (collectively distributions to shareholders) are determined in accordance with federal income tax regulations, which may differ from GAAP. To the extent these "book/tax" differences are permanent in nature (e.g., net operating loss and distribution reclassification), such amounts are reclassified within the components of net assets based on their federal tax-basis treatment; temporary differences (e.g., wash sales) do not require reclassification. To the extent dividends and distributions exceed net investment income and net realized gains for tax purposes, they are reported as distributions of capital. Net investment losses incurred by a Fund may be reclassified as an offset to capital on the accompanying Statements of Assets and Liabilities.
Federal Income Taxes:
It is the policy of each Fund to continue to qualify as a regulated investment company by complying with the provisions available to certain investment companies, as defined in applicable sections of the Internal Revenue Code, and to make distributions of net investment income and net realized gains sufficient to relieve it from all, or substantially all, federal income taxes. Accordingly, no provision for federal income taxes is required in the financial statements. The Funds have a tax year end of December 31.
Management of the Funds has reviewed tax positions taken in tax years that remain subject to examination by all major tax jurisdictions, including federal (i.e., all open tax year ends and the interim tax period since then). Management believes that there is no tax liability resulting from unrecognized tax benefits related to uncertain tax positions taken.
Allocations:
Expenses directly attributable to a Fund are charged to the Fund, while expenses which are attributable to more than one fund in the Trust, or jointly with an affiliated trust, are allocated among the respective funds in the Trust and/or affiliated trust based upon net assets or another appropriate basis.
Income, expenses (other than class-specific expenses such as transfer agent fees, state registration fees, printing and 12b-1 fees), and realized and unrealized gains or losses on investments are allocated to each class of shares based on its relative net assets on the date income is earned or expenses and realized and unrealized gains and losses are incurred.
Affiliated Securities Transactions:
Pursuant to Rule 17a-7 under the 1940 Act, the Funds may engage in securities transactions with affiliated investment companies and advisory accounts managed by the Adviser and any applicable sub-adviser. Any such purchase or sale transaction must be effected without brokerage commission or other remuneration, except for customary transfer fees. The transaction must be effected at the current market price, which is either the security's last sale price on an exchange or, if there are no transactions in the security that day, at the average of the highest bid and lowest asked price. For the six months ended June 30, 2019, the Funds did not engage in any Rule 17a-7 transactions under the 1940 Act.
Fees Paid Indirectly:
Expenses offsets to custody fees that arise from credits on cash balances maintained on deposit are reflected on the Statements of Operations, as applicable, as "Fees paid indirectly".
83
Victory Portfolios | | Notes to Financial Statements — continued
June 30, 2019 | |
(Unaudited)
3. Purchases and Sales of Securities:
Purchases and sales of securities (excluding securities maturing less than one year from acquisition) for the six months ended June 30, 2019 were as follows:
| | | Purchases
(excluding U.S.
Government
Securities) | | Sales
(excluding U.S.
Government
Securities) | | Purchases
of U.S.
Government
Securities | | Sales
of U.S.
Government
Securities | |
INCORE Investment Quality
Bond Fund | | $ | 17,157,675 | | | $ | 21,300,502 | | | $ | 8,584,399 | | | $ | 14,106,114 | | |
INCORE Low Duration Bond Fund | | | 46,077,687 | | | | 120,482,270 | | | | 19,436,666 | | | | 50,040,121 | | |
High Yield Fund | | | 127,368,317 | | | | 60,166,205 | | | | — | | | | — | | |
Tax-Exempt Fund | | | 32,787,198 | | | | 35,470,166 | | | | — | | | | — | | |
High Income Municipal Bond Fund | | | 15,536,449 | | | | 13,120,067 | | | | — | | | | — | | |
Floating Rate Fund | | | 101,309,010 | | | | 140,205,510 | | | | — | | | | — | | |
Strategic Income Fund | | | 31,457,028 | | | | 32,515,054 | | | | 2,532,969 | | | | 10,472,150 | | |
4. Fees and Transactions with Affiliates and Related Parties:
Investment advisory services are provided to the Funds by Victory Capital Management Inc. ("VCM" or the "Adviser"), a New York corporation registered as an investment adviser with the Securities and Exchange Commission ("SEC"). The Adviser is a wholly-owned indirect subsidiary of Victory Capital Holdings, Inc., a publicly traded Delaware corporation, and a wholly-owned direct subsidiary of Victory Capital Operating, LLC.
VCM has entered into a Sub-Advisory Agreement with Park Avenue Institutional Advisers LLC ("Park Avenue"). Park Avenue is responsible for providing day-to-day investment advisory services to the Funds, subject to the oversight of the Board of Trustees of the Trust. Sub-investment advisory fees are paid by VCM to Park Avenue and do not represent a separate or additional expense to the Funds.
Under the terms of the Investment Advisory Agreement, the Adviser is entitled to receive fees based on a percentage of the average daily net assets of each Fund. The rates at which the Adviser is paid by each Fund are included in the table below. The Adviser may use its resources to assist with the Funds' distribution and marketing expenses.
| | | Flat Rate | |
INCORE Investment Quality Bond Fund | | | 0.50 | % | |
INCORE Low Duration Bond Fund | | | 0.45 | % | |
High Yield Fund | | | 0.60 | % | |
Tax-Exempt Fund | | | 0.50 | % | |
High Income Municipal Bond Fund | | | 0.50 | % | |
Floating Rate Fund | | | 0.65 | % | |
Strategic Income Fund | | | 0.60 | % | |
VCM also serves as the Funds' administrator and fund accountant. Under an Administration and Fund Accounting Agreement, VCM is paid for its services an annual fee at a rate of 0.08% of the first $15 billion in average daily net assets of the Trust, Victory Variable Insurance Funds and Victory Portfolios II (collectively, the "Victory Funds Complex"), 0.05% of the average daily net assets above $15 billion to $30 billion of the Victory Funds Complex and 0.04% of the average daily net assets over $30 billion of the Victory Funds Complex.
Citi Fund Services Ohio, Inc. ("Citi"), an affiliate of Citibank, N.A., acts as sub-administrator and sub-fund accountant to the Funds pursuant to a Sub-Administration and Sub-Fund Accounting Services Agreement between VCM and Citi. VCM pays Citi a fee for providing these services. The Trust reimburses VCM and Citi for all of their reasonable out-of-pocket expenses incurred in providing these services.
FIS Investor Services, LLC ("FIS") serves as the Funds' transfer agent. Under the Transfer Agent Agreement, the Trust pays FIS a fee for its services and reimburses FIS for all of their reasonable out-of-pocket expenses incurred in providing these services.
84
Victory Portfolios | | Notes to Financial Statements — continued
June 30, 2019 | |
(Unaudited)
The Chief Compliance Officer ("CCO") is an employee of the Adviser, which pays the compensation of the CCO and his support staff. The Trust has entered into an Agreement to provide compliance services with the Adviser, pursuant to which the Adviser furnishes its compliance personnel, including the services of the CCO, and other resources reasonably necessary to provide the Trust with compliance oversight services related to the design, administration and oversight of a compliance program for the Trust in accordance with Rule 38a-1 under the 1940 Act. The funds in the Victory Funds Complex, in the aggregate, compensates the Adviser for these services.
The Victory Funds Complex pays an annual retainer to each Independent Trustee, plus an additional annual retainer to the Chairman of the Board. The aggregate amount of the fees and expenses of the Independent Trustees are allocated amongst all the funds in the Victory Funds Complex and are presented in the Statements of Operations.
Shearman & Sterling LLP provides legal services to the Trust.
Victory Capital Advisers, Inc. (the "Distributor"), an affiliate of the Adviser, serves as distributor for the continuous offering of the shares of the Funds pursuant to a Distribution Agreement between the Distributor and the Trust. Pursuant to the Distribution and Service Plans adopted in accordance with Rule 12b-1 under the 1940 Act, the Distributor may receive a monthly distribution and service fee, at an annual rate of up to 0.25% of the average daily net assets of Class A Shares, at an annual rate of up to 0.50% of the average daily net assets of Class R Shares and 1.00% of the average daily net assets of Class C Shares of the Funds. The distribution and service fees paid to the Distributor may be used by the Distributor to pay for activities primarily intended to result in the sale of Class A, Class R or Class C Shares of the Funds.
In addition, the Distributor is entitled to receive commissions on sales of the Class A Shares of the Funds. For the six months ended June 30, 2019, the Distributor received approximately $9,500 from commissions earned on sales of Class A Shares of the Funds.
The Adviser has entered into expense limitation agreements with certain Funds. Under the terms of the agreements, the Adviser has agreed to waive fees or reimburse certain expenses to the extent that ordinary operating expenses incurred by certain classes of a Fund in any fiscal year exceed the expense limit for such classes of the Fund. Such excess amounts will be the liability of the Adviser. Interest, taxes, brokerage commissions, other expenditures which are capitalized in accordance with GAAP, and other extraordinary expenses not incurred in the ordinary course of a Fund's business are excluded from the expense limits. During the six months ended June 30, 2019, the expense limits (excluding voluntary waivers) were as follows:
| | | In effect January 1, 2019 until April 30, 2020 | |
| | | Class A
Shares | | Class C
Shares | | Class R
Shares | | Class Y
Shares | |
INCORE Investment Quality Bond Fund | | | 0.90 | % | | | 1.77 | % | | | 1.30 | % | | | 0.66 | % | |
INCORE Low Duration Bond Fund | | | 0.85 | % | | | 1.62 | % | | | 1.27 | % | | | 0.62 | % | |
High Yield Fund | | | 1.00 | % | | | 1.70 | % | | | 1.35 | % | | | 0.76 | % | |
Tax-Exempt Fund | | | 0.80 | % | | | 1.60 | % | | | N/A | | | | 0.69 | % | |
| | | In effect January 1, 2019 until April 30, 2020 | |
| | | Class A
Shares | | Class C
Shares | | Class R
Shares | | Class Y
Shares | |
High Income Municipal Bond Fund | | | 0.80 | % | | | 1.57 | % | | | N/A | | | | 0.57 | % | |
Floating Rate Fund | | | 1.00 | % | | | 1.80 | % | | | 1.56 | % | | | 0.78 | % | |
Strategic Income Fund | | | 0.95 | % | | | 1.74 | % | | | 1.34 | % | | | 0.74 | % | |
The Funds have agreed to repay fees and expenses that were waived or reimbursed by the Adviser for a period up to three fiscal years after such waiver or reimbursement was made to the extent such payments or repayments would not cause the expenses of a class to exceed the original expense limitation in place at time of the waiver or reimbursement or any expense limitation agreement in place at the time of repayment. Amounts repaid to the Adviser during the six months ended, if any, are reflected on the Statements of Operations as "Recoupment of prior expenses waived/reimbursed by Adviser".
85
Victory Portfolios | | Notes to Financial Statements — continued
June 30, 2019 | |
(Unaudited)
As of June 30, 2019, the following amounts are available to be repaid to the Adviser:
| | | Expires
12/31/19 | | Expires
12/31/20 | | Expires
12/31/21 | | Expires
12/31/22 | | Total | |
INCORE Investment Quality
Bond Fund | | $ | 60,680 | | | $ | 102,291 | | | $ | 107,641 | | | $ | 59,486 | | | $ | 330,098 | | |
INCORE Low Duration Bond Fund | | | 119,520 | | | | 217,933 | | | | 110,273 | | | | 101,359 | | | | 549,085 | | |
High Yield Fund | | | 40,274 | | | | 80,774 | | | | 76,868 | | | | 43,683 | | | | 241,599 | | |
Tax-Exempt Fund | | | 70,950 | | | | 122,100 | | | | 114,539 | | | | 62,117 | | | | 369,706 | | |
High Income Municipal Bond Fund | | | 86,281 | | | | 139,397 | | | | 121,563 | | | | 58,004 | | | | 405,245 | | |
Floating Rate Fund | | | 368,104 | | | | 718,769 | | | | 765,491 | | | | 419,504 | | | | 2,271,868 | | |
Strategic Income Fund | | | 71,800 | | | | 90,313 | | | | 98,810 | | | | 48,950 | | | | 309,873 | | |
The Adviser may voluntarily waive or reimburse additional fees to assist the Funds in maintaining competitive expense ratios. Voluntary waivers and reimbursements applicable to the Funds are not available to be recouped at a future time. The Adviser voluntarily waived $45,765 for the six months ended June 30, 2019 for the INCORE Low Duration Bond Fund.
Certain officers and/or interested trustees of the Funds are also officers and/or employees of the Adviser, Administrator, Fund Accountant, Sub-Administrator, Sub-Fund Accountant, and Legal Counsel.
5. Risks:
Each Fund may be subject to other risks in addition to these identified risks.
An investment in the Funds' shares represents an indirect investment in the securities owned by the Funds, some of which will be traded on a national securities exchange or in the over-the-counter markets. The value of the securities in which the Funds invest, like other market investments, may move up or down, sometimes rapidly and unpredictably. The value of the securities in which the Funds invest may affect the value of the Funds' shares. An investment in the Funds' shares at any point in time may be worth less than the original investment, even after taking into account the reinvestment of the Funds' distributions.
The Funds will be subject to credit risk with respect to the amount each expects to receive from counterparties for financial instruments entered into by the Funds. The Funds may be negatively impacted if a counterparty becomes bankrupt or otherwise fails to perform its obligations due to financial difficulties. The Funds may experience significant delays in obtaining any recovery in bankruptcy or other reorganization proceeding and the Funds may obtain only limited recovery or may obtain no recovery in such circumstances. The Funds typically enter into transactions with counterparties whose credit ratings are investment grade, as determined by a nationally recognized statistical rating organization or, if unrated, judged by the Adviser to be of comparable quality.
The Funds will be subject to credit and interest rate risk with respect to fixed income securities. Credit risk refers to the ability of an issuer to make timely payments of interest and principal. Interest rates may rise or the rate of inflation may increase, impacting the value of investments in fixed income securities. A debt issuers' credit quality may be downgraded or an issuer may default. Interest rates may fluctuate due to changes in governmental fiscal policy initiatives and resulting market reaction to those initiatives.
6. Borrowing and Interfund Lending:
Line of Credit:
For the six months ended June 30, 2019, the Victory Funds Complex participated in a short-term, demand note "Line of Credit" agreement with Citibank. Under the agreement with Citibank, the Victory Funds Complex could borrow up to $250 million, of which $100 million was committed and $150 million was uncommitted. This agreement was in effect through July 26, 2019. Effective July 1, 2019, the current agreement was amended to include the USAA Mutual Funds Complex and has a new termination date
86
Victory Portfolios | | Notes to Financial Statements — continued
June 30, 2019 | |
(Unaudited)
of June 29, 2020. Under this amended agreement, the Victory Funds Complex and USAA Mutual Funds Complex, combined, may borrow up to $600 million, of which $300 million is committed and $300 million is uncommitted. $40 million of the Line of Credit is reserved for use by the Victory Floating Rate Fund, with that Fund paying the related commitment fees for that amount. The purpose of the agreement is to meet temporary or emergency cash needs, including redemption requests that might otherwise require the untimely disposition of securities. With the agreement in affect for the six months ended June 30, 2019, Citibank received an annual commitment fee of 0.15% on $100 million for providing the Line of Credit. For the six months ended June 30, 2019, Citibank earned approximately $76 thousand in commitment fees from the Victory Funds Complex. Effective July 1, 2019, Citibank receives an annual commitment fee of 0.15% on $300 million for providing the Line of Credit. Each fund in the Victory Funds Complex pays a pro-rata portion of the commitment fees plus any interest (one month LIBOR plus one percent) on amounts borrowed, including the USAA Mutual Funds Complex, commencing July 1, 2019. Interest charged to each Fund during the period is presented on the Statements of Operations under line of credit fees.
The Funds did not utilize the Line of Credit during the six months ended June 30, 2019
Interfund Lending:
The Trust and Adviser rely on an exemptive order granted by the SEC in March 2017 (the "Order"), permitting the establishment and operation of an Interfund Lending Facility (the "Facility"). The Facility allows each Fund to directly lend and borrow money to or from any other Victory Fund relying upon the Order at rates beneficial to both the borrowing and lending funds. Advances under the Facility are allowed for temporary or emergency purposes, including the meeting of redemption requests that otherwise might require the untimely disposition of securities, and are subject to each Fund's borrowing restrictions. The interfund loan rate is determined, as specified in the Order, by averaging the current repurchase agreement rate and the current bank loan rate. As a Borrower, interest charged to each Fund during the period is presented on the Statement of Operations under interfund lending fees. As a Lender, interest earned by each Fund during the period is presented on the Statement of Operations under Income on interfund lending.
The average borrowing and lending for the days outstanding and average interest rate for each Fund during the six months ended June 30, 2019 were as follows:
| | | Borrower or
Lender | | Amount
Outstanding at
June 30, 2019 | | Average
Borrowing* | | Days
Borrowing
Outstanding | | Average
Interest
Rate* | | Maximum
Borrowing
During the
Period | |
INCORE Low Duration
Bond Fund | | Borrower | | $ | — | | | $ | 289,000 | | | | 1 | | | | 2.98 | % | | $ | 289,000 | | |
Tax-Exempt Fund | | Borrower | | | 221,000 | | | | 240,750 | | | | 4 | | | | 2.93 | % | | | 300,000 | | |
High Income Municipal
Bond Fund | | Borrower | | | — | | | | 136,000 | | | | 1 | | | | 2.95 | % | | | 136,000 | | |
Floating Rate Fund | | Borrower | | | — | | | | 3,442,000 | | | | 1 | | | | 3.00 | % | | | 3,442,000 | | |
* For the six months ended June 30, 2019, based on the number of days borrowings were outstanding.
7. Federal Income Tax Information:
The tax character of distributions paid and the tax basis of current components of accumulated earnings (deficit) will be determined at the end of the current tax year ending December 31, 2019.
87
Victory Portfolios | | Notes to Financial Statements — continued
June 30, 2019 | |
(Unaudited)
The tax character of distributions paid during the most recent tax year ended, was as follows (total distributions paid may differ from the Statements of Changes in Net Assets because, for tax purposes, dividends are recognized when actually paid):
| | | Year Ended December 31, 2018 | |
| | | Distributions paid from | |
| | | Ordinary
Income | | Net
Long-Term
Capital Gains | | Total
Taxable
Distributions | | Tax-Exempt
Distributions | | Total
Distributions
Paid | |
INCORE Investment Quality Bond Fund | | $ | 1,009,807 | | | $ | — | | | $ | 1,009,807 | | | $ | — | | | $ | 1,009,807 | | |
INCORE Low Duration Bond Fund | | | 8,347,974 | | | | — | | | | 8,347,974 | | | | — | | | | 8,347,974 | | |
High Yield Fund | | | 4,212,512 | | | | — | | | | 4,212,512 | | | | — | | | | 4,212,512 | | |
Tax-Exempt Fund | | | 2,988 | | | | 1,051,617 | | | | 1,054,605 | | | | 2,762,067 | | | | 3,816,672 | | |
High Income Municipal Bond Fund | | | 6,002 | | | | — | | | | 6,002 | | | | 2,258,063 | | | | 2,264,065 | | |
Floating Rate Fund | | | 34,992,812 | | | | — | | | | 34,992,812 | | | | — | | | | 34,992,812 | | |
Strategic Income Fund | | | 1,686,254 | | | | — | | | | 1,686,254 | | | | — | | | | 1,686,254 | | |
As of the most recent tax year ended December 31, 2018, the components of distributable earnings/accumulated deficit on a tax basis were as follows:
| | | Undistributed
Ordinary
Income | | Undistributed
Tax Exempt
Income | | Distributions
Payable | | Accumulated
Earnings | | Accumulated
Capital and
Other
Losses | | Qualified
Late-Year
Losses* | | Unrealized
Appreciation
(Depreciation)** | | Other
Temporary
Differences | | Total
Accumulated
Earnings
(Deficit) | |
INCORE Investment
Quality Bond Fund | | $ | — | | | $ | — | | | $ | — | | | $ | — | | | $ | (1,019,493 | ) | | $ | (35,955 | ) | | $ | (466,666 | ) | | $ | — | | | $ | (1,522,114 | ) | |
INCORE Low Duration
Bond Fund | | | — | | | | — | | | | — | | | | — | | | | (30,840,950 | ) | | | (767,668 | ) | | | (3,784,645 | ) | | | — | | | | (35,393,263 | ) | |
High Yield Fund | | | 8,238 | | | | — | | | | — | | | | 8,238 | | | | (8,100,130 | ) | | | — | | | | (4,611,658 | ) | | | — | | | | (12,703,550 | ) | |
Tax-Exempt Fund | | | — | | | | — | | | | — | | | | — | | | | — | | | | (65,998 | ) | | | 1,647,128 | | | | — | | | | 1,581,130 | | |
High Income Municipal
Bond Fund | | | — | | | | 208,029 | | | | — | | | | 208,029 | | | | (262,516 | ) | | | — | | | | 404,593 | | | | (23,544 | ) | | | 326,562 | | |
Floating Rate Fund | | | 223,120 | | | | — | | | | — | | | | 223,120 | | | | (167,157,322 | ) | | | — | | | | (28,815,091 | ) | | | (23,881 | ) | | | (195,773,174 | ) | |
Strategic Income
Fund | | | — | | | | — | | | | (87,028 | ) | | | (87,028 | ) | | | (1,788,731 | ) | | | — | | | | (550,443 | ) | | | (23,544 | ) | | | (2,449,746 | ) | |
* Qualified Late-year Losses above are comprised of post-October capital losses and post-October specified losses incurred after October 31, 2018. These losses are deemed to arise on the first day of the Fund's next taxable year.
** The difference between the book-basis and tax-basis unrealized appreciation (depreciation) is attributable primarily to tax deferral of losses on wash sales.
As of the most recent tax year ended December 31, 2018, the following Funds had net capital loss carryforwards ("CLCFs") as summarized in the tables below.
| | | Short-Term
Amount | | Long-Term
Amount | | Total | |
INCORE Investment Quality Bond Fund | | $ | 371,133 | | | $ | 648,360 | | | $ | 1,019,493 | | |
INCORE Low Duration Bond Fund | | | 11,656,488 | | | | 19,184,462 | | | | 30,840,950 | | |
High Yield Fund | | | 2,393,087 | | | | 5,707,043 | | | | 8,100,130 | | |
High Income Municipal Bond Fund | | | 262,516 | | | | — | | | | 262,516 | | |
Floating Rate Fund | | | 25,973,092 | | | | 141,184,230 | | | | 167,157,322 | | |
Strategic Income Fund | | | 555,761 | | | | 1,232,970 | | | | 1,788,731 | | |
During the most recent tax year ended December 31, 2018, the High Yield Fund and High Income Municipal Bond Fund utilized $753,142 and $825,294, respectively, of CLCFs.
88
Victory Portfolios | | Notes to Financial Statements — continued
June 30, 2019 | |
(Unaudited)
At June 30, 2019, the cost basis for federal income tax purposes, gross unrealized appreciation, gross unrealized depreciation and net unrealized appreciation (depreciation) for investments and derivatives were as follows:
| | Cost of
Investments
for Federal
Tax Purposes | | Gross
Unrealized
Appreciation | | Gross
Unrealized
Depreciation | | Net
Unrealized
Appreciation
(Depreciation) | |
INCORE Investment Quality
Bond Fund | | $ | 32,113,116 | | | $ | 778,151 | | | $ | (155,603 | ) | | $ | 622,548 | | |
INCORE Low Duration Bond Fund | | | 277,645,163 | | | | 1,446,895 | | | | (711,820 | ) | | | 735,075 | | |
High Yield Fund | | | 165,458,296 | | | | 2,923,357 | | | | (1,724,938 | ) | | | 1,198,419 | | |
Tax-Exempt Fund | | | 64,003,582 | | | | 3,785,747 | | | | (10,373 | ) | | | 3,775,374 | | |
High Income Municipal Bond Fund | | | 43,178,356 | | | | 2,445,522 | | | | (809,092 | ) | | | 1,636,430 | | |
Floating Rate Fund | | | 576,465,090 | | | | 2,750,136 | | | | (12,450,739 | ) | | | (9,700,603 | ) | |
Strategic Income Fund | | | 51,155,060 | | | | 1,908,915 | | | | (13,628 | ) | | | 1,895,287 | | |
8. Capital Contribution from Prior Custodian:
During 2016, certain Funds received notification from their prior custodian, State Street Bank and Trust ("State Street"), concerning issues related to billing on certain categories of expenses during the approximately 16-year period from 1998 through October 31, 2014. The over-billing primarily related to categories of expenses that involved an allocation of general costs among multiple clients.
State Street paid the refunded amounts during January 2017. Based on billing information received during 2016 from State Street and an analysis of any expense limitation agreements that were in place during the period of the activities in question, including the application of any recoupment provisions in such agreements, the Adviser received a portion of the refund.
The portion of the refund retained by the Funds was accounted for as a capital contribution and is reflected on the Financial Highlights as "Capital Contribution from Prior Custodian, Net".
9. Fund Ownership:
Ownership of more than 25% of the voting securities of a fund creates presumptions of control of the fund, under section 2(a)(9) of the 1940 Act. As of June 30, 2019, the shareholders listed below held more than 25% of the shares outstanding of the Fund and may be deemed to control the Fund.
| | | Shareholder | | Percent | |
Strategic Income Fund | | Guardian Life Insurance | | | 70.3 | % | |
10. Recent Accounting Pronouncements:
In March 2017, the Financial Accounting Standards Board ("FASB") issued Accounting Standards Update ("ASU") No. 2017-08 "Premium Amortization on Purchased Callable Debt Securities" ("ASU 2017-08"), which shortens the premium amortization period for purchased non-contingently callable debt securities. ASU 2017-08 specifies that the premium amortization period ends at the earliest call date, for purchased non-contingently callable debt securities. The Fund has adopted and applied ASU 2017-08 on a modified retrospective basis through a cumulative-effect adjustment as of the beginning of the period of adoption.
As a result of the adoption of ASU 2017-08, as of January 1, 2019, the amortized cost basis of investments was reduced and unrealized appreciation of investment was increased by the amounts below. The adoption of ASU 2017-08 had no impact on beginning net assets, the current period results from operations, or any prior period information presented in the financial statements.
INCORE Investment Quality Bond Fund | | $ | 1,231 | | |
INCORE Low Duration Bond Fund | | | 33,823 | | |
High Yield Fund | | | 12,038 | | |
Tax-Exempt Fund | | | 227,936 | | |
89
Victory Portfolios | | Notes to Financial Statements — continued
June 30, 2019 | |
(Unaudited)
High Income Municipal Bond Fund | | $ | 117,750 | | |
Floating Rate Fund | | | 1,931 | | |
Strategic Income Fund | | | 2,055 | | |
In August 2018, the FASB issued ASU No. 2018-13, "Fair Value Measurements" ("ASU 2018-13"). This update makes certain removals from, changes to and additions to existing disclosure requirements for fair value measurements. ASU 2018-13 does not change fair value measurements already required or permitted by existing standards. ASU 2018-13 is effective for financial statements issued for fiscal years beginning after December 15, 2019, and interim periods within those fiscal years. As permitted, the Funds have early adopted ASU 2018-13 with the financial statements prepared as of June 30, 2019.
11. Subsequent Events:
The Funds have evaluated the need for additional disclosures or adjustments resulting from subsequent events through the date these financial statements were issued. Based on this evaluation, there were no subsequent events to report that would have a material impact on the Funds' financial statements.
90
Victory Portfolios | | Supplemental Information
June 30, 2019 | |
(Unaudited)
Trustee and Officer Information
Board of Trustees:
Overall responsibility for management of the Trust rests with the Board. The Trust is managed by the Board in accordance with the laws of the State of Delaware. There are currently ten Trustees, nine of whom are not "interested persons" of the Trust within the meaning of that term under the 1940 Act ("Independent Trustees") and one of whom is an "interested person" of the Trust within the meaning of that term under the 1940 Act ("Interested Trustee"). The Trustees, in turn, elect the officers of the Trust to actively supervise its day-to-day operations.
The following tables list the Trustees, their ages, position with the Trust, commencement of service, principal occupations during the past five years and any directorships of other investment companies or companies whose securities are registered under the Securities Exchange Act of 1934, as amended, or who file reports under that Act. Each Trustee oversees 42 portfolios in the Trust, nine portfolios in Victory Variable Insurance Funds and 20 portfolios in Victory Portfolios II, each a registered investment company that, together with the Trust, comprise the Victory Funds Complex. Each Trustee's address is c/o Victory Portfolios, 4900 Tiedeman Road, 4th Floor, Brooklyn, Ohio 44144. Each Trustee has an indefinite term.
Name and Age | | Position
Held with
the Trust | | Date
Commenced
Service | | Principal Occupation
During Past 5 Years | | Other
Directorships
Held During
Past 5 Years | |
Independent Trustees. | |
David Brooks Adcock, 67 | | Trustee | | May 2005 | | Consultant (since 2006). | | Chair and Trustee, Turner Funds (December 2016-December 2017). | |
Nigel D. T. Andrews, 72 | | Vice Chair and Trustee | | August 2002 | | Retired. | | Director, TCG BDC II, Inc. (since 2017); Director, TCG BDC I, Inc. (formerly Carlyle GMS Finance, Inc.) (since 2012); Director, Old Mutual US Asset Management (2002-2014). | |
E. Lee Beard, 68* | | Trustee | | May 2005 | | Retired (since 2015); Consultant, The Henlee Group, LLC (consulting) (2005-2015). | | None. | |
Dennis M. Bushe, 75 | | Trustee | | July 2016 | | Retired. | | Trustee, RS Investment Trust and RS Variable Products Trust (November 2011-July 2016). | |
91
Victory Portfolios | | Supplemental Information — continued
June 30, 2019 | |
(Unaudited)
Name and Age | | Position
Held with
the Trust | | Date
Commenced
Service | | Principal Occupation
During Past 5 Years | | Other
Directorships
Held During
Past 5 Years | |
Sally M. Dungan, 65 | | Trustee | | February 2011 | | Chief Investment Officer, Tufts University (since 2002). | | None. | |
John L. Kelly, 66 | | Trustee | | February 2015 | | Partner, McCarvill Capital Partners (September 2016-September 2017); Advisor, Endgate Commodities LLC (January 2016-April 2016); Managing Partner, Endgate Commodities LLC (August 2014-January 2016); Chief Operating Officer, Liquidnet Holdings, Inc. (December 2011-July 2014). | | Director, Caledonia Mining Corporation (since May 2012). | |
David L. Meyer, 62* | | Trustee | | December 2008 | | Retired. | | None. | |
Gloria S. Nelund, 58 | | Trustee | | July 2016 | | Chair, CEO and Co-Founder of TriLinc Global, LLC, an investment firm. | | TriLinc Global Impact Fund, LLC (since 2012); Trustee, RS Investment Trust and RS Variable Products Trust (November 2007-July 2016). | |
Leigh A. Wilson, 74 | | Chair and Trustee | | November 1994 | | Private Investor. | | Chair (since 2013), Caledonia Mining Corporation. | |
Interested Trustee. | |
David C. Brown, 47** | | Trustee | | May 2008 | | Chairman and Chief Executive Officer (since 2013), Co-Chief Executive Officer (2011-2013), the Adviser; Chairman and Chief Executive Officer, Victory Capital Holdings, Inc. (since 2013). | | None. | |
* The Board has designated Mr. Meyer and Ms. Beard as its Audit Committee Financial Experts.
** Mr. Brown is an "Interested Person" by reason of his relationship with the Adviser.
The Statement of Additional Information includes additional information about the Trustees of the Trust and is available, without charge, on the SEC's website at www.sec.gov and/or by calling 800-539-3863.
92
Victory Portfolios | | Supplemental Information — continued
June 30, 2019 | |
(Unaudited)
Officers:
The officers of the Trust, their ages, commencement of service and their principal occupations during the past five years, are detailed in the following table. Each officer serves until the earlier of his or her resignation, removal, retirement, death, or the election of a successor. The mailing address of each officer of the Trust is 4900 Tiedeman Road, 4th Floor, Brooklyn, Ohio 44144. The officers of the Trust receive no compensation directly from the Trust for performing the duties of their offices.
Name and Age | | Position with
the Trust | | Date
Commenced
Service | | Principal Occupation During Past 5 Years | |
Christopher K. Dyer, 57 | | President | | February 2006* | | Director of Fund Administration, the Adviser. | |
Scott A. Stahorsky, 50 | | Vice President | | December 2014 | | Manager, Fund Administration, the Adviser (since 2015); Senior Analyst, Fund Administration, the Adviser (prior to 2015). | |
Erin G. Wagner, 45 | | Secretary | | December 2014 | | Associate General Counsel, the Adviser (since 2013). | |
Allan Shaer, 54 | | Treasurer | | May 2017 | | Senior Vice President, Financial Administration, Citi Fund Services Ohio, Inc. (since 2016); Vice President, Mutual Fund Administration, JP Morgan Chase (2011-2016). | |
Christopher A. Ponte, 35 | | Assistant Treasurer | | December 2017 | | Manager, Fund Administration, the Adviser (since 2017); Senior Analyst, Fund Administration, the Adviser (prior to 2017); Chief Financial Officer, Victory Capital Advisers, Inc. (since 2018). | |
Colin Kinney, 45 | | Chief Compliance Officer | | July 2017 | | Chief Compliance Officer (since 2013) and Chief Risk Officer (2009-2017), the Adviser. | |
Chuck Booth, 59 | | Anti-Money Laundering Compliance Officer and Identity Theft Officer | | May 2015 | | Director, Regulatory Administration and CCO Support Services, Citi Fund Services Ohio, Inc. | |
Jay G. Baris, 65 | | Assistant Secretary | | December 1997 | | Partner, Shearman & Sterling LLP (since 2018); Partner, Morrison & Foerster LLP (2011-January 2018). | |
* On December 3, 2014, Mr. Dyer resigned as Secretary of the Trust and accepted the position of President.
93
Victory Portfolios | | Supplemental Information — continued
June 30, 2019 | |
(Unaudited)
Proxy Voting and Portfolio Holdings Information
Proxy Voting:
Information regarding the policies and procedures each Fund uses to determine how to vote proxies relating to portfolio securities is available without charge, upon request, by calling 800-539-3863. The information is also included in the Funds' Statement of Additional Information, which is available on the SEC's website at www.sec.gov.
Information relating to how the Funds voted proxies relating to portfolio securities held during the most recent twelve months ended June 30 is available on the SEC's website at www.sec.gov.
Availability of Schedules of Portfolio Investments:
The Trust files a complete list of Schedules of Portfolio Investments with the SEC for the first and third quarter of each fiscal year on Form N-PORT. Prior to the implementation of Form N-PORT, the Trust filed a complete list of Schedules of Portfolio Investments with the SEC for the first and third quarters of each fiscal year on Form N-Q. Forms N-PORT and Forms N-Q are available on the SEC's website at www.sec.gov.
Expense Examples
As a shareholder of the Funds, you may incur two types of costs: (1) transaction costs, including sales charges (loads) on purchases; and (2) ongoing costs, including management fees, distribution and service (12b-1) fees, and other Fund expenses. These examples are intended to help you understand your ongoing costs (in dollars) of investing in the Funds and to compare these costs with the ongoing costs of investing in other mutual funds.
These examples are based on an investment of $1,000 invested at the beginning of the period and held for the entire period from January 1, 2019 through June 30, 2019.
The Actual Expense figures in the table below provide information about actual account values and actual expenses. You may use the information below, together with the amount you invested, to estimate the expenses that you paid over the period. Simply divide your account value by $1,000 (for example, an $8,600 account value divided by $1,000 = 8.6), then multiply the result by the number in the table under the heading entitled "Actual Expenses Paid During Period" to estimate the expenses you paid on your account during this period.
The Hypothetical Expense figures in the table below provide information about hypothetical account values and hypothetical expenses based on each Fund's actual expense ratio and an assumed rate of return of 5% per year before expenses, which is not the Fund's actual return. The hypothetical account values and expenses may not be used to estimate the actual ending account balance or expenses you paid for the period. You may use this information to compare this 5% hypothetical example with the 5% hypothetical examples that appear in shareholder reports of other funds.
Please note the expenses shown in the table are meant to highlight your ongoing costs only and do not reflect any transactional costs. Therefore, the table is useful in comparing ongoing costs only, and will not help you determine the relative total costs of owning different funds. In addition, if these transactional costs were included, your costs would have been higher.
| | | Beginning
Account
Value
1/1/19 | | Actual
Ending
Account
Value
6/30/19 | | Hypothetical
Ending
Account
Value
6/30/19 | | Actual
Expenses
Paid
Period
1/1/19-
6/30/19* | | Hypothetical
Expenses
Paid
During
Period
1/1/19-
6/30/19* | | Annualized
Expense
Ratio
During
Period
1/1/19-
6/30/19 | |
INCORE Investment Quality Bond Fund | |
Class A Shares | | $ | 1,000.00 | | | $ | 1,048.20 | | | $ | 1,020.33 | | | $ | 4.57 | | | $ | 4.51 | | | | 0.90 | % | |
Class C Shares | | | 1,000.00 | | | | 1,043.70 | | | | 1,016.02 | | | | 8.97 | | | | 8.85 | | | | 1.77 | % | |
Class R Shares | | | 1,000.00 | | | | 1,045.90 | | | | 1,018.35 | | | | 6.59 | | | | 6.51 | | | | 1.30 | % | |
Class Y Shares | | | 1,000.00 | | | | 1,049.50 | | | | 1,021.52 | | | | 3.35 | | | | 3.31 | | | | 0.66 | % | |
94
Victory Portfolios | | Supplemental Information — continued
June 30, 2019 | |
(Unaudited)
| | | Beginning
Account
Value
1/1/19 | | Actual
Ending
Account
Value
6/30/19 | | Hypothetical
Ending
Account
Value
6/30/19 | | Actual
Expenses
Paid
Period
1/1/19-
6/30/19* | | Hypothetical
Expenses
Paid
During
Period
1/1/19-
6/30/19* | | Annualized
Expense
Ratio
During
Period
1/1/19-
6/30/19 | |
INCORE Low Duration Bond Fund | |
Class A Shares | | $ | 1,000.00 | | | $ | 1,023.00 | | | $ | 1,020.58 | | | $ | 4.26 | | | $ | 4.26 | | | | 0.85 | % | |
Class C Shares | | | 1,000.00 | | | | 1,020.20 | | | | 1,016.76 | | | | 8.11 | | | | 8.10 | | | | 1.62 | % | |
Class R Shares | | | 1,000.00 | | | | 1,021.90 | | | | 1,018.50 | | | | 6.37 | | | | 6.36 | | | | 1.27 | % | |
Class Y Shares | | | 1,000.00 | | | | 1,025.20 | | | | 1,021.72 | | | | 3.11 | | | | 3.11 | | | | 0.62 | % | |
High Yield Fund | |
Class A Shares | | | 1,000.00 | | | | 1,092.10 | | | | 1,019.84 | | | | 5.19 | | | | 5.01 | | | | 1.00 | % | |
Class C Shares | | | 1,000.00 | | | | 1,089.80 | | | | 1,016.36 | | | | 8.81 | | | | 8.50 | | | | 1.70 | % | |
Class R Shares | | | 1,000.00 | | | | 1,090.00 | | | | 1,018.20 | | | | 6.89 | | | | 6.66 | | | | 1.33 | % | |
Class Y Shares | | | 1,000.00 | | | | 1,093.80 | | | | 1,021.03 | | | | 3.95 | | | | 3.81 | | | | 0.76 | % | |
Tax-Exempt Fund | |
Class A Shares | | | 1,000.00 | | | | 1,055.30 | | | | 1,020.83 | | | | 4.08 | | | | 4.01 | | | | 0.80 | % | |
Class C Shares | | | 1,000.00 | | | | 1,051.20 | | | | 1,016.86 | | | | 8.14 | | | | 8.00 | | | | 1.60 | % | |
Class Y Shares | | | 1,000.00 | | | | 1,057.00 | | | | 1,021.37 | | | | 3.52 | | | | 3.46 | | | | 0.69 | % | |
High Income Municipal Bond Fund | |
Class A Shares | | | 1,000.00 | | | | 1,052.60 | | | | 1,020.83 | | | | 4.07 | | | | 4.01 | | | | 0.80 | % | |
Class C Shares | | | 1,000.00 | | | | 1,048.60 | | | | 1,017.01 | | | | 7.97 | | | | 7.85 | | | | 1.57 | % | |
Class Y Shares | | | 1,000.00 | | | | 1,053.80 | | | | 1,021.97 | | | | 2.90 | | | | 2.86 | | | | 0.57 | % | |
Floating Rate Fund | |
Class A Shares | | | 1,000.00 | | | | 1,059.20 | | | | 1,019.84 | | | | 5.11 | | | | 5.01 | | | | 1.00 | % | |
Class C Shares | | | 1,000.00 | | | | 1,055.10 | | | | 1,015.87 | | | | 9.17 | | | | 9.00 | | | | 1.80 | % | |
Class R Shares | | | 1,000.00 | | | | 1,056.30 | | | | 1,017.06 | | | | 7.95 | | | | 7.80 | | | | 1.56 | % | |
Class Y Shares | | | 1,000.00 | | | | 1,059.30 | | | | 1,020.93 | | | | 3.98 | | | | 3.91 | | | | 0.78 | % | |
Strategic Income Fund | |
Class A Shares | | | 1,000.00 | | | | 1,069.80 | | | | 1,020.08 | | | | 4.88 | | | | 4.76 | | | | 0.95 | % | |
Class C Shares | | | 1,000.00 | | | | 1,065.50 | | | | 1,016.17 | | | | 8.91 | | | | 8.70 | | | | 1.74 | % | |
Class R Shares | | | 1,000.00 | | | | 1,067.40 | | | | 1,018.15 | | | | 6.87 | | | | 6.71 | | | | 1.34 | % | |
Class Y Shares | | | 1,000.00 | | | | 1,070.20 | | | | 1,021.12 | | | | 3.80 | | | | 3.71 | | | | 0.74 | % | |
* Expenses are equal to the average account value multiplied by the Fund's annualized expense ratio multiplied by 181/365 (the number of days in the most recent fiscal half-year divided by the number of days in the fiscal year).
95
Privacy Policy
Protecting the Privacy of Information
The Trust respects your right to privacy. We also know that you expect us to conduct and process your business in an accurate and efficient manner. To do so, we must collect and maintain certain personal information about you. This is the information we collect from you on applications or other forms, and from the transactions you make with us or third parties. It may include your name, address, social security number, account transactions and balances, and information about investment goals and risk tolerance.
We do not disclose any information about you or about former customers to anyone except as permitted or required by law. Specifically, we may disclose the information we collect to companies that perform services on our behalf, such as the transfer agent that processes shareholder accounts and printers and mailers that assist us in the distribution of investor materials. We may also disclose this information to companies that perform marketing services on our behalf. This allows us to continue to offer you Victory investment products and services that meet your investing needs, and to effect transactions that you request or authorize. These companies will use this information only in connection with the services for which we hired them. They are not permitted to use or share this information for any other purpose.
To protect your personal information internally, we permit access only by authorized employees and maintain physical, electronic and procedural safeguards to guard your personal information.*
* You may have received communications regarding information about privacy policies from other financial institutions which gave you the opportunity to "opt-out" of certain information sharing with companies which are not affiliated with that financial institution. The Trust does not share information with other companies for purposes of marketing solicitations for products other than the Trust. Therefore, the Trust does not provide opt-out options to their shareholders.
Victory Funds
P.O. Box 182593
Columbus, Ohio 43218-2593

Visit our website at: | | Call Victory at: | |
www.vcm.com | | 800-539-FUND (800-539-3863) | |

June 30, 2019
Semi Annual Report
Victory RS Small Cap Growth Fund
Victory RS Select Growth Fund
Victory RS Mid Cap Growth Fund
Victory RS Growth Fund
Victory RS Science and Technology Fund
Victory RS Small Cap Equity Fund
Beginning on January 1, 2021, as permitted by regulations adopted by the Securities and Exchange Commission, paper copies of the Victory Funds' shareholder reports will no longer be sent by mail, unless you specifically request paper copies of the reports from the Victory Funds or from your financial intermediary, such as a broker-dealer or bank. Instead, the reports will be made available on www.VictoryFunds.com, and you will be notified by mail each time a report is posted and provided with a website link to access the report. If you already elected to receive shareholder reports electronically, you will not be affected by this change, and you need not take any action.
You may elect to receive shareholder reports and other communications from the Victory Funds or your financial intermediary electronically sooner than January 1, 2021 by notifying your financial intermediary directly or, if you are a direct investor, by calling 800-539-3863 or by sending an e-mail request to TA.Processing@FISGlobal.com.
You may elect to receive all future reports in paper free of charge. If you invest through a financial intermediary, you can contact your financial intermediary to request that you continue to receive paper copies of your reports. If you invest directly with the Victory Funds, you can call 800-539-3863 or send an e-mail request to TA.Processing@FISGlobal.com. Your election to receive reports in paper will apply to all Victory Funds you hold directly or through your financial intermediary.
www.vcm.com
News, Information And Education 24 Hours A Day, 7 Days A Week
The Victory Funds site gives fund shareholders, prospective shareholders, and investment professionals a convenient way to access fund information, get guidance, and track fund performance anywhere they can access the Internet. The site includes:
• Detailed performance records
• Daily share prices
• The latest fund news
• Investment resources to help you become a better investor
• A section dedicated to investment professionals
Whether you're a potential investor searching for the fund that matches your investment philosophy, a seasoned investor interested in planning tools, or an investment professional, www.vcm.com has what you seek. Visit us anytime. We're always open.
Table of Contents
Financial Statements | |
The Victory Growth Funds | |
Victory RS Small Cap Growth Fund | |
Investment Objectives & Portfolio Holdings | | | 3 | | |
Schedule of Portfolio Investments | | | 5 | | |
Statements of Assets and Liabilities | | | 25 | | |
Statements of Operations | | | 27 | | |
Statements of Changes in Net Assets | | | 29-31 | | |
Financial Highlights | | | 36-37 | | |
Victory RS Select Growth Fund | |
Investment Objectives & Portfolio Holdings | | | 3 | | |
Schedule of Portfolio Investments | | | 9 | | |
Statements of Assets and Liabilities | | | 25 | | |
Statements of Operations | | | 27 | | |
Statements of Changes in Net Assets | | | 29-31 | | |
Financial Highlights | | | 38-39 | | |
Victory RS Mid Cap Growth Fund | |
Investment Objectives & Portfolio Holdings | | | 3 | | |
Schedule of Portfolio Investments | | | 12 | | |
Statements of Assets and Liabilities | | | 25 | | |
Statements of Operations | | | 27 | | |
Statements of Changes in Net Assets | | | 29-31 | | |
Financial Highlights | | | 40-41 | | |
Victory RS Growth Fund | |
Investment Objectives & Portfolio Holdings | | | 3 | | |
Schedule of Portfolio Investments | | | 15 | | |
Statements of Assets and Liabilities | | | 26 | | |
Statements of Operations | | | 28 | | |
Statements of Changes in Net Assets | | | 32-34 | | |
Financial Highlights | | | 42-43 | | |
Victory RS Science and Technology Fund | |
Investment Objectives & Portfolio Holdings | | | 4 | | |
Schedule of Portfolio Investments | | | 17 | | |
Statements of Assets and Liabilities | | | 26 | | |
Statements of Operations | | | 28 | | |
Statements of Changes in Net Assets | | | 32-34 | | |
Financial Highlights | | | 44-45 | | |
Victory RS Small Cap Equity Fund | |
Investment Objectives & Portfolio Holdings | | | 4 | | |
Schedule of Portfolio Investments | | | 21 | | |
Statements of Assets and Liabilities | | | 26 | | |
Statements of Operations | | | 28 | | |
Statements of Changes in Net Assets | | | 32-34 | | |
Financial Highlights | | | 46-47 | | |
Notes to Financial Statements | | | 48 | | |
1
Table of Contents (continued)
Supplemental Information | | | 58 | | |
Trustee and Officer Information | | | 58 | | |
Proxy Voting and Portfolio Holdings Information | | | 61 | | |
Expense Examples | | | 61 | | |
Privacy Policy (inside back cover) | | | |
The Funds are distributed by Victory Capital Advisers, Inc. Victory Capital Management Inc. is the investment adviser to the Funds and receives fees from the Funds for performing services for the Funds.
This report is not authorized for distribution to prospective investors unless preceded or accompanied by a current prospectus of the Victory Funds.
For additional information about any Victory Fund, including fees, expenses, and risks, view our prospectus online at www.vcm.com or call 800-539-3863. Read it carefully before you invest or send money.
The information in this semi annual report is based on data obtained from recognized services and sources and is believed to be reliable. Any opinions, projections, or recommendations in this report are subject to change without notice and are not intended as individual investment advice. Past investment performance of the Funds, markets or securities mentioned herein should not be considered to be indicative of future results.
• NOT FDIC INSURED • NO BANK GUARANTEE • MAY LOSE VALUE

Call Victory at:
800-539-FUND (800-539-3863)
Visit our website at:
www.vcm.com
2
Victory Portfolios | | June 30, 2019 | |
(Unaudited)
Investment Objectives & Portfolio Holdings:
Victory RS Small Cap Growth Fund
The Fund seeks to provide long-term capital growth. | |
Portfolio Holdings
As a Percentage of Total Investments

Victory RS Select Growth Fund
The Fund seeks to provide long-term capital growth. | |
Portfolio Holdings
As a Percentage of Total Investments
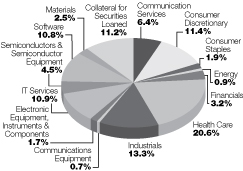
Victory RS Mid Cap Growth Fund
The Fund seeks to provide long-term capital growth.
Portfolio Holdings
As a Percentage of Total Investments
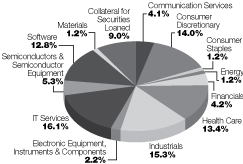
Victory RS Growth Fund
The Fund seeks to provide long-term capital growth.
Portfolio Holdings
As a Percentage of Total Investments
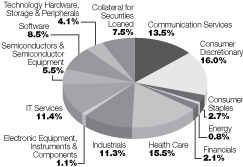
3
Victory Portfolios | | June 30, 2019 | |
(Unaudited)
Investment Objectives & Portfolio Holdings: (continued)
Victory RS Science and Technology Fund
The Fund seeks to provide long-term capital growth. | |
Portfolio Holdings
As a Percentage of Total Investments

Victory RS Small Cap Equity Fund
The Fund seeks to provide long-term capital growth. | |
Portfolio Holdings
As a Percentage of Total Investments
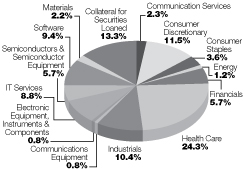
4
Victory Portfolios
Victory RS Small Cap Growth Fund | | Schedule of Portfolio Investments
June 30, 2019 | |
(Unaudited)
Security Description | | Shares | | Value | |
Common Stocks (98.3%) | |
Biotechnology (17.6%): | |
Aimmune Therapeutics, Inc. (a) (b) | | | 591,930 | | | $ | 12,323,983 | | |
Amicus Therapeutics, Inc. (a) (b) | | | 2,029,995 | | | | 25,334,338 | | |
Apellis Pharmaceuticals, Inc. (a) | | | 886,460 | | | | 22,462,896 | | |
Arena Pharmaceuticals, Inc. (a) (b) | | | 389,540 | | | | 22,838,730 | | |
Ascendis Pharma A/S, ADR (a) | | | 187,150 | | | | 21,550,323 | | |
Audentes Therapeutics, Inc. (a) | | | 492,627 | | | | 18,650,858 | | |
Bluebird Bio, Inc. (a) (b) | | | 159,079 | | | | 20,234,849 | | |
Blueprint Medicines Corp. (a) (b) | | | 268,778 | | | | 25,353,829 | | |
Bridgebio Pharma, Inc. (a) | | | 339,960 | | | | 9,168,721 | | |
Celyad SA, ADR (a) (b) (c) | | | 367,271 | | | | 4,212,598 | | |
Cytomx Therapeutics, Inc. (a) | | | 1,031,320 | | | | 11,571,410 | | |
Epizyme, Inc. (a) (b) | | | 910,500 | | | | 11,426,775 | | |
Equillium, Inc. (a) (b) (c) | | | 666,250 | | | | 3,770,975 | | |
Fate Therapeutics, Inc. (a) | | | 1,469,710 | | | | 29,835,114 | | |
Gossamer Bio, Inc. (a) | | | 540,830 | | | | 11,995,609 | | |
Invitae Corp. (a) | | | 1,131,430 | | | | 26,588,605 | | |
Iovance Biotherapeutics, Inc. (a) (b) | | | 1,104,045 | | | | 27,071,183 | | |
Kura Oncology, Inc. (a) | | | 1,016,100 | | | | 20,007,009 | | |
Ligand Pharmaceuticals, Inc., Class B (a) (b) | | | 170,935 | | | | 19,512,230 | | |
Mirati Therapeutics, Inc. (a) (b) | | | 137,790 | | | | 14,192,370 | | |
Myovant Sciences Ltd. (a) | | | 1,199,460 | | | | 10,855,113 | | |
Sage Therapeutics, Inc. (a) (b) | | | 108,800 | | | | 19,920,192 | | |
| | | | 388,877,710 | | |
Communication Services (2.6%): | |
Bandwidth, Inc., Class A (a) (b) | | | 350,210 | | | | 26,272,754 | | |
QuinStreet, Inc. (a) (b) | | | 1,376,420 | | | | 21,816,257 | | |
Yelp, Inc. (a) | | | 264,960 | | | | 9,056,333 | | |
| | | | 57,145,344 | | |
Communications Equipment (1.0%): | |
Acacia Communications, Inc. (a) | | | 447,520 | | | | 21,105,043 | | |
Consumer Discretionary (13.2%): | |
Arco Platform Ltd., ADR, Class A (a) (b) | | | 514,780 | | | | 22,537,068 | | |
Dineequity, Inc. (b) | | | 447,720 | | | | 42,743,828 | | |
Eldorado Resorts, Inc. (a) (b) | | | 479,080 | | | | 22,071,216 | | |
G-III Apparel Group Ltd. (a) (b) | | | 611,050 | | | | 17,977,091 | | |
Grand Canyon Education, Inc. (a) (b) | | | 117,254 | | | | 13,721,063 | | |
Monro Muffler Brake, Inc. (b) | | | 357,490 | | | | 30,493,897 | | |
Ollie's Bargain Outlet Holdings, Inc. (a) | | | 190,936 | | | | 16,632,435 | | |
Planet Fitness, Inc., Class A (a) | | | 318,450 | | | | 23,068,518 | | |
Red Rock Resorts, Inc., Class A | | | 787,500 | | | | 16,915,500 | | |
Shake Shack, Inc., Class A (a) (b) | | | 315,190 | | | | 22,756,718 | | |
Steven Madden Ltd. | | | 681,807 | | | | 23,147,348 | | |
Strategic Education, Inc. (b) | | | 203,430 | | | | 36,210,540 | | |
| | | | 288,275,222 | | |
See notes to financial statements.
5
Victory Portfolios
Victory RS Small Cap Growth Fund | | Schedule of Portfolio Investments — continued
June 30, 2019 | |
(Unaudited)
Security Description | | Shares | | Value | |
Consumer Staples (4.1%): | |
BJ's Wholesale Club Holdings, Inc. (a) | | | 1,118,840 | | | $ | 29,537,376 | | |
Freshpet, Inc. (a) (b) | | | 348,210 | | | | 15,847,037 | | |
Nomad Foods Ltd., ADR (a) | | | 2,141,360 | | | | 45,739,450 | | |
| | | | 91,123,863 | | |
Electronic Equipment, Instruments & Components (0.9%): | |
Littelfuse, Inc. | | | 118,246 | | | | 20,918,900 | | |
Energy (1.4%): | |
Matador Resources Co. (a) (b) | | | 535,920 | | | | 10,654,090 | | |
Newpark Resources, Inc. (a) (b) | | | 2,713,960 | | | | 20,137,583 | | |
| | | | 30,791,673 | | |
Financials (6.5%): | |
eHealth, Inc. (a) | | | 286,720 | | | | 24,686,592 | | |
Essent Group Ltd. (a) | | | 421,240 | | | | 19,794,068 | | |
Firstcash, Inc. (b) | | | 350,020 | | | | 35,009,000 | | |
Kemper Corp. | | | 451,790 | | | | 38,984,959 | | |
LendingTree, Inc. (a) (b) | | | 49,900 | | | | 20,959,497 | | |
Primerica, Inc. | | | 34,979 | | | | 4,195,731 | | |
| | | | 143,629,847 | | |
Health Care Equipment & Supplies (5.9%): | |
Cryoport, Inc. (a) (b) | | | 610,580 | | | | 11,185,826 | | |
Glaukos Corp. (a) | | | 249,630 | | | | 18,822,102 | | |
Insulet Corp. (a) (b) | | | 239,760 | | | | 28,622,549 | | |
Irhythm Technologies, Inc. (a) (b) | | | 167,020 | | | | 13,207,942 | | |
Masimo Corp. (a) | | | 270,340 | | | | 40,231,998 | | |
Penumbra, Inc. (a) (b) | | | 113,830 | | | | 18,212,800 | | |
Silk Road Medical, Inc. (a) (b) | | | 10,500 | | | | 508,830 | | |
| | | | 130,792,047 | | |
Health Care Providers & Services (2.2%): | |
Hanger, Inc. (a) | | | 746,000 | | | | 14,285,900 | | |
HealthEquity, Inc. (a) | | | 171,090 | | | | 11,189,286 | | |
LHC Group, Inc. (a) | | | 195,800 | | | | 23,413,764 | | |
| | | | 48,888,950 | | |
Health Care Technology (0.3%): | |
Inspire Medical System, Inc. (a) (b) | | | 114,140 | | | | 6,922,591 | | |
Industrials (11.9%): | |
Advanced Disposal Services, Inc. (a) | | | 479,630 | | | | 15,304,993 | | |
Altra Industrial Motion Corp. | | | 478,040 | | | | 17,152,075 | | |
Armstrong World Industries, Inc. | | | 112,050 | | | | 10,891,260 | | |
Axon Enterprise, Inc. (a) (b) | | | 467,480 | | | | 30,016,891 | | |
Azul SA, ADR (a) (b) | | | 584,440 | | | | 19,543,674 | | |
Generac Holdings, Inc. (a) (b) | | | 278,470 | | | | 19,328,603 | | |
Harsco Corp. (a) | | | 1,333,760 | | | | 36,598,375 | | |
Proto Labs, Inc. (a) (b) | | | 121,460 | | | | 14,091,789 | | |
Simpson Manufacturing Co., Inc. (b) | | | 327,350 | | | | 21,755,681 | | |
Siteone Landscape Supply, Inc. (a) (b) | | | 526,810 | | | | 36,507,933 | | |
See notes to financial statements.
6
Victory Portfolios
Victory RS Small Cap Growth Fund | | Schedule of Portfolio Investments — continued
June 30, 2019 | |
(Unaudited)
Security Description | | Shares | | Value | |
Trex Co., Inc. (a) (b) | | | 303,450 | | | $ | 21,757,365 | | |
Watts Water Technologies, Inc., Class A | | | 164,660 | | | | 15,343,019 | | |
| | | | 258,291,658 | | |
IT Services (10.0%): | |
Euronet Worldwide, Inc. (a) | | | 326,826 | | | | 54,985,206 | | |
Evo Payments, Inc. (a) (b) | | | 826,710 | | | | 26,066,166 | | |
InterXion Holding NV, ADR (a) | | | 614,533 | | | | 46,759,816 | | |
Liveramp Holdings, Inc. (a) | | | 369,060 | | | | 17,892,029 | | |
Wix.com Ltd., ADR (a) | | | 351,350 | | | | 49,926,835 | | |
WNS Holdings Ltd., ADR (a) | | | 412,627 | | | | 24,427,518 | | |
| | | | 220,057,570 | | |
Materials (2.5%): | |
Ashland Global Holdings, Inc. | | | 376,490 | | | | 30,107,905 | | |
Ingevity Corp. (a) (b) | | | 232,250 | | | | 24,425,733 | | |
| | | | 54,533,638 | | |
Pharmaceuticals (1.3%): | |
GW Pharmaceuticals PLC, ADR (a) (b) | | | 168,867 | | | | 29,110,982 | | |
Semiconductors & Semiconductor Equipment (6.4%): | |
Advanced Energy Industries, Inc. (a) | | | 320,780 | | | | 18,050,291 | | |
Cabot Microelectronics Corp. | | | 255,670 | | | | 28,144,154 | | |
Inphi Corp. (a) (b) | | | 554,840 | | | | 27,797,484 | | |
MKS Instruments, Inc. (b) | | | 228,590 | | | | 17,804,875 | | |
Monolithic Power Systems, Inc. (b) | | | 171,471 | | | | 23,282,332 | | |
Silicon Laboratories, Inc. (a) (b) | | | 269,440 | | | | 27,860,096 | | |
| | | | 142,939,232 | | |
Software (10.5%): | |
ACI Worldwide, Inc. (a) | | | 811,980 | | | | 27,883,393 | | |
Cornerstone OnDemand, Inc. (a) | | | 760,828 | | | | 44,074,766 | | |
Coupa Software, Inc. (a) (b) | | | 400,590 | | | | 50,718,698 | | |
Envestnet, Inc. (a) (b) | | | 324,356 | | | | 22,176,220 | | |
Everbridge, Inc. (a) (b) | | | 314,740 | | | | 28,144,051 | | |
Q2 Holdings, Inc. (a) (b) | | | 214,160 | | | | 16,353,258 | | |
RingCentral, Inc., Class A (a) (b) | | | 390,148 | | | | 44,835,808 | | |
| | | 234,186,194 | | |
Total Common Stocks (Cost $1,608,082,325) | | | 2,167,590,464 | | |
Collateral for Securities Loaned^ (16.2%) | |
BlackRock Liquidity Funds TempFund Portfolio, Institutional Class,
2.43% (d) | | | 74,542,194 | | | | 74,542,194 | | |
Fidelity Investments Money Market Government Portfolio, Class I,
2.28% (d) | | | 96,018,884 | | | | 96,018,884 | | |
Fidelity Investments Prime Money Market Portfolio, Class I, 2.39% (d) | | | 2,493,597 | | | | 2,493,597 | | |
Goldman Sachs Financial Square Prime Obligations Fund, Institutional
Class, 2.48% (d) | | | 40,992,745 | | | | 40,992,745 | | |
JPMorgan Prime Money Market Fund, Capital Class, 2.41% (d) | | | 55,897,956 | | | | 55,897,956 | | |
See notes to financial statements.
7
Victory Portfolios
Victory RS Small Cap Growth Fund | | Schedule of Portfolio Investments — continued
June 30, 2019 | |
(Unaudited)
Security Description | | Shares | | Value | |
Morgan Stanley Institutional Liquidity Prime Portfolio, Institutional Class,
2.42% (d) | | | 86,955,548 | | | $ | 86,955,548 | | |
Total Collateral for Securities Loaned (Cost $356,900,924) | | | 356,900,924 | | |
Total Investments (Cost $1,964,983,249) — 114.5% | | | 2,524,491,388 | | |
Liabilities in excess of other assets — (14.5)% | | | (319,820,045 | ) | |
NET ASSETS — 100.00% | | $ | 2,204,671,343 | | |
^ Purchased with cash collateral from securities on loan.
(a) Non-income producing security.
(b) All or a portion of this security is on loan.
(c) The Fund's Adviser has deemed this security to be illiquid based upon procedures approved by the Board of Trustees. As of June 30, 2019, illiquid securities were 0.4% of the Fund's net assets.
(d) Rate disclosed is the daily yield on June 30, 2019.
ADR — American Depositary Receipt
PLC — Public Limited Company
See notes to financial statements.
8
Victory Portfolios
Victory RS Select Growth Fund | | Schedule of Portfolio Investments
June 30, 2019 | |
(Unaudited)
Security Description | | Shares | | Value | |
Common Stocks (98.2%) | |
Communication Services (7.1%): | |
Boingo Wireless, Inc. (a) (b) | | | 290,600 | | | $ | 5,222,082 | | |
InterActive Corp. (a) | | | 14,610 | | | | 3,178,113 | | |
Live Nation Entertainment, Inc. (a) | | | 79,820 | | | | 5,288,075 | | |
Take-Two Interactive Software, Inc. (a) | | | 25,350 | | | | 2,877,986 | | |
Yelp, Inc. (a) | | | 39,070 | | | | 1,335,413 | | |
| | | | 17,901,669 | | |
Communications Equipment (0.8%): | |
Viavi Solutions, Inc. (a) (b) | | | 146,490 | | | | 1,946,852 | | |
Consumer Discretionary (12.7%): | |
Bright Horizons Family Solutions, Inc. (a) | | | 38,980 | | | | 5,880,913 | | |
Burlington Stores, Inc. (a) | | | 26,530 | | | | 4,514,080 | | |
Domino's Pizza, Inc. | | | 18,780 | | | | 5,226,098 | | |
PVH Corp. | | | 21,540 | | | | 2,038,546 | | |
Shake Shack, Inc., Class A (a) (b) | | | 51,280 | | | | 3,702,416 | | |
Strategic Education, Inc. (b) | | | 33,730 | | | | 6,003,940 | | |
Vail Resorts, Inc. | | | 21,660 | | | | 4,834,079 | | |
| | | | 32,200,072 | | |
Consumer Staples (2.1%): | |
Hostess Brands, Inc. (a) (b) | | | 331,490 | | | | 4,786,715 | | |
Post Holdings, Inc. (a) | | | 6,610 | | | | 687,242 | | |
| | | | 5,473,957 | | |
Electronic Equipment, Instruments & Components (1.9%): | |
Littelfuse, Inc. | | | 18,041 | | | | 3,191,633 | | |
Rogers Corp. (a) | | | 9,400 | | | | 1,622,252 | | |
| | | | 4,813,885 | | |
Energy (1.0%): | |
Diamondback Energy, Inc. | | | 22,876 | | | | 2,492,798 | | |
Financials (3.5%): | |
Firstcash, Inc. (b) | | | 51,720 | | | | 5,173,034 | | |
LendingTree, Inc. (a) (b) | | | 9,220 | | | | 3,872,677 | | |
| | | | 9,045,711 | | |
Health Care (22.9%): | |
Dexcom, Inc. (a) | | | 27,900 | | | | 4,180,536 | | |
Exact Sciences Corp. (a) | | | 64,580 | | | | 7,623,023 | | |
GW Pharmaceuticals PLC, ADR (a) (b) | | | 42,750 | | | | 7,369,673 | | |
HealthEquity, Inc. (a) | | | 37,770 | | | | 2,470,158 | | |
Horizon Therapeutics PLC (a) | | | 140,250 | | | | 3,374,415 | | |
LHC Group, Inc. (a) | | | 29,210 | | | | 3,492,932 | | |
Ligand Pharmaceuticals, Inc., Class B (a) (b) | | | 48,160 | | | | 5,497,464 | | |
Masimo Corp. (a) | | | 29,610 | | | | 4,406,560 | | |
Neurocrine Biosciences, Inc. (a) | | | 45,700 | | | | 3,858,451 | | |
The Cooper Co., Inc. | | | 18,050 | | | | 6,080,865 | | |
Veeva Systems, Inc., Class A (a) | | | 38,520 | | | | 6,244,477 | | |
West Pharmaceutical Services, Inc. | | | 30,016 | | | | 3,756,502 | | |
| | | | 58,355,056 | | |
See notes to financial statements.
9
Victory Portfolios
Victory RS Select Growth Fund | | Schedule of Portfolio Investments — continued
June 30, 2019 | |
(Unaudited)
Security Description | | Shares | | Value | |
Industrials (14.5%): | |
Armstrong World Industries, Inc. | | | 19,680 | | | $ | 1,912,896 | | |
Azul SA, ADR (a) (b) | | | 100,830 | | | | 3,371,755 | | |
Clean Harbors, Inc. (a) | | | 66,050 | | | | 4,696,155 | | |
Forward Air Corp. | | | 61,320 | | | | 3,627,078 | | |
HEICO Corp., Class A | | | 45,363 | | | | 4,689,173 | | |
Hexcel Corp. | | | 51,492 | | | | 4,164,673 | | |
IDEX Corp. | | | 10,890 | | | | 1,874,605 | | |
Siteone Landscape Supply, Inc. (a) (b) | | | 65,370 | | | | 4,530,141 | | |
Teledyne Technologies, Inc. (a) | | | 17,140 | | | | 4,694,132 | | |
Trex Co., Inc. (a) (b) | | | 52,520 | | | | 3,765,684 | | |
| | | | 37,326,292 | | |
IT Services (12.2%): | |
Black Knight, Inc. (a) (b) | | | 118,629 | | | | 7,135,534 | | |
Euronet Worldwide, Inc. (a) | | | 59,902 | | | | 10,077,912 | | |
GoDaddy, Inc., Class A (a) | | | 67,907 | | | | 4,763,676 | | |
InterXion Holding NV, ADR (a) | | | 72,110 | | | | 5,486,850 | | |
WEX, Inc. (a) | | | 16,090 | | | | 3,348,329 | | |
| | | | 30,812,301 | | |
Materials (2.7%): | |
Ashland Global Holdings, Inc. | | | 55,310 | | | | 4,423,141 | | |
Berry Global Group, Inc. (a) | | | 50,690 | | | | 2,665,787 | | |
| | | | 7,088,928 | | |
Semiconductors & Semiconductor Equipment (4.9%): | |
Cree, Inc. (a) (b) | | | 38,500 | | | | 2,162,930 | | |
MKS Instruments, Inc. | | | 34,890 | | | | 2,717,582 | | |
Monolithic Power Systems, Inc. (b) | | | 34,595 | | | | 4,697,309 | | |
Silicon Laboratories, Inc. (a) (b) | | | 28,750 | | | | 2,972,750 | | |
| | | | 12,550,571 | | |
Software (11.9%): | |
ACI Worldwide, Inc. (a) | | | 138,630 | | | | 4,760,554 | | |
Coupa Software, Inc. (a) | | | 25,270 | | | | 3,199,435 | | |
Docusign, Inc. (a) (b) | | | 82,800 | | | | 4,115,988 | | |
Fair Isaac Corp. (a) | | | 14,270 | | | | 4,481,065 | | |
Paycom Software, Inc. (a) | | | 25,095 | | | | 5,689,538 | | |
RingCentral, Inc., Class A (a) | | | 67,610 | | | | 7,769,741 | | |
| | | | 30,016,321 | | |
Total Common Stocks (Cost $174,404,625) | | | 250,024,413 | | |
Collateral for Securities Loaned^ (12.4%) | |
BlackRock Liquidity Funds TempFund Portfolio, Institutional Class, 2.43% (c) | | | 6,607,285 | | | | 6,607,285 | | |
Fidelity Investments Money Market Government Portfolio, Class I, 2.28% (c) | | | 8,510,939 | | | | 8,510,939 | | |
Fidelity Investments Prime Money Market Portfolio, Class I, 2.39% (c) | | | 221,028 | | | | 221,028 | | |
Goldman Sachs Financial Square Prime Obligations Fund, Institutional
Class, 2.48% (c) | | | 3,633,523 | | | | 3,633,523 | | |
See notes to financial statements.
10
Victory Portfolios
Victory RS Select Growth Fund | | Schedule of Portfolio Investments — continued
June 30, 2019 | |
(Unaudited)
Security Description | | Shares | | Value | |
JPMorgan Prime Money Market Fund, Capital Class, 2.41% (c) | | | 4,954,693 | | | $ | 4,954,693 | | |
Morgan Stanley Institutional Liquidity Prime Portfolio, Institutional Class,
2.42% (c) | | | 7,707,582 | | | | 7,707,582 | | |
Total Collateral for Securities Loaned (Cost $31,635,050) | | | 31,635,050 | | |
Total Investments (Cost $206,039,675) — 110.6% | | | 281,659,463 | | |
Liabilities in excess of other assets — (10.6)% | | | (27,054,961 | ) | |
NET ASSETS — 100.00% | | $ | 254,604,502 | | |
^ Purchased with cash collateral from securities on loan.
(a) Non-income producing security.
(b) All or a portion of this security is on loan.
(c) Rate disclosed is the daily yield on June 30, 2019.
ADR — American Depositary Receipt
PLC — Public Limited Company
See notes to financial statements.
11
Victory Portfolios
Victory RS Mid Cap Growth Fund | | Schedule of Portfolio Investments
June 30, 2019 | |
(Unaudited)
Security Description | | Shares | | Value | |
Common Stocks (98.1%) | |
Communication Services (4.4%): | |
InterActive Corp. (a) | | | 35,980 | | | $ | 7,826,729 | | |
Live Nation Entertainment, Inc. (a) | | | 141,510 | | | | 9,375,038 | | |
Take-Two Interactive Software, Inc. (a) | | | 53,870 | | | | 6,115,861 | | |
| | | | 23,317,628 | | |
Consumer Discretionary (15.2%): | |
Burlington Stores, Inc. (a) | | | 36,590 | | | | 6,225,789 | | |
Domino's Pizza, Inc. | | | 32,080 | | | | 8,927,222 | | |
Ferrari NV, ADR (b) | | | 39,290 | | | | 6,342,192 | | |
Grand Canyon Education, Inc. (a) | | | 57,460 | | | | 6,723,969 | | |
Hasbro, Inc. | | | 65,620 | | | | 6,934,722 | | |
Hilton Worldwide Holdings, Inc. | | | 72,820 | | | | 7,117,427 | | |
O'Reilly Automotive, Inc. (a) | | | 24,360 | | | | 8,996,634 | | |
PVH Corp. | | | 44,440 | | | | 4,205,802 | | |
Tractor Supply Co. | | | 45,560 | | | | 4,956,928 | | |
Ulta Salon, Cosmetics & Fragrance, Inc. (a) | | | 15,050 | | | | 5,220,695 | | |
Under Armour, Inc., Class C (a) | | | 310,650 | | | | 6,896,430 | | |
Vail Resorts, Inc. | | | 35,250 | | | | 7,867,095 | | |
| | | | 80,414,905 | | |
Consumer Staples (1.3%): | |
Post Holdings, Inc. (a) | | | 13,700 | | | | 1,424,389 | | |
Tyson Foods, Inc., Class A (b) | | | 64,700 | | | | 5,223,878 | | |
| | | | 6,648,267 | | |
Electronic Equipment, Instruments & Components (2.4%): | |
Amphenol Corp., Class A | | | 61,300 | | | | 5,881,122 | | |
Trimble Navigation Ltd. (a) | | | 147,050 | | | | 6,633,426 | | |
| | | | 12,514,548 | | |
Energy (1.3%): | |
Concho Resources, Inc. | | | 25,905 | | | | 2,672,878 | | |
Diamondback Energy, Inc. | | | 37,400 | | | | 4,075,478 | | |
| | | | 6,748,356 | | |
Financials (4.6%): | |
Kemper Corp. | | | 124,190 | | | | 10,716,355 | | |
LendingTree, Inc. (a) (b) | | | 12,060 | | | | 5,065,562 | | |
SVB Financial Group (a) | | | 11,470 | | | | 2,576,047 | | |
The Progressive Corp. | | | 71,740 | | | | 5,734,178 | | |
| | | | 24,092,142 | | |
Health Care (14.2%): | |
Align Technology, Inc. (a) | | | 17,340 | | | | 4,745,958 | | |
Bluebird Bio, Inc. (a) (b) | | | 58,480 | | | | 7,438,656 | | |
Dexcom, Inc. (a) | | | 44,980 | | | | 6,739,803 | | |
Exact Sciences Corp. (a) (b) | | | 92,590 | | | | 10,929,323 | | |
GW Pharmaceuticals PLC, ADR (a) (b) | | | 29,220 | | | | 5,037,236 | | |
Intuitive Surgical, Inc. (a) | | | 10,320 | | | | 5,413,356 | | |
IQVIA Holdings, Inc. (a) | | | 64,190 | | | | 10,328,171 | | |
See notes to financial statements.
12
Victory Portfolios
Victory RS Mid Cap Growth Fund | | Schedule of Portfolio Investments — continued
June 30, 2019 | |
(Unaudited)
Security Description | | Shares | | Value | |
Sage Therapeutics, Inc. (a) (b) | | | 34,430 | | | $ | 6,303,789 | | |
The Cooper Co., Inc. | | | 30,670 | | | | 10,332,417 | | |
WellCare Health Plans, Inc. (a) | | | 31,470 | | | | 8,971,153 | | |
| | | | 76,239,862 | | |
Industrials (16.5%): | |
AMETEK, Inc. | | | 66,310 | | | | 6,023,600 | | |
Clean Harbors, Inc. (a) | | | 121,230 | | | | 8,619,453 | | |
HEICO Corp., Class A (b) | | | 94,300 | | | | 9,747,791 | | |
Hexcel Corp. | | | 104,380 | | | | 8,442,254 | | |
IDEX Corp. | | | 22,490 | | | | 3,871,429 | | |
IHS Markit Ltd. (a) | | | 87,330 | | | | 5,564,668 | | |
Ingersoll-Rand PLC | | | 70,990 | | | | 8,992,303 | | |
Rockwell Automation, Inc. | | | 36,530 | | | | 5,984,710 | | |
Roper Technologies, Inc. | | | 21,790 | | | | 7,980,805 | | |
Spirit Airlines, Inc. (a) | | | 72,390 | | | | 3,455,175 | | |
Teledyne Technologies, Inc. (a) | | | 31,810 | | | | 8,711,805 | | |
Verisk Analytics, Inc., Class A | | | 38,540 | | | | 5,644,568 | | |
Woodward, Inc. | | | 36,350 | | | | 4,113,366 | | |
| | | | 87,151,927 | | |
IT Services (17.3%): | |
Black Knight, Inc. (a) | | | 218,884 | | | | 13,165,873 | | |
Euronet Worldwide, Inc. (a) (b) | | | 117,771 | | | | 19,813,793 | | |
Global Payments, Inc. | | | 43,890 | | | | 7,028,106 | | |
GoDaddy, Inc., Class A (a) | | | 101,360 | | | | 7,110,404 | | |
Okta, Inc. (a) | | | 64,000 | | | | 7,904,640 | | |
Square, Inc., Class A (a) (b) | | | 65,610 | | | | 4,758,693 | | |
Total System Services, Inc. | | | 45,490 | | | | 5,835,002 | | |
Twilio, Inc. (a) (b) | | | 104,920 | | | | 14,305,842 | | |
WEX, Inc. (a) | | | 20,150 | | | | 4,193,215 | | |
Wix.com Ltd., ADR (a) | | | 61,300 | | | | 8,710,730 | | |
| | | | 92,826,298 | | |
Materials (1.3%): | |
Berry Global Group, Inc. (a) | | | 132,850 | | | | 6,986,582 | | |
Semiconductors & Semiconductor Equipment (5.8%): | |
Cree, Inc. (a) (b) | | | 78,290 | | | | 4,398,332 | | |
Lam Research Corp. | | | 34,680 | | | | 6,514,291 | | |
Marvell Technology Group Ltd., ADR | | | 368,410 | | | | 8,793,946 | | |
Microchip Technology, Inc. (b) | | | 68,400 | | | | 5,930,280 | | |
Monolithic Power Systems, Inc. (b) | | | 37,600 | | | | 5,105,328 | | |
| | | | 30,742,177 | | |
Software (13.8%): | |
Docusign, Inc. (a) (b) | | | 157,930 | | | | 7,850,700 | | |
Dropbox, Inc. (a) | | | 364,050 | | | | 9,119,453 | | |
Fair Isaac Corp. (a) | | | 34,220 | | | | 10,745,764 | | |
Proofpoint, Inc. (a) | | | 68,280 | | | | 8,210,670 | | |
RingCentral, Inc., Class A (a) | | | 97,100 | | | | 11,158,732 | | |
ServiceNow, Inc. (a) | | | 54,010 | | | | 14,829,525 | | |
See notes to financial statements.
13
Victory Portfolios
Victory RS Mid Cap Growth Fund | | Schedule of Portfolio Investments — continued
June 30, 2019 | |
(Unaudited)
Security Description | | Shares | | Value | |
Slack Technologies, Inc., Class A (a) | | | 102,190 | | | $ | 3,832,125 | | |
Zendesk, Inc. (a) | | | 89,350 | | | | 7,954,831 | | |
| | | | 73,701,800 | | |
Total Common Stocks (Cost $420,133,304) | | | 521,384,492 | | |
Collateral for Securities Loaned^ (9.7%) | |
BlackRock Liquidity Funds TempFund Portfolio, Institutional Class, 2.43% (c) | | | 10,772,700 | | | | 10,772,700 | | |
Fidelity Investments Money Market Government Portfolio, Class I, 2.28% (c) | | | 13,876,471 | | | | 13,876,471 | | |
Fidelity Investments Prime Money Market Portfolio, Class I, 2.39% (c) | | | 360,370 | | | | 360,370 | | |
Goldman Sachs Financial Square Prime Obligations Fund, Institutional Class,
2.48% (c) | | | 5,924,196 | | | | 5,924,196 | | |
JPMorgan Prime Money Market Fund, Capital Class, 2.41% (c) | | | 8,078,269 | | | | 8,078,269 | | |
Morgan Stanley Institutional Liquidity Prime Portfolio, Institutional Class,
2.42% (c) | | | 12,566,655 | | | | 12,566,655 | | |
Total Collateral for Securities Loaned (Cost $51,578,661) | | | 51,578,661 | | |
Total Investments (Cost $471,711,965) — 107.8% | | | 572,963,153 | | |
Liabilities in excess of other assets — (7.8)% | | | (41,525,221 | ) | |
NET ASSETS — 100.00% | | $ | 531,437,932 | | |
^ Purchased with cash collateral from securities on loan.
(a) Non-income producing security.
(b) All or a portion of this security is on loan.
(c) Rate disclosed is the daily yield on June 30, 2019.
(d) Amount represents less than 0.05% of net assets.
ADR — American Depositary Receipt
PLC — Public Limited Company
See notes to financial statements.
14
Victory Portfolios
Victory RS Growth Fund | | Schedule of Portfolio Investments
June 30, 2019 | |
(Unaudited)
Security Description | | Shares | | Value | |
Common Stocks (99.8%) | |
Communication Services (14.4%): | |
Alphabet, Inc., Class C (a) | | | 8,651 | | | $ | 9,350,952 | | |
Facebook, Inc., Class A (a) | | | 51,250 | | | | 9,891,250 | | |
InterActive Corp. (a) | | | 24,290 | | | | 5,283,804 | | |
Netflix, Inc. (a) | | | 24,930 | | | | 9,157,288 | | |
The Walt Disney Co. | | | 28,000 | | | | 3,909,920 | | |
| | | | 37,593,214 | | |
Consumer Discretionary (17.2%): | |
Amazon.com, Inc. (a) | | | 8,870 | | | | 16,796,498 | | |
Domino's Pizza, Inc. | | | 21,980 | | | | 6,116,594 | | |
Ferrari NV, ADR (b) | | | 24,100 | | | | 3,890,222 | | |
Hilton Worldwide Holdings, Inc. | | | 26,220 | | | | 2,562,743 | | |
The Home Depot, Inc. | | | 28,205 | | | | 5,865,794 | | |
The TJX Co., Inc. | | | 122,810 | | | | 6,494,193 | | |
Vail Resorts, Inc. | | | 14,000 | | | | 3,124,520 | | |
| | | | 44,850,564 | | |
Consumer Staples (2.9%): | |
Keurig Dr Pepper, Inc. (b) | | | 139,270 | | | | 4,024,903 | | |
Tyson Foods, Inc., Class A (b) | | | 43,980 | | | | 3,550,945 | | |
| | | | 7,575,848 | | |
Electronic Equipment, Instruments & Components (1.2%): | |
Amphenol Corp., Class A | | | 33,640 | | | | 3,227,422 | | |
Energy (0.9%): | |
EOG Resources, Inc. | | | 24,365 | | | | 2,269,843 | | |
Financials (2.3%): | |
The Progressive Corp. | | | 73,670 | | | | 5,888,443 | | |
Health Care (16.8%): | |
BeiGene Ltd., ADR (a) (b) | | | 13,000 | | | | 1,611,350 | | |
Bluebird Bio, Inc. (a) (b) | | | 22,990 | | | | 2,924,328 | | |
Exact Sciences Corp. (a) | | | 33,900 | | | | 4,001,556 | | |
Illumina, Inc. (a) | | | 12,320 | | | | 4,535,608 | | |
Intuitive Surgical, Inc. (a) | | | 7,880 | | | | 4,133,454 | | |
IQVIA Holdings, Inc. (a) | | | 33,640 | | | | 5,412,676 | | |
Merck & Co., Inc. | | | 77,300 | | | | 6,481,605 | | |
Neurocrine Biosciences, Inc. (a) | | | 27,180 | | | | 2,294,807 | | |
Sage Therapeutics, Inc. (a) (b) | | | 14,710 | | | | 2,693,254 | | |
The Cooper Co., Inc. | | | 10,740 | | | | 3,618,199 | | |
UnitedHealth Group, Inc. | | | 24,060 | | | | 5,870,881 | | |
| | | | 43,577,718 | | |
Industrials (12.1%): | |
AMETEK, Inc. | | | 52,660 | | | | 4,783,634 | | |
Caterpillar, Inc. | | | 26,140 | | | | 3,562,621 | | |
IHS Markit Ltd. (a) | | | 53,000 | | | | 3,377,160 | | |
Ingersoll-Rand PLC | | | 85,990 | | | | 10,892,353 | | |
Roper Technologies, Inc. | | | 15,800 | | | | 5,786,908 | | |
Woodward, Inc. | | | 28,600 | | | | 3,236,376 | | |
| | | | 31,639,052 | | |
See notes to financial statements.
15
Victory Portfolios
Victory RS Growth Fund | | Schedule of Portfolio Investments — continued
June 30, 2019 | |
(Unaudited)
Security Description | | Shares | | Value | |
IT Services (12.3%): | |
Black Knight, Inc. (a) (b) | | | 117,890 | | | $ | 7,091,084 | | |
PayPal Holdings, Inc. (a) | | | 44,470 | | | | 5,090,036 | | |
Twilio, Inc. (a) (b) | | | 51,080 | | | | 6,964,758 | | |
Visa, Inc., Class A | | | 73,097 | | | | 12,685,984 | | |
| | | | 31,831,862 | | |
Semiconductors & Semiconductor Equipment (6.0%): | |
Broadcom, Inc. | | | 11,870 | | | | 3,416,898 | | |
KLA-Tencor Corp. | | | 24,500 | | | | 2,895,900 | | |
Lam Research Corp. | | | 18,090 | | | | 3,398,026 | | |
Marvell Technology Group Ltd., ADR | | | 145,350 | | | | 3,469,505 | | |
Microchip Technology, Inc. (b) | | | 28,510 | | | | 2,471,817 | | |
| | | | 15,652,146 | | |
Software (9.2%): | |
Fair Isaac Corp. (a) | | | 12,700 | | | | 3,988,054 | | |
Salesforce.com, Inc. (a) | | | 33,940 | | | | 5,149,716 | | |
ServiceNow, Inc. (a) | | | 32,060 | | | | 8,802,714 | | |
Workday, Inc. (a) | | | 29,200 | | | | 6,002,936 | | |
| | | | 23,943,420 | | |
Technology Hardware, Storage & Peripherals (4.5%): | |
Apple, Inc. | | | 58,547 | | | | 11,587,622 | | |
Total Common Stocks (Cost $176,091,683) | | | 259,637,154 | | |
Collateral for Securities Loaned^ (8.1%) | |
BlackRock Liquidity Funds TempFund Portfolio, Institutional Class, 2.43% (c) | | | 4,401,948 | | | | 4,401,948 | | |
Fidelity Investments Money Market Government Portfolio, Class I, 2.28% (c) | | | 5,670,213 | | | | 5,670,213 | | |
Fidelity Investments Prime Money Market Portfolio, Class I, 2.39% (c) | | | 147,255 | | | | 147,255 | | |
Goldman Sachs Financial Square Prime Obligations Fund, Institutional Class,
2.48% (c) | | | 2,420,749 | | | | 2,420,749 | | |
JPMorgan Prime Money Market Fund, Capital Class, 2.41% (c) | | | 3,300,948 | | | | 3,300,948 | | |
Morgan Stanley Institutional Liquidity Prime Portfolio, Institutional Class,
2.42% (c) | | | 5,134,995 | | | | 5,134,995 | | |
Total Collateral for Securities Loaned (Cost $21,076,108) | | | 21,076,108 | | |
Total Investments (Cost $197,167,791) — 107.9% | | | 280,713,262 | | |
Liabilities in excess of other assets — (7.9)% | | | (20,462,164 | ) | |
NET ASSETS — 100.00% | | $ | 260,251,098 | | |
^ Purchased with cash collateral from securities on loan.
(a) Non-income producing security.
(b) All or a portion of this security is on loan.
(c) Rate disclosed is the daily yield on June 30, 2019.
ADR — American Depositary Receipt
PLC — Public Limited Company
See notes to financial statements.
16
Victory Portfolios
Victory RS Science and Technology Fund | | Schedule of Portfolio Investments
June 30, 2019 | |
(Unaudited)
Security Description | | Shares | | Value | |
Common Stocks (96.7%) | |
Biotechnology (27.8%): | |
Adverum Biotechnologies, Inc. (a) | | | 99,680 | | | $ | 1,185,195 | | |
Aimmune Therapeutics, Inc. (a) (b) | | | 78,100 | | | | 1,626,042 | | |
Albireo Pharma, Inc. (a) | | | 29,810 | | | | 961,074 | | |
Allakos, Inc. (a) (b) | | | 29,990 | | | | 1,299,467 | | |
Alpine Immune Sciences, Inc. (a) (b) (c) | | | 65,297 | | | | 274,900 | | |
Amicus Therapeutics, Inc. (a) | | | 156,700 | | | | 1,955,616 | | |
Apellis Pharmaceuticals, Inc. (a) | | | 100,313 | | | | 2,541,931 | | |
Arena Pharmaceuticals, Inc. (a) | | | 26,390 | | | | 1,547,246 | | |
Ascendis Pharma A/S, ADR (a) | | | 16,460 | | | | 1,895,369 | | |
Atreca, Inc., Class A (a) (b) | | | 53,272 | | | | 1,003,644 | | |
Audentes Therapeutics, Inc. (a) | | | 48,410 | | | | 1,832,803 | | |
Autolus Therapeutics PLC, ADR (a) | | | 51,590 | | | | 830,599 | | |
Avrobio, Inc. (a) | | | 52,930 | | | | 860,642 | | |
BeiGene Ltd., ADR (a) (b) | | | 13,290 | | | | 1,647,296 | | |
Bicycle Therapeutics Ltd., ADR (a) | | | 72,270 | | | | 727,036 | | |
Bluebird Bio, Inc. (a) (b) | | | 25,240 | | | | 3,210,528 | | |
Blueprint Medicines Corp. (a) | | | 25,130 | | | | 2,370,513 | | |
Bridgebio Pharma, Inc. (a) | | | 42,750 | | | | 1,152,968 | | |
Celyad SA, ADR (a) (b) (c) | | | 57,900 | | | | 664,113 | | |
Crinetics Pharmaceuticals, Inc. (a) (b) | | | 35,990 | | | | 899,750 | | |
Cytomx Therapeutics, Inc. (a) | | | 155,400 | | | | 1,743,588 | | |
Eidos Therapeutics, Inc. (a) (b) | | | 57,100 | | | | 1,774,668 | | |
Epizyme, Inc. (a) | | | 93,030 | | | | 1,167,527 | | |
Equillium, Inc. (a) (b) (c) | | | 188,270 | | | | 1,065,608 | | |
Evlo Biosciences, Inc. (a) (b) | | | 29,449 | | | | 264,452 | | |
Exact Sciences Corp. (a) | | | 24,810 | | | | 2,928,572 | | |
Fate Therapeutics, Inc. (a) | | | 253,100 | | | | 5,137,930 | | |
Galapagos NV, ADR (a) (b) | | | 16,950 | | | | 2,185,364 | | |
Gossamer Bio, Inc. (a) | | | 42,830 | | | | 949,969 | | |
Gritstone Oncology, Inc. (a) (b) | | | 150,580 | | | | 1,677,461 | | |
Homology Medicines, Inc. (a) (b) | | | 64,390 | | | | 1,260,112 | | |
Ideaya Biosciences, Inc. (a) | | | 77,440 | | | | 771,302 | | |
Invitae Corp. (a) | | | 70,465 | | | | 1,655,928 | | |
Iovance Biotherapeutics, Inc. (a) (b) | | | 97,280 | | | | 2,385,306 | | |
Kezar Life Sciences, Inc. (a) (b) | | | 243,176 | | | | 1,874,887 | | |
Kiniksa Pharmaceuticals Ltd., Class A (a) (b) | | | 39,469 | | | | 534,410 | | |
Kura Oncology, Inc. (a) | | | 158,770 | | | | 3,126,181 | | |
Ligand Pharmaceuticals, Inc., Class B (a) (b) | | | 10,560 | | | | 1,205,424 | | |
MacroGenics, Inc. (a) | | | 54,620 | | | | 926,901 | | |
Matinas BioPharma Holdings, Inc. (a) (b) | | | 855,910 | | | | 733,173 | | |
Mirati Therapeutics, Inc. (a) (b) | | | 21,400 | | | | 2,204,200 | | |
Myovant Sciences Ltd. (a) | | | 156,160 | | | | 1,413,248 | | |
Neurocrine Biosciences, Inc. (a) | | | 7,770 | | | | 656,021 | | |
Precision BioSciences, Inc. (a) (b) | | | 71,200 | | | | 943,400 | | |
REGENXBIO, Inc. (a) (b) | | | 20,870 | | | | 1,072,092 | | |
Replimune Group, Inc. (a) (b) | | | 89,220 | | | | 1,307,965 | | |
Sage Therapeutics, Inc. (a) (b) | | | 16,450 | | | | 3,011,831 | | |
Scholar Rock Holding Corp. (a) | | | 50,980 | | | | 808,543 | | |
See notes to financial statements.
17
Victory Portfolios
Victory RS Science and Technology Fund | | Schedule of Portfolio Investments — continued
June 30, 2019 | |
(Unaudited)
Security Description | | Shares | | Value | |
Surface Oncology, Inc. (a) | | | 226,500 | | | $ | 638,730 | | |
Twist Bioscience Corp. (a) (b) | | | 69,840 | | | | 2,026,058 | | |
Xencor, Inc. (a) (b) | | | 25,740 | | | | 1,053,538 | | |
| | | | 76,991,121 | | |
Communication Services (10.5%): | |
Boingo Wireless, Inc. (a) (b) | | | 310,690 | | | | 5,583,099 | | |
Facebook, Inc., Class A (a) | | | 45,540 | | | | 8,789,220 | | |
Match Group, Inc. (b) | | | 52,370 | | | | 3,522,930 | | |
Netflix, Inc. (a) | | | 15,230 | | | | 5,594,283 | | |
Take-Two Interactive Software, Inc. (a) | | | 21,490 | | | | 2,439,760 | | |
Yelp, Inc. (a) | | | 97,850 | | | | 3,344,513 | | |
| | | | 29,273,805 | | |
Communications Equipment (2.9%): | |
Acacia Communications, Inc. (a) | | | 56,480 | | | | 2,663,597 | | |
Lumentum Holdings, Inc. (a) | | | 48,300 | | | | 2,579,703 | | |
Viavi Solutions, Inc. (a) | | | 212,990 | | | | 2,830,637 | | |
| | | | 8,073,937 | | |
Consumer Discretionary (4.5%): | |
Amazon.com, Inc. (a) | | | 4,930 | | | | 9,335,596 | | |
Arco Platform Ltd., ADR, Class A (a) | | | 52,910 | | | | 2,316,400 | | |
Waitr Holdings, Inc. (a) (b) | | | 146,030 | | | | 918,529 | | |
| | | | 12,570,525 | | |
Electronic Equipment, Instruments & Components (2.5%): | |
Airgain, Inc. (a) (b) | | | 97,370 | | | | 1,377,786 | | |
Fabrinet (a) | | | 58,010 | | | | 2,881,357 | | |
Flextronics International Ltd. (a) | | | 275,990 | | | | 2,641,224 | | |
| | | | 6,900,367 | | |
Financials (1.0%): | |
LendingTree, Inc. (a) (b) | | | 6,720 | | | | 2,822,602 | | |
Health Care Equipment & Supplies (1.6%): | |
Cryoport, Inc. (a) (b) | | | 182,310 | | | | 3,339,919 | | |
Quotient Ltd. (a) (b) | | | 121,440 | | | | 1,135,464 | | |
| | | | 4,475,383 | | |
Health Care Technology (1.1%): | |
Veeva Systems, Inc., Class A (a) | | | 19,120 | | | | 3,099,543 | | |
IT Services (9.1%): | |
Euronet Worldwide, Inc. (a) | | | 16,530 | | | | 2,781,007 | | |
Global Payments, Inc. | | | 16,620 | | | | 2,661,361 | | |
GoDaddy, Inc., Class A (a) | | | 47,560 | | | | 3,336,334 | | |
Twilio, Inc. (a) (b) | | | 41,940 | | | | 5,718,518 | | |
Visa, Inc., Class A | | | 31,310 | | | | 5,433,851 | | |
Wix.com Ltd., ADR (a) | | | 37,990 | | | | 5,398,379 | | |
| | | | 25,329,450 | | |
See notes to financial statements.
18
Victory Portfolios
Victory RS Science and Technology Fund | | Schedule of Portfolio Investments — continued
June 30, 2019 | |
(Unaudited)
Security Description | | Shares | | Value | |
Life Sciences Tools & Services (1.8%): | |
Adaptive Biotechnologies Corp. (a) | | | 32,790 | | | $ | 1,583,757 | | |
Genfit, ADR (a) (b) | | | 34,240 | | | | 676,240 | | |
Illumina, Inc. (a) | | | 4,270 | | | | 1,572,001 | | |
Neogenomics, Inc. (a) | | | 59,760 | | | | 1,311,134 | | |
| | | | 5,143,132 | | |
Pharmaceuticals (2.2%): | |
GW Pharmaceuticals PLC, ADR (a) (b) | | | 19,410 | | | | 3,346,090 | | |
Kaleido Biosciences, Inc. (a) (b) | | | 49,780 | | | | 577,448 | | |
MyoKardia, Inc. (a) | | | 16,180 | | | | 811,265 | | |
NGM Biopharmaceuticals, Inc. (a) (b) | | | 66,440 | | | | 972,682 | | |
Sienna Biopharmaceuticals, Inc. (a) (b) | | | 410,700 | | | | 357,309 | | |
| | | | 6,064,794 | | |
Semiconductors & Semiconductor Equipment (17.0%): | |
Broadcom, Inc. | | | 14,560 | | | | 4,191,242 | | |
Cohu, Inc. | | | 226,510 | | | | 3,495,049 | | |
Cree, Inc. (a) (b) | | | 42,240 | | | | 2,373,043 | | |
Inphi Corp. (a) | | | 88,230 | | | | 4,420,323 | | |
KLA-Tencor Corp. | | | 30,210 | | | | 3,570,822 | | |
Lam Research Corp. | | | 19,310 | | | | 3,627,190 | | |
Lattice Semiconductor Corp. (a) | | | 195,800 | | | | 2,856,722 | | |
Ma-Com Technology Solutions Holdings, Inc. (a) (b) | | | 265,120 | | | | 4,011,266 | | |
Marvell Technology Group Ltd., ADR (b) | | | 250,740 | | | | 5,985,164 | | |
MKS Instruments, Inc. | | | 36,610 | | | | 2,851,553 | | |
Monolithic Power Systems, Inc. (b) | | | 20,690 | | | | 2,809,288 | | |
Semtech Corp. (a) | | | 83,220 | | | | 3,998,721 | | |
Ultra Clean Holdings, Inc. (a) | | | 208,910 | | | | 2,908,027 | | |
| | | | 47,098,410 | | |
Software (14.7%): | |
Cornerstone OnDemand, Inc. (a) | | | 86,490 | | | | 5,010,366 | | |
Coupa Software, Inc. (a) (b) | | | 26,340 | | | | 3,334,907 | | |
Docusign, Inc. (a) (b) | | | 55,180 | | | | 2,742,998 | | |
Dropbox, Inc. (a) | | | 117,930 | | | | 2,954,147 | | |
Fair Isaac Corp. (a) | | | 8,020 | | | | 2,518,440 | | |
Paycom Software, Inc. (a) | | | 19,290 | | | | 4,373,429 | | |
Proofpoint, Inc. (a) | | | 29,709 | | | | 3,572,507 | | |
RingCentral, Inc., Class A (a) | | | 78,760 | | | | 9,051,098 | | |
ServiceNow, Inc. (a) | | | 12,880 | | | | 3,536,462 | | |
Zendesk, Inc. (a) | | | 40,850 | | | | 3,636,876 | | |
| | | | 40,731,230 | | |
Total Common Stocks (Cost $201,085,801) | | | 268,574,299 | | |
Collateral for Securities Loaned^ (19.9%) | |
BlackRock Liquidity Funds TempFund Portfolio, Institutional Class, 2.43% (d) | | | 11,566,621 | | | | 11,566,621 | | |
Fidelity Investments Money Market Government Portfolio, Class I, 2.28% (d) | | | 14,899,133 | | | | 14,899,133 | | |
Fidelity Investments Prime Money Market Portfolio, Class I, 2.39% (d) | | | 386,928 | | | | 386,928 | | |
See notes to financial statements.
19
Victory Portfolios
Victory RS Science and Technology Fund | | Schedule of Portfolio Investments — continued
June 30, 2019 | |
(Unaudited)
Security Description | | Shares | | Value | |
Goldman Sachs Financial Square Prime Obligations Fund, Institutional Class,
2.48% (d) | | | 6,360,794 | | | $ | 6,360,794 | | |
JPMorgan Prime Money Market Fund, Capital Class, 2.41% (d) | | | 8,673,617 | | | | 8,673,617 | | |
Morgan Stanley Institutional Liquidity Prime Portfolio, Institutional Class,
2.42% (d) | | | 13,492,786 | | | | 13,492,786 | | |
Total Collateral for Securities Loaned (Cost $55,379,879) | | | 55,379,879 | | |
Total Investments (Cost $256,465,680) — 116.6% | | | 323,954,178 | | |
Liabilities in excess of other assets — (16.6)% | | | (46,103,641 | ) | |
NET ASSETS — 100.00% | | $ | 277,850,537 | | |
^ Purchased with cash collateral from securities on loan.
(a) Non-income producing security.
(b) All or a portion of this security is on loan.
(c) The Fund's Adviser has deemed this security to be illiquid based upon procedures approved by the Board of Trustees. As of June 30, 2019, illiquid securities were 0.7% of the Fund's net assets.
(d) Rate disclosed is the daily yield on June 30, 2019.
ADR — American Depositary Receipt
PLC — Public Limited Company
See notes to financial statements.
20
Victory Portfolios
Victory RS Small Cap Equity Fund | | Schedule of Portfolio Investments
June 30, 2019 | |
(Unaudited)
Security Description | | Shares | | Value | |
Common Stocks (98.4%) | |
Biotechnology (17.6%): | |
Aimmune Therapeutics, Inc. (a) (b) | | | 19,370 | | | $ | 403,283 | | |
Amicus Therapeutics, Inc. (a) | | | 66,684 | | | | 832,216 | | |
Apellis Pharmaceuticals, Inc. (a) | | | 28,770 | | | | 729,032 | | |
Arena Pharmaceuticals, Inc. (a) | | | 12,680 | | | | 743,428 | | |
Ascendis Pharma A/S, ADR (a) | | | 6,100 | | | | 702,415 | | |
Audentes Therapeutics, Inc. (a) | | | 16,050 | | | | 607,653 | | |
Bluebird Bio, Inc. (a) (b) | | | 5,177 | | | | 658,514 | | |
Blueprint Medicines Corp. (a) | | | 8,698 | | | | 820,482 | | |
Bridgebio Pharma, Inc. (a) | | | 11,030 | | | | 297,479 | | |
Celyad SA, ADR (a) (b) (c) | | | 10,686 | | | | 122,568 | | |
Cytomx Therapeutics, Inc. (a) | | | 33,460 | | | | 375,421 | | |
Epizyme, Inc. (a) (b) | | | 29,790 | | | | 373,865 | | |
Equillium, Inc. (a) (c) | | | 22,818 | | | | 129,150 | | |
Fate Therapeutics, Inc. (a) | | | 48,060 | | | | 975,619 | | |
Gossamer Bio, Inc. (a) (b) | | | 17,550 | | | | 389,259 | | |
Invitae Corp. (a) | | | 36,820 | | | | 865,270 | | |
Iovance Biotherapeutics, Inc. (a) (b) | | | 35,631 | | | | 873,673 | | |
Kura Oncology, Inc. (a) | | | 33,310 | | | | 655,874 | | |
Ligand Pharmaceuticals, Inc., Class B (a) (b) | | | 5,607 | | | | 640,039 | | |
Mirati Therapeutics, Inc. (a) (b) | | | 4,490 | | | | 462,470 | | |
Myovant Sciences Ltd. (a) | | | 38,920 | | | | 352,226 | | |
Sage Therapeutics, Inc. (a) (b) | | | 3,547 | | | | 649,420 | | |
| | | | 12,659,356 | | |
Communication Services (2.6%): | |
Bandwidth, Inc., Class A (a) (b) | | | 11,590 | | | | 869,482 | | |
QuinStreet, Inc. (a) | | | 44,430 | | | | 704,215 | | |
Yelp, Inc. (a) | | | 8,660 | | | | 295,999 | | |
| | | | 1,869,696 | | |
Communications Equipment (1.0%): | |
Acacia Communications, Inc. (a) | | | 14,560 | | | | 686,650 | | |
Consumer Discretionary (13.2%): | |
Arco Platform Ltd., ADR, Class A (a) | | | 16,863 | | | | 738,262 | | |
Dineequity, Inc. | | | 14,530 | | | | 1,387,178 | | |
Eldorado Resorts, Inc. (a) (b) | | | 15,540 | | | | 715,928 | | |
G-III Apparel Group Ltd. (a) (b) | | | 19,870 | | | | 584,575 | | |
Grand Canyon Education, Inc. (a) | | | 3,861 | | | | 451,814 | | |
Monro Muffler Brake, Inc. | | | 11,910 | | | | 1,015,923 | | |
Ollie's Bargain Outlet Holdings, Inc. (a) | | | 6,191 | | | | 539,298 | | |
Planet Fitness, Inc., Class A (a) | | | 10,390 | | | | 752,652 | | |
Red Rock Resorts, Inc., Class A | | | 25,702 | | | | 552,079 | | |
Shake Shack, Inc., Class A (a) | | | 10,220 | | | | 737,884 | | |
Steven Madden Ltd. | | | 22,069 | | | | 749,243 | | |
Strategic Education, Inc. | | | 6,600 | | | | 1,174,800 | | |
| | | | 9,399,636 | | |
See notes to financial statements.
21
Victory Portfolios
Victory RS Small Cap Equity Fund | | Schedule of Portfolio Investments — continued
June 30, 2019 | |
(Unaudited)
Security Description | | Shares | | Value | |
Consumer Staples (4.1%): | |
BJ's Wholesale Club Holdings, Inc. (a) | | | 36,290 | | | $ | 958,056 | | |
Freshpet, Inc. (a) | | | 11,290 | | | | 513,808 | | |
Nomad Foods Ltd., ADR (a) | | | 69,440 | | | | 1,483,238 | | |
| | | | 2,955,102 | | |
Electronic Equipment, Instruments & Components (1.0%): | |
Littelfuse, Inc. | | | 3,877 | | | | 685,880 | | |
Energy (1.4%): | |
Matador Resources Co. (a) | | | 17,460 | | | | 347,105 | | |
Newpark Resources, Inc. (a) (b) | | | 88,870 | | | | 659,415 | | |
| | | | 1,006,520 | | |
Financials (6.5%): | |
eHealth, Inc. (a) | | | 9,301 | | | | 800,816 | | |
Essent Group Ltd. (a) | | | 13,660 | | | | 641,883 | | |
Firstcash, Inc. (b) | | | 11,390 | | | | 1,139,228 | | |
Kemper Corp. | | | 14,760 | | | | 1,273,640 | | |
LendingTree, Inc. (a) (b) | | | 1,620 | | | | 680,449 | | |
Primerica, Inc. | | | 1,130 | | | | 135,544 | | |
| | | | 4,671,560 | | |
Health Care Equipment & Supplies (5.8%): | |
Cryoport, Inc. (a) | | | 19,800 | | | | 362,736 | | |
Glaukos Corp. (a) | | | 8,060 | | | | 607,724 | | |
Insulet Corp. (a) (b) | | | 7,800 | | | | 931,164 | | |
Irhythm Technologies, Inc. (a) | | | 4,120 | | | | 325,810 | | |
Masimo Corp. (a) | | | 8,815 | | | | 1,311,848 | | |
Penumbra, Inc. (a) (b) | | | 3,750 | | | | 600,000 | | |
Silk Road Medical, Inc. (a) | | | 280 | | | | 13,569 | | |
| | | | 4,152,851 | | |
Health Care Providers & Services (2.2%): | |
Hanger, Inc. (a) (b) | | | 24,270 | | | | 464,771 | | |
HealthEquity, Inc. (a) | | | 5,610 | | | | 366,894 | | |
LHC Group, Inc. (a) | | | 6,390 | | | | 764,116 | | |
| | | | 1,595,781 | | |
Health Care Technology (0.3%): | |
Inspire Medical System, Inc. (a) (b) | | | 3,780 | | | | 229,257 | | |
Industrials (11.9%): | |
Advanced Disposal Services, Inc. (a) | | | 15,710 | | | | 501,306 | | |
Altra Industrial Motion Corp. | | | 15,510 | | | | 556,499 | | |
Armstrong World Industries, Inc. | | | 3,630 | | | | 352,836 | | |
Axon Enterprise, Inc. (a) | | | 15,227 | | | | 977,726 | | |
Azul SA, ADR (a) | | | 18,950 | | | | 633,688 | | |
Generac Holdings, Inc. (a) (b) | | | 9,030 | | | | 626,772 | | |
Harsco Corp. (a) | | | 43,280 | | | | 1,187,603 | | |
Proto Labs, Inc. (a) | | | 3,940 | | | | 457,119 | | |
Simpson Manufacturing Co., Inc. | | | 10,650 | | | | 707,799 | | |
Siteone Landscape Supply, Inc. (a) (b) | | | 17,080 | | | | 1,183,644 | | |
See notes to financial statements.
22
Victory Portfolios
Victory RS Small Cap Equity Fund | | Schedule of Portfolio Investments — continued
June 30, 2019 | |
(Unaudited)
Security Description | | Shares | | Value | |
Trex Co., Inc. (a) (b) | | | 9,850 | | | $ | 706,245 | | |
Watts Water Technologies, Inc., Class A | | | 5,340 | | | | 497,581 | | |
| | | | 8,388,818 | | |
IT Services (10.0%): | |
Euronet Worldwide, Inc. (a) | | | 10,607 | | | | 1,784,521 | | |
Evo Payments, Inc. (a) | | | 26,820 | | | | 845,635 | | |
InterXion Holding NV, ADR (a) | | | 19,944 | | | | 1,517,539 | | |
Liveramp Holdings, Inc. (a) | | | 11,972 | | | | 580,403 | | |
Wix.com Ltd., ADR (a) | | | 11,430 | | | | 1,624,203 | | |
WNS Holdings Ltd., ADR (a) | | | 13,588 | | | | 804,410 | | |
| | | | 7,156,711 | | |
Materials (2.5%): | |
Ashland Global Holdings, Inc. | | | 12,500 | | | | 999,625 | | |
Ingevity Corp. (a) (b) | | | 7,530 | | | | 791,930 | | |
| | | | 1,791,555 | | |
Pharmaceuticals (1.3%): | |
GW Pharmaceuticals PLC, ADR (a) (b) | | | 5,500 | | | | 948,145 | | |
Semiconductors & Semiconductor Equipment (6.5%): | |
Advanced Energy Industries, Inc. (a) | | | 10,410 | | | | 585,771 | | |
Cabot Microelectronics Corp. | | | 8,300 | | | | 913,663 | | |
Inphi Corp. (a) | | | 18,100 | | | | 906,810 | | |
MKS Instruments, Inc. | | | 7,550 | | | | 588,070 | | |
Monolithic Power Systems, Inc. (b) | | | 5,588 | | | | 758,739 | | |
Silicon Laboratories, Inc. (a) (b) | | | 8,780 | | | | 907,852 | | |
| | | | 4,660,905 | | |
Software (10.5%): | |
ACI Worldwide, Inc. (a) | | | 26,330 | | | | 904,172 | | |
Cornerstone OnDemand, Inc. (a) | | | 24,942 | | | | 1,444,890 | | |
Coupa Software, Inc. (a) | | | 12,990 | | | | 1,644,664 | | |
Envestnet, Inc. (a) | | | 10,560 | | | | 721,987 | | |
Everbridge, Inc. (a) (b) | | | 10,210 | | | | 912,978 | | |
Q2 Holdings, Inc. (a) | | | 6,950 | | | | 530,702 | | |
RingCentral, Inc., Class A (a) | | | 12,699 | | | | 1,459,369 | | |
| | | 7,618,762 | | |
Total Common Stocks (Cost $55,053,315) | | | 70,477,185 | | |
Collateral for Securities Loaned^ (15.1%) | |
BlackRock Liquidity Funds TempFund Portfolio, Institutional Class, 2.43% (d) | | | 2,263,945 | | | | 2,263,945 | | |
Fidelity Investments Money Market Government Portfolio, Class I, 2.28% (d) | | | 2,916,220 | | | | 2,916,220 | | |
Fidelity Investments Prime Money Market Portfolio, Class I, 2.39% (d) | | | 75,734 | | | | 75,734 | | |
Goldman Sachs Financial Square Prime Obligations Fund, Institutional Class,
2.48% (d) | | | 1,245,004 | | | | 1,245,004 | | |
JPMorgan Prime Money Market Fund, Capital Class, 2.41% (d) | | | 1,697,695 | | | | 1,697,695 | | |
See notes to financial statements.
23
Victory Portfolios
Victory RS Small Cap Equity Fund | | Schedule of Portfolio Investments — continued
June 30, 2019 | |
(Unaudited)
Security Description | | Shares | | Value | |
Morgan Stanley Institutional Liquidity Prime Portfolio, Institutional Class,
2.42% (d) | | | 2,640,955 | | | $ | 2,640,955 | | |
Total Collateral for Securities Loaned (Cost $10,839,553) | | | 10,839,553 | | |
Total Investments (Cost $65,892,868) — 113.5% | | | 81,316,738 | | |
Liabilities in excess of other assets — (13.5)% | | | (9,674,762 | ) | |
NET ASSETS — 100.00% | | $ | 71,641,976 | | |
^ Purchased with cash collateral from securities on loan.
(a) Non-income producing security.
(b) All or a portion of this security is on loan.
(c) The Fund's Adviser has deemed this security to be illiquid based upon procedures approved by the Board of Trustees. As of June 30, 2019, illiquid securities were 0.4% of the Fund's net assets.
(d) Rate disclosed is the daily yield on June 30, 2019.
ADR — American Depositary Receipt
PLC — Public Limited Company
See notes to financial statements.
24
Victory Portfolios | | Statements of Assets and Liabilities
June 30, 2019 | |
(Unaudited)
| | | Victory
RS Small Cap
Growth Fund | | Victory
RS Select
Growth Fund | | Victory
RS Mid Cap
Growth Fund | |
ASSETS: | |
Investments, at value (Cost $1,964,983,249,
$206,039,675 and $471,711,965) | | $ | 2,524,491,388 | (a) | | $ | 281,659,463 | (b) | | $ | 572,963,153 | (c) | |
Cash and cash equivalents | | | 54,746,482 | | | | 6,199,612 | | | | 9,801,647 | | |
Interest and dividends receivable | | | 696,578 | | | | 64,770 | | | | 161,909 | | |
Receivable for capital shares issued | | | 1,159,765 | | | | 11,181 | | | | 279,663 | | |
Receivable for investments sold | | | 1,647,820 | | | | 1,512,920 | | | | 1,001,556 | | |
Receivable from Adviser | | | 97,810 | | | | 72,614 | | | | 134,468 | | |
Prepaid expenses | | | 56,416 | | | | 30,350 | | | | 42,461 | | |
Total Assets | | | 2,582,896,259 | | | | 289,550,910 | | | | 584,384,857 | | |
LIABILITIES: | |
Payables: | |
Collateral received on loaned securities | | | 356,900,924 | | | | 31,635,050 | | | | 51,578,661 | | |
Investments purchased | | | 16,555,877 | | | | 571,055 | | | | 623,578 | | |
Capital shares redeemed | | | 2,438,893 | | | | 2,399,158 | | | | 250,291 | | |
Accrued expenses and other payables: | |
Investment advisory fees | | | 1,672,344 | | | | 209,259 | | | | 361,781 | | |
Administration fees | | | 108,530 | | | | 12,720 | | | | 26,146 | | |
Custodian fees | | | 24,999 | | | | 1,754 | | | | 1,914 | | |
Transfer agent fees | | | 336,906 | | | | 71,929 | | | | 73,949 | | |
Chief Compliance Officer fees | | | 1,385 | | | | 183 | | | | 301 | | |
Trustees' fees | | | 5,645 | | | | — | | | | 465 | | |
| 12b-1 fees | | | 79,341 | | | | 24,357 | | | | 18,746 | | |
Other accrued expenses | | | 100,072 | | | | 20,943 | | | | 11,093 | | |
Total Liabilities | | | 378,224,916 | | | | 34,946,408 | | | | 52,946,925 | | |
NET ASSETS: | |
Capital | | | 1,583,892,813 | | | | 138,915,824 | | | | 436,707,595 | | |
Total distributable earnings/(loss) | | | 620,778,530 | | | | 115,688,678 | | | | 94,730,337 | | |
Net Assets | | $ | 2,204,671,343 | | | $ | 254,604,502 | | | $ | 531,437,932 | | |
Net Assets | |
Class A Shares | | $ | 691,543,304 | | | $ | 106,684,207 | | | $ | 93,777,216 | | |
Class C Shares | | | 17,864,732 | | | | 32,624,815 | | | | 22,045,511 | | |
Class R Shares | | | 9,464,747 | | | | 848,500 | | | | 952,889 | | |
Class R6 Shares | | | 311,471,014 | | | | 274,449 | | | | 16,189,952 | | |
Class Y Shares | | | 1,174,327,546 | | | | 114,172,531 | | | | 398,472,364 | | |
Total | | $ | 2,204,671,343 | | | $ | 254,604,502 | | | $ | 531,437,932 | | |
Shares (unlimited number of shares authorized
with a par value of $0.001 per share): | |
Class A Shares | | | 8,617,102 | | | | 2,924,739 | | | | 3,608,050 | | |
Class C Shares | | | 261,658 | | | | 1,091,471 | | | | 977,329 | | |
Class R Shares | | | 129,295 | | | | 27,952 | | | | 40,067 | | |
Class R6 Shares | | | 3,709,418 | | | | 7,132 | | | | 598,551 | | |
Class Y Shares | | | 14,008,493 | | | | 2,976,453 | | | | 14,743,345 | | |
Total | | | 26,725,966 | | | | 7,027,747 | | | | 19,967,342 | | |
Net asset value, offering (except Class A Shares)
and redemption price per share: | |
Class A Shares | | $ | 80.25 | | | $ | 36.48 | | | $ | 25.99 | | |
Class C Shares (d) | | | 68.28 | | | | 29.89 | | | | 22.56 | | |
Class R Shares | | | 73.20 | | | | 30.36 | | | | 23.78 | | |
Class R6 Shares | | | 83.97 | | | | 38.48 | | | | 27.05 | | |
Class Y Shares | | | 83.83 | | | | 38.36 | | | | 27.03 | | |
Maximum Sales Charge — Class A Shares | | | 5.75 | % | | | 5.75 | % | | | 5.75 | % | |
Maximum offering price
(100%/(100%-maximum sales charge) of
net asset value adjusted to the nearest cent)
per share — Class A Shares | | $ | 85.15 | | | $ | 38.71 | | | $ | 27.58 | | |
(a) Includes $354,414,246 of securities on loan.
(b) Includes $30,791,667 of securities on loan.
(c) Includes $50,644,849 of securities on loan.
(d) Redemption price per share varies by the length of time shares are held.
See notes to financial statements.
25
Victory Portfolios | | Statements of Assets and Liabilities
June 30, 2019 | |
(Unaudited)
| | | Victory
RS Growth Fund | | Victory
RS Science and
Technology Fund | | Victory
RS Small Cap
Equity Fund | |
ASSETS: | |
Investments, at value (Cost $197,167,791,
$256,465,680 and $65,892,868) | | $ | 280,713,262 | (a) | | $ | 323,954,178 | (b) | | $ | 81,316,738 | (c) | |
Cash and cash equivalents | | | 1,954,330 | | | | 10,397,990 | | | | 1,624,735 | | |
Interest and dividends receivable | | | 89,485 | | | | 121,002 | | | | 22,392 | | |
Receivable for capital shares issued | | | 4,643 | | | | 1,438,738 | | | | 4,797 | | |
Receivable for investments sold | | | 5,548,288 | | | | 100,990 | | | | 55,856 | | |
Receivable from Adviser | | | 70,953 | | | | 5,498 | | | | 7,270 | | |
Prepaid expenses | | | 11,448 | | | | 20,257 | | | | 29,328 | | |
Total Assets | | | 288,392,409 | | | | 336,038,653 | | | | 83,061,116 | | |
LIABILITIES: | |
Payables: | |
Collateral received on loaned securities | | | 21,076,108 | | | | 55,379,879 | | | | 10,839,553 | | |
Investments purchased | | | 6,496,021 | | | | 2,356,636 | | | | 507,809 | | |
Capital shares redeemed | | | 328,012 | | | | 145,135 | | | | 94 | | |
Accrued expenses and other payables: | |
Investment advisory fees | | | 157,788 | | | | 220,761 | | | | 42,904 | | |
Administration fees | | | 12,940 | | | | 13,586 | | | | 3,522 | | |
Custodian fees | | | 1,736 | | | | 497 | | | | 398 | | |
Transfer agent fees | | | 28,565 | | | | 38,439 | | | | 10,325 | | |
Chief Compliance Officer fees | | | 171 | | | | 177 | | | | 47 | | |
Trustees' fees | | | 115 | | | | 118 | | | | 24 | | |
| 12b-1 fees | | | 24,937 | | | | 24,461 | | | | 7,363 | | |
Other accrued expenses | | | 14,918 | | | | 8,427 | | | | 7,101 | | |
Total Liabilities | | | 28,141,311 | | | | 58,188,116 | | | | 11,419,140 | | |
NET ASSETS: | |
Capital | | | 162,960,740 | | | | 186,877,024 | | | | 48,511,456 | | |
Total distributable earnings/(loss) | | | 97,290,358 | | | | 90,973,513 | | | | 23,130,520 | | |
Net Assets | | $ | 260,251,098 | | | $ | 277,850,537 | | | $ | 71,641,976 | | |
Net Assets | |
Class A Shares | | $ | 223,397,188 | | | $ | 186,323,615 | | | $ | 64,577,313 | | |
Class C Shares | | | 4,753,542 | | | | 13,418,652 | | | | 633,775 | | |
Class R Shares | | | 521,097 | | | | 809,000 | | | | 2,797,607 | | |
Class Y Shares | | | 31,579,271 | | | | 77,299,270 | | | | 3,633,281 | | |
Total | | $ | 260,251,098 | | | $ | 277,850,537 | | | $ | 71,641,976 | | |
Shares (unlimited number of shares authorized
with a par value of $0.001 per share): | |
Class A Shares | | | 10,991,063 | | | | 7,847,090 | | | | 3,779,056 | | |
Class C Shares | | | 280,095 | | | | 722,493 | | | | 109,742 | | |
Class R Shares | | | 28,106 | | | | 39,879 | | | | 206,192 | | |
Class Y Shares | | | 1,493,231 | | | | 3,024,400 | | | | 207,427 | | |
Total | | | 12,792,495 | | | | 11,633,862 | | | | 4,302,417 | | |
Net asset value, offering (except Class A Shares)
and redemption price per share: | |
Class A Shares | | $ | 20.33 | | | $ | 23.74 | | | $ | 17.09 | | |
Class C Shares (d) | | | 16.97 | | | | 18.57 | | | | 5.78 | | |
Class R Shares | | | 18.54 | | | | 20.29 | | | | 13.57 | | |
Class Y Shares | | | 21.15 | | | | 25.56 | | | | 17.52 | | |
Maximum Sales Charge — Class A Shares | | | 5.75 | % | | | 5.75 | % | | | 5.75 | % | |
Maximum offering price
(100%/(100%-maximum sales charge) of
net asset value adjusted to the nearest cent)
per share — Class A Shares | | $ | 21.57 | | | $ | 25.19 | | | $ | 18.13 | | |
(a) Includes $20,665,064 of securities on loan.
(b) Includes $54,597,012 of securities on loan.
(c) Includes $10,832,077 of securities on loan.
(d) Redemption price per share varies by the length of time shares are held.
See notes to financial statements.
26
Victory Portfolios | | Statements of Operations
For the Six Months Ended June 30, 2019 | |
(Unaudited)
| | | Victory
RS Small Cap
Growth Fund | | Victory
RS Select
Growth Fund | | Victory
RS Mid Cap
Growth Fund | |
Investment Income: | |
Dividends | | $ | 3,215,078 | | | $ | 453,662 | | | $ | 1,142,504 | | |
Interest | | | 566,994 | | | | 34,477 | | | | 85,829 | | |
Securities lending (net of fees) | | | 238,161 | | | | 22,021 | | | | 27,361 | | |
Foreign tax withholding | | | — | | | | — | | | | (15,639 | ) | |
Total Income | | | 4,020,233 | | | | 510,160 | | | | 1,240,055 | | |
Expenses: | |
Investment advisory fees | | | 9,515,106 | | | | 1,300,790 | | | | 1,790,550 | | |
Administration fees | | | 632,556 | | | | 82,209 | | | | 133,005 | | |
12b-1 fees — Class A Shares | | | 777,181 | | | | 128,636 | | | | 109,155 | | |
12b-1 fees — Class C Shares | | | 83,714 | | | | 166,749 | | | | 105,024 | | |
12b-1 fees — Class R Shares | | | 21,366 | | | | 2,100 | | | | 2,940 | | |
Custodian fees | | | 37,947 | | | | 6,473 | | | | 9,443 | | |
Transfer agent fees | | | 61,672 | | | | 18,208 | | | | 13,128 | | |
Transfer agent fees — Class A Shares | | | 403,811 | | | | 73,573 | | | | 58,878 | | |
Transfer agent fees — Class C Shares | | | 9,229 | | | | 20,863 | | | | 9,803 | | |
Transfer agent fees — Class R Shares | | | 7,057 | | | | 2,004 | | | | 2,442 | | |
Transfer agent fees — Class R6 Shares | | | 2,791 | | | | 49 | | | | 83 | | |
Transfer agent fees — Class Y Shares | | | 528,733 | | | | 69,990 | | | | 160,314 | | |
Trustees' fees | | | 84,261 | | | | 12,590 | | | | 17,470 | | |
Chief Compliance Officer fees | | | 7,948 | | | | 1,118 | | | | 1,638 | | |
Legal and audit fees | | | 80,034 | | | | 14,732 | | | | 19,659 | | |
State registration and filing fees | | | 75,729 | | | | 40,192 | | | | 52,287 | | |
Interfund lending fees | | | — | | | | 976 | | | | — | | |
Other expenses | | | 105,783 | | | | 20,919 | | | | 21,395 | | |
Total Expenses | | | 12,434,918 | | | | 1,962,171 | | | | 2,507,214 | | |
Expenses waived/reimbursed by Adviser | | | (224,361 | ) | | | (167,694 | ) | | | (265,237 | ) | |
Net Expenses | | | 12,210,557 | | | | 1,794,477 | | | | 2,241,977 | | |
Net Investment Income (Loss) | | | (8,190,324 | ) | | | (1,284,317 | ) | | | (1,001,922 | ) | |
Realized/Unrealized Gains (Losses) from
Investments: | |
Net realized gains (losses) from investment
securities | | | 91,094,416 | | | | 26,004,430 | | | | 8,116,052 | | |
Net change in unrealized appreciation/depreciation
on investment securities | | | 434,012,759 | | | | 35,723,214 | | | | 99,926,019 | | |
Net realized/unrealized gains (losses)
on investments | | | 525,107,175 | | | | 61,727,644 | | | | 108,042,071 | | |
Change in net assets resulting from operations | | $ | 516,916,851 | | | $ | 60,443,327 | | | $ | 107,040,149 | | |
See notes to financial statements.
27
Victory Portfolios | | Statements of Operations
For the Six Months Ended June 30, 2019 | |
(Unaudited)
| | | Victory
RS Growth Fund | | Victory
RS Science and
Technology Fund | | Victory
RS Small Cap
Equity Fund | |
Investment Income: | |
Dividends | | $ | 1,251,042 | | | $ | 197,700 | | | $ | 107,296 | | |
Interest | | | 38,607 | | | | 75,682 | | | | 14,866 | | |
Securities lending (net of fees) | | | 63,136 | | | | 159,655 | | | | 8,926 | | |
Foreign tax withholding | | | (12,971 | ) | | | — | | | | — | | |
Total Income | | | 1,339,814 | | | | 433,037 | | | | 131,088 | | |
Expenses: | |
Investment advisory fees | | | 930,411 | | | | 1,264,662 | | | | 250,253 | | |
Administration fees | | | 78,372 | | | | 79,869 | | | | 21,079 | | |
12b-1 fees — Class A Shares | | | 266,002 | | | | 213,966 | | | | 75,286 | | |
12b-1 fees — Class C Shares | | | 24,022 | | | | 70,563 | | | | 3,202 | | |
12b-1 fees — Class R Shares | | | 1,252 | | | | 1,994 | | | | 6,534 | | |
Custodian fees | | | 5,875 | | | | 6,496 | | | | 2,132 | | |
Transfer agent fees | | | 8,395 | | | | 4,648 | | | | 1,900 | | |
Transfer agent fees — Class A Shares | | | 86,260 | | | | 88,558 | | | | 31,109 | | |
Transfer agent fees — Class C Shares | | | 2,912 | | | | 6,513 | | | | 238 | | |
Transfer agent fees — Class R Shares | | | 1,774 | | | | 2,352 | | | | 2,839 | | |
Transfer agent fees — Class Y Shares | | | 9,722 | | | | 34,800 | | | | 653 | | |
Trustees' fees | | | 10,740 | | | | 10,643 | | | | 2,962 | | |
Chief Compliance Officer fees | | | 1,002 | | | | 1,001 | | | | 270 | | |
Legal and audit fees | | | 13,327 | | | | 13,357 | | | | 6,367 | | |
State registration and filing fees | | | 35,150 | | | | 39,815 | | | | 30,323 | | |
Interfund lending fees | | | 30 | | | | — | | | | — | | |
Other expenses | | | 12,631 | | | | 17,576 | | | | 5,745 | | |
Total Expenses | | | 1,487,877 | | | | 1,856,813 | | | | 440,892 | | |
Expenses waived/reimbursed by Adviser | | | (141,084 | ) | | | (12,953 | ) | | | (15,147 | ) | |
Net Expenses | | | 1,346,793 | | | | 1,843,860 | | | | 425,745 | | |
Net Investment Income (Loss) | | | (6,979 | ) | | | (1,410,823 | ) | | | (294,657 | ) | |
Realized/Unrealized Gains (Losses) from
Investments: | |
Net realized gains (losses) from investment
securities | | | 14,381,694 | | | | 26,347,762 | | | | 4,054,462 | | |
Net change in unrealized appreciation/depreciation
on investment securities | | | 37,508,804 | | | | 35,922,013 | | | | 14,068,681 | | |
Net realized/unrealized gains (losses) on
investments | | | 51,890,498 | | | | 62,269,775 | | | | 18,123,143 | | |
Change in net assets resulting from operations | | $ | 51,883,519 | | | $ | 60,858,952 | | | $ | 17,828,486 | | |
See notes to financial statements.
28
Victory Portfolios | | Statements of Changes in Net Assets | |
| | | Victory
RS Small Cap Growth Fund | | Victory
RS Select Growth Fund | | Victory
RS Mid Cap Growth Fund | |
| | | Six
Months
Ended
June 30,
2019 | | Year
Ended
December 31,
2018 | | Six
Months
Ended
June 30,
2019 | | Year
Ended
December 31,
2018 | | Six
Months
Ended
June 30,
2019 | | Year
Ended
December 31,
2018 | |
| | | (Unaudited) | | | | (Unaudited) | | | | (Unaudited) | | | |
From Investment
Activities: | |
Operations: | |
Net investment
income (loss) | | $ | (8,190,324 | ) | | $ | (14,995,332 | ) | | $ | (1,284,317 | ) | | $ | (3,232,574 | ) | | $ | (1,001,922 | ) | | $ | (1,546,774 | ) | |
Net realized gains
(losses) from
investments | | | 91,094,416 | | | | 252,184,350 | | | | 26,004,430 | | | | 77,904,223 | | | | 8,116,052 | | | | 40,686,227 | | |
Net change in
unrealized
appreciation/
depreciation
on investments | | | 434,012,759 | | | | (419,205,443 | ) | | | 35,723,214 | | | | (91,949,344 | ) | | | 99,926,019 | | | | (75,203,742 | ) | |
Change in net assets
resulting from
operations | | | 516,916,851 | | | | (182,016,425 | ) | | | 60,443,327 | | | | (17,277,695 | ) | | | 107,040,149 | | | | (36,064,289 | ) | |
Distributions to
Shareholders: | |
Class A Shares | | | — | | | | (86,181,961 | ) | | | — | | | | (32,610,434 | ) | | | — | | | | (12,442,159 | ) | |
Class C Shares | | | — | | | | (2,657,586 | ) | | | — | | | | (13,368,504 | ) | | | — | | | | (3,176,582 | ) | |
Class R Shares | | | — | | | | (1,376,192 | ) | | | — | | | | (276,329 | ) | | | — | | | | (212,737 | ) | |
Class R6 Shares | | | — | | | | (14,758,716 | ) | | | — | | | | (72,946 | ) | | | — | | | | (572,379 | ) | |
Class Y Shares | | | — | | | | (169,651,115 | ) | | | — | | | | (42,950,796 | ) | | | — | | | | (38,217,832 | ) | |
From return of capital: | |
Class A Shares | | | — | | | | — | | | | — | | | | — | | | | — | | | | (467,768 | ) | |
Class C Shares | | | — | | | | — | | | | — | | | | — | | | | — | | | | (119,425 | ) | |
Class R Shares | | | — | | | | — | | | | — | | | | — | | | | — | | | | (7,998 | ) | |
Class R6 Shares | | | — | | | | — | | | | — | | | | — | | | | — | | | | (21,519 | ) | |
Class Y Shares | | | — | | | | — | | | | — | | | | — | | | | — | | | | (1,436,814 | ) | |
Change in net assets
resulting from
distributions to
shareholders | | | — | | | | (274,625,570 | ) | | | — | | | | (89,279,009 | ) | | | — | | | | (56,675,213 | ) | |
Change in net assets
resulting from
capital transactions | | | 87,117,447 | | | | 353,743,296 | | | | (53,621,945 | ) | | | (90,253,951 | ) | | | 82,928,661 | | | | (11,193,976 | ) | |
Change in net assets | | | 604,034,298 | | | | (102,898,699 | ) | | | 6,821,382 | | | | (196,810,655 | ) | | | 189,968,810 | | | | (103,933,478 | ) | |
Net Assets: | |
Beginning of period | | | 1,600,637,045 | | | | 1,703,535,744 | | | | 247,783,120 | | | | 444,593,775 | | | | 341,469,122 | | | | 445,402,600 | | |
End of period | | $ | 2,204,671,343 | | | $ | 1,600,637,045 | | | $ | 254,604,502 | | | $ | 247,783,120 | | | $ | 531,437,932 | | | $ | 341,469,122 | | |
(continues on next page)
See notes to financial statements.
29
Victory Portfolios | | Statements of Changes in Net Assets | |
(continued)
| | | Victory
RS Small Cap Growth Fund | | Victory
RS Select Growth Fund | | Victory
RS Mid Cap Growth Fund | |
| | | Six
Months
Ended
June 30,
2019 | | Year
Ended
December 31,
2018 | | Six
Months
Ended
June 30,
2019 | | Year
Ended
December 31,
2018 | | Six
Months
Ended
June 30,
2019 | | Year
Ended
December 31,
2018 | |
| | | (Unaudited) | | | | (Unaudited) | | | | (Unaudited) | | | |
Capital Transactions: | |
Class A Shares | |
Proceeds from
shares issued | | $ | 101,285,068 | | | $ | 105,278,656 | | | $ | 4,851,123 | | | $ | 14,046,816 | | | $ | 4,294,580 | | | $ | 8,751,587 | | |
Distributions
reinvested | | | — | | | | 82,149,195 | | | | — | | | | 31,279,068 | | | | — | | | | 12,442,557 | | |
Cost of shares
redeemed | | | (68,400,378 | ) | | | (126,357,303 | ) | | | (16,248,920 | ) | | | (58,561,445 | ) | | | (8,428,218 | ) | | | (35,922,137 | ) | |
Total Class A
Shares | | $ | 32,884,690 | | | $ | 61,070,548 | | | $ | (11,397,797 | ) | | $ | (13,235,561 | ) | | $ | (4,133,638 | ) | | $ | (14,727,993 | ) | |
Class C Shares | |
Proceeds from
shares issued | | $ | 2,221,453 | | | $ | 8,087,931 | | | $ | 570,661 | | | $ | 3,457,448 | | | $ | 561,713 | | | $ | 2,830,669 | | |
Distributions
reinvested | | | — | | | | 2,345,566 | | | | — | | | | 12,670,417 | | | | — | | | | 2,550,620 | | |
Cost of shares
redeemed | | | (2,261,806 | ) | | | (5,957,121 | ) | | | (7,257,352 | ) | | | (19,496,179 | ) | | | (1,890,384 | ) | | | (5,849,733 | ) | |
Total Class C
Shares | | $ | (40,353 | ) | | $ | 4,476,376 | | | $ | (6,686,691 | ) | | $ | (3,368,314 | ) | | $ | (1,328,671 | ) | | $ | (468,444 | ) | |
Class R Shares | |
Proceeds from
shares issued | | $ | 2,153,021 | | | $ | 6,973,887 | | | $ | 121,170 | | | $ | 461,702 | | | $ | 61,939 | | | $ | 266,779 | | |
Distributions
reinvested | | | — | | | | 1,376,192 | | | | — | | | | 123,655 | | | | — | | | | 220,735 | | |
Cost of shares
redeemed | | | (2,212,208 | ) | | | (6,397,173 | ) | | | (159,744 | ) | | | (577,116 | ) | | | (567,673 | ) | | | (708,430 | ) | |
Total Class R
Shares | | $ | (59,187 | ) | | $ | 1,952,906 | | | $ | (38,574 | ) | | $ | 8,241 | | | $ | (505,734 | ) | | $ | (220,916 | ) | |
Class R6 Shares | |
Proceeds from
shares issued | | $ | 177,454,128 | | | $ | 124,843,919 | | | $ | 2,866 | | | $ | 117,936 | | | $ | 10,905,174 | | | $ | 2,219,318 | | |
Distributions
reinvested | | | — | | | | 14,369,574 | | | | — | | | | 72,946 | | | | — | | | | 593,898 | | |
Cost of shares
redeemed | | | (29,436,261 | ) | | | (19,320,964 | ) | | | (26,503 | ) | | | (1,210 | ) | | | (307,891 | ) | | | (99,947 | ) | |
Total Class R6
Shares | | $ | 148,017,867 | | | $ | 119,892,529 | | | $ | (23,637 | ) | | $ | 189,672 | | | $ | 10,597,283 | | | $ | 2,713,269 | | |
Class Y Shares | |
Proceeds from
shares issued | | $ | 156,070,535 | | | $ | 416,879,341 | | | $ | 8,691,558 | | | $ | 28,684,557 | | | $ | 164,241,375 | | | $ | 227,492,113 | | |
Distributions
reinvested | | | — | | | | 148,024,895 | | | | — | | | | 39,382,125 | | | | — | | | | 38,045,473 | | |
Cost of shares
redeemed | | | (249,756,105 | ) | | | (398,553,299 | ) | | | (44,166,804 | ) | | | (141,914,671 | ) | | | (85,941,954 | ) | | | (264,027,478 | ) | |
Total Class Y
Shares | | $ | (93,685,570 | ) | | $ | 166,350,937 | | | $ | (35,475,246 | ) | | $ | (73,847,989 | ) | | $ | 78,299,421 | | | $ | 1,510,108 | | |
Change in net assets
resulting from capital
transactions | | $ | 87,117,447 | | | $ | 353,743,296 | | | $ | (53,621,945 | ) | | $ | (90,253,951 | ) | | $ | 82,928,661 | | | $ | (11,193,976 | ) | |
(continues on next page)
See notes to financial statements.
30
Victory Portfolios | | Statements of Changes in Net Assets | |
(continued)
| | | Victory
RS Small Cap Growth Fund | | Victory
RS Select Growth Fund | | Victory
RS Mid Cap Growth Fund | |
| | | Six
Months
Ended
June 30,
2019 | | Year
Ended
December 31,
2018 | | Six
Months
Ended
June 30,
2019 | | Year
Ended
December 31,
2018 | | Six
Months
Ended
June 30,
2019 | | Year
Ended
December 31,
2018 | |
| | | (Unaudited) | | | | (Unaudited) | | | | (Unaudited) | | | |
Share Transactions: | |
Class A Shares | |
Issued | | | 1,365,841 | | | | 1,200,807 | | | | 147,782 | | | | 302,025 | | | | 179,397 | | | | 348,050 | | |
Reinvested | | | — | | | | 1,356,269 | | | | — | | | | 1,097,126 | | | | — | | | | 629,047 | | |
Redeemed | | | (919,714 | ) | | | (1,490,844 | ) | | | (482,649 | ) | | | (1,344,789 | ) | | | (352,083 | ) | | | (1,397,550 | ) | |
Total Class A
Shares | | | 446,127 | | | | 1,066,232 | | | | (334,867 | ) | | | 54,362 | | | | (172,686 | ) | | | (420,453 | ) | |
Class C Shares | |
Issued | | | 36,770 | | | | 110,706 | | | | 21,089 | | | | 96,266 | | | | 28,008 | | | | 145,805 | | |
Reinvested | | | — | | | | 45,334 | | | | — | | | | 540,086 | | | | — | | | | 147,862 | | |
Redeemed | | | (35,737 | ) | | | (85,559 | ) | | | (262,575 | ) | | | (558,364 | ) | | | (89,430 | ) | | | (256,898 | ) | |
Total Class C
Shares | | | 1,033 | | | | 70,481 | | | | (241,486 | ) | | | 77,988 | | | | (61,422 | ) | | | 36,769 | | |
Class R Shares | |
Issued | | | 31,457 | | | | 82,863 | | | | 4,657 | | | | 13,459 | | | | 2,919 | | | | 10,366 | | |
Reinvested | | | — | | | | 24,845 | | | | — | | | | 5,198 | | | | — | | | | 12,162 | | |
Redeemed | | | (32,550 | ) | | | (79,211 | ) | | | (5,738 | ) | | | (14,324 | ) | | | (25,332 | ) | | | (29,842 | ) | |
Total Class R
Shares | | | (1,093 | ) | | | 28,497 | | | | (1,081 | ) | | | 4,333 | | | | (22,413 | ) | | | (7,314 | ) | |
Class R6 Shares | |
Issued | | | 2,314,493 | | | | 1,459,295 | | | | 81 | | | | 2,231 | | | | 427,567 | | | | 77,219 | | |
Reinvested | | | — | | | | 227,151 | | | | — | | | | 2,430 | | | | — | | | | 28,900 | | |
Redeemed | | | (379,852 | ) | | | (217,059 | ) | | | (773 | ) | | | (24 | ) | | | (11,905 | ) | | | (3,537 | ) | |
Total Class R6
Shares | | | 1,934,641 | | | | 1,469,387 | | | | (692 | ) | | | 4,637 | | | | 415,662 | | | | 102,582 | | |
Class Y Shares | |
Issued | | | 2,062,608 | | | | 4,671,397 | | | | 253,618 | | | | 606,709 | | | | 6,535,338 | | | | 8,077,236 | | |
Reinvested | | | — | | | | 2,342,907 | | | | — | | | | 1,315,368 | | | | — | | | | 1,852,263 | | |
Redeemed | | | (3,224,087 | ) | | | (4,774,238 | ) | | | (1,245,618 | ) | | | (3,107,726 | ) | | | (3,516,189 | ) | | | (9,888,828 | ) | |
Total Class Y
Shares | | | (1,161,479 | ) | | | 2,240,066 | | | | (992,000 | ) | | | (1,185,649 | ) | | | 3,019,149 | | | | 40,671 | | |
Change in Shares | | | 1,219,229 | | | | 4,874,663 | | | | (1,570,126 | ) | | | (1,044,329 | ) | | | 3,178,290 | | | | (247,745 | ) | |
See notes to financial statements.
31
Victory Portfolios | | Statements of Changes in Net Assets | |
| | | Victory
RS Growth Fund | | Victory
RS Science and
Technology Fund | | Victory
RS Small Cap Equity Fund | |
| | | Six
Months
Ended
June 30,
2019 | | Year
Ended
December 31,
2018 | | Six
Months
Ended
June 30,
2019 | | Year
Ended
December 31,
2018 | | Six
Months
Ended
June 30,
2019 | | Year
Ended
December 31,
2018 | |
| | | (Unaudited) | | | | (Unaudited) | | | | (Unaudited) | | | |
From Investment Activities: | |
Operations: | |
Net investment
income (loss) | | $ | (6,979 | ) | | $ | (700,567 | ) | | $ | (1,410,823 | ) | | $ | (2,560,543 | ) | | $ | (294,657 | ) | | $ | (595,282 | ) | |
Net realized gains
(losses) from
investments | | | 14,381,694 | | | | 28,910,507 | | | | 26,347,762 | | | | 29,219,309 | | | | 4,054,462 | | | | 14,361,115 | | |
Net change in
unrealized
appreciation/
depreciation on
investments | | | 37,508,804 | | | | (43,461,446 | ) | | | 35,922,013 | | | | (35,986,495 | ) | | | 14,068,681 | | | | (18,554,821 | ) | |
Change in net assets resulting
from operations | | | 51,883,519 | | | | (15,251,506 | ) | | | 60,858,952 | | | | (9,327,729 | ) | | | 17,828,486 | | | | (4,788,988 | ) | |
Distributions to Shareholders: | |
Class A Shares | | | — | | | | (27,566,639 | ) | | | — | | | | (20,359,029 | ) | | | — | | | | (13,226,281 | ) | |
Class C Shares | | | — | | | | (842,729 | ) | | | — | | | | (2,120,416 | ) | | | — | | | | (209,470 | ) | |
Class R Shares | | | — | | | | (107,275 | ) | | | — | | | | (192,779 | ) | | | — | | | | (780,300 | ) | |
Class Y Shares | | | — | | | | (3,780,962 | ) | | | — | | | | (7,184,754 | ) | | | — | | | | (533,247 | ) | |
Change in net assets resulting
from distributions to
shareholders | | | — | | | | (32,297,605 | ) | | | — | | | | (29,856,978 | ) | | | — | | | | (14,749,298 | ) | |
Change in net assets resulting
from capital transactions | | | (11,234,002 | ) | | | 10,800,103 | | | | 10,643,508 | | | | 53,948,216 | | | | (3,473,991 | ) | | | 999,823 | | |
Change in net assets | | | 40,649,517 | | | | (36,749,008 | ) | | | 71,502,460 | | | | 14,763,509 | | | | 14,354,495 | | | | (18,538,463 | ) | |
Net Assets: | |
Beginning of period | | | 219,601,581 | | | | 256,350,589 | | | | 206,348,077 | | | | 191,584,568 | | | | 57,287,481 | | | | 75,825,944 | | |
End of period | | $ | 260,251,098 | | | $ | 219,601,581 | | | $ | 277,850,537 | | | $ | 206,348,077 | | | $ | 71,641,976 | | | $ | 57,287,481 | | |
(continues on next page)
See notes to financial statements.
32
Victory Portfolios | | Statements of Changes in Net Assets | |
(continued)
| | | Victory
RS Growth Fund | | Victory
RS Science and
Technology Fund | | Victory
RS Small Cap Equity Fund | |
| | | Six
Months
Ended
June 30,
2019 | | Year
Ended
December 31,
2018 | | Six
Months
Ended
June 30,
2019 | | Year
Ended
December 31,
2018 | | Six
Months
Ended
June 30,
2019 | | Year
Ended
December 31,
2018 | |
| | | (Unaudited) | | | | (Unaudited) | | | | (Unaudited) | | | |
Capital Transactions: | |
Class A Shares | |
Proceeds from shares
issued | | $ | 2,062,704 | | | $ | 6,647,316 | | | $ | 18,667,819 | | | $ | 45,799,664 | | | $ | 1,061,287 | | | $ | 2,996,513 | | |
Distributions reinvested | | | — | | | | 26,853,288 | | | | — | | | | 19,428,046 | | | | — | | | | 13,049,204 | | |
Cost of shares redeemed | | | (11,347,000 | ) | | | (22,877,989 | ) | | | (14,258,040 | ) | | | (47,927,603 | ) | | | (4,189,483 | ) | | | (12,380,756 | ) | |
Total Class A Shares | | $ | (9,284,296 | ) | | $ | 10,622,615 | | | $ | 4,409,779 | | | $ | 17,300,107 | | | $ | (3,128,196 | ) | | $ | 3,664,961 | | |
Class C Shares | |
Proceeds from shares
issued | | $ | 90,698 | | | $ | 890,775 | | | $ | 1,610,125 | | | $ | 3,866,344 | | | $ | 14,491 | | | $ | 528,709 | | |
Distributions reinvested | | | — | | | | 689,704 | | | | — | | | | 1,929,817 | | | | — | | | | 209,470 | | |
Cost of shares redeemed | | | (745,237 | ) | | | (2,955,385 | ) | | | (3,397,691 | ) | | | (3,343,244 | ) | | | (173,496 | ) | | | (395,878 | ) | |
Total Class C Shares | | $ | (654,539 | ) | | $ | (1,374,906 | ) | | $ | (1,787,566 | ) | | $ | 2,452,917 | | | $ | (159,005 | ) | | $ | 342,301 | | |
Class R Shares | |
Proceeds from shares
issued | | $ | 24,175 | | | $ | 160,857 | | | $ | 91,532 | | | $ | 227,735 | | | $ | 143,937 | | | $ | 378,935 | | |
Distributions reinvested | | | — | | | | 107,275 | | | | — | | | | 192,779 | | | | — | | | | 780,300 | | |
Cost of shares redeemed | | | (125,846 | ) | | | (421,435 | ) | | | (196,569 | ) | | | (1,256,857 | ) | | | (343,925 | ) | | | (1,202,751 | ) | |
Total Class R Shares | | $ | (101,671 | ) | | $ | (153,303 | ) | | $ | (105,037 | ) | | $ | (836,343 | ) | | $ | (199,988 | ) | | $ | (43,516 | ) | |
Class Y Shares | |
Proceeds from shares
issued | | $ | 1,013,145 | | | $ | 3,514,242 | | | $ | 24,425,830 | | | $ | 67,459,196 | | | $ | 227,869 | | | $ | 1,935,138 | | |
Distributions reinvested | | | — | | | | 3,588,161 | | | | — | | | | 6,895,347 | | | | — | | | | 530,782 | | |
Cost of shares redeemed | | | (2,206,641 | ) | | | (5,396,706 | ) | | | (16,299,498 | ) | | | (39,323,008 | ) | | | (214,671 | ) | | | (5,429,843 | ) | |
Total Class Y Shares | | $ | (1,193,496 | ) | | $ | 1,705,697 | | | $ | 8,126,332 | | | $ | 35,031,535 | | | $ | 13,198 | | | $ | (2,963,923 | ) | |
Change in net assets resulting
from capital transactions | | $ | (11,234,002 | ) | | $ | 10,800,103 | | | $ | 10,643,508 | | | $ | 53,948,216 | | | $ | (3,473,991 | ) | | $ | 999,823 | | |
(continues on next page)
See notes to financial statements.
33
Victory Portfolios | | Statements of Changes in Net Assets | |
(continued)
| | | Victory
RS Growth Fund | | Victory
RS Science and
Technology Fund | | Victory
RS Small Cap Equity Fund | |
| | | Six
Months
Ended
June 30,
2019 | | Year
Ended
December 31,
2018 | | Six
Months
Ended
June 30,
2019 | | Year
Ended
December 31,
2018 | | Six
Months
Ended
June 30,
2019 | | Year
Ended
December 31,
2018 | |
| | | (Unaudited) | | | | (Unaudited) | | | | (Unaudited) | | | |
Share Transactions: | |
Class A Shares | |
Issued | | | 106,822 | | | | 310,179 | | | | 829,250 | | | | 1,863,602 | | | | 67,991 | | | | 147,464 | | |
Reinvested | | | — | | | | 1,650,479 | | | | — | | | | 1,077,540 | | | | — | | | | 1,016,293 | | |
Redeemed | | | (593,008 | ) | | | (1,077,534 | ) | | | (637,395 | ) | | | (2,057,895 | ) | | | (268,456 | ) | | | (654,258 | ) | |
Total Class A Shares | | | (486,186 | ) | | | 883,124 | | | | 191,855 | | | | 883,247 | | | | (200,465 | ) | | | 509,499 | | |
Class C Shares | |
Issued | | | 5,710 | | | | 53,479 | | | | 90,398 | | | | 206,957 | | | | 2,678 | | | | 77,353 | | |
Reinvested | | | — | | | | 50,531 | | | | — | | | | 136,190 | | | | — | | | | 48,044 | | |
Redeemed | | | (46,284 | ) | | | (172,906 | ) | | | (191,167 | ) | | | (187,012 | ) | | | (32,776 | ) | | | (40,999 | ) | |
Total Class C Shares | | | (40,574 | ) | | | (68,896 | ) | | | (100,769 | ) | | | 156,135 | | | | (30,098 | ) | | | 84,398 | | |
Class R Shares | |
Issued | | | 1,391 | | | | 7,993 | | | | 4,914 | | | | 10,724 | | | | 11,500 | | | | 22,190 | | |
Reinvested | | | — | | | | 7,205 | | | | — | | | | 12,486 | | | | — | | | | 76,350 | | |
Redeemed | | | (7,646 | ) | | | (24,044 | ) | | | (10,031 | ) | | | (67,986 | ) | | | (28,334 | ) | | | (85,841 | ) | |
Total Class R Shares | | | (6,255 | ) | | | (8,846 | ) | | | (5,117 | ) | | | (44,776 | ) | | | (16,834 | ) | | | 12,699 | | |
Class Y Shares | |
Issued | | | 50,633 | | | | 161,376 | | | | 1,015,419 | | | | 2,542,760 | | | | 14,845 | | | | 109,862 | | |
Reinvested | | | — | | | | 212,192 | | | | — | | | | 355,614 | | | | — | | | | 40,364 | | |
Redeemed | | | (109,964 | ) | | | (248,627 | ) | | | (698,843 | ) | | | (1,590,202 | ) | | | (14,421 | ) | | | (276,436 | ) | |
Total Class Y Shares | | | (59,331 | ) | | | 124,941 | | | | 316,576 | | | | 1,308,172 | | | | 424 | | | | (126,210 | ) | |
Change in Shares | | | (592,346 | ) | | | 930,323 | | | | 402,545 | | | | 2,302,778 | | | | (246,973 | ) | | | 480,386 | | |
See notes to financial statements.
34
This page is intentionally left blank.
35
Victory Portfolios | | Financial Highlights | |
For a Share Outstanding Throughout Each Period
| | | | Investment Activities | | Distributions to
Shareholders From | |
| | | Net Asset
Value,
Beginning of
Period | | Net
Investment
Income
(Loss)(a) | | Net Realized
and Unrealized
Gains (Losses)
on Investments | | Total from
Investment
Activities | | Net
Investment
Income | | Net Realized
Gains from
Investments | |
Victory RS Small Cap Growth Fund | |
Class A | |
Six Months Ended
6/30/19 (unaudited) | | $ | 61.11 | | | | (0.37 | ) | | | 19.51 | | | | 19.14 | | | | — | | | | — | | |
Year Ended 12/31/18 | | $ | 80.96 | | | | (0.83 | ) | | | (6.54 | ) | | | (7.37 | ) | | | — | | | | (12.48 | ) | |
Year Ended 12/31/17 | | $ | 65.31 | | | | (0.75 | ) | | | 24.13 | | | | 23.38 | | | | — | | | | (7.73 | ) | |
Year Ended 12/31/16 | | $ | 64.73 | | | | (0.55 | ) | | | 1.13 | | | | 0.58 | | | | — | | | | — | | |
Year Ended 12/31/15 | | $ | 65.53 | | | | (0.74 | ) | | | 0.80 | | | | 0.06 | | | | — | | | | (0.86 | ) | |
Year Ended 12/31/14 | | $ | 63.68 | | | | (0.71 | ) | | | 6.64 | | | | 5.93 | | | | (0.57 | ) | | | (3.51 | ) | |
Class C | |
Six Months Ended
6/30/19 (unaudited) | | $ | 52.19 | | | | (0.55 | ) | | | 16.64 | | | | 16.09 | | | | — | | | | — | | |
Year Ended 12/31/18 | | $ | 71.70 | | | | (1.31 | ) | | | (5.72 | ) | | | (7.03 | ) | | | — | | | | (12.48 | ) | |
Year Ended 12/31/17 | | $ | 58.97 | | | | (1.18 | ) | | | 21.64 | | | | 20.46 | | | | — | | | | (7.73 | ) | |
Year Ended 12/31/16 | | $ | 58.90 | | | | (0.90 | ) | | | 0.97 | | | | 0.07 | | | | — | | | | — | | |
Year Ended 12/31/15 | | $ | 60.15 | | | | (1.15 | ) | | | 0.76 | | | | (0.39 | ) | | | — | | | | (0.86 | ) | |
Year Ended 12/31/14 | | $ | 58.84 | | | | (1.09 | ) | | | 6.08 | | | | 4.99 | | | | (0.17 | ) | | | (3.51 | ) | |
Class R | |
Six Months Ended
6/30/19 (unaudited) | | $ | 55.87 | | | | (0.49 | ) | | | 17.82 | | | | 17.33 | | | | — | | | | — | | |
Year Ended 12/31/18 | | $ | 75.55 | | | | (1.15 | ) | | | (6.05 | ) | | | (7.20 | ) | | | — | | | | (12.48 | ) | |
Year Ended 12/31/17 | | $ | 61.63 | | | | (1.04 | ) | | | 22.69 | | | | 21.65 | | | | — | | | | (7.73 | ) | |
Year Ended 12/31/16 | | $ | 61.27 | | | | (0.68 | ) | | | 1.04 | | | | 0.36 | | | | — | | | | — | | |
Year Ended 12/31/15 | | $ | 62.28 | | | | (0.93 | ) | | | 0.78 | | | | (0.15 | ) | | | — | | | | (0.86 | ) | |
Year Ended 12/31/14 | | $ | 60.77 | | | | (0.94 | ) | | | 6.29 | | | | 5.35 | | | | (0.33 | ) | | | (3.51 | ) | |
Class R6 | |
Six Months Ended
6/30/19 (unaudited) | | $ | 63.83 | | | | (0.25 | ) | | | 20.39 | | | | 20.14 | | | | — | | | | — | | |
Year Ended 12/31/18 | | $ | 83.67 | | | | (0.58 | ) | | | (6.78 | ) | | | (7.36 | ) | | | — | | | | (12.48 | ) | |
7/12/17(f) through
12/31/17 | | $ | 79.23 | | | | (0.41 | ) | | | 12.58 | | | | 12.17 | | | | — | | | | (7.73 | ) | |
Class Y | |
Six Months Ended
6/30/19 (unaudited) | | $ | 63.75 | | | | (0.28 | ) | | | 20.36 | | | | 20.08 | | | | — | | | | — | | |
Year Ended 12/31/18 | | $ | 83.64 | | | | (0.61 | ) | | | (6.80 | ) | | | (7.41 | ) | | | — | | | | (12.48 | ) | |
Year Ended 12/31/17 | | $ | 67.08 | | | | (0.53 | ) | | | 24.82 | | | | 24.29 | | | | — | | | | (7.73 | ) | |
Year Ended 12/31/16 | | $ | 66.32 | | | | (0.39 | ) | | | 1.16 | | | | 0.77 | | | | (0.01 | ) | | | — | | |
Year Ended 12/31/15 | | $ | 67.04 | | | | (0.56 | ) | | | 0.81 | | | | 0.25 | | | | (0.11 | ) | | | (0.86 | ) | |
Year Ended 12/31/14 | | $ | 65.06 | | | | (0.54 | ) | | | 6.79 | | | | 6.25 | | | | (0.76 | ) | | | (3.51 | ) | |
(a) Per share net investment income (loss) has been calculated using the average daily shares method.
(b) Not annualized for periods less than one year.
(c) Annualized for periods less than one year.
(d) During the period, certain fees were reduced and/or reimbursed. If such fee reductions and/or reimbursements had not occurred, the ratios would have been as indicated.
(e) Portfolio turnover is calculated on the basis of the Fund as a whole without distinguishing between the classes of shares issued.
(f) Commencement of operations.
See notes to financial statements.
36
Victory Portfolios | | Financial Highlights — continued | |
For a Share Outstanding Throughout Each Period
| | | | Ratios to Average Net Assets | | Supplemental Data | |
| | | Total
Distributions
to
Shareholders | | Net Asset
Value,
End of
Period | | Total
Return
(Excludes
Sales
charge)(b) | | Net
Expenses(c) | | Net
Investment
Income
(Loss)(c) | | Gross
Expenses(c)(d) | | Net Assets,
End of
Period
(000's) | | Portfolio
Turnover(b)(e) | |
Victory RS Small Cap Growth Fund | |
Class A | |
Six Months Ended
6/30/19 (unaudited) | | | — | | | $ | 80.25 | | | | 31.34 | % | | | 1.40 | % | | | (1.00 | )% | | | 1.43 | % | | $ | 691,542 | | | | 47 | % | |
Year Ended 12/31/18 | | | (12.48 | ) | | $ | 61.11 | | | | (8.97 | )% | | | 1.40 | % | | | (0.94 | )% | | | 1.45 | % | | $ | 499,350 | | | | 86 | % | |
Year Ended 12/31/17 | | | (7.73 | ) | | $ | 80.96 | | | | 36.86 | % | | | 1.40 | % | | | (1.00 | )% | | | 1.44 | % | | $ | 575,227 | | | | 107 | % | |
Year Ended 12/31/16 | | | — | | | $ | 65.31 | | | | 0.90 | % | | | 1.40 | % | | | (0.92 | )% | | | 1.45 | % | | $ | 481,125 | | | | 91 | % | |
Year Ended 12/31/15 | | | (0.86 | ) | | $ | 64.73 | | | | 0.08 | % | | | 1.40 | % | | | (1.07 | )% | | | 1.41 | % | | $ | 767,304 | | | | 94 | % | |
Year Ended 12/31/14 | | | (4.08 | ) | | $ | 65.53 | | | | 9.36 | % | | | 1.38 | % | | | (1.12 | )% | | | 1.42 | % | | $ | 618,656 | | | | 104 | % | |
Class C | |
Six Months Ended
6/30/19 (unaudited) | | | — | | | $ | 68.28 | | | | 30.83 | % | | | 2.16 | % | | | (1.76 | )% | | | 2.26 | % | | $ | 17,865 | | | | 47 | % | |
Year Ended 12/31/18 | | | (12.48 | ) | | $ | 52.19 | | | | (9.66 | )% | | | 2.16 | % | | | (1.71 | )% | | | 2.26 | % | | $ | 13,602 | | | | 86 | % | |
Year Ended 12/31/17 | | | (7.73 | ) | | $ | 71.70 | | | | 35.84 | % | | | 2.16 | % | | | (1.75 | )% | | | 2.23 | % | | $ | 13,633 | | | | 107 | % | |
Year Ended 12/31/16 | | | — | | | $ | 58.97 | | | | 0.12 | % | | | 2.16 | % | | | (1.67 | )% | | | 2.22 | % | | $ | 13,035 | | | | 91 | % | |
Year Ended 12/31/15 | | | (0.86 | ) | | $ | 58.90 | | | | (0.67 | )% | | | 2.16 | % | | | (1.67 | )% | | | 2.22 | % | | $ | 20,878 | | | | 94 | % | |
Year Ended 12/31/14 | | | (3.68 | ) | | $ | 60.15 | | | | 8.52 | % | | | 2.15 | % | | | (1.88 | )% | | | 2.29 | % | | $ | 11,792 | | | | 104 | % | |
Class R | |
Six Months Ended
6/30/19 (unaudited) | | | — | | | $ | 73.20 | | | | 31.04 | % | | | 1.86 | % | | | (1.46 | )% | | | 1.91 | % | | $ | 9,465 | | | | 47 | % | |
Year Ended 12/31/18 | | | (12.48 | ) | | $ | 55.87 | | | | (9.39 | )% | | | 1.86 | % | | | (1.40 | )% | | | 1.87 | % | | $ | 7,285 | | | | 86 | % | |
Year Ended 12/31/17 | | | (7.73 | ) | | $ | 75.55 | | | | 36.24 | % | | | 1.86 | % | | | (1.46 | )% | | | 1.94 | % | | $ | 7,698 | | | | 107 | % | |
Year Ended 12/31/16 | | | — | | | $ | 61.63 | | | | 0.59 | % | | | 1.70 | % | | | (1.20 | )% | | | 1.70 | % | | $ | 5,371 | | | | 91 | % | |
Year Ended 12/31/15 | | | (0.86 | ) | | $ | 61.27 | | | | (0.26 | )% | | | 1.75 | % | | | (1.41 | )% | | | 1.75 | % | | $ | 5,241 | | | | 94 | % | |
Year Ended 12/31/14 | | | (3.84 | ) | | $ | 62.28 | | | | 8.86 | % | | | 1.84 | % | | | (1.58 | )% | | | 1.88 | % | | $ | 2,621 | | | | 104 | % | |
Class R6 | |
Six Months Ended
6/30/19 (unaudited) | | | — | | | $ | 83.97 | | | | 31.55 | % | | | 1.06 | % | | | (0.65 | )% | | | 1.06 | % | | $ | 311,471 | | | | 47 | % | |
Year Ended 12/31/18 | | | (12.48 | ) | | $ | 63.83 | | | | (8.66 | )% | | | 1.06 | % | | | (0.64 | )% | | | 1.10 | % | | $ | 113,288 | | | | 86 | % | |
7/12/17(f) through
12/31/17 | | | (7.73 | ) | | $ | 83.67 | | | | 16.23 | % | | | 1.06 | % | | | (1.03 | )% | | | 1.41 | % | | $ | 25,551 | | | | 107 | % | |
Class Y | |
Six Months Ended
6/30/19 (unaudited) | | | — | | | $ | 83.83 | | | | 31.50 | % | | | 1.13 | % | | | (0.73 | )% | | | 1.15 | % | | $ | 1,174,328 | | | | 47 | % | |
Year Ended 12/31/18 | | | (12.48 | ) | | $ | 63.75 | | | | (8.72 | )% | | | 1.13 | % | | | (0.67 | )% | | | 1.15 | % | | $ | 967,112 | | | | 86 | % | |
Year Ended 12/31/17 | | | (7.73 | ) | | $ | 83.64 | | | | 37.23 | % | | | 1.13 | % | | | (0.68 | )% | | | 1.17 | % | | $ | 1,081,427 | | | | 107 | % | |
Year Ended 12/31/16 | | | (0.01 | ) | | $ | 67.08 | | | | 1.16 | % | | | 1.13 | % | | | (0.64 | )% | | | 1.21 | % | | $ | 1,379,669 | | | | 91 | % | |
Year Ended 12/31/15 | | | (0.97 | ) | | $ | 66.32 | | | | 0.36 | % | | | 1.13 | % | | | (0.79 | )% | | | 1.18 | % | | $ | 1,576,927 | | | | 94 | % | |
Year Ended 12/31/14 | | | (4.27 | ) | | $ | 67.04 | | | | 9.65 | % | | | 1.11 | % | | | (0.84 | )% | | | 1.13 | % | | $ | 504,974 | | | | 104 | % | |
See notes to financial statements.
37
Victory Portfolios | | Financial Highlights | |
For a Share Outstanding Throughout Each Period
| | | | Investment Activities | | Distributions
to
Shareholders
From | | | |
| | | Net Asset
Value,
Beginning of
Period | | Net
Investment
Income
(Loss)(a) | | Net Realized
and Unrealized
Gains (Losses)
on Investments | | Total from
Investment
Activities | | Net Realized
Gains from
Investments | | Total
Distributions
to
Shareholders | | Net Asset
Value,
End of
Period | | Total
Return
(Excludes
Sales
charge)(b) | |
Victory RS Select Growth Fund | |
Class A | |
Six Months Ended
6/30/19 (unaudited) | | $ | 28.96 | | | | (0.17 | ) | | | 7.69 | | | | 7.52 | | | | — | | | | — | | | $ | 36.48 | | | | 25.97 | % | |
Year Ended 12/31/18 | | $ | 46.03 | | | | (0.42 | ) | | | (3.12 | ) | | | (3.54 | ) | | | (13.53 | ) | | | (13.53 | ) | | $ | 28.96 | | | | (7.23 | )% | |
Year Ended 12/31/17 | | $ | 45.04 | | | | (0.43 | ) | | | 8.16 | | | | 7.73 | | | | (6.74 | ) | | | (6.74 | ) | | $ | 46.03 | | | | 17.10 | % | |
Year Ended 12/31/16 | | $ | 43.54 | | | | (0.32 | ) | | | 3.30 | | | | 2.98 | | | | (1.48 | ) | | | (1.48 | ) | | $ | 45.04 | | | | 6.85 | % | |
Year Ended 12/31/15 | | $ | 47.80 | | | | (0.41 | ) | | | 0.24 | | | | (0.17 | ) | | | (4.09 | ) | | | (4.09 | ) | | $ | 43.54 | | | | (0.38 | )% | |
Year Ended 12/31/14 | | $ | 49.57 | | | | (0.52 | ) | | | 1.08 | | | | 0.56 | | | | (2.33 | ) | | | (2.33 | ) | | $ | 47.80 | | | | 1.16 | % | |
Class C | |
Six Months Ended
6/30/19 (unaudited) | | $ | 23.82 | | | | (0.24 | ) | | | 6.31 | | | | 6.07 | | | | — | | | | — | | | $ | 29.89 | | | | 25.48 | % | |
Year Ended 12/31/18 | | $ | 40.80 | | | | (0.70 | ) | | | (2.75 | ) | | | (3.45 | ) | | | (13.53 | ) | | | (13.53 | ) | | $ | 23.82 | | | | (7.98 | )% | |
Year Ended 12/31/17 | | $ | 40.89 | | | | (0.73 | ) | | | 7.38 | | | | 6.65 | | | | (6.74 | ) | | | (6.74 | ) | | $ | 40.80 | | | | 16.19 | % | |
Year Ended 12/31/16 | | $ | 39.97 | | | | (0.60 | ) | | | 3.00 | | | | 2.40 | | | | (1.48 | ) | | | (1.48 | ) | | $ | 40.89 | | | | 6.04 | % | |
Year Ended 12/31/15 | | $ | 44.57 | | | | (0.74 | ) | | | 0.23 | | | | (0.51 | ) | | | (4.09 | ) | | | (4.09 | ) | | $ | 39.97 | | | | (1.17 | )% | |
Year Ended 12/31/14 | | $ | 46.73 | | | | (0.83 | ) | | | 1.00 | | | | 0.17 | | | | (2.33 | ) | | | (2.33 | ) | | $ | 44.57 | | | | 0.39 | % | |
Class R | |
Six Months Ended
6/30/19 (unaudited) | | $ | 24.16 | | | | (0.21 | ) | | | 6.41 | | | | 6.20 | | | | — | | | | — | | | $ | 30.36 | | | | 25.66 | % | |
Year Ended 12/31/18 | | $ | 41.06 | | | | (0.59 | ) | | | (2.78 | ) | | | (3.37 | ) | | | (13.53 | ) | | | (13.53 | ) | | $ | 24.16 | | | | (7.70 | )% | |
Year Ended 12/31/17 | | $ | 41.00 | | | | (0.61 | ) | | | 7.41 | | | | 6.80 | | | | (6.74 | ) | | | (6.74 | ) | | $ | 41.06 | | | | 16.51 | % | |
Year Ended 12/31/16 | | $ | 39.93 | | | | (0.46 | ) | | | 3.01 | | | | 2.55 | | | | (1.48 | ) | | | (1.48 | ) | | $ | 41.00 | | | | 6.39 | % | |
Year Ended 12/31/15 | | $ | 44.40 | | | | (0.59 | ) | | | 0.21 | | | | (0.38 | ) | | | (4.09 | ) | | | (4.09 | ) | | $ | 39.93 | | | | (0.88 | )% | |
Year Ended 12/31/14 | | $ | 46.38 | | | | (0.71 | ) | | | 1.06 | | | | — | | | | (2.33 | ) | | | (2.33 | ) | | $ | 44.40 | | | | 0.78 | % | |
Class R6 | |
Six Months Ended
6/30/19 (unaudited) | | $ | 30.50 | | | | (0.12 | ) | | | 8.10 | | | | 7.98 | | | | — | | | | — | | | $ | 38.48 | | | | 26.16 | % | |
Year Ended 12/31/18 | | $ | 47.53 | | | | (0.29 | ) | | | (3.21 | ) | | | (3.50 | ) | | | (13.53 | ) | | | (13.53 | ) | | $ | 30.50 | | | | (6.92 | )% | |
Year Ended 12/31/17 | | $ | 46.16 | | | | (0.28 | ) | | | 8.39 | | | | 8.11 | | | | (6.74 | ) | | | (6.74 | ) | | $ | 47.53 | | | | 17.48 | % | |
11/15/16(f) through
12/31/16 | | $ | 46.65 | | | | (0.03 | ) | | | 1.02 | | | | 0.99 | | | | (1.48 | ) | | | (1.48 | ) | | $ | 46.16 | | | | 2.15 | % | |
Class Y | |
Six Months Ended
6/30/19 (unaudited) | | $ | 30.41 | | | | (0.13 | ) | | | 8.08 | | | | 7.95 | | | | — | | | | — | | | $ | 38.36 | | | | 26.14 | % | |
Year Ended 12/31/18 | | $ | 47.47 | | | | (0.30 | ) | | | (3.23 | ) | | | (3.53 | ) | | | (13.53 | ) | | | (13.53 | ) | | $ | 30.41 | | | | (7.02 | )% | |
Year Ended 12/31/17 | | $ | 46.15 | | | | (0.31 | ) | | | 8.37 | | | | 8.06 | | | | (6.74 | ) | | | (6.74 | ) | | $ | 47.47 | | | | 17.40 | % | |
Year Ended 12/31/16 | | $ | 44.47 | | | | (0.21 | ) | | | 3.37 | | | | 3.16 | | | | (1.48 | ) | | | (1.48 | ) | | $ | 46.15 | | | | 7.13 | % | |
Year Ended 12/31/15 | | $ | 48.61 | | | | (0.29 | ) | | | 0.24 | | | | (0.05 | ) | | | (4.09 | ) | | | (4.09 | ) | | $ | 44.47 | | | | (0.12 | )% | |
Year Ended 12/31/14 | | $ | 50.24 | | | | (0.39 | ) | | | 1.09 | | | | 0.70 | | | | (2.33 | ) | | | (2.33 | ) | | $ | 48.61 | | | | 1.42 | % | |
(a) Per share net investment income (loss) has been calculated using the average daily shares method.
(b) Not annualized for periods less than one year.
(c) Annualized for periods less than one year.
(d) During the period, certain fees were reduced and/or reimbursed. If such fee reductions and/or reimbursements had not occurred, the ratios would have been as indicated.
See notes to financial statements.
38
Victory Portfolios | | Financial Highlights — continued | |
For a Share Outstanding Throughout Each Period
| | Ratios to Average Net Assets | | Supplemental Data | |
| | | Net
Expenses(c) | | Net
Investment
Income
(Loss)(c) | | Gross
Expenses(c)(d) | | Net Assets,
End of
Period
(000's) | | Portfolio
Turnover(b)(e) | |
Victory RS Select Growth Fund | |
Class A | |
Six Months Ended
6/30/19 (unaudited) | | | 1.40 | % | | | (1.01 | )% | | | 1.53 | % | | $ | 106,684 | | | | 42 | % | |
Year Ended 12/31/18 | | | 1.40 | % | | | (0.86 | )% | | | 1.50 | % | | $ | 94,393 | | | | 79 | % | |
Year Ended 12/31/17 | | | 1.40 | % | | | (0.88 | )% | | | 1.49 | % | | $ | 147,531 | | | | 69 | % | |
Year Ended 12/31/16 | | | 1.40 | % | | | (0.74 | )% | | | 1.47 | % | | $ | 170,825 | | | | 89 | % | |
Year Ended 12/31/15 | | | 1.40 | % | | | (0.84 | )% | | | 1.44 | % | | $ | 238 | | | | 86 | % | |
Year Ended 12/31/14 | | | 1.38 | % | | | (1.08 | )% | | | 1.43 | % | | $ | 284,499 | | | | 96 | % | |
Class C | |
Six Months Ended
6/30/19 (unaudited) | | | 2.18 | % | | | (1.79 | )% | | | 2.30 | % | | $ | 32,625 | | | | 42 | % | |
Year Ended 12/31/18 | | | 2.18 | % | | | (1.64 | )% | | | 2.25 | % | | $ | 31,754 | | | | 79 | % | |
Year Ended 12/31/17 | | | 2.18 | % | | | (1.66 | )% | | | 2.24 | % | | $ | 51,208 | | | | 69 | % | |
Year Ended 12/31/16 | | | 2.18 | % | | | (1.52 | )% | | | 2.23 | % | | $ | 63,841 | | | | 89 | % | |
Year Ended 12/31/15 | | | 2.18 | % | | | (1.62 | )% | | | 2.20 | % | | $ | 83 | | | | 86 | % | |
Year Ended 12/31/14 | | | 2.16 | % | | | (1.85 | )% | | | 2.25 | % | | $ | 86,025 | | | | 96 | % | |
Class R | |
Six Months Ended
6/30/19 (unaudited) | | | 1.91 | % | | | (1.52 | )% | | | 4.03 | % | | $ | 849 | | | | 42 | % | |
Year Ended 12/31/18 | | | 1.91 | % | | | (1.38 | )% | | | 3.60 | % | | $ | 701 | | | | 79 | % | |
Year Ended 12/31/17 | | | 1.91 | % | | | (1.39 | )% | | | 2.90 | % | | $ | 1,014 | | | | 69 | % | |
Year Ended 12/31/16 | | | 1.82 | % | | | (1.17 | )% | | | 1.82 | % | | $ | 1,440 | | | | 89 | % | |
Year Ended 12/31/15 | | | 1.90 | % | | | (1.30 | )% | | | 1.90 | % | | $ | 2 | | | | 86 | % | |
Year Ended 12/31/14 | | | 1.89 | % | | | (1.57 | )% | | | 1.97 | % | | $ | 1,239 | | | | 96 | % | |
Class R6 | |
Six Months Ended
6/30/19 (unaudited) | | | 1.06 | % | | | (0.67 | )% | | | 5.64 | % | | $ | 274 | | | | 42 | % | |
Year Ended 12/31/18 | | | 1.06 | % | | | (0.59 | )% | | | 6.33 | % | | $ | 239 | | | | 79 | % | |
Year Ended 12/31/17 | | | 1.06 | % | | | (0.55 | )% | | | 27.47 | % | | $ | 151 | | | | 69 | % | |
11/15/16(f) through
12/31/16 | | | 1.06 | % | | | (0.43 | )% | | | 26.37 | % | | $ | 51 | | | | 89 | % | |
Class Y | |
Six Months Ended
6/30/19 (unaudited) | | | 1.14 | % | | | (0.75 | )% | | | 1.25 | % | | $ | 114,173 | | | | 42 | % | |
Year Ended 12/31/18 | | | 1.14 | % | | | (0.59 | )% | | | 1.21 | % | | $ | 120,696 | | | | 79 | % | |
Year Ended 12/31/17 | | | 1.14 | % | | | (0.62 | )% | | | 1.20 | % | | $ | 244,689 | | | | 69 | % | |
Year Ended 12/31/16 | | | 1.14 | % | | | (0.49 | )% | | | 1.20 | % | | $ | 287,970 | | | | 89 | % | |
Year Ended 12/31/15 | | | 1.14 | % | | | (0.58 | )% | | | 1.18 | % | | $ | 403 | | | | 86 | % | |
Year Ended 12/31/14 | | | 1.12 | % | | | (0.81 | )% | | | 1.18 | % | | $ | 474,596 | | | | 96 | % | |
(e) Portfolio turnover is calculated on the basis of the Fund as a whole without distinguishing between the classes of shares issued.
(f) Commencement of operations.
See notes to financial statements.
39
Victory Portfolios | | Financial Highlights | |
For a Share Outstanding Throughout Each Period
| | | | Investment Activities | | Distributions to
Shareholders From | |
| | Net Asset
Value,
Beginning of
Period | | Net
Investment
Income
(Loss)(a) | | Net Realized
and Unrealized
Gains (Losses)
on Investments | | Total from
Investment
Activities | | Net Realized
Gains from
Investments | | Return of
Capital | |
Victory RS Mid Cap Growth Fund | |
Class A | |
Six Months Ended
6/30/19 (unaudited) | | $ | 19.96 | | | | (0.07 | ) | | | 6.10 | | | | 6.03 | | | | — | | | | — | | |
Year Ended 12/31/18 | | $ | 25.77 | | | | (0.14 | ) | | | (1.79 | ) | | | (1.93 | ) | | | (3.00 | ) | | | (0.88 | ) | |
Year Ended 12/31/17 | | $ | 21.32 | | | | (0.10 | ) | | | 4.55 | | | | 4.45 | | | | — | | | | — | | |
Year Ended 12/31/16 | | $ | 20.29 | | | | (0.07 | ) | | | 1.10 | | | | 1.03 | | | | — | | | | — | | |
Year Ended 12/31/15 | | $ | 20.14 | | | | (0.08 | ) | | | 0.23 | | | | 0.15 | | | | — | | | | — | | |
Year Ended 12/31/14 | | $ | 18.83 | | | | (0.15 | ) | | | 1.46 | | | | 1.31 | | | | — | | | | — | | |
Class C | |
Six Months Ended
6/30/19 (unaudited) | | $ | 17.40 | | | | (0.16 | ) | | | 5.32 | | | | 5.16 | | | | — | | | | — | | |
Year Ended 12/31/18 | | $ | 23.22 | | | | (0.35 | ) | | | (1.59 | ) | | | (1.94 | ) | | | (3.65 | ) | | | (0.23 | ) | |
Year Ended 12/31/17 | | $ | 19.38 | | | | (0.28 | ) | | | 4.12 | | | | 3.84 | | | | — | | | | — | | |
Year Ended 12/31/16 | | $ | 18.61 | | | | (0.23 | ) | | | 1.00 | | | | 0.77 | | | | — | | | | — | | |
Year Ended 12/31/15 | | $ | 18.64 | | | | (0.25 | ) | | | 0.22 | | | | (0.03 | ) | | | — | | | | — | | |
Year Ended 12/31/14 | | $ | 17.56 | | | | (0.28 | ) | | | 1.36 | | | | 1.08 | | | | — | | | | — | | |
Class R | |
Six Months Ended
6/30/19 (unaudited) | | $ | 18.31 | | | | (0.13 | ) | | | 5.60 | | | | 5.47 | | | | — | | | | — | | |
Year Ended 12/31/18 | | $ | 24.14 | | | | (0.29 | ) | | | (1.66 | ) | | | (1.95 | ) | | | (3.86 | ) | | | (0.02 | ) | |
Year Ended 12/31/17 | | $ | 20.09 | | | | (0.23 | ) | | | 4.28 | | | | 4.05 | | | | — | | | | — | | |
Year Ended 12/31/16 | | $ | 19.22 | | | | (0.16 | ) | | | 1.03 | | | | 0.87 | | | | — | | | | — | | |
Year Ended 12/31/15 | | $ | 19.18 | | | | (0.18 | ) | | | 0.22 | | | | 0.04 | | | | — | | | | — | | |
Year Ended 12/31/14 | | $ | 18.01 | | | | (0.24 | ) | | | 1.41 | | | | 1.17 | | | | — | | | | — | | |
Class R6 | |
Six Months Ended
6/30/19 (unaudited) | | $ | 20.74 | | | | (0.05 | ) | | | 6.36 | | | | 6.31 | | | | — | | | | — | | |
Year Ended 12/31/18 | | $ | 26.55 | | | | (0.07 | ) | | | (1.86 | ) | | | (1.93 | ) | | | (3.84 | ) | | | (0.04 | ) | |
Year Ended 12/31/17 | | $ | 21.90 | | | | (0.04 | ) | | | 4.69 | | | | 4.65 | | | | — | | | | — | | |
11/15/16(f) through
12/31/16 | | $ | 21.30 | | | | — | (g) | | | 0.60 | | | | 0.60 | | | | — | | | | — | | |
Class Y | |
Six Months Ended
6/30/19 (unaudited) | | $ | 20.73 | | | | (0.05 | ) | | | 6.35 | | | | 6.30 | | | | — | | | | — | | |
Year Ended 12/31/18 | | $ | 26.54 | | | | (0.08 | ) | | | (1.85 | ) | | | (1.93 | ) | | | (1.17 | ) | | | (2.71 | ) | |
Year Ended 12/31/17 | | $ | 21.90 | | | | (0.04 | ) | | | 4.68 | | | | 4.64 | | | | — | | | | — | | |
Year Ended 12/31/16 | | $ | 20.79 | | | | (0.02 | ) | | | 1.13 | | | | 1.11 | | | | — | | | | — | | |
Year Ended 12/31/15 | | $ | 20.58 | | | | (0.03 | ) | | | 0.24 | | | | 0.21 | | | | — | | | | — | | |
Year Ended 12/31/14 | | $ | 19.19 | | | | (0.10 | ) | | | 1.49 | | | | 1.39 | | | | — | | | | — | | |
(a) Per share net investment income (loss) has been calculated using the average daily shares method.
(b) Not annualized for periods less than one year.
(c) Annualized for periods less than one year.
(d) During the period, certain fees were reduced and/or reimbursed. If such fee reductions and/or reimbursements had not occurred, the ratios would have been as indicated.
See notes to financial statements.
40
Victory Portfolios | | Financial Highlights — continued | |
For a Share Outstanding Throughout Each Period
| | | | Ratios to Average Net Assets | | Supplemental Data | |
| | Total
Distributions
to
Shareholders | | Net Asset
Value,
End of
Period | | Total
Return
(Excludes
Sales
charge)(b) | | Net
Expenses(c) | | Net
Investment
Income
(Loss)(c) | | Gross
Expenses(c)(d) | | Net Assets,
End of
Period
(000's) | | Portfolio
Turnover(b)(e) | |
Victory RS Mid Cap Growth Fund | |
Class A | |
Six Months Ended
6/30/19 (unaudited) | | | — | | | $ | 25.99 | | | | 30.21 | % | | | 1.20 | % | | | (0.61 | )% | | | 1.35 | % | | $ | 93,777 | | | | 48 | % | |
Year Ended 12/31/18 | | | (3.88 | ) | | $ | 19.96 | | | | (7.37 | )% | | | 1.20 | % | | | (0.53 | )% | | | 1.34 | % | | $ | 75,451 | | | | 126 | % | |
Year Ended 12/31/17 | | | — | | | $ | 25.77 | | | | 20.87 | % | | | 1.20 | % | | | (0.44 | )% | | | 1.29 | % | | $ | 108,271 | | | | 86 | % | |
Year Ended 12/31/16 | | | — | | | $ | 21.32 | | | | 5.08 | % | | | 1.20 | % | | | (0.35 | )% | | | 1.27 | % | | $ | 231,056 | | | | 138 | % | |
Year Ended 12/31/15 | | | — | | | $ | 20.29 | | | | 0.74 | % | | | 1.23 | % | | | (0.39 | )% | | | 1.31 | % | | $ | 196,437 | | | | 120 | % | |
Year Ended 12/31/14 | | | — | | | $ | 20.14 | | | | 6.96 | % | | | 1.29 | % | | | (0.81 | )% | | | 1.38 | % | | $ | 104,407 | | | | 154 | % | |
Class C | |
Six Months Ended
6/30/19 (unaudited) | | | — | | | $ | 22.56 | | | | 29.66 | % | | | 2.11 | % | | | (1.52 | )% | | | 2.12 | % | | $ | 22,046 | | | | 48 | % | |
Year Ended 12/31/18 | | | (3.88 | ) | | $ | 17.40 | | | | (8.23 | )% | | | 2.11 | % | | | (1.44 | )% | | | 2.12 | % | | $ | 18,072 | | | | 126 | % | |
Year Ended 12/31/17 | | | — | | | $ | 23.22 | | | | 19.81 | % | | | 2.10 | % | | | (1.33 | )% | | | 2.10 | % | | $ | 23,264 | | | | 86 | % | |
Year Ended 12/31/16 | | | — | | | $ | 19.38 | | | | 4.14 | % | | | 2.11 | % | | | (1.25 | )% | | | 2.11 | % | | $ | 24,618 | | | | 138 | % | |
Year Ended 12/31/15 | | | — | | | $ | 18.61 | | | | (0.16 | )% | | | 2.11 | % | | | (1.30 | )% | | | 2.11 | % | | $ | 26,793 | | | | 120 | % | |
Year Ended 12/31/14 | | | — | | | $ | 18.64 | | | | 6.15 | % | | | 2.10 | % | | | (1.61 | )% | | | 2.22 | % | | $ | 13,040 | | | | 154 | % | |
Class R | |
Six Months Ended
6/30/19 (unaudited) | | | — | | | $ | 23.78 | | | | 29.87 | % | | | 1.80 | % | | | (1.20 | )% | | | 3.27 | % | | $ | 953 | | | | 48 | % | |
Year Ended 12/31/18 | | | (3.88 | ) | | $ | 18.31 | | | | (7.99 | )% | | | 1.80 | % | | | (1.13 | )% | | | 2.68 | % | | $ | 1,144 | | | | 126 | % | |
Year Ended 12/31/17 | | | — | | | $ | 24.14 | | | | 20.21 | % | | | 1.80 | % | | | (1.03 | )% | | | 2.43 | % | | $ | 1,685 | | | | 86 | % | |
Year Ended 12/31/16 | | | — | | | $ | 20.09 | | | | 4.53 | % | | | 1.69 | % | | | (0.84 | )% | | | 1.69 | % | | $ | 1,486 | | | | 138 | % | |
Year Ended 12/31/15 | | | — | | | $ | 19.22 | | | | 0.21 | % | | | 1.74 | % | | | (0.93 | )% | | | 1.74 | % | | $ | 1,740 | | | | 120 | % | |
Year Ended 12/31/14 | | | — | | | $ | 19.18 | | | | 6.50 | % | | | 1.79 | % | | | (1.31 | )% | | | 1.85 | % | | $ | 1,681 | | | | 154 | % | |
Class R6 | |
Six Months Ended
6/30/19 (unaudited) | | | — | | | $ | 27.05 | | | | 30.42 | % | | | 0.94 | % | | | (0.36 | )% | | | 1.13 | % | | $ | 16,190 | | | | 48 | % | |
Year Ended 12/31/18 | | | (3.88 | ) | | $ | 20.74 | | | | (7.15 | )% | | | 0.94 | % | | | (0.26 | )% | | | 1.32 | % | | $ | 3,793 | | | | 126 | % | |
Year Ended 12/31/17 | | | — | | | $ | 26.55 | | | | 21.23 | % | | | 0.94 | % | | | (0.17 | )% | | | 2.26 | % | | $ | 2,132 | | | | 86 | % | |
11/15/16(f) through
12/31/16 | | | — | | | $ | 21.90 | | | | 2.82 | % | | | 0.94 | % | | | (0.02 | )% | | | 25.90 | % | | $ | 60 | | | | 138 | % | |
Class Y | |
Six Months Ended
6/30/19 (unaudited) | | | — | | | $ | 27.03 | | | | 30.39 | % | | | 0.95 | % | | | (0.36 | )% | | | 1.07 | % | | $ | 398,472 | | | | 48 | % | |
Year Ended 12/31/18 | | | (3.88 | ) | | $ | 20.73 | | | | (7.15 | )% | | | 0.95 | % | | | (0.27 | )% | | | 1.05 | % | | $ | 243,009 | | | | 126 | % | |
Year Ended 12/31/17 | | | — | | | $ | 26.54 | | | | 21.19 | % | | | 0.95 | % | | | (0.18 | )% | | | 1.06 | % | | $ | 310,050 | | | | 86 | % | |
Year Ended 12/31/16 | | | — | | | $ | 21.90 | | | | 5.34 | % | | | 0.95 | % | | | (0.10 | )% | | | 1.05 | % | | $ | 168,936 | | | | 138 | % | |
Year Ended 12/31/15 | | | — | | | $ | 20.79 | | | | 1.02 | % | | | 0.97 | % | | | (0.15 | )% | | | 1.08 | % | | $ | 173,629 | | | | 120 | % | |
Year Ended 12/31/14 | | | — | | | $ | 20.58 | | | | 7.24 | % | | | 1.04 | % | | | (0.53 | )% | | | 1.11 | % | | $ | 73,672 | | | | 154 | % | |
(e) Portfolio turnover is calculated on the basis of the Fund as a whole without distinguishing between the classes of shares issued.
(f) Commencement of operations.
(g) Amount is less than $0.005 per share.
See notes to financial statements.
41
Victory Portfolios | | Financial Highlights | |
For a Share Outstanding Throughout Each Period
| | | | Investment Activities | | Distributions
to
Shareholders
From | | | |
| | | Net Asset
Value,
Beginning of
Period | | Net
Investment
Income (Loss) | | Net Realized
and Unrealized
Gains (Losses)
on Investments | | Total from
Investment
Activities | | Net Realized
Gains from
Investments | | Total
Distributions
to
Shareholders | | Net Asset
Value,
End of
Period | | Total
Return
(Excludes
Sales
Charge)(a) | |
Victory RS Growth Fund | |
Class A | |
Six Months Ended
6/30/19 (unaudited) | | $ | 16.40 | | | | — | (e)(f) | | | 3.93 | | | | 3.93 | | | | — | | | | — | | | $ | 20.33 | | | | 23.96 | % | |
Year Ended 12/31/18 | | $ | 20.60 | | | | (0.06 | )(f) | | | (1.36 | ) | | | (1.42 | ) | | | (2.78 | ) | | | (2.78 | ) | | $ | 16.40 | | | | (6.81 | )% | |
Year Ended 12/31/17 | | $ | 16.44 | | | | (0.02 | )(f) | | | 5.24 | | | | 5.22 | | | | (1.06 | ) | | | (1.06 | ) | | $ | 20.60 | | | | 31.75 | % | |
Year Ended 12/31/16 | | $ | 17.49 | | | | (0.02 | )(f) | | | 0.36 | | | | 0.34 | | | | (1.39 | ) | | | (1.39 | ) | | $ | 16.44 | | | | 1.86 | % | |
Year Ended 12/31/15 | | $ | 18.01 | | | | (0.03 | )(f) | | | 0.74 | | | | 0.71 | | | | (1.23 | ) | | | (1.23 | ) | | $ | 17.49 | | | | 3.94 | % | |
Year Ended 12/31/14 | | $ | 19.33 | | | | (0.07 | ) | | | 2.02 | | | | 1.95 | | | | (3.27 | ) | | | (3.27 | ) | | $ | 18.01 | | | | 9.98 | % | |
Class C | |
Six Months Ended
6/30/19 (unaudited) | | $ | 13.75 | | | | (0.07 | )(f) | | | 3.29 | | | | 3.22 | | | | — | | | | — | | | $ | 16.97 | | | | 23.42 | % | |
Year Ended 12/31/18 | | $ | 17.90 | | | | (0.21 | )(f) | | | (1.16 | ) | | | (1.37 | ) | | | (2.78 | ) | | | (2.78 | ) | | $ | 13.75 | | | | (7.56 | )% | |
Year Ended 12/31/17 | | $ | 14.51 | | | | (0.15 | )(f) | | | 4.60 | | | | 4.45 | | | | (1.06 | ) | | | (1.06 | ) | | $ | 17.90 | | | | 30.57 | % | |
Year Ended 12/31/16 | | $ | 15.73 | | | | (0.14 | )(f) | | | 0.31 | | | | 0.17 | | | | (1.39 | ) | | | (1.39 | ) | | $ | 14.51 | | | | 1.05 | % | |
Year Ended 12/31/15 | | $ | 16.45 | | | | (0.17 | )(f) | | | 0.68 | | | | 0.51 | | | | (1.23 | ) | | | (1.23 | ) | | $ | 15.73 | | | | 3.09 | % | |
Year Ended 12/31/14 | | $ | 18.06 | | | | (0.15 | ) | | | 1.81 | | | | 1.66 | | | | (3.27 | ) | | | (3.27 | ) | | $ | 16.45 | | | | 9.07 | % | |
Class R | |
Six Months Ended
6/30/19 (unaudited) | | $ | 15.00 | | | | (0.05 | )(f) | | | 3.59 | | | | 3.54 | | | | — | | | | — | | | $ | 18.54 | | | | 23.60 | % | |
Year Ended 12/31/18 | | $ | 19.22 | | | | (0.18 | )(f) | | | (1.26 | ) | | | (1.44 | ) | | | (2.78 | ) | | | (2.78 | ) | | $ | 15.00 | | | | (7.41 | )% | |
Year Ended 12/31/17 | | $ | 15.49 | | | | (0.13 | )(f) | | | 4.92 | | | | 4.79 | | | | (1.06 | ) | | | (1.06 | ) | | $ | 19.22 | | | | 30.92 | % | |
Year Ended 12/31/16 | | $ | 16.65 | | | | (0.11 | )(f) | | | 0.34 | | | | 0.23 | | | | (1.39 | ) | | | (1.39 | ) | | $ | 15.49 | | | | 1.29 | % | |
Year Ended 12/31/15 | | $ | 17.31 | | | | (0.14 | )(f) | | | 0.71 | | | | 0.57 | | | | (1.23 | ) | | | (1.23 | ) | | $ | 16.65 | | | | 3.28 | % | |
Year Ended 12/31/14 | | $ | 18.80 | | | | (0.17 | ) | | | 1.95 | | | | 1.78 | | | | (3.27 | ) | | | (3.27 | ) | | $ | 17.31 | | | | 9.36 | % | |
Class Y | |
Six Months Ended
6/30/19 (unaudited) | | $ | 17.04 | | | | 0.02 | (f) | | | 4.09 | | | | 4.11 | | | | — | | | | — | | | $ | 21.15 | | | | 24.12 | % | |
Year Ended 12/31/18 | | $ | 21.23 | | | | — | (f)(g) | | | (1.41 | ) | | | (1.41 | ) | | | (2.78 | ) | | | (2.78 | ) | | $ | 17.04 | | | | (6.56 | )% | |
Year Ended 12/31/17 | | $ | 16.88 | | | | 0.03 | (f) | | | 5.38 | | | | 5.41 | | | | (1.06 | ) | | | (1.06 | ) | | $ | 21.23 | | | | 32.05 | % | |
Year Ended 12/31/16 | | $ | 17.87 | | | | 0.03 | (f) | | | 0.37 | | | | 0.40 | | | | (1.39 | ) | | | (1.39 | ) | | $ | 16.88 | | | | 2.16 | % | |
Year Ended 12/31/15 | | $ | 18.33 | | | | 0.02 | (f) | | | 0.75 | | | | 0.77 | | | | (1.23 | ) | | | (1.23 | ) | | $ | 17.87 | | | | 4.20 | % | |
Year Ended 12/31/14 | | $ | 19.56 | | | | (0.04 | ) | | | 2.08 | | | | 2.04 | | | | (3.27 | ) | | | (3.27 | ) | | $ | 18.33 | | | | 10.33 | % | |
(a) Not annualized for periods less than one year.
(b) Annualized for periods less than one year.
(c) During the period, certain fees were reduced and/or reimbursed. If such fee reductions and/or reimbursements had not occurred, the ratios would have been as indicated.
(d) Portfolio turnover is calculated on the basis of the Fund as a whole without distinguishing between the classes of shares issued.
(e) Amount is less than $(0.005) per share.
(f) Per share net investment income (loss) has been calculated using the average daily shares method.
(g) Amount is less than $0.005 per share.
See notes to financial statements.
42
Victory Portfolios | | Financial Highlights — continued | |
For a Share Outstanding Throughout Each Period
| | Ratios to Average Net Assets | | Supplemental Data | |
| | | Net
Expenses(b) | | Net
Investment
Income
(Loss)(b) | | Gross
Expenses(b)(c) | | Net Assets,
End of
Period
(000's) | | Portfolio
Turnover(a)(d) | |
Victory RS Growth Fund | |
Class A | |
Six Months Ended
6/30/19 (unaudited) | | | 1.10 | % | | | (0.02 | )% | | | 1.19 | % | | $ | 223,397 | | | | 57 | % | |
Year Ended 12/31/18 | | | 1.10 | % | | | (0.28 | )% | | | 1.19 | % | | $ | 188,220 | | | | 87 | % | |
Year Ended 12/31/17 | | | 1.10 | % | | | (0.09 | )% | | | 1.20 | % | | $ | 218,238 | | | | 74 | % | |
Year Ended 12/31/16 | | | 1.10 | % | | | (0.09 | )% | | | 1.20 | % | | $ | 189,921 | | | | 123 | % | |
Year Ended 12/31/15 | | | 1.10 | % | | | (0.18 | )% | | | 1.19 | % | | $ | 204,027 | | | | 105 | % | |
Year Ended 12/31/14 | | | 1.14 | % | | | (0.39 | )% | | | 1.21 | % | | $ | 210,508 | | | | 136 | % | |
Class C | |
Six Months Ended
6/30/19 (unaudited) | | | 1.93 | % | | | (0.85 | )% | | | 2.33 | % | | $ | 4,754 | | | | 57 | % | |
Year Ended 12/31/18 | | | 1.93 | % | | | (1.10 | )% | | | 2.20 | % | | $ | 4,409 | | | | 87 | % | |
Year Ended 12/31/17 | | | 1.93 | % | | | (0.92 | )% | | | 2.10 | % | | $ | 6,974 | | | | 74 | % | |
Year Ended 12/31/16 | | | 1.93 | % | | | (0.93 | )% | | | 2.06 | % | | $ | 8,487 | | | | 123 | % | |
Year Ended 12/31/15 | | | 1.93 | % | | | (1.02 | )% | | | 2.02 | % | | $ | 11,553 | | | | 105 | % | |
Year Ended 12/31/14 | | | 1.97 | % | | | (1.21 | )% | | | 2.06 | % | | $ | 13,300 | | | | 136 | % | |
Class R | |
Six Months Ended
6/30/19 (unaudited) | | | 1.71 | % | | | (0.63 | )% | | | 5.39 | % | | $ | 521 | | | | 57 | % | |
Year Ended 12/31/18 | | | 1.71 | % | | | (0.88 | )% | | | 3.49 | % | | $ | 516 | | | | 87 | % | |
Year Ended 12/31/17 | | | 1.71 | % | | | (0.70 | )% | | | 2.72 | % | | $ | 830 | | | | 74 | % | |
Year Ended 12/31/16 | | | 1.71 | % | | | (0.69 | )% | | | 1.77 | % | | $ | 1,054 | | | | 123 | % | |
Year Ended 12/31/15 | | | 1.71 | % | | | (0.80 | )% | | | 1.79 | % | | $ | 979 | | | | 105 | % | |
Year Ended 12/31/14 | | | 1.71 | % | | | (0.97 | )% | | | 1.81 | % | | $ | 1,249 | | | | 136 | % | |
Class Y | |
Six Months Ended
6/30/19 (unaudited) | | | 0.83 | % | | | 0.25 | % | | | 0.98 | % | | $ | 31,579 | | | | 57 | % | |
Year Ended 12/31/18 | | | 0.83 | % | | | (0.01 | )% | | | 0.97 | % | | $ | 26,457 | | | | 87 | % | |
Year Ended 12/31/17 | | | 0.83 | % | | | 0.17 | % | | | 0.97 | % | | $ | 30,309 | | | | 74 | % | |
Year Ended 12/31/16 | | | 0.83 | % | | | 0.17 | % | | | 0.95 | % | | $ | 25,107 | | | | 123 | % | |
Year Ended 12/31/15 | | | 0.83 | % | | | 0.10 | % | | | 0.95 | % | | $ | 38,301 | | | | 105 | % | |
Year Ended 12/31/14 | | | 0.86 | % | | | (0.10 | )% | | | 0.91 | % | | $ | 37,757 | | | | 136 | % | |
See notes to financial statements.
43
Victory Portfolios | | Financial Highlights | |
For a Share Outstanding Throughout Each Period
| | | | Investment Activities | | Distributions
to
Shareholders
From | | | |
| | Net Asset
Value,
Beginning of
Period | | Net
Investment
Income (Loss)(a) | | Net Realized
and Unrealized
Gains (Losses)
on Investments | | Total from
Investment
Activities | | Net Realized
Gains from
Investments | | Total
Distributions
to
Shareholders | | Capital
Contributions
from Prior
Custodian, Net
(See Note 8) | | Net Asset
Value,
End of
Period | | Total
Return
(Excludes
Sales
Charge)(b) | |
Victory RS Science and Technology Fund | |
Class A | |
Six Months Ended
6/30/19 (unaudited) | | $ | 18.34 | | | | (0.13 | ) | | | 5.53 | | | | 5.40 | | | | — | | | | — | | | | — | | | $ | 23.74 | | | | 29.50 | % | |
Year Ended 12/31/18 | | $ | 21.56 | | | | (0.27 | ) | | | 0.06 | (f) | | | (0.21 | ) | | | (3.01 | ) | | | (3.01 | ) | | | — | | | $ | 18.34 | | | | (0.73 | )% | |
Year Ended 12/31/17 | | $ | 17.49 | | | | (0.25 | ) | | | 8.04 | | | | 7.79 | | | | (3.72 | ) | | | (3.72 | ) | | | — | | | $ | 21.56 | | | | 44.74 | % | |
Year Ended 12/31/16 | | $ | 17.35 | | | | (0.22 | ) | | | 2.64 | | | | 2.42 | | | | (2.28 | ) | | | (2.28 | ) | | | — | (g) | | $ | 17.49 | | | | 13.80 | %(h) | |
Year Ended 12/31/15 | | $ | 18.13 | | | | (0.19 | ) | | | 1.26 | | | | 1.07 | | | | (1.85 | ) | | | (1.85 | ) | | | — | | | $ | 17.35 | | | | 5.89 | % | |
Year Ended 12/31/14 | | $ | 20.38 | | | | (0.24 | ) | | | 1.30 | | | | 1.06 | | | | (3.31 | ) | | | (3.31 | ) | | | — | | | $ | 18.13 | | | | 5.26 | % | |
Class C | |
Six Months Ended
6/30/19 (unaudited) | | $ | 14.40 | | | | (0.17 | ) | | | 4.34 | | | | 4.17 | | | | — | | | | — | | | | — | | | $ | 18.57 | | | | 28.96 | % | |
Year Ended 12/31/18 | | $ | 17.73 | | | | (0.38 | ) | | | 0.06 | (f) | | | (0.32 | ) | | | (3.01 | ) | | | (3.01 | ) | | | — | | | $ | 14.40 | | | | (1.58 | )% | |
Year Ended 12/31/17 | | $ | 14.96 | | | | (0.36 | ) | | | 6.85 | | | | 6.49 | | | | (3.72 | ) | | | (3.72 | ) | | | — | | | $ | 17.73 | | | | 43.70 | % | |
Year Ended 12/31/16 | | $ | 15.25 | | | | (0.31 | ) | | | 2.30 | | | | 1.99 | | | | (2.28 | ) | | | (2.28 | ) | | | — | (g) | | $ | 14.96 | | | | 12.87 | %(h) | |
Year Ended 12/31/15 | | $ | 16.27 | | | | (0.29 | ) | | | 1.12 | | | | 0.83 | | | | (1.85 | ) | | | (1.85 | ) | | | — | | | $ | 15.25 | | | | 5.08 | % | |
Year Ended 12/31/14 | | $ | 18.77 | | | | (0.37 | ) | | | 1.18 | | | | 0.81 | | | | (3.31 | ) | | | (3.31 | ) | | | — | | | $ | 16.27 | | | | 4.38 | % | |
Class R | |
Six Months Ended
6/30/19 (unaudited) | | $ | 15.70 | | | | (0.15 | ) | | | 4.74 | | | | 4.59 | | | | — | | | | — | | | | — | | | $ | 20.29 | | | | 29.24 | % | |
Year Ended 12/31/18 | | $ | 18.99 | | | | (0.33 | ) | | | 0.05 | (f) | | | (0.28 | ) | | | (3.01 | ) | | | (3.01 | ) | | | — | | | $ | 15.70 | | | | (1.20 | )% | |
Year Ended 12/31/17 | | $ | 15.78 | | | | (0.31 | ) | | | 7.24 | | | | 6.93 | | | | (3.72 | ) | | | (3.72 | ) | | | — | | | $ | 18.99 | | | | 44.05 | % | |
Year Ended 12/31/16 | | $ | 15.91 | | | | (0.26 | ) | | | 2.41 | | | | 2.15 | | | | (2.28 | ) | | | (2.28 | ) | | | — | (g) | | $ | 15.78 | | | | 13.41 | %(h) | |
Year Ended 12/31/15 | | $ | 16.85 | | | | (0.25 | ) | | | 1.16 | | | | 0.91 | | | | (1.85 | ) | | | (1.85 | ) | | | — | | | $ | 15.91 | | | | 5.38 | % | |
Year Ended 12/31/14 | | $ | 19.26 | | | | (0.32 | ) | | | 1.22 | | | | 0.90 | | | | (3.31 | ) | | | (3.31 | ) | | | — | | | $ | 16.85 | | | | 4.74 | % | |
Class Y | |
Six Months Ended
6/30/19 (unaudited) | | $ | 19.72 | | | | (0.11 | ) | | | 5.95 | | | | 5.84 | | | | — | | | | — | | | | — | | | $ | 25.56 | | | | 29.61 | % | |
Year Ended 12/31/18 | | $ | 22.90 | | | | (0.22 | ) | | | 0.05 | (f) | | | (0.17 | ) | | | (3.01 | ) | | | (3.01 | ) | | | — | | | $ | 19.72 | | | | (0.51 | )% | |
Year Ended 12/31/17 | | $ | 18.37 | | | | (0.21 | ) | | | 8.46 | | | | 8.25 | | | | (3.72 | ) | | | (3.72 | ) | | | — | | | $ | 22.90 | | | | 45.11 | % | |
Year Ended 12/31/16 | | $ | 18.08 | | | | (0.18 | ) | | | 2.75 | | | | 2.57 | | | | (2.28 | ) | | | (2.28 | ) | | | — | (g) | | $ | 18.37 | | | | 14.07 | %(h) | |
Year Ended 12/31/15 | | $ | 18.78 | | | | (0.14 | ) | | | 1.29 | | | | 1.15 | | | | (1.85 | ) | | | (1.85 | ) | | | — | | | $ | 18.08 | | | | 6.11 | % | |
Year Ended 12/31/14 | | $ | 20.93 | | | | (0.19 | ) | | | 1.35 | | | | 1.16 | | | | (3.31 | ) | | | (3.31 | ) | | | — | | | $ | 18.78 | | | | 5.61 | % | |
(a) Per share net investment income (loss) has been calculated using the average daily shares method.
(b) Not annualized for periods less than one year.
(c) Annualized for periods less than one year.
(d) During the period, certain fees were reduced and/or reimbursed. If such fee reductions and/or reimbursements had not occurred, the ratios would have been as indicated.
(e) Portfolio turnover is calculated on the basis of the Fund as a whole without distinguishing between the classes of shares issued.
(f) The amount shown for a share outstanding throughout the period does not accord with the change in net assets resulting from operations during the period because of the timing of sales and purchases of fund shares in relation to fluctuating market values during the period.
See notes to financial statements.
44
Victory Portfolios | | Financial Highlights — continued | |
For a Share Outstanding Throughout Each Period
| | Ratios to Average Net Assets | | Supplemental Data | |
| | Net
Expenses(c) | | Net
Investment
Income
(Loss)(c) | | Gross
Expenses(c)(d) | | Net Assets,
End of
Period
(000's) | | Portfolio
Turnover(b)(e) | |
Victory RS Science and Technology Fund | |
Class A | |
Six Months Ended
6/30/19 (unaudited) | | | 1.47 | % | | | (1.13 | )% | | | 1.47 | % | | $ | 186,324 | | | | 60 | % | |
Year Ended 12/31/18 | | | 1.47 | % | | | (1.10 | )% | | | 1.47 | % | | $ | 140,389 | | | | 83 | % | |
Year Ended 12/31/17 | | | 1.49 | % | | | (1.18 | )% | | | 1.49 | % | | $ | 146,002 | | | | 89 | % | |
Year Ended 12/31/16 | | | 1.51 | % | | | (1.24 | )% | | | 1.52 | % | | $ | 105,041 | | | | 114 | % | |
Year Ended 12/31/15 | | | 1.49 | % | | | (1.01 | )% | | | 1.49 | % | | $ | 109,201 | | | | 119 | % | |
Year Ended 12/31/14 | | | 1.51 | % | | | (1.21 | )% | | | 1.51 | % | | $ | 134,534 | | | | 146 | % | |
Class C | |
Six Months Ended
6/30/19 (unaudited) | | | 2.28 | % | | | (1.94 | )% | | | 2.32 | % | | $ | 13,419 | | | | 60 | % | |
Year Ended 12/31/18 | | | 2.28 | % | | | (1.91 | )% | | | 2.31 | % | | $ | 11,857 | | | | 83 | % | |
Year Ended 12/31/17 | | | 2.28 | % | | | (1.97 | )% | | | 2.31 | % | | $ | 11,831 | | | | 89 | % | |
Year Ended 12/31/16 | | | 2.32 | % | | | (2.05 | )% | | | 2.32 | % | | $ | 10,332 | | | | 114 | % | |
Year Ended 12/31/15 | | | 2.28 | % | | | (1.79 | )% | | | 2.28 | % | | $ | 11,160 | | | | 119 | % | |
Year Ended 12/31/14 | | | 2.36 | % | | | (2.06 | )% | | | 2.36 | % | | $ | 12,745 | | | | 146 | % | |
Class R | |
Six Months Ended
6/30/19 (unaudited) | | | 1.93 | % | | | (1.59 | )% | | | 4.25 | % | | $ | 809 | | | | 60 | % | |
Year Ended 12/31/18 | | | 1.93 | % | | | (1.56 | )% | | | 2.75 | % | | $ | 707 | | | | 83 | % | |
Year Ended 12/31/17 | | | 1.93 | % | | | (1.62 | )% | | | 2.54 | % | | $ | 1,705 | | | | 89 | % | |
Year Ended 12/31/16 | | | 1.91 | % | | | (1.63 | )% | | | 1.91 | % | | $ | 1,394 | | | | 114 | % | |
Year Ended 12/31/15 | | | 1.93 | % | | | (1.45 | )% | | | 1.93 | % | | $ | 1,281 | | | | 119 | % | |
Year Ended 12/31/14 | | | 2.03 | % | | | (1.73 | )% | | | 2.03 | % | | $ | 1,367 | | | | 146 | % | |
Class Y | |
Six Months Ended
6/30/19 (unaudited) | | | 1.24 | % | | | (0.90 | )% | | | 1.24 | % | | $ | 77,299 | | | | 60 | % | |
Year Ended 12/31/18 | | | 1.24 | % | | | (0.85 | )% | | | 1.25 | % | | $ | 53,395 | | | | 83 | % | |
Year Ended 12/31/17 | | | 1.24 | % | | | (0.92 | )% | | | 1.26 | % | | $ | 32,047 | | | | 89 | % | |
Year Ended 12/31/16 | | | 1.28 | % | | | (1.01 | )% | | | 1.29 | % | | $ | 19,335 | | | | 114 | % | |
Year Ended 12/31/15 | | | 1.24 | % | | | (0.74 | )% | | | 1.24 | % | | $ | 27,416 | | | | 119 | % | |
Year Ended 12/31/14 | | | 1.22 | % | | | (0.91 | )% | | | 1.22 | % | | $ | 48,368 | | | | 146 | % | |
(g) Amount is less than $0.005 per share.
(h) The Fund received monies related to a nonrecurring refund from the prior Custodian. The corresponding impact to the total return was less than 0.005% for the period shown. (See Note 8)
See notes to financial statements.
45
Victory Portfolios | | Financial Highlights | |
For a Share Outstanding Throughout Each Period
| | | | Investment Activities | | Distributions
to
Shareholders
From | | | |
| | | Net Asset
Value,
Beginning of
Period | | Net
Investment
Income (Loss)(a) | | Net Realized
and Unrealized
Gains (Losses)
on Investments | | Total from
Investment
Activities | | Net Realized
Gains from
Investments | | Total
Distributions
to
Shareholders | | Capital
Contributions
from Prior
Custodian, Net
(See Note 8) | | Net Asset
Value,
End of
Period | | Total
Return
(Excludes
Sales
Charge)(b) | |
Victory RS Small Cap Equity Fund | |
Class A | |
Six Months Ended
6/30/19 (unaudited) | | $ | 12.97 | | | | (0.07 | ) | | | 4.19 | | | | 4.12 | | | | — | | | | — | | | | — | | | $ | 17.09 | | | | 31.77 | % | |
Year Ended 12/31/18 | | $ | 18.88 | | | | (0.16 | ) | | | (1.47 | ) | | | (1.63 | ) | | | (4.28 | ) | | | (4.28 | ) | | | — | | | $ | 12.97 | | | | (8.39 | )% | |
Year Ended 12/31/17 | | $ | 14.41 | | | | (0.14 | ) | | | 5.55 | | | | 5.41 | | | | (0.94 | ) | | | (0.94 | ) | | | — | | | $ | 18.88 | | | | 37.57 | % | |
Year Ended 12/31/16 | | $ | 14.24 | | | | (0.12 | ) | | | 0.28 | | | | 0.16 | | | | — | | | | — | | | | 0.01 | | | $ | 14.41 | | | | 1.19 | %(f) | |
Year Ended 12/31/15 | | $ | 19.81 | | | | (0.20 | ) | | | 0.38 | | | | 0.18 | | | | (5.75 | ) | | | (5.75 | ) | | | — | | | $ | 14.24 | | | | 0.61 | % | |
Year Ended 12/31/14 | | $ | 21.46 | | | | (0.21 | ) | | | 2.32 | | | | 2.11 | | | | (3.76 | ) | | | (3.76 | ) | | | — | | | $ | 19.81 | | | | 10.00 | % | |
Class C | |
Six Months Ended
6/30/19 (unaudited) | | $ | 4.40 | | | | (0.05 | ) | | | 1.43 | | | | 1.38 | | | | — | | | | — | | | | — | | | $ | 5.78 | | | | 31.36 | % | |
Year Ended 12/31/18 | | $ | 9.61 | | | | (0.17 | ) | | | (0.76 | ) | | | (0.93 | ) | | | (4.28 | ) | | | (4.28 | ) | | | — | | | $ | 4.40 | | | | (9.23 | )% | |
Year Ended 12/31/17 | | $ | 7.74 | | | | (0.15 | ) | | | 2.96 | | | | 2.81 | | | | (0.94 | ) | | | (0.94 | ) | | | — | | | $ | 9.61 | | | | 36.34 | % | |
Year Ended 12/31/16 | | $ | 7.71 | | | | (0.12 | ) | | | 0.14 | | | | 0.02 | | | | — | | | | — | | | | 0.01 | | | $ | 7.74 | | | | 0.39 | %(f) | |
Year Ended 12/31/15 | | $ | 13.42 | | | | (0.25 | ) | | | 0.29 | | | | 0.04 | | | | (5.75 | ) | | | (5.75 | ) | | | — | | | $ | 7.71 | | | | (0.17 | )% | |
Year Ended 12/31/14 | | $ | 15.79 | | | | (0.29 | ) | | | 1.68 | | | | 1.39 | | | | (3.76 | ) | | | (3.76 | ) | | | — | | | $ | 13.42 | | | | 9.02 | % | |
Class R | |
Six Months Ended
6/30/19 (unaudited) | | $ | 10.32 | | | | (0.08 | ) | | | 3.33 | | | | 3.25 | | | | — | | | | — | | | | — | | | $ | 13.57 | | | | 31.49 | % | |
Year Ended 12/31/18 | | $ | 16.08 | | | | (0.23 | ) | | | (1.25 | ) | | | (1.48 | ) | | | (4.28 | ) | | | (4.28 | ) | | | — | | | $ | 10.32 | | | | (8.92 | )% | |
Year Ended 12/31/17 | | $ | 12.44 | | | | (0.20 | ) | | | 4.78 | | | | 4.58 | | | | (0.94 | ) | | | (0.94 | ) | | | — | | | $ | 16.08 | | | | 36.84 | % | |
Year Ended 12/31/16 | | $ | 12.33 | | | | (0.14 | ) | | | 0.24 | | | | 0.10 | | | | — | | | | — | | | | 0.01 | | | $ | 12.44 | | | | 0.89 | %(f) | |
Year Ended 12/31/15 | | $ | 17.99 | | | | (0.26 | ) | | | 0.35 | | | | 0.09 | | | | (5.75 | ) | | | (5.75 | ) | | | — | | | $ | 12.33 | | | | 0.16 | % | |
Year Ended 12/31/14 | | $ | 19.88 | | | | (0.27 | ) | | | 2.14 | | | | 1.87 | | | | (3.76 | ) | | | (3.76 | ) | | | — | | | $ | 17.99 | | | | 9.58 | % | |
Class Y | |
Six Months Ended
6/30/19 (unaudited) | | $ | 13.29 | | | | (0.06 | ) | | | 4.29 | | | | 4.23 | | | | — | | | | — | | | | — | | | $ | 17.52 | | | | 31.83 | % | |
Year Ended 12/31/18 | | $ | 19.20 | | | | (0.14 | ) | | | (1.49 | ) | | | (1.63 | ) | | | (4.28 | ) | | | (4.28 | ) | | | — | | | $ | 13.29 | | | | (8.23 | )% | |
Year Ended 12/31/17 | | $ | 14.62 | | | | (0.14 | ) | | | 5.66 | | | | 5.52 | | | | (0.94 | ) | | | (0.94 | ) | | | — | | | $ | 19.20 | | | | 37.78 | % | |
Year Ended 12/31/16 | | $ | 14.39 | | | | (0.08 | ) | | | 0.30 | | | | 0.22 | | | | — | | | | — | | | | 0.01 | | | $ | 14.62 | | | | 1.60 | %(f) | |
Year Ended 12/31/15 | | $ | 20.04 | | | | (0.16 | ) | | | 0.26 | | | | 0.10 | | | | (5.75 | ) | | | (5.75 | ) | | | — | | | $ | 14.39 | | | | 0.18 | % | |
Year Ended 12/31/14 | | $ | 21.60 | | | | (0.16 | ) | | | 2.36 | | | | 2.20 | | | | (3.76 | ) | | | (3.76 | ) | | | — | | | $ | 20.04 | | | | 10.35 | % | |
(a) Per share net investment income (loss) has been calculated using the average daily shares method.
(b) Not annualized for periods less than one year.
(c) Annualized for periods less than one year.
(d) During the period, certain fees were reduced and/or reimbursed. If such fee reductions and/or reimbursements had not occurred, the ratios would have been as indicated.
(e) Portfolio turnover is calculated on the basis of the Fund as a whole without distinguishing between the classes of shares issued.
(f) The Fund received monies related to a nonrecurring refund from the prior Custodian. The corresponding impact to the total return was less than 0.005% for the period shown. (See Note 8)
See notes to financial statements.
46
Victory Portfolios | | Financial Highlights — continued | |
For a Share Outstanding Throughout Each Period
| | Ratios to Average Net Assets | | Supplemental Data | |
| | | Net
Expenses(c) | | Net
Investment
Income
(Loss)(c) | | Gross
Expenses(c)(d) | | Net Assets,
End of
Period
(000's) | | Portfolio
Turnover(b)(e) | |
Victory RS Small Cap Equity Fund | |
Class A | |
Six Months Ended
6/30/19 (unaudited) | | | 1.25 | % | | | (0.86 | )% | | | 1.25 | % | | $ | 64,577 | | | | 45 | % | |
Year Ended 12/31/18 | | | 1.22 | % | | | (0.78 | )% | | | 1.22 | % | | $ | 51,619 | | | | 77 | % | |
Year Ended 12/31/17 | | | 1.25 | % | | | (0.84 | )% | | | 1.25 | % | | $ | 65,514 | | | | 79 | % | |
Year Ended 12/31/16 | | | 1.35 | % | | | (0.88 | )% | | | 1.36 | % | | $ | 52,075 | | | | 86 | % | |
Year Ended 12/31/15 | | | 1.30 | % | | | 0.97 | % | | | 1.30 | % | | $ | 65 | | | | 98 | % | |
Year Ended 12/31/14 | | | 1.27 | % | | | (0.99 | )% | | | 1.27 | % | | $ | 68,785 | | | | 93 | % | |
Class C | |
Six Months Ended
6/30/19 (unaudited) | | | 2.10 | % | | | (1.72 | )% | | | 3.75 | % | | $ | 634 | | | | 45 | % | |
Year Ended 12/31/18 | | | 2.10 | % | | | (1.71 | )% | | | 4.24 | % | | $ | 616 | | | | 77 | % | |
Year Ended 12/31/17 | | | 2.10 | % | | | (1.69 | )% | | | 3.87 | % | | $ | 533 | | | | 79 | % | |
Year Ended 12/31/16 | | | 2.10 | % | | | (1.64 | )% | | | 3.14 | % | | $ | 410 | | | | 86 | % | |
Year Ended 12/31/15 | | | 2.10 | % | | | 1.77 | % | | | 2.39 | % | | $ | 1 | | | | 98 | % | |
Year Ended 12/31/14 | | | 2.15 | % | | | (1.90 | )% | | | 2.37 | % | | $ | 593 | | | | 93 | % | |
Class R | |
Six Months Ended
6/30/19 (unaudited) | | | 1.75 | % | | | (1.36 | )% | | | 2.10 | % | | $ | 2,798 | | | | 45 | % | |
Year Ended 12/31/18 | | | 1.75 | % | | | (1.30 | )% | | | 1.88 | % | | $ | 2,303 | | | | 77 | % | |
Year Ended 12/31/17 | | | 1.75 | % | | | (1.34 | )% | | | 1.97 | % | | $ | 3,381 | | | | 79 | % | |
Year Ended 12/31/16 | | | 1.70 | % | | | (1.24 | )% | | | 1.70 | % | | $ | 2,954 | | | | 86 | % | |
Year Ended 12/31/15 | | | 1.71 | % | | | (1.39 | )% | | | 1.71 | % | | $ | 3,662 | | | | 98 | % | |
Year Ended 12/31/14 | | | 1.67 | % | | | (1.39 | )% | | | 1.71 | % | | $ | 4,455 | | | | 93 | % | |
Class Y | |
Six Months Ended
6/30/19 (unaudited) | | | 1.10 | % | | | (0.71 | )% | | | 1.43 | % | | $ | 3,633 | | | | 45 | % | |
Year Ended 12/31/18 | | | 1.10 | % | | | (0.69 | )% | | | 1.68 | % | | $ | 2,750 | | | | 77 | % | |
Year Ended 12/31/17 | | | 1.10 | % | | | (0.78 | )% | | | 1.34 | % | | $ | 6,398 | | | | 79 | % | |
Year Ended 12/31/16 | | | 1.10 | % | | | (0.64 | )% | | | 1.24 | % | | $ | 1,834 | | | | 86 | % | |
Year Ended 12/31/15 | | | 1.07 | % | | | (0.76 | )% | | | 1.07 | % | | $ | 3,804 | | | | 98 | % | |
Year Ended 12/31/14 | | | 1.01 | % | | | (0.74 | )% | | | 1.01 | % | | $ | 48,597 | | | | 93 | % | |
See notes to financial statements.
47
Victory Portfolios | | Notes to Financial Statements
June 30, 2019 | |
(Unaudited)
1. Organization:
Victory Portfolios (the "Trust") was organized on December 6, 1995 as a Delaware statutory trust as a successor to a company named "The Victory Portfolios," which was organized as a Massachusetts business trust on February 5, 1986. The Trust is registered under the Investment Company Act of 1940, as amended (the "1940 Act"), as an open-end investment company. The Trust is comprised of 42 funds and is authorized to issue an unlimited number of shares, which are units of beneficial interest with a par value of $0.001 per share. Each Fund is classified as diversified under the 1940 Act.
The accompanying financial statements are those of the following six Funds (collectively, the "Funds" and individually, a "Fund").
Funds (Legal Name) | | Funds (Short Name) | | Investment Share
Classes Offered | |
Victory RS Small Cap Growth Fund
| | RS Small Cap
Growth Fund | | Classes A, C, R, R6 and Y
| |
Victory RS Select Growth Fund | | RS Select Growth Fund | | Classes A, C, R, R6 and Y | |
Victory RS Mid Cap Growth Fund
| | RS Mid Cap
Growth Fund | | Classes A, C, R, R6 and Y
| |
Victory RS Growth Fund | | RS Growth Fund | | Classes A, C, R and Y | |
Victory RS Science and
Technology Fund | | RS Science and
Technology Fund | | Classes A, C, R and Y
| |
Victory RS Small Cap Equity Fund
| | RS Small Cap
Equity Fund | | Classes A, C, R and Y
| |
Each class of shares of a Fund has substantially identical rights and privileges except with respect to sales charges, fees paid under distribution plans, expenses allocable exclusively to each class of shares, voting rights on matters solely affecting a single class of shares, and the exchange privilege of each class of shares.
Under the Trust's organizational documents, its officers and trustees are indemnified against certain liabilities arising out of the performance of their duties to the Funds. In addition, in the normal course of business, the Funds enter into contracts with their vendors and others that provide for general indemnifications. The Funds' maximum exposure under these arrangements is unknown, as this would involve future claims that may be made against the Funds. However, based on experience, the Funds expect that risk of loss to be remote.
2. Significant Accounting Policies:
The following is a summary of significant accounting policies followed by the Trust in the preparation of its financial statements. The policies are in conformity with accounting principles generally accepted in the United States of America ("GAAP"). The preparation of financial statements in accordance with GAAP requires management to make estimates and assumptions that affect the reported amounts of assets and liabilities and disclosure of contingent assets and liabilities at the date of the financial statements and the reported amounts of income and expenses for the period. Actual results could differ from those estimates. The Funds follow the specialized accounting and reporting requirements under GAAP that are applicable to investment companies.
Investment Valuation:
The Funds record investments at fair value. Fair value is defined as the price that would be received to sell an asset or paid to transfer a liability in an orderly transaction between market participants at the measurement date.
The valuation techniques described below maximize the use of observable inputs and minimize the use of unobservable inputs in determining fair value. The inputs used for valuing the Funds' investments are summarized in the three broad levels listed below:
• Level 1 — quoted prices in active markets for identical securities
• Level 2 — other significant observable inputs (including quoted prices for similar securities or interest rates applicable to those securities, etc.)
48
Victory Portfolios | | Notes to Financial Statements — continued
June 30, 2019 | |
(Unaudited)
• Level 3 — significant unobservable inputs (including the Funds' own assumptions in determining the fair value of investments)
Changes in valuation techniques may result in transfers in or out of an assigned level within the disclosure hierarchy. The inputs or methodologies used for valuation techniques are not necessarily an indication of the risk associated with entering into those investments.
Portfolio securities listed or traded on securities exchanges, including American Depositary Receipts ("ADRs") and Rights, are valued at the closing price on the exchange or system where the security is principally traded, if available, or at the Nasdaq Official Closing Price. If there have been no sales for that day on the exchange or system, then a security is valued at the last available bid quotation on the exchange or system where the security is principally traded. In each of these situations, valuations are typically categorized as Level 1 in the fair value hierarchy.
Investments for which there are no such quotations, or for which quotations do not appear reliable, are valued at fair value in accordance with procedures established by and under the general supervision and responsibility of the Trust's Board of Trustees (the "Board"). These valuations are typically categorized as Level 2 or Level 3 in the fair value hierarchy, based on the observability of inputs used to determine the fair value.
A summary of the valuations as of June 30, 2019, based upon the three levels defined above, is included in the table below while the breakdown, by category, of investments is disclosed in the Schedules of Portfolio Investments
| | | LEVEL 1 —
Quoted Prices | | Total | |
| | | Investments
in
Securities | | Investments
in
Securities | |
RS Small Cap Growth Fund | |
Common Stocks | | $ | 2,167,590,464 | | | $ | 2,167,590,464 | | |
Collateral for Securities Loaned | | | 356,900,924 | | | | 356,900,924 | | |
Total | | | 2,524,491,388 | | | | 2,524,491,388 | | |
RS Select Growth Fund | |
Common Stocks | | | 250,024,413 | | | | 250,024,413 | | |
Collateral for Securities Loaned | | | 31,635,050 | | | | 31,635,050 | | |
Total | | | 281,659,463 | | | | 281,659,463 | | |
RS Mid Cap Growth Fund | |
Common Stocks | | | 521,384,492 | | | | 521,384,492 | | |
Collateral for Securities Loaned | | | 51,578,661 | | | | 51,578,661 | | |
Total | | | 572,963,153 | | | | 572,963,153 | | |
RS Growth Fund | |
Common Stocks | | | 259,637,154 | | | | 259,637,154 | | |
Collateral for Securities Loaned | | | 21,076,108 | | | | 21,076,108 | | |
Total | | | 280,713,262 | | | | 280,713,262 | | |
RS Science and Technology Fund | |
Common Stocks | | | 268,574,299 | | | | 268,574,299 | | |
Collateral for Securities Loaned | | | 55,379,879 | | | | 55,379,879 | | |
Total | | | 323,954,178 | | | | 323,954,178 | | |
RS Small Cap Equity Fund | |
| Common Stocks | | | 70,477,185 | | | | 70,477,185 | | |
Collateral for Securities Loaned | | | 10,839,553 | | | | 10,839,553 | | |
Total | | | 81,316,738 | | | | 81,316,738 | | |
For the six months ended June 30, 2019, there were no Level 3 investments for which significant unobservable inputs were used to determine fair value.
49
Victory Portfolios | | Notes to Financial Statements — continued
June 30, 2019 | |
(Unaudited)
Real Estate Investment Trusts ("REITS"):
The Funds may invest in REITS which report information on the source of their distributions annually. REITS are pooled investment vehicles that invest primarily in income producing real estate or real estate related loans or interests (such as mortgages). Certain distributions received from REITS during the year are recorded as realized gains or return of capital as estimated by the Funds or when such information becomes known.
Investment Transactions and Related Income:
Changes in holdings of investments are accounted for no later than one business day following the trade date. For financial reporting purposes, however, investment transactions are accounted for on trade date on the last business day of the reporting period. Interest income is determined on the basis of coupon interest accrued using the effective interest method which adjusts where applicable, the amortization of premiums or accretion of discounts. Dividend income is recorded on the ex-dividend date. Gains or losses realized on sales of securities are determined by comparing the identified cost of the security lot sold with the net sales proceeds.
Withholding taxes on interest, dividends and gains as a result of certain investments in ADRs by the Funds have been provided for in accordance with each investment's applicable country's tax rules and rates.
Securities Lending:
The Trust has entered into a Master Securities Lending Agreement ("MSLA") with Citibank, N.A. ("Citibank" or the "Agent"). Under the terms of the MSLA, the Funds may lend securities to certain broker-dealers and banks in exchange for collateral in the amount of at least 102% of the value of U.S. securities loaned or at least 105% of the value of non-U.S. securities loaned, marked-to-market daily. Any collateral shortfalls associated with increases in the valuation of the securities loaned are adjusted the next business day. The collateral can be received in the form of cash collateral and/or non-cash collateral. Non-cash collateral can include U.S. Government Securities, letters of credit and certificates of deposit. The cash collateral is invested in short-term instruments or cash equivalents, primarily open-end investment companies, as noted in the Funds' Schedules of Portfolio Investments. The Trust does not have effective control of the non-cash collateral and therefore it is not disclosed in the Funds' Schedules of Portfolio Investments. During the time portfolio securities are on loan, the borrower will pay the Funds any dividends or interest paid on such securities plus any fee negotiated between the parties to the lending agreement. The Funds also earn a return from the collateral. The Funds pay the Agent various fees in connection with the investment of cash collateral and fees based on the investment income received from securities lending activities. Securities lending income (net of these fees) is disclosed on the Statements of Operations. Although risk is mitigated by the collateral, the Funds could experience a delay in recovering their securities and possible loss of income or value if the borrower fails to return them.
Securities lending transactions are entered into by a Fund under the MSLA, which permits the Fund, under certain circumstances such as an event of default, to offset amounts payable by the Fund to the same counterparty against amounts receivable from the counterparty to create a net payment due to or from the Fund.
The following table is a summary of the Funds' securities lending transactions which are subject to offset under the MSLA as of June 30, 2019. These transactions are accounted for as secured borrowings
50
Victory Portfolios | | Notes to Financial Statements — continued
June 30, 2019 | |
(Unaudited)
with an overnight and continuous contractual maturity for cash collateral, and greater than overnight and continuous contractual maturity for non-cash collateral.
| | | Gross
Amount of
Recognized
Assets
(Value of | | Value of
Cash | | Value of Non-cash Collateral
Received by Maturity | | | |
| | | Securities
on Loan) | | Collateral
Received* | | <30 Days | | Between
30 & 90 days | | >90 Days | | Net
Amount | |
RS Small Cap Growth
Fund | | $ | 354,414,246 | | | $ | 354,414,246 | | | $ | — | | | $ | — | | | $ | — | | | $ | — | | |
RS Select Growth Fund | | | 30,791,667 | | | | 30,791,667 | | | | — | | | | — | | | | — | | | | — | | |
RS Mid Cap Growth
Fund | | | 50,644,849 | | | | 50,644,849 | | | | — | | | | — | | | | — | | | | — | | |
RS Growth Fund | | | 20,665,064 | | | | 20,665,064 | | | | — | | | | — | | | | — | | | | — | | |
RS Science and
Technology Fund | | | 7,597,758 | | | | 7,597,758 | | | | — | | | | — | | | | — | | | | — | | |
RS Small Cap Equity
Fund | | | 10,832,077 | | | | 10,832,077 | | | | — | | | | — | | | | — | | | | — | | |
* Collateral received in excess of the market value of securities on loan is not presented in this table. The total cash collateral received by each Fund is disclosed in the Statements of Assets and Liabilities.
Distributions to Shareholders:
Dividends from net investment income, if any, are declared and paid annually for the Funds. Distributable net realized gains, if any, are declared and distributed at least annually from each Fund.
The amounts of dividends from net investment income and distributions from net realized gains (collectively distributions to shareholders) are determined in accordance with federal income tax regulations, which may differ from GAAP. To the extent these "book/tax" differences are permanent in nature (e.g., net operating loss and distribution reclassification), such amounts are reclassified within the components of net assets based on their federal tax-basis treatment; temporary differences (e.g., wash sales) do not require reclassification. To the extent dividends and distributions exceed net investment income and net realized gains for tax purposes, they are reported as distributions of capital. Net investment losses incurred by a Fund may be reclassified as an offset to capital on the accompanying Statements of Assets and Liabilities.
Federal Income Taxes:
It is the policy of each Fund to continue to qualify as a regulated investment company by complying with the provisions available to certain investment companies, as defined in applicable sections of the Internal Revenue Code, and to make distributions of net investment income and net realized gains sufficient to relieve it from all, or substantially all, federal income taxes. Accordingly, no provision for federal income taxes is required in the financial statements. The Funds have a tax year end of December 31.
Management of the Funds has reviewed tax positions taken in tax years that remain subject to examination by all major tax jurisdictions, including federal (i.e., all open tax years and the interim tax period since then). Management believes that there is no tax liability resulting from unrecognized tax benefits related to uncertain tax positions taken.
Allocations:
Expenses directly attributable to a Fund are charged to the Fund, while expenses which are attributable to more than one fund in the Trust, or jointly with an affiliated trust, are allocated among the respective funds in the Trust and/or affiliated trust based upon net assets or another appropriate basis.
Income, expenses (other than class-specific expenses such as transfer agent fees, state registration fees, printing and 12b-1 fees), and realized and unrealized gains or losses on investments are allocated
51
Victory Portfolios | | Notes to Financial Statements — continued
June 30, 2019 | |
(Unaudited)
to each class of shares based on its relative net assets on the date income is earned or expenses and realized and unrealized gains and losses are incurred.
Affiliated Securities Transactions:
Pursuant to Rule 17a-7 under the 1940 Act, the Funds may engage in securities transactions with affiliated investment companies and advisory accounts managed by the Adviser and any applicable sub-adviser. Any such purchase or sale transaction must be effected without brokerage commission or other remuneration, except for customary transfer fees. The transaction must be effected at the current market price, which is either the security's last sale price on an exchange or, if there are no transactions in the security that day, at the average of the highest bid and lowest asked price. For the six months ended June 30, 2019, the Funds did not engage in any Rule 17a-7 transactions under the 1940 Act.
3. Purchases and Sales of Securities:
Purchases and sales of securities (excluding securities maturing less than one year from acquisition) for the six months ended June 30, 2019 were as follows:
| | | Purchases
(excluding U.S.
Government
Securities) | | Sales
(excluding U.S.
Government
Securities) | |
RS Small Cap Growth Fund | | $ | 909,657,528 | | | $ | 956,843,388 | | |
RS Select Growth Fund | | | 109,830,672 | | | | 173,852,822 | | |
RS Mid Cap Growth Fund | | | 273,948,366 | | | | 200,635,231 | | |
RS Growth Fund | | | 140,119,903 | | | | 150,448,736 | | |
RS Science and Technology Fund | | | 148,253,340 | | | | 150,156,477 | | |
RS Small Cap Equity Fund | | | 29,149,853 | | | | 33,730,844 | | |
For the six months ended June 30, 2019, there were no purchases or sales of U.S. Government Securities.
4. Fees and Transactions with Affiliates and Related Parties:
Investment advisory services are provided to the Funds by Victory Capital Management Inc. ("VCM" or the "Adviser"), a New York corporation registered as an investment adviser with the Securities and Exchange Commission ("SEC"). The Adviser is a wholly-owned indirect subsidiary of Victory Capital Holdings, Inc., a publicly traded Delaware corporation, and a wholly-owned direct subsidiary of Victory Capital Operating, LLC.
Under the terms of the Investment Advisory Agreement, the Adviser is entitled to receive fees based on a percentage of the average daily net assets of each Fund. The rates at which the Adviser is paid by each Fund are included in the table below. The Adviser may use its resources to assist with the Funds' distribution and marketing expenses.
| | | Adviser Fee Rate | |
RS Small Cap Growth Fund | | | 0.95 | % | |
RS Select Growth Fund | | | 1.00 | % | |
RS Mid Cap Growth Fund | | | 0.85 | % | |
RS Growth Fund | | | 0.75 | % | |
RS Science and Technology Fund | | | 1.00 | % | |
RS Small Cap Equity Fund | | | 0.75 | % | |
VCM also serves as the Funds' administrator and fund accountant. Under an Administration and Fund Accounting Agreement, VCM is paid for its services an annual fee at a rate of 0.08% of the first $15 billion in average daily net assets of the Trust, Victory Variable Insurance Funds and Victory Portfolios II (collectively, the "Victory Funds Complex"), 0.05% of the average daily net assets above $15 billion to
52
Victory Portfolios | | Notes to Financial Statements — continued
June 30, 2019 | |
(Unaudited)
$30 billion of the Victory Funds Complex and 0.04% of the average daily net assets over $30 billion of the Victory Funds Complex.
Citi Fund Services Ohio, Inc. ("Citi"), an affiliate of Citibank, N.A., acts as sub-administrator and sub-fund accountant to the Funds pursuant to a Sub-Administration and Sub-Fund Accounting Services Agreement between VCM and Citi. VCM pays Citi a fee for providing these services. The Trust reimburses VCM and Citi for all of their reasonable out-of-pocket expenses incurred in providing these services.
FIS Investor Services, LLC ("FIS") serves as the Funds' transfer agent. Under the Transfer Agent Agreement, the Trust pays FIS a fee for its services and reimburses FIS for all of their reasonable out-of-pocket expenses incurred in providing these services.
The Chief Compliance Officer ("CCO") is an employee of the Adviser, which pays the compensation of the CCO and his support staff. The Trust has entered into an Agreement to provide compliance services with the Adviser, pursuant to which the Adviser furnishes its compliance personnel, including the services of the CCO, and other resources reasonably necessary to provide the Trust with compliance oversight services related to the design, administration and oversight of a compliance program for the Trust in accordance with Rule 38a-1 under the 1940 Act. The funds in the Victory Funds Complex, in the aggregate, compensate the Adviser for these services.
The Victory Funds Complex pays an annual retainer to each Independent Trustee, plus an additional annual retainer to the Chairman of the Board. The aggregate amount of the fees and expenses of the Independent Trustees are allocated amongst all the funds in the Victory Funds Complex and are presented in the Statements of Operations.
Shearman & Sterling LLP provides legal services to the Trust.
Victory Capital Advisers, Inc. (the "Distributor"), an affiliate of the Adviser, serves as distributor for the continuous offering of the shares of the Funds pursuant to a Distribution Agreement between the Distributor and the Trust. Pursuant to the Distribution and Service Plans adopted in accordance with Rule 12b-1 under the 1940 Act, the Distributor may receive a monthly distribution and service fee, at an annual rate of up to 0.25% of the average daily net assets of Class A Shares, at an annual rate of up to 0.50% of the average daily net assets of Class R Shares and 1.00% of the average daily net assets of Class C Shares of the Funds. The distribution and service fees paid to the Distributor may be used by the Distributor to pay for activities primarily intended to result in the sale of Class A, Class R or Class C Shares of the Funds.
In addition, the Distributor is entitled to receive commissions on sales of the Class A Shares of the Funds. For the six months ended June 30, 2019, the Distributor received approximately $21,424 from commissions earned on sales of Class A Shares of the Funds.
The Adviser has entered into expense limitation agreements with certain Funds. Under the terms of the agreements, the Adviser has agreed to waive fees or reimburse certain expenses to the extent that ordinary operating expenses incurred by certain classes of a Fund in any fiscal year exceed the expense limit for such classes of the Fund. Such excess amounts will be the liability of the Adviser. Interest, taxes, brokerage commissions, other expenditures which are capitalized in accordance with GAAP, and other extraordinary expenses not incurred in the ordinary course of a Fund's business are excluded from the expense limits. As of June 30, 2019, the expense limits (excluding voluntary waivers) are as follows:
| | | In effect January 1, 2019 until April 30, 2020 | |
| | | Class A
Shares | | Class C
Shares | | Class R
Shares | | Class R6
Shares | | Class Y
Shares | |
RS Small Cap Growth Fund | | | 1.40 | % | | | 2.16 | % | | | 1.86 | % | | | 1.06 | % | | | 1.13 | % | |
RS Select Growth Fund | | | 1.40 | % | | | 2.18 | % | | | 1.91 | % | | | 1.06 | % | | | 1.14 | % | |
RS Mid Cap Growth Fund | | | 1.20 | % | | | 2.11 | % | | | 1.80 | % | | | 0.94 | % | | | 0.95 | % | |
RS Growth Fund | | | 1.10 | % | | | 1.93 | % | | | 1.71 | % | | | N/A | | | | 0.83 | % | |
RS Science and Technology Fund | | | 1.49 | % | | | 2.28 | % | | | 1.93 | % | | | N/A | | | | 1.24 | % | |
RS Small Cap Equity Fund | | | 1.35 | % | | | 2.10 | % | | | 1.75 | % | | | N/A | | | | 1.10 | % | |
53
Victory Portfolios | | Notes to Financial Statements — continued
June 30, 2019 | |
(Unaudited)
The Funds have agreed to repay fees and expenses that were waived or reimbursed by the Adviser for a period up to three fiscal years after such waiver or reimbursement was made to the extent such payments or repayments would not cause the expenses of a class to exceed the original expense limitation in place at time of the waiver or reimbursement or any expense limitation agreement in place at the time of repayment. Amounts repaid to the Adviser during the six months ended, if any, are reflected on the Statements of Operations as "Recoupment of prior expenses waived/reimbursed by Adviser".
As of June 30, 2019, the following amounts are available to be repaid to the Adviser.
| | | Expires
12/31/19 | | Expires
12/31/20 | | Expires
12/31/21 | | Expires
12/31/22 | | Total | |
RS Small Cap Growth Fund | | $ | 542,236 | | | $ | 745,744 | | | $ | 578,670 | | | $ | 224,361 | | | $ | 2,091,011 | | |
RS Select Growth Fund | | | 93,780 | | | | 384,612 | | | | 334,454 | | | | 167,694 | | | | 980,540 | | |
RS Mid Cap Growth Fund | | | 138,565 | | | | 419,215 | | | | 394,372 | | | | 265,237 | | | | 1,217,389 | | |
RS Growth Fund | | | 111,652 | | | | 278,667 | | | | 283,325 | | | | 141,084 | | | | 814,728 | | |
RS Science and Technology Fund | | | 2,744 | | | | 18,803 | | | | 25,649 | | | | 12,953 | | | | 60,149 | | |
RS Small Cap Equity Fund | | | — | | | | 22,386 | | | | 28,246 | | | | 15,147 | | | | 65,779 | | |
The Adviser, may voluntarily waive or reimburse additional fees to assist the Funds in maintaining competitive expense ratios. Voluntary waivers and reimbursements applicable to the Funds are not available to be recouped at a future time. There were no voluntary waivers or reimbursements for the six months ended June 30, 2019.
Certain officers and/or interested trustees of the Funds are also officers and/or employees of the Adviser, Administrator, Fund Accountant, Sub-Administrator, Sub-Fund Accountant, and Legal Counsel.
5. Risks:
Each Fund may be subject to other risks in addition to these identified risks.
An investment in the Funds' shares represents an indirect investment in the securities owned by the Funds, some of which will be traded on a national securities exchange or in the over-the-counter markets. The value of the securities in which the Funds invest, like other market investments, may move up or down, sometimes rapidly and unpredictably. The value of the securities in which the Funds invest may affect the value of the Funds' shares. An investment in the Funds' shares at any point in time may be worth less than the original investment, even after taking into account the reinvestment of the Funds' distributions.
The Funds will be subject to credit risk with respect to the amount each expects to receive from counterparties for financial instruments entered into by the Funds. The Funds may be negatively impacted if a counterparty becomes bankrupt or otherwise fails to perform its obligations due to financial difficulties. The Funds may experience significant delays in obtaining any recovery in bankruptcy or other reorganization proceeding and the Funds may obtain only limited recovery or may obtain no recovery in such circumstances. The Funds typically enter into transactions with counterparties whose credit ratings are investment grade, as determined by a nationally recognized statistical rating organization or, if unrated, judged by the Adviser to be of comparable quality.
6. Borrowing and Interfund Lending:
Line of Credit:
For the six months ended June 30, 2019, the Victory Funds Complex participated in a short-term, demand note "Line of Credit" agreement with Citibank. Under the agreement with Citibank, the Victory Funds Complex could borrow up to $250 million, of which $100 million was committed and $150 million was uncommitted. This agreement was in effect through July 26, 2019. Effective July 1, 2019, the current agreement was amended to include the USAA Mutual Funds Complex and has a new termination date of June 29, 2020. Under this amended agreement, the Victory Funds Complex and USAA Mutual Funds Complex, combined, may borrow up to $600 million, of which $300 million is committed and $300 million is uncommitted. $40 million of the Line of Credit is reserved for use by the Victory Floating Rate Fund, another series of the Victory Funds Complex, with that Fund paying the related commitment fees for that amount. The purpose of the agreement is to meet temporary or emergency cash needs, including
54
Victory Portfolios | | Notes to Financial Statements — continued
June 30, 2019 | |
(Unaudited)
redemption requests that might otherwise require the untimely disposition of securities. With the agreement in affect for the six months ended June 30, 2019, Citibank received an annual commitment fee of 0.15% on $100 million for providing the Line of Credit. For the six months ended June 30, 2019, Citibank earned approximately $76 thousand in commitment fees from the Victory Funds Complex. Effective July 1, 2019, Citibank receives an annual commitment fee of 0.15% on $300 million for providing the Line of Credit. Each fund in the Victory Funds Complex pays a pro-rata portion of the commitment fees plus any interest (one month LIBOR plus one percent) on amounts borrowed, including the USAA Mutual Funds Complex, commencing July 1, 2019. Interest charged to each Fund during the period is presented on the Statements of Operations under line of credit fees.
The Funds did not utilize the Line of Credit during the six months ended June 30, 2019.
Interfund Lending:
The Trust and Adviser rely on an exemptive order granted by the SEC in March 2017 (the "Order"), permitting the establishment and operation of an Interfund Lending Facility (the "Facility"). The Facility allows each Fund to directly lend and borrow money to or from any other Victory Fund relying upon the Order at rates beneficial to both the borrowing and lending funds. Advances under the Facility are allowed for temporary or emergency purposes, including the meeting of redemption requests that otherwise might require the untimely disposition of securities, and are subject to each Fund's borrowing restrictions. The interfund loan rate is determined, as specified in the Order, by averaging the current repurchase agreement rate and the current bank loan rate. As a Borrower, interest charged to each Fund during the period is presented on the Statement of Operations under interfund lending fees. As a Lender, interest earned by each Fund during the period is presented on the Statement of Operations under Income on interfund lending.
The average borrowing and lending for the days outstanding and average interest rate for each Fund during the six months ended June 30, 2019 were as follows:
| | | Borrower or
Lender | | Amount
Outstanding at
June 30, 2019 | | Average
Borrowing* | | Days
Borrowing
Outstanding | | Average
Interest
Rate* | | Maximum
Borrowing
During the
Period | |
RS Select Growth Fund | | Borrower | | $ | — | | | $ | 2,048,167 | | | | 6 | | | | 3.14 | % | | $ | 4,725,000 | | |
RS Growth Fund | | Borrower | | | — | | | | 365,000 | | | | 1 | | | | 2.99 | % | | | 365,000 | | |
* For the six months ended June 30, 2019, based on the number of days borrowings were outstanding.
7. Federal Income Tax Information:
The tax character of distributions paid and the tax basis of current components of accumulated earnings (deficit) will be determined at the end of the current tax year ending December 31, 2019.
The tax character of distributions paid during the most recent tax year ended December 31, 2018, was as follows (total distributions paid may differ from the Statements of Changes in Net Assets because, for tax purposes, dividends are recognized when actually paid):
| | | Year Ended December 31, 2018 | |
| | | Distributions paid from | | | | | | | |
| | | Ordinary
Income | | Net
Long-Term
Capital Gains | | Total
Taxable
Distributions | | Return of
Capital | | Total
Distributions
Paid | |
RS Small Cap Growth
Fund | | $ | — | | | $ | 274,625,570 | | | $ | 274,625,570 | | | $ | — | | | $ | 274,625,570 | | |
RS Select Growth Fund | | | — | | | | 89,279,009 | | | | 89,279,009 | | | | — | | | | 89,279,009 | | |
RS Mid Cap Growth Fund | | | 10,276,039 | | | | 44,345,651 | | | | 54,621,690 | | | | 2,053,523 | | | | 56,675,213 | | |
RS Growth Fund | | | 3,016,021 | | | | 29,281,404 | | | | 32,297,425 | | | | — | | | | 32,297,425 | | |
RS Science and
Technology Fund | | | 4,628,756 | | | | 25,228,222 | | | | 29,856,978 | | | | — | | | | 29,856,978 | | |
RS Small Cap Equity Fund | | | — | | | | 14,749,298 | | | | 14,749,298 | | | | — | | | | 14,749,298 | | |
55
Victory Portfolios | | Notes to Financial Statements — continued
June 30, 2019 | |
(Unaudited)
As of the most recent tax year ended December 31, 2018, the components of distributable earnings/accumulated deficit on a tax basis were as follows:
| | | Undistributed
Long-Term
Capital Gains | | Accumulated
Earnings | | Qualified
Late-Year
Losses* | | Unrealized
Appreciation
(Depreciation)** | | Total
Accumulated
Earnings
(Deficit) | |
RS Small Cap Growth
Fund | | $ | 21,363,027 | | | $ | 21,363,027 | | | $ | (14,562,518 | ) | | $ | 97,061,170 | | | $ | 103,861,679 | | |
RS Select Growth
Fund | | | 18,679,766 | | | | 18,679,766 | | | | — | | | | 36,565,585 | | | | 55,245,351 | | |
RS Mid Cap Growth
Fund | | | — | | | | — | | | | (8,062,913 | ) | | | (4,246,899 | ) | | | (12,309,812 | ) | |
RS Growth Fund | | | 2,309,407 | | | | 2,309,407 | | | | (2,306,359 | ) | | | 45,403,791 | | | | 45,406,839 | | |
RS Science and
Technology Fund | | | — | | | | — | | | | — | | | | 30,114,561 | | | | 30,114,561 | | |
RS Small Cap Equity
Fund | | | 4,729,181 | | | | 4,729,181 | | | | (146,718 | ) | | | 719,571 | | | | 5,302,034 | | |
* Qualified Late-year Losses above are comprised of post-October capital losses and post-October specified losses incurred after October 31, 2018. These losses are deemed to arise on the first day of the Fund's next taxable year.
** The difference between the book-basis and tax-basis unrealized appreciation (depreciation) is attributable primarily to tax deferral of losses on wash sales.
As of June 30, 2019, the cost basis for federal income tax purposes, gross unrealized appreciation, gross unrealized depreciation and net unrealized appreciation (depreciation) for investments and derivatives were as follows:
| | Cost of
Investments
for Federal
Tax Purposes | | Gross
Unrealized
Appreciation | | Gross
Unrealized
Depreciation | | Net
Unrealized
Appreciation
(Depreciation) | |
RS Small Cap Growth Fund | | $ | 1,980,926,442 | | | $ | 618,209,841 | | | $ | (74,644,895 | ) | | $ | 543,564,946 | | |
RS Select Growth Fund | | | 208,193,010 | | | | 81,775,175 | | | | (8,308,722 | ) | | | 73,466,453 | | |
RS Mid Cap Growth Fund | | | 475,847,527 | | | | 106,593,127 | | | | (9,477,501 | ) | | | 97,115,626 | | |
RS Growth Fund | | | 197,818,710 | | | | 84,746,372 | | | | (1,851,820 | ) | | | 82,894,552 | | |
RS Science and Technology Fund | | | 257,967,325 | | | | 86,554,090 | | | | (20,567,237 | ) | | | 65,986,853 | | |
RS Small Cap Equity Fund | | | 66,303,215 | | | | 17,608,153 | | | | (2,594,630 | ) | | | 15,013,523 | | |
8. Capital Contribution from Prior Custodian:
During 2016, certain Funds received notification from their prior custodian, State Street Bank and Trust ("State Street"), concerning issues related to billing on certain categories of expenses during the approximately 16-year period from 1998 through October 31, 2014. The over-billing primarily related to categories of expenses that involved an allocation of general costs among multiple clients.
State Street paid the refunded amounts during January 2017. Based on billing information received during 2016 from State Street and an analysis of any expense limitation agreements that were in place during the period of the activities in question, including the application of any recoupment provisions in such agreements, the Adviser received a portion of the refund.
The portion of the refund retained by the Funds was accounted for as a capital contribution and is reflected on the Financial Highlights as "Capital Contribution from Prior Custodian, Net".
56
Victory Portfolios | | Notes to Financial Statements — continued
June 30, 2019 | |
(Unaudited)
9. Fund Ownership:
Ownership of more than 25% of the voting securities of a fund creates presumptions of control of the fund, under section 2(a)(9) of the 1940 Act. The shareholders listed below held more than 25% of the shares outstanding of the Fund and may be deemed to control the Fund.
| | | Shareholder | | Percent | |
RS Mid Cap Growth Fund | | Pershing LLC | | | 50.3 | % | |
10. Recent Accounting Pronouncements:
In August 2018, the Financial Accounting Standards Board ("FASB") issued Accounting Standards Update "ASU") No. 2018-13, "Fair Value Measurements" ("ASU 2018-13"). This update makes certain removals from, changes to and additions to existing disclosure requirements for fair value measurements. ASU 2018-13 does not change fair value measurements already required or permitted by existing standards. ASU 2018-13 is effective for financial statements issued for fiscal years beginning after December 15, 2019, and interim periods within those fiscal years. As permitted, the Funds have early adopted ASU 2018-13 with the financial statements prepared as of June 30, 2019.
11. Subsequent Events:
The Funds have evaluated the need for additional disclosures or adjustments resulting from subsequent events through the date these financial statements were issued. Based on this evaluation, there were no subsequent events to report that would have a material impact on the Funds' financial statements.
57
Victory Portfolios | | Supplemental Information
June 30, 2019 | |
(Unaudited)
Trustee and Officer
Information Board of Trustees:
Overall responsibility for management of the Trust rests with the Board. The Trust is managed by the Board in accordance with the laws of the State of Delaware. There are currently ten Trustees, nine of whom are not "interested persons" of the Trust within the meaning of that term under the 1940 Act ("Independent Trustees") and one of whom is an "interested person" of the Trust within the meaning of that term under the 1940 Act ("Interested Trustee"). The Trustees, in turn, elect the officers of the Trust to actively supervise its day-to-day operations. The following tables list the Trustees, their ages, position with the Trust, commencement of service, principal occupations during the past five years and any directorships of other investment companies or companies whose securities are registered under the Securities Exchange Act of 1934, as amended, or who file reports under that Act. Each Trustee oversees 42 portfolios in the Trust, nine portfolios in Victory Variable Insurance Funds, and 20 portfolios in Victory Portfolios II, each a registered investment company that, together with the Trust, comprise the Victory Funds Complex. Each Trustee's address is c/o Victory Portfolios, 4900 Tiedeman Road, 4th Floor, Brooklyn, Ohio 44144. Each Trustee has an indefinite term.
Name and Age | | Position
Held with
the Trust | | Date
Commenced
Service | | Principal Occupation
During Past 5 Years | | Other
Directorships
Held During
Past 5 Years | |
Independent Trustees. | | | | | | | | | |
David Brooks Adcock, 67 | | Trustee | | May 2005 | | Consultant (since 2006). | | Chair and Trustee, Turner Funds (December 2016-December 2017). | |
Nigel D. T. Andrews, 72 | | Vice Chair and Trustee | | August 2002 | | Retired. | | Director, TCG BDC II, Inc. (since 2017); Director, TCG BDC I, Inc. (formerly Carlyle GMS Finance, Inc.) (since 2012); Director, Old Mutual US Asset Management (2002-2014). | |
E. Lee Beard, 68* | | Trustee | | May 2005 | | Retired (since 2015); Consultant, The Henlee Group, LLC (consulting) (2005-2015). | | None. | |
Dennis M. Bushe, 75 | | Trustee | | July 2016 | | Retired. | | Trustee, RS Investment Trust and RS Variable Products Trust (November 2011-July 2016). | |
58
Victory Portfolios | | Supplemental Information — continued
June 30, 2019 | |
(Unaudited)
Name and Age | | Position
Held with
the Trust | | Date
Commenced
Service | | Principal Occupation
During Past 5 Years | | Other
Directorships
Held During
Past 5 Years | |
Sally M. Dungan, 65 | | Trustee | | February 2011 | | Chief Investment Officer, Tufts University (since 2002). | | None. | |
John L. Kelly, 66 | | Trustee | | February 2015 | | Partner, McCarvill Capital Partners (September 2016-September 2017); Advisor, Endgate Commodities LLC (January 2016-April 2016); Managing Partner, Endgate Commodities LLC (August 2014-January 2016); Chief Operating Officer, Liquidnet Holdings, Inc. (December 2011-July 2014). | | Director, Caledonia Mining Corporation (since May 2012). | |
David L. Meyer, 62* | | Trustee | | December 2008 | | Retired. | | None. | |
Gloria S. Nelund, 58 | | Trustee | | July 2016 | | Chair, CEO and Co-Founder of TriLinc Global, LLC, an investment firm. | | TriLinc Global Impact Fund, LLC (since 2012); Trustee, RS Investment Trust and RS Variable Products Trust (November 2007-July 2016). | |
Leigh A. Wilson, 74 | | Chair and Trustee | | November 1994 | | Private Investor. | | Chair (since 2013), Caledonia Mining Corporation. | |
Interested Trustee. | | | | | | | | | |
David C. Brown, 47** | | Trustee | | May 2008 | | Chairman and Chief Executive Officer (since 2013), Co-Chief Executive Officer (2011-2013), the Adviser; Chairman and Chief Executive Officer, Victory Capital Holdings, Inc. (since 2013). | | None. | |
* The Board has designated Mr. Meyer and Ms. Beard as its Audit Committee Financial Experts.
** Mr. Brown is an "Interested Person" by reason of his relationship with the Adviser.
The Statement of Additional Information includes additional information about the Trustees of the Trust and is available, without charge, on the SEC's website at www.sec.gov and/or by calling 800-539-3863.
59
Victory Portfolios | | Supplemental Information — continued
June 30, 2019 | |
(Unaudited)
Officers:
The officers of the Trust, their ages, commencement of service and their principal occupations during the past five years, are detailed in the following table. Each officer serves until the earlier of his or her resignation, removal, retirement, death, or the election of a successor. The mailing address of each officer of the Trust is 4900 Tiedeman Road, 4th Floor, Brooklyn, Ohio 44144. The officers of the Trust receive no compensation directly from the Trust for performing the duties of their offices.
Name and Age | | Position with
the Trust | | Date
Commenced
Service | | Principal Occupation During Past 5 Years | |
Christopher K. Dyer, 57 | | President | | February 2006* | | Director of Fund Administration, the Adviser. | |
Scott A. Stahorsky, 50 | | Vice President | | December 2014 | | Manager, Fund Administration, the Adviser (since 2015); Senior Analyst, Fund Administration, the Adviser (prior to 2015). | |
Erin G. Wagner, 45 | | Secretary | | December 2014 | | Associate General Counsel, the Adviser (since 2013). | |
Allan Shaer, 54 | | Treasurer | | May 2017 | | Senior Vice President, Financial Administration, Citi Fund Services Ohio, Inc. (since 2016); Vice President, Mutual Fund Administration, JP Morgan Chase (2011-2016). | |
Christopher A. Ponte, 35 | | Assistant Treasurer | | December 2017 | | Manager, Fund Administration, the Adviser (since 2017); Senior Analyst, Fund Administration, the Adviser (prior to 2017); Chief Financial Officer, Victory Capital Advisers, Inc. (since 2018). | |
Colin Kinney, 45 | | Chief Compliance Officer | | July 2017 | | Chief Compliance Officer (since 2013) and Chief Risk Officer (2009-2017), the Adviser. | |
Chuck Booth, 59 | | Anti-Money Laundering Compliance Officer and Identity Theft Officer | | May 2015 | | Director, Regulatory Administration and CCO Support Services, Citi Fund Services Ohio, Inc. | |
Jay G. Baris, 65 | | Assistant Secretary | | December 1997 | | Partner, Shearman & Sterling LLP (since 2018); Partner, Morrison & Foerster LLP (2011-January 2018). | |
* On December 3, 2014, Mr. Dyer resigned as Secretary of the Trust and accepted the position of President.
60
Victory Portfolios | | Supplemental Information — continued
June 30, 2019 | |
(Unaudited)
Proxy Voting and Portfolio Holdings Information
Proxy Voting:
Information regarding the policies and procedures each Fund uses to determine how to vote proxies relating to portfolio securities is available without charge, upon request, by calling 800-539-3863. The information is also included in the Funds' Statement of Additional Information, which is available on the SEC's website at www.sec.gov.
Information relating to how the Funds voted proxies relating to portfolio securities held during the most recent twelve months ended June 30 is available on the SEC's website at www.sec.gov.
Availability of Schedules of Portfolio Investments:
The Trust files a complete list of Schedules of Portfolio Investments with the SEC for the first and third quarter of each fiscal year on Form N-PORT. Prior to the implementation of Form N-PORT, the Trust filed a complete list of Schedules of Portfolio Investments with the SEC for the first and third quarters of each fiscal year on Form N-Q. Forms N-PORT and Forms N-Q are available on the SEC's website at www.sec.gov.
Expense Examples
As a shareholder of the Funds, you may incur two types of costs: (1) transaction costs, including sales charges (loads) on purchases; and (2) ongoing costs, including management fees, distribution and service (12b-1) fees, and other Fund expenses. These examples are intended to help you understand your ongoing costs (in dollars) of investing in the Funds and to compare these costs with the ongoing costs of investing in other mutual funds.
These examples are based on an investment of $1,000 invested at the beginning of the period and held for the entire period from January 1, 2019 through June 30, 2019.
The Actual Expense figures in the table below provide information about actual account values and actual expenses. You may use the information below, together with the amount you invested, to estimate the expenses that you paid over the period. Simply divide your account value by $1,000 (for example, an $8,600 account value divided by $1,000 = 8.6), then multiply the result by the number in the table under the heading entitled "Actual Expenses Paid During Period" to estimate the expenses you paid on your account during this period.
The Hypothetical Expense figures in the table below provide information about hypothetical account values and hypothetical expenses based on each Fund's actual expense ratio and an assumed rate of return of 5% per year before expenses, which is not the Fund's actual return. The hypothetical account values and expenses may not be used to estimate the actual ending account balance or expenses you paid for the period. You may use this information to compare this 5% hypothetical example with the 5% hypothetical examples that appear in shareholder reports of other funds.
Please note the expenses shown in the table are meant to highlight your ongoing costs only and do not reflect any transactional costs. Therefore, the table is useful in comparing ongoing costs only, and will not help you determine the relative total costs of owning different funds. In addition, if these transactional costs were included, your costs would have been higher.
Fund | | Beginning
Account
Value
1/1/19 | | Actual
Ending
Account
Value
6/30/19 | | Hypothetical
Ending
Account
Value
6/30/19 | | Actual
Expenses
Paid
During
Period
1/1/19-
6/30/19* | | Hypothetical
Expenses
Paid
During
Period
1/1/19-
6/30/19* | | Annualized
Expense
Ratio
During
Period
1/1/19-
6/30/19 | |
RS Small Cap Growth Fund | |
Class A Shares | | $ | 1,000.00 | | | $ | 1,313.40 | | | $ | 1,017.85 | | | $ | 8.03 | | | $ | 7.00 | | | | 1.40 | % | |
Class C Shares | | | 1,000.00 | | | | 1,308.30 | | | | 1,014.08 | | | | 12.36 | | | | 10.79 | | | | 2.16 | % | |
Class R Shares | | | 1,000.00 | | | | 1,310.40 | | | | 1,015.57 | | | | 10.66 | | | | 9.30 | | | | 1.86 | % | |
Class R6 Shares | | | 1,000.00 | | | | 1,315.50 | | | | 1,019.54 | | | | 6.09 | | | | 5.31 | | | | 1.06 | % | |
Class Y Shares | | | 1,000.00 | | | | 1,315.00 | | | | 1,019.19 | | | | 6.49 | | | | 5.66 | | | | 1.13 | % | |
61
Victory Portfolios | | Supplemental Information — continued
June 30, 2019 | |
(Unaudited)
Fund | | Beginning
Account
Value
1/1/19 | | Actual
Ending
Account
Value
6/30/19 | | Hypothetical
Ending
Account
Value
6/30/19 | | Actual
Expenses
Paid
During
Period
1/1/19-
6/30/19* | | Hypothetical
Expenses
Paid
During
Period
1/1/19-
6/30/19* | | Annualized
Expense
Ratio
During
Period
1/1/19-
6/30/19 | |
RS Select Growth Fund | |
Class A Shares | | $ | 1,000.00 | | | $ | 1,259.70 | | | $ | 1,017.85 | | | $ | 7.84 | | | $ | 7.00 | | | | 1.40 | % | |
Class C Shares | | | 1,000.00 | | | | 1,254.80 | | | | 1,013.98 | | | | 12.19 | | | | 10.89 | | | | 2.18 | % | |
Class R Shares | | | 1,000.00 | | | | 1,256.60 | | | | 1,015.32 | | | | 10.69 | | | | 9.54 | | | | 1.91 | % | |
Class R6 Shares | | | 1,000.00 | | | | 1,261.60 | | | | 1,019.54 | | | | 5.94 | | | | 5.31 | | | | 1.06 | % | |
Class Y Shares | | | 1,000.00 | | | | 1,261.40 | | | | 1,019.14 | | | | 6.39 | | | | 5.71 | | | | 1.14 | % | |
RS Mid Cap Growth Fund | |
Class A Shares | | | 1,000.00 | | | | 1,302.10 | | | | 1,018.84 | | | | 6.85 | | | | 6.01 | | | | 1.20 | % | |
Class C Shares | | | 1,000.00 | | | | 1,296.60 | | | | 1,014.33 | | | | 12.01 | | | | 10.54 | | | | 2.11 | % | |
Class R Shares | | | 1,000.00 | | | | 1,298.70 | | | | 1,015.87 | | | | 10.26 | | | | 9.00 | | | | 1.80 | % | |
Class R6 Shares | | | 1,000.00 | | | | 1,304.20 | | | | 1,020.13 | | | | 5.37 | | | | 4.71 | | | | 0.94 | % | |
Class Y Shares | | | 1,000.00 | | | | 1,303.90 | | | | 1,020.08 | | | | 5.43 | | | | 4.76 | | | | 0.95 | % | |
RS Growth Fund | |
Class A Shares | | | 1,000.00 | | | | 1,239.60 | | | | 1,019.34 | | | | 6.11 | | | | 5.51 | | | | 1.10 | % | |
Class C Shares | | | 1,000.00 | | | | 1,234.20 | | | | 1,015.22 | | | | 10.69 | | | | 9.64 | | | | 1.93 | % | |
Class R Shares | | | 1,000.00 | | | | 1,236.00 | | | | 1,016.31 | | | | 9.48 | | | | 8.55 | | | | 1.71 | % | |
Class Y Shares | | | 1,000.00 | | | | 1,241.20 | | | | 1,020.68 | | | | 4.61 | | | | 4.16 | | | | 0.83 | % | |
RS Science and Technology Fund | |
Class A Shares | | | 1,000.00 | | | | 1,295.00 | | | | 1,017.50 | | | | 8.36 | | | | 7.35 | | | | 1.47 | % | |
Class C Shares | | | 1,000.00 | | | | 1,289.60 | | | | 1,013.49 | | | | 12.94 | | | | 11.38 | | | | 2.28 | % | |
Class R Shares | | | 1,000.00 | | | | 1,292.40 | | | | 1,015.22 | | | | 10.97 | | | | 9.64 | | | | 1.93 | % | |
Class Y Shares | | | 1,000.00 | | | | 1,296.10 | | | | 1,018.65 | | | | 7.06 | | | | 6.21 | | | | 1.24 | % | |
RS Small Cap Equity Fund | |
Class A Shares | | | 1,000.00 | | | | 1,317.70 | | | | 1,018.60 | | | | 7.18 | | | | 6.26 | | | | 1.25 | % | |
Class C Shares | | | 1,000.00 | | | | 1,313.60 | | | | 1,014.38 | | | | 12.05 | | | | 10.49 | | | | 2.10 | % | |
Class R Shares | | | 1,000.00 | | | | 1,314.90 | | | | 1,016.12 | | | | 10.04 | | | | 8.75 | | | | 1.75 | % | |
Class Y Shares | | | 1,000.00 | | | | 1,318.30 | | | | 1,019.34 | | | | 6.32 | | | | 5.51 | | | | 1.10 | % | |
* Expenses are equal to the average account value multiplied by the Fund's annualized expense ratio multiplied by 181/365 (the number of days in the most recent fiscal half-year divided by the number of days in the fiscal year).
62
Privacy Policy
Protecting the Privacy of Information
The Trust respects your right to privacy. We also know that you expect us to conduct and process your business in an accurate and efficient manner. To do so, we must collect and maintain certain personal information about you. This is the information we collect from you on applications or other forms, and from the transactions you make with us or third parties. It may include your name, address, social security number, account transactions and balances, and information about investment goals and risk tolerance.
We do not disclose any information about you or about former customers to anyone except as permitted or required by law. Specifically, we may disclose the information we collect to companies that perform services on our behalf, such as the transfer agent that processes shareholder accounts and printers and mailers that assist us in the distribution of investor materials. We may also disclose this information to companies that perform marketing services on our behalf. This allows us to continue to offer you Victory investment products and services that meet your investing needs, and to effect transactions that you request or authorize. These companies will use this information only in connection with the services for which we hired them. They are not permitted to use or share this information for any other purpose.
To protect your personal information internally, we permit access only by authorized employees and maintain physical, electronic and procedural safeguards to guard your personal information.*
* You may have received communications regarding information about privacy policies from other financial institutions which gave you the opportunity to "opt-out" of certain information sharing with companies which are not affiliated with that financial institution. The Trust does not share information with other companies for purposes of marketing solicitations for products other than the Trust. Therefore, the Trust does not provide opt-out options to their shareholders.
Victory Funds
P.O. Box 182593
Columbus, Ohio 43218-2593

Visit our website at: | | Call Victory at: | |
www.vcm.com | | 800-539-FUND (800-539-3863) | |

June 30, 2019
Semi Annual Report
Victory RS International Fund
Victory RS Global Fund
Victory Sophus Emerging Markets Fund
Victory Sophus Emerging Markets Small Cap Fund
Beginning on January 1, 2021, as permitted by regulations adopted by the Securities and Exchange Commission, paper copies of the Victory Funds' shareholder reports will no longer be sent by mail, unless you specifically request paper copies of the reports from the Victory Funds or from your financial intermediary, such as a broker-dealer or bank. Instead, the reports will be made available on www.VictoryFunds.com, and you will be notified by mail each time a report is posted and provided with a website link to access the report. If you already elected to receive shareholder reports electronically, you will not be affected by this change, and you need not take any action.
You may elect to receive shareholder reports and other communications from the Victory Funds or your financial intermediary electronically sooner than January 1, 2021 by notifying your financial intermediary directly or, if you are a direct investor, by calling 800-539-3863 or by sending an e-mail request to TA.Processing@FISGlobal.com.
You may elect to receive all future reports in paper free of charge. If you invest through a financial intermediary, you can contact your financial intermediary to request that you continue to receive paper copies of your reports. If you invest directly with the Victory Funds, you can call 800-539-3863 or send an e-mail request to TA.Processing@FISGlobal.com. Your election to receive reports in paper will apply to all Victory Funds you hold directly or through your financial intermediary.
www.vcm.com
News, Information And Education 24 Hours A Day, 7 Days A Week
The Victory Funds site gives fund shareholders, prospective shareholders, and investment professionals a convenient way to access fund information, get guidance, and track fund performance anywhere they can access the Internet. The site includes:
• Detailed performance records
• Daily share prices
• The latest fund news
• Investment resources to help you become a better investor
• A section dedicated to investment professionals
Whether you're a potential investor searching for the fund that matches your investment philosophy, a seasoned investor interested in planning tools, or an investment professional, www.vcm.com has what you seek. Visit us anytime. We're always open.
Table of Contents
Financial Statements | |
The Victory International Funds | |
Victory RS International Fund | |
Investment Objectives & Portfolio Holdings | | | 3 | | |
Schedule of Portfolio Investments | | | 4 | | |
Statements of Assets and Liabilities | | | 28-29 | | |
Statements of Operations | | | 32 | | |
Statements of Changes in Net Assets | | | 34-36 | | |
Financial Highlights | | | 40-41 | | |
Victory RS Global Fund | |
Investment Objectives & Portfolio Holdings | | | 3 | | |
Schedule of Portfolio Investments | | | 9 | | |
Statements of Assets and Liabilities | | | 28-29 | | |
Statements of Operations | | | 32 | | |
Statements of Changes in Net Assets | | | 34-36 | | |
Financial Highlights | | | 42-43 | | |
Victory Sophus Emerging Markets Fund | |
Investment Objectives & Portfolio Holdings | | | 3 | | |
Schedule of Portfolio Investments | | | 14 | | |
Statements of Assets and Liabilities | | | 30-31 | | |
Statements of Operations | | | 33 | | |
Statements of Changes in Net Assets | | | 37-39 | | |
Financial Highlights | | | 44-45 | | |
Victory Sophus Emerging Markets Small Cap Fund | |
Investment Objectives & Portfolio Holdings | | | 3 | | |
Schedule of Portfolio Investments | | | 21 | | |
Statements of Assets and Liabilities | | | 30-31 | | |
Statements of Operations | | | 33 | | |
Statements of Changes in Net Assets | | | 37-39 | | |
Financial Highlights | | | 46-47 | | |
Notes to Financial Statements | | | 48 | | |
Supplemental Information | | | 59 | | |
Trustee and Officer Information | | | 59 | | |
Proxy Voting and Portfolio Holdings Information | | | 62 | | |
Expense Examples | | | 62 | | |
Privacy Policy (inside back cover) | | | |
1
The Funds are distributed by Victory Capital Advisers, Inc. Victory Capital Management Inc. is the investment adviser to the Funds and receives fees from the Funds for performing services for the Funds.
This report is not authorized for distribution to prospective investors unless preceded or accompanied by a current prospectus of the Victory Funds.
For additional information about any Victory Fund, including fees, expenses, and risks, view our prospectus online at www.vcm.com or call 800-539-3863. Read it carefully before you invest or send money.
The information in this semi annual report is based on data obtained from recognized services and sources and is believed to be reliable. Any opinions, projections, or recommendations in this report are subject to change without notice and are not intended as individual investment advice. Past investment performance of the Funds, markets or securities mentioned herein should not be considered to be indicative of future results.
• NOT FDIC INSURED • NO BANK GUARANTEE • MAY LOSE VALUE

Call Victory at:
800-539-FUND (800-539-3863)
Visit our website at:
www.vcm.com
2
Victory Portfolios | | June 30, 2019 | |
(Unaudited)
Investment Objectives & Portfolio Holdings:
Victory RS International Fund
Seeks to provide long-term capital appreciation. | |
Portfolio Holdings
As a Percentage of Total Investments

Victory RS Global Fund
Seeks to provide long-term capital appreciation. | |
Portfolio Holdings
As a Percentage of Total Investments
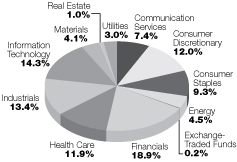
Victory Sophus Emerging Markets Fund
Seeks to provide long-term capital appreciation.
Portfolio Holdings
As a Percentage of Total Investments
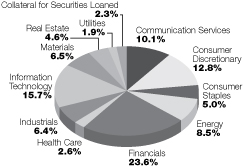
Victory Sophus Emerging Markets Small Cap Fund
Seeks to provide long-term capital appreciation.
Portfolio Holdings
As a Percentage of Total Investments
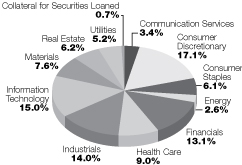
3
Victory Portfolios
Victory RS International Fund | | Schedule of Portfolio Investments
June 30, 2019 | |
(Unaudited)
Security Description | | Shares | | Value | |
Common Stocks (95.9%) | |
Australia (6.5%): | |
Financials (1.6%): | |
Macquarie Group Ltd. | | | 8,971 | | | $ | 791,130 | | |
Health Care (1.4%): | |
CSL Ltd. | | | 4,803 | | | | 727,136 | | |
Materials (1.6%): | |
BHP Billiton Ltd. | | | 28,080 | | | | 816,074 | | |
Real Estate (1.9%): | |
Scentre Group | | | 351,574 | | | | 948,621 | | |
| | | | 3,282,961 | | |
Belgium (0.5%): | |
Information Technology (0.5%): | |
Melexis NV | | | 4,093 | | | | 276,683 | | |
China (2.1%): | |
Communication Services (1.3%): | |
Tencent Holdings Ltd. | | | 14,300 | | | | 646,948 | | |
Financials (0.8%): | |
China Merchants Bank Co. Ltd., Class H | | | 80,000 | | | | 397,009 | | |
| | | | 1,043,957 | | |
Denmark (1.2%): | |
Consumer Staples (1.2%): | |
Royal Unibrew A/S | | | 8,344 | | | | 610,175 | | |
France (8.2%): | |
Consumer Discretionary (3.3%): | |
Cie Generale des Etablissements Michelin | | | 3,884 | | | | 490,970 | | |
LVMH Moet Hennessy Louis Vuitton SA | | | 2,750 | | | | 1,168,790 | | |
| | | | 1,659,760 | | |
Energy (1.5%): | |
Total SA | | | 13,358 | | | | 749,105 | | |
Financials (1.1%): | |
AXA SA | | | 20,775 | | | | 545,445 | | |
Information Technology (1.4%): | |
Cap Gemini SA | | | 5,813 | | | | 722,560 | | |
Materials (0.9%): | |
Arkema SA | | | 4,843 | | | | 450,109 | | |
| | | | 4,126,979 | | |
Germany (7.9%): | |
Financials (2.1%): | |
Allianz SE | | | 4,398 | | | | 1,060,416 | | |
See notes to financial statements.
4
Victory Portfolios
Victory RS International Fund | | Schedule of Portfolio Investments — continued
June 30, 2019 | |
(Unaudited)
Security Description | | Shares | | Value | |
Health Care (0.3%): | |
Bayer AG | | | 2,612 | | | $ | 181,121 | | |
Industrials (2.3%): | |
Siemens AG | | | 6,167 | | | | 734,022 | | |
Washtec AG | | | 6,067 | | | | 412,366 | | |
| | | | 1,146,388 | | |
Information Technology (1.9%): | |
SAP SE | | | 6,888 | | | | 944,042 | | |
Real Estate (1.3%): | |
Vonovia SE | | | 13,530 | | | | 646,157 | | |
| | | | 3,978,124 | | |
Hong Kong (2.4%): | |
Financials (0.9%): | |
AIA Group Ltd. | | | 44,600 | | | | 481,650 | | |
Real Estate (1.0%): | |
CK Asset Holdings Ltd. | | | 63,500 | | | | 497,483 | | |
Utilities (0.5%): | |
HK Electric Investments & HK Electric Investments Ltd. | | | 237,000 | | | | 242,678 | | |
| | | | 1,221,811 | | |
Ireland (1.0%): | |
Industrials (1.0%): | |
Experian PLC | | | 16,817 | | | | 509,278 | | |
Italy (4.4%): | |
Financials (1.2%): | |
Banca Generali SpA | | | 20,806 | | | | 598,943 | | |
Health Care (0.8%): | |
Recordati SpA | | | 10,153 | | | | 423,070 | | |
Utilities (2.4%): | |
Enel SpA | | | 171,628 | | | | 1,196,921 | | |
| | | | 2,218,934 | | |
Japan (20.0%): | |
Communication Services (0.7%): | |
Nippon Telegraph & Telephone Corp. | | | 7,700 | | | | 358,791 | | |
Consumer Discretionary (4.2%): | |
Hikari Tsushin, Inc. | | | 2,400 | | | | 524,393 | | |
Toyota Motor Corp. | | | 18,200 | | | | 1,129,719 | | |
United Arrows Ltd. | | | 15,200 | | | | 475,283 | | |
| | | | 2,129,395 | | |
Consumer Staples (1.0%): | |
Matsumotokiyoshi Holdings Co. Ltd. | | | 16,600 | | | | 487,657 | | |
See notes to financial statements.
5
Victory Portfolios
Victory RS International Fund | | Schedule of Portfolio Investments — continued
June 30, 2019 | |
(Unaudited)
Security Description | | Shares | | Value | |
Financials (2.5%): | |
Jafco Co. Ltd. | | | 8,600 | | | $ | 315,995 | | |
Mitsubishi UFJ Financial Group, Inc. | | | 100,200 | | | | 477,317 | | |
Tokio Marine Holdings, Inc. | | | 9,300 | | | | 466,696 | | |
| | | | 1,260,008 | | |
Health Care (2.4%): | |
Hoya Corp. | | | 8,400 | | | | 645,665 | | |
Shionogi & Co. Ltd. | | | 10,100 | | | | 583,688 | | |
| | | | 1,229,353 | | |
Industrials (5.8%): | |
EN-Japan, Inc. | | | 12,800 | | | | 501,069 | | |
Fuji Electric Co. Ltd. | | | 17,900 | | | | 620,442 | | |
Hitachi Construction Machinery Co. Ltd. | | | 14,300 | | | | 374,164 | | |
ITOCHU Corp. | | | 19,000 | | | | 364,034 | | |
Kyowa Exeo Corp. | | | 8,200 | | | | 204,656 | | |
Okuma Corp. | | | 7,700 | | | | 397,132 | | |
Sanwa Holdings Corp. | | | 42,500 | | | | 458,155 | | |
| | | | 2,919,652 | | |
Information Technology (1.5%): | |
Fujitsu Ltd. | | | 4,300 | | | | 300,553 | | |
Oracle Corp. Japan | | | 3,600 | | | | 263,615 | | |
Ulvac, Inc. | | | 6,700 | | | | 213,512 | | |
| | | | 777,680 | | |
Materials (0.3%): | |
DIC Corp. | | | 4,800 | | | | 127,116 | | |
Real Estate (0.6%): | |
Sumitomo Realty & Development | | | 8,400 | | | | 300,550 | | |
Utilities (1.0%): | |
Chubu Electric Power Co., Inc. | | | 35,500 | | | | 498,750 | | |
| | | | 10,088,952 | | |
Macau (1.1%): | |
Consumer Discretionary (1.1%): | |
Wynn Macau Ltd. | | | 237,600 | | | | 531,923 | | |
Netherlands (5.3%): | |
Communication Services (1.8%): | |
Koninklijke KPN NV | | | 286,282 | | | | 878,884 | | |
Financials (1.6%): | |
ING Groep NV | | | 68,303 | | | | 790,998 | | |
Industrials (1.9%): | |
Wolters Kluwer NV | | | 13,456 | | | | 978,686 | | |
| | | | 2,648,568 | | |
Norway (1.9%): | |
Energy (0.5%): | |
Aker BP ASA | | | 7,994 | | | | 230,653 | | |
See notes to financial statements.
6
Victory Portfolios
Victory RS International Fund | | Schedule of Portfolio Investments — continued
June 30, 2019 | |
(Unaudited)
Security Description | | Shares | | Value | |
Financials (1.4%): | |
SpareBank 1 SMN | | | 63,942 | | | $ | 733,139 | | |
| | | | 963,792 | | |
Russian Federation (0.6%): | |
Materials (0.6%): | |
Evraz PLC | | | 36,297 | | | | 307,278 | | |
Spain (2.5%): | |
Communication Services (1.6%): | |
Telefonica SA | | | 96,403 | | | | 792,544 | | |
Financials (0.9%): | |
Banco Santander SA (a) | | | 103,692 | | | | 480,451 | | |
| | | | 1,272,995 | | |
Sweden (2.4%): | |
Industrials (2.4%): | |
Atlas Copco AB, Class B | | | 32,924 | | | | 947,002 | | |
Epiroc AB, Class B | | | 28,237 | | | | 280,220 | | |
| | | | 1,227,222 | | |
Switzerland (11.2%): | |
Consumer Staples (3.6%): | |
Nestle SA, Registered Shares | | | 17,738 | | | | 1,837,030 | | |
Financials (1.9%): | |
Cembra Money Bank AG | | | 4,200 | | | | 405,473 | | |
UBS Group AG, Registered Shares | | | 45,902 | | | | 545,780 | | |
| | | | 951,253 | | |
Health Care (5.7%): | |
Novartis AG | | | 14,807 | | | | 1,352,312 | | |
Roche Holding AG | | | 5,345 | | | | 1,503,565 | | |
| | | | 2,855,877 | | |
| | | | 5,644,160 | | |
United Kingdom (16.7%): | |
Consumer Discretionary (0.9%): | |
Next PLC | | | 6,467 | | | | 452,774 | | |
Consumer Staples (4.2%): | |
Britvic PLC | | | 41,188 | | | | 464,612 | | |
Diageo PLC | | | 18,220 | | | | 784,037 | | |
Unilever PLC | | | 13,724 | | | | 851,751 | | |
| | | | 2,100,400 | | |
Energy (3.7%): | |
| BP PLC | | | 88,445 | | | | 616,053 | | |
Royal Dutch Shell PLC, Class A | | | 37,608 | | | | 1,227,189 | | |
| | | | 1,843,242 | | |
See notes to financial statements.
7
Victory Portfolios
Victory RS International Fund | | Schedule of Portfolio Investments — continued
June 30, 2019 | |
(Unaudited)
Security Description | | Shares | | Value | |
Financials (3.4%): | |
Close Brothers Group PLC | | | 16,548 | | | $ | 296,941 | | |
HSBC Holdings PLC | | | 79,437 | | | | 662,870 | | |
Legal & General Group PLC | | | 220,892 | | | | 756,628 | | |
| | | | 1,716,439 | | |
Health Care (1.1%): | |
Smith & Nephew PLC | | | 25,786 | | | | 559,821 | | |
Industrials (1.1%): | |
RELX PLC | | | 22,976 | | | | 557,159 | | |
Materials (2.3%): | |
Croda International PLC | | | 3,973 | | | | 258,377 | | |
Rio Tinto PLC | | | 14,867 | | | | 919,981 | | |
| | | | 1,178,358 | | |
| | | | 8,408,193 | | |
Total Common Stocks (Cost $44,436,975) | | | 48,361,985 | | |
Preferred Stocks (0.6%) | |
Japan (0.6%): | |
Consumer Staples (0.6%): | |
Ito En Ltd. | | | 13,200 | | | | 292,161 | | |
Total Preferred Stocks (Cost $286,121) | | | 292,161 | | |
Exchange-Traded Funds (1.3%) | |
United States (1.3%): | |
iShares MSCI EAFE ETF | | | 10,336 | | | | 679,385 | | |
Total Exchange-Traded Funds (Cost $662,554) | | | 679,385 | | |
Collateral for Securities Loaned^ (0.0%) (b) | |
United States (0.0%): (b) | |
BlackRock Liquidity Funds TempFund Portfolio, Institutional Class, 2.43% (c) | | | 5,065 | | | | 5,065 | | |
Fidelity Investments Money Market Government Portfolio, Class I, 2.28% (c) | | | 6,525 | | | | 6,525 | | |
Fidelity Investments Prime Money Market Portfolio, Class I, 2.39% (c) | | | 169 | | | | 169 | | |
Goldman Sachs Financial Square Prime Obligations Fund, Institutional
Class, 2.48% (c) | | | 2,785 | | | | 2,785 | | |
JPMorgan Prime Money Market Fund, Capital Class, 2.41% (c) | | | 3,798 | | | | 3,798 | | |
Morgan Stanley Institutional Liquidity Prime Portfolio, Institutional
Class, 2.42% (c) | | | 5,909 | | | | 5,909 | | |
Total Collateral for Securities Loaned (Cost $24,251) | | | 24,251 | | |
Total Investments (Cost $45,409,901) — 97.8% | | | 49,357,782 | | |
Other assets in excess of liabilities — 2.2% | | | 1,086,931 | | |
NET ASSETS — 100.00% | | $ | 50,444,713 | | |
^ Purchased with cash collateral from securities on loan.
(a) All or a portion of this security is on loan.
(b) Amount represents less than 0.05% of net assets.
(c) Rate disclosed is the daily yield on June 30, 2019.
ETF — Exchange-Traded Fund
PLC — Public Limited Company
See notes to financial statements.
8
Victory Portfolios
Victory RS Global Fund | | Schedule of Portfolio Investments
June 30, 2019 | |
(Unaudited)
Security Description | | Shares | | Value | |
Common Stocks (95.8%) | |
Australia (2.2%): | |
Financials (1.0%): | |
Macquarie Group Ltd. | | | 6,388 | | | $ | 563,342 | | |
Health Care (1.2%): | |
CSL Ltd. | | | 4,549 | | | | 688,682 | | |
| | | | 1,252,024 | | |
Belgium (0.4%): | |
Information Technology (0.4%): | |
Melexis NV | | | 3,624 | | | | 244,979 | | |
Bermuda (0.5%): | |
Industrials (0.5%): | |
Triton International Ltd. | | | 8,105 | | | | 265,520 | | |
Canada (1.3%): | |
Industrials (1.3%): | |
Canadian Pacific Railway Ltd. | | | 3,215 | | | | 757,295 | | |
China (3.1%): | |
Communication Services (1.5%): | |
Tencent Holdings Ltd. | | | 18,900 | | | | 855,058 | | |
Consumer Staples (0.7%): | |
Foshan Haitan Flavouring | | | 25,141 | | | | 385,144 | | |
Financials (0.9%): | |
Industrial & Commercial Bank of China Ltd. | | | 707,000 | | | | 516,074 | | |
| | | | 1,756,276 | | |
Denmark (0.7%): | |
Consumer Staples (0.7%): | |
Royal Unibrew A/S | | | 5,005 | | | | 366,003 | | |
France (5.4%): | |
Consumer Discretionary (2.0%): | |
Cie Generale des Etablissements Michelin | | | 2,859 | | | | 361,402 | | |
LVMH Moet Hennessy Louis Vuitton SA | | | 1,784 | | | | 758,226 | | |
| | | | 1,119,628 | | |
Energy (1.2%): | |
Total SA | | | 11,582 | | | | 649,508 | | |
Financials (1.3%): | |
BNP Paribas SA | | | 15,302 | | | | 725,206 | | |
Materials (0.9%): | |
Arkema SA | | | 5,771 | | | | 536,358 | | |
| | | | 3,030,700 | | |
Germany (0.4%): | |
Industrials (0.4%): | |
Washtec AG | | | 3,706 | | | | 251,892 | | |
See notes to financial statements.
9
Victory Portfolios
Victory RS Global Fund | | Schedule of Portfolio Investments — continued
June 30, 2019 | |
(Unaudited)
Security Description | | Shares | | Value | |
Hong Kong (1.0%): | |
Energy (1.0%): | |
CNOOC Ltd. | | | 330,957 | | | $ | 564,556 | | |
India (0.8%): | |
Consumer Staples (0.8%): | |
Nestle India Ltd. | | | 2,650 | | | | 457,388 | | |
Indonesia (0.6%): | |
Communication Services (0.6%): | |
PT Telekomunikasi Indonesia Persero TBK | | | 1,110,400 | | | | 325,500 | | |
Ireland (1.3%): | |
Industrials (1.3%): | |
Eaton Corp. PLC, ADR | | | 8,793 | | | | 732,281 | | |
Italy (2.8%): | |
Financials (0.9%): | |
Banca Generali SpA | | | 17,967 | | | | 517,217 | | |
Health Care (0.7%): | |
Recordati SpA | | | 9,652 | | | | 402,193 | | |
Utilities (1.2%): | |
Enel SpA | | | 93,458 | | | | 651,769 | | |
| | | | 1,571,179 | | |
Japan (7.6%): | |
Consumer Discretionary (2.2%): | |
Hikari Tsushin, Inc. | | | 2,000 | | | | 436,994 | | |
Toyota Motor Corp. | | | 10,300 | | | | 639,347 | | |
United Arrows Ltd. | | | 5,600 | | | | 175,104 | | |
| | | | 1,251,445 | | |
Financials (1.1%): | |
Jafco Co. Ltd. | | | 6,900 | | | | 253,531 | | |
Resona Holdings, Inc. | | | 91,496 | | | | 381,737 | | |
| | | | 635,268 | | |
Health Care (1.7%): | |
As One Corp. | | | 5,679 | | | | 472,561 | | |
Hoya Corp. | | | 6,100 | | | | 468,876 | | |
| | | | 941,437 | | |
Industrials (1.9%): | |
EN-Japan, Inc. | | | 6,700 | | | | 262,278 | | |
Hitachi Construction Machinery Co. Ltd. | | | 14,300 | | | | 374,164 | | |
Kyowa Exeo Corp. | | | 7,300 | | | | 182,193 | | |
Okuma Corp. | | | 4,600 | | | | 237,248 | | |
| | | | 1,055,883 | | |
Information Technology (0.3%): | |
Ulvac, Inc. | | | 5,700 | | | | 181,645 | | |
See notes to financial statements.
10
Victory Portfolios
Victory RS Global Fund | | Schedule of Portfolio Investments — continued
June 30, 2019 | |
(Unaudited)
Security Description | | Shares | | Value | |
Materials (0.4%): | |
DIC Corp. | | | 8,400 | | | $ | 222,453 | | |
| | | | 4,288,131 | | |
Korea, Republic Of (1.0%): | |
Information Technology (1.0%): | |
Samsung Electronics Co. Ltd. | | | 14,083 | | | | 573,589 | | |
Macau (0.7%): | |
Consumer Discretionary (0.7%): | |
Wynn Macau Ltd. | | | 179,200 | | | | 401,181 | | |
Mexico (0.7%): | |
Industrials (0.7%): | |
Promotora y Operadora de Infraestructura SAB de CV | | | 38,638 | | | | 384,028 | | |
Netherlands (1.1%): | |
Industrials (1.1%): | |
Wolters Kluwer NV | | | 8,591 | | | | 624,843 | | |
Norway (1.8%): | |
Energy (0.5%): | |
Aker BP ASA | | | 9,166 | | | | 264,469 | | |
Financials (1.3%): | |
SpareBank 1 SMN | | | 63,573 | | | | 728,908 | | |
| | | | 993,377 | | |
Russian Federation (0.5%): | |
Materials (0.5%): | |
Evraz PLC | | | 36,418 | | | | 308,302 | | |
Singapore (1.3%): | |
Financials (1.3%): | |
Singapore Exchange Ltd. | | | 127,700 | | | | 748,300 | | |
Sweden (1.6%): | |
Industrials (1.6%): | |
Atlas Copco AB, Class B | | | 22,366 | | | | 643,320 | | |
Nolato AB | | | 4,517 | | | | 276,208 | | |
| | | | 919,528 | | |
Switzerland (1.7%): | |
Health Care (1.7%): | |
Roche Holding AG | | | 3,366 | | | | 946,866 | | |
Taiwan (0.8%): | |
Financials (0.8%): | |
Cathay Financial Holding Co. Ltd. | | | 323,000 | | | | 447,432 | | |
United Kingdom (5.8%): | |
Consumer Discretionary (0.7%): | |
Next PLC | | | 5,562 | | | | 389,412 | | |
See notes to financial statements.
11
Victory Portfolios
Victory RS Global Fund | | Schedule of Portfolio Investments — continued
June 30, 2019 | |
(Unaudited)
Security Description | | Shares | | Value | |
Consumer Staples (1.6%): | |
Britvic PLC | | | 24,757 | | | $ | 279,266 | | |
Diageo PLC | | | 6,680 | | | | 287,451 | | |
Unilever PLC | | | 5,664 | | | | 351,524 | | |
| | | | 918,241 | | |
Financials (0.9%): | |
Close Brothers Group PLC | | | 9,233 | | | | 165,679 | | |
HSBC Holdings PLC | | | 40,888 | | | | 341,194 | | |
| | | | 506,873 | | |
Industrials (0.6%): | |
RELX PLC | | | 14,220 | | | | 344,829 | | |
Materials (2.0%): | |
Croda International PLC | | | 4,147 | | | | 269,693 | | |
Rio Tinto PLC | | | 13,295 | | | | 822,705 | | |
| | | | 1,092,398 | | |
| | | | 3,251,753 | | |
United States (50.7%): | |
Communication Services (5.0%): | |
Alphabet, Inc., Class C (a) | | | 775 | | | | 837,705 | | |
Facebook, Inc., Class A (a) | | | 5,179 | | | | 999,547 | | |
Verizon Communications, Inc. | | | 16,943 | | | | 967,954 | | |
| | | | 2,805,206 | | |
Consumer Discretionary (6.1%): | |
Amazon.com, Inc. (a) | | | 676 | | | | 1,274,413 | | |
McDonald's Corp. | | | 4,334 | | | | 899,998 | | |
Ross Stores, Inc. | | | 5,871 | | | | 581,934 | | |
The TJX Co., Inc. | | | 13,034 | | | | 689,238 | | |
| | | | 3,445,583 | | |
Consumer Staples (5.3%): | |
Colgate-Palmolive Co. | | | 12,889 | | | | 923,754 | | |
PepsiCo, Inc. | | | 9,708 | | | | 1,273,010 | | |
The Estee Lauder Cos., Inc., Class A | | | 4,280 | | | | 783,711 | | |
| | | | 2,980,475 | | |
Energy (1.7%): | |
ConocoPhillips | | | 10,016 | | | | 610,976 | | |
Phillips 66 | | | 4,113 | | | | 384,730 | | |
| | | | 995,706 | | |
Financials (8.3%): | |
Bank of America Corp. | | | 32,438 | | | | 940,702 | | |
CME Group, Inc. | | | 1,346 | | | | 261,272 | | |
JPMorgan Chase & Co. | | | 8,926 | | | | 997,927 | | |
MSCI, Inc. | | | 3,705 | | | | 884,717 | | |
The PNC Financial Services Group, Inc. | | | 4,973 | | | | 682,693 | | |
The Progressive Corp. | | | 11,247 | | | | 898,973 | | |
| | | | 4,666,284 | | |
See notes to financial statements.
12
Victory Portfolios
Victory RS Global Fund | | Schedule of Portfolio Investments — continued
June 30, 2019 | |
(Unaudited)
Security Description | | Shares | | Value | |
Health Care (6.1%): | |
Amedisys, Inc. (a) | | | 3,577 | | | $ | 434,283 | | |
Amgen, Inc. | | | 4,071 | | | | 750,204 | | |
CVS Health Corp. | | | 6,893 | | | | 375,600 | | |
Eli Lilly & Co. | | | 6,784 | | | | 751,599 | | |
Johnson & Johnson | | | 8,128 | | | | 1,132,068 | | |
| | | | 3,443,754 | | |
Industrials (3.5%): | |
3M Co. | | | 2,495 | | | | 432,483 | | |
HD Supply Holdings, Inc. (a) | | | 8,868 | | | | 357,203 | | |
Honeywell International, Inc. | | | 6,843 | | | | 1,194,720 | | |
| | | | 1,984,406 | | |
Information Technology (12.1%): | |
Apple, Inc. | | | 6,910 | | | | 1,367,627 | | |
Cisco Systems, Inc. | | | 18,505 | | | | 1,012,779 | | |
Mastercard, Inc., Class A | | | 5,164 | | | | 1,366,033 | | |
Microsoft Corp. | | | 15,759 | | | | 2,111,076 | | |
Texas Instruments, Inc. | | | 8,278 | | | | 949,983 | | |
| | | | 6,807,498 | | |
Real Estate (1.0%): | |
Liberty Property Trust | | | 11,378 | | | | 569,355 | | |
Utilities (1.6%): | |
MGE Energy, Inc. | | | 12,322 | | | | 900,492 | | |
| | | | 28,598,759 | | |
Total Common Stocks (Cost $43,279,530) | | | 54,061,682 | | |
Preferred Stocks (0.8%) | |
Brazil (0.8%): | |
Financials (0.8%): | |
Itau Unibanco Holding S.A. | | | 44,715 | | | | 422,308 | | |
Total Preferred Stocks (Cost $316,628) | | | 422,308 | | |
Exchange-Traded Funds (0.1%) | |
United States (0.1%): | |
iShares MSCI ACWI ETF | | | 1,122 | | | | 82,702 | | |
Total Exchange-Traded Funds (Cost $78,184) | | | 82,702 | | |
Total Investments (Cost $43,674,342) — 96.7% | | | 54,566,692 | | |
Other assets in excess of liabilities — 3.3% | | | 1,848,938 | | |
NET ASSETS — 100.00% | | $ | 56,415,630 | | |
(a) Non-income producing security.
ADR — American Depositary Receipt
ETF — Exchange-Traded Fund
PLC — Public Limited Company
See notes to financial statements.
13
Victory Portfolios
Victory Sophus Emerging Markets Fund | | Schedule of Portfolio Investments
June 30, 2019 | |
(Unaudited)
Security Description | | Shares | | Value | |
Common Stocks (95.7%) | |
Australia (0.7%): | |
Materials (0.7%): | |
BHP Billiton Ltd., ADR (a) | | | 43,283 | | | $ | 2,515,175 | | |
Brazil (8.4%): | |
Consumer Discretionary (1.3%): | |
BK Brasil Operacao e Assessoria a Restaurantes SA | | | 385,800 | | | | 2,234,833 | | |
Lojas Renner SA | | | 226,080 | | | | 2,777,051 | | |
| | | | 5,011,884 | | |
Consumer Staples (0.7%): | |
Atacadao Distribuicao Comercio E Industria Ltd. | | | 445,600 | | | | 2,553,382 | | |
Energy (1.7%): | |
Cosan Ltd. (b) | | | 179,476 | | | | 2,397,800 | | |
Petroleo Brasileiro SA, ADR | | | 258,532 | | | | 4,025,343 | | |
| | | | 6,423,143 | | |
Financials (1.0%): | |
Banco Bradesco SA, ADR | | | 383,065 | | | | 3,761,698 | | |
Health Care (1.4%): | |
Odontoprev SA | | | 581,700 | | | | 2,766,609 | | |
Qualicorp SA | | | 394,600 | | | | 2,360,837 | | |
| | | | 5,127,446 | | |
Industrials (0.7%): | |
Companhia de Locacao das Americas | | | 196,900 | | | | 2,506,830 | | |
Materials (0.4%): | |
Vale SA, ADR | | | 120,883 | | | | 1,624,667 | | |
Utilities (1.2%): | |
Cia de Saneamento Basico do Estado de Sao Paulo | | | 137,800 | | | | 1,696,613 | | |
Eneva SA (b) | | | 469,800 | | | | 2,951,469 | | |
| | | | 4,648,082 | | |
| | | | 31,657,132 | | |
Chile (1.2%): | |
Financials (0.5%): | |
Banco de Credito e Inversiones | | | 29,506 | | | | 2,036,293 | | |
Real Estate (0.7%): | |
Parque Arauco SA | | | 915,842 | | | | 2,542,932 | | |
| | | | 4,579,225 | | |
China (26.7%): | |
Communication Services (6.5%): | |
Momo, Inc., ADR | | | 61,866 | | | | 2,214,803 | | |
NetEase, Inc., ADR | | | 9,166 | | | | 2,344,388 | | |
Tencent Holdings Ltd. | | | 440,515 | | | | 19,929,408 | | |
| | | | 24,488,599 | | |
See notes to financial statements.
14
Victory Portfolios
Victory Sophus Emerging Markets Fund | | Schedule of Portfolio Investments — continued
June 30, 2019 | |
(Unaudited)
Security Description | | Shares | | Value | |
Consumer Discretionary (6.4%): | |
Alibaba Group Holding Ltd., ADR (b) | | | 99,408 | | | $ | 16,844,685 | | |
Baozun, Inc., ADR (a) (b) | | | 53,659 | | | | 2,675,438 | | |
Tongcheng-Elong Holdings Ltd. (b) | | | 1,292,000 | | | | 2,564,695 | | |
Xtep International Holdings Ltd. | | | 3,282,000 | | | | 1,980,503 | | |
| | | | 24,065,321 | | |
Consumer Staples (2.5%): | |
Ausnutria Dairy Corp. Ltd. (a) | | | 1,426,000 | | | | 2,842,301 | | |
Wuliangye Yibin Co. Ltd. | | | 233,450 | | | | 4,020,852 | | |
Yihai International Holding Ltd. | | | 498,000 | | | | 2,583,663 | | |
| | | | 9,446,816 | | |
Energy (1.2%): | |
China Oilfield Services Ltd. | | | 2,370,000 | | | | 2,351,310 | | |
PetroChina Co. Ltd. | | | 4,096,000 | | | | 2,258,570 | | |
| | | | 4,609,880 | | |
Financials (5.9%): | |
China Construction Bank Corp. | | | 10,997,857 | | | | 9,480,559 | | |
China Merchants Bank Co. Ltd., Class H | | | 830,000 | | | | 4,118,967 | | |
Ping An Insurance Group Co. of China Ltd. | | | 712,500 | | | | 8,568,053 | | |
| | | | 22,167,579 | | |
Industrials (0.8%): | |
Zoomlion Heavy Industry Science And Technology Co. | | | 4,430,000 | | | | 2,909,885 | | |
Information Technology (0.6%): | |
Beijing Sinnet Technology Co. Ltd., Class A | | | 915,600 | | | | 2,239,687 | | |
Materials (1.7%): | |
Anhui Conch Cement Co. Ltd. | | | 455,500 | | | | 2,850,315 | | |
Wanhua Chemical Group Co. Ltd., Class A | | | 302,600 | | | | 1,889,694 | | |
Zijin Mining Group Co. Ltd. | | | 4,388,000 | | | | 1,783,315 | | |
| | | | 6,523,324 | | |
Real Estate (1.1%): | |
China Sce Property Holdings | | | 3,894,000 | | | | 1,876,779 | | |
Sunac China Holdings Ltd. | | | 499,000 | | | | 2,450,627 | | |
| | | | 4,327,406 | | |
| | | | 100,778,497 | | |
Cyprus (0.2%): | |
Financials (0.2%): | |
TCS Group Holding PLC, GDR | | | 45,330 | | | | 888,727 | | |
Greece (1.1%): | |
Communication Services (0.7%): | |
Hellenic Telecommunications Organization SA | | | 171,144 | | | | 2,527,944 | | |
Industrials (0.4%): | |
Mytilineos Holdings SA | | | 131,782 | | | | 1,520,951 | | |
| | | | 4,048,895 | | |
See notes to financial statements.
15
Victory Portfolios
Victory Sophus Emerging Markets Fund | | Schedule of Portfolio Investments — continued
June 30, 2019 | |
(Unaudited)
Security Description | | Shares | | Value | |
Hong Kong (4.6%): | |
Consumer Discretionary (0.4%): | |
Xinyi Glass Holdings Ltd. | | | 1,574,000 | | | $ | 1,653,479 | | |
Energy (0.7%): | |
Kunlun Energy Co. Ltd. | | | 2,968,000 | | | | 2,591,548 | | |
Financials (0.7%): | |
Hong Kong Exchanges and Clearing Ltd. | | | 73,200 | | | | 2,586,994 | | |
Health Care (0.8%): | |
CSPC Pharmaceutical Group Ltd. | | | 1,956,000 | | | | 3,154,854 | | |
Industrials (0.5%): | |
CIMC Enric Holdings Ltd. | | | 2,300,000 | | | | 1,854,968 | | |
Information Technology (0.6%): | |
Kingboard Laminates Holdings Ltd. | | | 2,289,500 | | | | 2,100,713 | | |
Real Estate (0.9%): | |
Shimao Property Holdings Ltd. | | | 1,162,000 | | | | 3,540,235 | | |
| | | | 17,482,791 | | |
India (8.7%): | |
Consumer Discretionary (1.3%): | |
Aditya Birla Fashion and Retail Ltd. (b) | | | 454,953 | | | | 1,420,501 | | |
Indian Hotels Co. Ltd. | | | 598,202 | | | | 1,365,255 | | |
Jubilant Foodworks, Ltd. | | | 123,844 | | | | 2,212,309 | | |
| | | | 4,998,065 | | |
Energy (1.3%): | |
Reliance Industries Ltd. (b) | | | 278,313 | | | | 5,051,124 | | |
Financials (2.4%): | |
Cholamandalam Investment and Finance Co. Ltd. | | | 480,235 | | | | 1,987,267 | | |
Housing Development Finance Corp. Ltd. | | | 165,035 | | | | 5,240,950 | | |
Rec Ltd. | | | 697,280 | | | | 1,664,131 | | |
| | | | 8,892,348 | | |
Health Care (0.4%): | |
Jubilant Life Sciences Ltd. | | | 195,414 | | | | 1,449,919 | | |
Industrials (1.2%): | |
Adani Ports And Special Economic Zone | | | 418,282 | | | | 2,485,880 | | |
Larsen & Toubro Ltd. | | | 84,321 | | | | 1,897,387 | | |
| | | | 4,383,267 | | |
Information Technology (1.5%): | |
HCL Technologies Ltd. | | | 177,247 | | | | 2,734,589 | | |
Infosys Technologies, ADR (a) | | | 286,538 | | | | 3,065,957 | | |
| | | | 5,800,546 | | |
Utilities (0.6%): | |
Mahanagar Gas Ltd. | | | 178,679 | | | | 2,199,175 | | |
| | | | 32,774,444 | | |
See notes to financial statements.
16
Victory Portfolios
Victory Sophus Emerging Markets Fund | | Schedule of Portfolio Investments — continued
June 30, 2019 | |
(Unaudited)
Security Description | | Shares | | Value | |
Indonesia (3.2%): | |
Financials (2.4%): | |
Bank Tabungan Pensiunan Nasional Syariah Tbk PT (b) | | | 15,561,900 | | | $ | 3,800,913 | | |
PT Bank Negara Indonesia Persero TBK | | | 7,884,500 | | | | 5,137,693 | | |
| | | | 8,938,606 | | |
Industrials (0.4%): | |
PT Wijaya Karya Persero TBK | | | 9,150,000 | | | | 1,573,692 | | |
Materials (0.4%): | |
PT Indocement Tunggal Prakarsa TBK | | | 1,121,600 | | | | 1,585,432 | | |
| | | | 12,097,730 | | |
Korea, Republic Of (12.5%): | |
Communication Services (0.4%): | |
Innocean Worldwide, Inc. | | | 23,902 | | | | 1,475,402 | | |
Consumer Discretionary (1.6%): | |
Fila Korea Ltd. | | | 31,028 | | | | 2,061,079 | | |
Hyundai Mobis Co. Ltd. | | | 20,253 | | | | 4,132,981 | | |
| | | | 6,194,060 | | |
Consumer Staples (0.5%): | |
Neopharm Co. Ltd. | | | 39,714 | | | | 1,793,615 | | |
Energy (0.6%): | |
SK Innovation Co. Ltd. | | | 16,064 | | | | 2,214,738 | | |
Financials (0.6%): | |
Hana Financial Group, Inc. | | | 72,537 | | | | 2,351,603 | | |
Industrials (0.7%): | |
Samsung Engineering Co. Ltd. (b) | | | 181,594 | | | | 2,702,915 | | |
Information Technology (7.4%): | |
DuzonBizon Co. Ltd. | | | 32,196 | | | | 1,739,490 | | |
Samsung Electro-Mechanics Co. Ltd. | | | 22,578 | | | | 1,921,470 | | |
Samsung Electronics Co. Ltd. | | | 446,396 | | | | 18,181,334 | | |
SK Hynix, Inc. | | | 99,920 | | | | 6,011,430 | | |
| | | | 27,853,724 | | |
Materials (0.7%): | |
Ssangyong Cement Industrial Co. Ltd. | | | 473,113 | | | | 2,588,216 | | |
| | | | 47,174,273 | | |
Malaysia (0.5%): | |
Financials (0.5%): | |
Ammb Holdings Berhad | | | 1,706,800 | | | | 1,747,963 | | |
Mexico (3.6%): | |
Communication Services (0.7%): | |
America Movil, ADR | | | 192,578 | | | | 2,803,936 | | |
Consumer Discretionary (0.3%): | |
El Puerto de Liverpool Sab de CV | | | 173,507 | | | | 966,278 | | |
See notes to financial statements.
17
Victory Portfolios
Victory Sophus Emerging Markets Fund | | Schedule of Portfolio Investments — continued
June 30, 2019 | |
(Unaudited)
Security Description | | Shares | | Value | |
Consumer Staples (0.3%): | |
Grupo Lala SAB de CV | | | 989,293 | | | $ | 1,216,137 | | |
Financials (1.5%): | |
Gentera SAB de CV | | | 1,980,392 | | | | 1,712,092 | | |
Grupo Financiero Banorte SAB de CV | | | 670,344 | | | | 3,890,062 | | |
| | | | 5,602,154 | | |
Materials (0.4%): | |
Alpek SAB de CV | | | 1,208,387 | | | | 1,518,213 | | |
Real Estate (0.4%): | |
Corporacion Inmobiliaria Vesta SAB de CV | | | 887,836 | | | | 1,310,717 | | |
| | | | 13,417,435 | | |
Peru (0.9%): | |
Financials (0.9%): | |
Credicorp Ltd. | | | 14,603 | | | | 3,342,773 | | |
Philippines (1.6%): | |
Financials (0.8%): | |
BDO Unibank, Inc. | | | 1,036,640 | | | | 2,834,236 | | |
Real Estate (0.8%): | |
Megaworld Corp. | | | 25,830,900 | | | | 3,075,593 | | |
| | | | 5,909,829 | | |
Poland (0.5%): | |
Energy (0.5%): | |
Grupa Lotos SA | | | 81,786 | | | | 1,857,348 | | |
Russian Federation (3.3%): | |
Energy (1.6%): | |
LUKOIL PJSC, ADR | | | 72,513 | | | | 6,112,413 | | |
| | | | 6,112,413 | | |
Financials (1.5%): | |
Sberbank of Russia PJSC, ADR | | | 360,245 | | | | 5,549,955 | | |
Materials (0.2%): | |
ALROSA AO | | | 488,420 | | | | 664,788 | | |
| | | | 12,327,156 | | |
Saudi Arabia (1.1%): | |
Consumer Discretionary (0.3%): | |
Leejam Sports Co. JSC | | | 55,699 | | | | 1,110,774 | | |
Financials (0.8%): | |
Al Rajhi Bank | | | 156,381 | | | | 2,904,151 | | |
| | | | 4,014,925 | | |
South Africa (4.0%): | |
Communication Services (1.5%): | |
Naspers Ltd. | | | 24,211 | | | | 5,863,401 | | |
See notes to financial statements.
18
Victory Portfolios
Victory Sophus Emerging Markets Fund | | Schedule of Portfolio Investments — continued
June 30, 2019 | |
(Unaudited)
Security Description | | Shares | | Value | |
Consumer Staples (0.5%): | |
The SPAR Group Ltd. | | | 136,697 | | | $ | 1,816,864 | | |
Financials (1.1%): | |
Absa Group Ltd. | | | 184,500 | | | | 2,308,425 | | |
Nedbank Group Ltd. | | | 102,251 | | | | 1,840,284 | | |
| | | | 4,148,709 | | |
Materials (0.9%): | |
AngloGold Ashanti Ltd. | | | 182,002 | | | | 3,264,065 | | |
| | | | 15,093,039 | | |
Taiwan (8.5%): | |
Consumer Discretionary (0.6%): | |
Giant Manufacturing Co. Ltd. | | | 314,000 | | | | 2,462,570 | | |
Financials (1.4%): | |
Chailease Holding Co. Ltd. | | | 196,000 | | | | 812,315 | | |
Yuanta Financial Holding Co. Ltd. | | | 7,294,000 | | | | 4,385,055 | | |
| | | | 5,197,370 | | |
Industrials (0.8%): | |
Far Eastern New Century Corp. | | | 2,669,000 | | | | 2,883,915 | | |
Information Technology (5.7%): | |
Globalwafers Co. Ltd. | | | 188,000 | | | | 1,912,844 | | |
King Yuan Electronics Co. Ltd. | | | 2,519,000 | | | | 2,180,243 | | |
Nanya Technology Corp. | | | 1,278,000 | | | | 2,657,301 | | |
Phison Electronics Corp. | | | 150,000 | | | | 1,368,949 | | |
Taiwan Semiconductor Manufacturing Co. Ltd. | | | 1,543,998 | | | | 11,810,420 | | |
Utechzone Co. Ltd. | | | 647,000 | | | | 1,492,345 | | |
| | | | 21,422,102 | | |
| | | | 31,965,957 | | |
Thailand (2.0%): | |
Consumer Discretionary (0.5%): | |
Com7 PCL (a) | | | 2,571,600 | | | | 1,831,509 | | |
Consumer Staples (0.5%): | |
| CP All PCL | | | 672,800 | | | | 1,888,565 | | |
Energy (1.0%): | |
PTT Exploration & Production | | | 885,100 | | | | 3,908,202 | | |
| | | | 7,628,276 | | |
United Arab Emirates (0.5%): | |
Real Estate (0.5%): | |
Aldar Properties PJSC | | | 4,028,790 | | | | 2,077,141 | | |
United Kingdom (1.4%): | |
Communication Services (0.4%): | |
Airtel Africa PLC (b) (c) | | | 1,635,265 | | | | 1,407,724 | | |
See notes to financial statements.
19
Victory Portfolios
Victory Sophus Emerging Markets Fund | | Schedule of Portfolio Investments — continued
June 30, 2019 | |
(Unaudited)
Security Description | | Shares | | Value | |
Materials (1.0%): | |
Anglo American PLC | | | 129,424 | | | $ | 3,696,702 | | |
| | | | 5,104,426 | | |
United States (0.5%): | |
Industrials (0.5%): | |
Bizlink Holding, Inc. | | | 289,000 | | | | 2,008,652 | | |
Total Common Stocks (Cost $326,680,196) | | | 360,491,809 | | |
Preferred Stocks (1.7%) | |
Brazil (1.7%): | |
Financials (1.3%): | |
Itau Unibanco Holding S.A. | | | 547,300 | | | | 5,168,937 | | |
Industrials (0.4%): | |
Randon SA Implementos e Participacoes | | | 628,200 | | | | 1,479,157 | | |
| | | | 6,648,094 | | |
Total Preferred Stocks (Cost $5,705,837) | | | 6,648,094 | | |
Collateral for Securities Loaned^ (2.3%) | |
United States (2.3%): | |
BlackRock Liquidity Funds TempFund Portfolio, Institutional Class, 2.43% (d) | | | 1,783,829 | | | | 1,783,829 | | |
Fidelity Investments Money Market Government Portfolio, Class I, 2.28% (d) | | | 2,297,776 | | | | 2,297,776 | | |
Fidelity Investments Prime Money Market Portfolio, Class I, 2.39% (d) | | | 59,673 | | | | 59,673 | | |
Goldman Sachs Financial Square Prime Obligations Fund, Institutional
Class, 2.48% (d) | | | 980,975 | | | | 980,975 | | |
JPMorgan Prime Money Market Fund, Capital Class, 2.41% (d) | | | 1,337,664 | | | | 1,337,664 | | |
Morgan Stanley Institutional Liquidity Prime Portfolio, Institutional
Class, 2.42% (d) | | | 2,080,887 | | | | 2,080,887 | | |
Total Collateral for Securities Loaned (Cost $8,540,803) | | | 8,540,804 | | |
Total Investments (Cost $340,926,836) — 99.7% | | | 375,680,707 | | |
Other assets in excess of liabilities — 0.3% | | | 1,101,746 | | |
NET ASSETS — 100.00% | | $ | 376,782,453 | | |
^ Purchased with cash collateral from securities on loan.
(a) All or a portion of this security is on loan.
(b) Non-income producing security.
(c) Rule 144A security or other security that is restricted as to resale to institutional investors. The Fund's Adviser has deemed this security to be liquid based upon procedures approved by the Board of Trustees. As of June 30, 2019, the fair value of these securities was $1,407,724 and amounted to 0.4% of net assets.
(d) Rate disclosed is the daily yield on June 30, 2019.
ADR — American Depositary Receipt
GDR — Global Depository Receipt
PCL — Public Company Limited
PLC — Public Limited Company
See notes to financial statements.
20
Victory Portfolios
Victory Sophus Emerging Markets Small Cap Fund | | Schedule of Portfolio Investments
June 30, 2019 | |
(Unaudited)
Security Description | | Shares | | Value | |
Common Stocks (96.6%) | |
Brazil (6.6%): | |
Consumer Discretionary (1.1%): | |
BK Brasil Operacao e Assessoria a Restaurantes SA | | | 10,200 | | | $ | 59,086 | | |
Energy (0.9%): | |
Cosan Ltd. (a) | | | 3,690 | | | | 49,298 | | |
Financials (0.9%): | |
Banco ABC Brasil SA | | | 9,508 | | | | 47,598 | | |
Health Care (0.6%): | |
Qualicorp SA | | | 5,800 | | | | 34,701 | | |
Industrials (1.2%): | |
Companhia de Locacao das Americas | | | 5,000 | | | | 63,657 | | |
Utilities (1.9%): | |
Eneva SA (a) | | | 8,800 | | | | 55,285 | | |
Omega Geracao SA (a) | | | 8,000 | | | | 49,801 | | |
| | | | 105,086 | | |
| | | | 359,426 | | |
Chile (1.7%): | |
Energy (1.0%): | |
Geopark Ltd. (a) | | | 2,855 | | | | 52,932 | | |
Real Estate (0.7%): | |
Parque Arauco SA | | | 13,645 | | | | 37,887 | | |
| | | | 90,819 | | |
China (9.7%): | |
Communication Services (0.5%): | |
YY, Inc., ADR (a) | | | 409 | | | | 28,503 | | |
Consumer Discretionary (1.3%): | |
Baozun, Inc., ADR (a) (b) | | | 738 | | | | 36,797 | | |
Tongcheng-Elong Holdings Ltd. (a) | | | 17,200 | | | | 34,143 | | |
| | | | 70,940 | | |
Consumer Staples (2.5%): | |
Anhui Kouzi Distillery Co. Ltd., Class A | | | 4,100 | | | | 38,559 | | |
Ausnutria Dairy Corp. Ltd. | | | 33,000 | | | | 65,775 | | |
Tianyun International Holdings Ltd. | | | 214,000 | | | | 31,527 | | |
| | | | 135,861 | | |
Health Care (1.8%): | |
Livzon Pharmaceutical Group, Inc. | | | 8,700 | | | | 28,961 | | |
Luye Pharma Group Ltd. (c) | | | 46,000 | | | | 33,364 | | |
Shandong Weigao Group Medical Polymer Co. Ltd., Class H | | | 40,000 | | | | 36,299 | | |
| | | | 98,624 | | |
Industrials (1.6%): | |
Shenzhen Expressway Co. Ltd., Class H | | | 36,000 | | | | 43,277 | | |
Zoomlion Heavy Industry Science And Technology Co. | | | 63,800 | | | | 41,908 | | |
| | | | 85,185 | | |
See notes to financial statements.
21
Victory Portfolios
Victory Sophus Emerging Markets Small Cap Fund | | Schedule of Portfolio Investments — continued
June 30, 2019 | |
(Unaudited)
Security Description | | Shares | | Value | |
Information Technology (0.6%): | |
Beijing Sinnet Technology Co. Ltd., Class A | | | 13,700 | | | $ | 33,512 | | |
Real Estate (1.4%): | |
China Sce Property Holdings | | | 90,000 | | | | 43,377 | | |
Yuzhou Properties Co. Ltd. | | | 63,000 | | | | 29,596 | | |
| | | | 72,973 | | |
| | | | 525,598 | | |
Colombia (0.7%): | |
Financials (0.7%): | |
Banco Davivienda SA | | | 3,089 | | | | 38,942 | | |
Cyprus (0.4%): | |
Financials (0.4%): | |
TCS Group Holding PLC, GDR | | | 1,114 | | | | 21,841 | | |
Egypt (0.8%): | |
Health Care (0.8%): | |
Cleopatra Hospital (a) | | | 109,599 | | | | 42,404 | | |
Greece (2.6%): | |
Industrials (1.5%): | |
Mytilineos Holdings SA | | | 6,779 | | | | 78,239 | | |
Utilities (1.1%): | |
Terna Energy SA | | | 7,671 | | | | 61,482 | | |
| | | | 139,721 | | |
Hong Kong (3.5%): | |
Communication Services (0.6%): | |
Citic Telecom International Holdings Ltd. | | | 87,000 | | | | 34,500 | | |
Consumer Discretionary (0.7%): | |
Stella International Holdings, Ltd. | | | 21,000 | | | | 35,500 | | |
Industrials (0.7%): | |
CIMC Enric Holdings Ltd. | | | 46,000 | | | | 37,099 | | |
Information Technology (0.8%): | |
Kingboard Laminates Holdings Ltd. | | | 46,500 | | | | 42,666 | | |
Real Estate (0.7%): | |
Yuexiu Property Co. Ltd. | | | 170,000 | | | | 38,531 | | |
| | | | 188,296 | | |
India (13.4%): | |
Consumer Discretionary (2.8%): | |
Aditya Birla Fashion and Retail Ltd. (a) | | | 15,631 | | | | 48,805 | | |
Indian Hotels Co. Ltd. | | | 21,158 | | | | 48,288 | | |
Jubilant Foodworks, Ltd. | | | 2,937 | | | | 52,466 | | |
| | | | 149,559 | | |
See notes to financial statements.
22
Victory Portfolios
Victory Sophus Emerging Markets Small Cap Fund | | Schedule of Portfolio Investments — continued
June 30, 2019 | |
(Unaudited)
Security Description | | Shares | | Value | |
Financials (3.0%): | |
Cholamandalam Investment and Finance Co. Ltd. | | | 12,730 | | | $ | 52,678 | | |
Manappuram Finance Ltd. | | | 29,047 | | | | 58,164 | | |
Rec Ltd. | | | 21,302 | | | | 50,839 | | |
| | | | 161,681 | | |
Health Care (0.8%): | |
Jubilant Life Sciences Ltd. | | | 5,732 | | | | 42,530 | | |
Industrials (2.0%): | |
L&T Technology Services Ltd. (c) | | | 2,338 | | | | 59,110 | | |
PNC Infratech Ltd. | | | 17,854 | | | | 52,047 | | |
| | | | 111,157 | | |
Information Technology (2.1%): | |
NIIT Technologies Ltd. | | | 2,947 | | | | 57,433 | | |
Zensar Technologies Ltd. | | | 14,460 | | | | 54,163 | | |
| | | | 111,596 | | |
Materials (0.7%): | |
Essel Propack, Ltd. | | | 20,351 | | | | 38,377 | | |
Utilities (2.0%): | |
CESC Ltd. | | | 5,041 | | | | 57,267 | | |
Mahanagar Gas Ltd. | | | 4,401 | | | | 54,167 | | |
| | | | 111,434 | | |
| | | | 726,334 | | |
Indonesia (4.5%): | |
Consumer Discretionary (1.0%): | |
PT Mitra Adiperkasa TBK | | | 851,700 | | | | 54,272 | | |
Consumer Staples (0.7%): | |
Industri Jamu Dan Farmasi SI | | | 547,400 | | | | 38,974 | | |
Financials (1.3%): | |
Bank Tabungan Pensiunan Nasional Syariah Tbk PT (a) | | | 292,800 | | | | 71,515 | | |
Industrials (0.8%): | |
PT Wijaya Karya Persero TBK | | | 245,200 | | | | 42,171 | | |
Materials (0.7%): | |
PT Indocement Tunggal Prakarsa TBK | | | 26,700 | | | | 37,742 | | |
| | | | 244,674 | | |
Korea, Republic Of (13.9%): | |
Communication Services (1.7%): | |
AfreecaTV Co. Ltd. | | | 807 | | | | 43,099 | | |
Innocean Worldwide, Inc. | | | 784 | | | | 48,394 | | |
| | | | 91,493 | | |
Consumer Discretionary (1.3%): | |
Fila Korea Ltd. | | | 1,039 | | | | 69,017 | | |
Consumer Staples (0.7%): | |
Neopharm Co. Ltd. | | | 858 | | | | 38,750 | | |
See notes to financial statements.
23
Victory Portfolios
Victory Sophus Emerging Markets Small Cap Fund | | Schedule of Portfolio Investments — continued
June 30, 2019 | |
(Unaudited)
Security Description | | Shares | | Value | |
Financials (0.6%): | |
DGB Financial Group, Inc. | | | 4,327 | | | $ | 30,567 | | |
Health Care (3.7%): | |
Caregen Co. Ltd. (d) | | | 571 | | | | 34,055 | | |
Dong-A ST Co. Ltd. | | | 459 | | | | 40,366 | | |
Hanall Biopharma Co. Ltd. (a) | | | 1,347 | | | | 29,118 | | |
I-Sens, Inc. | | | 2,317 | | | | 48,820 | | |
Seegene, Inc. (a) | | | 2,025 | | | | 46,422 | | |
| | | | 198,781 | | |
Industrials (0.8%): | |
Samsung Engineering Co. Ltd. (a) | | | 2,881 | | | | 42,882 | | |
Information Technology (3.4%): | |
DuzonBizon Co. Ltd. | | | 1,295 | | | | 69,967 | | |
KoMiCo Ltd. | | | 1,818 | | | | 42,842 | | |
Tes Co. Ltd. | | | 3,328 | | | | 47,515 | | |
Tokai Carbon Korea Co. Ltd. | | | 584 | | | | 27,587 | | |
| | | | 187,911 | | |
Materials (1.7%): | |
Hansol Chemical Co. Ltd. | | | 672 | | | | 46,285 | | |
Ssangyong Cement Industrial Co. Ltd. | | | 8,767 | | | | 47,961 | | |
| | | | 94,246 | | |
| | | | 753,647 | | |
Malaysia (1.7%): | |
Consumer Discretionary (0.8%): | |
Bermaz Auto BHD | | | 70,100 | | | | 45,149 | | |
Financials (0.9%): | |
RHB Capital Berhad | | | 36,400 | | | | 49,270 | | |
| | | | 94,419 | | |
Mexico (3.8%): | |
Consumer Staples (0.6%): | |
Grupo Lala SAB de CV | | | 27,652 | | | | 33,992 | | |
Financials (1.5%): | |
Credito Real Sab de CV | | | 34,543 | | | | 42,374 | | |
Gentera SAB de CV | | | 47,091 | | | | 40,711 | | |
| | | | 83,085 | | |
Materials (0.7%): | |
Alpek SAB de CV | | | 28,003 | | | | 35,183 | | |
Real Estate (1.0%): | |
Macquarie Mexico Real Estate Management SA de CV (c) | | | 49,356 | | | | 56,044 | | |
| | | | 208,304 | | |
Peru (1.4%): | |
Financials (0.7%): | |
Intercorp Financial Services, Inc. | | | 882 | | | | 40,131 | | |
See notes to financial statements.
24
Victory Portfolios
Victory Sophus Emerging Markets Small Cap Fund | | Schedule of Portfolio Investments — continued
June 30, 2019 | |
(Unaudited)
Security Description | | Shares | | Value | |
Industrials (0.7%): | |
Ferreycorp Saa | | | 51,229 | | | $ | 35,188 | | |
| | | | 75,319 | | |
Philippines (2.5%): | |
Consumer Discretionary (1.0%): | |
Bloomberry Resorts Corp. | | | 246,000 | | | | 54,221 | | |
Industrials (0.8%): | |
Cebu Air, Inc. | | | 25,220 | | | | 44,810 | | |
Real Estate (0.7%): | |
Filinvest Land, Inc. | | | 1,086,000 | | | | 39,849 | | |
| | | | 138,880 | | |
Poland (0.7%): | |
Energy (0.7%): | |
Grupa Lotos SA | | | 1,666 | | | | 37,835 | | |
Saudi Arabia (1.6%): | |
Consumer Discretionary (0.7%): | |
Leejam Sports Co. JSC | | | 1,979 | | | | 39,466 | | |
Financials (0.9%): | |
Bupa Arabia for Cooperative Insurance Co. | | | 1,799 | | | | 46,302 | | |
| | | | 85,768 | | |
South Africa (4.9%): | |
Consumer Staples (1.5%): | |
Clover Industries Ltd. | | | 26,125 | | | | 37,554 | | |
The SPAR Group Ltd. | | | 3,206 | | | | 42,612 | | |
| | | | 80,166 | | |
Materials (2.5%): | |
African Rainbow Minerals Ltd. | | | 5,874 | | | | 76,305 | | |
AngloGold Ashanti Ltd. | | | 3,481 | | | | 62,429 | | |
| | | | 138,734 | | |
Real Estate (0.9%): | |
Vukile Property Fund Ltd. | | | 34,636 | | | | 47,187 | | |
| | | | 266,087 | | |
Taiwan (16.7%): | |
Consumer Discretionary (3.7%): | |
Giant Manufacturing Co. Ltd. | | | 5,000 | | | | 39,213 | | |
Power Wind Health Industry, Inc. | | | 7,000 | | | | 58,994 | | |
Poya Co. Ltd. | | | 4,000 | | | | 54,145 | | |
Topkey Corp. | | | 9,000 | | | | 49,687 | | |
| | | | 202,039 | | |
Financials (0.8%): | |
Chailease Holding Co. Ltd. | | | 11,000 | | | | 45,589 | | |
See notes to financial statements.
25
Victory Portfolios
Victory Sophus Emerging Markets Small Cap Fund | | Schedule of Portfolio Investments — continued
June 30, 2019 | |
(Unaudited)
Security Description | | Shares | | Value | |
Health Care (1.1%): | |
Bioteque Corp. | | | 15,000 | | | $ | 58,463 | | |
Industrials (2.2%): | |
Sinmag Equipment Corp. | | | 10,383 | | | | 38,799 | | |
Taiwan Secom Co., Ltd. | | | 15,000 | | | | 42,790 | | |
Xxentria Technology Material | | | 17,000 | | | | 39,232 | | |
| | | | 120,821 | | |
Information Technology (7.8%): | |
Elite Material Co. Ltd. | | | 18,000 | | | | 54,481 | | |
First Hi-Tec Enterprise Co. Ltd. | | | 33,000 | | | | 47,986 | | |
Flexium Interconnect, Inc. | | | 19,000 | | | | 52,870 | | |
King Yuan Electronics Co. Ltd. | | | 61,000 | | | | 52,797 | | |
Phison Electronics Corp. | | | 4,000 | | | | 36,505 | | |
Sino-American Silicon Products, Inc. | | | 23,000 | | | | 60,587 | | |
Taiwan Union Technology Corp. | | | 18,000 | | | | 72,415 | | |
Utechzone Co. Ltd. | | | 19,000 | | | | 43,825 | | |
| | | | 421,466 | | |
Materials (1.1%): | |
Shinkong Synthetic Fibers Corp. | | | 130,000 | | | | 58,303 | | |
| | | | 906,681 | | |
Thailand (2.6%): | |
Consumer Discretionary (1.6%): | |
Com7 PCL | | | 68,700 | | | | 48,928 | | |
Somboon Advance Technology PCL | | | 68,100 | | | | 40,215 | | |
| | | | 89,143 | | |
Financials (1.0%): | |
Kiatnakin Bank PCL | | | 24,000 | | | | 54,419 | | |
| | | | 143,562 | | |
Turkey (0.7%): | |
Consumer Discretionary (0.7%): | |
Kordsa Teknik Tekstil AS | | | 19,545 | | | | 40,949 | | |
Yatas Yatak ve Yorgan Sanayi ve Ticaret AS (a) | | | — | | | | — | (e) | |
| | | | 40,950 | | |
United Arab Emirates (0.7%): | |
Real Estate (0.7%): | |
Aldar Properties PJSC | | | 69,669 | | | | 35,920 | | |
United Kingdom (0.6%): | |
Communication Services (0.6%): | |
Airtel Africa PLC (a) (c) | | | 39,560 | | | | 34,055 | | |
United States (0.9%): | |
Industrials (0.9%): | |
Bizlink Holding, Inc. | | | 7,000 | | | | 48,652 | | |
Total Common Stocks (Cost $4,855,950) | | | 5,248,134 | | |
See notes to financial statements.
26
Victory Portfolios
Victory Sophus Emerging Markets Small Cap Fund | | Schedule of Portfolio Investments — continued
June 30, 2019 | |
(Unaudited)
Security Description | | Shares | | Value | |
Preferred Stocks (0.7%) | |
Brazil (0.7%): | |
Industrials (0.7%): | |
Randon SA Implementos e Participacoes | | | 17,400 | | | $ | 40,970 | | |
Total Preferred Stocks (Cost $33,028) | | | 40,970 | | |
Collateral for Securities Loaned^ (0.7%) | |
United States (0.7%): | |
BlackRock Liquidity Funds TempFund Portfolio, Institutional Class, 2.43% (f) | | | 7,776 | | | | 7,776 | | |
Fidelity Investments Money Market Government Portfolio, Class I, 2.28% (f) | | | 10,018 | | | | 10,018 | | |
Fidelity Investments Prime Money Market Portfolio, Class I, 2.39% (f) | | | 260 | | | | 260 | | |
Goldman Sachs Financial Square Prime Obligations Fund, Institutional
Class, 2.48% (f) | | | 4,276 | | | | 4,276 | | |
JPMorgan Prime Money Market Fund, Capital Class, 2.41% (f) | | | 5,831 | | | | 5,831 | | |
Morgan Stanley Institutional Liquidity Prime Portfolio, Institutional
Class, 2.42% (f) | | | 9,071 | | | | 9,071 | | |
Total Collateral for Securities Loaned (Cost $37,231) | | | 37,232 | | |
Total Investments (Cost $4,926,209) — 98.0% | | | 5,326,336 | | |
Other assets in excess of liabilities — 2.0% | | | 106,772 | | |
NET ASSETS — 100.00% | | $ | 5,433,108 | | |
^ Purchased with cash collateral from securities on loan.
(a) Non-income producing security.
(b) All or a portion of this security is on loan.
(c) Rule 144A security or other security that is restricted as to resale to institutional investors. The Fund's Adviser has deemed this security to be liquid based upon procedures approved by the Board of Trustees. As of June 30, 2019, the fair value of these securities was $182,573 and amounted to 3.3% of net assets.
(d) Security was fair valued based upon procedures approved by the Board of Trustees and represents 0.6% of the Fund's net assets as of June 30, 2019. This security is classified as Level 3 within the fair value hierarchy. (See Note 2)
(e) Rounds to less than $1.
(f) Rate disclosed is the daily yield on June 30, 2019.
ADR — American Depositary Receipt
GDR — Global Depository Receipt
PCL — Public Company Limited
PLC — Public Limited Company
See notes to financial statements.
27
Victory Portfolios | | Statements of Assets and Liabilities
June 30, 2019 | |
(Unaudited)
| | | Victory RS
International
Fund | | Victory RS
Global Fund | |
ASSETS: | |
Investments, at value (Cost $45,409,901 and $43,674,342) | | $ | 49,357,782 | (a) | | $ | 54,566,692 | | |
Foreign currency, at value (Cost $89,828 and $2,914) | | | 87,367 | | | | 2,712 | | |
Cash and cash equivalents | | | 1,219,244 | | | | 662,260 | | |
Interest and dividends receivable | | | 59,364 | | | | 81,866 | | |
Receivable for capital shares issued | | | 82,018 | | | | 1,064,616 | | |
Receivable for investments sold | | | 305,429 | | | | 107,600 | | |
Reclaims receivable | | | 112,031 | | | | 49,292 | | |
Receivable from Adviser | | | 47,868 | | | | 74,266 | | |
Prepaid expenses | | | 43,969 | | | | 56,056 | | |
Total Assets | | | 51,315,072 | | | | 56,665,360 | | |
LIABILITIES: | |
Payables: | |
Collateral received on loaned securities | | | 24,251 | | | | — | | |
Investments purchased | | | 713,878 | | | | 164,183 | | |
Capital shares redeemed | | | 76,990 | | | | 13,508 | | |
Accrued foreign capital gains taxes | | | — | | | | 10,280 | | |
Accrued expenses and other payables: | |
Investment advisory fees | | | 30,741 | | | | 35,335 | | |
Administration fees | | | 2,384 | | | | 2,730 | | |
Custodian fees | | | 2,284 | | | | 2,521 | | |
Transfer agent fees | | | 6,535 | | | | 6,446 | | |
Chief Compliance Officer fees | | | 26 | | | | 30 | | |
Trustees' fees | | | 129 | | | | 73 | | |
| 12b-1 fees | | | 2,813 | | | | 2,455 | | |
Other accrued expenses | | | 10,328 | | | | 12,169 | | |
Total Liabilities | | | 870,359 | | | | 249,730 | | |
NET ASSETS: | |
Capital | | | 45,728,055 | | | | 45,387,250 | | |
Total distributable earnings/(loss) | | | 4,716,658 | | | | 11,028,380 | | |
Net Assets | | $ | 50,444,713 | | | $ | 56,415,630 | | |
Net Assets | |
Class A Shares | | $ | 18,647,549 | | | $ | 9,213,262 | | |
Class C Shares | | | 1,214,612 | | | | 2,747,363 | | |
Class R Shares | | | 2,058,539 | | | | 1,933,254 | | |
Class R6 Shares | | | 52,621 | | | | 52,636 | | |
Class Y Shares | | | 28,471,392 | | | | 42,469,115 | | |
Total | | $ | 50,444,713 | | | $ | 56,415,630 | | |
Shares (unlimited number of shares authorized with a
par value of $0.001 per share): | |
Class A Shares | | | 1,521,205 | | | | 678,095 | | |
Class C Shares | | | 136,328 | | | | 209,377 | | |
Class R Shares | | | 179,710 | | | | 114,267 | | |
Class R6 Shares | | | 5,188 | | | | 5,188 | | |
Class Y Shares | | | 2,356,585 | | | | 3,152,311 | | |
Total | | | 4,199,016 | | | | 4,159,238 | | |
(continues on next page)
See notes to financial statements.
28
Victory Portfolios | | Statements of Assets and Liabilities
June 30, 2019 | |
(Unaudited) (continued)
| | | Victory RS
International
Fund | | Victory RS
Global Fund | |
Net asset value, offering (except Class A Shares) and redemption
price per share: | |
Class A Shares | | $ | 12.26 | | | $ | 13.59 | | |
Class C Shares (b) | | | 8.91 | | | | 13.12 | | |
Class R Shares | | | 11.45 | | | | 16.92 | | |
Class R6 Shares | | | 10.14 | | | | 10.15 | | |
Class Y Shares | | | 12.08 | | | | 13.47 | | |
Maximum Sales Charge — Class A Shares | | | 5.75 | % | | | 5.75 | % | |
Maximum offering price
(100%/(100%-maximum sales charge) of net asset value
adjusted to the nearest cent) per share — Class A Shares | | $ | 13.01 | | | $ | 14.42 | | |
(a) Includes $23,167 of securities on loan.
(b) Redemption price per share varies by the length of time shares are held.
See notes to financial statements.
29
Victory Portfolios | | Statements of Assets and Liabilities
June 30, 2019 | |
(Unaudited)
| | | Victory Sophus
Emerging
Markets Fund | | Victory Sophus
Emerging
Markets Small
Cap Fund | |
ASSETS: | |
Investments, at value (Cost $340,926,836 and $4,926,209) | | $ | 375,680,707 | (a) | | $ | 5,326,336 | (b) | |
Foreign currency, at value (Cost $1,725,089 and $8,404) | | | 1,720,558 | | | | 8,322 | | |
Cash and cash equivalents | | | 4,612,799 | | | | 134,585 | | |
Interest and dividends receivable | | | 1,603,691 | | | | 21,235 | | |
Receivable for capital shares issued | | | 1,223,430 | | | | — | | |
Receivable for investments sold | | | 7,982,431 | | | | 11,283 | | |
Reclaims receivable | | | 2,571 | | | | 625 | | |
Receivable from Adviser | | | 268,476 | | | | 36,702 | | |
Prepaid expenses | | | 47,158 | | | | 21,711 | | |
Total Assets | | | 393,141,821 | | | | 5,560,799 | | |
LIABILITIES: | |
Payables: | |
Collateral received on loaned securities | | | 8,540,804 | | | | 37,232 | | |
Investments purchased | | | 6,554,877 | | | | 62,950 | | |
Capital shares redeemed | | | 724,984 | | | | — | | |
Accrued foreign capital gains taxes | | | 90,472 | | | | 1,441 | | |
Accrued expenses and other payables: | |
Investment advisory fees | | | 299,457 | | | | 5,444 | | |
Administration fees | | | 18,531 | | | | 271 | | |
Custodian fees | | | 34,452 | | | | 1,825 | | |
Transfer agent fees | | | 43,321 | | | | 387 | | |
Chief Compliance Officer fees | | | 228 | | | | 4 | | |
Trustees' fees | | | 576 | | | | — | | |
| 12b-1 fees | | | 12,164 | | | | 91 | | |
Other accrued expenses | | | 39,502 | | | | 18,046 | | |
Total Liabilities | | | 16,359,368 | | | | 127,691 | | |
NET ASSETS: | |
Capital | | | 362,141,999 | | | | 5,200,469 | | |
Total distributable earnings/(loss) | | | 14,640,454 | | | | 232,639 | | |
Net Assets | | $ | 376,782,453 | | | $ | 5,433,108 | | |
Net Assets | |
Class A Shares | | $ | 62,150,382 | | | $ | 305,995 | | |
Class C Shares | | | 7,801,682 | | | | 147,563 | | |
Class R Shares | | | 13,442,309 | | | | — | | |
Class R6 Shares | | | 59,783,419 | | | | — | | |
Class Y Shares | | | 233,604,661 | | | | 4,979,550 | | |
Total | | $ | 376,782,453 | | | $ | 5,433,108 | | |
Shares (unlimited number of shares authorized with a
par value of $0.001 per share): | |
Class A Shares | | | 3,205,197 | | | | 44,337 | | |
Class C Shares | | | 539,580 | | | | 23,584 | | |
Class R Shares | | | 739,994 | | | | — | | |
Class R6 Shares | | | 3,035,633 | | | | — | | |
Class Y Shares | | | 11,967,542 | | | | 723,098 | | |
Total | | | 19,487,946 | | | | 791,019 | | |
(continues on next page)
See notes to financial statements.
30
Victory Portfolios | | Statements of Assets and Liabilities
June 30, 2019 | |
(Unaudited) (continued)
| | | Victory Sophus
Emerging
Markets Fund | | Victory Sophus
Emerging
Markets Small
Cap Fund | |
Net asset value, offering (except Class A Shares) and redemption
price per share: | |
Class A Shares | | $ | 19.39 | | | $ | 6.90 | | |
Class C Shares (c) | | | 14.46 | | | | 6.26 | | |
Class R Shares | | | 18.17 | | | | — | | |
Class R6 Shares | | | 19.69 | | | | — | | |
Class Y Shares | | | 19.52 | | | | 6.89 | | |
Maximum Sales Charge — Class A Shares | | | 5.75 | % | | | 5.75 | % | |
Maximum offering price
(100%/(100%-maximum sales charge) of net asset value
adjusted to the nearest cent) per share — Class A Shares | | $ | 20.57 | | | $ | 7.32 | | |
(a) Includes $8,352,549 of securities on loan.
(b) Includes $36,398 of securities on loan.
(c) Redemption price per share varies by the length of time shares are held.
See notes to financial statements.
31
Victory Portfolios | | Statements of Operations
For the Six Months Ended June 30, 2019 | |
(Unaudited)
| | | Victory RS
International
Fund | | Victory RS
Global Fund | |
Investment Income: | |
Dividends | | $ | 930,183 | | | $ | 793,213 | | |
Interest | | | 13,720 | | | | 9,850 | | |
Securities lending (net of fees) | | | 4,292 | | | | 2,999 | | |
Foreign tax withholding | | | (102,490 | ) | | | (57,067 | ) | |
Total Income | | | 845,705 | | | | 748,995 | | |
Expenses: | |
Investment advisory fees | | | 143,343 | | | | 175,286 | | |
Administration fees | | | 11,302 | | | | 13,832 | | |
12b-1 fees — Class A Shares | | | 21,767 | | | | 8,832 | | |
12b-1 fees — Class C Shares | | | 5,121 | | | | 13,122 | | |
12b-1 fees — Class R Shares | | | 4,928 | | | | 4,730 | | |
Custodian fees | | | 14,451 | | | | 7,458 | | |
Transfer agent fees | | | 804 | | | | 936 | | |
Transfer agent fees — Class A Shares | | | 16,555 | | | | 4,106 | | |
Transfer agent fees — Class C Shares | | | 789 | | | | 1,489 | | |
Transfer agent fees — Class R Shares | | | 2,141 | | | | 2,669 | | |
Transfer agent fees — Class R6 Shares (a) | | | 8 | | | | 8 | | |
Transfer agent fees — Class Y Shares | | | 4,474 | | | | 14,039 | | |
Trustees' fees | | | 1,393 | | | | 1,776 | | |
Chief Compliance Officer fees | | | 130 | | | | 165 | | |
Legal and audit fees | | | 5,710 | | | | 7,637 | | |
State registration and filing fees | | | 30,582 | | | | 30,432 | | |
Other expenses | | | 13,451 | | | | 10,657 | | |
Total Expenses | | | 276,949 | | | | 297,174 | | |
Expenses waived/reimbursed by Adviser | | | (86,790 | ) | | | (138,648 | ) | |
Net Expenses | | | 190,159 | | | | 158,526 | | |
Net Investment Income (Loss) | | | 655,546 | | | | 590,469 | | |
Realized/Unrealized Gains (Losses) from Investments: | |
Net realized gains (losses) from investment securities and foreign
currency translations | | | (2,779 | ) | | | (83,654 | ) | |
Net change in unrealized appreciation/depreciation on investment
securities and foreign currency translations | | | 3,899,013 | | | | 6,427,860 | | |
Net change in accrued foreign taxes on unrealized gains | | | — | | | | 15 | | |
Net realized/unrealized gains (losses) on investments | | | 3,896,234 | | | | 6,344,221 | | |
Change in net assets resulting from operations | | $ | 4,551,780 | | | $ | 6,934,690 | | |
(a) Victory RS International Fund and Victory RS Global Fund Class R6 Shares commenced operations on May 2, 2019.
See notes to financial statements.
32
Victory Portfolios | | Statements of Operations
For the Six Months Ended June 30, 2019 | |
(Unaudited)
| | | Victory Sophus
Emerging
Markets Fund | | Victory Sophus
Emerging
Markets Small
Cap Fund | |
Investment Income: | |
Dividends | | $ | 4,858,331 | | | $ | 75,838 | | |
Interest | | | 68,997 | | | | 819 | | |
Securities lending (net of fees) | | | 46,390 | | | | 496 | | |
Foreign tax withholding | | | (441,748 | ) | | | (8,331 | ) | |
Total Income | | | 4,531,970 | | | | 68,822 | | |
Expenses: | |
Investment advisory fees | | | 1,734,623 | | | | 31,063 | | |
Accounting fees | | | — | | | | 7,458 | | |
Administration fees | | | 109,565 | | | | 1,569 | | |
12b-1 fees — Class A Shares | | | 75,022 | | | | 370 | | |
12b-1 fees — Class C Shares | | | 45,540 | | | | 670 | | |
12b-1 fees — Class R Shares | | | 32,873 | | | | — | | |
Custodian fees | | | 97,674 | | | | 28,218 | | |
Transfer agent fees | | | 5,609 | | | | 702 | | |
Transfer agent fees — Class A Shares | | | 47,347 | | | | 306 | | |
Transfer agent fees — Class C Shares | | | 7,175 | | | | 85 | | |
Transfer agent fees — Class R Shares | | | 11,907 | | | | — | | |
Transfer agent fees — Class R6 Shares | | | 732 | | | | — | | |
Transfer agent fees — Class Y Shares | | | 99,397 | | | | 1,387 | | |
Trustees' fees | | | 14,221 | | | | 281 | | |
Chief Compliance Officer fees | | | 1,357 | | | | 19 | | |
Legal and audit fees | | | 23,827 | | | | 11,682 | | |
State registration and filing fees | | | 46,241 | | | | 20,410 | | |
Line of credit fees | | | — | | | | 4 | | |
Interfund lending fees | | | 691 | | | | 10 | | |
Other expenses | | | 47,025 | | | | 4,289 | | |
Total Expenses | | | 2,400,826 | | | | 108,523 | | |
Expenses waived/reimbursed by Adviser | | | (504,031 | ) | | | (70,148 | ) | |
Net Expenses | | | 1,896,795 | | | | 38,375 | | |
Net Investment Income (Loss) | | | 2,635,175 | | | | 30,447 | | |
Realized/Unrealized Gains (Losses) from Investment Transactions: | |
Net realized gains (losses) from investment securities and foreign
currency translations | | | (8,027,593 | ) | | | (15,027 | ) | |
Foreign taxes on realized gains | | | (7,708 | ) | | | — | | |
Net change in unrealized appreciation/depreciation on investments
and foreign currency translations | | | 40,042,344 | | | | 595,408 | | |
Net change in accrued foreign taxes on unrealized gains | | | (74,722 | ) | | | (1,439 | ) | |
Net realized/unrealized gains (losses) on investments | | | 31,932,321 | | | | 578,942 | | |
Change in net assets resulting from operations | | $ | 34,567,496 | | | $ | 609,389 | | |
See notes to financial statements.
33
Victory Portfolios | | Statements of Changes in Net Assets | |
| | | Victory
RS International Fund | | Victory RS Global Fund | |
| | | Six
Months
Ended
June 30,
2019 | | Year
Ended
December 31,
2018 | | Six
Months
Ended
June 30,
2019 | | Year
Ended
December 31,
2018 | |
| | | (Unaudited) | | | | (Unaudited) | | | |
From Investment Activities: | |
Operations: | |
Net investment income (loss) | | $ | 655,546 | | | $ | 477,399 | | | $ | 590,469 | | | $ | 570,635 | | |
Net realized gains (losses)
from investment transactions | | | (2,779 | ) | | | 1,177,830 | | | | (83,654 | ) | | | 860,931 | | |
Net change in unrealized
appreciation/depreciation
on investments | | | 3,899,013 | | | | (4,529,981 | ) | | | 6,427,875 | | | | (3,474,816 | ) | |
Change in net assets resulting from
operations | | | 4,551,780 | | | | (2,874,752 | ) | | | 6,934,690 | | | | (2,043,250 | ) | |
Distributions to Shareholders: | |
Class A Shares | | | — | | | | (284,566 | ) | | | — | | | | (235,004 | ) | |
Class C Shares | | | — | | | | (11,666 | ) | | | — | | | | (90,683 | ) | |
Class R Shares | | | — | | | | (31,806 | ) | | | — | | | | (63,429 | ) | |
Class Y Shares | | | — | | | | (123,500 | ) | | | — | | | | (1,171,457 | ) | |
Change in net assets resulting from
distributions to shareholders | | | — | | | | (451,538 | ) | | | — | | | | (1,560,573 | ) | |
Change in net assets resulting from
capital transactions | | | 21,710,000 | | | | 2,287,100 | | | | 13,963,779 | | | | 6,560,242 | | |
Change in net assets | | | 26,261,780 | | | | (1,039,190 | ) | | | 20,898,469 | | | | 2,956,419 | | |
Net Assets: | |
Beginning of period | | | 24,182,933 | | | | 25,222,123 | | | | 35,517,161 | | | | 32,560,742 | | |
End of period | | $ | 50,444,713 | | | $ | 24,182,933 | | | $ | 56,415,630 | | | $ | 35,517,161 | | |
(continues on next page)
See notes to financial statements.
34
Victory Portfolios | | Statements of Changes in Net Assets | |
(continued)
| | | Victory
RS International Fund | | Victory RS Global Fund | |
| | | Six
Months
Ended
June 30,
2019 | | Year
Ended
December 31,
2018 | | Six
Months
Ended
June 30,
2019 | | Year
Ended
December 31,
2018 | |
| | | (Unaudited) | | | | (Unaudited) | | | |
Capital Transactions: | |
Class A Shares | |
Proceeds from shares issued | | $ | 1,561,958 | | | $ | 2,288,447 | | | $ | 3,630,088 | | | $ | 3,860,237 | | |
Distributions reinvested | | | — | | | | 281,572 | | | | — | | | | 234,677 | | |
Cost of shares redeemed | | | (1,073,238 | ) | | | (3,237,246 | ) | | | (1,170,911 | ) | | | (1,373,547 | ) | |
Total Class A Shares | | $ | 488,720 | | | $ | (667,227 | ) | | $ | 2,459,177 | | | $ | 2,721,367 | | |
Class C Shares | |
Proceeds from shares issued | | $ | 567,874 | | | $ | 194,402 | | | $ | 218,221 | | | $ | 971,122 | | |
Distributions reinvested | | | — | | | | 11,611 | | | | — | | | | 85,530 | | |
Cost of shares redeemed | | | (182,720 | ) | | | (465,668 | ) | | | (243,673 | ) | | | (594,065 | ) | |
Total Class C Shares | | $ | 385,154 | | | $ | (259,655 | ) | | $ | (25,452 | ) | | $ | 462,587 | | |
Class R Shares | |
Proceeds from shares issued | | $ | 391,861 | | | $ | 223,517 | | | $ | 253,140 | | | $ | 1,047,820 | | |
Distributions reinvested | | | — | | | | 31,806 | | | | — | | | | 63,412 | | |
Cost of shares redeemed | | | (387,798 | ) | | | (706,064 | ) | | | (555,239 | ) | | | (1,274,358 | ) | |
Total Class R Shares | | $ | 4,063 | | | $ | (450,741 | ) | | $ | (302,099 | ) | | $ | (163,126 | ) | |
Class R6 Shares (a) | |
Proceeds from shares issued | | $ | 51,880 | | | $ | — | | | $ | 51,881 | | | $ | — | | |
Total Class R6 Shares | | $ | 51,880 | | | $ | — | | | $ | 51,881 | | | $ | — | | |
Class Y Shares | |
Proceeds from shares issued | | $ | 22,482,236 | | | $ | 4,390,231 | | | $ | 16,977,404 | | | $ | 9,260,102 | | |
Distributions reinvested | | | — | | | | 120,168 | | | | — | | | | 1,155,690 | | |
Cost of shares redeemed | | | (1,702,053 | ) | | | (845,676 | ) | | | (5,197,132 | ) | | | (6,876,378 | ) | |
Total Class Y Shares | | $ | 20,780,183 | | | $ | 3,664,723 | | | $ | 11,780,272 | | | $ | 3,539,414 | | |
Change in net assets resulting from
capital transactions | | $ | 21,710,000 | | | $ | 2,287,100 | | | $ | 13,963,779 | | | $ | 6,560,242 | | |
(continues on next page)
See notes to financial statements.
35
Victory Portfolios | | Statements of Changes in Net Assets | |
(continued)
| | | Victory
RS International Fund | | Victory RS Global Fund | |
| | | Six
Months
Ended
June 30,
2019 | | Year
Ended
December 31,
2018 | | Six
Months
Ended
June 30,
2019 | | Year
Ended
December 31,
2018 | |
| | | (Unaudited) | | | | (Unaudited) | | | |
Share Transactions: | |
Class A Shares | |
Issued | | | 134,949 | | | | 195,662 | | | | 278,304 | | | | 307,527 | | |
Reinvested | | | — | | | | 26,639 | | | | — | | | | 20,347 | | |
Redeemed | | | (91,996 | ) | | | (271,037 | ) | | | (94,198 | ) | | | (105,006 | ) | |
Total Class A Shares | | | 42,953 | | | | (48,736 | ) | | | 184,106 | | | | 222,868 | | |
Class C Shares | |
Issued | | | 67,093 | | | | 23,020 | | | | 18,188 | | | | 76,188 | | |
Reinvested | | | — | | | | 1,506 | | | | — | | | | 7,669 | | |
Redeemed | | | (21,289 | ) | | | (53,829 | ) | | | (19,820 | ) | | | (47,913 | ) | |
Total Class C Shares | | | 45,804 | | | | (29,303 | ) | | | (1,632 | ) | | | 35,944 | | |
Class R Shares | |
Issued | | | 35,858 | | | | 20,065 | | | | 15,532 | | | | 63,257 | | |
Reinvested | | | — | | | | 3,216 | | | | — | | | | 4,422 | | |
Redeemed | | | (35,666 | ) | | | (65,948 | ) | | | (34,866 | ) | | | (78,778 | ) | |
Total Class R Shares | | | 192 | | | | (42,667 | ) | | | (19,334 | ) | | | (11,099 | ) | |
Class R6 Shares (a) | |
Issued | | | 5,188 | | | | — | | | | 5,188 | | | | — | | |
Total Class R6 Shares | | | 5,188 | | | | — | | | | 5,188 | | | | — | | |
Class Y Shares | |
Issued | | | 1,934,484 | | | | 373,965 | | | | 1,319,756 | | | | 722,761 | | |
Reinvested | | | — | | | | 11,555 | | | | — | | | | 101,047 | | |
Redeemed | | | (149,203 | ) | | | (75,831 | ) | | | (404,939 | ) | | | (538,364 | ) | |
Total Class Y Shares | | | 1,785,281 | | | | 309,689 | | | | 914,817 | | | | 285,444 | | |
Change in Shares | | | 1,879,418 | | | | 188,983 | | | | 1,083,145 | | | | 533,157 | | |
(a) Victory RS International Fund and Victory RS Global Fund Class R6 Shares commenced operations on May 2, 2019
See notes to financial statements.
36
Victory Portfolios | | Statements of Changes in Net Assets | |
| | | Victory Sophus
Emerging Markets Fund | | Victory Sophus Emerging
Markets Small Cap Fund | |
| | | Six
Months
Ended
June 30,
2019 | | Year
Ended
December 31,
2018 | | Six
Months
Ended
June 30,
2019 | | Year
Ended
December 31,
2018 | |
| | | (Unaudited) | | | | (Unaudited) | | | |
From Investment Activities: | |
Operations: | |
Net investment income (loss) | | $ | 2,635,175 | | | $ | 4,102,037 | | | $ | 30,447 | | | $ | 45,674 | | |
Net realized gains (losses)
from investment transactions | | | (8,035,301 | ) | | | (14,816,850 | ) | | | (15,027 | ) | | | 206,641 | | |
Net change in unrealized
appreciation/depreciation
on investments | | | 39,967,622 | | | | (57,042,614 | ) | | | 593,969 | | | | (1,413,651 | ) | |
Change in net assets resulting from
operations | | | 34,567,496 | | | | (67,757,427 | ) | | | 609,389 | | | | (1,161,336 | ) | |
Distributions to Shareholders: | |
Class A Shares | | | — | | | | (2,404,521 | ) | | | — | | | | (77,275 | ) | |
Class C Shares | | | — | | | | (487,115 | ) | | | — | | | | (28,802 | ) | |
Class R Shares | | | — | | | | (557,638 | ) | | | — | | | | — | | |
Class R6 Shares | | | — | | | | (1,290,095 | ) | | | — | | | | — | | |
Class Y Shares | | | — | | | | (7,886,236 | ) | | | — | | | | (697,233 | ) | |
Change in net assets resulting from
distributions to shareholders | | | — | | | | (12,625,605 | ) | | | — | | | | (803,310 | ) | |
Change in net assets resulting from
capital transactions | | | 55,386,152 | | | | 137,334,265 | | | | 487,839 | | | | (938,856 | ) | |
Change in net assets | | | 89,953,648 | | | | 56,951,233 | | | | 1,097,228 | | | | (2,903,502 | ) | |
Net Assets: | |
Beginning of period | | | 286,828,805 | | | | 229,877,572 | | | | 4,335,880 | | | | 7,239,382 | | |
End of period | | $ | 376,782,453 | | | $ | 286,828,805 | | | $ | 5,433,108 | | | $ | 4,335,880 | | |
(continues on next page)
See notes to financial statements.
37
Victory Portfolios | | Statements of Changes in Net Assets | |
(continued)
| | | Victory Sophus
Emerging Markets Fund | | Victory Sophus Emerging
Markets Small Cap Fund | |
| | | Six
Months
Ended
June 30,
2019 | | Year
Ended
December 31,
2018 | | Six
Months
Ended
June 30,
2019 | | Year
Ended
December 31,
2018 | |
| | | (Unaudited) | | | | (Unaudited) | | | |
Capital Transactions: | |
Class A Shares | |
Proceeds from shares issued | | $ | 5,820,030 | | | $ | 33,865,822 | | | $ | 18,699 | | | $ | 292,487 | | |
Distributions reinvested | | | — | | | | 2,332,176 | | | | — | | | | 77,275 | | |
Cost of shares redeemed | | | (6,769,018 | ) | | | (39,120,936 | ) | | | (87,120 | ) | | | (1,300,280 | ) | |
Total Class A Shares | | $ | (948,988 | ) | | $ | (2,922,938 | ) | | $ | (68,421 | ) | | $ | (930,518 | ) | |
Class C Shares | |
Proceeds from shares issued | | $ | 357,705 | | | $ | 2,799,033 | | | $ | 18,900 | | | $ | 115,563 | | |
Distributions reinvested | | | — | | | | 472,508 | | | | — | | | | 24,961 | | |
Cost of shares redeemed | | | (3,647,926 | ) | | | (5,728,052 | ) | | | — | | | | (64,924 | ) | |
Total Class C Shares | | $ | (3,290,221 | ) | | $ | (2,456,511 | ) | | $ | 18,900 | | | $ | 75,600 | | |
Class R Shares | |
Proceeds from shares issued | | $ | 923,724 | | | $ | 3,155,291 | | | $ | — | | | $ | — | | |
Distributions reinvested | | | — | | | | 555,098 | | | | — | | | | — | | |
Cost of shares redeemed | | | (1,358,858 | ) | | | (5,171,495 | ) | | | — | | | | — | | |
Total Class R Shares | | $ | (435,134 | ) | | $ | (1,461,106 | ) | | $ | — | | | $ | — | | |
Class R6 Shares | |
Proceeds from shares issued | | $ | 32,355,494 | | | $ | 19,872,256 | | | $ | — | | | $ | — | | |
Distributions reinvested | | | — | | | | 1,290,095 | | | | — | | | | — | | |
Cost of shares redeemed | | | (6,000,096 | ) | | | (4,453,645 | ) | | | — | | | | — | | |
Total Class R6 Shares | | $ | 26,355,398 | | | $ | 16,708,706 | | | $ | — | | | $ | — | | |
Class Y Shares | |
Proceeds from shares issued | | $ | 81,780,328 | | | $ | 220,978,809 | | | $ | 933,459 | | | $ | 5,720,498 | | |
Distributions reinvested | | | 181 | | | | 7,831,210 | | | | — | | | | 697,233 | | |
Cost of shares redeemed | | | (48,075,412 | ) | | | (101,343,905 | ) | | | (396,099 | ) | | | (6,501,669 | ) | |
Total Class Y Shares | | $ | 33,705,097 | | | $ | 127,466,114 | | | $ | 537,360 | | | $ | (83,938 | ) | |
Change in net assets resulting from
capital transactions | | $ | 55,386,152 | | | $ | 137,334,265 | | | $ | 487,839 | | | $ | (938,856 | ) | |
(continues on next page)
See notes to financial statements.
38
Victory Portfolios | | Statements of Changes in Net Assets | |
(continued)
| | | Victory Sophus
Emerging Markets Fund | | Victory Sophus Emerging
Markets Small Cap Fund | |
| | | Six
Months
Ended
June 30,
2019 | | Year
Ended
December 31,
2018 | | Six
Months
Ended
June 30,
2019 | | Year
Ended
December 31,
2018 | |
| | | (Unaudited) | | | | (Unaudited) | | | |
Share Transactions: | |
Class A Shares | |
Issued | | | 310,773 | | | | 1,521,048 | | | | 2,879 | | | | 28,462 | | |
Reinvested | | | — | | | | 134,716 | | | | — | | | | 12,922 | | |
Redeemed | | | (361,948 | ) | | | (1,795,173 | ) | | | (13,562 | ) | | | (130,028 | ) | |
Total Class A Shares | | | (51,175 | ) | | | (139,409 | ) | | | (10,683 | ) | | | (88,644 | ) | |
Class C Shares | |
Issued | | | 25,629 | | | | 165,816 | | | | 3,242 | | | | 12,466 | | |
Reinvested | | | — | | | | 36,742 | | | | — | | | | 4,588 | | |
Redeemed | | | (262,347 | ) | | | (354,786 | ) | | | — | | | | (7,100 | ) | |
Total Class C Shares | | | (236,718 | ) | | | (152,228 | ) | | | 3,242 | | | | 9,954 | | |
Class R Shares | |
Issued | | | 52,658 | | | | 152,588 | | | | — | | | | — | | |
Reinvested | | | — | | | | 34,252 | | | | — | | | | — | | |
Redeemed | | | (76,711 | ) | | | (266,765 | ) | | | — | | | | — | | |
Total Class R Shares | | | (24,053 | ) | | | (79,925 | ) | | | — | | | | — | | |
Class R6 Shares | |
Issued | | | 1,701,390 | | | | 957,135 | | | | — | | | | — | | |
Reinvested | | | — | | | | 73,315 | | | | — | | | | — | | |
Redeemed | | | (318,495 | ) | | | (200,408 | ) | | | — | | | | — | | |
Total Class R6 Shares | | | 1,382,895 | | | | 830,042 | | | | — | | | | — | | |
Class Y Shares | |
Issued | | | 4,361,754 | | | | 10,283,738 | | | | 140,970 | | | | 632,138 | | |
Reinvested | | | 10 | | | | 448,845 | | | | — | | | | 116,985 | | |
Redeemed | | | (2,552,645 | ) | | | (5,031,804 | ) | | | (60,421 | ) | | | (670,562 | ) | |
Total Class Y Shares | | | 1,809,119 | | | | 5,700,779 | | | | 80,549 | | | | 78,561 | | |
Change in Shares | | | 2,880,068 | | | | 6,159,259 | | | | 73,108 | | | | (129 | ) | |
See notes to financial statements.
39
Victory Portfolios | | Financial Highlights | |
For a Share Outstanding Throughout Each Period
| | | | Investment Activities | | Distributions to
Shareholders From | |
| | | Net Asset
Value,
Beginning of
Period | | Net
Investment
Income (Loss)(a) | | Net Realized
and Unrealized
Gains (Losses)
on Investments | | Total from
Investment
Activities | | Net
Investment
Income | | Net Realized
Gains from
Investments | |
Victory RS International Fund | |
Class A | |
Six Months Ended
6/30/19 (unaudited) | | $ | 10.63 | | | | 0.20 | | | | 1.43 | | | | 1.63 | | | | — | | | | — | | |
Year Ended 12/31/18 | | $ | 12.12 | | | | 0.23 | | | | (1.52 | ) | | | (1.29 | ) | | | (0.20 | ) | | | — | | |
Year Ended 12/31/17 | | $ | 9.84 | | | | 0.19 | | | | 2.29 | | | | 2.48 | | | | (0.20 | ) | | | — | | |
Year Ended 12/31/16 | | $ | 9.78 | | | | 0.16 | | | | (0.07 | ) | | | 0.09 | | | | (0.17 | ) | | | — | | |
Year Ended 12/31/15 | | $ | 9.87 | | | | 0.15 | | | | (0.09 | ) | | | 0.06 | | | | (0.15 | ) | | | — | | |
Year Ended 12/31/14 | | $ | 13.24 | | | | 0.23 | | | | (0.98 | ) | | | (0.75 | ) | | | (0.21 | ) | | | (2.41 | ) | |
Class C | |
Six Months Ended
6/30/19 (unaudited) | | $ | 7.76 | | | | 0.12 | | | | 1.03 | | | | 1.15 | | | | — | | | | — | | |
Year Ended 12/31/18 | | $ | 8.89 | | | | 0.11 | | | | (1.11 | ) | | | (1.00 | ) | | | (0.13 | ) | | | — | | |
Year Ended 12/31/17 | | $ | 7.26 | | | | 0.08 | | | | 1.68 | | | | 1.76 | | | | (0.13 | ) | | | — | | |
Year Ended 12/31/16 | | $ | 7.26 | | | | 0.07 | | | | (0.08 | ) | | | (0.01 | ) | | | (0.13 | ) | | | — | | |
Year Ended 12/31/15 | | $ | 7.36 | | | | 0.05 | | | | (0.07 | ) | | | (0.02 | ) | | | (0.08 | ) | | | — | | |
Year Ended 12/31/14 | | $ | 10.62 | | | | 0.06 | | | | (0.78 | ) | | | (0.72 | ) | | | (0.13 | ) | | | (2.41 | ) | |
Class R | |
Six Months Ended
6/30/19 (unaudited) | | $ | 9.95 | | | | 0.18 | | | | 1.32 | | | | 1.50 | | | | — | | | | — | | |
Year Ended 12/31/18 | | $ | 11.35 | | | | 0.19 | | | | (1.42 | ) | | | (1.23 | ) | | | (0.17 | ) | | | — | | |
Year Ended 12/31/17 | | $ | 9.23 | | | | 0.15 | | | | 2.14 | | | | 2.29 | | | | (0.17 | ) | | | — | | |
Year Ended 12/31/16 | | $ | 9.18 | | | | 0.11 | | | | (0.06 | ) | | | 0.05 | | | | (0.14 | ) | | | — | | |
Year Ended 12/31/15 | | $ | 9.27 | | | | 0.11 | | | | (0.09 | ) | | | 0.02 | | | | (0.11 | ) | | | — | | |
Year Ended 12/31/14 | | $ | 12.63 | | | | 0.15 | | | | (0.94 | ) | | | (0.79 | ) | | | (0.16 | ) | | | (2.41 | ) | |
Class R6 | |
May 2, 2019(g) through
6/30/19 (unaudited) | | $ | 10.00 | | | | 0.06 | | | | 0.08 | | | | 0.14 | | | | — | | | | — | | |
Class Y | |
Six Months Ended
6/30/19 (unaudited) | | $ | 10.47 | | | | 0.23 | | | | 1.38 | | | | 1.61 | | | | — | | | | — | | |
Year Ended 12/31/18 | | $ | 11.93 | | | | 0.23 | | | | (1.47 | ) | | | (1.24 | ) | | | (0.22 | ) | | | — | | |
Year Ended 12/31/17 | | $ | 9.69 | | | | 0.22 | | | | 2.26 | | | | 2.48 | | | | (0.24 | ) | | | — | | |
Year Ended 12/31/16 | | $ | 9.62 | | | | 0.18 | | | | (0.06 | ) | | | 0.12 | | | | (0.19 | ) | | | — | | |
Year Ended 12/31/15 | | $ | 9.70 | | | | 0.18 | | | | (0.09 | ) | | | 0.09 | | | | (0.17 | ) | | | — | | |
Year Ended 12/31/14 | | $ | 13.08 | | | | 0.25 | | | | (0.96 | ) | | | (0.71 | ) | | | (0.26 | ) | | | (2.41 | ) | |
(a) Per share net investment income (loss) has been calculated using the average daily shares method.
(b) Not annualized for periods less than one year.
(c) Annualized for periods less than one year.
(d) During the period, certain fees were reduced and/or reimbursed. If such fee reductions and/or reimbursements had not occurred, the ratios would have been as indicated.
(e) Portfolio turnover is calculated on the basis of the Fund as a whole without distinguishing between the classes of shares issued.
See notes to financial statements.
40
Victory Portfolios | | Financial Highlights — continued | |
For a Share Outstanding Throughout Each Period
| | | | Ratios to Average Net Assets | | Supplemental Data | |
| | | Total
Distributions
to
Shareholders | | Capital
Contributions
from Prior
Custodian, Net
(See Note 8) | | Net Asset
Value,
End of
Period | | Total
Return
(Excludes
Sales
Charge)(b) | | Net
Expenses(c) | | Net
Investment
Income
(Loss)(c) | | Gross
Expenses(c)(d) | | Net Assets,
End of
Period
(000's) | | Portfolio
Turnover(b)(e) | |
Victory RS International Fund | |
Class A | |
Six Months Ended
6/30/19 (unaudited) | | | — | | | | — | | | $ | 12.26 | | | | 15.33 | % | | | 1.13 | % | | | 3.48 | % | | | 1.61 | % | | $ | 18,648 | | | | 16 | % | |
Year Ended 12/31/18 | | | (0.20 | ) | | | — | | | $ | 10.63 | | | | (10.65 | )% | | | 1.13 | % | | | 1.97 | % | | | 1.61 | % | | $ | 15,716 | | | | 52 | % | |
Year Ended 12/31/17 | | | (0.20 | ) | | | — | | | $ | 12.12 | | | | 25.26 | % | | | 1.20 | % | | | 1.66 | % | | | 1.81 | % | | $ | 18,512 | | | | 60 | % | |
Year Ended 12/31/16 | | | (0.17 | ) | | | 0.14 | | | $ | 9.84 | | | | 2.41 | %(f) | | | 1.40 | % | | | 1.64 | % | | | 1.95 | % | | $ | 16,799 | | | | 103 | % | |
Year Ended 12/31/15 | | | (0.15 | ) | | | — | | | $ | 9.78 | | | | 0.64 | % | | | 1.40 | % | | | 1.49 | % | | | 1.89 | % | | $ | 19,416 | | | | 117 | % | |
Year Ended 12/31/14 | | | (2.62 | ) | | | — | | | $ | 9.87 | | | | (5.80 | )% | | | 1.40 | % | | | 1.74 | % | | | 1.81 | % | | $ | 22,388 | | | | 186 | % | |
Class C | |
Six Months Ended
6/30/19 (unaudited) | | | — | | | | — | | | $ | 8.91 | | | | 14.82 | % | | | 1.88 | % | | | 2.87 | % | | | 3.36 | % | | $ | 1,215 | | | | 16 | % | |
Year Ended 12/31/18 | | | (0.13 | ) | | | — | | | $ | 7.76 | | | | (11.24 | )% | | | 1.88 | % | | | 1.23 | % | | | 3.52 | % | | $ | 702 | | | | 52 | % | |
Year Ended 12/31/17 | | | (0.13 | ) | | | — | | | $ | 8.89 | | | | 24.25 | % | | | 1.95 | % | | | 0.92 | % | | | 3.26 | % | | $ | 1,066 | | | | 60 | % | |
Year Ended 12/31/16 | | | (0.13 | ) | | | 0.14 | | | $ | 7.26 | | | | 1.77 | %(f) | | | 2.15 | % | | | 0.97 | % | | | 3.05 | % | | $ | 1,228 | | | | 103 | % | |
Year Ended 12/31/15 | | | (0.08 | ) | | | — | | | $ | 7.26 | | | | (0.27 | )% | | | 2.27 | % | | | 0.65 | % | | | 2.82 | % | | $ | 1,969 | | | | 117 | % | |
Year Ended 12/31/14 | | | (2.54 | ) | | | — | | | $ | 7.36 | | | | (6.90 | )% | | | 2.55 | % | | | 0.54 | % | | | 2.75 | % | | $ | 2,418 | | | | 186 | % | |
Class R | |
Six Months Ended
6/30/19 (unaudited) | | | — | | | | — | | | $ | 11.45 | | | | 15.18 | % | | | 1.38 | % | | | 3.25 | % | | | 2.48 | % | | $ | 2,059 | | | | 16 | % | |
Year Ended 12/31/18 | | | (0.17 | ) | | | — | | | $ | 9.95 | | | | (10.85 | )% | | | 1.38 | % | | | 1.73 | % | | | 2.31 | % | | $ | 1,786 | | | | 52 | % | |
Year Ended 12/31/17 | | | (0.17 | ) | | | — | | | $ | 11.35 | | | | 24.85 | % | | | 1.48 | % | | | 1.39 | % | | | 2.48 | % | | $ | 2,522 | | | | 60 | % | |
Year Ended 12/31/16 | | | (0.14 | ) | | | 0.14 | | | $ | 9.23 | | | | 2.06 | %(f) | | | 1.80 | % | | | 1.26 | % | | | 2.29 | % | | $ | 2,279 | | | | 103 | % | |
Year Ended 12/31/15 | | | (0.11 | ) | | | — | | | $ | 9.18 | | | | 0.22 | % | | | 1.86 | % | | | 1.10 | % | | | 2.28 | % | | $ | 2,707 | | | | 117 | % | |
Year Ended 12/31/14 | | | (2.57 | ) | | | — | | | $ | 9.27 | | | | (6.37 | )% | | | 1.96 | % | | | 1.20 | % | | | 2.19 | % | | $ | 3,403 | | | | 186 | % | |
Class R6 | |
May 2, 2019(g) through
6/30/19 (unaudited) | | | — | | | | — | | | $ | 10.14 | | | | 1.40 | % | | | 0.83 | % | | | 4.00 | % | | | 5.61 | % | | $ | 53 | | | | 16 | % | |
Class Y | |
Six Months Ended
6/30/19 (unaudited) | | | — | | | | — | | | $ | 12.08 | | | | 15.38 | % | | | 0.88 | % | | | 3.93 | % | | | 1.22 | % | | $ | 28,470 | | | | 16 | % | |
Year Ended 12/31/18 | | | (0.22 | ) | | | — | | | $ | 10.47 | | | | (10.38 | )% | | | 0.88 | % | | | 1.97 | % | | | 1.62 | % | | $ | 5,979 | | | | 52 | % | |
Year Ended 12/31/17 | | | (0.24 | ) | | | — | | | $ | 11.93 | | | | 25.56 | % | | | 0.94 | % | | | 1.98 | % | | | 1.85 | % | | $ | 3,122 | | | | 60 | % | |
Year Ended 12/31/16 | | | (0.19 | ) | | | 0.14 | | | $ | 9.69 | | | | 2.69 | %(f) | | | 1.15 | % | | | 1.93 | % | | | 1.80 | % | | $ | 2,626 | | | | 103 | % | |
Year Ended 12/31/15 | | | (0.17 | ) | | | — | | | $ | 9.62 | | | | 0.92 | % | | | 1.15 | % | | | 1.76 | % | | | 1.75 | % | | $ | 3,904 | | | | 117 | % | |
Year Ended 12/31/14 | | | (2.67 | ) | | | — | | | $ | 9.70 | | | | (5.60 | )% | | | 1.15 | % | | | 1.95 | % | | | 1.51 | % | | $ | 4,221 | | | | 186 | % | |
(f) The Fund received monies related to a nonrecurring refund from the prior Custodian. The corresponding impact to the total return was 1.45% for the period shown. (See Note 8)
(g) Commencement of operations.
See notes to financial statements.
41
Victory Portfolios | | Financial Highlights | |
For a Share Outstanding Throughout Each Period
| | | | Investment Activities | | Distributions to
Shareholders From | | Distributions to
Shareholders From | |
| | | Net Asset
Value,
Beginning of
Period | | Net
Investment
Income (Loss)(a) | | Net Realized
and Unrealized
Gains (Losses)
on Investments | | Total from
Investment
Activities | | Net
Investment
Income | | Net Realized
Gains from
Investments | | Return of
Capital | | Total
Distributions
to
Shareholders | |
Victory RS Global Fund | |
Class A | |
Six Months Ended
6/30/19 (unaudited) | | $ | 11.53 | | | | 0.16 | | | | 1.90 | | | | 2.06 | | | | — | | | | — | | | | — | | | | — | | |
Year Ended 12/31/18 | | $ | 12.75 | | | | 0.20 | | | | (0.90 | ) | | | (0.70 | ) | | | (0.16 | ) | | | (0.36 | ) | | | — | | | | (0.52 | ) | |
Year Ended 12/31/17 | | $ | 11.16 | | | | 0.15 | | | | 2.53 | | | | 2.68 | | | | — | | | | (1.00 | ) | | | (0.09 | ) | | | (1.09 | ) | |
Year Ended 12/31/16 | | $ | 11.56 | | | | 0.13 | | | | 0.65 | | | | 0.78 | | | | (0.03 | ) | | | (1.15 | ) | | | — | | | | (1.18 | ) | |
Year Ended 12/31/15 | | $ | 11.56 | | | | 0.11 | | | | 0.32 | | | | 0.43 | | | | (0.11 | ) | | | (0.32 | ) | | | — | | | | (0.43 | ) | |
Year Ended 12/31/14 | | $ | 11.65 | | | | 0.10 | | | | 0.45 | | | | 0.55 | | | | (0.08 | ) | | | (0.56 | ) | | | — | | | | (0.64 | ) | |
Class C | |
Six Months Ended
6/30/19 (unaudited) | | $ | 11.17 | | | | 0.11 | | | | 1.84 | | | | 1.95 | | | | — | | | | — | | | | — | | | | — | | |
Year Ended 12/31/18 | | $ | 12.38 | | | | 0.10 | | | | (0.87 | ) | | | (0.77 | ) | | | (0.08 | ) | | | (0.36 | ) | | | — | | | | (0.44 | ) | |
Year Ended 12/31/17 | | $ | 10.95 | | | | 0.05 | | | | 2.47 | | | | 2.52 | | | | — | | | | (1.00 | ) | | | (0.09 | ) | | | (1.09 | ) | |
Year Ended 12/31/16 | | $ | 11.42 | | | | 0.05 | | | | 0.63 | | | | 0.68 | | | | — | | | | (1.15 | ) | | | — | | | | (1.15 | ) | |
Year Ended 12/31/15 | | $ | 11.43 | | | | 0.01 | | | | 0.32 | | | | 0.33 | | | | (0.02 | ) | | | (0.32 | ) | | | — | | | | (0.34 | ) | |
Year Ended 12/31/14 | | $ | 11.54 | | | | 0.01 | | | | 0.44 | | | | 0.45 | | | | — | | | | (0.56 | ) | | | — | | | | (0.56 | ) | |
Class R | |
Six Months Ended
6/30/19 (unaudited) | | $ | 14.37 | | | | 0.18 | | | | 2.37 | | | | 2.55 | | | | — | | | | — | | | | — | | | | — | | |
Year Ended 12/31/18 | | $ | 15.76 | | | | 0.20 | | | | (1.10 | ) | | | (0.90 | ) | | | (0.13 | ) | | | (0.36 | ) | | | — | | | | (0.49 | ) | |
Year Ended 12/31/17 | | $ | 13.62 | | | | 0.05 | | | | 3.18 | | | | 3.23 | | | | — | | | | (1.00 | ) | | | (0.09 | ) | | | (1.09 | ) | |
Year Ended 12/31/16 | | $ | 11.50 | | | | 0.09 | | | | 3.43 | | | | 3.52 | | | | (0.25 | ) | | | (1.15 | ) | | | — | | | | (1.40 | ) | |
Year Ended 12/31/15 | | $ | 11.50 | | | | 0.06 | | | | 0.32 | | | | 0.38 | | | | (0.06 | ) | | | (0.32 | ) | | | — | | | | (0.38 | ) | |
Year Ended 12/31/14 | | $ | 11.59 | | | | 0.06 | | | | 0.44 | | | | 0.50 | | | | (0.03 | ) | | | (0.56 | ) | | | — | | | | (0.59 | ) | |
Class R6 | |
May 2, 2019(g) through
6/30/19 (unaudited) | | $ | 10.00 | | | | 0.06 | | | | 0.09 | | | | 0.15 | | | | — | | | | — | | | | — | | | | — | | |
Class Y | |
Six Months Ended
6/30/19 (unaudited) | | $ | 11.42 | | | | 0.18 | | | | 1.87 | | | | 2.05 | | | | — | | | | — | | | | — | | | | — | | |
Year Ended 12/31/18 | | $ | 12.63 | | | | 0.23 | | | | (0.89 | ) | | | (0.66 | ) | | | (0.19 | ) | | | (0.36 | ) | | | — | | | | (0.55 | ) | |
Year Ended 12/31/17 | | $ | 11.04 | | | | 0.18 | | | | 2.50 | | | | 2.68 | | | | — | | | | (1.00 | ) | | | (0.09 | ) | | | (1.09 | ) | |
Year Ended 12/31/16 | | $ | 11.60 | | | | 0.15 | | | | 0.67 | | | | 0.82 | | | | (0.23 | ) | | | (1.15 | ) | | | — | | | | (1.38 | ) | |
Year Ended 12/31/15 | | $ | 11.59 | | | | 0.15 | | | | 0.31 | | | | 0.46 | | | | (0.13 | ) | | | (0.32 | ) | | | — | | | | (0.45 | ) | |
Year Ended 12/31/14 | | $ | 11.67 | | | | 0.14 | | | | 0.45 | | | | 0.59 | | | | (0.11 | ) | | | (0.56 | ) | | | — | | | | (0.67 | ) | |
(a) Per share net investment income (loss) has been calculated using the average daily shares method.
(b) Not annualized for periods less than one year.
(c) Annualized for periods less than one year.
(d) During the period, certain fees were reduced and/or reimbursed. If such fee reductions and/or reimbursements had not occurred, the ratios would have been as indicated.
(e) Portfolio turnover is calculated on the basis of the Fund as a whole without distinguishing between the classes of shares issued.
See notes to financial statements.
42
Victory Portfolios | | Financial Highlights — continued | |
For a Share Outstanding Throughout Each Period
| | | | Ratios to Average Net Assets | | Supplemental Data | |
| | | Net Asset
Value,
End of
Period | | Total
Return
(Excludes
Sales
Charge)(b) | | Net
Expenses(c) | | Net
Investment
Income
(Loss)(c) | | Gross
Expenses(c)(d) | | Net Assets,
End of
Period
(000's) | | Portfolio
Turnover(b)(e) | |
Victory RS Global Fund | |
Class A | |
Six Months Ended
6/30/19 (unaudited) | | $ | 13.59 | | | | 17.87 | % | | | 0.85 | % | | | 2.57 | % | | | 1.55 | % | | $ | 9,213 | | | | 23 | % | |
Year Ended 12/31/18 | | $ | 11.53 | | | | (5.45 | )% | | | 0.94 | % | | | 1.51 | % | | | 1.75 | % | | $ | 5,695 | | | | 58 | % | |
Year Ended 12/31/17 | | $ | 12.75 | | | | 24.48 | % | | | 1.17 | % | | | 1.24 | % | | | 1.90 | % | | $ | 3,456 | | | | 187 | % | |
Year Ended 12/31/16 | | $ | 11.16 | | | | 6.67 | % | | | 1.40 | % | | | 1.12 | % | | | 1.71 | % | | $ | 5,366 | | | | 184 | % | |
Year Ended 12/31/15 | | $ | 11.56 | | | | 3.68 | % | | | 1.36 | % | | | 0.90 | % | | | 1.57 | % | | $ | 13,857 | | | | 90 | % | |
Year Ended 12/31/14 | | $ | 11.56 | | | | 4.70 | % | | | 1.40 | % | | | 0.85 | % | | | 1.63 | % | | $ | 13,015 | | | | 130 | % | |
Class C | |
Six Months Ended
6/30/19 (unaudited) | | $ | 13.12 | | | | 17.46 | % | | | 1.60 | % | | | 1.79 | % | | | 2.59 | % | | $ | 2,747 | | | | 23 | % | |
Year Ended 12/31/18 | | $ | 11.17 | | | | (6.20 | )% | | | 1.70 | % | | | 0.79 | % | | | 2.59 | % | | $ | 2,358 | | | | 58 | % | |
Year Ended 12/31/17 | | $ | 12.38 | | | | 23.47 | % | | | 1.91 | % | | | 0.41 | % | | | 3.00 | % | | $ | 2,167 | | | | 187 | % | |
Year Ended 12/31/16 | | $ | 10.95 | | | | 5.92 | % | | | 2.16 | % | | | 0.41 | % | | | 2.44 | % | | $ | 1,270 | | | | 184 | % | |
Year Ended 12/31/15 | | $ | 11.42 | | | | 2.85 | % | | | 2.17 | % | | | 0.11 | % | | | 2.38 | % | | $ | 7,367 | | | | 90 | % | |
Year Ended 12/31/14 | | $ | 11.43 | | | | 3.87 | % | | | 2.17 | % | | | 0.10 | % | | | 2.43 | % | | $ | 6,538 | | | | 130 | % | |
Class R | |
Six Months Ended
6/30/19 (unaudited) | | $ | 16.92 | | | | 17.75 | % | | | 1.10 | % | | | 2.25 | % | | | 2.42 | % | | $ | 1,933 | | | | 23 | % | |
Year Ended 12/31/18 | | $ | 14.37 | | | | (5.68 | )% | | | 1.20 | % | | | 1.25 | % | | | 2.34 | % | | $ | 1,920 | | | | 58 | % | |
Year Ended 12/31/17 | | $ | 15.76 | | | | 24.09 | % | | | 1.61 | % | | | 0.38 | % | | | 2.76 | % | | $ | 2,281 | | | | 187 | % | |
Year Ended 12/31/16 | | $ | 13.62 | | | | 30.57 | %(f) | | | 1.68 | % | | | 0.74 | % | | | 1.81 | % | | $ | 9,213 | | | | 184 | % | |
Year Ended 12/31/15 | | $ | 11.50 | | | | 3.23 | % | | | 1.78 | % | | | 0.50 | % | | | 2.00 | % | | $ | 5,265 | | | | 90 | % | |
Year Ended 12/31/14 | | $ | 11.50 | | | | 4.25 | % | | | 1.80 | % | | | 0.47 | % | | | 2.04 | % | | $ | 5,272 | | | | 130 | % | |
Class R6 | |
May 2, 2019(g) through
6/30/19 (unaudited) | | $ | 10.15 | | | | 1.50 | % | | | 0.55 | % | | | 3.45 | % | | | 5.53 | % | | $ | 53 | | | | 23 | % | |
Class Y | |
Six Months Ended
6/30/19 (unaudited) | | $ | 13.47 | | | | 17.95 | % | | | 0.60 | % | | | 2.81 | % | | | 1.14 | % | | $ | 42,470 | | | | 23 | % | |
Year Ended 12/31/18 | | $ | 11.42 | | | | (5.17 | )% | | | 0.70 | % | | | 1.80 | % | | | 1.20 | % | | $ | 25,544 | | | | 58 | % | |
Year Ended 12/31/17 | | $ | 12.63 | | | | 24.75 | % | | | 0.88 | % | | | 1.44 | % | | | 1.32 | % | | $ | 24,657 | | | | 187 | % | |
Year Ended 12/31/16 | | $ | 11.04 | | | | 7.01 | % | | | 1.09 | % | | | 1.30 | % | | | 1.36 | % | | $ | 13,430 | | | | 184 | % | |
Year Ended 12/31/15 | | $ | 11.60 | | | | 3.96 | % | | | 1.09 | % | | | 1.21 | % | | | 1.36 | % | | $ | 15,871 | | | | 90 | % | |
Year Ended 12/31/14 | | $ | 11.59 | | | | 5.04 | % | | | 1.09 | % | | | 1.17 | % | | | 1.33 | % | | $ | 15,334 | | | | 130 | % | |
(f) During the period, the share class recognized certain expense reimbursements and due to the fluctuation in average net assets during the same period the total return reflected is significantly higher than the other share classes of the Fund. The total return would have been 6.39% had the expense reimbursements not occurred.
(g) Commencement of operations.
See notes to financial statements.
43
Victory Portfolios | | Financial Highlights | |
For a Share Outstanding Throughout Each Period
| | | | Investment Activities | | Distributions to
Shareholders From | |
| | | Net Asset
Value,
Beginning of
Period | | Net
Investment
Income (Loss)(a) | | Net Realized
and Unrealized
Gains (Losses)
on Investments | | Total from
Investment
Activities | | Net
Investment
Income | | Net Realized
Gains from
Investments | |
Victory Sophus Emerging Markets Fund | |
Class A | |
Six Months Ended
6/30/19 (unaudited) | | $ | 17.45 | | | | 0.11 | | | | 1.83 | | | | 1.94 | | | | — | | | | — | | |
Year Ended 12/31/18 | | $ | 22.52 | | | | 0.24 | | | | (4.54 | ) | | | (4.30 | ) | | | (0.13 | ) | | | (0.64 | ) | |
Year Ended 12/31/17 | | $ | 15.98 | | | | 0.16 | | | | 6.55 | | | | 6.71 | | | | (0.17 | ) | | | — | | |
Year Ended 12/31/16 | | $ | 14.60 | | | | 0.11 | | | | 1.38 | | | | 1.49 | | | | (0.15 | ) | | | — | | |
Year Ended 12/31/15 | | $ | 17.22 | | | | 0.10 | | | | (2.33 | ) | | | (2.23 | ) | | | — | | | | (0.39 | ) | |
Year Ended 12/31/14 | | $ | 19.34 | | | | 0.12 | | | | (0.82 | ) | | | (0.70 | ) | | | (0.17 | ) | | | (1.25 | ) | |
Class C | |
Six Months Ended
6/30/19 (unaudited) | | $ | 13.06 | | | | 0.02 | | | | 1.38 | | | | 1.40 | | | | — | | | | — | | |
Year Ended 12/31/18 | | $ | 17.07 | | | | 0.05 | | | | (3.42 | ) | | | (3.37 | ) | | | — | (g) | | | (0.64 | ) | |
Year Ended 12/31/17 | | $ | 12.17 | | | | — | (g) | | | 4.97 | | | | 4.97 | | | | (0.07 | ) | | | — | | |
Year Ended 12/31/16 | | $ | 11.20 | | | | (0.01 | ) | | | 1.05 | | | | 1.04 | | | | (0.11 | ) | | | — | | |
Year Ended 12/31/15 | | $ | 13.43 | | | | (0.02 | ) | | | (1.82 | ) | | | (1.84 | ) | | | — | | | | (0.39 | ) | |
Year Ended 12/31/14 | | $ | 15.43 | | | | (0.03 | ) | | | (0.64 | ) | | | (0.67 | ) | | | (0.08 | ) | | | (1.25 | ) | |
Class R | |
Six Months Ended
6/30/19 (unaudited) | | $ | 16.37 | | | | 0.08 | | | | 1.72 | | | | 1.80 | | | | — | | | | — | | |
Year Ended 12/31/18 | | $ | 21.18 | | | | 0.18 | | | | (4.26 | ) | | | (4.08 | ) | | | (0.09 | ) | | | (0.64 | ) | |
Year Ended 12/31/17 | | $ | 15.03 | | | | 0.09 | | | | 6.17 | | | | 6.26 | | | | (0.11 | ) | | | — | | |
Year Ended 12/31/16 | | $ | 13.76 | | | | 0.07 | | | | 1.30 | | | | 1.37 | | | | (0.14 | ) | | | — | | |
Year Ended 12/31/15 | | $ | 16.31 | | | | 0.05 | | | | (2.21 | ) | | | (2.16 | ) | | | — | | | | (0.39 | ) | |
Year Ended 12/31/14 | | $ | 18.44 | | | | 0.07 | | | | (0.79 | ) | | | (0.72 | ) | | | (0.16 | ) | | | (1.25 | ) | |
Class R6 | |
Six Months Ended
6/30/19 (unaudited) | | $ | 17.68 | | | | 0.20 | | | | 1.81 | | | | 2.01 | | | | — | | | | — | | |
Year Ended 12/31/18 | | $ | 22.81 | | | | 0.34 | | | | (4.62 | ) | | | (4.28 | ) | | | (0.21 | ) | | | (0.64 | ) | |
Year Ended 12/31/17 | | $ | 16.16 | | | | 0.34 | | | | 6.57 | | | | 6.91 | | | | (0.26 | ) | | | — | | |
November 15, 2016(i)
through 12/31/16 | | $ | 15.91 | | | | 0.04 | | | | 0.25 | | | | 0.29 | | | | (0.04 | ) | | | — | | |
Class Y | |
Six Months Ended
6/30/19 (unaudited) | | $ | 17.54 | | | | 0.15 | | | | 1.83 | | | | 1.98 | | | | — | | | | — | | |
Year Ended 12/31/18 | | $ | 22.64 | | | | 0.35 | | | | (4.61 | ) | | | (4.26 | ) | | | (0.20 | ) | | | (0.64 | ) | |
Year Ended 12/31/17 | | $ | 16.05 | | | | 0.21 | | | | 6.62 | | | | 6.83 | | | | (0.24 | ) | | | — | | |
Year Ended 12/31/16 | | $ | 14.61 | | | | 0.18 | | | | 1.37 | | | | 1.55 | | | | (0.15 | ) | | | — | | |
Year Ended 12/31/15 | | $ | 17.22 | | | | 0.15 | | | | (2.34 | ) | | | (2.19 | ) | | | (0.03 | ) | | | (0.39 | ) | |
Year Ended 12/31/14 | | $ | 19.38 | | | | 0.20 | | | | (0.83 | ) | | | (0.63 | ) | | | (0.28 | ) | | | (1.25 | ) | |
(a) Per share net investment income (loss) has been calculated using the average daily shares method.
(b) Not annualized for periods less than one year.
(c) Annualized for periods less than one year.
(d) During the period, certain fees were reduced and/or reimbursed. If such fee reductions and/or reimbursements had not occurred, the ratios would have been as indicated.
(e) Portfolio turnover is calculated on the basis of the Fund as a whole without distinguishing between the classes of shares issued.
See notes to financial statements.
44
Victory Portfolios | | Financial Highlights — continued | |
For a Share Outstanding Throughout Each Period
| | | | Ratios to Average Net Assets | | Supplemental Data | |
| | | Total
Distributions
to
Shareholders | | Capital
Contributions
from Prior
Custodian, Net
(See Note 8) | | Net Asset
Value,
End of
Period | | Total
Return
(Excludes
Sales
Charge)(b) | | Net
Expenses(c) | | Net
Investment
Income
(Loss)(c) | | Gross
Expenses(c)(d) | | Net Assets,
End of
Period
(000's) | | Portfolio
Turnover(b)(e) | |
Victory Sophus Emerging Markets Fund | |
Class A | |
Six Months Ended
6/30/19 (unaudited) | | | — | | | | — | | | $ | 19.39 | | | | 11.12 | % | | | 1.34 | % | | | 1.20 | % | | | 1.62 | % | | $ | 62,150 | | | | 57 | % | |
Year Ended 12/31/18 | | | (0.77 | ) | | | — | | | $ | 17.45 | | | | (19.08 | )% | | | 1.34 | % | | | 1.11 | % | | | 1.61 | % | | $ | 56,823 | | | | 118 | % | |
Year Ended 12/31/17 | | | (0.17 | ) | | | — | | | $ | 22.52 | | | | 42.08 | % | | | 1.54 | % | | | 0.80 | % | | | 1.66 | % | | $ | 76,485 | | | | 113 | % | |
Year Ended 12/31/16 | | | (0.15 | ) | | | 0.04 | | | $ | 15.98 | | | | 10.50 | %(f) | | | 1.65 | % | | | 0.73 | % | | | 1.67 | % | | $ | 61,767 | | | | 120 | % | |
Year Ended 12/31/15 | | | (0.39 | ) | | | — | | | $ | 14.60 | | | | (12.94 | )% | | | 1.57 | % | | | 0.60 | % | | | 1.57 | % | | $ | 74,837 | | | | 111 | % | |
Year Ended 12/31/14 | | | (1.42 | ) | | | — | | | $ | 17.22 | | | | (3.54 | )% | | | 1.65 | % | | | 0.62 | % | | | 1.69 | % | | $ | 123,778 | | | | 138 | % | |
Class C | |
Six Months Ended
6/30/19 (unaudited) | | | — | | | | — | | | $ | 14.46 | | | | 10.72 | % | | | 2.14 | % | | | 0.26 | % | | | 2.48 | % | | $ | 7,802 | | | | 57 | % | |
Year Ended 12/31/18 | | | (0.64 | ) | | | — | | | $ | 13.06 | | | | (19.75 | )% | | | 2.14 | % | | | 0.31 | % | | | 2.40 | % | | $ | 10,141 | | | | 118 | % | |
Year Ended 12/31/17 | | | (0.07 | ) | | | — | | | $ | 17.07 | | | | 40.96 | % | | | 2.34 | % | | | — | (h) | | | 2.46 | % | | $ | 15,854 | | | | 113 | % | |
Year Ended 12/31/16 | | | (0.11 | ) | | | 0.04 | | | $ | 12.17 | | | | 9.62 | %(f) | | | 2.45 | % | | | (0.09 | )% | | | 2.48 | % | | $ | 12,273 | | | | 120 | % | |
Year Ended 12/31/15 | | | (0.39 | ) | | | — | | | $ | 11.20 | | | | (13.68 | )% | | | 2.38 | % | | | (0.19 | )% | | | 2.38 | % | | $ | 15,096 | | | | 111 | % | |
Year Ended 12/31/14 | | | (1.33 | ) | | | — | | | $ | 13.43 | | | | (4.25 | )% | | | 2.45 | % | | | (0.18 | )% | | | 2.45 | % | | $ | 21,416 | | | | 138 | % | |
Class R | |
Six Months Ended
6/30/19 (unaudited) | | | — | | | | — | | | $ | 18.17 | | | | 11.00 | % | | | 1.58 | % | | | 0.94 | % | | | 1.94 | % | | $ | 13,442 | | | | 57 | % | |
Year Ended 12/31/18 | | | (0.73 | ) | | | — | | | $ | 16.37 | | | | (19.24 | )% | | | 1.58 | % | | | 0.89 | % | | | 1.91 | % | | $ | 12,505 | | | | 118 | % | |
Year Ended 12/31/17 | | | (0.11 | ) | | | — | | | $ | 21.18 | | | | 41.69 | % | | | 1.83 | % | | | 0.50 | % | | | 2.00 | % | | $ | 17,875 | | | | 113 | % | |
Year Ended 12/31/16 | | | (0.14 | ) | | | 0.04 | | | $ | 15.03 | | | | 10.26 | %(f) | | | 1.87 | % | | | 0.50 | % | | | 1.87 | % | | $ | 15,923 | | | | 120 | % | |
Year Ended 12/31/15 | | | (0.39 | ) | | | — | | | $ | 13.76 | | | | (13.23 | )% | | | 1.87 | % | | | 0.33 | % | | | 1.87 | % | | $ | 18,648 | | | | 111 | % | |
Year Ended 12/31/14 | | | (1.41 | ) | | | — | | | $ | 16.31 | | | | (3.81 | )% | | | 1.94 | % | | | 0.36 | % | | | 1.94 | % | | $ | 24,143 | | | | 138 | % | |
Class R6 | |
Six Months Ended
6/30/19 (unaudited) | | | — | | | | — | | | $ | 19.69 | | | | 11.37 | % | | | 0.89 | % | | | 2.08 | % | | | 1.20 | % | | $ | 59,783 | | | | 57 | % | |
Year Ended 12/31/18 | | | (0.85 | ) | | | — | | | $ | 17.68 | | | | (18.73 | )% | | | 0.89 | % | | | 1.59 | % | | | 1.24 | % | | $ | 29,228 | | | | 118 | % | |
Year Ended 12/31/17 | | | (0.26 | ) | | | — | | | $ | 22.81 | | | | 42.77 | % | | | 1.03 | % | | | 1.66 | % | | | 1.39 | % | | $ | 18,762 | | | | 113 | % | |
November 15, 2016(i)
through 12/31/16 | | | (0.04 | ) | | | — | | | $ | 16.16 | | | | 1.81 | %(f) | | | 1.16 | % | | | 1.79 | % | | | 21.70 | % | | $ | 64 | | | | 120 | % | |
Class Y | |
Six Months Ended
6/30/19 (unaudited) | | | — | | | | — | | | $ | 19.52 | | | | 11.29 | % | | | 0.99 | % | | | 1.59 | % | | | 1.27 | % | | $ | 233,605 | | | | 57 | % | |
Year Ended 12/31/18 | | | (0.84 | ) | | | — | | | $ | 17.54 | | | | (18.77 | )% | | | 0.99 | % | | | 1.64 | % | | | 1.30 | % | | $ | 178,132 | | | | 118 | % | |
Year Ended 12/31/17 | | | (0.24 | ) | | | — | | | $ | 22.64 | | | | 42.59 | % | | | 1.18 | % | | | 1.07 | % | | | 1.33 | % | | $ | 100,902 | | | | 113 | % | |
Year Ended 12/31/16 | | | (0.15 | ) | | | 0.04 | | | $ | 16.05 | | | | 10.86 | %(f) | | | 1.32 | % | | | 1.17 | % | | | 1.38 | % | | $ | 60,277 | | | | 120 | % | |
Year Ended 12/31/15 | | | (0.42 | ) | | | — | | | $ | 14.61 | | | | (12.73 | )% | | | 1.30 | % | | | 0.89 | % | | | 1.30 | % | | $ | 98,634 | | | | 111 | % | |
Year Ended 12/31/14 | | | (1.53 | ) | | | — | | | $ | 17.22 | | | | (3.18 | )% | | | 1.31 | % | | | 1.03 | % | | | 1.31 | % | | $ | 124,357 | | | | 138 | % | |
(f) The Fund received monies related to a nonrecurring refund from the prior Custodian. The corresponding impact to the total return was less than 1.45% for the period shown. (See Note 8).
(g) Amount is less than $0.005 per share.
(h) Amount is less than 0.005%.
(i) Commencement of operations.
See notes to financial statements.
45
Victory Portfolios | | Financial Highlights | |
For a Share Outstanding Throughout Each Period
| | | | Investment Activities | | Distributions to
Shareholders From | | Distributions to
Shareholders From | |
| | | Net Asset
Value,
Beginning of
Period | | Net
Investment
Income (Loss)(a) | | Net Realized
and Unrealized
Gains (Losses)
on Investments | | Total from
Investment
Activities | | Net
Investment
Income | | Net Realized
Gains from
Investments | | Return of
Capital | | Total
Distributions
to
Shareholders | |
Victory Sophus Emerging Markets Small Cap Fund | |
Class A | |
Six Months Ended
6/30/19 (unaudited) | | $ | 6.07 | | | | 0.03 | | | | 0.80 | | | | 0.83 | | | | — | | | | — | | | | — | | | | — | | |
Year Ended 12/31/18 | | $ | 10.13 | | | | 0.04 | | | | (2.27 | ) | | | (2.23 | ) | | | — | | | | (1.83 | ) | | | — | | | | (1.83 | ) | |
Year Ended 12/31/17 | | $ | 9.75 | | | | 0.12 | | | | 3.86 | | | | 3.98 | | | | (0.12 | ) | | | (3.48 | ) | | | — | | | | (3.60 | ) | |
Year Ended 12/31/16 | | $ | 9.69 | | | | 0.04 | | | | 0.02 | | | | 0.06 | | | | — | | | | — | | | | — | | | | — | | |
Year Ended 12/31/15 | | $ | 10.31 | | | | 0.01 | | | | (0.63 | ) | | | (0.62 | ) | | | — | | | | — | | | | — | | | | — | | |
January 31, 2014(g)
through 12/31/14 | | $ | 10.00 | | | | 0.03 | | | | 0.28 | | | | 0.31 | | | | — | | | | — | | | | — | | | | — | | |
Class C | |
Six Months Ended
6/30/19 (unaudited) | | $ | 5.53 | | | | 0.01 | | | | 0.72 | | | | 0.73 | | | | — | | | | — | | | | — | | | | — | | |
Year Ended 12/31/18 | | $ | 9.51 | | | | 0.01 | | | | (2.16 | ) | | | (2.15 | ) | | | — | | | | (1.83 | ) | | | — | | | | (1.83 | ) | |
Year Ended 12/31/17 | | $ | 9.34 | | | | (0.02 | ) | | | 3.75 | | | | 3.73 | | | | (0.08 | ) | | | (3.48 | ) | | | — | | | | (3.56 | ) | |
Year Ended 12/31/16 | | $ | 9.56 | | | | (0.02 | ) | | | (0.20 | ) | | | (0.22 | ) | | | — | | | | — | | | | — | | | | — | | |
Year Ended 12/31/15 | | $ | 10.23 | | | | (0.05 | ) | | | (0.62 | ) | | | (0.67 | ) | | | — | | | | — | | | | — | | | | — | | |
January 31, 2014(g)
through 12/31/14 | | $ | 10.00 | | | | (0.04 | ) | | | 0.27 | | | | 0.23 | | | | — | | | | — | | | | — | | | | — | | |
Class Y | |
Six Months Ended
6/30/19 (unaudited) | | $ | 6.05 | | | | 0.04 | | | | 0.80 | | | | 0.84 | | | | — | | | | — | | | | — | | | | — | | |
Year Ended 12/31/18 | | $ | 10.08 | | | | 0.09 | | | | (2.29 | ) | | | (2.20 | ) | | | — | | | | (1.83 | ) | | | — | | | | (1.83 | ) | |
Year Ended 12/31/17 | | $ | 9.75 | | | | 0.15 | | | | 3.87 | | | | 4.02 | | | | (0.21 | ) | | | (3.48 | ) | | | — | | | | (3.69 | ) | |
Year Ended 12/31/16 | | $ | 9.74 | | | | 0.06 | | | | 0.02 | | | | 0.08 | | | | (0.07 | ) | | | — | | | | — | | | | (0.07 | ) | |
Year Ended 12/31/15 | | $ | 10.32 | | | | 0.06 | | | | (0.64 | ) | | | (0.58 | ) | | | — | | | | — | | | | — | | | | — | | |
January 31, 2014(g)
through 12/31/14 | | $ | 10.00 | | | | 0.08 | | | | 0.26 | | | | 0.34 | | | | (0.02 | ) | | | — | | | | — | (h) | | | (0.02 | ) | |
(a) Per share net investment income (loss) has been calculated using the average daily shares method.
(b) Not annualized for periods less than one year.
(c) Annualized for periods less than one year.
(d) During the period, certain fees were reduced and/or reimbursed. If such fee reductions and/or reimbursements had not occurred, the ratios would have been as indicated.
(e) Portfolio turnover is calculated on the basis of the Fund as a whole without distinguishing between the classes of shares issued.
(f) Portfolio turnover increased due to change within portfolio holdings during the year.
(g) Commencement of operations.
(h) Amount is less than $0.005 per share.
See notes to financial statements.
46
Victory Portfolios | | Financial Highlights — continued | |
For a Share Outstanding Throughout Each Period
| | | | Ratios to Average Net Assets | | Supplemental Data | |
| | | Net Asset
Value,
End of
Period | | Total
Return
(Excludes
Sales
Charge)(b) | | Net
Expenses(c) | | Net
Investment
Income
(Loss)(c) | | Gross
Expenses(c)(d) | | Net Assets,
End of
Period
(000's) | | Portfolio
Turnover(b)(e) | |
Victory Sophus Emerging Markets Small Cap Fund | |
Class A | |
Six Months Ended
6/30/19 (unaudited) | | $ | 6.90 | | | | 13.67 | % | | | 1.75 | % | | | 0.94 | % | | | 7.96 | % | | $ | 306 | | | | 59 | % | |
Year Ended 12/31/18 | | $ | 6.07 | | | | (21.76 | )% | | | 1.75 | % | | | 0.39 | % | | | 5.77 | % | | $ | 334 | | | | 200 | % | |
Year Ended 12/31/17 | | $ | 10.13 | | | | 42.55 | % | | | 1.75 | % | | | 1.07 | % | | | 2.94 | % | | $ | 1,456 | | | | 227 | %(f) | |
Year Ended 12/31/16 | | $ | 9.75 | | | | 0.62 | % | | | 1.75 | % | | | 0.44 | % | | | 2.29 | % | | $ | 2,552 | | | | 141 | % | |
Year Ended 12/31/15 | | $ | 9.69 | | | | (6.01 | )% | | | 1.92 | % | | | 0.08 | % | | | 2.44 | % | | $ | 5,083 | | | | 107 | % | |
January 31, 2014(g)
through 12/31/14 | | $ | 10.31 | | | | 3.10 | % | | | 1.88 | % | | | 0.30 | % | | | 2.29 | % | | $ | 6,808 | | | | 110 | % | |
Class C | |
Six Months Ended
6/30/19 (unaudited) | | $ | 6.26 | | | | 13.20 | % | | | 2.50 | % | | | 0.26 | % | | | 13.19 | % | | $ | 148 | | | | 59 | % | |
Year Ended 12/31/18 | | $ | 5.53 | | | | (22.31 | )% | | | 2.51 | % | | | 0.11 | % | | | 13.96 | % | | $ | 112 | | | | 200 | % | |
Year Ended 12/31/17 | | $ | 9.51 | | | | 41.68 | % | | | 2.50 | % | | | (0.21 | )% | | | 32.34 | % | | $ | 99 | | | | 227 | %(f) | |
Year Ended 12/31/16 | | $ | 9.34 | | | | (2.30 | )% | | | 2.50 | % | | | (0.18 | )% | | | 3.12 | % | | $ | 24 | | | | 141 | % | |
Year Ended 12/31/15 | | $ | 9.56 | | | | (6.55 | )% | | | 2.54 | % | | | (0.50 | )% | | | 3.05 | % | | $ | 2,617 | | | | 107 | % | |
January 31, 2014(g)
through 12/31/14 | | $ | 10.23 | | | | 2.30 | % | | | 2.69 | % | | | (0.43 | )% | | | 3.10 | % | | $ | 2,586 | | | | 110 | % | |
Class Y | |
Six Months Ended
6/30/19 (unaudited) | | $ | 6.89 | | | | 13.88 | % | | | 1.50 | % | | | 1.27 | % | | | 3.87 | % | | $ | 4,980 | | | | 59 | % | |
Year Ended 12/31/18 | | $ | 6.05 | | | | (21.57 | )% | | | 1.51 | % | | | 0.94 | % | | | 3.82 | % | | $ | 3,890 | | | | 200 | % | |
Year Ended 12/31/17 | | $ | 10.08 | | | | 43.02 | % | | | 1.50 | % | | | 1.32 | % | | | 2.13 | % | | $ | 5,685 | | | | 227 | %(f) | |
Year Ended 12/31/16 | | $ | 9.75 | | | | 0.79 | % | | | 1.50 | % | | | 0.62 | % | | | 1.98 | % | | $ | 17,261 | | | | 141 | % | |
Year Ended 12/31/15 | | $ | 9.74 | | | | (5.62 | )% | | | 1.50 | % | | | 0.53 | % | | | 2.01 | % | | $ | 17,581 | | | | 107 | % | |
January 31, 2014(g)
through 12/31/14 | | $ | 10.32 | | | | 3.45 | % | | | 1.50 | % | | | 0.76 | % | | | 1.91 | % | | $ | 18,440 | | | | 110 | % | |
See notes to financial statements.
47
Victory Portfolios | | Notes to Financial Statements
June 30, 2019 | |
(Unaudited)
1. Organization:
Victory Portfolios (the "Trust") was organized on December 6, 1995 as a Delaware statutory trust as a successor to a company named "The Victory Portfolios," which was organized as a Massachusetts business trust on February 5, 1986. The Trust is registered under the Investment Company Act of 1940, as amended (the "1940 Act"), as an open-end investment company. The Trust is comprised of 42 funds and is authorized to issue an unlimited number of shares, which are units of beneficial interest with a par value of $0.001 per share. Each Fund is classified as diversified under the 1940 Act.
The accompanying financial statements are those of the following four Funds (collectively, the "Funds" and individually, a "Fund").
Funds (Legal Name) | | Funds (Short Name) | | Investment Share
Classes Offered | |
Victory RS International Fund | | RS International Fund | | Classes A, C, R, R6 and Y | |
Victory RS Global Fund | | RS Global Fund | | Classes A, C, R, R6 and Y | |
Victory Sophus Emerging
Markets Fund | | Sophus Emerging Markets Fund
| | Classes A, C, R, R6 and Y
| |
Victory Sophus Emerging
Markets Small Cap Fund | | Sophus Emerging Markets
Small Cap Fund | | Classes A, C and Y
| |
Each class of shares of a Fund has substantially identical rights and privileges except with respect to sales charges, fees paid under distribution plans, expenses allocable exclusively to each class of shares, voting rights on matters solely affecting a single class of shares, and the exchange privilege of each class of shares.
Under the Trust's organizational documents, its officers and trustees are indemnified against certain liabilities arising out of the performance of their duties to the Funds. In addition, in the normal course of business, the Funds enter into contracts with their vendors and others that provide for general indemnifications. The Funds' maximum exposure under these arrangements is unknown, as this would involve future claims that may be made against the Funds. However, based on experience, the Funds expect that risk of loss to be remote.
2. Significant Accounting Policies:
The following is a summary of significant accounting policies followed by the Trust in the preparation of its financial statements. The policies are in conformity with accounting principles generally accepted in the United States of America ("GAAP"). The preparation of financial statements in accordance with GAAP requires management to make estimates and assumptions that affect the reported amounts of assets and liabilities and disclosure of contingent assets and liabilities at the date of the financial statements and the reported amounts of income and expenses for the period. Actual results could differ from those estimates. The Funds follow the specialized accounting and reporting requirements under GAAP that are applicable to investment companies.
Investment Valuation:
The Funds record investments at fair value. Fair value is defined as the price that would be received to sell an asset or paid to transfer a liability in an orderly transaction between market participants at the measurement date.
The valuation techniques described below maximize the use of observable inputs and minimize the use of unobservable inputs in determining fair value. The inputs used for valuing the Funds' investments are summarized in the three broad levels listed below:
• Level 1 — quoted prices in active markets for identical securities
• Level 2 — other significant observable inputs (including quoted prices for similar securities or interest rates applicable to those securities, etc.)
• Level 3 — significant unobservable inputs (including the Funds' own assumptions in determining the fair value of investments)
48
Victory Portfolios | | Notes to Financial Statements — continued
June 30, 2019 | |
(Unaudited)
Changes in valuation techniques may result in transfers in or out of an assigned level within the disclosure hierarchy. The inputs or methodologies used for valuation techniques are not necessarily an indication of the risk associated with entering into those investments.
Portfolio securities listed or traded on securities exchanges, including American Depositary Receipts ("ADRs") and Rights, are valued at the closing price on the exchange or system where the security is principally traded, if available, or at the Nasdaq Official Closing Price. If there have been no sales for that day on the exchange or system, then a security is valued at the last available bid quotation on the exchange or system where the security is principally traded. In each of these situations, valuations are typically categorized as Level 1 in the fair value hierarchy.
Investments for which there are no such quotations, or for which quotations do not appear reliable, are valued at fair value in accordance with procedures established by and under the general supervision and responsibility of the Trust's Board of Trustees (the "Board"). These valuations are typically categorized as Level 2 or Level 3 in the fair value hierarchy, based on the observability of inputs used to determine the fair value.
In accordance with procedures adopted by the Board, fair value pricing may be used if events materially affecting the value of foreign securities occur between the time the exchange on which they are traded closes and the time the Funds' net asset values are calculated. The Funds use a systematic valuation model, provided daily by an independent third party to fair value their international equity securities. These valuations are considered as Level 2 in the fair value hierarchy.
A summary of the valuations as of June 30, 2019, based upon the three levels defined above, is included in the table below while the breakdown, by category, of investments is disclosed in the Schedules of Portfolio Investments:
| | | LEVEL 1 —
Quoted Prices | | LEVEL 2 —
Other Significant
Observable Inputs | | LEVEL 3 —
Other Significant
Unobservable Inputs | | Total | |
| | | Investments in
Securities | | Investments in
Securities | | Investments in
Securities | | Investments in
Securities | |
RS International Fund | |
Common Stocks | | $ | — | | | $ | 48,361,985 | | | $ | — | | | $ | 48,361,985 | | |
Preferred Stocks | | | — | | | | 292,161 | | | | — | | | | 292,161 | | |
Exchange-Traded Funds | | | 679,385 | | | | — | | | | — | | | | 679,385 | | |
Collateral for Securities
Loaned | | | 24,251 | | | | — | | | | — | | | | 24,251 | | |
Total | | | 703,636 | | | | 48,654,146 | | | | — | | | | 49,357,782 | | |
RS Global Fund | |
Common Stocks | | | 30,737,883 | | | | 23,323,799 | | | | — | | | | 54,061,682 | | |
Preferred Stocks | | | 422,308 | | | | — | | | | — | | | | 422,308 | | |
Exchange-Traded Funds | | | 82,703 | | | | — | | | | — | | | | 82,702 | | |
Total | | | 31,242,894 | | | | 23,323,799 | | | | — | | | | 54,566,692 | | |
Sophus Emerging Markets Fund | |
Common Stocks | | | 86,945,949 | | | | 273,545,860 | | | | — | | | | 360,491,809 | | |
Preferred Stocks | | | 6,648,094 | | | | — | | | | — | | | | 6,648,094 | | |
Collateral for Securities
Loaned | | | 8,540,804 | | | | — | | | | — | | | | 8,540,804 | | |
Total | | | 102,134,847 | | | | 273,545,860 | | | | — | | | | 375,680,707 | | |
Sophus Emerging Markets Small Cap Fund | |
Common Stocks | | | 872,165 | | | | 4,341,914 | | | | 34,055 | | | | 5,248,134 | | |
Preferred Stocks | | | 40,970 | | | | — | | | | — | | | | 40,970 | | |
Collateral for Securities
Loaned | | | 37,232 | | | | — | | | | — | | | | 37,232 | | |
Total | | | 950,367 | | | | 4,341,914 | | | | 34,055 | | | | 5,326,336 | | |
49
Victory Portfolios | | Notes to Financial Statements — continued
June 30, 2019 | |
(Unaudited)
The following is a reconciliation of assets in which significant unobservable inputs (Level 3) were used in determining fair value:
Investment in Securities | | Sophus Emerging
Markets Small Cap Fund | |
Balance as of December 31, 2018 | | $ | — | | |
Accrued discount (premium) | | | — | | |
Realized Gain (Loss) | | | — | | |
Change in Unrealized Appreciation/Depreciation | | | — | | |
Purchases | | | — | | |
Sales Proceeds | | | — | | |
Transfers into Level 3 | | | 34,055 | | |
Transfers out of Level 3 | | | — | | |
Balance as of June 30, 2019 | | $ | 34,055 | | |
The following is a summary of quantitative information about Level 3 Fair Value Measurements:
Sophus Emerging
Markets Small Cap
Fund | | Fair Value as of
June 30, 2019* | | Valuation
Techniques | | Unobservable
Input | | Input
Values | | Impact to valuation
from an increase to
input | |
Common Stock
| | $ | 34,055
| | | Market
| | Premium/Discount
| | Market
Transactions
| | Any change
to the premium
or discount would
result in direct
and proportional
changes in the
fair value of the
security. | |
* Level 3 securities are typically valued by the Adviser, pursuant to fair valuation procedures approved by the Board of Trustees. The appropriateness of fair values for these securities is monitored on an ongoing basis, by the Adviser, which may include back testing, results of vendor due diligence, audited financial information, unchanged price review and consideration of market and/or sector events.
Real Estate Investment Trusts ("REITS"):
The Funds may invest in REITS which report information on the source of their distributions annually. REITS are pooled investment vehicles that invest primarily in income producing real estate or real estate related loans or interests (such as mortgages). Certain distributions received from REITS during the year are recorded as realized gains or return of capital as estimated by the Funds or when such information becomes known.
Foreign Exchange Currency Contracts:
The Funds may enter into foreign exchange currency contracts to convert U.S. dollars to and from various foreign currencies. A foreign exchange currency contract is an obligation by a Fund to purchase or sell a specific currency at a future date at a price (in U.S. dollars) set at the time of the contract. The Funds do not engage in "cross-currency" foreign exchange contracts (i.e., contracts to purchase or sell one foreign currency in exchange for another foreign currency). The Funds' foreign exchange currency contracts might be considered spot contracts (typically a contract of one week or less) or forward contracts (typically a contract term over one week). A spot contract is entered into for purposes of hedging against foreign currency fluctuations relating to a specific portfolio transaction, such as the delay between a security transaction trade date and settlement date. Forward contracts are entered into for purposes of hedging portfolio holdings or concentrations of such holdings. Each foreign exchange currency contract is adjusted daily by the prevailing spot or forward rate of the underlying currency, and any appreciation or depreciation is recorded for financial statement purposes as unrealized until the contract settlement date, at which time the Fund records realized gains or losses equal to the difference between the value of a contract at the time it was opened and the value at the time it was closed. A Fund could be exposed to risk if a counterparty is unable to meet the terms of a foreign exchange currency contract or if the value of the foreign currency changes unfavorably. In
50
Victory Portfolios | | Notes to Financial Statements — continued
June 30, 2019 | |
(Unaudited)
addition, the use of foreign exchange currency contracts does not eliminate fluctuations in the underlying prices of the securities. As of June 30, 2019, the Funds had no open forward foreign exchange currency contracts.
Investment Transactions and Related Income:
Changes in holdings of investments are accounted for no later than one business day following the trade date. For financial reporting purposes, however, investment transactions are accounted for on trade date on the last business day of the reporting period. Interest income is determined on the basis of coupon interest accrued using the effective interest method which adjusts, where applicable, the amortization of premiums or accretion of discounts. Dividend income is recorded on the ex-dividend date. Gains or losses realized on sales of securities are determined by comparing the identified cost of the security lot sold with the net sales proceeds.
Withholding taxes on interest, dividends and gains as a result of certain investments in ADRs by the Funds have been provided for in accordance with each investment's applicable country's tax rules and rates.
Securities Lending:
The Trust has entered into a Master Securities Lending Agreement ("MSLA") with Citibank, N.A. ("Citibank" or the "Agent"). Under the terms of the MSLA, the Funds may lend securities to certain broker-dealers and banks in exchange for collateral in the amount of at least 102% of the value of U.S. securities loaned or at least 105% of the value of non-U.S. securities loaned, marked-to-market daily. Any collateral shortfalls associated with increases in the valuation of the securities loaned are adjusted the next business day. The collateral can be received in the form of cash collateral and/or non-cash collateral. Non-cash collateral can include U.S. Government Securities, letters of credit and certificates of deposit. The cash collateral is invested in short-term instruments or cash equivalents as noted, primarily open-end investment companies, in the Funds' Schedules of Portfolio Investments. The Trust does not have effective control of the non-cash collateral and therefore it is not disclosed in the Funds' Schedules of Portfolio Investments. During the time portfolio securities are on loan, the borrower will pay the Funds any dividends or interest paid on such securities plus any fee negotiated between the parties to the lending agreement. The Funds also earn a return from the collateral. The Funds pay the Agent various fees in connection with the investment of cash collateral and fees based on the investment income received from securities lending activities. Securities lending income (net of these fees) is disclosed on the Statements of Operations. Although risk is mitigated by the collateral, the Funds could experience a delay in recovering their securities and possible loss of income or value if the borrower fails to return them.
Securities lending transactions are entered into by a Fund under the MSLA, which permits the Fund, under certain circumstances such as an event of default, to offset amounts payable by the Fund to the same counterparty against amounts receivable from the counterparty to create a net payment due to or from the Fund.
The following table is a summary of the Funds' securities lending transactions which are subject to offset under the MSLA as of June 30, 2019. These transactions are accounted for as secured borrowings with an overnight and continuous contractual maturity for cash collateral, and greater than overnight and continuous contractual maturity for non-cash collateral.
| | | Gross
Amount of
Recognized
Assets
(Value of | | Value of
Cash | | Value of Non-cash Collateral
Received by Maturity | | | |
| | | Securities
on Loan) | | Collateral
Received* | | <30 Days | | Between
30 & 90 days | | >90 Days | | Net Amount | |
RS International Fund | | $ | 23,167 | | | $ | 23,167 | | | $ | — | | | $ | — | | | $ | — | | | $ | — | | |
Sophus Emerging
Markets Fund | | | 8,352,549 | | | | 8,352,549 | | | | — | | | | — | | | | — | | | | — | | |
Sophus Emerging Markets
Small Cap Fund | | | 36,398 | | | | 36,398 | | | | — | | | | — | | | | — | | | | — | | |
* Collateral received in excess of the market value of securities on loan is not presented in this table. The total cash collateral received by each Fund is disclosed in the Statements of Assets and Liabilities.
51
Victory Portfolios | | Notes to Financial Statements — continued
June 30, 2019 | |
(Unaudited)
Foreign Currency Translations:
The accounting records of the Funds are maintained in U.S. dollars. Investment securities and other assets and liabilities of a Fund denominated in a foreign currency are translated into U.S. dollars at current exchange rates. Purchases and sales of securities, income receipts and expense payments are translated into U.S. dollars at the exchange rates on the date of the transactions. The Funds do not isolate the portion of the results of operations resulting from changes in foreign exchange rates on investments from fluctuations arising from changes in market prices of securities held. Such fluctuations are disclosed as net change in unrealized appreciation/depreciation on investments and foreign currency translations on the Statements of Operations. Any realized gains or losses from these fluctuations are disclosed as net realized gains or losses from investment securities and foreign currency translations on the Statements of Operations.
Foreign Taxes:
The Funds may be subject to foreign taxes related to foreign income received (a portion of which may be reclaimable), capital gains on the sale of securities, and certain foreign currency transactions. All foreign taxes are recorded in accordance with the applicable regulations and rates that exist in the foreign jurisdictions in which the Funds invest.
Distributions to Shareholders:
Dividends from net investment income, if any, are declared and paid annually for the Funds. Distributable net realized gains, if any, are declared and distributed at least annually from each Fund.
The amounts of dividends from net investment income and distributions from net realized gains (collectively distributions to shareholders) are determined in accordance with federal income tax regulations, which may differ from GAAP. To the extent these "book/tax" differences are permanent in nature (e.g., net operating loss and distribution reclassification), such amounts are reclassified within the components of net assets based on their federal tax-basis treatment; temporary differences (e.g., wash sales) do not require reclassification. To the extent dividends and distributions exceed net investment income and net realized gains for tax purposes, they are reported as distributions of capital. Net investment losses incurred by a Fund may be reclassified as an offset to capital on the accompanying Statements of Assets and Liabilities.
Federal Income Taxes:
It is the policy of each Fund to continue to qualify as a regulated investment company by complying with the provisions available to certain investment companies, as defined in applicable sections of the Internal Revenue Code, and to make distributions of net investment income and net realized gains sufficient to relieve it from all, or substantially all, federal income taxes. Accordingly, no provision for federal income taxes is required in the financial statements. The Funds have a tax year end of December 31.
Management of the Funds has reviewed tax positions taken in tax years that remain subject to examination by all major tax jurisdictions, including federal (i.e., all open tax years and the interim tax period since then). Management believes that there is no tax liability resulting from unrecognized tax benefits related to uncertain tax positions taken.
Allocations:
Expenses directly attributable to a Fund are charged to the Fund, while expenses which are attributable to more than one fund in the Trust, or jointly with an affiliated trust, are allocated among the respective funds in the Trust and/or affiliated trust based upon net assets or another appropriate basis.
Income, expenses (other than class-specific expenses such as transfer agent fees, state registration fees, printing and 12b-1 fees), and realized and unrealized gains or losses on investments are allocated to each class of shares based on its relative net assets on the date income is earned or expenses and realized and unrealized gains and losses are incurred.
52
Victory Portfolios | | Notes to Financial Statements — continued
June 30, 2019 | |
(Unaudited)
Affiliated Securities Transactions:
Pursuant to Rule 17a-7 under the 1940 Act, the Funds may engage in securities transactions with affiliated investment companies and advisory accounts managed by the Adviser and any applicable sub-adviser. Any such purchase or sale transaction must be effected without brokerage commission or other remuneration, except for customary transfer fees. The transaction must be effected at the current market price, which is either the security's last sale price on an exchange or, if there are no transactions in the security that day, at the average of the highest bid and lowest asked price. For the six months ended June 30, 2019, the Funds did not engage in any Rule 17a-7 transactions under the 1940 Act.
3. Purchases and Sales of Securities:
Purchases and sales of securities (excluding securities maturing less than one year from acquisition) for the six months ended June 30, 2019 were as follows:
| | | Purchases
(excluding U.S.
Government
Securities) | | Sales
(excluding U.S.
Government
Securities) | |
RS International Fund | | $ | 27,332,244 | | | $ | 5,587,340 | | |
RS Global Fund | | | 24,131,954 | | | | 10,194,849 | | |
Sophus Emerging Markets Fund | | | 250,801,375 | | | | 193,994,067 | | |
Sophus Emerging Markets Small Cap Fund | | | 3,198,986 | | | | 2,874,922 | | |
For the six months ended June 30, 2019, there were no purchases or sales of U.S. Government Securities.
4. Fees and Transactions with Affiliates and Related Parties:
Investment advisory services are provided to the Funds by Victory Capital Management Inc. ("VCM" or the "Adviser"), a New York corporation registered as an investment adviser with the Securities and Exchange Commission ("SEC"). The Adviser is a wholly-owned indirect subsidiary of Victory Capital Holdings, Inc., a publicly traded Delaware corporation, and a wholly-owned direct subsidiary of Victory Capital Operating, LLC.
Under the terms of the Investment Advisory Agreement, the Adviser is entitled to receive fees based on a percentage of the average daily net assets of each Fund. The rates at which the Adviser is paid by each Fund are included in the table below. The Adviser may use its resources to assist with the Funds' distribution and marketing expenses.
| | | Flat Rate | |
RS International Fund | | | 0.80 | % | |
RS Global Fund | | | 0.80 | % | |
Sophus Emerging Markets Fund | | | 1.00 | % | |
Sophus Emerging Markets Small Cap Fund | | | 1.25 | % | |
VCM also serves as the Funds' administrator and fund accountant. Under an Administration and Fund Accounting Agreement, VCM is paid for its services an annual fee at a rate of 0.08% of the first $15 billion in average daily net assets of the Trust, Victory Variable Insurance Funds and Victory Portfolios II (collectively, the "Victory Funds Complex"), 0.05% of the average daily net assets above $15 billion to $30 billion of the Victory Funds Complex and 0.04% of the average daily net assets over $30 billion of the Victory Funds Complex.
Citi Fund Services Ohio, Inc. ("Citi"), an affiliate of Citibank, N.A., acts as sub-administrator and sub-fund accountant to the Funds pursuant to a Sub-Administration and Sub-Fund Accounting Services Agreement between VCM and Citi. VCM pays Citi a fee for providing these services. The Trust reimburses VCM and Citi for all of their reasonable out-of-pocket expenses incurred in providing these services.
FIS Investor Services, LLC ("FIS") serves as the Funds' transfer agent. Under the Transfer Agent Agreement, the Trust pays FIS a fee for its services and reimburses FIS for all of their reasonable out-of-pocket expenses incurred in providing these services.
53
Victory Portfolios | | Notes to Financial Statements — continued
June 30, 2019 | |
(Unaudited)
The Chief Compliance Officer ("CCO") is an employee of the Adviser, which pays the compensation of the CCO and his support staff. The Trust has entered into an Agreement to provide compliance services with the Adviser, pursuant to which the Adviser furnishes its compliance personnel, including the services of the CCO, and other resources reasonably necessary to provide the Trust with compliance oversight services related to the design, administration and oversight of a compliance program for the Trust in accordance with Rule 38a-1 under the 1940 Act. The funds in the Victory Funds Complex), in the aggregate, compensate the Adviser for these services.
The Victory Funds Complex pays an annual retainer to each Independent Trustee, plus an additional annual retainer to the Chairman of the Board. The aggregate amount of the fees and expenses of the Independent Trustees are allocated amongst all the funds in the Victory Funds Complex and are presented in the Statements of Operations.
Shearman & Sterling LLP provides legal services to the Trust.
Victory Capital Advisers, Inc. (the "Distributor"), an affiliate of the Adviser, serves as distributor for the continuous offering of the shares of the Funds pursuant to a Distribution Agreement between the Distributor and the Trust.
Pursuant to the Distribution and Service Plans adopted in accordance with Rule 12b-1 under the 1940 Act, the Distributor may receive a monthly distribution and service fee, at an annual rate of up to 0.25% of the average daily net assets of Class A Shares, at an annual rate of up to 0.50% of the average daily net assets of Class R Shares and 1.00% of the average daily net assets of Class C Shares of the Funds. The distribution and service fees paid to the Distributor may be used by the Distributor to pay for activities primarily intended to result in the sale of Class A, Class R or Class C Shares of the Funds.
In addition, the Distributor is entitled to receive commissions on sales of the Class A Shares of the Funds. For the six months ended June 30, 2019, the Distributor received approximately $7,259 from commissions earned on sales of Class A Shares of the Funds.
The Adviser has entered into expense limitation agreements with certain Funds. Under the terms of the agreements, the Adviser has agreed to waive fees or reimburse certain expenses to the extent that ordinary operating expenses incurred by certain classes of a Fund in any fiscal year exceed the expense limit for such classes of the Fund. Such excess amounts will be the liability of the Adviser. Interest, taxes, brokerage commissions, other expenditures which are capitalized in accordance with GAAP, and other extraordinary expenses not incurred in the ordinary course of a Fund's business are excluded from the expense limits. As of June 30, 2019, the expense limits (excluding voluntary waivers) are as follows:
| | | In effect January 1, 2019 until April 30, 2020 | |
| | | Class A
Shares | | Class C
Shares | | Class R
Shares | | Class R6
Shares | | Class Y
Shares | |
RS International Fund | | | 1.13 | % | | | 1.88 | % | | | 1.38 | % | | | 0.83 | % | | | 0.88 | % | |
RS Global Fund | | | 0.85 | % | | | 1.60 | % | | | 1.10 | % | | | 0.55 | % | | | 0.60 | % | |
Sophus Emerging Markets Fund | | | 1.34 | % | | | 2.14 | % | | | 1.58 | % | | | 0.89 | % | | | 0.99 | % | |
Sophus Emerging Markets Small Cap Fund | | | 1.75 | % | | | 2.50 | % | | | N/A | | | | N/A | | | | 1.50 | % | |
The Funds have agreed to repay fees and expenses that were waived or reimbursed by the Adviser for a period up to three fiscal years after such waiver or reimbursement was made to the extent such payments or repayments would not cause the expenses of a class to exceed the original expense limitation in place at the time of the waiver or reimbursement or any expense limitation agreement in place at the time of repayment. Amounts repaid to the Adviser during the six months ended, if any, are reflected on the Statements of Operations as "Recoupment of prior expenses waived/reimbursed by Adviser".
As of June 30, 2019, the following amounts are available to be repaid to the Adviser.
54
Victory Portfolios | | Notes to Financial Statements — continued
June 30, 2019 | |
(Unaudited)
| | | Expires
12/31/19 | | Expires
12/31/20 | | Expires
12/31/21 | | Expires
12/31/22 | | Total | |
RS International Fund | | $ | 54,419 | | | $ | 178,334 | | | $ | 152,046 | | | $ | 86,790 | | | $ | 471,589 | | |
RS Global Fund | | | 40,586 | | | | 181,379 | | | | 205,996 | | | | 138,648 | | | | 566,609 | | |
Sophus Emerging Markets Fund | | | 54,398 | | | | 287,244 | | | | 879,454 | | | | 504,031 | | | | 1,725,127 | | |
Sophus Emerging Markets
Small Cap Fund | | | 41,003 | | | | 157,277 | | | | 143,951 | | | | 70,148 | | | | 412,379 | | |
The Adviser, may voluntarily waive or reimburse additional fees to assist the Funds in maintaining competitive expense ratios. Voluntary waivers and reimbursements applicable to the Funds are not available to be recouped at a future time. There were no voluntary waivers or reimbursements for the six months ended June 30, 2019.
Certain officers and/or interested trustees of the Funds are also officers and/or employees of the Adviser, Administrator, Fund Accountant, Sub-Administrator, Sub-Fund Accountant, and Legal Counsel.
5. Risks:
Each Fund may be subject to other risks in addition to these identified risks.
An investment in the Funds' shares represents an indirect investment in the securities owned by the Funds, some of which will be traded on a national securities exchange or in the over-the-counter markets. The value of the securities in which the Funds invest, like other market investments, may move up or down, sometimes rapidly and unpredictably. The value of the securities in which the Funds invest may affect the value of the Funds' shares. An investment in the Funds' shares at any point in time may be worth less than the original investment, even after taking into account the reinvestment of the Funds' distributions.
The Funds will be subject to credit risk with respect to the amount each expects to receive from counterparties for financial instruments entered into by the Funds. The Funds may be negatively impacted if a counterparty becomes bankrupt or otherwise fails to perform its obligations due to financial difficulties. The Funds may experience significant delays in obtaining any recovery in bankruptcy or other reorganization proceeding and the Funds may obtain only limited recovery or may obtain no recovery in such circumstances. The Funds typically enter into transactions with counterparties whose credit ratings are investment grade, as determined by a nationally recognized statistical rating organization or, if unrated, judged by the Adviser to be of comparable quality.
6. Borrowing and Interfund Lending:
Line of Credit:
For the six months ended June 30, 2019, the Victory Funds Complex participated in a short-term, demand note "Line of Credit" agreement with Citibank. Under the agreement with Citibank, the Victory Funds Complex could borrow up to $250 million, of which $100 million was committed and $150 million was uncommitted. This agreement was in effect through July 26, 2019. Effective July 1, 2019, the current agreement was amended to include the USAA Mutual Funds Complex and has a new termination date of June 29, 2020. Under this amended agreement, the Victory Funds Complex and USAA Mutual Funds Complex, combined, may borrow up to $600 million, of which $300 million is committed and $300 million is uncommitted. $40 million of the Line of Credit is reserved for use by the Victory Floating Rate Fund, another series of the Victory Funds Complex, with that Fund paying the related commitment fees for that amount. The purpose of the agreement is to meet temporary or emergency cash needs, including redemption requests that might otherwise require the untimely disposition of securities. With the agreement in affect for the six months ended June 30, 2019, Citibank received an annual commitment fee of 0.15% on $100 million for providing the Line of Credit. For the six months ended June 30, 2019, Citibank earned approximately $76 thousand in commitment fees from the Victory Funds Complex. Effective July 1, 2019, Citibank receives an annual commitment fee of 0.15% on $300 million for providing the Line of Credit. Each fund in the Victory Funds Complex pays a pro-rata portion of the commitment fees plus any interest (one month LIBOR plus one percent) on amounts borrowed, including the USAA Mutual Funds Complex,
55
Victory Portfolios | | Notes to Financial Statements — continued
June 30, 2019 | |
(Unaudited)
commencing July 1, 2019. Interest charged to each Fund during the period is presented on the Statements of Operations under line of credit fees.
The Funds did not utilize the Line of Credit during the six months ended June 30, 2019.
Interfund Lending:
The Trust and Adviser rely on an exemptive order granted by the SEC in March 2017 (the "Order"), permitting the establishment and operation of an Interfund Lending Facility (the "Facility"). The Facility allows each Fund to directly lend and borrow money to or from any other Victory Fund relying upon the Order at rates beneficial to both the borrowing and lending funds. Advances under the Facility are allowed for temporary or emergency purposes, including the meeting of redemption requests that otherwise might require the untimely disposition of securities, and are subject to each Fund's borrowing restrictions. The interfund loan rate is determined, as specified in the Order, by averaging the current repurchase agreement rate and the current bank loan rate. As a Borrower, interest charged to each Fund during the period is presented on the Statement of Operations under interfund lending fees. As a Lender, interest earned by each Fund during the period is presented on the Statement of Operations under Income on interfund lending.
The average borrowing and lending for the days outstanding and average interest rate for each Fund during the six months ended June 30, 2019 were as follows:
Fund | | Borrower or
Lender | | Amount
Outstanding at
June 30, 2019 | | Average
Borrowing* | | Days
Borrowing
Outstanding | | Average
Interest
Rate* | | Maximum
Borrowing
During the
Period | |
Sophus Emerging
Markets Fund | | Borrower | | $ | — | | | $ | 2,860,000 | | | | 3 | | | | 2.94 | % | | $ | 4,263,000 | | |
Sophus Emerging
Markets Small Cap
Fund | | Borrower | | | — | | | | 115,000 | | | | 1 | | | | 3.22 | % | | | 115,000 | | |
* For the six months ended June 30, 2019, based on the number of days borrowings were outstanding.
7. Federal Income Tax Information:
The tax character of distributions paid and the tax basis of current components of accumulated earnings (deficit) will be determined at the end of the current tax year ending December 31, 2019.
The tax character of distributions paid during the most recent tax year ended, was as follows (total distributions paid may differ from the Statements of Changes in Net Assets because, for tax purposes, dividends are recognized when actually paid):
| | | Year Ended December 31, 2018 | |
| | | Distributions paid from | | | | | |
| | | Ordinary
Income | | Net
Long-Term
Capital Gains | | Total
Taxable
Distributions | | Total
Distributions
Paid | |
RS International Fund | | $ | 451,538 | | | $ | — | | | $ | 451,538 | | | $ | 451,538 | | |
RS Global Fund | | | 710,732 | | | | 849,841 | | | | 1,560,573 | | | | 1,560,573 | | |
Sophus Emerging Markets Fund | | | 2,823,595 | | | | 9,802,010 | | | | 12,625,605 | | | | 12,625,605 | | |
Sophus Emerging Markets Small Cap Fund | | | 328,246 | | | | 475,064 | | | | 803,310 | | | | 803,310 | | |
56
Victory Portfolios | | Notes to Financial Statements — continued
June 30, 2019 | |
(Unaudited)
As of the most recent tax year ended December 31, 2018, the components of distributable earnings/accumulated deficit on a tax basis were as follows:
| | | Undistributed
Ordinary
Income | | Undistributed
Long-Term
Capital Gains | | Accumulated
Earnings | | Accumulated
Capital and
Other
Losses | | Qualified
Late-Year
Losses* | | Unrealized
Appreciation
(Depreciation)** | | Total
Accumulated
Earnings
(Deficit) | |
RS International Fund | | $ | 422,959 | | | $ | 149,059 | | | $ | 572,018 | | | $ | — | | | $ | — | | | $ | (407,140 | ) | | $ | 164,878 | | |
RS Global Fund | | | 128 | | | | — | | | | 128 | | | | — | | | | (30,258 | ) | | | 4,123,820 | | | | 4,093,690 | | |
Sophus Emerging
Markets Fund | | | 121,264 | | | | — | | | | 121,264 | | | | (12,387,465 | ) | | | — | | | | (7,660,841 | ) | | | (19,927,042 | ) | |
Sophus Emerging Markets
Small Cap Fund | | | 20,628 | | | | — | | | | 20,628 | | | | — | | | | (174,531 | ) | | | (222,847 | ) | | | (376,750 | ) | |
* Qualified Late-year Losses above are comprised of post-October capital losses and post-October specified losses incurred after October 31, 2018. These losses are deemed to arise on the first day of the Fund's next taxable year.
** The difference between the book-basis and tax-basis unrealized appreciation (depreciation) is attributable primarily to tax deferral of losses on wash sales and mark to market adjustments on passive foreign investment companies.
As of the most recenttax year ended December 31, 2018, the following Funds had net capital loss carryforwards ("CLCFs") as summarized in the tables below:
| | | Short-Term
Amount | | Long-Term
Amount | | Total | |
Sophus Emerging Markets Fund | | $ | 12,387,465 | | | $ | — | | | $ | 12,387,465 | | |
During the most recent tax year ended December 31, 2018, the RS International Fund utilized $1,020,470 of CLCFs.
At June 30, 2019, the cost basis for federal income tax purposes, gross unrealized appreciation, gross unrealized depreciation and net unrealized appreciation (depreciation) for investments were as follows:
| | Cost of
Investments
for Federal
Tax Purposes | | Gross
Unrealized
Appreciation | | Gross
Unrealized
Depreciation | | Net
Unrealized
Appreciation
(Depreciation) | |
RS International Fund | | $ | 46,199,419 | | | $ | 4,827,186 | | | $ | (1,668,823 | ) | | $ | 3,158,363 | | |
RS Global Fund | | | 44,259,895 | | | | 11,337,229 | | | | (1,030,432 | ) | | | 10,306,797 | | |
Sophus Emerging Markets Fund | | | 343,745,603 | | | | 44,325,645 | | | | (12,390,541 | ) | | | 31,935,104 | | |
Sophus Emerging Markets
Small Cap Fund | | | 4,950,344 | | | | 574,390 | | | | (198,398 | ) | | | 375,992 | | |
8. Capital Contribution from Prior Custodian:
During 2016, certain Funds received notification from their prior custodian, State Street Bank and Trust ("State Street"), concerning issues related to billing on certain categories of expenses during the approximately 16-year period from 1998 through October 31, 2014. The over-billing primarily related to categories of expenses that involved an allocation of general costs among multiple clients.
State Street paid the refunded amounts during January 2017. Based on billing information received during 2016 from State Street and an analysis of any expense limitation agreements that were in place during the period of the activities in question, including the application of any recoupment provisions in such agreements, the Adviser received a portion of the refund.
The portion of the refund retained by the Funds was accounted for as a capital contribution and is reflected on the Financial Highlights as "Capital Contribution from Prior Custodian, Net".
57
Victory Portfolios | | Notes to Financial Statements — continued
June 30, 2019 | |
(Unaudited)
9. Fund Ownership:
Ownership of more than 25% of the voting securities of a fund creates presumptions of control of the fund, under section 2(a)(9) of the 1940 Act. As of June 30, 2019, the shareholders listed below held more than 25% of the shares outstanding of the Funds and may be deemed to control those Funds.
| | | Shareholder | | Percent | |
Sophus Emerging Markets Small Cap Fund | | Gerlach Nominee And Co. LLC | | | 39.0 | % | |
Sophus Emerging Markets Small Cap Fund | | UBS Financial Services Inc. | | | 35.2 | % | |
10. Recent Accounting Pronouncements:
In August 2018, the Financial Accounting Standards Board issued Accounting Standards Update ("ASU") No. 2018-13, "Fair Value Measurements" ("ASU 2018-13"). This update makes certain removals from, changes to and additions to existing disclosure requirements for fair value measurements. ASU 2018-13 does not change fair value measurements already required or permitted by existing standards. ASU 2018-13 is effective for financial statements issued for fiscal years beginning after December 15, 2019, and interim periods within those fiscal years. As permitted, the Funds have early adopted ASU 2018-13 with the financial statements prepared as of June 30, 2019.
11. Subsequent Events:
The Funds have evaluated the need for additional disclosures or adjustments resulting from subsequent events through the date these financial statements were issued. Based on this evaluation, there were no subsequent events to report that would have a material impact on the Funds' financial statements.
58
Victory Portfolios | | Supplemental Information
June 30, 2019 | |
(Unaudited)
Trustee and Officer Information
Board of Trustees:
Overall responsibility for management of the Trust rests with the Board. The Trust is managed by the Board in accordance with the laws of the State of Delaware. There are currently ten Trustees, nine of whom are not "interested persons" of the Trust within the meaning of that term under the 1940 Act ("Independent Trustees") and one of whom is an "interested person" of the Trust within the meaning of that term under the 1940 Act ("Interested Trustee"). The Trustees, in turn, elect the officers of the Trust to actively supervise its day-to-day operations.
The following tables list the Trustees, their ages, position with the Trust, commencement of service, principal occupations during the past five years and any directorships of other investment companies or companies whose securities are registered under the Securities Exchange Act of 1934, as amended, or who file reports under that Act. Each Trustee oversees 42 portfolios in the Trust, nine portfolios in Victory Variable Insurance Funds and 20 portfolios in Victory Portfolios II, each a registered investment company that, together with the Trust, comprise the Victory Funds Complex. Each Trustee's address is c/o Victory Portfolios, 4900 Tiedeman Road, 4th Floor, Brooklyn, Ohio 44144. Each Trustee has an indefinite term.
Name and Age | | Position
Held with
the Trust | | Date
Commenced
Service | | Principal Occupation
During Past 5 Years | | Other
Directorships
Held During
Past 5 Years | |
Independent Trustees. | | | | | | | | | |
David Brooks Adcock, 67 | | Trustee | | May 2005 | | Consultant (since 2006). | | Chair and Trustee, Turner Funds (December 2016-December 2017). | |
Nigel D. T. Andrews, 72 | | Vice Chair and Trustee | | August 2002 | | Retired. | | Director, TCG BDC II, Inc. (since 2017); Director, TCG BDC I, Inc. (formerly Carlyle GMS Finance, Inc.) (since 2012); Director, Old Mutual US Asset Management (2002-2014). | |
E. Lee Beard, 68* | | Trustee | | May 2005 | | Retired (since 2015); Consultant, The Henlee Group, LLC (consulting) (2005-2015). | | None. | |
Dennis M. Bushe, 75 | | Trustee | | July 2016 | | Retired. | | Trustee, RS Investment Trust and RS Variable Products Trust (November 2011-July 2016). | |
59
Victory Portfolios | | Supplemental Information — continued
June 30, 2019 | |
(Unaudited)
Name and Age | | Position
Held with
the Trust | | Date
Commenced
Service | | Principal Occupation
During Past 5 Years | | Other
Directorships
Held During
Past 5 Years | |
Sally M. Dungan, 65 | | Trustee | | February 2011 | | Chief Investment Officer, Tufts University (since 2002). | | None. | |
John L. Kelly, 66 | | Trustee | | February 2015 | | Partner, McCarvill Capital Partners (September 2016- September 2017); Advisor, Endgate Commodities LLC (January 2016-April 2016); Managing Partner, Endgate Commodities LLC (August 2014-January 2016); Chief Operating Officer, Liquidnet Holdings, Inc. (December 2011-July 2014). | | Director, Caledonia Mining Corporation (since May 2012). | |
David L. Meyer, 62* | | Trustee | | December 2008 | | Retired. | | None. | |
Gloria S. Nelund, 58 | | Trustee | | July 2016 | | Chair, CEO and Co-Founder of TriLinc Global, LLC, an investment firm. | | TriLinc Global Impact Fund, LLC (since 2012); Trustee, RS Investment Trust and RS Variable Products Trust (November 2007-July 2016). | |
Leigh A. Wilson, 74 | | Chair and Trustee | | November 1994 | | Private Investor. | | Chair (since 2013), Caledonia Mining Corporation. | |
Interested Trustee. | | | | | | | | | |
David C. Brown, 47** | | Trustee | | May 2008 | | Chairman and Chief Executive Officer (since 2013), Co-Chief Executive Officer (2011-2013), the Adviser; Chairman and Chief Executive Officer, Victory Capital Holdings, Inc. (since 2013). | | None. | |
* The Board has designated Mr. Meyer and Ms. Beard as its Audit Committee Financial Experts.
** Mr. Brown is an "Interested Person" by reason of his relationship with the Adviser.
The Statement of Additional Information includes additional information about the Trustees of the Trust and is available, without charge, on the SEC's website at www.sec.gov and/or by calling 800-539-3863.
60
Victory Portfolios | | Supplemental Information — continued
June 30, 2019 | |
(Unaudited)
Officers:
The officers of the Trust, their ages, commencement of service and their principal occupations during the past five years, are detailed in the following table. Each officer serves until the earlier of his or her resignation, removal, retirement, death, or the election of a successor. The mailing address of each officer of the Trust is 4900 Tiedeman Road, 4th Floor, Brooklyn, Ohio 44144. The officers of the Trust receive no compensation directly from the Trust for performing the duties of their offices.
Name and Age | | Position with
the Trust | | Date
Commenced
Service | | Principal Occupation During Past 5 Years | |
Christopher K. Dyer, 57 | | President | | February 2006* | | Director of Fund Administration, the Adviser. | |
Scott A. Stahorsky, 50 | | Vice President | | December 2014 | | Manager, Fund Administration, the Adviser (since 2015); Senior Analyst, Fund Administration, the Adviser (prior to 2015). | |
Erin G. Wagner, 45 | | Secretary | | December 2014 | | Associate General Counsel, the Adviser (since 2013). | |
Allan Shaer, 54 | | Treasurer | | May 2017 | | Senior Vice President, Financial Administration, Citi Fund Services Ohio, Inc. (since 2016); Vice President, Mutual Fund Administration, JP Morgan Chase (2011-2016). | |
Christopher A. Ponte, 35 | | Assistant Treasurer | | December 2017 | | Manager, Fund Administration, the Adviser (since 2017); Senior Analyst, Fund Administration, the Adviser (prior to 2017); Chief Financial Officer, Victory Capital Advisers, Inc. (since 2018). | |
Colin Kinney, 45 | | Chief Compliance Officer | | July 2017 | | Chief Compliance Officer (since 2013) and Chief Risk Officer (2009-2017), the Adviser. | |
Chuck Booth, 59 | | Anti-Money Laundering Compliance Officer and Identity Theft Officer | | May 2015 | | Director, Regulatory Administration and CCO Support Services, Citi Fund Services Ohio, Inc. | |
Jay G. Baris, 65 | | Assistant Secretary | | December 1997 | | Partner, Shearman & Sterling LLP (since 2018); Partner, Morrison & Foerster LLP (2011-January 2018). | |
* On December 3, 2014, Mr. Dyer resigned as Secretary of the Trust and accepted the position of President.
61
Victory Portfolios | | Supplemental Information — continued
June 30, 2019 | |
(Unaudited)
Proxy Voting and Portfolio Holdings Information
Proxy Voting:
Information regarding the policies and procedures each Fund uses to determine how to vote proxies relating to portfolio securities is available without charge, upon request, by calling 800-539-3863. The information is also included in the Funds' Statement of Additional Information, which is available on the SEC's website at www.sec.gov.
Information relating to how the Funds voted proxies relating to portfolio securities held during the most recent twelve months ended June 30 is available on the SEC's website at www.sec.gov.
Availability of Schedules of Portfolio Investments:
The Trust files a complete list of Schedules of Portfolio Investments with the SEC for the first and third quarter of each fiscal year on Form N-PORT. Prior to the implementation of Form N-PORT, the Trust filed a complete list of Schedules of Portfolio Investments with the SEC for the first and third quarters of each fiscal year on Form N-Q. Forms N-PORT and Forms N-Q are available on the SEC's website at www.sec.gov.
Expense Examples
As a shareholder of the Funds, you may incur two types of costs: (1) transaction costs, including sales charges (loads) on purchases; and (2) ongoing costs, including management fees, distribution and service (12b-1) fees, and other Fund expenses. These examples are intended to help you understand your ongoing costs (in dollars) of investing in the Funds and to compare these costs with the ongoing costs of investing in other mutual funds.
These examples are based on an investment of $1,000 invested at the beginning of the period and held for the entire period from January 1, 2019 through June 30, 2019.
The Actual Expense figures in the table below provide information about actual account values and actual expenses. You may use the information below, together with the amount you invested, to estimate the expenses that you paid over the period. Simply divide your account value by $1,000 (for example, an $8,600 account value divided by $1,000 = 8.6), then multiply the result by the number in the table under the heading entitled "Actual Expenses Paid During Period" to estimate the expenses you paid on your account during this period.
The Hypothetical Expense figures in the table below provide information about hypothetical account values and hypothetical expenses based on each Fund's actual expense ratio and an assumed rate of return of 5% per year before expenses, which is not the Fund's actual return. The hypothetical account values and expenses may not be used to estimate the actual ending account balance or expenses you paid for the period. You may use this information to compare this 5% hypothetical example with the 5% hypothetical examples that appear in shareholder reports of other funds.
Please note the expenses shown in the table are meant to highlight your ongoing costs only and do not reflect any transactional costs. Therefore, the table is useful in comparing ongoing costs only, and will not help you determine the relative total costs of owning different funds. In addition, if these transactional costs were included, your costs would have been higher.
| | | Beginning
Account
Value
1/1/19 | | Actual
Ending
Account
Value
6/30/19 | | Hypothetical
Ending
Account
Value
6/30/19 | | Actual
Expenses
Paid
During
Period
1/1/19-
6/30/19* | | Hypothetical
Expenses
Paid
During
Period
1/1/19-
6/30/19* | | Annualized
Expense
Ratio
During
Period
1/1/19-
6/30/19 | |
RS International Fund | |
Class A Shares | | $ | 1,000.00 | | | $ | 1,153.30 | | | $ | 1,019.19 | | | $ | 6.03 | | | $ | 5.66 | | | | 1.13 | % | |
Class C Shares | | | 1,000.00 | | | | 1,148.20 | | | | 1,015.47 | | | | 10.01 | | | | 9.39 | | | | 1.88 | % | |
Class R Shares | | | 1,000.00 | | | | 1,151.80 | | | | 1,017.95 | | | | 7.36 | | | | 6.90 | | | | 1.38 | % | |
Class R6 Shares | | | 1,000.00 | | | | 1,014.00 | ** | | | 1,020.68 | | | | 1.37 | ** | | | 4.16 | | | | 0.83 | % | |
Class Y Shares | | | 1,000.00 | | | | 1,153.80 | | | | 1,020.43 | | | | 4.70 | | | | 4.41 | | | | 0.88 | % | |
62
Victory Portfolios | | Supplemental Information — continued
June 30, 2019 | |
(Unaudited)
| | | Beginning
Account
Value
1/1/19 | | Actual
Ending
Account
Value
6/30/19 | | Hypothetical
Ending
Account
Value
6/30/19 | | Actual
Expenses
Paid
During
Period
1/1/19-
6/30/19* | | Hypothetical
Expenses
Paid
During
Period
1/1/19-
6/30/19* | | Annualized
Expense
Ratio
During
Period
1/1/19-
6/30/19 | |
RS Global Fund | |
Class A Shares | | $ | 1,000.00 | | | $ | 1,178.70 | | | $ | 1,020.58 | | | $ | 4.59 | | | $ | 4.26 | | | | 0.85 | % | |
Class C Shares | | | 1,000.00 | | | | 1,174.60 | | | | 1,016.86 | | | | 8.63 | | | | 8.00 | | | | 1.60 | % | |
Class R Shares | | | 1,000.00 | | | | 1,177.50 | | | | 1,019.34 | | | | 5.94 | | | | 5.51 | | | | 1.10 | % | |
Class R6 Shares | | | 1,000.00 | | | | 1,015.00 | ** | | | 1,022.07 | | | | 0.91 | ** | | | 2.76 | | | | 0.55 | % | |
Class Y Shares | | | 1,000.00 | | | | 1,179.50 | | | | 1,021.82 | | | | 3.24 | | | | 3.01 | | | | 0.60 | % | |
Sophus Emerging Markets Fund | |
Class A Shares | | | 1,000.00 | | | | 1,111.20 | | | | 1,018.15 | | | | 7.01 | | | | 6.71 | | | | 1.34 | % | |
Class C Shares | | | 1,000.00 | | | | 1,107.20 | | | | 1,014.18 | | | | 11.18 | | | | 10.69 | | | | 2.14 | % | |
Class R Shares | | | 1,000.00 | | | | 1,110.00 | | | | 1,016.96 | | | | 8.27 | | | | 7.90 | | | | 1.58 | % | |
Class R6 Shares | | | 1,000.00 | | | | 1,113.70 | | | | 1,020.38 | | | | 4.66 | | | | 4.46 | | | | 0.89 | % | |
Class Y Shares | | | 1,000.00 | | | | 1,112.90 | | | | 1,019.89 | | | | 5.19 | | | | 4.96 | | | | 0.99 | % | |
Sophus Emerging Markets Small Cap Fund | |
Class A Shares | | | 1,000.00 | | | | 1,136.70 | | | | 1,016.12 | | | | 9.27 | | | | 8.75 | | | | 1.75 | % | |
Class C Shares | | | 1,000.00 | | | | 1,132.00 | | | | 1,012.40 | | | | 13.22 | | | | 12.47 | | | | 2.50 | % | |
Class Y Shares | | | 1,000.00 | | | | 1,138.80 | | | | 1,017.36 | | | | 7.95 | | | | 7.50 | | | | 1.50 | % | |
* Expenses are equal to the average account value multiplied by the Fund's annualized expense ratio multiplied by 181/365 (the number of days in the most recent fiscal half-year divided by the number of days in the fiscal year).
** Information shown reflects values for the period May 2, 2019 (commencement of operations) to June 30, 2019 and has been calculated using expense ratios and rates of return of the same period.
63
Privacy Policy
Protecting the Privacy of Information
The Trust respects your right to privacy. We also know that you expect us to conduct and process your business in an accurate and efficient manner. To do so, we must collect and maintain certain personal information about you. This is the information we collect from you on applications or other forms, and from the transactions you make with us or third parties. It may include your name, address, social security number, account transactions and balances, and information about investment goals and risk tolerance.
We do not disclose any information about you or about former customers to anyone except as permitted or required by law. Specifically, we may disclose the information we collect to companies that perform services on our behalf, such as the transfer agent that processes shareholder accounts and printers and mailers that assist us in the distribution of investor materials. We may also disclose this information to companies that perform marketing services on our behalf. This allows us to continue to offer you Victory investment products and services that meet your investing needs, and to effect transactions that you request or authorize. These companies will use this information only in connection with the services for which we hired them. They are not permitted to use or share this information for any other purpose.
To protect your personal information internally, we permit access only by authorized employees and maintain physical, electronic and procedural safeguards to guard your personal information.*
* You may have received communications regarding information about privacy policies from other financial institutions which gave you the opportunity to "opt-out" of certain information sharing with companies which are not affiliated with that financial institution. The Trust does not share information with other companies for purposes of marketing solicitations for products other than the Trust. Therefore, the Trust does not provide opt-out options to their shareholders.
Victory Funds
P.O. Box 182593
Columbus, Ohio 43218-2593

Visit our website at: | | Call Victory at: | |
www.vcm.com | | 800-539-FUND (800-539-3863) | |

June 30, 2019
Semi Annual Report
Victory RS Partners Fund
Victory RS Value Fund
Victory RS Large Cap Alpha Fund
Victory RS Investors Fund
Victory Global Natural Resources Fund
Beginning on January 1, 2021, as permitted by regulations adopted by the Securities and Exchange Commission, paper copies of the Victory Funds' shareholder reports will no longer be sent by mail, unless you specifically request paper copies of the reports from the Victory Funds or from your financial intermediary, such as a broker-dealer or bank. Instead, the reports will be made available on www.VictoryFunds.com, and you will be notified by mail each time a report is posted and provided with a website link to access the report. If you already elected to receive shareholder reports electronically, you will not be affected by this change, and you need not take any action.
You may elect to receive shareholder reports and other communications from the Victory Funds or your financial intermediary electronically sooner than January 1, 2021 by notifying your financial intermediary directly or, if you are a direct investor, by calling 800-539-3863 or by sending an e-mail request to TA.Processing@FISGlobal.com.
You may elect to receive all future reports in paper free of charge. If you invest through a financial intermediary, you can contact your financial intermediary to request that you continue to receive paper copies of your reports. If you invest directly with the Victory Funds, you can call 800-539-3863 or send an e-mail request to TA.Processing@FISGlobal.com. Your election to receive reports in paper will apply to all Victory Funds you hold directly or through your financial intermediary.
www.vcm.com
News, Information And Education 24 Hours A Day, 7 Days A Week
The Victory Funds site gives fund shareholders, prospective shareholders, and investment professionals a convenient way to access fund information, get guidance, and track fund performance anywhere they can access the Internet. The site includes:
• Detailed performance records
• Daily share prices
• The latest fund news
• Investment resources to help you become a better investor
• A section dedicated to investment professionals
Whether you're a potential investor searching for the fund that matches your investment philosophy, a seasoned investor interested in planning tools, or an investment professional, www.vcm.com has what you seek. Visit us anytime. We're always open.
Table of Contents
Financial Statements | |
The Victory Value Funds | |
Victory RS Partners Fund | |
Investment Objectives & Portfolio Holdings | | | 3 | | |
Schedule of Portfolio Investments | | | 5 | | |
Statements of Assets and Liabilities | | | 17 | | |
Statements of Operations | | | 19 | | |
Statements of Changes in Net Assets | | | 21-23 | | |
Financial Highlights | | | 28-29 | | |
Victory RS Value Fund | |
Investment Objectives & Portfolio Holdings | | | 3 | | |
Schedule of Portfolio Investments | | | 8 | | |
Statements of Assets and Liabilities | | | 17 | | |
Statements of Operations | | | 19 | | |
Statements of Changes in Net Assets | | | 21-23 | | |
Financial Highlights | | | 30-33 | | |
Victory RS Large Cap Alpha Fund | |
Investment Objectives & Portfolio Holdings | | | 3 | | |
Schedule of Portfolio Investments | | | 11 | | |
Statements of Assets and Liabilities | | | 17 | | |
Statements of Operations | | | 19 | | |
Statements of Changes in Net Assets | | | 21-23 | | |
Financial Highlights | | | 34-37 | | |
Victory RS Investors Fund | |
Investment Objectives & Portfolio Holdings | | | 3 | | |
Schedule of Portfolio Investments | | | 14 | | |
Statements of Assets and Liabilities | | | 18 | | |
Statements of Operations | | | 20 | | |
Statements of Changes in Net Assets | | | 24-26 | | |
Financial Highlights | | | 38-39 | | |
Victory Global Natural Resources Fund | |
Investment Objectives & Portfolio Holdings | | | 4 | | |
Schedule of Portfolio Investments | | | 16 | | |
Statements of Assets and Liabilities | | | 18 | | |
Statements of Operations | | | 20 | | |
Statements of Changes in Net Assets | | | 24-26 | | |
Financial Highlights | | | 40-43 | | |
Notes to Financial Statements | | | 44 | | |
1
Table of Contents (continued)
Supplemental Information | | | 54 | | |
Trustee and Officer Information | | | 54 | | |
Proxy Voting and Portfolio Holdings Information | | | 57 | | |
Expense Examples | | | 57 | | |
Privacy Policy (inside back cover) | | | |
The Funds are distributed by Victory Capital Advisers, Inc. Victory Capital Management Inc. is the investment adviser to the Funds and receives fees from the Funds for performing services for the Funds.
This report is not authorized for distribution to prospective investors unless preceded or accompanied by a current prospectus of the Victory Funds.
For additional information about any Victory Fund, including fees, expenses, and risks, view our prospectus online at www.vcm.com or call 800-539-3863. Read it carefully before you invest or send money.
The information in this semi annual report is based on data obtained from recognized services and sources and is believed to be reliable. Any opinions, projections, or recommendations in this report are subject to change without notice and are not intended as individual investment advice. Past investment performance of the Funds, markets or securities mentioned herein should not be considered to be indicative of future results.
• NOT FDIC INSURED • NO BANK GUARANTEE • MAY LOSE VALUE

Call Victory at:
800-539-FUND (800-539-3863)
Visit our website at:
www.vcm.com
2
Victory Portfolios | | June 30, 2019 | |
(Unaudited)
Investment Objectives & Portfolio Holdings:
Victory RS Partners Fund
The Fund seeks to provide long-term
capital appreciation. | |
Portfolio Holdings
As a Percentage of Total Investments
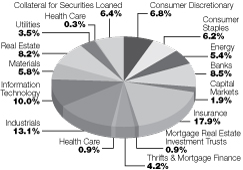
Victory RS Value Fund
The Fund seeks to provide long-term
capital appreciation. | |
Portfolio Holdings
As a Percentage of Total Investments

Victory RS Large Cap Alpha Fund
The Fund seeks to provide long-term
capital appreciation. | |
Portfolio Holdings
As a Percentage of Total Investments
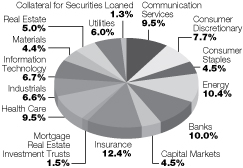
Victory RS Investors Fund
The Fund seeks to provide long-term
capital appreciation. | |
Portfolio Holdings
As a Percentage of Total Investments

3
Victory Portfolios | | June 30, 2019 | |
(Unaudited)
Investment Objectives & Portfolio Holdings: (continued)
Victory Global Natural Resources Fund
The Fund seeks to provide long-term
capital appreciation.
Portfolio Holdings
As a Percentage of Total Investments
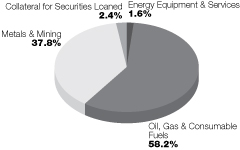
4
Victory Portfolios
Victory RS Partners Fund | | Schedule of Portfolio Investments
June 30, 2019 | |
(Unaudited)
Security Description | | Shares | | Value | |
Common Stocks (96.4%) | |
Banks (8.8%): | |
Associated Banc-Corp. | | | 182,407 | | | $ | 3,856,084 | | |
Atlantic Union Bankshares Corp. | | | 147,920 | | | | 5,226,014 | | |
Chemical Financial Corp. (a) | | | 130,765 | | | | 5,375,749 | | |
Columbia Banking System, Inc. | | | 94,046 | | | | 3,402,584 | | |
First Hawaiian, Inc. | | | 361,810 | | | | 9,360,025 | | |
Synovus Financial Corp. | | | 137,849 | | | | 4,824,715 | | |
UMB Financial Corp. | | | 90,512 | | | | 5,957,500 | | |
| | | | 38,002,671 | | |
Capital Markets (1.9%): | |
Federated Investors, Inc., Class B (a) | | | 155,750 | | | | 5,061,875 | | |
PJT Partners, Inc. | | | 79,850 | | | | 3,235,522 | | |
| | | | 8,297,397 | | |
Consumer Discretionary (7.1%): | |
Dineequity, Inc. (a) | | | 47,340 | | | | 4,519,550 | | |
Liberty Expedia Holdings, Inc., Class A (b) | | | 330,117 | | | | 15,776,291 | | |
Penske Automotive Group, Inc. (a) | | | 220,351 | | | | 10,422,602 | | |
| | | | 30,718,443 | | |
Consumer Staples (6.3%): | |
Hostess Brands, Inc. (b) | | | 907,671 | | | | 13,106,769 | | |
Nomad Foods Ltd., ADR (b) | | | 282,670 | | | | 6,037,831 | | |
Performance Food Group Co. (b) | | | 120,325 | | | | 4,816,610 | | |
Primo Water Corp. (a) (b) | | | 121,040 | | | | 1,488,792 | | |
TreeHouse Foods, Inc. (a) (b) | | | 38,920 | | | | 2,105,572 | | |
| | | | 27,555,574 | | |
Energy (5.6%): | |
Delek US Holdings, Inc. | | | 5,500 | | | | 222,860 | | |
Gulfport Energy Corp. (a) (b) | | | 490,710 | | | | 2,409,386 | | |
Kosmos Energy Ltd. | | | 1,250,247 | | | | 7,839,048 | | |
Magnolia Oil & Gas Corp. (a) (b) | | | 416,660 | | | | 4,824,923 | | |
RPC, Inc. (a) | | | 624,350 | | | | 4,501,564 | | |
SRC Energy, Inc. (b) | | | 901,260 | | | | 4,470,250 | | |
| | | | 24,268,031 | | |
Health Care (0.9%): | |
NuVasive, Inc. (b) | | | 68,570 | | | | 4,014,088 | | |
Industrials (13.7%): | |
Advanced Disposal Services, Inc. (b) | | | 185,163 | | | | 5,908,551 | | |
American Woodmark Corp. (b) | | | 48,390 | | | | 4,094,762 | | |
Atkore International Group, Inc. (a) (b) | | | 416,190 | | | | 10,766,835 | | |
Azul SA, ADR (b) | | | 62,539 | | | | 2,091,304 | | |
Kennametal, Inc. (a) | | | 114,930 | | | | 4,251,261 | | |
Regal Beloit Corp. | | | 46,818 | | | | 3,825,499 | | |
Rexnord Corp. (b) | | | 128,700 | | | | 3,889,314 | | |
Rush Enterprises, Inc., Class A | | | 187,210 | | | | 6,836,909 | | |
See notes to financial statements.
5
Victory Portfolios
Victory RS Partners Fund | | Schedule of Portfolio Investments — continued
June 30, 2019 | |
(Unaudited)
Security Description | | Shares | | Value | |
SkyWest, Inc. | | | 160,930 | | | $ | 9,763,623 | | |
Timken Co. | | | 97,330 | | | | 4,996,922 | | |
Welbilt, Inc. (a) (b) | | | 107,130 | | | | 1,789,071 | | |
| | | | 58,214,051 | | |
Information Technology (10.3%): | |
Belden, Inc. | | | 67,719 | | | | 4,034,021 | | |
Euronet Worldwide, Inc. (b) | | | 104,310 | | | | 17,549,114 | | |
NCR Corp. (b) | | | 213,330 | | | | 6,634,563 | | |
Verint Systems, Inc. (b) | | | 305,120 | | | | 16,409,354 | | |
| | | | 44,627,052 | | |
Insurance (18.5%): | |
Argo Group International Holdings | | | 73,740 | | | | 5,460,447 | | |
Axis Capital Holdings Ltd., ADR | | | 282,960 | | | | 16,878,564 | | |
Hanover Insurance Group, Inc. | | | 65,780 | | | | 8,439,574 | | |
Mercury General Corp. (a) | | | 173,680 | | | | 10,854,999 | | |
Primerica, Inc. | | | 58,723 | | | | 7,043,824 | | |
ProAssurance Corp. | | | 127,490 | | | | 4,603,664 | | |
Torchmark Corp. | | | 108,130 | | | | 9,673,310 | | |
United Fire Group, Inc. (a) | | | 65,890 | | | | 3,193,029 | | |
White Mountains Insurance Group Ltd., ADR (a) | | | 13,160 | | | | 13,442,414 | | |
| | | | 79,589,825 | | |
Materials (5.9%): | |
Crown Holdings, Inc. (b) | | | 130,520 | | | | 7,974,772 | | |
Element Solutions, Inc. (b) | | | 21,910 | | | | 226,549 | | |
Graphic Packaging Holding Co. (a) | | | 752,580 | | | | 10,521,068 | | |
Summit Materials, Inc., Class A (b) | | | 339,727 | | | | 6,539,745 | | |
| | | | 25,262,134 | | |
Mortgage Real Estate Investment Trusts (0.9%): | |
Redwood Trust, Inc. (a) | | | 233,400 | | | | 3,858,102 | | |
Real Estate (8.6%): | |
American Assets Trust, Inc. | | | 108,090 | | | | 5,093,201 | | |
Equity Commonwealth | | | 487,411 | | | | 15,850,606 | | |
Kennedy-Wilson Holdings, Inc. (a) | | | 269,930 | | | | 5,552,460 | | |
Spirit Realty Capital, Inc. | | | 190,146 | | | | 8,111,628 | | |
Terreno Realty Corp. | | | 44,670 | | | | 2,190,617 | | |
| | | | 36,798,512 | | |
Thrifts & Mortgage Finance (4.3%): | |
Kearny Financial Corp. | | | 564,940 | | | | 7,508,053 | | |
PCSB Financial Corp. | | | 122,000 | | | | 2,470,500 | | |
TFS Financial Corp. (a) | | | 480,730 | | | | 8,686,791 | | |
| | | | 18,665,344 | | |
See notes to financial statements.
6
Victory Portfolios
Victory RS Partners Fund | | Schedule of Portfolio Investments — continued
June 30, 2019 | |
(Unaudited)
Security Description | | Shares | | Value | |
Utilities (3.6%): | |
Black Hills Corp. (a) | | | 78,125 | | | $ | 6,107,031 | | |
NorthWestern Corp. | | | 46,570 | | | | 3,360,026 | | |
South Jersey Industries, Inc. (a) | | | 178,960 | | | | 6,036,321 | | |
| | | | 15,503,378 | | |
Total Common Stocks (Cost $345,037,875) | | | 415,374,602 | | |
Preferred Stocks (0.3%) | |
Health Care (0.3%): | |
WellDoc, Inc. (c) (d) | | | 1,587,483 | | | | 1,165,689 | | |
Total Preferred Stock (Cost $1,942,920) | | | 1,165,689 | | |
Collateral for Securities Loaned^ (6.6%) | |
BlackRock Liquidity Funds TempFund Portfolio, Institutional Class, 2.43% (e) | | | 5,910,695 | | | | 5,910,695 | | |
Fidelity Investments Money Market Government Portfolio, Class I, 2.28% (e) | | | 7,613,652 | | | | 7,613,652 | | |
Fidelity Investments Prime Money Market Portfolio, Class I, 2.39% (e) | | | 197,726 | | | | 197,726 | | |
Goldman Sachs Financial Square Prime Obligations Fund, Institutional
Class, 2.48% (e) | | | 3,250,449 | | | | 3,250,449 | | |
JPMorgan Prime Money Market Fund, Capital Class, 2.41% (e) | | | 4,432,332 | | | | 4,432,332 | | |
Morgan Stanley Institutional Liquidity Prime Portfolio, Institutional Class, 2.42% (e) | | | 6,894,990 | | | | 6,894,990 | | |
Total Collateral for Securities Loaned (Cost $28,299,844) | | | 28,299,844 | | |
Total Investments (Cost $375,280,639) — 103.3% | | | 444,840,135 | | |
Liabilities in excess of other assets — (3.3)% | | | (14,310,981 | ) | |
NET ASSETS — 100.00% | | $ | 430,529,154 | | |
^ Purchased with cash collateral from securities on loan.
(a) All or a portion of this security is on loan.
(b) Non-income producing security.
(c) The Fund's Adviser has deemed this security to be illiquid based upon procedures approved by the Board of Trustees. As of June 30, 2019, illiquid securities were 0.3% of the Fund's net assets.
(d) Security was fair valued based upon procedures approved by the Board of Trustees and represents 0.3% of the Fund's net assets as of June 30, 2019. This security is classified as Level 3 within the fair value hierarchy. (See Note 2)
(e) Rate disclosed is the daily yield on June 30, 2019.
ADR — American Depositary Receipt
See notes to financial statements.
7
Victory Portfolios
Victory RS Value Fund | | Schedule of Portfolio Investments
June 30, 2019 | |
(Unaudited)
Security Description | | Shares | | Value | |
Common Stocks (97.9%) | |
Consumer Discretionary (11.2%): | |
Aramark | | | 375,985 | | | $ | 13,558,019 | | |
Expedia, Inc. | | | 108,800 | | | | 14,473,664 | | |
LKQ Corp. (a) | | | 508,890 | | | | 13,541,563 | | |
Penske Automotive Group, Inc. | | | 42,640 | | | | 2,016,872 | | |
| | | | 43,590,118 | | |
Consumer Staples (4.6%): | |
Hostess Brands, Inc. (a) (b) | | | 607,230 | | | | 8,768,401 | | |
Keurig Dr Pepper, Inc. (b) | | | 97,470 | | | | 2,816,883 | | |
Nomad Foods Ltd., ADR (a) | | | 236,970 | | | | 5,061,679 | | |
Performance Food Group Co. (a) | | | 41,980 | | | | 1,680,459 | | |
| | | | 18,327,422 | | |
Energy (5.9%): | |
Diamondback Energy, Inc. | | | 57,150 | | | | 6,227,636 | | |
EQT Corp. | | | 401,860 | | | | 6,353,406 | | |
Magnolia Oil & Gas Corp. (a) (b) | | | 332,800 | | | | 3,853,824 | | |
Noble Energy, Inc. | | | 109,305 | | | | 2,448,432 | | |
RPC, Inc. (b) | | | 599,330 | | | | 4,321,169 | | |
| | | | 23,204,467 | | |
Financials (24.2%): | |
Aflac, Inc. | | | 227,590 | | | | 12,474,209 | | |
Agnc Investment Corp. | | | 350,700 | | | | 5,898,774 | | |
American International Group, Inc. | | | 90,610 | | | | 4,827,701 | | |
Axis Capital Holdings Ltd., ADR | | | 69,730 | | | | 4,159,395 | | |
Brown & Brown, Inc. | | | 251,200 | | | | 8,415,200 | | |
CBOE Holdings, Inc. | | | 96,120 | | | | 9,960,916 | | |
E*TRADE Financial Corp. | | | 170,790 | | | | 7,617,234 | | |
First American Financial Corp. | | | 76,030 | | | | 4,082,811 | | |
First Hawaiian, Inc. | | | 264,840 | | | | 6,851,411 | | |
Hartford Financial Services Group, Inc. | | | 76,760 | | | | 4,277,067 | | |
Kearny Financial Corp. | | | 419,000 | | | | 5,568,510 | | |
RenaissanceRe Holdings Ltd., ADR | | | 65,680 | | | | 11,691,696 | | |
Voya Financial, Inc. | | | 150,800 | | | | 8,339,240 | | |
| | | | 94,164,164 | | |
Health Care (7.1%): | |
Allergan PLC | | | 60,380 | | | | 10,109,423 | | |
Bio-Rad Laboratories, Inc., Class A (a) | | | 6,690 | | | | 2,091,227 | | |
Humana, Inc. | | | 22,020 | | | | 5,841,906 | | |
Zimmer Biomet Holdings, Inc. | | | 84,170 | | | | 9,910,176 | | |
| | | | 27,952,732 | | |
See notes to financial statements.
8
Victory Portfolios
Victory RS Value Fund | | Schedule of Portfolio Investments — continued
June 30, 2019 | |
(Unaudited)
Security Description | | Shares | | Value | |
Industrials (6.7%): | |
Crane Co. | | | 111,490 | | | $ | 9,302,725 | | |
Huntington Ingalls Industries, Inc. | | | 14,450 | | | | 3,247,493 | | |
Kennametal, Inc. (b) | | | 97,380 | | | | 3,602,086 | | |
Sensata Technologies Holding PLC, ADR (a) | | | 58,840 | | | | 2,883,160 | | |
Timken Co. | | | 141,390 | | | | 7,258,963 | | |
| | | | 26,294,427 | | |
Information Technology (11.0%): | |
Euronet Worldwide, Inc. (a) | | | 83,243 | | | | 14,004,802 | | |
FleetCor Technologies, Inc. (a) | | | 36,140 | | | | 10,149,919 | | |
NCR Corp. (a) | | | 216,660 | | | | 6,738,126 | | |
Verint Systems, Inc. (a) | | | 214,390 | | | | 11,529,894 | | |
| | | | 42,422,741 | | |
Materials (10.7%): | |
Crown Holdings, Inc. (a) | | | 140,880 | | | | 8,607,768 | | |
Freeport-McMoRan, Inc. | | | 509,280 | | | | 5,912,741 | | |
Graphic Packaging Holding Co. | | | 728,390 | | | | 10,182,892 | | |
Sealed Air Corp. (b) | | | 216,300 | | | | 9,253,314 | | |
Summit Materials, Inc., Class A (a) (b) | | | 381,190 | | | | 7,337,908 | | |
| | | | 41,294,623 | | |
Real Estate (9.3%): | |
Equity Commonwealth | | | 233,293 | | | | 7,586,688 | | |
Healthcare Trust of America, Inc., Class A | | | 141,080 | | | | 3,869,824 | | |
Invitation Homes, Inc. | | | 403,580 | | | | 10,787,694 | | |
MGM Growth Properties LLC, Series A | | | 178,530 | | | | 5,471,945 | | |
Spirit Realty Capital, Inc. | | | 194,258 | | | | 8,287,047 | | |
| | | | 36,003,198 | | |
Utilities (7.2%): | |
AES Corp. | | | 227,950 | | | | 3,820,442 | | |
Atmos Energy Corp. | | | 29,659 | | | | 3,130,804 | | |
DTE Energy Co. | | | 16,235 | | | | 2,076,132 | | |
FirstEnergy Corp. | | | 140,580 | | | | 6,018,230 | | |
Vistra Energy Corp. (a) | | | 493,650 | | | | 11,176,235 | | |
Xcel Energy, Inc. | | | 35,545 | | | | 2,114,572 | | |
| | | | 28,336,415 | | |
Total Common Stocks (Cost $333,077,296) | | | 381,590,307 | | |
See notes to financial statements.
9
Victory Portfolios
Victory RS Value Fund | | Schedule of Portfolio Investments — continued
June 30, 2019 | |
(Unaudited)
Security Description | | Shares | | Value | |
Collateral for Securities Loaned^ (4.9%) | |
BlackRock Liquidity Funds TempFund Portfolio, Institutional Class, 2.43% (c) | | | 4,031,220 | | | $ | 4,031,220 | | |
Fidelity Investments Money Market Government Portfolio, Class I, 2.28% (c) | | | 5,192,673 | | | | 5,192,673 | | |
Fidelity Investments Prime Money Market Portfolio, Class I, 2.39% (c) | | | 134,853 | | | | 134,853 | | |
Goldman Sachs Financial Square Prime Obligations Fund, Institutional
Class, 2.48% (c) | | | 2,216,876 | | | | 2,216,876 | | |
JPMorgan Prime Money Market Fund, Capital Class, 2.41% (c) | | | 3,022,945 | | | | 3,022,945 | | |
Morgan Stanley Institutional Liquidity Prime Portfolio, Institutional
Class, 2.42% (c) | | | 4,702,531 | | | | 4,702,531 | | |
Total Collateral for Securities Loaned (Cost $19,301,098) | | | 19,301,098 | | |
Total Investments (Cost $352,378,394) — 102.8% | | | 400,891,405 | | |
Liabilities in excess of other assets — (2.8)% | | | (10,893,947 | ) | |
NET ASSETS — 100.00% | | $ | 389,997,458 | | |
^ Purchased with cash collateral from securities on loan.
(a) Non-income producing security.
(b) All or a portion of this security is on loan.
(c) Rate disclosed is the daily yield on June 30, 2019.
ADR — American Depositary Receipt
LLC — Limited Liability Company
PLC — Public Limited Company
See notes to financial statements.
10
Victory Portfolios
Victory RS Large Cap Alpha Fund | | Schedule of Portfolio Investments
June 30, 2019 | |
(Unaudited)
Security Description | | Shares | | Value | |
Common Stocks (96.6%) | |
Banks (9.8%): | |
Citigroup, Inc. | | | 266,180 | | | $ | 18,640,585 | | |
The PNC Financial Services Group, Inc. | | | 100,620 | | | | 13,813,114 | | |
U.S. Bancorp | | | 218,070 | | | | 11,426,868 | | |
Wells Fargo & Co. | | | 197,430 | | | | 9,342,388 | | |
| | | | 53,222,955 | | |
Capital Markets (4.4%): | |
CBOE Holdings, Inc. | | | 153,958 | | | | 15,954,668 | | |
E*TRADE Financial Corp. | | | 180,040 | | | | 8,029,784 | | |
| | | | 23,984,452 | | |
Communication Services (9.3%): | |
Alphabet, Inc., Class A (a) | | | 19,940 | | | | 21,591,032 | | |
Facebook, Inc., Class A (a) | | | 151,630 | | | | 29,264,590 | | |
| | | | 50,855,622 | | |
Consumer Discretionary (7.5%): | |
Aramark | | | 464,790 | | | | 16,760,327 | | |
Booking Holdings, Inc. (a) | | | 7,250 | | | | 13,591,648 | | |
LKQ Corp. (a) | | | 397,410 | | | | 10,575,080 | | |
| | | | 40,927,055 | | |
Consumer Staples (4.4%): | |
Keurig Dr Pepper, Inc. (b) | | | 205,680 | | | | 5,944,152 | | |
Mondelez International, Inc., Class A | | | 331,270 | | | | 17,855,453 | | |
| | | | 23,799,605 | | |
Energy (10.2%): | |
Chevron Corp. | | | 93,335 | | | | 11,614,607 | | |
Devon Energy Corp. | | | 187,618 | | | | 5,350,865 | | |
Diamondback Energy, Inc. | | | 74,560 | | | | 8,124,803 | | |
Enterprise Products Partners LP (b) | | | 578,010 | | | | 16,687,148 | | |
EQT Corp. | | | 613,390 | | | | 9,697,696 | | |
Noble Energy, Inc. | | | 183,684 | | | | 4,114,522 | | |
| | | | 55,589,641 | | |
Health Care (9.1%): | |
Allergan PLC | | | 49,644 | | | | 8,311,895 | | |
AstraZeneca PLC, ADR | | | 151,334 | | | | 6,247,068 | | |
CVS Health Corp. | | | 100,395 | | | | 5,470,524 | | |
Humana, Inc. | | | 25,790 | | | | 6,842,087 | | |
UnitedHealth Group, Inc. | | | 40,415 | | | | 9,861,664 | | |
Zimmer Biomet Holdings, Inc. | | | 112,390 | | | | 13,232,799 | | |
| | | | 49,966,037 | | |
See notes to financial statements.
11
Victory Portfolios
Victory RS Large Cap Alpha Fund | | Schedule of Portfolio Investments — continued
June 30, 2019 | |
(Unaudited)
Security Description | | Shares | | Value | |
Industrials (6.5%): | |
Air Canada (a) | | | 264,830 | | | $ | 8,027,419 | | |
Eaton Corp. PLC, ADR | | | 146,540 | | | | 12,203,851 | | |
Parker-Hannifin Corp. | | | 51,640 | | | | 8,779,316 | | |
Union Pacific Corp. | | | 38,910 | | | | 6,580,070 | | |
| | | | 35,590,656 | | |
Information Technology (6.5%): | |
FleetCor Technologies, Inc. (a) | | | 58,550 | | | | 16,443,768 | | |
Visa, Inc., Class A | | | 109,990 | | | | 19,088,764 | | |
| | | | 35,532,532 | | |
Insurance (12.3%): | |
Aflac, Inc. | | | 389,190 | | | | 21,331,503 | | |
Brown & Brown, Inc. | | | 547,870 | | | | 18,353,645 | | |
Cincinnati Financial Corp. | | | 155,720 | | | | 16,143,492 | | |
RenaissanceRe Holdings Ltd., ADR | | | 58,410 | | | | 10,397,564 | | |
| | | | 66,226,204 | | |
Materials (4.4%): | |
Freeport-McMoRan, Inc. | | | 776,670 | | | | 9,017,139 | | |
Sealed Air Corp. (b) | | | 339,770 | | | | 14,535,361 | | |
| | | | 23,552,500 | | |
Mortgage Real Estate Investment Trusts (1.5%): | |
Agnc Investment Corp. | | | 469,900 | | | | 7,903,718 | | |
Real Estate (4.8%): | |
Equity Commonwealth | | | 371,660 | | | | 12,086,383 | | |
Invitation Homes, Inc. | | | 534,770 | | | | 14,294,402 | | |
| | | | 26,380,785 | | |
Utilities (5.9%): | �� |
Exelon Corp. | | | 161,780 | | | | 7,755,733 | | |
FirstEnergy Corp. | | | 278,560 | | | | 11,925,154 | | |
Vistra Energy Corp. (a) | | | 547,040 | | | | 12,384,986 | | |
| | | | 32,065,873 | | |
Total Common Stocks (Cost $440,861,747) | | | 525,597,635 | | |
See notes to financial statements.
12
Victory Portfolios
Victory RS Large Cap Alpha Fund | | Schedule of Portfolio Investments — continued
June 30, 2019 | |
(Unaudited)
Security Description | | Shares | | Value | |
Collateral for Securities Loaned^ (1.3%) | |
BlackRock Liquidity Funds TempFund Portfolio, Institutional Class, 2.43% (c) | | | 1,493,709 | | | $ | 1,493,709 | | |
Fidelity Investments Money Market Government Portfolio, Class I, 2.28% (c) | | | 1,924,068 | | | | 1,924,068 | | |
Fidelity Investments Prime Money Market Portfolio, Class I, 2.39% (c) | | | 49,968 | | | | 49,968 | | |
Goldman Sachs Financial Square Prime Obligations Fund, Institutional
Class, 2.48% (c) | | | 821,430 | | | | 821,430 | | |
JPMorgan Prime Money Market Fund, Capital Class, 2.41% (c) | | | 1,120,107 | | | | 1,120,107 | | |
Morgan Stanley Institutional Liquidity Prime Portfolio, Institutional Class, 2.42% (c) | | | 1,742,453 | | | | 1,742,453 | | |
Total Collateral for Securities Loaned (Cost $7,151,735) | | | 7,151,735 | | |
Total Investments (Cost $448,013,482) — 97.9% | | | 532,749,370 | | |
Other assets in excess of liabilities — 2.1% | | | 11,574,277 | | |
NET ASSETS — 100.00% | | $ | 544,323,647 | | |
^ Purchased with cash collateral from securities on loan.
(a) Non-income producing security.
(b) All or a portion of this security is on loan.
(c) Rate disclosed is the daily yield on June 30, 2019.
ADR — American Depositary Receipt
LP — Limited Partnership
PLC — Public Limited Company
See notes to financial statements.
13
Victory Portfolios
Victory RS Investors Fund | | Schedule of Portfolio Investments
June 30, 2019 | |
(Unaudited)
Security Description | | Shares | | Value | |
Common Stocks (96.8%) | |
Banks (2.0%): | |
First Hawaiian, Inc. | | | 32,040 | | | $ | 828,875 | | |
Capital Markets (4.8%): | |
CBOE Holdings, Inc. | | | 12,000 | | | | 1,243,560 | | |
E*TRADE Financial Corp. | | | 17,495 | | | | 780,277 | | |
| | | | 2,023,837 | | |
Communication Services (10.5%): | |
Alphabet, Inc., Class A (a) | | | 1,712 | | | | 1,853,754 | | |
Facebook, Inc., Class A (a) | | | 13,240 | | | | 2,555,320 | | |
| | | | 4,409,074 | | |
Consumer Discretionary (13.1%): | |
Aramark | | | 42,700 | | | | 1,539,762 | | |
Liberty Expedia Holdings, Inc., Class A (a) | | | 39,810 | | | | 1,902,520 | | |
LKQ Corp. (a) | | | 77,640 | | | | 2,066,000 | | |
| | | | 5,508,282 | | |
Consumer Staples (6.5%): | |
Hostess Brands, Inc. (a) (b) | | | 101,330 | | | | 1,463,205 | | |
Mondelez International, Inc., Class A | | | 23,020 | | | | 1,240,778 | | |
| | | | 2,703,983 | | |
Energy (9.3%): | |
Diamondback Energy, Inc. | | | 12,941 | | | | 1,410,180 | | |
EQT Corp. | | | 69,970 | | | | 1,106,226 | | |
Kosmos Energy Ltd. | | | 146,670 | | | | 919,621 | | |
Noble Energy, Inc. | | | 20,502 | | | | 459,245 | | |
| | | | 3,895,272 | | |
Health Care (2.6%): | |
Allergan PLC | | | 6,593 | | | | 1,103,866 | | |
Industrials (2.0%): | |
SkyWest, Inc. | | | 14,110 | | | | 856,054 | | |
Information Technology (9.2%): | |
Euronet Worldwide, Inc. (a) | | | 9,800 | | | | 1,648,752 | | |
NCR Corp. (a) | | | 26,330 | | | | 818,863 | | |
Verint Systems, Inc. (a) | | | 25,850 | | | | 1,390,213 | | |
| | | | 3,857,828 | | |
Insurance (18.3%): | |
Aflac, Inc. | | | 34,500 | | | | 1,890,946 | | |
Brown & Brown, Inc. | | | 49,250 | | | | 1,649,875 | | |
Mercury General Corp. | | | 29,160 | | | | 1,822,500 | | |
RenaissanceRe Holdings Ltd., ADR | | | 12,730 | | | | 2,266,067 | | |
| | | | 7,629,388 | | |
See notes to financial statements.
14
Victory Portfolios
Victory RS Investors Fund | | Schedule of Portfolio Investments — continued
June 30, 2019 | |
(Unaudited)
Security Description | | Shares | | Value | |
Materials (8.9%): | |
Crown Holdings, Inc. (a) | | | 15,170 | | | $ | 926,887 | | |
Graphic Packaging Holding Co. | | | 91,190 | | | | 1,274,836 | | |
Sealed Air Corp. (b) | | | 35,260 | | | | 1,508,423 | | |
| | | | 3,710,146 | | |
Real Estate (3.7%): | |
Equity Commonwealth | | | 48,120 | | | | 1,564,862 | | |
Thrifts & Mortgage Finance (2.0%): | |
Kearny Financial Corp. (b) | | | 63,100 | | | | 838,599 | | |
Utilities (3.9%): | |
Vistra Energy Corp. (a) | | | 71,530 | | | | 1,619,439 | | |
Total Common Stocks (Cost $33,997,832) | | | 40,549,505 | | |
Collateral for Securities Loaned^ (3.7%) | |
BlackRock Liquidity Funds TempFund Portfolio, Institutional Class, 2.43% (c) | | | 324,633 | | | | 324,633 | | |
Fidelity Investments Money Market Government Portfolio, Class I, 2.28% (c) | | | 418,164 | | | | 418,164 | | |
Fidelity Investments Prime Money Market Portfolio, Class I, 2.39% (c) | | | 10,860 | | | | 10,860 | | |
Goldman Sachs Financial Square Prime Obligations Fund, Institutional
Class, 2.48% (c) | | | 178,524 | | | | 178,524 | | |
JPMorgan Prime Money Market Fund, Capital Class, 2.41% (c) | | | 243,437 | | | | 243,437 | | |
Morgan Stanley Institutional Liquidity Prime Portfolio, Institutional Class, 2.42% (c) | | | 378,694 | | | | 378,694 | | |
Total Collateral for Securities Loaned (Cost $1,554,312) | | | 1,554,312 | | |
Total Investments (Cost $35,552,144) — 100.5% | | | 42,103,817 | | |
Liabilities in excess of other assets — (0.5)% | | | (197,002 | ) | |
NET ASSETS — 100.00% | | $ | 41,906,815 | | |
^ Purchased with cash collateral from securities on loan.
(a) Non-income producing security.
(b) All or a portion of this security is on loan.
(c) Rate disclosed is the daily yield on June 30, 2019.
ADR — American Depositary Receipt
PLC — Public Limited Company
See notes to financial statements.
15
Victory Portfolios
Victory Global Natural Resources Fund | | Schedule of Portfolio Investments
June 30, 2019 | |
(Unaudited)
Security Description | | Shares | | Value | |
Common Stocks (93.7%) | |
Energy Equipment & Services (1.6%): | |
Covia Holdings Corp. (a) (b) | | | 2,685,271 | | | $ | 5,263,131 | | |
Metals & Mining (36.3%): | |
First Quantum Minerals Ltd. | | | 5,111,085 | | | | 48,558,040 | | |
Rio Tinto PLC, ADR (b) | | | 119,274 | | | | 7,435,541 | | |
Turquoise Hill Resources Ltd. (a) (b) | | | 53,037,437 | | | | 65,766,422 | | |
| | | | 121,760,003 | | |
Oil, Gas & Consumable Fuels (55.8%): | |
Antero Resources Corp. (a) | | | 2,745,158 | | | | 15,180,724 | | |
Centennial Resource Development, Inc., Class A (a) (b) | | | 1,984,793 | | | | 15,064,579 | | |
Concho Resources, Inc. | | | 107,769 | | | | 11,119,605 | | |
EOG Resources, Inc. | | | 41,416 | | | | 3,858,315 | | |
EQT Corp. | | | 564,147 | | | | 8,919,164 | | |
Laredo Petroleum, Inc. (a) | | | 5,464,086 | | | | 15,845,849 | | |
Noble Energy, Inc. (b) | | | 488,097 | | | | 10,933,373 | | |
Peyto Exploration & Development Corp. | | | 4,156,255 | | | | 12,442,737 | | |
Range Resources Corp. | | | 7,515,345 | | | | 52,457,108 | | |
SRC Energy, Inc. (a) | | | 3,081,830 | | | | 15,285,877 | | |
Tourmaline Oil Corp. | | | 756,009 | | | | 9,630,541 | | |
Whitecap Resources, Inc. | | | 4,939,084 | | | | 16,031,088 | | |
| | | | 186,768,960 | | |
Total Common Stocks (Cost $720,280,409) | | | 313,792,094 | | |
Collateral for Securities Loaned^ (2.3%) | |
BlackRock Liquidity Funds TempFund Portfolio, Institutional Class, 2.43% (c) | | | 1,608,568 | | | | 1,608,568 | | |
Fidelity Investments Money Market Government Portfolio, Class I, 2.28% (c) | | | 2,072,020 | | | | 2,072,020 | | |
Fidelity Investments Prime Money Market Portfolio, Class I, 2.39% (c) | | | 53,810 | | | | 53,810 | | |
Goldman Sachs Financial Square Prime Obligations Fund, Institutional
Class, 2.48% (c) | | | 884,594 | | | | 884,594 | | |
JPMorgan Prime Money Market Fund, Capital Class, 2.41% (c) | | | 1,206,239 | | | | 1,206,239 | | |
Morgan Stanley Institutional Liquidity Prime Portfolio, Institutional
Class, 2.42% (c) | | | 1,876,440 | | | | 1,876,440 | | |
Total Collateral for Securities Loaned (Cost $7,701,671) | | | 7,701,671 | | |
Total Investments (Cost $727,982,080) — 96.0% | | | 321,493,765 | | |
Other assets in excess of liabilities — 4.0% | | | 13,353,864 | | |
NET ASSETS — 100.00% | | $ | 334,847,629 | | |
^ Purchased with cash collateral from securities on loan.
(a) Non-income producing security.
(b) All or a portion of this security is on loan.
(c) Rate disclosed is the daily yield on June 30, 2019.
ADR — American Depositary Receipt
PLC — Public Limited Company
See notes to financial statements.
16
Victory Portfolios | | Statements of Assets and Liabilities
June 30, 2019 | |
(Unaudited)
| | | Victory
RS Partners
Fund | | Victory
RS Value
Fund | | Victory
RS Large
Cap Alpha
Fund | |
ASSETS: | |
Investments, at value (Cost $375,280,639,
$352,378,394 and $448,013,482) | | $ | 444,840,135 | (a) | | $ | 400,891,405 | (b) | | $ | 532,749,370 | (c) | |
Cash and cash equivalents | | | 18,348,656 | | | | 11,036,410 | | | | 26,220,278 | | |
Interest and dividends receivable | | | 604,258 | | | | 468,123 | | | | 429,402 | | |
Receivable for capital shares issued | | | 133,634 | | | | 122,575 | | | | 26,540 | | |
Receivable for investments sold | | | 7,121,846 | | | | 783,474 | | | | 7,813,907 | | |
Receivable from Adviser | | | 88,708 | | | | 36,096 | | | | 86,544 | | |
Prepaid expenses | | | 33,889 | | | | 27,642 | | | | 31,824 | | |
Total Assets | | | 471,171,126 | | | | 413,365,725 | | | | 567,357,865 | | |
LIABILITIES: | |
Payables: | |
Collateral received on loaned securities | | | 28,299,844 | | | | 19,301,098 | | | | 7,151,735 | | |
Investments purchased | | | 9,671,956 | | | | 1,866,352 | | | | 15,022,661 | | |
Capital shares redeemed | | | 2,161,155 | | | | 1,782,275 | | | | 454,369 | | |
Accrued expenses and other payables: | |
Investment advisory fees | | | 349,159 | | | | 270,855 | | | | 220,660 | | |
Administration fees | | | 21,357 | | | | 19,514 | | | | 27,073 | | |
Custodian fees | | | 6,926 | | | | 7,718 | | | | 3,344 | | |
Transfer agent fees | | | 74,874 | | | | 72,987 | | | | 67,598 | | |
Chief Compliance Officer fees | | | 291 | | | | 259 | | | | 358 | | |
Trustees' fees | | | — | | | | 111 | | | | 461 | | |
| 12b-1 fees | | | 20,222 | | | | 23,750 | | | | 59,484 | | |
Other accrued expenses | | | 36,188 | | | | 23,348 | | | | 26,475 | | |
Total Liabilities | | | 40,641,972 | | | | 23,368,267 | | | | 23,034,218 | | |
NET ASSETS: | |
Capital | | | 340,995,885 | | | | 320,166,193 | | | | 441,553,673 | | |
Total distributable earnings/(loss) | | | 89,533,269 | | | | 69,831,265 | | | | 102,769,974 | | |
Net Assets | | $ | 430,529,154 | | | $ | 389,997,458 | | | $ | 544,323,647 | | |
Net Assets | |
Class A Shares | | $ | 194,201,130 | | | $ | 205,330,390 | | | $ | 497,902,748 | | |
Class C Shares | | | — | | | | 6,147,349 | | | | 17,539,927 | | |
Class R Shares | | | 1,492,649 | | | | 1,042,462 | | | | 6,903,153 | | |
Class Y Shares | | | 234,835,375 | | | | 177,477,257 | | | | 21,977,819 | | |
Total | | $ | 430,529,154 | | | $ | 389,997,458 | | | $ | 544,323,647 | | |
Shares (unlimited number of shares authorized
with a par value of $0.001 per share): | |
Class A Shares | | | 7,902,519 | | | | 8,307,813 | | | | 9,939,139 | | |
Class C Shares | | | — | | | | 280,136 | | | | 414,625 | | |
Class R Shares | | | 67,093 | | | | 44,508 | | | | 138,705 | | |
Class Y Shares | | | 8,966,446 | | | | 7,003,361 | | | | 440,299 | | |
Total | | | 16,936,058 | | | | 15,635,818 | | | | 10,932,768 | | |
Net asset value, offering (except Class A Shares)
and redemption price per share: | |
Class A Shares | | $ | 24.57 | | | $ | 24.72 | | | $ | 50.10 | | |
Class C Shares (d) | | | — | | | | 21.94 | | | | 42.30 | | |
Class R Shares | | | 22.25 | | | | 23.42 | | | | 49.77 | | |
Class Y Shares | | | 26.19 | | | | 25.34 | | | | 49.92 | | |
Maximum Sales Charge — Class A Shares | | | 5.75 | % | | | 5.75 | % | | | 5.75 | % | |
Maximum offering price (100%/(100%-maximum
sales charge) of net asset value adjusted to the
nearest cent) per share — Class A Shares | | $ | 26.07 | | | $ | 26.23 | | | $ | 53.16 | | |
(a) Includes $27,831,841 of securities on loan.
(b) Includes $19,095,830 of securities on loan.
(c) Includes $7,014,962 of securities on loan.
(d) Redemption price per share varies by the length of time shares are held.
See notes to financial statements.
17
Victory Portfolios | | Statements of Assets and Liabilities
June 30, 2019 | |
(Unaudited)
| | | Victory
RS Investors
Fund | | Victory
Global Natural
Resources
Fund | |
ASSETS: | |
Investments, at value (Cost $35,552,144 and $727,982,080) | | $ | 42,103,817 | (a) | | $ | 321,493,765 | (b) | |
Foreign currency, at value (Cost $— and $58,892) | | | — | | | | 58,260 | | |
Cash and cash equivalents | | | 2,039,714 | | | | 17,712,811 | | |
Interest and dividends receivable | | | 16,899 | | | | 172,838 | | |
Receivable for capital shares issued | | | 8,251 | | | | 847,307 | | |
Receivable for investments sold | | | — | | | | 3,924,423 | | |
Receivable from Adviser | | | 39,134 | | | | 125,536 | | |
Prepaid expenses | | | 8,022 | | | | 17,719 | | |
Total Assets | | | 44,215,837 | | | | 344,352,659 | | |
LIABILITIES: | |
Payables: | |
Collateral received on loaned securities | | | 1,554,312 | | | | 7,701,671 | | |
Investments purchased | | | 491,753 | | | | — | | |
Capital shares redeemed | | | 204,764 | | | | 1,310,433 | | |
Accrued expenses and other payables: | |
Investment advisory fees | | | 34,109 | | | | 278,988 | | |
Administration fees | | | 2,089 | | | | 16,939 | | |
Custodian fees | | | 324 | | | | 11,905 | | |
Transfer agent fees | | | 9,564 | | | | 127,575 | | |
Chief Compliance Officer fees | | | 29 | | | | 384 | | |
| 12b-1 fees | | | 5,045 | | | | 6,873 | | |
Other accrued expenses | | | 7,033 | | | | 50,262 | | |
Total Liabilities | | | 2,309,022 | | | | 9,505,030 | | |
NET ASSETS: | |
Capital | | | 34,927,580 | | | | 2,230,431,215 | | |
Total distributable earnings/(loss) | | | 6,979,235 | | | | (1,895,583,586 | ) | |
Net Assets | | $ | 41,906,815 | | | $ | 334,847,629 | | |
Net Assets | |
Class A Shares | | $ | 17,369,402 | | | $ | 49,503,800 | | |
Class C Shares | | | 7,568,108 | | | | 4,296,973 | | |
Class R Shares | | | 907,127 | | | | 757,779 | | |
Class Y Shares | | | 16,062,178 | | | | 280,289,077 | | |
Total | | $ | 41,906,815 | | | $ | 334,847,629 | | |
Shares (unlimited number of shares authorized with a
par value of $0.001 per share): | |
Class A Shares | | | 1,334,248 | | | | 4,482,094 | | |
Class C Shares | | | 653,759 | | | | 431,851 | | |
Class R Shares | | | 77,268 | | | | 72,571 | | |
Class Y Shares | | | 1,203,036 | | | | 24,353,828 | | |
Total | | | 3,268,311 | | | | 29,340,344 | | |
Net asset value, offering (except Class A Shares) and
redemption price per share: | |
Class A Shares | | $ | 13.02 | | | $ | 11.04 | | |
Class C Shares (c) | | | 11.58 | | | | 9.95 | | |
Class R Shares | | | 11.74 | | | | 10.44 | | |
Class Y Shares | | | 13.35 | | | | 11.51 | | |
Maximum Sales Charge — Class A Shares | | | 5.75 | % | | | 5.75 | % | |
Maximum offering price (100%/(100%-maximum
sales charge) of net asset value adjusted to the
nearest cent) per share — Class A Shares | | $ | 13.81 | | | $ | 11.71 | | |
(a) Includes $1,536,091 of securities on loan.
(b) Includes $7,597,758 of securities on loan.
(c) Redemption price per share varies by the length of time shares are held.
See notes to financial statements.
18
Victory Portfolios | | Statements of Operations
For the Six Months Ended June 30, 2019 | |
(Unaudited)
| | | Victory
RS Partners
Fund | | Victory
RS Value
Fund | | Victory
RS Large
Cap Alpha
Fund | |
Investment Income: | |
Dividends | | $ | 3,863,873 | | | $ | 3,010,934 | | | $ | 5,069,671 | | |
Interest | | | 173,166 | | | | 140,563 | | | | 190,531 | | |
Securities lending (net of fees) | | | 30,756 | | | | 20,458 | | | | 6,161 | | |
Foreign tax withholding | | | (8,975 | ) | | | — | | | | — | | |
Total Income | | | 4,058,820 | | | | 3,171,955 | | | | 5,266,363 | | |
Expenses: | |
Investment advisory fees | | | 2,202,539 | | | | 1,655,392 | | | | 1,320,424 | | |
Administration fees | | | 139,233 | | | | 123,056 | | | | 166,855 | | |
12b-1 fees — Class A Shares | | | 236,093 | | | | 248,512 | | | | 600,578 | | |
12b-1 fees — Class C Shares | | | — | | | | 42,557 | | | | 93,471 | | |
12b-1 fees — Class R Shares | | | 3,488 | | | | 2,739 | | | | 16,812 | | |
Custodian fees | | | 9,307 | | | | 7,831 | | | | 11,979 | | |
Transfer agent fees | | | 25,899 | | | | 19,103 | | | | 19,037 | | |
Transfer agent fees — Class A Shares | | | 139,071 | | | | 129,977 | | | | 229,156 | | |
Transfer agent fees — Class C Shares | | | — | | | | 5,935 | | | | 8,055 | | |
Transfer agent fees — Class R Shares | | | 1,595 | | | | 2,470 | | | | 7,708 | | |
Transfer agent fees — Class Y Shares | | | 100,040 | | | | 85,910 | | | | 11,127 | | |
Trustees' fees | | | 20,350 | | | | 17,503 | | | | 23,107 | | |
Chief Compliance Officer fees | | | 1,849 | | | | 1,605 | | | | 2,155 | | |
Legal and audit fees | | | 21,953 | | | | 19,473 | | | | 24,659 | | |
State registration and filing fees | | | 27,128 | | | | 37,427 | | | | 33,553 | | |
Other expenses | | | 44,622 | | | | 35,714 | | | | 21,295 | | |
Total Expenses | | | 2,973,167 | | | | 2,435,204 | | | | 2,589,971 | | |
Expenses waived/reimbursed by Adviser | | | (189,595 | ) | | | (84,787 | ) | | | (174,407 | ) | |
Net Expenses | | | 2,783,572 | | | | 2,350,417 | | | | 2,415,564 | | |
Net Investment Income (Loss) | | | 1,275,248 | | | | 821,538 | | | | 2,850,799 | | |
Realized/Unrealized Gains (Losses) from
Investments: | |
Net realized gains (losses) from investment
securities and foreign currency translations | | | 25,632,484 | | | | 19,657,242 | | | | 6,907,972 | | |
Net change in unrealized appreciation/depreciation
on investment securities and foreign currency
translations | | | 63,134,424 | | | | 55,699,101 | | | | 79,457,494 | | |
Net realized/unrealized gains (losses) on investments | | | 88,766,908 | | | | 75,356,343 | | | | 86,365,466 | | |
Change in net assets resulting from operations | | $ | 90,042,156 | | | $ | 76,177,881 | | | $ | 89,216,265 | | |
See notes to financial statements.
19
Victory Portfolios | | Statements of Operations
For the Six Months Ended June 30, 2019 | |
(Unaudited)
| | | Victory
RS Investors
Fund | | Victory
Global Natural
Resources
Fund | |
Investment Income: | |
Dividends | | $ | 226,895 | | | $ | 2,922,184 | | |
Interest | | | 13,444 | | | | 221,401 | | |
Securities lending (net of fees) | | | 1,166 | | | | 33,436 | | |
Foreign tax withholding | | | — | | | | (206,008 | ) | |
Total Income | | | 241,505 | | | | 2,971,013 | | |
Expenses: | |
Investment advisory fees | | | 205,953 | | | | 2,308,045 | | |
Administration fees | | | 13,013 | | | | 146,000 | | |
12b-1 fees — Class A Shares | | | 21,237 | | | | 78,340 | | |
12b-1 fees — Class C Shares | | | 38,970 | | | | 31,467 | | |
12b-1 fees — Class R Shares | | | 2,224 | | | | 2,286 | | |
Custodian fees | | | 1,625 | | | | 15,916 | | |
Transfer agent fees | | | 3,182 | | | | 60,919 | | |
Transfer agent fees — Class A Shares | | | 10,889 | | | | 84,290 | | |
Transfer agent fees — Class C Shares | | | 4,803 | | | | 8,340 | | |
Transfer agent fees — Class R Shares | | | 1,069 | | | | 1,561 | | |
Transfer agent fees — Class Y Shares | | | 11,491 | | | | 221,848 | | |
Trustees' fees | | | 1,909 | | | | 25,887 | | |
Chief Compliance Officer fees | | | 170 | | | | 2,241 | | |
Legal and audit fees | | | 5,426 | | | | 26,352 | | |
State registration and filing fees | | | 34,266 | | | | 45,947 | | |
Other expenses | | | 6,483 | | | | 49,250 | | |
Total Expenses | | | 362,710 | | | | 3,108,689 | | |
Expenses waived/reimbursed by Adviser | | | (78,806 | ) | | | (316,678 | ) | |
Net Expenses | | | 283,904 | | | | 2,792,011 | | |
Net Investment Income (Loss) | | | (42,399 | ) | | | 179,002 | | |
Realized/Unrealized Gains (Losses) from Investments: | |
Net realized gains (losses) from investment securities and
foreign currency translations | | | 598,350 | | | | (38,320,005 | ) | |
Net change in unrealized appreciation/depreciation on
investment securities | | | 7,500,899 | | | | (18,128,932 | ) | |
Net realized/unrealized gains (losses) on investments | | | 8,099,249 | | | | (56,448,937 | ) | |
Change in net assets resulting from operations | | $ | 8,056,850 | | | $ | (56,269,935 | ) | |
See notes to financial statements.
20
Victory Portfolios | | Statements of Changes in Net Assets | |
| | | Victory
RS Partners
Fund | | Victory
RS Value
Fund | | Victory
RS Large Cap Alpha
Fund | |
| | Six Months
Ended
June 30,
2019 | | Year
Ended
December 31,
2018 | | Six Months
Ended
June 30,
2019 | | Year
Ended
December 31,
2018 | | Six Months
Ended
June 30,
2019 | | Year
Ended
December 31,
2018 | |
| | (Unaudited) | | | | (Unaudited) | | | | (Unaudited) | | | |
From Investment Activities: | |
Operations: | |
Net investment
income (loss) | | $ | 1,275,248 | | | $ | 1,833,237 | | | $ | 821,538 | | | $ | 1,554,498 | | | $ | 2,850,799 | | | $ | 4,308,297 | | |
Net realized gains
(losses) from
investments | | | 25,632,484 | | | | 86,121,266 | | | | 19,657,242 | | | | 47,724,006 | | | | 6,907,972 | | | | 81,827,397 | | |
Net change in
unrealized
appreciation/
depreciation
on investments | | | 63,134,424 | | | | (147,254,191 | ) | | | 55,699,101 | | | | (93,914,909 | ) | | | 79,457,494 | | | | (135,809,861 | ) | |
Change in net assets
resulting from
operations | | | 90,042,156 | | | | (59,299,688 | ) | | | 76,177,881 | | | | (44,636,405 | ) | | | 89,216,265 | | | | (49,674,167 | ) | |
Distributions to
Shareholders: | |
Class A Shares | | | (5,299,588 | ) | | | (35,773,137 | ) | | | — | | | | (24,922,768 | ) | | | — | | | | (80,490,381 | ) | |
Class C Shares | | | — | | | | — | | | | — | | | | (1,375,886 | ) | | | — | | | | (3,700,952 | ) | |
Class R Shares | | | (43,836 | ) | | | (270,891 | ) | | | — | | | | (162,838 | ) | | | — | | | | (1,216,665 | ) | |
Class Y Shares | | | (7,460,499 | ) | | | (49,823,881 | ) | | | — | | | | (24,215,948 | ) | | | — | | | | (4,333,722 | ) | |
Change in net assets
resulting from
distributions to
shareholders | | | (12,803,923 | ) | | | (85,867,909 | ) | | | — | | | | (50,677,440 | ) | | | — | | | | (89,741,720 | ) | |
Change in net assets
resulting from
capital transactions | | | (74,347,619 | ) | | | (37,433,612 | ) | | | (42,700,385 | ) | | | (54,228,953 | ) | | | (30,329,374 | ) | | | 10,452,685 | | |
Change in net assets | | | 2,890,614 | | | | (182,601,209 | ) | | | 33,477,496 | | | | (149,542,798 | ) | | | 58,886,891 | | | | (128,963,202 | ) | |
Net Assets: | |
Beginning of period | | | 427,638,540 | | | | 610,239,749 | | | | 356,519,962 | | | | 506,062,760 | | | | 485,436,756 | | | | 614,399,958 | | |
End of period | | $ | 430,529,154 | | | $ | 427,638,540 | | | $ | 389,997,458 | | | $ | 356,519,962 | | | $ | 544,323,647 | | | $ | 485,436,756 | | |
(continues on next page)
See notes to financial statements.
21
Victory Portfolios | | Statements of Changes in Net Assets | |
(continued)
| | | Victory
RS Partners
Fund | | Victory
RS Value
Fund | | Victory
RS Large Cap Alpha
Fund | |
| | | Six Months
Ended
June 30,
2019 | | Year
Ended
December 31,
2018 | | Six Months
Ended
June 30,
2019 | | Year
Ended
December 31,
2018 | | Six Months
Ended
June 30,
2019 | | Year
Ended
December 31,
2018 | |
| | (Unaudited) | | | | (Unaudited) | | | | (Unaudited) | | | |
Capital Transactions: | |
Class A Shares | |
Proceeds from
shares issued | | $ | 7,875,519 | | | $ | 10,542,694 | | | $ | 7,405,405 | | | $ | 14,150,821 | | | $ | 7,832,797 | | | $ | 20,740,364 | | |
Distributions reinvested | | | 5,213,420 | | | | 35,117,192 | | | | — | | | | 24,219,793 | | | | — | | | | 77,994,848 | | |
Cost of shares redeemed | | | (27,084,149 | ) | | | (68,463,235 | ) | | | (20,122,533 | ) | | | (51,805,118 | ) | | | (30,010,078 | ) | | | (75,131,993 | ) | |
Total Class A Shares | | $ | (13,995,210 | ) | | $ | (22,803,349 | ) | | $ | (12,717,128 | ) | | $ | (13,434,504 | ) | | $ | (22,177,281 | ) | | $ | 23,603,219 | | |
Class C Shares | |
Proceeds from
shares issued | | $ | — | | | $ | — | | | $ | 307,566 | | | $ | 1,342,072 | | | $ | 329,728 | | | $ | 2,049,875 | | |
Distributions reinvested | | | — | | | | — | | | | — | | | | 1,333,779 | | | | — | | | | 3,453,415 | | |
Cost of shares redeemed | | | — | | | | — | | | | (5,364,241 | ) | | | (7,541,603 | ) | | | (4,175,970 | ) | | | (11,400,448 | ) | |
Total Class C Shares | | $ | — | | | $ | — | | | $ | (5,056,675 | ) | | $ | (4,865,752 | ) | | $ | (3,846,242 | ) | | $ | (5,897,158 | ) | |
Class R Shares | |
Proceeds from
shares issued | | $ | 77,365 | | | $ | 250,543 | | | $ | 57,101 | | | $ | 214,961 | | | $ | 290,574 | | | $ | 1,047,801 | | |
Distributions reinvested | | | 43,836 | | | | 270,891 | | | | — | | | | 162,838 | | | | — | | | | 1,210,626 | | |
Cost of shares redeemed | | | (62,163 | ) | | | (1,018,596 | ) | | | (246,558 | ) | | | (669,866 | ) | | | (862,920 | ) | | | (4,210,175 | ) | |
Total Class R Shares | | $ | 59,038 | | | $ | (497,162 | ) | | $ | (189,457 | ) | | $ | (292,067 | ) | | $ | (572,346 | ) | | $ | (1,951,748 | ) | |
Class Y Shares | |
Proceeds from
shares issued | | $ | 23,970,202 | | | $ | 33,627,569 | | | $ | 9,344,781 | | | $ | 17,137,847 | | | $ | 1,651,452 | | | $ | 6,642,092 | | |
Distributions reinvested | | | 7,423,032 | | | | 49,499,526 | | | | — | | | | 23,672,512 | | | | — | | | | 4,119,726 | | |
Cost of shares redeemed | | | (91,804,681 | ) | | | (97,260,196 | ) | | | (34,081,906 | ) | | | (76,446,989 | ) | | | (5,384,957 | ) | | | (16,063,446 | ) | |
Total Class Y Shares | | $ | (60,411,447 | ) | | $ | (14,133,101 | ) | | $ | (24,737,125 | ) | | $ | (35,636,630 | ) | | $ | (3,733,505 | ) | | $ | (5,301,628 | ) | |
Change in net assets resulting
from capital transactions | | $ | (74,347,619 | ) | | $ | (37,433,612 | ) | | $ | (42,700,385 | ) | | $ | (54,228,953 | ) | | $ | (30,329,374 | ) | | $ | 10,452,685 | | |
(continues on next page)
See notes to financial statements.
22
Victory Portfolios | | Statements of Changes in Net Assets | |
(continued)
| | | Victory
RS Partners
Fund | | Victory
RS Value
Fund | | Victory
RS Large Cap Alpha
Fund | |
| | | Six Months
Ended
June 30,
2019 | | Year
Ended
December 31,
2018 | | Six Months
Ended
June 30,
2019 | | Year
Ended
December 31,
2018 | | Six Months
Ended
June 30,
2019 | | Year
Ended
December 31,
2018 | |
| | (Unaudited) | | | | (Unaudited) | | | | (Unaudited) | | | |
Share Transactions: | |
Class A Shares | |
Issued | | | 335,482 | | | | 370,388 | | | | 314,912 | | | | 539,942 | | | | 164,994 | | | | 364,209 | | |
Reinvested | | | 228,759 | | | | 1,683,464 | | | | — | | | | 1,176,725 | | | | — | | | | 1,825,583 | | |
Redeemed | | | (1,168,239 | ) | | | (2,415,797 | ) | | | (860,290 | ) | | | (2,021,000 | ) | | | (628,520 | ) | | | (1,340,333 | ) | |
Total Class A Shares | | | (603,998 | ) | | | (361,945 | ) | | | (545,378 | ) | | | (304,333 | ) | | | (463,526 | ) | | | 849,459 | | |
Class C Shares | |
Issued | | | — | | | | — | | | | 15,111 | | | | 60,727 | | | | 8,504 | | | | 43,140 | | |
Reinvested | | | — | | | | — | | | | — | | | | 73,124 | | | | — | | | | 96,062 | | |
Redeemed | | | — | | | | — | | | | (256,588 | ) | | | (324,233 | ) | | | (103,277 | ) | | | (231,269 | ) | |
Total Class C Shares | | | — | | | | — | | | | (241,477 | ) | | | (190,382 | ) | | | (94,773 | ) | | | (92,067 | ) | |
Class R Shares | |
Issued | | | 3,627 | | | | 9,314 | | | | 2,553 | | | | 8,571 | | | | 6,151 | | | | 18,584 | | |
Reinvested | | | 2,123 | | | | 14,325 | | | | — | | | | 8,359 | | | | — | | | | 28,596 | | |
Redeemed | | | (2,919 | ) | | | (39,384 | ) | | | (10,944 | ) | | | (28,882 | ) | | | (18,563 | ) | | | (77,609 | ) | |
Total Class R Shares | | | 2,831 | | | | (15,745 | ) | | | (8,391 | ) | | | (11,952 | ) | | | (12,412 | ) | | | (30,429 | ) | |
Class Y Shares | |
Issued | | | 953,411 | | | | 1,142,322 | | | | 392,018 | | | | 656,480 | | | | 34,552 | | | | 115,708 | | |
Reinvested | | | 305,978 | | | | 2,227,155 | | | | — | | | | 1,119,999 | | | | — | | | | 96,691 | | |
Redeemed | | | (3,718,683 | ) | | | (3,323,588 | ) | | | (1,407,519 | ) | | | (3,005,028 | ) | | | (113,835 | ) | | | (289,399 | ) | |
Total Class Y Shares | | | (2,459,294 | ) | | | 45,889 | | | | (1,015,501 | ) | | | (1,228,549 | ) | | | (79,283 | ) | | | (77,000 | ) | |
Change in Shares | | | (3,060,461 | ) | | | (331,801 | ) | | | (1,810,747 | ) | | | (1,735,216 | ) | | | (649,994 | ) | | | 649,963 | | |
See notes to financial statements.
23
Victory Portfolios | | Statements of Changes in Net Assets | |
| | | Victory RS Investors
Fund | | Victory Global Natural Resources
Fund | |
| | | Six Months
Ended
June 30,
2019 | | Year
Ended
December 31,
2018 | | Six Months
Ended
June 30,
2019 | | Year
Ended
December 31,
2018 | |
| | (Unaudited) | | | | (Unaudited) | | | |
From Investment Activities: | |
Operations: | |
Net investment income (loss) | | $ | (42,399 | ) | | $ | (54,803 | ) | | $ | 179,002 | | | $ | (4,077,976 | ) | |
Net realized gains (losses) from
investments | | | 598,350 | | | | 5,799,863 | | | | (38,320,005 | ) | | | (193,930,232 | ) | |
Net change in unrealized
appreciation/depreciation
on investments | | | 7,500,899 | | | | (9,808,027 | ) | | | (18,128,932 | ) | | | (289,417,818 | ) | |
Change in net assets resulting
from operations | | | 8,056,850 | | | | (4,062,967 | ) | | | (56,269,935 | ) | | | (487,426,026 | ) | |
Distributions to Shareholders: | |
Class A Shares | | | — | | | | (2,453,812 | ) | | | — | | | | — | | |
Class C Shares | | | — | | | | (1,248,830 | ) | | | — | | | | — | | |
Class R Shares | | | — | | | | (139,602 | ) | | | — | | | | — | | |
Class Y Shares | | | — | | | | (2,365,022 | ) | | | — | | | | — | | |
Change in net assets resulting
from distributions to shareholders | | | — | | | | (6,207,266 | ) | | | — | | | | — | | |
Change in net assets resulting
from capital transactions | | | (4,613,942 | ) | | | (11,344,224 | ) | | | (74,323,387 | ) | | | (458,989,878 | ) | |
Change in net assets | | | 3,442,908 | | | | (21,614,457 | ) | | | (130,593,322 | ) | | | (946,415,904 | ) | |
Net Assets: | |
Beginning of period | | | 38,463,907 | | | | 60,078,364 | | | | 465,440,951 | | | | 1,411,856,855 | | |
End of period | | $ | 41,906,815 | | | $ | 38,463,907 | | | $ | 334,847,629 | | | $ | 465,440,951 | | |
(continues on next page)
See notes to financial statements.
24
Victory Portfolios | | Statements of Changes in Net Assets | |
(continued)
| | | Victory RS Investors
Fund | | Victory Global Natural Resources
Fund | |
| | | Six Months
Ended
June 30,
2019 | | Year
Ended
December 31,
2018 | | Six Months
Ended
June 30,
2019 | | Year
Ended
December 31,
2018 | |
| | (Unaudited) | | | | (Unaudited) | | | |
Capital Transactions: | |
Class A Shares | |
Proceeds from shares issued | | $ | 752,260 | | | $ | 1,692,860 | | | $ | 6,160,073 | | | $ | 41,141,199 | | |
Distributions reinvested | | | — | | | | 2,382,350 | | | | — | | | | — | | |
Cost of shares redeemed | | | (2,359,353 | ) | | | (4,704,359 | ) | | | (12,614,204 | ) | | | (168,408,240 | ) | |
Total Class A Shares | | $ | (1,607,093 | ) | | $ | (629,149 | ) | | $ | (6,454,131 | ) | | $ | (127,267,041 | ) | |
Class C Shares | |
Proceeds from shares issued | | $ | 266,545 | | | $ | 474,091 | | | $ | 132,536 | | | $ | 577,051 | | |
Distributions reinvested | | | — | | | | 1,055,957 | | | | — | | | | — | | |
Cost of shares redeemed | | | (1,493,904 | ) | | | (3,353,594 | ) | | | (2,046,343 | ) | | | (7,085,345 | ) | |
Total Class C Shares | | $ | (1,227,359 | ) | | $ | (1,823,546 | ) | | $ | (1,913,807 | ) | | $ | (6,508,294 | ) | |
Class R Shares | |
Proceeds from shares issued | | $ | 24,049 | | | $ | 110,635 | | | $ | 122,878 | | | $ | 562,850 | | |
Distributions reinvested | | | — | | | | 139,602 | | | | — | | | | — | | |
Cost of shares redeemed | | | (120,609 | ) | | | (577,298 | ) | | | (162,882 | ) | | | (1,061,738 | ) | |
Total Class R Shares | | $ | (96,560 | ) | | $ | (327,061 | ) | | $ | (40,004 | ) | | $ | (498,888 | ) | |
Class Y Shares | |
Proceeds from shares issued | | $ | 2,701,183 | | | $ | 2,756,651 | | | $ | 74,107,741 | | | $ | 264,889,815 | | |
Distributions reinvested | | | — | | | | 2,290,072 | | | | — | | | | — | | |
Cost of shares redeemed | | | (4,384,113 | ) | | | (13,611,191 | ) | | | (140,023,186 | ) | | | (526,709,948 | ) | |
Cost of Shares redeemed in-kind | | | — | | | | — | | | | — | | | | (62,895,522 | ) | |
Total Class Y Shares | | $ | (1,682,930 | ) | | $ | (8,564,468 | ) | | $ | (65,915,445 | ) | | $ | (324,715,655 | ) | |
Change in net assets resulting from
capital transactions | | $ | (4,613,942 | ) | | $ | (11,344,224 | ) | | $ | (74,323,387 | ) | | $ | (458,989,878 | ) | |
(continues on next page)
See notes to financial statements.
25
Victory Portfolios | | Statements of Changes in Net Assets | |
(continued)
| | | Victory RS Investors
Fund | | Victory Global Natural Resources
Fund | |
| | | Six Months
Ended
June 30,
2019 | | Year
Ended
December 31,
2018 | | Six Months
Ended
June 30,
2019 | | Year
Ended
December 31,
2018 | |
| | (Unaudited) | | | | (Unaudited) | | | |
Share Transactions: | |
Class A Shares | |
Issued | | | 59,798 | | | | 121,865 | | | | 469,558 | | | | 1,809,584 | | |
Reinvested | | | — | | | | 219,774 | | | | — | | | | — | | |
Redeemed | | | (194,250 | ) | | | (346,502 | ) | | | (963,734 | ) | | | (7,892,823 | ) | |
Total Class A Shares | | | (134,452 | ) | | | (4,863 | ) | | | (494,176 | ) | | | (6,083,239 | ) | |
Class C Shares | |
Issued | | | 23,615 | | | | 42,948 | | | | 11,219 | | | | 30,147 | | |
Reinvested | | | — | | | | 109,086 | | | | — | | | | — | | |
Redeemed | | | (133,938 | ) | | | (266,960 | ) | | | (175,883 | ) | | | (377,893 | ) | |
Total Class C Shares | | | (110,323 | ) | | | (114,926 | ) | | | (164,664 | ) | | | (347,746 | ) | |
Class R Shares | |
Issued | | | 2,155 | | | | 8,825 | | | | 9,715 | | | | 28,741 | | |
Reinvested | | | — | | | | 14,231 | | | | — | | | | — | | |
Redeemed | | | (10,906 | ) | | | (44,650 | ) | | | (12,672 | ) | | | (61,437 | ) | |
Total Class R Shares | | | (8,751 | ) | | | (21,594 | ) | | | (2,957 | ) | | | (32,696 | ) | |
Class Y Shares | |
Issued | | | 211,221 | | | | 202,137 | | | | 5,326,858 | | | | 11,961,924 | | |
Reinvested | | | — | | | | 206,346 | | | | — | | | | — | | |
Redeemed | | | (349,509 | ) | | | (991,078 | ) | | | (10,389,391 | ) | | | (25,719,904 | ) | |
Redeemed in-kind | | | — | | | | — | | | | — | | | | (2,611,940 | ) | |
Total Class Y Shares | | | (138,288 | ) | | | (582,595 | ) | | | (5,062,533 | ) | | | (16,369,920 | ) | |
Change in Shares | | | (391,814 | ) | | | (723,978 | ) | | | (5,724,330 | ) | | | (22,833,601 | ) | |
See notes to financial statements.
26
This page is intentionally left blank.
27
Victory Portfolios | | Financial Highlights | |
For a Share Outstanding Throughout Each Period
| | | | Investment Activities | | Distributions to
Shareholders From | |
| | | Net Asset
Value,
Beginning of
Period | | Net
Investment
Income
(Loss)(a) | | Net Realized
and Unrealized
Gains (Losses)
on Investments | | Total from
Investment
Activities | | Net
Investment
Income | | Net Realized
Gains from
Investments | |
Victory RS Partners Fund | |
Class A | |
Six Months Ended
6/30/19 (unaudited) | | $ | 20.66 | | | | 0.04 | | | | 4.53 | | | | 4.57 | | | | — | | | | (0.66 | ) | |
Year Ended 12/31/18 | | $ | 29.21 | | | | 0.04 | | | | (3.52 | ) | | | (3.48 | ) | | | (0.08 | ) | | | (4.99 | ) | |
Year Ended 12/31/17 | | $ | 31.58 | | | | (0.25 | ) | | | 4.78 | | | | 4.53 | | | | — | | | | (6.90 | ) | |
Year Ended 12/31/16 | | $ | 26.89 | | | | (0.12 | ) | | | 6.59 | | | | 6.47 | | | | — | | | | (1.78 | ) | |
Year Ended 12/31/15 | | $ | 31.08 | | | | (0.11 | ) | | | (3.22 | ) | | | (3.33 | ) | | | — | | | | (0.86 | ) | |
Year Ended 12/31/14 | | $ | 40.09 | | | | (0.14 | ) | | | (1.52 | ) | | | (1.66 | ) | | | — | | | | (7.35 | ) | |
Class R | |
Six Months Ended
6/30/19 (unaudited) | | $ | 18.79 | | | | — | (f) | | | 4.12 | | | | 4.12 | | | | — | | | | (0.66 | ) | |
Year Ended 12/31/18 | | $ | 27.09 | | | | (0.04 | ) | | | (3.27 | ) | | | (3.31 | ) | | | — | | | | (4.99 | ) | |
Year Ended 12/31/17 | | $ | 29.84 | | | | (0.44 | ) | | | 4.59 | | | | 4.15 | | | | — | | | | (6.90 | ) | |
Year Ended 12/31/16 | | $ | 25.57 | | | | (0.21 | ) | | | 6.26 | | | | 6.05 | | | | — | | | | (1.78 | ) | |
Year Ended 12/31/15 | | $ | 29.72 | | | | (0.21 | ) | | | (3.08 | ) | | | (3.29 | ) | | | — | | | | (0.86 | ) | |
Year Ended 12/31/14 | | $ | 38.82 | | | | (0.25 | ) | | | (1.50 | ) | | | (1.75 | ) | | | — | | | | (7.35 | ) | |
Class Y | |
Six Months Ended
6/30/19 (unaudited) | | $ | 21.94 | | | | 0.09 | | | | 4.82 | | | | 4.91 | | | | — | | | | (0.66 | ) | |
Year Ended 12/31/18 | | $ | 30.67 | | | | 0.14 | | | | (3.71 | ) | | | (3.57 | ) | | | (0.17 | ) | | | (4.99 | ) | |
Year Ended 12/31/17 | | $ | 32.75 | | | | (0.04 | ) | | | 4.86 | | | | 4.82 | | | | — | | | | (6.90 | ) | |
Year Ended 12/31/16 | | $ | 27.75 | | | | (0.03 | ) | | | 6.81 | | | | 6.78 | | | | — | | | | (1.78 | ) | |
Year Ended 12/31/15 | | $ | 31.95 | | | | (0.02 | ) | | | (3.32 | ) | | | (3.34 | ) | | | — | | | | (0.86 | ) | |
Year Ended 12/31/14 | | $ | 40.86 | | | | 0.01 | | | | (1.57 | ) | | | (1.56 | ) | | | — | | | | (7.35 | ) | |
(a) Per share net investment income (loss) has been calculated using the average daily shares method.
(b) Not annualized for periods less than one year.
(c) Annualized for periods less than one year.
(d) During the period, certain fees were reduced and/or reimbursed. If such fee reductions and/or reimbursements had not occurred, the ratios would have been as indicated.
(e) Portfolio turnover is calculated on the basis of the Fund as a whole without distinguishing between the classes of shares issued.
(f) Amount is less than $0.005 per share.
See notes to financial statements.
28
Victory Portfolios | | Financial Highlights — continued | |
For a Share Outstanding Throughout Each Period
| | | | Ratios to Average Net Assets | | Supplemental Data | |
| | | Total
Distributions
to
Shareholders | | Net Asset
Value,
End of
Period | | Total
Return
(Excludes
Sales
Charge)(b) | | Net
Expenses(c) | | Net
Investment
Income
(Loss)(c) | | Gross
Expenses(c)(d) | | Net Assets,
End of
Period
(000's) | | Portfolio
Turnover(b)(e) | |
Victory RS Partners Fund | |
Class A | |
Six Months Ended
6/30/19 (unaudited) | | | (0.66 | ) | | $ | 24.57 | | | | 22.44 | % | | | 1.45 | % | | | 0.37 | % | | | 1.53 | % | | $ | 194,201 | | | | 29 | % | |
Year Ended 12/31/18 | | | (5.07 | ) | | $ | 20.66 | | | | (12.04 | )% | | | 1.45 | % | | | 0.14 | % | | | 1.52 | % | | $ | 175,723 | | | | 62 | % | |
Year Ended 12/31/17 | | | (6.90 | ) | | $ | 29.21 | | | | 14.21 | % | | | 1.45 | % | | | (0.75 | )% | | | 1.50 | % | | $ | 259,050 | | | | 38 | % | |
Year Ended 12/31/16 | | | (1.78 | ) | | $ | 31.58 | | | | 24.04 | % | | | 1.45 | % | | | (0.44 | )% | | | 1.53 | % | | $ | 378,695 | | | | 60 | % | |
Year Ended 12/31/15 | | | (0.86 | ) | | $ | 26.89 | | | | (10.74 | )% | | | 1.42 | % | | | (0.35 | )% | | | 1.42 | % | | $ | 475,722 | | | | 42 | % | |
Year Ended 12/31/14 | | | (7.35 | ) | | $ | 31.08 | | | | (3.85 | )% | | | 1.45 | % | | | (0.35 | )% | | | 1.55 | % | | $ | 827,108 | | | | 47 | % | |
Class R | |
Six Months Ended
6/30/19 (unaudited) | | | (0.66 | ) | | $ | 22.25 | | | | 22.22 | % | | | 1.81 | % | | | 0.02 | % | | | 2.65 | % | | $ | 1,493 | | | | 29 | % | |
Year Ended 12/31/18 | | | (4.99 | ) | | $ | 18.79 | | | | (12.39 | )% | | | 1.81 | % | | | (0.16 | )% | | | 2.37 | % | | $ | 1,207 | | | | 62 | % | |
Year Ended 12/31/17 | | | (6.90 | ) | | $ | 27.09 | | | | 13.81 | % | | | 1.81 | % | | | (1.40 | )% | | | 2.28 | % | | $ | 2,168 | | | | 38 | % | |
Year Ended 12/31/16 | | | (1.78 | ) | | $ | 29.84 | | | | 23.64 | % | | | 1.81 | % | | | (0.78 | )% | | | 1.81 | % | | $ | 2,452 | | | | 60 | % | |
Year Ended 12/31/15 | | | (0.86 | ) | | $ | 25.57 | | | | (11.09 | )% | | | 1.81 | % | | | (0.74 | )% | | | 1.81 | % | | $ | 2,365 | | | | 42 | % | |
Year Ended 12/31/14 | | | (7.35 | ) | | $ | 29.72 | | | | (4.21 | )% | | | 1.80 | % | | | (0.66 | )% | | | 1.88 | % | | $ | 4,321 | | | | 47 | % | |
Class Y | |
Six Months Ended
6/30/19 (unaudited) | | | (0.66 | ) | | $ | 26.19 | | | | 22.64 | % | | | 1.12 | % | | | 0.74 | % | | | 1.21 | % | | $ | 234,835 | | | | 29 | % | |
Year Ended 12/31/18 | | | (5.16 | ) | | $ | 21.94 | | | | (11.77 | )% | | | 1.12 | % | | | 0.48 | % | | | 1.19 | % | | $ | 250,709 | | | | 62 | % | |
Year Ended 12/31/17 | | | (6.90 | ) | | $ | 30.67 | | | | 14.59 | % | | | 1.12 | % | | | (0.11 | )% | | | 1.21 | % | | $ | 349,022 | | | | 38 | % | |
Year Ended 12/31/16 | | | (1.78 | ) | | $ | 32.75 | | | | 24.41 | % | | | 1.12 | % | | | (0.11 | )% | | | 1.22 | % | | $ | 378,271 | | | | 60 | % | |
Year Ended 12/31/15 | | | (0.86 | ) | | $ | 27.75 | | | | (10.47 | )% | | | 1.12 | % | | | (0.05 | )% | | | 1.18 | % | | $ | 542,595 | | | | 42 | % | |
Year Ended 12/31/14 | | | (7.35 | ) | | $ | 31.95 | | | | (3.53 | )% | | | 1.11 | % | | | 0.04 | % | | | 1.18 | % | | $ | 903,833 | | | | 47 | % | |
See notes to financial statements.
29
Victory Portfolios | | Financial Highlights | |
For a Share Outstanding Throughout Each Period
| | | | Investment Activities | | Distributions to
Shareholders From | |
| | | Net Asset
Value,
Beginning of
Period | | Net
Investment
Income
(Loss)(a) | | Net
Realized and
Unrealized
Gains
(Losses) on
Investments | | Total from
Investment
Activities | | Net
Investment
Income | | Net Realized
Gains from
Investments | | Total
Distributions
to
Shareholders | |
Victory RS Value Fund | |
Class A | |
Six Months
Ended
6/30/19
(unaudited) | | $ | 20.28 | | | | 0.04 | | | | 4.40 | | | | 4.44 | | | | — | | | | — | | | | — | | |
Year Ended
12/31/18 | | $ | 26.21 | | | | 0.06 | | | | (2.85 | ) | | | (2.79 | ) | | | (0.14 | ) | | | (3.00 | ) | | | (3.14 | ) | |
Year Ended
12/31/17 | | $ | 27.94 | | | | 0.03 | | | | 4.80 | | | | 4.83 | | | | (0.04 | ) | | | (6.52 | ) | | | (6.56 | ) | |
Year Ended
12/31/16 | | $ | 28.33 | | | | — | (f) | | | 3.09 | | | | 3.09 | | | | (0.13 | ) | | | (3.35 | ) | | | (3.48 | ) | |
Year Ended
12/31/15 | | $ | 33.04 | | | | (0.08 | ) | | | (1.98 | ) | | | (2.06 | ) | | | — | (f) | | | (2.65 | ) | | | (2.65 | ) | |
Year Ended
12/31/14 | | $ | 34.76 | | | | 0.25 | | | | 3.71 | | | | 3.96 | | | | (0.36 | ) | | | (5.32 | ) | | | (5.68 | ) | |
Class C | |
Six Months
Ended
6/30/19
(unaudited) | | $ | 18.08 | | | | (0.05 | ) | | | 3.91 | | | | 3.86 | | | | — | | | | — | | | | — | | |
Year Ended
12/31/18 | | $ | 23.76 | | | | (0.13 | ) | | | (2.55 | ) | | | (2.68 | ) | | | — | | | | (3.00 | ) | | | (3.00 | ) | |
Year Ended
12/31/17 | | $ | 26.01 | | | | (0.08 | ) | | | 4.35 | | | | 4.27 | | | | — | | | | (6.52 | ) | | | (6.52 | ) | |
Year Ended
12/31/16 | | $ | 26.69 | | | | (0.21 | ) | | | 2.88 | | | | 2.67 | | | | — | | | | (3.35 | ) | | | (3.35 | ) | |
Year Ended
12/31/15 | | $ | 31.54 | | | | (0.32 | ) | | | (1.88 | ) | | | (2.20 | ) | | | — | | | | (2.65 | ) | | | (2.65 | ) | |
Year Ended
12/31/14 | | $ | 33.47 | | | | — | (f) | | | 3.52 | | | | 3.52 | | | | (0.13 | ) | | | (5.32 | ) | | | (5.45 | ) | |
(a) Per share net investment income (loss) has been calculated using the average daily shares method.
(b) Not annualized for periods less than one year.
(c) Annualized for periods less than one year.
(d) During the period, certain fees were reduced and/or reimbursed. If such fee reductions and/or reimbursements had not occurred, the ratios would have been as indicated
(e) Portfolio turnover is calculated on the basis of the Fund as a whole without distinguishing between the classes of shares issued.
(f) Amount is less than $0.005 per share.
(g) The Fund received monies related to a nonrecurring refund from the prior Custodian. The corresponding impact to the total return was less than 0.005% for the period shown. (See Note 8)
(h) Amount is less than 0.005%
See notes to financial statements.
30
Victory Portfolios | | Financial Highlights — continued | |
For a Share Outstanding Throughout Each Period
| | | | Ratios to Average Net Assets | | Supplemental Data | |
| | | Capital
Contributions
from Prior
Custodian,
Net (See
Note 8) | | Net Asset
Value,
End of
Period | | Total
Return
(Excludes
Sales
Charge)(b) | | Net
Expenses(c) | | Net
Investment
Income
(Loss)(c) | | Gross
Expenses(c)(d) | | Net Assets,
End of
Period
(000's) | | Portfolio
Turnover(b)(e) | |
Victory RS Value Fund | |
Class A | |
Six Months
Ended
6/30/19
(unaudited) | | | — | | | $ | 24.72 | | | | 21.89 | % | | | 1.30 | % | | | 0.33 | % | | | 1.35 | % | | $ | 205,331 | | | | 31 | % | |
Year Ended
12/31/18 | | | — | | | $ | 20.28 | | | | (10.75 | )% | | | 1.30 | % | | | 0.24 | % | | | 1.34 | % | | $ | 179,535 | | | | 65 | % | |
Year Ended
12/31/17 | | | — | | | $ | 26.21 | | | | 17.41 | % | | | 1.30 | % | | | 0.09 | % | | | 1.33 | % | | $ | 239,994 | | | | 64 | % | |
Year Ended
12/31/16 | | | — | (f) | | $ | 27.94 | | | | 10.92 | %(g) | | | 1.30 | % | | | (0.01 | )% | | | 1.35 | % | | $ | 268,979 | | | | 67 | % | |
Year Ended
12/31/15 | | | — | | | $ | 28.33 | | | | (6.18 | )% | | | 1.26 | % | | | (0.24 | )% | | | 1.26 | % | | $ | 352,205 | | | | 55 | % | |
Year Ended
12/31/14 | | | — | | | $ | 33.04 | | | | 11.60 | % | | | 1.29 | % | | | 0.71 | % | | | 1.35 | % | | $ | 432,082 | | | | 56 | % | |
Class C | |
Six Months
Ended
6/30/19
(unaudited) | | | — | | | $ | 21.94 | | | | 21.40 | % | | | 2.07 | % | | | (0.48 | )% | | | 2.27 | % | | $ | 6,147 | | | | 31 | % | |
Year Ended
12/31/18 | | | — | | | $ | 18.08 | | | | (11.41 | )% | | | 2.07 | % | | | (0.54 | )% | | | 2.14 | % | | $ | 9,428 | | | | 65 | % | |
Year Ended
12/31/17 | | | — | | | $ | 23.76 | | | | 16.53 | % | | | 2.07 | % | | | (0.30 | )% | | | 2.08 | % | | $ | 16,916 | | | | 64 | % | |
Year Ended
12/31/16 | | | — | (f) | | $ | 26.01 | | | | 10.01 | %(g) | | | 2.07 | % | | | (0.78 | )% | | | 2.13 | % | | $ | 19,943 | | | | 67 | % | |
Year Ended
12/31/15 | | | — | | | $ | 26.69 | | | | (6.92 | )% | | | 2.04 | % | | | (1.03 | )% | | | 2.04 | % | | $ | 24,714 | | | | 55 | % | |
Year Ended
12/31/14 | | | — | | | $ | 31.54 | | | | 10.75 | % | | | 2.06 | % | | | — | (h) | | | 2.11 | % | | $ | 30,568 | | | | 56 | % | |
(continues on next page)
See notes to financial statements.
31
Victory Portfolios | | Financial Highlights | |
For a Share Outstanding Throughout Each Period
| | | | Investment Activities | | Distributions to
Shareholders From | |
| | | Net Asset
Value,
Beginning of
Period | | Net
Investment
Income
(Loss)(a) | | Net
Realized and
Unrealized
Gains
(Losses) on
Investments | | Total from
Investment
Activities | | Net
Investment
Income | | Net Realized
Gains from
Investments | | Total
Distributions
to
Shareholders | |
Victory RS Value Fund | |
Class R | |
Six Months
Ended
6/30/19
(unaudited) | | $ | 19.26 | | | | (0.01 | ) | | | 4.17 | | | | 4.16 | | | | — | | | | — | | | | — | | |
Year Ended
12/31/18 | | $ | 25.06 | | | | (0.03 | ) | | | (2.72 | ) | | | (2.75 | ) | | | (0.05 | ) | | | (3.00 | ) | | | (3.05 | ) | |
Year Ended
12/31/17 | | $ | 27.03 | | | | (0.03 | ) | | | 4.58 | | | | 4.55 | | | | — | | | | (6.52 | ) | | | (6.52 | ) | |
Year Ended
12/31/16 | | $ | 27.51 | | | | (0.09 | ) | | | 2.96 | | | | 2.87 | | | | — | | | | (3.35 | ) | | | (3.35 | ) | |
Year Ended
12/31/15 | | $ | 32.29 | | | | (0.21 | ) | | | (1.92 | ) | | | (2.13 | ) | | | — | | | | (2.65 | ) | | | (2.65 | ) | |
Year Ended
12/31/14 | | $ | 34.15 | | | | 0.13 | | | | 3.60 | | | | 3.73 | | | | (0.27 | ) | | | (5.32 | ) | | | (5.59 | ) | |
Class Y | |
Six Months
Ended
6/30/19
(unaudited) | | $ | 20.77 | | | | 0.07 | | | | 4.50 | | | | 4.57 | | | | — | | | | — | | | | — | | |
Year Ended
12/31/18 | | $ | 26.77 | | | | 0.13 | | | | (2.92 | ) | | | (2.79 | ) | | | (0.21 | ) | | | (3.00 | ) | | | (3.21 | ) | |
Year Ended
12/31/17 | | $ | 28.40 | | | | 0.06 | | | | 4.94 | | | | 5.00 | | | | (0.11 | ) | | | (6.52 | ) | | | (6.63 | ) | |
Year Ended
12/31/16 | | $ | 28.57 | | | | 0.08 | | | | 3.10 | | | | 3.18 | | | | — | | | | (3.35 | ) | | | (3.35 | ) | |
Year Ended
12/31/15 | | $ | 33.23 | | | | (0.02 | ) | | | (1.99 | ) | | | (2.01 | ) | | | — | | | | (2.65 | ) | | | (2.65 | ) | |
Year Ended
12/31/14 | | $ | 34.99 | | | | 0.38 | | | | 3.69 | | | | 4.07 | | | | (0.51 | ) | | | (5.32 | ) | | | (5.83 | ) | |
(a) Per share net investment income (loss) has been calculated using the average daily shares method.
(b) Not annualized for periods less than one year.
(c) Annualized for periods less than one year.
(d) During the period, certain fees were reduced and/or reimbursed. If such fee reductions and/or reimbursements had not occurred, the ratios would have been as indicated
(e) Portfolio turnover is calculated on the basis of the Fund as a whole without distinguishing between the classes of shares issued.
(f) Amount is less than $0.005 per share.
(g) The Fund received monies related to a nonrecurring refund from the prior Custodian. The corresponding impact to the total return was less than 0.005% for the period shown. (See Note 8)
See notes to financial statements.
32
Victory Portfolios | | Financial Highlights — continued | |
For a Share Outstanding Throughout Each Period
| | | | Ratios to Average Net Assets | | Supplemental Data | |
| | | Capital
Contributions
from Prior
Custodian,
Net (See
Note 8) | | Net Asset
Value,
End of
Period | | Total
Return
(Excludes
Sales
Charge)(b) | | Net
Expenses(c) | | Net
Investment
Income
(Loss)(c) | | Gross
Expenses(c)(d) | | Net Assets,
End of
Period
(000's) | | Portfolio
Turnover(b)(e) | |
Victory RS Value Fund | |
Class R | |
Six Months
Ended
6/30/19
(unaudited) | | | — | | | $ | 23.42 | | | | 21.66 | % | | | 1.69 | % | | | (0.08 | )% | | | 3.46 | % | | $ | 1,042 | | | | 31 | % | |
Year Ended
12/31/18 | | | — | | | $ | 19.26 | | | | (11.12 | )% | | | 1.69 | % | | | (0.11 | )% | | | 2.82 | % | | $ | 1,019 | | | | 65 | % | |
Year Ended
12/31/17 | | | — | | | $ | 25.06 | | | | 16.95 | % | | | 1.69 | % | | | (0.11 | )% | | | 2.29 | % | | $ | 1,625 | | | | 64 | % | |
Year Ended
12/31/16 | | | — | (f) | | $ | 27.03 | | | | 10.45 | %(g) | | | 1.69 | % | | | (0.34 | )% | | | 1.80 | % | | $ | 1,670 | | | | 67 | % | |
Year Ended
12/31/15 | | | — | | | $ | 27.51 | | | | (6.54 | )% | | | 1.65 | % | | | (0.64 | )% | | | 1.65 | % | | $ | 3,456 | | | | 55 | % | |
Year Ended
12/31/14 | | | — | | | $ | 32.29 | | | | 11.15 | % | | | 1.69 | % | | | 0.37 | % | | | 1.73 | % | | $ | 4,412 | | | | 56 | % | |
Class Y | |
Six Months
Ended
6/30/19
(unaudited) | | | — | | | $ | 25.34 | | | | 22.00 | % | | | 1.06 | % | | | 0.56 | % | | | 1.07 | % | | $ | 177,477 | | | | 31 | % | |
Year Ended
12/31/18 | | | — | | | $ | 20.77 | | | | (10.54 | )% | | | 1.06 | % | | | 0.49 | % | | | 1.06 | % | | $ | 166,538 | | | | 65 | % | |
Year Ended
12/31/17 | | | — | | | $ | 26.77 | | | | 17.71 | % | | | 1.06 | % | | | 0.20 | % | | | 1.06 | % | | $ | 247,528 | | | | 64 | % | |
Year Ended
12/31/16 | | | — | (f) | | $ | 28.40 | | | | 11.14 | %(g) | | | 1.06 | % | | | 0.26 | % | | | 1.19 | % | | $ | 260,818 | | | | 67 | % | |
Year Ended
12/31/15 | | | — | | | $ | 28.57 | | | | (5.99 | )% | | | 1.06 | % | | | (0.05 | )% | | | 1.11 | % | | $ | 724,715 | | | | 55 | % | |
Year Ended
12/31/14 | | | — | | | $ | 33.23 | | | | 11.85 | % | | | 1.05 | % | | | 1.05 | % | | | 1.11 | % | | $ | 821,479 | | | | 56 | % | |
See notes to financial statements.
33
Victory Portfolios | | Financial Highlights | |
For a Share Outstanding Throughout Each Period
| | | | Investment Activities | | Distributions to
Shareholders From | |
| | | Net Asset
Value,
Beginning of
Period | | Net
Investment
Income
(Loss)(a) | | Net
Realized and
Unrealized
Gains
(Losses) on
Investments | | Total from
Investment
Activities | | Net
Investment
Income | | Net Realized
Gains from
Investments | | Total
Distributions
to
Shareholders | |
Victory RS Large Cap Alpha Fund | |
Class A | |
Six Months
Ended
6/30/19
(unaudited) | | $ | 42.20 | | | | 0.26 | | | | 7.64 | | | | 7.90 | | | | — | | | | — | | | | — | | |
Year Ended
12/31/18 | | $ | 56.61 | | | | 0.44 | | | | (5.67 | ) | | | (5.23 | ) | | | (0.38 | ) | | | (8.80 | ) | | | (9.18 | ) | |
Year Ended
12/31/17 | | $ | 51.86 | | | | 0.38 | | | | 9.10 | | | | 9.48 | | | | — | (f) | | | (4.73 | ) | | | (4.73 | ) | |
Year Ended
12/31/16 | | $ | 50.98 | | | | 0.40 | | | | 4.01 | | | | 4.41 | | | | (0.42 | ) | | | (3.12 | ) | | | (3.54 | ) | |
Year Ended
12/31/15 | | $ | 59.25 | | | | 0.50 | | | | (1.74 | ) | | | (1.24 | ) | | | (0.57 | ) | | | (6.46 | ) | | | (7.03 | ) | |
Year Ended
12/31/14 | | $ | 59.06 | | | | 0.55 | | | | 7.13 | | | | 7.68 | | | | (0.55 | ) | | | (6.94 | ) | | | (7.49 | ) | |
Class C | |
Six Months
Ended
6/30/19
(unaudited) | | $ | 35.78 | | | | 0.06 | | | | 6.46 | | | | 6.52 | | | | — | | | | — | | | | — | | |
Year Ended
12/31/18 | | $ | 49.50 | | | | (0.03 | ) | | | (4.89 | ) | | | (4.92 | ) | | | — | (f) | | | (8.80 | ) | | | (8.80 | ) | |
Year Ended
12/31/17 | | $ | 46.22 | | | | (0.04 | ) | | | 8.05 | | | | 8.01 | | | | — | | | | (4.73 | ) | | | (4.73 | ) | |
Year Ended
12/31/16 | | $ | 45.80 | | | | — | (f) | | | 3.57 | | | | 3.57 | | | | (0.04 | ) | | | (3.12 | ) | | | (3.16 | ) | |
Year Ended
12/31/15 | | $ | 53.96 | | | | 0.03 | | | | (1.58 | ) | | | (1.55 | ) | | | (0.15 | ) | | | (6.46 | ) | | | (6.61 | ) | |
Year Ended
12/31/14 | | $ | 54.43 | | | | 0.04 | | | | 6.53 | | | | 6.57 | | | | (0.10 | ) | | | (6.94 | ) | | | (7.04 | ) | |
(a) Per share net investment income (loss) has been calculated using the average daily shares method.
(b) Not annualized for periods less than one year.
(c) Annualized for periods less than one year.
(d) During the period, certain fees were reduced and/or reimbursed. If such fee reductions and/or reimbursements had not occurred, the ratios would have been as indicated.
(e) Portfolio turnover is calculated on the basis of the Fund as a whole without distinguishing between the classes of shares issued.
(f) Amount is less than $0.005 per share.
(g) The Fund received monies related to a nonrecurring refund from the prior Custodian. The corresponding impact to the total return was less than 0.01% for the period shown. (See Note 8)
See notes to financial statements.
34
Victory Portfolios | | Financial Highlights — continued | |
For a Share Outstanding Throughout Each Period
| | | | Ratios to Average Net Assets | | Supplemental Data | |
| | | Capital
Contributions
from Prior
Custodian,
Net (See
Note 8) | | Net Asset
Value,
End of
Period | | Total
Return
(Excludes
Sales
Charge)(b) | | Net
Expenses(c) | | Net
Investment
Income
(Loss)(c) | | Gross
Expenses(c)(d) | | Net Assets,
End of
Period
(000's) | | Portfolio
Turnover(b)(e) | |
Victory RS Large Cap Alpha Fund | |
Class A | |
Six Months
Ended
6/30/19
(unaudited) | | | — | | | $ | 50.10 | | | | 18.72 | % | | | 0.89 | % | | | 1.10 | % | | | 0.95 | % | | $ | 497,903 | | | | 24 | % | |
Year Ended
12/31/18 | | | — | | | $ | 42.20 | | | | (9.31 | )% | | | 0.89 | % | | | 0.77 | % | | | 0.93 | % | | $ | 439,035 | | | | 59 | % | |
Year Ended
12/31/17 | | | — | | | $ | 56.61 | | | | 18.32 | % | | | 0.89 | % | | | 0.68 | % | | �� | 0.94 | % | | $ | 540,762 | | | | 55 | % | |
Year Ended
12/31/16 | | | 0.01 | | | $ | 51.86 | | | | 8.67 | %(g) | | | 0.89 | % | | | 0.79 | % | | | 0.92 | % | | $ | 522,593 | | | | 79 | % | |
Year Ended
12/31/15 | | | — | | | $ | 50.98 | | | | (2.03 | )% | | | 0.89 | % | | | 0.86 | % | | | 0.89 | % | | $ | 556,204 | | | | 39 | % | |
Year Ended
12/31/14 | | | — | | | $ | 59.25 | | | | 13.08 | % | | | 0.92 | % | | | 0.89 | % | | | 0.92 | % | | $ | 630,654 | | | | 60 | % | |
Class C | |
Six Months
Ended
6/30/19
(unaudited) | | | — | | | $ | 42.30 | | | | 18.25 | % | | | 1.69 | % | | | 0.31 | % | | | 1.76 | % | | $ | 17,540 | | | | 24 | % | |
Year Ended
12/31/18 | | | — | | | $ | 35.78 | | | | (10.03 | )% | | | 1.69 | % | | | (0.06 | )% | | | 1.75 | % | | $ | 18,227 | | | | 59 | % | |
Year Ended
12/31/17 | | | — | | | $ | 49.50 | | | | 17.36 | % | | | 1.69 | % | | | (0.08 | )% | | | 1.71 | % | | $ | 29,771 | | | | 55 | % | |
Year Ended
12/31/16 | | | 0.01 | | | $ | 46.22 | | | | 7.80 | %(g) | | | 1.69 | % | | | (0.01 | )% | | | 1.71 | % | | $ | 28,801 | | | | 79 | % | |
Year Ended
12/31/15 | | | — | | | $ | 45.80 | | | | (2.80 | )% | | | 1.69 | % | | | 0.06 | % | | | 1.69 | % | | $ | 33,608 | | | | 39 | % | |
Year Ended
12/31/14 | | | — | | | $ | 53.96 | | | | 12.15 | % | | | 1.73 | % | | | 0.08 | % | | | 1.73 | % | | $ | 36,868 | | | | 60 | % | |
(continues on next page)
See notes to financial statements.
35
Victory Portfolios | | Financial Highlights | |
For a Share Outstanding Throughout Each Period
| | | | Investment Activities | | Distributions to
Shareholders From | |
| | | Net Asset
Value,
Beginning of
Period | | Net
Investment
Income
(Loss)(a) | | Net
Realized and
Unrealized
Gains
(Losses) on
Investments | | Total from
Investment
Activities | | Net
Investment
Income | | Net Realized
Gains from
Investments | | Total
Distributions
to
Shareholders | |
Victory RS Large Cap Alpha Fund | |
Class R | |
Six Months
Ended
6/30/19
(unaudited) | | $ | 42.01 | | | | 0.17 | | | | 7.59 | | | | 7.76 | | | | — | | | | — | | | | — | | |
Year Ended
12/31/18 | | $ | 56.35 | | | | 0.22 | | | | (5.61 | ) | | | (5.39 | ) | | | (0.15 | ) | | | (8.80 | ) | | | (8.95 | ) | |
Year Ended
12/31/17 | | $ | 51.83 | | | | 0.18 | | | | 9.07 | | | | 9.25 | | | | — | | | | (4.73 | ) | | | (4.73 | ) | |
Year Ended
12/31/16 | | $ | 50.93 | | | | 0.23 | | | | 3.99 | | | | 4.22 | | | | (0.21 | ) | | | (3.12 | ) | | | (3.33 | ) | |
Year Ended
12/31/15 | | $ | 59.15 | | | | 0.29 | | | | (1.74 | ) | | | (1.45 | ) | | | (0.31 | ) | | | (6.46 | ) | | | (6.77 | ) | |
Year Ended
12/31/14 | | $ | 58.97 | | | | 0.31 | | | | 7.09 | | | | 7.40 | | | | (0.28 | ) | | | (6.94 | ) | | | (7.22 | ) | |
Class Y | |
Six Months
Ended
6/30/19
(unaudited) | | $ | 42.01 | | | | 0.31 | | | | 7.60 | | | | 7.91 | | | | — | | | | — | | | | — | | |
Year Ended
12/31/18 | | $ | 56.38 | | | | 0.55 | | | | (5.64 | ) | | | (5.09 | ) | | | (0.48 | ) | | | (8.80 | ) | | | (9.28 | ) | |
Year Ended
12/31/17 | | $ | 51.66 | | | | 0.49 | | | | 9.07 | | | | 9.56 | | | | (0.11 | ) | | | (4.73 | ) | | | (4.84 | ) | |
Year Ended
12/31/16 | | $ | 50.82 | | | | 0.51 | | | | 4.00 | | | | 4.51 | | | | (0.56 | ) | | | (3.12 | ) | | | (3.68 | ) | |
Year Ended
12/31/15 | | $ | 59.08 | | | | 0.62 | | | | (1.74 | ) | | | (1.12 | ) | | | (0.68 | ) | | | (6.46 | ) | | | (7.14 | ) | |
Year Ended
12/31/14 | | $ | 58.92 | | | | 0.71 | | | | 7.10 | | | | 7.81 | | | | (0.71 | ) | | | (6.94 | ) | | | (7.65 | ) | |
(a) Per share net investment income (loss) has been calculated using the average daily shares method.
(b) Not annualized for periods less than one year.
(c) Annualized for periods less than one year.
(d) During the period, certain fees were reduced and/or reimbursed. If such fee reductions and/or reimbursements had not occurred, the ratios would have been as indicated.
(e) Portfolio turnover is calculated on the basis of the Fund as a whole without distinguishing between the classes of shares issued.
(g) The Fund received monies related to a nonrecurring refund from the prior Custodian. The corresponding impact to the total return was less than 0.01% for the period shown. (See Note 8)
See notes to financial statements.
36
Victory Portfolios | | Financial Highlights — continued | |
For a Share Outstanding Throughout Each Period
| | | | Ratios to Average Net Assets | | Supplemental Data | |
| | | Capital
Contributions
from Prior
Custodian,
Net (See
Note 8) | | Net Asset
Value,
End of
Period | | Total
Return
(Excludes
Sales
Charge)(b) | | Net
Expenses(c) | | Net
Investment
Income
(Loss)(c) | | Gross
Expenses(c)(d) | | Net Assets,
End of
Period
(000's) | | Portfolio
Turnover(b)(e) | |
Victory RS Large Cap Alpha Fund | |
Class R | |
Six Months
Ended
6/30/19
(unaudited) | | | — | | | $ | 49.77 | | | | 18.47 | % | | | 1.26 | % | | | 0.74 | % | | | 1.52 | % | | $ | 6,903 | | | | 24 | % | |
Year Ended
12/31/18 | | | — | | | $ | 42.01 | | | | (9.63 | )% | | | 1.26 | % | | | 0.38 | % | | | 1.40 | % | | $ | 6,348 | | | | 59 | % | |
Year Ended
12/31/17 | | | — | | | $ | 56.35 | | | | 17.87 | % | | | 1.26 | % | | | 0.33 | % | | | 1.42 | % | | $ | 10,229 | | | | 55 | % | |
Year Ended
12/31/16 | | | 0.01 | | | $ | 51.83 | | | | 8.30 | %(g) | | | 1.23 | % | | | 0.45 | % | | | 1.23 | % | | $ | 10,631 | | | | 79 | % | |
Year Ended
12/31/15 | | | — | | | $ | 50.93 | | | | (2.38 | )% | | | 1.26 | % | | | 0.49 | % | | | 1.26 | % | | $ | 12,402 | | | | 39 | % | |
Year Ended
12/31/14 | | | — | | | $ | 59.15 | | | | 12.62 | % | | | 1.31 | % | | | 0.50 | % | | | 1.31 | % | | $ | 16,458 | | | | 60 | % | |
Class Y | |
Six Months
Ended
6/30/19
(unaudited) | | | — | | | $ | 49.92 | | | | 18.83 | % | | | 0.68 | % | | | 1.32 | % | | | 0.78 | % | | $ | 21,978 | | | | 24 | % | |
Year Ended
12/31/18 | | | — | | | $ | 42.01 | | | | (9.11 | )% | | | 0.68 | % | | | 0.96 | % | | | 0.75 | % | | $ | 21,827 | | | | 59 | % | |
Year Ended
12/31/17 | | | — | | | $ | 56.38 | | | | 18.56 | % | | | 0.68 | % | | | 0.88 | % | | | 0.72 | % | | $ | 33,638 | | | | 55 | % | |
Year Ended
12/31/16 | | | 0.01 | | | $ | 51.66 | | | | 8.89 | %(g) | | | 0.68 | % | | | 1.00 | % | | | 0.69 | % | | $ | 31,840 | | | | 79 | % | |
Year Ended
12/31/15 | | | — | | | $ | 50.82 | | | | (1.82 | )% | | | 0.68 | % | | | 1.05 | % | | | 0.68 | % | | $ | 31,662 | | | | 39 | % | |
Year Ended
12/31/14 | | | — | | | $ | 59.08 | | | | 13.34 | % | | | 0.66 | % | | | 1.16 | % | | | 0.66 | % | | $ | 189,850 | | | | 60 | % | |
See notes to financial statements.
37
Victory Portfolios | | Financial Highlights | |
For a Share Outstanding Throughout Each Period
| | | | Investment Activities | | Distributions to
Shareholders From | |
| | | Net Asset
Value,
Beginning of
Period | | Net
Investment
Income
(Loss)(a) | | Net Realized
and Unrealized
Gains (Losses)
on Investments | | Total from
Investment
Activities | | Net
Investment
Income | | Net Realized
Gains from
Investments | |
Victory RS Investors Fund | |
Class A | |
Six Months Ended
6/30/19 (unaudited) | | $ | 10.68 | | | | (0.01 | ) | | | 2.35 | | | | 2.34 | | | | — | | | | — | | |
Year Ended 12/31/18 | | $ | 13.86 | | | | — | (f) | | | (1.27 | ) | | | (1.27 | ) | | | — | | | | (1.91 | ) | |
Year Ended 12/31/17 | | $ | 13.65 | | | | (0.03 | ) | | | 2.23 | | | | 2.20 | | | | — | | | | (1.99 | ) | |
Year Ended 12/31/16 | | $ | 12.42 | | | | — | (f) | | | 1.23 | | | | 1.23 | | | | — | | | | — | | |
Year Ended 12/31/15 | | $ | 12.95 | | | | (0.04 | ) | | | (0.49 | ) | | | (0.53 | ) | | | — | | | | — | | |
Year Ended 12/31/14 | | $ | 13.02 | | | | 0.14 | | | | 0.42 | | | | 0.56 | | | | (0.12 | ) | | | (0.51 | ) | |
Class C | |
Six Months Ended
6/30/19 (unaudited) | | $ | 9.53 | | | | (0.05 | ) | | | 2.10 | | | | 2.05 | | | | — | | | | — | | |
Year Ended 12/31/18 | | $ | 12.68 | | | | (0.10 | ) | | | (1.14 | ) | | | (1.24 | ) | | | — | | | | (1.91 | ) | |
Year Ended 12/31/17 | | $ | 12.73 | | | | (0.19 | ) | | | 2.13 | | | | 1.94 | | | | — | | | | (1.99 | ) | |
Year Ended 12/31/16 | | $ | 11.67 | | | | (0.09 | ) | | | 1.15 | | | | 1.06 | | | | — | | | | — | | |
Year Ended 12/31/15 | | $ | 12.26 | | | | (0.12 | ) | | | (0.47 | ) | | | (0.59 | ) | | | — | | | | — | | |
Year Ended 12/31/14 | | $ | 12.40 | | | | 0.02 | | | | 0.42 | | | | 0.44 | | | | (0.07 | ) | | | (0.51 | ) | |
Class R | |
Six Months Ended
6/30/19 (unaudited) | | $ | 9.66 | | | | (0.04 | ) | | | 2.12 | | | | 2.08 | | | | — | | | | — | | |
Year Ended 12/31/18 | | $ | 12.81 | | | | (0.08 | ) | | | (1.16 | ) | | | (1.24 | ) | | | — | | | | (1.91 | ) | |
Year Ended 12/31/17 | | $ | 12.83 | | | | (0.17 | ) | | | 2.14 | | | | 1.97 | | | | — | | | | (1.99 | ) | |
Year Ended 12/31/16 | | $ | 11.73 | | | | (0.06 | ) | | | 1.16 | | | | 1.10 | | | | — | | | | — | | |
Year Ended 12/31/15 | | $ | 12.30 | | | | (0.09 | ) | | | (0.48 | ) | | | (0.57 | ) | | | — | | | | — | | |
Year Ended 12/31/14 | | $ | 12.43 | | | | 0.06 | | | | 0.42 | | | | 0.48 | | | | (0.10 | ) | | | (0.51 | ) | |
Class Y | |
Six Months Ended
6/30/19 (unaudited) | | $ | 10.94 | | | | 0.01 | | | | 2.40 | | | | 2.41 | | | | — | | | | — | | |
Year Ended 12/31/18 | | $ | 14.10 | | | | 0.03 | | | | (1.28 | ) | | | (1.25 | ) | | | — | | | | (1.91 | ) | |
Year Ended 12/31/17 | | $ | 13.82 | | | | 0.03 | | | | 2.24 | | | | 2.27 | | | | — | | | | (1.99 | ) | |
Year Ended 12/31/16 | | $ | 12.55 | | | | 0.04 | | | | 1.24 | | | | 1.28 | | | | (0.01 | ) | | | — | | |
Year Ended 12/31/15 | | $ | 13.05 | | | | — | | | | (0.50 | ) | | | (0.50 | ) | | | — | | | | — | | |
Year Ended 12/31/14 | | $ | 13.12 | | | | 0.20 | | | | 0.41 | | | | 0.61 | | | | (0.17 | ) | | | (0.51 | ) | |
(a) Per share net investment income (loss) has been calculated using the average daily shares method.
(b) Not annualized for periods less than one year.
(c) Annualized for periods less than one year.
(d) During the period, certain fees were reduced and/or reimbursed. If such fee reductions and/or reimbursements had not occurred, the ratios would have been as indicated.
(e) Portfolio turnover is calculated on the basis of the Fund as a whole without distinguishing between the classes of shares issued.
(f) Amount is less than $0.005 per share.
See notes to financial statements.
38
Victory Portfolios | | Financial Highlights — continued | |
For a Share Outstanding Throughout Each Period
| | | | Ratios to Average Net Assets | | Supplemental Data | |
| | | Total
Distributions
to
Shareholders | | Net Asset
Value,
End of
Period | | Total
Return
(Excludes
Sales
Charge)(b) | | Net
Expenses(c) | | Net
Investment
Income
(Loss)(c) | | Gross
Expenses(c)(d) | | Net Assets,
End of
Period
(000's) | | Portfolio
Turnover(b)(e) | |
Victory RS Investors Fund | |
Class A | |
Six Months Ended
6/30/19 (unaudited) | | | — | | | $ | 13.02 | | | | 21.91 | % | | | 1.33 | % | | | (0.15 | )% | | | 1.61 | % | | $ | 17,370 | | | | 33 | % | |
Year Ended 12/31/18 | | | (1.91 | ) | | $ | 10.68 | | | | (9.36 | )% | | | 1.33 | % | | | (0.03 | )% | | | 1.58 | % | | $ | 15,682 | | | | 56 | % | |
Year Ended 12/31/17 | | | (1.99 | ) | | $ | 13.86 | | | | 16.28 | % | | | 1.33 | % | | | (0.24 | )% | | | 1.54 | % | | $ | 20,419 | | | | 80 | % | |
Year Ended 12/31/16 | | | — | | | $ | 13.65 | | | | 9.90 | % | | | 1.33 | % | | | 0.02 | % | | | 1.56 | % | | $ | 28,022 | | | | 92 | % | |
Year Ended 12/31/15 | | | — | | | $ | 12.42 | | | | (4.09 | )% | | | 1.33 | % | | | (0.28 | )% | | | 1.51 | % | | $ | 41,556 | | | | 50 | % | |
Year Ended 12/31/14 | | | (0.63 | ) | | $ | 12.95 | | | | 4.39 | % | | | 1.32 | % | | | 1.04 | % | | | 1.52 | % | | $ | 67,364 | | | | 83 | % | |
Class C | |
Six Months Ended
6/30/19 (unaudited) | | | — | | | $ | 11.58 | | | | 21.51 | % | | | 2.07 | % | | | (0.90 | )% | | | 2.51 | % | | $ | 7,568 | | | | 33 | % | |
Year Ended 12/31/18 | | | (1.91 | ) | | $ | 9.53 | | | | (10.08 | )% | | | 2.07 | % | | | (0.82 | )% | | | 2.44 | % | | $ | 7,282 | | | | 56 | % | |
Year Ended 12/31/17 | | | (1.99 | ) | | $ | 12.68 | | | | 15.48 | % | | | 2.07 | % | | | (1.42 | )% | | | 2.35 | % | | $ | 11,149 | | | | 80 | % | |
Year Ended 12/31/16 | | | — | | | $ | 12.73 | | | | 9.08 | % | | | 2.07 | % | | | (0.72 | )% | | | 2.35 | % | | $ | 14,517 | | | | 92 | % | |
Year Ended 12/31/15 | | | — | | | $ | 11.67 | | | | (4.81 | )% | | | 2.07 | % | | | (1.01 | )% | | | 2.29 | % | | $ | 21,654 | | | | 50 | % | |
Year Ended 12/31/14 | | | (0.58 | ) | | $ | 12.26 | | | | 3.63 | % | | | 2.07 | % | | | 0.18 | % | | | 2.29 | % | | $ | 31,819 | | | | 83 | % | |
Class R | |
Six Months Ended
6/30/19 (unaudited) | | | — | | | $ | 11.74 | | | | 21.53 | % | | | 1.95 | % | | | (0.78 | )% | | | 3.84 | % | | $ | 907 | | | | 33 | % | |
Year Ended 12/31/18 | | | (1.91 | ) | | $ | 9.66 | | | | (9.91 | )% | | | 1.95 | % | | | (0.64 | )% | | | 3.15 | % | | $ | 831 | | | | 56 | % | |
Year Ended 12/31/17 | | | (1.99 | ) | | $ | 12.81 | | | | 15.50 | % | | | 1.95 | % | | | (1.27 | )% | | | 2.72 | % | | $ | 1,379 | | | | 80 | % | |
Year Ended 12/31/16 | | | — | | | $ | 12.83 | | | | 9.38 | % | | | 1.92 | % | | | (0.50 | )% | | | 1.92 | % | | $ | 1,314 | | | | 92 | % | |
Year Ended 12/31/15 | | | — | | | $ | 11.73 | | | | (4.63 | )% | | | 1.84 | % | | | (0.78 | )% | | | 1.90 | % | | $ | 1,771 | | | | 50 | % | |
Year Ended 12/31/14 | | | (0.61 | ) | | $ | 12.30 | | | | 3.90 | % | | | 1.91 | % | | | 0.47 | % | | | 1.97 | % | | $ | 2,077 | | | | 83 | % | |
Class Y | |
Six Months Ended
6/30/19 (unaudited) | | | — | | | $ | 13.35 | | | | 22.03 | % | | | 1.05 | % | | | 0.12 | % | | | 1.43 | % | | $ | 16,062 | | | | 33 | % | |
Year Ended 12/31/18 | | | (1.91 | ) | | $ | 10.94 | | | | (9.06 | )% | | | 1.05 | % | | | 0.18 | % | | | 1.37 | % | | $ | 14,669 | | | | 56 | % | |
Year Ended 12/31/17 | | | (1.99 | ) | | $ | 14.10 | | | | 16.59 | % | | | 1.05 | % | | | 0.19 | % | | | 1.25 | % | | $ | 27,131 | | | | 80 | % | |
Year Ended 12/31/16 | | | (0.01 | ) | | $ | 13.82 | | | | 10.17 | % | | | 1.05 | % | | | 0.28 | % | | | 1.24 | % | | $ | 50,013 | | | | 92 | % | |
Year Ended 12/31/15 | | | — | | | $ | 12.55 | | | | (3.83 | )% | | | 1.05 | % | | | (0.01 | )% | | | 1.21 | % | | $ | 80,290 | | | | 50 | % | |
Year Ended 12/31/14 | | | (0.68 | ) | | $ | 13.05 | | | | 4.72 | % | | | 1.05 | % | | | 1.49 | % | | | 1.17 | % | | $ | 142,623 | | | | 83 | % | |
See notes to financial statements.
39
Victory Portfolios | | Financial Highlights | |
For a Share Outstanding Throughout Each Period
| | | | Investment Activities | | Distributions to
Shareholders From | |
| | | Net Asset
Value,
Beginning of
Period | | Net
Investment
Income
(Loss)(a) | | Net
Realized and
Unrealized
Gains
(Losses) on
Investments | | Total from
Investment
Activities | | Net
Investment
Income | | Net Realized
Gains from
Investments | | Total
Distributions
to
Shareholders | |
Victory Global Natural Resources Fund | |
Class A | |
Six Months
Ended
6/30/19
(unaudited) | | $ | 12.86 | | | | (0.01 | ) | | | (1.81 | ) | | | (1.82 | ) | | | — | | | | — | | | | — | | |
Year Ended
12/31/18 | | $ | 23.73 | | | | (0.14 | ) | | | (10.73 | ) | | | (10.87 | ) | | | — | | | | — | | | | — | | |
Year Ended
12/31/17 | | $ | 23.49 | | | | (0.22 | ) | | | 0.46 | | | | 0.24 | | | | — | | | | — | | | | — | | |
Year Ended
12/31/16 | | $ | 15.34 | | | | (0.10 | ) | | | 8.25 | | | | 8.15 | | | | — | | | | — | | | | — | | |
Year Ended
12/31/15 | | $ | 24.81 | | | | (0.11 | ) | | | (9.36 | ) | | | (9.47 | ) | | | — | | | | — | | | | — | | |
Year Ended
12/31/14 | | $ | 35.02 | | | | (0.04 | ) | | | (7.97 | ) | | | (8.01 | ) | | | (0.01 | ) | | | (2.19 | ) | | | (2.20 | ) | |
Class C | |
Six Months
Ended
6/30/19
(unaudited) | | $ | 11.63 | | | | (0.06 | ) | | | (1.62 | ) | | | (1.68 | ) | | | — | | | | — | | | | — | | |
Year Ended
12/31/18 | | $ | 21.63 | | | | (0.28 | ) | | | (9.72 | ) | | | (10.00 | ) | | | — | | | | — | | | | — | | |
Year Ended
12/31/17 | | $ | 21.59 | | | | (0.36 | ) | | | 0.40 | | | | 0.04 | | | | — | | | | — | | | | — | | |
Year Ended
12/31/16 | | $ | 14.21 | | | | (0.24 | ) | | | 7.62 | | | | 7.38 | | | | — | | | | — | | | | — | | |
Year Ended
12/31/15 | | $ | 23.17 | | | | (0.27 | ) | | | (8.69 | ) | | | (8.96 | ) | | | — | | | | — | | | | — | | |
Year Ended
12/31/14 | | $ | 33.14 | | | | (0.29 | ) | | | (7.48 | ) | | | (7.77 | ) | | | (0.01 | ) | | | (2.19 | ) | | | (2.20 | ) | |
(a) Per share net investment income (loss) has been calculated using the average daily shares method.
(b) Not annualized for periods less than one year.
(c) Annualized for periods less than one year.
(d) During the period, certain fees were reduced and/or reimbursed. If such fee reductions and/or reimbursements had not occurred, the ratios would have been as indicated.
(e) Portfolio turnover is calculated on the basis of the Fund as a whole without distinguishing between the classes of shares issued.
(f) Portfolio turnover increased due to a change within the portfolio holdings during the year.
(g) Amount is less than $0.005 per share.
(h) The Fund received monies related to a nonrecurring refund from the prior Custodian. The corresponding impact to the total return was less than 0.005% for the period shown. (See Note 8)
See notes to financial statements.
40
Victory Portfolios | | Financial Highlights — continued | |
For a Share Outstanding Throughout Each Period
| | | | Ratios to Average Net Assets | | Supplemental Data | |
| | | Capital
Contributions
from Prior
Custodian,
Net (See
Note 8) | | Net Asset
Value,
End of
Period | | Total
Return
(Excludes
Sales
Charge)(b) | | Net
Expenses(c) | | Net
Investment
Income
(Loss)(c) | | Gross
Expenses(c)(d) | | Net Assets,
End of
Period
(000's) | | Portfolio
Turnover(b)(e) | |
Victory Global Natural Resources Fund | |
Class A | |
Six Months
Ended
6/30/19
(unaudited) | | | — | | | $ | 11.04 | | | | (14.07 | )% | | | 1.48 | % | | | (0.19 | )% | | | 1.71 | % | | $ | 49,504 | | | | 4 | % | |
Year Ended
12/31/18 | | | — | | | $ | 12.86 | | | | (45.81 | )% | | | 1.48 | % | | | (0.65 | )% | | | 1.54 | % | | $ | 64,001 | | | | 26 | % | |
Year Ended
12/31/17 | | | — | | | $ | 23.73 | | | | 1.02 | % | | | 1.48 | % | | | (0.93 | )% | | | 1.55 | % | | $ | 262,455 | | | | 57 | %(f) | |
Year Ended
12/31/16 | | | — | (g) | | $ | 23.49 | | | | 53.13 | %(h) | | | 1.48 | % | | | (0.51 | )% | | | 1.48 | % | | $ | 545,778 | | | | 29 | % | |
Year Ended
12/31/15 | | | — | | | $ | 15.34 | | | | (38.17 | )% | | | 1.45 | % | | | (0.52 | )% | | | 1.45 | % | | $ | 332,598 | | | | 33 | % | |
Year Ended
12/31/14 | | | — | | | $ | 24.81 | | | | (22.84 | )% | | | 1.47 | % | | | (0.10 | )% | | | 1.48 | % | | $ | 620,030 | | | | 34 | % | |
Class C | |
Six Months
Ended
6/30/19
(unaudited) | | | — | | | $ | 9.95 | | | | (14.45 | )% | | | 2.28 | % | | | (0.99 | )% | | | 2.67 | % | | $ | 4,297 | | | | 4 | % | |
Year Ended
12/31/18 | | | — | | | $ | 11.63 | | | | (46.26 | )% | | | 2.28 | % | | | (1.42 | )% | | | 2.38 | % | | $ | 6,939 | | | | 26 | % | |
Year Ended
12/31/17 | | | — | | | $ | 21.63 | | | | 0.23 | % | | | 2.28 | % | | | (1.72 | )% | | | 2.35 | % | | $ | 20,428 | | | | 57 | %(f) | |
Year Ended
12/31/16 | | | — | (g) | | $ | 21.59 | | | | 51.94 | %(h) | | | 2.28 | % | | | (1.32 | )% | | | 2.31 | % | | $ | 30,789 | | | | 29 | % | |
Year Ended
12/31/15 | | | — | | | $ | 14.21 | | | | (38.67 | )% | | | 2.25 | % | | | (1.33 | )% | | | 2.25 | % | | $ | 26,501 | | | | 33 | % | |
Year Ended
12/31/14 | | | — | | | $ | 23.17 | | | | (23.41 | )% | | | 2.23 | % | | | (0.86 | )% | | | 2.24 | % | | $ | 63,193 | | | | 34 | % | |
See notes to financial statements.
41
Victory Portfolios | | Financial Highlights | |
For a Share Outstanding Throughout Each Period
| | | | Investment Activities | | Distributions to
Shareholders From | |
| | | Net Asset
Value,
Beginning of
Period | | Net
Investment
Income
(Loss)(a) | | Net
Realized and
Unrealized
Gains
(Losses) on
Investments | | Total from
Investment
Activities | | Net
Investment
Income | | Net Realized
Gains from
Investments | | Total
Distributions
to
Shareholders | |
Victory Global Natural Resources Fund | |
Class R | |
Six Months
Ended
6/30/19
(unaudited) | | $ | 12.18 | | | | (0.04 | ) | | | (1.70 | ) | | | (1.74 | ) | | | — | | | | — | | | | — | | |
Year Ended
12/31/18 | | $ | 22.56 | | | | (0.20 | ) | | | (10.18 | ) | | | (10.38 | ) | | | — | | | | — | | | | — | | |
Year Ended
12/31/17 | | $ | 22.42 | | | | (0.29 | ) | | | 0.43 | | | | 0.14 | | | | — | | | | — | | | | — | | |
Year Ended
12/31/16 | | $ | 14.68 | | | | (0.15 | ) | | | 7.89 | | | | 7.74 | | | | — | | | | — | | | | — | | |
Year Ended
12/31/15 | | $ | 23.82 | | | | (0.18 | ) | | | (8.96 | ) | | | (9.14 | ) | | | — | | | | — | | | | — | | |
Year Ended
12/31/14 | | $ | 33.86 | | | | (0.16 | ) | | | (7.68 | ) | | | (7.84 | ) | | | (0.01 | ) | | | (2.19 | ) | | | (2.20 | ) | |
Class Y | |
Six Months
Ended
6/30/19
(unaudited) | | $ | 13.38 | | | | 0.01 | | | | (1.88 | ) | | | (1.87 | ) | | | — | | | | — | | | | — | | |
Year Ended
12/31/18 | | $ | 24.60 | | | | (0.06 | ) | | | (11.16 | ) | | | (11.22 | ) | | | — | | | | — | | | | — | | |
Year Ended
12/31/17 | | $ | 24.28 | | | | (0.14 | ) | | | 0.46 | | | | 0.32 | | | | — | | | | — | | | | — | | |
Year Ended
12/31/16 | | $ | 15.80 | | | | (0.04 | ) | | | 8.52 | | | | 8.48 | | | | — | | | | — | | | | — | | |
Year Ended
12/31/15 | | $ | 25.48 | | | | (0.05 | ) | | | (9.63 | ) | | | (9.68 | ) | | | — | | | | — | | | | — | | |
Year Ended
12/31/14 | | $ | 35.76 | | | | 0.09 | | | | (8.17 | ) | | | (8.08 | ) | | | (0.01 | ) | | | (2.19 | ) | | | (2.20 | ) | |
(a) Per share net investment income (loss) has been calculated using the average daily shares method.
(b) Not annualized for periods less than one year.
(c) Annualized for periods less than one year.
(d) During the period, certain fees were reduced and/or reimbursed. If such fee reductions and/or reimbursements had not occurred, the ratios would have been as indicated.
(e) Portfolio turnover is calculated on the basis of the Fund as a whole without distinguishing between the classes of shares issued.
(f) Portfolio turnover increased due to a change within the portfolio holdings during the year.
(g) Amount is less than $0.005 per share.
(h) The Fund received monies related to a nonrecurring refund from the prior Custodian. The corresponding impact to the total return was less than 0.005% for the period shown. (See Note 8)
See notes to financial statements.
42
Victory Portfolios | | Financial Highlights — continued | |
For a Share Outstanding Throughout Each Period
| | | | Ratios to Average Net Assets | | Supplemental Data | |
| | | Capital
Contributions
from Prior
Custodian,
Net (See
Note 8) | | Net Asset
Value,
End of
Period | | Total
Return
(Excludes
Sales
Charge)(b) | | Net
Expenses(c) | | Net
Investment
Income
(Loss)(c) | | Gross
Expenses(c)(d) | | Net Assets,
End of
Period
(000's) | | Portfolio
Turnover(b)(e) | |
Victory Global Natural Resources Fund | |
Class R | |
Six Months
Ended
6/30/19
(unaudited) | | | — | | | $ | 10.44 | | | | (14.29 | )% | | | 1.86 | % | | | (0.58 | )% | | | 3.80 | % | | $ | 758 | | | | 4 | % | |
Year Ended
12/31/18 | | | — | | | $ | 12.18 | | | | (46.01 | )% | | | 1.86 | % | | | (0.99 | )% | | | 2.50 | % | | $ | 920 | | | | 26 | % | |
Year Ended
12/31/17 | | | — | | | $ | 22.56 | | | | 0.62 | % | | | 1.86 | % | | | (1.31 | )% | | | 2.20 | % | | $ | 2,442 | | | | 57 | %(f) | |
Year Ended
12/31/16 | | | — | (g) | | $ | 22.42 | | | | 52.72 | %(h) | | | 1.74 | % | | | (0.80 | )% | | | 1.74 | % | | $ | 4,611 | | | | 29 | % | |
Year Ended
12/31/15 | | | — | | | $ | 14.68 | | | | (38.37 | )% | | | 1.78 | % | | | (0.85 | )% | | | 1.78 | % | | $ | 3,427 | | | | 33 | % | |
Year Ended
12/31/14 | | | — | | | $ | 23.82 | | | | (23.12 | )% | | | 1.84 | % | | | (0.47 | )% | | | 1.85 | % | | $ | 4,929 | | | | 34 | % | |
Class Y | |
Six Months
Ended
6/30/19
(unaudited) | | | — | | | $ | 11.51 | | | | (13.98 | )% | | | 1.15 | % | | | 0.14 | % | | | 1.26 | % | | $ | 280,289 | | | | 4 | % | |
Year Ended
12/31/18 | | | — | | | $ | 13.38 | | | | (45.63 | )% | | | 1.15 | % | | | (0.29 | )% | | | 1.20 | % | | $ | 393,581 | | | | 26 | % | |
Year Ended
12/31/17 | | | — | | | $ | 24.60 | | | | 1.36 | % | | | 1.15 | % | | | (0.58 | )% | | | 1.19 | % | | $ | 1,126,533 | | | | 57 | %(f) | |
Year Ended
12/31/16 | | | — | (g) | | $ | 24.38 | | | | 53.67 | %(h) | | | 1.15 | % | | | (0.19 | )% | | | 1.17 | % | | $ | 1,300,024 | | | | 29 | % | |
Year Ended
12/31/15 | | | — | | | $ | 15.80 | | | | (37.99 | )% | | | 1.14 | % | | | (0.21 | )% | | | 1.14 | % | | $ | 1,174,590 | | | | 33 | % | |
Year Ended
12/31/14 | | | — | | | $ | 25.48 | | | | (22.56 | )% | | | 1.13 | % | | | 0.24 | % | | | 1.14 | % | | $ | 2,230,527 | | | | 34 | % | |
See notes to financial statements.
43
Victory Portfolios | | Notes to Financial Statements
June 30, 2019 | |
(Unaudited)
1. Organization:
Victory Portfolios (the "Trust") was organized on December 6, 1995 as a Delaware statutory trust as a successor to a company named "The Victory Portfolios," which was organized as a Massachusetts business trust on February 5, 1986. The Trust is registered under the Investment Company Act of 1940, as amended (the "1940 Act"), as an open-end investment company. The Trust is comprised of 42 funds and is authorized to issue an unlimited number of shares, which are units of beneficial interest with a par value of $0.001 per share. Each Fund is classified as diversified under the 1940 Act.
The accompanying financial statements are those of the following five Funds (collectively, the "Funds" and individually, a "Fund").
Funds (Legal Name) | | Funds (Short Name) | | Investment Share
Classes Offered | |
Victory RS Partners Fund | | RS Partners Fund | | Classes A, R and Y | |
Victory RS Value Fund | | RS Value Fund | | Classes A, C, R and Y | |
Victory RS Large Cap Alpha Fund | | RS Large Cap Alpha Fund | | Classes A, C, R and Y | |
Victory RS Investors Fund | | RS Investors Fund | | Classes A, C, R and Y | |
Victory Global Natural Resources Fund | | Global Natural Resources Fund | | Classes A, C, R and Y | |
Each class of shares of a Fund has substantially identical rights and privileges except with respect to sales charges, fees paid under distribution plans, expenses allocable exclusively to each class of shares, voting rights on matters solely affecting a single class of shares, and the exchange privilege of each class of shares.
Under the Trust's organizational documents, its officers and trustees are indemnified against certain liabilities arising out of the performance of their duties to the Funds. In addition, in the normal course of business, the Funds enter into contracts with their vendors and others that provide for general indemnifications. The Funds' maximum exposure under these arrangements is unknown, as this would involve future claims that may be made against the Funds. However, based on experience, the Funds expect that risk of loss to be remote.
2. Significant Accounting Policies:
The following is a summary of significant accounting policies followed by the Trust in the preparation of its financial statements. The policies are in conformity with accounting principles generally accepted in the United States of America ("GAAP"). The preparation of financial statements in accordance with GAAP requires management to make estimates and assumptions that affect the reported amounts of assets and liabilities and disclosure of contingent assets and liabilities at the date of the financial statements and the reported amounts of income and expenses for the period. Actual results could differ from those estimates. The Funds follow the specialized accounting and reporting requirements under GAAP that are applicable to investment companies.
Investment Valuation:
The Funds record investments at fair value. Fair value is defined as the price that would be received to sell an asset or paid to transfer a liability in an orderly transaction between market participants at the measurement date.
The valuation techniques described below maximize the use of observable inputs and minimize the use of unobservable inputs in determining fair value. The inputs used for valuing the Funds' investments are summarized in the three broad levels listed below:
• Level 1 — quoted prices in active markets for identical securities
• Level 2 — other significant observable inputs (including quoted prices for similar securities or interest rates applicable to those securities, etc.)
• Level 3 — significant unobservable inputs (including the Funds' own assumptions in determining the fair value of investments)
44
Victory Portfolios | | Notes to Financial Statements — continued
June 30, 2019 | |
(Unaudited)
Changes in valuation techniques may result in transfers in or out of an assigned level within the disclosure hierarchy. The inputs or methodologies used for valuation techniques are not necessarily an indication of the risk associated with entering into those investments.
Portfolio securities listed or traded on securities exchanges, including American Depositary Receipts ("ADRs") and Rights, are valued at the closing price on the exchange or system where the security is principally traded, if available, or at the Nasdaq Official Closing Price. If there have been no sales for that day on the exchange or system, then a security is valued at the last available bid quotation on the exchange or system where the security is principally traded. In each of these situations, valuations are typically categorized as Level 1 in the fair value hierarchy.
Investments for which there are no such quotations, or for which quotations do not appear reliable, are valued at fair value in accordance with procedures established by and under the general supervision and responsibility of the Trust's Board of Trustees (the "Board"). These valuations are typically categorized as Level 2 or Level 3 in the fair value hierarchy, based on the observability of inputs used to determine the fair value.
A summary of the valuations as of June 30, 2019, based upon the three levels defined above, is included in the table below while the breakdown, by category, of investments is disclosed in the Schedules of Portfolio Investments:
| | | LEVEL 1 —
Quoted Prices | | LEVEL 3 —
Other Significant
Unobservable Inputs | |
Total | |
| | | Investments
in
Securities | | Investments
in
Securities | | Investments
in
Securities | |
RS Partners Fund | |
Common Stocks | | $ | 415,374,602 | | | $ | — | | | $ | 415,374,602 | | |
Preferred Stocks | | | — | | | | 1,165,689 | | | | 1,165,689 | | |
Collateral for Securities Loaned | | | 28,299,844 | | | | — | | | | 28,299,844 | | |
Total | | | 443,674,446 | | | | 1,165,689 | | | | 444,840,135 | | |
RS Value Fund | |
Common Stocks | | | 381,590,307 | | | | — | | | | 381,590,307 | | |
Collateral for Securities Loaned | | | 19,301,098 | | | | — | | | | 19,301,098 | | |
Total | | | 400,891,405 | | | | — | | | | 400,891,405 | | |
RS Large Cap Alpha Fund | |
Common Stocks | | | 525,597,635 | | | | — | | | | 525,597,635 | | |
Collateral for Securities Loaned | | | 7,151,735 | | | | — | | | | 7,151,735 | | |
Total | | | 532,749,370 | | | | — | | | | 532,749,370 | | |
RS Investors Fund | |
Common Stocks | | | 40,549,505 | | | | — | | | | 40,549,505 | | |
Collateral for Securities Loaned | | | 1,554,312 | | | | — | | | | 1,554,312 | | |
Total | | | 42,103,817 | | | | — | | | | 42,103,817 | | |
Global Natural Resources Fund | |
Common Stocks | | | 313,792,094 | | | | — | | | | 313,792,094 | | |
Collateral for Securities Loaned | | | 7,701,671 | | | | — | | | | 7,701,671 | | |
Total | | | 321,493,765 | | | | — | | | | 321,493,765 | | |
45
Victory Portfolios | | Notes to Financial Statements — continued
June 30, 2019 | |
(Unaudited)
The following is a reconciliation of assets in which significant unobservable inputs (Level 3) were used in determining fair value:
Investment in Securities | | RS Partners
Fund | |
Balance as of December 31, 2018 | | $ | 1,165,689 | | |
Accrued discount (premium) | | | — | | |
Realized Gain (Loss) | | | — | | |
Change in Unrealized Appreciation/Depreciation | | | — | | |
Purchases | | | — | | |
Sales Proceeds | | | — | | |
Transfers into Level 3 | | | — | | |
Transfers out of Level 3 | | | — | | |
Balance as of June 30, 2019 | | $ | 1,165,689 | | |
The following is a summary of quantitative information about Level 3 Fair Value Measurements:
RS Partners Fund | | Fair Value
as of
June 30,
2019* | | Valuation
Techniques | | Unobservable
Input | | Input Values | | Impact to valuation
from an increase to input | |
Preferred Stocks
| | $ | 1,165,689
| | | Market
| | Premium /
Discount
| | Market
Transactions
| | Any change to the premium or
discount would result in direct
and proportional changes in the
fair value of the security. | |
* Level 3 securities are typically valued by the Adviser, pursuant to fair valuation procedures approved by the Board of Trustees. The appropriateness of fair values for these securities is monitored on an ongoing basis, by the Adviser, which may include back testing, results of vendor due diligence, audited financial information, unchanged price review and consideration of market and/or sector events.
Real Estate Investment Trusts ("REITS"):
The Funds may invest in REITS which report information on the source of their distributions annually. REITS are pooled investment vehicles that invest primarily in income producing real estate or real estate related loans or interests (such as mortgages). Certain distributions received from REITS during the year are recorded as realized gains or return of capital as estimated by the Funds or when such information becomes known.
Foreign Exchange Currency Contracts:
The Funds may enter into foreign exchange currency contracts to convert U.S. dollars to and from various foreign currencies. A foreign exchange currency contract is an obligation by a Fund to purchase or sell a specific currency at a future date at a price (in U.S. dollars) set at the time of the contract. The Funds do not engage in "cross-currency" foreign exchange contracts (i.e., contracts to purchase or sell one foreign currency in exchange for another foreign currency). The Funds' foreign exchange currency contracts might be considered spot contracts (typically a contract of one week or less) or forward contracts (typically a contract term over one week). A spot contract is entered into for purposes of hedging against foreign currency fluctuations relating to a specific portfolio transaction, such as the delay between a security transaction trade date and settlement date. Forward contracts are entered into for purposes of hedging portfolio holdings or concentrations of such holdings. Each foreign exchange currency contract is adjusted daily by the prevailing spot or forward rate of the underlying currency, and any appreciation or depreciation is recorded for financial statement purposes as unrealized until the contract settlement date, at which time the Fund records realized gains or losses equal to the difference between the value of a contract at the time it was opened and the value at the time it was closed. A Fund could be exposed to risk if a counterparty is unable to meet the terms of a foreign exchange currency contract or if the value of the foreign currency changes unfavorably. In
46
Victory Portfolios | | Notes to Financial Statements — continued
June 30, 2019 | |
(Unaudited)
addition, the use of foreign exchange currency contracts does not eliminate fluctuations in the underlying prices of the securities. As of June 30, 2019, the Funds had no open forward foreign exchange currency contracts.
Investment Transactions and Related Income:
Changes in holdings of investments are accounted for no later than one business day following the trade date. For financial reporting purposes, however, investment transactions are accounted for on trade date on the last business day of the reporting period. Interest income is determined on the basis of coupon interest accrued using the effective interest method which adjusts, where applicable, the amortization of premiums or accretion of discounts. Dividend income is recorded on the ex-dividend date. Gains or losses realized on sales of securities are determined by comparing the identified cost of the security lot sold with the net sales proceeds.
Withholding taxes on interest, dividends and gains as a result of certain investments in ADRs by the Funds have been provided for in accordance with each investment's applicable country's tax rules and rates.
Securities Lending:
The Trust has entered into a Master Securities Lending Agreement ("MSLA") with Citibank, N.A. ("Citibank" or the "Agent"). Under the terms of the MSLA, the Funds may lend securities to certain broker-dealers and banks in exchange for collateral in the amount of at least 102% of the value of U.S. securities loaned or at least 105% of the value of non-U.S. securities loaned, marked-to-market daily. Any collateral shortfalls associated with increases in the valuation of the securities loaned are adjusted the next business day. The collateral can be received in the form of cash collateral and/or non-cash collateral. Non-cash collateral can include U.S. Government Securities, letters of credit and certificates of deposit. The cash collateral is invested in short-term instruments or cash equivalents, primarily open-end investment companies, as noted in the Funds' Schedules of Portfolio Investments. The Trust does not have effective control of the non-cash collateral and therefore it is not disclosed in the Funds' Schedules of Portfolio Investments. The Funds continue to benefit from interest or dividends on the securities loaned and may also earn a return from the collateral. During the time portfolio securities are on loan, the borrower will pay the Funds any dividends or interest paid on such securities plus any fee negotiated between the parties to the lending agreement. The Funds also earn a return from the collateral. The Funds pay the Agent various fees in connection with the investment of cash collateral and fees based on the investment income received from securities lending activities. Securities lending income (net of the these fees) is disclosed on the Statements of Operations. Although risk is mitigated by the collateral, the Funds could experience a delay in recovering their securities and possible loss of income or value if the borrower fails to return them.
Securities lending transactions are entered into by a Fund under the MSLA, which permits the Fund, under certain circumstances such as an event of default, to offset amounts payable by the Fund to the same counterparty against amounts receivable from the counterparty to create a net payment due to or from the Fund.
The following table is a summary of the Funds' securities lending transactions which are subject to offset under the MSLA as of June 30, 2019. These transactions are accounted for as secured borrowings with an overnight and continuous contractual maturity for cash collateral, and greater than overnight and continuous contractual maturity for non-cash collateral.
| | | Gross
Amount of
Recognized
Assets
(Value of | | Value of
Cash | | Value of Non-cash Collateral
Received by Maturity | | | |
| | | Securities
on Loan) | | Collateral
Received* | | <30 Days | | Between
30 & 90 Days | | >90 Days | | Net Amount | |
RS Partners Fund | | $ | 27,831,841 | | | $ | 27,831,841 | | | $ | — | | | $ | — | | | $ | — | | | $ | — | | |
RS Value Fund | | | 19,095,830 | | | | 19,095,830 | | | | — | | | | — | | | | — | | | | — | | |
RS Large Cap Alpha Fund | | | 7,014,962 | | | | 7,014,962 | | | | — | | | | — | | | | — | | | | — | | |
47
Victory Portfolios | | Notes to Financial Statements — continued
June 30, 2019 | |
(Unaudited)
| | | Gross
Amount of
Recognized
Assets
(Value of | | Value of
Cash | | Value of Non-cash Collateral
Received by Maturity | | | |
| | | Securities
on Loan) | | Collateral
Received* | | <30 Days | | Between
30 & 90 Days | | >90 Days | | Net Amount | |
RS Investors Fund | | $ | 1,536,091 | | | $ | 1,536,091 | | | $ | — | | | $ | — | | | $ | — | | | $ | — | | |
Global Natural Resources Fund | | | 7,597,758 | | | | 7,597,758 | | | | | | | | | | — | | |
* Collateral received in excess of the market value of securities on loan is not presented in this table. The total cash collateral received by each Fund is disclosed in the Statements of Assets and Liabilities.
Distributions to Shareholders:
Dividends from net investment income, if any, are declared and paid annually for the Funds. Distributable net realized gains, if any, are declared and distributed at least annually from each Fund.
The amounts of dividends from net investment income and distributions from net realized gains (collectively distributions to shareholders) are determined in accordance with federal income tax regulations, which may differ from GAAP. To the extent these "book/tax" differences are permanent in nature (e.g., net operating loss and distribution reclassification), such amounts are reclassified within the components of net assets based on their federal tax-basis treatment; temporary differences (e.g., wash sales) do not require reclassification. To the extent dividends and distributions exceed net investment income and net realized gains for tax purposes, they are reported as distributions of capital. Net investment losses incurred by a Fund may be reclassified as an offset to capital on the accompanying Statements of Assets and Liabilities.
Federal Income Taxes:
It is the policy of each Fund to continue to qualify as a regulated investment company by complying with the provisions available to certain investment companies, as defined in applicable sections of the Internal Revenue Code, and to make distributions of net investment income and net realized gains sufficient to relieve it from all, or substantially all, federal income taxes. Accordingly, no provision for federal income taxes is required in the financial statements. The Funds have a tax year end of December 31.
Management of the Funds has reviewed tax positions taken in tax years that remain subject to examination by all major tax jurisdictions, including federal (i.e., all open tax years and the interim tax period since then). Management believes that there is no tax liability resulting from unrecognized tax benefits related to uncertain tax positions taken.
Allocations:
Expenses directly attributable to a Fund are charged to the Fund, while expenses which are attributable to more than one fund in the Trust, or jointly with an affiliated trust, are allocated among the respective funds in the Trust and/or affiliated trust based upon net assets or another appropriate basis.
Income, expenses (other than class-specific expenses such as transfer agent fees, state registration fees, printing and 12b-1 fees), and realized and unrealized gains or losses on investments are allocated to each class of shares based on its relative net assets on the date income is earned or expenses and realized and unrealized gains and losses are incurred.
Affiliated Securities Transactions:
Pursuant to Rule 17a-7 under the 1940 Act, the Funds may engage in securities transactions with affiliated investment companies and advisory accounts managed by the Adviser and any applicable sub-adviser. Any such purchase or sale transaction must be effected without brokerage commission or other remuneration, except for customary transfer fees. The transaction must be effected at the current market price, which is either the security's last sale price on an exchange or, if there are no transactions
48
Victory Portfolios | | Notes to Financial Statements — continued
June 30, 2019 | |
(Unaudited)
in the security that day, at the average of the highest bid and lowest asked price. For the six months ended June 30, 2019, the Funds did not engage in any Rule 17a-7 transactions under the 1940 Act.
3. Purchases and Sales of Securities:
Purchases and sales of securities (excluding securities maturing less than one year from acquisition) for the six months ended June 30, 2019 were as follows:
| | | Purchases
(excluding U.S.
Government
Securities) | | Sales
(excluding U.S.
Government
Securities) | |
RS Partners Fund | | $ | 123,477,862 | | | $ | 219,039,353 | | |
RS Value Fund | | | 116,436,453 | | | | 166,570,387 | | |
RS Large Cap Alpha Fund | | | 119,787,565 | | | | 162,787,632 | | |
RS Investors Fund | | | 13,099,676 | | | | 19,180,240 | | |
Global Natural Resources Fund | | | 18,014,079 | | | | 93,360,159 | | |
For the six months ended June 30, 2019, there were no purchases or sales of U.S. Government Securities.
4. Fees and Transactions with Affiliates and Related Parties:
Investment advisory services are provided to the Funds by Victory Capital Management Inc. ("VCM" or the "Adviser"), a New York corporation registered as an investment adviser with the Securities and Exchange Commission ("SEC"). The Adviser is wholly-owned indirect subsidiary of Victory Capital Holdings, Inc., a publicly traded Delaware corporation, and a wholly-owned direct subsidiary of Victory Capital Operating, LLC.
VCM has entered into a Sub-Advisory Agreement with SailingStone Capital Partners LLC ("SailingStone"). SailingStone is responsible for providing day-to-day investment advisory services to the Global Natural Resources Fund, subject to the oversight of the Board of Trustees of the Trust. Sub-investment advisory fees paid by VCM to SailingStone do not represent a separate or additional expense to the Funds.
Under the terms of the Investment Advisory Agreement, the Adviser is entitled to receive fees based on a percentage of the average daily net assets of each Fund. The rates at which the Adviser is paid by each Fund are included in the table below. The Adviser may use its resources to assist with the Funds' distribution and marketing expenses.
| | | Adviser Fee Rate | |
RS Partners Fund | | | 1.00 | % | |
RS Value Fund | | | 0.85 | % | |
RS Large Cap Alpha Fund | | | 0.50 | % | |
RS Investors Fund | | | 1.00 | % | |
Global Natural Resources Fund | | | 1.00 | % | |
VCM also serves as the Funds' administrator and fund accountant. Under an Administration and Fund Accounting Agreement, VCM is paid for its services an annual fee at a rate of 0.08% of the first $15 billion in average daily net assets of the Trust, Victory Variable Insurance Funds and Victory Portfolios II (collectively, the "Victory Funds Complex"), 0.05% of the average daily net assets above $15 billion to $30 billion of the Victory Funds Complex and 0.04% of the average daily net assets over $30 billion of the Victory Funds Complex.
Citi Fund Services Ohio, Inc. ("Citi"), an affiliate of Citibank, N.A., acts as sub-administrator and sub-fund accountant to the Funds pursuant to a Sub-Administration and Sub-Fund Accounting Services Agreement between VCM and Citi. VCM pays Citi a fee for providing these services. The Trust reimburses VCM and Citi for all of their reasonable out-of-pocket expenses incurred in providing these services.
FIS Investor Services, LLC ("FIS") serves as the Funds' transfer agent. Under the Transfer Agent Agreement, the Trust pays FIS a fee for its services and reimburses FIS for all of their reasonable out-of-pocket expenses incurred in providing these services.
49
Victory Portfolios | | Notes to Financial Statements — continued
June 30, 2019 | |
(Unaudited)
The Chief Compliance Officer ("CCO") is an employee of the Adviser, which pays the compensation of the CCO and his support staff. The Trust has entered into an Agreement to provide compliance services with the Adviser, pursuant to which the Adviser furnishes its compliance personnel, including the services of the CCO, and other resources reasonably necessary to provide the Trust with compliance oversight services related to the design, administration and oversight of a compliance program for the Trust in accordance with Rule 38a-1 under the 1940 Act. The funds in the Victory Funds Complex, in the aggregate, compensate the Adviser for these services.
The Victory Funds Complex pays an annual retainer to each Independent Trustee, plus an additional annual retainer to the Chairman of the Board. The aggregate amount of the fees and expenses of the Independent Trustees are allocated amongst all the funds in the Victory Funds Complex and are presented in the Statements of Operations.
Shearman & Sterling LLP provides legal services to the Trust.
Victory Capital Advisers, Inc. (the "Distributor"), an affiliate of the Adviser, serves as distributor for the continuous offering of the shares of the Funds pursuant to a Distribution Agreement between the Distributor and the Trust. Pursuant to the Distribution and Service Plans adopted in accordance with Rule 12b-1 under the 1940 Act, the Distributor may receive a monthly distribution and service fee, at an annual rate of up to 0.25% of the average daily net assets of Class A Shares, at an annual rate of up to 0.50% of the average daily net assets of Class R Shares and 1.00% of the average daily net assets of Class C Shares of the Funds. The distribution and service fees paid to the Distributor may be used by the Distributor to pay for activities primarily intended to result in the sale of Class A, Class R or Class C Shares of the Funds.
In addition, the Distributor is entitled to receive commissions on sales of the Class A Shares of the Funds. For the six months ended June 30, 2019, the Distributor received approximately $10,306 from commissions earned on sales of Class A Shares of the Funds.
The Adviser has entered into expense limitation agreements with certain Funds. Under the terms of the agreements, the Adviser has agreed to waive fees or reimburse certain expenses to the extent that ordinary operating expenses incurred by certain classes of a Fund in any fiscal year exceed the expense limit for such classes of the Fund. Such excess amounts will be the liability of the Adviser. Interest, taxes, brokerage commissions, other expenditures which are capitalized in accordance with GAAP, and other extraordinary expenses not incurred in the ordinary course of a Fund's business are excluded from the expense limits. As of June 30, 2019, the expense limits (excluding voluntary waivers) are as follows:
| | | In effect January 1, 2019 until April 30, 2020 | |
| | | Class A
Shares | | Class C
Shares | | Class R
Shares | | Class Y
Shares | |
RS Partners Fund | | | 1.45 | % | | | N/A | | | | 1.81 | % | | | 1.12 | % | |
RS Value Fund | | | 1.30 | % | | | 2.07 | % | | | 1.69 | % | | | 1.06 | % | |
RS Large Cap Alpha Fund | | | 0.89 | % | | | 1.69 | % | | | 1.26 | % | | | 0.68 | % | |
RS Investors Fund | | | 1.33 | % | | | 2.07 | % | | | 1.95 | % | | | 1.05 | % | |
Global Natural Resources Fund | | | 1.48 | % | | | 2.28 | % | | | 1.86 | % | | | 1.15 | % | |
The Funds have agreed to repay fees and expenses that were waived or reimbursed by the Adviser for a period up to three fiscal years after such waiver or reimbursement was made to the extent such payments or repayments would not cause the expenses of a class to exceed the original expense limitation in place at time of the waiver or reimbursement or any expense limitation agreement in place at the time of repayment. Amounts repaid to the Adviser during the six months ended, if any, are reflected on the Statements of Operations as "Recoupment of prior expenses waived/reimbursed by Adviser".
As of June 30, 2019, the following amounts are available to be repaid to the Adviser.
| | | Expires
12/31/19 | | Expires
12/31/20 | | Expires
12/31/21 | | Expires
12/31/22 | | Total | |
RS Partners Fund | | $ | 243,315 | | | $ | 487,905 | | | $ | 386,406 | | | $ | 189,595 | | | $ | 1,307,221 | | |
RS Value Fund | | | 210,691 | | | | 94,907 | | | | 116,096 | | | | 84,787 | | | | 506,481 | | |
50
Victory Portfolios | | Notes to Financial Statements — continued
June 30, 2019 | |
(Unaudited)
| | | Expires
12/31/19 | | Expires
12/31/20 | | Expires
12/31/21 | | Expires
12/31/22 | | Total | |
RS Large Cap Alpha Fund | | $ | 137,276 | | | $ | 283,005 | | | $ | 236,137 | | | $ | 174,407 | | | $ | 830,825 | | |
RS Investors Fund | | | 86,542 | | | | 179,335 | | | | 163,946 | | | | 78,806 | | | | 508,629 | | |
Global Natural Resources Fund | | | 118,930 | | | | 697,524 | | | | 577,205 | | | | 316,678 | | | | 1,710,337 | | |
The Adviser, may voluntarily waive or reimburse additional fees to assist the Funds in maintaining competitive expense ratios. Voluntary waivers and reimbursements applicable to the Funds are not available to be recouped at a future time. There were no voluntary waivers or reimbursements for the six months ended June 30, 2019.
Certain officers and/or interested trustees of the Funds are also officers and/or employees of the Adviser, Administrator, Fund Accountant, Sub-Administrator, Sub-Fund Accountant, and Legal Counsel.
5. Risks:
Each Fund may be subject to other risks in addition to these identified risks.
An investment in the Funds' shares represents an indirect investment in the securities owned by the Funds, some of which will be traded on a national securities exchange or in the over-the-counter markets. The value of the securities in which the Funds invest, like other market investments, may move up or down, sometimes rapidly and unpredictably. The value of the securities in which the Funds invest may affect the value of the Funds' shares. An investment in the Funds' shares at any point in time may be worth less than the original investment, even after taking into account the reinvestment of the Funds' distributions.
The Funds will be subject to credit risk with respect to the amount each expects to receive from counterparties for financial instruments entered into by the Funds. The Funds may be negatively impacted if a counterparty becomes bankrupt or otherwise fails to perform its obligations due to financial difficulties. The Funds may experience significant delays in obtaining any recovery in bankruptcy or other reorganization proceeding and the Funds may obtain only limited recovery or may obtain no recovery in such circumstances. The Funds typically enter into transactions with counterparties whose credit ratings are investment grade, as determined by a nationally recognized statistical rating organization or, if unrated, judged by the Adviser to be of comparable quality.
6. Borrowing and Interfund Lending:
Line of Credit:
For the six months ended June 30, 2019, the Victory Funds Complex participated in a short-term, demand note "Line of Credit" agreement with Citibank. Under the agreement with Citibank, the Victory Funds Complex could borrow up to $250 million, of which $100 million was committed and $150 million was uncommitted. This agreement was in effect through July 26, 2019. Effective July 1, 2019, the current agreement was amended to include the USAA Mutual Funds Complex and has a new termination date of June 29, 2020. Under this amended agreement, the Victory Funds Complex and USAA Mutual Funds Complex, combined, may borrow up to $600 million, of which $300 million is committed and $300 million is uncommitted. $40 million of the Line of Credit is reserved for use by the Victory Floating Rate Fund, another series of the Victory Funds Complex, with that Fund paying the related commitment fees for that amount. The purpose of the agreement is to meet temporary or emergency cash needs, including redemption requests that might otherwise require the untimely disposition of securities. With the agreement in affect for the six months ended June 30, 2019, Citibank received an annual commitment fee of 0.15% on $100 million for providing the Line of Credit. For the six months ended June 30, 2019, Citibank earned approximately $76 thousand in commitment fees from the Victory Funds Complex. Effective July 1, 2019, Citibank receives an annual commitment fee of 0.15% on $300 million for providing the Line of Credit. Each fund in the Victory Funds Complex pays a pro-rata portion of the commitment fees plus any interest (one month LIBOR plus one percent) on amounts borrowed, including the USAA Mutual Funds Complex, commencing July 1, 2019. Interest
51
Victory Portfolios | | Notes to Financial Statements — continued
June 30, 2019 | |
(Unaudited)
charged to each Fund during the period is presented on the Statements of Operations under line of credit fees.
The Funds did not utilize the Line of Credit during the six months ended June 30, 2019.
Interfund Lending:
The Trust and Adviser rely on an exemptive order granted by the SEC in March 2017 (the "Order"), permitting the establishment and operation of an Interfund Lending Facility (the "Facility"). The Facility allows each Fund to directly lend and borrow money to or from any other Victory Fund relying upon the Order at rates beneficial to both the borrowing and lending funds. Advances under the Facility are allowed for temporary or emergency purposes, including the meeting of redemption requests that otherwise might require the untimely disposition of securities, and are subject to each Fund's borrowing restrictions. The interfund loan rate is determined, as specified in the Order, by averaging the current repurchase agreement rate and the current bank loan rate. As a Borrower, interest charged to each Fund during the period is presented on the Statement of Operations under interfund lending fees. As a Lender, interest earned by each Fund during the period is presented on the Statement of Operations under Income on interfund lending.
The Funds did not utilize or participate in the Facility during the six months ended June 30, 2019.
7. Federal Income Tax Information:
The tax character of distributions paid and the tax basis of current components of accumulated earnings (deficit) will be determined at the end of the current tax year ending December 31, 2019.
The tax character of distributions paid during the most recent tax year ended December 31, 2018, was as follows (total distributions paid may differ from the Statements of Changes in Net Assets because, for tax purposes, dividends are recognized when actually paid):
| | | Year Ended December 31, 2018 | |
| | | Distributions paid from | | | | | |
| | | Ordinary
Income | | Net
Long-Term
Capital Gains | | Total
Taxable
Distributions | | Total
Distributions
Paid | |
RS Partners Fund | | $ | 21,072,795 | | | $ | 64,795,114 | | | $ | 85,867,909 | | | $ | 85,867,909 | | |
RS Value Fund | | | 17,224,429 | | | | 33,453,011 | | | | 50,677,440 | | | | 50,677,440 | | |
RS Large Cap Alpha Fund | | | 11,094,267 | | | | 78,647,453 | | | | 89,741,720 | | | | 89,741,720 | | |
RS Investors Fund | | | 1,664,202 | | | | 4,543,064 | | | | 6,207,266 | | | | 6,207,266 | | |
As of the most recent tax year ended December 31, 2018, the components of distributable earnings/accumulated deficit on a tax basis were as follows:
| | | Undistributed
Ordinary
Income | | Undistributed
Long-Term
Capital Gains | | Accumulated
Earnings | | Accumulated
Capital and
Other
Losses | | Unrealized
Appreciation
(Depreciation)* | | Total
Accumulated
Earnings
(Deficit) | |
RS Partners Fund | | $ | — | | | $ | 6,637,062 | | | $ | 6,637,062 | | | $ | — | | | $ | 5,657,974 | | | $ | 12,295,036 | | |
RS Value Fund | | | — | | | | 956,773 | | | | 956,773 | | | | — | | | | (7,303,389 | ) | | | (6,346,616 | ) | |
RS Large Cap Alpha
Fund | | | 1,805,721 | | | | 5,706,806 | | | | 7,512,527 | | | | — | | | | 6,041,182 | | | | 13,553,709 | | |
RS Investors Fund | | | — | | | | 108,057 | | | | 108,057 | | | | — | | | | (1,185,672 | ) | | | (1,077,615 | ) | |
Global Natural
Resources Fund | | | — | | | | — | | | | — | | | | (1,350,964,403 | ) | | | (488,349,248 | ) | | | (1,839,313,651 | ) | |
* The difference between the book-basis and tax-basis unrealized appreciation (depreciation) is attributable primarily to tax deferral of losses on wash sales.
52
Victory Portfolios | | Notes to Financial Statements — continued
June 30, 2019 | |
(Unaudited)
As of the most recent tax year ended December 31, 2018, the following Funds had net capital loss carryforwards ("CLCFs") as summarized in the tables below:
| | | Short-Term
Amount | | Long-Term
Amount | | Total | |
Global Natural Resources Fund | | $ | — | | | $ | 1,350,964,403 | | | $ | 1,350,964,403 | | |
As of June 30, 2019, the cost basis for federal income tax purposes, gross unrealized appreciation, gross unrealized depreciation and net unrealized appreciation (depreciation) for investments and derivatives were as follows:
| | Cost of
Investments
for Federal
Tax Purposes | | Gross
Unrealized
Appreciation | | Gross
Unrealized
Depreciation | | Net
Unrealized
Appreciation
(Depreciation) | |
RS Partners Fund | | $ | 375,500,940 | | | $ | 78,380,470 | | | $ | (9,041,275 | ) | | $ | 69,339,195 | | |
RS Value Fund | | | 352,495,692 | | | | 60,418,406 | | | | (12,022,693 | ) | | | 48,395,713 | | |
RS Large Cap Alpha Fund | | | 446,560,285 | | | | 98,377,382 | | | | (12,188,297 | ) | | | 86,189,085 | | |
RS Investors Fund | | | 35,752,756 | | | | 7,854,818 | | | | (1,503,757 | ) | | | 6,351,061 | | |
Global Natural Resources Fund | | | 827,291,684 | | | | 31,866,762 | | | | (537,664,681 | ) | | | (505,797,919 | ) | |
8. Capital Contribution from Prior Custodian:
During 2016, certain Funds received notification from their prior custodian, State Street Bank and Trust ("State Street"), concerning issues related to billing on certain categories of expenses during the approximately 16-year period from 1998 through October 31, 2014. The over-billing primarily related to categories of expenses that involved an allocation of general costs among multiple clients.
State Street paid the refunded amounts during January 2017. Based on billing information received during 2016 from State Street and an analysis of any expense limitation agreements that were in place during the period of the activities in question, including the application of any recoupment provisions in such agreements, the Adviser received a portion of the refund.
The portion of the refund retained by the Funds was accounted for as a capital contribution and is reflected on the Financial Highlights as "Capital Contribution from Prior Custodian, Net".
9. Fund Ownership:
Ownership of more than 25% of the voting securities of a fund creates presumptions of control of the fund, under section 2(a)(9) of the 1940 Act. As of June 30, 2019, The shareholders listed below held more than 25% of the shares outstanding of the Fund and may be deemed to control the Fund.
| | | Shareholder | | Percent | |
RS Partners Fund | | National Financial Services LLC | | | 33.8 | % | |
10. Recent Accounting Pronouncements:
In August 2018, the Financial Accounting Standards Board ("FASB") issued Accounting Standards Update "ASU") No. 2018-13, "Fair Value Measurements" ("ASU 2018-13"). This update makes certain removals from, changes to and additions to existing disclosure requirements for fair value measurements. ASU 2018-13 does not change fair value measurements already required or permitted by existing standards. ASU 2018-13 is effective for financial statements issued for fiscal years beginning after December 15, 2019, and interim periods within those fiscal years. As permitted, the Funds have early adopted ASU 2018-13 with the financial statements prepared as of June 30, 2019.
11. Subsequent Events:
The Funds have evaluated the need for additional disclosures or adjustments resulting from subsequent events through the date these financial statements were issued. Based on this evaluation, there were no subsequent events to report that would have a material impact on the Funds' financial statements.
53
Victory Portfolios | | Supplemental Information
June 30, 2019 | |
(Unaudited)
Trustee and Officer Information
Board of Trustees:
Overall responsibility for management of the Trust rests with the Board. The Trust is managed by the Board in accordance with the laws of the State of Delaware. There are currently ten Trustees, nine of whom are not "interested persons" of the Trust within the meaning of that term under the 1940 Act ("Independent Trustees") and one of whom is an "interested person" of the Trust within the meaning of that term under the 1940 Act ("Interested Trustee"). The Trustees, in turn, elect the officers of the Trust to actively supervise its day-to-day operations. The following tables list the Trustees, their ages, position with the Trust, commencement of service, principal occupations during the past five years and any directorships of other investment companies or companies whose securities are registered under the Securities Exchange Act of 1934, as amended, or who file reports under that Act. Each Trustee oversees 42 portfolios in the Trust, nine portfolios in Victory Variable Insurance Funds and 20 portfolios in Victory Portfolios II, each a registered investment company that, together with the Trust, comprise the Victory Funds Complex. Each Trustee's address is c/o Victory Portfolios, 4900 Tiedeman Road, 4th Floor, Brooklyn, Ohio 44144. Each Trustee has an indefinite term.
Name and Age | | Position
Held with
the Trust | | Date
Commenced
Service | | Principal Occupation
During Past 5 Years | | Other
Directorships
Held During
Past 5 Years | |
Independent Trustees. | | | | | | | | | |
David Brooks Adcock, 67 | | Trustee | | May 2005 | | Consultant (since 2006). | | Chair and Trustee, Turner Funds (December 2016-December 2017). | |
Nigel D. T. Andrews, 72 | | Vice Chair and Trustee | | August 2002 | | Retired. | | Director, TCG BDC II, Inc. (since 2017); Director, TCG BDC I, Inc. (formerly Carlyle GMS Finance, Inc.) (since 2012); Director, Old Mutual US Asset Management (2002-2014). | |
E. Lee Beard, 68* | | Trustee | | May 2005 | | Retired (since 2015); Consultant, The Henlee Group, LLC (consulting) (2005-2015). | | None. | |
Dennis M. Bushe, 75 | | Trustee | | July 2016 | | Retired. | | Trustee, RS Investment Trust and RS Variable Products Trust (November 2011-July 2016). | |
54
Victory Portfolios | | Supplemental Information — continued
June 30, 2019 | |
(Unaudited)
Name and Age | | Position
Held with
the Trust | | Date
Commenced
Service | | Principal Occupation
During Past 5 Years | | Other
Directorships
Held During
Past 5 Years | |
Sally M. Dungan, 65 | | Trustee | | February 2011 | | Chief Investment Officer, Tufts University (since 2002). | | None. | |
John L. Kelly, 66 | | Trustee | | February 2015 | | Partner, McCarvill Capital Partners (September 2016-September 2017); Advisor, Endgate Commodities LLC (January 2016-April 2016); Managing Partner, Endgate Commodities LLC (August 2014-January 2016); Chief Operating Officer, Liquidnet Holdings, Inc. (December 2011-July 2014). | | Director, Caledonia Mining Corporation (since May 2012). | |
David L. Meyer, 62* | | Trustee | | December 2008 | | Retired. | | None. | |
Gloria S. Nelund, 58 | | Trustee | | July 2016 | | Chair, CEO and Co-Founder of TriLinc Global, LLC, an investment firm. | | TriLinc Global Impact Fund, LLC (since 2012); Trustee, RS Investment Trust and RS Variable Products Trust (November 2007-July 2016). | |
Leigh A. Wilson, 74 | | Chair and Trustee | | November 1994 | | Private Investor. | | Chair (since 2013), Caledonia Mining Corporation. | |
Interested Trustee. | |
David C. Brown, 47** | | Trustee | | May 2008 | | Chairman and Chief Executive Officer (since 2013), Co-Chief Executive Officer (2011-2013), the Adviser; Chairman and Chief Executive Officer, Victory Capital Holdings, Inc. (since 2013). | | None. | |
* The Board has designated Mr. Meyer and Ms. Beard as its Audit Committee Financial Experts.
** Mr. Brown is an "Interested Person" by reason of his relationship with the Adviser.
The Statement of Additional Information includes additional information about the Trustees of the Trust and is available, without charge, on the SEC's website at www.sec.gov and/or by calling 800-539-3863.
55
Victory Portfolios | | Supplemental Information — continued
June 30, 2019 | |
(Unaudited)
Officers:
The officers of the Trust, their ages, commencement of service and their principal occupations during the past five years, are detailed in the following table. Each officer serves until the earlier of his or her resignation, removal, retirement, death, or the election of a successor. The mailing address of each officer of the Trust is 4900 Tiedeman Road, 4th Floor, Brooklyn, Ohio 44144. The officers of the Trust receive no compensation directly from the Trust for performing the duties of their offices.
Name and Age | | Position with
the Trust | | Date
Commenced
Service | | Principal Occupation During Past 5 Years | |
Christopher K. Dyer, 57 | | President | | February 2006* | | Director of Mutual Fund Administration, the Adviser. | |
Scott A. Stahorsky, 50 | | Vice President | | December 2014 | | Manager, Fund Administration, the Adviser (since 2015); Senior Analyst, Fund Administration, the Adviser (prior to 2015). | |
Erin G. Wagner, 45 | | Secretary | | December 2014 | | Associate General Counsel, the Adviser (since 2013). | |
Allan Shaer, 54 | | Treasurer | | May 2017 | | Senior Vice President, Financial Administration, Citi Fund Services Ohio, Inc. (since 2016); Vice President, Mutual Fund Administration, JP Morgan Chase (2011-2016). | |
Christopher A. Ponte, 35 | | Assistant Treasurer | | December 2017 | | Manager, Fund Administration, the Adviser (since 2017); Senior Analyst, Fund Administration, the Adviser (prior to 2017); Chief Financial Officer, Victory Capital Advisers, Inc. (since 2018). | |
Colin Kinney, 45 | | Chief Compliance Officer | | July 2017 | | Chief Compliance Officer (since 2013) and Chief Risk Officer (2009-2017), the Adviser. | |
Chuck Booth, 59 | | Anti-Money Laundering Compliance Officer and Identity Theft Officer | | May 2015 | | Director, Regulatory Administration and CCO Support Services, Citi Fund Services Ohio, Inc. | |
Jay G. Baris, 65 | | Assistant Secretary | | December 1997 | | Partner, Shearman & Sterling LLP (since 2018); Partner, Morrison & Foerster LLP (2011-January 2018). | |
* On December 3, 2014, Mr. Dyer resigned as Secretary of the Trust and accepted the position of President.
56
Victory Portfolios | | Supplemental Information — continued
June 30, 2019 | |
(Unaudited)
Proxy Voting and Portfolio Holdings Information
Proxy Voting:
Information regarding the policies and procedures each Fund uses to determine how to vote proxies relating to portfolio securities is available without charge, upon request, by calling 800-539-3863. The information is also included in the Funds' Statement of Additional Information, which is available on the SEC's website at www.sec.gov.
Information relating to how the Funds voted proxies relating to portfolio securities held during the most recent twelve months ended June 30 is available on the SEC's website at www.sec.gov.
Availability of Schedules of Portfolio Investments:
The Trust files a complete list of Schedules of Portfolio Investments with the SEC for the first and third quarter of each fiscal year on Form N-PORT. Prior to the implementation of Form N-PORT, the Trust filed a complete list of Schedules of Portfolio Investments with the SEC for the first and third quarters of each fiscal year on Form N-Q. Forms N-PORT and Forms N-Q are available on the SEC's website at www.sec.gov.
Expense Examples
As a shareholder of the Funds, you may incur two types of costs: (1) transaction costs, including sales charges (loads) on purchases; and (2) ongoing costs, including management fees, distribution and service (12b-1) fees, and other Fund expenses. These examples are intended to help you understand your ongoing costs (in dollars) of investing in the Funds and to compare these costs with the ongoing costs of investing in other mutual funds.
These examples are based on an investment of $1,000 invested at the beginning of the period and held for the entire period from January 1, 2019 through June 30, 2019.
The Actual Expense figures in the table below provide information about actual account values and actual expenses. You may use the information below, together with the amount you invested, to estimate the expenses that you paid over the period. Simply divide your account value by $1,000 (for example, an $8,600 account value divided by $1,000 = 8.6), then multiply the result by the number in the table under the heading entitled "Actual Expenses Paid During Period" to estimate the expenses you paid on your account during this period.
The Hypothetical Expense figures in the table below provide information about hypothetical account values and hypothetical expenses based on each Fund's actual expense ratio and an assumed rate of return of 5% per year before expenses, which is not the Fund's actual return. The hypothetical account values and expenses may not be used to estimate the actual ending account balance or expenses you paid for the period. You may use this information to compare this 5% hypothetical example with the 5% hypothetical examples that appear in shareholder reports of other funds.
Please note the expenses shown in the table are meant to highlight your ongoing costs only and do not reflect any transactional costs. Therefore, the table is useful in comparing ongoing costs only, and will not help you determine the relative total costs of owning different funds. In addition, if these transactional costs were included, your costs would have been higher.
Fund | | Beginning
Account
Value
1/1/19 | | Actual
Ending
Account
Value
6/30/19 | | Hypothetical
Ending
Account
Value
6/30/19 | | Actual
Expenses
Paid
During
Period
1/1/19-
6/30/19* | | Hypothetical
Expenses
Paid
During
Period
1/1/19-
6/30/19* | | Annualized
Expense
Ratio
During
Period
1/1/19-
6/30/19 | |
RS Partners Fund | |
Class A Shares | | $ | 1,000.00 | | | $ | 1,224.40 | | | $ | 1,017.60 | | | $ | 8.00 | | | $ | 7.25 | | | | 1.45 | % | |
Class R Shares | | | 1,000.00 | | | | 1,222.20 | | | | 1,015.82 | | | | 9.97 | | | | 9.05 | | | | 1.81 | % | |
Class Y Shares | | | 1,000.00 | | | | 1,226.40 | | | | 1,019.24 | | | | 6.18 | | | | 5.61 | | | | 1.12 | % | |
57
Victory Portfolios | | Supplemental Information — continued
June 30, 2019 | |
(Unaudited)
Fund | | Beginning
Account
Value
1/1/19 | | Actual
Ending
Account
Value
6/30/19 | | Hypothetical
Ending
Account
Value
6/30/19 | | Actual
Expenses
Paid
During
Period
1/1/19-
6/30/19* | | Hypothetical
Expenses
Paid
During
Period
1/1/19-
6/30/19* | | Annualized
Expense
Ratio
During
Period
1/1/19-
6/30/19 | |
RS Value Fund | |
Class A Shares | | $ | 1,000.00 | | | $ | 1,218.90 | | | $ | 1,018.35 | | | $ | 7.15 | | | $ | 6.51 | | | | 1.30 | % | |
Class C Shares | | | 1,000.00 | | | | 1,214.00 | | | | 1,014.53 | | | | 11.36 | | | | 10.34 | | | | 2.07 | % | |
Class R Shares | | | 1,000.00 | | | | 1,216.60 | | | | 1,016.41 | | | | 9.29 | | | | 8.45 | | | | 1.69 | % | |
Class Y Shares | | | 1,000.00 | | | | 1,220.00 | | | | 1,019.54 | | | | 5.83 | | | | 5.31 | | | | 1.06 | % | |
RS Large Cap Alpha Fund | |
Class A Shares | | | 1,000.00 | | | | 1,187.20 | | | | 1,020.38 | | | | 4.83 | | | | 4.46 | | | | 0.89 | % | |
Class C Shares | | | 1,000.00 | | | | 1,182.50 | | | | 1,016.41 | | | | 9.15 | | | | 8.45 | | | | 1.69 | % | |
Class R Shares | | | 1,000.00 | | | | 1,184.70 | | | | 1,018.55 | | | | 6.83 | | | | 6.31 | | | | 1.26 | % | |
Class Y Shares | | | 1,000.00 | | | | 1,188.30 | | | | 1,021.42 | | | | 3.69 | | | | 3.41 | | | | 0.68 | % | |
RS Investors Fund | |
Class A Shares | | | 1,000.00 | | | | 1,219.10 | | | | 1,018.20 | | | | 7.32 | | | | 6.66 | | | | 1.33 | % | |
Class C Shares | | | 1,000.00 | | | | 1,215.10 | | | | 1,014.53 | | | | 11.37 | | | | 10.34 | | | | 2.07 | % | |
Class R Shares | | | 1,000.00 | | | | 1,215.30 | | | | 1,015.12 | | | | 10.71 | | | | 9.74 | | | | 1.95 | % | |
Class Y Shares | | | 1,000.00 | | | | 1,220.30 | | | | 1,019.59 | | | | 5.78 | | | | 5.26 | | | | 1.05 | % | |
Global Natural Resources Fund | |
Class A Shares | | | 1,000.00 | | | | 859.30 | | | | 1,017.46 | | | | 6.82 | | | | 7.40 | | | | 1.48 | % | |
Class C Shares | | | 1,000.00 | | | | 855.50 | | | | 1,013.49 | | | | 10.49 | | | | 11.38 | | | | 2.28 | % | |
Class R Shares | | | 1,000.00 | | | | 857.10 | | | | 1,015.57 | | | | 8.56 | | | | 9.30 | | | | 1.86 | % | |
Class Y Shares | | | 1,000.00 | | | | 860.20 | | | | 1,019.09 | | | | 5.30 | | | | 5.76 | | | | 1.15 | % | |
* Expenses are equal to the average account value multiplied by the Fund's annualized expense ratio multiplied by 181/365 (the number of days in the most recent fiscal half-year divided by the number of days in the fiscal year).
58
Privacy Policy
Protecting the Privacy of Information
The Trust respects your right to privacy. We also know that you expect us to conduct and process your business in an accurate and efficient manner. To do so, we must collect and maintain certain personal information about you. This is the information we collect from you on applications or other forms, and from the transactions you make with us or third parties. It may include your name, address, social security number, account transactions and balances, and information about investment goals and risk tolerance.
We do not disclose any information about you or about former customers to anyone except as permitted or required by law. Specifically, we may disclose the information we collect to companies that perform services on our behalf, such as the transfer agent that processes shareholder accounts and printers and mailers that assist us in the distribution of investor materials. We may also disclose this information to companies that perform marketing services on our behalf. This allows us to continue to offer you Victory investment products and services that meet your investing needs, and to effect transactions that you request or authorize. These companies will use this information only in connection with the services for which we hired them. They are not permitted to use or share this information for any other purpose.
To protect your personal information internally, we permit access only by authorized employees and maintain physical, electronic and procedural safeguards to guard your personal information.*
* You may have received communications regarding information about privacy policies from other financial institutions which gave you the opportunity to "opt-out" of certain information sharing with companies which are not affiliated with that financial institution. The Trust does not share information with other companies for purposes of marketing solicitations for products other than the Trust. Therefore, the Trust does not provide opt-out options to their shareholders.
Victory Funds
P.O. Box 182593
Columbus, Ohio 43218-2593

Visit our website at: | | Call Victory at: | |
www.vcm.com | | 800-539-FUND (800-539-3863) | |
Item 2. Code of Ethics.
Not applicable — only for annual reports.
Item 3. Audit Committee Financial Expert.
Not applicable — only for annual reports.
Item 4. Principal Accountant Fees and Services.
Not applicable — only for annual reports.
Item 5. Audit Committee of Listed Registrants.
Not applicable.
Item 6. Investments.
(a) | Not applicable. |
(b) | Not applicable. |
Item 7. Disclosure of Proxy Voting Policies and Procedures for Closed-End Management Investment Companies.
Not applicable.
Item 8. Portfolio Managers of Closed-End Management Investment Companies.
Not applicable.
Item 9. Purchases of Equity Securities by Closed-End Management Investment Company and Affiliated Purchasers.
Not applicable.
Item 10. Submission of Matters to a Vote of Security Holders.
Not applicable.
Item 11. Controls and Procedures.
(a) The registrant’s principal executive officer and principal financial officer have concluded, based on their evaluation of the registrant’s disclosure controls and procedures as conducted within 90 days of the filing date of this report, that these disclosure controls and procedures are adequately designed and are operating effectively to ensure that information required to be disclosed by the registrant on Form N-CSR is recorded, processed, summarized and reported within the time periods specified in the Securities and Exchange Commission’s rules and forms.
(b) There were no changes in the registrant’s internal control over financial reporting (as defined in Rule 30a-3(d) under the Investment Company Act of 1940 (17 CFR 270.30a-3(d)) that occurred during the period covered by this report that have materially affected or are reasonably likely to materially affect, the registrant’s internal control over financial reporting.
Item 12. Disclosure of Securities Lending Activities for Closed-End Management Investment Companies.
(a)(1) | Not applicable. |
(a)(2) | Not applicable. |
(a)(3) | Not applicable. |
(a)(4) | Not applicable. |
(b) | Not applicable. |
Item 13. Exhibits.
(a)(1) | Not applicable. |
(a)(2) | Certifications pursuant to Rule 30a-2(a) are attached hereto. |
(a)(3) | Not applicable. |
(b) | Certifications pursuant to Rule 30a-2(b) are furnished herewith. |
SIGNATURES
Pursuant to the requirements of the Securities Exchange Act of 1934 and the Investment Company Act of 1940, the registrant has duly caused this report to be signed on its behalf by the undersigned, thereunto duly authorized.
(Registrant) | Victory Portfolios | |
| | |
By (Signature and Title)* | /s/ Allan Shaer | |
| Allan Shaer, Principal Financial Officer | |
| | | |
Date | September 3, 2019 | | |
| | | |
Pursuant to the requirements of the Securities Exchange Act of 1934 and the Investment Company Act of 1940, this report has been signed below by the following persons on behalf of the registrant and in the capacities and on the dates indicated. |
| | |
By (Signature and Title)* | /s/ Christopher K. Dyer | |
| | Christopher K. Dyer, Principal Executive Officer | |
| | | |
Date | August 30, 2019 | | |
| | | |
By (Signature and Title)* | /s/ Allan Shaer | |
| | Allan Shaer, Principal Financial Officer | |
| | | |
Date | September 3, 2019 | | |
| | | | |