UNITED STATES
SECURITIES AND EXCHANGE COMMISSION
Washington, D.C. 20549
FORM N-CSR
CERTIFIED SHAREHOLDER REPORT OF REGISTERED
MANAGEMENT INVESTMENT COMPANIES
Investment Company Act file number: 811-04852
Victory Portfolios
(Exact name of registrant as specified in charter)
| 4900 Tiedeman Road, 4th Floor, Brooklyn, Ohio | 44144 |
| (Address of principal executive offices) | (Zip code) |
Citi Fund Services Ohio, Inc., 4400 Easton Commons, Suite 200, Columbus, OH 43219
(Name and address of agent for service)
Registrant’s telephone number, including area code: 800-539-3863
Date of fiscal year end: October 31
Date of reporting period: April 30, 2020
Item 1. Reports to Stockholders.

April 30, 2020
Semi Annual Report
Victory Diversified Stock Fund
Victory NewBridge Large Cap Growth Fund
Victory Special Value Fund
Victory Strategic Allocation Fund
Victory INCORE Fund for Income
Victory INCORE Investment Grade Convertible Fund
Beginning January 1, 2021, as permitted by regulations adopted by the Securities and Exchange Commission, paper copies of the Victory Funds' shareholder reports will no longer be sent by mail, unless you specifically request paper copies of the reports from the Victory Funds or from your financial intermediary, such as a broker-dealer or bank. Instead, the reports will be made available on www.VictoryFunds.com, and you will be notified by mail each time a report is posted and provided with a website link to access the report.
If you already elected to receive shareholder reports electronically, you will not be affected by this change and you need not take any action. You may elect to receive shareholder reports and other communications from the Victory Funds or your financial intermediary electronically by notifying your financial intermediary directly or, if you are a direct investor, by calling 800-539-3863 or by sending an e-mail request to TA.Processing@FISGlobal.com.
You may elect to receive all future reports in paper free of charge. If you invest through a financial intermediary, you can contact your financial intermediary to request that you continue to receive paper copies of your reports. If you invest directly with the Victory Funds, you can call 800-539-3863 or send an e-mail request to TA.Processing@FISGlobal.com. Your election to receive reports in paper will apply to all Victory Funds you hold directly or through your financial intermediary.
www.vcm.com
News, Information And Education 24 Hours A Day, 7 Days A Week
The Victory Funds site gives fund shareholders, prospective shareholders, and investment professionals a convenient way to access fund information, get guidance, and track fund performance anywhere they can access the Internet. The site includes:
• Detailed performance records
• Daily share prices
• The latest fund news
• Investment resources to help you become a better investor
• A section dedicated to investment professionals
Whether you're a potential investor searching for the fund that matches your investment philosophy, a seasoned investor interested in planning tools, or an investment professional, www.vcm.com has what you seek. Visit us anytime. We're always open.
Table of Contents
Financial Statements | |
Victory Diversified Stock Fund | |
Investment Objectives & Portfolio Holdings | | | 4 | | |
Schedule of Portfolio Investments | | | 6 | | |
Statements of Assets and Liabilities | | | 20-21 | | |
Statements of Operations | | | 24 | | |
Statements of Changes in Net Assets | | | 26-28 | | |
Financial Highlights | | | 32-35 | | |
Victory NewBridge Large Cap Growth Fund | |
Investment Objectives & Portfolio Holdings | | | 4 | | |
Schedule of Portfolio Investments | | | 9 | | |
Statements of Assets and Liabilities | | | 20-21 | | |
Statements of Operations | | | 24 | | |
Statements of Changes in Net Assets | | | 26-28 | | |
Financial Highlights | | | 36-37 | | |
Victory Special Value Fund | |
Investment Objectives & Portfolio Holdings | | | 4 | | |
Schedule of Portfolio Investments | | | 11 | | |
Statements of Assets and Liabilities | | | 20-21 | | |
Statements of Operations | | | 24 | | |
Statements of Changes in Net Assets | | | 26-28 | | |
Financial Highlights | | | 38-41 | | |
Victory Strategic Allocation Fund | |
Investment Objectives & Portfolio Holdings | | | 4 | | |
Schedule of Portfolio Investments | | | 14 | | |
Statements of Assets and Liabilities | | | 22-23 | | |
Statements of Operations | | | 25 | | |
Statements of Changes in Net Assets | | | 29-31 | | |
Financial Highlights | | | 42-43 | | |
Victory INCORE Fund for Income | |
Investment Objectives & Portfolio Holdings | | | 5 | | |
Schedule of Portfolio Investments | | | 15 | | |
Statements of Assets and Liabilities | | | 22-23 | | |
Statements of Operations | | | 25 | | |
Statements of Changes in Net Assets | | | 29-31 | | |
Financial Highlights | | | 44-47 | | |
Victory INCORE Investment Grade Convertible Fund | |
Investment Objectives & Portfolio Holdings | | | 5 | | |
Schedule of Portfolio Investments | | | 17 | | |
Statements of Assets and Liabilities | | | 22-23 | | |
Statements of Operations | | | 25 | | |
Statements of Changes in Net Assets | | | 29-31 | | |
Financial Highlights | | | 48-49 | | |
Notes to Financial Statements | | | 50 | | |
1
Supplemental Information | | | |
Proxy Voting and Portfolio Holdings Information | | | 62 | | |
Expense Examples | | | 62 | | |
Considerations of the Board in Continuing the
Investment Advisory Agreement | | | 64 | | |
Privacy Policy (inside back cover) | | | |
The Funds are distributed by Victory Capital Services, Inc. Victory Capital Management Inc. is the investment adviser to the Funds and receives fees from the Funds for performing services for the Funds.
This report is not authorized for distribution to prospective investors unless preceded or accompanied by a current prospectus of the Victory Funds.
For additional information about any Victory Fund, including fees, expenses, and risks, view our prospectus online at vcm.com or call 800-539-3863. Read it carefully before you invest or send money.
The information in this semi annual report is based on data obtained from recognized services and sources and is believed to be reliable. Any opinions, projections, or recommendations in this report are subject to change without notice and are not intended as individual investment advice. Past investment performance of the Funds, markets or securities mentioned herein should not be considered to be indicative of future results.
• NOT FDIC INSURED • NO BANK GUARANTEE • MAY LOSE VALUE

Call Victory at:
800-539-FUND (800-539-3863)
Visit our website at:
www.vcm.com
2
This page is intentionally left blank.
3
Victory Portfolios | | April 30, 2020 | |
(Unaudited)
Investment Objectives & Portfolio Holdings:
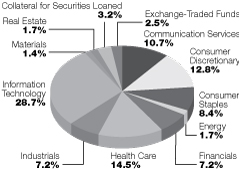
Diversified Stock Fund
Seeks to provide long-term growth of capital. | |
Portfolio Holdings
As a Percentage of Total Investments
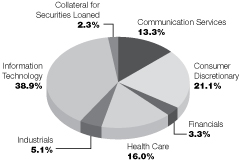
NewBridge Large Cap Growth Fund
Seeks to provide long-term capital appreciation. | |
Portfolio Holdings
As a Percentage of Total Investments
Special Value Fund
Seeks to provide long-term growth of capital
and dividend income. | |
Portfolio Holdings
As a Percentage of Total Investments

Strategic Allocation Fund
Seeks to provide income and long-term
growth of capital. | |
Portfolio Holdings
As a Percentage of Total Investments

4
Victory Portfolios | | April 30, 2020 | |
(Unaudited)
Investment Objectives & Portfolio Holdings: (continued)
INCORE Fund for Income
Seeks to provide a high level of current income
consistent with preservation of shareholder's capital. | |
Portfolio Holdings
As a Percentage of Total Investments

INCORE Investment Grade Convertible Fund
Seeks to provide a high level of current income
together with long-term capital appreciation. | |
Portfolio Holdings
As a Percentage of Total Investments

5
Victory Portfolios
Victory Diversified Stock Fund | | Schedule of Portfolio Investments
April 30, 2020 | |
(Amounts in Thousands, Except for Shares) (Unaudited)
Security Description | | Shares | | Value | |
Common Stocks (95.7%) | |
Communication Services (10.9%): | |
Alphabet, Inc., Class C (a) | | | 7,604 | | | $ | 10,256 | | |
Comcast Corp., Class A | | | 78,359 | | | | 2,948 | | |
Facebook, Inc., Class A (a) | | | 25,359 | | | | 5,191 | | |
Netflix, Inc. (a) | | | 7,494 | | | | 3,146 | | |
Nexstar Media Group, Inc., Class A | | | 19,457 | | | | 1,363 | | |
T-Mobile US, Inc. (a) | | | 35,144 | | | | 3,086 | | |
| | | | 25,990 | | |
Communications Equipment (1.3%): | |
Cisco Systems, Inc. | | | 41,847 | | | | 1,773 | | |
Lumentum Holdings, Inc. (a) | | | 16,028 | | | | 1,297 | | |
| | | | 3,070 | | |
Consumer Discretionary (13.0%): | |
Amazon.com, Inc. (a) | | | 5,288 | | | | 13,082 | | |
Boyd Gaming Corp. | | | 137,472 | | | | 2,294 | | |
D.R. Horton, Inc. | | | 27,714 | | | | 1,309 | | |
Dollar General Corp. | | | 21,683 | | | | 3,801 | | |
Installed Building Products, Inc. (a) | | | 22,875 | | | | 1,128 | | |
LGI Homes, Inc. (a) | | | 22,088 | | | | 1,338 | | |
Marriott Vacations Worldwide Corp. | | | 12,252 | | | | 1,017 | | |
Meritage Homes Corp. (a) | | | 26,237 | | | | 1,379 | | |
Skechers USA, Inc., Class A (a) | | | 64,615 | | | | 1,821 | | |
Target Corp. | | | 22,681 | | | | 2,489 | | |
TopBuild Corp. (a) | | | 14,367 | | | | 1,339 | | |
| | | | 30,997 | | |
Consumer Staples (8.5%): | |
Kimberly-Clark Corp. | | | 22,408 | | | | 3,103 | | |
PepsiCo, Inc. | | | 25,004 | | | | 3,307 | | |
Philip Morris International, Inc. | | | 17,425 | | | | 1,300 | | |
The Coca-Cola Co. | | | 35,882 | | | | 1,647 | | |
The Kroger Co. | | | 94,508 | | | | 2,987 | | |
The Procter & Gamble Co. | | | 28,591 | | | | 3,370 | | |
US Foods Holding Corp. (a) | | | 120,535 | | | | 2,592 | | |
Walmart, Inc. | | | 16,880 | | | | 2,052 | | |
| | | | 20,358 | | |
Electronic Equipment, Instruments & Components (1.2%): | |
CDW Corp. | | | 26,673 | | | | 2,955 | | |
Energy (1.8%): | |
Chevron Corp. | | | 14,038 | | | | 1,291 | | |
Phillips 66 | | | 19,844 | | | | 1,453 | | |
Valero Energy Corp. | | | 22,639 | | | | 1,434 | | |
| | | | 4,178 | | |
Financials (7.3%): | |
Ameriprise Financial, Inc. | | | 22,728 | | | | 2,613 | | |
Citigroup, Inc. | | | 45,639 | | | | 2,216 | | |
See notes to financial statements.
6
Victory Portfolios
Victory Diversified Stock Fund | | Schedule of Portfolio Investments — continued
April 30, 2020 | |
(Amounts in Thousands, Except for Shares) (Unaudited)
Security Description | | Shares | | Value | |
Essent Group Ltd. | | | 82,376 | | | $ | 2,250 | | |
Flagstar Bancorp, Inc. | | | 77,220 | | | | 2,000 | | |
Meta Financial Group, Inc. (b) | | | 72,889 | | | | 1,343 | | |
NMI Holdings, Inc., Class A (a) | | | 106,825 | | | | 1,444 | | |
Primerica, Inc. | | | 18,011 | | | | 1,872 | | |
Stifel Financial Corp. | | | 24,534 | | | | 1,086 | | |
Western Alliance Bancorp | | | 70,980 | | | | 2,547 | | |
| | | | 17,371 | | |
Health Care (14.7%): | |
AbbVie, Inc. (b) | | | 57,437 | | | | 4,721 | | |
Bristol-Myers Squibb Co. | | | 70,143 | | | | 4,266 | | |
Charles River Laboratories International, Inc. (a) | | | 21,738 | | | | 3,146 | | |
HCA Healthcare, Inc. | | | 20,879 | | | | 2,294 | | |
ICON PLC (a) | | | 19,070 | | | | 3,060 | | |
Medtronic PLC | | | 10,113 | | | | 987 | | |
Merck & Co., Inc. | | | 38,823 | | | | 3,080 | | |
Pfizer, Inc. | | | 70,248 | | | | 2,695 | | |
Regeneron Pharmaceuticals, Inc. (a) | | | 5,800 | | | | 3,050 | | |
Syneos Health, Inc. (a) | | | 38,181 | | | | 2,130 | | |
UnitedHealth Group, Inc. | | | 19,750 | | | | 5,776 | | |
| | | | 35,205 | | |
Industrials (7.3%): | |
Federal Signal Corp. | | | 102,087 | | | | 2,749 | | |
Kansas City Southern | | | 16,696 | | | | 2,180 | | |
L3Harris Technologies, Inc. | | | 15,546 | | | | 3,011 | | |
Lockheed Martin Corp. | | | 10,899 | | | | 4,240 | | |
Old Dominion Freight Line, Inc. | | | 9,357 | | | | 1,359 | | |
Universal Forest Products, Inc. | | | 55,317 | | | | 2,275 | | |
XPO Logistics, Inc. (a)(b) | | | 24,164 | | | | 1,613 | | |
| | | | 17,427 | | |
IT Services (5.6%): | |
Booz Allen Hamilton Holdings Corp. | | | 37,460 | | | | 2,751 | | |
EPAM Systems, Inc. (a) | | | 12,136 | | | | 2,681 | | |
Fiserv, Inc. (a) | | | 21,741 | | | | 2,241 | | |
Leidos Holdings, Inc. | | | 25,479 | | | | 2,518 | | |
Mastercard, Inc., Class A | | | 5,071 | | | | 1,394 | | |
Visa, Inc., Class A (b) | | | 10,477 | | | | 1,872 | | |
| | | | 13,457 | | |
Materials (1.4%): | |
Silgan Holdings, Inc. | | | 38,897 | | | | 1,342 | | |
Vulcan Materials Co. | | | 18,018 | | | | 2,035 | | |
| | | | 3,377 | | |
Real Estate (1.7%): | |
American Tower Corp. | | | 8,845 | | | | 2,105 | | |
CBRE Group, Inc., Class A (a) | | | 45,677 | | | | 1,961 | | |
| | | | 4,066 | | |
See notes to financial statements.
7
Victory Portfolios
Victory Diversified Stock Fund | | Schedule of Portfolio Investments — continued
April 30, 2020 | |
(Amounts in Thousands, Except for Shares) (Unaudited)
Security Description | | Shares | | Value | |
Semiconductors & Semiconductor Equipment (3.7%): | |
Broadcom, Inc. | | | 15,908 | | | $ | 4,321 | | |
NVIDIA Corp. | | | 15,641 | | | | 4,571 | | |
| | | | 8,892 | | |
Software (12.0%): | |
Adobe, Inc. (a) | | | 9,281 | | | | 3,282 | | |
Microsoft Corp. | | | 91,577 | | | | 16,412 | | |
Oracle Corp. | | | 53,210 | | | | 2,819 | | |
Salesforce.com, Inc. (a) | | | 26,336 | | | | 4,265 | | |
ServiceNow, Inc. (a) | | | 4,421 | | | | 1,554 | | |
| | | | 28,332 | | |
Technology Hardware, Storage & Peripherals (5.3%): | |
Apple, Inc. | | | 43,225 | | | | 12,700 | | |
Total Common Stocks (Cost $194,732) | | | 228,375 | | |
Exchange-Traded Funds (2.5%) | |
SPDR S&P 500 ETF Trust | | | 20,472 | | | | 5,947 | | |
Total Exchange-Traded Funds (Cost $5,631) | | | 5,947 | | |
Collateral for Securities Loaned^ (3.3%) | |
BlackRock Liquidity Funds TempFund, Institutional Class, 0.61% (c) | | | 147,588 | | | | 148 | | |
Fidelity Investments Money Market Government Portfolio,
Institutional Class, 0.18% (c) | | | 3,379,472 | | | | 3,379 | | |
Fidelity Investments Money Market Prime Money Market Portfolio,
Institutional Class, 0.47% (c) | | | 73,622 | | | | 74 | | |
Goldman Sachs Financial Square Prime Obligations Fund,
Institutional Class, 0.67% (c) | | | 1,026,322 | | | | 1,026 | | |
JPMorgan Prime Money Market Fund, Capital Class, 0.68% (c) | | | 587,291 | | | | 587 | | |
Morgan Stanley Institutional Liquidity Prime Portfolio,
Institutional Class, 0.72% (c) | | | 2,640,573 | | | | 2,641 | | |
Total Collateral for Securities Loaned (Cost $7,855) | | | 7,855 | | |
Total Investments (Cost $208,218) — 101.5% | | | 242,177 | | |
Liabilities in excess of other assets — (1.5)% | | | (3,462 | ) | |
NET ASSETS — 100.00% | | $ | 238,715 | | |
^ Purchased with cash collateral from securities on loan.
(a) Non-income producing security.
(b) All or a portion of this security is on loan.
(c) Rate disclosed is the daily yield on April 30, 2020.
ETF — Exchange-Traded Fund
PLC — Public Limited Company
See notes to financial statements.
8
Victory Portfolios
Victory NewBridge Large Cap Growth Fund | | Schedule of Portfolio Investments
April 30, 2020 | |
(Amounts in Thousands, Except for Shares) (Unaudited)
Security Description | | Shares | | Value | |
Common Stocks (98.7%) | |
Communication Services (13.3%): | |
Activision Blizzard, Inc. | | | 8,873 | | | $ | 565 | | |
Alphabet, Inc., Class C (a) | | | 565 | | | | 762 | | |
Facebook, Inc., Class A (a) | | | 3,359 | | | | 688 | | |
| | | | 2,015 | | |
Consumer Discretionary (21.5%): | |
Alibaba Group Holding Ltd., ADR (a) | | | 2,823 | | | | 572 | | |
Amazon.com, Inc. (a) | | | 509 | | | | 1,259 | | |
Burlington Stores, Inc. (a) | | | 2,839 | | | | 519 | | |
Lululemon Athletica, Inc. (a) | | | 2,747 | | | | 614 | | |
Ulta Beauty, Inc. (a) | | | 1,300 | | | | 283 | | |
| | | | 3,247 | | |
Electronic Equipment, Instruments & Components (2.1%): | |
Keysight Technologies, Inc. (a) | | | 3,362 | | | | 325 | | |
Financials (3.4%): | |
MSCI, Inc. | | | 1,550 | | | | 507 | | |
Health Care (16.3%): | |
Edwards Lifesciences Corp. (a) | | | 1,966 | | | | 428 | | |
UnitedHealth Group, Inc. | | | 1,794 | | | | 525 | | |
Veeva Systems, Inc., Class A (a) | | | 2,584 | | | | 493 | | |
Vertex Pharmaceuticals, Inc. (a) | | | 1,619 | | | | 407 | | |
Zoetis, Inc. | | | 4,628 | | | | 598 | | |
| | | | 2,451 | | |
Industrials (5.3%): | |
CoStar Group, Inc. (a) | | | 738 | | | | 478 | | |
Uber Technologies, Inc. (a) | | | 10,321 | | | | 312 | | |
| | | | 790 | | |
IT Services (15.5%): | |
EPAM Systems, Inc. (a) | | | 2,352 | | | | 520 | | |
PayPal Holdings, Inc. (a) | | | 5,171 | | | | 636 | | |
Shopify, Inc., Class A (a) | | | 433 | | | | 274 | | |
Visa, Inc., Class A | | | 5,257 | | | | 939 | | |
| | | | 2,369 | | |
Semiconductors & Semiconductor Equipment (4.8%): | |
NVIDIA Corp. | | | 2,463 | | | | 720 | | |
Software (16.5%): | |
Adobe, Inc. (a) | | | 1,284 | | | | 454 | | |
Proofpoint, Inc. (a) | | | 2,687 | | | | 327 | | |
Salesforce.com, Inc. (a) | | | 3,077 | | | | 498 | | |
ServiceNow, Inc. (a) | | | 2,525 | | | | 889 | | |
The Trade Desk, Inc., Class A (a) (b) | | | 1,174 | | | | 343 | | |
| | | | 2,511 | | |
Total Common Stocks (Cost $7,949) | | | 14,935 | | |
See notes to financial statements.
9
Victory Portfolios
Victory NewBridge Large Cap Growth Fund | | Schedule of Portfolio Investments — continued
April 30, 2020 | |
(Amounts in Thousands, Except for Shares) (Unaudited)
Security Description | | Shares | | Value | |
Collateral for Securities Loaned^ (2.3%) | |
BlackRock Liquidity Funds TempFund, Institutional Class, 0.61% (c) | | | 6,556 | | | $ | 7 | | |
Fidelity Investments Money Market Government Portfolio,
Institutional Class, 0.18% (c) | | | 150,126 | | | | 150 | | |
Fidelity Investments Money Market Prime Money Market Portfolio,
Institutional Class, 0.47% (c) | | | 3,270 | | | | 3 | | |
Goldman Sachs Financial Square Prime Obligations Fund,
Institutional Class, 0.67% (c) | | | 45,592 | | | | 46 | | |
JPMorgan Prime Money Market Fund, Capital Class, 0.68% (c) | | | 26,089 | | | | 26 | | |
Morgan Stanley Institutional Liquidity Prime Portfolio,
Institutional Class, 0.72% (c) | | | 117,302 | | | | 117 | | |
Total Collateral for Securities Loaned (Cost $349) | | | 349 | | |
Total Investments (Cost $8,298) — 101.0% | | | 15,284 | | |
Liabilities in excess of other assets — (1.0)% | | | (155 | ) | |
NET ASSETS — 100.00% | | $ | 15,129 | | |
^ Purchased with cash collateral from securities on loan.
(a) Non-income producing security.
(b) All or a portion of this security is on loan.
(c) Rate disclosed is the daily yield on April 30, 2020.
ADR — American Depositary Receipt
See notes to financial statements.
10
Victory Portfolios
Victory Special Value Fund | | Schedule of Portfolio Investments
April 30, 2020 | |
(Amounts in Thousands, Except for Shares) (Unaudited)
Security Description | | Shares | | Value | |
Common Stocks (95.6%) | |
Communication Services (10.9%): | |
Alphabet, Inc., Class C (a) | | | 1,379 | | | $ | 1,859 | | |
Comcast Corp., Class A | | | 14,210 | | | | 535 | | |
Facebook, Inc., Class A (a) | | | 4,585 | | | | 939 | | |
Netflix, Inc. (a) | | | 1,355 | | | | 569 | | |
Nexstar Media Group, Inc., Class A | | | 3,558 | | | | 249 | | |
T-Mobile US, Inc. (a) | | | 6,340 | | | | 557 | | |
| | | | 4,708 | | |
Communications Equipment (1.3%): | |
Cisco Systems, Inc. | | | 7,591 | | | | 322 | | |
Lumentum Holdings, Inc. (a) | | | 2,907 | | | | 235 | | |
| | | | 557 | | |
Consumer Discretionary (13.0%): | |
Amazon.com, Inc. (a) | | | 969 | | | | 2,398 | | |
Boyd Gaming Corp. | | | 24,901 | | | | 416 | | |
D.R. Horton, Inc. | | | 5,043 | | | | 238 | | |
Dollar General Corp. | | | 3,887 | | | | 681 | | |
Installed Building Products, Inc. (a) | | | 4,101 | | | | 202 | | |
LGI Homes, Inc. (a) (b) | | | 4,019 | | | | 243 | | |
Marriott Vacations Worldwide Corp. | | | 2,209 | | | | 183 | | |
Meritage Homes Corp. (a) | | | 4,774 | | | | 251 | | |
Skechers USA, Inc., Class A (a) | | | 11,719 | | | | 330 | | |
Target Corp. | | | 4,078 | | | | 448 | | |
TopBuild Corp. (a) | | | 2,614 | | | | 244 | | |
| | | | 5,634 | | |
Consumer Staples (8.5%): | |
Kimberly-Clark Corp. | | | 4,066 | | | | 563 | | |
PepsiCo, Inc. | | | 4,529 | | | | 599 | | |
Philip Morris International, Inc. | | | 3,110 | | | | 232 | | |
The Coca-Cola Co. | | | 6,500 | | | | 298 | | |
The Kroger Co. | | | 17,147 | | | | 542 | | |
The Procter & Gamble Co. | | | 5,137 | | | | 606 | | |
US. Foods Holding Corp. (a) | | | 21,656 | | | | 466 | | |
Walmart, Inc. | | | 3,070 | | | | 373 | | |
| | | | 3,679 | | |
Electronic Equipment, Instruments & Components (1.2%): | |
CDW Corp. | | | 4,811 | | | | 533 | | |
Energy (1.7%): | |
Chevron Corp. | | | 2,545 | | | | 234 | | |
Phillips 66 | | | 3,581 | | | | 262 | | |
Valero Energy Corp. | | | 3,909 | | | | 248 | | |
| | | | 744 | | |
See notes to financial statements.
11
Victory Portfolios
Victory Special Value Fund | | Schedule of Portfolio Investments — continued
April 30, 2020 | |
(Amounts in Thousands, Except for Shares) (Unaudited)
Security Description | | Shares | | Value | |
Financials (7.2%): | |
Ameriprise Financial, Inc. | | | 4,118 | | | $ | 474 | | |
Citigroup, Inc. | | | 8,300 | | | | 403 | | |
Essent Group Ltd. | | | 14,418 | | | | 394 | | |
Flagstar Bancorp, Inc. | | | 13,945 | | | | 361 | | |
Meta Financial Group, Inc. | | | 13,153 | | | | 242 | | |
NMI Holdings, Inc., Class A (a) | | | 19,243 | | | | 260 | | |
Primerica, Inc. | | | 3,277 | | | | 341 | | |
Stifel Financial Corp. | | | 4,408 | | | | 195 | | |
Western Alliance Bancorp | | | 12,708 | | | | 456 | | |
| | | | 3,126 | | |
Health Care (14.7%): | |
AbbVie, Inc. | | | 10,319 | | | | 848 | | |
Bristol-Myers Squibb Co. | | | 12,678 | | | | 770 | | |
Charles River Laboratories International, Inc. (a) | | | 3,921 | | | | 567 | | |
HCA Healthcare, Inc. | | | 3,790 | | | | 416 | | |
ICON PLC (a) | | | 3,440 | | | | 552 | | |
Medtronic PLC | | | 1,835 | | | | 179 | | |
Merck & Co., Inc. | | | 7,003 | | | | 556 | | |
Pfizer, Inc. | | | 12,631 | | | | 485 | | |
Regeneron Pharmaceuticals, Inc. (a) | | | 1,046 | | | | 550 | | |
Syneos Health, Inc. (a) | | | 6,866 | | | | 383 | | |
UnitedHealth Group, Inc. | | | 3,594 | | | | 1,052 | | |
| | | | 6,358 | | |
Industrials (7.3%): | |
Federal Signal Corp. | | | 18,294 | | | | 493 | | |
Kansas City Southern | | | 3,041 | | | | 397 | | |
L3Harris Technologies, Inc. | | | 2,807 | | | | 544 | | |
Lockheed Martin Corp. | | | 1,972 | | | | 766 | | |
Old Dominion Freight Line, Inc. | | | 1,698 | | | | 247 | | |
Universal Forest Products, Inc. | | | 9,924 | | | | 408 | | |
XPO Logistics, Inc. (a) (b) | | | 4,384 | | | | 293 | | |
| | | | 3,148 | | |
IT Services (5.7%): | |
Booz Allen Hamilton Holdings Corp. | | | 6,774 | | | | 496 | | |
EPAM Systems, Inc. (a) | | | 2,189 | | | | 484 | | |
Fiserv, Inc. (a) | | | 3,880 | | | | 400 | | |
Leidos Holdings, Inc. | | | 4,548 | | | | 449 | | |
Mastercard, Inc., Class A | | | 922 | | | | 254 | | |
Visa, Inc., Class A | | | 1,905 | | | | 340 | | |
| | | | 2,423 | | |
Materials (1.4%): | |
Silgan Holdings, Inc. | | | 7,057 | | | | 243 | | |
Vulcan Materials Co. | | | 3,237 | | | | 366 | | |
| | | | 609 | | |
See notes to financial statements.
12
Victory Portfolios
Victory Special Value Fund | | Schedule of Portfolio Investments — continued
April 30, 2020 | |
(Amounts in Thousands, Except for Shares) (Unaudited)
Security Description | | Shares | | Value | |
Real Estate (1.7%): | |
American Tower Corp. | | | 1,596 | | | $ | 380 | | |
CBRE Group, Inc., Class A (a) | | | 8,311 | | | | 357 | | |
| | | | 737 | | |
Semiconductors & Semiconductor Equipment (3.7%): | |
Broadcom, Inc. | | | 2,858 | | | | 776 | | |
NVIDIA Corp. | | | 2,865 | | | | 838 | | |
| | | | 1,614 | | |
Software (12.0%): | |
Adobe, Inc. (a) | | | 1,697 | | | | 600 | | |
Microsoft Corp. | | | 16,559 | | | | 2,967 | | |
Oracle Corp. | | | 9,645 | | | | 511 | | |
Salesforce.com, Inc. (a) | | | 4,823 | | | | 781 | | |
ServiceNow, Inc. (a) | | | 805 | | | | 283 | | |
| | | | 5,142 | | |
Technology Hardware, Storage & Peripherals (5.3%): | |
Apple, Inc. | | | 7,855 | | | | 2,308 | | |
Total Common Stocks (Cost $36,088) | | | 41,320 | | |
Exchange-Traded Funds (2.5%) | |
SPDR S&P 500 ETF Trust | | | 3,704 | | | | 1,076 | | |
Total Exchange-Traded Funds (Cost $1,004) | | | 1,076 | | |
Collateral for Securities Loaned^ (1.2%) | |
BlackRock Liquidity Funds TempFund, Institutional Class, 0.61% (c) | | | 9,453 | | | | 9 | | |
Fidelity Investments Money Market Government Portfolio, Institutional Class,
0.18% (c) | | | 216,455 | | | | 216 | | |
Fidelity Investments Money Market Prime Money Market Portfolio, Institutional
Class, 0.47% (c) | | | 4,715 | | | | 5 | | |
Goldman Sachs Financial Square Prime Obligations Fund, Institutional Class,
0.67% (c) | | | 65,736 | | | | 66 | | |
JPMorgan Prime Money Market Fund, Capital Class, 0.68% (c) | | | 37,616 | | | | 38 | | |
Morgan Stanley Institutional Liquidity Prime Portfolio, Institutional Class,
0.72% (c) | | | 169,128 | | | | 169 | | |
Total Collateral for Securities Loaned (Cost $503) | | | 503 | | |
Total Investments (Cost $37,595) — 99.3% | | | 42,899 | | |
Other assets in excess of liabilities — 0.7% | | | 324 | | |
NET ASSETS — 100.00% | | $ | 43,223 | | |
^ Purchased with cash collateral from securities on loan.
(a) Non-income producing security.
(b) All or a portion of this security is on loan.
(c) Rate disclosed is the daily yield on April 30, 2020.
ETF — Exchange-Traded Fund
PLC — Public Limited Company
See notes to financial statements.
13
Victory Portfolios
Victory Strategic Allocation Fund | | Schedule of Portfolio Investments
April 30, 2020 | |
(Amounts in Thousands, Except for Shares) (Unaudited)
Security Description | | Shares | | Value | |
Affiliated Exchange-Traded Funds (6.8%) | |
VictoryShares US Multi-Factor Minimum Volatility ETF | | | 51,490 | | | $ | 1,508 | | |
Total Affiliated Exchange-Traded Funds (Cost $1,307) | | | 1,508 | | |
Affiliated Mutual Funds (93.2%) | |
Victory INCORE Total Return Bond Fund, Class R6 | | | 327,464 | | | | 3,209 | | |
Victory Integrity Discovery Fund, Class Y | | | 24,258 | | | | 604 | | |
Victory Market Neutral Income Fund, Class I | | | 542,049 | | | | 5,290 | | |
Victory RS Global Fund, Class Y (a) | | | 479,056 | | | | 6,300 | | |
Victory RS Partners Fund, Class Y | | | 34,289 | | | | 658 | | |
Victory Sophus Emerging Markets Small Cap Fund, Class Y | | | 270,871 | | | | 1,503 | | |
Victory Trivalent Emerging Markets Small-Cap Fund, Class Y | | | 161,324 | | | | 1,610 | | |
Victory Trivalent International Small-Cap Fund, Class I | | | 133,014 | | | | 1,523 | | |
Total Affiliated Mutual Funds (Cost $21,862) | | | 20,697 | | |
Total Investments (Cost $23,169) — 100.0% | | | 22,205 | | |
Other assets in excess of liabilities — 0.0% | | | 10 | | |
NET ASSETS — 100.00% | | $ | 22,215 | | |
(a) Represents investments greater than 25% of the Fund's net assets. Performance of the Fund may be adversely impacted by concentrated investments in securities. The financial statements and portfolio holdings for these securities can be found at www.sec.gov.
ETF — Exchange-Traded Fund
See notes to financial statements.
14
Victory Portfolios
Victory INCORE Fund for Income | | Schedule of Portfolio Investments
April 30, 2020 | |
(Amounts in Thousands, Except for Shares) (Unaudited)
Security Description | | Principal
Amount | | Value | |
Government National Mortgage Association (72.3%) | |
Multi-family (0.5%): | |
Collateralized Mortgage Obligations (0.3%): | |
Government National Mortgage Assoc. | |
Series 2012-33, Class AB, 7.00%, 3/16/46 | | $ | 2,407 | | | $ | 2,558 | | |
Pass-throughs (0.2%): | |
Government National Mortgage Assoc. | |
7.49%, 8/15/20 – 11/15/20 | | | 5 | | | | 5 | | |
7.50%, 8/15/21 | | | 6 | | | | 6 | | |
7.92%, 7/1/23 | | | 225 | | | | 225 | | |
8.00%, 1/15/31 – 11/15/33 | | | 1,134 | | | | 1,135 | | |
7.75%, 9/15/33 | | | 407 | | | | 407 | | |
| | | | 1,778 | | |
Single Family (71.8%): | |
Collateralized Mortgage Obligations (3.0%): | |
Government National Mortgage Assoc. | |
Series 1999-4, Class ZB, 6.00%, 2/20/29 | | | 229 | | | | 229 | | |
Series 2001-10, Class PE, 6.50%, 3/16/31 | | | 180 | | | | 180 | | |
Series 2002-22, Class GF, 6.50%, 3/20/32 | | | 31 | | | | 31 | | |
Series 2005-74, Class HB, 7.50%, 9/16/35 | | | 14 | | | | 16 | | |
Series 2005-74, Class HC, 7.50%, 9/16/35 | | | 70 | | | | 82 | | |
Series 2011-166, Class NT, 7.75%, 11/20/31 (a) | | | 1,045 | | | | 1,234 | | |
Series 2012-106, Class JM, 7.30%, 10/20/34 (a) | | | 834 | | | | 991 | | |
Series 2012-30, Class WB, 7.07%, 11/20/39 (a) | | | 3,271 | | | | 3,821 | | |
Series 2013-190, Class KT, 8.12%, 9/20/30 (a) | | | 470 | | | | 539 | | |
Series 2013-51, Class BL, 6.08%, 4/20/34 (a) | | | 2,229 | | | | 2,607 | | |
Series 2013-64, Class KY, 6.87%, 12/20/38 (a) | | | 1,348 | | | | 1,565 | | |
Series 2013-70, Class KP, 7.05%, 2/20/39 (a) | | | 1,113 | | | | 1,333 | | |
Series 2014-69, Class W, 7.21%, 11/20/34 (a) | | | 165 | | | | 194 | | |
Series 2014-74, Class PT, 7.78%, 5/16/44 (a) | | | 282 | | | | 325 | | |
Series 2015-77, Class PT, 7.74%, 6/20/39 (a) | | | 685 | | | | 789 | | |
Series 2019-22, Class PT, 7.91%, 2/20/49 (a) | | | 9,836 | | | | 11,430 | | |
| | | | 25,366 | | |
Pass-throughs (68.8%): | |
Government National Mortgage Assoc. | |
9.00%, 6/15/20 – 12/15/30 | | | 3,399 | | | | 3,828 | | |
9.50%, 6/15/20 – 9/15/27 | | | 203 | | | | 221 | | |
7.75%, 11/15/20 | | | 17 | | | | 17 | | |
10.50%, 12/15/20 | | | — | (b) | | | — | (b) | |
6.00%, 1/15/22 – 2/20/49 | | | 66,396 | | | | 76,199 | | |
7.95%, 9/15/22 | | | 11 | | | | 11 | | |
7.13%, 3/15/23 – 7/15/25 | | | 650 | | | | 673 | | |
5.50%, 7/15/23 | | | 22 | | | | 24 | | |
6.50%, 8/20/23 – 2/20/41 (c) (d) | | | 164,158 | | | | 193,610 | | |
7.00%, 12/15/23 – 1/15/39 | | | 114,133 | | | | 135,984 | | |
7.50%, 3/15/24 – 5/15/49 | | | 88,775 | | | | 104,361 | | |
8.00%, 6/20/24 – 5/15/49 | | | 51,251 | | | | 61,358 | | |
See notes to financial statements.
15
Victory Portfolios
Victory INCORE Fund for Income | | Schedule of Portfolio Investments — continued
April 30, 2020 | |
(Amounts in Thousands, Except for Shares) (Unaudited)
Security Description | | Shares or
Principal
Amount | | Value | |
10.00%, 4/15/25 – 2/15/26 | | $ | 47 | | | $ | 47 | | |
6.13%, 6/20/28 – 9/20/29 | | | 447 | | | | 473 | | |
6.28%, 10/20/28 – 10/20/29 | | | 805 | | | | 869 | | |
6.10%, 5/20/29 – 7/20/31 | | | 685 | | | | 745 | | |
7.30%, 4/20/30 – 2/20/31 | | | 302 | | | | 323 | | |
6.49%, 5/20/31 – 3/20/32 | | | 1,095 | | | | 1,209 | | |
8.50%, 6/15/31 – 7/15/32 | | | 8,698 | | | | 10,168 | | |
| | | | 590,120 | | |
Total Government National Mortgage Association (Cost $605,507) | | | 619,822 | | |
U.S. Treasury Obligations (26.5%) | |
U.S. Treasury Bills, 0.11%, 9/24/20 (e) | | | 101,461 | | | | 101,414 | | |
U.S. Treasury Bonds, 8.00%, 11/15/21 | | | 112,049 | | | | 125,525 | | |
Total U.S. Treasury Obligations (Cost $226,138) | | | 226,939 | | |
Investment Companies (1.6%) | |
BlackRock Liquidity Funds Fedfund Portfolio, 0.20% | | | 13,479,400 | | | | 13,479 | | |
Total Investment Companies (Cost $13,479) | | | 13,479 | | |
Total Investments (Cost $845,124) — 100.4% | | | 860,240 | | |
Liabilities in excess of other assets — (0.4)% | | | (3,596 | ) | |
NET ASSETS — 100.00% | | $ | 856,644 | | |
(a) The rate for certain asset-backed and mortgage-backed securities may vary based on factors relating to the pool of assets underlying the security. The rate disclosed is the rate in effect at April 30, 2020.
(b) Rounds to less than $1 thousand.
(c) Security purchased on a when-issued basis.
(d) All or a portion of this security has been segregated as collateral for securities purchased on a when-issued basis.
(e) Rate represents the effective yield at April 30, 2020.
See notes to financial statements.
16
Victory Portfolios
Victory INCORE Investment Grade Convertible Fund | | Schedule of Portfolio Investments
April 30, 2020 | |
(Amounts in Thousands, Except for Shares) (Unaudited)
Security Description | | Principal
Amount | | Value | |
Convertible Corporate Bonds (67.5%) | |
Communication Services (0.6%): | |
Snap, Inc., 0.75%, 8/1/26 (a) | | $ | 1,595 | | | $ | 1,651 | | |
Consumer Discretionary (4.4%): | |
Booking Holdings, Inc. | |
0.35%, 6/15/20 | | | 4,750 | | | | 5,361 | | |
0.90%, 9/15/21 | | | 3,522 | | | | 3,555 | | |
0.75%, 5/1/25 (a) | | | 3,720 | | | | 4,197 | | |
| | | | 13,113 | | |
Financials (15.7%): | |
Ares Capital Corp. | |
3.75%, 2/1/22 | | | 8,335 | | | | 8,099 | | |
4.63%, 3/1/24 | | | 3,845 | | | | 3,683 | | |
Barclays Bank PLC | |
0.00%, 2/4/25 (b) | | | 3,025 | | | | 3,501 | | |
0.00%, 2/18/25 | | | 1,595 | | | | 1,635 | | |
BlackRock Capital Investment Corp., 5.00%, 6/15/22 | | | 3,712 | | | | 3,080 | | |
Blackstone Mortgage Trust, Inc., 4.75%, 3/15/23 (c) | | | 4,000 | | | | 3,519 | | |
JPMorgan Chase Financial Co. LLC, 0.25%, 5/1/23 (a) | | | 9,355 | | | | 9,037 | | |
MGIC Investment Corp. Convertible Subordinated Notes, 9.00%, 4/1/63 (a) | | | 4,127 | | | | 5,323 | | |
Prospect Capital Corp., 4.95%, 7/15/22, Callable 4/15/22 @ 100 | | | 5,923 | | | | 5,607 | | |
TPG Specialty Lending, Inc., 4.50%, 8/1/22 | | | 2,985 | | | | 2,951 | | |
| | | | 46,435 | | |
Health Care (17.8%): | |
ALZA Corp. Convertible Subordinated Notes, 7/28/20,
Callable 5/21/20 @ 99.44 (d) | | | 5,029 | | | | 10,381 | | |
Anthem, Inc., 2.75%, 10/15/42 | | | 3,649 | | | | 14,469 | | |
Bristol-Myers Squibb Co., Convertible Subordinated Notes, 0.24%
(LIBOR03M-50bps), 9/15/23, Callable 6/5/20 @ 100 (e) (f) | | | 2,466 | | | | 3,797 | | |
Danaher Corp., Convertible Subordinated Notes, 1/22/21,
Callable 5/21/20 @ 98.42 (d) | | | 1,557 | | | | 9,722 | | |
Illumina, Inc., Convertible Subordinated Notes, 0.50%, 6/15/21 (b) | | | 9,352 | | | | 12,472 | | |
Teladoc Health, Inc., 3.00%, 12/15/22 | | | 500 | | | | 1,946 | | |
| | | | 52,787 | | |
Industrials (6.6%): | |
Dycom Industries, Inc., 0.75%, 9/15/21 | | | 1,555 | | | | 1,435 | | |
Fortive Corp., 0.88%, 2/15/22 | | | 10,380 | | | | 9,976 | | |
Macquarie Infrastructure, 2.00%, 10/1/23 | | | 6,441 | | | | 5,161 | | |
Southwest Airlines Co., 1.25%, 5/1/25 | | | 2,650 | | | | 2,912 | | |
| | | | 19,484 | | |
Information Technology (15.3%): | |
Akamai Technologies, Inc., 0.13%, 5/1/25 | | | 4,622 | | | | 5,473 | | |
Euronet Worldwide, Inc., 0.75%, 3/15/49, Callable 3/20/25 @ 100 (b) | | | 4,705 | | | | 4,265 | | |
Micron Technology, Inc., Convertible Subordinated Notes, 3.13%, 5/1/32 | | | 1,093 | | | | 5,162 | | |
Novellus Systems, Inc., Convertible Subordinated Notes, 2.63%, 5/15/41 | | | 1,521 | | | | 12,134 | | |
Nuance Communication, Inc. Convertible Subordinated Notes,
1.00%, 12/15/35, Callable 12/20/22 @ 100 | | | 2,345 | | | | 2,442 | | |
See notes to financial statements.
17
Victory Portfolios
Victory INCORE Investment Grade Convertible Fund | | Schedule of Portfolio Investments — continued
April 30, 2020 | |
(Amounts in Thousands, Except for Shares) (Unaudited)
Security Description | | Shares or
Principal
Amount | | Value | |
ON Semiconductor Corp. | |
1.00%, 12/1/20 | | $ | 925 | | | $ | 967 | | |
1.63%, 10/15/23 (b) | | | 660 | | | | 722 | | |
Palo Alto Networks, Inc., 0.75%, 7/1/23 | | | 1,365 | | | | 1,395 | | |
Western Digital Corp., 1.50%, 2/1/24 | | | 14,000 | | | | 12,811 | | |
| | | | 45,371 | | |
Real Estate (7.1%): | |
Spirit Realty Capital, Inc., 3.75%, 5/15/21 | | | 10,175 | | | | 9,847 | | |
VEREIT, Inc., 3.75%, 12/15/20 | | | 11,352 | | | | 11,088 | | |
| | | | 20,935 | | |
Total Convertible Corporate Bonds (Cost $191,415) | | | 199,776 | | |
Convertible Preferred Stocks (29.6%) | |
Financials (11.5%): | |
AMG Capital Trust II, 5.15%, 10/15/37 | | | 181,860 | | | | 6,537 | | |
Bank of America Corp., Series L, 7.25% (g) | | | 8,630 | | | | 11,930 | | |
New York Community Capital Trust, 6.00%, 11/1/51 (c) | | | 67,654 | | | | 2,977 | | |
Wells Fargo & Co., Series L, 7.50% (g) | | | 9,024 | | | | 12,623 | | |
| | | | 34,067 | | |
Industrials (3.2%): | |
Stanley Black & Decker, Inc., 5.25%, 11/15/22 | | | 119,525 | | | | 9,503 | | |
Utilities (14.9%): | |
American Electric Power Co., Inc., 6.13%, 3/15/22 | | | 98,985 | | | | 5,028 | | |
CenterPoint Energy, Inc. Convertible Subordinated Notes, 4.57%, 9/15/29 (f) | | | 80,000 | | | | 4,260 | | |
Dominion Energy, Inc., Series A, 7.25%, 6/1/22 | | | 100,003 | | | | 9,823 | | |
DTE Energy Co., 6.25%, 11/1/22 | | | 152,215 | | | | 6,363 | | |
NextEra Energy, Inc., 4.87%, 9/1/22 | | | 127,545 | | | | 6,115 | | |
NextEra Energy, Inc., 5.28%, 3/1/23 | | | 75,000 | | | | 3,239 | | |
Southern Co., 6.75%, 8/1/22 | | | 199,220 | | | | 9,432 | | |
| | | | 44,260 | | |
Total Convertible Preferred Stocks (Cost $94,551) | | | 87,830 | | |
Collateral for Securities Loaned^ (5.2%) | |
BlackRock Liquidity Funds TempFund, Institutional Class, 0.61% (h) | | | 290,240 | | | | 290 | | |
Fidelity Investments Money Market Prime Money Market Portfolio,
Institutional Class, 0.47% (h) | | | 144,781 | | | | 145 | | |
Fidelity Investments Money Market Government Portfolio,
Institutional Shares, 0.18% (h) | | | 6,645,927 | | | | 6,646 | | |
Goldman Sachs Financial Square Prime Obligations Fund, Institutional
Class, 0.67%(h) | | | 2,018,320 | | | | 2,018 | | |
JPMorgan Prime Money Market Fund, Capital Class, 0.68% (h) | | | 1,154,941 | | | | 1,155 | | |
Morgan Stanley Institutional Liquidity Prime Portfolio, Institutional
Class, 0.72% (h) | | | 5,192,839 | | | | 5,193 | | |
Total Collateral for Securities Loaned (Cost $15,447) | | | 15,447 | | |
Total Investments (Cost $301,413) — 102.3% | | | 303,053 | | |
Liabilities in excess of other assets — (2.3)% | | | (6,825 | ) | |
NET ASSETS — 100.00% | | $ | 296,228 | | |
See notes to financial statements.
18
Victory Portfolios
Victory INCORE Investment Grade Convertible Fund | | Schedule of Portfolio Investments — continued
April 30, 2020 | |
(Amounts in Thousands, Except for Shares) (Unaudited)
^ Purchased with cash collateral from securities on loan.
(a) Rule 144A security or other security that is restricted as to resale to institutional investors. The Fund's Adviser has deemed this security to be liquid based upon procedures approved by the Board of Trustees. As of April 30, 2020, the fair value of these securities was $20,208 (thousands) and amounted to 6.8% of net assets.
(b) All or a portion of this security is on loan.
(c) The Fund's Adviser has deemed this security to be illiquid based upon procedures approved by the Board of Trustees. As of April 30, 2020, illiquid securities were 2.2% of the Fund's net assets.
(d) Continuously callable with 15 days' notice.
(e) Variable or Floating-Rate Security. Rate disclosed is as of April 30, 2020.
(f) Continuously callable with 30 days' notice.
(g) Security is perpetual and has no final maturity date but may be subject to calls at various dates in the future.
(h) Rate disclosed is the daily yield on April 30, 2020.
bps — Basis points
LIBOR — London InterBank Offered Rate
LIBOR03M — 3 Month US Dollar LIBOR, rate disclosed as of April 30, 2020, based on the last reset date of the security
LLC — Limited Liability Company
PLC — Public Limited Company
See notes to financial statements.
19
Victory Portfolios | | Statements of Assets and Liabilities
April 30, 2020 | |
(Amounts in Thousands, Except Per Share Amounts) (Unaudited)
| | | Victory
Diversified
Stock Fund | | Victory
NewBridge
Large Cap
Growth Fund | | Victory
Special
Value Fund | |
ASSETS: | |
Investments, at value (Cost $208,218, $8,298 and
$37,595) | | $ | 242,177 | (a) | | $ | 15,284 | (b) | | $ | 42,899 | (c) | |
Cash and cash equivalents | | | 4,306 | | | | 225 | | | | 901 | | |
Receivables: | |
Interest and dividends | | | 140 | | | | 5 | | | | 24 | | |
Capital shares issued | | | 61 | | | | — | (d) | | | 233 | | |
Investments sold | | | 1,498 | | | | — | | | | 270 | | |
From Adviser | | | 8 | | | | 9 | | | | 8 | | |
Prepaid expenses | | | 36 | | | | 11 | | | | 27 | | |
Total Assets | | | 248,226 | | | | 15,534 | | | | 44,362 | | |
LIABILITIES: | |
Payables: | |
Collateral received on loaned securities | | | 7,855 | | | | 349 | | | | 503 | | |
Investments purchased | | | 841 | | | | — | | | | 152 | | |
Capital shares redeemed | | | 606 | | | | 39 | | | | 437 | | |
Accrued expenses and other payables: | |
Investment advisory fees | | | 120 | | | | 9 | | | | 25 | | |
Administration fees | | | 11 | | | | 1 | | | | 2 | | |
Custodian fees | | | 2 | | | | — | (d) | | | 1 | | |
Transfer agent fees | | | 32 | | | | 3 | | | | 7 | | |
Compliance fees | | | — | (d) | | | — | (d) | | | — | (d) | |
Trustees' fees | | | — | (d) | | | — | | | | — | | |
| 12b-1 fees | | | 26 | | | | 1 | | | | 6 | | |
Other accrued expenses | | | 18 | | | | 3 | | | | 6 | | |
Total Liabilities | | | 9,511 | | | | 405 | | | | 1,139 | | |
NET ASSETS: | |
Capital | | | 211,663 | | | | 7,272 | | | | 39,181 | | |
Total distributable earnings/(loss) | | | 27,052 | | | | 7,857 | | | | 4,042 | | |
Net Assets | | $ | 238,715 | | | $ | 15,129 | | | $ | 43,223 | | |
Net Assets | |
Class A Shares | | $ | 171,151 | | | $ | 5,618 | | | $ | 22,649 | | |
Class C Shares | | | 3,847 | | | | 1,460 | | | | 961 | | |
Class I Shares | | | 22,648 | | | | 5,688 | | | | 3,009 | | |
Class R Shares | | | 36,798 | | | | — | | | | 16,082 | | |
Class R6 Shares | | | 709 | | | | — | | | | — | | |
Class Y Shares | | | 3,562 | | | | 2,363 | | | | 522 | | |
Total | | $ | 238,715 | | | $ | 15,129 | | | $ | 43,223 | | |
Shares (unlimited number of shares authorized with
a par value of $0.001 per share): | |
Class A Shares | | | 11,390 | | | | 1,104 | | | | 999 | | |
Class C Shares | | | 277 | | | | 913 | | | | 49 | | |
Class I Shares | | | 1,511 | | | | 984 | | | | 131 | | |
Class R Shares | | | 2,505 | | | | — | | | | 746 | | |
Class R6 Shares | | | 47 | | | | — | | | | — | | |
Class Y Shares | | | 237 | | | | 432 | | | | 23 | | |
Total | | | 15,967 | | | | 3,433 | | | | 1,948 | | |
(continues on next page)
See notes to financial statements.
20
Victory Portfolios | | Statements of Assets and Liabilities
April 30, 2020 | |
(Amounts in Thousands, Except Per Share Amounts) (Unaudited) (continued)
| | | Victory
Diversified
Stock Fund | | Victory
NewBridge
Large Cap
Growth Fund | | Victory
Special
Value Fund | |
Net asset value, offering (except Class A Shares) and
redemption price per share: (e) | |
Class A Shares | | $ | 15.03 | | | $ | 5.09 | | | $ | 22.66 | | |
Class C Shares (f) | | | 13.90 | | | | 1.60 | | | | 19.71 | | |
Class I Shares | | | 14.99 | | | | 5.78 | | | | 22.95 | | |
Class R Shares | | | 14.69 | | | | — | | | | 21.56 | | |
Class R6 Shares | | | 15.00 | | | | — | | | | — | | |
Class Y Shares | | | 15.02 | | | | 5.47 | | | | 22.81 | | |
Maximum Sales Charge — Class A Shares | | | 5.75 | % | | | 5.75 | % | | | 5.75 | % | |
Maximum offering price
(100%/(100%-maximum sales charge) of net asset
value adjusted to the nearest cent) per share —
Class A Shares | | $ | 15.95 | | | $ | 5.40 | | | $ | 24.04 | | |
(a) Includes $7,537 of securities on loan.
(b) Includes $340 of securities on loan.
(c) Includes $472 of securities on loan.
(d) Rounds to less than $1 thousand.
(e) Per share amount may not recalculate due to rounding of net assets and/or shares outstanding.
(f) Redemption price per share varies by the length of time shares are held.
See notes to financial statements.
21
Victory Portfolios | | Statements of Assets and Liabilities
April 30, 2020 | |
(Amounts in Thousands, Except Per Share Amounts) (Unaudited)
| | | Victory
Strategic
Allocation
Fund | | Victory
INCORE
Fund for
Income | | Victory
INCORE
Investment
Grade
Convertible
Fund | |
ASSETS: | |
Affiliated investments, at value (Cost $23,169,
$— and $—) | | $ | 22,205 | | | $ | — | | | $ | — | | |
Unaffiliated Investments, at value (Cost $—,
$845,124 and $301,413) | | | — | | | | 860,240 | | | | 303,053 | (a) | |
Cash and cash equivalents | | | 10 | | | | — | | | | 9,308 | | |
Receivables: | |
Interest and dividends | | | 8 | | | | 7,187 | | | | 1,276 | | |
Capital shares issued | | | — | (b) | | | 3,347 | | | | 1,264 | | |
Investments sold | | | — | | | | — | | | | 1,269 | | |
From Adviser | | | 18 | | | | 1 | | | | — | | |
Prepaid expenses | | | 31 | | | | 56 | | | | 56 | | |
Total Assets | | | 22,272 | | | | 870,831 | | | | 316,226 | | |
LIABILITIES: | |
Payables: | |
Collateral received on loaned securities | | | — | | | | — | | | | 15,447 | | |
Investments purchased | | | — | | | | 12,504 | | | | 4,011 | | |
Capital shares redeemed | | | 42 | | | | 1,159 | | | | 285 | | |
Accrued expenses and other payables: | |
Investment advisory fees | | | 2 | | | | 321 | | | | 177 | | |
Administration fees | | | 1 | | | | 41 | | | | 15 | | |
Custodian fees | | | — | (b) | | | 6 | | | | 2 | | |
Transfer agent fees | | | 5 | | | | 89 | | | | 40 | | |
Compliance fees | | | — | (b) | | | 1 | | | | — | (b) | |
Trustees' fees | | | — | (b) | | | 3 | | | | 1 | | |
| 12b-1 fees | | | 2 | | | | 25 | | | | 4 | | |
Other accrued expenses | | | 5 | | | | 38 | | | | 16 | | |
Total Liabilities | | | 57 | | | | 14,187 | | | | 19,998 | | |
NET ASSETS: | |
Capital | | | 23,575 | | | | 1,156,818 | | | | 291,318 | | |
Total distributable earnings/(loss) | | | (1,360 | ) | | | (300,174 | ) | | | 4,910 | | |
Net Assets | | $ | 22,215 | | | $ | 856,644 | | | $ | 296,228 | | |
Net Assets | |
Class A Shares | | $ | 13,493 | | | $ | 123,867 | | | $ | 37,461 | | |
Class C Shares | | | 2,203 | | | | 21,065 | | | | — | | |
Class I Shares | | | 5,368 | | | | 523,712 | | | | 258,767 | | |
Class R Shares | | | 1,151 | | | | 39,695 | | | | — | | |
Class R6 Shares | | | — | | | | 44,205 | | | | — | | |
Class Y Shares | | | — | | | | 104,100 | | | | — | | |
Total | | $ | 22,215 | | | $ | 856,644 | | | $ | 296,228 | | |
(continues on next page)
See notes to financial statements.
22
Victory Portfolios | | Statements of Assets and Liabilities
April 30, 2020 | |
(Amounts in Thousands, Except Per Share Amounts) (Unaudited) (continued)
| | | Victory
Strategic
Allocation
Fund | | Victory
INCORE
Fund for
Income | | Victory
INCORE
Investment
Grade
Convertible
Fund | |
Shares (unlimited number of shares authorized with
a par value of $0.001 per share): | |
Class A Shares | | | 900 | | | | 14,403 | | | | 2,363 | | |
Class C Shares | | | 149 | | | | 2,474 | | | | — | | |
Class I Shares | | | 356 | | | | 60,926 | | | | 16,325 | | |
Class R Shares | | | 77 | | | | 4,612 | | | | — | | |
Class R6 Shares | | | — | | | | 5,148 | | | | — | | |
Class Y Shares | | | — | | | | 12,105 | | | | — | | |
Total | | | 1,482 | | | | 99,668 | | | | 18,688 | | |
Net asset value, offering (except Class A Shares)
and redemption price per share: (c) | |
Class A Shares | | $ | 15.00 | | | $ | 8.60 | | | $ | 15.85 | | |
Class C Shares (d) | | | 14.73 | | | | 8.52 | | | | — | | |
Class I Shares | | | 15.08 | | | | 8.60 | | | | 15.85 | | |
Class R Shares | | | 14.97 | | | | 8.61 | | | | — | | |
Class R6 Shares | | | — | | | | 8.59 | | | | — | | |
Class Y Shares | | | — | | | | 8.60 | | | | — | | |
Maximum Sales Charge — Class A Shares | | | 5.75 | % | | | 2.00 | % | | | 2.00 | % | |
Maximum offering price
(100%/(100%-maximum sales charge) of net asset
value adjusted to the nearest cent) per share —
Class A Shares | | $ | 15.92 | | | $ | 8.78 | | | $ | 16.17 | | |
(a) Includes $15,194 of securities on loan.
(b) Rounds to less than $1 thousand.
(c) Per share amount may not recalculate due to rounding of net assets and/or shares outstanding.
(d) Redemption price per share varies by the length of time shares are held.
See notes to financial statements.
23
Victory Portfolios | | Statements of Operations
For the Year Ended April 30, 2020 | |
(Amounts in Thousands) (Unaudited)
| | | Victory
Diversified
Stock Fund | | Victory
NewBridge
Large Cap
Growth Fund | | Victory
Special
Value Fund | |
Investment Income: | |
Dividends | | $ | 1,935 | | | $ | 28 | | | $ | 346 | | |
Interest | | | 19 | | | | 2 | | | | 4 | | |
Securities lending (net of fees) | | | 8 | | | | — | (a) | | | — | (a) | |
Total Income | | | 1,962 | | | | 30 | | | | 350 | | |
Expenses: | |
Investment advisory fees | | | 888 | | | | 57 | | | | 186 | | |
Administration fees | | | 82 | | | | 5 | | | | 15 | | |
12b-1 fees — Class A Shares | | | 242 | | | | 7 | | | | 32 | | |
12b-1 fees — Class C Shares | | | 24 | | | | 8 | | | | 5 | | |
12b-1 fees — Class R Shares | | | 108 | | | | — | | | | 48 | | |
Custodian fees | | | 7 | | | | 1 | | | | 2 | | |
Transfer agent fees — Class A Shares | | | 75 | | | | 3 | | | | 15 | | |
Transfer agent fees — Class C Shares | | | 3 | | | | 1 | | | | 1 | | |
Transfer agent fees — Class I Shares | | | 8 | | | | 3 | | | | 1 | | |
Transfer agent fees — Class R Shares | | | 19 | | | | — | | | | 16 | | |
Transfer agent fees — Class R6 Shares | | | — | (a) | | | — | | | | — | | |
Transfer agent fees — Class Y Shares | | | 3 | | | | 1 | | | | — | (a) | |
Trustees' fees | | | 12 | | | | 1 | | | | 2 | | |
Compliance fees | | | 1 | | | | — | (a) | | | — | (a) | |
Legal and audit fees | | | 10 | | | | 4 | | | | 5 | | |
State registration and filing fees | | | 41 | | | | 26 | | | | 33 | | |
Other expenses | | | 29 | | | | 9 | | | | 15 | | |
Total Expenses | | | 1,552 | | | | 126 | | | | 376 | | |
Expenses waived/reimbursed by Adviser | | | (18 | ) | | | (33 | ) | | | (40 | ) | |
Net Expenses | | | 1,534 | | | | 93 | | | | 336 | | |
Net Investment Income (Loss) | | | 428 | | | | (63 | ) | | | 14 | | |
Realized/Unrealized Gains (Losses) from Investments: | |
Net realized gains (losses) from investment securities | | | (6,184 | ) | | | 1,092 | | | | (1,050 | ) | |
Net change in unrealized appreciation/depreciation on
investment securities | | | (18,760 | ) | | | 750 | | | | (3,316 | ) | |
Net realized/unrealized gains (losses) on investments | | | (24,944 | ) | | | 1,842 | | | | (4,366 | ) | |
Change in net assets resulting from operations | | $ | (24,516 | ) | | $ | 1,779 | | | $ | (4,352 | ) | |
(a) Rounds to less than $1 thousand.
See notes to financial statements.
24
Victory Portfolios | | Statements of Operations
For the Year Ended April 30, 2020 | |
(Amounts in Thousands) (Unaudited)
| | | Victory
Strategic
Allocation
Fund | | Victory
INCORE
Fund for
Income | | Victory
INCORE
Investment
Grade
Convertible
Fund | |
Investment Income: | |
Interest from non-affiliates | | $ | — | | | $ | 8,414 | | | $ | 1,804 | | |
Dividends from affiliates | | | 294 | | | | — | | | | — | | |
Dividends from non-affiliates | | | — | | | | 15 | | | | 2,432 | | |
Securities lending (net of fees) | | | — | | | | — | | | | 45 | | |
Total Income | | | 294 | | | | 8,429 | | | | 4,281 | | |
Expenses: | |
Investment advisory fees | | | 12 | | | | 1,753 | | | | 1,082 | | |
Administration fees | | | 7 | | | | 221 | | | | 87 | | |
12b-1 fees — Class A Shares | | | 18 | | | | 156 | | | | 27 | | |
12b-1 fees — Class C Shares | | | 14 | | | | 104 | | | | — | | |
12b-1 fees — Class R Shares | | | 3 | | | | 48 | | | | — | | |
Custodian fees | | | 1 | | | | 16 | | | | 7 | | |
Transfer agent fees — Class A Shares | | | 10 | | | | 50 | | | | 22 | | |
Transfer agent fees — Class C Shares | | | 2 | | | | 12 | | | | — | | |
Transfer agent fees — Class I Shares | | | 2 | | | | 174 | | | | 119 | | |
Transfer agent fees — Class R Shares | | | 1 | | | | 12 | | | | — | | |
Transfer agent fees — Class R6 Shares | | | — | | | | 1 | | | | — | | |
Transfer agent fees — Class Y Shares | | | — | | | | 46 | | | | — | | |
Trustees' fees | | | 1 | | | | 30 | | | | 12 | | |
Compliance fees | | | — | (a) | | | 3 | | | | 1 | | |
Legal and audit fees | | | 4 | | | | 20 | | | | 11 | | |
State registration and filing fees | | | 26 | | | | 52 | | | | 22 | | |
Other expenses | | | 12 | | | | 72 | | | | 29 | | |
Total Expenses | | | 113 | | | | 2,770 | | | | 1,419 | | |
Expenses waived/reimbursed by Adviser | | | (60 | ) | | | (65 | ) | | | — | | |
Net Expenses | | | 53 | | | | 2,705 | | | | 1,419 | | |
Net Investment Income (Loss) | | | 241 | | | | 5,724 | | | | 2,862 | | |
Realized/Unrealized Gains (Losses) from Investments: | |
Net realized gains (losses) from affiliated securities transactions | | | (211 | ) | | | — | | | | — | | |
Net realized gains (losses) from unaffiliated securities transactions | | | 8 | | | | 18 | | | | 5,809 | | |
Distributions of realized gains from affiliated underlying
investment companies | | | 30 | | | | — | | | | — | | |
Net change in unrealized appreciation/depreciation on affiliated
investments | | | (1,500 | ) | | | — | | | | — | | |
Net change in unrealized appreciation/depreciation on
unaffiliated investments | | | — | | | | 16,124 | | | | (21,985 | ) | |
Net realized/unrealized gains (losses) on investments | | | (1,673 | ) | | | 16,142 | | | | (16,176 | ) | |
Change in net assets resulting from operations | | $ | (1,432 | ) | | $ | 21,866 | | | $ | (13,314 | ) | |
(a) Rounds to less than $1 thousand.
See notes to financial statements.
25
Victory Portfolios | | Statements of Changes in Net Assets | |
(Amounts in Thousands)
| | | Victory
Diversified Stock Fund | | Victory
NewBridge Large Cap
Growth Fund | | Victory
Special Value Fund | |
| | | Six
Months
Ended
April 30,
2020
(unaudited) | | Year
Ended
October 31,
2019 | | Six
Months
Ended
April 30,
2020
(unaudited) | | Year
Ended
October 31,
2019 | | Six
Months
Ended
April 30,
2020
(unaudited) | | Year
Ended
October 31,
2019 | |
From Investment Activities: | |
Operations: | |
Net investment income (loss) | | $ | 428 | | | $ | 1,645 | | | $ | (63 | ) | | $ | (160 | ) | | $ | 14 | | | $ | 167 | | |
Net realized gains (losses) from
investments | | | (6,184 | ) | | | 18,632 | | | | 1,092 | | | | 3,860 | | | | (1,050 | ) | | | 1,560 | | |
Net change in unrealized
appreciation (depreciation)
on investments | | | (18,760 | ) | | | 13,132 | | | | 750 | | | | (2,906 | ) | | | (3,316 | ) | | | 4,228 | | |
Change in net assets resulting
from operations | | | (24,516 | ) | | | 33,409 | | | | 1,779 | | | | 794 | | | | (4,352 | ) | | | 5,955 | | |
Distributions to Shareholders: | |
Class A Shares | | | (13,479 | ) | | | (28,297 | ) | | | (1,005 | ) | | | (1,659 | ) | | | (913 | ) | | | (3,327 | ) | |
Class C Shares | | | (369 | ) | | | (1,188 | ) | | | (746 | ) | | | (1,416 | ) | | | (40 | ) | | | (223 | ) | |
Class I Shares | | | (1,887 | ) | | | (4,956 | ) | | | (987 | ) | | | (2,847 | ) | | | (114 | ) | | | (366 | ) | |
Class R Shares | | | (3,064 | ) | | | (5,943 | ) | | | — | | | | (265 | ) | | | (659 | ) | | | (2,640 | ) | |
Class R6 Shares | | | (53 | ) | | | (255 | ) | | | — | | | | — | | | | — | | | | — | | |
Class Y Shares | | | (279 | ) | | | (476 | ) | | | (385 | ) | | | (957 | ) | | | (19 | ) | | | (47 | ) | |
Change in net assets resulting from
distributions to shareholders | | | (19,131 | ) | | | (41,115 | ) | | | (3,123 | ) | | | (7,144 | ) | | | (1,745 | ) | | | (6,603 | ) | |
Change in net assets resulting from
capital transactions | | | (14,654 | ) | | | (78,621 | ) | | | 432 | | | | (969 | ) | | | (4,617 | ) | | | (10,771 | ) | |
Change in net assets | | | (58,301 | ) | | | (86,327 | ) | | | (912 | ) | | | (7,319 | ) | | | (10,714 | ) | | | (11,419 | ) | |
Net Assets: | |
Beginning of period | | | 297,016 | | | | 383,343 | | | | 16,041 | | | | 23,360 | | | | 53,937 | | | | 65,356 | | |
End of period | | $ | 238,715 | | | $ | 297,016 | | | $ | 15,129 | | | $ | 16,041 | | | $ | 43,223 | | | $ | 53,937 | | |
(continues on next page)
See notes to financial statements.
26
Victory Portfolios | | Statements of Changes in Net Assets | |
(Amounts in Thousands) (continued)
| | | Victory
Diversified Stock Fund | | Victory
NewBridge Large Cap
Growth Fund | | Victory
Special Value Fund | |
| | | Six
Months
Ended
April 30,
2020
(unaudited) | | Year
Ended
October 31,
2019 | | Six
Months
Ended
April 30,
2020
(unaudited) | | Year
Ended
October 31,
2019 | | Six
Months
Ended
April 30,
2020
(unaudited) | | Year
Ended
October 31,
2019 | |
Capital Transactions: | |
Class A Shares | |
Proceeds from shares issued | | $ | 4,767 | | | $ | 10,469 | | | $ | 562 | | | $ | 1,642 | | | $ | 1,566 | | | $ | 2,878 | | |
Distributions reinvested | | | 12,261 | | | | 25,681 | | | | 817 | | | | 1,429 | | | | 818 | | | | 2,670 | | |
Cost of shares redeemed | | | (19,819 | ) | | | (90,032 | ) | | | (1,124 | ) | | | (1,465 | ) | | | (4,314 | ) | | | (9,989 | ) | |
Total Class A Shares | | $ | (2,791 | ) | | $ | (53,882 | ) | | $ | 255 | | | $ | 1,606 | | | $ | (1,930 | ) | | $ | (4,441 | ) | |
Class C Shares | |
Proceeds from shares issued | | $ | 130 | | | $ | 864 | | | $ | 190 | | | $ | 448 | | | $ | 244 | | | $ | 345 | | |
Distributions reinvested | | | 311 | | | | 962 | | | | 569 | | | | 1,198 | | | | 29 | | | | 134 | | |
Cost of shares redeemed | | | (1,749 | ) | | | (7,037 | ) | | | (512 | ) | | | (1,643 | ) | | | (414 | ) | | | (1,334 | ) | |
Total Class C Shares | | $ | (1,308 | ) | | $ | (5,211 | ) | | $ | 247 | | | $ | 3 | | | $ | (141 | ) | | $ | (855 | ) | |
Class I Shares | |
Proceeds from shares issued | | $ | 1,055 | | | $ | 3,181 | | | $ | 291 | | | $ | 557 | | | $ | 328 | | | $ | 588 | | |
Distributions reinvested | | | 1,757 | | | | 4,500 | | | | 927 | | | | 2,644 | | | | 98 | | | | 317 | | |
Cost of shares redeemed | | | (7,502 | ) | | | (21,038 | ) | | | (1,264 | ) | | | (5,198 | ) | | | (302 | ) | | | (1,283 | ) | |
Total Class I Shares | | $ | (4,690 | ) | | $ | (13,357 | ) | | $ | (46 | ) | | $ | (1,997 | ) | | $ | 124 | | | $ | (378 | ) | |
Class R Shares | |
Proceeds from shares issued | | $ | 685 | | | $ | 1,997 | | | $ | — | | | $ | 84 | | | $ | 1,446 | | | $ | 2,963 | | |
Distributions reinvested | | | 2,939 | | | | 5,689 | | | | — | | | | 265 | | | | 613 | | | | 2,334 | | |
Cost of shares redeemed | | | (7,920 | ) | | | (13,852 | ) | | | — | | | | (814 | ) | | | (4,798 | ) | | | (10,470 | ) | |
Total Class R Shares | | $ | (4,296 | ) | | $ | (6,166 | ) | | $ | — | | | $ | (465 | ) | | $ | (2,739 | ) | | $ | (5,173 | ) | |
Class R6 Shares | |
Proceeds from shares issued | | $ | 125 | | | $ | 180 | | | $ | — | | | $ | — | | | $ | — | | | $ | — | | |
Distributions reinvested | | | 53 | | | | 255 | | | | — | | | | — | | | | — | | | | — | | |
Cost of shares redeemed | | | (1,682 | ) | | | (314 | ) | | | — | | | | — | | | | — | | | | — | | |
Total Class R6 Shares | | $ | (1,504 | ) | | $ | 121 | | | $ | — | | | $ | — | | | $ | — | | | $ | — | | |
Class Y Shares | |
Proceeds from shares issued | | $ | 161 | | | $ | 867 | | | $ | 285 | | | $ | 554 | | | $ | 89 | | | $ | 144 | | |
Distributions reinvested | | | 237 | | | | 387 | | | | 184 | | | | 397 | | | | 14 | | | | 33 | | |
Cost of shares redeemed | | | (463 | ) | | | (1,380 | ) | | | (493 | ) | | | (1,067 | ) | | | (34 | ) | | | (101 | ) | |
Total Class Y Shares | | $ | (65 | ) | | $ | (126 | ) | | $ | (24 | ) | | $ | (116 | ) | | $ | 69 | | | $ | 76 | | |
Change in net assets resulting from
capital transactions | | $ | (14,654 | ) | | $ | (78,621 | ) | | $ | 432 | | | $ | (969 | ) | | $ | (4,617 | ) | | $ | (10,771 | ) | |
(continues on next page)
See notes to financial statements.
27
Victory Portfolios | | Statements of Changes in Net Assets | |
(Amounts in Thousands) (continued)
| | | Victory
Diversified Stock Fund | | Victory
NewBridge Large Cap
Growth Fund | | Victory
Special Value Fund | |
| | | Six
Months
Ended
April 30,
2020
(unaudited) | | Year
Ended
October 31,
2019 | | Six
Months
Ended
April 30,
2020
(unaudited) | | Year
Ended
October 31,
2019 | | Six
Months
Ended
April 30,
2020
(unaudited) | | Year
Ended
October 31,
2019 | |
Share Transactions: | |
Class A Shares | |
Issued | | | 299 | | | | 648 | | | | 116 | | | | 295 | | | | 66 | | | | 121 | | |
Reinvested | | | 709 | | | | 1,778 | | | | 171 | | | | 297 | | | | 31 | | | | 126 | | |
Redeemed | | | (1,230 | ) | | | (5,576 | ) | | | (220 | ) | | | (254 | ) | | | (177 | ) | | | (416 | ) | |
Total Class A Shares | | | (222 | ) | | | (3,150 | ) | | | 67 | | | | 338 | | | | (80 | ) | | | (169 | ) | |
Class C Shares | |
Issued | | | 9 | | | | 60 | | | | 126 | | | | 203 | | | | 12 | | | | 17 | | |
Reinvested | | | 19 | | | | 71 | | | | 377 | | | | 562 | | | | 1 | | | | 7 | | |
Redeemed | | | (110 | ) | | | (458 | ) | | | (318 | ) | | | (645 | ) | | | (19 | ) | | | (61 | ) | |
Total Class C Shares | | | (82 | ) | | | (327 | ) | | | 185 | | | | 120 | | | | (6 | ) | | | (37 | ) | |
Class I Shares | |
Issued | | | 65 | | | | 194 | | | | 52 | | | | 87 | | | | 14 | | | | 23 | | |
Reinvested | | | 102 | | | | 311 | | | | 170 | | | | 497 | | | | 4 | | | | 15 | | |
Redeemed | | | (451 | ) | | | (1,291 | ) | | | (224 | ) | | | (850 | ) | | | (12 | ) | | | (52 | ) | |
Total Class I Shares | | | (284 | ) | | | (786 | ) | | | (2 | ) | | | (266 | ) | | | 6 | | | | (14 | ) | |
Class R Shares | |
Issued | | | 44 | | | | 126 | | | | — | | | | 13 | | | | 69 | | | | 130 | | |
Reinvested | | | 173 | | | | 403 | | | | — | | | | 72 | | | | 25 | | | | 116 | | |
Redeemed | | | (488 | ) | | | (869 | ) | | | — | | | | (194 | ) | | | (207 | ) | | | (447 | ) | |
Total Class R Shares | | | (271 | ) | | | (340 | ) | | | — | | | | (109 | ) | | | (113 | ) | | | (201 | ) | |
Class R6 Shares | |
Issued | | | 7 | | | | 11 | | | | — | | | | — | | | | — | | | | — | | |
Reinvested | | | 3 | | | | 18 | | | | — | | | | — | | | | — | | | | — | | |
Redeemed | | | (94 | ) | | | (20 | ) | | | — | | | | — | | | | — | | | | — | | |
Total Class R6 Shares | | | (84 | ) | | | 9 | | | | — | | | | — | | | | — | | | | — | | |
Class Y Shares | |
Issued | | | 10 | | | | 54 | | | | 56 | | | | 107 | | | | 3 | | | | 6 | | |
Reinvested | | | 14 | | | | 27 | | | | 36 | | | | 78 | | | | 1 | | | | 2 | | |
Redeemed | | | (28 | ) | | | (84 | ) | | | (86 | ) | | | (173 | ) | | | (1 | ) | | | (5 | ) | |
Total Class Y Shares | | | (4 | ) | | | (3 | ) | | | 6 | | | | 12 | | | | 3 | | | | 3 | | |
Change in Shares | | | (947 | ) | | | (4,597 | ) | | | 256 | | | | 95 | | | | (190 | ) | | | (418 | ) | |
See notes to financial statements.
28
Victory Portfolios | | Statements of Changes in Net Assets | |
(Amounts in Thousands)
| | | Victory
Strategic
Allocation Fund | | Victory INCORE
Fund for Income | | Victory
INCORE Investment Grade
Convertible Fund | |
| | | Six
Months
Ended
April 30,
2020
(unaudited) | | Year
Ended
October 31,
2019 | | Six
Months
Ended
April 30,
2020
(unaudited) | | Year
Ended
October 31,
2019 | | Six
Months
Ended
April 30,
2020
(unaudited) | | Year
Ended
October 31,
2019 | |
From Investment Activities: | |
Operations: | |
Net investment income (loss) | | $ | 241 | | | $ | 715 | | | $ | 5,724 | | | $ | 12,415 | | | $ | 2,862 | | | $ | 3,557 | | |
Net realized gains (losses) from
affiliated and unaffiliated
investment transactions | | | (173 | ) | | | 393 | | | | 18 | | | | 37 | | | | 5,809 | | | | 9,776 | | |
Net change in unrealized
appreciation (depreciation)
on affiliated and unaffiliated
investments | | | (1,500 | ) | | | 1,486 | | | | 16,124 | | | | 22,751 | | | | (21,985 | ) | | | 14,314 | | |
Change in net assets resulting
from operations | | | (1,432 | ) | | | 2,594 | | | | 21,866 | | | | 35,203 | | | | (13,314 | ) | | | 27,647 | | |
Distributions to Shareholders: | |
Class A Shares | | | (514 | ) | | | (574 | ) | | | (3,045 | ) | | | (7,959 | ) | | | (847 | ) | | | (663 | ) | |
Class C Shares | | | (97 | ) | | | (114 | ) | | | (427 | ) | | | (1,264 | ) | | | — | | | | — | | |
Class I Shares | | | (202 | ) | | | (231 | ) | | | (11,533 | ) | | | (21,576 | ) | | | (12,793 | ) | | | (7,328 | ) | |
Class R Shares | | | (40 | ) | | | (44 | ) | | | (920 | ) | | | (2,160 | ) | | | — | | | | — | | |
Class R6 Shares | | | — | | | | — | | | | (730 | ) | | | (815 | ) | | | — | | | | — | | |
Class Y Shares | | | — | | | | — | | | | (1,649 | ) | | | (2,348 | ) | | | — | | | | — | | |
Change in net assets resulting from
distributions to shareholders | | | (853 | ) | | | (963 | ) | | | (18,304 | ) | | | (36,122 | ) | | | (13,640 | ) | | | (7,991 | ) | |
Change in net assets resulting from
capital transactions | | | (1,109 | ) | | | (9,554 | ) | | | 136,826 | | | | 111,166 | | | | 42,852 | | | | 119,535 | | |
Change in net assets | | | (3,394 | ) | | | (7,923 | ) | | | 140,388 | | | | 110,247 | | | | 15,898 | | | | 139,191 | | |
Net Assets: | |
Beginning of period | | | 25,609 | | | | 33,532 | | | | 716,256 | | | | 606,009 | | | | 280,330 | | | | 141,139 | | |
End of period | | $ | 22,215 | | | $ | 25,609 | | | $ | 856,644 | | | $ | 716,256 | | | $ | 296,228 | | | $ | 280,330 | | |
(continues on next page)
See notes to financial statements.
29
Victory Portfolios | | Statements of Changes in Net Assets | |
(Amounts in Thousands) (continued)
| | | Victory
Strategic
Allocation Fund | | Victory INCORE
Fund for Income | | Victory
INCORE Investment Grade
Convertible Fund | |
| | | Six
Months
Ended
April 30,
2020
(unaudited) | | Year
Ended
October 31,
2019 | | Six
Months
Ended
April 30,
2020
(unaudited) | | Year
Ended
October 31,
2019 | | Six
Months
Ended
April 30,
2020
(unaudited) | | Year
Ended
October 31,
2019 | |
Capital Transactions: | |
Class A Shares | |
Proceeds from shares issued | | $ | 982 | | | $ | 1,078 | | | $ | 25,249 | | | $ | 52,087 | | | $ | 23,650 | | | $ | 5,609 | | |
Distributions reinvested | | | 491 | | | | 546 | | | | 2,560 | | | | 6,231 | | | | 718 | | | | 531 | | |
Cost of shares redeemed | | | (1,969 | ) | | | (5,939 | ) | | | (40,972 | ) | | | (75,399 | ) | | | (2,625 | ) | | | (5,263 | ) | |
Total Class A Shares | | $ | (496 | ) | | $ | (4,315 | ) | | $ | (13,163 | ) | | $ | (17,081 | ) | | $ | 21,743 | | | $ | 877 | | |
Class C Shares | |
Proceeds from shares issued | | $ | 89 | | | $ | 281 | | | $ | 2,642 | | | $ | 3,731 | | | $ | — | | | $ | — | | |
Distributions reinvested | | | 96 | | | | 106 | | | | 356 | | | | 1,066 | | | | — | | | | — | | |
Cost of shares redeemed | | | (955 | ) | | | (1,868 | ) | | | (4,558 | ) | | | (14,281 | ) | | | — | | | | — | | |
Total Class C Shares | | $ | (770 | ) | | $ | (1,481 | ) | | $ | (1,560 | ) | | $ | (9,484 | ) | | $ | — | | | $ | — | | |
Class I Shares | |
Proceeds from shares issued | | $ | 691 | | | $ | 673 | | | $ | 192,792 | | | $ | 212,608 | | | $ | 110,699 | | | $ | 188,612 | | |
Distributions reinvested | | | 197 | | | | 223 | | | | 9,572 | | | | 15,748 | | | | 12,346 | | | | 6,976 | | |
Cost of shares redeemed | | | (684 | ) | | | (4,348 | ) | | | (128,657 | ) | | | (111,040 | ) | | | (101,936 | ) | | | (76,930 | ) | |
Total Class I Shares | | $ | 204 | | | $ | (3,452 | ) | | $ | 73,707 | | | $ | 117,316 | | | $ | 21,109 | | | $ | 118,658 | | |
Class R Shares | |
Proceeds from shares issued | | $ | 15 | | | $ | 90 | | | $ | 4,195 | | | $ | 5,048 | | | $ | — | | | $ | — | | |
Distributions reinvested | | | 40 | | | | 39 | | | | 873 | | | | 2,042 | | | | — | | | | — | | |
Cost of shares redeemed | | | (102 | ) | | | (435 | ) | | | (4,155 | ) | | | (11,905 | ) | | | — | | | | — | | |
Total Class R Shares | | $ | (47 | ) | | $ | (306 | ) | | $ | 913 | | | $ | (4,815 | ) | | $ | — | | | $ | — | | |
Class R6 Shares | |
Proceeds from shares issued | | $ | — | | | $ | — | | | $ | 33,594 | | | $ | 8,367 | | | $ | — | | | $ | — | | |
Distributions reinvested | | | — | | | | — | | | | 724 | | | | 811 | | | | — | | | | — | | |
Cost of shares redeemed | | | — | | | | — | | | | (6,274 | ) | | | (7,027 | ) | | | — | | | | — | | |
Total Class R6 Shares | | $ | — | | | $ | — | | | $ | 28,044 | | | $ | 2,151 | | | $ | — | | | $ | — | | |
Class Y Shares | |
Proceeds from shares issued | | $ | — | | | $ | — | | | $ | 70,112 | | | $ | 44,007 | | | $ | — | | | $ | — | | |
Distributions reinvested | | | — | | | | — | | | | 809 | | | | 1,155 | | | | — | | | | — | | |
Cost of shares redeemed | | | — | | | | — | | | | (22,036 | ) | | | (22,083 | ) | | | — | | | | — | | |
Total Class Y Shares | | $ | — | | | $ | — | | | $ | 48,885 | | | $ | 23,079 | | | $ | — | | | $ | — | | |
Change in net assets resulting from
capital transactions | | $ | (1,109 | ) | | $ | (9,554 | ) | | $ | 136,826 | | | $ | 111,166 | | | $ | 42,852 | | | $ | 119,535 | | |
(continues on next page)
See notes to financial statements.
30
Victory Portfolios | | Statements of Changes in Net Assets | |
(Amounts in Thousands) (continued)
| | | Victory
Strategic
Allocation Fund | | Victory INCORE
Fund for Income | | Victory
INCORE Investment Grade
Convertible Fund | |
| | | Six
Months
Ended
April 30,
2020
(unaudited) | | Year
Ended
October 31,
2019 | | Six
Months
Ended
April 30,
2020
(unaudited) | | Year
Ended
October 31,
2019 | | Six
Months
Ended
April 30,
2020
(unaudited) | | Year
Ended
October 31,
2019 | |
Share Transactions: | |
Class A Shares | |
Issued | | | 62 | | | | 69 | | | | 2,945 | | | | 6,053 | | | | 1,549 | | | | 345 | | |
Reinvested | | | 30 | | | | 37 | | | | 301 | | | | 727 | | | | 43 | | | | 34 | | |
Redeemed | | | (125 | ) | | | (387 | ) | | | (4,804 | ) | | | (8,762 | ) | | | (162 | ) | | | (326 | ) | |
Total Class A Shares | | | (33 | ) | | | (281 | ) | | | (1,558 | ) | | | (1,982 | ) | | | 1,430 | | | | 53 | | |
Class C Shares | |
Issued | | | 6 | | | | 18 | | | | 310 | | | | 438 | | | | — | | | | — | | |
Reinvested | | | 6 | | | | 7 | | | | 42 | | | | 125 | | | | — | | | | — | | |
Redeemed | | | (60 | ) | | | (121 | ) | | | (537 | ) | | | (1,674 | ) | | | — | | | | — | | |
Total Class C Shares | | | (48 | ) | | | (96 | ) | | | (185 | ) | | | (1,111 | ) | | | — | | | | — | | |
Class I Shares | |
Issued | | | 44 | | | | 43 | | | | 22,465 | | | | 24,691 | | | | 6,804 | | | | 11,502 | | |
Reinvested | | | 12 | | | | 15 | | | | 1,123 | | | | 1,837 | | | | 726 | | | | 445 | | |
Redeemed | | | (47 | ) | | | (279 | ) | | | (15,016 | ) | | | (12,911 | ) | | | (6,289 | ) | | | (4,689 | ) | |
Total Class I Shares | | | 9 | | | | (221 | ) | | | 8,572 | | | | 13,617 | | | | 1,241 | | | | 7,258 | | |
Class R Shares | |
Issued | | | 1 | | | | 6 | | | | 487 | | | | 586 | | | | — | | | | — | | |
Reinvested | | | 2 | | | | 3 | | | | 102 | | | | 238 | | | | — | | | | — | | |
Redeemed | | | (6 | ) | | | (28 | ) | | | (484 | ) | | | (1,384 | ) | | | — | | | | — | | |
Total Class R Shares | | | (3 | ) | | | (19 | ) | | | 105 | | | | (560 | ) | | | — | | | | — | | |
Class R6 Shares | |
Issued | | | — | | | | — | | | | 3,939 | | | | 974 | | | | — | | | | — | | |
Reinvested | | | — | | | | — | | | | 85 | | | | 95 | | | | — | | | | — | | |
Redeemed | | | — | | | | — | | | | (733 | ) | | | (820 | ) | | | — | | | | — | | |
Total Class R6 Shares | | | — | | | | — | | | | 3,291 | | | | 249 | | | | — | | | | — | | |
Class Y Shares | |
Issued | | | — | | | | — | | | | 8,149 | | | | 5,117 | | | | — | | | | — | | |
Reinvested | | | — | | | | — | | | | 95 | | | | 135 | | | | — | | | | — | | |
Redeemed | | | — | | | | — | | | | (2,560 | ) | | | (2,567 | ) | | | — | | | | — | | |
Total Class Y Shares | | | — | | | | — | | | | 5,684 | | | | 2,685 | | | | — | | | | — | | |
Change in Shares | | | (75 | ) | | | (617 | ) | | | 15,909 | | | | 12,898 | | | | 2,671 | | | | 7,311 | | |
See notes to financial statements.
31
Victory Portfolios | | Financial Highlights | |
For a Share Outstanding Throughout Each Period
| | | | | Investment Activities | | Distributions to
Shareholders From | |
| | | Net Asset
Value,
Beginning of
Period | | Net
Investment
Income (Loss) | | Net Realized
and Unrealized
Gains (Losses)
on Investments | | Total from
Investment
Activities | | Net
Investment
Income | | Net Realized
Gains from
Investments | |
Victory Diversified Stock Fund | |
Class A | |
Six Months Ended
4/30/20 (unaudited) | | $ | 17.65 | | | | 0.03 | (d) | | | (1.47 | ) | | | (1.44 | ) | | | (0.03 | ) | | | (1.15 | ) | |
Year Ended 10/31/19 | | $ | 17.90 | | | | 0.09 | (d) | | | 1.65 | | | | 1.74 | | | | (0.08 | ) | | | (1.91 | ) | |
Year Ended 10/31/18 | | $ | 22.03 | | | | 0.06 | (d) | | | 0.17 | | | | 0.23 | | | | (0.06 | ) | | | (4.30 | ) | |
Year Ended 10/31/17 | | $ | 18.01 | | | | 0.13 | (d) | | | 4.28 | | | | 4.41 | | | | (0.17 | ) | | | (0.22 | ) | |
Year Ended 10/31/16 | | $ | 20.80 | | | | 0.20 | (d) | | | (1.04 | ) | | | (0.84 | ) | | | (0.19 | ) | | | (1.76 | ) | |
Year Ended 10/31/15 | | $ | 23.04 | | | | 0.15 | | | | 0.97 | | | | 1.12 | | | | (0.15 | ) | | | (3.21 | ) | |
Class C | |
Six Months Ended
4/30/20 (unaudited) | | $ | 16.46 | | | | (0.05 | )(d) | | | (1.36 | ) | | | (1.41 | ) | | | — | | | | (1.15 | ) | |
Year Ended 10/31/19 | | $ | 16.90 | | | | (0.05 | )(d) | | | 1.52 | | | | 1.47 | | | | — | | | | (1.91 | ) | |
Year Ended 10/31/18 | | $ | 21.12 | | | | (0.10 | )(d) | | | 0.18 | | | | 0.08 | | | | — | | | | (4.30 | ) | |
Year Ended 10/31/17 | | $ | 17.30 | | | | (0.02 | )(d) | | | 4.10 | | | | 4.08 | | | | (0.04 | ) | | | (0.22 | ) | |
Year Ended 10/31/16 | | $ | 20.07 | | | | 0.04 | (d) | | | (1.00 | ) | | | (0.96 | ) | | | (0.05 | ) | | | (1.76 | ) | |
Year Ended 10/31/15 | | $ | 22.38 | | | | (0.03 | ) | | | 0.95 | | | | 0.92 | | | | (0.02 | ) | | | (3.21 | ) | |
Class I | |
Six Months Ended
4/30/20 (unaudited) | | $ | 17.61 | | | | 0.05 | (d) | | | (1.48 | ) | | | (1.43 | ) | | | (0.04 | ) | | | (1.15 | ) | |
Year Ended 10/31/19 | | $ | 17.87 | | | | 0.13 | (d) | | | 1.65 | | | | 1.78 | | | | (0.13 | ) | | | (1.91 | ) | |
Year Ended 10/31/18 | | $ | 22.00 | | | | 0.11 | (d) | | | 0.16 | | | | 0.27 | | | | (0.10 | ) | | | (4.30 | ) | |
Year Ended 10/31/17 | | $ | 17.98 | | | | 0.19 | (d) | | | 4.27 | | | | 4.46 | | | | (0.22 | ) | | | (0.22 | ) | |
Year Ended 10/31/16 | | $ | 20.77 | | | | 0.24 | (d) | | | (1.03 | ) | | | (0.79 | ) | | | (0.24 | ) | | | (1.76 | ) | |
Year Ended 10/31/15 | | $ | 23.01 | | | | 0.20 | | | | 0.98 | | | | 1.18 | | | | (0.21 | ) | | | (3.21 | ) | |
Class R | |
Six Months Ended
4/30/20 (unaudited) | | $ | 17.29 | | | | 0.01 | (d) | | | (1.45 | ) | | | (1.44 | ) | | | (0.01 | ) | | | (1.15 | ) | |
Year Ended 10/31/19 | | $ | 17.58 | | | | 0.04 | (d) | | | 1.62 | | | | 1.66 | | | | (0.04 | ) | | | (1.91 | ) | |
Year Ended 10/31/18 | | $ | 21.71 | | | | 0.01 | (d) | | | 0.16 | | | | 0.17 | | | | — | (f) | | | (4.30 | ) | |
Year Ended 10/31/17 | | $ | 17.75 | | | | 0.07 | (d) | | | 4.23 | | | | 4.30 | | | | (0.12 | ) | | | (0.22 | ) | |
Year Ended 10/31/16 | | $ | 20.54 | | | | 0.14 | (d) | | | (1.04 | ) | | | (0.90 | ) | | | (0.13 | ) | | | (1.76 | ) | |
Year Ended 10/31/15 | | $ | 22.79 | | | | 0.08 | | | | 0.97 | | | | 1.05 | | | | (0.09 | ) | | | (3.21 | ) | |
(a) Not annualized for periods less than one year.
(b) Annualized for periods less than one year.
(c) Portfolio turnover is calculated on the basis of the Fund as a whole without distinguishing between the classes of shares issued.
(d) Per share net investment income (loss) has been calculated using the average daily shares method.
(e) Portfolio turnover increase due to a change within the portfolio holdings during the year.
(f) Amount is less than $0.005 per share.
See notes to financial statements.
32
Victory Portfolios | | Financial Highlights — continued | |
For a Share Outstanding Throughout Each Period
| | | | | Ratios to Average Net Assets | | Supplemental Data | |
| | | Total
Distributions | | Net Asset
Value,
End of
Period | | Total
Return
(Excludes
Sales
Charge)(a) | | Net
Expenses(b) | | Net
Investment
Income
(Loss)(b) | | Gross
Expenses(b) | | Net Assets,
End of
Period
(000's) | | Portfolio
Turnover(a)(c) | |
Victory Diversified Stock Fund | |
Class A | |
Six Months Ended
4/30/20 (unaudited) | | | (1.18 | ) | | $ | 15.03 | | | | (9.04 | )% | | | 1.09 | % | | | 0.35 | % | | | 1.09 | % | | $ | 171,151 | | | | 66 | % | |
Year Ended 10/31/19 | | | (1.99 | ) | | $ | 17.65 | | | | 12.27 | % | | | 1.08 | % | | | 0.55 | % | | | 1.08 | % | | $ | 204,945 | | | | 132 | % | |
Year Ended 10/31/18 | | | (4.36 | ) | | $ | 17.90 | | | | (0.20 | )% | | | 1.05 | % | | | 0.32 | % | | | 1.05 | % | | $ | 264,297 | | | | 112 | % | |
Year Ended 10/31/17 | | | (0.39 | ) | | $ | 22.03 | | | | 24.85 | % | | | 1.05 | % | | | 0.66 | % | | | 1.05 | % | | $ | 311,255 | | | | 133 | %(e) | |
Year Ended 10/31/16 | | | (1.95 | ) | | $ | 18.01 | | | | (4.21 | )% | | | 1.07 | % | | | 1.06 | % | | | 1.07 | % | | $ | 352,748 | | | | 74 | % | |
Year Ended 10/31/15 | | | (3.36 | ) | | $ | 20.80 | | | | 4.85 | % | | | 1.09 | % | | | 0.68 | % | | | 1.09 | % | | $ | 532,180 | | | | 74 | % | |
Class C | |
Six Months Ended
4/30/20 (unaudited) | | | (1.15 | ) | | $ | 13.90 | | | | (9.53 | )% | | | 2.08 | % | | | (0.62 | )% | | | 2.13 | % | | $ | 3,847 | | | | 66 | % | |
Year Ended 10/31/19 | | | (1.91 | ) | | $ | 16.46 | | | | 11.19 | % | | | 2.02 | % | | | (0.35 | )% | | | 2.02 | % | | $ | 5,909 | | | | 132 | % | |
Year Ended 10/31/18 | | | (4.30 | ) | | $ | 16.90 | | | | (1.02 | )% | | | 1.89 | % | | | (0.53 | )% | | | 1.89 | % | | $ | 11,586 | | | | 112 | % | |
Year Ended 10/31/17 | | | (0.26 | ) | | $ | 21.12 | | | | 23.82 | % | | | 1.87 | % | | | (0.12 | )% | | | 1.87 | % | | $ | 36,001 | | | | 133 | %(e) | |
Year Ended 10/31/16 | | | (1.81 | ) | | $ | 17.30 | | | | (5.01 | )% | | | 1.90 | % | | | 0.23 | % | | | 1.90 | % | | $ | 50,213 | | | | 74 | % | |
Year Ended 10/31/15 | | | (3.23 | ) | | $ | 20.07 | | | | 4.01 | % | | | 1.91 | % | | | (0.16 | )% | | | 1.91 | % | | $ | 67,997 | | | | 74 | % | |
Class I | |
Six Months Ended
4/30/20 (unaudited) | | | (1.19 | ) | | $ | 14.99 | | | | (8.95 | )% | | | 0.84 | % | | | 0.60 | % | | | 0.86 | % | | $ | 22,648 | | | | 66 | % | |
Year Ended 10/31/19 | | | (2.04 | ) | | $ | 17.61 | | | | 12.52 | % | | | 0.84 | % | | | 0.81 | % | | | 0.84 | % | | $ | 31,619 | | | | 132 | % | |
Year Ended 10/31/18 | | | (4.40 | ) | | $ | 17.87 | | | | 0.05 | % | | | 0.79 | % | | | 0.58 | % | | | 0.79 | % | | $ | 46,122 | | | | 112 | % | |
Year Ended 10/31/17 | | | (0.44 | ) | | $ | 22.00 | | | | 25.21 | % | | | 0.80 | % | | | 0.99 | % | | | 0.80 | % | | $ | 74,466 | | | | 133 | %(e) | |
Year Ended 10/31/16 | | | (2.00 | ) | | $ | 17.98 | | | | (3.96 | )% | | | 0.80 | % | | | 1.33 | % | | | 0.80 | % | | $ | 162,923 | | | | 74 | % | |
Year Ended 10/31/15 | | | (3.42 | ) | | $ | 20.77 | | | | 5.16 | % | | | 0.81 | % | | | 0.94 | % | | | 0.81 | % | | $ | 313,482 | | | | 74 | % | |
Class R | |
Six Months Ended
4/30/20 (unaudited) | | | (1.16 | ) | | $ | 14.69 | | | | (9.18 | )% | | | 1.37 | % | | | 0.07 | % | | | 1.37 | % | | $ | 36,798 | | | | 66 | % | |
Year Ended 10/31/19 | | | (1.95 | ) | | $ | 17.29 | | | | 11.90 | % | | | 1.37 | % | | | 0.26 | % | | | 1.37 | % | | $ | 47,981 | | | | 132 | % | |
Year Ended 10/31/18 | | | (4.30 | ) | | $ | 17.58 | | | | (0.47 | )% | | | 1.34 | % | | | 0.03 | % | | | 1.34 | % | | $ | 54,776 | | | | 112 | % | |
Year Ended 10/31/17 | | | (0.34 | ) | | $ | 21.71 | | | | 24.56 | % | | | 1.33 | % | | | 0.38 | % | | | 1.33 | % | | $ | 66,310 | | | | 133 | %(e) | |
Year Ended 10/31/16 | | | (1.89 | ) | | $ | 17.75 | | | | (4.55 | )% | | | 1.36 | % | | | 0.77 | % | | | 1.36 | % | | $ | 69,751 | | | | 74 | % | |
Year Ended 10/31/15 | | | (3.30 | ) | | $ | 20.54 | | | | 4.57 | % | | | 1.38 | % | | | 0.38 | % | | | 1.38 | % | | $ | 89,949 | | | | 74 | % | |
See notes to financial statements.
33
Victory Portfolios | | Financial Highlights | |
For a Share Outstanding Throughout Each Period
| | | | | Investment Activities | | Distributions to
Shareholders From | |
| | | Net Asset
Value,
Beginning of
Period | | Net
Investment
Income (Loss) | | Net Realized
and Unrealized
Gains (Losses)
on Investments | | Total from
Investment
Activities | | Net
Investment
Income | | Net Realized
Gains from
Investments | |
Victory Diversified Stock Fund | |
Class R6 | |
Six Months Ended
4/30/20 (unaudited) | | $ | 17.62 | | | | 0.06 | (d) | | | (1.48 | ) | | | (1.42 | ) | | | (0.05 | ) | | | (1.15 | ) | |
Year Ended 10/31/19 | | $ | 17.88 | | | | 0.14 | (d) | | | 1.64 | | | | 1.78 | | | | (0.13 | ) | | | (1.91 | ) | |
Year Ended 10/31/18 | | $ | 22.00 | | | | 0.11 | (d) | | | 0.17 | | | | 0.28 | | | | (0.10 | ) | | | (4.30 | ) | |
Year Ended 10/31/17 | | $ | 17.98 | | | | 0.18 | (d) | | | 4.29 | | | | 4.47 | | | | (0.23 | ) | | | (0.22 | ) | |
Year Ended 10/31/16 | | $ | 20.77 | | | | 0.26 | (d) | | | (1.05 | ) | | | (0.79 | ) | | | (0.24 | ) | | | (1.76 | ) | |
Year Ended 10/31/15 | | $ | 23.01 | | | | 0.19 | | | | 0.99 | | | | 1.18 | | | | (0.21 | ) | | | (3.21 | ) | |
Class Y | |
Six Months Ended
4/30/20 (unaudited) | | $ | 17.65 | | | | 0.05 | (d) | | | (1.49 | ) | | | (1.44 | ) | | | (0.04 | ) | | | (1.15 | ) | |
Year Ended 10/31/19 | | $ | 17.90 | | | | 0.12 | (d) | | | 1.66 | | | | 1.78 | | | | (0.12 | ) | | | (1.91 | ) | |
Year Ended 10/31/18 | | $ | 22.02 | | | | 0.11 | (d) | | | 0.16 | | | | 0.27 | | | | (0.09 | ) | | | (4.30 | ) | |
Year Ended 10/31/17 | | $ | 18.00 | | | | 0.17 | (d) | | | 4.28 | | | | 4.45 | | | | (0.21 | ) | | | (0.22 | ) | |
Year Ended 10/31/16 | | $ | 20.79 | | | | 0.23 | (d) | | | (1.03 | ) | | | (0.80 | ) | | | (0.23 | ) | | | (1.76 | ) | |
Year Ended 10/31/15 | | $ | 23.04 | | | | 0.19 | | | | 0.97 | | | | 1.16 | | | | (0.20 | ) | | | (3.21 | ) | |
(a) Not annualized for periods less than one year.
(b) Annualized for periods less than one year.
(c) Portfolio turnover is calculated on the basis of the Fund as a whole without distinguishing between the classes of shares issued.
(d) Per share net investment income (loss) has been calculated using the average daily shares method.
(e) Portfolio turnover increase due to a change within the portfolio holdings during the year.
See notes to financial statements.
34
Victory Portfolios | | Financial Highlights — continued | |
For a Share Outstanding Throughout Each Period
| | | | | Ratios to Average Net Assets | | Supplemental Data | |
| | | Total
Distributions | | Net Asset
Value,
End of
Period | | Total
Return
(Excludes
Sales
Charge)(a) | | Net
Expenses(b) | | Net
Investment
Income
(Loss)(b) | | Gross
Expenses(b) | | Net Assets,
End of
Period
(000's) | | Portfolio
Turnover(a)(c) | |
Victory Diversified Stock Fund | |
Class R6 | |
Six Months Ended
4/30/20 (unaudited) | | | (1.20 | ) | | $ | 15.00 | | | | (8.92 | )% | | | 0.78 | % | | | 0.69 | % | | | 2.04 | % | | $ | 709 | | | | 66 | % | |
Year Ended 10/31/19 | | | (2.04 | ) | | $ | 17.62 | | | | 12.58 | % | | | 0.78 | % | | | 0.83 | % | | | 1.24 | % | | $ | 2,313 | | | | 132 | % | |
Year Ended 10/31/18 | | | (4.40 | ) | | $ | 17.88 | | | | 0.10 | % | | | 0.78 | % | | | 0.58 | % | | | 1.21 | % | | $ | 2,189 | | | | 112 | % | |
Year Ended 10/31/17 | | | (0.45 | ) | | $ | 22.00 | | | | 25.24 | % | | | 0.78 | % | | | 0.94 | % | | | 1.29 | % | | $ | 2,427 | | | | 133 | %(e) | |
Year Ended 10/31/16 | | | (2.00 | ) | | $ | 17.98 | | | | (3.93 | )% | | | 0.78 | % | | | 1.40 | % | | | 0.92 | % | | $ | 2,332 | | | | 74 | % | |
Year Ended 10/31/15 | | | (3.42 | ) | | $ | 20.77 | | | | 5.19 | % | | | 0.78 | % | | | 0.78 | % | | | 2.01 | % | | $ | 5,447 | | | | 74 | % | |
Class Y | |
Six Months Ended
4/30/20 (unaudited) | | | (1.19 | ) | | $ | 15.02 | | | | (8.99 | )% | | | 0.86 | % | | | 0.58 | % | | | 1.31 | % | | $ | 3,562 | | | | 66 | % | |
Year Ended 10/31/19 | | | (2.03 | ) | | $ | 17.65 | | | | 12.53 | % | | | 0.86 | % | | | 0.76 | % | | | 1.33 | % | | $ | 4,249 | | | | 132 | % | |
Year Ended 10/31/18 | | | (4.39 | ) | | $ | 17.90 | | | | 0.01 | % | | | 0.86 | % | | | 0.54 | % | | | 1.13 | % | | $ | 4,373 | | | | 112 | % | |
Year Ended 10/31/17 | | | (0.43 | ) | | $ | 22.02 | | | | 25.11 | % | | | 0.86 | % | | | 0.88 | % | | | 0.94 | % | | $ | 8,843 | | | | 133 | %(e) | |
Year Ended 10/31/16 | | | (1.99 | ) | | $ | 18.00 | | | | (4.01 | )% | | | 0.86 | % | | | 1.27 | % | | | 0.96 | % | | $ | 11,907 | | | | 74 | % | |
Year Ended 10/31/15 | | | (3.41 | ) | | $ | 20.79 | | | | 5.06 | % | | | 0.86 | % | | | 0.90 | % | | | 0.98 | % | | $ | 18,526 | | | | 74 | % | |
See notes to financial statements.
35
Victory Portfolios | | Financial Highlights | |
For a Share Outstanding Throughout Each Period
| | | | | Investment Activities | | Distributions to
Shareholders From | |
| | | Net Asset
Value,
Beginning of
Period | | Net
Investment
Income (Loss) | | Net Realized
and Unrealized
Gains (Losses)
on Investments | | Total from
Investment
Activities | | Net Realized
Gains from
Investments | | Total
Distributions | |
Victory NewBridge Large Cap Growth Fund | |
Class A | |
Six Months Ended
4/30/20 (unaudited) | | $ | 5.52 | | | | (0.02 | )(d) | | | 0.65 | | | | 0.63 | | | | (1.06 | ) | | | (1.06 | ) | |
Year Ended 10/31/19 | | $ | 7.94 | | | | (0.05 | )(d) | | | 0.05 | (e) | | | — | (f) | | | (2.42 | ) | | | (2.42 | ) | |
Year Ended 10/31/18 | | $ | 10.23 | | | | (0.09 | )(d) | | | 0.85 | | | | 0.76 | | | | (3.05 | ) | | | (3.05 | ) | |
Year Ended 10/31/17 | | $ | 12.79 | | | | (0.09 | )(d) | | | 1.82 | | | | 1.73 | | | | (4.29 | ) | | | (4.29 | ) | |
Year Ended 10/31/16 | | $ | 19.17 | | | | (0.11 | )(d) | | | (0.22 | ) | | | (0.33 | ) | | | (6.05 | ) | | | (6.05 | ) | |
Year Ended 10/31/15 | | $ | 19.38 | | | | (0.20 | ) | | | 1.63 | | | | 1.43 | | | | (1.64 | ) | | | (1.64 | ) | |
Class C | |
Six Months Ended
4/30/20 (unaudited) | | $ | 2.43 | | | | (0.01 | )(d) | | | 0.24 | | | | 0.23 | | | | (1.06 | ) | | | (1.06 | ) | |
Year Ended 10/31/19 | | $ | 5.00 | | | | (0.06 | )(d) | | | (0.09 | )(e) | | | (0.15 | ) | | | (2.42 | ) | | | (2.42 | ) | |
Year Ended 10/31/18 | | $ | 7.59 | | | | (0.10 | )(d) | | | 0.56 | | | | 0.46 | | | | (3.05 | ) | | | (3.05 | ) | |
Year Ended 10/31/17 | | $ | 10.65 | | | | (0.12 | )(d) | | | 1.35 | | | | 1.23 | | | | (4.29 | ) | | | (4.29 | ) | |
Year Ended 10/31/16 | | $ | 17.06 | | | | (0.18 | )(d) | | | (0.18 | ) | | | (0.36 | ) | | | (6.05 | ) | | | (6.05 | ) | |
Year Ended 10/31/15 | | $ | 17.56 | | | | (0.29 | ) | | | 1.43 | | | | 1.14 | | | | (1.64 | ) | | | (1.64 | ) | |
Class I | |
Six Months Ended
4/30/20 (unaudited) | | $ | 6.13 | | | | (0.02 | )(d) | | | 0.73 | | | | 0.71 | | | | (1.06 | ) | | | (1.06 | ) | |
Year Ended 10/31/19 | | $ | 8.49 | | | | (0.04 | )(d) | | | 0.10 | (e) | | | 0.06 | | | | (2.42 | ) | | | (2.42 | ) | |
Year Ended 10/31/18 | | $ | 10.71 | | | | (0.06 | )(d) | | | 0.89 | | | | 0.83 | | | | (3.05 | ) | | | (3.05 | ) | |
Year Ended 10/31/17 | | $ | 13.13 | | | | (0.05 | )(d) | | | 1.92 | | | | 1.87 | | | | (4.29 | ) | | | (4.29 | ) | |
Year Ended 10/31/16 | | $ | 19.47 | | | | (0.05 | )(d) | | | (0.24 | ) | | | (0.29 | ) | | | (6.05 | ) | | | (6.05 | ) | |
Year Ended 10/31/15 | | $ | 19.61 | | | | (0.26 | ) | | | 1.76 | | | | 1.50 | | | | (1.64 | ) | | | (1.64 | ) | |
Class Y | |
Six Months Ended
4/30/20 (unaudited) | | $ | 5.86 | | | | (0.02 | )(d) | | | 0.69 | | | | 0.67 | | | | (1.06 | ) | | | (1.06 | ) | |
Year Ended 10/31/19 | | $ | 8.24 | | | | (0.04 | )(d) | | | 0.08 | (e) | | | 0.04 | | | | (2.42 | ) | | | (2.42 | ) | |
Year Ended 10/31/18 | | $ | 10.48 | | | | (0.06 | )(d) | | | 0.87 | | | | 0.81 | | | | (3.05 | ) | | | (3.05 | ) | |
Year Ended 10/31/17 | | $ | 12.96 | | | | (0.06 | )(d) | | | 1.87 | | | | 1.81 | | | | (4.29 | ) | | | (4.29 | ) | |
Year Ended 10/31/16 | | $ | 19.31 | | | | (0.07 | )(d) | | | (0.23 | ) | | | (0.30 | ) | | | (6.05 | ) | | | (6.05 | ) | |
Year Ended 10/31/15 | | $ | 19.47 | | | | (0.28 | ) | | | 1.76 | | | | 1.48 | | | | (1.64 | ) | | | (1.64 | ) | |
(a) Not annualized for periods less than one year.
(b) Annualized for periods less than one year.
(c) Portfolio turnover is calculated on the basis of the Fund as a whole without distinguishing between the classes of shares issued.
(d) Per share net investment income (loss) has been calculated using the average daily shares method.
(e) The amount shown for a share outstanding throughout the period does not accord with the change in aggregate gains and losses in the portfolio of securities during the period because of timing of sales and purchases of fund shares in relation to fluctuating market values during the period.
(f) Amount is less than $0.005 per share.
See notes to financial statements.
36
Victory Portfolios | | Financial Highlights — continued | |
For a Share Outstanding Throughout Each Period
| | | | Ratios to Average Net Assets | | Supplemental Data | |
| | | Net Asset
Value,
End of
Period | | Total
Return
(Excludes
Sales
Charge)(a) | | Net
Expenses(b) | | Net
Investment
Income
(Loss)(b) | | Gross
Expenses(b) | | Net Assets,
End of
Period
(000's) | | Portfolio
Turnover(a)(c) | |
Victory NewBridge Large Cap Growth Fund | |
Class A | |
Six Months Ended
4/30/20 (unaudited) | | $ | 5.09 | | | | 12.61 | % | | | 1.36 | % | | | (0.96 | )% | | | 1.60 | % | | $ | 5,618 | | | | 28 | % | |
Year Ended 10/31/19 | | $ | 5.52 | | | | 4.56 | % | | | 1.36 | % | | | (0.97 | )% | | | 1.60 | % | | $ | 5,732 | | | | 62 | % | |
Year Ended 10/31/18 | | $ | 7.94 | | | | 9.41 | % | | | 1.36 | % | | | (1.05 | )% | | | 1.47 | % | | $ | 5,546 | | | | 41 | % | |
Year Ended 10/31/17 | | $ | 10.23 | | | | 20.84 | % | | | 1.40 | % | | | (0.94 | )% | | | 1.40 | % | | $ | 7,639 | | | | 60 | % | |
Year Ended 10/31/16 | | $ | 12.79 | | | | (3.00 | )% | | | 1.30 | % | | | (0.79 | )% | | | 1.30 | % | | $ | 11,700 | | | | 52 | % | |
Year Ended 10/31/15 | | $ | 19.17 | | | | 7.86 | % | | | 1.26 | % | | | (0.73 | )% | | | 1.26 | % | | $ | 20,207 | | | | 55 | % | |
Class C | |
Six Months Ended
4/30/20 (unaudited) | | $ | 1.60 | | | | 12.06 | % | | | 2.10 | % | | | (1.70 | )% | | | 2.80 | % | | $ | 1,460 | | | | 28 | % | |
Year Ended 10/31/19 | | $ | 2.43 | | | | 3.92 | % | | | 2.10 | % | | | (1.71 | )% | | | 2.70 | % | | $ | 1,768 | | | | 62 | % | |
Year Ended 10/31/18 | | $ | 5.00 | | | | 8.47 | % | | | 2.10 | % | | | (1.78 | )% | | | 2.40 | % | | $ | 3,042 | | | | 41 | % | |
Year Ended 10/31/17 | | $ | 7.59 | | | | 20.06 | % | | | 2.10 | % | | | (1.64 | )% | | | 2.27 | % | | $ | 4,201 | | | | 60 | % | |
Year Ended 10/31/16 | | $ | 10.65 | | | | (3.79 | )% | | | 2.10 | % | | | (1.59 | )% | | | 2.15 | % | | $ | 6,321 | | | | 52 | % | |
Year Ended 10/31/15 | | $ | 17.06 | | | | 6.94 | % | | | 2.10 | % | | | (1.58 | )% | | | 2.13 | % | | $ | 9,389 | | | | 55 | % | |
Class I | |
Six Months Ended
4/30/20 (unaudited) | | $ | 5.78 | | | | 12.66 | % | | | 0.95 | % | | | (0.55 | )% | | | 1.35 | % | | $ | 5,688 | | | | 28 | % | |
Year Ended 10/31/19 | | $ | 6.13 | | | | 5.11 | % | | | 0.95 | % | | | (0.56 | )% | | | 1.26 | % | | $ | 6,043 | | | | 62 | % | |
Year Ended 10/31/18 | | $ | 8.49 | | | | 9.74 | % | | | 0.95 | % | | | (0.63 | )% | | | 1.09 | % | | $ | 10,633 | | | | 41 | % | |
Year Ended 10/31/17 | | $ | 10.71 | | | | 21.52 | % | | | 0.95 | % | | | (0.47 | )% | | | 1.01 | % | | $ | 16,103 | | | | 60 | % | |
Year Ended 10/31/16 | �� | $ | 13.13 | | | | (2.67 | )% | | | 0.88 | % | | | (0.36 | )% | | | 0.88 | % | | $ | 31,299 | | | | 52 | % | |
Year Ended 10/31/15 | | $ | 19.47 | | | | 8.14 | % | | | 0.95 | % | | | (0.41 | )% | | | 1.04 | % | | $ | 63,569 | | | | 55 | % | |
Class Y | |
Six Months Ended
4/30/20 (unaudited) | | $ | 5.47 | | | | 12.56 | % | | | 1.02 | % | | | (0.62 | )% | | | 1.86 | % | | $ | 2,363 | | | | 28 | % | |
Year Ended 10/31/19 | | $ | 5.86 | | | | 5.06 | % | | | 1.02 | % | | | (0.63 | )% | | | 1.69 | % | | $ | 2,498 | | | | 62 | % | |
Year Ended 10/31/18 | | $ | 8.24 | | | | 9.75 | % | | | 1.02 | % | | | (0.72 | )% | | | 1.48 | % | | $ | 3,411 | | | | 41 | % | |
Year Ended 10/31/17 | | $ | 10.48 | | | | 21.30 | % | | | 1.02 | % | | | (0.55 | )% | | | 1.42 | % | | $ | 2,128 | | | | 60 | % | |
Year Ended 10/31/16 | | $ | 12.96 | | | | (2.76 | )% | | | 1.02 | % | | | (0.50 | )% | | | 1.08 | % | | $ | 4,344 | | | | 52 | % | |
Year Ended 10/31/15 | | $ | 19.31 | | | | 8.09 | % | | | 1.02 | % | | | (0.46 | )% | | | 1.04 | % | | $ | 12,141 | | | | 55 | % | |
See notes to financial statements.
37
Victory Portfolios | | Financial Highlights | |
For a Share Outstanding Throughout Each Period
| | | | | Investment Activities | | Distributions to
Shareholders From | |
| | | Net Asset
Value,
Beginning of
Period | | Net
Investment
Income (Loss) | | Net Realized
and Unrealized
Gains (Losses)
on Investments | | Total from
Investment
Activities | | Net
Investment
Income | | Net Realized
Gains from
Investments | |
Victory Special Value Fund | |
Class A | |
Six Months Ended
4/30/20 (unaudited) | | $ | 25.78 | | | | 0.02 | (d) | | | (2.26 | ) | | | (2.24 | ) | | | (0.09 | ) | | | (0.79 | ) | |
Year Ended 10/31/19 | | $ | 26.10 | | | | 0.10 | (d) | | | 2.26 | | | | 2.36 | | | | (0.03 | ) | | | (2.65 | ) | |
Year Ended 10/31/18 | | $ | 26.31 | | | | 0.05 | (d) | | | (0.15 | ) | �� | | (0.10 | ) | | | (0.11 | ) | | | — | | |
Year Ended 10/31/17 | | $ | 21.48 | | | | 0.13 | (d) | | | 4.95 | | | | 5.08 | | | | (0.25 | ) | | | — | | |
Year Ended 10/31/16 | | $ | 22.46 | | | | 0.20 | (d) | | | (1.11 | ) | | | (0.91 | ) | | | (0.07 | ) | | | — | | |
Year Ended 10/31/15 | | $ | 21.71 | | | | 0.12 | | | | 0.63 | | | | 0.75 | | | | — | | | | — | | |
Class C | |
Six Months Ended
4/30/20 (unaudited) | | $ | 22.54 | | | | (0.07 | )(d) | | | (1.97 | ) | | | (2.04 | ) | | | — | | | | (0.79 | ) | |
Year Ended 10/31/19 | | $ | 23.34 | | | | (0.09 | )(d) | | | 1.94 | | | | 1.85 | | | | — | | | | (2.65 | ) | |
Year Ended 10/31/18 | | $ | 23.66 | | | | (0.18 | )(d) | | | (0.14 | ) | | | (0.32 | ) | | | — | | | | — | | |
Year Ended 10/31/17 | | $ | 19.34 | | | | (0.08 | )(d) | | | 4.45 | | | | 4.37 | | | | (0.05 | ) | | | — | | |
Year Ended 10/31/16 | | $ | 20.34 | | | | 0.01 | (d) | | | (1.01 | ) | | | (1.00 | ) | | | — | | | | — | | |
Year Ended 10/31/15 | | $ | 19.82 | | | | (0.10 | ) | | | 0.62 | | | | 0.52 | | | | — | | | | — | | |
Class I | |
Six Months Ended
4/30/20 (unaudited) | | $ | 26.13 | | | | 0.05 | (d) | | | (2.30 | ) | | | (2.25 | ) | | | (0.14 | ) | | | (0.79 | ) | |
Year Ended 10/31/19 | | $ | 26.39 | | | | 0.14 | (d) | | | 2.30 | | | | 2.44 | | | | (0.05 | ) | | | (2.65 | ) | |
Year Ended 10/31/18 | | $ | 26.62 | | | | 0.09 | (d) | | | (0.15 | ) | | | (0.06 | ) | | | (0.17 | ) | | | — | | |
Year Ended 10/31/17 | | $ | 21.76 | | | | 0.13 | (d) | | | 5.01 | | | | 5.14 | | | | (0.28 | ) | | | — | | |
Year Ended 10/31/16 | | $ | 22.78 | | | | 0.23 | (d) | | | (1.12 | ) | | | (0.89 | ) | | | (0.13 | ) | | | — | | |
Year Ended 10/31/15 | | $ | 21.96 | | | | 0.19 | | | | 0.63 | | | | 0.82 | | | | — | | | | — | | |
Class R | |
Six Months Ended
4/30/20 (unaudited) | | $ | 24.55 | | | | (0.02 | )(d) | | | (2.16 | ) | | | (2.18 | ) | | | (0.02 | ) | | | (0.79 | ) | |
Year Ended 10/31/19 | | $ | 25.02 | | | | 0.03 | (d) | | | 2.15 | | | | 2.18 | | | | — | | | | (2.65 | ) | |
Year Ended 10/31/18 | | $ | 25.24 | | | | (0.03 | )(d) | | | (0.15 | ) | | | (0.18 | ) | | | (0.04 | ) | | | — | | |
Year Ended 10/31/17 | | $ | 20.63 | | | | 0.05 | (d) | | | 4.75 | | | | 4.80 | | | | (0.19 | ) | | | — | | |
Year Ended 10/31/16 | | $ | 21.57 | | | | 0.14 | (d) | | | (1.07 | ) | | | (0.93 | ) | | | (0.01 | ) | | | — | | |
Year Ended 10/31/15 | | $ | 20.91 | | | | 0.04 | | | | 0.62 | | | | 0.66 | | | | — | | | | — | | |
(a) Not annualized for periods less than one year.
(b) Annualized for periods less than one year.
(c) Portfolio turnover is calculated on the basis of the Fund as a whole without distinguishing between the classes of shares issued.
(d) Per share net investment income (loss) has been calculated using the average daily shares method.
See notes to financial statements.
38
Victory Portfolios | | Financial Highlights — continued | |
For a Share Outstanding Throughout Each Period
| | | | | Ratios to Average Net Assets | | Supplemental Data | |
| | | Total
Distributions | | Net Asset
Value,
End of
Period | | Total
Return
(Excludes
Sales
Charge)(a) | | Net
Expenses(b) | | Net
Investment
Income
(Loss)(b) | | Gross
Expenses(b) | | Net Assets,
End of
Period
(000's) | | Portfolio
Turnover(a)(c) | |
Victory Special Value Fund | |
Class A | |
Six Months Ended
4/30/20 (unaudited) | | | (0.88 | ) | | $ | 22.66 | | | | (9.16 | )% | | | 1.23 | % | | | 0.19 | % | | | 1.33 | % | | $ | 22,649 | | | | 68 | % | |
Year Ended 10/31/19 | | | (2.68 | ) | | $ | 25.78 | | | | 11.32 | % | | | 1.21 | % | | | 0.41 | % | | | 1.31 | % | | $ | 27,818 | | | | 126 | % | |
Year Ended 10/31/18 | | | (0.11 | ) | | $ | 26.10 | | | | (0.42 | )% | | | 1.17 | % | | | 0.19 | % | | | 1.27 | % | | $ | 32,565 | | | | 113 | % | |
Year Ended 10/31/17 | | | (0.25 | ) | | $ | 26.31 | | | | 23.84 | % | | | 1.17 | % | | | 0.53 | % | | | 1.27 | % | | $ | 35,223 | | | | 135 | % | |
Year Ended 10/31/16 | | | (0.07 | ) | | $ | 21.48 | | | | (4.06 | )% | | | 1.20 | % | | | 0.93 | % | | | 1.30 | % | | $ | 36,971 | | | | 76 | % | |
Year Ended 10/31/15 | | | — | | | $ | 22.46 | | | | 3.45 | % | | | 1.28 | % | | | 0.52 | % | | | 1.35 | % | | $ | 48,913 | | | | 137 | % | |
Class C | |
Six Months Ended
4/30/20 (unaudited) | | | (0.79 | ) | | $ | 19.71 | | | | (9.55 | )% | | | 2.10 | % | | | (0.68 | )% | | | 3.06 | % | | $ | 961 | | | | 68 | % | |
Year Ended 10/31/19 | | | (2.65 | ) | | $ | 22.54 | | | | 10.34 | % | | | 2.10 | % | | | (0.44 | )% | | | 2.79 | % | | $ | 1,241 | | | | 126 | % | |
Year Ended 10/31/18 | | | — | | | $ | 23.34 | | | | (1.35 | )% | | | 2.10 | % | | | (0.75 | )% | | | 2.27 | % | | $ | 2,145 | | | | 113 | % | |
Year Ended 10/31/17 | | | (0.05 | ) | | $ | 23.66 | | | | 22.65 | % | | | 2.10 | % | | | (0.38 | )% | | | 2.21 | % | | $ | 7,296 | | | | 135 | % | |
Year Ended 10/31/16 | | | — | | | $ | 19.34 | | | | (4.92 | )% | | | 2.09 | % | | | 0.04 | % | | | 2.19 | % | | $ | 7,955 | | | | 76 | % | |
Year Ended 10/31/15 | | | — | | | $ | 20.34 | | | | 2.62 | % | | | 2.13 | % | | | (0.35 | )% | | | 2.21 | % | | $ | 11,253 | | | | 137 | % | |
Class I | |
Six Months Ended
4/30/20 (unaudited) | | | (0.93 | ) | | $ | 22.95 | | | | (9.11 | )% | | | 1.05 | % | | | 0.36 | % | | | 1.34 | % | | $ | 3,009 | | | | 68 | % | |
Year Ended 10/31/19 | | | (2.70 | ) | | $ | 26.13 | | | | 11.52 | % | | | 1.05 | % | | | 0.58 | % | | | 1.34 | % | | $ | 3,274 | | | | 126 | % | |
Year Ended 10/31/18 | | | (0.17 | ) | | $ | 26.39 | | | | (0.28 | )% | | | 1.02 | % | | | 0.31 | % | | | 1.16 | % | | $ | 3,678 | | | | 113 | % | |
Year Ended 10/31/17 | | | (0.28 | ) | | $ | 26.62 | | | | 23.86 | % | | | 1.15 | % | | | 0.56 | % | | | 1.25 | % | | $ | 3,703 | | | | 135 | % | |
Year Ended 10/31/16 | | | (0.13 | ) | | $ | 21.76 | | | | (3.93 | )% | | | 1.05 | % | | | 1.07 | % | | | 1.15 | % | | $ | 4,016 | | | | 76 | % | |
Year Ended 10/31/15 | | | — | | | $ | 22.78 | | | | 3.73 | % | | | 1.02 | % | | | 0.78 | % | | | 1.09 | % | | $ | 6,285 | | | | 137 | % | |
Class R | |
Six Months Ended
4/30/20 (unaudited) | | | (0.81 | ) | | $ | 21.56 | | | | (9.35 | )% | | | 1.55 | % | | | (0.14 | )% | | | 1.65 | % | | $ | 16,082 | | | | 68 | % | |
Year Ended 10/31/19 | | | (2.65 | ) | | $ | 24.55 | | | | 11.03 | % | | | 1.50 | % | | | 0.13 | % | | | 1.60 | % | | $ | 21,084 | | | | 126 | % | |
Year Ended 10/31/18 | | | (0.04 | ) | | $ | 25.02 | | | | (0.71 | )% | | | 1.46 | % | | | (0.10 | )% | | | 1.56 | % | | $ | 26,532 | | | | 113 | % | |
Year Ended 10/31/17 | | | (0.19 | ) | | $ | 25.24 | | | | 23.43 | % | | | 1.47 | % | | | 0.24 | % | | | 1.57 | % | | $ | 36,688 | | | | 135 | % | |
Year Ended 10/31/16 | | | (0.01 | ) | | $ | 20.63 | | | | (4.29 | )% | | | 1.46 | % | | | 0.67 | % | | | 1.56 | % | | $ | 34,784 | | | | 76 | % | |
Year Ended 10/31/15 | | | — | | | $ | 21.57 | | | | 3.16 | % | | | 1.55 | % | | | 0.23 | % | | | 1.63 | % | | $ | 46,357 | | | | 137 | % | |
See notes to financial statements.
39
Victory Portfolios | | Financial Highlights | |
For a Share Outstanding Throughout Each Period
| | | | | Investment Activities | | Distributions to
Shareholders From | |
| | | Net Asset
Value,
Beginning of
Period | | Net
Investment
Income (Loss) | | Net Realized
and Unrealized
Gains (Losses)
on Investments | | Total from
Investment
Activities | | Net
Investment
Income | | Net Realized
Gains from
Investments | |
Victory Special Value Fund | |
Class Y | |
Six Months Ended
4/30/20 (unaudited) | | $ | 25.98 | | | | 0.05 | (d) | | | (2.27 | ) | | | (2.22 | ) | | | (0.16 | ) | | | (0.79 | ) | |
Year Ended 10/31/19 | | $ | 26.25 | | | | 0.15 | (d) | | | 2.28 | | | | 2.43 | | | | (0.05 | ) | | | (2.65 | ) | |
Year Ended 10/31/18 | | $ | 26.47 | | | | 0.12 | (d) | | | (0.17 | ) | | | (0.05 | ) | | | (0.17 | ) | | | — | | |
Year Ended 10/31/17 | | $ | 21.62 | | | | 0.18 | (d) | | | 4.98 | | | | 5.16 | | | | (0.31 | ) | | | — | | |
Year Ended 10/31/16 | | $ | 22.62 | | | | 0.26 | (d) | | | (1.12 | ) | | | (0.86 | ) | | | (0.14 | ) | | | — | | |
Year Ended 10/31/15 | | $ | 21.80 | | | | 0.18 | | | | 0.64 | | | | 0.82 | | | | — | | | | — | | |
(a) Not annualized for periods less than one year.
(b) Annualized for periods less than one year.
(c) Portfolio turnover is calculated on the basis of the Fund as a whole without distinguishing between the classes of shares issued.
(d) Per share net investment income (loss) has been calculated using the average daily shares method.
See notes to financial statements.
40
Victory Portfolios | | Financial Highlights — continued | |
For a Share Outstanding Throughout Each Period
| | | | | Ratios to Average Net Assets | | Supplemental Data | |
| | | Total
Distributions | | Net Asset
Value,
End of
Period | | Total
Return
(Excludes
Sales
Charge)(a) | | Net
Expenses(b) | | Net
Investment
Income
(Loss)(b) | | Gross
Expenses(b) | | Net Assets,
End of
Period
(000's) | | Portfolio
Turnover(a)(c) | |
Victory Special Value Fund | |
Class Y | |
Six Months Ended
4/30/20 (unaudited) | | | (0.95 | ) | | $ | 22.81 | | | | (9.07 | )% | | | 1.00 | % | | | 0.40 | % | | | 3.98 | % | | $ | 522 | | | | 68 | % | |
Year Ended 10/31/19 | | | (2.70 | ) | | $ | 25.98 | | | | 11.57 | % | | | 1.00 | % | | | 0.60 | % | | | 4.50 | % | | $ | 520 | | | | 126 | % | |
Year Ended 10/31/18 | | | (0.17 | ) | | $ | 26.25 | | | | (0.21 | )% | | | 0.97 | % | | | 0.42 | % | | | 2.82 | % | | $ | 436 | | | | 113 | % | |
Year Ended 10/31/17 | | | (0.31 | ) | | $ | 26.47 | | | | 24.12 | % | | | 0.93 | % | | | 0.77 | % | | | 2.07 | % | | $ | 1,219 | | | | 135 | % | |
Year Ended 10/31/16 | | | (0.14 | ) | | $ | 21.62 | | | | (3.80 | )% | | | 0.93 | % | | | 1.20 | % | | | 1.75 | % | | $ | 1,170 | | | | 76 | % | |
Year Ended 10/31/15 | | | — | | | $ | 22.62 | | | | 3.76 | % | | | 1.00 | % | | | 0.78 | % | | | 1.58 | % | | $ | 1,790 | | | | 137 | % | |
See notes to financial statements.
41
Victory Portfolios | | Financial Highlights | |
For a Share Outstanding Throughout Each Period
| | | | | Investment Activities | | Distributions to
Shareholders From | |
| | | Net Asset
Value,
Beginning of
Period | | Net
Investment
Income (Loss) | | Net Realized
and Unrealized
Gains (Losses)
on Investments | | Total from
Investment
Activities | | Net
Investment
Income | | Net Realized
Gains from
Investments | |
Victory Strategic Allocation Fund | |
Class A | |
Six Months Ended
4/30/20 (unaudited) | | $ | 16.47 | | | | 0.16 | (e) | | | (1.07 | ) | | | (0.91 | ) | | | (0.16 | ) | | | (0.40 | ) | |
Year Ended 10/31/19 | | $ | 15.44 | | | | 0.43 | (e) | | | 1.12 | | | | 1.55 | | | | (0.39 | ) | | | (0.13 | ) | |
Year Ended 10/31/18 | | $ | 16.41 | | | | 0.29 | (e) | | | (0.68 | ) | | | (0.39 | ) | | | (0.39 | ) | | | (0.19 | ) | |
Year Ended 10/31/17 | | $ | 14.80 | | | | 0.50 | (e) | | | 1.51 | | | | 2.01 | | | | (0.40 | ) | | | — | | |
Year Ended 10/31/16 | | $ | 15.10 | | | | 0.15 | (e) | | | (0.28 | ) | | | (0.13 | ) | | | (0.17 | ) | | | — | | |
Year Ended 10/31/15 | | $ | 15.69 | | | | 0.14 | | | | 0.57 | | | | 0.71 | | | | (0.30 | ) | | | (1.00 | ) | |
Class C | |
Six Months Ended
4/30/20 (unaudited) | | $ | 16.18 | | | | 0.11 | (e) | | | (1.06 | ) | | | (0.95 | ) | | | (0.10 | ) | | | (0.40 | ) | |
Year Ended 10/31/19 | | $ | 15.19 | | | | 0.30 | (e) | | | 1.10 | | | | 1.40 | | | | (0.28 | ) | | | (0.13 | ) | |
Year Ended 10/31/18 | | $ | 16.19 | | | | 0.21 | (e) | | | (0.71 | ) | | | (0.50 | ) | | | (0.31 | ) | | | (0.19 | ) | |
Year Ended 10/31/17 | | $ | 14.65 | | | | 0.43 | (e) | | | 1.44 | | | | 1.87 | | | | (0.33 | ) | | | — | | |
Year Ended 10/31/16 | | $ | 14.97 | | | | 0.06 | (e) | | | (0.29 | ) | | | (0.23 | ) | | | (0.09 | ) | | | — | | |
Year Ended 10/31/15 | | $ | 15.57 | | | | 0.01 | | | | 0.59 | | | | 0.60 | | | | (0.20 | ) | | | (1.00 | ) | |
Class I | |
Six Months Ended
4/30/20 (unaudited) | | $ | 16.56 | | | | 0.18 | (e) | | | (1.08 | ) | | | (0.90 | ) | | | (0.18 | ) | | | (0.40 | ) | |
Year Ended 10/31/19 | | $ | 15.52 | | | | 0.46 | (e) | | | 1.13 | | | | 1.59 | | | | (0.42 | ) | | | (0.13 | ) | |
Year Ended 10/31/18 | | $ | 16.48 | | | | 0.35 | (e) | | | (0.70 | ) | | | (0.35 | ) | | | (0.42 | ) | | | (0.19 | ) | |
Year Ended 10/31/17 | | $ | 14.86 | | | | 0.55 | (e) | | | 1.50 | | | | 2.05 | | | | (0.43 | ) | | | — | | |
Year Ended 10/31/16 | | $ | 15.16 | | | | 0.15 | (e) | | | (0.24 | ) | | | (0.09 | ) | | | (0.21 | ) | | | — | | |
Year Ended 10/31/15 | | $ | 15.74 | | | | 0.29 | | | | 0.47 | | | | 0.76 | | | | (0.34 | ) | | | (1.00 | ) | |
Class R | |
Six Months Ended
4/30/20 (unaudited) | | $ | 16.43 | | | | 0.14 | (e) | | | (1.06 | ) | | | (0.92 | ) | | | (0.14 | ) | | | (0.40 | ) | |
Year Ended 10/31/19 | | $ | 15.41 | | | | 0.36 | (e) | | | 1.14 | | | | 1.50 | | | | (0.35 | ) | | | (0.13 | ) | |
Year Ended 10/31/18 | | $ | 16.38 | | | | 0.27 | (e) | | | (0.70 | ) | | | (0.43 | ) | | | (0.35 | ) | | | (0.19 | ) | |
Year Ended 10/31/17 | | $ | 14.79 | | | | 0.46 | (e) | | | 1.49 | | | | 1.95 | | | | (0.36 | ) | | | — | | |
Year Ended 10/31/16 | | $ | 15.09 | | | | 0.09 | (e) | | | (0.26 | ) | | | (0.17 | ) | | | (0.13 | ) | | | — | | |
Year Ended 10/31/15 | | $ | 15.68 | | | | 0.08 | | | | 0.59 | | | | 0.67 | | | | (0.26 | ) | | | (1.00 | ) | |
(a) Not annualized for periods less than one year.
(b) Annualized for periods less than one year.
(c) The expense ratios exclude the impact of expenses paid by each underlying fund.
(d) Portfolio turnover is calculated on the basis of the Fund as a whole without distinguishing between the classes of shares issued.
(e) Per share net investment income (loss) has been calculated using the average daily shares method.
(f) Effective with the December 30, 2015 strategy change, the Adviser began reimbursing expenses inclusive of acquired fund fee and expenses.
See notes to financial statements.
42
Victory Portfolios | | Financial Highlights — continued | |
For a Share Outstanding Throughout Each Period
| | | | | Ratios to Average Net Assets | | Supplemental Data | |
| | | Total
Distributions | | Net Asset
Value,
End of
Period | | Total
Return
(Excludes
Sales
Charge)(a) | | Net
Expenses(b)(c) | | Net
Investment
Income
(Loss)(b) | | Gross
Expenses(b)(c) | | Net Assets,
End of
Period
(000's) | | Portfolio
Turnover(a)(d) | |
Victory Strategic Allocation Fund | |
Class A | |
Six Months Ended
4/30/20 (unaudited) | | | (0.56 | ) | | $ | 15.00 | | | | (5.80 | )% | | | 0.40 | % | | | 2.03 | % | | | 0.81 | % | | $ | 13,493 | | | | 9 | % | |
Year Ended 10/31/19 | | | (0.52 | ) | | $ | 16.47 | | | | 10.37 | % | | | 0.40 | % | | | 2.69 | % | | | 0.77 | % | | $ | 15,365 | | | | 5 | % | |
Year Ended 10/31/18 | | | (0.58 | ) | | $ | 15.44 | | | | (2.56 | )% | | | 0.40 | % | | | 1.77 | % | | | 0.28 | %(g) | | $ | 18,747 | | | | 40 | % | |
Year Ended 10/31/17 | | | (0.40 | ) | | $ | 16.41 | | | | 13.72 | % | | | 0.30 | % | | | 3.19 | % | | | 0.79 | % | | $ | 14,820 | | | | 51 | % | |
Year Ended 10/31/16 | | | (0.17 | ) | | $ | 14.80 | | | | (0.87 | )% | | | 0.31 | %(f) | | | 0.99 | % | | | 1.69 | % | | $ | 16,587 | | | | 192 | %(h) | |
Year Ended 10/31/15 | | | (1.30 | ) | | $ | 15.10 | | | | 4.66 | % | | | 1.15 | % | | | 0.82 | % | | | 1.40 | % | | $ | 10,560 | | | | 72 | % | |
Class C | |
Six Months Ended
4/30/20 (unaudited) | | | (0.50 | ) | | $ | 14.73 | | | | (6.17 | )% | | | 1.15 | % | | | 1.37 | % | | | 1.87 | % | | $ | 2,203 | | | | 9 | % | |
Year Ended 10/31/19 | | | (0.41 | ) | | $ | 16.18 | | | | 9.53 | % | | | 1.15 | % | | | 1.94 | % | | | 1.72 | % | | $ | 3,193 | | | | 5 | % | |
Year Ended 10/31/18 | | | (0.50 | ) | | $ | 15.19 | | | | (3.26 | )% | | | 1.15 | % | | | 1.30 | % | | | 1.08 | %(g) | | $ | 4,445 | | | | 40 | % | |
Year Ended 10/31/17 | | | (0.33 | ) | | $ | 16.19 | | | | 12.88 | % | | | 1.03 | % | | | 2.78 | % | | | 1.58 | % | | $ | 8,814 | | | | 51 | % | |
Year Ended 10/31/16 | | | (0.09 | ) | | $ | 14.65 | | | | (1.56 | )% | | | 0.95 | %(f) | | | 0.44 | % | | | 2.65 | % | | $ | 9,724 | | | | 192 | %(h) | |
Year Ended 10/31/15 | | | (1.20 | ) | | $ | 14.97 | | | | 3.92 | % | | | 1.85 | % | | | 0.12 | % | | | 2.36 | % | | $ | 2,725 | | | | 72 | % | |
Class I | |
Six Months Ended
4/30/20 (unaudited) | | | (0.58 | ) | | $ | 15.08 | | | | (5.71 | )% | | | 0.15 | % | | | 2.26 | % | | | 0.61 | % | | $ | 5,368 | | | | 9 | % | |
Year Ended 10/31/19 | | | (0.55 | ) | | $ | 16.56 | | | | 10.63 | % | | | 0.15 | % | | | 2.90 | % | | | 0.59 | % | | $ | 5,743 | | | | 5 | % | |
Year Ended 10/31/18 | | | (0.61 | ) | | $ | 15.52 | | | | (2.29 | )% | | | 0.15 | % | | | 2.11 | % | | | 0.01 | %(g) | | $ | 8,811 | | | | 40 | % | |
Year Ended 10/31/17 | | | (0.43 | ) | | $ | 16.48 | | | | 13.95 | % | | | 0.10 | % | | | 3.48 | % | | | 0.61 | % | | $ | 9,153 | | | | 51 | % | |
Year Ended 10/31/16 | | | (0.21 | ) | | $ | 14.86 | | | | (0.61 | )% | | | 0.24 | %(f) | | | 1.04 | % | | | 2.64 | % | | $ | 1,099 | | | | 192 | %(h) | |
Year Ended 10/31/15 | | | (1.34 | ) | | $ | 15.16 | | | | 4.96 | % | | | 0.90 | % | | | 0.93 | % | | | 4.15 | % | | $ | 1,474 | | | | 72 | % | |
Class R | |
Six Months Ended
4/30/20 (unaudited) | | | (0.54 | ) | | $ | 14.97 | | | | (5.87 | )% | | | 0.65 | % | | | 1.75 | % | | | 1.88 | % | | $ | 1,151 | | | | 9 | % | |
Year Ended 10/31/19 | | | (0.48 | ) | | $ | 16.43 | | | | 10.08 | % | | | 0.65 | % | | | 2.30 | % | | | 1.87 | % | | $ | 1,308 | | | | 5 | % | |
Year Ended 10/31/18 | | | (0.54 | ) | | $ | 15.41 | | | | (2.77 | )% | | | 0.65 | % | | | 1.63 | % | | | 1.01 | %(g) | | $ | 1,529 | | | | 40 | % | |
Year Ended 10/31/17 | | | (0.36 | ) | | $ | 16.38 | | | | 13.36 | % | | | 0.56 | % | | | 2.96 | % | | | 1.80 | % | | $ | 1,892 | | | | 51 | % | |
Year Ended 10/31/16 | | | (0.13 | ) | | $ | 14.79 | | | | (1.14 | )% | | | 0.62 | %(f) | | | 0.58 | % | | | 2.13 | % | | $ | 1,702 | | | | 192 | %(h) | |
Year Ended 10/31/15 | | | (1.26 | ) | | $ | 15.09 | | | | 4.36 | % | | | 1.45 | % | | | 0.52 | % | | | 2.17 | % | | $ | 1,875 | | | | 72 | % | |
(g) The amount includes a change in accounting estimate. Without this change in accounting estimate, the gross expense ratio would have been 0.67%, 1.54%, 0.42% and 1.43% for Class A, C, I and R, respectively.
(h) Portfolio turnover increased due to a change in investment strategy.
See notes to financial statements.
43
Victory Portfolios | | Financial Highlights | |
For a Share Outstanding Throughout Each Period
| | | | | Investment Activities | | Distributions to
Shareholders From | |
| | | Net Asset
Value,
Beginning of
Period | | Net
Investment
Income (Loss) | | Net Realized
and Unrealized
Gains (Losses)
on Investments | | Total from
Investment
Activities | | Net
Investment
Income | | Total
Distributions | |
Victory INCORE Fund for Income | |
Class A | |
Six Months Ended
4/30/20 (unaudited) | | $ | 8.56 | | | | 0.07 | (d) | | | 0.17 | | | | 0.24 | | | | (0.20 | ) | | | (0.20 | ) | |
Year Ended 10/31/19 | | $ | 8.56 | | | | 0.18 | (d) | | | 0.28 | | | | 0.46 | | | | (0.46 | ) | | | (0.46 | ) | |
Year Ended 10/31/18 | | $ | 9.09 | | | | 0.15 | (d)(e) | | | (0.23 | )(e) | | | (0.08 | ) | | | (0.45 | ) | | | (0.45 | ) | |
Year Ended 10/31/17 | | $ | 9.63 | | | | 0.10 | (d) | | | (0.15 | ) | | | (0.05 | ) | | | (0.49 | ) | | | (0.49 | ) | |
Year Ended 10/31/16 | | $ | 9.96 | | | | 0.11 | (d) | | | 0.05 | | | | 0.16 | | | | (0.49 | ) | | | (0.49 | ) | |
Year Ended 10/31/15 | | $ | 10.27 | | | | 0.15 | | | | 0.04 | | | | 0.19 | | | | (0.50 | ) | | | (0.50 | ) | |
Class C | |
Six Months Ended
4/30/20 (unaudited) | | $ | 8.48 | | | | 0.04 | (d) | | | 0.17 | | | | 0.21 | | | | (0.17 | ) | | | (0.17 | ) | |
Year Ended 10/31/19 | | $ | 8.48 | | | | 0.13 | (d) | | | 0.26 | | | | 0.39 | | | | (0.39 | ) | | | (0.39 | ) | |
Year Ended 10/31/18 | | $ | 9.01 | | | | 0.08 | (d)(e) | | | (0.23 | )(e) | | | (0.15 | ) | | | (0.38 | ) | | | (0.38 | ) | |
Year Ended 10/31/17 | | $ | 9.56 | | | | 0.03 | (d) | | | (0.16 | ) | | | (0.13 | ) | | | (0.42 | ) | | | (0.42 | ) | |
Year Ended 10/31/16 | | $ | 9.89 | | | | 0.03 | (d) | | | 0.06 | | | | 0.09 | | | | (0.42 | ) | | | (0.42 | ) | |
Year Ended 10/31/15 | | $ | 10.20 | | | | 0.02 | | | | 0.10 | | | | 0.12 | | | | (0.43 | ) | | | (0.43 | ) | |
Class I | |
Six Months Ended
4/30/20 (unaudited) | | $ | 8.55 | | | | 0.07 | (d) | | | 0.20 | | | | 0.27 | | | | (0.22 | ) | | | (0.22 | ) | |
Year Ended 10/31/19 | | $ | 8.55 | | | | 0.16 | (d) | | | 0.32 | | | | 0.48 | | | | (0.48 | ) | | | (0.48 | ) | |
Year Ended 10/31/18 | | $ | 9.08 | | | | 0.15 | (d)(e) | | | (0.21 | )(e) | | | (0.06 | ) | | | (0.47 | ) | | | (0.47 | ) | |
Year Ended 10/31/17 | | $ | 9.63 | | | | 0.13 | (d) | | | (0.16 | ) | | | (0.03 | ) | | | (0.52 | ) | | | (0.52 | ) | |
Year Ended 10/31/16 | | $ | 9.96 | | | | 0.13 | (d) | | | 0.06 | | | | 0.19 | | | | (0.52 | ) | | | (0.52 | ) | |
Year Ended 10/31/15 | | $ | 10.26 | | | | 0.16 | | | | 0.07 | | | | 0.23 | | | | (0.53 | ) | | | (0.53 | ) | |
Class R | |
Six Months Ended
4/30/20 (unaudited) | | $ | 8.56 | | | | 0.07 | (d) | | | 0.18 | | | | 0.25 | | | | (0.20 | ) | | | (0.20 | ) | |
Year Ended 10/31/19 | | $ | 8.57 | | | | 0.18 | (d) | | | 0.27 | | | | 0.45 | | | | (0.46 | ) | | | (0.46 | ) | |
Year Ended 10/31/18 | | $ | 9.09 | | | | 0.15 | (d)(e) | | | (0.22 | )(e) | | | (0.07 | ) | | | (0.45 | ) | | | (0.45 | ) | |
Year Ended 10/31/17 | | $ | 9.64 | | | | 0.10 | (d) | | | (0.16 | ) | | | (0.06 | ) | | | (0.49 | ) | | | (0.49 | ) | |
Year Ended 10/31/16 | | $ | 9.97 | | | | 0.11 | (d) | | | 0.05 | | | | 0.16 | | | | (0.49 | ) | | | (0.49 | ) | |
Year Ended 10/31/15 | | $ | 10.28 | | | | 0.11 | | | | 0.08 | | | | 0.19 | | | | (0.50 | ) | | | (0.50 | ) | |
(a) Not annualized for periods less than one year.
(b) Annualized for periods less than one year.
(c) Portfolio turnover is calculated on the basis of the Fund as a whole without distinguishing between the classes of shares issued.
(d) Per share net investment income (loss) has been calculated using the average daily shares method.
(e) Net Investment Income (Loss) per share, Net Realized and Unrealized Gains (Losses) on Investments and the Ratio of Net Investment Income (Loss) have been restated. See Item 11 in the Notes to Financial Statements.
(f) Commencement of operations.
See notes to financial statements.
44
Victory Portfolios | | Financial Highlights — continued | |
For a Share Outstanding Throughout Each Period
| | | | | Ratios to Average Net Assets | | Supplemental Data | |
| | | Net Asset
Value,
End of
Period | | Total
Return
(Excludes
Sales
Charge)(a) | | Net
Expenses(b) | | Net
Investment
Income
(Loss)(b) | | Gross
Expenses(b) | | Net Assets,
End of
Period
(000's) | | Portfolio
Turnover(a)(c) | |
Victory INCORE Fund for Income | |
Class A | |
Six Months Ended
4/30/20 (unaudited) | | $ | 8.60 | | | | 2.91 | % | | | 0.91 | % | | | 1.75 | % | | | 0.92 | % | | $ | 123,867 | | | | 15 | % | |
Year Ended 10/31/19 | | $ | 8.56 | | | | 5.50 | % | | | 0.92 | % | | | 2.12 | % | | | 0.94 | % | | $ | 136,570 | | | | 29 | % | |
Year Ended 10/31/18 | | $ | 8.56 | | | | (0.91 | )% | | | 0.92 | % | | | 1.64 | %(e) | | | 0.93 | % | | $ | 153,574 | | | | 27 | % | |
Year Ended 10/31/17 | | $ | 9.09 | | | | (0.51 | )% | | | 0.88 | % | | | 1.08 | % | | | 0.88 | % | | $ | 224,822 | | | | 30 | % | |
Year Ended 10/31/16 | | $ | 9.63 | | | | 1.62 | % | | | 0.91 | % | | | 1.10 | % | | | 0.91 | % | | $ | 400,740 | | | | 31 | % | |
Year Ended 10/31/15 | | $ | 9.96 | | | | 1.90 | % | | | 0.94 | % | | | 1.09 | % | | | 0.94 | % | | $ | 349,571 | | | | 44 | % | |
Class C | |
Six Months Ended
4/30/20 (unaudited) | | $ | 8.52 | | | | 2.55 | % | | | 1.71 | % | | | 0.91 | % | | | 1.75 | % | | $ | 21,065 | | | | 15 | % | |
Year Ended 10/31/19 | | $ | 8.48 | | | | 4.72 | % | | | 1.72 | % | | | 1.53 | % | | | 1.73 | % | | $ | 22,541 | | | | 29 | % | |
Year Ended 10/31/18 | | $ | 8.48 | | | | (1.69 | )% | | | 1.70 | % | | | 0.94 | %(e) | | | 1.71 | % | | $ | 31,976 | | | | 27 | % | |
Year Ended 10/31/17 | | $ | 9.01 | | | | (1.41 | )% | | | 1.67 | % | | | 0.29 | % | | | 1.67 | % | | $ | 50,316 | | | | 30 | % | |
Year Ended 10/31/16 | | $ | 9.56 | | | | 0.88 | % | | | 1.69 | % | | | 0.32 | % | | | 1.69 | % | | $ | 72,958 | | | | 31 | % | |
Year Ended 10/31/15 | | $ | 9.89 | | | | 1.14 | % | | | 1.72 | % | | | 0.31 | % | | | 1.72 | % | | $ | 68,015 | | | | 44 | % | |
Class I | |
Six Months Ended
4/30/20 (unaudited) | | $ | 8.60 | | | | 3.16 | % | | | 0.64 | % | | | 1.68 | % | | | 0.66 | % | | $ | 523,712 | | | | 15 | % | |
Year Ended 10/31/19 | | $ | 8.55 | | | | 5.79 | % | | | 0.64 | % | | | 1.84 | % | | | 0.65 | % | | $ | 447,735 | | | | 29 | % | |
Year Ended 10/31/18 | | $ | 8.55 | | | | (0.64 | )% | | | 0.63 | % | | | 1.69 | %(e) | | | 0.63 | % | | $ | 331,338 | | | | 27 | % | |
Year Ended 10/31/17 | | $ | 9.08 | | | | (0.34 | )% | | | 0.61 | % | | | 1.34 | % | | | 0.61 | % | | $ | 520,056 | | | | 30 | % | |
Year Ended 10/31/16 | | $ | 9.63 | | | | 1.90 | % | | | 0.63 | % | | | 1.37 | % | | | 0.63 | % | | $ | 547,322 | | | | 31 | % | |
Year Ended 10/31/15 | | $ | 9.96 | | | | 2.28 | % | | | 0.65 | % | | | 1.37 | % | | | 0.65 | % | | $ | 403,879 | | | | 44 | % | |
Class R | |
Six Months Ended
4/30/20 (unaudited) | | $ | 8.61 | | | | 3.02 | % | | | 0.91 | % | | | 1.65 | % | | | 0.92 | % | | $ | 39,695 | | | | 15 | % | |
Year Ended 10/31/19 | | $ | 8.56 | | | | 5.37 | % | | | 0.92 | % | | | 2.04 | % | | | 0.94 | % | | $ | 38,596 | | | | 29 | % | |
Year Ended 10/31/18 | | $ | 8.57 | | | | (0.79 | )% | | | 0.91 | % | | | 1.67 | %(e) | | | 0.91 | % | | $ | 43,405 | | | | 27 | % | |
Year Ended 10/31/17 | | $ | 9.09 | | | | (0.62 | )% | | | 0.88 | % | | | 1.08 | % | | | 0.88 | % | | $ | 58,783 | | | | 30 | % | |
Year Ended 10/31/16 | | $ | 9.64 | | | | 1.62 | % | | | 0.90 | % | | | 1.11 | % | | | 0.90 | % | | $ | 85,195 | | | | 31 | % | |
Year Ended 10/31/15 | | $ | 9.97 | | | | 1.88 | % | | | 0.95 | % | | | 1.07 | % | | | 0.95 | % | | $ | 73,805 | | | | 44 | % | |
See notes to financial statements.
45
Victory Portfolios | | Financial Highlights | |
For a Share Outstanding Throughout Each Period
| | | | | Investment Activities | | Distributions to
Shareholders From | |
| | | Net Asset
Value,
Beginning of
Period | | Net
Investment
Income (Loss) | | Net Realized
and Unrealized
Gains (Losses)
on Investments | | Total from
Investment
Activities | | Net
Investment
Income | | Total
Distributions | |
Victory INCORE Fund for Income | |
Class R6 | |
Six Months Ended
4/30/20 (unaudited) | | $ | 8.54 | | | | 0.04 | (d) | | | 0.23 | | | | 0.27 | | | | (0.22 | ) | | | (0.22 | ) | |
Year Ended 10/31/19 | | $ | 8.55 | | | | 0.17 | (d) | | | 0.30 | | | | 0.47 | | | | (0.48 | ) | | | (0.48 | ) | |
Year Ended 10/31/18 | | $ | 9.07 | | | | 0.13 | (d)(e) | | | (0.18 | )(e) | | | (0.05 | ) | | | (0.47 | ) | | | (0.47 | ) | |
Year Ended 10/31/17 | | $ | 9.62 | | | | 0.12 | (d) | | | (0.16 | ) | | | (0.04 | ) | | | (0.51 | ) | | | (0.51 | ) | |
Year Ended 10/31/16 | | $ | 9.95 | | | | 0.13 | (d) | | | 0.06 | | | | 0.19 | | | | (0.52 | ) | | | (0.52 | ) | |
March 4, 2015(f)
through 10/31/15 | | $ | 10.23 | | | | 0.10 | | | | (0.03 | ) | | | 0.07 | | | | (0.35 | ) | | | (0.35 | ) | |
Class Y | |
Six Months Ended
4/30/20 (unaudited) | | $ | 8.56 | | | | 0.03 | (d) | | | 0.22 | | | | 0.25 | | | | (0.21 | ) | | | (0.21 | ) | |
Year Ended 10/31/19 | | $ | 8.56 | | | | 0.13 | (d) | | | 0.35 | | | | 0.48 | | | | (0.48 | ) | | | (0.48 | ) | |
Year Ended 10/31/18 | | $ | 9.08 | | | | 0.19 | (d)(e) | | | (0.25 | )(e) | | | (0.06 | ) | | | (0.46 | ) | | | (0.46 | ) | |
Year Ended 10/31/17 | | $ | 9.64 | | | | 0.10 | (d) | | | (0.15 | ) | | | (0.05 | ) | | | (0.51 | ) | | | (0.51 | ) | |
Year Ended 10/31/16 | | $ | 9.96 | | | | 0.13 | (d) | | | 0.06 | | | | 0.19 | | | | (0.51 | ) | | | (0.51 | ) | |
Year Ended 10/31/15 | | $ | 10.27 | | | | 0.08 | | | | 0.14 | | | | 0.22 | | | | (0.53 | ) | | | (0.53 | ) | |
(a) Not annualized for periods less than one year.
(b) Annualized for periods less than one year.
(c) Portfolio turnover is calculated on the basis of the Fund as a whole without distinguishing between the classes of shares issued.
(d) Per share net investment income (loss) has been calculated using the average daily shares method.
(e) Net Investment Income (Loss) per share, Net Realized and Unrealized Gains (Losses) on Investments and the Ratio of Net Investment Income (Loss) have been restated. See Item 11 in the Notes to Financial Statements.
(f) Commencement of operations.
See notes to financial statements.
46
Victory Portfolios | | Financial Highlights — continued | |
For a Share Outstanding Throughout Each Period
| | | | | Ratios to Average Net Assets | | Supplemental Data | |
| | | Net Asset
Value,
End of
Period | | Total
Return
(Excludes
Sales
Charge)(a) | | Net
Expenses(b) | | Net
Investment
Income
(Loss)(b) | | Gross
Expenses(b) | | Net Assets,
End of
Period
(000's) | | Portfolio
Turnover(a)(c) | |
Victory INCORE Fund for Income | |
Class R6 | |
Six Months Ended
4/30/20 (unaudited) | | $ | 8.59 | | | | 3.17 | % | | | 0.61 | % | | | 0.97 | % | | | 0.61 | % | | $ | 44,205 | | | | 15 | % | |
Year Ended 10/31/19 | | $ | 8.54 | | | | 5.68 | % | | | 0.63 | % | | | 2.00 | % | | | 0.66 | % | | $ | 15,864 | | | | 29 | % | |
Year Ended 10/31/18 | | $ | 8.55 | | | | (0.52 | )% | | | 0.63 | % | | | 1.43 | %(e) | | | 0.69 | % | | $ | 13,741 | | | | 27 | % | |
Year Ended 10/31/17 | | $ | 9.07 | | | | (0.36 | )% | | | 0.63 | % | | | 1.31 | % | | | 0.73 | % | | $ | 9,407 | | | | 30 | % | |
Year Ended 10/31/16 | | $ | 9.62 | | | | 1.89 | % | | | 0.63 | % | | | 1.37 | % | | | 0.97 | % | | $ | 6,286 | | | | 31 | % | |
March 4, 2015(f)
through 10/31/15 | | $ | 9.95 | | | | 0.70 | % | | | 0.63 | % | | | 1.24 | % | | | 0.99 | % | | $ | 3,896 | | | | 44 | % | |
Class Y | |
Six Months Ended
4/30/20 (unaudited) | | $ | 8.60 | | | | 3.00 | % | | | 0.71 | % | | | 0.72 | % | | | 0.75 | % | | $ | 104,100 | | | | 15 | % | |
Year Ended 10/31/19 | | $ | 8.56 | | | | 5.72 | % | | | 0.71 | % | | | 1.48 | % | | | 0.79 | % | | $ | 54,950 | | | | 29 | % | |
Year Ended 10/31/18 | | $ | 8.56 | | | | (0.61 | )% | | | 0.71 | % | | | 2.14 | %(e) | | | 0.79 | % | | $ | 31,975 | | | | 27 | % | |
Year Ended 10/31/17 | | $ | 9.08 | | | | (0.53 | )% | | | 0.68 | % | | | 1.09 | % | | | 0.68 | % | | $ | 62,408 | | | | 30 | % | |
Year Ended 10/31/16 | | $ | 9.64 | | | | 1.92 | % | | | 0.71 | % | | | 1.30 | % | | | 0.89 | % | | $ | 8,119 | | | | 31 | % | |
Year Ended 10/31/15 | | $ | 9.96 | | | | 2.12 | % | | | 0.71 | % | | | 1.32 | % | | | 0.90 | % | | $ | 5,093 | | | | 44 | % | |
See notes to financial statements.
47
Victory Portfolios | | Financial Highlights | |
For a Share Outstanding Throughout Each Period
| | | | | Investment Activities | | Distributions to
Shareholders From | |
| | | Net Asset
Value,
Beginning of
Period | | Net
Investment
Income (Loss) | | Net Realized
and Unrealized
Gains (Losses)
on Investments | | Total from
Investment
Activities | | Net
Investment
Income | | Net Realized
Gains From
Investments | |
Victory INCORE Investment Grade Convertible Fund | |
Class A | |
Six Months Ended
4/30/20 (unaudited) | | $ | 17.51 | | | | 0.13 | (d) | | | (0.99 | ) | | | (0.86 | ) | | | (0.21 | ) | | | (0.59 | ) | |
Year Ended 10/31/19 | | $ | 16.22 | | | | 0.21 | (d) | | | 1.84 | | | | 2.05 | | | | (0.28 | ) | | | (0.48 | ) | |
Year Ended 10/31/18 | | $ | 16.53 | | | | 0.30 | (d) | | | 0.01 | | | | 0.31 | | | | (0.53 | ) | | | (0.09 | ) | |
Year Ended 10/31/17 | | $ | 13.72 | | | | 0.17 | (d) | | | 2.89 | | | | 3.06 | | | | (0.25 | ) | | | — | | |
Year Ended 10/31/16 | | $ | 14.00 | | | | 0.11 | (d) | | | (0.07 | ) | | | 0.04 | | | | (0.32 | ) | | | — | | |
Year Ended 10/31/15 | | $ | 14.10 | | | | 0.14 | | | | 0.03 | | | | 0.17 | | | | (0.27 | ) | | | — | | |
Class I | |
Six Months Ended
4/30/20 (unaudited) | | $ | 17.50 | | | | 0.17 | (d) | | | (0.99 | ) | | | (0.82 | ) | | | (0.24 | ) | | | (0.59 | ) | |
Year Ended 10/31/19 | | $ | 16.21 | | | | 0.31 | (d) | | | 1.83 | | | | 2.14 | | | | (0.37 | ) | | | (0.48 | ) | |
Year Ended 10/31/18 | | $ | 16.53 | | | | 0.36 | (d) | | | (0.01 | ) | | | 0.35 | | | | (0.58 | ) | | | (0.09 | ) | |
Year Ended 10/31/17 | | $ | 13.71 | | | | 0.22 | (d) | | | 2.90 | | | | 3.12 | | | | (0.30 | ) | | | — | | |
Year Ended 10/31/16 | | $ | 13.98 | | | | 0.17 | (d) | | | (0.07 | ) | | | 0.10 | | | | (0.37 | ) | | | — | | |
Year Ended 10/31/15 | | $ | 14.09 | | | | 0.18 | | | | 0.03 | | | | 0.21 | | | | (0.32 | ) | | | — | | |
(a) Not annualized for periods less than one year.
(b) Annualized for periods less than one year.
(c) Portfolio turnover is calculated on the basis of the Fund as a whole without distinguishing between the classes of shares issued.
(d) Per share net investment income (loss) has been calculated using the average daily shares method.
See notes to financial statements.
48
Victory Portfolios | | Financial Highlights — continued | |
For a Share Outstanding Throughout Each Period
| | | | | Ratios to Average Net Assets | | Supplemental Data | |
| | | Total
Distributions | | Net Asset
Value,
End of
Period | | Total
Return
(Excludes
Sales
Charge)(a) | | Net
Expenses(b) | | Net
Investment
Income
(Loss)(b) | | Gross
Expenses(b) | | Net Assets,
End of
Period
(000's) | | Portfolio
Turnover(a)(c) | |
Victory INCORE Investment Grade Convertible Fund | |
Class A | |
Six Months Ended
4/30/20 (unaudited) | | | (0.80 | ) | | $ | 15.85 | | | | (5.14 | )% | | | 1.36 | % | | | 1.65 | % | | | 1.36 | % | | $ | 37,461 | | | | 24 | % | |
Year Ended 10/31/19 | | | (0.76 | ) | | $ | 17.51 | | | | 13.35 | % | | | 1.49 | % | | | 1.31 | % | | | 1.49 | % | | $ | 16,349 | | | | 35 | % | |
Year Ended 10/31/18 | | | (0.62 | ) | | $ | 16.22 | | | | 1.87 | % | | | 1.27 | % | | | 1.79 | % | | | 1.27 | % | | $ | 14,268 | | | | 41 | % | |
Year Ended 10/31/17 | | | (0.25 | ) | | $ | 16.53 | | | | 22.57 | % | | | 1.30 | % | | | 1.12 | % | | | 1.30 | % | | $ | 33,040 | | | | 39 | % | |
Year Ended 10/31/16 | | | (0.32 | ) | | $ | 13.72 | | | | 0.29 | % | | | 1.48 | % | | | 0.80 | % | | | 1.48 | % | | $ | 14,350 | | | | 22 | % | |
Year Ended 10/31/15 | | | (0.27 | ) | | $ | 14.00 | | | | 1.21 | % | | | 1.39 | % | | | 0.75 | % | | | 1.39 | % | | $ | 10,396 | | | | 32 | % | |
Class I | |
Six Months Ended
4/30/20 (unaudited) | | | (0.83 | ) | | $ | 15.85 | | | | (4.99 | )% | | | 0.95 | % | | | 2.01 | % | | | 0.95 | % | | $ | 258,767 | | | | 24 | % | |
Year Ended 10/31/19 | | | (0.85 | ) | | $ | 17.50 | | | | 13.99 | % | | | 0.96 | % | | | 1.87 | % | | | 0.96 | % | | $ | 263,981 | | | | 35 | % | |
Year Ended 10/31/18 | | | (0.67 | ) | | $ | 16.21 | | | | 2.16 | % | | | 0.94 | % | | | 2.17 | % | | | 0.94 | % | | $ | 126,871 | | | | 41 | % | |
Year Ended 10/31/17 | | | (0.30 | ) | | $ | 16.53 | | | | 23.07 | % | | | 0.94 | % | | | 1.47 | % | | | 0.94 | % | | $ | 78,879 | | | | 39 | % | |
Year Ended 10/31/16 | | | (0.37 | ) | | $ | 13.71 | | | | 0.77 | % | | | 0.99 | % | | | 1.26 | % | | | 0.99 | % | | $ | 53,438 | | | | 22 | % | |
Year Ended 10/31/15 | | | (0.32 | ) | | $ | 13.98 | | | | 1.54 | % | | | 1.00 | % | | | 1.14 | % | | | 1.01 | % | | $ | 40,024 | | | | 32 | % | |
See notes to financial statements.
49
Victory Portfolios | | Notes to Financial Statements
April 30, 2020 | |
(Unaudited)
1. Organization:
Victory Portfolios (the "Trust") was organized on December 6, 1995 as a Delaware statutory trust as a successor to a company named "The Victory Portfolios," which was organized as a Massachusetts business trust on February 5, 1986. The Trust is registered under the Investment Company Act of 1940, as amended (the "1940 Act"), as an open-end investment company. The Trust is comprised of 42 funds and is authorized to issue an unlimited number of shares, which are units of beneficial interest with a par value of $0.001 per share. Each Fund is classified as diversified under the 1940 Act.
The accompanying financial statements are those of the following six Funds (collectively, the "Funds" and individually, a "Fund"):
Funds (Legal Name) | | Funds (Short Name) | | Investment Share
Classes Offered | |
Victory Diversified Stock Fund | | Diversified Stock Fund | | Class A, C, I, R, R6, and Y | |
Victory NewBridge Large Cap
Growth Fund | | NewBridge Large Cap
Growth Fund | | Class A, C, I and Y
| |
Victory Special Value Fund | | Special Value Fund | | Class A, C, I, R and Y | |
Victory Strategic Allocation Fund | | Strategic Allocation Fund | | Class A, C, I and R | |
Victory INCORE Fund for Income | | INCORE Fund for Income | | Class A, C, I, R, R6 and Y | |
Victory INCORE Investment Grade
Convertible Fund | | INCORE Investment Grade
Convertible Fund | | Class A and I
| |
Each class of shares of a Fund has substantially identical rights and privileges except with respect to sales charges, fees paid under distribution plans, expenses allocable exclusively to each class of shares, voting rights on matters solely affecting a single class of shares, and the exchange privilege of each class of shares.
Under the Trust's organizational documents, its officers and trustees are indemnified against certain liabilities arising out of the performance of their duties to the Funds. In addition, in the normal course of business, the Funds enter into contracts with their vendors and others that provide for general indemnifications. The Funds' maximum exposure under these arrangements is unknown, as this would involve future claims that may be made against the Funds. However, based on experience, the Funds expect that risk of loss to be remote.
2. Significant Accounting Policies:
The following is a summary of significant accounting policies followed by the Trust in the preparation of its financial statements. The policies are in conformity with generally accepted accounting principles in the United States of America ("GAAP"). The preparation of financial statements in accordance with GAAP requires management to make estimates and assumptions that affect the reported amounts of assets and liabilities and disclosure of contingent assets and liabilities at the date of the financial statements and the reported amounts of income and expenses for the period. Actual results could differ from those estimates. The Funds follow the specialized accounting and reporting requirements under GAAP that are applicable to investment companies.
Investment Valuation:
The Funds record investments at fair value. Fair value is defined as the price that would be received to sell an asset or paid to transfer a liability in an orderly transaction between market participants at the measurement date.
The valuation techniques described below maximize the use of observable inputs and minimize the use of unobservable inputs in determining fair value. The inputs used for valuing the Funds' investments are summarized in the three broad levels listed below:
• Level 1 — quoted prices in active markets for identical securities
• Level 2 — other significant observable inputs (including quoted prices for similar securities or interest rates applicable to those securities, etc.)
50
Victory Portfolios | | Notes to Financial Statements — continued
April 30, 2020 | |
(Unaudited)
• Level 3 — significant unobservable inputs (including the Funds' own assumptions in determining the fair value of investments)
Changes in valuation techniques may result in transfers in or out of an assigned level within the disclosure hierarchy. The inputs or methodologies used for valuation techniques are not necessarily an indication of the risk associated with entering into those investments.
Portfolio securities listed or traded on securities exchanges, including American Depositary Receipts ("ADRs") and Rights, are valued at the closing price on the exchange or system where the security is principally traded, if available, or at the Nasdaq Official Closing Price. If there have been no sales for that day on the exchange or system, then a security is valued at the last available bid quotation on the exchange or system where the security is principally traded. In each of these situations, valuations are typically categorized as Level 1 in the fair value hierarchy.
Investments in open-end investment companies are valued at net asset value. These valuations are typically categorized as Level 1 in the fair value hierarchy.
Debt securities of United States ("U.S.") issuers (other than short-term investments maturing in 60 days or less), including corporate and municipal securities, are valued on the basis of bid valuations provided by dealers or an independent pricing service approved by the Trust's Board of Trustees (the "Board"). Short-term investments maturing in 60 days or less may be valued at amortized cost, which approximates market value. Under the amortized cost method, premium or discount, if any, is amortized or accreted, respectively, on a constant basis to the maturity of the security. In each of these situations, valuations are typically categorized as Level 2 in the fair value hierarchy.
Investments for which there are no such quotations, or for which quotations do not appear reliable, are valued at fair value in accordance with procedures established by and under the general supervision and responsibility of the Board. These valuations are typically categorized as Level 2 or Level 3 in the fair value hierarchy, based on the observability of inputs used to determine the fair value.
A summary of the valuations as of April 30, 2020, based upon the three levels defined above, is included in the table below while the breakdown, by category, of investments is disclosed on the Schedules of Portfolio Investments (amounts in thousands).
| | | Level 1 | | Level 2 | | Level 3 | | Total | |
Diversified Stock Fund | |
Common Stocks | | $ | 228,375 | | | $ | — | | | $ | — | | | $ | 228,375 | | |
Exchange-Traded Funds | | | 5,947 | | | | — | | | | — | | | | 5,947 | | |
Collateral for Securities Loaned | | | 7,855 | | | | — | | | | — | | | | 7,855 | | |
Total | | $ | 242,177 | | | $ | — | | | $ | — | | | $ | 242,177 | | |
NewBridge Large Cap Growth Fund | |
Common Stocks | | $ | 14,935 | | | $ | — | | | $ | — | | | $ | 14,935 | | |
Collateral for Securities Loaned | | | 349 | | | | — | | | | — | | | | 349 | | |
Total | | $ | 15,284 | | | $ | — | | | $ | — | | | $ | 15,284 | | |
Special Value Fund | |
Common Stocks | | $ | 41,320 | | | $ | — | | | $ | — | | | $ | 41,320 | | |
Exchange-Traded Funds | | | 1,076 | | | | — | | | | — | | | | 1,076 | | |
Collateral for Securities Loaned | | | 503 | | | | — | | | | — | | | | 503 | | |
Total | | $ | 42,899 | | | $ | — | | | $ | — | | | $ | 42,899 | | |
Strategic Allocation Fund | |
Affiliated Exchange-Traded Funds | | $ | 1,508 | | | $ | — | | | $ | — | | | $ | 1,508 | | |
Affiliated Mutual Funds | | | 20,697 | | | | — | | | | — | | | | 20,697 | | |
Total | | $ | 22,205 | | | $ | — | | | $ | — | | | $ | 22,205 | | |
51
Victory Portfolios | | Notes to Financial Statements — continued
April 30, 2020 | |
(Unaudited)
| | | Level 1 | | Level 2 | | Level 3 | | Total | |
INCORE Fund for Income | |
Government National Mortgage Association | | $ | — | | | $ | 619,822 | | | $ | — | | | $ | 619,822 | | |
U.S. Treasury Obligations | | | — | | | | 226,939 | | | | — | | | | 226,939 | | |
Investment Companies | | | 13,479 | | | | — | | | | — | | | | 13,479 | | |
Total | | $ | 13,479 | | | $ | 846,761 | | | $ | — | | | $ | 860,240 | | |
INCORE Investment Grade Convertible Fund | |
Convertible Corporate Bonds | | $ | — | | | $ | 199,776 | | | $ | — | | | $ | 199,776 | | |
Convertible Preferred Stocks | | | 81,293 | | | | 6,537 | | | | — | | | | 87,830 | | |
Collateral for Securities Loaned | | | 15,447 | | | | — | | | | — | | | | 15,447 | | |
Total | | $ | 96,740 | | | $ | 206,313 | | | $ | — | | | $ | 303,053 | | |
For the six months ended April 30, 2020, there were no transfers in or out of the Level 3 fair value hierarchy.
Securities Purchased on a When-Issued Basis:
The Funds may purchase securities on a when-issued basis. When-issued securities are securities purchased for delivery beyond normal settlement periods at a stated price and/or yield, thereby involving the risk that the price and/or yield obtained may be more or less than those available in the market when delivery takes place. At the time a Fund makes the commitment to purchase a security on a when-issued basis, the Fund records the transaction and reflects the value of the security in determining net asset value. No interest accrues to the Fund until the transaction settles and payment takes place. Normally, the settlement date occurs within one month of the purchase. A segregated account is established and the Fund maintains cash and/or marketable securities at least equal in value to commitments for when-issued securities. If a Fund owns when-issued securities, these values are included in Payable for investments purchased on the accompanying Statements of Assets and Liabilities and the segregated assets are identified on the Schedules of Portfolio Investments.
Real Estate Investment Trusts ("REITs"):
The Funds may invest in REITs, which report information on the source of their distributions annually. REITs are pooled investment vehicles that invest primarily in income-producing real estate or real estate-related loans or interests (such as mortgages). Certain distributions received from REITs during the year are recorded as realized gains or return of capital as estimated by the Funds or when such information becomes known.
Investment Companies:
Exchange-Traded Funds ("ETFs"):
The Funds may invest in ETFs. ETFs are a type of index fund, the shares of which are bought and sold on a securities exchange. An ETF trades like common stock and represents a fixed portfolio of securities designed to track the performance and dividend yield of a particular domestic or foreign market index. A Fund may purchase shares of an ETF to temporarily gain exposure to a portion of the U.S. or a foreign market while awaiting purchase of underlying securities. The risks of owning an ETF generally reflect the risks of owning the underlying securities they are designed to track, although the lack of liquidity of an ETF could result in it being more volatile. Additionally, ETFs have fees and expenses that reduce their value.
52
Victory Portfolios | | Notes to Financial Statements — continued
April 30, 2020 | |
(Unaudited)
Open-End Funds:
The Funds may invest in portfolios of open-end investment companies. These investment companies value securities in their portfolios for which market quotations are readily available at their market values (generally the last reported sale price) and all other securities and assets at their fair value by the methods established by the board of directors of the underlying funds.
Investment Transactions and Related Income:
Changes in holdings of investments are accounted for no later than one business day following the trade date. For financial reporting purposes, however, investment transactions are accounted for on trade date on the last business day of the reporting period. Interest income is determined on the basis of coupon interest accrued using the effective interest method which adjusts, where applicable, the amortization of premiums or accretion of discounts. Dividend income is recorded on the ex-dividend date. Gains or losses realized on sales of securities are recorded on the identified cost basis. Paydown gains or losses on applicable securities, if any, are recorded as components of Interest income on the Statements of Operations.
Withholding taxes on interest, dividends and gains as a result of certain investments in ADRs by the Funds have been provided for in accordance with each investment's applicable country's tax rules and rates.
Securities Lending:
The Trust has entered into a Master Securities Lending Agreement ("MSLA") with Citibank, N.A. ("Citibank" or the "Agent"). Under the terms of the MSLA, the Funds may lend securities to certain broker-dealers and banks in exchange for collateral in the amount of at least 102% of the value of U.S. securities loaned or at least 105% of the value of non-U.S. securities loaned, marked-to-market daily. Any collateral shortfalls associated with increases in the valuation of the securities loaned are adjusted the next business day. The collateral can be received in the form of cash collateral and/or non-cash collateral. Non-cash collateral can include U.S. Government Securities, letters of credit and certificates of deposit. The cash collateral is invested in short-term instruments or cash equivalents, primarily open-end investment companies, as noted in the Funds' Schedules of Portfolio Investments. The Trust does not have effective control of the non-cash collateral and therefore it is not disclosed in the Funds' Schedules of Portfolio Investments. During the time portfolio securities are on loan, the borrower will pay the Funds any dividends or interest paid on such securities plus any fee negotiated between the parties to the lending agreement. The Funds also earn a return from the collateral. The Funds pay the Agent various fees in connection with the investment of cash collateral and fees based on the investment income received from securities lending activities. Securities lending income (net of these fees) is disclosed on the Statements of Operations. Although risk is mitigated by the collateral, the Funds could experience a delay in recovering their securities and possible loss of income or value if the borrower fails to return them.
Securities lending transactions are entered into by a Fund under the MSLA, which permits the Fund, under certain circumstances such as an event of default, to offset amounts payable by the Fund to the same counterparty against amounts receivable from the counterparty to create a net payment due to or from the Fund.
The following table (amounts in thousands) is a summary of the Funds' securities lending transactions which are subject to offset under the MSLA as of April 30, 2020. These transactions are accounted for as secured borrowings with an overnight and continuous contractual maturity for cash collateral and greater than overnight and continuous contractual maturity for non-cash collateral.
53
Victory Portfolios | | Notes to Financial Statements — continued
April 30, 2020 | |
(Unaudited)
| | | Gross
Amount of
Recognized
Assets
(Value of | | Value of
Cash | | Value of Non-cash Collateral
Received by Maturity | | | |
| | | Securities
on Loan) | | Collateral
Received* | | <30 Days | | Between 30
& 90 days | | > 90 Days | | Net Amount | |
Diversified Stock Fund | | $ | 7,537 | | | $ | 7,537 | | | $ | — | | | $ | — | | | $ | — | | | $ | — | | |
NewBridge Large Cap
Growth Fund | | | 340 | | | | 340 | | | | — | | | | — | | | | — | | | | — | | |
Special Value Fund | | | 472 | | | | 472 | | | | — | | | | — | | | | — | | | | — | | |
INCORE Investment Grade
Convertible Fund | | $ | 15,194 | | | | 15,194 | | | | — | | | | — | | | | — | | | | — | | |
* Collateral received in excess of the market value of securities on loan is not presented in this table. The total cash collateral received by each Fund is disclosed in the Statement of Assets and Liabilities.
Distributions to Shareholders:
Dividends from net investment income, if any, are declared and paid monthly for the INCORE Fund for Income. Dividends from net investment income, if any, are declared and paid quarterly for the Diversified Stock Fund, Strategic Allocation Fund and INCORE Investment Grade Convertible Fund. Dividends from net investment income, if any, are declared and paid annually for the NewBridge Large Cap Growth Fund and Special Value Fund. Distributable net realized gains, if any, are declared and distributed at least annually from each Fund.
The amounts of dividends from net investment income and distributions from net realized gains (collectively, distributions to shareholders) are determined in accordance with federal income tax regulations, which may differ from GAAP. To the extent these "book/tax" differences are permanent in nature (e.g., net operating loss and distribution reclassification), such amounts are reclassified within the components of net assets based on their federal tax-basis treatment; temporary differences (e.g., wash sales) do not require reclassification. To the extent dividends and distributions exceed net investment income and net realized gains for tax purposes, they are reported as distributions of capital. Net investment losses incurred by a Fund may be reclassified as an offset to capital on the accompanying Statements of Assets and Liabilities.
Federal Income Taxes:
It is the policy of each Fund to continue to qualify as a regulated investment company by complying with the provisions available to certain investment companies, as defined in applicable sections of the Internal Revenue Code, and to make distributions of net investment income and net realized gains sufficient to relieve it from all, or substantially all, federal income taxes. Accordingly, no provision for federal income taxes is required in the financial statements. The Funds have a tax year end of October 31.
Management of the Funds has reviewed tax positions taken in tax years that remain subject to examination by all major tax jurisdictions, including federal (i.e., all open tax years and the interim tax period since then). Management believes that there is no tax liability resulting from unrecognized tax benefits related to uncertain tax positions taken.
Allocations:
Expenses directly attributable to a Fund are charged to the Fund, while expenses which are attributable to more than one fund in the Trust, or jointly with an affiliated trust, are allocated among the respective funds in the Trust and/or affiliated trust based upon net assets or another appropriate basis.
54
Victory Portfolios | | Notes to Financial Statements — continued
April 30, 2020 | |
(Unaudited)
Income, expenses (other than class-specific expenses such as transfer agent fees, state registration fees, printing fees and 12b-1 fees), and realized and unrealized gains or losses on investments are allocated to each class of shares based on its relative net assets on the date income is earned or expenses and realized and unrealized gains and losses are incurred.
3. Purchases and Sales of Securities:
Purchases and sales of securities (excluding securities maturing less than one year from acquisition) for the six months ended April 30, 2020, were as follows (amounts in thousands):
| | | Purchases
(excluding U.S.
Government
Securities) | | Sales
(excluding U.S.
Government
Securities) | | Purchases
of U.S.
Government
Securities | | Sales
U.S.
Government
Securities | |
Diversified Stock Fund | | $ | 154,602 | | | $ | 189,514 | | | $ | — | | | $ | — | | |
NewBridge Large Cap Growth Fund | | | 3,566 | | | | 6,094 | | | | — | | | | — | | |
Special Value Fund | | | 28,808 | | | | 35,445 | | | | — | | | | — | | |
Strategic Allocation Fund | | | 2,281 | | | | 3,852 | | | | — | | | | — | | |
INCORE Fund for Income | | | — | | | | — | | | | 171,402 | | | | 103,152 | | |
INCORE Investment Grade
Convertible Fund | | | 78,118 | | | | 44,167 | | | | — | | | | — | | |
4. Fees and Transactions with Affiliates and Related Parties:
Investment advisory services are provided to the Funds by Victory Capital Management Inc. ("VCM" or the "Adviser"), a New York corporation registered as an investment adviser with the Securities and Exchange Commission ("SEC"). The Adviser is a wholly owned indirect subsidiary of Victory Capital Holdings, Inc., a publicly traded Delaware Corporation and a wholly owned direct subsidiary of Victory Capital Operating, LLC.
Under the terms of the Investment Advisory Agreement, the Adviser is entitled to receive fees based on a percentage of the average daily net assets of each Fund. The rates at which the Adviser is paid by each Fund are included in the table below. The Adviser may use its resources to assist with the Funds' distribution and marketing expenses.
| | | Flat Rate | |
Strategic Allocation Fund | | | 0.10 | % | |
| | Tier Rate | |
Diversified Stock Fund | |
Up to $800 million | | | 0.65 | % | |
$800 million — $2.4 billion | | | 0.60 | % | |
Over $2.4 billion | | | 0.55 | % | |
NewBridge Large Cap Growth Fund | |
Up to $400 million | | | 0.75 | % | |
$400 million — $800 million | | | 0.65 | % | |
Over $800 million | | | 0.60 | % | |
Special Value Fund | |
Up to $400 million | | | 0.75 | % | |
$400 million — $800 million | | | 0.65 | % | |
Over $800 million | | | 0.60 | % | |
INCORE Fund for Income | |
Up to $400 million | | | 0.50 | % | |
$400 million — $800 million | | | 0.45 | % | |
Over $800 million | | | 0.40 | % | |
55
Victory Portfolios | | Notes to Financial Statements — continued
April 30, 2020 | |
(Unaudited)
| | Tier Rate | |
INCORE Investment Grade Convertible Fund | |
Up to $400 million | | | 0.75 | % | |
$400 million — $800 million | | | 0.65 | % | |
Over $800 million | | | 0.60 | % | |
VCM also serves as the Funds' administrator and fund accountant. Under an Administration and Fund Accounting Agreement, VCM is paid for its services an annual fee at a rate of 0.08% of the first $15 billion in average daily net assets of the Trust, Victory Variable Insurance Funds and Victory Portfolios II (collectively, the "Victory Funds Complex"), 0.05% of the average daily net assets above $15 billion to $30 billion of the Victory Funds Complex and 0.04% of the average daily net assets over $30 billion of the Victory Funds Complex.
Citi Fund Services Ohio, Inc. ("Citi"), an affiliate of Citibank, acts as sub-administrator and sub-fund accountant to the Funds pursuant to a Sub-Administration and Sub-Fund Accounting Services Agreement between VCM and Citi. VCM pays Citi a fee for providing these services. The Trust reimburses VCM and Citi for all of their reasonable out-of-pocket expenses incurred in providing these services.
FIS Investor Services, LLC ("FIS") serves as the Funds' transfer agent. Under the Transfer Agent Agreement, the Trust pays FIS a fee for its services and reimburses FIS for all of their reasonable out-of-pocket expenses incurred in providing these services.
The Chief Compliance Officer ("CCO") is an employee of the Adviser, which pays the compensation of the CCO and his support staff. The Trust has entered into an Agreement to provide compliance services with the Adviser, pursuant to which the Adviser furnishes its compliance personnel, including the services of the CCO, and other resources reasonably necessary to provide the Trust with compliance oversight services related to the design, administration and oversight of a compliance program for the Trust in accordance with Rule 38a-1 under the 1940 Act. The Funds in the Victory Funds Complex, in aggregate, compensate the Adviser for these services.
The Victory Funds Complex pays an annual retainer to each Independent Trustee, plus an additional annual retainer to the Chairman of the Board. The aggregate amount of the fees and expenses of the Independent Trustees are allocated amongst all the funds in the Victory Funds Complex and are presented on the Statements of Operations.
Sidley Austin LLP provides legal services to the Trust.
Victory Capital Advisers, Inc. (the "Distributor"), an affiliate of the Adviser, serves as distributor for the continuous offering of the shares of the Funds pursuant to a Distribution Agreement between the Distributor and the Trust. Effective on or about June 30, 2020, the Distributor's name will change to Victory Capital Services, Inc. Pursuant to the Distribution and Service Plans adopted in accordance with Rule 12b-1 under the 1940 Act, the Distributor may receive a monthly distribution and service fee, at an annual rate of up to 0.25% of the average daily net assets of Class A Shares, at an annual rate of up to 0.50% of the average daily net assets of Class R Shares of the Funds, except for INCORE Fund for Income, and 1.00% of the average daily net assets of Class C Shares of the Funds. The Distributor may receive a monthly distribution and service fee at an annual rate of up to 0.25% of the average daily net assets of Class R Shares of INCORE Fund for Income. The distribution and service fees paid to the Distributor may be used by the Distributor to pay for activities primarily intended to result in the sale of Class A, Class R or Class C Shares of the Funds.
In addition, the Distributor is entitled to receive commissions on sales of the Class A Shares of the Funds. For the six months ended April 30, 2020, the Distributor received approximately $25 thousand from commissions earned on sales of Class A Shares of the Funds.
The Adviser has entered into expense limitation agreements with certain Funds. Under the terms of the agreements, the Adviser has agreed to waive fees or reimburse certain expenses to the extent that ordinary operating expenses incurred by certain classes of a Fund in any fiscal year exceed the expense limit for such classes of the Fund. Such excess amounts will be the liability of the Adviser. Interest, taxes, brokerage commissions, other expenditures which are capitalized in accordance with GAAP, and
56
Victory Portfolios | | Notes to Financial Statements — continued
April 30, 2020 | |
(Unaudited)
other extraordinary expenses not incurred in the ordinary course of a Fund's business are excluded from the expense limits. As of April 30, 2020, the expense limits (excluding voluntary waivers) are as follows:
| | | In effect November 1, 2019 until February 28, 2021 | |
| | | Class A
Shares | | Class C
Shares | | Class I
Shares | | Class R
Shares | | Class R6
Shares | | Class Y
Shares | |
Diversified Stock Fund | | | N/A | | | | 2.02 | %(a) | | | 0.83 | %(a) | | | N/A | | | | 0.78 | % | | | 0.86 | % | |
NewBridge Large Cap
Growth Fund | | | 1.36 | % | | | 2.10 | % | | | 0.95 | % | | | N/A | | | | N/A | | | | 1.02 | % | |
Special Value Fund | | | N/A | | | | 2.20 | % | | | 1.15 | % | | | N/A | | | | N/A | | | | 1.10 | % | |
Strategic Allocation Fund | | | 0.40 | % | | | 1.15 | % | | | 0.15 | % | | | 0.65 | % | | | N/A | | | | N/A | | |
INCORE Fund for Income | | | 0.91 | % | | | 1.71 | % | | | 0.64 | % | | | 0.91 | % | | | 0.63 | % | | | 0.71 | % | |
INCORE Investment Grade
Convertible Fund | | | 1.39 | %(a) | | | N/A | | | | N/A | | | | N/A | | | | N/A | | | | N/A | | |
(a) In effect from March 1, 2020 until at least February 28, 2021
| | | Was in effect from November 1, 2019 until February 29, 2020 | |
| | | Class A
Shares | | Class C
Shares | | Class I
Shares | | Class R
Shares | | Class R6
Shares | | Class Y
Shares | |
Diversified Stock Fund | | | N/A | | | | N/A | | | | N/A | | | | N/A | | | | 0.78 | % | | | 0.86 | % | |
The Funds (except Strategic Allocation Fund) have agreed to repay fees and expenses that were waived or reimbursed by the Adviser for a period up to three fiscal years after such waiver or reimbursement was made to the extent such payments or repayments would not cause the expenses of a class to exceed the original expense limitation in place at time of the waiver or reimbursement or any expense limitation agreement in place at the time of repayment. As of November 11, 2010, the Strategic Allocation Fund is no longer subject to repaying waived or reimbursed fees to the Adviser. Amounts repaid to the Adviser during the six months ended April 30, 2020, if any, are reflected on the Statements of Operations as Recoupment of prior expenses waived/reimbursed by Adviser.
As of April 30, 2020, the following amounts are available to be repaid to the Adviser (amounts in thousands):
Fund | | Expires
10/31/20 | | Expires
10/31/21 | | Expires
10/31/22 | | Expires
10/31/23 | | Total | |
Diversified Stock Fund | | $ | 20 | | | $ | 27 | | | $ | 30 | | | $ | 18 | | | $ | 95 | | |
NewBridge Large Cap Growth Fund | | | 43 | | | | 64 | | | | 76 | | | | 33 | | | | 216 | | |
Special Value Fund | | | 12 | | | | 21 | | | | 33 | | | | 15 | | | | 81 | | |
INCORE Fund for Income | | | 8 | | | | 42 | | | | 86 | | | | 65 | | | | 201 | | |
The Adviser may voluntarily waive or reimburse additional fees to assist the Funds in maintaining competitive expense ratios. Voluntary waivers and reimbursements applicable to the Funds are not available to be recouped at a future time. For the six months ended April 30, 2020, the Adviser voluntarily waived the following amounts (in thousands):
Fund | | As of
4/30/20 | |
Special Value Fund | | $ | 25 | | |
Strategic Allocation Fund | | | 12 | | |
Certain officers and/or interested trustees of the Funds are also officers and/or employees of the Adviser, Administrator, Fund Accountant, Sub-Administrator, Sub-Fund Accountant, and Legal Counsel.
5. Risks:
Each Fund may be subject to other risks in addition to these identified risks.
An investment in the Funds' shares represents an indirect investment in the securities owned by the Funds, some of which will be traded on a national securities exchange or in the over-the-counter
57
Victory Portfolios | | Notes to Financial Statements — continued
April 30, 2020 | |
(Unaudited)
markets. The value of the securities in which the Funds invest, like other market investments, may move up or down, sometimes rapidly and unpredictably. The value of the securities in which the Funds invest may affect the value of the Funds' shares. An investment in the Funds' shares at any point in time may be worth less than the original investment, even after taking into account the reinvestment of the Funds' distributions.
The Funds will be subject to credit risk with respect to the amount each expects to receive from counterparties for financial instruments entered into by the Funds. The Funds may be negatively impacted if a counterparty becomes bankrupt or otherwise fails to perform its obligations due to financial difficulties. The Funds may experience significant delays in obtaining any recovery in bankruptcy or other reorganization proceeding and the Funds may obtain only limited recovery or may obtain no recovery in such circumstances. The Funds typically enter into transactions with counterparties whose credit ratings are investment grade, as determined by a nationally recognized statistical rating organization or, if unrated, judged by the Adviser to be of comparable quality.
The INCORE Fund for Income and the INCORE Investment Grade Convertible Bond Fund are subject to credit and interest rate risk with respect to fixed income securities. Credit risk refers to the ability of an issuer to make timely payments of interest and principal. Interest rates may rise or the rate of inflation may increase, impacting the value of investments in fixed income securities. A debt issuers' credit quality may be downgraded or an issuer may default. Interest rates may fluctuate due to changes in governmental fiscal policy initiatives and resulting market reaction to those initiatives.
6. Borrowing and Interfund Lending:
Line of Credit:
For the six months ended April 30, 2020, the Victory Funds Complex participated in a short-term demand note "Line of Credit" agreement with Citibank. Under the agreement with Citibank, prior to July 1, 2019, the Victory Funds Complex could borrow up to $250 million, of which $100 million was committed and $150 million was uncommitted. Effective July 1, 2019, the agreement was amended to include the USAA Mutual Funds Complex (another series of mutual funds managed by the Adviser) and has a new termination date of June 29, 2020. Under this amended agreement, the Victory Funds Complex and USAA Mutual Funds Complex, combined, may borrow up to $600 million, of which $300 million is committed and $300 million is uncommitted. $40 million of the Line of Credit is reserved for use by the Victory Floating Rate Fund (herein, the "Fund"), another series of the Victory Funds Complex, with that Fund paying the related commitment fees for that amount. The purpose of the agreement is to meet temporary or emergency cash needs. For the six months ended April 30, 2020, Citibank received an annual commitment fee of 0.15% on $300 million for providing the Line of Credit. For the six months ended April 30, 2020, Citibank earned approximately $225 thousand in commitment fees from the combined Victory Funds Complex and USAA Mutual Funds Complex. Each fund in the Victory Funds Complex pays a pro-rata portion of the commitment fees plus any interest (one month LIBOR plus one percent) on amounts borrowed. Interest charged to each Fund during the period, if applicable, is presented on the Statements of Operations under Line of credit fees.
The Funds did not utilize the Line of Credit during the six months ended April 30, 2020.
Interfund Lending:
The Trust and Adviser rely on an exemptive order granted by the SEC in March 2017 (the "Order"), permitting the establishment and operation of an Interfund Lending Facility (the "Facility"). The Facility allows each Fund to directly lend and borrow money to or from any other Victory Fund relying upon the Order at rates beneficial to both the borrowing and lending funds. Advances under the Facility are allowed for temporary or emergency purposes, including the meeting of redemption requests that otherwise might require the untimely disposition of securities, and are subject to each fund's borrowing restrictions. The interfund loan rate is determined, as specified in the Order, by averaging the current repurchase agreement rate and the current bank loan rate. As a Borrower, interest charged to each Fund during the period, if applicable, is presented on the Statements of Operations under Interfund
58
Victory Portfolios | | Notes to Financial Statements — continued
April 30, 2020 | |
(Unaudited)
lending fees. As a Lender, interest earned by each Fund during the period, if applicable, is presented on the Statements of Operations under Interfund lending income.
The Funds did not utilize the Interfund Lending during the six months ended April 30, 2020.
7. Federal Income Tax Information:
The tax character of distributions paid and the tax basis of current components of accumulated earnings (deficit) will be determined at the end of the current tax year ending October 31, 2020.
As of the most recent tax year ended October 31, 2019, the following Funds had net capital loss carryforwards as summarized in the table below (amounts in thousands):
| | | Short-Term
Amount | | Long-Term
Amount | | Total | |
INCORE Fund for Income | | $ | 102,634 | | | $ | 186,679 | | | $ | 289,313 | | |
8. Affiliated Securities:
An affiliated security is a security in which the Fund has ownership of at least 5% of the security's outstanding voting shares or an investment company managed by VCM. Transactions in affiliated securities during the six months ended April 30, 2020, were as follows (amounts in thousands):
| | Value
10/31/2019 | | Purchases
at Cost | | Proceeds
from
Sales | | Net
Realized
Gains
(Losses) | | Net
Realized
Gains
Distributions
from
Affiliated
Underlying
Funds | | Net
Change in
Unrealized
Appreciation/
Depreciation | | Value
4/30/2020 | | Dividend
Income | |
Strategic Allocation Fund | |
Victory INCORE Total
Return Bond Fund,
Class R6 | | $ | 3,151 | | | $ | 45 | | | $ | (48 | ) | | $ | 1 | | | $ | — | | | $ | 60 | | | $ | 3,209 | | | $ | 45 | | |
Victory Integrity
Discovery Fund,
Class Y | | | 929 | | | | — | | | | (76 | ) | | | (14 | ) | | | 20 | | | | (255 | ) | | | 604 | | | | — | | |
Victory Market
Neutral Income
Fund, Class I | | | 5,437 | | | | 74 | | | | (310 | ) | | | (1 | ) | | | — | | | | 90 | | | | 5,290 | | | | 74 | | |
Victory RS Global
Fund, Class Y | | | 7,443 | | | | 99 | | | | (857 | ) | | | 71 | | | | 5 | | | | (461 | ) | | | 6,300 | | | | 98 | | |
Victory RS Partners
Fund, Class Y | | | — | | | | 603 | | | | — | | | | — | | | | — | | | | 55 | | | | 658 | | | | — | | |
Victory Sophus
Emerging Markets
Small Cap Fund,
Class Y | | | 2,061 | | | | 20 | | | | (180 | ) | | | (113 | ) | | | 5 | | | | (290 | ) | | | 1,503 | | | | 20 | | |
Victory Trivalent
Emerging Markets
Small-Cap Fund,
Class Y | | | 1,968 | | | | 19 | | | | (145 | ) | | | (69 | ) | | | — | | | | (163 | ) | | | 1,610 | | | | 20 | | |
Victory Trivalent
International
Small-Cap Fund,
Class I | | | — | | | | 1,390 | | | | — | | | | — | | | | — | | | | 133 | | | | 1,523 | | | | — | | |
59
Victory Portfolios | | Notes to Financial Statements — continued
April 30, 2020 | |
(Unaudited)
| | Value
10/31/2019 | | Purchases
at Cost | | Proceeds
from
Sales | | Net
Realized
Gains
(Losses) | | Net
Realized
Gains
Distributions
from
Affiliated
Underlying
Funds | | Net
Change in
Unrealized
Appreciation/
Depreciation | | Value
4/30/2020 | | Dividend
Income | |
VictoryShares
International
Volatility Wtd ETF | | $ | 1,807 | | | $ | — | | | $ | (1,466 | ) | | $ | (60 | ) | | $ | — | | | $ | (281 | ) | | $ | — | | | $ | 14 | | |
VictoryShares
US Multi-Factor
Minimum
Volatility ETF | | | 1,802 | | | | — | | | | (151 | ) | | | 35 | | | | — | | | | (178 | ) | | | 1,508 | | | | 18 | | |
VictoryShares
US Small Cap
Volatility Wtd ETF | | | 889 | | | | — | | | | (618 | ) | | | (61 | ) | | | — | | | | (210 | ) | | | — | | | | 5 | | |
| | | $ | 25,487 | | | $ | 2,250 | | | $ | (3,851 | ) | | $ | (211 | ) | | $ | 30 | | | $ | (1,500 | ) | | $ | 22,205 | | | $ | 294 | | |
9. Fund Ownership:
Ownership of more than 25% of the voting securities of a fund creates presumptions of control of the fund, under section 2(a)(9) of the 1940 Act. As of April 30, 2020, the shareholders listed below held more than 25% of the shares outstanding of the Funds and may be deemed to control those Funds.
Fund | | Shareholder | | Percent | |
INCORE Investment Grade Convertible Fund | | Morgan Stanley Smith Barney LLC | | | 35.8 | % | |
Special Value Fund | | Talcott Resolution Life Insurance Co. | | | 34.4 | % | |
10. Liquidity Risk Management Program:
The Victory Funds have adopted and implemented a written liquidity risk management program (the "LRMP") as required by Rule 22e-4 under the Act. The LRMP is reasonably designed to assess and manage each Fund's liquidity risk, taking into consideration each Fund's investment strategy and the liquidity of its portfolio investments during normal and reasonably foreseeable stressed market conditions; its short and long-term cash flow projections; and its cash holdings and access to other liquidity management tools such as available funding sources including the Victory Funds Complex Interfund Lending Facility and Line of Credit (discussed in the Notes to Financial Statements). The Board approved the appointment of VCM as the administrator of the LRMP. At an in-person meeting held on February 20, 2020, VCM provided an oral and written report to the Trustees on the operation and effectiveness of the LRMP during the previous year.
VCM manages liquidity risks associated with the Funds' investments by monitoring, among other things, cash and cash equivalents, any use of derivatives, the concentration of investments, the appropriateness of each Fund's investment strategy, and by classifying every fund investment as either highly liquid, moderately liquid, less liquid or illiquid on at least a monthly basis. To assist with the classification of Fund investments, VCM has retained a third-party provider of liquidity evaluation services. This provider determines preliminary liquidity classifications for all portfolio holdings based upon portfolio-level data and certain assumptions provided by VCM. VCM reviews the preliminary liquidity classifications and, when appropriate, considers other information including input from the Funds' portfolio managers (including the portfolio managers employed by any investment sub-advisers) in determining final liquidity classifications.
The report from VCM concluded that the Funds did not experience any significant liquidity challenges during the covered period, and the Funds' LRMP is reasonably designed to assess and manage its liquidity risk. The report also concluded that the LRMP continues to operate adequately and effectively to enable VCM to oversee and manage liquidity risk and ensure each Fund is able to meet redemption
60
Victory Portfolios | | Notes to Financial Statements — continued
April 30, 2020 | |
(Unaudited)
requests without significant dilution to the remaining investors' interest in each Fund. During the review period, each Fund's portfolio consisted primarily of highly liquid investments, which are defined as cash and any investments reasonably expected to be converted to cash in current market conditions in three business days or less without significantly changing the market value of the investment. Therefore, the Fund has not adopted a Highly Liquid Investment Minimum. The Funds' investments were below the limitation on illiquid investments during the review period. Additionally, VCM indicated that no events occurred that would require the filing of Form N-LIQUID and recommended no material changes to the LRMP.
11. Reclassification Adjustment:
INCORE Fund for Income has restated certain elements of its 2018 financial statements resulting from the identification of a GAAP reclassification error for the Fund's paydown gain (loss) transactions. The Fund accounts for paydown gain (loss) on a tax basis, requiring a GAAP reclassification to its periodic financial statements. This GAAP reclassification was not applied to the Fund's 2018 annual financial statements, which resulted in net investment income being overstated. Certain amounts in the Financial Highlights were misstated; net investment income (loss) per share, net realized and unrealized gains (losses) per share and ratio of net investment income (loss) to average net assets. However, this reclassification had no impact on the Fund's net assets, NAV, performance, or taxable distributions paid and reported to shareholders for the fiscal and tax years ended 2018.
12. Subsequent Events:
An outbreak of respiratory disease called COVID-19 was first detected in China in December 2019 and subsequently spread internationally. The transmission of COVID-19 and efforts to contain its spread have resulted in international, national and local border closings and other significant travel restrictions and disruptions, significant disruptions to business operations, supply chains and consumer activity, significant challenges in healthcare service preparation and delivery, quarantines and general concern and uncertainty. These negative impacts have caused significant volatility and declines in global financial markets, which have caused losses for Fund investors during and subsequent to period end. The impact of the COVID-19 pandemic may be short term or may last for an extended period of time, and in either case could result in a substantial economic downturn or recession. Public health crises may exacerbate other pre-existing political, social, economic, market and financial risks. The extent of the impact to the financial performance of the Funds' investments will depend on future developments, including (i) the duration and spread of the outbreak, (ii) the restrictions and advisories, (iii) the effects on the financial markets, and (iv) the effects on the economy overall, all of which are highly uncertain and cannot be predicted.
61
Victory Portfolios | | Supplemental Information
April 30, 2020 | |
(Unaudited)
Proxy Voting and Portfolio Holdings Information
Proxy Voting:
Information regarding the policies and procedures each Fund uses to determine how to vote proxies relating to portfolio securities is available without charge, upon request, by calling 800-539-3863. The information is also included in the Funds' Statement of Additional Information, which is available on the SEC's website at www.sec.gov.
Information relating to how the Funds voted proxies relating to portfolio securities held during the most recent twelve months ended June 30 is available on the SEC's website at www.sec.gov.
Availability of Schedules of Portfolio Investments:
The Trust files a complete list of Schedules of Portfolio Investments with the SEC for the first and third quarter of each fiscal year on Form N-PORT. Forms N-PORT are available on the SEC's web site at www.sec.gov.
Expense Examples
As a shareholder of the Funds, you may incur two types of costs: (1) transaction costs, including sales charges (loads) on purchases; and (2) ongoing costs, including management fees, distribution and service (12b-1) fees and other Fund expenses. These examples are intended to help you understand your ongoing costs (in dollars) of investing in the Funds and to compare these costs with the ongoing costs of investing in other mutual funds.
These examples are based on an investment of $1,000 invested at the beginning of the period and held for the entire period from November 1, 2019 through April 30, 2020.
The Actual Expense figures in the table below provide information about actual account values and actual expenses. You may use the information below, together with the amount you invested, to estimate the expenses that you paid over the period. Simply divide your account value by $1,000 (for example, an $8,600 account value divided by $1,000 = 8.6), then multiply the result by the number in the table under the heading entitled "Actual Expenses Paid During Period" to estimate the expenses you paid on your account during this period.
The Hypothetical Expense figures in the table below provide information about hypothetical account values and hypothetical expenses based on each Fund's actual expense ratio and an assumed rate of return of 5% per year before expenses, which is not the Fund's actual return. The hypothetical account values and expenses may not be used to estimate the actual ending account balance or expenses you paid for the period. You may use this information to compare this 5% hypothetical example with the 5% hypothetical examples that appear in shareholder reports of other funds.
Please note the expenses shown in the table are meant to highlight your ongoing costs only and do not reflect any transactional costs. Therefore, the table is useful in comparing ongoing costs only, and will not help you determine the relative total costs of owning different funds. In addition, if these transactional costs were included, your costs would have been higher.
62
Victory Portfolios | | Supplemental Information — continued
April 30, 2020 | |
(Unaudited)
| | | Beginning
Account
Value
11/1/19 | | Actual
Ending
Account
Value
4/30/20 | | Hypothetical
Ending
Account
Value
4/30/20 | | Actual
Expenses
Paid
During
Period
11/1/19-
4/30/20* | | Hypothetical
Expenses
Paid
During
Period
11/1/19-
4/30/20* | | Annualized
Expense
Ratio
During
Period
11/1/19-
4/30/20 | |
Diversified Stock Fund | |
Class A Shares | | $ | 1,000.00 | | | $ | 909.60 | | | $ | 1,019.44 | | | $ | 5.18 | | | $ | 5.47 | | | | 1.09 | % | |
Class C Shares | | | 1,000.00 | | | | 904.70 | | | | 1,014.52 | | | | 9.85 | | | | 10.42 | | | | 2.08 | % | |
Class I Shares | | | 1,000.00 | | | | 910.50 | | | | 1,020.69 | | | | 3.99 | | | | 4.22 | | | | 0.84 | % | |
Class R Shares | | | 1,000.00 | | | | 908.20 | | | | 1,018.05 | | | | 6.50 | | | | 6.87 | | | | 1.37 | % | |
Class R6 Shares | | | 1,000.00 | | | | 910.80 | | | | 1,020.98 | | | | 3.71 | | | | 3.92 | | | | 0.78 | % | |
Class Y Shares | | | 1,000.00 | | | | 910.10 | | | | 1,020.59 | | | | 4.08 | | | | 4.32 | | | | 0.86 | % | |
NewBridge Large Cap Growth Fund | |
Class A Shares | | | 1,000.00 | | | | 1,126.10 | | | | 1,018.10 | | | | 7.19 | | | | 6.82 | | | | 1.36 | % | |
Class C Shares | | | 1,000.00 | | | | 1,120.60 | | | | 1,014.42 | | | | 11.07 | | | | 10.52 | | | | 2.10 | % | |
Class I Shares | | | 1,000.00 | | | | 1,126.60 | | | | 1,020.14 | | | | 5.02 | | | | 4.77 | | | | 0.95 | % | |
Class Y Shares | | | 1,000.00 | | | | 1,125.60 | | | | 1,019.79 | | | | 5.39 | | | | 5.12 | | | | 1.02 | % | |
Special Value Fund | |
Class A Shares | | | 1,000.00 | | | | 908.40 | | | | 1,018.75 | | | | 5.84 | | | | 6.17 | | | | 1.23 | % | |
Class C Shares | | | 1,000.00 | | | | 904.50 | | | | 1,014.42 | | | | 9.94 | | | | 10.52 | | | | 2.10 | % | |
Class I Shares | | | 1,000.00 | | | | 908.90 | | | | 1,019.64 | | | | 4.98 | | | | 5.27 | | | | 1.05 | % | |
Class R Shares | | | 1,000.00 | | | | 906.50 | | | | 1,017.16 | | | | 7.35 | | | | 7.77 | | | | 1.55 | % | |
Class Y Shares | | | 1,000.00 | | | | 909.30 | | | | 1,019.89 | | | | 4.75 | | | | 5.02 | | | | 1.00 | % | |
Strategic Allocation Fund | |
Class A Shares | | | 1,000.00 | | | | 942.00 | | | | 1,022.87 | | | | 1.93 | | | | 2.01 | | | | 0.40 | % | |
Class C Shares | | | 1,000.00 | | | | 938.30 | | | | 1,019.14 | | | | 5.54 | | | | 5.77 | | | | 1.15 | % | |
Class I Shares | | | 1,000.00 | | | | 942.90 | | | | 1,024.12 | | | | 0.72 | | | | 0.75 | | | | 0.15 | % | |
Class R Shares | | | 1,000.00 | | | | 941.30 | | | | 1,021.63 | | | | 3.14 | | | | 3.27 | | | | 0.65 | % | |
INCORE Fund for Income | |
Class A Shares | | | 1,000.00 | | | | 1,029.10 | | | | 1,020.34 | | | | 4.59 | | | | 4.57 | | | | 0.91 | % | |
Class C Shares | | | 1,000.00 | | | | 1,025.50 | | | | 1,016.36 | | | | 8.61 | | | | 8.57 | | | | 1.71 | % | |
Class I Shares | | | 1,000.00 | | | | 1,031.60 | | | | 1,021.68 | | | | 3.23 | | | | 3.22 | | | | 0.64 | % | |
Class R Shares | | | 1,000.00 | | | | 1,030.20 | | | | 1,020.34 | | | | 4.59 | | | | 4.57 | | | | 0.91 | % | |
Class R6 Shares | | | 1,000.00 | | | | 1,031.70 | | | | 1,021.83 | | | | 3.08 | | | | 3.07 | | | | 0.61 | % | |
Class Y Shares | | | 1,000.00 | | | | 1,030.00 | | | | 1,021.33 | | | | 3.58 | | | | 3.57 | | | | 0.71 | % | |
INCORE Investment Grade Convertible Fund | |
Class A Shares | | | 1,000.00 | | | | 948.60 | | | | 1,018.10 | | | | 6.59 | | | | 6.82 | | | | 1.36 | % | |
Class I Shares | | | 1,000.00 | | | | 950.10 | | | | 1,020.14 | | | | 4.61 | | | | 4.77 | | | | 0.95 | % | |
* Expenses are equal to the average account value multiplied by the Fund's annualized expense ratio multiplied by 182/366 (the number of days in the most recent fiscal half-year divided by the number of days in the fiscal year).
63
Victory Portfolios | | Supplemental Information — continued
April 30, 2020 | |
(Unaudited)
Considerations of the Board in Continuing the Investment Advisory Agreement (the "Agreement")
The Board approved the Agreement on behalf of each of the Funds at an in-person meeting, which was called for that purpose, on December 4, 2019. The Board also considered information relating to the Funds and the Agreement provided throughout the year and, more specifically, at a meeting on October 22, 2019. In considering whether to approve the Agreement, the Board requested, and the Adviser provided, information that the Board believed to be reasonably necessary to reach its conclusions.
The Board, including the Independent Trustees, evaluated this information along with other information obtained throughout the year and was advised by legal counsel to the Funds, which also serves as independent legal counsel to the Independent Trustees. In addition, in 2017 the Independent Trustees, through their counsel, retained an independent consultant to assist with a review of the overall process for conducting the annual review of these advisory arrangements.
The Board considered each Fund's advisory fee, expense ratio and investment performance as significant factors in determining whether the Agreement should be continued. In considering whether the compensation paid to the Adviser was fair and reasonable, the Board also evaluated, among other things, the following factors:
• The requirements of the Funds for the services provided by the Adviser;
• The nature, quality and extent of the services provided and expected to be provided;
• The performance of the Funds as compared to comparable funds;
• The fees payable for the services and whether the fee arrangements provided for economies of scale that would benefit Fund shareholders as the Funds grow;
• Whether the fee would be sufficient to enable the Adviser to attract and retain experienced personnel and continue to provide quality services to the Funds;
• The fees paid by other clients of the Adviser whose accounts are managed in a similar investment style and any differences in the services provided to the other clients compared to those provided to the Funds;
• The total expenses of each Fund, taking into consideration any distribution or shareholder servicing fees;
• Management's commitment to operating the Funds at competitive expense levels;
• The profitability of the Adviser (as reflected by comparing fees earned against an estimate of the Adviser's costs) with respect to the Adviser's relationship with the Funds;
• Research and other service benefits received by the Adviser obtained through payment of client commissions for securities transactions;
• Other indirect benefits received by the Adviser, and its affiliates, including revenues paid to the Adviser, or its affiliates, by the Funds for administration and fund accounting services, and distribution;
• The capabilities and financial condition of the Adviser;
• Current economic and industry trends; and
• The historical relationship between each Fund and the Adviser.
The Board reviewed each Fund's current management fee, comprised of the advisory fee plus the administrative services fee paid to the Adviser, in the context of the Adviser's profitability with respect to each Fund individually. In addition, the Board compared each Fund's gross management fees and total operating expense ratio on a net and gross basis, taking into consideration any distribution or shareholder servicing fees, with the median gross management fee and median expense ratio of a universe of comparable mutual funds compiled by an independent consultant and a peer group of funds with similar investment strategies selected by that independent consultant from the universe. The Board reviewed the factors and methodology used by the independent consultant in the selection of each Fund's peer group, including the independent consultant's selection of a broad universe of funds, the more specific universe of comparable funds, and peer groups of funds with comparable investment strategies and asset levels, among other factors. The Board also reviewed any changes to the independent consultant's methodology as compared to the prior year, including those resulting from the Adviser's input, if any. With respect to certain Funds, the Board also reviewed fees and other information related
64
Victory Portfolios | | Supplemental Information — continued
April 30, 2020 | |
(Unaudited)
to the Adviser's management of similarly managed institutional or private accounts, and the differences in the services provided to these other accounts. The Board also noted that the breakpoints in the advisory fee schedule for some of the Funds evidenced one way in which the Adviser has shown a willingness to share in its economies of scale.
The Board found that the gross annual management fee paid by each Fund was within the range of management fees paid by each Fund's respective peer group. The Board noted that, except for the Strategic Allocation Fund, each Fund's advisory fee structure contained at least one breakpoint. The Board also noted that the Adviser contractually agreed to waive the advisory fee payable by the Strategic Allocation Fund through February 28, 2020. The Board also found that each Fund's Class A net annual expense ratio, taking into account any shareholder servicing or distribution fees, was reasonable as compared with each Fund's respective peer group. The Board considered the Adviser's contractual agreement with each Fund to waive its fees and reimburse expenses of certain classes for a specified period of time, as described in the Fund's prospectus.
The Board reviewed each Fund's performance over one-, three-, five- and ten-year periods (as applicable) against the performance of the Fund's selected peer group and benchmark index. The Board recognized that the performance of the Funds and the peer group funds are net of expenses, while the performance of the benchmark index reflects gross returns. The Board considered the additional resources that the Adviser has committed to enhance portfolio analysis, compliance and trading systems.
The Board reviewed various other specific factors with respect to each Fund, as described below. In their deliberations, the Trustees did not rank the importance of any particular information or factor considered and each Trustee may have attributed different weights to various factors.
Victory Diversified Stock Fund:
The Board compared the Fund's Class A performance for the one-, three-, five- and ten-year periods ended June 30, 2019, to that of the median performance of the peer group and benchmark index for the same periods and considered the fact that the Fund underperformed both the benchmark index and the peer group median for all of the periods reviewed. The Board noted that the Fund's portfolio management team changed in May 2017. The Board discussed the Fund's investment strategy, the Adviser's implementation of the strategy, and related market conditions, together with relevant fee and expense considerations. The Board also discussed the steps that had been or could be taken by the Adviser to enhance performance in the future, and the Board's continued monitoring of the Fund's performance.
Having considered, among other things: (1) the Fund's management fee compared to comparable mutual funds; (2) the Fund's total expense ratio compared to comparable mutual funds; (3) that the Adviser's willingness to limit the expenses of certain classes for a period of time would provide stability to the Fund's expenses for those share classes during that period; and (4) the Fund's performance during the periods reviewed, the Board concluded that the Agreement continued to be in the best interests of the Fund's shareholders.
NewBridge Large Cap Growth Fund:
The Board compared the Fund's Class A performance for the one-, three-, five- and ten-year periods ended June 30, 2019, to that of the median performance of the peer group and benchmark index for the same periods and considered the fact that the Fund underperformed both the benchmark index and the peer group median for all of the periods reviewed. The Adviser discussed the Fund's performance in the context of the Fund's investment strategy. The Board discussed the Fund's investment strategy, the Adviser's implementation of the strategy, and related market conditions, together with relevant fee and expense considerations. The Board also discussed the steps that had been or could be taken by the Adviser to enhance performance in the future, and the Board's continued monitoring of the Fund's performance.
Having considered, among other things: (1) the Fund's management fee compared to comparable mutual funds; (2) the Fund's total expense ratio compared to comparable mutual funds; (3) that the Adviser's willingness to limit the expenses of certain classes for a period of time would provide stability to the Fund's expenses for those share classes during that period; and (4) the Fund's performance during the periods reviewed, the Board concluded that the Agreement continued to be in the best interests of the Fund's shareholders.
65
Victory Portfolios | | Supplemental Information — continued
April 30, 2020 | |
(Unaudited)
Special Value Fund:
The Board compared the Fund's Class A performance for the one-, three-, five- and ten-year periods ended June 30, 2019, to that of the median performance of the peer group and benchmark index for the same periods and considered the fact that the Fund underperformed both the benchmark index and the peer group median for all of the periods reviewed. The Board noted that the Fund's portfolio management team changed in May 2017. The Board discussed the Fund's investment strategy, the Adviser's implementation of the strategy, and related market conditions, together with relevant fee and expense considerations. The Board also discussed the steps that had been or could be taken by the Adviser to enhance performance in the future, and the Board's continued monitoring of the Fund's performance.
Having considered, among other things: (1) the Fund's management fee compared to comparable mutual funds; (2) the Fund's total expense ratio compared to comparable mutual funds; (3) that one way the Adviser is addressing the Fund's underperformance is through its change of the Fund's portfolio management team; (4) that the Adviser's willingness to limit the expenses of certain classes for a period of time would provide stability to the Fund's expenses for those share classes during that period; and (5) the Fund's performance during the periods reviewed, the Board concluded that the Agreement continued to be in the best interests of the Fund's shareholders.
Strategic Allocation Fund:
The Board compared the Fund's Class A performance for the one-, three-, five- and ten-year periods ended June 30, 2019, to that of the median performance of the peer group and benchmark index for the same periods and considered the fact that the Fund underperformed the benchmark index for all of the periods reviewed, and outperformed the peer group median for all of the periods reviewed. The Board noted that the Fund changed its investment strategy and its benchmark index in December 2015. The Board brought the Fund's underperformance as compared to its benchmark index to management's attention and discussed with the Adviser the Fund's benchmark index.
Having considered, among other things: (1) the Fund's management fee compared to comparable mutual funds; (2) the Fund's total expense ratio compared to comparable mutual funds; (3) that the Adviser's willingness to limit the expenses of certain classes for a period of time would provide stability to the Fund's expenses for those share classes during that period; and (4) the Fund's performance during the periods reviewed, the Board concluded that the Agreement continued to be in the best interests of the Fund's shareholders.
INCORE Fund for Income:
The Board compared the Fund's Class A performance for the one-, three-, five- and ten-year periods ended June 30, 2019, to that of the median performance of the peer group and benchmark index for the same periods and considered the fact that the Fund outperformed both the benchmark index and the peer group median for the five- and ten-year periods, underperformed both the benchmark index and the peer group median for the three-year period, outperformed the peer group median for the one-year period, and underperformed the benchmark index for the one-year period. The Board discussed with the Adviser how market conditions affected the Fund during periods of underperformance given the Fund's investment strategy and fee and expense profile.
Having considered, among other things: (1) the Fund's management fee compared to comparable mutual funds; (2) the Fund's total expense ratio compared to comparable mutual funds; (3) that the Adviser's willingness to limit the expenses of certain classes for a period of time would provide stability to the Fund's expenses for those share classes during that period; and (4) the Fund's performance during the periods reviewed, the Board concluded that the Agreement continued to be in the best interests of the Fund's shareholders.
INCORE Investment Grade Convertible Fund:
The Board compared the Fund's Class A performance for the one-, three-, five- and ten-year periods ended June 30, 2019, to that of the median performance of the peer group and benchmark index for the same periods and considered the fact that the Fund outperformed both the benchmark index and the peer group median for the one-year period, underperformed both the benchmark index and the peer group median for the three- and ten-year periods, underperformed the benchmark index for the five-year period and outperformed the peer
66
Victory Portfolios | | Supplemental Information — continued
April 30, 2020 | |
(Unaudited)
group median for the five-year period. The Board noted that the Fund changed its benchmark index in August 2017.
Having considered, among other things: (1) the Fund's management fee compared to comparable mutual funds; (2) the Fund's total expense ratio compared to comparable mutual funds; (3) that the Adviser's willingness to limit the expenses of certain classes for a period of time would provide stability to the Fund's expenses for those share classes during that period; and (4) the Fund's performance during the periods reviewed, the Board concluded that the Agreement continued to be in the best interests of the Fund's shareholders.
Conclusion
Based on its review of the information requested and provided, and following extended discussions, the Board determined that the Agreement, on behalf of the Funds discussed above, was consistent with the best interests of each Fund and its shareholders, and the Board unanimously approved the Agreement, on behalf of each Fund, for an additional annual period on the basis of the foregoing review and discussions and the following considerations, among others:
• The fairness and reasonableness of the investment advisory fee payable to the Adviser under the Agreement in light of the investment advisory services provided, the costs of these services, the profitability of the Adviser's relationship with the Fund and the comparability of the fee paid to the fees paid by other investment companies;
• The nature, quality and extent of the investment advisory services provided by the Adviser;
• The Adviser's entrepreneurial commitment to the management of the Funds and the creation of a broad-based family of funds, which could entail a substantial commitment of the Adviser's resources to the successful operation of the Funds;
• The Adviser's representations regarding its staffing and capabilities to manage the Funds, including the retention of personnel with relevant portfolio management experience;
• The Adviser's efforts to enhance investment results by, among other things, developing quality portfolio management teams; and
• The overall high quality of the personnel, operations, financial condition, investment management capabilities, methodologies and performance of the Adviser.
67
Privacy Policy
Protecting the Privacy of Information
The Trust respects your right to privacy. We also know that you expect us to conduct and process your business in an accurate and efficient manner. To do so, we must collect and maintain certain personal information about you. This is the information we collect from you on applications or other forms, and from the transactions you make with us or third parties. It may include your name, address, social security number, account transactions and balances, and information about investment goals and risk tolerance.
We do not disclose any information about you or about former customers to anyone except as permitted or required by law. Specifically, we may disclose the information we collect to companies that perform services on our behalf, such as the transfer agent that processes shareholder accounts and printers and mailers that assist us in the distribution of investor materials. We may also disclose this information to companies that perform marketing services on our behalf. This allows us to continue to offer you Victory investment products and services that meet your investing needs, and to effect transactions that you request or authorize. These companies will use this information only in connection with the services for which we hired them. They are not permitted to use or share this information for any other purpose.
To protect your personal information internally, we permit access only by authorized employees and maintain physical, electronic and procedural safeguards to guard your personal information.*
* You may have received communications regarding information about privacy policies from other financial institutions which gave you the opportunity to "opt-out" of certain information sharing with companies which are not affiliated with that financial institution. The Trust does not share information with other companies for purposes of marketing solicitations for products other than the Trust. Therefore, the Trust does not provide opt-out options to their shareholders.
Victory Funds
P.O. Box 182593
Columbus, Ohio 43218-2593

Visit our website at: | | Call Victory at: | |
www.vcm.com | | 800-539-FUND (800-539-3863) | |

April 30, 2020
Semi Annual Report
Victory Sycamore Established Value Fund
Victory Sycamore Small Company Opportunity Fund
Beginning January 1, 2021, as permitted by regulations adopted by the Securities and Exchange Commission, paper copies of the Victory Funds' shareholder reports will no longer be sent by mail, unless you specifically request paper copies of the reports from the Victory Funds or from your financial intermediary, such as a broker-dealer or bank. Instead, the reports will be made available on www.VictoryFunds.com, and you will be notified by mail each time a report is posted and provided with a website link to access the report.
If you already elected to receive shareholder reports electronically, you will not be affected by this change and you need not take any action. You may elect to receive shareholder reports and other communications from the Victory Funds or your financial intermediary electronically by notifying your financial intermediary directly or, if you are a direct investor, by calling 800-539-3863 or by sending an e-mail request to TA.Processing@FISGlobal.com.
You may elect to receive all future reports in paper free of charge. If you invest through a financial intermediary, you can contact your financial intermediary to request that you continue to receive paper copies of your reports. If you invest directly with the Victory Funds, you can call 800-539-3863 or send an e-mail request to TA.Processing@FISGlobal.com. Your election to receive reports in paper will apply to all Victory Funds you hold directly or through your financial intermediary.
www.vcm.com
News, Information And Education 24 Hours A Day, 7 Days A Week
The Victory Funds site gives fund shareholders, prospective shareholders, and investment professionals a convenient way to access fund information, get guidance, and track fund performance anywhere they can access the Internet. The site includes:
• Detailed performance records
• Daily share prices
• The latest fund news
• Investment resources to help you become a better investor
• A section dedicated to investment professionals
Whether you're a potential investor searching for the fund that matches your investment philosophy, a seasoned investor interested in planning tools, or an investment professional, www.vcm.com has what you seek. Visit us anytime. We're always open.
Victory Portfolios
Table of Contents
Financial Statements | | | |
Victory Sycamore Established Value Fund | |
Investment Objectives & Portfolio Holdings | | | 4 | | |
Schedule of Portfolio Investments | | | 5 | | |
Statements of Assets and Liabilities | | | 12-13 | | |
Statements of Operations | | | 14 | | |
Statements of Changes in Net Assets | | | 15-17 | | |
Financial Highlights | | | 18-21 | | |
Victory Sycamore Small Company Opportunity Fund | |
Investment Objectives & Portfolio Holdings | | | 4 | | |
Schedule of Portfolio Investments | | | 8 | | |
Statements of Assets and Liabilities | | | 12-13 | | |
Statements of Operations | | | 14 | | |
Statements of Changes in Net Assets | | | 15-17 | | |
Financial Highlights | | | 22-23 | | |
Notes to Financial Statements | | | 24 | | |
Supplemental Information | |
Proxy Voting and Portfolio Holdings Information | | | 33 | | |
Expense Examples | | | 33 | | |
Considerations of the Board in Continuing the
Investment Advisory Agreement | | | 35 | | |
Privacy Policy (inside back cover) | | | |
1
The Funds are distributed by Victory Capital Services, Inc. Victory Capital Management Inc. is the investment adviser to the Funds and receives fees from the Funds for performing services for the Funds.
This report is not authorized for distribution to prospective investors unless preceded or accompanied by a current prospectus of the Victory Funds.
For additional information about any Victory Fund, including fees, expenses, and risks, view our prospectus online at vcm.com or call 800-539-3863. Read it carefully before you invest or send money.
The information in this semi annual report is based on data obtained from recognized services and sources and is believed to be reliable. Any opinions, projections, or recommendations in this report are subject to change without notice and are not intended as individual investment advice. Past investment performance of the Funds, markets or securities mentioned herein should not be considered to be indicative of future results.
• NOT FDIC INSURED • NO BANK GUARANTEE • MAY LOSE VALUE

Call Victory at:
800-539-FUND (800-539-3863)
Visit our website at:
www.vcm.com
2
This page is intentionally left blank.
3
Victory Portfolios | | April 30, 2020 | |
(Unaudited)
Investment Objectives & Portfolio Holdings:
Sycamore Established Value Fund
Seeks to provide long-term capital growth. | |
Portfolio Holdings
As a Percentage of Total Investments

Sycamore Small Company Opportunity Fund
Seeks to provide capital appreciation. | |
Portfolio Holdings
As a Percentage of Total Investments
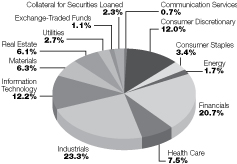
4
Victory Portfolios
Victory Sycamore Established Value Fund | | Schedule of Portfolio Investments
April 30, 2020 | |
(Amounts in Thousands, Except for Shares) (Unaudited)
Security Description | | Shares | | Value | |
Common Stocks (97.4%) | |
Communication Services (2.3%): | |
Cinemark Holdings, Inc. (a) | | | 3,674,300 | | | $ | 52,469 | | |
The Interpublic Group of Cos., Inc. (a) | | | 7,200,000 | | | | 122,256 | | |
ViacomCBS, Inc., Class B (a) | | | 3,041,000 | | | | 52,488 | | |
| | | | 227,213 | | |
Consumer Discretionary (9.4%): | |
Aptiv PLC | | | 738,100 | | | | 51,335 | | |
BorgWarner, Inc. (a) | | | 5,775,000 | | | | 164,992 | | |
Carter's, Inc. | | | 1,062,700 | | | | 83,103 | | |
Darden Restaurants, Inc. | | | 2,613,675 | | | | 192,862 | | |
Las Vegas Sands Corp. | | | 1,475,000 | | | | 70,830 | | |
Marriott International, Inc., Class A (a) | | | 1,300,000 | | | | 118,222 | | |
Mohawk Industries, Inc. (a) (b) | | | 946,600 | | | | 83,036 | | |
Yum! Brands, Inc. | | | 1,865,000 | | | | 161,192 | | |
| | | | 925,572 | | |
Consumer Staples (7.4%): | |
Archer-Daniels-Midland Co. | | | 6,520,200 | | | | 242,160 | | |
Hormel Foods Corp. (a) | | | 1,786,275 | | | | 83,687 | | |
Kimberly-Clark Corp. | | | 36,675 | | | | 5,079 | | |
Sysco Corp. | | | 2,800,000 | | | | 157,556 | | |
The Kroger Co. | | | 4,664,500 | | | | 147,445 | | |
Tyson Foods, Inc., Class A | | | 1,475,000 | | | | 91,730 | | |
| | | | 727,657 | | |
Energy (3.6%): | |
Cimarex Energy Co. | | | 3,208,800 | | | | 81,568 | | |
Devon Energy Corp. | | | 6,400,000 | | | | 79,808 | | |
Parsley Energy, Inc., Class A | | | 6,233,500 | | | | 58,907 | | |
Valero Energy Corp. | | | 2,040,000 | | | | 129,233 | | |
| | | | 349,516 | | |
Financials (16.9%): | |
Aflac, Inc. | | | 3,490,000 | | | | 129,968 | | |
Alleghany Corp. | | | 390,000 | | | | 208,146 | | |
American Financial Group, Inc. | | | 2,200,000 | | | | 145,728 | | |
Arthur J. Gallagher & Co. | | | 1,210,100 | | | | 94,993 | | |
E*TRADE Financial Corp. | | | 3,417,600 | | | | 138,789 | | |
Everest Re Group Ltd. | | | 791,000 | | | | 136,946 | | |
Old Republic International Corp. | | | 5,900,000 | | | | 94,105 | | |
Prosperity Bancshares, Inc. (a) | | | 2,844,999 | | | | 170,500 | | |
TCF Financial Corp. | | | 3,811,000 | | | | 113,149 | | |
The Allstate Corp. | | | 1,693,925 | | | | 172,306 | | |
W.R. Berkley Corp. | | | 2,050,000 | | | | 110,700 | | |
Zions Bancorp NA (a) | | | 4,700,000 | | | | 148,567 | | |
| | | | 1,663,897 | | |
Health Care (7.2%): | |
AmerisourceBergen Corp. (a) | | | 1,353,000 | | | | 121,310 | | |
Hill-Rom Holdings, Inc. | | | 1,202,100 | | | | 135,224 | | |
See notes to financial statements.
5
Victory Portfolios
Victory Sycamore Established Value Fund | | Schedule of Portfolio Investments — continued
April 30, 2020 | |
(Amounts in Thousands, Except for Shares) (Unaudited)
Security Description | | Shares | | Value | |
Molina Healthcare, Inc. (b) | | | 829,900 | | | $ | 136,079 | | |
QIAGEN NV (b) | | | 2,481,800 | | | | 103,466 | | |
Quest Diagnostics, Inc. | | | 1,875,300 | | | | 206,489 | | |
| | | | 702,568 | | |
Industrials (14.5%): | |
AGCO Corp. (a) | | | 2,935,000 | | | | 155,086 | | |
Alaska Air Group, Inc. | | | 2,604,400 | | | | 84,695 | | |
Hubbell, Inc. | | | 865,000 | | | | 107,632 | | |
JB Hunt Transport Services, Inc. | | | 1,489,300 | | | | 150,598 | | |
Landstar System, Inc. (a) | | | 1,883,800 | | | | 194,615 | | |
ManpowerGroup, Inc. | | | 2,007,800 | | | | 149,059 | | |
Owens Corning, Inc. (a) | | | 3,100,000 | | | | 134,416 | | |
Parker-Hannifin Corp. | | | 930,000 | | | | 147,052 | | |
Republic Services, Inc. | | | 1,166,000 | | | | 91,344 | | |
Textron, Inc. | | | 5,345,000 | | | | 140,894 | | |
Xylem, Inc. | | | 975,000 | | | | 70,103 | | |
| | | | 1,425,494 | | |
Information Technology (15.0%): | |
Amphenol Corp., Class A | | | 560,000 | | | | 49,426 | | |
Coherent, Inc. (b) | | | 1,150,000 | | | | 147,051 | | |
DXC Technology Co. | | | 2,748,793 | | | | 49,836 | | |
Flex Ltd. (a) (b) | | | 16,200,000 | | | | 158,111 | | |
Genpact Ltd. | | | 4,100,000 | | | | 141,163 | | |
Hewlett Packard Enterprises Co. (a) | | | 9,089,000 | | | | 91,435 | | |
KLA Corp. | | | 495,000 | | | | 81,225 | | |
Leidos Holdings, Inc. | | | 1,435,500 | | | | 141,842 | | |
MAXIMUS, Inc. | | | 2,390,650 | | | | 160,938 | | |
Motorola Solutions, Inc. | | | 845,300 | | | | 121,563 | | |
Nuance Communications, Inc. (b) | | | 8,031,000 | | | | 162,226 | | |
Skyworks Solutions, Inc. | | | 1,178,000 | | | | 122,370 | | |
Zebra Technologies Corp. (b) | | | 203,000 | | | | 46,621 | | |
| | | | 1,473,807 | | |
Materials (10.2%): | |
AptarGroup, Inc. | | | 1,135,300 | | | | 121,568 | | |
Avery Dennison Corp. | | | 1,510,000 | | | | 166,689 | | |
Eastman Chemical Co. | | | 2,925,000 | | | | 176,991 | | |
Packaging Corp. of America | | | 1,195,000 | | | | 115,497 | | |
Reliance Steel & Aluminum Co. | | | 1,810,000 | | | | 162,140 | | |
Steel Dynamics, Inc. | | | 5,300,000 | | | | 128,631 | | |
Westlake Chemical Corp. (a) | | | 2,950,000 | | | | 128,178 | | |
| | | | 999,694 | | |
Real Estate (7.8%): | |
American Homes 4 Rent, Class A (a) | | | 2,775,000 | | | | 66,989 | | |
Healthcare Trust of America, Inc., Class A | | | 4,904,500 | | | | 120,798 | | |
Highwoods Properties, Inc. | | | 4,600,000 | | | | 178,525 | | |
Lamar Advertising Co., Class A (a) | | | 2,880,000 | | | | 166,032 | | |
National Retail Properties, Inc. | | | 3,450,000 | | | | 112,608 | | |
Public Storage | | | 643,800 | | | | 119,393 | | |
| | | | 764,345 | | |
See notes to financial statements.
6
Victory Portfolios
Victory Sycamore Established Value Fund | | Schedule of Portfolio Investments — continued
April 30, 2020 | |
(Amounts in Thousands, Except for Shares) (Unaudited)
Security Description | | Shares | | Value | |
Utilities (3.1%): | |
Alliant Energy Corp. (a) | | | 2,724,100 | | | $ | 132,255 | | |
DTE Energy Co. | | | 407,575 | | | | 42,282 | | |
Xcel Energy, Inc. | | | 2,068,975 | | | | 131,504 | | |
| | | | 306,041 | | |
Total Common Stocks (Cost $10,447,438) | | | 9,565,804 | | |
Exchange-Traded Funds (1.4%) | |
iShares Russell Mid-Cap Value ETF (a) | | | 1,896,800 | | | | 137,784 | | |
Total Exchange-Traded Funds (Cost $133,210) | | | 137,784 | | |
Collateral for Securities Loaned^ (1.1%) | |
BlackRock Liquidity Funds TempFund, Institutional Class, 0.61% (c) | | | 1,954,396 | | | | 1,954 | | |
Fidelity Investments Money Market Government Portfolio,
Institutional Class, 0.18% (c) | | | 44,751,868 | | | | 44,752 | | |
Fidelity Investments Money Market Prime Money Market Portfolio,
Institutional Class, 0.47% (c) | | | 974,917 | | | | 975 | | |
Goldman Sachs Financial Square Prime Obligations Fund,
Institutional Class, 0.67% (c) | | | 13,590,822 | | | | 13,591 | | |
JPMorgan Prime Money Market Fund, Capital Class, 0.68% (c) | | | 7,777,058 | | | | 7,777 | | |
Morgan Stanley Institutional Liquidity Prime Portfolio,
Institutional Class, 0.72% (c) | | | 34,967,169 | | | | 34,967 | | |
Total Collateral for Securities Loaned (Cost $104,016) | | | 104,016 | | |
Total Investments (Cost $10,684,664) — 99.9% | | | 9,807,604 | | |
Other assets in excess of liabilities — 0.1% | | | 6,251 | | |
NET ASSETS — 100.00% | | $ | 9,813,855 | | |
^ Purchased with cash collateral from securities on loan.
(a) All or a portion of this security is on loan.
(b) Non-income producing security.
(c) Rate disclosed is the daily yield on April 30, 2020.
ETF — Exchange-Traded Fund
PLC — Public Limited Company
See notes to financial statements.
7
Victory Portfolios
Victory Sycamore Small Company Opportunity Fund | | Schedule of Portfolio Investments
April 30, 2020 | |
(Amounts in Thousands, Except for Shares) (Unaudited)
Security Description | | Shares | | Value | |
Common Stocks (96.5%) | |
Communication Services (0.7%): | |
The E.W. Scripps Co., Class A (a) (b) | | | 4,324,200 | | | $ | 34,896 | | |
Consumer Discretionary (12.0%): | |
Asbury Automotive Group, Inc. (c) | | | 51,144 | | | | 3,452 | | |
Choice Hotels International, Inc. (d) | | | 540,875 | | | | 40,593 | | |
Churchill Downs, Inc. (d) | | | 424,600 | | | | 42,553 | | |
Core-Mark Holding Co., Inc. (b) | | | 2,399,950 | | | | 68,975 | | |
Dunkin' Brands Group, Inc. | | | 616,550 | | | | 38,744 | | |
Helen of Troy Ltd. (c) (d) | | | 334,776 | | | | 54,997 | | |
Hyatt Hotels Corp., Class A (d) | | | 765,500 | | | | 43,067 | | |
Murphy USA, Inc. (c) (d) | | | 397,880 | | | | 42,494 | | |
Oxford Industries, Inc. | | | 508,147 | | | | 21,302 | | |
Penske Automotive Group, Inc. (d) | | | 1,464,975 | | | | 52,709 | | |
Sonic Automotive, Inc., Class A | | | 107,818 | | | | 2,311 | | |
Steven Madden Ltd. | | | 1,692,062 | | | | 42,420 | | |
Texas Roadhouse, Inc. (d) | | | 1,488,625 | | | | 70,099 | | |
Unifi, Inc. (c) | | | 694,700 | | | | 7,190 | | |
Visteon Corp. (c) (d) | | | 513,700 | | | | 30,976 | | |
| | | | 561,882 | | |
Consumer Staples (3.4%): | |
Casey's General Stores, Inc. (d) | | | 265,540 | | | | 40,205 | | |
Edgewell Personal Care Co. (c) (d) | | | 1,546,100 | | | | 42,688 | | |
Flowers Foods, Inc. (d) | | | 301,475 | | | | 6,717 | | |
Sanderson Farms, Inc. (d) | | | 525,088 | | | | 71,486 | | |
| | | | 161,096 | | |
Energy (1.7%): | |
Delek U.S. Holdings, Inc. (d) | | | 1,890,200 | | | | 44,136 | | |
Helix Energy Solutions Group, Inc. (c) (d) | | | 6,200,000 | | | | 15,748 | | |
PDC Energy, Inc. (c) | | | 1,678,698 | | | | 21,806 | | |
| | | | 81,690 | | |
Financials (20.7%): | |
American Financial Group, Inc. | | | 354,553 | | | | 23,486 | | |
AMERISAFE, Inc. | | | 732,414 | | | | 46,633 | | |
Associated Bancorp, Class A | | | 1,957,734 | | | | 27,682 | | |
Axis Capital Holdings Ltd. | | | 1,463,075 | | | | 53,549 | | |
Bank of Hawaii Corp. (d) | | | 906,800 | | | | 61,826 | | |
Columbia Banking System, Inc. | | | 1,525,200 | | | | 41,165 | | |
Eagle Bancorp, Inc. | | | 830,250 | | | | 29,125 | | |
FBL Financial Group, Inc., Class A (a) | | | 501,805 | | | | 19,611 | | |
First American Financial Corp. | | | 1,417,300 | | | | 65,365 | | |
Horace Mann Educators Corp. | | | 1,384,600 | | | | 48,683 | | |
Independent Bank Corp. | | | 959,321 | | | | 69,926 | | |
Kemper Corp. (d) | | | 970,600 | | | | 65,243 | | |
Lakeland Financial Corp. (d) | | | 1,014,350 | | | | 42,937 | | |
Pinnacle Financial Partners, Inc. (d) | | | 1,460,675 | | | | 58,792 | | |
RenaissanceRe Holdings Ltd. (d) | | | 272,000 | | | | 39,715 | | |
Renasant Corp. | | | 885,200 | | | | 23,219 | | |
See notes to financial statements.
8
Victory Portfolios
Victory Sycamore Small Company Opportunity Fund | | Schedule of Portfolio Investments — continued
April 30, 2020 | |
(Amounts in Thousands, Except for Shares) (Unaudited)
Security Description | | Shares | | Value | |
South State Corp. | | | 974,800 | | | $ | 56,382 | | |
State Auto Financial Corp. (a) | | | 1,318,777 | | | | 33,088 | | |
Stewart Information Services Corp. (b) | | | 1,360,810 | | | | 43,355 | | |
UMB Financial Corp. | | | 1,066,850 | | | | 54,239 | | |
White Mountains Insurance Group Ltd. | | | 60,145 | | | | 58,521 | | |
| | | | 962,542 | | |
Health Care (7.5%): | |
AngioDynamics, Inc. (b) (c) | | | 4,048,525 | | | | 42,226 | | |
Avanos Medical, Inc., Class I (c) (d) | | | 1,402,325 | | | | 43,542 | | |
Cutera, Inc. (b) (c) | | | 1,137,300 | | | | 15,297 | | |
Hanger, Inc. (b) (c) | | | 2,041,640 | | | | 37,485 | | |
ICU Medical, Inc. (c) (d) | | | 283,500 | | | | 62,174 | | |
Magellan Health, Inc. (c) | | | 739,600 | | | | 44,916 | | |
Natus Medical, Inc. (c) | | | 1,023,500 | | | | 25,577 | | |
NuVasive, Inc. (c) | | | 626,275 | | | | 38,128 | | |
Patterson Cos., Inc. (d) | | | 2,186,400 | | | | 39,967 | | |
| | | | 349,312 | | |
Industrials (23.3%): | |
ABM Industries, Inc. | | | 1,209,525 | | | | 41,717 | | |
Alamo Group, Inc. | | | 579,950 | | | | 57,090 | | |
Altra Industrial Motion Corp. | | | 1,376,200 | | | | 38,410 | | |
Applied Industrial Technologies, Inc. (d) | | | 1,377,525 | | | | 72,169 | | |
Astec Industries, Inc. | | | 762,200 | | | | 30,572 | | |
Carlisle Cos., Inc. | | | 393,984 | | | | 47,656 | | |
Crane Co. | | | 1,060,500 | | | | 57,744 | | |
EMCOR Group, Inc. | | | 904,025 | | | | 57,433 | | |
Encore Wire Corp. | | | 1,002,300 | | | | 45,885 | | |
Forward Air Corp. | | | 826,602 | | | | 42,653 | | |
Hillenbrand, Inc. (d) | | | 971,704 | | | | 20,357 | | |
Kennametal, Inc. (d) | | | 969,600 | | | | 24,831 | | |
Korn Ferry | | | 1,224,500 | | | | 35,302 | | |
Marten Transport Ltd. | | | 2,275,800 | | | | 51,023 | | |
Mueller Industries, Inc. | | | 1,151,975 | | | | 29,836 | | |
MYR Group, Inc. (c) | | | 481,800 | | | | 14,454 | | |
Saia, Inc. (c) (d) | | | 461,025 | | | | 42,654 | | |
TriMas Corp. (c) | | | 1,679,050 | | | | 40,029 | | |
US Ecology, Inc. | | | 930,600 | | | | 30,505 | | |
UniFirst Corp. | | | 359,825 | | | | 60,504 | | |
Universal Forest Products, Inc. | | | 1,193,050 | | | | 49,058 | | |
Valmont Industries, Inc. | | | 292,800 | | | | 34,328 | | |
Viad Corp. | | | 1,424,350 | | | | 34,142 | | |
Watts Water Technologies, Inc., Class A | | | 705,300 | | | | 58,117 | | |
Werner Enterprises, Inc. (d) | | | 1,724,900 | | | | 69,203 | | |
| | | | 1,085,672 | | |
Information Technology (12.1%): | |
ADTRAN, Inc. (b) | | | 2,754,600 | | | | 28,317 | | |
Advanced Energy Industries, Inc. (c) | | | 863,350 | | | | 48,002 | | |
Littelfuse, Inc. (d) | | | 318,200 | | | | 46,216 | | |
LogMeIn, Inc. (d) | | | 451,025 | | | | 38,545 | | |
See notes to financial statements.
9
Victory Portfolios
Victory Sycamore Small Company Opportunity Fund | | Schedule of Portfolio Investments — continued
April 30, 2020 | |
(Amounts in Thousands, Except for Shares) (Unaudited)
Security Description | | Shares | | Value | |
ManTech International Corp., Class A | | | 703,000 | | | $ | 52,416 | | |
MAXIMUS, Inc. | | | 777,075 | | | | 52,313 | | |
MicroStrategy, Inc. (c) | | | 376,800 | | | | 47,600 | | |
MKS Instruments, Inc. (d) | | | 543,300 | | | | 54,455 | | |
NETGEAR, Inc. (b) (c) | | | 1,951,100 | | | | 46,788 | | |
Plexus Corp. (c) | | | 721,600 | | | | 45,237 | | |
ScanSource, Inc. (c) | | | 1,255,800 | | | | 32,550 | | |
Sykes Enterprises, Inc. (c) | | | 1,944,125 | | | | 55,660 | | |
Verint Systems, Inc. (c) (d) | | | 435,600 | | | | 18,618 | | |
| | | | 566,717 | | |
Materials (6.3%): | |
Cabot Corp. | | | 1,417,733 | | | | 48,047 | | |
Kaiser Aluminum Corp. | | | 485,825 | | | | 35,091 | | |
Minerals Technologies, Inc. | | | 1,249,725 | | | | 55,037 | | |
PolyOne Corp. | | | 844,950 | | | | 19,679 | | |
Silgan Holdings, Inc. | | | 1,306,100 | | | | 45,060 | | |
Sonoco Products Co. (d) | | | 993,050 | | | | 48,501 | | |
Worthington Industries, Inc. | | | 1,628,500 | | | | 43,058 | | |
| | | | 294,473 | | |
Real Estate (6.1%): | |
Columbia Property Trust, Inc. | | | 2,463,300 | | | | 35,201 | | |
Healthcare Realty Trust, Inc. (d) | | | 1,869,875 | | | | 54,956 | | |
LTC Properties, Inc. (d) | | | 588,675 | | | | 20,957 | | |
Rayonier, Inc. | | | 2,397,800 | | | | 57,619 | | |
Sunstone Hotel Investors, Inc. | | | 4,812,500 | | | | 44,227 | | |
Urstadt Biddle Properties, Inc., Class A | | | 1,065,225 | | | | 15,563 | | |
Washington Real Estate Investment Trust (d) | | | 2,508,525 | | | | 58,498 | | |
| | | | 287,021 | | |
Utilities (2.7%): | |
ALLETE, Inc. | | | 559,400 | | | | 32,199 | | |
MGE Energy, Inc. | | | 457,600 | | | | 29,588 | | |
NorthWestern Corp. | | | 613,050 | | | | 35,367 | | |
ONE Gas, Inc. (d) | | | 377,000 | | | | 30,051 | | |
| | | | 127,205 | | |
Total Common Stocks (Cost $4,807,634) | | | 4,512,506 | | |
Exchange-Traded Funds (1.1%) | |
iShares Russell 2000 Value ETF (d) | | | 576,000 | | | | 53,171 | | |
Total Exchange-Traded Funds (Cost $66,331) | | | 53,171 | | |
See notes to financial statements.
10
Victory Portfolios
Victory Sycamore Small Company Opportunity Fund | | Schedule of Portfolio Investments — continued
April 30, 2020 | |
(Amounts in Thousands, Except for Shares) (Unaudited)
Security Description | | Shares | | Value | |
Collateral for Securities Loaned^ (2.3%) | |
BlackRock Liquidity Funds TempFund, Institutional Class, 0.61% (e) | | | 1,999,278 | | | $ | 1,999 | | |
Fidelity Investments Money Market Government Portfolio,
Institutional Class, 0.18% (e) | | | 45,779,593 | | | | 45,780 | | |
Fidelity Investments Money Market Prime Money Market Portfolio,
Institutional Class, 0.47% (e) | | | 997,306 | | | | 997 | | |
Goldman Sachs Financial Square Prime Obligations Fund,
Institutional Class, 0.67% (e) | | | 13,902,935 | | | | 13,903 | | |
JPMorgan Prime Money Market Fund, Capital Class, 0.68% (e) | | | 7,955,658 | | | | 7,956 | | |
Morgan Stanley Institutional Liquidity Prime Portfolio,
Institutional Class, 0.72% (e) | | | 35,770,189 | | | | 35,770 | | |
Total Collateral for Securities Loaned (Cost $106,405) | | | 106,405 | | |
Total Investments (Cost $4,980,370) — 99.9% | | | 4,672,082 | | |
Other assets in excess of liabilities — 0.1% | | | 6,286 | | |
NET ASSETS — 100.00% | | $ | 4,678,368 | | |
^ Purchased with cash collateral from securities on loan.
(a) The Fund's Adviser has deemed this security to be illiquid based upon procedures approved by the Board of Trustees. As of April 30, 2020, illiquid securities were 1.9% of the Fund's net assets.
(b) Affiliated security (See Note 8).
(c) Non-income producing security.
(d) All or a portion of this security is on loan.
(e) Rate disclosed is the daily yield on April 30, 2020.
ETF — Exchange-Traded Fund
See notes to financial statements.
11
Victory Portfolios | | Statements of Assets and Liabilities
April 30, 2020 | |
(Amounts in Thousands, Except Per Share Amounts) (Unaudited)
| | | Victory
Sycamore
Established
Value Fund | | Victory
Sycamore
Small Company
Opportunity
Fund | |
ASSETS: | |
Affiliated investments, at value (Cost $— and $443,520) | | $ | — | | | $ | 317,339 | | |
Unaffiliated investments, at value (Cost $10,684,664 and
$4,536,850) | | | 9,807,604 | (a) | | | 4,354,743 | (b) | |
Cash and cash equivalents | | | 149,006 | | | | 124,620 | | |
Receivables: | |
Interest and dividends | | | 4,039 | | | | 1,719 | | |
Capital shares issued | | | 12,123 | | | | 10,815 | | |
Investments sold | | | 21,190 | | | | 21,069 | | |
Prepaid expenses | | | 165 | | | | 68 | | |
Total Assets | | | 9,994,127 | | | | 4,830,373 | | |
LIABILITIES: | |
Payables: | |
Collateral received on loaned securities | | | 104,016 | | | | 106,405 | | |
Investments purchased | | | 49,409 | | | | 35,470 | | |
Capital shares redeemed | | | 21,359 | | | | 6,400 | | |
Accrued expenses and other payables: | |
Investment advisory fees | | | 3,388 | | | | 2,709 | | |
Administration fees | | | 449 | | | | 214 | | |
Custodian fees | | | 75 | | | | 36 | | |
Transfer agent fees | | | 783 | | | | 370 | | |
Compliance fees | | | 9 | | | | 4 | | |
Trustees' fees | | | 31 | | | | 16 | | |
| 12b-1 fees | | | 277 | | | | 73 | | |
Other accrued expenses | | | 476 | | | | 308 | | |
Total Liabilities | | | 180,272 | | | | 152,005 | | |
NET ASSETS: | |
Capital | | | 10,163,154 | | | | 4,946,704 | | |
Total distributable earnings/(loss) | | | (349,299 | ) | | | (268,336 | ) | |
Net Assets | | $ | 9,813,855 | | | $ | 4,678,368 | | |
Net Assets | |
Class A Shares | | $ | 1,364,843 | | | $ | 337,799 | | |
Class C Shares | | | 56,911 | | | | — | | |
Class I Shares | | | 2,822,793 | | | | 3,816,616 | | |
Class R Shares | | | 616,741 | | | | 209,913 | | |
Class R6 Shares | | | 4,350,662 | | | | 286,960 | | |
Class Y Shares | | | 601,905 | | | | 27,080 | | |
Total | | $ | 9,813,855 | | | $ | 4,678,368 | | |
Shares (unlimited number of shares authorized with a
par value of $0.001 per share): | |
Class A Shares | | | 42,897 | | | | 9,664 | | |
Class C Shares | | | 1,833 | | | | — | | |
Class I Shares | | | 88,664 | | | | 107,967 | | |
Class R Shares | | | 19,667 | | | | 6,470 | | |
Class R6 Shares | | | 136,605 | | | | 8,128 | | |
Class Y Shares | | | 18,908 | | | | 771 | | |
Total | | | 308,574 | | | | 133,000 | | |
(continues on next page)
See notes to financial statements.
12
Victory Portfolios | | Statements of Assets and Liabilities
April 30, 2020 | |
(Amounts in Thousands, Except Per Share Amounts) (Unaudited) (continued)
| | | Victory
Sycamore
Established
Value Fund | | Victory
Sycamore
Small Company
Opportunity
Fund | |
Net asset value, offering (except Class A Shares)
and redemption price per share: (c) | |
Class A Shares | | $ | 31.82 | | | $ | 34.95 | | |
Class C Shares (d) | | | 31.05 | | | | — | | |
Class I Shares | | | 31.84 | | | | 35.35 | | |
Class R Shares | | | 31.36 | | | | 32.45 | | |
Class R6 Shares | | | 31.85 | | | | 35.31 | | |
Class Y Shares | | | 31.83 | | | | 35.11 | | |
Maximum Sales Charge — Class A Shares | | | 5.75 | % | | | 5.75 | % | |
Maximum offering price
(100%/(100%-maximum sales charge) of net asset value
adjusted to the nearest cent) per share — Class A Shares | | $ | 33.76 | | | $ | 37.08 | | |
(a) Includes $98,612 of securities on loan.
(b) Includes $101,164 of securities on loan.
(c) Per share amount may not recalculate due to rounding of net assets and/or shares outstanding.
(d) Redemption price per share varies by the length of time shares are held.
See notes to financial statements.
13
Victory Portfolios | | Statements of Operations
For the Six Months Ended April 30, 2020 | |
(Amounts in Thousands, Except Per Share Amounts) (Unaudited)
| | | Victory
Sycamore
Established
Value Fund | | Victory
Sycamore
Small Company
Opportunity
Fund | |
Investment Income: | |
Interest from non-affiliates | | $ | 2,131 | | | $ | 762 | | |
Dividends from affiliates | | | — | | | | 2,231 | | |
Dividends from non-affiliates | | | 132,256 | | | | 47,883 | | |
Interfund lending income | | | 40 | | | | 1 | | |
Securities lending (net of fees) | | | 280 | | | | 150 | | |
Foreign tax withholding | | | — | | | | (132 | ) | |
Total Income | | | 134,707 | | | | 50,895 | | |
Expenses: | |
Investment advisory fees | | | 24,949 | | | | 19,997 | | |
Administration fees | | | 3,294 | | | | 1,574 | | |
12b-1 fees — Class A Shares | | | 2,026 | | | | 505 | | |
12b-1 fees — Class C Shares | | | 356 | | | | — | | |
12b-1 fees — Class R Shares | | | 1,847 | | | | 627 | | |
Custodian fees | | | 242 | | | | 118 | | |
Transfer agent fees — Class A Shares | | | 1,047 | | | | 322 | | |
Transfer agent fees — Class C Shares | | | 45 | | | | — | | |
Transfer agent fees — Class I Shares | | | 1,017 | | | | 1,639 | | |
Transfer agent fees — Class R Shares | | | 345 | | | | 112 | | |
Transfer agent fees — Class R6 Shares | | | 556 | | | | 8 | | |
Transfer agent fees — Class Y Shares | | | 277 | | | | 24 | | |
Trustees' fees | | | 478 | | | | 226 | | |
Compliance fees | | | 45 | | | | 22 | | |
Legal and audit fees | | | 251 | | | | 121 | | |
State registration and filing fees | | | 147 | | | | 76 | | |
Other expenses | | | 542 | | | | 372 | | |
Total Expenses | | | 37,464 | | | | 25,743 | | |
Net Investment Income (Loss) | | | 97,243 | | | | 25,152 | | |
Realized/Unrealized Gains (Losses) from Investments: | |
Net realized gains (losses) from affiliated investment securities | | | — | | | | (4,234 | ) | |
Net realized gains (losses) from unaffiliated investment securities | | | 534,340 | | | | 42,405 | | |
Net change in unrealized appreciation/depreciation on
affiliated investment securities | | | — | | | | (80,818 | ) | |
Net change in unrealized appreciation/depreciation on
unaffiliated investment securities | | | (2,456,030 | ) | | | (1,004,161 | ) | |
Net realized/unrealized gains (losses) on investments | | | (1,921,690 | ) | | | (1,046,808 | ) | |
Change in net assets resulting from operations | | $ | (1,824,447 | ) | | $ | (1,021,656 | ) | |
See notes to financial statements.
14
Victory Portfolios | | Statements of Change in Net Assets | |
(Amounts in Thousands)
| | | Victory Sycamore
Established
Value Fund | | Victory Sycamore
Small Company
Opportunity Fund | |
| | | Six
Months
Ended
April 30,
2020 | | Year
Ended
October 31, | | Six
Months
Ended
April 30,
2020 | | Year
Ended
October 31, | |
| | | (unaudited) | | 2019 | | (unaudited) | | 2019 | |
From Investment Activities: | |
Operations: | |
Net investment income (loss) | | $ | 97,243 | | | $ | 138,347 | | | $ | 25,152 | | | $ | 40,419 | | |
Net realized gains (losses) from
affiliated and unaffiliated
investments | | | 534,340 | | | | 553,734 | | | | 38,171 | | | | 255,811 | | |
Net change in unrealized appreciation
(depreciation) on affiliated and
unaffiliated investments | | | (2,456,030 | ) | | | 547,492 | | | | (1,084,979 | ) | | | 318,608 | | |
Change in net assets resulting from
operations | | | (1,824,447 | ) | | | 1,239,573 | | | | (1,021,656 | ) | | | 614,838 | | |
Distributions to Shareholders: | |
Class A Shares | | | (96,068 | ) | | | (169,100 | ) | | | (22,491 | ) | | | (53,953 | ) | |
Class C Shares | | | (4,079 | ) | | | (7,200 | ) | | | — | | | | — | | |
Class I Shares | | | (196,651 | ) | | | (316,124 | ) | | | (243,951 | ) | | | (475,137 | ) | |
Class R Shares | | | (43,572 | ) | | | (76,258 | ) | | | (14,387 | ) | | | (33,313 | ) | |
Class R6 Shares | | | (275,576 | ) | | | (354,635 | ) | | | (15,900 | ) | | | (23,009 | ) | |
Class Y Shares | | | (38,349 | ) | | | (43,476 | ) | | | (1,835 | ) | | | (3,713 | ) | |
Change in net assets resulting from
distributions to shareholders | | | (654,295 | ) | | | (966,793 | ) | | | (298,564 | ) | | | (589,125 | ) | |
Change in net assets resulting from capital
transactions | | | 664,116 | | | | 580,139 | | | | 375,868 | | | | 468,542 | | |
Change in net assets | | | (1,814,626 | ) | | | 852,919 | | | | (944,352 | ) | | | 494,255 | | |
Net Assets: | |
Beginning of period | | | 11,628,481 | | | | 10,775,562 | | | | 5,622,720 | | | | 5,128,465 | | |
End of period | | $ | 9,813,855 | | | $ | 11,628,481 | | | $ | 4,678,368 | | | $ | 5,622,720 | | |
(continues on next page)
See notes to financial statements.
15
Victory Portfolios | | Statements of Change in Net Assets | |
(Amounts in Thousands) (continued)
| | | Victory Sycamore
Established
Value Fund | | Victory Sycamore
Small Company
Opportunity Fund | |
| | | Six
Months
Ended
April 30,
2020
(unaudited) | | Year
Ended
October 31,
2019 | | Six
Months
Ended
April 30,
2020
(unaudited) | | Year
Ended
October 31,
2019 | |
Capital Transactions: | |
Class A Shares | |
Proceeds from shares issued | | $ | 202,116 | | | $ | 354,106 | | | $ | 52,561 | | | $ | 96,031 | | |
Distributions reinvested | | | 80,788 | | | | 140,929 | | | | 18,989 | | | | 45,327 | | |
Cost of shares redeemed | | | (361,914 | ) | | | (739,328 | ) | | | (85,179 | ) | | | (174,978 | ) | |
Total Class A Shares | | $ | (79,010 | ) | | $ | (244,293 | ) | | $ | (13,629 | ) | | $ | (33,620 | ) | |
Class C Shares | |
Proceeds from shares issued | | $ | 933 | | | $ | 3,767 | | | $ | — | | | $ | — | | |
Distributions reinvested | | | 3,802 | | | | 6,686 | | | | — | | | | — | | |
Cost of shares redeemed | | | (10,398 | ) | | | (22,418 | ) | | | — | | | | — | | |
Total Class C Shares | | $ | (5,663 | ) | | $ | (11,965 | ) | | $ | — | | | $ | — | | |
Class I Shares | |
Proceeds from shares issued | | $ | 550,697 | | | $ | 880,254 | | | $ | 688,376 | | | $ | 911,034 | | |
Distributions reinvested | | | 168,289 | | | | 273,354 | | | | 227,267 | | | | 434,644 | | |
Cost of shares redeemed | | | (639,967 | ) | | | (1,206,721 | ) | | | (614,185 | ) | | | (913,187 | ) | |
Total Class I Shares | | $ | 79,019 | | | $ | (53,113 | ) | | $ | 301,458 | | | $ | 432,491 | | |
Class R Shares | |
Proceeds from shares issued | | $ | 58,334 | | | $ | 119,414 | | | $ | 26,601 | | | $ | 40,972 | | |
Distributions reinvested | | | 42,394 | | | | 73,094 | | | | 13,958 | | | | 31,790 | | |
Cost of shares redeemed | | | (140,998 | ) | | | (279,535 | ) | | | (47,003 | ) | | | (77,878 | ) | |
Total Class R Shares | | $ | (40,270 | ) | | $ | (87,027 | ) | | $ | (6,444 | ) | | $ | (5,116 | ) | |
Class R6 Shares | |
Proceeds from shares issued | | $ | 964,664 | | | $ | 1,274,143 | | | $ | 128,391 | | | $ | 102,798 | | |
Distributions reinvested | | | 268,929 | | | | 345,033 | | | | 15,321 | | | | 22,339 | | |
Cost of shares redeemed | | | (619,204 | ) | | | (829,351 | ) | | | (53,637 | ) | | | (49,049 | ) | |
Total Class R6 Shares | | $ | 614,389 | | | $ | 789,825 | | | $ | 90,075 | | | $ | 76,088 | | |
Class Y Shares | |
Proceeds from shares issued | | $ | 182,748 | | | $ | 333,916 | | | $ | 8,149 | | | $ | 7,131 | | |
Distributions reinvested | | | 34,703 | | | | 37,685 | | | | 831 | | | | 1,272 | | |
Cost of shares redeemed | | | (121,800 | ) | | | (184,889 | ) | | | (4,572 | ) | | | (9,704 | ) | |
Total Class Y Shares | | $ | 95,651 | | | $ | 186,712 | | | $ | 4,408 | | | $ | (1,301 | ) | |
Change in net assets resulting from
capital transactions | | $ | 664,116 | | | $ | 580,139 | | | $ | 375,868 | | | $ | 468,542 | | |
(continues on next page)
See notes to financial statements.
16
Victory Portfolios | | Statements of Change in Net Assets | |
(Amounts in Thousands) (continued)
| | | Victory Sycamore
Established
Value Fund | | Victory Sycamore
Small Company
Opportunity Fund | |
| | | Six
Months
Ended
April 30,
2020
(unaudited) | | Year
Ended
October 31,
2019 | | Six
Months
Ended
April 30,
2020
(unaudited) | | Year
Ended
October 31,
2019 | |
Share Transactions: | |
Class A Shares | |
Issued | | | 5,917 | | | | 9,514 | | | | 1,389 | | | | 2,275 | | |
Reinvested | | | 2,082 | | | | 4,199 | | | | 420 | | | | 1,215 | | |
Redeemed | | | (10,055 | ) | | | (19,577 | ) | | | (2,139 | ) | | | (4,096 | ) | |
Total Class A Shares | | | (2,056 | ) | | | (5,864 | ) | | | (330 | ) | | | (606 | ) | |
Class C Shares | |
Issued | | | 27 | | | | 105 | | | | — | | | | — | | |
Reinvested | | | 99 | | | | 206 | | | | — | | | | — | | |
Redeemed | | | (312 | ) | | | (621 | ) | | | — | | | | — | | |
Total Class C Shares | | | (186 | ) | | | (310 | ) | | | — | | | | — | | |
Class I Shares | |
Issued | | | 15,733 | | | | 23,417 | | | | 18,255 | | | | 21,227 | | |
Reinvested | | | 4,359 | | | | 8,111 | | | | 4,969 | | | | 11,502 | | |
Redeemed | | | (18,719 | ) | | | (32,973 | ) | | | (15,543 | ) | | | (21,333 | ) | |
Total Class I Shares | | | 1,373 | | | | (1,445 | ) | | | 7,681 | | | | 11,396 | | |
Class R Shares | |
Issued | | | 1,707 | | | | 3,186 | | | | 752 | | | | 1,036 | | |
Reinvested | | | 1,106 | | | | 2,212 | | | | 333 | | | | 915 | | |
Redeemed | | | (3,983 | ) | | | (7,552 | ) | | | (1,251 | ) | | | (1,957 | ) | |
Total Class R Shares | | | (1,170 | ) | | | (2,154 | ) | | | (166 | ) | | | (6 | ) | |
Class R6 Shares | |
Issued | | | 28,312 | | | | 33,711 | | | | 3,068 | | | | 2,402 | | |
Reinvested | | | 6,988 | | | | 10,212 | | | | 335 | | | | 592 | | |
Redeemed | | | (17,387 | ) | | | (21,871 | ) | | | (1,346 | ) | | | (1,136 | ) | |
Total Class R6 Shares | | | 17,913 | | | | 22,052 | | | | 2,057 | | | | 1,858 | | |
Class Y Shares | |
Issued | | | 5,174 | | | | 8,883 | | | | 193 | | | | 172 | | |
Reinvested | | | 901 | | | | 1,114 | | | | 18 | | | | 34 | | |
Redeemed | | | (3,600 | ) | | | (4,909 | ) | | | (123 | ) | | | (230 | ) | |
Total Class Y Shares | | | 2,475 | | | | 5,088 | | | | 88 | | | | (24 | ) | |
Change in Shares | | | 18,349 | | | | 17,367 | | | | 9,330 | | | | 12,618 | | |
See notes to financial statements.
17
Victory Portfolios | | Financial Highlights | |
For a Share Outstanding Throughout Each Period
| | | | | Investment Activities | | Distributions to
Shareholders From | |
| | | Net Asset
Value,
Beginning of
Period | | Net
Investment
Income (Loss) | | Net Realized
and Unrealized
Gains (Losses)
on Investments | | Total from
Investment
Activities | | Net
Investment
Income | | Net Realized
Gains from
Investments | |
Victory Sycamore Established Value Fund | |
Class A | |
Six Months Ended
4/30/20 (unaudited) | | $ | 40.09 | | | | 0.28 | (c) | | | (6.36 | ) | | | (6.08 | ) | | | (0.29 | ) | | | (1.90 | ) | |
Year Ended 10/31/19 | | $ | 39.52 | | | | 0.40 | (c) | | | 3.61 | | | | 4.01 | | | | (0.39 | ) | | | (3.05 | ) | |
Year Ended 10/31/18 | | $ | 40.01 | | | | 0.35 | (c) | | | 0.48 | | | | 0.83 | | | | (0.33 | ) | | | (0.99 | ) | |
Year Ended 10/31/17 | | $ | 33.82 | | | | 0.22 | (c) | | | 6.53 | | | | 6.75 | | | | (0.21 | ) | | | (0.35 | ) | |
Year Ended 10/31/16 | | $ | 35.55 | | | | 0.23 | (c) | | | 1.50 | | | | 1.73 | | | | (0.22 | ) | | | (3.24 | ) | |
Year Ended 10/31/15 | | $ | 37.01 | | | | 0.44 | | | | 3.07 | | | | 3.51 | | | | (0.41 | ) | | | (4.56 | ) | |
Class C | |
Six Months Ended
4/30/20 (unaudited) | | $ | 39.16 | | | | 0.14 | (c) | | | (6.20 | ) | | | (6.06 | ) | | | (0.15 | ) | | | (1.90 | ) | |
Year Ended 10/31/19 | | $ | 38.69 | | | | 0.11 | (c) | | | 3.53 | | | | 3.64 | | | | (0.12 | ) | | | (3.05 | ) | |
Year Ended 10/31/18 | | $ | 39.22 | | | | 0.03 | (c) | | | 0.46 | | | | 0.49 | | | | (0.03 | ) | | | (0.99 | ) | |
Year Ended 10/31/17 | | $ | 33.26 | | | | (0.09 | )(c) | | | 6.44 | | | | 6.35 | | | | (0.04 | ) | | | (0.35 | ) | |
3/1/16(d) through
10/31/16 | | $ | 29.08 | | | | (0.09 | ) | | | 4.37 | | | | 4.28 | | | | (0.10 | ) | | | — | | |
Class I | |
Six Months Ended
4/30/20 (unaudited) | | $ | 40.12 | | | | 0.34 | (c) | | | (6.37 | ) | | | (6.03 | ) | | | (0.35 | ) | | | (1.90 | ) | |
Year Ended 10/31/19 | | $ | 39.55 | | | | 0.52 | (c) | | | 3.62 | | | | 4.14 | | | | (0.52 | ) | | | (3.05 | ) | |
Year Ended 10/31/18 | | $ | 40.04 | | | | 0.47 | (c) | | | 0.48 | | | | 0.95 | | | | (0.45 | ) | | | (0.99 | ) | |
Year Ended 10/31/17 | | $ | 33.83 | | | | 0.32 | (c) | | | 6.56 | | | | 6.88 | | | | (0.32 | ) | | | (0.35 | ) | |
Year Ended 10/31/16 | | $ | 35.56 | | | | 0.30 | (c) | | | 1.52 | | | | 1.82 | | | | (0.31 | ) | | | (3.24 | ) | |
Year Ended 10/31/15 | | $ | 37.01 | | | | 0.56 | | | | 3.08 | | | | 3.64 | | | | (0.53 | ) | | | (4.56 | ) | |
Class R | |
Six Months Ended
4/30/20 (unaudited) | | $ | 39.54 | | | | 0.24 | (c) | | | (6.27 | ) | | | (6.03 | ) | | | (0.25 | ) | | | (1.90 | ) | |
Year Ended 10/31/19 | | $ | 39.03 | | | | 0.31 | (c) | | | 3.57 | | | | 3.88 | | | | (0.32 | ) | | | (3.05 | ) | |
Year Ended 10/31/18 | | $ | 39.54 | | | | 0.26 | (c) | | | 0.48 | | | | 0.74 | | | | (0.26 | ) | | | (0.99 | ) | |
Year Ended 10/31/17 | | $ | 33.43 | | | | 0.14 | (c) | | | 6.46 | | | | 6.60 | | | | (0.14 | ) | | | (0.35 | ) | |
Year Ended 10/31/16 | | $ | 35.18 | | | | 0.17 | (c) | | | 1.48 | | | | 1.65 | | | | (0.16 | ) | | | (3.24 | ) | |
Year Ended 10/31/15 | | $ | 36.67 | | | | 0.38 | | | | 3.04 | | | | 3.42 | | | | (0.35 | ) | | | (4.56 | ) | |
(a) Not annualized for periods less than one year.
(b) Annualized for periods less than one year.
(c) Per share net investment income (loss) has been calculated using the average daily shares method.
(d) Commencement of operations.
(e) Portfolio turnover is calculated on the basis of the Fund as a whole without distinguishing between the classes of shares issued.
See notes to financial statements.
18
Victory Portfolios | | Financial Highlights — continued | |
For a Share Outstanding Throughout Each Period
| | | | | Ratios to Average Net Assets | | Supplemental Data | |
| | | Total
Distributions | | Net Asset
Value,
End of
Period | | Total
Return
(Excludes
Sales
Charge)(a) | | Net
Expenses(b) | | Net
Investment
Income
(Loss)(b) | | Gross
Expenses(b) | | Net Assets,
End of
Period
(000's) | | Portfolio
Turnover(a)(e) | |
Victory Sycamore Established Value Fund | |
Class A | |
Six Months Ended
4/30/20 (unaudited) | | | (2.19 | ) | | $ | 31.82 | | | | (16.11 | )% | | | 0.92 | % | | | 1.53 | % | | | 0.92 | % | | $ | 1,364,843 | | | | 24 | % | |
Year Ended 10/31/19 | | | (3.44 | ) | | $ | 40.09 | | | | 11.96 | % | | | 0.92 | % | | | 1.06 | % | | | 0.92 | % | | $ | 1,802,034 | | | | 34 | % | |
Year Ended 10/31/18 | | | (1.32 | ) | | $ | 39.52 | | | | 2.01 | % | | | 0.89 | % | | | 0.85 | % | | | 0.89 | % | | $ | 2,008,143 | | | | 36 | % | |
Year Ended 10/31/17 | | | (0.56 | ) | | $ | 40.01 | | | | 20.12 | % | | | 0.90 | % | | | 0.58 | % | | | 0.90 | % | | $ | 2,386,049 | | | | 32 | % | |
Year Ended 10/31/16 | | | (3.46 | ) | | $ | 33.82 | | | | 5.80 | % | | | 0.95 | % | | | 0.69 | % | | | 0.95 | % | | $ | 1,735,974 | | | | 40 | % | |
Year Ended 10/31/15 | | | (4.97 | ) | | $ | 35.55 | | | | 10.08 | % | | | 0.99 | % | | | 1.21 | % | | | 0.99 | % | | $ | 1,076,956 | | | | 58 | % | |
Class C | |
Six Months Ended
4/30/20 (unaudited) | | | (2.05 | ) | | $ | 31.05 | | | | (16.41 | )% | | | 1.69 | % | | | 0.78 | % | | | 1.69 | % | | $ | 56,911 | | | | 24 | % | |
Year Ended 10/31/19 | | | (3.17 | ) | | $ | 39.16 | | | | 11.10 | % | | | 1.68 | % | | | 0.30 | % | | | 1.68 | % | | $ | 79,066 | | | | 34 | % | |
Year Ended 10/31/18 | | | (1.02 | ) | | $ | 38.69 | | | | 1.19 | % | | | 1.68 | % | | | 0.07 | % | | | 1.68 | % | | $ | 90,128 | | | | 36 | % | |
Year Ended 10/31/17 | | | (0.39 | ) | | $ | 39.22 | | | | 19.20 | % | | | 1.70 | % | | | (0.24 | )% | | | 1.70 | % | | $ | 101,506 | | | | 32 | % | |
3/1/16(d) through
10/31/16 | | | (0.10 | ) | | $ | 33.26 | | | | 14.75 | % | | | 1.80 | % | | | (0.40 | )% | | | 1.80 | % | | $ | 25,146 | | | | 40 | % | |
Class I | |
Six Months Ended
4/30/20 (unaudited) | | | (2.25 | ) | | $ | 31.84 | | | | (15.98 | )% | | | 0.60 | % | | | 1.86 | % | | | 0.60 | % | | $ | 2,822,793 | | | | 24 | % | |
Year Ended 10/31/19 | | | (3.57 | ) | | $ | 40.12 | | | | 12.31 | % | | | 0.60 | % | | | 1.37 | % | | | 0.60 | % | | $ | 3,501,630 | | | | 34 | % | |
Year Ended 10/31/18 | | | (1.44 | ) | | $ | 39.55 | | | | 2.30 | % | | | 0.59 | % | | | 1.14 | % | | | 0.59 | % | | $ | 3,509,093 | | | | 36 | % | |
Year Ended 10/31/17 | | | (0.67 | ) | | $ | 40.04 | | | | 20.50 | % | | | 0.62 | % | | | 0.85 | % | | | 0.62 | % | | $ | 5,263,053 | | | | 32 | % | |
Year Ended 10/31/16 | | | (3.55 | ) | | $ | 33.83 | | | | 6.08 | % | | | 0.69 | % | | | 0.91 | % | | | 0.69 | % | | $ | 2,590,122 | | | | 40 | % | |
Year Ended 10/31/15 | | | (5.09 | ) | | $ | 35.56 | | | | 10.51 | % | | | 0.63 | % | | | 1.55 | % | | | 0.63 | % | | $ | 761,549 | | | | 58 | % | |
Class R | |
Six Months Ended
4/30/20 (unaudited) | | | (2.15 | ) | | $ | 31.36 | | | | (16.21 | )% | | | 1.13 | % | | | 1.33 | % | | | 1.13 | % | | $ | 616,741 | | | | 24 | % | |
Year Ended 10/31/19 | | | (3.37 | ) | | $ | 39.54 | | | | 11.72 | % | | | 1.13 | % | | | 0.84 | % | | | 1.13 | % | | $ | 823,796 | | | | 34 | % | |
Year Ended 10/31/18 | | | (1.25 | ) | | $ | 39.03 | | | | 1.80 | % | | | 1.10 | % | | | 0.65 | % | | | 1.10 | % | | $ | 897,277 | | | | 36 | % | |
Year Ended 10/31/17 | | | (0.49 | ) | | $ | 39.54 | | | | 19.89 | % | | | 1.10 | % | | | 0.38 | % | | | 1.10 | % | | $ | 1,005,561 | | | | 32 | % | |
Year Ended 10/31/16 | | | (3.40 | ) | | $ | 33.43 | | | | 5.60 | % | | | 1.13 | % | | | 0.54 | % | | | 1.13 | % | | $ | 784,442 | | | | 40 | % | |
Year Ended 10/31/15 | | | (4.91 | ) | | $ | 35.18 | | | | 9.91 | % | | | 1.16 | % | | | 1.05 | % | | | 1.16 | % | | $ | 705,436 | | | | 58 | % | |
See notes to financial statements.
19
Victory Portfolios | | Financial Highlights | |
For a Share Outstanding Throughout Each Period
| | | | | Investment Activities | | Distributions to
Shareholders From | |
| | | Net Asset
Value,
Beginning of
Period | | Net
Investment
Income (Loss) | | Net Realized
and Unrealized
Gains (Losses)
on Investments | | Total from
Investment
Activities | | Net
Investment
Income | | Net Realized
Gains from
Investments | |
Victory Sycamore Established Value Fund | |
Class R6 | |
Six Months Ended
4/30/20 (unaudited) | | $ | 40.13 | | | | 0.34 | (c) | | | (6.37 | ) | | | (6.03 | ) | | | (0.35 | ) | | | (1.90 | ) | |
Year Ended 10/31/19 | | $ | 39.55 | | | | 0.52 | (c) | | | 3.63 | | | | 4.15 | | | | (0.52 | ) | | | (3.05 | ) | |
Year Ended 10/31/18 | | $ | 40.05 | | | | 0.49 | (c) | | | 0.48 | | | | 0.97 | | | | (0.48 | ) | | | (0.99 | ) | |
Year Ended 10/31/17 | | $ | 33.85 | | | | 0.35 | (c) | | | 6.54 | | | | 6.89 | | | | (0.34 | ) | | | (0.35 | ) | |
Year Ended 10/31/16 | | $ | 35.56 | | | | 0.31 | (c) | | | 1.55 | | | | 1.86 | | | | (0.33 | ) | | | (3.24 | ) | |
Year Ended 10/31/15 | | $ | 37.02 | | | | 0.55 | | | | 3.08 | | | | 3.63 | | | | (0.53 | ) | | | (4.56 | ) | |
Class Y | |
Six Months Ended
4/30/20 (unaudited) | | $ | 40.11 | | | | 0.33 | (c) | | | (6.37 | ) | | | (6.04 | ) | | | (0.34 | ) | | | (1.90 | ) | |
Year Ended 10/31/19 | | $ | 39.54 | | | | 0.50 | (c) | | | 3.63 | | | | 4.13 | | | | (0.51 | ) | | | (3.05 | ) | |
Year Ended 10/31/18 | | $ | 40.04 | | | | 0.46 | (c) | | | 0.48 | | | | 0.94 | | | | (0.45 | ) | | | (0.99 | ) | |
Year Ended 10/31/17 | | $ | 33.83 | | | | 0.31 | (c) | | | 6.57 | | | | 6.88 | | | | (0.32 | ) | | | (0.35 | ) | |
Year Ended 10/31/16 | | $ | 35.56 | | | | 0.28 | (c) | | | 1.53 | | | | 1.81 | | | | (0.30 | ) | | | (3.24 | ) | |
Year Ended 10/31/15 | | $ | 37.02 | | | | 0.49 | | | | 3.08 | | | | 3.57 | | | | (0.47 | ) | | | (4.56 | ) | |
(a) Not annualized for periods less than one year.
(b) Annualized for periods less than one year.
(c) Per share net investment income (loss) has been calculated using the average daily shares method.
(d) Commencement of operations.
(e) Portfolio turnover is calculated on the basis of the Fund as a whole without distinguishing between the classes of shares issued.
See notes to financial statements.
20
Victory Portfolios | | Financial Highlights — continued | |
For a Share Outstanding Throughout Each Period
| | | | | Ratios to Average Net Assets | | Supplemental Data | |
| | | Total
Distributions | | Net Asset
Value,
End of
Period | | Total
Return
(Excludes
Sales
Charge)(a) | | Net
Expenses(b) | | Net
Investment
Income
(Loss)(b) | | Gross
Expenses(b) | | Net Assets,
End of
Period
(000's) | | Portfolio
Turnover(a)(e) | |
Victory Sycamore Established Value Fund | |
Class R6 | |
Six Months Ended
4/30/20 (unaudited) | | | (2.25 | ) | | $ | 31.85 | | | | (15.97 | )% | | | 0.57 | % | | | 1.87 | % | | | 0.57 | % | | $ | 4,350,662 | | | | 24 | % | |
Year Ended 10/31/19 | | | (3.57 | ) | | $ | 40.13 | | | | 12.35 | % | | | 0.58 | % | | | 1.38 | % | | | 0.58 | % | | $ | 4,762,844 | | | | 34 | % | |
Year Ended 10/31/18 | | | (1.47 | ) | | $ | 39.55 | | | | 2.34 | % | | | 0.57 | % | | | 1.19 | % | | | 0.57 | % | | $ | 3,822,378 | | | | 36 | % | |
Year Ended 10/31/17 | | | (0.69 | ) | | $ | 40.05 | | | | 20.54 | % | | | 0.54 | % | | | 0.91 | % | | | 0.54 | % | | $ | 1,314,843 | | | | 32 | % | |
Year Ended 10/31/16 | | | (3.57 | ) | | $ | 33.85 | | | | 6.20 | % | | | 0.59 | % | | | 0.93 | % | | | 0.59 | % | | $ | 458,750 | | | | 40 | % | |
Year Ended 10/31/15 | | | (5.09 | ) | | $ | 35.56 | | | | 10.48 | % | | | 0.63 | % | | | 1.47 | % | | | 0.65 | % | | $ | 52,450 | | | | 58 | % | |
Class Y | |
Six Months Ended
4/30/20 (unaudited) | | | (2.24 | ) | | $ | 31.83 | | | | (16.00 | )% | | | 0.63 | % | | | 1.81 | % | | | 0.63 | % | | $ | 601,905 | | | | 24 | % | |
Year Ended 10/31/19 | | | (3.56 | ) | | $ | 40.11 | | | | 12.28 | % | | | 0.63 | % | | | 1.32 | % | | | 0.63 | % | | $ | 659,111 | | | | 34 | % | |
Year Ended 10/31/18 | | | (1.44 | ) | | $ | 39.54 | | | | 2.27 | % | | | 0.62 | % | | | 1.13 | % | | | 0.62 | % | | $ | 448,543 | | | | 36 | % | |
Year Ended 10/31/17 | | | (0.67 | ) | | $ | 40.04 | | | | 20.51 | % | | | 0.60 | % | | | 0.81 | % | | | 0.60 | % | | $ | 487,044 | | | | 32 | % | |
Year Ended 10/31/16 | | | (3.54 | ) | | $ | 33.83 | | | | 6.03 | % | | | 0.72 | % | | | 0.85 | % | | | 0.72 | % | | $ | 50,765 | | | | 40 | % | |
Year Ended 10/31/15 | | | (5.03 | ) | | $ | 35.56 | | | | 10.27 | % | | | 0.83 | % | | | 1.36 | % | | | 0.94 | % | | $ | 10,200 | | | | 58 | % | |
See notes to financial statements.
21
Victory Portfolios | | Financial Highlights | |
For a Share Outstanding Throughout Each Period
| | | | | Investment Activities | | Distributions to
Shareholders From | |
| | | Net Asset
Value,
Beginning of
Period | | Net
Investment
Income (Loss) | | Net Realized
and Unrealized
Gains (Losses)
on Investments | | Total from
Investment
Activities | | Net
Investment
Income | | Net Realized
Gains from
Investments | |
Victory Sycamore Small Company Opportunity Fund | |
Class A | |
Six Months Ended
4/30/20 (unaudited) | | $ | 45.16 | | | | 0.14 | (c) | | | (8.07 | ) | | | (7.93 | ) | | | (0.20 | ) | | | (2.08 | ) | |
Year Ended 10/31/19 | | $ | 45.91 | | | | 0.22 | (c) | | | 4.22 | | | | 4.44 | | | | (0.10 | ) | | | (5.09 | ) | |
Year Ended 10/31/18 | | $ | 48.23 | | | | 0.22 | (c) | | | (0.09 | ) | | | 0.13 | | | | (0.21 | ) | | | (2.24 | ) | |
Year Ended 10/31/17 | | $ | 39.74 | | | | 0.11 | (c) | | | 10.44 | | | | 10.55 | | | | (0.12 | ) | | | (1.94 | ) | |
Year Ended 10/31/16 | | $ | 40.01 | | | | 0.10 | (c) | | | 3.05 | | | | 3.15 | | | | (0.05 | ) | | | (3.37 | ) | |
Year Ended 10/31/15 | | $ | 42.01 | | | | 0.03 | | | | 1.60 | | | | 1.63 | | | | — | | | | (3.63 | ) | |
Class I | |
Six Months Ended
4/30/20 (unaudited) | | $ | 45.71 | | | | 0.21 | (c) | | | (8.15 | ) | | | (7.94 | ) | | | (0.34 | ) | | | (2.08 | ) | |
Year Ended 10/31/19 | | $ | 46.43 | | | | 0.35 | (c) | | | 4.28 | | | | 4.63 | | | | (0.26 | ) | | | (5.09 | ) | |
Year Ended 10/31/18 | | $ | 48.75 | | | | 0.37 | (c) | | | (0.09 | ) | | | 0.28 | | | | (0.36 | ) | | | (2.24 | ) | |
Year Ended 10/31/17 | | $ | 40.12 | | | | 0.25 | (c) | | | 10.55 | | | | 10.80 | | | | (0.23 | ) | | | (1.94 | ) | |
Year Ended 10/31/16 | | $ | 40.37 | | | | 0.21 | (c) | | | 3.08 | | | | 3.29 | | | | (0.17 | ) | | | (3.37 | ) | |
Year Ended 10/31/15 | | $ | 42.31 | | | | 0.16 | | | | 1.62 | | | | 1.78 | | | | (0.09 | ) | | | (3.63 | ) | |
Class R | |
Six Months Ended
4/30/20 (unaudited) | | $ | 42.05 | | | | 0.09 | (c) | | | (7.47 | ) | | | (7.38 | ) | | | (0.14 | ) | | | (2.08 | ) | |
Year Ended 10/31/19 | | $ | 43.13 | | | | 0.13 | (c) | | | 3.91 | | | | 4.04 | | | | (0.03 | ) | | | (5.09 | ) | |
Year Ended 10/31/18 | | $ | 45.47 | | | | 0.10 | (c) | | | (0.08 | ) | | | 0.02 | | | | (0.12 | ) | | | (2.24 | ) | |
Year Ended 10/31/17 | | $ | 37.59 | | | | 0.01 | (c) | | | 9.86 | | | | 9.87 | | | | (0.05 | ) | | | (1.94 | ) | |
Year Ended 10/31/16 | | $ | 38.06 | | | | 0.02 | (c) | | | 2.88 | | | | 2.90 | | | | — | | | | (3.37 | ) | |
Year Ended 10/31/15 | | $ | 40.21 | | | | (0.05 | ) | | | 1.53 | | | | 1.48 | | | | — | | | | (3.63 | ) | |
Class R6 | |
Six Months Ended
4/30/20 (unaudited) | | $ | 45.66 | | | | 0.21 | (c) | | | (8.11 | ) | | | (7.90 | ) | | | (0.37 | ) | | | (2.08 | ) | |
Year Ended 10/31/19 | | $ | 46.38 | | | | 0.36 | (c) | | | 4.28 | | | | 4.64 | | | | (0.27 | ) | | | (5.09 | ) | |
Year Ended 10/31/18 | | $ | 48.69 | | | | 0.30 | (c) | | | — | (f) | | | 0.30 | | | | (0.37 | ) | | | (2.24 | ) | |
Year Ended 10/31/17 | | $ | 40.08 | | | | 0.21 | (c) | | | 10.58 | | | | 10.79 | | | | (0.24 | ) | | | (1.94 | ) | |
12/15/15(d) through
10/31/16 | | $ | 38.97 | | | | 0.13 | (c) | | | 4.54 | | | | 4.67 | | | | (0.19 | ) | | | (3.37 | ) | |
Class Y | |
Six Months Ended
4/30/20 (unaudited) | | $ | 45.39 | | | | 0.18 | (c) | | | (8.09 | ) | | | (7.91 | ) | | | (0.29 | ) | | | (2.08 | ) | |
Year Ended 10/31/19 | | $ | 46.13 | | | | 0.30 | (c) | | | 4.24 | | | | 4.54 | | | | (0.19 | ) | | | (5.09 | ) | |
Year Ended 10/31/18 | | $ | 48.33 | | | | 0.29 | (c) | | | (0.09 | ) | | | 0.20 | | | | (0.16 | ) | | | (2.24 | ) | |
Year Ended 10/31/17 | | $ | 39.84 | | | | 0.20 | (c) | | | 10.40 | | | | 10.60 | | | | (0.17 | ) | | | (1.94 | ) | |
Year Ended 10/31/16 | | $ | 40.10 | | | | 0.13 | (c) | | | 3.07 | | | | 3.20 | | | | (0.09 | ) | | | (3.37 | ) | |
Year Ended 10/31/15 | | $ | 42.06 | | | | 0.10 | | | | 1.59 | | | | 1.69 | | | | (0.02 | ) | | | (3.63 | ) | |
(a) Not annualized for periods less than one year.
(b) Annualized for periods less than one year.
(c) Per share net investment income (loss) has been calculated using the average daily shares method.
(d) Commencement of operations.
(e) Portfolio turnover is calculated on the basis of the Fund as a whole without distinguishing between the classes of shares issued.
(f) Rounds to less than $0.005.
See notes to financial statements.
22
Victory Portfolios | | Financial Highlights — continued | |
For a Share Outstanding Throughout Each Period
| | | | | Ratios to Average Net Assets | | Supplemental Data | |
| | | Total
Distributions | | Net Asset
Value,
End of
Period | | Total
Return
(Excludes
Sales
Charge)(a) | | Net
Expenses(b) | | Net
Investment
Income
(Loss)(b) | | Gross
Expenses(b) | | Net Assets,
End of
Period
(000's) | | Portfolio
Turnover(a)(e) | |
Victory Sycamore Small Company Opportunity Fund | |
Class A | |
Six Months Ended
4/30/20 (unaudited) | | | (2.28 | ) | | $ | 34.95 | | | | (18.68 | )% | | | 1.26 | % | | | 0.68 | % | | | 1.26 | % | | $ | 337,799 | | | | 19 | % | |
Year Ended 10/31/19 | | | (5.19 | ) | | $ | 45.16 | | | | 12.10 | % | | | 1.25 | % | | | 0.51 | % | | | 1.25 | % | | $ | 451,310 | | | | 34 | % | |
Year Ended 10/31/18 | | | (2.45 | ) | | $ | 45.91 | | | | 0.17 | % | | | 1.22 | % | | | 0.46 | % | | | 1.22 | % | | $ | 486,622 | | | | 43 | % | |
Year Ended 10/31/17 | | | (2.06 | ) | | $ | 48.23 | | | | 27.02 | % | | | 1.23 | % | | | 0.25 | % | | | 1.23 | % | | $ | 603,851 | | | | 36 | % | |
Year Ended 10/31/16 | | | (3.42 | ) | | $ | 39.74 | | | | 8.66 | % | | | 1.26 | % | | | 0.25 | % | | | 1.26 | % | | $ | 529,545 | | | | 59 | % | |
Year Ended 10/31/15 | | | (3.63 | ) | | $ | 40.01 | | | | 3.94 | % | | | 1.30 | % | | | 0.08 | % | | | 1.30 | % | | $ | 437,280 | | | | 53 | % | |
Class I | |
Six Months Ended
4/30/20 (unaudited) | | | (2.42 | ) | | $ | 35.35 | | | | (18.54 | )% | | | 0.93 | % | | | 1.00 | % | | | 0.93 | % | | $ | 3,816,616 | | | | 19 | % | |
Year Ended 10/31/19 | | | (5.35 | ) | | $ | 45.71 | | | | 12.49 | % | | | 0.92 | % | | | 0.82 | % | | | 0.92 | % | | $ | 4,584,086 | | | | 34 | % | |
Year Ended 10/31/18 | | | (2.60 | ) | | $ | 46.43 | | | | 0.49 | % | | | 0.88 | % | | | 0.76 | % | | | 0.88 | % | | $ | 4,127,411 | | | | 43 | % | |
Year Ended 10/31/17 | | | (2.17 | ) | | $ | 48.75 | | | | 27.44 | % | | | 0.90 | % | | | 0.56 | % | | | 0.90 | % | | $ | 4,003,419 | | | | 36 | % | |
Year Ended 10/31/16 | | | (3.54 | ) | | $ | 40.12 | | | | 8.99 | % | | | 0.96 | % | | | 0.56 | % | | | 0.96 | % | | $ | 2,428,803 | | | | 59 | % | |
Year Ended 10/31/15 | | | (3.72 | ) | | $ | 40.37 | | | | 4.30 | % | | | 0.96 | % | | | 0.40 | % | | | 0.96 | % | | $ | 2,049,885 | | | | 53 | % | |
Class R | |
Six Months Ended
4/30/20 (unaudited) | | | (2.22 | ) | | $ | 32.45 | | | | (18.73 | )% | | | 1.44 | % | | | 0.50 | % | | | 1.44 | % | | $ | 209,913 | | | | 19 | % | |
Year Ended 10/31/19 | | | (5.12 | ) | | $ | 42.05 | | | | 11.89 | % | | | 1.44 | % | | | 0.32 | % | | | 1.44 | % | | $ | 279,090 | | | | 34 | % | |
Year Ended 10/31/18 | | | (2.36 | ) | | $ | 43.13 | | | | (0.06 | )% | | | 1.44 | % | | | 0.23 | % | | | 1.44 | % | | $ | 286,480 | | | | 43 | % | |
Year Ended 10/31/17 | | | (1.99 | ) | | $ | 45.47 | | | | 26.73 | % | | | 1.45 | % | | | 0.03 | % | | | 1.45 | % | | $ | 333,944 | | | | 36 | % | |
Year Ended 10/31/16 | | | (3.37 | ) | | $ | 37.59 | | | | 8.42 | % | | | 1.48 | % | | | 0.05 | % | | | 1.48 | % | | $ | 302,652 | | | | 59 | % | |
Year Ended 10/31/15 | | | (3.63 | ) | | $ | 38.06 | | | | 3.73 | % | | | 1.52 | % | | | (0.13 | )% | | | 1.52 | % | | $ | 274,917 | | | | 53 | % | |
Class R6 | |
Six Months Ended
4/30/20 (unaudited) | | | (2.45 | ) | | $ | 35.31 | | | | (18.49 | )% | | | 0.87 | % | | | 1.04 | % | | | 0.87 | % | | $ | 286,960 | | | | 19 | % | |
Year Ended 10/31/19 | | | (5.36 | ) | | $ | 45.66 | | | | 12.52 | % | | | 0.87 | % | | | 0.84 | % | | | 0.87 | % | | $ | 277,218 | | | | 34 | % | |
Year Ended 10/31/18 | | | (2.61 | ) | | $ | 46.38 | | | | 0.52 | % | | | 0.87 | % | | | 0.62 | % | | | 0.87 | % | | $ | 195,360 | | | | 43 | % | |
Year Ended 10/31/17 | | | (2.18 | ) | | $ | 48.69 | | | | 27.44 | % | | | 0.90 | % | | | 0.46 | % | | | 0.90 | % | | $ | 85,307 | | | | 36 | % | |
12/15/15(d) through
10/31/16 | | | (3.56 | ) | | $ | 40.08 | | | | 12.86 | % | | | 0.98 | % | | | 0.39 | % | | | 1.12 | % | | $ | 21,044 | | | | 59 | % | |
Class Y | |
Six Months Ended
4/30/20 (unaudited) | | | (2.37 | ) | | $ | 35.11 | | | | (18.58 | )% | | | 1.06 | % | | | 0.88 | % | | | 1.06 | % | | $ | 27,080 | | | | 19 | % | |
Year Ended 10/31/19 | | | (5.28 | ) | | $ | 45.39 | | | | 12.31 | % | | | 1.07 | % | | | 0.69 | % | | | 1.07 | % | | $ | 31,016 | | | | 34 | % | |
Year Ended 10/31/18 | | | (2.40 | ) | | $ | 46.13 | | | | 0.33 | % | | | 1.06 | % | | | 0.61 | % | | | 1.06 | % | | $ | 32,592 | | | | 43 | % | |
Year Ended 10/31/17 | | | (2.11 | ) | | $ | 48.33 | | | | 27.10 | % | | | 1.15 | % | | | 0.45 | % | | | 1.25 | % | | $ | 35,416 | | | | 36 | % | |
Year Ended 10/31/16 | | | (3.46 | ) | | $ | 39.84 | | | | 8.79 | % | | | 1.15 | % | | | 0.34 | % | | | 1.39 | % | | $ | 141,097 | | | | 59 | % | |
Year Ended 10/31/15 | | | (3.65 | ) | | $ | 40.10 | | | | 4.10 | % | | | 1.15 | % | | | 0.23 | % | | | 1.33 | % | | $ | 76,761 | | | | 53 | % | |
See notes to financial statements.
23
Victory Portfolios | | Notes to Financial Statements
April 30, 2020 | |
(Unaudited)
1. Organization:
Victory Portfolios (the "Trust") was organized on December 6, 1995 as a Delaware statutory trust as a successor to a company named "The Victory Portfolios," which was organized as a Massachusetts business trust on February 5, 1986. The Trust is registered under the Investment Company Act of 1940, as amended (the "1940 Act"), as an open-end investment company. The Trust is comprised of 42 funds and is authorized to issue an unlimited number of shares, which are units of beneficial interest with a par value of $0.001 per share. Each Fund is classified as diversified under the 1940 Act.
The accompanying financial statements are those of the following two Funds (collectively, the "Funds" and individually, a "Fund"):
Funds (Legal Name) | | Funds (Short Name)* | | Investment Share
Classes Offered | |
Victory Sycamore Established
Value Fund | | Sycamore Established Value Fund | | Class A, C, I, R, R6 and Y | |
Victory Sycamore Small Company
Opportunity Fund | | Sycamore Small Company
Opportunity Fund | | Class A, I, R, R6 and Y | |
* The Funds are generally closed to new investors. The Funds will continue to be available for investment (by direct purchase or exchange) by only: existing shareholders, investors that purchase shares through certain intermediaries, retirement plans that purchase shares through certain record keepers, and current and retired Fund trustees, officers, employees of Victory Capital Management Inc. and affiliated providers, and their family members.
Each class of shares of a Fund has substantially identical rights and privileges except with respect to sales charges, fees paid under distribution plans, expenses allocable exclusively to each class of shares, voting rights on matters solely affecting a single class of shares, and the exchange privilege of each class of shares.
Under the Trust's organizational documents, its officers and trustees are indemnified against certain liabilities arising out of the performance of their duties to the Funds. In addition, in the normal course of business, the Funds enter into contracts with their vendors and others that provide for general indemnifications. The Funds' maximum exposure under these arrangements is unknown, as this would involve future claims that may be made against the Funds. However, based on experience, the Funds expect that risk of loss to be remote.
2. Significant Accounting Policies:
The following is a summary of significant accounting policies followed by the Trust in the preparation of its financial statements. The policies are in conformity with generally accepted accounting principles in the United States of America ("GAAP"). The preparation of financial statements in accordance with GAAP requires management to make estimates and assumptions that affect the reported amounts of assets and liabilities and disclosure of contingent assets and liabilities at the date of the financial statements and the reported amounts of income and expenses for the period. Actual results could differ from those estimates. The Funds follow the specialized accounting and reporting requirements under GAAP that are applicable to investment companies.
Investment Valuation:
The Funds record investments at fair value. Fair value is defined as the price that would be received to sell an asset or paid to transfer a liability in an orderly transaction between market participants at the measurement date.
The valuation techniques described below maximize the use of observable inputs and minimize the use of unobservable inputs in determining fair value. The inputs used for valuing the Funds' investments are summarized in the three broad levels listed below:
• Level 1 — quoted prices in active markets for identical securities
24
Victory Portfolios | | Notes to Financial Statements — continued
April 30, 2020 | |
(Unaudited)
• Level 2 — other significant observable inputs (including quoted prices for similar securities or interest rates applicable to those securities, etc.)
• Level 3 — significant unobservable inputs (including the Funds' own assumptions in determining the fair value of investments)
Changes in valuation techniques may result in transfers in or out of an assigned level within the disclosure hierarchy. The inputs or methodologies used for valuation techniques are not necessarily an indication of the risk associated with entering into those investments.
Portfolio securities listed or traded on securities exchanges, including American Depositary Receipts ("ADRs") and Rights, are valued at the closing price on the exchange or system where the security is principally traded, if available, or at the Nasdaq Official Closing Price. If there have been no sales for that day on the exchange or system, then a security is valued at the last available bid quotation on the exchange or system where the security is principally traded. In each of these situations, valuations are typically categorized as Level 1 in the fair value hierarchy.
Investments in open-end investment companies are valued at net asset value. These valuations are typically categorized as Level 1 in the fair value hierarchy.
Investments for which there are no such quotations, or for which quotations do not appear reliable, are valued at fair value in accordance with procedures established by and under the general supervision and responsibility of the Trust's Board of Trustees (the "Board"). These valuations are typically categorized as Level 2 or Level 3 in the fair value hierarchy, based on the observability of inputs used to determine the fair value.
A summary of the valuations as of April 30, 2020, based upon the three levels defined above, is included in the table below while the breakdown, by category, of investments is disclosed on the Schedules of Portfolio Investments (amounts in thousands).
| | | Level 1 | | Level 2 | | Level 3 | | Total | |
Sycamore Established Value Fund | |
Common Stocks | | $ | 9,565,804 | | | $ | — | | | $ | — | | | $ | 9,565,804 | | |
Exchange-Traded Funds | | | 137,784 | | | | — | | | | — | | | | 137,784 | | |
Collateral for Securities Loaned | | | 104,016 | | | | — | | | | — | | | | 104,016 | | |
Total | | $ | 9,807,604 | | | $ | — | | | $ | — | | | $ | 9,807,604 | | |
Sycamore Small Company Opportunity Fund | |
Common Stocks | | $ | 4,512,506 | | | $ | — | | | $ | — | | | $ | 4,512,506 | | |
Exchange-Traded Funds | | | 53,171 | | | | — | | | | — | | | | 53,171 | | |
Collateral for Securities Loaned | | | 106,405 | | | | — | | | | — | | | | 106,405 | | |
Total | | $ | 4,672,082 | | | $ | — | | | $ | — | | | $ | 4,672,082 | | |
For the six months ended April 30, 2020, there were no transfers in or out of the Level 3 fair value hierarchy.
Real Estate Investment Trusts ("REITs"):
The Funds may invest in REITs, which report information on the source of their distributions annually. REITs are pooled investment vehicles that invest primarily in income producing real estate or real estate related loans or interests (such as mortgages). Certain distributions received from REITs during the year are recorded as realized gains or return of capital as estimated by the Funds or when such information becomes known.
Investment Companies:
Exchange-Traded Funds ("ETFs"):
The Funds may invest in ETFs. ETFs are a type of index fund, the shares of which are bought and sold on a securities exchange. An ETF trades like common stock and represents a fixed portfolio of securities
25
Victory Portfolios | | Notes to Financial Statements — continued
April 30, 2020 | |
(Unaudited)
designed to track the performance and dividend yield of a particular domestic or foreign market index. A Fund may purchase shares of an ETF to temporarily gain exposure to a portion of the U.S. or a foreign market while awaiting purchase of underlying securities. The risks of owning an ETF generally reflect the risks of owning the underlying securities they are designed to track, although the lack of liquidity of an ETF could result in it being more volatile. Additionally, ETFs have fees and expenses that reduce their value.
Open-End Funds:
The Funds may invest in portfolios of open-end investment companies. These investment companies value securities in their portfolios for which market quotations are readily available at their market values (generally the last reported sale price) and all other securities and assets at their fair value by the methods established by the board of directors of the underlying funds.
Investment Transactions and Related Income:
Changes in holdings of investments are accounted for no later than one business day following the trade date. For financial reporting purposes, however, investment transactions are accounted for on trade date on the last business day of the reporting period. Interest income is determined on the basis of coupon interest accrued using the effective interest method which adjusts, where applicable, the amortization of premiums or accretion of discounts. Dividend income is recorded on the ex-dividend date. Gains or losses realized on sales of securities are recorded on the identified cost basis. Paydown gains or losses on applicable securities, if any, are recorded as components of Interest income on the Statements of Operations.
Withholding taxes on interest, dividends and gains as a result of certain investments in ADRs by the Funds have been provided for in accordance with each investment's applicable country's tax rules and rates.
Securities Lending:
The Trust has entered into a Master Securities Lending Agreement ("MSLA") with Citibank, N.A. ("Citibank" or the "Agent"). Under the terms of the MSLA, the Funds may lend securities to certain broker-dealers and banks in exchange for collateral in the amount of at least 102% of the value of U.S. securities loaned or at least 105% of the value of non-U.S. securities loaned, marked-to-market daily. Any collateral shortfalls associated with increases in the valuation of the securities loaned are adjusted the next business day. The collateral can be received in the form of cash collateral and/or non-cash collateral. Non-cash collateral can include U.S. Government Securities, letters of credit and certificates of deposit. The cash collateral is invested in short-term instruments or cash equivalents, primarily open-end investment companies, as noted in the Funds' Schedules of Portfolio Investments. The Trust does not have effective control of the non-cash collateral and therefore it is not disclosed on the Funds' Schedules of Portfolio Investments. During the time portfolio securities are on loan, the borrower will pay the Funds any dividends or interest paid on such securities plus any fee negotiated between the parties to the lending agreement. The Funds also earn a return from the collateral. The Funds pay the Agent various fees in connection with the investment of cash collateral and fees based on the investment income received from securities lending activities. Securities lending income (net of these fees) is disclosed on the Statements of Operations. Although risk is mitigated by the collateral, the Funds could experience a delay in recovering their securities and possible loss of income or value if the borrower fails to return them.
Securities lending transactions are entered into by a Fund under the MSLA, which permits the Fund, under certain circumstances such as an event of default, to offset amounts payable by the Fund to the same counterparty against amounts receivable from the counterparty to create a net payment due to or from the Fund.
The following table (amounts in thousands) is a summary of the Funds' securities lending transactions which are subject to offset under the MSLA as of April 30, 2020. These transactions are accounted for
26
Victory Portfolios | | Notes to Financial Statements — continued
April 30, 2020 | |
(Unaudited)
as secured borrowings with an overnight and continuous contractual maturity for cash collateral and greater than overnight and continuous contractual maturity for non-cash collateral.
| | | Gross
Amount of
Recognized
Assets
(Value of | | Value of
Cash | | Value of Non-cash Collateral
Received by Maturity | | | |
| | | Securities
on Loan) | | Collateral
Received* | | <30 Days | | Between
30 & 90 days | | >90 Days | | Net Amount | |
Sycamore Established
Value Fund | | $ | 98,612 | | | $ | 98,612 | | | $ | — | | | $ | — | | | $ | — | | | $ | — | | |
Sycamore Small Company
Opportunity Fund | | | 101,164 | | | | 101,164 | | | | — | | | | — | | | | — | | | | — | | |
* Collateral received in excess of the market value of securities on loan is not presented in this table. The total cash collateral received by each Fund is disclosed in the Statements of Assets and Liabilities.
Distributions to Shareholders:
Dividends from net investment income, if any, are declared and paid quarterly for the Sycamore Established Value Fund. Dividends from net investment income, if any, are declared and paid annually for the Sycamore Small Company Opportunity Fund. Distributable net realized gains, if any, are declared and distributed at least annually from each Fund.
The amounts of dividends from net investment income and distributions from net realized gains (collectively, distributions to shareholders) are determined in accordance with federal income tax regulations, which may differ from GAAP. To the extent these "book/tax" differences are permanent in nature (e.g., net operating loss and distribution reclassification), such amounts are reclassified within the components of net assets based on their federal tax-basis treatment; temporary differences (e.g., wash sales) do not require reclassification. To the extent dividends and distributions exceed net investment income and net realized gains for tax purposes, they are reported as distributions of capital. Net investment losses incurred by a Fund may be reclassified as an offset to capital on the accompanying Statements of Assets and Liabilities.
Federal Income Taxes:
It is the policy of each Fund to continue to qualify as a regulated investment company by complying with the provisions available to certain investment companies, as defined in applicable sections of the Internal Revenue Code, and to make distributions of net investment income and net realized gains sufficient to relieve it from all, or substantially all, federal income taxes. Accordingly, no provision for federal income taxes is required in the financial statements. The Funds have a tax year end of October 31.
Management of the Funds has reviewed tax positions taken in tax years that remain subject to examination by all major tax jurisdictions, including federal (i.e., all open tax years and the interim tax period since then). Management believes that there is no tax liability resulting from unrecognized tax benefits related to uncertain tax positions taken.
Allocations:
Expenses directly attributable to a Fund are charged to the Fund, while expenses which are attributable to more than one fund in the Trust, or jointly with an affiliated trust, are allocated among the respective funds in the Trust and/or affiliated trust based upon net assets or another appropriate basis.
Income, expenses (other than class-specific expenses such as transfer agent fees, state registration fees, printing fees and 12b-1 fees), and realized and unrealized gains or losses on investments are allocated to each class of shares based on its relative net assets on the date income is earned or expenses and realized and unrealized gains and losses are incurred.
27
Victory Portfolios | | Notes to Financial Statements — continued
April 30, 2020 | |
(Unaudited)
3. Purchases and Sales of Securities:
Purchases and sales of securities (excluding securities maturing less than one year from acquisition) for the six months ended April 30, 2020, were as follows (amounts in thousands):
| | | Purchases | | Sales | |
Sycamore Established Value Fund | | $ | 3,002,642 | | | $ | 2,610,769 | | |
Sycamore Small Company Opportunity Fund | | | 1,190,720 | | | | 993,715 | | |
For the six months ended April 30, 2020, there were no purchases or sales of U.S. Government Securities.
4. Fees and Transactions with Affiliates and Related Parties:
Investment advisory services are provided to the Funds by Victory Capital Management Inc. ("VCM" or the "Adviser"), a New York corporation registered as an investment adviser with the Securities and Exchange Commission ("SEC"). The Adviser is a wholly owned indirect subsidiary of Victory Capital Holdings, Inc., a publicly traded Delaware Corporation and a wholly owned direct subsidiary of Victory Capital Operating, LLC.
Under the terms of the Investment Advisory Agreement, the Adviser is entitled to receive fees based on a percentage of the average daily net assets of each Fund. The rates at which the Adviser is paid by each Fund are included in the table below. The Adviser may use its resources to assist with the Funds' distribution and marketing expenses.
| | Tier Rate | |
Sycamore Established Value Fund | |
Up to $100 million | | | 0.65 | % | |
$100 million — $200 million | | | 0.55 | % | |
Over $200 million | | | 0.45 | % | |
Sycamore Small Company Opportunity Fund | |
Up to $500 million | | | 0.85 | % | |
Over $500 million | | | 0.75 | % | |
VCM also serves as the Funds' administrator and fund accountant. Under an Administration and Fund Accounting Agreement, VCM is paid for its services an annual fee at a rate of 0.08% of the first $15 billion in average daily net assets of the Trust, Victory Variable Insurance Funds and Victory Portfolios II (collectively, the "Victory Funds Complex"), 0.05% of the average daily net assets above $15 billion to $30 billion of the Victory Funds Complex and 0.04% of the average daily net assets over $30 billion of the Victory Funds Complex.
Citi Fund Services Ohio, Inc. ("Citi"), an affiliate of Citibank, acts as sub-administrator and sub-fund accountant to the Funds pursuant to a Sub-Administration and Sub-Fund Accounting Services Agreement between VCM and Citi. VCM pays Citi a fee for providing these services. The Trust reimburses VCM and Citi for all of their reasonable out-of-pocket expenses incurred in providing these services.
FIS Investor Services, LLC ("FIS") serves as the Funds' transfer agent. Under the Transfer Agent Agreement, the Trust pays FIS a fee for its services and reimburses FIS for all of their reasonable out-of-pocket expenses incurred in providing these services.
The Chief Compliance Officer ("CCO") is an employee of the Adviser, which pays the compensation of the CCO and his support staff. The Trust has entered into an Agreement to provide compliance services with the Adviser, pursuant to which the Adviser furnishes its compliance personnel, including the services of the CCO, and other resources reasonably necessary to provide the Trust with compliance oversight services related to the design, administration and oversight of a compliance program for the Trust in accordance with Rule 38a-1 under the 1940 Act. The Funds in the Victory Funds Complex, in aggregate, compensate the Adviser for these services.
The Victory Funds Complex pays an annual retainer to each Independent Trustee, plus an additional annual retainer to the Chairman of the Board. The aggregate amount of the fees and expenses of the
28
Victory Portfolios | | Notes to Financial Statements — continued
April 30, 2020 | |
(Unaudited)
Independent Trustees are allocated amongst all the funds in the Victory Funds Complex and are presented in the Statements of Operations.
Sidley Austin LLP provides legal services to the Trust.
Victory Capital Advisers, Inc. (the "Distributor"), an affiliate of the Adviser, serves as distributor for the continuous offering of the shares of the Funds pursuant to a Distribution Agreement between the Distributor and the Trust. Effective on or about June 30, 2020, the Distributor's name will change to Victory Capital Services, Inc. Pursuant to the Distribution and Service Plans adopted in accordance with Rule 12b-1 under the 1940 Act, the Distributor may receive a monthly distribution and service fee, at an annual rate of up to 0.25% of the average daily net assets of Class A Shares, at an annual rate of up to 0.50% of the average daily net assets of Class R Shares of the Funds, and 1.00% of the average daily net assets of Class C Shares of the Funds. The distribution and service fees paid to the Distributor may be used by the Distributor to pay for activities primarily intended to result in the sale of Class A, Class R or Class C Shares of the Funds.
In addition, the Distributor is entitled to receive commissions on sales of the Class A Shares of the Funds. For the six months ended April 30, 2020, the Distributor received approximately $24 thousand from commissions earned on sales of Class A Shares of the Funds.
The Adviser has entered into expense limitation agreements with certain Funds. Under the terms of the agreements, the Adviser has agreed to waive fees or reimburse certain expenses to the extent that ordinary operating expenses incurred by certain classes of a Fund in any fiscal year exceed the expense limit for such classes of the Fund. Such excess amounts will be the liability of the Adviser. Interest, taxes, brokerage commissions, other expenditures which are capitalized in accordance with GAAP, and other extraordinary expenses not incurred in the ordinary course of a Fund's business are excluded from the expense limits. As of April 30, 2020, the expense limits (excluding voluntary waivers) are as follows:
| | | In effect November 1, 2019 until February 28, 2021 | |
| | | Class A
Shares | | Class C
Shares | | Class I
Shares | | Class R
Shares | | Class R6
Shares | | Class Y
Shares | |
Sycamore Established
Value Fund | | | N/A | | | | 1.84 | % | | | N/A | | | | N/A | | | | N/A | | | | N/A | | |
Sycamore Small Company
Opportunity Fund | | | N/A | | | | N/A | | | | N/A | | | | N/A | | | | N/A | | | | 1.15 | % | |
The Funds have agreed to repay fees and expenses that were waived or reimbursed by the Adviser for a period up to three fiscal years after such waiver or reimbursement was made to the extent such payments or repayments would not cause the expenses of a class to exceed the original expense limitation in place at time of the waiver or reimbursement or any expense limitation agreement in place at the time of repayment. Amounts repaid to the Adviser during the six months ended April 30, 2020, if any, are reflected on the Statements of Operations as Recoupment of prior expenses waived/reimbursed by Adviser.
As of April 30, 2020, the following amounts are available to be repaid to the Adviser (amounts in thousands).
| | | Expires
10/31/2020 | | Total | |
Sycamore Small Company Opportunity Fund | | $ | 79 | | | $ | 79 | | |
The Adviser may voluntarily waive or reimburse additional fees to assist the Funds in maintaining competitive expense ratios. Voluntary waivers and reimbursements applicable to the Funds are not available to be recouped at a future time. There were no voluntary waivers or reimbursements for the six months ended April 30, 2020.
Certain officers and/or interested trustees of the Funds are also officers and/or employees of the Adviser, Administrator, Fund Accountant, Sub-Administrator, Sub-Fund Accountant, and Legal Counsel.
29
Victory Portfolios | | Notes to Financial Statements — continued
April 30, 2020 | |
(Unaudited)
5. Risks:
Each Fund may be subject to other risks in addition to these identified risks.
An investment in the Funds' shares represents an indirect investment in the securities owned by the Funds, some of which will be traded on a national securities exchange or in the over-the-counter markets. The value of the securities in which the Funds invest, like other market investments, may move up or down, sometimes rapidly and unpredictably. The value of the securities in which the Funds invest may affect the value of the Funds' shares. An investment in the Funds' shares at any point in time may be worth less than the original investment, even after taking into account the reinvestment of the Funds' distributions.
The Funds will be subject to credit risk with respect to the amount each expects to receive from counterparties for financial instruments entered into by the Funds. The Funds may be negatively impacted if a counterparty becomes bankrupt or otherwise fails to perform its obligations due to financial difficulties. The Funds may experience significant delays in obtaining any recovery in bankruptcy or other reorganization proceeding and the Funds may obtain only limited recovery or may obtain no recovery in such circumstances. The Funds typically enter into transactions with counterparties whose credit ratings are investment grade, as determined by a nationally recognized statistical rating organization or, if unrated, judged by the Adviser to be of comparable quality.
6. Borrowing and Interfund Lending:
Line of Credit:
For the six months ended April 30, 2020, the Victory Funds Complex participated in a short-term demand note "Line of Credit" agreement with Citibank. Under the agreement with Citibank, prior to July 1, 2019, Victory Funds Complex could borrow up to $250 million, of which $100 million was committed and $150 million was uncommitted. Effective July 1, 2019, the agreement was amended to include the USAA Mutual Funds Complex (another series of mutual funds managed by the Adviser) and has a new termination date of June 29, 2020. Under this amended agreement, the Victory Funds Complex and USAA Mutual Funds Complex, combined, may borrow up to $600 million, of which $300 million is committed and $300 million is uncommitted. $40 million of the Line of Credit is reserved for use by the Victory Floating Rate Fund (herein, the "Fund"), another series of the Victory Funds Complex, with that Fund paying the related commitment fees for that amount. The purpose of the agreement is to meet temporary or emergency cash needs. For the six months ended April 30, 2020, Citibank received an annual commitment fee of 0.15% on $300 million for providing the Line of Credit. For the six months ended April 30, 2020, Citibank earned approximately $225 thousand in commitment fees from the combined Victory Funds Complex and USAA Mutual Funds Complex. Each fund in the Victory Funds Complex and the USAA Mutual Funds Complex pay a pro-rata portion of the commitment fees plus any interest (one month LIBOR plus one percent) on amounts borrowed. Interest charged to each Fund during the period, if applicable, is presented on the Statements of Operations under Line of credit fees.
The Funds did not utilize the Line of Credit during the six months ended April 30, 2020.
Interfund Lending:
The Trust and Adviser rely on an exemptive order granted by the SEC in March 2017 (the "Order"), permitting the establishment and operation of an Interfund Lending Facility (the "Facility"). The Facility allows each Fund to directly lend and borrow money to or from any other Victory Fund relying upon the Order at rates beneficial to both the borrowing and lending funds. Advances under the Facility are allowed for temporary or emergency purposes, including the meeting of redemption requests that otherwise might require the untimely disposition of securities, and are subject to each fund's borrowing restrictions. The interfund loan rate is determined, as specified in the Order, by averaging the current repurchase agreement rate and the current bank loan rate. As a Borrower, interest charged to each Fund during the period, if applicable, is presented on the Statements of Operations under Interfund lending fees. As a Lender, interest earned by each Fund during the period, if applicable, is presented on the Statements of Operations under Interfund lending income.
30
Victory Portfolios | | Notes to Financial Statements — continued
April 30, 2020 | |
(Unaudited)
The average borrowing and lending for the days outstanding and average interest rate for each Fund during the six months ended April 30, 2020, were as follows (amounts in thousands):
| | | Borrower or
Lender | | Amount
Outstanding at
April 30, 2020 | | Average
Lending* | | Days
Lending
Outstanding | | Average
Interest
Rate* | | Maximum
Lending
During the
Period | |
Sycamore Established
Value Fund | | Lender | | $ | — | | | $ | 12,351 | | | | 78 | | | | 1.90 | % | | $ | 66,694 | | |
Sycamore Small
Company Opportunity
Fund | | Lender | | | — | | | | 11,414 | | | | 2 | | | | 0.83 | % | | | 20,857 | | |
* For the six months ended April 30, 2020, based on the number of days borrowings were outstanding.
7. Federal Income Tax Information:
The tax character of distributions paid and the tax basis of current components of accumulated earnings (deficit) will be determined at the end of the current tax year ending October 31, 2020.
As of the most recent tax year ended October 31, 2019, the Funds had no capital loss carryforwards for federal income tax purposes.
8. Affiliated Securities:
An affiliated security is a security in which the Fund has ownership of at least 5% of the security's outstanding voting shares or an investment company managed by VCM. Transactions in affiliated securities during the six months ended April 30, 2020, were as follows (amounts in thousands):
| | Value
10/31/2019 | | Purchases
at Cost | | Proceeds
from
Sales | | Realized
Gain
(Loss) | | Capital
Gain
Distributions | | Net
Change in
Unrealized
Appreciation/
Depreciation | | Value
4/30/2020 | | Dividend
Income | |
Sycamore
Small Company
Opportunity Fund | |
ADTRAN, Inc. | | $ | 23,764 | | | $ | 386 | | | $ | — | | | $ | — | | | $ | — | | | $ | 4,167 | | | $ | 28,317 | | | $ | 486 | | |
Angiodynamics, Inc. | | | 58,613 | | | | 3,341 | | | | — | | | | — | | | | — | | | | (19,728 | ) | | | 42,226 | | | | — | | |
Core-Mark Holding
Co., Inc. | | | 63,584 | | | | 23,861 | | | | (15,196 | ) | | | (3,969 | ) | | | — | | | | 695 | | | | 68,975 | | | | 653 | | |
Cutera, Inc. | | | — | | | | 34,961 | | | | — | | | | — | | | | — | | | | (19,664 | ) | | | 15,297 | | | | — | | |
Hanger, Inc. | | | 49,146 | | | | — | | | | (2,512 | ) | | | (265 | ) | | | — | | | | (8,884 | ) | | | 37,485 | | | | — | | |
NETGEAR, Inc. | | | 41,915 | | | | 9,277 | | | | — | | | | — | | | | — | | | | (4,404 | ) | | | 46,788 | | | | — | | |
The E.W. Scripps Co.,
Class A | | | 51,725 | | | | 6,075 | | | | — | | | | — | | | | — | | | | (22,904 | ) | | | 34,896 | | | | 409 | | |
Stewart Information
Services Corp. | | | 41,198 | | | | 12,253 | | | | — | | | | — | | | | — | | | | (10,096 | ) | | | 43,355 | | | | 683 | | |
Total | | $ | 329,945 | | | $ | 90,154 | | | $ | (17,708 | ) | | $ | (4,234 | ) | | $ | — | | | $ | (80,818 | ) | | $ | 317,339 | | | $ | 2,231 | | |
9. Fund Ownership:
Ownership of more than 25% of the voting securities of a fund creates presumptions of control of the fund, under section 2(a)(9) of the 1940 Act. As of April 30, 2020, the shareholder listed below held more than 25% of the shares outstanding of the Funds and may be deemed to control those Funds.
| | | Shareholder | | Percent | |
Sycamore Small Company Opportunity Fund | | Edward D. Jones & Co., L.P. | | | 25.1 | % | |
31
Victory Portfolios | | Notes to Financial Statements — continued
April 30, 2020 | |
(Unaudited)
10. Liquidity Risk Management Program:
The Victory Funds have adopted and implemented a written liquidity risk management program (the "LRMP") as required by Rule 22e-4 under the Act. The LRMP is reasonably designed to assess and manage each Fund's liquidity risk, taking into consideration each Fund's investment strategy and the liquidity of its portfolio investments during normal and reasonably foreseeable stressed market conditions; its short and long-term cash flow projections; and its cash holdings and access to other liquidity management tools such as available funding sources including the Victory Funds Complex Interfund Lending Facility and Line of Credit (discussed in the Notes to Financial Statements). The Board approved the appointment of VCM as the administrator of the LRMP. At an in-person meeting held on February 20, 2020, VCM provided an oral and written report to the Trustees on the operation and effectiveness of the LRMP during the previous year.
VCM manages liquidity risks associated with the Funds' investments by monitoring, among other things, cash and cash equivalents, any use of derivatives, the concentration of investments, the appropriateness of each Fund's investment strategy, and by classifying every fund investment as either highly liquid, moderately liquid, less liquid or illiquid on at least a monthly basis. To assist with the classification of Fund investments, VCM has retained a third-party provider of liquidity evaluation services. This provider determines preliminary liquidity classifications for all portfolio holdings based upon portfolio-level data and certain assumptions provided by VCM. VCM reviews the preliminary liquidity classifications and, when appropriate, considers other information including input from the Funds' portfolio managers (including the portfolio managers employed by any investment sub-advisers) in determining final liquidity classifications.
The report from VCM concluded that the Funds did not experience any significant liquidity challenges during the covered period, and the Funds' LRMP is reasonably designed to assess and manage its liquidity risk. The report also concluded that the LRMP continues to operate adequately and effectively to enable VCM to oversee and manage liquidity risk and ensure each Fund is able to meet redemption requests without significant dilution to the remaining investors' interest in each Fund. During the review period, each Fund's portfolio consisted primarily of highly liquid investments, which are defined as cash and any investments reasonably expected to be converted to cash in current market conditions in three business days or less without significantly changing the market value of the investment. Therefore, the Fund has not adopted a Highly Liquid Investment Minimum. The Funds' investments were below the limitation on illiquid investments during the review period. Additionally, VCM indicated that no events occurred that would require the filing of Form N-LIQUID and recommended no material changes to the LRMP.
11. Subsequent Events:
An outbreak of respiratory disease called COVID-19 was first detected in China in December 2019 and subsequently spread internationally. The transmission of COVID-19 and efforts to contain its spread have resulted in international, national and local border closings and other significant travel restrictions and disruptions, significant disruptions to business operations, supply chains and consumer activity, significant challenges in healthcare service preparation and delivery, quarantines and general concern and uncertainty. These negative impacts have caused significant volatility and declines in global financial markets, which have caused losses for Fund investors during and subsequent to period end. The impact of the COVID-19 pandemic may be short term or may last for an extended period of time, and in either case could result in a substantial economic downturn or recession. Public health crises may exacerbate other pre-existing political, social, economic, market and financial risks. The extent of the impact to the financial performance of the Funds' investments will depend on future developments, including (i) the duration and spread of the outbreak, (ii) the restrictions and advisories, (iii) the effects on the financial markets, and (iv) the effects on the economy overall, all of which are highly uncertain and cannot be predicted.
32
Victory Portfolios | | Supplemental Information
April 30, 2020 | |
(Unaudited)
Proxy Voting and Portfolio Holdings Information
Proxy Voting:
Information regarding the policies and procedures each Fund uses to determine how to vote proxies relating to portfolio securities is available without charge, upon request, by calling 800-539-3863. The information is also included in the Funds' Statement of Additional Information, which is available on the SEC's website at www.sec.gov.
Information relating to how the Funds voted proxies relating to portfolio securities held during the most recent twelve months ended June 30 is available on the SEC's website at www.sec.gov.
Availability of Schedules of Portfolio Investments:
The Trust files a complete list of Schedules of Portfolio Investments with the SEC for the first and third quarter of each fiscal year on Form N-PORT. Forms N-PORT are available on the SEC's web site at www.sec.gov.
Expense Examples
As a shareholder of the Funds, you may incur two types of costs: (1) transaction costs, including sales charges (loads) on purchases; and (2) ongoing costs, including management fees, distribution and service (12b-1) fees and other Fund expenses. These examples are intended to help you understand your ongoing costs (in dollars) of investing in the Funds and to compare these costs with the ongoing costs of investing in other mutual funds.
These examples are based on an investment of $1,000 invested at the beginning of the period and held for the entire period from November 1, 2019 through April 30, 2020.
The Actual Expense figures in the table below provide information about actual account values and actual expenses. You may use the information below, together with the amount you invested, to estimate the expenses that you paid over the period. Simply divide your account value by $1,000 (for example, an $8,600 account value divided by $1,000 = 8.6), then multiply the result by the number in the table under the heading entitled "Actual Expenses Paid During Period" to estimate the expenses you paid on your account during this period.
The Hypothetical Expense figures in the table below provide information about hypothetical account values and hypothetical expenses based on each Fund's actual expense ratio and an assumed rate of return of 5% per year before expenses, which is not the Fund's actual return. The hypothetical account values and expenses may not be used to estimate the actual ending account balance or expenses you paid for the period. You may use this information to compare this 5% hypothetical example with the 5% hypothetical examples that appear in shareholder reports of other funds.
Please note the expenses shown in the table are meant to highlight your ongoing costs only and do not reflect any transactional costs. Therefore, the table is useful in comparing ongoing costs only, and will not help you determine the relative total costs of owning different funds. In addition, if these transactional costs were included, your costs would have been higher.
33
Victory Portfolios | | Supplemental Information — continued
April 30, 2020 | |
(Unaudited)
| | | Beginning
Account
Value
11/1/19 | | Actual
Ending
Account
Value
4/30/20 | | Hypothetical
Ending
Account
Value
4/30/20 | | Actual
Expenses
Paid
During
Period
11/1/19-
4/30/20* | | Hypothetical
Expenses
Paid
During
Period
11/1/19-
4/30/20* | | Annualized
Expense
Ratio
During
Period
11/1/19-
4/30/20 | |
Sycamore Established Value Fund | |
Class A Shares | | $ | 1,000.00 | | | $ | 838.90 | | | $ | 1,020.29 | | | $ | 4.21 | | | $ | 4.62 | | | | 0.92 | % | |
Class C Shares | | | 1,000.00 | | | | 835.90 | | | | 1,016.46 | | | | 7.71 | | | | 8.47 | | | | 1.69 | % | |
Class I Shares | | | 1,000.00 | | | | 840.20 | | | | 1,021.88 | | | | 2.75 | | | | 3.02 | | | | 0.60 | % | |
Class R Shares | | | 1,000.00 | | | | 837.90 | | | | 1,019.24 | | | | 5.16 | | | | 5.67 | | | | 1.13 | % | |
Class R6 Shares | | | 1,000.00 | | | | 840.30 | | | | 1,022.03 | | | | 2.61 | | | | 2.87 | | | | 0.57 | % | |
Class Y Shares | | | 1,000.00 | | | | 840.00 | | | | 1,021.73 | | | | 2.88 | | | | 3.17 | | | | 0.63 | % | |
Sycamore Small Company Opportunity Fund | |
Class A Shares | | | 1,000.00 | | | | 813.20 | | | | 1,018.60 | | | | 5.68 | | | | 6.32 | | | | 1.26 | % | |
Class I Shares | | | 1,000.00 | | | | 814.60 | | | | 1,020.24 | | | | 4.20 | | | | 4.67 | | | | 0.93 | % | |
Class R Shares | | | 1,000.00 | | | | 812.70 | | | | 1,017.70 | | | | 6.49 | | | | 7.22 | | | | 1.44 | % | |
Class R6 Shares | | | 1,000.00 | | | | 815.10 | | | | 1,020.54 | | | | 3.93 | | | | 4.37 | | | | 0.87 | % | |
Class Y Shares | | | 1,000.00 | | | | 814.20 | | | | 1,019.59 | | | | 4.78 | | | | 5.32 | | | | 1.06 | % | |
* Expenses are equal to the average account value multiplied by the Fund's annualized expense ratio multiplied by 182/366 (the number of days in the most recent fiscal half-year divided by the number of days in the fiscal year).
34
Victory Portfolios | | Supplemental Information — continued
April 30, 2020 | |
(Unaudited)
Considerations of the Board in Continuing the Investment Advisory Agreement (the "Agreement")
The Board approved the Agreement on behalf of each of the Funds at an in-person meeting, which was called for that purpose, on December 4, 2019. The Board also considered information relating to the Funds and the Agreement provided throughout the year and, more specifically, at a meeting on October 22, 2019. In considering whether to approve the Agreement, the Board requested, and the Adviser provided, information that the Board believed to be reasonably necessary to reach its conclusions.
The Board, including the Independent Trustees, evaluated this information along with other information obtained throughout the year and was advised by legal counsel to the Funds, which also serves as independent legal counsel to the Independent Trustees. In addition, in 2017 the Independent Trustees, through their counsel, retained an independent consultant to assist with a review of the overall process for conducting the annual review of these advisory arrangements.
The Board considered each Fund's advisory fee, expense ratio and investment performance as significant factors in determining whether the Agreement should be continued. In considering whether the compensation paid to the Adviser was fair and reasonable, the Board also evaluated, among other things, the following factors:
• The requirements of the Funds for the services provided by the Adviser;
• The nature, quality and extent of the services provided and expected to be provided;
• The performance of the Funds as compared to comparable funds;
• The fees payable for the services and whether the fee arrangements provided for economies of scale that would benefit Fund shareholders as the Funds grow;
• Whether the fee would be sufficient to enable the Adviser to attract and retain experienced personnel and continue to provide quality services to the Funds;
• The fees paid by other clients of the Adviser whose accounts are managed in a similar investment style and any differences in the services provided to the other clients compared to those provided to the Funds;
• The total expenses of each Fund, taking into consideration any distribution or shareholder servicing fees;
• Management's commitment to operating the Funds at competitive expense levels;
• The profitability of the Adviser (as reflected by comparing fees earned against an estimate of the Adviser's costs) with respect to the Adviser's relationship with the Funds;
• Research and other service benefits received by the Adviser obtained through payment of client commissions for securities transactions;
• Other indirect benefits received by the Adviser, and its affiliates, including revenues paid to the Adviser, or its affiliates, by the Funds for administration and fund accounting services, and distribution;
• The capabilities and financial condition of the Adviser;
• Current economic and industry trends; and
• The historical relationship between each Fund and the Adviser.
The Board reviewed each Fund's current management fee, comprised of the advisory fee plus the administrative services fee paid to the Adviser, in the context of the Adviser's profitability with respect to each Fund individually. In addition, the Board compared each Fund's gross management fees and total operating expense ratio on a net and gross basis, taking into consideration any distribution or shareholder servicing fees, with the median gross management fee and median expense ratio of a universe of comparable mutual funds compiled by an independent consultant and a peer group of funds with similar investment strategies selected by that independent consultant from the universe. The Board reviewed the factors and methodology used by the independent consultant in the selection of each Fund's peer group, including the independent consultant's selection of a broad universe of funds, the more specific universe of comparable funds, and peer groups of funds with comparable investment strategies and asset levels, among other factors. The Board also reviewed any changes to the independent consultant's methodology as compared to the prior year, including those resulting from the Adviser's input, if any. With respect to certain Funds, the Board also reviewed fees and other information related to the Adviser's management of similarly managed institutional or private accounts, and the differences in the
35
Victory Portfolios | | Supplemental Information — continued
April 30, 2020 | |
(Unaudited)
services provided to these other accounts. The Board also noted that the breakpoints in the advisory fee schedule for some of the Funds evidenced one way in which the Adviser has shown a willingness to share in its economies of scale.
The Board found that the gross annual management fee paid by each Fund was within the range of management fees paid by each Fund's respective peer group. The Board noted that each Fund's advisory fee structure contained at least one breakpoint. The Board also found that each Fund's Class A net annual expense ratio, taking into account any shareholder servicing or distribution fees, was reasonable as compared with each Fund's respective peer group. The Board considered the Adviser's contractual agreement with each Fund to waive its fees and reimburse expenses of certain classes for a specified period of time, as described in the Fund's prospectus.
The Board reviewed each Fund's performance over one-, three-, five- and ten-year periods (as applicable) against the performance of the Fund's selected peer group and benchmark index. The Board recognized that the performance of the Funds and the peer group funds are net of expenses, while the performance of the benchmark index reflects gross returns. The Board considered the additional resources that the Adviser has committed to enhance portfolio analysis, compliance and trading systems.
The Board reviewed various other specific factors with respect to each Fund, as described below. In their deliberations, the Trustees did not rank the importance of any particular information or factor considered and each Trustee may have attributed different weights to various factors.
Sycamore Established Value Fund:
The Board compared the Fund's Class A performance for the one-, three-, five- and ten-year periods ended June 30, 2019, to that of the median performance of the peer group and benchmark index for the same periods and considered the fact that the Fund outperformed both the benchmark index and the peer group median for all of the periods reviewed.
Having considered, among other things: (1) the Fund's management fee compared to comparable mutual funds; (2) the Fund's total expense ratio compared to comparable mutual funds; (3) that the Adviser's willingness to limit the expenses of certain classes for a period of time would provide stability to the Fund's expenses for those share classes during that period; and (4) the Fund's performance during the periods reviewed, the Board concluded that the Agreement continued to be in the best interests of the Fund's shareholders.
Sycamore Small Company Opportunity Fund:
The Board compared the Fund's Class A performance for the one-, three-, five- and ten-year periods ended June 30, 2019, to that of the median performance of the peer group and benchmark index for the same periods and considered the fact that the Fund outperformed both the benchmark index and the peer group median for all of the periods reviewed.
Having considered, among other things: (1) the Fund's management fee compared to comparable mutual funds; (2) the Fund's total expense ratio compared to comparable mutual funds; (3) that the Adviser's willingness to limit the expenses of certain classes for a period of time would provide stability to the Fund's expenses for those share classes during that period; and (4) the Fund's performance during the periods reviewed, the Board concluded that the Agreement continued to be in the best interests of the Fund's shareholders.
Conclusion
Based on its review of the information requested and provided, and following extended discussions, the Board determined that the Agreement, on behalf of the Funds discussed above, was consistent with the best interests of each Fund and its shareholders, and the Board unanimously approved the Agreement, on behalf of each Fund, for an additional annual period on the basis of the foregoing review and discussions and the following considerations, among others:
• The fairness and reasonableness of the investment advisory fee payable to the Adviser under the Agreement in light of the investment advisory services provided, the costs of these services, the profitability of the Adviser's relationship with the Fund and the comparability of the fee paid to the fees paid by other investment companies;
36
Victory Portfolios | | Supplemental Information — continued
April 30, 2020 | |
(Unaudited)
• The nature, quality and extent of the investment advisory services provided by the Adviser;
• The Adviser's entrepreneurial commitment to the management of the Funds and the creation of a broad-based family of funds, which could entail a substantial commitment of the Adviser's resources to the successful operation of the Funds;
• The Adviser's representations regarding its staffing and capabilities to manage the Funds, including the retention of personnel with relevant portfolio management experience;
• The Adviser's efforts to enhance investment results by, among other things, developing quality portfolio management teams; and
• The overall high quality of the personnel, operations, financial condition, investment management capabilities, methodologies and performance of the Adviser.
37
Privacy Policy
Protecting the Privacy of Information
The Trust respects your right to privacy. We also know that you expect us to conduct and process your business in an accurate and efficient manner. To do so, we must collect and maintain certain personal information about you. This is the information we collect from you on applications or other forms, and from the transactions you make with us or third parties. It may include your name, address, social security number, account transactions and balances, and information about investment goals and risk tolerance.
We do not disclose any information about you or about former customers to anyone except as permitted or required by law. Specifically, we may disclose the information we collect to companies that perform services on our behalf, such as the transfer agent that processes shareholder accounts and printers and mailers that assist us in the distribution of investor materials. We may also disclose this information to companies that perform marketing services on our behalf. This allows us to continue to offer you Victory investment products and services that meet your investing needs, and to effect transactions that you request or authorize. These companies will use this information only in connection with the services for which we hired them. They are not permitted to use or share this information for any other purpose.
To protect your personal information internally, we permit access only by authorized employees and maintain physical, electronic and procedural safeguards to guard your personal information.*
* You may have received communications regarding information about privacy policies from other financial institutions which gave you the opportunity to "opt-out" of certain information sharing with companies which are not affiliated with that financial institution. The Trust does not share information with other companies for purposes of marketing solicitations for products other than the Trust. Therefore, the Trust does not provide opt-out options to their shareholders.
Victory Funds
P.O. Box 182593
Columbus, Ohio 43218-2593

Visit our website at: | | Call Victory at: | |
www.vcm.com | | 800-539-FUND (800-539-3863) | |
Item 2. Code of Ethics.
Not applicable – only for annual reports.
Item 3. Audit Committee Financial Expert.
Not applicable – only for annual reports.
Item 4. Principal Accountant Fees and Services.
Not applicable – only for annual reports.
Item 5. Audit Committee of Listed Registrants.
Not applicable.
Item 6. Investments.
(a) Not applicable.
(b) Not applicable.
Item 7. Disclosure of Proxy Voting Policies and Procedures for Closed-End Management Investment Companies.
Not applicable.
Item 8. Portfolio Managers of Closed-End Management Investment Companies.
Not applicable.
Item 9. Purchases of Equity Securities by Closed-End Management Investment Company and Affiliated Purchasers.
Not applicable.
Item 10. Submission of Matters to a Vote of Security Holders.
Not applicable.
Item 11. Controls and Procedures.
(a)The registrant’s principal executive officer and principal financial officer have concluded, based on their evaluation of the registrant's disclosure controls and procedures as conducted within 90 days of the filing date of this report, that these disclosure controls and procedures are adequately designed and are operating effectively to ensure that information required to be disclosed by the registrant on Form N-CSR is recorded, processed, summarized and reported within the time periods specified in the Securities and Exchange Commission's rules and forms.
(b)There were no changes in the registrant’s internal control over financial reporting (as defined in Rule 30a-3(d) under the Investment Company Act of 1940 (17 CFR 270.30a-3(d)) that occurred during the period covered by this report that have materially affected or are reasonably likely to materially affect, the registrant’s internal control over financial reporting.
Item 12. Disclosure of Securities Lending Activities for Closed-End Management Investment Companies.
(a)(1) Not applicable.
(a)(2) Not applicable.
(a)(3) Not applicable.
(a)(4) Not applicable.
(b) Not applicable.
Item 13. Exhibits.
(a)(1) Not applicable.
(a)(2) Certifications pursuant to Rule 30a-2(a) are attached hereto.
(a)(3) Not applicable.
(b) Certifications pursuant to Rule 30a-2(b) are furnished herewith.
SIGNATURES
Pursuant to the requirements of the Securities Exchange Act of 1934 and the Investment Company Act of 1940, the registrant
has duly caused this report to be signed on its behalf by the undersigned, thereunto duly authorized.
| (Registrant) | Victory Portfolios | |
| By (Signature and Title)* | /s/ Allan Shaer | |
| | Allan Shaer, Principal Financial Officer | |
Pursuant to the requirements of the Securities Exchange Act of 1934 and the Investment Company Act of 1940, this report has been signed below by the following persons on behalf of the registrant and in the capacities and on the dates indicated.
| By (Signature and Title)* | /s/ Christopher K. Dyer | |
| | Christopher K. Dyer, Principal Executive Officer | |
| By (Signature and Title)* | /s/ Allan Shaer | |
| | Allan Shaer, Principal Financial Officer | |