UNITED STATES
SECURITIES AND EXCHANGE COMMISSION
Washington, D.C. 20549
FORM N-CSR
CERTIFIED SHAREHOLDER REPORT OF REGISTERED
MANAGEMENT INVESTMENT COMPANIES
Investment Company Act file number: 811-04852
Victory Portfolios
(Exact name of registrant as specified in charter)
| | 4900 Tiedeman Road, 4th Floor, Brooklyn, Ohio | 44144 | |
| | (Address of principal executive offices) | (Zip code) | |
Citi Fund Services Ohio, Inc., 4400 Easton Commons, Suite 200, Columbus, OH 43219
(Name and address of agent for service)
Registrant’s telephone number, including area code: 800-539-3863
Date of fiscal year end: October 31
Date of reporting period: April 30, 2021
Item 1. Reports to Stockholders.

April 30, 2021
Semi Annual Report
Victory Diversified Stock Fund
Victory NewBridge Large Cap Growth Fund
Victory Special Value Fund
Victory Strategic Allocation Fund
Victory INCORE Fund for Income
Victory INCORE Investment Grade Convertible Fund
www.vcm.com
News, Information And Education 24 Hours A Day, 7 Days A Week
The Victory Funds site gives fund shareholders, prospective shareholders, and investment professionals a convenient way to access fund information, get guidance, and track fund performance anywhere they can access the Internet. The site includes:
• Detailed performance records
• Daily share prices
• The latest fund news
• Investment resources to help you become a better investor
• A section dedicated to investment professionals
Whether you're a potential investor searching for the fund that matches your investment philosophy, a seasoned investor interested in planning tools, or an investment professional, www.vcm.com has what you seek. Visit us anytime. We're always open.
TABLE OF CONTENTS
Investment Objectives and Portfolio
Holdings | | | 4 | | |
Schedule of Portfolio Investments | |
Victory Diversified Stock Fund | | | 10 | | |
Victory NewBridge Large Cap Growth Fund | | | 13 | | |
Victory Special Value Fund | | | 15 | | |
Victory Strategic Allocation Fund | | | 18 | | |
Victory INCORE Fund for Income | | | 19 | | |
Victory INCORE Investment Grade Convertible Fund | | | 21 | | |
Financial Statements | | | |
Statements of Assets and Liabilities | | | 24 | | |
Statements of Operations | | | 28 | | |
Statements of Changes in Net Assets | | | 30-35 | | |
Financial Highlights | | | 36-53 | | |
Notes to Financial Statements | | | 54 | | |
Supplemental Information | | | 66 | | |
Proxy Voting and Portfolio Holdings Information | | | 66 | | |
Expense Examples | | | 66 | | |
Advisory Contract Approval | | | 68 | | |
Liquidity Risk Management Program | | | 72 | | |
Privacy Policy (inside back cover) | | | |
1
IRA DISTRIBUTION WITHHOLDING DISCLOSURE
We generally must withhold federal income tax at a rate of 10% of the taxable portion of your distribution and, if you live in a state that requires state income tax withholding, at your state's tax rate. However, you may elect not to have withholding apply or to have income tax withheld at a higher rate. Any withholding election that you make will apply to any subsequent distribution unless and until you change or revoke the election. If you wish to make a withholding election, or change or revoke a prior withholding election, call 800-539-3863 (800-235-8396 for Member Class) and form W-4P (OMB No. 1545-0074 withholding certificate for pension or annuity payments) will be electronically sent.
If you do not have a withholding election in place by the date of a distribution, federal income tax will be withheld from the taxable portion of your distribution at a rate of 10%. If you must pay estimated taxes, you may be subject to estimated tax penalties if your estimated tax payments are not sufficient and sufficient tax is not withheld from your distribution.
For more specific information, please consult your tax adviser.
The Funds are distributed by Victory Capital Services, Inc. Victory Capital Management Inc. is the investment adviser to the Funds and receives fees from the Funds for performing services for the Funds.
This report is not authorized for distribution to prospective investors unless preceded or accompanied by a current prospectus of the Victory Funds.
For additional information about any Victory Fund, including fees, expenses, and risks, view our prospectus online at vcm.com or call 800-539-3863 (800-235-8396 for Member Class). Read it carefully before you invest or send money.
The information in this report is based on data obtained from recognized services and sources and is believed to be reliable. Any opinions, projections, or recommendations in this report are subject to change without notice and are not intended as individual investment advice. Past investment performance of the Funds, markets or securities mentioned herein should not be considered to be indicative of future results.
• NOT FDIC INSURED • NO BANK GUARANTEE • MAY LOSE VALUE

Call Victory at:
800-539-FUND (800-539-3863)
800-235-8396 for Member Class
Visit our website at:
www.vcm.com
2
This page is intentionally left blank.
3
Victory Portfolios
Victory Diversified Stock Fund | | April 30, 2021 | |
(Unaudited)
Investment Objective and Portfolio Holdings:
The Fund's investment objective seeks to provide long-term growth of capital.
Top 10 Holdings*:
April 30, 2021
(% of Net Assets)
Microsoft Corp. | | | 5.9 | % | |
Apple, Inc. | | | 5.1 | % | |
Amazon.com, Inc. | | | 3.5 | % | |
Alphabet, Inc., Class C | | | 3.3 | % | |
NVIDIA Corp. | | | 2.2 | % | |
JPMorgan Chase & Co. | | | 2.0 | % | |
AbbVie, Inc. | | | 1.8 | % | |
Facebook, Inc., Class A | | | 1.7 | % | |
Old Dominion Freight Line, Inc. | | | 1.6 | % | |
Bank of America Corp. | | | 1.5 | % | |
Sector Allocation*:
April 30, 2021
(% of Net Assets)

* Does not include futures, money market instruments, and short-term investments purchased with cash collateral from securities loaned.
Percentages are of the net assets of the Fund and may not equal 100%.
Refer to the Schedule of Portfolio Investments for a complete list of securities.
4
Victory Portfolios
Victory NewBridge Large Cap Growth Fund | | April 30, 2021 | |
(Unaudited)
Investment Objective and Portfolio Holdings:
The Fund's investment objective seeks to provide long-term capital appreciation.
Top 10 Holdings*:
April 30, 2021
(% of Net Assets)
Amazon.com, Inc. | | | 7.7 | % | |
Alphabet, Inc., Class C | | | 5.4 | % | |
Visa, Inc., Class A | | | 5.3 | % | |
NVIDIA Corp. | | | 5.3 | % | |
PayPal Holdings, Inc. | | | 5.1 | % | |
ServiceNow, Inc. | | | 3.9 | % | |
Adobe, Inc. | | | 3.8 | % | |
EPAM Systems, Inc. | | | 3.5 | % | |
Facebook, Inc., Class A | | | 3.3 | % | |
Uber Technologies, Inc. | | | 3.3 | % | |
Sector Allocation*:
April 30, 2021
(% of Net Assets)

* Does not include futures, money market instruments, and short-term investments purchased with cash collateral from securities loaned.
Percentages are of the net assets of the Fund and may not equal 100%.
Refer to the Schedule of Portfolio Investments for a complete list of securities.
5
Victory Portfolios
Victory Special Value Fund | | April 30, 2021 | |
(Unaudited)
Investment Objective and Portfolio Holdings:
The Fund's investment objective seeks to provide long-term growth of capital and dividend income.
Top 10 Holdings*:
April 30, 2021
(% of Net Assets)
Microsoft Corp. | | | 5.7 | % | |
Apple, Inc. | | | 4.8 | % | |
Amazon.com, Inc. | | | 3.4 | % | |
Alphabet, Inc., Class C | | | 3.2 | % | |
SPDR S&P 500 ETF Trust | | | 2.5 | % | |
NVIDIA Corp. | | | 2.1 | % | |
JPMorgan Chase & Co. | | | 2.1 | % | |
AbbVie, Inc. | | | 1.8 | % | |
Facebook, Inc., Cass A | | | 1.7 | % | |
Bank of America Corp. | | | 1.6 | % | |
Sector Allocation*:
April 30, 2021
(% of Net Assets)

* Does not include futures, money market instruments, and short-term investments purchased with cash collateral from securities loaned.
Percentages are of the net assets of the Fund and may not equal 100%.
Refer to the Schedule of Portfolio Investments for a complete list of securities.
6
Victory Portfolios
Victory Strategic Allocation Fund | | April 30, 2021 | |
(Unaudited)
Investment Objective and Portfolio Holdings:
The Fund's investment objective seeks to provide income and long-term growth of capital.
Top 10 Holdings*:
April 30, 2021
(% of Net Assets)
Victory RS Global Fund, Class Y | | | 29.5 | % | |
Victory Market Neutral Income Fund, Class I | | | 19.3 | % | |
Victory INCORE Total Return Bond Fund, Class R6 | | | 10.8 | % | |
Victory Trivalent International Small-Cap Fund, Class I | | | 7.2 | % | |
VictoryShares U.S. Multi-Factor Minimum Volatility ETF | | | 6.9 | % | |
Victory Integrity Discovery Fund, Class Y | | | 4.3 | % | |
Victory RS Partners Fund, Class Y | | | 4.2 | % | |
Victory Sophus Emerging Markets Fund, Class R6 | | | 0.2 | % | |
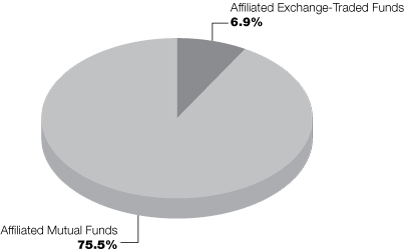
Asset Allocation*:
April 30, 2021
(% of Net Assets)
* Does not include futures, money market instruments, and short-term investments purchased with cash collateral from securities loaned.
Percentages are of the net assets of the Fund and may not equal 100%.
Refer to the Schedule of Portfolio Investments for a complete list of securities.
7
Victory Portfolios
Victory INCORE Fund for Income | | April 30, 2021 | |
(Unaudited)
Investment Objective and Portfolio Holdings:
The Fund's investment objective seeks to provide a high level of current income consistent with preservation of shareholders' capital.
Asset Allocation*:
April 30, 2021
(% of Net Assets)

* Does not include futures, money market instruments, and short-term investments purchased with cash collateral from securities loaned.
Percentages are of the net assets of the Fund and may not equal 100%.
Refer to the Schedule of Portfolio Investments for a complete list of securities.
8
Victory Portfolios
Victory INCORE Investment Grade Convertible Fund | | April 30, 2021 | |
(Unaudited)
Investment Objective and Portfolio Holdings:
The Fund's investment objective seeks to provide a high level of current income together with long-term capital appreciation.
Top 10 Holdings*:
April 30, 2021
(% of Net Assets)
Fortive Corp. | | | 4.8 | % | |
Western Digital Corp. | | | 4.8 | % | |
Southwest Airlines Co. | | | 4.6 | % | |
Wells Fargo & Co., Series L | | | 4.2 | % | |
Anthem, Inc. | | | 4.0 | % | |
Stanley Black & Decker, Inc. | | | 4.0 | % | |
Booking Holdings, Inc. | | | 3.9 | % | |
Pioneer Natural Resources Co. | | | 3.8 | % | |
Micron Technology, Inc., Convertible Subordinated Notes | | | 3.4 | % | |
Euronet Worldwide, Inc. | | | 3.3 | % | |
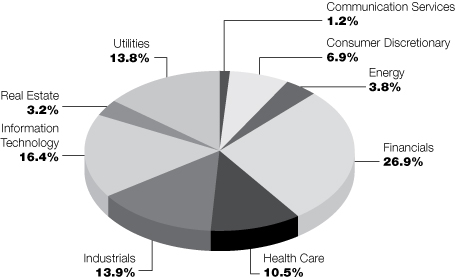
Sector Allocation*:
April 30, 2021
(% of Net Assets)
* Does not include futures, money market instruments, and short-term investments purchased with cash collateral from securities loaned.
Percentages are of the net assets of the Fund and may not equal 100%.
Refer to the Schedule of Portfolio Investments for a complete list of securities.
9
Victory Portfolios
Victory Diversified Stock Fund | | Schedule of Portfolio Investments
April 30, 2021 | |
(Amounts in Thousands, Except for Shares) (Unaudited)
Security Description | | Shares | | Value | |
Common Stocks (98.4%) | |
Communication Services (9.1%): | |
Alphabet, Inc., Class C (a) | | | 4,291 | | | $ | 10,342 | | |
Charter Communications, Inc., Class A (a) | | | 5,908 | | | | 3,979 | | |
Facebook, Inc., Class A (a) | | | 16,340 | | | | 5,312 | | |
Iridium Communications, Inc. (a) | | | 39,886 | | | | 1,515 | | |
Nexstar Media Group, Inc., Class A | | | 20,264 | | | | 2,987 | | |
Zynga, Inc., Class A (a) | | | 408,498 | | | | 4,420 | | |
| | | | 28,555 | | |
Communications Equipment (1.0%): | |
Lumentum Holdings, Inc. (a) | | | 38,401 | | | | 3,266 | | |
Consumer Discretionary (16.7%): | |
Amazon.com, Inc. (a) | | | 3,179 | | | | 11,023 | | |
Asbury Automotive Group, Inc. (a) | | | 21,169 | | | | 4,203 | | |
Boyd Gaming Corp. (a) | | | 46,734 | | | | 3,091 | | |
Brunswick Corp. | | | 29,893 | | | | 3,202 | | |
D.R. Horton, Inc. | | | 33,420 | | | | 3,285 | | |
Group 1 Automotive, Inc. (b) | | | 19,180 | | | | 3,149 | | |
LCI Industries | | | 21,004 | | | | 3,077 | | |
LGI Homes, Inc. (a) | | | 28,006 | | | | 4,644 | | |
Lowe's Cos., Inc. | | | 15,860 | | | | 3,113 | | |
Malibu Boats, Inc., Class A (a) | | | 33,743 | | | | 2,813 | | |
Meritage Homes Corp. (a) | | | 32,454 | | | | 3,453 | | |
Rent-A-Center, Inc. | | | 51,520 | | | | 2,965 | | |
Tesla, Inc. (a) | | | 2,117 | | | | 1,502 | | |
TopBuild Corp. (a) | | | 11,761 | | | | 2,615 | | |
| | | | 52,135 | | |
Consumer Staples (4.7%): | |
BJ's Wholesale Club Holdings, Inc. (a) | | | 65,528 | | | | 2,927 | | |
Monster Beverage Corp. (a) | | | 30,501 | | | | 2,960 | | |
PepsiCo, Inc. | | | 21,932 | | | | 3,163 | | |
Performance Food Group Co. (a) | | | 53,376 | | | | 3,133 | | |
Philip Morris International, Inc. | | | 27,605 | | | | 2,622 | | |
| | | | 14,805 | | |
Energy (2.9%): | |
Chevron Corp. | | | 30,222 | | | | 3,116 | | |
Matador Resources Co. | | | 107,139 | | | | 2,819 | | |
Pioneer Natural Resources Co. | | | 11,002 | | | | 1,692 | | |
Valero Energy Corp. | | | 19,556 | | | | 1,446 | | |
| | | | 9,073 | | |
Financials (10.8%): | |
Ameriprise Financial, Inc. | | | 8,858 | | | | 2,289 | | |
Bank of America Corp. | | | 117,220 | | | | 4,751 | | |
Flagstar Bancorp, Inc. | | | 48,555 | | | | 2,260 | | |
JPMorgan Chase & Co. | | | 40,948 | | | | 6,298 | | |
Morgan Stanley | | | 45,353 | | | | 3,744 | | |
See notes to financial statements.
10
Victory Portfolios
Victory Diversified Stock Fund | | Schedule of Portfolio Investments — continued
April 30, 2021 | |
(Amounts in Thousands, Except for Shares) (Unaudited)
Security Description | | Shares | | Value | |
Primerica, Inc. | | | 26,827 | | | $ | 4,286 | | |
ServisFirst Bancshares, Inc. | | | 37,353 | | | | 2,362 | | |
T. Rowe Price Group, Inc. | | | 17,705 | | | | 3,173 | | |
Western Alliance Bancorp | | | 42,709 | | | | 4,487 | | |
| | | | 33,650 | | |
Health Care (11.1%): | |
AbbVie, Inc. | | | 50,380 | | | | 5,618 | | |
Bristol-Myers Squibb Co. | | | 29,767 | | | | 1,858 | | |
Charles River Laboratories International, Inc. (a) | | | 13,360 | | | | 4,441 | | |
ICON PLC (a) (b) | | | 16,619 | | | | 3,605 | | |
Insulet Corp. (a) | | | 6,351 | | | | 1,875 | | |
Quest Diagnostics, Inc. | | | 22,022 | | | | 2,905 | | |
Regeneron Pharmaceuticals, Inc. (a) | | | 7,854 | | | | 3,780 | | |
Stryker Corp. | | | 13,136 | | | | 3,450 | | |
Thermo Fisher Scientific, Inc. | | | 9,011 | | | | 4,237 | | |
UnitedHealth Group, Inc. | | | 7,092 | | | | 2,828 | | |
| | | | 34,597 | | |
Industrials (12.3%): | |
Builders FirstSource, Inc. (a) | | | 65,806 | | | | 3,203 | | |
Chart Industries, Inc. (a) (b) | | | 13,065 | | | | 2,099 | | |
Kansas City Southern | | | 15,788 | | | | 4,613 | | |
Marten Transport Ltd. | | | 160,181 | | | | 2,678 | | |
Masco Corp. | | | 63,054 | | | | 4,028 | | |
Masonite International Corp. (a) | | | 15,551 | | | | 1,964 | | |
Old Dominion Freight Line, Inc. | | | 19,000 | | | | 4,899 | | |
Patrick Industries, Inc. | | | 36,956 | | | | 3,311 | | |
Trex Co., Inc. (a) | | | 31,051 | | | | 3,353 | | |
UFP Industries, Inc. | | | 53,177 | | | | 4,469 | | |
XPO Logistics, Inc. (a) | | | 28,751 | | | | 4,000 | | |
| | | | 38,617 | | |
IT Services (4.0%): | |
Akamai Technologies, Inc. (a) | | | 31,857 | | | | 3,463 | | |
EPAM Systems, Inc. (a) | | | 8,246 | | | | 3,775 | | |
Fiserv, Inc. (a) | | | 27,355 | | | | 3,286 | | |
Visa, Inc., Class A | | | 8,723 | | | | 2,037 | | |
| | | | 12,561 | | |
Materials (4.4%): | |
Avery Dennison Corp. | | | 16,124 | | | | 3,454 | | |
Berry Global Group, Inc. (a) | | | 26,729 | | | | 1,700 | | |
Dow, Inc. | | | 27,574 | | | | 1,723 | | |
Silgan Holdings, Inc. | | | 38,589 | | | | 1,627 | | |
Summit Materials, Inc., Class A (a) | | | 101,753 | | | | 2,929 | | |
Valvoline, Inc. (b) | | | 70,521 | | | | 2,215 | | |
| | | | 13,648 | | |
Real Estate (1.1%): | |
American Tower Corp. | | | 13,641 | | | | 3,475 | | |
See notes to financial statements.
11
Victory Portfolios
Victory Diversified Stock Fund | | Schedule of Portfolio Investments — continued
April 30, 2021 | |
(Amounts in Thousands, Except for Shares) (Unaudited)
Security Description | | Shares | | Value | |
Semiconductors & Semiconductor Equipment (6.9%): | |
Advanced Micro Devices, Inc. (a) | | | 55,537 | | | $ | 4,533 | | |
Applied Materials, Inc. | | | 14,016 | | | | 1,860 | | |
Broadcom, Inc. | | | 8,845 | | | | 4,035 | | |
NVIDIA Corp. | | | 11,273 | | | | 6,768 | | |
Qorvo, Inc. (a) | | | 22,794 | | | | 4,289 | | |
| | | | 21,485 | | |
Software (8.3%): | |
Adobe, Inc. (a) | | | 2,960 | | | | 1,505 | | |
Cadence Design Systems, Inc. (a) | | | 22,255 | | | | 2,933 | | |
Microsoft Corp. | | | 72,977 | | | | 18,402 | | |
ServiceNow, Inc. (a) | | | 5,713 | | | | 2,893 | | |
| | | | 25,733 | | |
Technology Hardware, Storage & Peripherals (5.1%): | |
Apple, Inc. | | | 120,148 | | | | 15,795 | | |
Total Common Stocks (Cost $193,436) | | | 307,395 | | |
Exchange-Traded Funds (1.1%) | |
SPDR S&P 500 ETF Trust | | | 8,570 | | | | 3,576 | | |
Total Exchange-Traded Funds (Cost $2,355) | | | 3,576 | | |
Collateral for Securities Loaned^ (1.9%) | |
BlackRock Liquidity Funds TempFund, Institutional Class, 0.04% (c) | | | 119,142 | | | | 119 | | |
Fidelity Investments Money Market Government Portfolio,
Institutional Class, 0.01% (c) | | | 3,188,302 | | | | 3,188 | | |
Goldman Sachs Financial Square Prime Obligations Fund,
Institutional Class, 0.02% (c) | | | 59,507 | | | | 60 | | |
JPMorgan Prime Money Market Fund, Capital Class, 0.09% (c) | | | 474,494 | | | | 474 | | |
Morgan Stanley Institutional Liquidity Prime Portfolio,
Institutional Class, 0.06% (c) | | | 2,133,516 | | | | 2,134 | | |
Total Collateral for Securities Loaned (Cost $5,975) | | | 5,975 | | |
Total Investments (Cost $201,766) — 101.4% | | | 316,946 | | |
Liabilities in excess of other assets — (1.4)% | | | (4,244 | ) | |
NET ASSETS — 100.00% | | $ | 312,702 | | |
^ Purchased with cash collateral from securities on loan.
(a) Non-income producing security.
(b) All or a portion of this security is on loan.
(c) Rate disclosed is the daily yield on April 30, 2021.
ETF — Exchange-Traded Fund
PLC — Public Limited Company
See notes to financial statements.
12
Victory Portfolios
Victory NewBridge Large Cap Growth Fund | | Schedule of Portfolio Investments
April 30, 2021 | |
(Amounts in Thousands, Except for Shares) (Unaudited)
Security Description | | Shares | | Value | |
Common Stocks (99.1%) | |
Communication Services (13.1%): | |
Activision Blizzard, Inc. | | | 4,778 | | | $ | 436 | | |
Alphabet, Inc., Class C (a) | | | 398 | | | | 959 | | |
Facebook, Inc., Class A (a) | | | 1,823 | | | | 593 | | |
Snap, Inc., Class A (a) | | | 5,350 | | | | 331 | | |
| | | | 2,319 | | |
Consumer Discretionary (17.6%): | |
Airbnb, Inc., Class A (a) (b) | | | 1,471 | | | | 254 | | |
Amazon.com, Inc. (a) | | | 395 | | | | 1,370 | | |
Burlington Stores, Inc. (a) | | | 1,684 | | | | 550 | | |
Lululemon Athletica, Inc. (a) | | | 1,468 | | | | 492 | | |
NIKE, Inc., Class B | | | 3,537 | | | | 469 | | |
| | | | 3,135 | | |
Financials (3.1%): | |
MSCI, Inc. | | | 1,136 | | | | 552 | | |
Health Care (14.4%): | |
Align Technology, Inc. (a) | | | 765 | | | | 456 | | |
Masimo Corp. (a) | | | 1,312 | | | | 305 | | |
TG Therapeutics, Inc. (a) | | | 2,891 | | | | 129 | | |
Thermo Fisher Scientific, Inc. | | | 933 | | | | 439 | | |
Veeva Systems, Inc., Class A (a) | | | 1,678 | | | | 474 | | |
Vertex Pharmaceuticals, Inc. (a) | | | 1,301 | | | | 284 | | |
Zoetis, Inc. | | | 2,632 | | | | 455 | | |
| | | | 2,542 | | |
Industrials (10.4%): | |
CoStar Group, Inc. (a) | | | 588 | | | | 502 | | |
Generac Holdings, Inc. (a) | | | 814 | | | | 264 | | |
Trane Technologies PLC | | | 2,856 | | | | 496 | | |
Uber Technologies, Inc. (a) | | | 10,704 | | | | 586 | | |
| | | | 1,848 | | |
IT Services (18.6%): | |
EPAM Systems, Inc. (a) | | | 1,359 | | | | 622 | | |
PayPal Holdings, Inc. (a) | | | 3,466 | | | | 909 | | |
Shopify, Inc., Class A (a) | | | 337 | | | | 399 | | |
Twilio, Inc., Class A (a) | | | 1,188 | | | | 437 | | |
Visa, Inc., Class A | | | 4,019 | | | | 938 | | |
| | | | 3,305 | | |
Semiconductors & Semiconductor Equipment (8.2%): | |
Micron Technology, Inc. (a) | | | 6,113 | | | | 526 | | |
NVIDIA Corp. | | | 1,563 | | | | 939 | | |
| | | | 1,465 | | |
See notes to financial statements.
13
Victory Portfolios
Victory NewBridge Large Cap Growth Fund | | Schedule of Portfolio Investments — continued
April 30, 2021 | |
(Amounts in Thousands, Except for Shares) (Unaudited)
Security Description | | Shares | | Value | |
Software (13.7%): | |
Adobe, Inc. (a) | | | 1,319 | | | $ | 671 | | |
Autodesk, Inc. (a) | | | 1,076 | | | | 314 | | |
Cadence Design Systems, Inc. (a) | | | 2,682 | | | | 353 | | |
ServiceNow, Inc. (a) | | | 1,379 | | | | 697 | | |
The Trade Desk, Inc., Class A (a) | | | 550 | | | | 401 | | |
| | | | 2,436 | | |
Total Common Stocks (Cost $8,626) | | | 17,602 | | |
Collateral for Securities Loaned^ (1.0%) | |
BlackRock Liquidity Funds TempFund, Institutional Class, 0.04% (c) | | | 3,543 | | | | 4 | | |
Fidelity Investments Money Market Government Portfolio,
Institutional Shares, 0.01% (c) | | | 94,734 | | | | 95 | | |
Goldman Sachs Financial Square Prime Obligations Fund,
Institutional Class, 0.02% (c) | | | 1,768 | | | | 2 | | |
JPMorgan Prime Money Market Fund, Capital Class, 0.09% (c) | | | 14,099 | | | | 14 | | |
Morgan Stanley Institutional Liquidity Prime Portfolio,
Institutional Class, 0.06% (c) | | | 63,390 | | | | 63 | | |
Total Collateral for Securities Loaned (Cost $178) | | | 178 | | |
Total Investments (Cost $8,804) — 100.1% | | | 17,780 | | |
Liabilities in excess of other assets — (0.1)% | | | (12 | ) | |
NET ASSETS — 100.00% | | $ | 17,768 | | |
^ Purchased with cash collateral from securities on loan.
(a) Non-income producing security.
(b) All or a portion of this security is on loan.
(c) Rate disclosed is the daily yield on April 30, 2021.
PLC — Public Limited Company
See notes to financial statements.
14
Victory Portfolios
Victory Special Value Fund | | Schedule of Portfolio Investments
April 30, 2021 | |
(Amounts in Thousands, Except for Shares) (Unaudited)
Security Description | | Shares | | Value | |
Common Stocks (97.4%) | |
Communication Services (9.0%): | |
Alphabet, Inc., Class C (a) | | | 658 | | | $ | 1,586 | | |
Charter Communications, Inc., Class A (a) | | | 909 | | | | 612 | | |
Facebook, Inc., Class A (a) | | | 2,573 | | | | 836 | | |
Iridium Communications, Inc. (a) | | | 6,218 | | | | 236 | | |
Nexstar Media Group, Inc., Class A | | | 3,270 | | | | 482 | | |
Zynga, Inc., Class A (a) | | | 63,744 | | | | 690 | | |
| | | | 4,442 | | |
Consumer Discretionary (16.6%): | |
Amazon.com, Inc. (a) | | | 479 | | | | 1,661 | | |
Asbury Automotive Group, Inc. (a) | | | 3,304 | | | | 656 | | |
Boyd Gaming Corp. (a) | | | 7,542 | | | | 499 | | |
Brunswick Corp. | | | 4,740 | | | | 508 | | |
D.R. Horton, Inc. | | | 5,391 | | | | 530 | | |
Group 1 Automotive, Inc. | | | 2,992 | | | | 491 | | |
LCI Industries | | | 3,238 | | | | 474 | | |
LGI Homes, Inc. (a) | | | 4,518 | | | | 748 | | |
Lowe's Cos., Inc. | | | 2,560 | | | | 502 | | |
Malibu Boats, Inc., Class A (a) | | | 5,444 | | | | 454 | | |
Meritage Homes Corp. (a) | | | 5,169 | | | | 550 | | |
Rent-A-Center, Inc. | | | 8,315 | | | | 479 | | |
Tesla, Inc. (a) | | | 328 | | | | 233 | | |
TopBuild Corp. (a) | | | 1,843 | | | | 410 | | |
| | | | 8,195 | | |
Consumer Staples (4.7%): | |
BJ's Wholesale Club Holdings, Inc. (a) | | | 10,064 | | | | 450 | | |
Monster Beverage Corp. (a) | | | 4,796 | | | | 465 | | |
PepsiCo, Inc. | | | 3,474 | | | | 502 | | |
Performance Food Group Co. (a) | | | 8,615 | | | | 505 | | |
Philip Morris International, Inc. | | | 4,327 | | | | 411 | | |
| | | | 2,333 | | |
Energy (2.9%): | |
Chevron Corp. | | | 4,877 | | | | 502 | | |
Matador Resources Co. | | | 16,719 | | | | 440 | | |
Pioneer Natural Resources Co. | | | 1,775 | | | | 273 | | |
Valero Energy Corp. | | | 2,999 | | | | 222 | | |
| | | | 1,437 | | |
Financials (10.8%): | |
Ameriprise Financial, Inc. | | | 1,365 | | | | 353 | | |
Bank of America Corp. | | | 18,916 | | | | 767 | | |
Flagstar Bancorp, Inc. | | | 7,733 | | | | 360 | | |
JPMorgan Chase & Co. | | | 6,608 | | | | 1,016 | | |
Morgan Stanley | | | 7,079 | | | | 584 | | |
Primerica, Inc. | | | 4,206 | | | | 672 | | |
See notes to financial statements.
15
Victory Portfolios
Victory Special Value Fund | | Schedule of Portfolio Investments — continued
April 30, 2021 | |
(Amounts in Thousands, Except for Shares) (Unaudited)
Security Description | | Shares | | Value | |
ServisFirst Bancshares, Inc. | | | 5,736 | | | $ | 363 | | |
T. Rowe Price Group, Inc. | | | 2,784 | | | | 499 | | |
Western Alliance Bancorp | | | 6,881 | | | | 723 | | |
| | | | 5,337 | | |
Health Care (10.9%): | |
AbbVie, Inc. | | | 7,773 | | | | 866 | | |
Bristol-Myers Squibb Co. | | | 4,578 | | | | 286 | | |
Charles River Laboratories International, Inc. (a) | | | 2,093 | | | | 696 | | |
ICON PLC (a) | | | 2,604 | | | | 565 | | |
Insulet Corp. (a) | | | 991 | | | | 293 | | |
Quest Diagnostics, Inc. | | | 3,408 | | | | 449 | | |
Regeneron Pharmaceuticals, Inc. (a) | | | 1,194 | | | | 575 | | |
Stryker Corp. | | | 2,066 | | | | 542 | | |
Thermo Fisher Scientific, Inc. | | | 1,435 | | | | 675 | | |
UnitedHealth Group, Inc. | | | 1,098 | | | | 438 | | |
| | | | 5,385 | | |
Industrials (12.4%): | |
Builders FirstSource, Inc. (a) | | | 10,619 | | | | 517 | | |
Chart Industries, Inc. (a) | | | 2,036 | | | | 327 | | |
Kansas City Southern | | | 2,548 | | | | 745 | | |
Marten Transport Ltd. | | | 24,785 | | | | 414 | | |
Masco Corp. | | | 9,553 | | | | 610 | | |
Masonite International Corp. (a) | | | 2,510 | | | | 317 | | |
Old Dominion Freight Line, Inc. | | | 2,871 | | | | 740 | | |
Patrick Industries, Inc. | | | 5,964 | | | | 534 | | |
Trex Co., Inc. (a) | | | 5,012 | | | | 541 | | |
UFP Industries, Inc. | | | 8,578 | | | | 721 | | |
XPO Logistics, Inc. (a) | | | 4,526 | | | | 630 | | |
| | | | 6,096 | | |
Information Technology (24.6%): | |
Adobe, Inc. (a) | | | 462 | | | | 235 | | |
Advanced Micro Devices, Inc. (a) | | | 8,529 | | | | 696 | | |
Akamai Technologies, Inc. (a) | | | 4,986 | | | | 542 | | |
Apple, Inc. | | | 17,951 | | | | 2,360 | | |
Applied Materials, Inc. | | | 2,261 | | | | 300 | | |
Broadcom, Inc. | | | 1,392 | | | | 635 | | |
Cadence Design Systems, Inc. (a) | | | 3,473 | | | | 458 | | |
EPAM Systems, Inc. (a) | | | 1,292 | | | | 592 | | |
Fiserv, Inc. (a) | | | 4,289 | | | | 515 | | |
Lumentum Holdings, Inc. (a) | | | 6,003 | | | | 511 | | |
Microsoft Corp. | | | 11,142 | | | | 2,809 | | |
NVIDIA Corp. | | | 1,731 | | | | 1,040 | | |
Qorvo, Inc. (a) | | | 3,689 | | | | 694 | | |
ServiceNow, Inc. (a) | | | 880 | | | | 446 | | |
Visa, Inc., Class A | | | 1,367 | | | | 319 | | |
| | | | 12,152 | | |
See notes to financial statements.
16
Victory Portfolios
Victory Special Value Fund | | Schedule of Portfolio Investments — continued
April 30, 2021 | |
(Amounts in Thousands, Except for Shares) (Unaudited)
Security Description | | Shares | | Value | |
Materials (4.4%): | |
Avery Dennison Corp. | | | 2,601 | | | $ | 557 | | |
Berry Global Group, Inc. (a) | | | 4,167 | | | | 265 | | |
Dow, Inc. | | | 4,448 | | | | 278 | | |
Silgan Holdings, Inc. | | | 6,016 | | | | 254 | | |
Summit Materials, Inc., Class A (a) | | | 16,413 | | | | 473 | | |
Valvoline, Inc. | | | 10,899 | | | | 342 | | |
| | | | 2,169 | | |
Real Estate (1.1%): | |
American Tower Corp. | | | 2,100 | | | | 535 | | |
Total Common Stocks (Cost $30,616) | | | 48,081 | | |
Exchange-Traded Funds (2.5%) | |
SPDR S&P 500 ETF Trust | | | 2,931 | | | | 1,223 | | |
Total Exchange-Traded Funds (Cost $1,139) | | | 1,223 | | |
Total Investments (Cost $31,755) — 99.9% | | | 49,304 | | |
Other assets in excess of liabilities — 0.1% | | | 55 | | |
NET ASSETS — 100.00% | | $ | 49,359 | | |
(a) Non-income producing security.
ETF — Exchange-Traded Fund
PLC — Public Limited Company
See notes to financial statements.
17
Victory Portfolios
Victory Strategic Allocation Fund | | Schedule of Portfolio Investments
April 30, 2021 | |
(Amounts in Thousands, Except for Shares) (Unaudited)
Security Description | | Shares | | Value | |
Affiliated Exchange-Traded Funds (6.9%) | |
VictoryShares U.S. Multi-Factor Minimum Volatility ETF | | | 54,280 | | | $ | 2,015 | | |
Total Affiliated Exchange-Traded Funds (Cost $1,400) | | | 2,015 | | |
Affiliated Mutual Funds (75.5%) | |
Victory INCORE Total Return Bond Fund, Class R6 | | | 321,551 | | | | 3,151 | | |
Victory Integrity Discovery Fund, Class Y | | | 25,959 | | | | 1,264 | | |
Victory Market Neutral Income Fund, Class I | | | 586,334 | | | | 5,647 | | |
Victory RS Global Fund, Class Y (a) | | | 458,725 | | | | 8,579 | | |
Victory RS Partners Fund, Class Y | | | 37,802 | | | | 1,240 | | |
Victory Sophus Emerging Markets Fund, Class R6 | | | 2,641 | | | | 71 | | |
Victory Trivalent International Small-Cap Fund, Class I | | | 118,131 | | | | 2,107 | | |
Total Affiliated Mutual Funds (Cost $17,182) | | | 22,059 | | |
Total Investments (Cost $18,582) — 82.4% | | | 24,074 | | |
Other assets in excess of liabilities — 17.6% | | | 5,158 | | |
NET ASSETS — 100.00% | | $ | 29,232 | | |
(a) Represents investments greater than 25% of the Fund's net assets. Performance of the Fund may be adversely impacted by concentrated investments in securities. The financial statements and portfolio holdings for these securities can be found at www.sec.gov.
ETF — Exchange-Traded Fund
See notes to financial statements.
18
Victory Portfolios
Victory INCORE Fund for Income | | Schedule of Portfolio Investments
April 30, 2021 | |
(Amounts in Thousands, Except for Shares) (Unaudited)
Security Description | | Principal
Amount | | Value | |
Government National Mortgage Association (71.5%) | |
Multi-family (0.3%): | |
Collateralized Mortgage Obligations (0.1%): | |
Government National Mortgage Assoc. | |
Series 2012-33, Class AB, 7.00%, 3/16/46 | | $ | 982 | | | $ | 1,019 | | |
Pass-throughs (0.2%): | |
Government National Mortgage Assoc. | |
7.50%, 8/15/21 | | | 1 | | | | 1 | | |
7.92%, 7/1/23 | | | 162 | | | | 162 | | |
8.00%, 1/15/31 – 11/15/33 | | | 1,071 | | | | 1,073 | | |
7.75%, 9/15/33 | | | 390 | | | | 390 | | |
| | | | 1,626 | | |
Single Family (71.2%): | |
Collateralized Mortgage Obligations (3.3%): | |
Government National Mortgage Assoc. | |
Series 1999-4, Class ZB, 6.00%, 2/20/29 | | | 168 | | | | 168 | | |
Series 2001-10, Class PE, 6.50%, 3/16/31 | | | 137 | | | | 137 | | |
Series 2005-74, Class HB, 7.50%, 9/16/35 | | | 10 | | | | 11 | | |
Series 2005-74, Class HC, 7.50%, 9/16/35 | | | 54 | | | | 62 | | |
Series 2011-166, Class NT, 7.75%, 11/20/31 (a) | | | 831 | | | | 964 | | |
Series 2012-106, Class JM, 7.32%, 10/20/34 (a) | | | 619 | | | | 732 | | |
Series 2012-30, Class WB, 7.06%, 11/20/39 (a) | | | 2,375 | | | | 2,756 | | |
Series 2013-190, Class KT, 8.13%, 9/20/30 (a) | | | 268 | | | | 308 | | |
Series 2013-51, Class BL, 6.07%, 4/20/34 (a) | | | 1,776 | | | | 2,059 | | |
Series 2013-64, Class KY, 6.80%, 12/20/38 (a) | | | 984 | | | | 1,124 | | |
Series 2013-70, Class KP, 7.06%, 2/20/39 (a) | | | 878 | | | | 1,034 | | |
Series 2014-69, Class W, 7.20%, 11/20/34 (a) | | | 125 | | | | 146 | | |
Series 2014-74, Class PT, 7.79%, 5/16/44 (a) | | | 194 | | | | 219 | | |
Series 2015-77, Class PT, 7.53%, 6/20/39 (a) | | | 408 | | | | 471 | | |
Series 2019-22, Class PT, 7.92%, 2/20/49 (a) | | | 6,800 | | | | 7,797 | | |
Series 2021-1, Class WT, 7.84%, 1/20/51 (a) | | | 6,889 | | | | 8,038 | | |
| | | | 26,026 | | |
Pass-throughs (67.9%): | |
Government National Mortgage Assoc. | |
8.50%, 7/15/21 – 7/15/32 | | | 5,874 | | | | 6,722 | | |
9.00%, 7/15/21 – 9/15/30 | | | 1,642 | | | | 1,858 | | |
9.50%, 8/15/21 – 9/15/24 | | | 1 | | | | — | (b) | |
8.00%, 12/15/21 – 5/15/49 | | | 37,702 | | | | 44,315 | | |
6.00%, 1/15/22 – 9/20/50 | | | 81,606 | | | | 96,087 | | |
7.13%, 3/15/23 – 7/15/25 | | | 264 | | | | 268 | | |
5.50%, 7/15/23 – 11/15/45 | | | 15,539 | | | | 18,272 | | |
7.50%, 8/15/23 – 5/15/49 | | | 65,613 | | | | 75,814 | | |
6.50%, 8/20/23 – 2/20/41 | | | 130,429 | | | | 152,564 | | |
7.00%, 12/15/23 – 9/20/50 | | | 91,750 | | | | 107,843 | | |
10.00%, 4/15/25 – 2/15/26 | | | 2 | | | | 2 | | |
6.13%, 6/20/28 – 9/20/29 | | | 363 | | | | 388 | | |
6.28%, 10/20/28 – 9/20/29 | | | 646 | | | | 708 | | |
See notes to financial statements.
19
Victory Portfolios
Victory INCORE Fund for Income | | Schedule of Portfolio Investments — continued
April 30, 2021 | |
(Amounts in Thousands, Except for Shares) (Unaudited)
Security Description | | Shares or
Principal
Amount | | Value | |
6.10%, 5/20/29 – 7/20/31 | | $ | 476 | | | $ | 523 | | |
7.30%, 4/20/30 – 2/20/31 | | | 186 | | | | 195 | | |
6.49%, 5/20/31 – 3/20/32 | | | 922 | | | | 1,028 | | |
6.50%, 12/15/32 (c) | | | 8,414 | | | | 9,860 | | |
6.00%, 11/15/33 (c) | | | 5,230 | | | | 6,187 | | |
4.50%, 12/15/33 – 5/15/41 | | | 4,338 | | | | 4,989 | | |
5.00%, 1/20/34 – 1/15/40 | | | 10,003 | | | | 11,600 | | |
4.00%, 8/15/41 | | | 775 | | | | 868 | | |
| | | | 540,091 | | |
Total Government National Mortgage Association (Cost $559,580) | | | 568,762 | | |
U.S. Treasury Obligations (28.9%) | |
U.S. Treasury Bills, 9/9/21 (d) | | | 21,009 | | | | 21,007 | | |
U.S. Treasury Bonds | |
7.13%, 2/15/23 (c) | | | 113,300 | | | | 127,459 | | |
7.50%, 11/15/24 | | | 65,226 | | | | 81,400 | | |
Total U.S. Treasury Obligations (Cost $230,673) | | | 229,866 | | |
Investment Companies (0.0%) (e) | |
BlackRock Liquidity Funds Fedfund Portfolio, 0.02% (f) | | | 100,369 | | | | 100 | | |
Total Investment Companies (Cost $100) | | | 100 | | |
Total Investments (Cost $790,353) — 100.4% | | | 798,728 | | |
Liabilities in excess of other assets — (0.4)% | | | (3,560 | ) | |
NET ASSETS — 100.00% | | $ | 795,168 | | |
(a) The rate for certain asset-backed and mortgage-backed securities may vary based on factors relating to the pool of assets underlying the security. The rate disclosed is the rate in effect at April 30, 2021.
(b) Rounds to less than $1 thousand.
(c) All or a portion of the security has been segregated as collateral for securities purchased on a when-issued basis.
(d) Zero-coupon bond.
(e) Amount represents less than 0.05% of net assets.
(f) Rate represents the effective yield at April 30, 2021.
Continuously callable — Investment is continuously callable or will be continuously callable on any date after the first call date until its maturity.
See notes to financial statements.
20
Victory Portfolios
Victory INCORE Investment Grade Convertible Fund | | Schedule of Portfolio Investments
April 30, 2021 | |
(Amounts in Thousands, Except for Shares) (Unaudited)
Security Description | | Principal
Amount | | Value | |
Convertible Corporate Bonds (66.7%) | |
Communication Services (1.2%): | |
Snap, Inc., 0.75%, 8/1/26 | | $ | 1,595 | | | $ | 4,363 | | |
Consumer Discretionary (6.9%): | |
Booking Holdings, Inc. | |
0.90%, 9/15/21 | | | 2,722 | | | | 3,325 | | |
0.75%, 5/1/25 (a) | | | 9,410 | | | | 14,252 | | |
Expedia Group, Inc. , 0.00%, 2/15/26 (b) | | | 7,125 | | | | 7,775 | | |
| | | | 25,352 | | |
Energy (3.8%): | |
Pioneer Natural Resources Co., 0.25%, 5/15/25 (a) (b) | | | 9,225 | | | | 14,025 | | |
Financials (14.8%): | |
Ares Capital Corp. | |
3.75%, 2/1/22 | | | 8,240 | | | | 8,547 | | |
4.63%, 3/1/24 | | | 7,515 | | | | 8,161 | | |
Barclays Bank PLC | |
0.00%, 2/4/25 | | | 4,815 | | | | 6,605 | | |
0.00%, 2/18/25 | | | 1,990 | | | | 2,341 | | |
BlackRock Capital Investment Corp., 5.00%, 6/15/22 | | | 3,712 | | | | 3,722 | | |
BlackRock TCP Capital Corp., 4.63%, 3/1/22 | | | 1,390 | | | | 1,421 | | |
GSK Finance NO 3 PLC , 0.00%, 6/22/23 (b) | | | 1,545 | | | | 1,665 | | |
JPMorgan Chase Financial Co. LLC, 0.25%, 5/1/23 (b) | | | 9,355 | | | | 10,623 | | |
MGIC Investment Corp. Convertible Subordinated Notes, 9.00%, 4/1/63 | | | 4,127 | | | | 5,534 | | |
TPG Specialty Lending, Inc., 4.50%, 8/1/22 | | | 4,391 | | | | 5,101 | | |
| | | | 53,720 | | |
Health Care (10.5%): | |
Anthem, Inc., 2.75%, 10/15/42 | | | 3,427 | | | | 18,259 | | |
Bristol-Myers Squibb Co., Convertible Subordinated Notes, 0.24%
(LIBOR03M-50bps), 9/15/23, Callable 6/7/21 @ 100 (c) (d) | | | 2,466 | | | | 3,839 | | |
Illumina, Inc. , 0.00%, 8/15/23 (a) | | | 8,375 | | | | 10,031 | | |
Illumina, Inc., Convertible Subordinated Notes, 0.50%, 6/15/21 | | | 4,265 | | | | 6,568 | | |
| | | | 38,697 | | |
Industrials (9.9%): | |
Fortive Corp., 0.88%, 2/15/22 | | | 17,361 | | | | 17,576 | | |
Parsons Corp., 0.25%, 8/15/25 (b) | | | 1,500 | | | | 1,714 | | |
Southwest Airlines Co., 1.25%, 5/1/25 | | | 9,660 | | | | 16,795 | | |
| | | | 36,085 | | |
Information Technology (16.4%): | |
Akamai Technologies, Inc., 0.13%, 5/1/25 | | | 1,922 | | | | 2,417 | | |
Euronet Worldwide, Inc., 0.75%, 3/15/49, Callable 3/20/25 @ 100 (a) | | | 10,545 | | | | 12,152 | | |
Micron Technology, Inc., Convertible Subordinated Notes, 3.13%, 5/1/32 | | | 1,462 | | | | 12,588 | | |
Novellus Systems, Inc., Convertible Subordinated Notes, 2.63%, 5/15/41 | | | 353 | | | | 6,965 | | |
Nuance Communication, Inc. Convertible Subordinated Notes, 1.00%,
12/15/35, Callable 12/20/22 @ 100 | | | 1,410 | | | | 3,098 | | |
ServiceNow, Inc. , 0.00%, 6/1/22 | | | 520 | | | | 1,930 | | |
See notes to financial statements.
21
Victory Portfolios
Victory INCORE Investment Grade Convertible Fund | | Schedule of Portfolio Investments — continued
April 30, 2021 | |
(Amounts in Thousands, Except for Shares) (Unaudited)
Shares or
Security Description | | Principal
Amount | | Value | |
Vishay Intertechnology, Inc., 2.25%, 6/15/25 | | $ | 3,186 | | | $ | 3,463 | | |
Western Digital Corp., 1.50%, 2/1/24 | | | 16,943 | | | | 17,556 | | |
| | | | 60,169 | | |
Real Estate (3.2%): | |
Kite Realty Group, LP, 0.75%, 4/1/27 (b) | | | 5,185 | | | | 5,273 | | |
Spirit Realty Capital, Inc., 3.75%, 5/15/21 | | | 6,255 | | | | 6,302 | | |
| | | | 11,575 | | |
Total Convertible Corporate Bonds (Cost $200,165) | | | 243,986 | | |
Convertible Preferred Stocks (29.9%) | |
Financials (12.1%): | |
AMG Capital Trust II, 5.15%, 10/15/37 | | | 181,860 | | | | 10,525 | | |
Bank of America Corp., Series L, 7.25% (e) | | | 7,130 | | | | 10,096 | | |
KKR & Co., Inc., Series C, 6.00%, 9/15/23 | | | 70,650 | | | | 5,297 | | |
New York Community Capital Trust, 6.00%, 11/1/51 | | | 57,174 | | | | 2,886 | | |
Wells Fargo & Co., Series L, 7.50% (e) | | | 10,809 | | | | 15,498 | | |
| | | | 44,302 | | |
Industrials (4.0%): | |
Stanley Black & Decker, Inc., 5.25%, 11/15/22 | | | 119,525 | | | | 14,583 | | |
Utilities (13.8%): | |
American Electric Power Co., Inc., 6.13%, 3/15/22 | | | 49,970 | | | | 2,508 | | |
American Electric Power Co., Inc., 6.13%, 8/15/23 | | | 49,910 | | | | 2,554 | | |
CenterPoint Energy, Inc., Convertible Subordinated Notes, 4.57%, 9/15/29 | | | 80,000 | | | | 5,180 | | |
Dominion Energy, Inc., Series A, 7.25%, 6/1/22 | | | 100,003 | | | | 10,315 | | |
DTE Energy Co., 6.25%, 11/1/22 | | | 162,215 | | | | 8,231 | | |
NextEra Energy, Inc., 4.87%, 9/1/22 | | | 127,545 | | | | 7,441 | | |
NextEra Energy, Inc., 5.28%, 3/1/23 | | | 75,000 | | | | 3,778 | | |
The Southern Co., Series 2019, 6.75%, 8/1/22 | | | 199,220 | | | | 10,440 | | |
| | | | 50,447 | | |
Total Convertible Preferred Stocks (Cost $98,194) | | | 109,332 | | |
Collateral for Securities Loaned^ (11.0%) | |
BlackRock Liquidity Funds TempFund, Institutional Class, 0.04% (f) | | | 800,266 | | | | 800 | | |
Fidelity Investments Money Market Government Portfolio,
Institutional Shares, 0.01% (f) | | | 21,400,329 | | | | 21,400 | | |
Goldman Sachs Financial Square Prime Obligations Fund,
Institutional Class, 0.02% (f) | | | 399,522 | | | | 400 | | |
JPMorgan Prime Money Market Fund, Capital Class, 0.09% (f) | | | 3,184,868 | | | | 3,185 | | |
Morgan Stanley Institutional Liquidity Prime Portfolio,
Institutional Class, 0.06% (f) | | | 14,319,786 | | | | 14,320 | | |
Total Collateral for Securities Loaned (Cost $40,105) | | | 40,105 | | |
Total Investments (Cost $338,464) — 107.6% | | | 393,423 | | |
Liabilities in excess of other assets — (7.6)% | | | (27,780 | ) | |
NET ASSETS — 100.00% | | $ | 365,643 | | |
See notes to financial statements.
22
Victory Portfolios
Victory INCORE Investment Grade Convertible Fund | | Schedule of Portfolio Investments — continued
April 30, 2021 | |
(Unaudited)
^ Purchased with cash collateral from securities on loan.
(a) All or a portion of this security is on loan.
(b) Rule 144A security or other security that is restricted as to resale to institutional investors. The Fund's Adviser has deemed this security to be liquid based upon procedures approved by the Board of Trustees. As of April 30, 2021, the fair value of these securities was $41,075 (thousands) and amounted to 11.2% of net assets.
(c) Variable or Floating-Rate Security. Rate disclosed is as of April 30, 2021.
(d) Continuously callable with 30 days' notice.
(e) Security is perpetual and has no final maturity date but may be subject to calls at various dates in the future.
(f) Rate disclosed is the daily yield on April 30, 2021.
bps — Basis points
Continuously callable — Investment is continuously callable or will be continuously callable on any date after the first call date until its maturity.
LIBOR — London InterBank Offered Rate
LIBOR03M — 3 Month US Dollar LIBOR, rate disclosed as of April 30, 2021, based on the last reset date of the security
LLC — Limited Liability Company
LP — Limited Partnership
PLC — Public Limited Company
See notes to financial statements.
23
Victory Portfolios | | Statements of Assets and Liabilities
April 30, 2021 | |
(Amounts in Thousands, Except Per Share Amounts) (Unaudited)
| | | Victory
Diversified
Stock Fund | | Victory
NewBridge
Large Cap
Growth Fund | | Victory
Special
Value Fund | |
Assets: | |
Investments, at value (Cost $201,766, $8,804 and
$31,755) | | $ | 316,946 | (a) | | $ | 17,780 | (b) | | $ | 49,304 | | |
Cash | | | 989 | | | | 169 | | | | 191 | | |
Receivables: | |
Interest and dividends | | | 106 | | | | 3 | | | | 16 | | |
Capital shares issued | | | 16 | | | | — | (c) | | | 26 | | |
Investments sold | | | 2,507 | | | | — | | | | 394 | | |
From Adviser | | | 5 | | | | 11 | | | | 8 | | |
Prepaid expenses | | | 44 | | | | 21 | | | | 29 | | |
Total Assets | | | 320,613 | | | | 17,984 | | | | 49,968 | | |
Liabilities: | |
Payables: | |
Collateral received on loaned securities | | | 5,975 | | | | 178 | | | | — | | |
Investments purchased | | | 1,170 | | | | — | | | | 180 | | |
Capital shares redeemed | | | 501 | | | | 17 | | | | 378 | | |
Accrued expenses and other payables: | |
Investment advisory fees | | | 165 | | | | 11 | | | | 30 | | |
Administration fees | | | 15 | | | | 1 | | | | 2 | | |
Custodian fees | | | 2 | | | | — | (c) | | | 1 | | |
Transfer agent fees | | | 31 | | | | 3 | | | | 4 | | |
Compliance fees | | | — | (c) | | | — | (c) | | | — | (c) | |
Trustees' fees | | | — | (c) | | | — | | | | — | (c) | |
| 12b-1 fees | | | 34 | | | | 1 | | | | 7 | | |
Other accrued expenses | | | 18 | | | | 5 | | | | 7 | | |
Total Liabilities | | | 7,911 | | | | 216 | | | | 609 | | |
Net Assets: | |
Capital | | | 179,048 | | | | 5,821 | | | | 27,770 | | |
Total accumulated earnings/(loss) | | | 133,654 | | | | 11,947 | | | | 21,589 | | |
Net Assets | | $ | 312,702 | | | $ | 17,768 | | | $ | 49,359 | | |
Net Assets | |
Class A | | $ | 228,026 | | | $ | 8,330 | | | $ | 28,087 | | |
Class C | | | 2,550 | | | | 723 | | | | 875 | | |
Class I | | | 25,796 | | | | 7,190 | | | | 3,859 | | |
Class R | | | 47,746 | | | | — | | | | 15,843 | | |
Class R6 | | | 3,889 | | | | — | | | | — | | |
Class Y | | | 4,695 | | | | 1,525 | | | | 695 | | |
Total | | $ | 312,702 | | | $ | 17,768 | | | $ | 49,359 | | |
Shares (unlimited number of shares authorized with
a par value of $0.001 per share): | |
Class A | | | 10,261 | | | | 1,255 | | | | 849 | | |
Class C | | | 125 | | | | 478 | | | | 31 | | |
Class I | | | 1,163 | | | | 935 | | | | 115 | | |
Class R | | | 2,202 | | | | — | | | | 506 | | |
Class R6 | | | 175 | | | | — | | | | — | | |
Class Y | | | 211 | | | | 211 | | | | 21 | | |
Total | | | 14,137 | | | | 2,879 | | | | 1,522 | | |
(continues on next page)
See notes to financial statements.
24
Victory Portfolios | | Statements of Assets and Liabilities
April 30, 2021 | |
(Amounts in Thousands, Except Per Share Amounts) (Unaudited) (continued)
| | | Victory
Diversified
Stock Fund | | Victory
NewBridge
Large Cap
Growth Fund | | Victory
Special
Value Fund | |
Net asset value, offering (except Class A) and
redemption price per share: (d) | |
Class A | | $ | 22.22 | | | $ | 6.64 | | | $ | 33.07 | | |
Class C (e) | | | 20.36 | | | | 1.52 | | | | 28.36 | | |
Class I | | | 22.19 | | | | 7.69 | | | | 33.52 | | |
Class R | | | 21.68 | | | | — | | | | 31.32 | | |
Class R6 | | | 22.20 | | | | — | | | | — | | |
Class Y | | | 22.23 | | | | 7.22 | | | | 33.30 | | |
Maximum Sales Charge — Class A | | | 5.75 | % | | | 5.75 | % | | | 5.75 | % | |
Maximum offering price
(100%/(100%-maximum sales charge) of net asset
value adjusted to the nearest cent) per share —
Class A | | $ | 23.58 | | | $ | 7.05 | | | $ | 35.09 | | |
(a) Includes $5,775 of securities on loan.
(b) Includes $169 of securities on loan.
(c) Rounds to less than $1 thousand.
(d) Per share amount may not recalculate due to rounding of net assets and/or shares outstanding.
(e) Redemption price per share varies by the length of time shares are held.
See notes to financial statements.
25
Victory Portfolios | | Statements of Assets and Liabilities
April 30, 2021 | |
(Amounts in Thousands, Except Per Share Amounts) (Unaudited)
| | | Victory
Strategic
Allocation
Fund | | Victory
INCORE
Fund for
Income | | Victory
INCORE
Investment
Grade
Convertible
Fund | |
Assets: | |
Affiliated investments, at value (Cost $18,582,
$— and $—) | | $ | 24,074 | | | $ | — | | | $ | — | | |
Unaffiliated investments, at value (Cost $—,
$790,353 and $338,464) | | | — | | | | 798,728 | | | | 393,423 | (a) | |
Cash | | | 5,118 | | | | — | | | | 10,796 | | |
Receivables: | |
Interest and dividends | | | — | | | | 6,665 | | | | 1,066 | | |
Capital shares issued | | | 2 | | | | 1,016 | | | | 719 | | |
Investments sold | | | — | | | | — | | | | 1,714 | | |
From Adviser | | | 20 | | | | 37 | | | | 8 | | |
Prepaid expenses | | | 37 | | | | 99 | | | | 31 | | |
Total Assets | | | 29,251 | | | | 806,545 | | | | 407,757 | | |
Liabilities: | |
Payables: | |
Collateral received on loaned securities | | | — | | | | — | | | | 40,105 | | |
Investments purchased | | | — | | | | 4,287 | | | | 1,540 | | |
Capital shares redeemed | | | 2 | | | | 6,490 | | | | 152 | | |
Accrued expenses and other payables: | |
Investment advisory fees | | | 2 | | | | 340 | | | | 221 | | |
Administration fees | | | 1 | | | | 45 | | | | 18 | | |
Custodian fees | | | — | (b) | | | — | | | | 2 | | |
Transfer agent fees | | | 5 | | | | 133 | | | | 56 | | |
Compliance fees | | | — | (b) | | | 1 | | | | — | (b) | |
Trustees' fees | | | — | | | | 2 | | | | — | (b) | |
| 12b-1 fees | | | 3 | | | | 23 | | | | 2 | | |
Other accrued expenses | | | 6 | | | | 56 | | | | 18 | | |
Total Liabilities | | | 19 | | | | 11,377 | | | | 42,114 | | |
Net Assets: | |
Capital | | | 23,582 | | | | 1,144,578 | | | | 292,125 | | |
Total accumulated earnings/(loss) | | | 5,650 | | | | (349,410 | ) | | | 73,518 | | |
Net Assets | | $ | 29,232 | | | $ | 795,168 | | | $ | 365,643 | | |
Net Assets | |
Class A | | $ | 16,741 | | | $ | 141,270 | | | $ | 21,662 | | |
Class C | | | 2,329 | | | | 12,209 | | | | — | | |
Class I | | | 8,809 | | | | 429,376 | | | | 343,693 | | |
Class R | | | 1,353 | | | | 37,950 | | | | — | | |
Class R6 | | | — | | | | 29,099 | | | | — | | |
Class Y | | | — | | | | 144,429 | | | | — | | |
Member Class | | | — | | | | 835 | | | | 288 | | |
Total | | $ | 29,232 | | | $ | 795,168 | | | $ | 365,643 | | |
(continues on next page)
See notes to financial statements.
26
Victory Portfolios | | Statements of Assets and Liabilities
April 30, 2021 | |
(Amounts in Thousands, Except Per Share Amounts) (Unaudited) (continued)
| | | Victory
Strategic
Allocation
Fund | | Victory
INCORE
Fund for
Income | | Victory
INCORE
Investment
Grade
Convertible
Fund | |
Shares (unlimited number of shares authorized with
a par value of $0.001 per share): | |
Class A | | | 850 | | | | 17,286 | | | | 1,093 | | |
Class C | | | 120 | | | | 1,510 | | | | — | | |
Class I | | | 444 | | | | 52,555 | | | | 17,336 | | |
Class R | | | 69 | | | | 4,639 | | | | — | | |
Class R6 | | | — | | | | 3,566 | | | | — | | |
Class Y | | | — | | | | 17,674 | | | | — | | |
Member Class | | | — | | | | 102 | | | | 14 | | |
Total | | | 1,483 | | | | 97,332 | | | | 18,443 | | |
Net asset value, offering (except Class A)
and redemption price per share: (c) | |
Class A | | $ | 19.71 | | | $ | 8.17 | | | $ | 19.82 | | |
Class C (d) | | | 19.35 | | | | 8.09 | | | | — | | |
Class I | | | 19.83 | | | | 8.17 | | | | 19.82 | | |
Class R | | | 19.66 | | | | 8.18 | | | | — | | |
Class R6 | | | — | | | | 8.16 | | | | — | | |
Class Y | | | — | | | | 8.17 | | | | — | | |
Member Class | | | — | | | | 8.20 | | | | 20.55 | | |
Maximum Sales Charge — Class A | | | 2.25 | % | | | 2.25 | % | | | 2.25 | % | |
Maximum offering price
(100%/(100%-maximum sales charge) of net asset
value adjusted to the nearest cent) per share —
Class A | | $ | 20.16 | | | $ | 8.36 | | | $ | 20.28 | | |
(a) Includes $39,019 of securities on loan.
(b) Rounds to less than $1 thousand.
(c) Per share amount may not recalculate due to rounding of net assets and/or shares outstanding.
(d) Redemption price per share varies by the length of time shares are held.
See notes to financial statements.
27
Victory Portfolios | | Statements of Operations
For the Year Ended April 30, 2021 | |
(Amounts in Thousands) (Unaudited)
| | | Victory
Diversified
Stock Fund | | Victory
NewBridge
Large Cap
Growth Fund | | Victory
Special
Value Fund | |
Investment Income: | | | |
Dividends | | $ | 1,528 | | | $ | 17 | | | $ | 251 | | |
Interest | | | — | (a) | | | — | (a) | | | — | (a) | |
Securities lending (net of fees) | | | 2 | | | | — | (a) | | | — | (a) | |
Total Income | | | 1,530 | | | | 17 | | | | 251 | | |
Expenses: | | | |
Investment advisory fees | | | 929 | | | | 65 | | | | 177 | | |
Administration fees | | | 82 | | | | 5 | | | | 14 | | |
Sub-Administration fees | | | 8 | | | | 7 | | | | 8 | | |
| 12b-1 fees — Class A | | | 260 | | | | 10 | | | | 33 | | |
| 12b-1 fees — Class C | | | 14 | | | | 5 | | | | 4 | | |
| 12b-1 fees — Class R | | | 110 | | | | — | | | | 38 | | |
Custodian fees | | | 7 | | | | 1 | | | | 2 | | |
Transfer agent fees — Class A | | | 73 | | | | 4 | | | | 15 | | |
Transfer agent fees — Class C | | | 2 | | | | 1 | | | | 1 | | |
Transfer agent fees — Class I | | | 7 | | | | 2 | | | | 1 | | |
Transfer agent fees — Class R | | | 18 | | | | — | | | | 12 | | |
Transfer agent fees — Class R6 | | | — | (a) | | | — | | | | — | | |
Transfer agent fees — Class Y | | | 3 | | | | 1 | | | | — | (a) | |
Trustees' fees | | | 11 | | | | 1 | | | | 2 | | |
Compliance fees | | | 1 | | | | — | (a) | | | — | (a) | |
Legal and audit fees | | | 10 | | | | 4 | | | | 5 | | |
State registration and filing fees | | | 40 | | | | 27 | | | | 33 | | |
Other expenses | | | 18 | | | | 5 | | | | 7 | | |
Total Expenses | | | 1,593 | | | | 138 | | | | 352 | | |
Expenses waived/reimbursed by Adviser | | | (18 | ) | | | (32 | ) | | | (38 | ) | |
Net Expenses | | | 1,575 | | | | 106 | | | | 314 | | |
Net Investment Income (Loss) | | | (45 | ) | | | (89 | ) | | | (63 | ) | |
Realized/Unrealized Gains (Losses) from
Investments: | | | |
Net realized gains (losses) from investment securities | | | 19,926 | | | | 3,134 | | | | 4,452 | | |
Net change in unrealized appreciation/depreciation on
investment securities | | | 56,058 | | | | (102 | ) | | | 8,074 | | |
Net realized/unrealized gains (losses) on investments | | | 75,984 | | | | 3,032 | | | | 12,526 | | |
Change in net assets resulting from operations | | $ | 75,939 | | | $ | 2,943 | | | $ | 12,463 | | |
(a) Rounds to less than $1 thousand.
See notes to financial statements.
28
Victory Portfolios | | Statements of Operations
For the Year Ended April 30, 2021 | |
(Amounts in Thousands) (Unaudited)
| | | Victory
Strategic
Allocation
Fund | | Victory
INCORE
Fund for
Income | | Victory
INCORE
Investment
Grade
Convertible
Fund | |
Investment Income: | | | |
Income distributions from affiliated funds | | $ | 930 | | | $ | — | | | $ | — | | |
Dividends from unaffiliated investments | | | — | | | | — | | | | 2,823 | | |
Interest from unaffiliated investments | | | — | (a) | | | 5,153 | | | | 1,359 | | |
Securities lending (net of fees) | | | — | | | | — | | | | 40 | | |
Total Income | | | 930 | | | | 5,153 | | | | 4,222 | | |
Expenses: | | | |
Investment advisory fees | | | 14 | | | | 2,184 | | | | 1,189 | | |
Administration fees | | | 8 | | | | 272 | | | | 91 | | |
Sub-Administration fees | | | 6 | | | | 11 | | | | 8 | | |
| 12b-1 fees — Class A | | | 20 | | | | 176 | | | | 24 | | |
| 12b-1 fees — Class C | | | 11 | | | | 80 | | | | — | | |
| 12b-1 fees — Class R | | | 3 | | | | 50 | | | | — | | |
Custodian fees | | | 1 | | | | 25 | | | | 7 | | |
Transfer agent fees — Class A | | | 10 | | | | 56 | | | | 21 | | |
Transfer agent fees — Class C | | | 1 | | | | 11 | | | | — | | |
Transfer agent fees — Class I | | | 3 | | | | 242 | | | | 117 | | |
Transfer agent fees — Class R | | | 1 | | | | 16 | | | | — | | |
Transfer agent fees — Class R6 | | | — | | | | 1 | | | | — | | |
Transfer agent fees — Class Y | | | — | | | | 93 | | | | — | | |
Transfer agent fees — Member Class (b) | | | — | | | | — | (a) | | | — | (a) | |
Trustees' fees | | | 2 | | | | 36 | | | | 12 | | |
Compliance fees | | | — | (a) | | | 4 | | | | 1 | | |
Legal and audit fees | | | 4 | | | | 27 | | | | 12 | | |
State registration and filing fees | | | 28 | | | | 81 | | | | 47 | | |
Interfund lending fees | | | — | | | | — | (a) | | | — | (a) | |
Other expenses | | | 6 | | | | 92 | | | | 25 | | |
Total Expenses | | | 118 | | | | 3,457 | | | | 1,554 | | |
Expenses waived/reimbursed by Adviser | | | (64 | ) | | | (80 | ) | | | (28 | ) | |
Net Expenses | | | 54 | | | | 3,377 | | | | 1,526 | | |
Net Investment Income (Loss) | | | 876 | | | | 1,776 | | | | 2,696 | | |
Realized/Unrealized Gains (Losses) from Investments: | | | |
Net realized gains (losses) from unaffiliated investment securities | | | 2 | | | | (814 | ) | | | 22,883 | | |
Net realized gains (losses) from sales of affiliated funds | | | (310 | ) | | | — | | | | — | | |
Capital gain distributions received from affiliated funds | | | 118 | | | | — | | | | — | | |
Net change in unrealized appreciation/depreciation on
unaffiliated investment securities | | | — | | | | (2,871 | ) | | | 29,992 | | |
Net change in unrealized appreciation/depreciation on
affiliated funds | | | 4,312 | | | | — | | | | — | | |
Net realized/unrealized gains (losses) on investments | | | 4,122 | | | | (3,685 | ) | | | 52,875 | | |
Change in net assets resulting from operations | | $ | 4,998 | | | $ | (1,909 | ) | | $ | 55,571 | | |
(a) Rounds to less than $1 thousand.
(b) Member Class commenced operations on November 3, 2020.
See notes to financial statements.
29
Victory Portfolios | | Statements of Changes in Net Assets | |
(Amounts in Thousands)
| | | Victory
Diversified Stock Fund | | Victory
NewBridge Large Cap
Growth Fund | | Victory
Special Value Fund | |
| | | Six
Months
Ended
April 30,
2021
(unaudited) | | Year
Ended
October 31,
2020 | | Six
Months
Ended
April 30,
2021
(unaudited) | | Year
Ended
October 31,
2020 | | Six
Months
Ended
April 30,
2021
(unaudited) | | Year
Ended
October 31,
2020 | |
From Investment Activities: | |
Operations: | |
Net investment income (loss) | | $ | (45 | ) | | $ | 701 | | | $ | (89 | ) | | $ | (153 | ) | | $ | (63 | ) | | $ | 12 | | |
Net realized gains (losses) from
investments | | | 19,926 | | | | 6,025 | | | | 3,134 | | | | 2,698 | | | | 4,452 | | | | 1,501 | | |
Net change in unrealized
appreciation/depreciation
on investments | | | 56,058 | | | | 6,403 | | | | (102 | ) | | | 2,842 | | | | 8,074 | | | | 855 | | |
Change in net assets resulting
from operations | | | 75,939 | | | | 13,129 | | | | 2,943 | | | | 5,387 | | | | 12,463 | | | | 2,368 | | |
Distributions to Shareholders: | |
Class A | | | (4,846 | ) | | | (13,665 | ) | | | (924 | ) | | | (1,005 | ) | | | (913 | ) | | | (912 | ) | |
Class C | | | (83 | ) | | | (369 | ) | | | (429 | ) | | | (746 | ) | | | (36 | ) | | | (40 | ) | |
Class I | | | (570 | ) | | | (1,940 | ) | | | (641 | ) | | | (987 | ) | | | (121 | ) | | | (114 | ) | |
Class R | | | (1,037 | ) | | | (3,072 | ) | | | — | | | | — | | | | (543 | ) | | | (660 | ) | |
Class R6 | | | (85 | ) | | | (57 | ) | | | — | | | | — | | | | — | | | | — | | |
Class Y | | | (99 | ) | | | (287 | ) | | | (148 | ) | | | (385 | ) | | | (23 | ) | | | (19 | ) | |
Change in net assets resulting from
distributions to shareholders | | | (6,720 | ) | | | (19,390 | ) | | | (2,142 | ) | | | (3,123 | ) | | | (1,636 | ) | | | (1,745 | ) | |
Change in net assets resulting from
capital transactions | | | (11,123 | ) | | | (36,149 | ) | | | 105 | | | | (1,443 | ) | | | (4,375 | ) | | | (11,653 | ) | |
Change in net assets | | | 58,096 | | | | (42,410 | ) | | | 906 | | | | 821 | | | | 6,452 | | | | (11,030 | ) | |
Net Assets: | |
Beginning of period | | | 254,606 | | | | 297,016 | | | | 16,862 | | | | 16,041 | | | | 42,907 | | | | 53,937 | | |
End of period | | $ | 312,702 | | | $ | 254,606 | | | $ | 17,768 | | | $ | 16,862 | | | $ | 49,359 | | | $ | 42,907 | | |
(continues on next page)
See notes to financial statements.
30
Victory Portfolios | | Statements of Changes in Net Assets | |
(Amounts in Thousands) (continued)
| | | Victory
Diversified Stock Fund | | Victory
NewBridge Large Cap
Growth Fund | | Victory
Special Value Fund | |
| | | Six
Months
Ended
April 30,
2021
(unaudited) | | Year
Ended
October 31,
2020 | | Six
Months
Ended
April 30,
2021
(unaudited) | | Year
Ended
October 31,
2020 | | Six
Months
Ended
April 30,
2021
(unaudited) | | Year
Ended
October 31,
2020 | |
Capital Transactions: | |
Class A | |
Proceeds from shares issued | | $ | 5,169 | | | $ | 7,727 | | | $ | 608 | | | $ | 1,914 | | | $ | 934 | | | $ | 2,733 | | |
Distributions reinvested | | | 4,436 | | | | 12,429 | | | | 740 | | | | 817 | | | | 831 | | | | 818 | | |
Cost of shares redeemed | | | (16,133 | ) | | | (36,795 | ) | | | (1,234 | ) | | | (1,714 | ) | | | (4,144 | ) | | | (7,356 | ) | |
Total Class A | | $ | (6,528 | ) | | $ | (16,639 | ) | | $ | 114 | | | $ | 1,017 | | | $ | (2,379 | ) | | $ | (3,805 | ) | |
Class C | |
Proceeds from shares issued | | $ | 21 | | | $ | 169 | | | $ | 90 | | | $ | 286 | | | $ | — | (a) | | $ | 446 | | |
Distributions reinvested | | | 82 | | | | 311 | | | | 338 | | | | 569 | | | | 36 | | | | 29 | | |
Cost of shares redeemed | | | (1,280 | ) | | | (3,132 | ) | | | (644 | ) | | | (1,193 | ) | | | (217 | ) | | | (870 | ) | |
Total Class C | | $ | (1,177 | ) | | $ | (2,652 | ) | | $ | (216 | ) | | $ | (338 | ) | | $ | (181 | ) | | $ | (395 | ) | |
Class I | |
Proceeds from shares issued | | $ | 812 | | | $ | 2,816 | | | $ | 1,007 | | | $ | 522 | | | $ | 281 | | | $ | 436 | | |
Distributions reinvested | | | 537 | | | | 1,805 | | | | 624 | | | | 927 | | | | 101 | | | | 98 | | |
Cost of shares redeemed | | | (2,347 | ) | | | (14,222 | ) | | | (1,073 | ) | | | (2,375 | ) | | | (641 | ) | | | (601 | ) | |
Total Class I | | $ | (998 | ) | | $ | (9,601 | ) | | $ | 558 | | | $ | (926 | ) | | $ | (259 | ) | | $ | (67 | ) | |
Class R | |
Proceeds from shares issued | | $ | 346 | | | $ | 1,667 | | | $ | — | | | $ | — | | | $ | 975 | | | $ | 2,086 | | |
Distributions reinvested | | | 1,016 | | | | 2,947 | | | | — | | | | — | | | | 530 | | | | 613 | | |
Cost of shares redeemed | | | (3,654 | ) | | | (12,020 | ) | | | — | | | | — | | | | (3,022 | ) | | | (10,132 | ) | |
Total Class R | | $ | (2,292 | ) | | $ | (7,406 | ) | | $ | — | | | $ | — | | | $ | (1,517 | ) | | $ | (7,433 | ) | |
Class R6 | |
Proceeds from shares issued | | $ | 129 | | | $ | 2,494 | | | $ | — | | | $ | — | | | $ | — | | | $ | — | | |
Distributions reinvested | | | 85 | | | | 57 | | | | — | | | | — | | | | — | | | | — | | |
Cost of shares redeemed | | | (272 | ) | | | (1,945 | ) | | | — | | | | — | | | | — | | | | — | | |
Total Class R6 | | $ | (58 | ) | | $ | 606 | | | $ | — | | | $ | — | | | $ | — | | | $ | — | | |
Class Y | |
Proceeds from shares issued | | $ | 161 | | | $ | 188 | | | $ | 207 | | | $ | 310 | | | $ | 15 | | | $ | 105 | | |
Distributions reinvested | | | 83 | | | | 244 | | | | 131 | | | | 184 | | | | 18 | | | | 14 | | |
Cost of shares redeemed | | | (314 | ) | | | (889 | ) | | | (689 | ) | | | (1,690 | ) | | | (72 | ) | | | (72 | ) | |
Total Class Y | | $ | (70 | ) | | $ | (457 | ) | | $ | (351 | ) | | $ | (1,196 | ) | | $ | (39 | ) | | $ | 47 | | |
Change in net assets resulting from
capital transactions | | $ | (11,123 | ) | | $ | (36,149 | ) | | $ | 105 | | | $ | (1,443 | ) | | $ | (4,375 | ) | | $ | (11,653 | ) | |
(a) Rounds to less than $1 thousand.
(continues on next page)
See notes to financial statements.
31
Victory Portfolios | | Statements of Changes in Net Assets | |
(Amounts in Thousands) (continued)
| | | Victory
Diversified Stock Fund | | Victory
NewBridge Large Cap
Growth Fund | | Victory
Special Value Fund | |
| | | Six
Months
Ended
April 30,
2021
(unaudited) | | Year
Ended
October 31,
2020 | | Six
Months
Ended
April 30,
2021
(unaudited) | | Year
Ended
October 31,
2020 | | Six
Months
Ended
April 30,
2021
(unaudited) | | Year
Ended
October 31,
2020 | |
Share Transactions: | |
Class A | |
Issued | | | 261 | | | | 473 | | | | 96 | | | | 336 | | | | 31 | | | | 111 | | |
Reinvested | | | 231 | | | | 719 | | | | 118 | | | | 171 | | | | 29 | | | | 31 | | |
Redeemed | | | (810 | ) | | | (2,225 | ) | | | (189 | ) | | | (314 | ) | | | (138 | ) | | | (294 | ) | |
Total Class A | | | (318 | ) | | | (1,033 | ) | | | 25 | | | | 193 | | | | (78 | ) | | | (152 | ) | |
Class C | |
Issued | | | 1 | | | | 11 | | | | 64 | | | | 176 | | | | 1 | | | | 21 | | |
Reinvested | | | 5 | | | | 19 | | | | 236 | | | | 377 | | | | 1 | | | | 1 | | |
Redeemed | | | (71 | ) | | | (199 | ) | | | (425 | ) | | | (678 | ) | | | (9 | ) | | | (39 | ) | |
Total Class C | | | (65 | ) | | | (169 | ) | | | (125 | ) | | | (125 | ) | | | (7 | ) | | | (17 | ) | |
Class I | |
Issued | | | 40 | | | | 169 | | | | 133 | | | | 86 | | | | 10 | | | | 18 | | |
Reinvested | | | 28 | | | | 105 | | | | 86 | | | | 170 | | | | 3 | | | | 4 | | |
Redeemed | | | (118 | ) | | | (856 | ) | | | (143 | ) | | | (383 | ) | | | (21 | ) | | | (24 | ) | |
Total Class I | | | (50 | ) | | | (582 | ) | | | 76 | | | | (127 | ) | | | (8 | ) | | | (2 | ) | |
Class R | |
Issued | | | 18 | | | | 102 | | | | — | | | | — | | | | 34 | | | | 95 | | |
Reinvested | | | 54 | | | | 174 | | | | — | | | | — | | | | 20 | | | | 25 | | |
Redeemed | | | (188 | ) | | | (734 | ) | | | — | | | | — | | | | (105 | ) | | | (422 | ) | |
Total Class R | | | (116 | ) | | | (458 | ) | | | — | | | | — | | | | (51 | ) | | | (302 | ) | |
Class R6 | |
Issued | | | 6 | | | | 154 | | | | — | | | | — | | | | — | | | | — | | |
Reinvested | | | 4 | | | | 3 | | | | — | | | | — | | | | — | | | | — | | |
Redeemed | | | (14 | ) | | | (109 | ) | | | — | | | | — | | | | — | | | | — | | |
Total Class R6 | | | (4 | ) | | | 48 | | | | — | | | | — | | | | — | | | | — | | |
Class Y | |
Issued | | | 8 | | | | 12 | | | | 30 | | | | 59 | | | | — | (a) | | | 4 | | |
Reinvested | | | 4 | | | | 14 | | | | 19 | | | | 36 | | | | 1 | | | | 1 | | |
Redeemed | | | (16 | ) | | | (52 | ) | | | (95 | ) | | | (264 | ) | | | (2 | ) | | | (3 | ) | |
Total Class Y | | | (4 | ) | | | (26 | ) | | | (46 | ) | | | (169 | ) | | | (1 | ) | | | 2 | | |
Change in Shares | | | (557 | ) | | | (2,220 | ) | | | (70 | ) | | | (228 | ) | | | (145 | ) | | | (471 | ) | |
(a) Rounds to less than 1 thousand.
See notes to financial statements.
32
Victory Portfolios | | Statements of Changes in Net Assets | |
(Amounts in Thousands)
| | | Victory
Strategic
Allocation Fund | | Victory INCORE
Fund for Income | | Victory
INCORE Investment Grade
Convertible Fund | |
| | | Six
Months
Ended
April 30,
2021
(unaudited) | | Year
Ended
October 31,
2020 | | Six
Months
Ended
April 30,
2021
(unaudited) | | Year
Ended
October 31,
2020 | | Six
Months
Ended
April 30,
2021
(unaudited) | | Year
Ended
October 31,
2020 | |
From Investment Activities: | |
Operations: | |
Net investment income (loss) | | $ | 876 | | | $ | 347 | | | $ | 1,776 | | | $ | 7,347 | | | $ | 2,696 | | | $ | 5,803 | | |
Net realized gains (losses) from
investments | | | (190 | ) | | | (96 | ) | | | (814 | ) | | | 877 | | | | 22,883 | | | | 8,565 | | |
Net change in unrealized
appreciation/depreciation
on investments | | | 4,312 | | | | 644 | | | | (2,871 | ) | | | 12,254 | | | | 29,992 | | | | 1,342 | | |
Change in net assets resulting
from operations | | | 4,998 | | | | 895 | | | | (1,909 | ) | | | 20,478 | | | | 55,571 | | | | 15,710 | | |
Distributions to Shareholders: | |
Class A | | | (119 | ) | | | (582 | ) | | | (3,366 | ) | | | (6,067 | ) | | | (718 | ) | | | (1,183 | ) | |
Class C | | | (10 | ) | | | (99 | ) | | | (326 | ) | | | (809 | ) | | | — | | | | — | | |
Class I | | | (66 | ) | | | (239 | ) | | | (13,111 | ) | | | (25,543 | ) | | | (12,171 | ) | | | (15,554 | ) | |
Class R | | | (8 | ) | | | (45 | ) | | | (960 | ) | | | (1,831 | ) | | | — | | | | — | | |
Class R6 | | | — | | | | — | | | | (1,120 | ) | | | (1,832 | ) | | | — | | | | — | | |
Class Y | | | — | | | | — | | | | (4,195 | ) | | | (5,074 | ) | | | — | | | | — | | |
Member Class(a) | | | — | | | | — | | | | (11 | ) | | | — | | | | (1 | ) | | | — | | |
Change in net assets resulting from
distributions to shareholders | | | (203 | ) | | | (965 | ) | | | (23,089 | ) | | | (41,156 | ) | | | (12,890 | ) | | | (16,737 | ) | |
Change in net assets resulting from
capital transactions | | | (201 | ) | | | (901 | ) | | | (221,734 | ) | | | 346,322 | | | | 29,468 | | | | 14,191 | | |
Change in net assets | | | 4,594 | | | | (971 | ) | | | (246,732 | ) | | | 325,644 | | | | 72,149 | | | | 13,164 | | |
Net Assets: | |
Beginning of period | | | 24,638 | | | | 25,609 | | | | 1,041,900 | | | | 716,256 | | | | 293,494 | | | | 280,330 | | |
End of period | | $ | 29,232 | | | $ | 24,638 | | | $ | 795,168 | | | $ | 1,041,900 | | | $ | 365,643 | | | $ | 293,494 | | |
(a) Member Class commenced operations on November 3, 2020.
(continues on next page)
See notes to financial statements.
33
Victory Portfolios | | Statements of Changes in Net Assets | |
(Amounts in Thousands) (continued)
| | | Victory
Strategic
Allocation Fund | | Victory INCORE
Fund for Income | | Victory
INCORE Investment Grade
Convertible Fund | |
| | | Six
Months
Ended
April 30,
2021
(unaudited) | | Year
Ended
October 31,
2020 | | Six
Months
Ended
April 30,
2021
(unaudited) | | Year
Ended
October 31,
2020 | | Six
Months
Ended
April 30,
2021
(unaudited) | | Year
Ended
October 31,
2020 | |
Capital Transactions: | |
Class A | |
Proceeds from shares issued | | $ | 1,163 | | | $ | 2,364 | | | $ | 31,445 | | | $ | 73,304 | | | $ | 5,075 | | | $ | 26,469 | | |
Distributions reinvested | | | 114 | | | | 557 | | | | 2,948 | | | | 5,164 | | | | 622 | | | | 1,032 | | |
Cost of shares redeemed | | | (1,692 | ) | | | (3,895 | ) | | | (40,514 | ) | | | (60,933 | ) | | | (3,127 | ) | | | (29,802 | ) | |
Total Class A | | $ | (415 | ) | | $ | (974 | ) | | $ | (6,121 | ) | | $ | 17,535 | | | $ | 2,570 | | | $ | (2,301 | ) | |
Class C | |
Proceeds from shares issued | | $ | 394 | | | $ | 574 | | | $ | 1,312 | | | $ | 6,690 | | | $ | — | | | $ | — | | |
Distributions reinvested | | | 10 | | | | 98 | | | | 302 | | | | 690 | | | | — | | | | — | | |
Cost of shares redeemed | | | (475 | ) | | | (1,845 | ) | | | (9,782 | ) | | | (8,697 | ) | | | — | | | | — | | |
Total Class C | | $ | (71 | ) | | $ | (1,173 | ) | | $ | (8,168 | ) | | $ | (1,317 | ) | | $ | — | | | $ | — | | |
Class I | |
Proceeds from shares issued | | $ | 1,145 | | | $ | 2,267 | | | $ | 113,776 | | | $ | 410,936 | | | $ | 89,300 | | | $ | 181,653 | | |
Distributions reinvested | | | 65 | | | | 233 | | | | 11,364 | | | | 21,645 | | | | 12,051 | | | | 15,054 | | |
Cost of shares redeemed | | | (784 | ) | | | (1,204 | ) | | | (272,553 | ) | | | (277,267 | ) | | | (74,729 | ) | | | (180,215 | ) | |
Total Class I | | $ | 426 | | | $ | 1,296 | | | $ | (147,413 | ) | | $ | 155,314 | | | $ | 26,622 | | | $ | 16,492 | | |
Class R | |
Proceeds from shares issued | | $ | 10 | | | $ | 30 | | | $ | 3,673 | | | $ | 18,508 | | | $ | — | | | $ | — | | |
Distributions reinvested | | | 8 | | | | 45 | | | | 934 | | | | 1,753 | | | | — | | | | — | | |
Cost of shares redeemed | | | (159 | ) | | | (125 | ) | | | (9,255 | ) | | | (14,365 | ) | | | — | | | | — | | |
Total Class R | | $ | (141 | ) | | $ | (50 | ) | | $ | (4,648 | ) | | $ | 5,896 | | | $ | — | | | $ | — | | |
Class R6 | |
Proceeds from shares issued | | $ | — | | | $ | — | | | $ | 7,122 | | | $ | 49,482 | | | $ | — | | | $ | — | | |
Distributions reinvested | | | — | | | | — | | | | 1,110 | | | | 1,818 | | | | — | | | | — | | |
Cost of shares redeemed | | | — | | | | — | | | | (26,964 | ) | | | (17,319 | ) | | | — | | | | — | | |
Total Class R6 | | $ | — | | | $ | — | | | $ | (18,732 | ) | | $ | 33,981 | | | $ | — | | | $ | — | | |
Class Y | |
Proceeds from shares issued | | $ | — | | | $ | — | | | $ | 52,184 | | | $ | 189,431 | | | $ | — | | | $ | — | | |
Distributions reinvested | | | — | | | | — | | | | 4,190 | | | | 3,546 | | | | — | | | | — | | |
Cost of shares redeemed | | | — | | | | — | | | | (93,875 | ) | | | (58,064 | ) | | | — | | | | — | | |
Total Class Y | | $ | — | | | $ | — | | | $ | (37,501 | ) | | $ | 134,913 | | | $ | — | | | $ | — | | |
Member Class(a) | |
Proceeds from shares issued | | $ | — | | | $ | — | | | $ | 1,045 | | | $ | — | | | $ | 356 | | | $ | — | | |
Distributions reinvested | | | — | | | | — | | | | 11 | | | | — | | | | 1 | | | | — | | |
Cost of shares redeemed | | | — | | | | — | | | | (207 | ) | | | — | | | | (81 | ) | | | — | | |
Total Member Class | | $ | — | | | $ | — | | | $ | 849 | | | $ | — | | | $ | 276 | | | $ | — | | |
Change in net assets resulting from
capital transactions | | $ | (201 | ) | | $ | (901 | ) | | $ | (221,734 | ) | | $ | 346,322 | | | $ | 29,468 | | | $ | 14,191 | | |
(a) Member Class commenced operations on November 3, 2020.
(continues on next page)
See notes to financial statements.
34
Victory Portfolios | | Statements of Changes in Net Assets | |
(Amounts in Thousands) (continued)
| | | Victory
Strategic
Allocation Fund | | Victory INCORE
Fund for Income | | Victory
INCORE Investment Grade
Convertible Fund | |
| | | Six
Months
Ended
April 30,
2021
(unaudited) | | Year
Ended
October 31,
2020 | | Six
Months
Ended
April 30,
2021
(unaudited) | | Year
Ended
October 31,
2020 | | Six
Months
Ended
April 30,
2021
(unaudited) | | Year
Ended
October 31,
2020 | |
Share Transactions: | |
Class A | |
Issued | | | 65 | | | | 146 | | | | 3,779 | | | | 8,586 | | | | 269 | | | | 1,717 | | |
Reinvested | | | 6 | | | | 34 | | | | 356 | | | | 608 | | | | 34 | | | | 62 | | |
Redeemed | | | (92 | ) | | | (242 | ) | | | (4,859 | ) | | | (7,145 | ) | | | (167 | ) | | | (1,755 | ) | |
Total Class A | | | (21 | ) | | | (62 | ) | | | (724 | ) | | | 2,049 | | | | 136 | | | | 24 | | |
Class C | |
Issued | | | 21 | | | | 36 | | | | 160 | | | | 789 | | | | — | | | | — | | |
Reinvested | | | 1 | | | | 6 | | | | 37 | | | | 82 | | | | — | | | | — | | |
Redeemed | | | (26 | ) | | | (115 | ) | | | (1,189 | ) | | | (1,028 | ) | | | — | | | | — | | |
Total Class C | | | (4 | ) | | | (73 | ) | | | (992 | ) | | | (157 | ) | | | — | | | | — | | |
Class I | |
Issued | | | 60 | | | | 140 | | | | 13,671 | | | | 48,019 | | | | 4,667 | | | | 11,013 | | |
Reinvested | | | 4 | | | | 14 | | | | 1,373 | | | | 2,546 | | | | 664 | | | | 889 | | |
Redeemed | | | (43 | ) | | | (78 | ) | | | (32,872 | ) | | | (32,536 | ) | | | (3,987 | ) | | | (10,994 | ) | |
Total Class I | | | 21 | | | | 76 | | | | (17,828 | ) | | | 18,029 | | | | 1,344 | | | | 908 | | |
Class R | |
Issued | | | 1 | | | | 2 | | | | 440 | | | | 2,167 | | | | — | | | | — | | |
Reinvested | | | — | (b) | | | 3 | | | | 113 | | | | 206 | | | | — | | | | — | | |
Redeemed | | | (9 | ) | | | (8 | ) | | | (1,112 | ) | | | (1,682 | ) | | | — | | | | — | | |
Total Class R | | | (8 | ) | | | (3 | ) | | | (559 | ) | | | 691 | | | | — | | | | — | | |
Class R6 | |
Issued | | | — | | | | — | | | | 856 | | | | 5,802 | | | | — | | | | — | | |
Reinvested | | | — | | | | — | | | | 134 | | | | 214 | | | | — | | | | — | | |
Redeemed | | | — | | | | — | | | | (3,270 | ) | | | (2,027 | ) | | | — | | | | — | | |
Total Class R6 | | | — | | | | — | | | | (2,280 | ) | | | 3,989 | | | | — | | | | — | | |
Class Y | |
Issued | | | — | | | | — | | | | 6,269 | | | | 22,159 | | | | — | | | | — | | |
Reinvested | | | — | | | | — | | | | 506 | | | | 418 | | | | — | | | | — | | |
Redeemed | | | — | | | | — | | | | (11,302 | ) | | | (6,797 | ) | | | — | | | | — | | |
Total Class Y | | | — | | | | — | | | | (4,527 | ) | | | 15,780 | | | | — | | | | — | | |
Member Class (a) | |
Issued | | | — | | | | — | | | | 126 | | | | — | | | | 18 | | | | — | | |
Reinvested | | | — | | | | — | | | | 1 | | | | — | | | | — | (b) | | | — | | |
Redeemed | | | — | | | | — | | | | (25 | ) | | | — | | | | (4 | ) | | | — | | |
Total Member Class | | | — | | | | — | | | | 102 | | | | — | | | | 14 | | | | — | | |
Change in Shares | | | (12 | ) | | | (62 | ) | | | (26,808 | ) | | | 40,381 | | | | 1,494 | | | | 932 | | |
(a) Member Class commenced operations on November 3, 2020.
(b) Rounds to less than 1 thousand.
See notes to financial statements.
35
Victory Portfolios | | Financial Highlights | |
For a Share Outstanding Throughout Each Period
| | | | Investment Activities | | Distributions to
Shareholders From | |
| | | Net Asset
Value,
Beginning of
Period | | Net
Investment
Income
(Loss)(a) | | Net Realized
and Unrealized
Gains (Losses)
on Investments | | Total from
Investment
Activities | | Net
Investment
Income | | Net Realized
Gains from
Investments | |
Victory Diversified Stock Fund | |
Class A | |
Six Months Ended
4/30/21 (unaudited) | | $ | 17.41 | | | | — | (e) | | | 5.28 | | | | 5.28 | | | | (0.01 | ) | | | (0.46 | ) | |
Year Ended 10/31/20 | | $ | 17.65 | | | | 0.05 | | | | 0.90 | | | | 0.95 | | | | (0.04 | ) | | | (1.15 | ) | |
Year Ended 10/31/19 | | $ | 17.90 | | | | 0.09 | | | | 1.65 | | | | 1.74 | | | | (0.08 | ) | | | (1.91 | ) | |
Year Ended 10/31/18 | | $ | 22.03 | | | | 0.06 | | | | 0.17 | | | | 0.23 | | | | (0.06 | ) | | | (4.30 | ) | |
Year Ended 10/31/17 | | $ | 18.01 | | | | 0.13 | | | | 4.28 | | | | 4.41 | | | | (0.17 | ) | | | (0.22 | ) | |
Year Ended 10/31/16 | | $ | 20.80 | | | | 0.20 | | | | (1.04 | ) | | | (0.84 | ) | | | (0.19 | ) | | | (1.76 | ) | |
Class C | |
Six Months Ended
4/30/21 (unaudited) | | $ | 16.05 | | | | (0.08 | ) | | | 4.85 | | | | 4.77 | | | | — | | | | (0.46 | ) | |
Year Ended 10/31/20 | | $ | 16.46 | | | | (0.10 | ) | | | 0.84 | | | | 0.74 | | | | — | | | | (1.15 | ) | |
Year Ended 10/31/19 | | $ | 16.90 | | | | (0.05 | ) | | | 1.52 | | | | 1.47 | | | | — | | | | (1.91 | ) | |
Year Ended 10/31/18 | | $ | 21.12 | | | | (0.10 | ) | | | 0.18 | | | | 0.08 | | | | — | | | | (4.30 | ) | |
Year Ended 10/31/17 | | $ | 17.30 | | | | (0.02 | ) | | | 4.10 | | | | 4.08 | | | | (0.04 | ) | | | (0.22 | ) | |
Year Ended 10/31/16 | | $ | 20.07 | | | | 0.04 | | | | (1.00 | ) | | | (0.96 | ) | | | (0.05 | ) | | | (1.76 | ) | |
Class I | |
Six Months Ended
4/30/21 (unaudited) | | $ | 17.37 | | | | 0.02 | | | | 5.28 | | | | 5.30 | | | | (0.02 | ) | | | (0.46 | ) | |
Year Ended 10/31/20 | | $ | 17.61 | | | | 0.09 | | | | 0.90 | | | | 0.99 | | | | (0.08 | ) | | | (1.15 | ) | |
Year Ended 10/31/19 | | $ | 17.87 | | | | 0.13 | | | | 1.65 | | | | 1.78 | | | | (0.13 | ) | | | (1.91 | ) | |
Year Ended 10/31/18 | | $ | 22.00 | | | | 0.11 | | | | 0.16 | | | | 0.27 | | | | (0.10 | ) | | | (4.30 | ) | |
Year Ended 10/31/17 | | $ | 17.98 | | | | 0.19 | | | | 4.27 | | | | 4.46 | | | | (0.22 | ) | | | (0.22 | ) | |
Year Ended 10/31/16 | | $ | 20.77 | | | | 0.24 | | | | (1.03 | ) | | | (0.79 | ) | | | (0.24 | ) | | | (1.76 | ) | |
Class R | |
Six Months Ended
4/30/21 (unaudited) | | $ | 17.01 | | | | (0.03 | ) | | | 5.16 | | | | 5.13 | | | | — | | | | (0.46 | ) | |
Year Ended 10/31/20 | | $ | 17.29 | | | | — | (e) | | | 0.88 | | | | 0.88 | | | | (0.01 | ) | | | (1.15 | ) | |
Year Ended 10/31/19 | | $ | 17.58 | | | | 0.04 | | | | 1.62 | | | | 1.66 | | | | (0.04 | ) | | | (1.91 | ) | |
Year Ended 10/31/18 | | $ | 21.71 | | | | 0.01 | | | | 0.16 | | | | 0.17 | | | | — | (e) | | | (4.30 | ) | |
Year Ended 10/31/17 | | $ | 17.75 | | | | 0.07 | | | | 4.23 | | | | 4.30 | | | | (0.12 | ) | | | (0.22 | ) | |
Year Ended 10/31/16 | | $ | 20.54 | | | | 0.14 | | | | (1.04 | ) | | | (0.90 | ) | | | (0.13 | ) | | | (1.76 | ) | |
(a) Per share net investment income (loss) has been calculated using the average daily shares method.
(b) Not annualized for periods less than one year.
(c) Annualized for periods less than one year.
(d) Portfolio turnover is calculated on the basis of the Fund as a whole without distinguishing between the classes of shares issued.
(e) Amount is less than $0.005 per share.
(f) Portfolio turnover increased due to a change within the portfolio holdings during the year.
See notes to financial statements.
36
Victory Portfolios | | Financial Highlights — continued | |
For a Share Outstanding Throughout Each Period
| | | | | Ratios to Average Net Assets | | Supplemental Data | |
| | | Total
Distributions | | Net Asset
Value,
End of
Period | | Total
Return
(Excludes
Sales
Charge)(b) | | Net
Expenses(c) | | Net
Investment
Income
(Loss)(c) | | Gross
Expenses(c) | | Net Assets,
End of
Period
(000's) | | Portfolio
Turnover(b)(d) | |
Victory Diversified Stock Fund | |
Class A | |
Six Months Ended
4/30/21 (unaudited) | | | (0.47 | ) | | $ | 22.22 | | | | 30.73 | % | | | 1.07 | % | | | (0.01 | )% | | | 1.07 | % | | $ | 228,026 | | | | 33 | % | |
Year Ended 10/31/20 | | | (1.19 | ) | | $ | 17.41 | | | | 5.47 | % | | | 1.09 | % | | | 0.29 | % | | | 1.09 | % | | $ | 184,217 | | | | 95 | % | |
Year Ended 10/31/19 | | | (1.99 | ) | | $ | 17.65 | | | | 12.27 | % | | | 1.08 | % | | | 0.55 | % | | | 1.08 | % | | $ | 204,945 | | | | 132 | % | |
Year Ended 10/31/18 | | | (4.36 | ) | | $ | 17.90 | | | | (0.20 | )% | | | 1.05 | % | | | 0.32 | % | | | 1.05 | % | | $ | 264,297 | | | | 112 | % | |
Year Ended 10/31/17 | | | (0.39 | ) | | $ | 22.03 | | | | 24.85 | % | | | 1.05 | % | | | 0.66 | % | | | 1.05 | % | | $ | 311,255 | | | | 133 | %(f) | |
Year Ended 10/31/16 | | | (1.95 | ) | | $ | 18.01 | | | | (4.21 | )% | | | 1.07 | % | | | 1.06 | % | | | 1.07 | % | | $ | 352,748 | | | | 74 | % | |
Class C | |
Six Months Ended
4/30/21 (unaudited) | | | (0.46 | ) | | $ | 20.36 | | | | 30.07 | % | | | 2.02 | % | | | (0.91 | )% | | | 2.29 | % | | $ | 2,550 | | | | 33 | % | |
Year Ended 10/31/20 | | | (1.15 | ) | | $ | 16.05 | | | | 4.53 | % | | | 2.05 | % | | | (0.64 | )% | | | 2.14 | % | | $ | 3,046 | | | | 95 | % | |
Year Ended 10/31/19 | | | (1.91 | ) | | $ | 16.46 | | | | 11.19 | % | | | 2.02 | % | | | (0.35 | )% | | | 2.02 | % | | $ | 5,909 | | | | 132 | % | |
Year Ended 10/31/18 | | | (4.30 | ) | | $ | 16.90 | | | | (1.02 | )% | | | 1.89 | % | | | (0.53 | )% | | | 1.89 | % | | $ | 11,586 | | | | 112 | % | |
Year Ended 10/31/17 | | | (0.26 | ) | | $ | 21.12 | | | | 23.82 | % | | | 1.87 | % | | | (0.12 | )% | | | 1.87 | % | | $ | 36,001 | | | | 133 | %(f) | |
Year Ended 10/31/16 | | | (1.81 | ) | | $ | 17.30 | | | | (5.01 | )% | | | 1.90 | % | | | 0.23 | % | | | 1.90 | % | | $ | 50,213 | | | | 74 | % | |
Class I | |
Six Months Ended
4/30/21 (unaudited) | | | (0.48 | ) | | $ | 22.19 | | | | 30.86 | % | | | 0.83 | % | | | 0.24 | % | | | 0.86 | % | | $ | 25,796 | | | | 33 | % | |
Year Ended 10/31/20 | | | (1.23 | ) | | $ | 17.37 | | | | 5.81 | % | | | 0.84 | % | | | 0.56 | % | | | 0.86 | % | | $ | 21,071 | | | | 95 | % | |
Year Ended 10/31/19 | | | (2.04 | ) | | $ | 17.61 | | | | 12.52 | % | | | 0.84 | % | | | 0.81 | % | | | 0.84 | % | | $ | 31,619 | | | | 132 | % | |
Year Ended 10/31/18 | | | (4.40 | ) | | $ | 17.87 | | | | 0.05 | % | | | 0.79 | % | | | 0.58 | % | | | 0.79 | % | | $ | 46,122 | | | | 112 | % | |
Year Ended 10/31/17 | | | (0.44 | ) | | $ | 22.00 | | | | 25.21 | % | | | 0.80 | % | | | 0.99 | % | | | 0.80 | % | | $ | 74,466 | | | | 133 | %(f) | |
Year Ended 10/31/16 | | | (2.00 | ) | | $ | 17.98 | | | | (3.96 | )% | | | 0.80 | % | | | 1.33 | % | | | 0.80 | % | | $ | 162,923 | | | | 74 | % | |
Class R | |
Six Months Ended
4/30/21 (unaudited) | | | (0.46 | ) | | $ | 21.68 | | | | 30.49 | % | | | 1.35 | % | | | (0.29 | )% | | | 1.35 | % | | $ | 47,746 | | | | 33 | % | |
Year Ended 10/31/20 | | | (1.16 | ) | | $ | 17.01 | | | | 5.25 | % | | | 1.37 | % | | | 0.01 | % | | | 1.37 | % | | $ | 39,432 | | | | 95 | % | |
Year Ended 10/31/19 | | | (1.95 | ) | | $ | 17.29 | | | | 11.90 | % | | | 1.37 | % | | | 0.26 | % | | | 1.37 | % | | $ | 47,981 | | | | 132 | % | |
Year Ended 10/31/18 | | | (4.30 | ) | | $ | 17.58 | | | | (0.47 | )% | | | 1.34 | % | | | 0.03 | % | | | 1.34 | % | | $ | 54,776 | | | | 112 | % | |
Year Ended 10/31/17 | | | (0.34 | ) | | $ | 21.71 | | | | 24.56 | % | | | 1.33 | % | | | 0.38 | % | | | 1.33 | % | | $ | 66,310 | | | | 133 | %(f) | |
Year Ended 10/31/16 | | | (1.89 | ) | | $ | 17.75 | | | | (4.55 | )% | | | 1.36 | % | | | 0.77 | % | | | 1.36 | % | | $ | 69,751 | | | | 74 | % | |
(continues on next page)
See notes to financial statements.
37
Victory Portfolios | | Financial Highlights | |
For a Share Outstanding Throughout Each Period
| | | | | Investment Activities | | Distributions to
Shareholders From | |
| | Net Asset
Value,
Beginning of
Period | | Net
Investment
Income
(Loss)(a) | | Net Realized
and Unrealized
Gains (Losses)
on Investments | | Total from
Investment
Activities | | Net
Investment
Income | | Net Realized
Gains from
Investments | |
Victory Diversified Stock Fund | |
Class R6 | |
Six Months Ended
4/30/21 (unaudited) | | $ | 17.38 | | | | 0.03 | | | | 5.27 | | | | 5.30 | | | | (0.02 | ) | | | (0.46 | ) | |
Year Ended 10/31/20 | | $ | 17.62 | | | | 0.08 | | | | 0.92 | | | | 1.00 | | | | (0.09 | ) | | | (1.15 | ) | |
Year Ended 10/31/19 | | $ | 17.88 | | | | 0.14 | | | | 1.64 | | | | 1.78 | | | | (0.13 | ) | | | (1.91 | ) | |
Year Ended 10/31/18 | | $ | 22.00 | | | | 0.11 | | | | 0.17 | | | | 0.28 | | | | (0.10 | ) | | | (4.30 | ) | |
Year Ended 10/31/17 | | $ | 17.98 | | | | 0.18 | | | | 4.29 | | | | 4.47 | | | | (0.23 | ) | | | (0.22 | ) | |
Year Ended 10/31/16 | | $ | 20.77 | | | | 0.26 | | | | (1.05 | ) | | | (0.79 | ) | | | (0.24 | ) | | | (1.76 | ) | |
Class Y | |
Six Months Ended
4/30/21 (unaudited) | | $ | 17.41 | | | | 0.02 | | | | 5.28 | | | | 5.30 | | | | (0.02 | ) | | | (0.46 | ) | |
Year Ended 10/31/20 | | $ | 17.65 | | | | 0.09 | | | | 0.90 | | | | 0.99 | | | | (0.08 | ) | | | (1.15 | ) | |
Year Ended 10/31/19 | | $ | 17.90 | | | | 0.12 | | | | 1.66 | | | | 1.78 | | | | (0.12 | ) | | | (1.91 | ) | |
Year Ended 10/31/18 | | $ | 22.02 | | | | 0.11 | | | | 0.16 | | | | 0.27 | | | | (0.09 | ) | | | (4.30 | ) | |
Year Ended 10/31/17 | | $ | 18.00 | | | | 0.17 | | | | 4.28 | | | | 4.45 | | | | (0.21 | ) | | | (0.22 | ) | |
Year Ended 10/31/16 | | $ | 20.79 | | | | 0.23 | | | | (1.03 | ) | | | (0.80 | ) | | | (0.23 | ) | | | (1.76 | ) | |
(a) Per share net investment income (loss) has been calculated using the average daily shares method.
(b) Not annualized for periods less than one year.
(c) Annualized for periods less than one year.
(d) Portfolio turnover is calculated on the basis of the Fund as a whole without distinguishing between the classes of shares issued.
(e) Portfolio turnover increased due to a change within the portfolio holdings during the year.
See notes to financial statements.
38
Victory Portfolios | | Financial Highlights — continued | |
For a Share Outstanding Throughout Each Period (continued)
| | | | | Ratios to Average Net Assets | | Supplemental Data | |
| | Total
Distributions | | Net Asset
Value,
End of
Period | | Total
Return(b) | | Net
Expenses(c) | | Net
Investment
Income
(Loss)(c) | | Gross
Expenses(c) | | Net Assets,
End of
Period
(000's) | | Portfolio
Turnover(b)(d) | |
Victory Diversified Stock Fund | |
Class R6 | |
Six Months Ended
4/30/21 (unaudited) | | | (0.48 | ) | | $ | 22.20 | | | | 30.86 | % | | | 0.78 | % | | | 0.29 | % | | | 1.08 | % | | $ | 3,889 | | | | 33 | % | |
Year Ended 10/31/20 | | | (1.24 | ) | | $ | 17.38 | | | | 5.86 | % | | | 0.78 | % | | | 0.49 | % | | | 1.34 | % | | $ | 3,103 | | | | 95 | % | |
Year Ended 10/31/19 | | | (2.04 | ) | | $ | 17.62 | | | | 12.58 | % | | | 0.78 | % | | | 0.83 | % | | | 1.24 | % | | $ | 2,313 | | | | 132 | % | |
Year Ended 10/31/18 | | | (4.40 | ) | | $ | 17.88 | | | | 0.10 | % | | | 0.78 | % | | | 0.58 | % | | | 1.21 | % | | $ | 2,189 | | | | 112 | % | |
Year Ended 10/31/17 | | | (0.45 | ) | | $ | 22.00 | | | | 25.24 | % | | | 0.78 | % | | | 0.94 | % | | | 1.29 | % | | $ | 2,427 | | | | 133 | %(e) | |
Year Ended 10/31/16 | | | (2.00 | ) | | $ | 17.98 | | | | (3.93 | )% | | | 0.78 | % | | | 1.40 | % | | | 0.92 | % | | $ | 2,332 | | | | 74 | % | |
Class Y | |
Six Months Ended
4/30/21 (unaudited) | | | (0.48 | ) | | $ | 22.23 | | | | 30.86 | % | | | 0.86 | % | | | 0.21 | % | | | 1.13 | % | | $ | 4,695 | | | | 33 | % | |
Year Ended 10/31/20 | | | (1.23 | ) | | $ | 17.41 | | | | 5.72 | % | | | 0.86 | % | | | 0.52 | % | | | 1.31 | % | | $ | 3,737 | | | | 95 | % | |
Year Ended 10/31/19 | | | (2.03 | ) | | $ | 17.65 | | | | 12.53 | % | | | 0.86 | % | | | 0.76 | % | | | 1.33 | % | | $ | 4,249 | | | | 132 | % | |
Year Ended 10/31/18 | | | (4.39 | ) | | $ | 17.90 | | | | 0.01 | % | | | 0.86 | % | | | 0.54 | % | | | 1.13 | % | | $ | 4,373 | | | | 112 | % | |
Year Ended 10/31/17 | | | (0.43 | ) | | $ | 22.02 | | | | 25.11 | % | | | 0.86 | % | | | 0.88 | % | | | 0.94 | % | | $ | 8,843 | | | | 133 | %(e) | |
Year Ended 10/31/16 | | | (1.99 | ) | | $ | 18.00 | | | | (4.01 | )% | | | 0.86 | % | | | 1.27 | % | | | 0.96 | % | | $ | 11,907 | | | | 74 | % | |
See notes to financial statements.
39
Victory Portfolios | | Financial Highlights | |
For a Share Outstanding Throughout Each Period
| | | | Investment Activities | | Distributions to
Shareholders From | |
| | | Net Asset
Value,
Beginning of
Period | | Net
Investment
Income
(Loss)(a) | | Net Realized
and Unrealized
Gains (Losses)
on Investments | | Total from
Investment
Activities | | Net Realized
Gains from
Investments | | Total
Distributions | |
Victory NewBridge Large Cap Growth Fund | |
Class A | |
Six Months Ended
4/30/21 (unaudited) | | $ | 6.31 | | | | (0.04 | ) | | | 1.13 | | | | 1.09 | | | | (0.76 | ) | | | (0.76 | ) | |
Year Ended 10/31/20 | | $ | 5.52 | | | | (0.06 | ) | | | 1.91 | | | | 1.85 | | | | (1.06 | ) | | | (1.06 | ) | |
Year Ended 10/31/19 | | $ | 7.94 | | | | (0.05 | ) | | | 0.05 | (e) | | | — | (f) | | | (2.42 | ) | | | (2.42 | ) | |
Year Ended 10/31/18 | | $ | 10.23 | | | | (0.09 | ) | | | 0.85 | | | | 0.76 | | | | (3.05 | ) | | | (3.05 | ) | |
Year Ended 10/31/17 | | $ | 12.79 | | | | (0.09 | ) | | | 1.82 | | | | 1.73 | | | | (4.29 | ) | | | (4.29 | ) | |
Year Ended 10/31/16 | | $ | 19.17 | | | | (0.11 | ) | | | (0.22 | ) | | | (0.33 | ) | | | (6.05 | ) | | | (6.05 | ) | |
Class C | |
Six Months Ended
4/30/21 (unaudited) | | $ | 1.97 | | | | (0.02 | ) | | | 0.33 | | | | 0.31 | | | | (0.76 | ) | | | (0.76 | ) | |
Year Ended 10/31/20 | | $ | 2.43 | | | | (0.03 | ) | | | 0.63 | | | | 0.60 | | | | (1.06 | ) | | | (1.06 | ) | |
Year Ended 10/31/19 | | $ | 5.00 | | | | (0.06 | ) | | | (0.09 | )(e) | | | (0.15 | ) | | | (2.42 | ) | | | (2.42 | ) | |
Year Ended 10/31/18 | | $ | 7.59 | | | | (0.10 | ) | | | 0.56 | | | | 0.46 | | | | (3.05 | ) | | | (3.05 | ) | |
Year Ended 10/31/17 | | $ | 10.65 | | | | (0.12 | ) | | | 1.35 | | | | 1.23 | | | | (4.29 | ) | | | (4.29 | ) | |
Year Ended 10/31/16 | | $ | 17.06 | | | | (0.18 | ) | | | (0.18 | ) | | | (0.36 | ) | | | (6.05 | ) | | | (6.05 | ) | |
Class I | |
Six Months Ended
4/30/21 (unaudited) | | $ | 7.18 | | | | (0.03 | ) | | | 1.30 | | | | 1.27 | | | | (0.76 | ) | | | (0.76 | ) | |
Year Ended 10/31/20 | | $ | 6.13 | | | | (0.04 | ) | | | 2.15 | | | | 2.11 | | | | (1.06 | ) | | | (1.06 | ) | |
Year Ended 10/31/19 | | $ | 8.49 | | | | (0.04 | ) | | | 0.10 | (e) | | | 0.06 | | | | (2.42 | ) | | | (2.42 | ) | |
Year Ended 10/31/18 | | $ | 10.71 | | | | (0.06 | ) | | | 0.89 | | | | 0.83 | | | | (3.05 | ) | | | (3.05 | ) | |
Year Ended 10/31/17 | | $ | 13.13 | | | | (0.05 | ) | | | 1.92 | | | | 1.87 | | | | (4.29 | ) | | | (4.29 | ) | |
Year Ended 10/31/16 | | $ | 19.47 | | | | (0.05 | ) | | | (0.24 | ) | | | (0.29 | ) | | | (6.05 | ) | | | (6.05 | ) | |
Class Y | |
Six Months Ended
4/30/21 (unaudited) | | $ | 6.79 | | | | (0.03 | ) | | | 1.22 | | | | 1.19 | | | | (0.76 | ) | | | (0.76 | ) | |
Year Ended 10/31/20 | | $ | 5.86 | | | | (0.04 | ) | | | 2.03 | | | | 1.99 | | | | (1.06 | ) | | | (1.06 | ) | |
Year Ended 10/31/19 | | $ | 8.24 | | | | (0.04 | ) | | | 0.08 | (e) | | | 0.04 | | | | (2.42 | ) | | | (2.42 | ) | |
Year Ended 10/31/18 | | $ | 10.48 | | | | (0.06 | ) | | | 0.87 | | | | 0.81 | | | | (3.05 | ) | | | (3.05 | ) | |
Year Ended 10/31/17 | | $ | 12.96 | | | | (0.06 | ) | | | 1.87 | | | | 1.81 | | | | (4.29 | ) | | | (4.29 | ) | |
Year Ended 10/31/16 | | $ | 19.31 | | | | (0.07 | ) | | | (0.23 | ) | | | (0.30 | ) | | | (6.05 | ) | | | (6.05 | ) | |
(a) Per share net investment income (loss) has been calculated using the average daily shares method.
(b) Not annualized for periods less than one year.
(c) Annualized for periods less than one year.
(d) Portfolio turnover is calculated on the basis of the Fund as a whole without distinguishing between the classes of shares issued.
(e) The amount shown for a share outstanding throughout the period does not accord with the change in aggregate gains and losses in the portfolio of securities during the period because of timing of sales and purchases of fund shares in relation to fluctuating market values during the period.
(f) Amount is less than $0.005 per share.
See notes to financial statements.
40
Victory Portfolios | | Financial Highlights — continued | |
For a Share Outstanding Throughout Each Period
| | | | | Ratios to Average Net Assets | | Supplemental Data | |
| | | Net Asset
Value,
End of
Period | | Total
Return
(Excludes
Sales
Charge)(b) | | Net
Expenses(c) | | Net
Investment
Income
(Loss)(c) | | Gross
Expenses(c) | | Net Assets,
End of
Period
(000's) | | Portfolio
Turnover(b)(d) | |
Victory NewBridge Large Cap Growth Fund | |
Class A | |
Six Months Ended
4/30/21 (unaudited) | | $ | 6.64 | | | | 18.04 | % | | | 1.36 | % | | | (1.17 | )% | | | 1.55 | % | | $ | 8,330 | | | | 27 | % | |
Year Ended 10/31/20 | | $ | 6.31 | | | | 39.61 | % | | | 1.36 | % | | | (1.08 | )% | | | 1.52 | % | | $ | 7,757 | | | | 39 | % | |
Year Ended 10/31/19 | | $ | 5.52 | | | | 4.56 | % | | | 1.36 | % | | | (0.97 | )% | | | 1.60 | % | | $ | 5,732 | | | | 62 | % | |
Year Ended 10/31/18 | | $ | 7.94 | | | | 9.41 | % | | | 1.36 | % | | | (1.05 | )% | | | 1.47 | % | | $ | 5,546 | | | | 41 | % | |
Year Ended 10/31/17 | | $ | 10.23 | | | | 20.84 | % | | | 1.40 | % | | | (0.94 | )% | | | 1.40 | % | | $ | 7,639 | | | | 60 | % | |
Year Ended 10/31/16 | | $ | 12.79 | | | | (3.00 | )% | | | 1.30 | % | | | (0.79 | )% | | | 1.30 | % | | $ | 11,700 | | | | 52 | % | |
Class C | |
Six Months Ended
4/30/21 (unaudited) | | $ | 1.52 | | | | 18.22 | % | | | 2.10 | % | | | (1.90 | )% | | | 3.42 | % | | $ | 723 | | | | 27 | % | |
Year Ended 10/31/20 | | $ | 1.97 | | | | 37.97 | % | | | 2.10 | % | | | (1.79 | )% | | | 2.67 | % | | $ | 1,190 | | | | 39 | % | |
Year Ended 10/31/19 | | $ | 2.43 | | | | 3.92 | % | | | 2.10 | % | | | (1.71 | )% | | | 2.70 | % | | $ | 1,768 | | | | 62 | % | |
Year Ended 10/31/18 | | $ | 5.00 | | | | 8.47 | % | | | 2.10 | % | | | (1.78 | )% | | | 2.40 | % | | $ | 3,042 | | | | 41 | % | |
Year Ended 10/31/17 | | $ | 7.59 | | | | 20.06 | % | | | 2.10 | % | | | (1.64 | )% | | | 2.27 | % | | $ | 4,201 | | | | 60 | % | |
Year Ended 10/31/16 | | $ | 10.65 | | | | (3.79 | )% | | | 2.10 | % | | | (1.59 | )% | | | 2.15 | % | | $ | 6,321 | | | | 52 | % | |
Class I | |
Six Months Ended
4/30/21 (unaudited) | | $ | 7.69 | | | | 18.38 | % | | | 0.95 | % | | | (0.76 | )% | | | 1.31 | % | | $ | 7,190 | | | | 27 | % | |
Year Ended 10/31/20 | | $ | 7.18 | | | | 39.95 | % | | | 0.95 | % | | | (0.66 | )% | | | 1.31 | % | | $ | 6,171 | | | | 39 | % | |
Year Ended 10/31/19 | | $ | 6.13 | | | | 5.11 | % | | | 0.95 | % | | | (0.56 | )% | | | 1.26 | % | | $ | 6,043 | | | | 62 | % | |
Year Ended 10/31/18 | | $ | 8.49 | | | | 9.74 | % | | | 0.95 | % | | | (0.63 | )% | | | 1.09 | % | | $ | 10,633 | | | | 41 | % | |
Year Ended 10/31/17 | | $ | 10.71 | | | | 21.52 | % | | | 0.95 | % | | | (0.47 | )% | | | 1.01 | % | | $ | 16,103 | | | | 60 | % | |
Year Ended 10/31/16 | | $ | 13.13 | | | | (2.67 | )% | | | 0.88 | % | | | (0.36 | )% | | | 0.88 | % | | $ | 31,299 | | | | 52 | % | |
Class Y | |
Six Months Ended
4/30/21 (unaudited) | | $ | 7.22 | | | | 18.23 | % | | | 1.02 | % | | | (0.83 | )% | | | 1.89 | % | | $ | 1,525 | | | | 27 | % | |
Year Ended 10/31/20 | | $ | 6.79 | | | | 39.72 | % | | | 1.02 | % | | | (0.73 | )% | | | 1.78 | % | | $ | 1,744 | | | | 39 | % | |
Year Ended 10/31/19 | | $ | 5.86 | | | | 5.06 | % | | | 1.02 | % | | | (0.63 | )% | | | 1.69 | % | | $ | 2,498 | | | | 62 | % | |
Year Ended 10/31/18 | | $ | 8.24 | | | | 9.75 | % | | | 1.02 | % | | | (0.72 | )% | | | 1.48 | % | | $ | 3,411 | | | | 41 | % | |
Year Ended 10/31/17 | | $ | 10.48 | | | | 21.30 | % | | | 1.02 | % | | | (0.55 | )% | | | 1.42 | % | | $ | 2,128 | | | | 60 | % | |
Year Ended 10/31/16 | | $ | 12.96 | | | | (2.76 | )% | | | 1.02 | % | | | (0.50 | )% | | | 1.08 | % | | $ | 4,344 | | | | 52 | % | |
See notes to financial statements.
41
Victory Portfolios | | Financial Highlights | |
For a Share Outstanding Throughout Each Period
| | | | Investment Activities | | Distributions to
Shareholders From | |
| | | Net Asset
Value,
Beginning of
Period | | Net
Investment
Income
(Loss)(a) | | Net Realized
and Unrealized
Gains (Losses)
on Investments | | Total from
Investment
Activities | | Net
Investment
Income | | Net Realized
Gains from
Investments | |
Victory Special Value Fund | |
Class A | |
Six Months Ended
4/30/21 (unaudited) | | $ | 26.23 | | | | (0.02 | ) | | | 7.86 | | | | 7.84 | | | | — | (e) | | | (1.00 | ) | |
Year Ended 10/31/20 | | $ | 25.78 | | | | 0.04 | | | | 1.29 | | | | 1.33 | | | | (0.09 | ) | | | (0.79 | ) | |
Year Ended 10/31/19 | | $ | 26.10 | | | | 0.10 | | | | 2.26 | | | | 2.36 | | | | (0.03 | ) | | | (2.65 | ) | |
Year Ended 10/31/18 | | $ | 26.31 | | | | 0.05 | | | | (0.15 | ) | | | (0.10 | ) | | | (0.11 | ) | | | — | | |
Year Ended 10/31/17 | | $ | 21.48 | | | | 0.13 | | | | 4.95 | | | | 5.08 | | | | (0.25 | ) | | | — | | |
Year Ended 10/31/16 | | $ | 22.46 | | | | 0.20 | | | | (1.11 | ) | | | (0.91 | ) | | | (0.07 | ) | | | — | | |
Class C | |
Six Months Ended
4/30/21 (unaudited) | | $ | 22.72 | | | | (0.13 | ) | | | 6.77 | | | | 6.64 | | | | — | | | | (1.00 | ) | |
Year Ended 10/31/20 | | $ | 22.54 | | | | (0.16 | ) | | | 1.13 | | | | 0.97 | | | | — | | | | (0.79 | ) | |
Year Ended 10/31/19 | | $ | 23.34 | | | | (0.09 | ) | | | 1.94 | | | | 1.85 | | | | — | | | | (2.65 | ) | |
Year Ended 10/31/18 | | $ | 23.66 | | | | (0.18 | ) | | | (0.14 | ) | | | (0.32 | ) | | | — | | | | — | | |
Year Ended 10/31/17 | | $ | 19.34 | | | | (0.08 | ) | | | 4.45 | | | | 4.37 | | | | (0.05 | ) | | | — | | |
Year Ended 10/31/16 | | $ | 20.34 | | | | 0.01 | | | | (1.01 | ) | | | (1.00 | ) | | | — | | | | — | | |
Class I | |
Six Months Ended
4/30/21 (unaudited) | | $ | 26.59 | | | | — | (e) | | | 7.98 | | | | 7.98 | | | | (0.05 | ) | | | (1.00 | ) | |
Year Ended 10/31/20 | | $ | 26.13 | | | | 0.08 | | | | 1.31 | | | | 1.39 | | | | (0.14 | ) | | | (0.79 | ) | |
Year Ended 10/31/19 | | $ | 26.39 | | | | 0.14 | | | | 2.30 | | | | 2.44 | | | | (0.05 | ) | | | (2.65 | ) | |
Year Ended 10/31/18 | | $ | 26.62 | | | | 0.09 | | | | (0.15 | ) | | | (0.06 | ) | | | (0.17 | ) | | | — | | |
Year Ended 10/31/17 | | $ | 21.76 | | | | 0.13 | | | | 5.01 | | | | 5.14 | | | | (0.28 | ) | | | — | | |
Year Ended 10/31/16 | | $ | 22.78 | | | | 0.23 | | | | (1.12 | ) | | | (0.89 | ) | | | (0.13 | ) | | | — | | |
Class R | |
Six Months Ended
4/30/21 (unaudited) | | $ | 24.93 | | | | (0.07 | ) | | | 7.46 | | | | 7.39 | | | | — | | | | (1.00 | ) | |
Year Ended 10/31/20 | | $ | 24.55 | | | | (0.04 | ) | | | 1.23 | | | | 1.19 | | | | (0.02 | ) | | | (0.79 | ) | |
Year Ended 10/31/19 | | $ | 25.02 | | | | 0.03 | | | | 2.15 | | | | 2.18 | | | | — | | | | (2.65 | ) | |
Year Ended 10/31/18 | | $ | 25.24 | | | | (0.03 | ) | | | (0.15 | ) | | | (0.18 | ) | | | (0.04 | ) | | | — | | |
Year Ended 10/31/17 | | $ | 20.63 | | | | 0.05 | | | | 4.75 | | | | 4.80 | | | | (0.19 | ) | | | — | | |
Year Ended 10/31/16 | | $ | 21.57 | | | | 0.14 | | | | (1.07 | ) | | | (0.93 | ) | | | (0.01 | ) | | | — | | |
(a) Per share net investment income (loss) has been calculated using the average daily shares method.
(b) Not annualized for periods less than one year.
(c) Annualized for periods less than one year.
(d) Portfolio turnover is calculated on the basis of the Fund as a whole without distinguishing between the classes of shares issued.
(e) Amount is less than $0.005 per share.
(f) During the year, additional fees were voluntarily waived or reimbursed. Had these fees not been waived or reimbursed, the net expense ratio for each class would have been 0.10% higher.
See notes to financial statements.
42
Victory Portfolios | | Financial Highlights — continued | |
For a Share Outstanding Throughout Each Period
| | | | | Ratios to Average Net Assets | | Supplemental Data | |
| | | Total
Distributions | | Net Asset
Value,
End of
Period | | Total
Return
(Excludes
Sales
Charge)(b) | | Net
Expenses(c) | | Net
Investment
Income
(Loss)(c) | | Gross
Expenses(c) | | Net Assets,
End of
Period
(000's) | | Portfolio
Turnover(b)(d) | |
Victory Special Value Fund | |
Class A | |
Six Months Ended
4/30/21 (unaudited) | | | (1.00 | ) | | $ | 33.07 | | | | 30.51 | % | | | 1.23 | %(f) | | | (0.17 | )% | | | 1.33 | % | | $ | 28,087 | | | | 40 | % | |
Year Ended 10/31/20 | | | (0.88 | ) | | $ | 26.23 | | | | 5.15 | % | | | 1.23 | %(f) | | | 0.14 | % | | | 1.33 | % | | $ | 24,302 | | | | 102 | % | |
Year Ended 10/31/19 | | | (2.68 | ) | | $ | 25.78 | | | | 11.32 | % | | | 1.21 | % | | | 0.41 | % | | | 1.31 | % | | $ | 27,818 | | | | 126 | % | |
Year Ended 10/31/18 | | | (0.11 | ) | | $ | 26.10 | | | | (0.42 | )% | | | 1.17 | % | | | 0.19 | % | | | 1.27 | % | | $ | 32,565 | | | | 113 | % | |
Year Ended 10/31/17 | | | (0.25 | ) | | $ | 26.31 | | | | 23.84 | % | | | 1.17 | % | | | 0.53 | % | | | 1.27 | % | | $ | 35,223 | | | | 135 | % | |
Year Ended 10/31/16 | | | (0.07 | ) | | $ | 21.48 | | | | (4.06 | )% | | | 1.20 | % | | | 0.93 | % | | | 1.30 | % | | $ | 36,971 | | | | 76 | % | |
Class C | |
Six Months Ended
4/30/21 (unaudited) | | | (1.00 | ) | | $ | 28.36 | | | | 29.92 | % | | | 2.10 | %(f) | | | (1.02 | )% | | | 3.50 | % | | $ | 875 | | | | 40 | % | |
Year Ended 10/31/20 | | | (0.79 | ) | | $ | 22.72 | | | | 4.26 | % | | | 2.10 | %(f) | | | (0.72 | )% | | | 2.99 | % | | $ | 863 | | | | 102 | % | |
Year Ended 10/31/19 | | | (2.65 | ) | | $ | 22.54 | | | | 10.34 | % | | | 2.10 | % | | | (0.44 | )% | | | 2.79 | % | | $ | 1,241 | | | | 126 | % | |
Year Ended 10/31/18 | | | — | | | $ | 23.34 | | | | (1.35 | )% | | | 2.10 | % | | | (0.75 | )% | | | 2.27 | % | | $ | 2,145 | | | | 113 | % | |
Year Ended 10/31/17 | | | (0.05 | ) | | $ | 23.66 | | | | 22.65 | % | | | 2.10 | % | | | (0.38 | )% | | | 2.21 | % | | $ | 7,296 | | | | 135 | % | |
Year Ended 10/31/16 | | | — | | | $ | 19.34 | | | | (4.92 | )% | | | 2.09 | % | | | 0.04 | % | | | 2.19 | % | | $ | 7,955 | | | | 76 | % | |
Class I | |
Six Months Ended
4/30/21 (unaudited) | | | (1.05 | ) | | $ | 33.52 | | | | 30.59 | % | | | 1.05 | %(f) | | | 0.01 | % | | | 1.32 | % | | $ | 3,859 | | | | 40 | % | |
Year Ended 10/31/20 | | | (0.93 | ) | | $ | 26.59 | | | | 5.35 | % | | | 1.05 | %(f) | | | 0.32 | % | | | 1.31 | % | | $ | 3,283 | | | | 102 | % | |
Year Ended 10/31/19 | | | (2.70 | ) | | $ | 26.13 | | | | 11.52 | % | | | 1.05 | % | | | 0.58 | % | | | 1.34 | % | | $ | 3,274 | | | | 126 | % | |
Year Ended 10/31/18 | | | (0.17 | ) | | $ | 26.39 | | | | (0.28 | )% | | | 1.02 | % | | | 0.31 | % | | | 1.16 | % | | $ | 3,678 | | | | 113 | % | |
Year Ended 10/31/17 | | | (0.28 | ) | | $ | 26.62 | | | | 23.86 | % | | | 1.15 | % | | | 0.56 | % | | | 1.25 | % | | $ | 3,703 | | | | 135 | % | |
Year Ended 10/31/16 | | | (0.13 | ) | | $ | 21.76 | | | | (3.93 | )% | | | 1.05 | % | | | 1.07 | % | | | 1.15 | % | | $ | 4,016 | | | | 76 | % | |
Class R | |
Six Months Ended
4/30/21 (unaudited) | | | (1.00 | ) | | $ | 31.32 | | | | 30.28 | % | | | 1.55 | %(f) | | | (0.49 | )% | | | 1.65 | % | | $ | 15,843 | | | | 40 | % | |
Year Ended 10/31/20 | | | (0.81 | ) | | $ | 24.93 | | | | 4.82 | % | | | 1.54 | %(f) | | | (0.16 | )% | | | 1.64 | % | | $ | 13,875 | | | | 102 | % | |
Year Ended 10/31/19 | | | (2.65 | ) | | $ | 24.55 | | | | 11.03 | % | | | 1.50 | % | | | 0.13 | % | | | 1.60 | % | | $ | 21,084 | | | | 126 | % | |
Year Ended 10/31/18 | | | (0.04 | ) | | $ | 25.02 | | | | (0.71 | )% | | | 1.46 | % | | | (0.10 | )% | | | 1.56 | % | | $ | 26,532 | | | | 113 | % | |
Year Ended 10/31/17 | | | (0.19 | ) | | $ | 25.24 | | | | 23.43 | % | | | 1.47 | % | | | 0.24 | % | | | 1.57 | % | | $ | 36,688 | | | | 135 | % | |
Year Ended 10/31/16 | | | (0.01 | ) | | $ | 20.63 | | | | (4.29 | )% | | | 1.46 | % | | | 0.67 | % | | | 1.56 | % | | $ | 34,784 | | | | 76 | % | |
(continues on next page)
See notes to financial statements.
43
Victory Portfolios | | Financial Highlights | |
For a Share Outstanding Throughout Each Period
| | | | Investment Activities | | Distributions to
Shareholders From | |
| | | Net Asset
Value,
Beginning of
Period | | Net
Investment
Income
(Loss)(a) | | Net Realized
and Unrealized
Gains (Losses)
on Investments | | Total from
Investment
Activities | | Net
Investment
Income | | Net Realized
Gains from
Investments | |
Victory Special Value Fund | |
Class Y | |
Six Months Ended
4/30/21 (unaudited) | | $ | 26.44 | | | | 0.01 | | | | 7.91 | | | | 7.92 | | | | (0.06 | ) | | | (1.00 | ) | |
Year Ended 10/31/20 | | $ | 25.98 | | | | 0.09 | | | | 1.32 | | | | 1.41 | | | | (0.16 | ) | | | (0.79 | ) | |
Year Ended 10/31/19 | | $ | 26.25 | | | | 0.15 | | | | 2.28 | | | | 2.43 | | | | (0.05 | ) | | | (2.65 | ) | |
Year Ended 10/31/18 | | $ | 26.47 | | | | 0.12 | | | | (0.17 | ) | | | (0.05 | ) | | | (0.17 | ) | | | — | | |
Year Ended 10/31/17 | | $ | 21.62 | | | | 0.18 | | | | 4.98 | | | | 5.16 | | | | (0.31 | ) | | | — | | |
Year Ended 10/31/16 | | $ | 22.62 | | | | 0.26 | | | | (1.12 | ) | | | (0.86 | ) | | | (0.14 | ) | | | — | | |
(a) Per share net investment income (loss) has been calculated using the average daily shares method.
(b) Not annualized for periods less than one year.
(c) Annualized for periods less than one year.
(d) Portfolio turnover is calculated on the basis of the Fund as a whole without distinguishing between the classes of shares issued.
(e) During the year, additional fees were voluntarily waived or reimbursed. Had these fees not been waived or reimbursed, the net expense ratio for each class would have been 0.10% higher.
See notes to financial statements.
44
Victory Portfolios | | Financial Highlights — continued | |
For a Share Outstanding Throughout Each Period (continued)
| | | | | Ratios to Average Net Assets | | Supplemental Data | |
| | | Total
Distributions | | Net Asset
Value,
End of
Period | | Total
Return(b) | | Net
Expenses(c) | | Net
Investment
Income
(Loss)(c) | | Gross
Expenses(c) | | Net Assets,
End of
Period
(000's) | | Portfolio
Turnover(b)(d) | |
Victory Special Value Fund | |
Class Y | |
Six Months Ended
4/30/21 (unaudited) | | | (1.06 | ) | | $ | 33.30 | | | | 30.62 | % | | | 1.00 | % | | | 0.06 | % | | | 2.62 | % | | $ | 695 | | | | 40 | % | |
Year Ended 10/31/20 | | | (0.95 | ) | | $ | 26.44 | | | | 5.40 | % | | | 1.00 | %(e) | | | 0.36 | % | | | 3.68 | % | | $ | 584 | | | | 102 | % | |
Year Ended 10/31/19 | | | (2.70 | ) | | $ | 25.98 | | | | 11.57 | % | | | 1.00 | % | | | 0.60 | % | | | 4.50 | % | | $ | 520 | | | | 126 | % | |
Year Ended 10/31/18 | | | (0.17 | ) | | $ | 26.25 | | | | (0.21 | )% | | | 0.97 | % | | | 0.42 | % | | | 2.82 | % | | $ | 436 | | | | 113 | % | |
Year Ended 10/31/17 | | | (0.31 | ) | | $ | 26.47 | | | | 24.12 | % | | | 0.93 | % | | | 0.77 | % | | | 2.07 | % | | $ | 1,219 | | | | 135 | % | |
Year Ended 10/31/16 | | | (0.14 | ) | | $ | 21.62 | | | | (3.80 | )% | | | 0.93 | % | | | 1.20 | % | | | 1.75 | % | | $ | 1,170 | | | | 76 | % | |
See notes to financial statements.
45
Victory Portfolios | | Financial Highlights | |
For a Share Outstanding Throughout Each Period
| | | | Investment Activities | | Distributions to
Shareholders From | |
| | | Net Asset
Value,
Beginning of
Period | | Net
Investment
Income
(Loss)(a) | | Net Realized
and Unrealized
Gains (Losses)
on Investments | | Total from
Investment
Activities | | Net
Investment
Income | | Net Realized
Gains from
Investments | |
Victory Strategic Allocation Fund | |
Class A | |
Six Months Ended
4/30/21 (unaudited) | | $ | 16.48 | | | | 0.59 | | | | 2.78 | | | | 3.37 | | | | (0.14 | ) | | | — | | |
Year Ended 10/31/20 | | $ | 16.47 | | | | 0.23 | | | | 0.41 | | | | 0.64 | | | | (0.23 | ) | | | (0.40 | ) | |
Year Ended 10/31/19 | | $ | 15.44 | | | | 0.43 | | | | 1.12 | | | | 1.55 | | | | (0.39 | ) | | | (0.13 | ) | |
Year Ended 10/31/18 | | $ | 16.41 | | | | 0.29 | | | | (0.68 | ) | | | (0.39 | ) | | | (0.39 | ) | | | (0.19 | ) | |
Year Ended 10/31/17 | | $ | 14.80 | | | | 0.50 | | | | 1.51 | | | | 2.01 | | | | (0.40 | ) | | | — | | |
Year Ended 10/31/16 | | $ | 15.10 | | | | 0.15 | | | | (0.28 | ) | | | (0.13 | ) | | | (0.17 | ) | | | — | | |
Class C | |
Six Months Ended
4/30/21 (unaudited) | | $ | 16.19 | | | | 0.52 | | | | 2.72 | | | | 3.24 | | | | (0.08 | ) | | | — | | |
Year Ended 10/31/20 | | $ | 16.18 | | | | 0.13 | | | | 0.39 | | | | 0.52 | | | | (0.11 | ) | | | (0.40 | ) | |
Year Ended 10/31/19 | | $ | 15.19 | | | | 0.30 | | | | 1.10 | | | | 1.40 | | | | (0.28 | ) | | | (0.13 | ) | |
Year Ended 10/31/18 | | $ | 16.19 | | | | 0.21 | | | | (0.71 | ) | | | (0.50 | ) | | | (0.31 | ) | | | (0.19 | ) | |
Year Ended 10/31/17 | | $ | 14.65 | | | | 0.43 | | | | 1.44 | | | | 1.87 | | | | (0.33 | ) | | | — | | |
Year Ended 10/31/16 | | $ | 14.97 | | | | 0.06 | | | | (0.29 | ) | | | (0.23 | ) | | | (0.09 | ) | | | — | | |
Class I | |
Six Months Ended
4/30/21 (unaudited) | | $ | 16.57 | | | | 0.64 | | | | 2.78 | | | | 3.42 | | | | (0.16 | ) | | | — | | |
Year Ended 10/31/20 | | $ | 16.56 | | | | 0.27 | | | | 0.41 | | | | 0.68 | | | | (0.27 | ) | | | (0.40 | ) | |
Year Ended 10/31/19 | | $ | 15.52 | | | | 0.46 | | | | 1.13 | | | | 1.59 | | | | (0.42 | ) | | | (0.13 | ) | |
Year Ended 10/31/18 | | $ | 16.48 | | | | 0.35 | | | | (0.70 | ) | | | (0.35 | ) | | | (0.42 | ) | | | (0.19 | ) | |
Year Ended 10/31/17 | | $ | 14.86 | | | | 0.55 | | | | 1.50 | | | | 2.05 | | | | (0.43 | ) | | | — | | |
Year Ended 10/31/16 | | $ | 15.16 | | | | 0.15 | | | | (0.24 | ) | | | (0.09 | ) | | | (0.21 | ) | | | — | | |
Class R | |
Six Months Ended
4/30/21 (unaudited) | | $ | 16.44 | | | | 0.55 | | | | 2.79 | | | | 3.34 | | | | (0.12 | ) | | | — | | |
Year Ended 10/31/20 | | $ | 16.43 | | | | 0.19 | | | | 0.42 | | | | 0.61 | | | | (0.20 | ) | | | (0.40 | ) | |
Year Ended 10/31/19 | | $ | 15.41 | | | | 0.36 | | | | 1.14 | | | | 1.50 | | | | (0.35 | ) | | | (0.13 | ) | |
Year Ended 10/31/18 | | $ | 16.38 | | | | 0.27 | | | | (0.70 | ) | | | (0.43 | ) | | | (0.35 | ) | | | (0.19 | ) | |
Year Ended 10/31/17 | | $ | 14.79 | | | | 0.46 | | | | 1.49 | | | | 1.95 | | | | (0.36 | ) | | | — | | |
Year Ended 10/31/16 | | $ | 15.09 | | | | 0.09 | | | | (0.26 | ) | | | (0.17 | ) | | | (0.13 | ) | | | — | | |
(a) Per share net investment income (loss) has been calculated using the average daily shares method.
(b) Not annualized for periods less than one year.
(c) Annualized for periods less than one year.
(d) The expense ratios exclude the impact of expenses paid by each underlying fund.
(e) Portfolio turnover is calculated on the basis of the Fund as a whole without distinguishing between the classes of shares issued.
(f) The amount includes a change in accounting estimate. Without this change in accounting estimate, the gross expense ratio would have been 0.67%, 1.54%, 0.42%, and 1.43% for Class A, C, I and R, respectively.
(g) Effective with the December 30, 2015 strategy change, the Adviser began reimbursing expenses inclusive of acquired fund fee and expenses.
(h) Portfolio turnover increased due to a change in investment strategy.
See notes to financial statements.
46
Victory Portfolios | | Financial Highlights — continued | |
For a Share Outstanding Throughout Each Period
| | | | | Ratios to Average Net Assets | | Supplemental Data | |
| | | Total
Distributions | | Net Asset
Value,
End of
Period | | Total
Return
(Excludes
Sales
Charge)(b) | | Net
Expenses(c)(d) | | Net
Investment
Income
(Loss)(c) | | Gross
Expenses(c)(d) | | Net Assets,
End of
Period
(000's) | | Portfolio
Turnover(b)(e) | |
Victory Strategic Allocation Fund | |
Class A | |
Six Months Ended
4/30/21 (unaudited) | | | (0.14 | ) | | $ | 19.71 | | | | 20.50 | % | | | 0.40 | % | | | 6.36 | % | | | 0.79 | % | | $ | 16,741 | | | | 5 | % | |
Year Ended 10/31/20 | | | (0.63 | ) | | $ | 16.48 | | | | 3.99 | % | | | 0.40 | % | | | 1.45 | % | | | 0.81 | % | | $ | 14,364 | | | | 13 | % | |
Year Ended 10/31/19 | | | (0.52 | ) | | $ | 16.47 | | | | 10.37 | % | | | 0.40 | % | | | 2.69 | % | | | 0.77 | % | | $ | 15,365 | | | | 5 | % | |
Year Ended 10/31/18 | | | (0.58 | ) | | $ | 15.44 | | | | (2.56 | )% | | | 0.40 | % | | | 1.77 | % | | | 0.28 | %(f) | | $ | 18,747 | | | | 40 | % | |
Year Ended 10/31/17 | | | (0.40 | ) | | $ | 16.41 | | | | 13.72 | % | | | 0.30 | % | | | 3.19 | % | | | 0.79 | % | | $ | 14,820 | | | | 51 | % | |
Year Ended 10/31/16 | | | (0.17 | ) | | $ | 14.80 | | | | (0.87 | )% | | | 0.31 | %(g) | | | 0.99 | % | | | 1.69 | % | | $ | 16,587 | | | | 192 | %(h) | |
Class C | |
Six Months Ended
4/30/21 (unaudited) | | | (0.08 | ) | | $ | 19.35 | | | | 20.06 | % | | | 1.15 | % | | | 5.70 | % | | | 2.01 | % | | $ | 2,329 | | | | 5 | % | |
Year Ended 10/31/20 | | | (0.51 | ) | | $ | 16.19 | | | | 3.23 | % | | | 1.15 | % | | | 0.82 | % | | | 1.90 | % | | $ | 2,009 | | | | 13 | % | |
Year Ended 10/31/19 | | | (0.41 | ) | | $ | 16.18 | | | | 9.53 | % | | | 1.15 | % | | | 1.94 | % | | | 1.72 | % | | $ | 3,193 | | | | 5 | % | |
Year Ended 10/31/18 | | | (0.50 | ) | | $ | 15.19 | | | | (3.26 | )% | | | 1.15 | % | | | 1.30 | % | | | 1.08 | %(f) | | $ | 4,445 | | | | 40 | % | |
Year Ended 10/31/17 | | | (0.33 | ) | | $ | 16.19 | | | | 12.88 | % | | | 1.03 | % | | | 2.78 | % | | | 1.58 | % | | $ | 8,814 | | | | 51 | % | |
Year Ended 10/31/16 | | | (0.09 | ) | | $ | 14.65 | | | | (1.56 | )% | | | 0.95 | %(g) | | | 0.44 | % | | | 2.65 | % | | $ | 9,724 | | | | 192 | %(h) | |
Class I | |
Six Months Ended
4/30/21 (unaudited) | | | (0.16 | ) | | $ | 19.83 | | | | 20.71 | % | | | 0.15 | % | | | 6.91 | % | | | 0.56 | % | | $ | 8,809 | | | | 5 | % | |
Year Ended 10/31/20 | | | (0.67 | ) | | $ | 16.57 | | | | 4.22 | % | | | 0.15 | % | | | 1.66 | % | | | 0.59 | % | | $ | 7,006 | | | | 13 | % | |
Year Ended 10/31/19 | | | (0.55 | ) | | $ | 16.56 | | | | 10.63 | % | | | 0.15 | % | | | 2.90 | % | | | 0.59 | % | | $ | 5,743 | | | | 5 | % | |
Year Ended 10/31/18 | | | (0.61 | ) | | $ | 15.52 | | | | (2.29 | )% | | | 0.15 | % | | | 2.11 | % | | | 0.01 | %(f) | | $ | 8,811 | | | | 40 | % | |
Year Ended 10/31/17 | | | (0.43 | ) | | $ | 16.48 | | | | 13.95 | % | | | 0.10 | % | | | 3.48 | % | | | 0.61 | % | | $ | 9,153 | | | | 51 | % | |
Year Ended 10/31/16 | | | (0.21 | ) | | $ | 14.86 | | | | (0.61 | )% | | | 0.24 | %(g) | | | 1.04 | % | | | 2.64 | % | | $ | 1,099 | | | | 192 | %(h) | |
Class R | |
Six Months Ended
4/30/21 (unaudited) | | | (0.12 | ) | | $ | 19.66 | | | | 20.35 | % | | | 0.65 | % | | | 6.03 | % | | | 1.78 | % | | $ | 1,353 | | | | 5 | % | |
Year Ended 10/31/20 | | | (0.60 | ) | | $ | 16.44 | | | | 3.74 | % | | | 0.65 | % | | | 1.18 | % | | | 1.76 | % | | $ | 1,259 | | | | 13 | % | |
Year Ended 10/31/19 | | | (0.48 | ) | | $ | 16.43 | | | | 10.08 | % | | | 0.65 | % | | | 2.30 | % | | | 1.87 | % | | $ | 1,308 | | | | 5 | % | |
Year Ended 10/31/18 | | | (0.54 | ) | | $ | 15.41 | | | | (2.77 | )% | | | 0.65 | % | | | 1.63 | % | | | 1.01 | %(f) | | $ | 1,529 | | | | 40 | % | |
Year Ended 10/31/17 | | | (0.36 | ) | | $ | 16.38 | | | | 13.36 | % | | | 0.56 | % | | | 2.96 | % | | | 1.80 | % | | $ | 1,892 | | | | 51 | % | |
Year Ended 10/31/16 | | | (0.13 | ) | | $ | 14.79 | | | | (1.14 | )% | | | 0.62 | %(g) | | | 0.58 | % | | | 2.13 | % | | $ | 1,702 | | | | 192 | %(h) | |
See notes to financial statements.
47
Victory Portfolios | | Financial Highlights | |
For a Share Outstanding Throughout Each Period
| | | | Investment Activities | | Distributions to
Shareholders From | |
| | | Net Asset
Value,
Beginning of
Period | | Net
Investment
Income
(Loss)(a) | | Net Realized
and Unrealized
Gains (Losses)
on Investments | | Total from
Investment
Activities | | Net
Investment
Income | | Total
Distributions | |
Victory INCORE Fund for Income | |
Class A | |
Six Months Ended
4/30/21 (unaudited) | | $ | 8.40 | | | | 0.01 | | | | (0.04 | ) | | | (0.03 | ) | | | (0.20 | ) | | | (0.20 | ) | |
Year Ended 10/31/20 | | $ | 8.56 | | | | 0.06 | | | | 0.17 | | | | 0.23 | | | | (0.39 | ) | | | (0.39 | ) | |
Year Ended 10/31/19 | | $ | 8.56 | | | | 0.18 | | | | 0.28 | | | | 0.46 | | | | (0.46 | ) | | | (0.46 | ) | |
Year Ended 10/31/18 | | $ | 9.09 | | | | 0.15 | (e) | | | (0.23 | )(e) | | | (0.08 | ) | | | (0.45 | ) | | | (0.45 | ) | |
Year Ended 10/31/17 | | $ | 9.63 | | | | 0.10 | | | | (0.15 | ) | | | (0.05 | ) | | | (0.49 | ) | | | (0.49 | ) | |
Year Ended 10/31/16 | | $ | 9.96 | | | | 0.11 | | | | 0.05 | | | | 0.16 | | | | (0.49 | ) | | | (0.49 | ) | |
Class C | |
Six Months Ended
4/30/21 (unaudited) | | $ | 8.31 | | | | (0.03 | ) | | | (0.02 | ) | | | (0.05 | ) | | | (0.17 | ) | | | (0.17 | ) | |
Year Ended 10/31/20 | | $ | 8.48 | | | | — | (f) | | | 0.16 | | | | 0.16 | | | | (0.33 | ) | | | (0.33 | ) | |
Year Ended 10/31/19 | | $ | 8.48 | | | | 0.13 | | | | 0.26 | | | | 0.39 | | | | (0.39 | ) | | | (0.39 | ) | |
Year Ended 10/31/18 | | $ | 9.01 | | | | 0.08 | (e) | | | (0.23 | )(e) | | | (0.15 | ) | | | (0.38 | ) | | | (0.38 | ) | |
Year Ended 10/31/17 | | $ | 9.56 | | | | 0.03 | | | | (0.16 | ) | | | (0.13 | ) | | | (0.42 | ) | | | (0.42 | ) | |
Year Ended 10/31/16 | | $ | 9.89 | | | | 0.03 | | | | 0.06 | | | | 0.09 | | | | (0.42 | ) | | | (0.42 | ) | |
Class I | |
Six Months Ended
4/30/21 (unaudited) | | $ | 8.39 | | | | 0.02 | | | | (0.03 | ) | | | (0.01 | ) | | | (0.21 | ) | | | (0.21 | ) | |
Year Ended 10/31/20 | | $ | 8.55 | | | | 0.08 | | | | 0.17 | | | | 0.25 | | | | (0.41 | ) | | | (0.41 | ) | |
Year Ended 10/31/19 | | $ | 8.55 | | | | 0.16 | | | | 0.32 | | | | 0.48 | | | | (0.48 | ) | | | (0.48 | ) | |
Year Ended 10/31/18 | | $ | 9.08 | | | | 0.15 | (e) | | | (0.21 | )(e) | | | (0.06 | ) | | | (0.47 | ) | | | (0.47 | ) | |
Year Ended 10/31/17 | | $ | 9.63 | | | | 0.13 | | | | (0.16 | ) | | | (0.03 | ) | | | (0.52 | ) | | | (0.52 | ) | |
Year Ended 10/31/16 | | $ | 9.96 | | | | 0.13 | | | | 0.06 | | | | 0.19 | | | | (0.52 | ) | | | (0.52 | ) | |
Class R | |
Six Months Ended
4/30/21 (unaudited) | | $ | 8.40 | | | | 0.01 | | | | (0.03 | ) | | | (0.02 | ) | | | (0.20 | ) | | | (0.20 | ) | |
Year Ended 10/31/20 | | $ | 8.56 | | | | 0.06 | | | | 0.17 | | | | 0.23 | | | | (0.39 | ) | | | (0.39 | ) | |
Year Ended 10/31/19 | | $ | 8.57 | | | | 0.18 | | | | 0.27 | | | | 0.45 | | | | (0.46 | ) | | | (0.46 | ) | |
Year Ended 10/31/18 | | $ | 9.09 | | | | 0.15 | (e) | | | (0.22 | )(e) | | | (0.07 | ) | | | (0.45 | ) | | | (0.45 | ) | |
Year Ended 10/31/17 | | $ | 9.64 | | | | 0.10 | | | | (0.16 | ) | | | (0.06 | ) | | | (0.49 | ) | | | (0.49 | ) | |
Year Ended 10/31/16 | | $ | 9.97 | | | | 0.11 | | | | 0.05 | | | | 0.16 | | | | (0.49 | ) | | | (0.49 | ) | |
(a) Per share net investment income (loss) has been calculated using the average daily shares method.
(b) Not annualized for periods less than one year.
(c) Annualized for periods less than one year.
(d) Portfolio turnover is calculated on the basis of the Fund as a whole without distinguishing between the classes of shares issued.
(e) The Fund restated certain elements of its 2018 financial statements resulting from the identification of a GAAP reclassification error for the Fund's paydown gain (loss) transactions. However, this reclassification had no impact on the Fund's net assets, NAV, performance, or taxable distributions paid and reported to shareholders for the fiscal and tax years ended 2018.
(f) Amount is less than $0.005 per share.
See notes to financial statements.
48
Victory Portfolios | | Financial Highlights — continued | |
For a Share Outstanding Throughout Each Period
| | | | | Ratios to Average Net Assets | | Supplemental Data | |
| | | Net Asset
Value,
End of
Period | | Total
Return
(Excludes
Sales
Charge)(b) | | Net
Expenses(c) | | Net
Investment
Income
(Loss)(c) | | Gross
Expenses(c) | | Net Assets,
End of
Period
(000's) | | Portfolio
Turnover(b)(d) | |
Victory INCORE Fund for Income | |
Class A | |
Six Months Ended
4/30/21 (unaudited) | | $ | 8.17 | | | | (0.40 | )% | | | 0.91 | % | | | 0.20 | % | | | 0.91 | % | | $ | 141,270 | | | | 24 | % | |
Year Ended 10/31/20 | | $ | 8.40 | | | | 2.75 | % | | | 0.91 | % | | | 0.75 | % | | | 0.92 | % | | $ | 151,236 | | | | 55 | % | |
Year Ended 10/31/19 | | $ | 8.56 | | | | 5.50 | % | | | 0.92 | % | | | 2.12 | % | | | 0.94 | % | | $ | 136,570 | | | | 29 | % | |
Year Ended 10/31/18 | | $ | 8.56 | | | | (0.91 | )% | | | 0.92 | % | | | 1.64 | %(e) | | | 0.93 | % | | $ | 153,574 | | | | 27 | % | |
Year Ended 10/31/17 | | $ | 9.09 | | | | (0.51 | )% | | | 0.88 | % | | | 1.08 | % | | | 0.88 | % | | $ | 224,822 | | | | 30 | % | |
Year Ended 10/31/16 | | $ | 9.63 | | | | 1.62 | % | | | 0.91 | % | | | 1.10 | % | | | 0.91 | % | | $ | 400,740 | | | | 31 | % | |
Class C | |
Six Months Ended
4/30/21 (unaudited) | | $ | 8.09 | | | | (0.65 | )% | | | 1.71 | % | | | (0.64 | )% | | | 1.78 | % | | $ | 12,209 | | | | 24 | % | |
Year Ended 10/31/20 | | $ | 8.31 | | | | 1.85 | % | | | 1.71 | % | | | (0.01 | )% | | | 1.74 | % | | $ | 20,801 | | | | 55 | % | |
Year Ended 10/31/19 | | $ | 8.48 | | | | 4.72 | % | | | 1.72 | % | | | 1.53 | % | | | 1.73 | % | | $ | 22,541 | | | | 29 | % | |
Year Ended 10/31/18 | | $ | 8.48 | | | | (1.69 | )% | | | 1.70 | % | | | 0.94 | %(e) | | | 1.71 | % | | $ | 31,976 | | | | 27 | % | |
Year Ended 10/31/17 | | $ | 9.01 | | | | (1.41 | )% | | | 1.67 | % | | | 0.29 | % | | | 1.67 | % | | $ | 50,316 | | | | 30 | % | |
Year Ended 10/31/16 | | $ | 9.56 | | | | 0.88 | % | | | 1.69 | % | | | 0.32 | % | | | 1.69 | % | | $ | 72,958 | | | | 31 | % | |
Class I | |
Six Months Ended
4/30/21 (unaudited) | | $ | 8.17 | | | | (0.15 | )% | | | 0.64 | % | | | 0.45 | % | | | 0.66 | % | | $ | 429,376 | | | | 24 | % | |
Year Ended 10/31/20 | | $ | 8.39 | | | | 3.01 | % | | | 0.64 | % | | | 0.95 | % | | | 0.66 | % | | $ | 590,749 | | | | 55 | % | |
Year Ended 10/31/19 | | $ | 8.55 | | | | 5.79 | % | | | 0.64 | % | | | 1.84 | % | | | 0.65 | % | | $ | 447,735 | | | | 29 | % | |
Year Ended 10/31/18 | | $ | 8.55 | | | | (0.64 | )% | | | 0.63 | % | | | 1.69 | %(e) | | | 0.63 | % | | $ | 331,338 | | | | 27 | % | |
Year Ended 10/31/17 | | $ | 9.08 | | | | (0.34 | )% | | | 0.61 | % | | | 1.34 | % | | | 0.61 | % | | $ | 520,056 | | | | 30 | % | |
Year Ended 10/31/16 | | $ | 9.63 | | | | 1.90 | % | | | 0.63 | % | | | 1.37 | % | | | 0.63 | % | | $ | 547,322 | | | | 31 | % | |
Class R | |
Six Months Ended
4/30/21 (unaudited) | | $ | 8.18 | | | | (0.40 | )% | | | 0.91 | % | | | 0.19 | % | | | 0.92 | % | | $ | 37,950 | | | | 24 | % | |
Year Ended 10/31/20 | | $ | 8.40 | | | | 2.74 | % | | | 0.91 | % | | | 0.76 | % | | | 0.92 | % | | $ | 43,684 | | | | 55 | % | |
Year Ended 10/31/19 | | $ | 8.56 | | | | 5.37 | % | | | 0.92 | % | | | 2.04 | % | | | 0.94 | % | | $ | 38,596 | | | | 29 | % | |
Year Ended 10/31/18 | | $ | 8.57 | | | | (0.79 | )% | | | 0.91 | % | | | 1.67 | %(e) | | | 0.91 | % | | $ | 43,405 | | | | 27 | % | |
Year Ended 10/31/17 | | $ | 9.09 | | | | (0.62 | )% | | | 0.88 | % | | | 1.08 | % | | | 0.88 | % | | $ | 58,783 | | | | 30 | % | |
Year Ended 10/31/16 | | $ | 9.64 | | | | 1.62 | % | | | 0.90 | % | | | 1.11 | % | | | 0.90 | % | | $ | 85,195 | | | | 31 | % | |
(continues on next page)
See notes to financial statements.
49
Victory Portfolios | | Financial Highlights | |
For a Share Outstanding Throughout Each Period
| | | | | Investment Activities | | Distributions to
Shareholders From | |
| | | Net Asset
Value,
Beginning of
Period | | Net
Investment
Income
(Loss)(a) | | Net Realized
and Unrealized
Gains (Losses)
on Investments | | Total from
Investment
Activities | | Net
Investment
Income | | Total
Distributions | |
Victory INCORE Fund for Income | |
Class R6 | |
Six Months Ended
4/30/21 (unaudited) | | $ | 8.38 | | | | 0.02 | | | | (0.03 | ) | | | (0.01 | ) | | | (0.21 | ) | | | (0.21 | ) | |
Year Ended 10/31/20 | | $ | 8.54 | | | | 0.08 | | | | 0.18 | | | | 0.26 | | | | (0.42 | ) | | | (0.42 | ) | |
Year Ended 10/31/19 | | $ | 8.55 | | | | 0.17 | | | | 0.30 | | | | 0.47 | | | | (0.48 | ) | | | (0.48 | ) | |
Year Ended 10/31/18 | | $ | 9.07 | | | | 0.13 | (e) | | | (0.18 | )(e) | | | (0.05 | ) | | | (0.47 | ) | | | (0.47 | ) | |
Year Ended 10/31/17 | | $ | 9.62 | | | | 0.12 | | | | (0.16 | ) | | | (0.04 | ) | | | (0.51 | ) | | | (0.51 | ) | |
Year Ended 10/31/16 | | $ | 9.95 | | | | 0.13 | | | | 0.06 | | | | 0.19 | | | | (0.52 | ) | | | (0.52 | ) | |
Class Y | |
Six Months Ended
4/30/21 (unaudited) | | $ | 8.40 | | | | 0.02 | | | | (0.04 | ) | | | (0.02 | ) | | | (0.21 | ) | | | (0.21 | ) | |
Year Ended 10/31/20 | | $ | 8.56 | | | | 0.06 | | | | 0.19 | | | | 0.25 | | | | (0.41 | ) | | | (0.41 | ) | |
Year Ended 10/31/19 | | $ | 8.56 | | | | 0.13 | | | | 0.35 | | | | 0.48 | | | | (0.48 | ) | | | (0.48 | ) | |
Year Ended 10/31/18 | | $ | 9.08 | | | | 0.19 | (e) | | | (0.25 | )(e) | | | (0.06 | ) | | | (0.46 | ) | | | (0.46 | ) | |
Year Ended 10/31/17 | | $ | 9.64 | | | | 0.10 | | | | (0.15 | ) | | | (0.05 | ) | | | (0.51 | ) | | | (0.51 | ) | |
Year Ended 10/31/16 | | $ | 9.96 | | | | 0.13 | | | | 0.06 | | | | 0.19 | | | | (0.51 | ) | | | (0.51 | ) | |
Member Class | |
11/3/20(f) through
4/30/21 (unaudited) | | $ | 8.41 | | | | 0.10 | | | | (0.14 | ) | | | (0.04 | ) | | | (0.17 | ) | | | (0.17 | ) | |
(a) Per share net investment income (loss) has been calculated using the average daily shares method.
(b) Not annualized for periods less than one year.
(c) Annualized for periods less than one year.
(d) Portfolio turnover is calculated on the basis of the Fund as a whole without distinguishing between the classes of shares issued.
(e) The Fund restated certain elements of its 2018 financial statements resulting from the identification of a GAAP reclassification error for the Fund's paydown gain (loss) transactions. However, this reclassification had no impact on the Fund's net assets, NAV, performance, or taxable distributions paid and reported to shareholders for the fiscal and tax years ended 2018.
(f) Commencement of operations.
See notes to financial statements.
50
Victory Portfolios | | Financial Highlights — continued | |
For a Share Outstanding Throughout Each Period (continued)
| | | | | Ratios to Average Net Assets | | Supplemental Data | |
| | | Net Asset
Value,
End of
Period | | Total
Return(b) | | Net
Expenses(c) | | Net
Investment
Income
(Loss)(c) | | Gross
Expenses(c) | | Net Assets,
End of
Period
(000's) | | Portfolio
Turnover(b)(d) | |
Victory INCORE Fund for Income | |
Class R6 | |
Six Months Ended
4/30/21 (unaudited) | | $ | 8.16 | | | | (0.26 | )% | | | 0.60 | % | | | 0.48 | % | | | 0.60 | % | | $ | 29,099 | | | | 24 | % | |
Year Ended 10/31/20 | | $ | 8.38 | | | | 3.06 | % | | | 0.63 | % | | | 0.88 | % | | | 0.64 | % | | $ | 49,009 | | | | 55 | % | |
Year Ended 10/31/19 | | $ | 8.54 | | | | 5.68 | % | | | 0.63 | % | | | 2.00 | % | | | 0.66 | % | | $ | 15,864 | | | | 29 | % | |
Year Ended 10/31/18 | | $ | 8.55 | | | | (0.52 | )% | | | 0.63 | % | | | 1.43 | %(e) | | | 0.69 | % | | $ | 13,741 | | | | 27 | % | |
Year Ended 10/31/17 | | $ | 9.07 | | | | (0.36 | )% | | | 0.63 | % | | | 1.31 | % | | | 0.73 | % | | $ | 9,407 | | | | 30 | % | |
Year Ended 10/31/16 | | $ | 9.62 | | | | 1.89 | % | | | 0.63 | % | | | 1.37 | % | | | 0.97 | % | | $ | 6,286 | | | | 31 | % | |
Class Y | |
Six Months Ended
4/30/21 (unaudited) | | $ | 8.17 | | | | (0.29 | )% | | | 0.69 | % | | | 0.40 | % | | | 0.69 | % | | $ | 144,429 | | | | 24 | % | |
Year Ended 10/31/20 | | $ | 8.40 | | | | 2.95 | % | | | 0.71 | % | | | 0.67 | % | | | 0.74 | % | | $ | 186,421 | | | | 55 | % | |
Year Ended 10/31/19 | | $ | 8.56 | | | | 5.72 | % | | | 0.71 | % | | | 1.48 | % | | | 0.79 | % | | $ | 54,950 | | | | 29 | % | |
Year Ended 10/31/18 | | $ | 8.56 | | | | (0.61 | )% | | | 0.71 | % | | | 2.14 | %(e) | | | 0.79 | % | | $ | 31,975 | | | | 27 | % | |
Year Ended 10/31/17 | | $ | 9.08 | | | | (0.53 | )% | | | 0.68 | % | | | 1.09 | % | | | 0.68 | % | | $ | 62,408 | | | | 30 | % | |
Year Ended 10/31/16 | | $ | 9.64 | | | | 1.92 | % | | | 0.71 | % | | | 1.30 | % | | | 0.89 | % | | $ | 8,119 | | | | 31 | % | |
Member Class | |
11/3/20(f) through
4/30/21 (unaudited) | | $ | 8.20 | | | | (0.42 | )% | | | 0.75 | % | | | 2.44 | % | | | 5.97 | % | | $ | 835 | | | | 24 | % | |
See notes to financial statements.
51
Victory Portfolios | | Financial Highlights | |
For a Share Outstanding Throughout Each Period
| | | | | Investment Activities | | Distributions to
Shareholders From | |
| | | Net Asset
Value,
Beginning of
Period | | Net
Investment
Income
(Loss)(a) | | Net Realized
and Unrealized
Gains (Losses)
on Investments | | Total from
Investment
Activities | | Net
Investment
Income | | Net Realized
Gains from
Investments | |
Victory INCORE Investment Grade Convertible Fund | |
Class A | |
Six Months Ended
4/30/21 (unaudited) | | $ | 17.31 | | | | 0.12 | | | | 3.12 | (e) | | | 3.24 | | | | (0.73 | ) | | | — | | |
Year Ended 10/31/20 | | $ | 17.51 | | | | 0.27 | | | | 0.47 | | | | 0.74 | | | | (0.35 | ) | | | (0.59 | ) | |
Year Ended 10/31/19 | | $ | 16.22 | | | | 0.21 | | | | 1.84 | | | | 2.05 | | | | (0.28 | ) | | | (0.48 | ) | |
Year Ended 10/31/18 | | $ | 16.53 | | | | 0.30 | | | | 0.01 | | | | 0.31 | | | | (0.53 | ) | | | (0.09 | ) | |
Year Ended 10/31/17 | | $ | 13.72 | | | | 0.17 | | | | 2.89 | | | | 3.06 | | | | (0.25 | ) | | | — | | |
Year Ended 10/31/16 | | $ | 14.00 | | | | 0.11 | | | | (0.07 | ) | | | 0.04 | | | | (0.32 | ) | | | — | | |
Class I | |
Six Months Ended
4/30/21 (unaudited) | | $ | 17.32 | | | | 0.16 | | | | 3.12 | (e) | | | 3.28 | | | | (0.78 | ) | | | — | | |
Year Ended 10/31/20 | | $ | 17.50 | | | | 0.33 | | | | 0.49 | | | | 0.82 | | | | (0.41 | ) | | | (0.59 | ) | |
Year Ended 10/31/19 | | $ | 16.21 | | | | 0.31 | | | | 1.83 | | | | 2.14 | | | | (0.37 | ) | | | (0.48 | ) | |
Year Ended 10/31/18 | | $ | 16.53 | | | | 0.36 | | | | (0.01 | ) | | | 0.35 | | | | (0.58 | ) | | | (0.09 | ) | |
Year Ended 10/31/17 | | $ | 13.71 | | | | 0.22 | | | | 2.90 | | | | 3.12 | | | | (0.30 | ) | | | — | | |
Year Ended 10/31/16 | | $ | 13.98 | | | | 0.17 | | | | (0.07 | ) | | | 0.10 | | | | (0.37 | ) | | | — | | |
Member Class | |
11/3/20(f) through
4/30/21 (unaudited) | | $ | 17.36 | | | | 0.13 | | | | 3.16 | (e) | | | 3.29 | | | | (0.10 | ) | | | — | | |
(a) Per share net investment income (loss) has been calculated using the average daily shares method.
(b) Not annualized for periods less than one year.
(c) Annualized for periods less than one year
(d) Portfolio turnover is calculated on the basis of the Fund as a whole without distinguishing between the classes of shares issued.
(e) The amount shown for a share outstanding throughout the period does not accord with the change in net assets resulting from operations during the period because of the timing of sales and purchases of fund shares in relation to fluctuating market values during the period.
(f) Commencement of operations.
See notes to financial statements.
52
Victory Portfolios | | Financial Highlights — continued | |
For a Share Outstanding Throughout Each Period
| | | | | Ratios to Average Net Assets | | Supplemental Data | |
| | | Total
Distributions | | Net Asset
Value,
End of
Period | | Total
Return
(Excludes
Sales
Charge)(b) | | Net
Expenses(c) | | Net
Investment
Income
(Loss)(c) | | Gross
Expenses(c) | | Net Assets,
End of
Period
(000's) | | Portfolio
Turnover(b)(d) | |
Victory INCORE Investment Grade Convertible Fund | |
Class A | |
Six Months Ended
4/30/21 (unaudited) | | | (0.73 | ) | | $ | 19.82 | | | | 19.15 | % | | | 1.39 | % | | | 1.26 | % | | | 1.57 | % | | $ | 21,662 | | | | 18 | % | |
Year Ended 10/31/20 | | | (0.94 | ) | | $ | 17.31 | | | | 4.43 | % | | | 1.38 | % | | | 1.63 | % | | | 1.38 | % | | $ | 16,571 | | | | 34 | % | |
Year Ended 10/31/19 | | | (0.76 | ) | | $ | 17.51 | | | | 13.35 | % | | | 1.49 | % | | | 1.31 | % | | | 1.49 | % | | $ | 16,349 | | | | 35 | % | |
Year Ended 10/31/18 | | | (0.62 | ) | | $ | 16.22 | | | | 1.87 | % | | | 1.27 | % | | | 1.79 | % | | | 1.27 | % | | $ | 14,268 | | | | 41 | % | |
Year Ended 10/31/17 | | | (0.25 | ) | | $ | 16.53 | | | | 22.57 | % | | | 1.30 | % | | | 1.12 | % | | | 1.30 | % | | $ | 33,040 | | | | 39 | % | |
Year Ended 10/31/16 | | | (0.32 | ) | | $ | 13.72 | | | | 0.29 | % | | | 1.48 | % | | | 0.80 | % | | | 1.48 | % | | $ | 14,350 | | | | 22 | % | |
Class I | |
Six Months Ended
4/30/21 (unaudited) | | | (0.78 | ) | | $ | 19.82 | | | | 19.42 | % | | | 0.93 | % | | | 1.73 | % | | | 0.93 | % | | $ | 343,693 | | | | 18 | % | |
Year Ended 10/31/20 | | | (1.00 | ) | | $ | 17.32 | | | | 4.91 | % | | | 0.96 | % | | | 1.98 | % | | | 0.96 | % | | $ | 276,923 | | | | 34 | % | |
Year Ended 10/31/19 | | | (0.85 | ) | | $ | 17.50 | | | | 13.99 | % | | | 0.96 | % | | | 1.87 | % | | | 0.96 | % | | $ | 263,981 | | | | 35 | % | |
Year Ended 10/31/18 | | | (0.67 | ) | | $ | 16.21 | | | | 2.16 | % | | | 0.94 | % | | | 2.17 | % | | | 0.94 | % | | $ | 126,871 | | | | 41 | % | |
Year Ended 10/31/17 | | | (0.30 | ) | | $ | 16.53 | | | | 23.07 | % | | | 0.94 | % | | | 1.47 | % | | | 0.94 | % | | $ | 78,879 | | | | 39 | % | |
Year Ended 10/31/16 | | | (0.37 | ) | | $ | 13.71 | | | | 0.77 | % | | | 0.99 | % | | | 1.26 | % | | | 0.99 | % | | $ | 53,438 | | | | 22 | % | |
Member Class | |
11/3/20(f) through
4/30/21 (unaudited) | | | (0.10 | ) | | $ | 20.55 | | | | 18.96 | % | | | 1.10 | % | | | 1.36 | % | | | 19.35 | % | | $ | 288 | | | | 18 | % | |
See notes to financial statements.
53
Victory Portfolios | | Notes to Financial Statements
April 30, 2021 | |
(Unaudited)
1. Organization:
Victory Portfolios (the "Trust") is organized as a Delaware statutory trust and the Trust is registered under the Investment Company Act of 1940, as amended (the "1940 Act"), as an open-end investment company. The Trust is comprised of 42 funds and is authorized to issue an unlimited number of shares, which are units of beneficial interest with a par value of $0.001 per share.
The accompanying financial statements are those of the following six Funds (collectively, the "Funds" and individually, a "Fund"). Each Fund is classified as diversified under the 1940 Act.
Funds (Legal Name) | | Funds (Short Name) | | Investment Share
Classes Offered | |
Victory Diversified Stock Fund | | Diversified Stock Fund | | Class A, C, I, R, R6, and Y | |
Victory NewBridge Large Cap
Growth Fund | | NewBridge Large Cap
Growth Fund | | Class A, C, I, and Y
| |
Victory Special Value Fund | | Special Value Fund | | Class A, C, I, R, and Y | |
Victory Strategic Allocation Fund | | Strategic Allocation Fund | | Class A, C, I, and R | |
Victory INCORE Fund for Income | | INCORE Fund for Income | | Class A, C, I, R, R6, Y, and
Member Class* | |
Victory INCORE Investment Grade
Convertible Fund | | INCORE Investment Grade
Convertible Fund | | Class A, I, and
Member Class* | |
* Member Class commenced operations on November 3, 2020.
Each class of shares of a Fund has substantially identical rights and privileges except with respect to sales charges, fees paid under distribution plans, expenses allocable exclusively to each class of shares, voting rights on matters solely affecting a single class of shares, and the exchange privilege of each class of shares.
Under the Trust's organizational documents, its officers and trustees are indemnified against certain liabilities arising out of the performance of their duties to the Funds. In addition, in the normal course of business, the Funds enter into contracts with their vendors and others that provide for general indemnifications. The Funds' maximum exposure under these arrangements is unknown, as this would involve future claims that may be made against the Funds. However, based on experience, the Funds expect that risk of loss to be remote.
2. Significant Accounting Policies:
The following is a summary of significant accounting policies followed by the Trust in the preparation of its financial statements. The policies are in conformity with generally accepted accounting principles in the United States of America ("GAAP"). The preparation of financial statements in accordance with GAAP requires management to make estimates and assumptions that affect the reported amounts of assets and liabilities and disclosure of contingent assets and liabilities at the date of the financial statements and the reported amounts of income and expenses for the period. Actual results could differ from those estimates. The Funds follow the specialized accounting and reporting requirements under GAAP that are applicable to investment companies under Accounting Standards Codification Topic 946.
Investment Valuation:
The Funds record investments at fair value. Fair value is defined as the price that would be received to sell an asset or paid to transfer a liability in an orderly transaction between market participants at the measurement date.
The valuation techniques described below maximize the use of observable inputs and minimize the use of unobservable inputs in determining fair value. The inputs used for valuing the Funds' investments are summarized in the three broad levels listed below:
• Level 1 — quoted prices in active markets for identical securities
54
Victory Portfolios | | Notes to Financial Statements — continued
April 30, 2021 | |
(Unaudited)
• Level 2 — other significant observable inputs (including quoted prices for similar securities or interest rates applicable to those securities, etc.)
• Level 3 — significant unobservable inputs (including the Funds' own assumptions in determining the fair value of investments)
Changes in valuation techniques may result in transfers in or out of an assigned level within the disclosure hierarchy. The inputs or methodologies used for valuation techniques are not necessarily an indication of the risk associated with entering into those investments.
Victory Capital Management Inc. ("VCM" or the "Adviser") has established the Pricing and Liquidity Committee (the "Committee"), and subject to the Trust's Board of Trustees (the "Board") oversight, the Committee administers and oversees the Fund's valuation policies and procedures, which are approved by the Board.
Portfolio securities listed or traded on securities exchanges, including exchange-traded funds ("ETFs"), American Depositary Receipts ("ADRs") and Rights, are valued at the closing price on the exchange or system where the security is principally traded, if available, or at the Nasdaq Official Closing Price. If there have been no sales for that day on the exchange or system, then a security is valued at the last available bid quotation on the exchange or system where the security is principally traded. In each of these situations, valuations are typically categorized as Level 1 in the fair value hierarchy
Investments in open-end investment companies are valued at net asset value ("NAV"). These valuations are typically categorized as Level 1 in the fair value hierarchy.
Debt securities are valued each business day by a pricing service approved by the Board. The approved pricing service uses evaluated bid or the last sale price to value securities. Debt obligations maturing within 60 days may be valued at amortized cost provided that amortized cost represents the fair value of such securities. These valuations are typically categorized as Level 2 in the fair value hierarchy.
In the event that price quotations or valuations are not readily available, investments are valued at fair value in accordance with procedures established by and under the general supervision and responsibility of the Board. These valuations are typically categorized as Level 2 or Level 3 in the fair value hierarchy, based on the observability of inputs used to determine the fair value. The effect of fair value pricing is that securities may not be priced on the basis of quotations from the primary market in which they are traded and the actual price realized from the sale of a security may differ materially from the fair value price. Valuing these securities at fair value is intended to cause the Fund's NAV to be more reliable than it otherwise would be.
A summary of the valuations as of April 30, 2021, based upon the three levels defined above, is included in the table below while the breakdown, by category, of investments is disclosed on the Schedules of Portfolio Investments (amounts in thousands):
| | | Level 1 | | Level 2 | | Level 3 | | Total | |
Diversified Stock Fund | |
Common Stocks | | $ | 307,395 | | | $ | — | | | $ | — | | | $ | 307,395 | | |
Exchange-Traded Funds | | | 3,576 | | | | — | | | | — | | | | 3,576 | | |
Collateral for Securities Loaned | | | 5,975 | | | | — | | | | — | | | | 5,975 | | |
Total | | $ | 316,946 | | | $ | — | | | $ | — | | | $ | 316,946 | | |
NewBridge Large Cap Growth Fund | |
Common Stocks | | $ | 17,602 | | | $ | — | | | $ | — | | | $ | 17,602 | | |
Collateral for Securities Loaned | | | 178 | | | | — | | | | — | | | | 178 | | |
Total | | $ | 17,780 | | | $ | — | | | $ | — | | | $ | 17,780 | | |
55
Victory Portfolios | | Notes to Financial Statements — continued
April 30, 2021 | |
(Unaudited)
| | | Level 1 | | Level 2 | | Level 3 | | Total | |
Special Value Fund | |
Common Stocks | | $ | 48,081 | | | $ | — | | | $ | — | | | $ | 48,081 | | |
Exchange-Traded Funds | | | 1,223 | | | | — | | | | — | | | | 1,223 | | |
Total | | $ | 49,304 | | | $ | — | | | $ | — | | | $ | 49,304 | | |
Strategic Allocation Fund | |
Affiliated Exchange-Traded Funds | | $ | 2,015 | | | $ | — | | | $ | — | | | $ | 2,015 | | |
Affiliated Mutual Funds | | | 22,059 | | | | — | | | | — | | | | 22,059 | | |
Total | | $ | 24,074 | | | $ | — | | | $ | — | | | $ | 24,074 | | |
INCORE Fund for Income | |
Government National Mortgage Association | | $ | — | | | $ | 568,762 | | | $ | — | | | $ | 568,762 | | |
U.S. Treasury Obligations | | | — | | | | 229,866 | | | | — | | | | 229,866 | | |
Investment Companies | | | 100 | | | | — | | | | — | | | | 100 | | |
Total | | $ | 100 | | | $ | 798,628 | | | $ | — | | | $ | 798,728 | | |
INCORE Investment Grade Convertible Fund | |
Convertible Corporate Bonds | | $ | — | | | $ | 243,986 | | | $ | — | | | $ | 243,986 | | |
Convertible Preferred Stocks | | | 104,152 | | | | 5,180 | | | | — | | | | 109,332 | | |
Collateral for Securities Loaned | | | 40,105 | | | | — | | | | — | | | | 40,105 | | |
Total | | $ | 144,257 | | | $ | 249,166 | | | $ | — | | | $ | 393,423 | | |
For the six months ended April 30, 2021, there were no transfers in or out of Level 3 in the fair value hierarchy.
Securities Purchased on a When-Issued Basis:
The Funds may purchase securities on a delayed-delivery or when-issued basis. Delivery and payment for securities that have been purchased by the Funds on a delayed-delivery or when-issued basis or for delayed draws on loans can take place a month or more after the trade date. At the time the Funds make the commitment to purchase a security on a delayed-delivery or when-issued basis, the Funds record the transaction and reflects the value of the security in determining NAV. No interest accrues to the Fund until the transaction settles and payment takes place. A segregated account is established and the Funds maintain cash and/or marketable securities at least equal in value to commitments for delayed-delivery or when-issued securities. If the Funds own delayed-delivery or when-issued securities, these values are included in Payable for investments purchased on the accompanying Statement of Assets and Liabilities and the segregated assets are identified in the Schedule of Portfolio Investments.
Investment Companies:
Exchange-Traded Funds:
The Funds may invest in ETFs, the shares of which are bought and sold on a securities exchange. An ETF trades like common stock and represents a fixed portfolio of securities often designed to track the performance and dividend yield of a particular domestic or foreign market index. The Funds may purchase shares of an ETF to temporarily gain exposure to a portion of the U.S. or a foreign market while awaiting purchase of underlying securities. The risks of owning an ETF generally reflect the risks of owning the underlying securities they are designed to track, although the lack of liquidity of an ETF could result in it being more volatile. Additionally, ETFs have fees and expenses that reduce their value.
Open-End Funds:
The Funds may invest in portfolios of open-end investment companies. These investment companies value securities in their portfolios for which market quotations are readily available at their market values (generally the last reported sale price) and all other securities and assets at their fair value by the methods established by the board of directors of the underlying funds.
56
Victory Portfolios | | Notes to Financial Statements — continued
April 30, 2021 | |
(Unaudited)
Investment Transactions and Related Income:
Changes in holdings of investments are accounted for no later than one business day following the trade date. For financial reporting purposes, however, investment transactions are accounted for on trade date on the last business day of the reporting period. Interest income is determined on the basis of coupon interest accrued using the effective interest method which adjusts, where applicable, the amortization of premiums or accretion of discounts. Dividend income is recorded on the ex-dividend date. Gains or losses realized on sales of securities are recorded on the identified cost basis. Paydown gains or losses on applicable securities, if any, are recorded as components of Interest income on the Statements of Operations.
Securities Lending:
The Trust has entered into a Master Securities Lending Agreement ("MSLA") with Citibank, N.A. ("Citibank"). Under the terms of the MSLA, the Funds may lend securities to certain broker-dealers and banks in exchange for collateral in the amount of at least 102% of the value of U.S. securities loaned or at least 105% of the value of non-U.S. securities loaned, marked-to-market daily. Any collateral shortfalls associated with increases in the valuation of the securities loaned are adjusted the next business day. The collateral can be received in the form of cash collateral and/or non-cash collateral. Non-cash collateral can include U.S. Government Securities, letters of credit and certificates of deposit. The cash collateral is invested in short-term instruments or cash equivalents, primarily open-end investment companies, as noted in the Funds' Schedules of Portfolio Investments. The Trust does not have effective control of the non-cash collateral and therefore it is not disclosed in the Funds' Schedules of Portfolio Investments. During the time portfolio securities are on loan, the borrower will pay the Funds any dividends or interest paid on such securities plus any fee negotiated between the parties to the lending agreement. The Funds also earn a return from the collateral. The Funds pay Citibank various fees in connection with the investment of cash collateral and fees based on the investment income received from securities lending activities. Securities lending income (net of these fees) is disclosed on the Statements of Operations. Although risk is mitigated by the collateral, the Funds could experience a delay in recovering their securities and possible loss of income or value if the borrower fails to return them.
Securities lending transactions are entered into by a Fund under the MSLA, which permits the Fund, under certain circumstances such as an event of default, to offset amounts payable by the Fund to the same counterparty against amounts receivable from the counterparty to create a net payment due to or from the Fund.
The following table (amounts in thousands) is a summary of the Funds' securities lending transactions which are subject to offset under the MSLA as of April 30, 2021. These transactions are accounted for as secured borrowings with an overnight and continuous contractual maturity for cash collateral, and greater than overnight and continuous contractual maturity for non-cash collateral.
| | | Gross Amount of | | | | Value of Non-Cash Collateral
Received by Maturity | | | |
| | | Recognized Assets
(Value of
Securities on Loan) | | Value of
Cash Collateral
Received* | | <30
Days | | Between
30 & 90
Days | | >90
Days | | Net
Amount | |
Diversified Stock Fund | | $ | 5,775 | | | $ | 5,775 | | | $ | — | | | $ | — | | | $ | — | | | $ | — | | |
NewBridge Large Cap
Growth Fund | | | 169 | | | | 169 | | | | — | | | | — | | | | — | | | | — | | |
INCORE Investment Grade
Convertible Fund | | | 39,019 | | | | 39,019 | | | | — | | | | — | | | | — | | | | — | | |
* Collateral received in excess of the market value of securities on loan is not presented in this table. The total cash collateral received by each Fund is disclosed on the Statements of Assets and Liabilities.
57
Victory Portfolios | | Notes to Financial Statements — continued
April 30, 2021 | |
(Unaudited)
Federal Income Taxes:
It is the policy of each Fund to continue to qualify as a regulated investment company by complying with the provisions available to certain investment companies, as defined in applicable sections of the Internal Revenue Code, and to make distributions of net investment income and net realized gains sufficient to relieve it from all, or substantially all, federal income taxes. Accordingly, no provision for federal income taxes is required in the financial statements. The Funds have a tax year end of October 31.
Management of the Funds has reviewed tax positions taken in tax years that remain subject to examination by all major tax jurisdictions, including federal (i.e., the last four tax years, which includes the current fiscal tax year end). Management believes that there is no tax liability resulting from unrecognized tax benefits related to uncertain tax positions taken.
Allocations:
Expenses directly attributable to a Fund are charged to the Fund, while expenses which are attributable to more than one fund in the Trust, or jointly with an affiliated trust, are allocated among the respective funds in the Trust and/or affiliated trust based upon net assets or another appropriate basis.
Income, expenses (other than class-specific expenses such as transfer agent fees, state registration fees, 12b-1 fees and printing fees), and realized and unrealized gains or losses on investments are allocated to each class of shares based on its relative net assets on the date income is earned or expenses and realized and unrealized gains and losses are incurred.
3. Purchases and Sales of Securities:
Purchases and sales of securities (excluding securities maturing less than one year from acquisition) for the six months ended April 30, 2021 were as follows (amounts in thousands). Any realized gains or losses from in-kind redemptions, if any, are reflected on the Statements of Operations as Net realized gains (losses) from in-kind redemptions.
| | | Excluding
U.S. Government Securities | | U.S. Government Securities | |
| | | Purchases | | Sales | | Purchases | | Sales | |
| Diversified Stock Fund | | $ | 91,504 | | | $ | 107,944 | | | $ | — | | | $ | — | | |
| NewBridge Large Cap Growth Fund | | | 4,524 | | | | 6,674 | | | | — | | | | — | | |
| Special Value Fund | | | 18,625 | | | | 24,297 | | | | — | | | | — | | |
| Strategic Allocation Fund | | | 1,285 | | | | 5,647 | | | | — | | | | — | | |
| INCORE Fund for Income | | | — | | | | — | | | | 216,153 | | | | 405,321 | | |
INCORE Investment Grade
Convertible Fund | | | 63,608 | | | | 54,877 | | | | — | | | | — | | |
4. Fees and Transactions with Affiliates and Related Parties:
Investment Advisory Fees:
Investment advisory services are provided to the Funds by the Adviser, which is a New York corporation registered as an investment adviser with the Securities and Exchange Commission ("SEC"). The Adviser is an indirect wholly owned subsidiary of Victory Capital Holdings, Inc., a publicly traded Delaware corporation, and a wholly owned direct subsidiary of Victory Capital Operating, LLC.
Under the terms of the Investment Advisory Agreements, the Adviser is entitled to receive fees based on a percentage of the average daily net assets of each Fund. The rates at which the Adviser is paid by each Fund are included in the table below.
58
Victory Portfolios | | Notes to Financial Statements — continued
April 30, 2021 | |
(Unaudited)
| | | Adviser Fee Tier Rates | |
| | | Up to $800 million | | $800 million – $2.4 billion | | Over $2.4 billion | |
Diversified Stock Fund | | | 0.65 | % | | | 0.60 | % | | | 0.55 | % | |
| | | Up to $400 million | | $400 million – $800 million | | Over $800 million | |
NewBridge Large Cap Growth Fund | | | 0.75 | % | | | 0.65 | % | | | 0.60 | % | |
Special Value Fund | | | 0.75 | % | | | 0.65 | % | | | 0.60 | % | |
| | | Flat Rate | | | | | |
Strategic Allocation Fund | | | 0.10 | % | | | | | | | | | |
| | | Up to $400 million | | $400 million – $800 million | | Over $800 million | |
INCORE Fund for Income | | | 0.50 | % | | | 0.45 | % | | | 0.40 | % | |
INCORE Investment Grade
Convertible Fund | | | 0.75 | % | | | 0.65 | % | | | 0.60 | % | |
Amounts incurred and paid to VCM for the six months ended April 30, 2021, are reflected on the Statements of Operations as Investment advisory fees.
Administration and Servicing Fees:
VCM serves as the Funds' administrator and fund accountant. Under the Administration and Fund Accounting Agreement, VCM is entitled to receive fees based on a percentage of the average daily net assets of the Trust, Victory Variable Insurance Funds and Victory Portfolios II (collectively, the "Victory Funds Complex"). The tiered rates at which VCM is paid by the Funds are shown in the table below:
| Up to $15 billion | | $15 billion – $30 billion | | Over $30 billion | |
| | 0.08 | %, plus | | | 0.05 | %, plus | | | 0.04 | % | |
Amounts incurred for the six months ended April 30, 2021, are reflected on the Statements of Operations as Administration fees.
Citi Fund Services Ohio, Inc. ("Citi"), an affiliate of Citibank, acts as sub-administrator and sub-fund accountant to the Funds pursuant to the Sub-Administration and Sub-Fund Accounting Services Agreement between VCM and Citi. VCM pays Citi a fee for providing these services. The Trust reimburses VCM and Citi for out-of-pocket expenses incurred in providing these services and certain other expenses specifically allocated to the Funds. Amounts incurred for the six months ended April 30, 2021, are reflected on the Statements of Operations as Sub-Administration fees.
The Chief Compliance Officer ("CCO") is an employee of the Adviser, which pays the compensation of the CCO and his support staff. The Funds (as part of the Trust) have entered into an agreement to provide compliance services with the Adviser, pursuant to which the Adviser furnishes its compliance personnel, including the services of the Chief Compliance Officer ("CCO"), and other resources reasonably necessary to provide the Trust with compliance oversight services related to the design, administration and oversight of a compliance program for the Trust in accordance with Rule 38a-1 under the 1940 Act. The CCO is an employee of the Adviser, which pays the compensation of the CCO and support staff. The Funds in the Victory Funds Complex along with the funds in the USAA Mutual Funds Trust, in aggregate, compensate the Adviser for these services. Amounts incurred for the six months ended April 30, 2021, are reflected on the Statements of Operations as Compliance fees.
Transfer Agency Fees:
FIS Investor Services, LLC ("FIS") serves as the Funds' transfer agent. Under the Transfer Agent Agreement, the Trust pays FIS a fee for its services and reimburses FIS for all of their reasonable out-of-pocket expenses incurred in providing these services. Amounts incurred for the six months ended April 30, 2021, are reflected on the Statements of Operations as Transfer agent fees.
Victory Capital Transfer Agency, Inc., an affiliate of the Adviser, serves as sub-transfer agent for Member Class and receives no fee or other compensation for these services.
59
Victory Portfolios | | Notes to Financial Statements — continued
April 30, 2021 | |
(Unaudited)
Distributor/Underwriting Services:
Victory Capital Services, Inc. (the "Distributor"), an affiliate of the Adviser, serves as distributor for the continuous offering of the shares of the Funds pursuant to a Distribution Agreement between the Distributor and the Trust. Pursuant to the Distribution and Service Plans adopted in accordance with Rule 12b-1 under the 1940 Act, the Distributor may receive a monthly distribution and service fee as shown in the table below:
| | | Class A | | Class C | | Class I | | Class R | | Class R6 | | Class Y | | Member
Class | |
Diversified Stock Fund | | | 0.25 | % | | | 1.00 | % | | | 0.00 | % | | | 0.50 | % | | | 0.00 | % | | | 0.00 | % | | | N/A | | |
NewBridge Large Cap
Growth Fund | | | 0.25 | % | | | 1.00 | % | | | 0.00 | % | | | N/A | | | | N/A | | | | 0.00 | % | | | N/A | | |
Special Value Fund | | | 0.25 | % | | | 1.00 | % | | | 0.00 | % | | | 0.00 | % | | | N/A | | | | 0.00 | % | | | N/A | | |
Strategic Allocation Fund | | | 0.25 | % | | | 1.00 | % | | | 0.00 | % | | | 0.00 | % | | | N/A | | | | N/A | | | | N/A | | |
INCORE Fund for Income | | | 0.25 | % | | | 1.00 | % | | | 0.00 | % | | | 0.25 | % | | | 0.00 | % | | | 0.00 | % | | | 0.00 | % | |
INCORE Investment Grade
Convertible Fund | | | 0.25 | % | | | N/A | | | | 0.00 | % | | | N/A | | | | N/A | | | | N/A | | | | 0.00 | % | |
The distribution and service fees paid to the Distributor may be used by the Distributor to pay for activities primarily intended to result in the sale of Class A, Class C, and Class R. Amounts incurred for the six months ended April 30, 2021, are reflected on the Statements of Operations as 12b-1 fees.
In addition, the Distributor is entitled to receive commissions on sale of the Class A. For the six months ended April 30, 2021, the Distributor received approximately $15 thousand from commissions earned on the sale of Class A.
Other Fees:
Citibank serves as the Funds' custodian. The Funds pay Citibank a fee for providing these services. Amounts incurred for the six months ended April 30, 2021, are reflected on the Statements of Operations as Custodian fees.
Sidley Austin LLP provides legal services to the Trust.
The Adviser has entered into expense limitation agreements with certain Funds. Under the terms of the agreements, the Adviser has agreed to waive fees or reimburse certain expenses to the extent that ordinary operating expenses incurred by certain classes of a Fund in any fiscal year exceed the expense limit for such classes of the Fund. Such excess amounts will be the liability of the Adviser. Acquired fund fees and expense, interest, taxes, brokerage commissions, other expenditures that are capitalized in accordance with GAAP, and other extraordinary expenses not incurred in the ordinary course of a Fund's business are excluded from the expense limits. As of April 30, 2021, the expense limits (excluding voluntary waivers) are as follows:
| | | In effect until February 28, 2022 | |
| | | Class A | | Class C | | Class I | | Class R | | Class R6 | | Class Y | | Member
Class | |
Diversified Stock Fund | | | N/A | | | | 2.02 | % | | | 0.83 | % | | | N/A | | | | 0.78 | % | | | 0.86 | % | | | N/A | | |
NewBridge Large Cap
Growth Fund | | | 1.36 | % | | | 2.10 | % | | | 0.95 | % | | | N/A | | | | N/A | | | | 1.02 | % | | | N/A | | |
Special Value Fund | | | N/A | | | | 2.20 | % | | | 1.15 | % | | | N/A | | | | N/A | | | | 1.10 | % | | | N/A | | |
Strategic Allocation Fund | | | 0.40 | % | | | 1.15 | % | | | 0.15 | % | | | 0.65 | % | | | N/A | | | | N/A | | | | N/A | | |
INCORE Fund for Income | | | 0.91 | % | | | 1.71 | % | | | 0.64 | % | | | 0.91 | % | | | 0.63 | % | | | 0.71 | % | | | 0.75 | % | |
INCORE Investment Grade
Convertible Fund | | | 1.39 | % | | | N/A | | | | N/A | | | | N/A | | | | N/A | | | | N/A | | | | 1.10 | % | |
60
Victory Portfolios | | Notes to Financial Statements — continued
April 30, 2021 | |
(Unaudited)
The Funds (except Strategic Allocation Fund) have agreed to repay fees and expenses that were waived or reimbursed by the Adviser for a period up to three fiscal years after such waiver or reimbursement was made to the extent such payments or repayments would not cause the expenses of the class to exceed the original expense limitation in place at time of the waiver or reimbursement or any expense limitation agreement in place at the time of repayment. Amounts repaid to the Adviser during the six months ended April 30, 2021, if any, are reflected on the Statements of Operations as Recoupment of prior expenses waived/reimbursed by Adviser.
As of April 30, 2021, the following amounts are available to be repaid to the Adviser (amounts in thousands). The Funds have not recorded any amounts available to be repaid as a liability due to an assessment that such repayment is not probable at April 30, 2021.
Effective May 1, 2021, the expense limitation agreements have been revised to reflect that the Adviser will have the ability to recoup expenses up to three years after the date of the waiver or reimbursement, subject to the lesser of any operating expense limits in effect at the time of: (a) the original waiver or expense reimbursement; or (b) the recoupment, after giving effect to the recoupment amount. The Adviser has determined the effect of this change will have no significant impact on financial statements.
| | | Expires
10/31/2021 | | Expires
10/31/2022 | | Expires
10/31/2023 | | Expires
10/31/2024 | | Total | |
Diversified Stock Fund | | $ | 27 | | | $ | 30 | | | $ | 36 | | | $ | 18 | | | $ | 111 | | |
NewBridge Large Cap Growth Fund | | | 64 | | | | 76 | | | | 58 | | | | 32 | | | | 230 | | |
Special Value Fund | | | 21 | | | | 33 | | | | 28 | | | | 14 | | | | 96 | | |
INCORE Fund for Income | | | 31 | | | | 86 | | | | 105 | | | | 80 | | | | 302 | | |
INCORE Investment Grade
Convertible Fund | | | — | | | | — | | | | — | | | | 28 | | | | 28 | | |
The Adviser may voluntarily waive or reimburse additional fees to assist the Funds in maintaining competitive expense ratios. Voluntary waivers and reimbursements applicable to the Funds are not available to be recouped at a future time. For the six months ended April 30, 2021, the Adviser voluntarily waived the following amounts (in thousands):
For the year ended October 31, 2020, the Sub-Administrator voluntarily reimbursed INCORE Fund for Income $75 thousand for expenses incurred by the Fund related to the Reclassification Adjustment disclosed in Item 10 of the Notes to Financial Statements. Had this voluntary waiver not occurred, the net expense ratios of each class in the Fund would have been 0.01% higher for the year ended October 31, 2020. This voluntary reimbursement is not available to be recouped at a future time.
Certain officers and/or interested trustees of the Funds are also officers and/or employees of the Adviser, administrator, fund accountant, sub-administrator, sub-fund accountant, custodian, legal counsel, and Distributor.
5. Risks:
Each Fund may be subject to other risks in addition to these identified risks.
Credit Risk — The Funds will be subject to credit risk with respect to the amount each expects to receive from counterparties for financial instruments entered into by the Funds. The Funds may be negatively impacted if a counterparty becomes bankrupt or otherwise fails to perform its obligations due to financial difficulties. The Funds may experience significant delays in obtaining any recovery in bankruptcy or other reorganization proceeding and the Funds may obtain only limited recovery or may obtain no recovery in such circumstances. The Funds typically enter into transactions with counterparties whose credit ratings are investment grade, as determined by a nationally recognized statistical rating organization or, if unrated, judged by the Adviser to be of comparable quality.
Sector Risk — The NewBridge Large Cap Growth Fund is subject to sector risk. To the extent that Fund focuses in one or more sectors, such as the Information Technology sector, market or economic factors impacting those sectors could have a significant effect on the value of the Fund's investments and could
61
Victory Portfolios | | Notes to Financial Statements — continued
April 30, 2021 | |
(Unaudited)
make the Fund's performance more volatile. For example, the values of companies in the Information Technology sector are particularly vulnerable to economic downturns, short product cycles and aggressive pricing, market competition and changes in government regulation.
Credit and Interest Rate Risk — The INCORE Fund for Income and the INCORE Investment Grade Convertible Bond Fund are subject to credit and interest rate risk with respect to fixed income securities. Credit risk refers to the ability of an issuer to make timely payments of interest and principal. Interest rates may rise or the rate of inflation may increase, impacting the value of investments in fixed income securities. A debt issuers' credit quality may be downgraded or an issuer may default. Interest rates may fluctuate due to changes in governmental fiscal policy initiatives and resulting market reaction to those initiatives.
Geopolitical/Natural Disaster Risk — Global economies and financial markets are increasingly interconnected, which increases the possibilities that conditions in one country or region might adversely affect issuers in another country or region. Geopolitical and other risks, including war, terrorism, trade disputes, political or economic dysfunction within some nations, public health crises and related geopolitical events, as well as environmental disasters such as earthquakes, fires, and floods, may add to instability in world economies and markets generally. Changes in trade policies and international trade agreements could affect the economies of many countries in unpredictable ways. Likewise, systemic market dislocations of the kind that occurred during the financial crisis that began in 2008, if repeated, would be highly disruptive to economies and markets, adversely affecting individual companies and industries, securities markets, interest rates, credit ratings, inflation, investor sentiment, and other factors affecting the value of a Fund's investments. Some countries, including the United States, are adopting more protectionist trade policies and moving away from the tighter financial industry regulations that followed the 2008 financial crisis, which may also affect the value of a Fund's investments.
Political events within the United States at times have resulted, and may in the future result, in a shutdown of government services, which could negatively affect the U.S. economy, decrease the value of a Fund's investments, increase uncertainty in or impair the operation of the U.S. or other securities markets and degrade investor and consumer confidence, perhaps suddenly and to a significant degree.
An outbreak of disease called COVID-19 has spread internationally. The transmission of COVID-19 and efforts to contain its spread have resulted in international, national and local border closings and other significant travel restrictions and disruptions, significant disruptions to business operations, supply chains and consumer activity, significant challenges in healthcare service preparation and delivery, quarantines and general concern and uncertainty. These negative impacts have caused significant volatility and declines in global financial markets, which have caused losses for Fund investors during and subsequent to period end. The impact of the COVID-19 pandemic may last for an extended period of time, and could result in a substantial economic downturn or recession. Public health crises may exacerbate other pre-existing political, social, economic, market and financial risks. The extent of the impact to the financial performance of the Fund's investments will depend on future developments, including (i) the duration and spread of the outbreak, (ii) the restrictions and advisories, (iii) the effects on the financial markets, and (iv) the effects on the economy overall, all of which are highly uncertain and cannot be predicted.
LIBOR Discontinuation Risk — Many debt securities, derivatives and other financial instruments, including some of the Funds' investments, use the London Interbank Offered Rate ("LIBOR") as the reference or benchmark rate for variable interest rate calculations. In June 2017, the Alternative Reference Rates Committee, a group of large U.S. banks working with the Federal Reserve, announced its selection of a new Secured Overnight Funding Rate ("SOFR"), which is intended to be a broad measure of secured overnight U.S. Treasury repo rates, as an appropriate replacement for LIBOR. The Federal Reserve Bank of New York began publishing the SOFR in 2018, expecting that it could be used on a voluntary basis in new instruments and transactions. Bank working groups and regulators in other countries have suggested other alternatives for their markets, including the Sterling Overnight Interbank Average Rate ("SONIA") in England. In July 2017, the Financial Conduct Authority (the "FCA"), the United Kingdom financial regulatory body, announced that after 2021 it will cease its active
62
Victory Portfolios | | Notes to Financial Statements — continued
April 30, 2021 | |
(Unaudited)
encouragement of UK banks to provide the quotations needed to sustain LIBOR. That announcement suggests that LIBOR may cease to be published after that time. For U.S. dollar LIBOR, however, the relevant date may be deferred to June 30, 2023, for the most common tenors (overnight and one, three, six and 12 months). As to those tenors, the LIBOR administrator has published a consultation regarding its intention to cease publication of U.S. dollar LIBOR as of June 30, 2023, (instead of December 31, 2021, as previously expected), apparently based on continued rate submissions from banks. It is expected that there will be enough time for market participants to transition to the use of a different benchmark for both new and existing securities and transactions. Various financial industry groups have begun planning for that transition, but there are obstacles to converting certain longer-term securities and transactions to a new benchmark. Transition planning is at an early stage, and neither the effect of the transition process nor its ultimate success can yet be known. Although the foregoing may provide some sense of timing, there is no assurance that LIBOR, or any particular currency and tenor, will continue to be published until any particular date, and it appears highly likely that LIBOR will be discontinued or modified after December 31, 2021, or June 30, 2023, depending on the currency and tenor. The transition process might lead to increased volatility and illiquidity in markets that currently rely on the LIBOR to determine interest rates. It could also lead to a reduction in the value of some LIBOR-based investments and reduce the effectiveness of new hedges placed against existing LIBOR-based instruments. Since the usefulness of LIBOR as a benchmark could deteriorate during the transition period, these effects could occur before the end of 2021.
6. Borrowing and Interfund Lending:
Line of Credit:
For the six months ended April 30, 2021, the Victory Funds Complex and the USAA Mutual Funds Complex (another series of mutual funds managed by the Adviser) participated in a short-term demand note "Line of Credit" agreement with Citibank. The Line of Credit agreement with Citibank was renewed on June 29, 2020, with a termination date of June 28, 2021. Under the agreement with Citibank, the Victory Funds Complex and USAA Mutual Funds Complex, combined, may borrow up to $600 million, of which $300 million is committed and $300 million is uncommitted. $40 million of the Line of Credit is reserved for use by the Victory Floating Rate Fund (herein, the "Fund"), another series of the Victory Funds Complex, with that Fund paying the related commitment fees for that amount. The purpose of the Line of Credit is to meet temporary or emergency cash needs. For the six months ended April 30, 2021, Citibank received an annual commitment fee of 0.15% on $300 million for providing the Line of Credit. Each fund in the Victory Funds Complex pays a pro-rata portion of the commitment fees plus any interest (one month LIBOR plus one percent) on amounts borrowed. Effective June 29, 2020, under an amended Line of Credit agreement, Citibank also received an annual upfront fee of 0.10% on the $300 million committed line of credit. Effective with the next amendment, the upfront fee of 0.10% will be discontinued. Each fund in the Victory Funds Complex paid a pro-rata portion of the upfront fee. Interest charged to each Fund during the period, if applicable, is presented on the Statements of Operations under Line of credit fees. The Funds had no borrowings under the Line of Credit agreement during the six months ended April 30, 2021.
Interfund Lending:
The Trust and Adviser rely on an exemptive order granted by the SEC in March 2017 (the "Order"), permitting the establishment and operation of an Interfund Lending Facility (the "Facility"). The Facility allows each Fund to directly lend and borrow money to or from any other fund in the Victory Funds Complex that is permitted to participate in the Facility, relying upon the Order at rates beneficial to both the borrowing and lending funds. Advances under the Facility are allowed for temporary or emergency purposes, including the meeting of redemption requests that otherwise might require the untimely disposition of securities, and are subject to each Fund's borrowing restrictions. The interfund loan rate is determined, as specified in the Order, by averaging the current repurchase agreement rate and the current bank loan rate. As a Borrower, interest charged to the Fund, if any, during the period is reflected on the Statement of Operations under Interfund lending fees. As a Lender, interest earned
63
Victory Portfolios | | Notes to Financial Statements — continued
April 30, 2021 | |
(Unaudited)
by the Fund, if any, during the period is presented on the Statement of Operations under Interfund lending.
The average borrowing and lending for the days outstanding and average interest rate for each Fund during the six months ended April 30, 2021, were as follows (amounts in thousands):
| | | Borrower or
Lender | | Amount
Outstanding at
April 30, 2021 | | Average
Borrowing* | | Days
Borrowing
Outstanding | | Average
Interest
Rate | | Maximum
Borrowing
During the
Period | |
INCORE Fund for
Income | | Borrower | | $ | — | | | $ | 825 | | | | 3 | | | | 0.57 | % | | $ | 825 | | |
INCORE Investment
Grade Convertible
Fund | | Borrower | | | — | | | | 946 | | | | 1 | | | | 0.62 | % | | | 946 | | |
* For the six months ended April 30, 2021, based on the number of days borrowings were outstanding.
7. Federal Income Tax Information:
Distributable net realized gains, if any, are declared and distributed at least annually from each Fund. Dividends from net investment income, if any, are declared and paid as noted in the table below.
| | | Declared | | Paid | |
Diversified Stock Fund | | Quarterly | | Quarterly | |
NewBridge Large Cap Growth Fund | | Annually | | Annually | |
Special Value Fund | | Annually | | Annually | |
Strategic Allocation Fund | | Quarterly | | Quarterly | |
INCORE Fund for Income | | Monthly | | Monthly | |
INCORE Investment Grade Convertible Fund | | Quarterly | | Quarterly | |
The amounts of dividends from net investment income and distributions from net realized gains (collectively, distributions to shareholders) are determined in accordance with federal income tax regulations, which may differ from GAAP. To the extent these "book/tax" differences are permanent in nature (e.g., net operating loss and distribution reclassification), such amounts are reclassified within the components of net assets based on their federal tax-basis treatment; temporary differences (e.g., wash sales) do not require reclassification. To the extent dividends and distributions exceed net investment income and net realized gains for tax purposes, they are reported as distributions of capital. Net investment losses incurred by a Fund may be reclassified as an offset to capital on the accompanying Statements of Assets and Liabilities.
The tax character of distributions paid and the tax basis of current components of accumulated earnings (deficit) will be determined at the end of the current tax year ending October 31, 2021.
As of the tax year ended October 31, 2020, the Funds had net capital loss carryforwards as summarized in the table below (amounts in thousands):
| | | Short-Term
Amount | | Long-Term
Amount | | Total | |
Strategic Allocation Fund | | $ | — | | | $ | 76 | | | $ | 76 | | |
INCORE Fund for Income | | | 110,087 | | | | 205,377 | | | | 315,464 | | |
INCORE Investment Grade Convertible Fund | | | — | | | | 1,509 | | | | 1,509 | | |
64
Victory Portfolios | | Notes to Financial Statements — continued
April 30, 2021 | |
(Unaudited)
8. Affiliated Securities:
An affiliated security is a security in which the Fund has ownership of at least 5% of the security's outstanding voting shares, an investment company managed by VCM or an issuer under common control with a Fund or VCM. The Fund does not invest in affiliated securities for the purpose of exercising management or control. These securities are noted as affiliated on the Fund's Schedule of Portfolio Investments. Transactions in affiliated securities during the six months ended April 30, 2021, were as follows (amounts in thousands):
| | | Fair
Value
10/31/2020 | | Purchases
at Cost | | Proceeds
from
Sales | | Net
Realized
Gains
(Losses) | | Capital Gain
Distributions | | Net
Change in
Unrealized
Appreciation/
Depreciation | | Fair
Value
4/30/2021 | | Dividend
Income | |
Strategic Allocation Fund | |
Victory INCORE Total
Return Bond Fund,
Class R6 | | $ | 3,081 | | | $ | 110 | | | $ | — | | | $ | — | | | $ | — | | | $ | (40 | ) | | $ | 3,151 | | | $ | 40 | | |
Victory Integrity
Discovery Fund,
Class Y | | | 820 | | | | — | | | | (105 | ) | | | (20 | ) | | | — | | | | 569 | | | | 1,264 | | | | — | | |
Victory Market
Neutral Income
Fund, Class I | | | 5,412 | | | | 275 | | | | — | | | | — | | | | 101 | | | | (40 | ) | | | 5,647 | | | | 102 | | |
Victory RS Global
Fund, Class Y | | | 7,049 | | | | 64 | | | | (353 | ) | | | 73 | | | | 3 | | | | 1,746 | | | | 8,579 | | | | 61 | | |
Victory RS Partners
Fund, Class Y | | | 830 | | | | 14 | | | | (78 | ) | | | 14 | | | | 14 | | | | 460 | | | | 1,240 | | | | — | * | |
Victory Sophus
Emerging Markets
Fund, Class R6 | | | — | | | | 70 | | | | — | | | | — | | | | — | | | | 1 | | | | 71 | | | | — | * | |
Victory Sophus
Emerging Markets
Small Cap Fund,
Class Y | | | 1,916 | | | | 682 | | | | (2,579 | ) | | | (682 | ) | | | — | | | | 663 | | | | — | | | | 682 | | |
Victory Trivalent
Emerging Markets
Small-Cap Fund,
Class Y | | | 1,987 | | | | 19 | | | | (2,453 | ) | | | 281 | | | | — | | | | 166 | | | | — | | | | 19 | | |
Victory Trivalent
International
Small-Cap Fund,
Class I | | | 1,710 | | | | 8 | | | | (79 | ) | | | 24 | | | | — | | | | 444 | | | | 2,107 | | | | 8 | | |
VictoryShares U.S.
Multi-Factor
Minimum Volatility
ETF | | | 1,629 | | | | 43 | | | | — | | | | — | | | | — | | | | 343 | | | | 2,015 | | | | 18 | | |
| | | $ | 24,434 | | | $ | 1,285 | | | $ | (5,647 | ) | | $ | (310 | ) | | $ | 118 | | | $ | 4,312 | | | $ | 24,074 | | | $ | 930 | | |
* Rounds to less than $1 thousand.
65
Victory Portfolios | | Supplemental Information
April 30, 2021 | |
(Unaudited)
Proxy Voting and Portfolio Holdings Information
Proxy Voting:
Information regarding the policies and procedures each Fund uses to determine how to vote proxies relating to portfolio securities is available without charge, upon request, by calling 800-539-3863. The information is also included in the Funds' Statement of Additional Information, which is available on the SEC's website at www.sec.gov.
Information relating to how the Funds voted proxies relating to portfolio securities held during the most recent twelve months ended June 30 is available on the SEC's website at www.sec.gov.
Availability of Schedules of Portfolio Investments:
The Trust files a complete list of Schedules of Portfolio Investments with the SEC for the first and third quarter of each fiscal year on Form N-PORT. Forms N-PORT are available on the SEC's web site at www.sec.gov.
Expense Examples
As a shareholder of the Funds, you may incur two types of costs: (1) transaction costs, including sales charges (loads) on purchases; and (2) ongoing costs, including management fees, distribution and service (12b-1) fees and other Fund expenses. These examples are intended to help you understand your ongoing costs (in dollars) of investing in the Funds and to compare these costs with the ongoing costs of investing in other mutual funds.
These examples are based on an investment of $1,000 invested at the beginning of the period and held for the entire period from November 1, 2020, through April 30, 2021 (unless otherwise noted).
The Actual Expense figures in the table below provide information about actual account values and actual expenses. You may use the information below, together with the amount you invested, to estimate the expenses that you paid over the period. Simply divide your account value by $1,000 (for example, an $8,600 account value divided by $1,000 = 8.6), then multiply the result by the number in the table under the heading entitled "Actual Expenses Paid During Period" to estimate the expenses you paid on your account during this period.
The Hypothetical Expense figures in the table below provide information about hypothetical account values and hypothetical expenses based on each Fund's actual expense ratio and an assumed rate of return of 5% per year before expenses, which is not the Fund's actual return. The hypothetical account values and expenses may not be used to estimate the actual ending account balance or expenses you paid for the period. You may use this information to compare this 5% hypothetical example with the 5% hypothetical examples that appear in shareholder reports of other funds.
Please note the expenses shown in the table are meant to highlight your ongoing costs only and do not reflect any transactional costs. Therefore, the table is useful in comparing ongoing costs only, and will not help you determine the relative total costs of owning different funds. In addition, if these transactional costs were included, your costs would have been higher.
| | Beginning
Account
Value
11/1/20 | | Actual
Ending
Account
Value
4/30/21 | | Hypothetical
Ending
Account
Value
4/30/21 | | Actual
Expenses
Paid During
Period
11/1/20-4/30/21* | | Hypothetical
Expenses
Paid During
Period
11/1/20-4/30/21* | | Annualized
Expense Ratio
During Period
11/1/20-4/30/21 | |
Diversified Stock Fund | |
Class A | | $ | 1,000.00 | | | $ | 1,307.30 | | | $ | 1,019.49 | | | $ | 6.12 | | | $ | 5.36 | | | | 1.07 | % | |
Class C | | | 1,000.00 | | | | 1,300.70 | | | | 1,014.78 | | | | 11.52 | | | | 10.09 | | | | 2.02 | % | |
Class I | | | 1,000.00 | | | | 1,308.60 | | | | 1,020.68 | | | | 4.75 | | | | 4.16 | | | | 0.83 | % | |
Class R | | | 1,000.00 | | | | 1,304.90 | | | | 1,018.10 | | | | 7.72 | | | | 6.76 | | | | 1.35 | % | |
Class R6 | | | 1,000.00 | | | | 1,308.60 | | | | 1,020.93 | | | | 4.46 | | | | 3.91 | | | | 0.78 | % | |
Class Y | | | 1,000.00 | | | | 1,308.60 | | | | 1,020.53 | | | | 4.92 | | | | 4.31 | | | | 0.86 | % | |
66
Victory Portfolios | | Supplemental Information — continued
April 30, 2021 | |
(Unaudited)
| | Beginning
Account
Value
11/1/20 | | Actual
Ending
Account
Value
4/30/21 | | Hypothetical
Ending
Account
Value
4/30/21 | | Actual
Expenses
Paid During
Period
11/1/20-4/30/21* | | Hypothetical
Expenses
Paid During
Period
11/1/20-4/30/21* | | Annualized
Expense Ratio
During Period
11/1/20-4/30/21 | |
Newbridge Large Cap Growth Fund | |
Class A | | $ | 1,000.00 | | | $ | 1,180.40 | | | $ | 1,018.05 | | | $ | 7.35 | | | $ | 6.80 | | | | 1.36 | % | |
Class C | | | 1,000.00 | | | | 1,182.20 | | | | 1,014.38 | | | | 11.36 | | | | 10.49 | | | | 2.10 | % | |
Class I | | | 1,000.00 | | | | 1,183.80 | | | | 1,020.08 | | | | 5.14 | | | | 4.76 | | | | 0.95 | % | |
Class Y | | | 1,000.00 | | | | 1,182.30 | | | | 1,019.74 | | | | 5.52 | | | | 5.11 | | | | 1.02 | % | |
Special Value Fund | |
Class A | | | 1,000.00 | | | | 1,305.10 | | | | 1,018.70 | | | | 7.03 | | | | 6.16 | | | | 1.23 | % | |
Class C | | | 1,000.00 | | | | 1,299.20 | | | | 1,014.38 | | | | 11.97 | | | | 10.49 | | | | 2.10 | % | |
Class I | | | 1,000.00 | | | | 1,305.90 | | | | 1,019.59 | | | | 6.00 | | | | 5.26 | | | | 1.05 | % | |
Class R | | | 1,000.00 | | | | 1,302.80 | | | | 1,017.11 | | | | 8.85 | | | | 7.75 | | | | 1.55 | % | |
Class Y | | | 1,000.00 | | | | 1,306.20 | | | | 1,019.84 | | | | 5.72 | | | | 5.01 | | | | 1.00 | % | |
Strategic Allocation Fund | |
Class A | | | 1,000.00 | | | | 1,205.00 | | | | 1,022.81 | | | | 2.19 | | | | 2.01 | | | | 0.40 | % | |
Class C | | | 1,000.00 | | | | 1,200.60 | | | | 1,019.09 | | | | 6.27 | | | | 5.76 | | | | 1.15 | % | |
Class I | | | 1,000.00 | | | | 1,207.10 | | | | 1,024.05 | | | | 0.82 | | | | 0.75 | | | | 0.15 | % | |
Class R | | | 1,000.00 | | | | 1,203.50 | | | | 1,021.57 | | | | 3.55 | | | | 3.26 | | | | 0.65 | % | |
INCORE Fund for Income | |
Class A | | | 1,000.00 | | | | 996.00 | | | | 1,020.28 | | | | 4.50 | | | | 4.56 | | | | 0.91 | % | |
Class C | | | 1,000.00 | | | | 993.50 | | | | 1,016.31 | | | | 8.45 | | | | 8.55 | | | | 1.71 | % | |
Class I | | | 1,000.00 | | | | 998.50 | | | | 1,021.62 | | | | 3.17 | | | | 3.21 | | | | 0.64 | % | |
Class R | | | 1,000.00 | | | | 996.00 | | | | 1,020.28 | | | | 4.50 | | | | 4.56 | | | | 0.91 | % | |
Class R6 | | | 1,000.00 | | | | 997.40 | | | | 1,021.82 | | | | 2.97 | | | | 3.01 | | | | 0.60 | % | |
Class Y | | | 1,000.00 | | | | 997.10 | | | | 1,021.37 | | | | 3.42 | | | | 3.46 | | | | 0.69 | % | |
Member Class** | | | 1,000.00 | | | | 995.80 | | | | 1,021.08 | | | | 3.67 | | | | 3.76 | | | | 0.75 | % | |
INCORE Investment Grade Convertible Fund | |
Class A | | | 1,000.00 | | | | 1,191.50 | | | | 1,017.90 | | | | 7.55 | | | | 6.95 | | | | 1.39 | % | |
Class I | | | 1,000.00 | | | | 1,194.20 | | | | 1,020.18 | | | | 5.06 | | | | 4.66 | | | | 0.93 | % | |
Member Class** | | | 1,000.00 | | | | 1,189.60 | | | | 1,019.34 | | | | 5.91 | | | | 5.51 | | | | 1.10 | % | |
* Expenses are equal to the average account value multiplied by the Fund's annualized expense ratio multiplied by 181/365 (the number of days in the most recent fiscal half-year divided by the number of days in the fiscal year).
** Actual Expenses Paid are equal to the average account value multiplied by the Fund's annualized expense ratio multiplied by 179/365 to reflect the stub period from commencement of operations November 3, 2020, through April 30, 2021.
67
Victory Portfolios | | Supplemental Information — continued
April 30, 2021 | |
(Unaudited)
Considerations of the Board in Continuing the Investment Advisory Agreement (the "Agreement")
The Board approved the Agreement on behalf of each of the Funds at a meeting, which was called for that purpose, on December 2, 2020. The Board also considered information relating to the Funds and the Agreement provided throughout the year and, more specifically, at a meeting on October 27, 2020, called for the purpose of reviewing the Agreement. In considering whether to approve the Agreement, the Board requested, and the Adviser provided, information that the Board believed to be reasonably necessary to reach its conclusions.
The Board, including the Independent Trustees, evaluated this information along with other information obtained throughout the year and was advised by legal counsel to the Funds, which also serves as independent legal counsel to the Independent Trustees. In addition, the Independent Trustees considered a past review of their overall process for conducting the annual review of the Funds' advisory arrangements by an independent consultant retained through their counsel.
The Board took into consideration regular reports from the Adviser throughout the COVID-19 pandemic public health crisis concerning how the ongoing pandemic has affected market volatility, investment risk and the implementation and effectiveness of business continuity plans. These reports also had confirmed that the pandemic had no material impact on the Adviser's operations.
The Board considered each Fund's advisory fee, expense ratio and investment performance as significant factors in determining whether the Agreement should be continued. In considering whether the compensation paid to the Adviser was fair and reasonable, the Board also evaluated, among other things, the following factors:
• The requirements of the Funds for the services provided by the Adviser;
• The nature, quality and extent of the services provided and expected to be provided;
• The performance of the Funds as compared to comparable funds;
• The fees payable for the services and whether the fee arrangements provided for economies of scale that would benefit Fund shareholders as the Funds grow;
• Whether the fee would be sufficient to enable the Adviser to attract and retain experienced personnel and continue to provide quality services to the Funds;
• The fees paid by other clients of the Adviser whose accounts are managed in a similar investment style and any differences in the services provided to the other clients compared to those provided to the Funds;
• The total expenses of each Fund;
• Management's commitment to operating the Funds at competitive expense levels;
• The profitability of the Adviser (as reflected by comparing fees earned against an estimate of the Adviser's costs) with respect to the Adviser's relationship with the Funds;
• Research and other service benefits received by the Adviser obtained through payment of client commissions for securities transactions;
• Other indirect benefits received by the Adviser, and its affiliates, including revenues paid to the Adviser, or its affiliates, by the Funds for administration and fund accounting services, and distribution;
• The capabilities and financial condition of the Adviser;
• Current economic and industry trends; and
• The historical relationship between each Fund and the Adviser.
The Board reviewed each Fund's current management fee, comprised of the advisory fee plus the administrative services fee paid to the Adviser, in the context of the Adviser's profitability with respect to each Fund individually. In addition, the Board compared each Fund's gross management fee and total operating expense ratio on a net and gross basis with the median gross management fee and median expense ratio of a universe of comparable mutual funds compiled by an independent consultant and a peer group of funds with similar investment strategies selected by that independent consultant from the universe. The Board reviewed the factors and methodology used by the independent consultant in the selection of each Fund's peer group, including the independent consultant's selection of a broad universe of funds, the more specific universe of comparable funds, and peer
68
Victory Portfolios | | Supplemental Information — continued
April 30, 2021 | |
(Unaudited)
groups of funds with comparable investment strategies and asset levels, among other factors. The Board also reviewed any changes to the independent consultant's methodology as compared to the prior year, including those resulting from the Adviser's input, if any. With respect to certain Funds, the Board also reviewed fees and other information related to the Adviser's management of similarly managed institutional or private accounts, and the differences in the services provided to these other accounts. The Board also noted that the breakpoints in the advisory fee schedule for some of the Funds evidenced one way in which the Adviser has shown a willingness to share in its economies of scale.
The Board also reviewed the compliance and administrative services provided to the Funds by the Adviser and its affiliates, including the Adviser's oversight of the Funds' day-to-day operations and oversight of Fund accounting, assistance in meeting legal and regulatory requirements, and other services necessary for the operation of the Funds and the Trust.
The Board found that the gross annual management fee paid by each Fund was within the range of management fees paid by each Fund's respective peer group. The Board noted that, except for the Strategic Allocation Fund, each Fund's advisory fee structure contained at least one breakpoint. The Board also noted that the Adviser contractually agreed to waive the advisory fee payable by the Strategic Allocation Fund through February 28, 2021. The Board also found that each Fund's Class A net annual expense ratio, taking into account any shareholder servicing or distribution fees, was reasonable as compared with each Fund's respective peer group. The Board considered the Adviser's contractual agreement with each Fund to waive its fees and reimburse expenses of certain classes for a specified period of time, as described in the Fund's prospectus.
The Board reviewed each Fund's performance over one-, three-, five- and ten-year periods (as applicable) against the performance of the Fund's selected peer group and benchmark index. The Board recognized that the performance of the Funds and the peer group funds are net of expenses, while the performance of the benchmark index reflects gross returns.
The Board reviewed various other specific factors with respect to each Fund, as described below. In their deliberations, the Trustees did not rank the importance of any particular information or factor considered and each Trustee may have attributed different weights to various factors.
Victory Diversified Stock Fund:
The Board compared the Fund's Class A performance for the one-, three-, five- and ten-year periods ended June 30, 2020, to that of the median performance of the Fund's peer group and benchmark index for the same periods and considered the fact that the Fund underperformed both the benchmark index and the peer group median for all of the periods reviewed. The Board noted that the Fund's portfolio management team changed in May 2017. The Board discussed the Fund's investment strategy, the Adviser's implementation of the strategy, and related market conditions, together with relevant fee and expense considerations. The Board also discussed the steps that had been or could be taken by the Adviser to enhance performance in the future, and the Board's continued monitoring of the Fund's performance.
Having considered, among other things: (1) the Fund's management fee compared to comparable mutual funds; (2) the Fund's total expense ratio compared to comparable mutual funds; (3) that the Adviser's willingness to limit the expenses of certain classes for a period of time would provide stability to the Fund's expenses for those share classes during that period; and (4) the Fund's performance during the periods reviewed, the Board concluded that the Agreement continued to be in the best interests of the Fund's shareholders.
NewBridge Large Cap Growth Fund:
The Board compared the Fund's Class A performance for the one-, three-, five- and ten-year periods ended June 30, 2020, to that of the median performance of the Fund's peer group and benchmark index for the same periods and considered the fact that the Fund underperformed the benchmark index for all of the periods reviewed, and underperformed the peer group median for all of the periods reviewed, with the exception of the one-year period. The Adviser discussed the Fund's performance in the context of the Fund's investment strategy. The Board discussed the Fund's investment strategy, the Adviser's implementation of the strategy, and related market conditions, together with relevant fee and expense considerations. The Board also discussed the steps
69
Victory Portfolios | | Supplemental Information — continued
April 30, 2021 | |
(Unaudited)
that had been or could be taken by the Adviser to enhance performance in the future, and the Board's continued monitoring of the Fund's performance.
Having considered, among other things: (1) the Fund's management fee compared to comparable mutual funds; (2) the Fund's total expense ratio compared to comparable mutual funds; (3) that the Adviser's willingness to limit the expenses of certain classes for a period of time would provide stability to the Fund's expenses for those share classes during that period; and (4) the Fund's performance during the periods reviewed, the Board concluded that the Agreement continued to be in the best interests of the Fund's shareholders.
Special Value Fund:
The Board compared the Fund's Class A performance for the one-, three-, five- and ten-year periods ended June 30, 2020, to that of the median performance of the Fund's peer group and benchmark index for the same periods and considered the fact that the Fund underperformed both the benchmark index and the peer group median for all of the periods reviewed. The Board noted that the Fund's portfolio management team changed in May 2017. The Board discussed the Fund's investment strategy, the Adviser's implementation of the strategy, and related market conditions, together with relevant fee and expense considerations. The Board also discussed the steps that had been or could be taken by the Adviser to enhance performance in the future, and the Board's continued monitoring of the Fund's performance.
Having considered, among other things: (1) the Fund's management fee compared to comparable mutual funds; (2) the Fund's total expense ratio compared to comparable mutual funds; (3) that one way the Adviser is addressing the Fund's underperformance is through its change of the Fund's portfolio management team; (4) that the Adviser's willingness to limit the expenses of certain classes for a period of time would provide stability to the Fund's expenses for those share classes during that period; and (5) the Fund's performance during the periods reviewed, the Board concluded that the Agreement continued to be in the best interests of the Fund's shareholders.
Strategic Allocation Fund:
The Board compared the Fund's Class A performance for the one-, three-, five- and ten-year periods ended June 30, 2020, to that of the median performance of the Fund's peer group and benchmark index for the same periods and considered the fact that the Fund underperformed the benchmark index for all of the periods reviewed, and outperformed the peer group median for all of the periods reviewed. The Board noted that the Fund changed its investment strategy and its benchmark index in December 2015.
Having considered, among other things: (1) the Fund's management fee compared to comparable mutual funds; (2) the Fund's total expense ratio compared to comparable mutual funds; (3) that the Adviser's willingness to limit the expenses of certain classes for a period of time would provide stability to the Fund's expenses for those share classes during that period; and (4) the Fund's performance during the periods reviewed, the Board concluded that the Agreement continued to be in the best interests of the Fund's shareholders.
INCORE Fund for Income:
The Board compared the Fund's Class A performance for the one-, three-, five- and ten-year periods ended June 30, 2020, to that of the median performance of the Fund's peer group and benchmark index for the same periods and considered the fact that the Fund underperformed the benchmark index for all of the periods reviewed, with the exception of the ten-year period, and outperformed the peer group median for all of the periods reviewed.
Having considered, among other things: (1) the Fund's management fee compared to comparable mutual funds; (2) the Fund's total expense ratio compared to comparable mutual funds; (3) that the Adviser's willingness to limit the expenses of certain classes for a period of time would provide stability to the Fund's expenses for those share classes during that period; and (4) the Fund's performance during the periods reviewed, the Board concluded that the Agreement continued to be in the best interests of the Fund's shareholders.
70
Victory Portfolios | | Supplemental Information — continued
April 30, 2021 | |
(Unaudited)
INCORE Investment Grade Convertible Fund:
The Board compared the Fund's Class A performance for the one-, three-, five- and ten-year periods ended June 30, 2020, to that of the median performance of the Fund's peer group and benchmark index for the same periods and considered the fact that the Fund underperformed the benchmark index for all of the periods reviewed, with the exception of the one-year period, and underperformed the peer group median for all of the periods reviewed. The Board noted that the Fund changed its benchmark index in August 2017. The Board discussed with the Adviser how market conditions affected the Fund during periods of underperformance given the Fund's investment strategy, benchmark index, and fee and expense profile.
Having considered, among other things: (1) the Fund's management fee compared to comparable mutual funds; (2) the Fund's total expense ratio compared to comparable mutual funds; (3) that the Adviser's willingness to limit the expenses of certain classes for a period of time would provide stability to the Fund's expenses for those share classes during that period; and (4) the Fund's performance during the periods reviewed, the Board concluded that the Agreement continued to be in the best interests of the Fund's shareholders.
Conclusion
Based on its review of the information requested and provided, and following extended discussions, the Board determined that the Agreement, on behalf of the Funds discussed above, was consistent with the best interests of each Fund and its shareholders, and the Board unanimously approved the Agreement, on behalf of each Fund, for an additional annual period on the basis of the foregoing review and discussions and the following considerations, among others:
• The fairness and reasonableness of the investment advisory fee payable to the Adviser under the Agreement in light of the investment advisory services provided, the costs of these services, the profitability of the Adviser's relationship with the Fund and the comparability of the fee paid to the fees paid by other investment companies;
• The nature, quality and extent of the investment advisory services provided by the Adviser;
• The Adviser's entrepreneurial commitment to the management of the Funds and the creation of a broad-based family of funds, which could entail a substantial commitment of the Adviser's resources to the successful operation of the Funds;
• The Adviser's representations regarding its staffing and capabilities to manage the Funds, including the retention of personnel with relevant portfolio management experience;
• The Adviser's efforts to enhance investment results by, among other things, developing quality portfolio management teams; and
• The overall high quality of the personnel, operations, financial condition, investment management capabilities, methodologies and performance of the Adviser.
71
Victory Portfolios | | Supplemental Information — continued
April 30, 2021 | |
(Unaudited)
Liquidity Risk Management Program:
The Funds have adopted and implemented a written liquidity risk management program (the "LRMP") as required by Rule 22e-4 under the Investment Company Act of 1940, as amended. The LRMP is reasonably designed to assess and manage each Fund's liquidity risk, taking into consideration each Fund's investment strategy and the liquidity of its portfolio investments during normal and reasonably foreseeable stressed market conditions; its short- and long-term cash flow projections; and its cash holdings and access to other liquidity management tools such as available funding sources including the Victory Funds Complex Interfund Lending Facility and Line of Credit (discussed in the Notes to Financial Statements). The Victory Funds' Board of Trustees approved the appointment of the Funds' investment adviser, Victory Capital Management Inc. ("Victory Capital"), as the administrator of the LRMP.
Victory Capital manages liquidity risks associated with the Funds' investments by monitoring, among other things, cash and cash equivalents, any use of derivatives, the concentration of investments, the appropriateness of each Fund's investment strategy, and by classifying every Fund investment as either highly liquid, moderately liquid, less liquid or illiquid on at least a monthly basis. To assist with the classification of Fund investments, Victory Capital has retained a third-party provider of liquidity evaluation services. This provider determines preliminary liquidity classifications for all portfolio holdings based upon portfolio-level data and certain assumptions provided by Victory Capital. Victory Capital reviews the preliminary liquidity classifications and, when appropriate, considers other information including input from the Funds' portfolio managers (including the portfolio managers employed by any investment sub-advisers) in determining final liquidity classifications.
At a meeting held on February 18, 2021, Victory Capital provided an oral and written report to the Trustees on the operation and effectiveness of the LRMP during the previous year. The report from Victory Capital concluded that the Funds did not experience any significant liquidity challenges during the covered period, and the Funds' LRMP is reasonably designed to assess and manage its liquidity risk. The report also concluded that the LRMP continues to operate adequately and effectively to enable Victory Capital to oversee and manage liquidity risk and ensure each Fund is able to meet redemption requests without significant dilution to the remaining investors' interest in each Fund. During the review period, each Fund's portfolio consisted primarily of highly liquid investments, which are defined as cash and any investments that the Fund reasonably expects to be converted to cash in current market conditions in three business days or less without significantly changing the market value of the investment. Therefore, the Funds have not adopted a highly liquid investment minimum. The Funds' investments were below the limitation on illiquid investments during the review period. Additionally, Victory Capital indicated that no events occurred that would require the filing of Form N-LIQUID and recommended no material changes to the LRMP.
72
Privacy Policy
Protecting the Privacy of Information
The Trust respects your right to privacy. We also know that you expect us to conduct and process your business in an accurate and efficient manner. To do so, we must collect and maintain certain personal information about you. This is the information we collect from you on applications or other forms, and from the transactions you make with us or third parties. It may include your name, address, social security number, account transactions and balances, and information about investment goals and risk tolerance.
We do not disclose any information about you or about former customers to anyone except as permitted or required by law. Specifically, we may disclose the information we collect to companies that perform services on our behalf, such as the transfer agent that processes shareholder accounts and printers and mailers that assist us in the distribution of investor materials. We may also disclose this information to companies that perform marketing services on our behalf. This allows us to continue to offer you Victory investment products and services that meet your investing needs, and to effect transactions that you request or authorize. These companies will use this information only in connection with the services for which we hired them. They are not permitted to use or share this information for any other purpose.
To protect your personal information internally, we permit access only by authorized employees and maintain physical, electronic and procedural safeguards to guard your personal information.*
* You may have received communications regarding information about privacy policies from other financial institutions which gave you the opportunity to "opt-out" of certain information sharing with companies which are not affiliated with that financial institution. The Trust does not share information with other companies for purposes of marketing solicitations for products other than the Trust. Therefore, the Trust does not provide opt-out options to their shareholders.
Victory Funds
P.O. Box 182593
Columbus, Ohio 43218-2593

| Visit our website at: | | Call Victory at: | |
| www.vcm.com | | 800-539-FUND (800-539-3863) | |
| | | | | 800-235-8396 for Member Class | |

April 30, 2021
Semi Annual Report
Victory Sycamore Established Value Fund
Victory Sycamore Small Company Opportunity Fund
www.vcm.com
News, Information And Education 24 Hours A Day, 7 Days A Week
The Victory Funds site gives fund shareholders, prospective shareholders, and investment professionals a convenient way to access fund information, get guidance, and track fund performance anywhere they can access the Internet. The site includes:
• Detailed performance records
• Daily share prices
• The latest fund news
• Investment resources to help you become a better investor
• A section dedicated to investment professionals
Whether you're a potential investor searching for the fund that matches your investment philosophy, a seasoned investor interested in planning tools, or an investment professional, www.vcm.com has what you seek. Visit us anytime. We're always open.
TABLE OF CONTENTS
Investment Objective and Portfolio
Holdings | | | 4 | | |
Schedule of Portfolio Investments | |
Victory Sycamore Established Value Fund | | | 6 | | |
Victory Sycamore Small Company Opportunity Fund | | | 9 | | |
Financial Statements | |
Statements of Assets and Liabilities | | | 13 | | |
Statements of Operations | | | 15 | | |
Statements of Changes in Net Assets | | | 16 | | |
Financial Highlights | | | 20 | | |
Notes to Financial Statements | | | 26 | | |
Supplemental Information | | | 35 | | |
Proxy Voting and Portfolio Holdings Information | | | 35 | | |
Expense Examples | | | 35 | | |
Advisory Contract Approval | | | 37 | | |
Liquidity Risk Management Program | | | 40 | | |
Privacy Policy (inside back cover) | | | |
1
IRA DISTRIBUTION WITHHOLDING DISCLOSURE
We generally must withhold federal income tax at a rate of 10% of the taxable portion of your distribution and, if you live in a state that requires state income tax withholding, at your state's tax rate. However, you may elect not to have withholding apply or to have income tax withheld at a higher rate. Any withholding election that you make will apply to any subsequent distribution unless and until you change or revoke the election. If you wish to make a withholding election, or change or revoke a prior withholding election, call 800-539-3863 and form W-4P (OMB No. 1545-0074 withholding certificate for pension or annuity payments) will be electronically sent.
If you do not have a withholding election in place by the date of a distribution, federal income tax will be withheld from the taxable portion of your distribution at a rate of 10%. If you must pay estimated taxes, you may be subject to estimated tax penalties if your estimated tax payments are not sufficient and sufficient tax is not withheld from your distribution.
For more specific information, please consult your tax adviser.
The Funds are distributed by Victory Capital Services, Inc. Victory Capital Management Inc. is the investment adviser to the Funds and receives fees from the Funds for performing services for the Funds.
This report is not authorized for distribution to prospective investors unless preceded or accompanied by a current prospectus of the Victory Funds.
For additional information about any Victory Fund, including fees, expenses, and risks, view our prospectus online at vcm.com or call 800-539-3863. Read it carefully before you invest or send money.
The information in this report is based on data obtained from recognized services and sources and is believed to be reliable. Any opinions, projections, or recommendations in this report are subject to change without notice and are not intended as individual investment advice. Past investment performance of the Funds, markets or securities mentioned herein should not be considered to be indicative of future results.
• NOT FDIC INSURED • NO BANK GUARANTEE • MAY LOSE VALUE

Call Victory at:
800-539-FUND (800-539-3863)
Visit our website at:
www.vcm.com
2
This page is intentionally left blank.
3
Victory Portfolios
Victory Sycamore Established Value Fund | | April 30, 2021 | |
(Unaudited)
Investment Objective & Portfolio Holdings:
The Fund's investment objective seeks to provide long-term capital growth by investing primarily in common stocks.
Top 10 Holdings*:
April 30, 2021
(% of Net Assets)
Archer-Daniels-Midland Co. | | | 2.5 | % | |
Textron, Inc. | | | 2.2 | % | |
BorgWarner, Inc. | | | 2.2 | % | |
Alleghany Corp. | | | 2.1 | % | |
American Financial Group, Inc. | | | 1.9 | % | |
Everest Re Group Ltd. | | | 1.7 | % | |
W.R. Berkley Corp. | | | 1.7 | % | |
Tyson Foods, Inc., Class A | | | 1.7 | % | |
Avery Dennison Corp. | | | 1.7 | % | |
Yum! Brands, Inc. | | | 1.7 | % | |
Sector Allocation*:
April 30, 2021
(% of Net Assets)

* Does not include futures, money market instruments, and short-term investments purchased with cash collateral from securities loaned.
Percentages are of the net assets of the Fund and may not equal 100%.
Refer to the Schedule of Portfolio Investments for a complete list of securities.
4
Victory Portfolios
Victory Sycamore Small Company Opportunity Fund | | April 30, 2021 | |
(Unaudited)
Investment Objective & Portfolio Holdings:
The Fund's investment objective seeks to provide capital appreciation.
Top 10 Holdings*:
April 30, 2021
(% of Net Assets)
EMCOR Group, Inc. | | | 1.7 | % | |
UMB Financial Corp. | | | 1.7 | % | |
Applied Industrial Technologies, Inc. | | | 1.7 | % | |
South State Corp. | | | 1.5 | % | |
Core-Mark Holding Co., Inc. | | | 1.5 | % | |
Steven Madden Ltd. | | | 1.5 | % | |
Korn Ferry | | | 1.4 | % | |
Sanderson Farms, Inc. | | | 1.4 | % | |
Pinnacle Financial Partners, Inc. | | | 1.4 | % | |
Cabot Corp. | | | 1.4 | % | |
Sector Allocation*:
April 30, 2021
(% of Net Assets)

* Does not include futures, money market instruments, and short-term investments purchased with cash collateral from securities loaned.
Percentages are of the net assets of the Fund and may not equal 100%.
Refer to the Schedule of Portfolio Investments for a complete list of securities.
5
Victory Portfolios
Victory Sycamore Established Value Fund | | Schedule of Portfolio Investments
April 30, 2021 | |
(Amounts in Thousands, Except for Shares) (Unaudited)
Security Description | | Shares | | Value | |
Common Stocks (97.2%) | |
Communication Services (1.6%): | |
The Interpublic Group of Cos., Inc. | | | 8,050,000 | | | $ | 255,588 | | |
Consumer Discretionary (10.9%): | |
Aptiv PLC (a) | | | 1,123,000 | | | | 161,588 | | |
AutoNation, Inc. (a) | | | 1,523,000 | | | | 156,077 | | |
BorgWarner, Inc. | | | 6,875,000 | | | | 333,988 | | |
Darden Restaurants, Inc. | | | 1,060,000 | | | | 155,523 | | |
Las Vegas Sands Corp. (a) | | | 3,680,000 | | | | 225,437 | | |
Ross Stores, Inc. | | | 1,870,000 | | | | 244,858 | | |
VF Corp. | | | 1,750,000 | | | | 153,405 | | |
Yum! Brands, Inc. | | | 2,185,000 | | | | 261,151 | | |
| | | | 1,692,027 | | |
Consumer Staples (7.5%): | |
Archer-Daniels-Midland Co. | | | 6,075,000 | | | | 383,514 | | |
Sysco Corp. | | | 3,025,000 | | | | 256,308 | | |
The Hershey Co. | | | 1,565,700 | | | | 257,245 | | |
Tyson Foods, Inc., Class A | | | 3,415,000 | | | | 264,492 | | |
| | | | 1,161,559 | | |
Energy (4.2%): | |
Cimarex Energy Co. | | | 2,880,000 | | | | 190,656 | | |
Devon Energy Corp. | | | 8,360,000 | | | | 195,457 | | |
Pioneer Natural Resources Co. | | | 204,000 | | | | 31,381 | | |
Valero Energy Corp. | | | 3,100,000 | | | | 229,276 | | |
| | | | 646,770 | | |
Financials (15.0%): | |
Aflac, Inc. | | | 1,600,000 | | | | 85,968 | | |
Alleghany Corp. (a) | | | 475,000 | | | | 322,511 | | |
American Financial Group, Inc. | | | 2,440,000 | | | | 299,778 | | |
Arthur J. Gallagher & Co. | | | 1,600,000 | | | | 231,920 | | |
Everest Re Group Ltd. | | | 960,000 | | | | 265,872 | | |
Old Republic International Corp. | | | 6,650,000 | | | | 163,723 | | |
Prosperity Bancshares, Inc. | | | 2,725,000 | | | | 199,906 | | |
TCF Financial Corp. | | | 3,840,000 | | | | 174,797 | | |
The Bank of New York Mellon Corp. | | | 1,100,000 | | | | 54,868 | | |
W.R. Berkley Corp. | | | 3,325,000 | | | | 265,069 | | |
Zions Bancorp NA | | | 4,620,000 | | | | 257,796 | | |
| | | | 2,322,208 | | |
Health Care (5.4%): | |
Hill-Rom Holdings, Inc. | | | 2,030,000 | | | | 223,747 | | |
Molina Healthcare, Inc. (a) | | | 640,000 | | | | 163,264 | | |
Quest Diagnostics, Inc. | | | 1,780,000 | | | | 234,746 | | |
The Cooper Cos., Inc. | | | 530,000 | | | | 217,772 | | |
| | | | 839,529 | | |
See notes to financial statements.
6
Victory Portfolios
Victory Sycamore Established Value Fund | | Schedule of Portfolio Investments — continued
April 30, 2021 | |
(Amounts in Thousands, Except for Shares) (Unaudited)
Security Description | | Shares | | Value | |
Industrials (21.5%): | |
AGCO Corp. | | | 1,500,000 | | | $ | 218,880 | | |
Alaska Air Group, Inc. (a) | | | 3,700,000 | | | | 255,818 | | |
Hubbell, Inc. | | | 1,175,000 | | | | 225,611 | | |
J.B. Hunt Transport Services, Inc. | | | 1,230,000 | | | | 209,973 | | |
Landstar System, Inc. (b) | | | 1,435,000 | | | | 247,223 | | |
Lincoln Electric Holdings, Inc. | | | 920,000 | | | | 117,806 | | |
ManpowerGroup, Inc. | | | 2,000,000 | | | | 241,780 | | |
Oshkosh Corp. | | | 1,803,600 | | | | 224,423 | | |
Owens Corning, Inc. | | | 2,000,000 | | | | 193,620 | | |
Parker-Hannifin Corp. | | | 668,000 | | | | 209,625 | | |
Republic Services, Inc. | | | 1,200,000 | | | | 127,560 | | |
Textron, Inc. | | | 5,400,000 | | | | 346,896 | | |
The Middleby Corp. (a) | | | 1,070,000 | | | | 194,012 | | |
The Toro Co. | | | 1,415,000 | | | | 162,159 | | |
United Rentals, Inc. (a) | | | 475,000 | | | | 151,976 | | |
Vertiv Holdings Co. | | | 5,285,000 | | | | 119,970 | | |
Xylem, Inc. | | | 677,000 | | | | 74,910 | | |
| | | | 3,322,242 | | |
Information Technology (10.0%): | |
Amphenol Corp., Class A | | | 2,125,000 | | | | 143,098 | | |
DXC Technology Co. (a) | | | 5,520,000 | | | | 181,663 | | |
Flex Ltd. (a) | | | 11,350,000 | | | | 197,490 | | |
Genpact Ltd. | | | 5,000,000 | | | | 237,649 | | |
Hewlett Packard Enterprise Co. | | | 9,000,000 | | | | 144,180 | | |
Leidos Holdings, Inc. | | | 1,625,000 | | | | 164,580 | | |
MAXIMUS, Inc. | | | 2,350,000 | | | | 215,354 | | |
Motorola Solutions, Inc. | | | 828,300 | | | | 155,969 | | |
Skyworks Solutions, Inc. | | | 320,000 | | | | 58,026 | | |
Zebra Technologies Corp. (a) | | | 107,500 | | | | 52,432 | | |
| | | | 1,550,441 | | |
Materials (12.2%): | |
AptarGroup, Inc. | | | 1,005,600 | | | | 151,655 | | |
Avery Dennison Corp. | | | 1,225,000 | | | | 262,358 | | |
Corteva, Inc. | | | 3,175,000 | | | | 154,813 | | |
Eastman Chemical Co. | | | 1,660,000 | | | | 191,547 | | |
International Flavors & Fragrances, Inc. | | | 1,590,000 | | | | 226,050 | | |
Packaging Corp. of America | | | 1,620,000 | | | | 239,193 | | |
Reliance Steel & Aluminum Co. | | | 1,440,000 | | | | 230,846 | | |
Steel Dynamics, Inc. | | | 4,365,000 | | | | 236,671 | | |
Westlake Chemical Corp. | | | 2,145,000 | | | | 201,394 | | |
| | | | 1,894,527 | | |
Real Estate (6.6%): | |
American Homes 4 Rent, Class A (b) | | | 5,500,000 | | | | 203,720 | | |
Americold Realty Trust | | | 3,950,000 | | | | 159,541 | | |
Healthcare Trust of America, Inc., Class A | | | 4,325,000 | | | | 127,025 | | |
Highwoods Properties, Inc. | | | 3,500,000 | | | | 156,765 | | |
See notes to financial statements.
7
Victory Portfolios
Victory Sycamore Established Value Fund | | Schedule of Portfolio Investments — continued
April 30, 2021 | |
(Amounts in Thousands, Except for Shares) (Unaudited)
Security Description | | Shares | | Value | |
Lamar Advertising Co., Class A (b) | | | 2,260,000 | | | $ | 223,830 | | |
National Retail Properties, Inc. | | | 3,215,000 | | | | 149,240 | | |
| | | | 1,020,121 | | |
Utilities (2.3%): | |
Alliant Energy Corp. | | | 3,500,000 | | | | 196,595 | | |
Xcel Energy, Inc. | | | 2,270,000 | | | | 161,851 | | |
| | | | 358,446 | | |
Total Common Stocks (Cost $10,667,527) | | | 15,063,458 | | |
Exchange-Traded Funds (1.0%) | |
iShares Russell Mid-Cap Value ETF (b) | | | 1,305,000 | | | | 149,370 | | |
Total Exchange-Traded Funds (Cost $82,743) | | | 149,370 | | |
Collateral for Securities Loaned^ (0.0%) (c) | |
BlackRock Liquidity Funds TempFund, Institutional Class, 0.04% (d) | | | 132,264 | | | | 132 | | |
Fidelity Investments Money Market Government Portfolio, Institutional
Class, 0.01% (d) | | | 3,536,495 | | | | 3,536 | | |
Goldman Sachs Financial Square Prime Obligations Fund, Institutional
Class, 0.02% (d) | | | 66,006 | | | | 66 | | |
JPMorgan Prime Money Market Fund, Capital Class, 0.09% (d) | | | 526,313 | | | | 526 | | |
Morgan Stanley Institutional Liquidity Prime Portfolio, Institutional
Class, 0.06% (d) | | | 2,366,405 | | | | 2,367 | | |
Total Collateral for Securities Loaned (Cost $6,627) | | | 6,627 | | |
Total Investments (Cost $10,756,897) — 98.2% | | | 15,219,455 | | |
Other assets in excess of liabilities — 1.8% | | | 278,289 | | |
NET ASSETS — 100.00% | | $ | 15,497,744 | | |
^ Purchased with cash collateral from securities on loan.
(a) Non-income producing security.
(b) All or a portion of this security is on loan.
(c) Amount represents less than 0.05% of net assets.
(d) Rate disclosed is the daily yield on April 30, 2021.
ETF — Exchange-Traded Fund
PLC — Public Limited Company | |
See notes to financial statements.
8
Victory Portfolios
Victory Sycamore Small Company Opportunity Fund | | Schedule of Portfolio Investments
April 30, 2021 | |
(Amounts in Thousands, Except for Shares) (Unaudited)
Security Description | | Shares | | Value | |
Common Stocks (97.7%) | |
Aerospace & Defense (0.6%): | |
Hexcel Corp. (a) | | | 780,000 | | | $ | 44,000 | | |
Air Freight & Logistics (0.8%): | |
Forward Air Corp. | | | 616,800 | | | | 54,457 | | |
Airlines (0.3%): | |
Frontier Group Holdings, Inc. (a) | | | 1,175,000 | | | | 24,722 | | |
Building Products (1.3%): | |
UFP Industries, Inc. | | | 1,095,000 | | | | 92,024 | | |
Commercial Services & Supplies (3.3%): | |
ABM Industries, Inc. | | | 1,070,800 | | | | 55,050 | | |
U.S. Ecology, Inc. (a) | | | 1,275,000 | | | | 54,137 | | |
UniFirst Corp. | | | 333,500 | | | | 74,767 | | |
Viad Corp. (a) (b) | | | 1,200,000 | | | | 49,992 | | |
| | | | 233,946 | | |
Communication Services (0.9%): | |
The E.W. Scripps Co., Class A | | | 2,900,000 | | | | 62,698 | | |
Construction & Engineering (3.2%): | |
EMCOR Group, Inc. | | | 1,015,000 | | | | 121,597 | | |
MYR Group, Inc. (a) | | | 450,000 | | | | 35,055 | | |
Valmont Industries, Inc. | | | 294,900 | | | | 72,796 | | |
| | | | 229,448 | | |
Consumer Discretionary (14.5%): | |
Asbury Automotive Group, Inc. (a) | | | 217,000 | | | | 43,098 | | |
Carter's, Inc. (a) (c) | | | 700,000 | | | | 76,153 | | |
Choice Hotels International, Inc. (a) | | | 785,000 | | | | 89,333 | | |
Citi Trends, Inc. (a) (b) | | | 520,000 | | | | 54,392 | | |
Columbia Sportswear Co. | | | 700,500 | | | | 76,362 | | |
Core-Mark Holding Co., Inc. (b) | | | 2,475,000 | | | | 105,336 | | |
Helen of Troy Ltd. (a) | | | 335,000 | | | | 70,756 | | |
Hyatt Hotels Corp., Class A (a) (c) | | | 650,000 | | | | 53,515 | | |
LCI Industries | | | 304,200 | | | | 44,565 | | |
Mattel, Inc. (a) | | | 3,350,000 | | | | 71,891 | | |
Murphy USA, Inc. | | | 275,000 | | | | 38,335 | | |
Penske Automotive Group, Inc. | | | 530,000 | | | | 46,476 | | |
Purple Innovation, Inc. (a) | | | 1,090,000 | | | | 37,147 | | |
Sonic Automotive, Inc., Class A | | | 972,000 | | | | 47,958 | | |
Steven Madden Ltd. | | | 2,575,000 | | | | 104,724 | | |
Visteon Corp. (a) | | | 543,000 | | | | 66,143 | | |
| | | | 1,026,184 | | |
Consumer Staples (4.7%): | |
Edgewell Personal Care Co. | | | 1,275,400 | | | | 48,720 | | |
Ingredion, Inc. | | | 666,600 | | | | 62,267 | | |
Lancaster Colony Corp. | | | 159,500 | | | | 29,461 | | |
See notes to financial statements.
9
Victory Portfolios
Victory Sycamore Small Company Opportunity Fund | | Schedule of Portfolio Investments — continued
April 30, 2021 | |
(Amounts in Thousands, Except for Shares) (Unaudited)
Security Description | | Shares | | Value | |
Performance Food Group Co. (a) | | | 1,581,000 | | | $ | 92,805 | | |
Sanderson Farms, Inc. | | | 600,000 | | | | 98,718 | | |
| | | | 331,971 | | |
Electrical Equipment (1.2%): | |
Encore Wire Corp. (b) | | | 1,140,000 | | | | 85,135 | | |
Energy (2.1%): | |
Delek U.S. Holdings, Inc. | | | 2,359,800 | | | | 55,998 | | |
Helix Energy Solutions Group, Inc. (a) | | | 6,040,300 | | | | 25,913 | | |
PDC Energy, Inc. (a) | | | 1,810,000 | | | | 66,083 | | |
| | | | 147,994 | | |
Financials (18.1%): | |
American Financial Group, Inc. | | | 260,000 | | | | 31,944 | | |
AMERISAFE, Inc. | | | 945,000 | | | | 58,666 | | |
Bank of Hawaii Corp. | | | 955,000 | | | | 86,800 | | |
Columbia Banking System, Inc. | | | 1,510,000 | | | | 65,730 | | |
Eagle Bancorp, Inc. | | | 910,000 | | | | 48,603 | | |
First American Financial Corp. | | | 758,200 | | | | 48,904 | | |
Independent Bank Corp. | | | 1,157,700 | | | | 94,816 | | |
Kemper Corp. | | | 755,692 | | | | 58,989 | | |
Lakeland Financial Corp. | | | 981,000 | | | | 63,991 | | |
Pinnacle Financial Partners, Inc. | | | 1,105,000 | | | | 96,842 | | |
RenaissanceRe Holdings Ltd. | | | 516,900 | | | | 87,258 | | |
Renasant Corp. | | | 2,200,000 | | | | 92,686 | | |
Selective Insurance Group, Inc. | | | 936,200 | | | | 71,282 | | |
South State Corp. | | | 1,283,300 | | | | 108,208 | | |
State Auto Financial Corp. | | | 1,577,277 | | | | 29,779 | | |
Stewart Information Services Corp. | | | 1,085,100 | | | | 63,641 | | |
UMB Financial Corp. | | | 1,240,000 | | | | 120,316 | | |
White Mountains Insurance Group Ltd. | | | 44,000 | | | | 51,279 | | |
| | | | 1,279,734 | | |
Health Care (6.1%): | |
AngioDynamics, Inc. (a) (b) | | | 2,140,000 | | | | 52,002 | | |
Avanos Medical, Inc. (a) | | | 1,198,000 | | | | 51,766 | | |
Cutera, Inc. (a) (c) | | | 659,800 | | | | 19,814 | | |
Hanger, Inc. (a) (b) | | | 2,240,800 | | | | 55,863 | | |
ICU Medical, Inc. (a) | | | 340,000 | | | | 70,811 | | |
Magellan Health, Inc. (a) | | | 546,600 | | | | 51,490 | | |
Natus Medical, Inc. (a) | | | 1,580,000 | | | | 40,369 | | |
NuVasive, Inc. (a) | | | 655,000 | | | | 46,800 | | |
Patterson Cos., Inc. | | | 1,328,900 | | | | 42,711 | | |
| | | | 431,626 | | |
Industrial Conglomerates (1.2%): | |
Carlisle Cos., Inc. | | | 425,000 | | | | 81,451 | | |
Information Technology (9.4%): | |
ADTRAN, Inc. (b) | | | 2,624,000 | | | | 44,844 | | |
Advanced Energy Industries, Inc. | | | 305,600 | | | | 33,711 | | |
Avnet, Inc. | | | 1,300,000 | | | | 57,097 | | |
See notes to financial statements.
10
Victory Portfolios
Victory Sycamore Small Company Opportunity Fund | | Schedule of Portfolio Investments — continued
April 30, 2021 | |
(Amounts in Thousands, Except for Shares) (Unaudited)
Security Description | | Shares | | Value | |
Cognyte Software Ltd. (a) | | | 1,769,200 | | | $ | 46,229 | | |
Fabrinet (a) | | | 581,000 | | | | 49,745 | | |
Littelfuse, Inc. | | | 131,200 | | | | 34,799 | | |
ManTech International Corp., Class A | | | 490,000 | | | | 41,822 | | |
MAXIMUS, Inc. | | | 475,000 | | | | 43,529 | | |
NETGEAR, Inc. (a) (b) | | | 1,690,000 | | | | 62,885 | | |
Plexus Corp. (a) | | | 751,000 | | | | 69,423 | | |
ScanSource, Inc. (a) (b) | | | 1,562,600 | | | | 47,237 | | |
Sykes Enterprises, Inc. (a) | | | 1,825,000 | | | | 79,989 | | |
Verint Systems, Inc. (a) (c) | | | 1,100,000 | | | | 53,427 | | |
| | | | 664,737 | | |
Machinery (9.1%): | |
Alamo Group, Inc. | | | 450,000 | | | | 70,762 | | |
Altra Industrial Motion Corp. | | | 870,400 | | | | 51,362 | | |
Astec Industries, Inc. | | | 790,800 | | | | 59,318 | | |
Columbus McKinnon Corp. | | | 831,200 | | | | 41,153 | | |
Crane Co. | | | 970,400 | | | | 91,275 | | |
Hillenbrand, Inc. | | | 1,775,000 | | | | 87,134 | | |
Kennametal, Inc. | | | 1,480,000 | | | | 59,437 | | |
Mueller Industries, Inc. | | | 1,350,000 | | | | 60,575 | | |
The Manitowoc Co., Inc. (a) | | | 1,000,000 | | | | 22,880 | | |
TriMas Corp. (a) | | | 1,543,150 | | | | 49,134 | | |
Watts Water Technologies, Inc., Class A | | | 449,800 | | | | 56,023 | | |
| | | | 649,053 | | |
Materials (7.2%): | |
Avient Corp. | | | 1,320,000 | | | | 67,016 | | |
Cabot Corp. | | | 1,759,700 | | | | 96,573 | | |
Kaiser Aluminum Corp. | | | 570,000 | | | | 68,668 | | |
Minerals Technologies, Inc. | | | 871,300 | | | | 68,083 | | |
Silgan Holdings, Inc. | | | 1,499,200 | | | | 63,221 | | |
Sonoco Products Co. | | | 1,395,000 | | | | 91,317 | | |
Worthington Industries, Inc. | | | 801,100 | | | | 52,280 | | |
| | | | 507,158 | | |
Professional Services (2.3%): | |
ICF International, Inc. | | | 685,000 | | | | 62,376 | | |
Korn Ferry | | | 1,500,000 | | | | 101,835 | | |
| | | | 164,211 | | |
Real Estate (5.3%): | |
Apple Hospitality REIT, Inc. | | | 3,869,800 | | | | 61,375 | | |
Corporate Office Properties Trust | | | 2,546,400 | | | | 71,401 | | |
First Industrial Realty Trust, Inc. | | | 1,385,000 | | | | 68,931 | | |
Healthcare Realty Trust, Inc. | | | 785,000 | | | | 25,246 | | |
Rayonier, Inc. | | | 1,975,000 | | | | 71,653 | | |
Sunstone Hotel Investors, Inc. (a) | | | 4,425,000 | | | | 58,233 | | |
Washington Real Estate Investment Trust | | | 903,900 | | | | 20,989 | | |
| | | | 377,828 | | |
See notes to financial statements.
11
Victory Portfolios
Victory Sycamore Small Company Opportunity Fund | | Schedule of Portfolio Investments — continued
April 30, 2021 | |
(Amounts in Thousands, Except for Shares) (Unaudited)
Security Description | | Shares | | Value | |
Road & Rail (2.0%): | |
Marten Transport Ltd. | | | 3,593,500 | | | $ | 60,084 | | |
Saia, Inc. (a) | | | 100,000 | | | | 23,450 | | |
Werner Enterprises, Inc. | | | 1,180,000 | | | | 54,551 | | |
| | | | 138,085 | | |
Trading Companies & Distributors (1.7%): | |
Applied Industrial Technologies, Inc. | | | 1,240,000 | | | | 118,618 | | |
Utilities (2.4%): | |
ALLETE, Inc. | | | 645,000 | | | | 45,383 | | |
MGE Energy, Inc. | | | 489,700 | | | | 36,634 | | |
NorthWestern Corp. | | | 646,550 | | | | 43,985 | | |
ONE Gas, Inc. | | | 560,000 | | | | 45,063 | | |
| | | | 171,065 | | |
Total Common Stocks (Cost $4,814,170) | | | 6,916,145 | | |
Exchange-Traded Funds (1.1%) | |
iShares Russell 2000 Value ETF | | | 465,000 | | | | 75,507 | | |
Total Exchange-Traded Funds (Cost $53,217) | | | 75,507 | | |
Collateral for Securities Loaned^ (0.2%) | |
BlackRock Liquidity Funds TempFund, Institutional Class, 0.04% (d) | | | 260,108 | | | | 260 | | |
Fidelity Investments Money Market Government Portfolio, Institutional
Class, 0.01% (d) | | | 6,954,821 | | | | 6,955 | | |
Goldman Sachs Financial Square Prime Obligations Fund, Institutional
Class, 0.02% (d) | | | 129,807 | | | | 130 | | |
JPMorgan Prime Money Market Fund, Capital Class, 0.09% (d) | | | 1,035,039 | | | | 1,035 | | |
Morgan Stanley Institutional Liquidity Prime Portfolio, Institutional
Class, 0.06% (d) | | | 4,653,739 | | | | 4,654 | | |
Total Collateral for Securities Loaned (Cost $13,034) | | | 13,034 | | |
Total Investments (Cost $4,880,421) — 99.0% | | | 7,004,686 | | |
Other assets in excess of liabilities — 1.0% | | | 69,009 | | |
NET ASSETS — 100.00% | | $ | 7,073,695 | | |
^ Purchased with cash collateral from securities on loan.
(a) Non-income producing security.
(b) Affiliated security (See Note 8).
(c) All or a portion of this security is on loan.
(d) Rate disclosed is the daily yield on April 30, 2021.
ETF — Exchange-Traded Fund
REIT — Real Estate Investment Trust
See notes to financial statements.
12
Victory Portfolios | | Statements of Assets and Liabilities
April 30, 2021 | |
(Amounts in Thousands, Except Per Share Amounts) (Unaudited)
| | | Victory
Sycamore
Established
Value Fund | | Victory
Sycamore
Small Company
Opportunity
Fund | |
Assets: | |
Affiliated investments, at value (Cost $- and $410,794) | | $ | — | | | $ | 557,686 | | |
Unaffiliated investments, at value (Cost $10,756,897 and
$4,469,627) | | | 15,219,455 | (a) | | | 6,447,000 | (b) | |
Cash | | | 283,085 | | | | 77,619 | | |
Receivables: | |
Interest and dividends | | | 4,787 | | | | 1,366 | | |
Capital shares issued | | | 20,105 | | | | 6,865 | | |
Investments sold | | | 48,846 | | | | 35,819 | | |
Prepaid expenses | | | 239 | | | | 113 | | |
Total Assets | | | 15,576,517 | | | | 7,126,468 | | |
Liabilities: | |
Payables: | |
Collateral received on loaned securities | | | 6,627 | | | | 13,034 | | |
Investments purchased | | | 49,056 | | | | 27,012 | | |
Capital shares redeemed | | | 15,321 | | | | 7,355 | | |
Accrued expenses and other payables: | |
Investment advisory fees | | | 5,594 | | | | 4,363 | | |
Administration fees | | | 755 | | | | 352 | | |
Custodian fees | | | 80 | | | | 37 | | |
Transfer agent fees | | | 496 | | | | 235 | | |
Compliance fees | | | 8 | | | | 4 | | |
Trustees' fees | | | 19 | | | | 11 | | |
| 12b-1 fees | | | 406 | | | | 102 | | |
Other accrued expenses | | | 411 | | | | 268 | | |
Total Liabilities | | | 78,773 | | | | 52,773 | | |
Net Assets: | |
Capital | | | 10,447,621 | | | | 4,652,117 | | |
Total accumulated earnings/(loss) | | | 5,050,123 | | | | 2,421,578 | | |
Net Assets | | $ | 15,497,744 | | | $ | 7,073,695 | | |
Net Assets | |
Class A | | $ | 1,859,089 | | | $ | 452,168 | | |
Class C | | | 71,177 | | | | — | | |
Class I | | | 4,897,400 | | | | 3,952,233 | | |
Class R | | | 929,228 | | | | 268,171 | | |
Class R6 | | | 6,857,795 | | | | 2,367,002 | | |
Class Y | | | 883,055 | | | | 34,121 | | |
Total | | $ | 15,497,744 | | | $ | 7,073,695 | | |
Shares (unlimited number of shares authorized with a
par value of $0.001 per share): | |
Class A | | | 37,085 | | | | 8,063 | | |
Class C | | | 1,457 | | | | — | | |
Class I | | | 97,608 | | | | 69,641 | | |
Class R | | | 18,828 | | | | 5,157 | | |
Class R6 | | | 136,619 | | | | 41,772 | | |
Class Y | | | 17,602 | | | | 606 | | |
Total | | | 309,199 | | | | 125,239 | | |
(continues on next page)
See notes to financial statements.
13
Victory Portfolios | | Statements of Assets and Liabilities
April 30, 2021 | |
(Amounts in Thousands, Except Per Share Amounts) (Unaudited) (continued)
| | | Victory
Sycamore
Established
Value Fund | | Victory
Sycamore
Small Company
Opportunity
Fund | |
Net asset value, offering (except Class A)
and redemption price per share: (c) | |
Class A | | $ | 50.13 | | | $ | 56.08 | | |
Class C (d) | | | 48.84 | | | | — | | |
Class I | | | 50.17 | | | | 56.75 | | |
Class R | | | 49.35 | | | | 52.00 | | |
Class R6 | | | 50.20 | | | | 56.66 | | |
Class Y | | | 50.17 | | | | 56.34 | | |
Maximum Sales Charge — Class A | | | 5.75 | % | | | 5.75 | % | |
Maximum offering price
(100%/(100%-maximum sales charge) of net asset value
adjusted to the nearest cent) per share — Class A | | $ | 53.19 | | | $ | 59.50 | | |
(a) Includes $4,502 of securities on loan.
(b) Includes $12,553 of securities on loan.
(c) Per share amount may not recalculate due to rounding of net assets and/or shares outstanding.
(d) Redemption price per share varies by the length of time shares are held.
See notes to financial statements.
14
Victory Portfolios | | Statements of Operations
For the Six Months Ended April 30, 2021 | |
(Amounts in Thousands, Except Per Share Amounts) (Unaudited)
| | | Victory
Sycamore
Established
Value Fund | | Victory
Sycamore
Small Company
Opportunity
Fund | |
Investment Income: | | | |
Dividends from unaffiliated investments | | $ | 127,902 | | | $ | 43,109 | | |
Dividends from affiliated investments | | | — | | | | 1,169 | | |
Interest from unaffiliated investments | | | 26 | | | | 8 | | |
Interfund lending | | | 10 | | | | — | | |
Securities lending (net of fees) | | | 618 | | | | 20 | | |
Total Income | | | 128,556 | | | | 44,306 | | |
Expenses: | | | |
Investment advisory fees | | | 29,553 | | | | 23,627 | | |
Administration fees | | | 3,750 | | | | 1,789 | | |
Sub-Administration fees | | | 8 | | | | 8 | | |
| 12b-1 fees — Class A | | | 2,055 | | | | 513 | | |
| 12b-1 fees — Class C | | | 321 | | | | — | | |
| 12b-1 fees — Class R | | | 1,985 | | | | 612 | | |
Custodian fees | | | 259 | | | | 123 | | |
Transfer agent fees — Class A | | | 914 | | | | 293 | | |
Transfer agent fees — Class C | | | 35 | | | | — | | |
Transfer agent fees — Class I | | | 1,085 | | | | 899 | | |
Transfer agent fees — Class R | | | 286 | | | | 86 | | |
Transfer agent fees — Class R6 | | | 75 | | | | 18 | | |
Transfer agent fees — Class Y | | | 238 | | | | 18 | | |
Trustees' fees | | | 438 | | | | 210 | | |
Compliance fees | | | 50 | | | | 24 | | |
Legal and audit fees | | | 270 | | | | 132 | | |
State registration and filing fees | | | 136 | | | | 75 | | |
Other expenses | | | 596 | | | | 378 | | |
Total Expenses | | | 42,054 | | | | 28,805 | | |
Net Investment Income (Loss) | | | 86,502 | | | | 15,501 | | |
Realized/Unrealized Gains (Losses) from Investments: | | | |
Net realized gains (losses) from affiliated investment securities | | | — | | | | (2,835 | ) | |
Net realized gains (losses) from unaffiliated investment securities | | | 616,259 | | | | 313,153 | | |
Net change in unrealized appreciation/depreciation on
affiliated investment securities | | | — | | | | 232,717 | | |
Net change in unrealized appreciation/depreciation on
unaffiliated investment securities | | | 4,199,712 | | | | 1,794,878 | | |
Net realized/unrealized gains (losses) on investments | | | 4,815,971 | | | | 2,337,913 | | |
Change in net assets resulting from operations | | $ | 4,902,473 | | | $ | 2,353,414 | | |
See notes to financial statements.
15
Victory Portfolios | | Statements of Change in Net Assets | |
(Amounts in Thousands)
| | | Victory Sycamore
Established
Value Fund | | Victory Sycamore
Small Company
Opportunity Fund | |
| | | Six
Months
Ended
April 30,
2021
(unaudited) | | Year
Ended
October 31,
2020 | | Six
Months
Ended
April 30,
2021
(unaudited) | | Year
Ended
October 31,
2020 | |
From Investment Activities: | |
Operations: | |
Net investment income (loss) | | $ | 86,502 | | | $ | 168,869 | | | $ | 15,501 | | | $ | 35,573 | | |
Net realized gains (losses) from
investments | | | 616,259 | | | | 591,933 | | | | 310,318 | | | | 31,757 | | |
Net change in unrealized appreciation/
depreciation on investments | | | 4,199,712 | | | | (1,316,124 | ) | | | 2,027,595 | | | | (680,021 | ) | |
Change in net assets resulting from
operations | | | 4,902,473 | | | | (555,322 | ) | | | 2,353,414 | | | | (612,691 | ) | |
Distributions to Shareholders: | |
Class A | | | (72,132 | ) | | | (103,792 | ) | | | (2,698 | ) | | | (22,491 | ) | |
Class C | | | (2,693 | ) | | | (4,182 | ) | | | — | | | | — | | |
Class I | | | (179,773 | ) | | | (218,171 | ) | | | (30,516 | ) | | | (243,950 | ) | |
Class R | | | (34,553 | ) | | | (46,556 | ) | | | (1,442 | ) | | | (14,387 | ) | |
Class R6 | | | (252,127 | ) | | | (308,392 | ) | | | (20,349 | ) | | | (15,900 | ) | |
Class Y | | | (31,995 | ) | | | (42,591 | ) | | | (228 | ) | | | (1,835 | ) | |
Change in net assets resulting from
distributions to shareholders | | | (573,273 | ) | | | (723,684 | ) | | | (55,233 | ) | | | (298,563 | ) | |
Change in net assets resulting from capital
transactions | | | 694,965 | | | | 124,104 | | | | (69,945 | ) | | | 133,993 | | |
Change in net assets | | | 5,024,165 | | | | (1,154,902 | ) | | | 2,228,236 | | | | (777,261 | ) | |
Net Assets: | |
Beginning of period | | | 10,473,579 | | | | 11,628,481 | | | | 4,845,459 | | | | 5,622,720 | | |
End of period | | $ | 15,497,744 | | | $ | 10,473,579 | | | $ | 7,073,695 | | | $ | 4,845,459 | | |
(continues on next page)
See notes to financial statements.
16
Victory Portfolios | | Statements of Change in Net Assets | |
(Amounts in Thousands) (continued)
| | | Victory Sycamore
Established
Value Fund | | Victory Sycamore
Small Company
Opportunity Fund | |
| | | Six
Months
Ended
April 30,
2021
(unaudited) | | Year
Ended
October 31,
2020 | | Six
Months
Ended
April 30,
2021
(unaudited) | | Year
Ended
October 31,
2020 | |
Capital Transactions: | |
Class A | |
Proceeds from shares issued | | $ | 163,694 | | | $ | 323,380 | | | $ | 55,384 | | | $ | 93,340 | | |
Distributions reinvested | | | 60,859 | | | | 87,261 | | | | 2,255 | | | | 18,989 | | |
Cost of shares redeemed | | | (293,118 | ) | | | (638,669 | ) | | | (95,143 | ) | | | (155,298 | ) | |
Total Class A | | $ | (68,565 | ) | | $ | (228,028 | ) | | $ | (37,504 | ) | | $ | (42,969 | ) | |
Class C | |
Proceeds from shares issued | | $ | 1,058 | | | $ | 1,281 | | | $ | — | | | $ | — | | |
Distributions reinvested | | | 2,607 | | | | 3,900 | | | | — | | | | — | | |
Cost of shares redeemed | | | (8,060 | ) | | | (20,288 | ) | | | — | | | | — | | |
Total Class C | | $ | (4,395 | ) | | $ | (15,107 | ) | | $ | — | | | $ | — | | |
Class I | |
Proceeds from shares issued | | $ | 656,377 | | | $ | 1,126,708 | | | $ | 450,856 | | | $ | 1,115,785 | | |
Distributions reinvested | | | 154,186 | | | | 186,353 | | | | 28,267 | | | | 227,267 | | |
Cost of shares redeemed | | | (595,613 | ) | | | (1,094,095 | ) | | | (468,650 | ) | | | (2,509,736 | ) | |
Total Class I | | $ | 214,950 | | | $ | 218,966 | | | $ | 10,473 | | | $ | (1,166,684 | ) | |
Class R | |
Proceeds from shares issued | | $ | 111,687 | | | $ | 102,944 | | | $ | 19,782 | | | $ | 43,209 | | |
Distributions reinvested | | | 34,077 | | | | 45,322 | | | | 1,426 | | | | 13,958 | | |
Cost of shares redeemed | | | (110,103 | ) | | | (246,422 | ) | | | (45,433 | ) | | | (89,785 | ) | |
Total Class R | | $ | 35,661 | | | $ | (98,156 | ) | | $ | (24,225 | ) | | $ | (32,618 | ) | |
Class R6 | |
Proceeds from shares issued | | $ | 1,028,607 | | | $ | 1,467,343 | | | $ | 319,079 | | | $ | 1,529,209 | | |
Distributions reinvested | | | 247,822 | | | | 301,095 | | | | 19,320 | | | | 15,321 | | |
Cost of shares redeemed | | | (798,344 | ) | | | (1,544,569 | ) | | | (365,739 | ) | | | (158,934 | ) | |
Total Class R6 | | $ | 478,085 | | | $ | 223,869 | | | $ | (27,340 | ) | | $ | 1,385,596 | | |
Class Y | |
Proceeds from shares issued | | $ | 182,632 | | | $ | 286,306 | | | $ | 13,393 | | | $ | 10,492 | | |
Distributions reinvested | | | 30,428 | | | | 38,649 | | | | 207 | | | | 831 | | |
Cost of shares redeemed | | | (173,831 | ) | | | (302,395 | ) | | | (4,949 | ) | | | (20,655 | ) | |
Total Class Y | | $ | 39,229 | | | $ | 22,560 | | | $ | 8,651 | | | $ | (9,332 | ) | |
Change in net assets resulting from
capital transactions | | $ | 694,965 | | | $ | 124,104 | | | $ | (69,945 | ) | | $ | 133,993 | | |
(continues on next page)
See notes to financial statements.
17
Victory Portfolios | | Statements of Change in Net Assets | |
(Amounts in Thousands) (continued)
| | | Victory Sycamore
Established
Value Fund | | Victory Sycamore
Small Company
Opportunity Fund | |
| | | Six
Months
Ended
April 30,
2021
(unaudited) | | Year
Ended
October 31,
2020 | | Six
Months
Ended
April 30,
2021
(unaudited) | | Year
Ended
October 31,
2020 | |
Share Transactions: | |
Class A | |
Issued | | | 3,686 | | | | 9,415 | | | | 1,102 | | | | 2,491 | | |
Reinvested | | | 1,493 | | | | 2,275 | | | | 49 | | | | 420 | | |
Redeemed | | | (6,712 | ) | | | (18,025 | ) | | | (1,954 | ) | | | (4,039 | ) | |
Total Class A | | | (1,533 | ) | | | (6,335 | ) | | | (803 | ) | | | (1,128 | ) | |
Class C | |
Issued | | | 24 | | | | 37 | | | | — | | | | — | | |
Reinvested | | | 66 | | | | 102 | | | | — | | | | — | | |
Redeemed | | | (189 | ) | | | (602 | ) | | | — | | | | — | | |
Total Class C | | | (99 | ) | | | (463 | ) | | | — | | | | — | | |
Class I | |
Issued | | | 15,029 | | | | 32,071 | | | | 8,905 | | | | 29,815 | | |
Reinvested | | | 3,771 | | | | 4,896 | | | | 605 | | | | 4,969 | | |
Redeemed | | | (13,627 | ) | | | (31,823 | ) | | | (9,319 | ) | | | (65,620 | ) | |
Total Class I | | | 5,173 | | | | 5,144 | | | | 191 | | | | (30,836 | ) | |
Class R | |
Issued | | | 2,592 | | | | 3,001 | | | | 419 | | | | 1,236 | | |
Reinvested | | | 850 | | | | 1,194 | | | | 33 | | | | 333 | | |
Redeemed | | | (2,589 | ) | | | (7,057 | ) | | | (1,001 | ) | | | (2,499 | ) | |
Total Class R | | | 853 | | | | (2,862 | ) | | | (549 | ) | | | (930 | ) | |
Class R6 | |
Issued | | | 23,175 | | | | 42,781 | | | | 6,211 | | | | 40,067 | | |
Reinvested | | | 6,057 | | | | 7,945 | | | | 414 | | | | 335 | | |
Redeemed | | | (18,342 | ) | | | (43,689 | ) | | | (7,229 | ) | | | (4,097 | ) | |
Total Class R6 | | | 10,890 | | | | 7,037 | | | | (604 | ) | | | 36,305 | | |
Class Y | |
Issued | | | 4,078 | | | | 8,117 | | | | 277 | | | | 256 | | |
Reinvested | | | 744 | | | | 1,018 | | | | 4 | | | | 18 | | |
Redeemed | | | (4,002 | ) | | | (8,786 | ) | | | (96 | ) | | | (536 | ) | |
Total Class Y | | | 820 | | | | 349 | | | | 185 | | | | (262 | ) | |
Change in Shares | | | 16,104 | | | | 2,870 | | | | (1,580 | ) | | | 3,149 | | |
See notes to financial statements.
18
This page is intentionally left blank.
19
Victory Portfolios | | Financial Highlights | |
For a Share Outstanding Throughout Each Period
| | | | Investment Activities | | Distributions to
Shareholders From | |
| | | Net Asset
Value,
Beginning of
Period | | Net
Investment
Income
(Loss)(a) | | Net Realized
and Unrealized
Gains (Losses)
on Investments | | Total from
Investment
Activities | | Net
Investment
Income | | Net Realized
Gains from
Investments | |
Victory Sycamore Established Value Fund | |
Class A | |
Six Months Ended
4/30/21 (unaudited) | | $ | 35.75 | | | | 0.24 | | | | 16.05 | | | | 16.29 | | | | (0.24 | ) | | | (1.67 | ) | |
Year Ended 10/31/20 | | $ | 40.09 | | | | 0.48 | | | | (2.44 | ) | | | (1.96 | ) | | | (0.48 | ) | | | (1.90 | ) | |
Year Ended 10/31/19 | | $ | 39.52 | | | | 0.40 | | | | 3.61 | | | | 4.01 | | | | (0.39 | ) | | | (3.05 | ) | |
Year Ended 10/31/18 | | $ | 40.01 | | | | 0.35 | | | | 0.48 | | | | 0.83 | | | | (0.33 | ) | | | (0.99 | ) | |
Year Ended 10/31/17 | | $ | 33.82 | | | | 0.22 | | | | 6.53 | | | | 6.75 | | | | (0.21 | ) | | | (0.35 | ) | |
Year Ended 10/31/16 | | $ | 35.55 | | | | 0.23 | | | | 1.50 | | | | 1.73 | | | | (0.22 | ) | | | (3.24 | ) | |
Class C | |
Six Months Ended
4/30/21 (unaudited) | | $ | 34.89 | | | | 0.07 | | | | 15.65 | | | | 15.72 | | | | (0.10 | ) | | | (1.67 | ) | |
Year Ended 10/31/20 | | $ | 39.16 | | | | 0.20 | | | | (2.35 | ) | | | (2.15 | ) | | | (0.22 | ) | | | (1.90 | ) | |
Year Ended 10/31/19 | | $ | 38.69 | | | | 0.11 | | | | 3.53 | | | | 3.64 | | | | (0.12 | ) | | | (3.05 | ) | |
Year Ended 10/31/18 | | $ | 39.22 | | | | 0.03 | | | | 0.46 | | | | 0.49 | | | | (0.03 | ) | | | (0.99 | ) | |
Year Ended 10/31/17 | | $ | 33.26 | | | | (0.09 | ) | | | 6.44 | | | | 6.35 | | | | (0.04 | ) | | | (0.35 | ) | |
3/1/16(e) through
10/31/16 | | $ | 29.08 | | | | (0.09 | ) | | | 4.37 | | | | 4.28 | | | | (0.10 | ) | | | — | | |
Class I | |
Six Months Ended
4/30/21 (unaudited) | | $ | 35.77 | | | | 0.30 | | | | 16.07 | | | | 16.37 | | | | (0.30 | ) | | | (1.67 | ) | |
Year Ended 10/31/20 | | $ | 40.12 | | | | 0.59 | | | | (2.45 | ) | | | (1.86 | ) | | | (0.59 | ) | | | (1.90 | ) | |
Year Ended 10/31/19 | | $ | 39.55 | | | | 0.52 | | | | 3.62 | | | | 4.14 | | | | (0.52 | ) | | | (3.05 | ) | |
Year Ended 10/31/18 | | $ | 40.04 | | | | 0.47 | | | | 0.48 | | | | 0.95 | | | | (0.45 | ) | | | (0.99 | ) | |
Year Ended 10/31/17 | | $ | 33.83 | | | | 0.32 | | | | 6.56 | | | | 6.88 | | | | (0.32 | ) | | | (0.35 | ) | |
Year Ended 10/31/16 | | $ | 35.56 | | | | 0.30 | | | | 1.52 | | | | 1.82 | | | | (0.31 | ) | | | (3.24 | ) | �� |
Class R | |
Six Months Ended
4/30/21 (unaudited) | | $ | 35.23 | | | | 0.19 | | | | 15.81 | | | | 16.00 | | | | (0.21 | ) | | | (1.67 | ) | |
Year Ended 10/31/20 | | $ | 39.54 | | | | 0.40 | | | | (2.40 | ) | | | (2.00 | ) | | | (0.41 | ) | | | (1.90 | ) | |
Year Ended 10/31/19 | | $ | 39.03 | | | | 0.31 | | | | 3.57 | | | | 3.88 | | | | (0.32 | ) | | | (3.05 | ) | |
Year Ended 10/31/18 | | $ | 39.54 | | | | 0.26 | | | | 0.48 | | | | 0.74 | | | | (0.26 | ) | | | (0.99 | ) | |
Year Ended 10/31/17 | | $ | 33.43 | | | | 0.14 | | | | 6.46 | | | | 6.60 | | | | (0.14 | ) | | | (0.35 | ) | |
Year Ended 10/31/16 | | $ | 35.18 | | | | 0.17 | | | | 1.48 | | | | 1.65 | | | | (0.16 | ) | | | (3.24 | ) | |
(a) Per share net investment income (loss) has been calculated using the average daily shares method.
(b) Not annualized for periods less than one year.
(c) Annualized for periods less than one year.
(d) Portfolio turnover is calculated on the basis of the Fund as a whole without distinguishing between the classes of shares issued.
(e) Commencement of operations.
See notes to financial statements.
20
Victory Portfolios | | Financial Highlights — continued | |
For a Share Outstanding Throughout Each Period
| | | | | Ratios to Average Net Assets | | Supplemental Data | |
| | | Total
Distributions | | Net Asset
Value,
End of
Period | | Total
Return
(Excludes
Sales
Charge)(b) | | Net
Expenses(c) | | Net
Investment
Income
(Loss)(c) | | Gross
Expenses(c) | | Net Assets,
End of
Period
(000's) | | Portfolio
Turnover(b)(d) | |
Victory Sycamore Established Value Fund | |
Class A | |
Six Months Ended
4/30/21 (unaudited) | | | (1.91 | ) | | $ | 50.13 | | | | 46.83 | % | | | 0.89 | % | | | 1.09 | % | | | 0.89 | % | | $ | 1,859,089 | | | | 18 | % | |
Year Ended 10/31/20 | | | (2.38 | ) | | $ | 35.75 | | | | (5.22 | )% | | | 0.92 | % | | | 1.34 | % | | | 0.92 | % | | $ | 1,380,509 | | | | 44 | % | |
Year Ended 10/31/19 | | | (3.44 | ) | | $ | 40.09 | | | | 11.96 | % | | | 0.92 | % | | | 1.06 | % | | | 0.92 | % | | $ | 1,802,034 | | | | 34 | % | |
Year Ended 10/31/18 | | | (1.32 | ) | | $ | 39.52 | | | | 2.01 | % | | | 0.89 | % | | | 0.85 | % | | | 0.89 | % | | $ | 2,008,143 | | | | 36 | % | |
Year Ended 10/31/17 | | | (0.56 | ) | | $ | 40.01 | | | | 20.12 | % | | | 0.90 | % | | | 0.58 | % | | | 0.90 | % | | $ | 2,386,049 | | | | 32 | % | |
Year Ended 10/31/16 | | | (3.46 | ) | | $ | 33.82 | | | | 5.80 | % | | | 0.95 | % | | | 0.69 | % | | | 0.95 | % | | $ | 1,735,974 | | | | 40 | % | |
Class C | |
Six Months Ended
4/30/21 (unaudited) | | | (1.77 | ) | | $ | 48.84 | | | | 46.28 | % | | | 1.66 | % | | | 0.32 | % | | | 1.66 | % | | $ | 71,177 | | | | 18 | % | |
Year Ended 10/31/20 | | | (2.12 | ) | | $ | 34.89 | | | | (5.93 | )% | | | 1.69 | % | | | 0.58 | % | | | 1.69 | % | | $ | 54,271 | | | | 44 | % | |
Year Ended 10/31/19 | | | (3.17 | ) | | $ | 39.16 | | | | 11.10 | % | | | 1.68 | % | | | 0.30 | % | | | 1.68 | % | | $ | 79,066 | | | | 34 | % | |
Year Ended 10/31/18 | | | (1.02 | ) | | $ | 38.69 | | | | 1.19 | % | | | 1.68 | % | | | 0.07 | % | | | 1.68 | % | | $ | 90,128 | | | | 36 | % | |
Year Ended 10/31/17 | | | (0.39 | ) | | $ | 39.22 | | | | 19.20 | % | | | 1.70 | % | | | (0.24 | )% | | | 1.70 | % | | $ | 101,506 | | | | 32 | % | |
3/1/16(e) through
10/31/16 | | | (0.10 | ) | | $ | 33.26 | | | | 14.75 | % | | | 1.80 | % | | | (0.40 | )% | | | 1.80 | % | | $ | 25,146 | | | | 40 | % | |
Class I | |
Six Months Ended
4/30/21 (unaudited) | | | (1.97 | ) | | $ | 50.17 | | | | 47.04 | % | | | 0.58 | % | | | 1.38 | % | | | 0.58 | % | | $ | 4,897,400 | | | | 18 | % | |
Year Ended 10/31/20 | | | (2.49 | ) | | $ | 35.77 | | | | (4.92 | )% | | | 0.60 | % | | | 1.64 | % | | | 0.60 | % | | $ | 3,306,226 | | | | 44 | % | |
Year Ended 10/31/19 | | | (3.57 | ) | | $ | 40.12 | | | | 12.31 | % | | | 0.60 | % | | | 1.37 | % | | | 0.60 | % | | $ | 3,501,630 | | | | 34 | % | |
Year Ended 10/31/18 | | | (1.44 | ) | | $ | 39.55 | | | | 2.30 | % | | | 0.59 | % | | | 1.14 | % | | | 0.59 | % | | $ | 3,509,093 | | | | 36 | % | |
Year Ended 10/31/17 | | | (0.67 | ) | | $ | 40.04 | | | | 20.50 | % | | | 0.62 | % | | | 0.85 | % | | | 0.62 | % | | $ | 5,263,053 | | | | 32 | % | |
Year Ended 10/31/16 | | | (3.55 | ) | | $ | 33.83 | | | | 6.08 | % | | | 0.69 | % | | | 0.91 | % | | | 0.69 | % | | $ | 2,590,122 | | | | 40 | % | |
Class R | |
Six Months Ended
4/30/21 (unaudited) | | | (1.88 | ) | | $ | 49.35 | | | | 46.67 | % | | | 1.10 | % | | | 0.86 | % | | | 1.10 | % | | $ | 929,228 | | | | 18 | % | |
Year Ended 10/31/20 | | | (2.31 | ) | | $ | 35.23 | | | | (5.41 | )% | | | 1.12 | % | | | 1.14 | % | | | 1.12 | % | | $ | 633,244 | | | | 44 | % | |
Year Ended 10/31/19 | | | (3.37 | ) | | $ | 39.54 | | | | 11.72 | % | | | 1.13 | % | | | 0.84 | % | | | 1.13 | % | | $ | 823,796 | | | | 34 | % | |
Year Ended 10/31/18 | | | (1.25 | ) | | $ | 39.03 | | | | 1.80 | % | | | 1.10 | % | | | 0.65 | % | | | 1.10 | % | | $ | 897,277 | | | | 36 | % | |
Year Ended 10/31/17 | | | (0.49 | ) | | $ | 39.54 | | | | 19.89 | % | | | 1.10 | % | | | 0.38 | % | | | 1.10 | % | | $ | 1,005,561 | | | | 32 | % | |
Year Ended 10/31/16 | | | (3.40 | ) | | $ | 33.43 | | | | 5.60 | % | | | 1.13 | % | | | 0.54 | % | | | 1.13 | % | | $ | 784,442 | | | | 40 | % | |
(continues on next page)
See notes to financial statements.
21
Victory Portfolios | | Financial Highlights | |
For a Share Outstanding Throughout Each Period
| | | | Investment Activities | | Distributions to
Shareholders From | |
| | | Net Asset
Value,
Beginning of
Period | | Net
Investment
Income
(Loss)(a) | | Net Realized
and Unrealized
Gains (Losses)
on Investments | | Total from
Investment
Activities | | Net
Investment
Income | | Net Realized
Gains from
Investments | |
Victory Sycamore Established Value Fund | |
Class R6 | |
Six Months Ended
4/30/21 (unaudited) | | $ | 35.78 | | | | 0.31 | | | | 16.09 | | | | 16.40 | | | | (0.31 | ) | | | (1.67 | ) | |
Year Ended 10/31/20 | | $ | 40.13 | | | | 0.60 | | | | (2.45 | ) | | | (1.85 | ) | | | (0.60 | ) | | | (1.90 | ) | |
Year Ended 10/31/19 | | $ | 39.55 | | | | 0.52 | | | | 3.63 | | | | 4.15 | | | | (0.52 | ) | | | (3.05 | ) | |
Year Ended 10/31/18 | | $ | 40.05 | | | | 0.49 | | | | 0.48 | | | | 0.97 | | | | (0.48 | ) | | | (0.99 | ) | |
Year Ended 10/31/17 | | $ | 33.85 | | | | 0.35 | | | | 6.54 | | | | 6.89 | | | | (0.34 | ) | | | (0.35 | ) | |
Year Ended 10/31/16 | | $ | 35.56 | | | | 0.31 | | | | 1.55 | | | | 1.86 | | | | (0.33 | ) | | | (3.24 | ) | |
Class Y | |
Six Months Ended
4/30/21 (unaudited) | | $ | 35.76 | | | | 0.30 | | | | 16.07 | | | | 16.37 | | | | (0.29 | ) | | | (1.67 | ) | |
Year Ended 10/31/20 | | $ | 40.11 | | | | 0.58 | | | | (2.45 | ) | | | (1.87 | ) | | | (0.58 | ) | | | (1.90 | ) | |
Year Ended 10/31/19 | | $ | 39.54 | | | | 0.50 | | | | 3.63 | | | | 4.13 | | | | (0.51 | ) | | | (3.05 | ) | |
Year Ended 10/31/18 | | $ | 40.04 | | | | 0.46 | | | | 0.48 | | | | 0.94 | | | | (0.45 | ) | | | (0.99 | ) | |
Year Ended 10/31/17 | | $ | 33.83 | | | | 0.31 | | | | 6.57 | | | | 6.88 | | | | (0.32 | ) | | | (0.35 | ) | |
Year Ended 10/31/16 | | $ | 35.56 | | | | 0.28 | | | | 1.53 | | | | 1.81 | | | | (0.30 | ) | | | (3.24 | ) | |
(a) Per share net investment income (loss) has been calculated using the average daily shares method.
(b) Not annualized for periods less than one year.
(c) Annualized for periods less than one year.
(d) Portfolio turnover is calculated on the basis of the Fund as a whole without distinguishing between the classes of shares issued.
See notes to financial statements.
22
Victory Portfolios | | Financial Highlights — continued | |
For a Share Outstanding Throughout Each Period
| | | | | Ratios to Average Net Assets | | Supplemental Data | |
| | | Total
Distributions | | Net Asset
Value,
End of
Period | | Total
Return(b) | | Net
Expenses(c) | | Net
Investment
Income
(Loss)(c) | | Gross
Expenses(c) | | Net Assets,
End of
Period
(000's) | | Portfolio
Turnover(b)(d) | |
Victory Sycamore Established Value Fund | |
Class R6 | |
Six Months Ended
4/30/21 (unaudited) | | | (1.98 | ) | | $ | 50.20 | | | | 47.12 | % | | | 0.54 | % | | | 1.42 | % | | | 0.54 | % | | $ | 6,857,795 | | | | 18 | % | |
Year Ended 10/31/20 | | | (2.50 | ) | | $ | 35.78 | | | | (4.89 | )% | | | 0.57 | % | | | 1.68 | % | | | 0.57 | % | | $ | 4,499,129 | | | | 44 | % | |
Year Ended 10/31/19 | | | (3.57 | ) | | $ | 40.13 | | | | 12.35 | % | | | 0.58 | % | | | 1.38 | % | | | 0.58 | % | | $ | 4,762,844 | | | | 34 | % | |
Year Ended 10/31/18 | | | (1.47 | ) | | $ | 39.55 | | | | 2.34 | % | | | 0.57 | % | | | 1.19 | % | | | 0.57 | % | | $ | 3,822,378 | | | | 36 | % | |
Year Ended 10/31/17 | | | (0.69 | ) | | $ | 40.05 | | | | 20.54 | % | | | 0.54 | % | | | 0.91 | % | | | 0.54 | % | | $ | 1,314,843 | | | | 32 | % | |
Year Ended 10/31/16 | | | (3.57 | ) | | $ | 33.85 | | | | 6.20 | % | | | 0.59 | % | | | 0.93 | % | | | 0.59 | % | | $ | 458,750 | | | | 40 | % | |
Class Y | |
Six Months Ended
4/30/21 (unaudited) | | | (1.96 | ) | | $ | 50.17 | | | | 47.04 | % | | | 0.60 | % | | | 1.36 | % | | | 0.60 | % | | $ | 883,055 | | | | 18 | % | |
Year Ended 10/31/20 | | | (2.48 | ) | | $ | 35.76 | | | | (4.92 | )% | | | 0.63 | % | | | 1.63 | % | | | 0.63 | % | | $ | 600,200 | | | | 44 | % | |
Year Ended 10/31/19 | | | (3.56 | ) | | $ | 40.11 | | | | 12.28 | % | | | 0.63 | % | | | 1.32 | % | | | 0.63 | % | | $ | 659,111 | | | | 34 | % | |
Year Ended 10/31/18 | | | (1.44 | ) | | $ | 39.54 | | | | 2.27 | % | | | 0.62 | % | | | 1.13 | % | | | 0.62 | % | | $ | 448,543 | | | | 36 | % | |
Year Ended 10/31/17 | | | (0.67 | ) | | $ | 40.04 | | | | 20.51 | % | | | 0.60 | % | | | 0.81 | % | | | 0.60 | % | | $ | 487,044 | | | | 32 | % | |
Year Ended 10/31/16 | | | (3.54 | ) | | $ | 33.83 | | | | 6.03 | % | | | 0.72 | % | | | 0.85 | % | | | 0.72 | % | | $ | 50,765 | | | | 40 | % | |
See notes to financial statements.
23
Victory Portfolios | | Financial Highlights | |
For a Share Outstanding Throughout Each Period
| | | | Investment Activities | | Distributions to
Shareholders From | |
| | | Net Asset
Value,
Beginning of
Period | | Net
Investment
Income
(Loss)(a) | | Net Realized
and Unrealized
Gains (Losses)
on Investments | | Total from
Investment
Activities | | Net
Investment
Income | | Net Realized
Gains from
Investments | |
Victory Sycamore Small Company Opportunity Fund | |
Class A | |
Six Months Ended
4/30/21 (unaudited) | | $ | 37.91 | | | | 0.05 | | | | 18.43 | | | | 18.48 | | | | (0.16 | ) | | | (0.15 | ) | |
Year Ended 10/31/20 | | $ | 45.16 | | | | 0.17 | | | | (5.14 | ) | | | (4.97 | ) | | | (0.20 | ) | | | (2.08 | ) | |
Year Ended 10/31/19 | | $ | 45.91 | | | | 0.22 | | | | 4.22 | | | | 4.44 | | | | (0.10 | ) | | | (5.09 | ) | |
Year Ended 10/31/18 | | $ | 48.23 | | | | 0.22 | | | | (0.09 | ) | | | 0.13 | | | | (0.21 | ) | | | (2.24 | ) | |
Year Ended 10/31/17 | | $ | 39.74 | | | | 0.11 | | | | 10.44 | | | | 10.55 | | | | (0.12 | ) | | | (1.94 | ) | |
Year Ended 10/31/16 | | $ | 40.01 | | | | 0.10 | | | | 3.05 | | | | 3.15 | | | | (0.05 | ) | | | (3.37 | ) | |
Class I | |
Six Months Ended
4/30/21 (unaudited) | | $ | 38.40 | | | | 0.13 | | | | 18.66 | | | | 18.79 | | | | (0.29 | ) | | | (0.15 | ) | |
Year Ended 10/31/20 | | $ | 45.71 | | | | 0.31 | | | | (5.20 | ) | | | (4.89 | ) | | | (0.34 | ) | | | (2.08 | ) | |
Year Ended 10/31/19 | | $ | 46.43 | | | | 0.35 | | | | 4.28 | | | | 4.63 | | | | (0.26 | ) | | | (5.09 | ) | |
Year Ended 10/31/18 | | $ | 48.75 | | | | 0.37 | | | | (0.09 | ) | | | 0.28 | | | | (0.36 | ) | | | (2.24 | ) | |
Year Ended 10/31/17 | | $ | 40.12 | | | | 0.25 | | | | 10.55 | | | | 10.80 | | | | (0.23 | ) | | | (1.94 | ) | |
Year Ended 10/31/16 | | $ | 40.37 | | | | 0.21 | | | | 3.08 | | | | 3.29 | | | | (0.17 | ) | | | (3.37 | ) | |
Class R | |
Six Months Ended
4/30/21 (unaudited) | | $ | 35.16 | | | | 0.01 | | | | 17.09 | | | | 17.10 | | | | (0.11 | ) | | | (0.15 | ) | |
Year Ended 10/31/20 | | $ | 42.05 | | | | 0.09 | | | | (4.76 | ) | | | (4.67 | ) | | | (0.14 | ) | | | (2.08 | ) | |
Year Ended 10/31/19 | | $ | 43.13 | | | | 0.13 | | | | 3.91 | | | | 4.04 | | | | (0.03 | ) | | | (5.09 | ) | |
Year Ended 10/31/18 | | $ | 45.47 | | | | 0.10 | | | | (0.08 | ) | | | 0.02 | | | | (0.12 | ) | | | (2.24 | ) | |
Year Ended 10/31/17 | | $ | 37.59 | | | | 0.01 | | | | 9.86 | | | | 9.87 | | | | (0.05 | ) | | | (1.94 | ) | |
Year Ended 10/31/16 | | $ | 38.06 | | | | 0.02 | | | | 2.88 | | | | 2.90 | | | | — | | | | (3.37 | ) | |
Class R6 | |
Six Months Ended
4/30/21 (unaudited) | | $ | 38.37 | | | | 0.14 | | | | 18.63 | | | | 18.77 | | | | (0.33 | ) | | | (0.15 | ) | |
Year Ended 10/31/20 | | $ | 45.66 | | | | 0.19 | | | | (5.03 | ) | | | (4.84 | ) | | | (0.37 | ) | | | (2.08 | ) | |
Year Ended 10/31/19 | | $ | 46.38 | | | | 0.36 | | | | 4.28 | | | | 4.64 | | | | (0.27 | ) | | | (5.09 | ) | |
Year Ended 10/31/18 | | $ | 48.69 | | | | 0.30 | | | | — | (e) | | | 0.30 | | | | (0.37 | ) | | | (2.24 | ) | |
Year Ended 10/31/17 | | $ | 40.08 | | | | 0.21 | | | | 10.58 | | | | 10.79 | | | | (0.24 | ) | | | (1.94 | ) | |
12/15/15(f) through
10/31/16 | | $ | 38.97 | | | | 0.13 | | | | 4.54 | | | | 4.67 | | | | (0.19 | ) | | | (3.37 | ) | |
Class Y | |
Six Months Ended
4/30/21 (unaudited) | | $ | 38.10 | | | | 0.08 | | | | 18.54 | | | | 18.62 | | | | (0.23 | ) | | | (0.15 | ) | |
Year Ended 10/31/20 | | $ | 45.39 | | | | 0.24 | | | | (5.16 | ) | | | (4.92 | ) | | | (0.29 | ) | | | (2.08 | ) | |
Year Ended 10/31/19 | | $ | 46.13 | | | | 0.30 | | | | 4.24 | | | | 4.54 | | | | (0.19 | ) | | | (5.09 | ) | |
Year Ended 10/31/18 | | $ | 48.33 | | | | 0.29 | | | | (0.09 | ) | | | 0.20 | | | | (0.16 | ) | | | (2.24 | ) | |
Year Ended 10/31/17 | | $ | 39.84 | | | | 0.20 | | | | 10.40 | | | | 10.60 | | | | (0.17 | ) | | | (1.94 | ) | |
Year Ended 10/31/16 | | $ | 40.10 | | | | 0.13 | | | | 3.07 | | | | 3.20 | | | | (0.09 | ) | | | (3.37 | ) | |
(a) Per share net investment income (loss) has been calculated using the average daily shares method.
(b) Not annualized for periods less than one year.
(c) Annualized for periods less than one year.
(d) Portfolio turnover is calculated on the basis of the Fund as a whole without distinguishing between the classes of shares issued.
(e) Amount is less than $0.005 per share.
(f) Commencement of operations.
See notes to financial statements.
24
Victory Portfolios | | Financial Highlights — continued | |
For a Share Outstanding Throughout Each Period
| | | | | Ratios to Average Net Assets | | Supplemental Data | |
| | | Total
Distributions | | Net Asset
Value,
End of
Period | | Total
Return
(Excludes
Sales
Charge)(b) | | Net
Expenses(c) | | Net
Investment
Income
(Loss)(c) | | Gross
Expenses(c) | | Net Assets,
End of
Period
(000's) | | Portfolio
Turnover(b)(d) | |
Victory Sycamore Small Company Opportunity Fund | |
Class A | |
Six Months Ended
4/30/21 (unaudited) | | | (0.31 | ) | | $ | 56.08 | | | | 48.94 | % | | | 1.23 | % | | | 0.20 | % | | | 1.23 | % | | $ | 452,168 | | | | 17 | % | |
Year Ended 10/31/20 | | | (2.28 | ) | | $ | 37.91 | | | | (11.80 | )% | | | 1.26 | % | | | 0.43 | % | | | 1.26 | % | | $ | 336,083 | | | | 37 | % | |
Year Ended 10/31/19 | | | (5.19 | ) | | $ | 45.16 | | | | 12.10 | % | | | 1.25 | % | | | 0.51 | % | | | 1.25 | % | | $ | 451,310 | | | | 34 | % | |
Year Ended 10/31/18 | | | (2.45 | ) | | $ | 45.91 | | | | 0.17 | % | | | 1.22 | % | | | 0.46 | % | | | 1.22 | % | | $ | 486,622 | | | | 43 | % | |
Year Ended 10/31/17 | | | (2.06 | ) | | $ | 48.23 | | | | 27.02 | % | | | 1.23 | % | | | 0.25 | % | | | 1.23 | % | | $ | 603,851 | | | | 36 | % | |
Year Ended 10/31/16 | | | (3.42 | ) | | $ | 39.74 | | | | 8.66 | % | | | 1.26 | % | | | 0.25 | % | | | 1.26 | % | | $ | 529,545 | | | | 59 | % | |
Class I | |
Six Months Ended
4/30/21 (unaudited) | | | (0.44 | ) | | $ | 56.75 | | | | 49.18 | % | | | 0.90 | % | | | 0.52 | % | | | 0.90 | % | | $ | 3,952,233 | | | | 17 | % | |
Year Ended 10/31/20 | | | (2.42 | ) | | $ | 38.40 | | | | (11.51 | )% | | | 0.93 | % | | | 0.78 | % | | | 0.93 | % | | $ | 2,666,852 | | | | 37 | % | |
Year Ended 10/31/19 | | | (5.35 | ) | | $ | 45.71 | | | | 12.49 | % | | | 0.92 | % | | | 0.82 | % | | | 0.92 | % | | $ | 4,584,086 | | | | 34 | % | |
Year Ended 10/31/18 | | | (2.60 | ) | | $ | 46.43 | | | | 0.49 | % | | | 0.88 | % | | | 0.76 | % | | | 0.88 | % | | $ | 4,127,411 | | | | 43 | % | |
Year Ended 10/31/17 | | | (2.17 | ) | | $ | 48.75 | | | | 27.44 | % | | | 0.90 | % | | | 0.56 | % | | | 0.90 | % | | $ | 4,003,419 | | | | 36 | % | |
Year Ended 10/31/16 | | | (3.54 | ) | | $ | 40.12 | | | | 8.99 | % | | | 0.96 | % | | | 0.56 | % | | | 0.96 | % | | $ | 2,428,803 | | | | 59 | % | |
Class R | |
Six Months Ended
4/30/21 (unaudited) | | | (0.26 | ) | | $ | 52.00 | | | | 48.79 | % | | | 1.41 | % | | | 0.02 | % | | | 1.41 | % | | $ | 268,171 | | | | 17 | % | |
Year Ended 10/31/20 | | | (2.22 | ) | | $ | 35.16 | | | | (11.94 | )% | | | 1.44 | % | | | 0.25 | % | | | 1.44 | % | | $ | 200,617 | | | | 37 | % | |
Year Ended 10/31/19 | | | (5.12 | ) | | $ | 42.05 | | | | 11.89 | % | | | 1.44 | % | | | 0.32 | % | | | 1.44 | % | | $ | 279,090 | | | | 34 | % | |
Year Ended 10/31/18 | | | (2.36 | ) | | $ | 43.13 | | | | (0.06 | )% | | | 1.44 | % | | | 0.23 | % | | | 1.44 | % | | $ | 286,480 | | | | 43 | % | |
Year Ended 10/31/17 | | | (1.99 | ) | | $ | 45.47 | | | | 26.73 | % | | | 1.45 | % | | | 0.03 | % | | | 1.45 | % | | $ | 333,944 | | | | 36 | % | |
Year Ended 10/31/16 | | | (3.37 | ) | | $ | 37.59 | | | | 8.42 | % | | | 1.48 | % | | | 0.05 | % | | | 1.48 | % | | $ | 302,652 | | | | 59 | % | |
Class R6 | |
Six Months Ended
4/30/21 (unaudited) | | | (0.48 | ) | | $ | 56.66 | | | | 49.21 | % | | | 0.84 | % | | | 0.58 | % | | | 0.84 | % | | $ | 2,367,002 | | | | 17 | % | |
Year Ended 10/31/20 | | | (2.45 | ) | | $ | 38.37 | | | | (11.43 | )% | | | 0.86 | % | | | 0.48 | % | | | 0.86 | % | | $ | 1,625,853 | | | | 37 | % | |
Year Ended 10/31/19 | | | (5.36 | ) | | $ | 45.66 | | | | 12.52 | % | | | 0.87 | % | | | 0.84 | % | | | 0.87 | % | | $ | 277,218 | | | | 34 | % | |
Year Ended 10/31/18 | | | (2.61 | ) | | $ | 46.38 | | | | 0.52 | % | | | 0.87 | % | | | 0.62 | % | | | 0.87 | % | | $ | 195,360 | | | | 43 | % | |
Year Ended 10/31/17 | | | (2.18 | ) | | $ | 48.69 | | | | 27.44 | % | | | 0.90 | % | | | 0.46 | % | | | 0.90 | % | | $ | 85,307 | | | | 36 | % | |
12/15/15(f) through
10/31/16 | | | (3.56 | ) | | $ | 40.08 | | | | 12.86 | % | | | 0.98 | % | | | 0.39 | % | | | 1.12 | % | | $ | 21,044 | | | | 59 | % | |
Class Y | |
Six Months Ended
4/30/21 (unaudited) | | | (0.38 | ) | | $ | 56.34 | | | | 49.10 | % | | | 1.01 | % | | | 0.33 | % | | | 1.01 | % | | $ | 34,121 | | | | 17 | % | |
Year Ended 10/31/20 | | | (2.37 | ) | | $ | 38.10 | | | | (11.65 | )% | | | 1.08 | % | | | 0.62 | % | | | 1.08 | % | | $ | 16,054 | | | | 37 | % | |
Year Ended 10/31/19 | | | (5.28 | ) | | $ | 45.39 | | | | 12.31 | % | | | 1.07 | % | | | 0.69 | % | | | 1.07 | % | | $ | 31,016 | | | | 34 | % | |
Year Ended 10/31/18 | | | (2.40 | ) | | $ | 46.13 | | | | 0.33 | % | | | 1.06 | % | | | 0.61 | % | | | 1.06 | % | | $ | 32,592 | | | | 43 | % | |
Year Ended 10/31/17 | | | (2.11 | ) | | $ | 48.33 | | | | 27.10 | % | | | 1.15 | % | | | 0.45 | % | | | 1.25 | % | | $ | 35,416 | | | | 36 | % | |
Year Ended 10/31/16 | | | (3.46 | ) | | $ | 39.84 | | | | 8.79 | % | | | 1.15 | % | | | 0.34 | % | | | 1.39 | % | | $ | 141,097 | | | | 59 | % | |
See notes to financial statements.
25
Victory Portfolios | | Notes to Financial Statements
April 30, 2021 | |
(Unaudited)
1. Organization:
Victory Portfolios (the "Trust") is organized as a Delaware statutory trust and the Trust is registered under the Investment Company Act of 1940, as amended (the "1940 Act"), as an open-end investment company. The Trust is comprised of 42 funds and is authorized to issue an unlimited number of shares, which are units of beneficial interest with a par value of $0.001 per share.
The accompanying financial statements are those of the following two Funds (collectively, the "Funds" and individually, a "Fund"). Each Fund is classified as diversified under the 1940 Act.
Funds (Legal Name) | | Funds (Short Name)* | | Investment Share
Classes Offered | |
Victory Sycamore Established
Value Fund | | Sycamore Established Value Fund | | Class A, C, I, R, R6, and Y | |
Victory Sycamore Small Company
Opportunity Fund | | Sycamore Small Company
Opportunity Fund | | Class A, I, R, R6, and Y | |
* The Funds are generally closed to new investors. The Funds will continue to be available for investment (by direct purchase or exchange) by only: existing shareholders, investors that purchase shares through certain intermediaries, retirement plans that purchase shares through certain record keepers, and current and retired Fund trustees, officers, employees of Victory Capital Management Inc. and affiliated providers, and their family members.
Each class of shares of a Fund has substantially identical rights and privileges except with respect to sales charges, fees paid under distribution plans, expenses allocable exclusively to each class of shares, voting rights on matters solely affecting a single class of shares, and the exchange privilege of each class of shares.
Under the Trust's organizational documents, its officers and trustees are indemnified against certain liabilities arising out of the performance of their duties to the Funds. In addition, in the normal course of business, the Funds enter into contracts with their vendors and others that provide for general indemnifications. A Fund's maximum exposure under these arrangements is unknown, as this would involve future claims that may be made against the Funds. However, based on experience, the Funds expect that risk of loss to be remote.
2. Significant Accounting Policies:
The following is a summary of significant accounting policies followed by the Trust in the preparation of its financial statements. The policies are in conformity with generally accepted accounting principles in the United States of America ("GAAP"). The preparation of financial statements in accordance with GAAP requires management to make estimates and assumptions that affect the reported amounts of assets and liabilities and disclosure of contingent assets and liabilities at the date of the financial statements and the reported amounts of income and expenses for the period. Actual results could differ from those estimates. The Funds follow the specialized accounting and reporting requirements under GAAP that are applicable to investment companies under Accounting Standards Codification Topic 946.
Investment Valuation:
The Funds record investments at fair value. Fair value is defined as the price that would be received to sell an asset or paid to transfer a liability in an orderly transaction between market participants at the measurement date.
The valuation techniques described below maximize the use of observable inputs and minimize the use of unobservable inputs in determining fair value. The inputs used for valuing the Funds' investments are summarized in the three broad levels listed below:
• Level 1 — quoted prices in active markets for identical securities
• Level 2 — other significant observable inputs (including quoted prices for similar securities or interest rates applicable to those securities, etc.)
26
Victory Portfolios | | Notes to Financial Statements — continued
April 30, 2021 | |
(Unaudited)
• Level 3 — significant unobservable inputs (including the Fund's own assumptions in determining the fair value of investments)
Changes in valuation techniques may result in transfers in or out of an assigned level within the disclosure hierarchy. The inputs or methodologies used for valuation techniques are not necessarily an indication of the risk associated with entering into those investments.
Victory Capital Management Inc. ("VCM" or the "Adviser") has established the Pricing and Liquidity Committee (the "Committee"), and subject to the Trust's Board of Trustees (the "Board") oversight, the Committee administers and oversees the Fund's valuation policies and procedures, which are approved by the Board.
Portfolio securities listed or traded on securities exchanges, including exchange-traded funds ("ETFs"), American Depositary Receipts ("ADRs") and Rights, are valued at the closing price on the exchange or system where the security is principally traded, if available, or at the Nasdaq Official Closing Price. If there have been no sales for that day on the exchange or system, then a security is valued at the last available bid quotation on the exchange or system where the security is principally traded. In each of these situations, valuations are typically categorized as Level 1 in the fair value hierarchy.
Investments in open-end investment companies are valued at net asset value ("NAV"). These valuations are typically categorized as Level 1 in the fair value hierarchy.
In the event that price quotations or valuations are not readily available, investments are valued at fair value in accordance with procedures established by and under the general supervision and responsibility of the Board. These valuations are typically categorized as Level 2 or Level 3 in the fair value hierarchy, based on the observability of inputs used to determine the fair value. The effect of fair value pricing is that securities may not be priced on the basis of quotations from the primary market in which they are traded and the actual price realized from the sale of a security may differ materially from the fair value price. Valuing these securities at fair value is intended to cause the Fund's NAV to be more reliable than it otherwise would be.
A summary of the valuations as of April 30, 2021, is included in the table below while the breakdown, by category, of investments is disclosed on the Schedules of Portfolio Investments (amounts in thousands):
| | | Level 1 | | Level 2 | | Level 3 | | Total | |
Sycamore Established Value Fund | |
Common Stocks | | $ | 15,063,458 | | | $ | — | | | $ | — | | | $ | 15,063,458 | | |
Exchange-Traded Funds | | | 149,370 | | | | — | | | | — | | | | 149,370 | | |
Collateral for Securities Loaned | | | 6,627 | | | | — | | | | — | | | | 6,627 | | |
Total | | $ | 15,219,455 | | | $ | — | | | $ | — | | | $ | 15,219,455 | | |
Sycamore Small Company Opportunity Fund | |
Common Stocks | | $ | 6,916,145 | | | $ | — | | | $ | — | | | $ | 6,916,145 | | |
Exchange-Traded Funds | | | 75,507 | | | | — | | | | — | | | | 75,507 | | |
Collateral for Securities Loaned | | | 13,034 | | | | — | | | | — | | | | 13,034 | | |
Total | | $ | 7,004,686 | | | $ | — | | | $ | — | | | $ | 7,004,686 | | |
For the six months ended April 30, 2021, there were no transfers in or out of Level 3 in the fair value hierarchy.
Real Estate Investment Trusts ("REITs"):
The Funds may invest in REITs, which report information on the source of their distributions annually. REITs are pooled investment vehicles that invest primarily in income-producing real estate or real-estate related loans or interests (such as mortgages). Certain distributions received from REITs during the year are recorded as realized gains or return of capital as estimated by the Funds or when such information becomes known.
27
Victory Portfolios | | Notes to Financial Statements — continued
April 30, 2021 | |
(Unaudited)
Investment Companies:
Exchange-Traded Funds:
The Funds may invest in ETFs, the shares of which are bought and sold on a securities exchange. An ETF trades like common stock and represents a fixed portfolio of securities often designed to track the performance and dividend yield of a particular domestic or foreign market index. The Funds may purchase shares of an ETF to temporarily gain exposure to a portion of the U.S. or a foreign market while awaiting purchase of underlying securities. The risks of owning an ETF generally reflect the risks of owning the underlying securities they are designed to track, although the lack of liquidity of an ETF could result in it being more volatile. Additionally, ETFs have fees and expenses that reduce their value.
Open-End Funds:
The Funds may invest in portfolios of open-end investment companies. These investment companies value securities in their portfolios for which market quotations are readily available at their market values (generally the last reported sale price) and all other securities and assets at their fair value by the methods established by the board of directors of the underlying funds.
Investment Transactions and Related Income:
Changes in holdings of investments are accounted for no later than one business day following the trade date. For financial reporting purposes, however, investment transactions are accounted for on trade date on the last business day of the reporting period. Interest income is determined on the basis of coupon interest accrued using the effective interest method which adjusts, where applicable, the amortization of premiums or accretion of discounts. Dividend income is recorded on the ex-dividend date. Gains or losses realized on sales of securities are recorded on the identified cost basis. Paydown gains or losses on applicable securities, if any, are recorded as components of Interest income on the Statements of Operations.
Securities Lending:
The Trust has entered into a Master Securities Lending Agreement ("MSLA") with Citibank, N.A. ("Citibank"). Under the terms of the MSLA, the Funds may lend securities to certain broker-dealers and banks in exchange for collateral in the amount of at least 102% of the value of U.S. securities loaned or at least 105% of the value of non-U.S. securities loaned, marked-to-market daily. Any collateral shortfalls associated with increases in the valuation of the securities loaned are adjusted the next business day. The collateral can be received in the form of cash collateral and/or non-cash collateral. Non-cash collateral can include U.S. Government Securities, letters of credit and certificates of deposit. The cash collateral is invested in short-term instruments or cash equivalents, primarily open-end investment companies, as noted on the Funds' Schedules of Portfolio Investments. The Trust does not have effective control of the non-cash collateral and therefore it is not disclosed on the Funds' Schedules of Portfolio Investments. During the time portfolio securities are on loan, the borrower will pay the Funds any dividends or interest paid on such securities plus any fee negotiated between the parties to the lending agreement. The Funds also earn a return from the collateral. The Funds pay Citibank various fees in connection with the investment of cash collateral and fees based on the investment income received from securities lending activities. Securities lending income (net of these fees) is disclosed on the Statements of Operations. Although risk is mitigated by the collateral, the Funds could experience a delay in recovering their securities and possible loss of income or value if the borrower fails to return them.
Securities lending transactions are entered into by a Fund under the MSLA, which permits the Fund, under certain circumstances such as an event of default, to offset amounts payable by the Fund to the same counterparty against amounts receivable from the counterparty to create a net payment due to or from the Fund.
The following table (amounts in thousands) is a summary of the Funds' securities lending transactions which are subject to offset under the MSLA as of April 30, 2021. These transactions are accounted for
28
Victory Portfolios | | Notes to Financial Statements — continued
April 30, 2021 | |
(Unaudited)
as secured borrowings with an overnight and continuous contractual maturity for cash collateral, and greater than overnight and continuous contractual maturity for non-cash collateral.
| | | Gross Amount of | | | | Value of Non-cash Collateral
Received by Maturity | | | |
| | | Recognized Assets
(Value of
Securities on Loan) | | Value of
Cash Collateral
Received* | | <30
Days | | Between
30 & 90
Days | | >90
Days | | Net
Amount | |
Sycamore Established Value
Fund | | $ | 6,425 | ** | | $ | 6,425 | | | $ | — | | | $ | — | | | $ | — | | | $ | — | | |
Sycamore Small Company
Opportunity Fund | | | 12,553 | | | | 12,553 | | | | — | | | | — | | | | — | | | | — | | |
* Collateral received in excess of the market value of securities on loan is not presented in this table. The total cash collateral received by each Fund is disclosed on the Statements of Assets and Liabilities.
** Includes $1,923 of securities on loan that were sold prior to April 30, 2021.
Federal Income Taxes:
It is the policy of each Fund to continue to qualify as a regulated investment company by complying with the provisions available to certain investment companies, as defined in applicable sections of the Internal Revenue Code, and to make distributions of net investment income and net realized gains sufficient to relieve it from all, or substantially all, federal income taxes. Accordingly, no provision for federal income taxes is required in the financial statements. The Funds have a tax year end of October 31.
Management of the Funds has reviewed tax positions taken in tax years that remain subject to examination by all major tax jurisdictions, including federal (i.e., the last four tax years, which includes the current fiscal tax year end). Management believes that there is no tax liability resulting from unrecognized tax benefits related to uncertain tax positions taken.
Allocations:
Expenses directly attributable to the Funds are charged to the Funds, while expenses that are attributable to more than one fund in the Trust, or jointly with an affiliated trust, are allocated among the respective funds in the Trust and/or affiliated trust based upon net assets or another appropriate basis.
Income, expenses (other than class-specific expenses such as transfer agent fees, state registration fees, 12b-1 fees, and printing fees), and realized and unrealized gains or losses on investments are allocated to each class of shares based on its relative net assets on the date income is earned or expenses and realized and unrealized gains and losses are incurred.
3. Purchases and Sales:
Purchases and sales of securities (excluding securities maturing less than one year from acquisition) for the six months ended April 30, 2021, were as follows (amount in thousands).
| | | Excluding
U.S. Government Securities | |
| | | Purchases | | Sales | |
Sycamore Established Value Fund | | $ | 2,289,300 | | | $ | 2,298,592 | | |
| Sycamore Small Company Opportunity Fund | | | 1,028,966 | | | | 1,167,592 | | |
For the six months ended April 30, 2021, there were no purchases or sales of U.S. Government Securities.
29
Victory Portfolios | | Notes to Financial Statements — continued
April 30, 2021 | |
(Unaudited)
4. Fees and Transactions with Affiliates and Related Parties:
Investment Advisory Fees:
Investment advisory services are provided to the Funds by the Adviser, which is a New York corporation registered as an investment adviser with the Securities and Exchange Commission ("SEC"). The Adviser is an indirect wholly owned subsidiary of Victory Capital Holdings, Inc., a publicly traded Delaware corporation, and a wholly owned direct subsidiary of Victory Capital Operating, LLC.
Under the terms of the Investment Advisory Agreement, the Adviser is entitled to receive fees based on a percentage of the average daily net assets of each Fund. The rates at which the Adviser is paid by each Fund are included in the table below.
| | | Adviser Fee Tier Rates | |
| | | Up to $100 million | | $100 million — $200 million | | Over $200 million | |
Sycamore Established Value Fund | | | 0.65 | % | | | 0.55 | % | | | 0.45 | % | |
| | | Up to $500 million | | | | Over $500 million | |
Sycamore Small Company
Opportunity Fund | | | 0.85 | % | | | | | | | 0.75 | % | |
Amounts incurred and paid to VCM for the six months ended April 30, 2021, are reflected on the Statements of Operations as Investment advisory fees.
Administration and Servicing Fees:
VCM serves as the Funds' administrator and fund accountant. Under the Administration and Fund Accounting Agreement, VCM is entitled to receive fees based on a percentage of the average daily net assets of the Trust, Victory Variable Insurance Funds and Victory Portfolios II (collectively, the "Victory Funds Complex"). The tiered rates at which VCM is paid by the Funds are shown in the table below:
| Up to $15 billion | | $15 billion — $30 billion | | Over $30 billion | |
| | 0.08 | %, plus | | | 0.05 | %, plus | | | 0.04 | % | |
Amounts incurred for the six months ended April 30, 2021, are reflected on the Statements of Operations as Administration fees.
Citi Fund Services Ohio, Inc. ("Citi"), an affiliate of Citibank, acts as sub-administrator and sub-fund accountant to the Funds pursuant to the Sub-Administration and Sub-Fund Accounting Services Agreement between VCM and Citi. VCM pays Citi a fee for providing these services. The Trust reimburse VCM and Citi for out-of-pocket expenses incurred in providing these services and certain other expenses specifically allocated to the Funds. Amounts incurred for the six months ended April 30, 2021, are reflected on the Statements of Operations as Sub-Administration fees.
The Chief Compliance Officer ("CCO") is an employee of the Adviser, which pays the compensation of the CCO and his support staff. The Funds (as part of the Trust) have entered into an agreement to provide compliance services with the Adviser, pursuant to which the Adviser furnishes its compliance personnel, including the services of the CCO, and other resources reasonably necessary to provide the Trust with compliance oversight services related to the design, administration and oversight of a compliance program for the Trust in accordance with Rule 38a-1 under the 1940 Act. The Funds in the Victory Funds Complex, in aggregate, compensate the Adviser for these services. Amounts incurred for the six months ended April 30, 2021, are reflected on the Statements of Operations as Compliance fees.
Transfer Agency Fees:
FIS Investor Services, LLC ("FIS") serves as the Funds' transfer agent. Under the Transfer Agent Agreement, the Trust pays FIS a fee for its services and reimburses FIS for all of their reasonable out-of-pocket expenses incurred in providing these services. Amounts incurred for the six months ended April 30, 2021, are reflected on the Statements of Operations as Transfer agent fees.
30
Victory Portfolios | | Notes to Financial Statements — continued
April 30, 2021 | |
(Unaudited)
Distributor/Underwriting Services:
Victory Capital Services, Inc. (the "Distributor"), an affiliate of the Adviser, serves as distributor for the continuous offering of the shares of the Funds pursuant to a Distribution Agreement between the Distributor and the Trust.
Pursuant to the Distribution and Service Plans adopted in accordance with Rule 12b-1 under the 1940 Act, the Distributor may receive a monthly distribution and service fee as shown in the table below:
| | | Class A | | Class C | | Class I | | Class R | | Class R6 | | Class Y | |
Sycamore Established Value Fund | | | 0.25 | % | | | 1.00 | % | | | 0.00 | % | | | 0.50 | % | | | 0.00 | % | | | 0.00 | % | |
Sycamore Small Company Opportunity
Fund | | | 0.25 | % | | | N/A | | | | 0.00 | % | | | 0.50 | % | | | 0.00 | % | | | 0.00 | % | |
The distribution and service fees paid to the Distributor may be used by the Distributor to pay for activities primarily intended to result in the sale of Class A, Class C, and Class R. Amounts incurred for the six months ended April 30, 2021, are reflected on the Statements of Operations as 12b-1 fees.
In addition, the Distributor is entitled to receive commissions on sale of the Class A. For the six months ended April 30, 2021, the Distributor received approximately $10 thousand from commissions earned on the sale of Class A.
Other Fees:
Citibank serves as the Funds' custodian. The Funds pay Citibank a fee for providing these services. Amounts incurred for the six months ended April 30, 2021, are reflected on the Statements of Operations as Custodian fees.
Sidley Austin LLP provides legal services to the Trust.
The Adviser has entered into expense limitation agreements with certain Funds. Under the terms of the agreements, the Adviser has agreed to waive fees or reimburse certain expenses to the extent that ordinary operating expenses incurred by certain classes of a Fund in any fiscal year exceed the expense limit for such classes of the Fund. Such excess amounts will be the liability of the Adviser. Acquired fund fees and expense, interest, taxes, brokerage commissions, other expenditures that are capitalized in accordance with GAAP, and other extraordinary expenses not incurred in the ordinary course of a Fund's business are excluded from the expense limits. As of April 30, 2021, the expense limits (excluding voluntary waivers) are as follows:
| | | In effect until February 28, 2022 | |
| | | Class A | | Class C | | Class I | | Class R | | Class R6 | | Class Y | |
Sycamore Established Value Fund | | | N/A | | | | 1.84 | % | | | N/A | | | | N/A | | | | N/A | | | | N/A | | |
Sycamore Small Company Opportunity
Fund | | | N/A | | | | N/A | | | | N/A | | | | N/A | | | | N/A | | | | 1.15 | % | |
The Funds have agreed to repay fees and expenses that were waived or reimbursed by the Adviser for a period up to three fiscal years after such waiver or reimbursement was made to the extent such payments or repayments would not cause the expenses of the class to exceed the original expense limitation in place at time of the waiver or reimbursement or any expense limitation agreement in place at the time of repayment. Amounts repaid to the Adviser during the six months ended April 30, 2021, if any, are reflected on the Statements of Operations as Recoupment of prior expenses waived/reimbursed by Adviser.
As of April 30, 2021, the Funds had no amounts available to be repaid to the Adviser. The Funds have not recorded any amounts available to be repaid as a liability due to an assessment that such repayment is not probable at April 30, 2021.
Effective May 1, 2021, the expense limitation agreements have been revised to reflect that the Adviser will have the ability to recoup expenses up to three years after the date of the waiver or reimbursement, subject to the lesser of any operating expense limits in effect at the time of: (a) the original waiver or
31
Victory Portfolios | | Notes to Financial Statements — continued
April 30, 2021 | |
(Unaudited)
expense reimbursement; or (b) the recoupment, after giving effect to the recoupment amount. The Adviser has determined the effect of this change will have no significant impact on financial statements.
The Adviser may voluntarily waive or reimburse additional fees to assist the Funds in maintaining competitive expense ratios. Voluntary waivers and reimbursements applicable to the Funds are not available to be recouped at a future time.
Certain officers and/or interested trustees of the Funds are also officers and/or employees of the Adviser, administrator, fund accountant, sub-administrator, sub-fund accountant, custodian, legal counsel, and Distributor.
5. Risks:
Each Fund may be subject to other risks in addition to these identified risks.
Equity Risk — The value of the equity securities in which the Fund invests may decline in response to developments affecting individual companies and/or general economic conditions in the United States or abroad. A company's earnings or dividends may not increase as expected (or may decline) because of poor management, competitive pressures, reliance on particular suppliers or geographical regions, labor problems or shortages, corporate restructurings, fraudulent disclosures, man-made or natural disasters, military confrontations or wars, terrorism, public health crises, or other events, conditions and factors. Price changes may be temporary or last for extended periods.
Stock Market Risk — Overall stock market risks may affect the value of the Fund. Domestic and international factors such as political events, war, trade disputes, interest rate levels and other fiscal and monetary policy changes, pandemics and other public health crises and related geopolitical events, as well as environmental disasters such as earthquakes, fires and floods, may add to instability in world economies and markets generally. The impact of these and other factors may be short-term or may last for extended periods.
Small-Capitalization Stock Risk — Small-capitalization companies are subject to a number of risks not associated with larger, more established companies, potentially making their stock prices more volatile and increasing the risk of loss. Smaller companies may have limited markets, product lines, or financial resources and lack management experience and may experience higher failure rates than larger companies.
Mid-Capitalization Stock Risk — Mid-sized companies may be subject to a number of risks not associated with larger, more established companies, potentially making their stock prices more volatile and increasing the risk of loss.
Geopolitical/Natural Disaster Risk — Global economies and financial markets are increasingly interconnected, which increases the possibilities that conditions in one country or region might adversely affect issuers in another country or region. Geopolitical and other risks, including war, terrorism, trade disputes, political or economic dysfunction within some nations, public health crises and related geopolitical events, as well as environmental disasters such as earthquakes, fires, and floods, may add to instability in world economies and markets generally. Changes in trade policies and international trade agreements could affect the economies of many countries in unpredictable ways. Likewise, systemic market dislocations of the kind that occurred during the financial crisis that began in 2008, if repeated, would be highly disruptive to economies and markets, adversely affecting individual companies and industries, securities markets, interest rates, credit ratings, inflation, investor sentiment, and other factors affecting the value of a Fund's investments. Some countries, including the United States, are adopting more protectionist trade policies and moving away from the tighter financial industry regulations that followed the 2008 financial crisis, which may also affect the value of a Fund's investments.
Political events within the United States at times have resulted, and may in the future result, in a shutdown of government services, which could negatively affect the U.S. economy, decrease the value of a Fund's investments, increase uncertainty in or impair the operation of the U.S. or other securities markets and degrade investor and consumer confidence, perhaps suddenly and to a significant degree.
An outbreak of disease called COVID-19 has spread internationally. The transmission of COVID-19 and efforts to contain its spread have resulted in international, national and local border closings and other significant travel restrictions and disruptions, significant disruptions to business operations, supply chains and consumer activity, significant challenges in healthcare service preparation and delivery, quarantines
32
Victory Portfolios | | Notes to Financial Statements — continued
April 30, 2021 | |
(Unaudited)
and general concern and uncertainty. These negative impacts have caused significant volatility and declines in global financial markets, which have caused losses for Fund investors during and subsequent to period end. The impact of the COVID-19 pandemic may last for an extended period of time, and could result in a substantial economic downturn or recession. Public health crises may exacerbate other pre-existing political, social, economic, market and financial risks. The extent of the impact to the financial performance of the Fund's investments will depend on future developments, including (i) the duration and spread of the outbreak, (ii) the restrictions and advisories, (iii) the effects on the financial markets, and (iv) the effects on the economy overall, all of which are highly uncertain and cannot be predicted.
6. Borrowing and Interfund Lending:
Line of Credit:
For the six months ended April 30, 2021, the Victory Funds Complex participated in a short-term demand note "Line of Credit" agreement with Citibank. The Line of Credit agreement with Citibank was renewed on June 29, 2020 with a termination date of June 28, 2021. Under the agreement with Citibank, the Victory Funds Complex and USAA Mutual Funds Complex, combined, may borrow up to $600 million, of which $300 million is committed and $300 million is uncommitted. $40 million of the Line of Credit is reserved for use by the Victory Floating Rate Fund (herein, the "Fund"), another series of the Victory Funds Complex, with that Fund paying the related commitment fees for that amount. The purpose of the Line of Credit is to meet temporary or emergency cash needs. For the six months ended April 30, 2021, Citibank received an annual commitment fee of 0.15% on $300 million for providing the Line of Credit. Each fund in the Victory Funds Complex pays a pro-rata portion of the commitment fees plus any interest (one month LIBOR plus one percent) on amounts borrowed. Effective June 29, 2020, under an amended Line of Credit agreement, Citibank also received an annual upfront fee of 0.10% on the $300 million committed line of credit. Effective with the next amendment, the upfront fee of 0.10% will be discontinued. Each fund in the Victory Funds Complex paid a pro-rata portion of the upfront fee. Interest charged to each Fund during the period, if applicable, is presented on the Statements of Operations under Line of credit fees. The Funds did not utilize the Line of Credit during the six months ended April 30, 2021.
Interfund Lending:
The Trust and Adviser rely on an exemptive order granted by the SEC in March 2017 (the "Order"), permitting the establishment and operation of an Interfund Lending Facility (the "Facility"). The Facility allows each Fund to directly lend and borrow money to or from any other fund in the Victory Funds Complex that is permitted to participate in the Facility, relying upon the Order at rates beneficial to both the borrowing and lending funds. Advances under the Facility are allowed for temporary or emergency purposes, including the meeting of redemption requests that otherwise might require the untimely disposition of securities, and are subject to each Fund's borrowing restrictions. The interfund loan rate is determined, as specified in the Order, by averaging the current repurchase agreement rate and the current bank loan rate. As a Borrower, interest charged to the Fund, if any, during the period is reflected on the Statement of Operations under Interfund lending fees. As a Lender, interest earned by the Fund, if any, during the period is presented on the Statement of Operations under Interfund lending.
The average borrowing or lending for the days outstanding and average interest rate for the Funds during the six months ended April 30, 2021, were as follows (amounts in thousands):
| | | Borrower or
Lender | | Amount
Outstanding at
April 30, 2021 | | Average
Borrowing* | | Days
Borrowing
Outstanding | | Average
Interest
Rate | | Maximum
Borrowing
During the
Period | |
Sycamore Established
Value Fund | | Lender | | $ | — | | | $ | 6,501 | | | | 93 | | | | 0.80 | % | | $ | 64,000 | | |
* For the six months ended April 30, 2021, based on the number of days borrowings were outstanding.
33
Victory Portfolios | | Notes to Financial Statements — continued
April 30, 2021 | |
(Unaudited)
7. Federal Income Tax Information:
Distributable net realized gains, if any, are declared and distributed at least annually from each Fund. Dividends from net investment income, if any, are declared and paid as noted in the table below.
| | | Declared | | Paid | |
Sycamore Established Value Fund | | Quarterly | | Quarterly | |
Sycamore Small Company Opportunity Fund | | Annually | | Annually | |
The amounts of dividends from net investment income and distributions from net realized gains (collectively distributions to shareholders) are determined in accordance with federal income tax regulations, which may differ from GAAP. To the extent these "book/tax" differences are permanent in nature (e.g., net operating loss and distribution reclassification), such amounts are reclassified within the components of net assets based on their federal tax-basis treatment; temporary differences (e.g., wash sales) do not require reclassification. To the extent dividends and distributions exceed net investment income and net realized gains for tax purposes, they are reported as distributions of capital. Net investment losses incurred by the Funds may be reclassified as an offset to capital on the accompanying Statement of Assets and Liabilities.
The tax character of distributions paid and the tax basis of current components of accumulated earnings (deficit) will be determined at the end of the current tax year ending October 31, 2021.
As of the tax year ended October 31, 2020, the Funds had no capital loss carryforwards for federal income tax purposes.
8. Affiliated Securities:
An affiliated security is a security in which the Fund has ownership of at least 5% of the security's outstanding voting shares, an investment company managed by VCM or an issuer under common control with a Fund or VCM. The Fund does not invest in affiliated securities for the purpose of exercising management or control. These securities are noted as affiliated on the Fund's Schedule of Portfolio Investments. Transactions in affiliated securities during the six months ended April 30, 2021, were as follows (amounts in thousands):
| | Fair Value
10/31/2020 | | Purchases
at Cost | | Proceeds
from
Sales | | Net
Realized
Gains
(Losses) | | Capital
Gain
Distributions | | Net
Change in
Unrealized
Appreciation/
Depreciation | | Fair
Value
4/30/21 | | Dividend
Income | |
Sycamore Small Company Opportunity Fund | |
ADTRAN, Inc. | | $ | 28,324 | | | $ | — | | | $ | (417 | ) | | $ | (189 | ) | | $ | — | | | $ | 17,126 | | | $ | 44,844 | | | $ | 475 | | |
AngioDynamics Inc. | | | 43,442 | | | | — | | | | (38,095 | ) | | | (7,047 | ) | | | — | | | | 53,702 | | | | 52,002 | | | | — | | |
Citi Trends, Inc. | | | — | | | | 26,839 | | | | — | | | | — | | | | — | | | | 27,553 | | | | 54,392 | | | | — | | |
Core-Mark Holding Co.
Inc. | | | 68,490 | | | | — | | | | (1,003 | ) | | | 105 | | | | — | | | | 37,744 | | | | 105,336 | | | | 648 | | |
Encore Wire Corp. | | | 49,509 | | | | 3,593 | | | | — | | | | — | | | | — | | | | 32,033 | | | | 85,135 | | | | 46 | | |
Hanger, Inc. | | | 39,179 | | | | 3,881 | | | | (3,836 | ) | | | 414 | | | | — | | | | 16,225 | | | | 55,863 | | | | — | | |
NETGEAR, Inc. | | | 54,958 | | | | 10,324 | | | | (18,131 | ) | | | 3,882 | | | | — | | | | 11,852 | | | | 62,885 | | | | — | | |
ScanSource, Inc. | | | 24,596 | | | | 9,499 | | | | — | | | | — | | | | — | | | | 13,142 | | | | 47,237 | | | | — | | |
Viad Corp. | | | 20,071 | | | | 6,581 | | | | — | | | | — | | | | — | | | | 23,340 | | | | 49,992 | | | | — | | |
| | | $ | 328,569 | | | $ | 60,717 | | | $ | (61,482 | ) | | $ | (2,835 | ) | | $ | — | | | $ | 232,717 | | | $ | 557,686 | | | $ | 1,169 | | |
34
Victory Portfolios | | Supplemental Information
April 30, 2021 | |
(Unaudited)
Proxy Voting and Portfolio Holdings Information
Proxy Voting:
Information regarding the policies and procedures each Fund uses to determine how to vote proxies relating to portfolio securities is available without charge, upon request, by calling 800-539-3863. The information is also included in the Fund's Statement of Additional Information, which is available on the SEC's website at www.sec.gov.
Information relating to how the Funds voted proxies relating to portfolio securities held during the most recent 12 months ended June 30 is available on the SEC's website at www.sec.gov.
Availability of Schedules of Portfolio Investments:
The Trust files a complete list of Schedules of Portfolio Investments with the SEC for the first and third quarter of each fiscal year on Form N-PORT. Forms N-PORT are available on the SEC's website at www.sec.gov.
Expense Examples
As a shareholder of the Funds, you may incur two types of costs: (1) transaction costs, including sales charges (loads) on purchases; and (2) ongoing costs, including management fees, distribution and service (12b-1) fees and other Fund expenses. These examples are intended to help you understand your ongoing costs (in dollars) of investing in the Funds and to compare these costs with the ongoing costs of investing in other mutual funds.
These examples are based on an investment of $1,000 invested at the beginning of the period and held for the entire period from November 1, 2020, through April 30, 2021.
The Actual Expense figures in the table below provide information about actual account values and actual expenses. You may use the information below, together with the amount you invested, to estimate the expenses that you paid over the period. Simply divide your account value by $1,000 (for example, an $8,600 account value divided by $1,000 = 8.6), then multiply the result by the number in the table under the heading entitled "Actual Expenses Paid During Period" to estimate the expenses you paid on your account during this period.
The Hypothetical Expense figures in the table below provide information about hypothetical account values and hypothetical expenses based on each Fund's actual expense ratio and an assumed rate of return of 5% per year before expenses, which is not the Fund's actual return. The hypothetical account values and expenses may not be used to estimate the actual ending account balance or expenses you paid for the period. You may use this information to compare this 5% hypothetical example with the 5% hypothetical examples that appear in shareholder reports of other funds.
Please note the expenses shown in the table are meant to highlight your ongoing costs only and do not reflect any transactional costs. Therefore, the table is useful in comparing ongoing costs only, and will not help you determine the relative total costs of owning different funds. In addition, if these transactional costs were included, your costs would have been higher.
| | | Beginning
Account
Value
11/1/20 | | Actual
Ending
Account
Value
4/30/21 | | Hypothetical
Ending
Account
Value
4/30/21 | | Actual
Expenses
Paid During
Period
11/1/20-4/30/21* | | Hypothetical
Expenses
Paid During
Period
11/1/20-4/30/21* | | Annualized
Expense Ratio
During Period
11/1/20-4/30/21 | |
Sycamore Established Value Fund | |
Class A | | $ | 1,000.00 | | | $ | 1,468.30 | | | $ | 1,020.38 | | | $ | 5.45 | | | $ | 4.46 | | | | 0.89 | % | |
Class C | | | 1,000.00 | | | | 1,462.80 | | | | 1,016.56 | | | | 10.14 | | | | 8.30 | | | | 1.66 | % | |
Class I | | | 1,000.00 | | | | 1,470.40 | | | | 1,021.92 | | | | 3.55 | | | | 2.91 | | | | 0.58 | % | |
Class R | | | 1,000.00 | | | | 1,466.70 | | | | 1,019.34 | | | | 6.73 | | | | 5.51 | | | | 1.10 | % | |
Class R6 | | | 1,000.00 | | | | 1,471.20 | | | | 1,022.12 | | | | 3.31 | | | | 2.71 | | | | 0.54 | % | |
Class Y | | | 1,000.00 | | | | 1,470.40 | | | | 1,021.82 | | | | 3.68 | | | | 3.01 | | | | 0.60 | % | |
35
Victory Portfolios | | Supplemental Information — continued
April 30, 2021 | |
(Unaudited)
| | | Beginning
Account
Value
11/1/20 | | Actual
Ending
Account
Value
4/30/21 | | Hypothetical
Ending
Account
Value
4/30/21 | | Actual
Expenses
Paid During
Period
11/1/20-4/30/21* | | Hypothetical
Expenses
Paid During
Period
11/1/20-4/30/21* | | Annualized
Expense Ratio
During Period
11/1/20-4/30/21 | |
Sycamore Small Company Opportunity Fund | |
Class A | | $ | 1,000.00 | | | $ | 1,489.40 | | | $ | 1,018.70 | | | $ | 7.59 | | | $ | 6.16 | | | | 1.23 | % | |
Class I | | | 1,000.00 | | | | 1,491.80 | | | | 1,020.33 | | | | 5.56 | | | | 4.51 | | | | 0.90 | % | |
Class R | | | 1,000.00 | | | | 1,487.90 | | | | 1,017.80 | | | | 8.70 | | | | 7.05 | | | | 1.41 | % | |
Class R6 | | | 1,000.00 | | | | 1,492.10 | | | | 1,020.63 | | | | 5.19 | | | | 4.21 | | | | 0.84 | % | |
Class Y | | | 1,000.00 | | | | 1,491.00 | | | | 1,019.79 | | | | 6.24 | | | | 5.06 | | | | 1.01 | % | |
* Expenses are equal to the average account value multiplied by the Fund's annualized expense ratio multiplied by 181/365 (the number of days in the most recent fiscal half-year divided by the number of days in the fiscal year).
36
Victory Portfolios | | Supplemental Information — continued
April 30, 2021 | |
(Unaudited)
Considerations of the Board in Continuing the Investment Advisory Agreement (the "Agreement")
The Board approved the Agreement on behalf of the Funds at a meeting, which was called for that purpose, on December 2, 2020. The Board also considered information relating to the Funds and the Agreement provided throughout the year and, more specifically, at a meeting on October 27, 2020, called for the purpose of reviewing the Agreement. In considering whether to approve the Agreement, the Board requested, and the Adviser provided, information that the Board believed to be reasonably necessary to reach its conclusions.
The Board, including the Independent Trustees, evaluated this information along with other information obtained throughout the year and was advised by legal counsel to the Funds, which also serves as independent legal counsel to the Independent Trustees. In addition, the Independent Trustees considered a past review of their overall process for conducting the annual review of the Funds' advisory arrangements by an independent consultant retained through their counsel.
The Board took into consideration regular reports from the Adviser throughout the COVID-19 pandemic public health crisis concerning how the ongoing pandemic has affected market volatility, investment risk and the implementation and effectiveness of business continuity plans. These reports also had confirmed that the pandemic had no material impact on the Adviser's operations.
The Board considered each Fund's advisory fee, expense ratio and investment performance as significant factors in determining whether the Agreement should be continued. In considering whether the compensation paid to the Adviser was fair and reasonable, the Board also evaluated, among other things, the following factors:
• The requirements of the Funds for the services provided by the Adviser;
• The nature, quality and extent of the services provided and expected to be provided;
• The performance of the Funds as compared to comparable funds;
• The fees payable for the services and whether the fee arrangements provided for economies of scale that would benefit Fund shareholders as the Funds grow;
• Whether the fee would be sufficient to enable the Adviser to attract and retain experienced personnel and continue to provide quality services to the Funds;
• The fees paid by other clients of the Adviser whose accounts are managed in a similar investment style and any differences in the services provided to the other clients compared to those provided to the Funds;
• The total expenses of each Fund;
• Management's commitment to operating the Funds at competitive expense levels;
• The profitability of the Adviser (as reflected by comparing fees earned against an estimate of the Adviser's costs) with respect to the Adviser's relationship with the Funds;
• Research and other service benefits received by the Adviser obtained through payment of client commissions for securities transactions;
• Other indirect benefits received by the Adviser, and its affiliates, including revenues paid to the Adviser, or its affiliates, by the Funds for administration and fund accounting services, and distribution;
• The capabilities and financial condition of the Adviser;
• Current economic and industry trends; and
• The historical relationship between each Fund and the Adviser.
The Board reviewed each Fund's current management fee, comprised of the advisory fee plus the administrative services fee paid to the Adviser, in the context of the Adviser's profitability with respect to each Fund individually. In addition, the Board compared each Fund's gross management fee and total operating expense ratio on a net and gross basis with the median gross management fee and median expense ratio of a universe of comparable mutual funds compiled by an independent consultant and a peer group of funds with similar investment strategies selected by that independent consultant from the universe. The Board reviewed the factors and methodology used by the independent consultant in the selection of each Fund's peer group, including the independent consultant's selection of a broad universe of funds, the more specific universe of comparable funds, and peer
37
Victory Portfolios | | Supplemental Information — continued
April 30, 2021 | |
(Unaudited)
groups of funds with comparable investment strategies and asset levels, among other factors. The Board also reviewed any changes to the independent consultant's methodology as compared to the prior year, including those resulting from the Adviser's input, if any. With respect to certain Funds, the Board also reviewed fees and other information related to the Adviser's management of similarly managed institutional or private accounts, and the differences in the services provided to these other accounts. The Board also noted that the breakpoints in the advisory fee schedule evidenced one way in which the Adviser has shown a willingness to share in its economies of scale.
The Board also reviewed the compliance and administrative services provided to the Funds by the Adviser and its affiliates, including the Adviser's oversight of the Funds' day-to-day operations and oversight of Fund accounting, assistance in meeting legal and regulatory requirements, and other services necessary for the operation of the Funds and the Trust.
The Board found that the gross annual management fee paid by each Fund was within the range of management fees paid by each Fund's respective peer group. The Board noted that each Fund's advisory fee structure contained at least one breakpoint. The Board also found that each Fund's Class A net annual expense ratio, taking into account any shareholder servicing or distribution fees, was reasonable as compared with each Fund's respective peer group. The Board considered the Adviser's contractual agreement with each Fund to waive its fees and reimburse expenses of certain classes for a specified period of time, as described in the Fund's prospectus.
The Board reviewed each Fund's performance over one-, three-, five- and ten-year periods against the performance of the Fund's selected peer group and benchmark index. The Board recognized that the performance of the Funds and the peer group funds are net of expenses, while the performance of the benchmark index reflects gross returns.
The Board reviewed various other specific factors with respect to each Fund, as described below. In their deliberations, the Trustees did not rank the importance of any particular information or factor considered and each Trustee may have attributed different weights to various factors.
Sycamore Established Value Fund
The Board compared the Fund's Class A performance for the one-, three-, five- and ten-year periods ended June 30, 2020, to that of the median performance of the Fund's peer group and benchmark index for the same periods and considered the fact that the Fund outperformed both the benchmark index and the peer group median for all of the periods reviewed.
Having considered, among other things: (1) the Fund's management fee compared to comparable mutual funds; (2) the Fund's total expense ratio compared to comparable mutual funds; (3) that the Adviser's willingness to limit the expenses of certain classes for a period of time would provide stability to the Fund's expenses for those share classes during that period; and (4) the Fund's performance during the periods reviewed, the Board concluded that the Agreement continued to be in the best interests of the Fund's shareholders.
Sycamore Small Company Opportunity Fund
The Board compared the Fund's Class A performance for the one-, three-, five- and ten-year periods ended June 30, 2020, to that of the median performance of the Fund's peer group and benchmark index for the same periods and considered the fact that the Fund outperformed both the benchmark index and the peer group median for all of the periods reviewed.
Having considered, among other things: (1) the Fund's management fee compared to comparable mutual funds; (2) the Fund's total expense ratio compared to comparable mutual funds; (3) that the Adviser's willingness to limit the expenses of certain classes for a period of time would provide stability to the Fund's expenses for those share classes during that period; and (4) the Fund's performance during the periods reviewed, the Board concluded that the Agreement continued to be in the best interests of the Fund's shareholders.
38
Victory Portfolios | | Supplemental Information — continued
April 30, 2021 | |
(Unaudited)
Conclusion
Based on its review of the information requested and provided, and following extended discussions, the Board determined that the Agreement, on behalf of the Funds discussed above, was consistent with the best interests of each Fund and its shareholders, and the Board unanimously approved the Agreement, on behalf of each Fund, for an additional annual period on the basis of the foregoing review and discussions and the following considerations, among others:
• The fairness and reasonableness of the investment advisory fee payable to the Adviser under the Agreement in light of the investment advisory services provided, the costs of these services, the profitability of the Adviser's relationship with the Fund and the comparability of the fee paid to the fees paid by other investment companies;
• The nature, quality and extent of the investment advisory services provided by the Adviser;
• The Adviser's entrepreneurial commitment to the management of the Funds and the creation of a broad-based family of funds, which could entail a substantial commitment of the Adviser's resources to the successful operation of the Funds;
• The Adviser's representations regarding its staffing and capabilities to manage the Funds, including the retention of personnel with relevant portfolio management experience;
• The Adviser's efforts to enhance investment results by, among other things, developing quality portfolio management teams; and
• The overall high quality of the personnel, operations, financial condition, investment management capabilities, methodologies and performance of the Adviser.
39
Victory Portfolios | | Supplemental Information — continued
April 30, 2021 | |
(Unaudited)
Liquidity Risk Management Program:
The Funds have adopted and implemented a written liquidity risk management program (the "LRMP") as required by Rule 22e-4 under the Investment Company Act of 1940, as amended. The LRMP is reasonably designed to assess and manage each Fund's liquidity risk, taking into consideration each Fund's investment strategy and the liquidity of its portfolio investments during normal and reasonably foreseeable stressed market conditions; its short- and long-term cash flow projections; and its cash holdings and access to other liquidity management tools such as available funding sources including the Victory Funds Complex Interfund Lending Facility and Line of Credit (discussed in the Notes to Financial Statements). The Victory Funds' Board of Trustees approved the appointment of the Funds' investment adviser, Victory Capital Management Inc. ("Victory Capital"), as the administrator of the LRMP.
Victory Capital manages liquidity risks associated with the Funds' investments by monitoring, among other things, cash and cash equivalents, any use of derivatives, the concentration of investments, the appropriateness of each Fund's investment strategy, and by classifying every Fund investment as either highly liquid, moderately liquid, less liquid or illiquid on at least a monthly basis. To assist with the classification of Fund investments, Victory Capital has retained a third-party provider of liquidity evaluation services. This provider determines preliminary liquidity classifications for all portfolio holdings based upon portfolio-level data and certain assumptions provided by Victory Capital. Victory Capital reviews the preliminary liquidity classifications and, when appropriate, considers other information including input from the Funds' portfolio managers (including the portfolio managers employed by any investment sub-advisers) in determining final liquidity classifications.
At a meeting held on February 18, 2021, Victory Capital provided an oral and written report to the Trustees on the operation and effectiveness of the LRMP during the previous year. The report from Victory Capital concluded that the Funds did not experience any significant liquidity challenges during the covered period, and the Funds' LRMP is reasonably designed to assess and manage its liquidity risk. The report also concluded that the LRMP continues to operate adequately and effectively to enable Victory Capital to oversee and manage liquidity risk and ensure each Fund is able to meet redemption requests without significant dilution to the remaining investors' interest in each Fund. During the review period, each Fund's portfolio consisted primarily of highly liquid investments, which are defined as cash and any investments that the Fund reasonably expects to be converted to cash in current market conditions in three business days or less without significantly changing the market value of the investment. Therefore, the Funds have not adopted a highly liquid investment minimum. The Funds' investments were below the limitation on illiquid investments during the review period. Additionally, Victory Capital indicated that no events occurred that would require the filing of Form N-LIQUID and recommended no material changes to the LRMP.
40
Privacy Policy
Protecting the Privacy of Information
The Trust respects your right to privacy. We also know that you expect us to conduct and process your business in an accurate and efficient manner. To do so, we must collect and maintain certain personal information about you. This is the information we collect from you on applications or other forms, and from the transactions you make with us or third parties. It may include your name, address, social security number, account transactions and balances, and information about investment goals and risk tolerance.
We do not disclose any information about you or about former customers to anyone except as permitted or required by law. Specifically, we may disclose the information we collect to companies that perform services on our behalf, such as the transfer agent that processes shareholder accounts and printers and mailers that assist us in the distribution of investor materials. We may also disclose this information to companies that perform marketing services on our behalf. This allows us to continue to offer you Victory investment products and services that meet your investing needs, and to effect transactions that you request or authorize. These companies will use this information only in connection with the services for which we hired them. They are not permitted to use or share this information for any other purpose.
To protect your personal information internally, we permit access only by authorized employees and maintain physical, electronic and procedural safeguards to guard your personal information.*
* You may have received communications regarding information about privacy policies from other financial institutions which gave you the opportunity to "opt-out" of certain information sharing with companies which are not affiliated with that financial institution. The Trust does not share information with other companies for purposes of marketing solicitations for products other than the Trust. Therefore, the Trust does not provide opt-out options to their shareholders.
Victory Funds
P.O. Box 182593
Columbus, Ohio 43218-2593

Visit our website at: | | Call Victory at: | |
www.vcm.com | | 800-539-FUND (800-539-3863) | |
(b) Not applicable
Item 2. Code of Ethics.
Not applicable – only for annual reports.
Item 3. Audit Committee Financial Expert.
Not applicable – only for annual reports.
Item 4. Principal Accountant Fees and Services.
Not applicable – only for annual reports.
Item 5. Audit Committee of Listed Registrants.
Not applicable.
Item 6. Investments.
Item 7. Disclosure of Proxy Voting Policies and Procedures for Closed-End Management Investment Companies.
Not applicable.
Item 8. Portfolio Managers of Closed-End Management Investment Companies.
Not applicable.
Item 9. Purchases of Equity Securities by Closed-End Management Investment Company and Affiliated Purchasers.
Not applicable.
Item 10. Submission of Matters to a Vote of Security Holders.
Not applicable.
Item 11. Controls and Procedures.
(a)The registrant’s principal executive officer and principal financial officer have concluded, based on their evaluation of the registrant's disclosure controls and procedures as conducted within 90 days of the filing date of this report, that these disclosure controls and procedures are adequately designed and are operating effectively to ensure that information required to be disclosed by the registrant on Form N-CSR is recorded, processed, summarized and reported within the time periods specified in the Securities and Exchange Commission's rules and forms.
(b)There were no changes in the registrant’s internal control over financial reporting (as defined in Rule 30a-3(d) under the Investment Company Act of 1940 (17 CFR 270.30a-3(d)) that occurred during the period covered by this report that have materially affected or are reasonably likely to materially affect, the registrant’s internal control over financial reporting.
Item 12. Disclosure of Securities Lending Activities for Closed-End Management Investment Companies.
(a)(1) Not applicable.
(a)(2) Not applicable.
(a)(3) Not applicable.
(a)(4) Not applicable.
(b) Not applicable.
Item 13. Exhibits.
(a)(1) Not applicable.
(a)(2) Certifications pursuant to Rule 30a-2(a) are attached hereto.
(a)(3) Not applicable.
(b) Certifications pursuant to Rule 30a-2(b) are furnished herewith.
SIGNATURES
Pursuant to the requirements of the Securities Exchange Act of 1934 and the Investment Company Act of 1940, the registrant has duly caused this report to be signed on its behalf by the undersigned, thereunto duly authorized.
| (Registrant) | Victory Portfolios | |
| By (Signature and Title)* | /s/ Allan Shaer | |
| | Allan Shaer, Principal Financial Officer | |
Pursuant to the requirements of the Securities Exchange Act of 1934 and the Investment Company Act of 1940, this report has been signed below by the following persons on behalf of the registrant and in the capacities and on the dates indicated.
| By (Signature and Title)* | /s/ Christopher K. Dyer | |
| | Christopher K. Dyer, Principal Executive Officer | |
| By (Signature and Title)* | /s/ Allan Shaer | |
| | Allan Shaer, Principal Financial Officer | |