UNITED STATES
SECURITIES AND EXCHANGE COMMISSION
Washington, D.C. 20549
FORM N-CSR
CERTIFIED SHAREHOLDER REPORT OF REGISTERED
MANAGEMENT INVESTMENT COMPANIES
Investment Company Act file number: 811-04852
Victory Portfolios
(Exact name of registrant as specified in charter)
4900 Tiedeman Road, 4th Floor, Brooklyn, Ohio 44144
(Address of principal executive offices) (Zip code)
Citi Fund Services Ohio, Inc., 4400 Easton Commons, Suite 200, Columbus, Ohio 43219
(Name and address of agent for service)
Registrant’s telephone number, including area code: 800-539-3863
Date of fiscal year end: December 31
Date of reporting period: June 30, 2021
Item 1. Reports to Stockholders.

June 30, 2021
Semi Annual Report
Victory RS Partners Fund
Victory RS Value Fund
Victory RS Large Cap Alpha Fund
Victory RS Investors Fund
Victory Global Energy Transition Fund
(Formerly Victory Global Natural Resources Fund)
www.vcm.com
News, Information And Education 24 Hours A Day, 7 Days A Week
The Victory Funds site gives fund shareholders, prospective shareholders, and investment professionals a convenient way to access fund information, get guidance, and track fund performance anywhere they can access the Internet. The site includes:
• Detailed performance records
• Daily share prices
• The latest fund news
• Investment resources to help you become a better investor
• A section dedicated to investment professionals
Whether you're a potential investor searching for the fund that matches your investment philosophy, a seasoned investor interested in planning tools, or an investment professional, www.vcm.com has what you seek. Visit us anytime. We're always open.
TABLE OF CONTENTS
Investment Objective and Portfolio
Holdings | | | 3 | | |
Schedules of Portfolio Investments | |
Victory RS Partners Fund | | | 8 | | |
Victory RS Value Fund | | | 11 | | |
Victory RS Large Cap Alpha Fund | | | 14 | | |
Victory RS Investors Fund | | | 16 | | |
Victory Global Energy Transition Fund
(Formerly Victory Global Natural Resources Fund) | | | 18 | | |
Financial Statements | |
Statements of Assets and Liabilities | | | 19 | | |
Statements of Operations | | | 21 | | |
Statements of Changes in Net Assets | | | 23 | | |
Financial Highlights | | | 30 | | |
Notes to Financial Statements | | | 44 | | |
Supplemental Information | | | 53 | | |
Proxy Voting and Portfolio Holdings Information | | | 53 | | |
Expense Examples | | | 53 | | |
Liquidity Risk Management Program | | | 55 | | |
Privacy Policy (inside back cover) | | | |
1
IRA DISTRIBUTION WITHHOLDING DISCLOSURE
We generally must withhold federal income tax at a rate of 10% of the taxable portion of your distribution and, if you live in a state that requires state income tax withholding, at your state's tax rate. However, you may elect not to have withholding apply or to have income tax withheld at a higher rate. Any withholding election that you make will apply to any subsequent distribution unless and until you change or revoke the election. If you wish to make a withholding election, or change or revoke a prior withholding election, call 800-539-3863 (800-235-8396 for Member Class) and form W-4P (OMB No. 1545-0074 withholding certificate for pension or annuity payments) will be electronically sent.
If you do not have a withholding election in place by the date of a distribution, federal income tax will be withheld from the taxable portion of your distribution at a rate of 10%. If you must pay estimated taxes, you may be subject to estimated tax penalties if your estimated tax payments are not sufficient and sufficient tax is not withheld from your distribution.
For more specific information, please consult your tax adviser.
The Funds are distributed by Victory Capital Services, Inc. Victory Capital Management Inc. is the investment adviser to the Funds and receives fees from the Funds for performing services for the Funds.
This report is not authorized for distribution to prospective investors unless preceded or accompanied by a current prospectus of the Victory Funds.
For additional information about any Victory Fund, including fees, expenses, and risks, view our prospectus online at vcm.com or call 800-539-3863 (800-235-8396 for Member Class). Read it carefully before you invest or send money.
The information in this report is based on data obtained from recognized services and sources and is believed to be reliable. Any opinions, projections, or recommendations in this report are subject to change without notice and are not intended as individual investment advice. Past investment performance of the Funds, markets or securities mentioned herein should not be considered to be indicative of future results.
• NOT FDIC INSURED • NO BANK GUARANTEE • MAY LOSE VALUE

Call Victory at:
800-539-FUND (800-539-3863)
800-235-8396 for Member Class
Visit our website at:
www.vcm.com
2
Victory Portfolios
Victory RS Partners Fund | | June 30, 2021 | |
(Unaudited)
Investment Objective and Portfolio Holdings:
The Fund's investment objective seeks to provide long-term capital appreciation.
Top 10 Holdings*:
June 30, 2021
(% of Net Assets)
NCR Corp. | | | 2.8 | % | |
Ameris Bancorp | | | 2.7 | % | |
Euronet Worldwide, Inc. | | | 2.5 | % | |
Carter's, Inc. | | | 2.5 | % | |
Graphic Packaging Holding Co. | | | 2.4 | % | |
Eastern Bankshares, Inc. | | | 2.2 | % | |
Hostess Brands, Inc. | | | 2.1 | % | |
Pinnacle Financial Partners, Inc. | | | 2.1 | % | |
Magnolia Oil & Gas Corp., Class A | | | 2.1 | % | |
Cognyte Software Ltd. | | | 2.1 | % | |
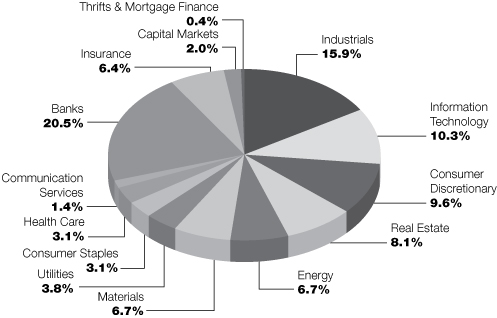
Sector Allocation*:
June 30, 2021
(% of Net Assets)
* Does not include futures contracts, money market instruments, and short-term investments purchased with cash collateral from securities loaned.
Percentages are of the net assets of the Fund and may not equal 100%.
Refer to the Schedule of Portfolio Investments for a complete list of securities.
3
Victory Portfolios
Victory RS Value Fund | | June 30, 2021 | |
(Unaudited)
Investment Objective and Portfolio Holdings:
The Fund's investment objective seeks to provide long-term capital appreciation.
Top 10 Holdings*:
June 30, 2021
(% of Net Assets)
Sealed Air Corp. | | | 3.6 | % | |
Vistra Corp. | | | 3.0 | % | |
Euronet Worldwide, Inc. | | | 2.9 | % | |
Cboe Global Markets, Inc. | | | 2.8 | % | |
Graphic Packaging Holding Co. | | | 2.6 | % | |
NCR Corp. | | | 2.5 | % | |
Herbalife Nutrition Ltd. | | | 2.5 | % | |
Fiserv, Inc. | | | 2.4 | % | |
Carter's, Inc. | | | 2.3 | % | |
Citizens Financial Group, Inc. | | | 2.3 | % | |
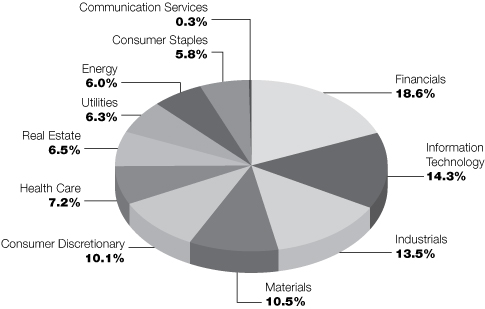
Sector Allocation*:
June 30, 2021
(% of Net Assets)
* Does not include futures contracts, money market instruments, and short-term investments purchased with cash collateral from securities loaned.
Percentages are of the net assets of the Fund and may not equal 100%.
Refer to the Schedule of Portfolio Investments for a complete list of securities.
4
Victory Portfolios
Victory RS Large Cap Alpha Fund | | June 30, 2021 | |
(Unaudited)
Investment Objective and Portfolio Holdings:
The Fund's investment objective seeks to provide long-term capital appreciation.
Top 10 Holdings*:
June 30, 2021
(% of Net Assets)
Sealed Air Corp. | | | 3.7 | % | |
Keurig Dr Pepper, Inc. | | | 3.5 | % | |
Cboe Global Markets, Inc. | | | 3.5 | % | |
Facebook, Inc., Class A | | | 3.1 | % | |
Mondelez International, Inc., Class A | | | 3.1 | % | |
Vistra Corp. | | | 2.9 | % | |
U.S. Bancorp | | | 2.8 | % | |
Hill-Rom Holdings, Inc. | | | 2.8 | % | |
Comerica, Inc. | | | 2.8 | % | |
Citigroup, Inc. | | | 2.8 | % | |
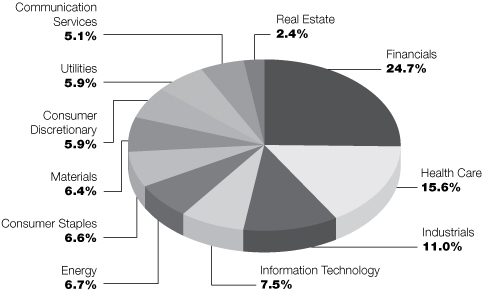
Sector Allocation*:
June 30, 2021
(% of Net Assets)
* Does not include futures contracts, money market instruments, and short-term investments purchased with cash collateral from securities loaned.
Percentages are of the net assets of the Fund and may not equal 100%.
Refer to the Schedule of Portfolio Investments for a complete list of securities.
5
Victory Portfolios
Victory RS Investors Fund | | June 30, 2021 | |
(Unaudited)
Investment Objective and Portfolio Holdings:
The Fund's investment objective seeks to provide long-term capital appreciation.
Top 10 Holdings*:
June 30, 2021
(% of Net Assets)
Sealed Air Corp. | | | 5.5 | % | |
Vistra Corp. | | | 5.3 | % | |
Olin Corp. | | | 4.8 | % | |
Keurig Dr Pepper, Inc. | | | 4.7 | % | |
Graphic Packaging Holding Co. | | | 4.0 | % | |
Comerica, Inc. | | | 3.9 | % | |
Facebook, Inc., Class A | | | 3.9 | % | |
Herbalife Nutrition Ltd. | | | 3.8 | % | |
Alleghany Corp. | | | 3.7 | % | |
Citizens Financial Group, Inc. | | | 3.6 | % | |
Sector Allocation*:
June 30, 2021
(% of Net Assets)

* Does not include futures contracts, money market instruments, and short-term investments purchased with cash collateral from securities loaned.
Percentages are of the net assets of the Fund and may not equal 100%.
Refer to the Schedule of Portfolio Investments for a complete list of securities.
6
Victory Portfolios
Victory Global Energy Transition Fund | | June 30, 2021 | |
(Unaudited)
Investment Objective and Portfolio Holdings:
The Fund's investment objective seeks to provide long-term capital appreciation.
Top 10 Holdings*:
June 30, 2021
(% of Net Assets)
Turquoise Hill Resources Ltd. | | | 14.6 | % | |
Range Resources Corp. | | | 9.7 | % | |
Antero Resources Corp. | | | 9.5 | % | |
Whitecap Resources, Inc. | | | 8.0 | % | |
First Quantum Minerals Ltd. | | | 5.8 | % | |
Tourmaline Oil Corp. | | | 4.7 | % | |
Cameco Corp. | | | 4.6 | % | |
ARC Resources Ltd. | | | 4.5 | % | |
Peyto Exploration & Development Corp. | | | 4.5 | % | |
PDC Energy, Inc. | | | 4.3 | % | |
Sector Allocation*:
June 30, 2021
(% of Net Assets)

* Does not include futures contracts, money market instruments, and short-term investments purchased with cash collateral from securities loaned.
Percentages are of the net assets of the Fund and may not equal 100%.
Refer to the Schedule of Portfolio Investments for a complete list of securities.
7
Victory Portfolios
Victory RS Partners Fund | | Schedule of Portfolio Investments
June 30, 2021 | |
(Unaudited)
Security Description | | Shares | | Value | |
Common Stocks (97.8%) | |
Banks (20.5%): | |
Ameris Bancorp | | | 201,850 | | | $ | 10,219,666 | | |
Associated Bancorp | | | 228,560 | | | | 4,680,909 | | |
Banner Corp. | | | 132,120 | | | | 7,162,225 | | |
Columbia Banking System, Inc. | | | 97,986 | | | | 3,778,340 | | |
Eastern Bankshares, Inc. | | | 406,120 | | | | 8,353,888 | | |
Independent Bank Corp. | | | 45,300 | | | | 3,420,150 | | |
Investors Bancorp, Inc. | | | 455,820 | | | | 6,499,993 | | |
Pacific Premier Bancorp, Inc. | | | 120,490 | | | | 5,095,522 | | |
Pinnacle Financial Partners, Inc. | | | 93,100 | | | | 8,219,799 | | |
South State Corp. | | | 77,790 | | | | 6,360,111 | | |
Synovus Financial Corp. | | | 115,840 | | | | 5,083,059 | | |
Texas Capital Bancshares, Inc. (a) | | | 59,500 | | | | 3,777,655 | | |
UMB Financial Corp. | | | 67,652 | | | | 6,295,695 | | |
| | | | 78,947,012 | | |
Capital Markets (2.0%): | |
Federated Hermes, Inc. | | | 226,120 | | | | 7,667,729 | | |
Communication Services (1.4%): | |
Madison Square Garden Sports Corp. (a) | | | 17,310 | | | | 2,987,187 | | |
World Wrestling Entertainment, Inc., Class A (b) | | | 41,630 | | | | 2,409,960 | | |
| | | | 5,397,147 | | |
Consumer Discretionary (9.6%): | |
Brinker International, Inc. (a) | | | 45,100 | | | | 2,789,435 | | |
Carter's, Inc. | | | 92,520 | | | | 9,545,288 | | |
Dana, Inc. | | | 277,480 | | | | 6,592,925 | | |
Penske Automotive Group, Inc. | | | 40,261 | | | | 3,039,303 | | |
Taylor Morrison Home Corp. (a) | | | 185,320 | | | | 4,896,154 | | |
Wolverine World Wide, Inc. | | | 117,160 | | | | 3,941,262 | | |
WW International, Inc. (a) | | | 169,290 | | | | 6,118,141 | | |
| | | | 36,922,508 | | |
Consumer Staples (3.1%): | |
Herbalife Nutrition Ltd. (a) | | | 72,170 | | | | 3,805,524 | | |
Hostess Brands, Inc. (a) (b) | | | 510,421 | | | | 8,263,716 | | |
| | | | 12,069,240 | | |
Energy (6.7%): | |
California Resources Corp. (a) (b) | | | 237,370 | | | | 7,154,332 | | |
Magnolia Oil & Gas Corp., Class A (a) | | | 518,750 | | | | 8,108,063 | | |
National Energy Services Reunited Corp. (a) | | | 203,420 | | | | 2,898,735 | | |
PDC Energy, Inc. | | | 166,480 | | | | 7,623,119 | | |
| | | | 25,784,249 | | |
Health Care (2.9%): | |
The Ensign Group, Inc. | | | 45,260 | | | | 3,922,684 | | |
Tivity Health, Inc. (a) (b) | | | 270,910 | | | | 7,127,642 | | |
| | | | 11,050,326 | | |
See notes to financial statements.
8
Victory Portfolios
Victory RS Partners Fund | | Schedule of Portfolio Investments — continued
June 30, 2021 | |
(Unaudited)
Security Description | | Shares | | Value | |
Industrials (15.9%): | |
Altra Industrial Motion Corp. | | | 60,360 | | | $ | 3,924,607 | | |
American Woodmark Corp. (a) (b) | | | 31,550 | | | | 2,577,320 | | |
ArcBest Corp. | | | 100,640 | | | | 5,856,242 | | |
Atkore, Inc. (a) | | | 77,560 | | | | 5,506,760 | | |
Crane Co. | | | 23,530 | | | | 2,173,466 | | |
Evoqua Water Technologies Corp. (a) | | | 75,800 | | | | 2,560,524 | | |
Finning International, Inc. | | | 146,940 | | | | 3,847,187 | | |
GMS, Inc. (a) | | | 148,980 | | | | 7,171,897 | | |
GrafTech International Ltd. | | | 493,300 | | | | 5,732,146 | | |
H&E Equipment Services, Inc. (b) | | | 91,820 | | | | 3,054,851 | | |
McGrath RentCorp | | | 39,870 | | | | 3,252,196 | | |
Meritor, Inc. (a) | | | 234,470 | | | | 5,491,287 | | |
Primoris Services Corp. (b) | | | 165,480 | | | | 4,870,076 | | |
Ryder System, Inc. | | | 33,340 | | | | 2,478,162 | | |
SkyWest, Inc. (a) | | | 64,710 | | | | 2,787,060 | | |
| | | | 61,283,781 | | |
Information Technology (10.3%): | |
Cognyte Software Ltd. (a) | | | 324,070 | | | | 7,939,715 | | |
Euronet Worldwide, Inc. (a) | | | 72,510 | | | | 9,814,229 | | |
NCR Corp. (a) | | | 235,350 | | | | 10,734,313 | | |
Verint Systems, Inc. (a) | | | 165,030 | | | | 7,437,902 | | |
Verra Mobility Corp. (a) | | | 252,040 | | | | 3,873,855 | | |
| | | | 39,800,014 | | |
Insurance (6.4%): | |
Alleghany Corp. (a) | | | 8,850 | | | | 5,903,569 | | |
Axis Capital Holdings Ltd. | | | 118,920 | | | | 5,828,269 | | |
Globe Life, Inc. | | | 56,410 | | | | 5,373,053 | | |
James River Group Holdings Ltd. | | | 42,940 | | | | 1,611,109 | | |
Primerica, Inc. | | | 37,963 | | | | 5,813,654 | | |
| | | | 24,529,654 | | |
Materials (6.7%): | |
Constellium SE (a) (b) | | | 248,680 | | | | 4,712,486 | | |
Graphic Packaging Holding Co. | | | 517,040 | | | | 9,379,106 | | |
Olin Corp. | | | 126,700 | | | | 5,861,142 | | |
Summit Materials, Inc., Class A (a) | | | 170,017 | | | | 5,925,092 | | |
| | | | 25,877,826 | | |
Real Estate (8.1%): | |
Four Corners Property Trust, Inc. | | | 164,850 | | | | 4,551,508 | | |
Jones Lang LaSalle, Inc. (a) | | | 38,530 | | | | 7,531,074 | | |
Kennedy-Wilson Holdings, Inc. | | | 225,680 | | | | 4,484,262 | | |
Spirit Realty Capital, Inc. | | | 106,660 | | | | 5,102,614 | | |
Sunstone Hotel Investors, Inc. (a) | | | 604,180 | | | | 7,503,916 | | |
Washington Real Estate Investment Trust | | | 88,530 | | | | 2,036,190 | | |
| | | | 31,209,564 | | |
Thrifts & Mortgage Finance (0.4%): | |
PCSB Financial Corp. | | | 96,940 | | | | 1,761,400 | | |
See notes to financial statements.
9
Victory Portfolios
Victory RS Partners Fund | | Schedule of Portfolio Investments — continued
June 30, 2021 | |
(Unaudited)
Security Description | | Shares | | Value | |
Utilities (3.8%): | |
Black Hills Corp. | | | 76,905 | | | $ | 5,047,275 | | |
NorthWestern Corp. | | | 77,540 | | | | 4,669,459 | | |
South Jersey Industries, Inc. | | | 186,030 | | | | 4,823,758 | | |
| | | | 14,540,492 | | |
Total Common Stocks (Cost $265,649,095) | | | 376,840,942 | | |
Preferred Stocks (0.2%) | |
Health Care (0.2%): | |
WellDoc, Inc. Series B (a) (c) (d) | | | 1,587,483 | | | | 587,369 | | |
Total Preferred Stocks (Cost $1,942,921) | | | 587,369 | | |
Collateral for Securities Loaned^ (3.6%) | |
BlackRock Liquidity Funds TempFund Portfolio, Institutional Class, 0.04% (e) | | | 277,597 | | | | 277,597 | | |
Fidelity Investments Money Market Government Portfolio I Shares, 0.01% (e) | | | 7,519,210 | | | | 7,519,210 | | |
Goldman Sachs Financial Square Prime Obligations Fund, Institutional
Class, 0.02% (e) | | | 138,535 | | | | 138,535 | | |
JPMorgan Prime Money Market Fund, Capital Class, 0.07% (e) | | | 1,104,632 | | | | 1,104,632 | | |
Morgan Stanley Institutional Liquidity Prime Portfolio, Institutional
Class, 0.06% (e) | | | 4,966,643 | | | | 4,966,643 | | |
Total Collateral for Securities Loaned (Cost $14,006,617) | | | 14,006,617 | | |
Total Investments (Cost $281,598,633) — 101.6% | | | 391,434,928 | | |
Liabilities in excess of other assets — (1.6)% | | | (6,267,820 | ) | |
NET ASSETS — 100.00% | | $ | 385,167,108 | | |
^ Purchased with cash collateral from securities on loan.
(a) Non-income producing security.
(b) All or a portion of this security is on loan.
(c) Security was fair valued based upon procedures approved by the Board of Trustees and represents 0.2% of net assets as of June 30, 2021. This security is classified as Level 3 within the fair value hierarchy. (See Note 2 in the Notes to Financial Statements)
(d) The Fund's Adviser has deemed this security to be illiquid based upon procedures approved by the Board of Trustees and has classified it as a Level 3 security. As of June 30, 2021, illiquid securities were 0.2% of net assets.
(e) Rate disclosed is the daily yield on June 30, 2021.
See notes to financial statements.
10
Victory Portfolios
Victory RS Value Fund | | Schedule of Portfolio Investments
June 30, 2021 | |
(Unaudited)
Security Description | | Shares | | Value | |
Common Stocks (99.1%) | |
Communication Services (0.3%): | |
World Wrestling Entertainment, Inc., Class A | | | 19,440 | | | $ | 1,125,382 | | |
Consumer Discretionary (10.1%): | |
Adient PLC (a) | | | 159,200 | | | | 7,195,840 | | |
Carter's, Inc. | | | 75,770 | | | | 7,817,191 | | |
Dollar Tree, Inc. (a) | | | 49,310 | | | | 4,906,345 | | |
LKQ Corp. (a) | | | 122,890 | | | | 6,048,646 | | |
Magna International, Inc. | | | 17,880 | | | | 1,656,403 | | |
Taylor Morrison Home Corp. (a) | | | 129,040 | | | | 3,409,237 | | |
WW International, Inc. (a) | | | 89,510 | | | | 3,234,891 | | |
| | | | 34,268,553 | | |
Consumer Staples (5.8%): | |
Herbalife Nutrition Ltd. (a) | | | 160,000 | | | | 8,436,800 | | |
Hostess Brands, Inc. (a) (b) | | | 409,200 | | | | 6,624,948 | | |
Keurig Dr Pepper, Inc. | | | 130,575 | | | | 4,601,463 | | |
| | | | 19,663,211 | | |
Energy (6.0%): | |
Baker Hughes Co. (b) | | | 137,630 | | | | 3,147,598 | | |
Chesapeake Energy Corp. (b) | | | 111,010 | | | | 5,763,639 | | |
Devon Energy Corp. | | | 245,240 | | | | 7,158,556 | | |
Magnolia Oil & Gas Corp., Class A (a) (b) | | | 278,360 | | | | 4,350,767 | | |
| | | | 20,420,560 | | |
Financials (18.6%): | |
Aflac, Inc. | | | 94,240 | | | | 5,056,918 | | |
Alleghany Corp. (a) | | | 9,800 | | | | 6,537,286 | | |
Cboe Global Markets, Inc. | | | 80,570 | | | | 9,591,859 | | |
Citizens Financial Group, Inc. | | | 169,820 | | | | 7,789,643 | | |
Federated Hermes, Inc. | | | 165,260 | | | | 5,603,967 | | |
First Horizon Corp. | | | 306,350 | | | | 5,293,728 | | |
Globe Life, Inc. | | | 68,150 | | | | 6,491,288 | | |
Hancock Whitney Corp. | | | 91,020 | | | | 4,044,929 | | |
KeyCorp | | | 362,550 | | | | 7,486,657 | | |
RenaissanceRe Holdings Ltd. | | | 33,750 | | | | 5,022,675 | | |
| | | | 62,918,950 | | |
Health Care (7.2%): | |
Hill-Rom Holdings, Inc. | | | 62,170 | | | | 7,061,890 | | |
Humana, Inc. | | | 15,530 | | | | 6,875,442 | | |
Quest Diagnostics, Inc. | | | 26,050 | | | | 3,437,818 | | |
Sotera Health Co. (a) (b) | | | 145,590 | | | | 3,527,646 | | |
Zimmer Biomet Holdings, Inc. | | | 22,410 | | | | 3,603,976 | | |
| | | | 24,506,772 | | |
See notes to financial statements.
11
Victory Portfolios
Victory RS Value Fund | | Schedule of Portfolio Investments — continued
June 30, 2021 | |
(Unaudited)
Security Description | | Shares | | Value | |
Industrials (13.5%): | |
Allison Transmission Holdings, Inc. | | | 78,490 | | | $ | 3,119,193 | | |
Carrier Global Corp. | | | 55,910 | | | | 2,717,226 | | |
Crane Co. | | | 36,360 | | | | 3,358,573 | | |
Curtiss-Wright Corp. | | | 40,950 | | | | 4,863,222 | | |
Fluor Corp. (a) (b) | | | 228,040 | | | | 4,036,308 | | |
GrafTech International Ltd. | | | 397,370 | | | | 4,617,439 | | |
nVent Electric PLC | | | 120,650 | | | | 3,769,106 | | |
Sensata Technologies Holding PLC (a) | | | 119,100 | | | | 6,904,227 | | |
Textron, Inc. | | | 30,330 | | | | 2,085,794 | | |
TFI International, Inc. | | | 55,410 | | | | 5,052,838 | | |
The Timken Co. | | | 30,760 | | | | 2,478,948 | | |
United Rentals, Inc. (a) | | | 9,050 | | | | 2,887,041 | | |
| | | | 45,889,915 | | |
Information Technology (14.3%): | |
Cognyte Software Ltd. (a) | | | 317,870 | | | | 7,787,815 | | |
Euronet Worldwide, Inc. (a) | | | 71,793 | | | | 9,717,183 | | |
Fiserv, Inc. (a) | | | 76,970 | | | | 8,227,323 | | |
FleetCor Technologies, Inc. (a) | | | 16,200 | | | | 4,148,172 | | |
Leidos Holdings, Inc. | | | 32,770 | | | | 3,313,047 | | |
NCR Corp. (a) | | | 187,850 | | | | 8,567,838 | | |
Verint Systems, Inc. (a) | | | 147,840 | | | | 6,663,149 | | |
| | | | 48,424,527 | | |
Materials (10.5%): | |
Graphic Packaging Holding Co. | | | 490,170 | | | | 8,891,684 | | |
Olin Corp. | | | 157,980 | | | | 7,308,155 | | |
Sealed Air Corp. | | | 205,360 | | | | 12,167,580 | | |
Summit Materials, Inc., Class A (a) | | | 161,280 | | | | 5,620,608 | | |
The Mosaic Co. | | | 48,840 | | | | 1,558,484 | | |
| | | | 35,546,511 | | |
Real Estate (6.5%): | |
Americold Realty Trust | | | 87,370 | | | | 3,306,955 | | |
Healthcare Trust of America, Inc., Class A | | | 157,440 | | | | 4,203,648 | | |
Highwoods Properties, Inc. | | | 78,460 | | | | 3,544,038 | | |
Host Hotels & Resorts, Inc. (a) | | | 145,690 | | | | 2,489,842 | | |
MGM Growth Properties LLC, Series A | | | 99,070 | | | | 3,627,943 | | |
Spirit Realty Capital, Inc. | | | 104,120 | | | | 4,981,101 | | |
| | | | 22,153,527 | | |
Utilities (6.3%): | |
Evergy, Inc. | | | 53,140 | | | | 3,211,250 | | |
FirstEnergy Corp. | | | 92,570 | | | | 3,444,530 | | |
The AES Corp. | | | 175,690 | | | | 4,580,238 | | |
Vistra Corp. | | | 549,600 | | | | 10,195,080 | | |
| | | | 21,431,098 | | |
Total Common Stocks (Cost $260,369,970) | | | 336,349,006 | | |
See notes to financial statements.
12
Victory Portfolios
Victory RS Value Fund | | Schedule of Portfolio Investments — continued
June 30, 2021 | |
(Unaudited)
Security Description | | Shares | | Value | |
Collateral for Securities Loaned^ (3.6%) | |
BlackRock Liquidity Funds TempFund Portfolio, Institutional Class, 0.04% (c) | | | 239,073 | | | $ | 239,073 | | |
Fidelity Investments Money Market Government Portfolio I Shares, 0.01% (c) | | | 6,475,713 | | | | 6,475,713 | | |
Goldman Sachs Financial Square Prime Obligations Fund, Institutional
Class, 0.02% (c) | | | 119,309 | | | | 119,309 | | |
JPMorgan Prime Money Market Fund, Capital Class, 0.07% (c) | | | 951,334 | | | | 951,334 | | |
Morgan Stanley Institutional Liquidity Prime Portfolio, Institutional
Class, 0.06% (c) | | | 4,277,384 | | | | 4,277,384 | | |
Total Collateral for Securities Loaned (Cost $12,062,813) | | | 12,062,813 | | |
Total Investments (Cost $272,432,783) — 102.7% | | | 348,411,819 | | |
Liabilities in excess of other assets — (2.7)% | | | (9,007,082 | ) | |
NET ASSETS — 100.00% | | $ | 339,404,737 | | |
^ Purchased with cash collateral from securities on loan.
(a) Non-income producing security.
(b) All or a portion of this security is on loan.
(c) Rate disclosed is the daily yield on June 30, 2021.
LLC — Limited Liability Company
PLC — Public Limited Company
See notes to financial statements.
13
Victory Portfolios
Victory RS Large Cap Alpha Fund | | Schedule of Portfolio Investments
June 30, 2021 | |
(Unaudited)
Security Description | | Shares | | Value | |
Common Stocks (97.8%) | |
Communication Services (5.1%): | |
Alphabet, Inc., Class A (a) | | | 4,260 | | | $ | 10,402,025 | | |
Facebook, Inc., Class A (a) | | | 46,790 | | | | 16,269,351 | | |
| | | | 26,671,376 | | |
Consumer Discretionary (5.9%): | |
Dollar Tree, Inc. (a) | | | 79,980 | | | | 7,958,010 | | |
General Motors Co. (a) | | | 136,480 | | | | 8,075,521 | | |
LKQ Corp. (a) | | | 188,750 | | | | 9,290,275 | | |
Magna International, Inc. | | | 59,640 | | | | 5,525,050 | | |
| | | | 30,848,856 | | |
Consumer Staples (6.6%): | |
Keurig Dr Pepper, Inc. | | | 526,310 | | | | 18,547,164 | | |
Mondelez International, Inc., Class A | | | 256,560 | | | | 16,019,607 | | |
| | | | 34,566,771 | | |
Energy (6.7%): | |
Enterprise Products Partners LP | | | 462,030 | | | | 11,148,784 | | |
Hess Corp. | | | 118,210 | | | | 10,322,097 | | |
Pioneer Natural Resources Co. | | | 52,860 | | | | 8,590,807 | | |
Valero Energy Corp. | | | 67,380 | | | | 5,261,031 | | |
| | | | 35,322,719 | | |
Financials (24.7%): | |
Aflac, Inc. | | | 184,420 | | | | 9,895,977 | | |
Bank of America Corp. | | | 192,900 | | | | 7,953,267 | | |
Cboe Global Markets, Inc. | | | 152,610 | | | | 18,168,221 | | |
Citigroup, Inc. | | | 209,220 | | | | 14,802,315 | | |
Comerica, Inc. | | | 207,610 | | | | 14,810,897 | | |
Discover Financial Services | | | 90,910 | | | | 10,753,744 | | |
JPMorgan Chase & Co. | | | 66,920 | | | | 10,408,737 | | |
KeyCorp | | | 512,910 | | | | 10,591,592 | | |
RenaissanceRe Holdings Ltd. | | | 72,550 | | | | 10,796,891 | | |
U.S. Bancorp | | | 261,650 | | | | 14,906,200 | | |
Voya Financial, Inc. | | | 104,500 | | | | 6,426,750 | | |
| | | | 129,514,591 | | |
Health Care (15.6%): | |
AbbVie, Inc. | | | 45,720 | | | | 5,149,901 | | |
Cigna Corp. | | | 60,830 | | | | 14,420,968 | | |
Hill-Rom Holdings, Inc. | | | 130,580 | | | | 14,832,582 | | |
Humana, Inc. | | | 27,530 | | | | 12,188,082 | | |
Johnson & Johnson | | | 47,710 | | | | 7,859,745 | | |
Medtronic PLC | | | 92,840 | | | | 11,524,229 | | |
Quest Diagnostics, Inc. | | | 53,570 | | | | 7,069,633 | | |
UnitedHealth Group, Inc. | | | 22,525 | | | | 9,019,911 | | |
| | | | 82,065,051 | | |
See notes to financial statements.
14
Victory Portfolios
Victory RS Large Cap Alpha Fund | | Schedule of Portfolio Investments — continued
June 30, 2021 | |
(Unaudited)
Security Description | | Shares | | Value | |
Industrials (11.0%): | |
3M Co. | | | 27,080 | | | $ | 5,378,900 | | |
Eaton Corp. PLC | | | 45,920 | | | | 6,804,426 | | |
Johnson Controls International PLC | | | 144,510 | | | | 9,917,721 | | |
L3Harris Technologies, Inc. | | | 23,790 | | | | 5,142,208 | | |
Parker-Hannifin Corp. | | | 22,480 | | | | 6,903,833 | | |
Raytheon Technologies Corp. | | | 73,872 | | | | 6,302,020 | | |
Sensata Technologies Holding PLC (a) | | | 142,910 | | | | 8,284,493 | | |
Union Pacific Corp. | | | 40,100 | | | | 8,819,193 | | |
| | | | 57,552,794 | | |
Information Technology (7.5%): | |
Euronet Worldwide, Inc. (a) | | | 94,550 | | | | 12,797,343 | | |
Fidelity National Information Services, Inc. | | | 62,570 | | | | 8,864,292 | | |
FleetCor Technologies, Inc. (a) | | | 43,090 | | | | 11,033,625 | | |
Leidos Holdings, Inc. | | | 65,410 | | | | 6,612,951 | | |
| | | | 39,308,211 | | |
Materials (6.4%): | |
Freeport-McMoRan, Inc. | | | 128,330 | | | | 4,762,326 | | |
Sealed Air Corp. | | | 329,432 | | | | 19,518,846 | | |
Vale SA, ADR | | | 413,940 | | | | 9,441,972 | | |
| | | | 33,723,144 | | |
Real Estate (2.4%): | |
Host Hotels & Resorts, Inc. (a) | | | 745,600 | | | | 12,742,304 | | |
Utilities (5.9%): | |
Exelon Corp. | | | 252,760 | | | | 11,199,796 | | |
FirstEnergy Corp. | | | 118,750 | | | | 4,418,687 | | |
Vistra Corp. | | | 818,980 | | | | 15,192,079 | | |
| | | | 30,810,562 | | |
Total Common Stocks (Cost $377,320,773) | | | 513,126,379 | | |
Total Investments (Cost $377,320,773) — 97.8% | | | 513,126,379 | | |
Other assets in excess of liabilities — 2.2% | | | 11,514,881 | | |
NET ASSETS — 100.00% | | $ | 524,641,260 | | |
(a) Non-income producing security.
ADR — American Depositary Receipt
LP — Limited Partnership
PLC — Public Limited Company
See notes to financial statements.
15
Victory Portfolios
Victory RS Investors Fund | | Schedule of Portfolio Investments
June 30, 2021 | |
(Unaudited)
Security Description | | Shares | | Value | |
Common Stocks (96.6%) | |
Banks (16.2%): | |
Citigroup, Inc. | | | 12,800 | | | $ | 905,600 | | |
Citizens Financial Group, Inc. | | | 24,780 | | | | 1,136,659 | | |
Comerica, Inc. | | | 17,040 | | | | 1,215,633 | | |
First Horizon Corp. | | | 52,920 | | | | 914,458 | | |
KeyCorp | | | 43,670 | | | | 901,785 | | |
| | | | 5,074,135 | | |
Capital Markets (3.5%): | |
Cboe Global Markets, Inc. | | | 9,170 | | | | 1,091,688 | | |
Communication Services (7.1%): | |
Alphabet, Inc., Class A (a) | | | 412 | | | | 1,006,017 | | |
Facebook, Inc., Class A (a) | | | 3,470 | | | | 1,206,554 | | |
| | | | 2,212,571 | | |
Consumer Discretionary (5.5%): | |
Carter's, Inc. | | | 9,000 | | | | 928,530 | | |
LKQ Corp. (a) | | | 16,110 | | | | 792,934 | | |
| | | | 1,721,464 | | |
Consumer Staples (8.5%): | |
Herbalife Nutrition Ltd. (a) | | | 22,460 | | | | 1,184,316 | | |
Keurig Dr Pepper, Inc. | | | 41,900 | | | | 1,476,556 | | |
| | | | 2,660,872 | | |
Energy (3.4%): | |
PDC Energy, Inc. | | | 23,030 | | | | 1,054,544 | | |
Health Care (8.2%): | |
Cigna Corp. | | | 4,300 | | | | 1,019,401 | | |
Hill-Rom Holdings, Inc. | | | 8,300 | | | | 942,797 | | |
Humana, Inc. | | | 1,330 | | | | 588,818 | | |
| | | | 2,551,016 | | |
Industrials (7.1%): | |
Fluor Corp. (a) | | | 49,460 | | | | 875,442 | | |
Meritor, Inc. (a) | | | 30,890 | | | | 723,444 | | |
TFI International, Inc. | | | 6,910 | | | | 630,954 | | |
| | | | 2,229,840 | | |
Information Technology (10.9%): | |
Cognyte Software Ltd. (a) | | | 33,320 | | | | 816,340 | | |
Euronet Worldwide, Inc. (a) | | | 7,620 | | | | 1,031,367 | | |
NCR Corp. (a) | | | 17,000 | | | | 775,370 | | |
Verint Systems, Inc. (a) | | | 17,660 | | | | 795,936 | | |
| | | | 3,419,013 | | |
Insurance (6.6%): | |
Alleghany Corp. (a) | | | 1,730 | | | | 1,154,031 | | |
RenaissanceRe Holdings Ltd. | | | 6,080 | | | | 904,826 | | |
| | | | 2,058,857 | | |
See notes to financial statements.
16
Victory Portfolios
Victory RS Investors Fund | | Schedule of Portfolio Investments — continued
June 30, 2021 | |
(Unaudited)
Security Description | | Shares | | Value | |
Materials (14.3%): | |
Graphic Packaging Holding Co. | | | 68,510 | | | $ | 1,242,771 | | |
Olin Corp. | | | 32,750 | | | | 1,515,015 | | |
Sealed Air Corp. | | | 28,950 | | | | 1,715,288 | | |
| | | | 4,473,074 | | |
Utilities (5.3%): | |
Vistra Corp. | | | 89,920 | | | | 1,668,016 | | |
Total Common Stocks (Cost $23,652,614) | | | 30,215,090 | | |
Total Investments (Cost $23,652,614) — 96.6% | | | 30,215,090 | | |
Other assets in excess of liabilities — 3.4% | | | 1,075,648 | | |
NET ASSETS — 100.00% | | $ | 31,290,738 | | |
(a) Non-income producing security.
See notes to financial statements.
17
Victory Portfolios
Victory Global Energy Transition Fund | | Schedule of Portfolio Investments
June 30, 2021 | |
(Unaudited)
Security Description | | Shares | | Value | |
Common Stocks (90.4%) | |
Chemicals (4.9%): | |
Linde PLC | | | 26,843 | | | $ | 7,760,311 | | |
Sociedad Quimica y Minera de Chile SA, ADR | | | 159,856 | | | | 7,565,985 | | |
| | | | 15,326,296 | | |
Metals & Mining (29.9%): | |
Antofagasta PLC | | | 336,745 | | | | 6,685,903 | | |
First Quantum Minerals Ltd. | | | 789,269 | | | | 18,193,816 | | |
Lundin Mining Corp. | | | 854,140 | | | | 7,704,764 | | |
Newmont Corp. | | | 171,311 | | | | 10,857,691 | | |
Rio Tinto PLC, ADR (a) | | | 53,759 | | | | 4,509,842 | | |
Turquoise Hill Resources Ltd. (a) (b) | | | 2,707,933 | | | | 45,682,830 | | |
| | | | 93,634,846 | | |
Oil, Gas & Consumable Fuels (55.6%): | |
Antero Resources Corp. (b) | | | 1,985,543 | | | | 29,842,711 | | |
ARC Resources Ltd. | | | 1,665,648 | | | | 14,178,301 | | |
Cameco Corp. | | | 756,886 | | | | 14,509,933 | | |
Cheniere Energy, Inc. (b) | | | 114,368 | | | | 9,920,281 | | |
PDC Energy, Inc. | | | 294,166 | | | | 13,469,861 | | |
Peyto Exploration & Development Corp. | | | 2,085,250 | | | | 14,048,602 | | |
Pioneer Natural Resources Co. | | | 47,854 | | | | 7,777,232 | | |
Range Resources Corp. (b) | | | 1,814,820 | | | | 30,416,383 | | |
Tourmaline Oil Corp. (a) | | | 514,635 | | | | 14,711,569 | | |
Whitecap Resources, Inc. | | | 5,042,982 | | | | 25,064,361 | | |
| | | | 173,939,234 | | |
Total Common Stocks (Cost $183,205,428) | | | 282,900,376 | | |
Collateral for Securities Loaned^ (5.6%) | |
BlackRock Liquidity Funds TempFund Portfolio, Institutional Class, 0.04% (c) | | | 348,678 | | | | 348,678 | | |
Fidelity Investments Money Market Government Portfolio I Shares, 0.01% (c) | | | 9,444,553 | | | | 9,444,553 | | |
Goldman Sachs Financial Square Prime Obligations Fund, Institutional
Class, 0.02% (c) | | | 174,007 | | | | 174,007 | | |
JPMorgan Prime Money Market Fund, Capital Class, 0.07% (c) | | | 1,387,481 | | | | 1,387,481 | | |
Morgan Stanley Institutional Liquidity Prime Portfolio, Institutional
Class, 0.06% (c) | | | 6,238,384 | | | | 6,238,384 | | |
Total Collateral for Securities Loaned (Cost $17,593,103) | | | 17,593,103 | | |
Total Investments (Cost $200,798,531) — 96.0% | | | 300,493,479 | | |
Other assets in excess of liabilities — 4.0% | | | 12,277,346 | | |
NET ASSETS — 100.00% | | $ | 312,770,825 | | |
^ Purchased with cash collateral from securities on loan.
(a) All or a portion of this security is on loan.
(b) Non-income producing security.
(c) Rate disclosed is the daily yield on June 30, 2021.
ADR — American Depositary Receipt
PLC — Public Limited Company
See notes to financial statements.
18
Victory Portfolios | | Statements of Assets and Liabilities
June 30, 2021 | |
(Unaudited)
| | | Victory
RS Partners
Fund | | Victory
RS Value
Fund | | Victory
RS Large
Cap Alpha
Fund | |
Assets: | |
Investments, at value (Cost $281,598,633,
$272,432,783 and $377,320,773) | | $ | 391,434,928 | (a) | | $ | 348,411,819 | (b) | | $ | 513,126,379 | | |
Cash | | | 7,536,239 | | | | 3,628,287 | | | | 11,145,234 | | |
Receivables: | |
Interest and dividends | | | 492,668 | | | | 325,952 | | | | 761,990 | | |
Capital shares issued | | | 362,634 | | | | 171,260 | | | | 20,331 | | |
Investments sold | | | 2,616,887 | | | | 1,843,570 | | | | — | | |
From Adviser | | | 36,006 | | | | 9,382 | | | | 33,234 | | |
Prepaid expenses | | | 27,400 | | | | 13,279 | | | | 20,707 | | |
Total Assets | | | 402,506,762 | | | | 354,403,549 | | | | 525,107,875 | | |
Liabilities: | |
Payables: | |
Collateral received on loaned securities | | | 14,006,617 | | | | 12,062,813 | | | | — | | |
Investments purchased | | | 2,455,694 | | | | 1,653,041 | | | | — | | |
Capital shares redeemed | | | 428,216 | | | | 925,723 | | | | 76,209 | | |
Accrued expenses and other payables: | |
Investment advisory fees | | | 322,848 | | | | 241,768 | | | | 218,238 | | |
Administration fees | | | 19,622 | | | | 17,396 | | | | 26,844 | | |
Custodian fees | | | 5,584 | | | | 6,768 | | | | 3,479 | | |
Transfer agent fees | | | 37,240 | | | | 39,054 | | | | 61,107 | | |
Compliance fees | | | 220 | | | | 198 | | | | 297 | | |
Trustees' fees | | | 59 | | | | — | | | | 11 | | |
| 12b-1 fees | | | 19,643 | | | | 19,481 | | | | 55,137 | | |
Other accrued expenses | | | 43,911 | | | | 32,570 | | | | 25,293 | | |
Total Liabilities | | | 17,339,654 | | | | 14,998,812 | | | | 466,615 | | |
Net Assets: | |
Capital | | | 239,312,817 | | | | 240,676,894 | | | | 345,923,520 | | |
Total accumulated earnings/(loss) | | | 145,854,291 | | | | 98,727,843 | | | | 178,717,740 | | |
Net Assets | | $ | 385,167,108 | | | $ | 339,404,737 | | | $ | 524,641,260 | | |
Net Assets | |
Class A | | $ | 186,587,983 | | | $ | 182,193,397 | | | $ | 492,856,650 | | |
Class C | | | — | | | | 1,580,425 | | | | 8,082,720 | | |
Class R | | | 1,593,684 | | | | 672,397 | | | | 6,172,973 | | |
Class Y | | | 195,699,974 | | | | 154,958,518 | | | | 17,528,917 | | |
Member Class | | | 1,285,467 | | | | — | | | | — | | |
Total | | $ | 385,167,108 | | | $ | 339,404,737 | | | $ | 524,641,260 | | |
Shares (unlimited number of shares authorized
with a par value of $0.001 per share): | |
Class A | | | 6,146,872 | | | | 6,473,620 | | | | 8,339,145 | | |
Class C | | | — | | | | 64,647 | | | | 165,124 | | |
Class R | | | 58,803 | | | | 25,451 | | | | 105,300 | | |
Class Y | | | 5,993,535 | | | | 5,342,439 | | | | 297,604 | | |
Member Class | | | 42,285 | | | | — | | | | — | | |
Total | | | 12,241,495 | | | | 11,906,157 | | | | 8,907,173 | | |
Net asset value, offering (except Class A)
and redemption price per share: | |
Class A | | $ | 30.35 | | | $ | 28.14 | | | $ | 59.10 | | |
Class C (c) | | | — | | | | 24.45 | | | | 48.95 | | |
Class R | | | 27.10 | | | | 26.42 | | | | 58.62 | | |
Class Y | | | 32.65 | | | | 29.01 | | | | 58.90 | | |
Member Class | | | 30.40 | | | | — | | | | — | | |
Maximum Sales Charge — Class A | | | 5.75 | % | | | 5.75 | % | | | 5.75 | % | |
Maximum offering price (100%/(100%-maximum
sales charge) of net asset value adjusted to the
nearest cent) per share — Class A | | $ | 32.20 | | | $ | 29.86 | | | $ | 62.71 | | |
(a) Includes $13,563,229 of securities on loan.
(b) Includes $12,055,234 of securities on loan.
(c) Redemption price per share varies by the length of time shares are held.
See notes to financial statements.
19
Victory Portfolios | | Statements of Assets and Liabilities
June 30, 2021 | |
(Unaudited)
| | | Victory
RS Investors
Fund | | Victory
Global Energy
Transition
Fund | |
Assets: | |
Investments, at value (Cost $23,652,614 and $200,798,531) | | $ | 30,215,090 | | | $ | 300,493,479 | (a) | |
Foreign currency, at value (Cost $— and $60,092) | | | — | | | | 56,426 | | |
Cash | | | 1,161,089 | | | | 27,033,901 | | |
Receivables: | |
Interest and dividends | | | 34,833 | | | | 175,573 | | |
Capital shares issued | | | 311 | | | | 596,084 | | |
Investments sold | | | — | | | | 6,294,176 | | |
From Adviser | | | 13,971 | | | | 10,545 | | |
Prepaid expenses | | | 217 | | | | 11,899 | | |
Total Assets | | | 31,425,511 | | | | 334,672,083 | | |
Liabilities: | |
Payables: | |
Collateral received on loaned securities | | | — | | | | 17,593,103 | | |
Investments purchased | | | 84,766 | | | | 3,684,731 | | |
Capital shares redeemed | | | 188 | | | | 337,308 | | |
Accrued expenses and other payables: | |
Investment advisory fees | | | 26,038 | | | | 246,394 | | |
Administration fees | | | 1,580 | | | | 14,075 | | |
Custodian fees | | | 758 | | | | 4,046 | | |
Transfer agent fees | | | 5,436 | | | | 10,763 | | |
Compliance fees | | | 19 | | | | 145 | | |
Trustees' fees | | | 3 | | | | 404 | | |
| 12b-1 fees | | | 2,898 | | | | 9,234 | | |
Other accrued expenses | | | 13,087 | | | | 1,055 | | |
Total Liabilities | | | 134,773 | | | | 21,901,258 | | |
Net Assets: | |
Capital | | | 22,755,083 | | | | 2,126,509,008 | | |
Total accumulated earnings/(loss) | | | 8,535,655 | | | | (1,813,738,183 | ) | |
Net Assets | | $ | 31,290,738 | | | $ | 312,770,825 | | |
Net Assets | |
Class A | | $ | 14,699,947 | | | $ | 76,053,789 | | |
Class C | | | 3,021,737 | | | | 3,120,027 | | |
Class R | | | 742,523 | | | | 2,201,305 | | |
Class Y | | | 12,826,531 | | | | 231,395,704 | | |
Total | | $ | 31,290,738 | | | $ | 312,770,825 | | |
Shares (unlimited number of shares authorized with a
par value of $0.001 per share): | |
Class A | | | 971,058 | | | | 3,716,934 | | |
Class C | | | 229,203 | | | | 171,937 | | |
Class R | | | 55,357 | | | | 114,614 | | |
Class Y | | | 820,503 | | | | 10,836,051 | | |
Total | | | 2,076,121 | | | | 14,839,536 | | |
Net asset value, offering (except Class A) and
redemption price per share: | |
Class A | | $ | 15.14 | | | $ | 20.46 | | |
Class C (b) | | | 13.18 | | | | 18.15 | | |
Class R | | | 13.41 | | | | 19.21 | | |
Class Y | | | 15.63 | | | | 21.35 | | |
Maximum Sales Charge — Class A | | | 5.75 | % | | | 5.75 | % | |
Maximum offering price (100%/(100%-maximum
sales charge) of net asset value adjusted to the
nearest cent) per share — Class A | | $ | 16.06 | | | $ | 21.71 | | |
(a) Includes $17,206,403 of securities on loan.
(b) Redemption price per share varies by the length of time shares are held.
See notes to financial statements.
20
Victory Portfolios | | Statements of Operations
For the Six Months Ended June 30, 2021 | |
(Unaudited)
| | | Victory
RS Partners
Fund | | Victory
RS Value
Fund | | Victory
RS Large
Cap Alpha
Fund | |
Investment Income: | | | |
Dividends | | $ | 2,467,840 | | | $ | 2,468,652 | | | $ | 4,863,616 | | |
Interest | | | 495 | | | | 373 | | | | 430 | | |
Securities lending (net of fees) | | | 6,817 | | | | 3,445 | | | | 515 | | |
Foreign tax withholding | | | (10,173 | ) | | | (7,694 | ) | | | (11,170 | ) | |
Total Income | | | 2,464,979 | | | | 2,464,776 | | | | 4,853,391 | | |
Expenses: | | | |
Investment advisory fees | | | 1,845,971 | | | | 1,407,577 | | | | 1,265,903 | | |
Administration fees | | | 103,415 | | | | 92,789 | | | | 141,859 | | |
Sub-Administration fees | | | 8,287 | | | | 7,820 | | | | 7,683 | | |
| 12b-1 fees — Class A | | | 224,629 | | | | 219,121 | | | | 593,173 | | |
| 12b-1 fees — Class C | | | — | | | | 8,739 | | | | 42,814 | | |
| 12b-1 fees — Class R | | | 4,035 | | | | 1,802 | | | | 16,156 | | |
Custodian fees | | | 11,681 | | | | 12,510 | | | | 11,633 | | |
Transfer agent fees — Class A | | | 110,573 | | | | 106,507 | | | | 212,145 | | |
Transfer agent fees — Class C | | | — | | | | 1,650 | | | | 2,988 | | |
Transfer agent fees — Class R | | | 1,348 | | | | 790 | | | | 5,293 | | |
Transfer agent fees — Class Y | | | 71,142 | | | | 75,208 | | | | 8,011 | | |
Transfer agent fees — Member Class | | | 315 | | | | — | | | | — | | |
Trustees' fees | | | 12,680 | | | | 11,547 | | | | 17,280 | | |
Compliance fees | | | 1,341 | | | | 1,214 | | | | 1,856 | | |
Legal and audit fees | | | 14,969 | | | | 13,328 | | | | 18,364 | | |
State registration and filing fees | | | 30,823 | | | | 19,224 | | | | 23,531 | | |
Other expenses | | | 39,948 | | | | 26,887 | | | | 20,160 | | |
Total Expenses | | | 2,481,157 | | | | 2,006,713 | | | | 2,388,849 | | |
Expenses waived/reimbursed by Adviser | | | (109,648 | ) | | | (34,976 | ) | | | (105,955 | ) | |
Net Expenses | | | 2,371,509 | | | | 1,971,737 | | | | 2,282,894 | | |
Net Investment Income (Loss) | | | 93,470 | | | | 493,039 | | | | 2,570,497 | | |
Realized/Unrealized Gains (Losses) from
Investments: | | | |
Net realized gains (losses) from investment
securities and foreign currency translations | | | 46,624,202 | | | | 33,890,070 | | | | 36,862,679 | | |
Net change in unrealized appreciation/depreciation
on investment securities | | | 33,732,400 | | | | 22,431,245 | | | | 38,586,841 | | |
Net realized/unrealized gains (losses) on
investments | | | 80,356,602 | | | | 56,321,315 | | | | 75,449,520 | | |
Change in net assets resulting from operations | | $ | 80,450,072 | | | $ | 56,814,354 | | | $ | 78,020,017 | | |
See notes to financial statements.
21
Victory Portfolios | | Statements of Operations
For the Six Months Ended June 30, 2021 | |
(Unaudited)
| | | Victory RS
Investors
Fund | | Victory
Global Energy
Transition
Fund | |
Investment Income: | | | |
Dividends | | $ | 214,973 | | | $ | 1,360,060 | | |
Interest | | | 67 | | | | 19 | | |
Securities lending (net of fees) | | | 583 | | | | 5,007 | | |
Foreign tax withholding | | | (476 | ) | | | (117,448 | ) | |
Total Income | | | 215,147 | | | | 1,247,638 | | |
Expenses: | | | |
Investment advisory fees | | | 150,261 | | | | 1,192,562 | | |
Administration fees | | | 8,419 | | | | 66,657 | | |
Sub-Administration fees | | | 6,581 | | | | 6,581 | | |
| 12b-1 fees — Class A | | | 17,544 | | | | 69,210 | | |
| 12b-1 fees — Class C | | | 15,918 | | | | 12,523 | | |
| 12b-1 fees — Class R | | | 1,785 | | | | 4,025 | | |
Custodian fees | | | 2,144 | | | | 13,160 | | |
Transfer agent fees — Class A | | | 8,160 | | | | 49,144 | | |
Transfer agent fees — Class C | | | 2,362 | | | | 2,958 | | |
Transfer agent fees — Class R | | | 654 | | | | 995 | | |
Transfer agent fees — Class Y | | | 6,422 | | | | 72,029 | | |
Trustees' fees | | | 1,768 | | | | 7,239 | | |
Compliance fees | | | 111 | | | | 778 | | |
Legal and audit fees | | | 4,543 | | | | 13,476 | | |
State registration and filing fees | | | 11,905 | | | | 12,884 | | |
Other expenses | | | 5,164 | | | | 12,306 | | |
Total Expenses | | | 243,741 | | | | 1,536,527 | | |
Expenses waived/reimbursed by Adviser | | | (46,765 | ) | | | (48,721 | ) | |
Net Expenses | | | 196,976 | | | | 1,487,806 | | |
Net Investment Income (Loss) | | | 18,171 | | | | (240,168 | ) | |
Realized/Unrealized Gains (Losses) from Investments: | | | |
Net realized gains (losses) from investment securities and
foreign currency translations | | | 4,144,625 | | | | (3,997,270 | ) | |
Net change in unrealized appreciation/depreciation on
investment securities and foreign currency translations | | | 700,369 | | | | 114,641,791 | | |
Net realized/unrealized gains (losses) on investments | | | 4,844,994 | | | | 110,644,521 | | |
Change in net assets resulting from operations | | $ | 4,863,165 | | | $ | 110,404,353 | | |
See notes to financial statements.
22
Victory Portfolios | | Statements of Changes in Net Assets | |
| | | Victory RS Partners
Fund | | Victory RS Value
Fund | | Victory RS Large Cap Alpha
Fund | |
| | | Six Months
Ended
June 30,
2021
(Unaudited) | | Year
Ended
December 31,
2020 | | Six Months
Ended
June 30,
2021
(Unaudited) | | Year
Ended
December 31,
2020 | | Six Months
Ended
June 30,
2021
(Unaudited) | | Year
Ended
December 31,
2020 | |
From Investment Activities: | |
Operations: | |
Net investment
income (loss) | | $ | 93,470 | | | $ | 1,240,556 | | | $ | 493,039 | | | $ | 718,636 | | | $ | 2,570,497 | | | $ | 5,054,970 | | |
Net realized gains
(losses) from
investments | | | 46,624,202 | | | | (11,698,940 | ) | | | 33,890,070 | | | | (12,229,730 | ) | | | 36,862,679 | | | | (4,201,598 | ) | |
Net change in
unrealized
appreciation/
depreciation
on investments | | | 33,732,400 | | | | (4,653,083 | ) | | | 22,431,245 | | | | (9,051,390 | ) | | | 38,586,841 | | | | (17,104,453 | ) | |
Change in net assets
resulting from
operations | | | 80,450,072 | | | | (15,111,467 | ) | | | 56,814,354 | | | | (20,562,484 | ) | | | 78,020,017 | | | | (16,251,081 | ) | |
Distributions to
Shareholders: | |
Class A | | | — | | | | (2,382,023 | ) | | | — | | | | (3,101,649 | ) | | | — | | | | (16,466,861 | ) | |
Class C | | | — | | | | — | | | | — | | | | (57,388 | ) | | | — | | | | (464,103 | ) | |
Class R | | | — | | | | (24,191 | ) | | | — | | | | (13,629 | ) | | | — | | | | (206,060 | ) | |
Class Y | | | — | | | | (2,572,869 | ) | | | — | | | | (2,641,513 | ) | | | — | | | | (617,022 | ) | |
Member Class (a) | | | — | | | | (1,246 | ) | | | — | | | | — | | | | — | | | | — | | |
Change in net assets
resulting from
distributions to
shareholders | | | — | | | | (4,980,329 | ) | | | — | | | | (5,814,179 | ) | | | — | | | | (17,754,046 | ) | |
Change in net assets
resulting from
capital transactions | | | (21,523,585 | ) | | | (81,239,459 | ) | | | (25,364,937 | ) | | | (55,511,801 | ) | | | (30,941,037 | ) | | | (52,872,803 | ) | |
Change in net assets | | | 58,926,487 | | | | (101,331,255 | ) | | | 31,449,417 | | | | (81,888,464 | ) | | | 47,078,980 | | | | (86,877,930 | ) | |
Net Assets: | |
Beginning of period | | | 326,240,621 | | | | 427,571,876 | | | | 307,955,320 | | | | 389,843,784 | | | | 477,562,280 | | | | 564,440,210 | | |
End of period | | $ | 385,167,108 | | | $ | 326,240,621 | | | $ | 339,404,737 | | | $ | 307,955,320 | | | $ | 524,641,260 | | | $ | 477,562,280 | | |
(a) Victory RS Partners Fund Member Class commenced operations on November 3, 2020.
(continues on next page)
See notes to financial statements.
23
Victory Portfolios | | Statements of Changes in Net Assets | |
(continued)
| | | Victory RS Partners
Fund | | Victory RS Value
Fund | | Victory RS Large Cap Alpha
Fund | |
| | | Six Months
Ended
June 30,
2021
(Unaudited) | | Year
Ended
December 31,
2020 | | Six Months
Ended
June 30,
2021
(Unaudited) | | Year
Ended
December 31,
2020 | | Six Months
Ended
June 30,
2021
(Unaudited) | | Year
Ended
December 31,
2020 | |
Capital Transactions: | |
Class A | |
Proceeds from
shares issued | | $ | 9,623,734 | | | $ | 8,056,549 | | | $ | 5,351,282 | | | $ | 10,671,316 | | | $ | 11,322,619 | | | $ | 15,044,197 | | |
Distributions reinvested | | | — | | | | 2,346,101 | | | | — | | | | 3,021,005 | | | | — | | | | 16,006,543 | | |
Cost of shares redeemed | | | (18,495,212 | ) | | | (38,903,637 | ) | | | (15,082,270 | ) | | | (43,963,514 | ) | | | (35,708,178 | ) | | | (76,615,653 | ) | |
Total Class A | | $ | (8,871,478 | ) | | $ | (28,500,987 | ) | | $ | (9,730,988 | ) | | $ | (30,271,193 | ) | | $ | (24,385,559 | ) | | $ | (45,564,913 | ) | |
Class C | |
Proceeds from
shares issued | | $ | — | | | $ | — | | | $ | 56,864 | | | $ | 111,055 | | | $ | 154,016 | | | $ | 228,965 | | |
Distributions reinvested | | | — | | | | — | | | | — | | | | 57,388 | | | | — | | | | 464,103 | | |
Cost of shares redeemed | | | — | | | | — | | | | (1,415,359 | ) | | | (1,886,466 | ) | | | (4,715,260 | ) | | | (4,905,429 | ) | |
Total Class C | | $ | — | | | $ | — | | | $ | (1,358,495 | ) | | $ | (1,718,023 | ) | | $ | (4,561,244 | ) | | $ | (4,212,361 | ) | |
Class R | |
Proceeds from
shares issued | | $ | 70,365 | | | $ | 336,137 | | | $ | 21,280 | | | $ | 58,505 | | | $ | 260,914 | | | $ | 908,104 | | |
Distributions reinvested | | | — | | | | 24,191 | | | | — | | | | 13,629 | | | | — | | | | 206,047 | | |
Cost of shares redeemed | | | (254,076 | ) | | | (421,656 | ) | | | (150,210 | ) | | | (319,314 | ) | | | (1,169,293 | ) | | | (1,850,065 | ) | |
Total Class R | | $ | (183,711 | ) | | $ | (61,328 | ) | | $ | (128,930 | ) | | $ | (247,180 | ) | | $ | (908,379 | ) | | $ | (735,914 | ) | |
Class Y | |
Proceeds from
shares issued | | $ | 31,258,935 | | | $ | 28,022,881 | | | $ | 7,050,887 | | | $ | 18,473,898 | | | $ | 1,249,996 | | | $ | 2,949,615 | | |
Distributions reinvested | | | — | | | | 2,567,572 | | | | — | | | | 2,604,139 | | | | — | | | | 596,266 | | |
Cost of shares redeemed | | | (44,883,229 | ) | | | (83,363,101 | ) | | | (21,197,411 | ) | | | (44,353,442 | ) | | | (2,335,851 | ) | | | (5,905,496 | ) | |
Total Class Y | | $ | (13,624,294 | ) | | $ | (52,772,648 | ) | | $ | (14,146,524 | ) | | $ | (23,275,405 | ) | | $ | (1,085,855 | ) | | $ | (2,359,615 | ) | |
Member Class (a) | |
Proceeds from
shares issued | | $ | 1,514,954 | | | $ | 94,259 | | | $ | — | | | $ | — | | | $ | — | | | $ | — | | |
Distributions reinvested | | | — | | | | 1,245 | | | | — | | | | — | | | | — | | | | — | | |
Cost of shares redeemed | | | (359,056 | ) | | | — | | | | — | | | | — | | | | — | | | | — | | |
Total Member Class | | $ | 1,155,898 | | | $ | 95,504 | | | $ | — | | | $ | — | | | $ | — | | | $ | — | | |
Change in net assets resulting
from capital transactions | | $ | (21,523,585 | ) | | $ | (81,239,459 | ) | | $ | (25,364,937 | ) | | $ | (55,511,801 | ) | | $ | (30,941,037 | ) | | $ | (52,872,803 | ) | |
(a) Victory RS Partners Fund Member Class commenced operations on November 3, 2020.
(continues on next page)
See notes to financial statements.
24
Victory Portfolios | | Statements of Changes in Net Assets | |
(continued)
| | | Victory RS Partners
Fund | | Victory RS Value
Fund | | Victory RS Large Cap Alpha
Fund | |
| | | Six Months
Ended
June 30,
2021
(Unaudited) | | Year
Ended
December 31,
2020 | | Six Months
Ended
June 30,
2021
(Unaudited) | | Year
Ended
December 31,
2020 | | Six Months
Ended
June 30,
2021
(Unaudited) | | Year
Ended
December 31,
2020 | |
Share Transactions: | |
Class A | |
Issued | | | 323,188 | | | | 411,941 | | | | 203,078 | | | | 545,133 | | | | 204,888 | | | | 327,242 | | |
Reinvested | | | — | | | | 98,163 | | | | — | | | | 130,384 | | | | — | | | | 321,465 | | |
Redeemed | | | (647,026 | ) | | | (1,952,159 | ) | | | (575,717 | ) | | | (2,185,810 | ) | | | (644,474 | ) | | | (1,663,736 | ) | |
Total Class A | | | (323,838 | ) | | | (1,442,055 | ) | | | (372,639 | ) | | | (1,510,293 | ) | | | (439,586 | ) | | | (1,015,029 | ) | |
Class C | |
Issued | | | — | | | | — | | | | 2,409 | | | | 6,149 | | | | 3,103 | | | | 6,096 | | |
Reinvested | | | — | | | | — | | | | — | | | | 2,840 | | | | — | | | | 11,226 | | |
Redeemed | | | — | | | | — | | | | (64,538 | ) | | | (105,185 | ) | | | (107,178 | ) | | | (129,105 | ) | |
Total Class C | | | — | | | | — | | | | (62,129 | ) | | | (96,196 | ) | | | (104,075 | ) | | | (111,783 | ) | |
Class R | |
Issued | | | 2,724 | | | | 19,278 | | | | 858 | | | | 3,076 | | | | 4,758 | | | | 19,865 | | |
Reinvested | | | — | | | | 1,131 | | | | — | | | | 625 | | | | — | | | | 4,172 | | |
Redeemed | | | (9,572 | ) | | | (23,375 | ) | | | (5,814 | ) | | | (16,873 | ) | | | (20,100 | ) | | | (40,294 | ) | |
Total Class R | | | (6,848 | ) | | | (2,966 | ) | | | (4,956 | ) | | | (13,172 | ) | | | (15,342 | ) | | | (16,257 | ) | |
Class Y | |
Issued | | | 967,672 | | | | 1,326,866 | | | | 264,305 | | | | 931,019 | | | | 21,893 | | | | 60,906 | | |
Reinvested | | | — | | | | 100,022 | | | | — | | | | 109,188 | | | | — | | | | 12,016 | | |
Redeemed | | | (1,440,289 | ) | | | (3,844,005 | ) | | | (767,782 | ) | | | (2,139,626 | ) | | | (42,158 | ) | | | (133,707 | ) | |
Total Class Y | | | (472,617 | ) | | | (2,417,117 | ) | | | (503,477 | ) | | | (1,099,419 | ) | | | (20,265 | ) | | | (60,785 | ) | |
Member Class (a) | |
Issued | | | 49,797 | | | | 4,173 | | | | — | | | | — | | | | — | | | | — | | |
Reinvested | | | — | | | | 52 | | | | — | | | | — | | | | — | | | | — | | |
Redeemed | | | (11,737 | ) | | | — | | | | — | | | | — | | | | — | | | | — | | |
Total Member Class | | | 38,060 | | | | 4,225 | | | | — | | | | — | | | | — | | | | — | | |
Change in Shares | | | (765,243 | ) | | | (3,857,913 | ) | | | (943,201 | ) | | | (2,719,080 | ) | | | (579,268 | ) | | | (1,203,854 | ) | |
(a) Victory RS Partners Fund Member Class commenced operations on November 3, 2020.
See notes to financial statements.
25
Victory Portfolios | | Statements of Changes in Net Assets | |
| | | Victory RS
Investors Fund | | Victory Global Energy
Transition Fund | |
| | | Six Months
Ended
June 30,
2021
(Unaudited) | | Year
Ended
December 31,
2020 | | Six Months
Ended
June 30,
2021
(Unaudited) | | Year
Ended
December 31,
2020 | |
From Investment Activities: | |
Operations: | |
Net investment income (loss) | | $ | 18,171 | | | $ | (32,101 | ) | | $ | (240,168 | ) | | $ | 95,179 | | |
Net realized gains (losses) from
investments | | | 4,144,625 | | | | (2,049,123 | ) | | | (3,997,270 | ) | | | (156,274,442 | ) | |
Net change in unrealized
appreciation/depreciation
on investments | | | 700,369 | | | | (1,336,814 | ) | | | 114,641,791 | | | | 185,771,622 | | |
Change in net assets resulting
from operations | | | 4,863,165 | | | | (3,418,038 | ) | | | 110,404,353 | | | | 29,592,359 | | |
Distributions to Shareholders: | |
Class A | | | — | | | | (38,891 | ) | | | — | | | | (17,431 | ) | |
Class C | | | — | | | | (11,599 | ) | | | — | | | | — | | |
Class R | | | — | | | | (2,189 | ) | | | — | | | | — | | |
Class Y | | | — | | | | (33,498 | ) | | | — | | | | (307,837 | ) | |
Change in net assets resulting
from distributions to shareholders | | | — | | | | (86,177 | ) | | | — | | | | (325,268 | ) | |
Change in net assets resulting
from capital transactions | | | (1,449,875 | ) | | | (12,411,650 | ) | | | 43,261,432 | | | | (21,333,904 | ) | |
Change in net assets | | | 3,413,290 | | | | (15,915,865 | ) | | | 153,665,785 | | | | 7,933,187 | | |
Net Assets: | |
Beginning of period | | | 27,877,448 | | | | 43,793,313 | | | | 159,105,040 | | | | 151,171,853 | | |
End of period | | $ | 31,290,738 | | | $ | 27,877,448 | | | $ | 312,770,825 | | | $ | 159,105,040 | | |
(continues on next page)
See notes to financial statements.
26
Victory Portfolios | | Statements of Changes in Net Assets | |
(continued)
| | | Victory RS
Investors Fund | | Victory
Global Energy Transition
Fund | |
| | | Six Months
Ended
June 30,
2021
(Unaudited) | | Year
Ended
December 31,
2020 | | Six Months
Ended
June 30,
2021
(Unaudited) | | Year
Ended
December 31,
2020 | |
Capital Transactions: | |
Class A | |
Proceeds from shares issued | | $ | 882,108 | | | $ | 1,680,515 | | | $ | 26,305,015 | | | $ | 5,505,577 | | |
Distributions reinvested | | | — | | | | 36,157 | | | | — | | | | 16,618 | | |
Cost of shares redeemed | | | (1,100,949 | ) | | | (4,654,377 | ) | | | (12,800,742 | ) | | | (8,758,422 | ) | |
Total Class A | | $ | (218,841 | ) | | $ | (2,937,705 | ) | | $ | 13,504,273 | | | $ | (3,236,227 | ) | |
Class C | |
Proceeds from shares issued | | $ | 99,947 | | | $ | 64,083 | | | $ | 783,135 | | | $ | 496,242 | | |
Distributions reinvested | | | — | | | | 11,513 | | | | — | | | | — | | |
Cost of shares redeemed | | | (909,394 | ) | | | (2,978,451 | ) | | | (1,284,816 | ) | | | (1,312,505 | ) | |
Total Class C | | $ | (809,447 | ) | | $ | (2,902,855 | ) | | $ | (501,681 | ) | | $ | (816,263 | ) | |
Class R | |
Proceeds from shares issued | | $ | 15,542 | | | $ | 46,519 | | | $ | 1,167,795 | | | $ | 263,387 | | |
Distributions reinvested | | | — | | | | 2,189 | | | | — | | | | — | | |
Cost of shares redeemed | | | (41,175 | ) | | | (195,450 | ) | | | (341,461 | ) | | | (294,240 | ) | |
Total Class R | | $ | (25,633 | ) | | $ | (146,742 | ) | | $ | 826,334 | | | $ | (30,853 | ) | |
Class Y | |
Proceeds from shares issued | | $ | 1,255,488 | | | $ | 1,952,154 | | | $ | 63,059,008 | | | $ | 22,164,045 | | |
Distributions reinvested | | | — | | | | 33,328 | | | | — | | | | 288,040 | | |
Cost of shares redeemed | | | (1,651,442 | ) | | | (8,409,830 | ) | | | (33,626,502 | ) | | | (39,702,646 | ) | |
Total Class Y | | $ | (395,954 | ) | | $ | (6,424,348 | ) | | $ | 29,432,506 | | | $ | (17,250,561 | ) | |
Change in net assets resulting from
capital transactions | | $ | (1,449,875 | ) | | $ | (12,411,650 | ) | | $ | 43,261,432 | | | $ | (21,333,904 | ) | |
(continues on next page)
See notes to financial statements.
27
Victory Portfolios | | Statements of Changes in Net Assets | |
(continued)
| | | Victory RS
Investors Fund | | Victory
Global Energy Transition
Fund | |
| | | Six Months
Ended
June 30,
2021
(Unaudited) | | Year
Ended
December 31,
2020 | | Six Months
Ended
June 30,
2021
(Unaudited) | | Year
Ended
December 31,
2020 | |
Share Transactions: | |
Class A | |
Issued | | | 61,931 | | | | 153,026 | | | | 1,492,071 | | | | 690,679 | | |
Reinvested | | | — | | | | 2,876 | | | | — | | | | 1,375 | | |
Redeemed | | | (77,160 | ) | | | (460,596 | ) | | | (753,044 | ) | | | (1,073,725 | ) | |
Total Class A | | | (15,229 | ) | | | (304,694 | ) | | | 739,027 | | | | (381,671 | ) | |
Class C | |
Issued | | | 8,000 | | | | 7,008 | | | | 57,252 | | | | 58,179 | | |
Reinvested | | | — | | | | 1,048 | | | | — | | | | — | | |
Redeemed | | | (73,379 | ) | | | (311,413 | ) | | | (102,072 | ) | | | (179,802 | ) | |
Total Class C | | | (65,379 | ) | | | (303,357 | ) | | | (44,820 | ) | | | (121,623 | ) | |
Class R | |
Issued | | | 1,223 | | | | 4,704 | | | | 78,224 | | | | 32,115 | | |
Reinvested | | | — | | | | 196 | | | | — | | | | — | | |
Redeemed | | | (3,270 | ) | | | (19,506 | ) | | | (22,117 | ) | | | (41,381 | ) | |
Total Class R | | | (2,047 | ) | | | (14,606 | ) | | | 56,107 | | | | (9,266 | ) | |
Class Y | |
Issued | | | 82,575 | | | | 176,376 | | | | 3,507,185 | | | | 2,643,842 | | |
Reinvested | | | — | | | | 2,572 | | | | — | | | | 22,860 | | |
Redeemed | | | (111,987 | ) | | | (750,912 | ) | | | (1,928,703 | ) | | | (4,779,989 | ) | |
Total Class Y | | | (29,412 | ) | | | (571,964 | ) | | | 1,578,482 | | | | (2,113,287 | ) | |
Change in Shares | | | (112,067 | ) | | | (1,194,621 | ) | | | 2,328,796 | | | | (2,625,847 | ) | |
See notes to financial statements.
28
This page is intentionally left blank.
29
Victory Portfolios | | Financial Highlights | |
For a Share Outstanding Throughout Each Period
| | | | Investment Activities | | Distributions to
Shareholders From | |
| | | Net Asset
Value,
Beginning of
Period | | Net
Investment
Income
(Loss)(a) | | Net Realized
and Unrealized
Gains (Losses)
on Investments | | Total from
Investment
Activities | | Net
Investment
Income | | Net Realized
Gains from
Investments | |
Victory RS Partners Fund | |
Class A | |
Six Months Ended
June 30, 2021
(Unaudited) | | $ | 24.21 | | | | (0.02 | ) | | | 6.16 | | | | 6.14 | | | | — | | | | — | | |
Year Ended
December 31, 2020 | | $ | 24.47 | | | | 0.04 | | | | 0.07 | (e) | | | 0.11 | | | | — | | | | (0.37 | ) | |
December 31, 2019 | | $ | 20.66 | | | | 0.12 | | | | 6.12 | | | | 6.24 | | | | (0.21 | ) | | | (2.22 | ) | |
December 31, 2018 | | $ | 29.21 | | | | 0.04 | | | | (3.52 | ) | | | (3.48 | ) | | | (0.08 | ) | | | (4.99 | ) | |
December 31, 2017 | | $ | 31.58 | | | | (0.25 | ) | | | 4.78 | | | | 4.53 | | | | — | | | | (6.90 | ) | |
December 31, 2016 | | $ | 26.89 | | | | (0.12 | ) | | | 6.59 | | | | 6.47 | | | | — | | | | (1.78 | ) | |
Class R | |
Six Months Ended
June 30, 2021
(Unaudited) | | $ | 21.65 | | | | (0.06 | ) | | | 5.51 | | | | 5.45 | | | | — | | | | — | | |
Year Ended
December 31, 2020 | | $ | 22.01 | | | | (0.03 | ) | | | 0.04 | (e) | | | 0.01 | | | | — | | | | (0.37 | ) | |
December 31, 2019 | | $ | 18.79 | | | | 0.03 | | | | 5.55 | | | | 5.58 | | | | (0.14 | ) | | | (2.22 | ) | |
December 31, 2018 | | $ | 27.09 | | | | (0.04 | ) | | | (3.27 | ) | | | (3.31 | ) | | | — | | | | (4.99 | ) | |
December 31, 2017 | | $ | 29.84 | | | | (0.44 | ) | | | 4.59 | | | | 4.15 | | | | — | | | | (6.90 | ) | |
December 31, 2016 | | $ | 25.57 | | | | (0.21 | ) | | | 6.26 | | | | 6.05 | | | | — | | | | (1.78 | ) | |
Class Y | |
Six Months Ended
June 30, 2021
(Unaudited) | | $ | 25.99 | | | | 0.03 | | | | 6.63 | | | | 6.66 | | | | — | | | | — | | |
Year Ended
December 31, 2020 | | $ | 26.17 | | | | 0.12 | | | | 0.07 | (e) | | | 0.19 | | | | — | | | | (0.37 | ) | |
December 31, 2019 | | $ | 21.94 | | | | 0.21 | | | | 6.52 | | | | 6.73 | | | | (0.28 | ) | | | (2.22 | ) | |
December 31, 2018 | | $ | 30.67 | | | | 0.14 | | | | (3.71 | ) | | | (3.57 | ) | | | (0.17 | ) | | | (4.99 | ) | |
December 31, 2017 | | $ | 32.75 | | | | (0.04 | ) | | | 4.86 | | | | 4.82 | | | | — | | | | (6.90 | ) | |
December 31, 2016 | | $ | 27.75 | | | | (0.03 | ) | | | 6.81 | | | | 6.78 | | | | — | | | | (1.78 | ) | |
Member Class | |
Six Months Ended
June 30, 2021
(Unaudited) | | $ | 24.22 | | | | 0.05 | | | | 6.13 | | | | 6.18 | | | | — | | | | — | | |
November 3, 2020(f)
through
December 31, 2020 | | $ | 19.64 | | | | 0.01 | | | | 4.94 | (e) | | | 4.95 | | | | — | | | | (0.37 | ) | |
(a) Per share net investment income (loss) has been calculated using the average daily shares method.
(b) Not annualized for periods less than one year.
(c) Annualized for periods less than one year.
(d) Portfolio turnover is calculated on the basis of the Fund as a whole without distinguishing between the classes of shares issued.
(e) The amount shown reflects a net realized and unrealized gain per share, whereas the statement of operations reflected a net realized and unrealized loss for the period for the Fund in total. The difference in realized and unrealized gains and losses for the Fund versus the class is due to the timing of sales and repurchases of the class in relation to fluctuating market values during the period.
(f) Commencement of operations.
See notes to financial statements.
30
Victory Portfolios | | Financial Highlights — continued | |
For a Share Outstanding Throughout Each Period
| | | | | Ratios to Average Net Assets | | Supplemental Data | |
| | | Total
Distributions | | Net Asset
Value,
End of
Period | | Total
Return
(Excludes
Sales
Charge)(b) | | Net
Expenses(c) | | Net
Investment
Income
(Loss)(c) | | Gross
Expenses(c) | | Net Assets,
End of
Period
(000's) | | Portfolio
Turnover(b)(d) | |
Victory RS Partners Fund | |
Class A | |
Six Months Ended
June 30, 2021
(Unaudited) | | | — | | | $ | 30.35 | | | | 25.36 | % | | | 1.45 | % | | | (0.12 | )% | | | 1.48 | % | | $ | 186,588 | | | | 31 | % | |
Year Ended
December 31, 2020 | | | (0.37 | ) | | $ | 24.21 | | | | 0.46 | % | | | 1.45 | % | | | 0.20 | % | | | 1.53 | % | | $ | 156,629 | | | | 108 | % | |
December 31, 2019 | | | (2.43 | ) | | $ | 24.47 | | | | 30.69 | % | | | 1.45 | % | | | 0.49 | % | | | 1.52 | % | | $ | 193,630 | | | | 57 | % | |
December 31, 2018 | | | (5.07 | ) | | $ | 20.66 | | | | (12.04 | )% | | | 1.45 | % | | | 0.14 | % | | | 1.52 | % | | $ | 175,723 | | | | 62 | % | |
December 31, 2017 | | | (6.90 | ) | | $ | 29.21 | | | | 14.21 | % | | | 1.45 | % | | | (0.75 | )% | | | 1.50 | % | | $ | 259,050 | | | | 38 | % | |
December 31, 2016 | | | (1.78 | ) | | $ | 31.58 | | | | 24.04 | % | | | 1.45 | % | | | (0.44 | )% | | | 1.53 | % | | $ | 378,695 | | | | 60 | % | |
Class R | |
Six Months Ended
June 30, 2021
(Unaudited) | | | — | | | $ | 27.10 | | | | 25.17 | % | | | 1.81 | % | | | (0.49 | )% | | | 2.46 | % | | $ | 1,594 | | | | 31 | % | |
Year Ended
December 31, 2020 | | | (0.37 | ) | | $ | 21.65 | | | | 0.06 | % | | | 1.81 | % | | | (0.15 | )% | | | 2.87 | % | | $ | 1,421 | | | | 108 | % | |
December 31, 2019 | | | (2.36 | ) | | $ | 22.01 | | | | 30.26 | % | | | 1.81 | % | | | 0.12 | % | | | 2.63 | % | | $ | 1,510 | | | | 57 | % | |
December 31, 2018 | | | (4.99 | ) | | $ | 18.79 | | | | (12.39 | )% | | | 1.81 | % | | | (0.16 | )% | | | 2.37 | % | | $ | 1,207 | | | | 62 | % | |
December 31, 2017 | | | (6.90 | ) | | $ | 27.09 | | | | 13.81 | % | | | 1.81 | % | | | (1.40 | )% | | | 2.28 | % | | $ | 2,168 | | | | 38 | % | |
December 31, 2016 | | | (1.78 | ) | | $ | 29.84 | | | | 23.64 | % | | | 1.81 | % | | | (0.78 | )% | | | 1.81 | % | | $ | 2,452 | | | | 60 | % | |
Class Y | |
Six Months Ended
June 30, 2021
(Unaudited) | | | — | | | $ | 32.65 | | | | 25.58 | % | | | 1.12 | % | | | 0.21 | % | | | 1.19 | % | | $ | 195,700 | | | | 31 | % | |
Year Ended
December 31, 2020 | | | (0.37 | ) | | $ | 25.99 | | | | 0.77 | % | | | 1.12 | % | | | 0.54 | % | | | 1.23 | % | | $ | 168,087 | | | | 108 | % | |
December 31, 2019 | | | (2.50 | ) | | $ | 26.17 | | | | 31.18 | % | | | 1.12 | % | | | 0.82 | % | | | 1.21 | % | | $ | 232,432 | | | | 57 | % | |
December 31, 2018 | | | (5.16 | ) | | $ | 21.94 | | | | (11.77 | )% | | | 1.12 | % | | | 0.48 | % | | | 1.19 | % | | $ | 250,709 | | | | 62 | % | |
December 31, 2017 | | | (6.90 | ) | | $ | 30.67 | | | | 14.59 | % | | | 1.12 | % | | | (0.11 | )% | | | 1.21 | % | | $ | 349,022 | | | | 38 | % | |
December 31, 2016 | | | (1.78 | ) | | $ | 32.75 | | | | 24.41 | % | | | 1.12 | % | | | (0.11 | )% | | | 1.22 | % | | $ | 378,271 | | | | 60 | % | |
Member Class | |
Six Months Ended
June 30, 2021
(Unaudited) | | | — | | | $ | 30.40 | | | | 25.52 | % | | | 1.25 | % | | | 0.35 | % | | | 6.54 | % | | $ | 1,285 | | | | 31 | % | |
November 3, 2020(f)
through
December 31, 2020 | | | (0.37 | ) | | $ | 24.22 | | | | 25.22 | % | | | 1.25 | % | | | 0.36 | % | | | 33.63 | % | | $ | 102 | | | | 108 | % | |
See notes to financial statements.
31
Victory Portfolios | | Financial Highlights | |
For a Share Outstanding Throughout Each Period
| | | | Investment Activities | | Distributions to
Shareholders From | |
| | | Net Asset
Value,
Beginning of
Period | | Net
Investment
Income
(Loss)(a) | | Net
Realized and
Unrealized
Gains
(Losses) on
Investments | | Total from
Investment
Activities | | Net
Investment
Income | | Net Realized
Gains from
Investments | | Total
Distributions | |
Victory RS Value Fund | |
Class A | |
Six Months
Ended
June 30, 2021
(Unaudited) | | $ | 23.68 | | | | 0.03 | | | | 4.43 | | | | 4.46 | | | | — | | | | — | | | | — | | |
Year Ended
December 31,
2020 | | $ | 24.79 | | | | 0.03 | | | | (0.68 | ) | | | (0.65 | ) | | | — | | | | (0.46 | ) | | | (0.46 | ) | |
December 31,
2019 | | $ | 20.28 | | | | 0.07 | | | | 6.28 | | | | 6.35 | | | | (0.14 | ) | | | (1.70 | ) | | | (1.84 | ) | |
December 31,
2018 | | $ | 26.21 | | | | 0.06 | | | | (2.85 | ) | | | (2.79 | ) | | | (0.14 | ) | | | (3.00 | ) | | | (3.14 | ) | |
December 31,
2017 | | $ | 27.94 | | | | 0.03 | | | | 4.80 | | | | 4.83 | | | | (0.04 | ) | | | (6.52 | ) | | | (6.56 | ) | |
December 31,
2016 | | $ | 28.33 | | | | — | (e) | | | 3.09 | | | | 3.09 | | | | (0.13 | ) | | | (3.35 | ) | | | (3.48 | ) | |
Class C | |
Six Months
Ended
June 30, 2021
(Unaudited) | | $ | 20.65 | | | | (0.07 | ) | | | 3.87 | | | | 3.80 | | | | — | | | | — | | | | — | | |
Year Ended
December 31,
2020 | | $ | 21.85 | | | | (0.11 | ) | | | (0.63 | ) | | | (0.74 | ) | | | — | | | | (0.46 | ) | | | (0.46 | ) | |
December 31,
2019 | | $ | 18.08 | | | | (0.11 | ) | | | 5.58 | | | | 5.47 | | | | — | | | | (1.70 | ) | | | (1.70 | ) | |
December 31,
2018 | | $ | 23.76 | | | | (0.13 | ) | | | (2.55 | ) | | | (2.68 | ) | | | — | | | | (3.00 | ) | | | (3.00 | ) | |
December 31,
2017 | | $ | 26.01 | | | | (0.08 | ) | | | 4.35 | | | | 4.27 | | | | — | | | | (6.52 | ) | | | (6.52 | ) | |
December 31,
2016 | | $ | 26.69 | | | | (0.21 | ) | | | 2.88 | | | | 2.67 | | | | — | | | | (3.35 | ) | | | (3.35 | ) | |
(a) Per share net investment income (loss) has been calculated using the average daily shares method.
(b) The Fund received monies related to nonrecurring refund from the prior custodian. The corresponding impact to the total return was less than 0.005% for the period shown.
(c) Not annualized for periods less than one year.
(d) Annualized for periods less than one year.
(e) Portfolio turnover is calculated on the basis of the Fund as a whole without distinguishing between the classes of shares issued.
(f) Amount is less than $0.005 per share.
See notes to financial statements.
32
Victory Portfolios | | Financial Highlights — continued | |
For a Share Outstanding Throughout Each Period
| | | | | Ratios to Average Net Assets | | Supplemental Data | |
| | | Capital
Contributions
from Prior
Custodian,
Net(b) | | Net Asset
Value,
End of
Period | | Total
Return
(Excludes
Sales
Charge)(c) | | Net
Expenses(d) | | Net
Investment
Income
(Loss)(d) | | Gross
Expenses(d) | | Net Assets,
End of
Period
(000's) | | Portfolio
Turnover(c)(e) | |
Victory RS Value Fund | |
Class A | |
Six Months
Ended
June 30, 2021
(Unaudited) | | | — | | | $ | 28.14 | | | | 18.83 | % | | | 1.30 | % | | | 0.19 | % | | | 1.34 | % | | $ | 182,193 | | | | 35 | % | |
Year Ended
December 31,
2020 | | | — | | | $ | 23.68 | | | | (2.59 | )% | | | 1.30 | % | | | 0.14 | % | | | 1.37 | % | | $ | 162,145 | | | | 73 | % | |
December 31,
2019 | | | — | | | $ | 24.79 | | | | 31.35 | % | | | 1.30 | % | | | 0.28 | % | | | 1.35 | % | | $ | 207,200 | | | | 54 | % | |
December 31,
2018 | | | — | | | $ | 20.28 | | | | (10.75 | )% | | | 1.30 | % | | | 0.24 | % | | | 1.34 | % | | $ | 179,535 | | | | 65 | % | |
December 31,
2017 | | | — | | | $ | 26.21 | | | | 17.41 | % | | | 1.30 | % | | | 0.09 | % | | | 1.33 | % | | $ | 239,994 | | | | 64 | % | |
December 31,
2016 | | | — | (f) | | $ | 27.94 | | | | 10.92 | %(b) | | | 1.30 | % | | | (0.01 | )% | | | 1.35 | % | | $ | 268,979 | | | | 67 | % | |
Class C | |
Six Months
Ended
June 30, 2021
(Unaudited) | | | — | | | $ | 24.45 | | | | 18.40 | % | | | 2.07 | % | | | (0.62 | )% | | | 2.39 | % | | $ | 1,580 | | | | 35 | % | |
Year Ended
December 31,
2020 | | | — | | | $ | 20.65 | | | | (3.35 | )% | | | 2.07 | % | | | (0.62 | )% | | | 2.60 | % | | $ | 2,618 | | | | 73 | % | |
December 31,
2019 | | | — | | | $ | 21.85 | | | | 30.32 | % | | | 2.07 | % | | | (0.50 | )% | | | 2.29 | % | | $ | 4,872 | | | | 54 | % | |
December 31,
2018 | | | — | | | $ | 18.08 | | | | (11.41 | )% | | | 2.07 | % | | | (0.54 | )% | | | 2.14 | % | | $ | 9,428 | | | | 65 | % | |
December 31,
2017 | | | — | | | $ | 23.76 | | | | 16.53 | % | | | 2.07 | % | | | (0.30 | )% | | | 2.08 | % | | $ | 16,916 | | | | 64 | % | |
December 31,
2016 | | | — | (f) | | $ | 26.01 | | | | 10.01 | %(b) | | | 2.07 | % | | | (0.78 | )% | | | 2.13 | % | | $ | 19,943 | | | | 67 | % | |
See notes to financial statements.
33
Victory Portfolios | | Financial Highlights | |
For a Share Outstanding Throughout Each Period
| | | | Investment Activities | | Distributions to
Shareholders From | |
| | | Net Asset
Value,
Beginning of
Period | | Net
Investment
Income
(Loss)(a) | | Net
Realized and
Unrealized
Gains
(Losses) on
Investments | | Total from
Investment
Activities | | Net
Investment
Income | | Net Realized
Gains from
Investments | | Total
Distributions | |
Victory RS Value Fund | |
Class R | |
Six Months
Ended
June 30, 2021
(Unaudited) | | $ | 22.27 | | | | (0.03 | ) | | | 4.18 | | | | 4.15 | | | | — | | | | — | | | | — | | |
Year Ended
December 31,
2020 | | $ | 23.44 | | | | (0.05 | ) | | | (0.66 | ) | | | (0.71 | ) | | | — | | | | (0.46 | ) | | | (0.46 | ) | |
December 31,
2019 | | $ | 19.26 | | | | (0.03 | ) | | | 5.95 | | | | 5.92 | | | | (0.04 | ) | | | (1.70 | ) | | | (1.74 | ) | |
December 31,
2018 | | $ | 25.06 | | | | (0.03 | ) | | | (2.72 | ) | | | (2.75 | ) | | | (0.05 | ) | | | (3.00 | ) | | | (3.05 | ) | |
December 31,
2017 | | $ | 27.03 | | | | (0.03 | ) | | | 4.58 | | | | 4.55 | | | | — | | | | (6.52 | ) | | | (6.52 | ) | |
December 31,
2016 | | $ | 27.51 | | | | (0.09 | ) | | | 2.96 | | | | 2.87 | | | | — | | | | (3.35 | ) | | | (3.35 | ) | |
Class Y | |
Six Months
Ended
June 30, 2021
(Unaudited) | | $ | 24.38 | | | | 0.06 | | | | 4.57 | | | | 4.63 | | | | — | | | | — | | | | — | | |
Year Ended
December 31,
2020 | | $ | 25.45 | | | | 0.08 | | | | (0.69 | ) | | | (0.61 | ) | | | — | | | | (0.46 | ) | | | (0.46 | ) | |
December 31,
2019 | | $ | 20.77 | | | | 0.13 | | | | 6.44 | | | | 6.57 | | | | (0.19 | ) | | | (1.70 | ) | | | (1.89 | ) | |
December 31,
2018 | | $ | 26.77 | | | | 0.13 | | | | (2.92 | ) | | | (2.79 | ) | | | (0.21 | ) | | | (3.00 | ) | | | (3.21 | ) | |
December 31,
2017 | | $ | 28.40 | | | | 0.06 | | | | 4.94 | | | | 5.00 | | | | (0.11 | ) | | | (6.52 | ) | | | (6.63 | ) | |
December 31,
2016 | | $ | 28.57 | | | | 0.08 | | | | 3.10 | | | | 3.18 | | | | — | | | | (3.35 | ) | | | (3.35 | ) | |
(a) Per share net investment income (loss) has been calculated using the average daily shares method.
(b) The Fund received monies related to nonrecurring refund from the prior custodian. The corresponding impact to the total return was less than 0.005% for the period shown.
(c) Not annualized for periods less than one year.
(d) Annualized for periods less than one year.
(e) Portfolio turnover is calculated on the basis of the Fund as a whole without distinguishing between the classes of shares issued.
(f) Amount is less than $0.005 per share.
See notes to financial statements.
34
Victory Portfolios | | Financial Highlights — continued | |
For a Share Outstanding Throughout Each Period (continued)
| | | | | Ratios to Average Net Assets | | Supplemental Data | |
| | | Capital
Contributions
from Prior
Custodian,
Net(b) | | Net Asset
Value,
End of
Period | | Total
Return(c) | | Net
Expenses(d) | | Net
Investment
Income
(Loss)(d) | | Gross
Expenses(d) | | Net Assets,
End of
Period
(000's) | | Portfolio
Turnover(c)(e) | |
Victory RS Value Fund | |
Class R | |
Six Months
Ended
June 30, 2021
(Unaudited) | | | — | | | $ | 26.42 | | | | 18.58 | % | | | 1.69 | % | | | (0.21 | )% | | | 2.05 | % | | $ | 672 | | | | 35 | % | |
Year Ended
December 31,
2020 | | | — | | | $ | 22.27 | | | | (2.95 | )% | | | 1.69 | % | | | (0.23 | )% | | | 4.03 | % | | $ | 677 | | | | 73 | % | |
December 31,
2019 | | | — | | | $ | 23.44 | | | | 30.89 | % | | | 1.69 | % | | | (0.13 | )% | | | 3.47 | % | | $ | 1,022 | | | | 54 | % | |
December 31,
2018 | | | — | | | $ | 19.26 | | | | (11.12 | )% | | | 1.69 | % | | | (0.11 | )% | | | 2.82 | % | | $ | 1,019 | | | | 65 | % | |
December 31,
2017 | | | — | | | $ | 25.06 | | | | 16.95 | % | | | 1.69 | % | | | (0.11 | )% | | | 2.29 | % | | $ | 1,625 | | | | 64 | % | |
December 31,
2016 | | | — | (f) | | $ | 27.03 | | | | 10.45 | %(b) | | | 1.69 | % | | | (0.34 | )% | | | 1.80 | % | | $ | 1,670 | | | | 67 | % | |
Class Y | |
Six Months
Ended
June 30, 2021
(Unaudited) | | | — | | | $ | 29.01 | | | | 18.99 | % | | | 1.05 | % | | | 0.43 | % | | | 1.05 | % | | $ | 154,959 | | | | 35 | % | |
Year Ended
December 31,
2020 | | | — | | | $ | 24.38 | | | | (2.37 | )% | | | 1.06 | % | | | 0.38 | % | | | 1.10 | % | | $ | 142,515 | | | | 73 | % | |
December 31,
2019 | | | — | | | $ | 25.45 | | | | 31.69 | % | | | 1.06 | % | | | 0.51 | % | | | 1.07 | % | | $ | 176,749 | | | | 54 | % | |
December 31,
2018 | | | — | | | $ | 20.77 | | | | (10.54 | )% | | | 1.06 | % | | | 0.49 | % | | | 1.06 | % | | $ | 166,538 | | | | 65 | % | |
December 31,
2017 | | | — | | | $ | 26.77 | | | | 17.71 | % | | | 1.06 | % | | | 0.20 | % | | | 1.06 | % | | $ | 247,528 | | | | 64 | % | |
December 31,
2016 | | | — | (f) | | $ | 28.40 | | | | 11.14 | %(b) | | | 1.06 | % | | | 0.26 | % | | | 1.19 | % | | $ | 260,818 | | | | 67 | % | |
See notes to financial statements.
35
Victory Portfolios | | Financial Highlights | |
For a Share Outstanding Throughout Each Period
| | | | | Investment Activities | | Distributions to
Shareholders From | |
| | | Net Asset
Value,
Beginning of
Period | | Net
Investment
Income
(Loss)(a) | | Net
Realized and
Unrealized
Gains
(Losses) on
Investments | | Total from
Investment
Activities | | Net
Investment
Income | | Net Realized
Gains from
Investments | | Total
Distributions | |
Victory RS Large Cap Alpha Fund | |
Class A | |
Six Months
Ended
June 30, 2021
(Unaudited) | | $ | 50.59 | | | | 0.29 | | | | 8.22 | | | | 8.51 | | | | — | | | | — | | | | — | | |
Year Ended
December 31,
2020 | | $ | 53.11 | | | | 0.52 | | | | (1.12 | ) | | | (0.60 | ) | | | (0.15 | ) | | | (1.77 | ) | | | (1.92 | ) | |
December 31,
2019 | | $ | 42.20 | | | | 0.51 | | | | 12.44 | | | | 12.95 | | | | (0.37 | ) | | | (1.67 | ) | | | (2.04 | ) | |
December 31,
2018 | | $ | 56.61 | | | | 0.44 | | | | (5.67 | ) | | | (5.23 | ) | | | (0.38 | ) | | | (8.80 | ) | | | (9.18 | ) | |
December 31,
2017 | | $ | 51.86 | | | | 0.38 | | | | 9.10 | | | | 9.48 | | | | — | (f) | | | (4.73 | ) | | | (4.73 | ) | |
December 31,
2016 | | $ | 50.98 | | | | 0.40 | | | | 4.01 | | | | 4.41 | | | | (0.42 | ) | | | (3.12 | ) | | | (3.54 | ) | |
Class C | |
Six Months
Ended
June 30, 2021
(Unaudited) | | $ | 42.07 | | | | 0.04 | | | | 6.84 | | | | 6.88 | | | | — | | | | — | | | | — | | |
Year Ended
December 31,
2020 | | $ | 44.70 | | | | 0.14 | | | | (1.00 | ) | | | (0.86 | ) | | | — | | | | (1.77 | ) | | | (1.77 | ) | |
December 31,
2019 | | $ | 35.78 | | | | 0.10 | | | | 10.50 | | | | 10.60 | | | | (0.01 | ) | | | (1.67 | ) | | | (1.68 | ) | |
December 31,
2018 | | $ | 49.50 | | | | (0.03 | ) | | | (4.89 | ) | | | (4.92 | ) | | | — | (f) | | | (8.80 | ) | | | (8.80 | ) | |
December 31,
2017 | | $ | 46.22 | | | | (0.04 | ) | | | 8.05 | | | | 8.01 | | | | — | | | | (4.73 | ) | | | (4.73 | ) | |
December 31,
2016 | | $ | 45.80 | | | | — | (f) | | | 3.57 | | | | 3.57 | | | | (0.04 | ) | | | (3.12 | ) | | | (3.16 | ) | |
(a) Per share net investment income (loss) has been calculated using the average daily shares method.
(b) The Fund received monies related to a nonrecurring refund from the prior custodian. The corresponding impact to the total return was 0.01% for the period shown.
(c) Not annualized for periods less than one year.
(d) Annualized for periods less than one year.
(e) Portfolio turnover is calculated on the basis of the Fund as a whole without distinguishing between the classes of shares issued.
(f) Amount is less than $0.005 per share.
See notes to financial statements.
36
Victory Portfolios | | Financial Highlights — continued | |
For a Share Outstanding Throughout Each Period
| | | | | Ratios to Average Net Assets | | Supplemental Data | |
| | | Capital
Contributions
from Prior
Custodian,
Net(b) | | Net Asset
Value,
End of
Period | | Total
Return
(Excludes
Sales
Charge)(c) | | Net
Expenses(d) | | Net
Investment
Income
(Loss)(d) | | Gross
Expenses(d) | | Net Assets,
End of
Period
(000's) | | Portfolio
Turnover(c)(e) | |
Victory RS Large Cap Alpha Fund | |
Class A | |
Six Months
Ended
June 30, 2021
(Unaudited) | | | — | | | $ | 59.10 | | | | 16.80 | % | | | 0.89 | % | | | 1.03 | % | | | 0.93 | % | | $ | 492,857 | | | | 20 | % | |
Year Ended
December 31,
2020 | | | — | | | $ | 50.59 | | | | (1.03 | )% | | | 0.89 | % | | | 1.13 | % | | | 0.95 | % | | $ | 444,160 | | | | 95 | % | |
December 31,
2019 | | | — | | | $ | 53.11 | | | | 30.73 | % | | | 0.89 | % | | | 1.03 | % | | | 0.95 | % | | $ | 520,159 | | | | 51 | % | |
December 31,
2018 | | | — | | | $ | 42.20 | | | | (9.31 | )% | | | 0.89 | % | | | 0.77 | % | | | 0.93 | % | | $ | 439,035 | | | | 59 | % | |
December 31,
2017 | | | — | | | $ | 56.61 | | | | 18.32 | % | | | 0.89 | % | | | 0.68 | % | | | 0.94 | % | | $ | 540,762 | | | | 55 | % | |
December 31,
2016 | | | 0.01 | | | $ | 51.86 | | | | 8.67 | %(b) | | | 0.89 | % | | | 0.79 | % | | | 0.92 | % | | $ | 522,593 | | | | 79 | % | |
Class C | |
Six Months
Ended
June 30, 2021
(Unaudited) | | | — | | | $ | 48.95 | | | | 16.35 | % | | | 1.69 | % | | | 0.18 | % | | | 1.80 | % | | $ | 8,083 | | | | 20 | % | |
Year Ended
December 31,
2020 | | | — | | | $ | 42.07 | | | | (1.85 | )% | | | 1.69 | % | | | 0.37 | % | | | 1.79 | % | | $ | 11,326 | | | | 95 | % | |
December 31,
2019 | | | — | | | $ | 44.70 | | | | 29.70 | % | | | 1.69 | % | | | 0.24 | % | | | 1.74 | % | | $ | 17,028 | | | | 51 | % | |
December 31,
2018 | | | — | | | $ | 35.78 | | | | (10.03 | )% | | | 1.69 | % | | | (0.06 | )% | | | 1.75 | % | | $ | 18,227 | | | | 59 | % | |
December 31,
2017 | | | — | | | $ | 49.50 | | | | 17.36 | % | | | 1.69 | % | | | (0.08 | )% | | | 1.71 | % | | $ | 29,771 | | | | 55 | % | |
December 31,
2016 | | | 0.01 | | | $ | 46.22 | | | | 7.80 | %(b) | | | 1.69 | % | | | (0.01 | )% | | | 1.71 | % | | $ | 28,801 | | | | 79 | % | |
See notes to financial statements.
37
Victory Portfolios | | Financial Highlights | |
For a Share Outstanding Throughout Each Period
| | | | Investment Activities | | Distributions to
Shareholders From | |
| | | Net Asset
Value,
Beginning of
Period | | Net
Investment
Income
(Loss)(a) | | Net
Realized and
Unrealized
Gains
(Losses) on
Investments | | Total from
Investment
Activities | | Net
Investment
Income | | Net Realized
Gains from
Investments | | Total
Distributions | |
Victory RS Large Cap Alpha Fund | |
Class R | |
Six Months
Ended
June 30, 2021
(Unaudited) | | $ | 50.28 | | | | 0.18 | | | | 8.16 | | | | 8.34 | | | | — | | | | — | | | | — | | |
Year Ended
December 31,
2020 | | $ | 52.83 | | | | 0.35 | | | | (1.13 | ) | | | (0.78 | ) | | | — | | | | (1.77 | ) | | | (1.77 | ) | |
December 31,
2019 | | $ | 42.01 | | | | 0.32 | | | | 12.36 | | | | 12.68 | | | | (0.19 | ) | | | (1.67 | ) | | | (1.86 | ) | |
December 31,
2018 | | $ | 56.35 | | | | 0.22 | | | | (5.61 | ) | | | (5.39 | ) | | | (0.15 | ) | | | (8.80 | ) | | | (8.95 | ) | |
December 31,
2017 | | $ | 51.83 | | | | 0.18 | | | | 9.07 | | | | 9.25 | | | | — | | | | (4.73 | ) | | | (4.73 | ) | |
December 31,
2016 | | $ | 50.93 | | | | 0.23 | | | | 3.99 | | | | 4.22 | | | | (0.21 | ) | | | (3.12 | ) | | | (3.33 | ) | |
Class Y | |
Six Months
Ended
June 30, 2021
(Unaudited) | | $ | 50.37 | | | | 0.34 | | | | 8.19 | | | | 8.53 | | | | — | | | | — | | | | — | | |
Year Ended
December 31,
2020 | | $ | 52.87 | | | | 0.62 | | | | (1.10 | ) | | | (0.48 | ) | | | (0.25 | ) | | | (1.77 | ) | | | (2.02 | ) | |
December 31,
2019 | | $ | 42.01 | | | | 0.61 | | | | 12.38 | | | | 12.99 | | | | (0.46 | ) | | | (1.67 | ) | | | (2.13 | ) | |
December 31,
2018 | | $ | 56.38 | | | | 0.55 | | | | (5.64 | ) | | | (5.09 | ) | | | (0.48 | ) | | | (8.80 | ) | | | (9.28 | ) | |
December 31,
2017 | | $ | 51.66 | | | | 0.49 | | | | 9.07 | | | | 9.56 | | | | (0.11 | ) | | | (4.73 | ) | | | (4.84 | ) | |
December 31,
2016 | | $ | 50.82 | | | | 0.51 | | | | 4.00 | | | | 4.51 | | | | (0.56 | ) | | | (3.12 | ) | | | (3.68 | ) | |
(a) Per share net investment income (loss) has been calculated using the average daily shares method.
(b) The Fund received monies related to a nonrecurring refund from the prior custodian. The corresponding impact to the total return was 0.01% for the period shown.
(c) Not annualized for periods less than one year.
(d) Annualized for periods less than one year.
(e) Portfolio turnover is calculated on the basis of the Fund as a whole without distinguishing between the classes of shares issued.
See notes to financial statements.
38
Victory Portfolios | | Financial Highlights — continued | |
For a Share Outstanding Throughout Each Period (continued)
| | | | | Ratios to Average Net Assets | | Supplemental Data | |
| | | Capital
Contributions
from Prior
Custodian,
Net(b) | | Net Asset
Value,
End of
Period | | Total
Return(c) | | Net
Expenses(d) | | Net
Investment
Income
(Loss)(d) | | Gross
Expenses(d) | | Net Assets,
End of
Period
(000's) | | Portfolio
Turnover(c)(e) | |
Victory RS Large Cap Alpha Fund | |
Class R | |
Six Months
Ended
June 30, 2021
(Unaudited) | | | — | | | $ | 58.62 | | | | 16.59 | % | | | 1.26 | % | | | 0.65 | % | | | 1.42 | % | | $ | 6,173 | | | | 20 | % | |
Year Ended
December 31,
2020 | | | — | | | $ | 50.28 | | | | (1.41 | )% | �� | | 1.26 | % | | | 0.77 | % | | | 1.50 | % | | $ | 6,066 | | | | 95 | % | |
December 31,
2019 | | | — | | | $ | 52.83 | | | | 30.23 | % | | | 1.26 | % | | | 0.66 | % | | | 1.48 | % | | $ | 7,232 | | | | 51 | % | |
December 31,
2018 | | | — | | | $ | 42.01 | | | | (9.63 | )% | | | 1.26 | % | | | 0.38 | % | | | 1.40 | % | | $ | 6,348 | | | | 59 | % | |
December 31,
2017 | | | — | | | $ | 56.35 | | | | 17.87 | % | | | 1.26 | % | | | 0.33 | % | | | 1.42 | % | | $ | 10,229 | | | | 55 | % | |
December 31,
2016 | | | 0.01 | | | $ | 51.83 | | | | 8.30 | %(b) | | | 1.23 | % | | | 0.45 | % | | | 1.23 | % | | $ | 10,631 | | | | 79 | % | |
Class Y | |
Six Months
Ended
June 30, 2021
(Unaudited) | | | — | | | $ | 58.90 | | | | 16.93 | % | | | 0.68 | % | | | 1.23 | % | | | 0.70 | % | | $ | 17,529 | | | | 20 | % | |
Year Ended
December 31,
2020 | | | — | | | $ | 50.37 | | | | (0.83 | )% | | | 0.68 | % | | | 1.34 | % | | | 0.82 | % | | $ | 16,011 | | | | 95 | % | |
December 31,
2019 | | | — | | | $ | 52.87 | | | | 30.99 | % | | | 0.68 | % | | | 1.24 | % | | | 0.78 | % | | $ | 20,021 | | | | 51 | % | |
December 31,
2018 | | | — | | | $ | 42.01 | | | | (9.11 | )% | | | 0.68 | % | | | 0.96 | % | | | 0.75 | % | | $ | 21,827 | | | | 59 | % | |
December 31,
2017 | | | — | | | $ | 56.38 | | | | 18.56 | % | | | 0.68 | % | | | 0.88 | % | | | 0.72 | % | | $ | 33,638 | | | | 55 | % | |
December 31,
2016 | | | 0.01 | | | $ | 51.66 | | | | 8.89 | %(b) | | | 0.68 | % | | | 1.00 | % | | | 0.69 | % | | $ | 31,840 | | | | 79 | % | |
See notes to financial statements.
39
Victory Portfolios | | Financial Highlights | |
For a Share Outstanding Throughout Each Period
| | | | Investment Activities | | Distributions to
Shareholders From | |
| | | Net Asset
Value,
Beginning of
Period | | Net
Investment
Income
(Loss)(a) | | Net Realized
and Unrealized
Gains (Losses)
on Investments | | Total from
Investment
Activities | | Net
Investment
Income | | Net Realized
Gains from
Investments | |
Victory RS Investors Fund | |
Class A | |
Six Months Ended
June 30, 2021
(Unaudited) | | $ | 12.84 | | | | 0.01 | | | | 2.29 | | | | 2.30 | | | | — | | | | — | | |
Year Ended
December 31, 2020 | | $ | 13.10 | | | | (0.01 | ) | | | (0.21 | ) | | | (0.22 | ) | | | — | | | | (0.04 | ) | |
December 31, 2019 | | $ | 10.68 | | | | — | (e) | | | 2.99 | | | | 2.99 | | | | — | | | | (0.57 | ) | |
December 31, 2018 | | $ | 13.86 | | | | — | (e) | | | (1.27 | ) | | | (1.27 | ) | | | — | | | | (1.91 | ) | |
December 31, 2017 | | $ | 13.65 | | | | (0.03 | ) | | | 2.23 | | | | 2.20 | | | | — | | | | (1.99 | ) | |
December 31, 2016 | | $ | 12.42 | | | | — | (e) | | | 1.23 | | | | 1.23 | | | | — | | | | — | | |
Class C | |
Six Months Ended
June 30, 2021
(Unaudited) | | $ | 11.22 | | | | (0.04 | ) | | | 2.00 | | | | 1.96 | | | | — | | | | — | | |
Year Ended
December 31, 2020 | | $ | 11.54 | | | | (0.08 | ) | | | (0.20 | ) | | | (0.28 | ) | | | — | | | | (0.04 | ) | |
December 31, 2019 | | $ | 9.53 | | | | (0.08 | ) | | | 2.66 | | | | 2.58 | | | | — | | | | (0.57 | ) | |
December 31, 2018 | | $ | 12.68 | | | | (0.10 | ) | | | (1.14 | ) | | | (1.24 | ) | | | — | | | | (1.91 | ) | |
December 31, 2017 | | $ | 12.73 | | | | (0.19 | ) | | | 2.13 | | | | 1.94 | | | | — | | | | (1.99 | ) | |
December 31, 2016 | | $ | 11.67 | | | | (0.09 | ) | | | 1.15 | | | | 1.06 | | | | — | | | | — | | |
Class R | |
Six Months Ended
June 30, 2021
(Unaudited) | | $ | 11.41 | | | | (0.03 | ) | | | 2.03 | | | | 2.00 | | | | — | | | | — | | |
Year Ended
December 31, 2020 | | $ | 11.72 | | | | (0.07 | ) | | | (0.20 | ) | | | (0.27 | ) | | | — | | | | (0.04 | ) | |
December 31, 2019 | | $ | 9.66 | | | | (0.07 | ) | | | 2.70 | | | | 2.63 | | | | — | | | | (0.57 | ) | |
December 31, 2018 | | $ | 12.81 | | | | (0.08 | ) | | | (1.16 | ) | | | (1.24 | ) | | | — | | | | (1.91 | ) | |
December 31, 2017 | | $ | 12.83 | | | | (0.17 | ) | | | 2.14 | | | | 1.97 | | | | — | | | | (1.99 | ) | |
December 31, 2016 | | $ | 11.73 | | | | (0.06 | ) | | | 1.16 | | | | 1.10 | | | | — | | | | — | | |
Class Y | |
Six Months Ended
June 30, 2021
(Unaudited) | | $ | 13.24 | | | | 0.03 | | | | 2.36 | | | | 2.39 | | | | — | | | | — | | |
Year Ended
December 31, 2020 | | $ | 13.47 | | | | 0.02 | | | | (0.21 | ) | | | (0.19 | ) | | | — | | | | (0.04 | ) | |
December 31, 2019 | | $ | 10.94 | | | | 0.03 | | | | 3.07 | | | | 3.10 | | | | — | | | | (0.57 | ) | |
December 31, 2018 | | $ | 14.10 | | | | 0.03 | | | | (1.28 | ) | | | (1.25 | ) | | | — | | | | (1.91 | ) | |
December 31, 2017 | | $ | 13.82 | | | | 0.03 | | | | 2.24 | | | | 2.27 | | | | — | | | | (1.99 | ) | |
December 31, 2016 | | $ | 12.55 | | | | 0.04 | | | | 1.24 | | | | 1.28 | | | | (0.01 | ) | | | — | | |
(a) Per share net investment income (loss) has been calculated using the average daily shares method.
(b) Not annualized for periods less than one year.
(c) Annualized for periods less than one year.
(d) Portfolio turnover is calculated on the basis of the Fund as a whole without distinguishing between the classes of shares issued.
(e) Amount is less than $0.005 per share.
See notes to financial statements.
40
Victory Portfolios | | Financial Highlights — continued | |
For a Share Outstanding Throughout Each Period
| | | | | Ratios to Average Net Assets | | Supplemental Data | |
| | | Total
Distributions | | Net Asset
Value,
End of
Period | | Total
Return
(Excludes
Sales
charge)(b) | | Net
Expenses(c) | | Net
Investment
Income
(Loss)(c) | | Gross
Expenses(c) | | Net Assets,
End of
Period
(000's) | | Portfolio
Turnover(b)(d) | |
Victory RS Investors Fund | |
Class A | |
Six Months Ended
June 30, 2021
(Unaudited) | | | — | | | $ | 15.14 | | | | 17.91 | % | | | 1.33 | % | | | 0.10 | % | | | 1.65 | % | | $ | 14,700 | | | | 41 | % | |
Year Ended
December 31, 2020 | | | (0.04 | ) | | $ | 12.84 | | | | (1.68 | )% | | | 1.33 | % | | | (0.08 | )% | | | 1.71 | % | | $ | 12,663 | | | | 66 | % | |
December 31, 2019 | | | (0.57 | ) | | $ | 13.10 | | | | 28.01 | % | | | 1.33 | % | | | 0.03 | % | | | 1.62 | % | | $ | 16,906 | | | | 64 | % | |
December 31, 2018 | | | (1.91 | ) | | $ | 10.68 | | | | (9.36 | )% | | | 1.33 | % | | | (0.03 | )% | | | 1.58 | % | | $ | 15,682 | | | | 56 | % | |
December 31, 2017 | | | (1.99 | ) | | $ | 13.86 | | | | 16.28 | % | | | 1.33 | % | | | (0.24 | )% | | | 1.54 | % | | $ | 20,419 | | | | 80 | % | |
December 31, 2016 | | | — | | | $ | 13.65 | | | | 9.90 | % | | | 1.33 | % | | | 0.02 | % | | | 1.56 | % | | $ | 28,022 | | | | 92 | % | |
Class C | |
Six Months Ended
June 30, 2021
(Unaudited) | | | — | | | $ | 13.18 | | | | 17.47 | % | | | 2.07 | % | | | (0.65 | )% | | | 2.48 | % | | $ | 3,022 | | | | 41 | % | |
Year Ended
December 31, 2020 | | | (0.04 | ) | | $ | 11.22 | | | | (2.43 | )% | | | 2.07 | % | | | (0.85 | )% | | | 2.75 | % | | $ | 3,306 | | | | 66 | % | |
December 31, 2019 | | | (0.57 | ) | | $ | 11.54 | | | | 27.08 | % | | | 2.07 | % | | | (0.73 | )% | | | 2.54 | % | | $ | 6,898 | | | | 64 | % | |
December 31, 2018 | | | (1.91 | ) | | $ | 9.53 | | | | (10.08 | )% | | | 2.07 | % | | | (0.82 | )% | | | 2.44 | % | | $ | 7,282 | | | | 56 | % | |
December 31, 2017 | | | (1.99 | ) | | $ | 12.68 | | | | 15.48 | % | | | 2.07 | % | | | (1.42 | )% | | | 2.35 | % | | $ | 11,149 | | | | 80 | % | |
December 31, 2016 | | | — | | | $ | 12.73 | | | | 9.08 | % | | | 2.07 | % | | | (0.72 | )% | | | 2.35 | % | | $ | 14,517 | | | | 92 | % | |
Class R | |
Six Months Ended
June 30, 2021
(Unaudited) | | | — | | | $ | 13.41 | | | | 17.53 | % | | | 1.95 | % | | | (0.52 | )% | | | 2.25 | % | | $ | 743 | | | | 41 | % | |
Year Ended
December 31, 2020 | | | (0.04 | ) | | $ | 11.41 | | | | (2.30 | )% | | | 1.95 | % | | | (0.71 | )% | | | 4.41 | % | | $ | 655 | | | | 66 | % | |
December 31, 2019 | | | (0.57 | ) | | $ | 11.72 | | | | 27.24 | % | | | 1.95 | % | | | (0.59 | )% | | | 3.85 | % | | $ | 844 | | | | 64 | % | |
December 31, 2018 | | | (1.91 | ) | | $ | 9.66 | | | | (9.91 | )% | | | 1.95 | % | | | (0.64 | )% | | | 3.15 | % | | $ | 831 | | | | 56 | % | |
December 31, 2017 | | | (1.99 | ) | | $ | 12.81 | | | | 15.50 | % | | | 1.95 | % | | | (1.27 | )% | | | 2.72 | % | | $ | 1,379 | | | | 80 | % | |
December 31, 2016 | | | — | | | $ | 12.83 | | | | 9.38 | % | | | 1.92 | % | | | (0.50 | )% | | | 1.92 | % | | $ | 1,314 | | | | 92 | % | |
Class Y | |
Six Months Ended
June 30, 2021
(Unaudited) | | | — | | | $ | 15.63 | | | | 18.05 | % | | | 1.05 | % | | | 0.38 | % | | | 1.32 | % | | $ | 12,827 | | | | 41 | % | |
Year Ended
December 31, 2020 | | | (0.04 | ) | | $ | 13.24 | | | | (1.41 | )% | | | 1.05 | % | | | 0.17 | % | | | 1.50 | % | | $ | 11,253 | | | | 66 | % | |
December 31, 2019 | | | (0.57 | ) | | $ | 13.47 | | | | 28.35 | % | | | 1.05 | % | | | 0.27 | % | | | 1.43 | % | | $ | 19,146 | | | | 64 | % | |
December 31, 2018 | | | (1.91 | ) | | $ | 10.94 | | | | (9.06 | )% | | | 1.05 | % | | | 0.18 | % | | | 1.37 | % | | $ | 14,669 | | | | 56 | % | |
December 31, 2017 | | | (1.99 | ) | | $ | 14.10 | | | | 16.59 | % | | | 1.05 | % | | | 0.19 | % | | | 1.25 | % | | $ | 27,131 | | | | 80 | % | |
December 31, 2016 | | | (0.01 | ) | | $ | 13.82 | | | | 10.17 | % | | | 1.05 | % | | | 0.28 | % | | | 1.24 | % | | $ | 50,013 | | | | 92 | % | |
See notes to financial statements.
41
Victory Portfolios | | Financial Highlights | |
For a Share Outstanding Throughout Each Period
| | | | | Investment Activities | | Distributions to
Shareholders From | |
| | | Net Asset
Value,
Beginning of
Period | | Net
Investment
Income
(Loss)(a) | | Net
Realized and
Unrealized
Gains
(Losses) on
Investments | | Total from
Investment
Activities | | Net
Investment
Income | | Total
Distributions | |
Victory Global Energy Transition Fund | |
Class A | |
Six Months Ended
June 30, 2021
(Unaudited) | | $ | 12.36 | | | | (0.04 | ) | | | 8.14 | | | | 8.10 | | | | — | | | | — | | |
Year Ended
December 31, 2020 | | $ | 9.71 | | | | (0.01 | ) | | | 2.67 | | | | 2.66 | | | | (0.01 | ) | | | (0.01 | ) | |
December 31, 2019 | | $ | 12.86 | | | | — | (f) | | | (3.15 | ) | | | (3.15 | ) | | | — | | | | — | | |
December 31, 2018 | | $ | 23.73 | | | | (0.14 | ) | | | (10.73 | ) | | | (10.87 | ) | | | — | | | | — | | |
December 31, 2017 | | $ | 23.49 | | | | (0.22 | ) | | | 0.46 | | | | 0.24 | | | | — | | | | — | | |
December 31, 2016 | | $ | 15.34 | | | | (0.10 | ) | | | 8.25 | | | | 8.15 | | | | — | | | | — | | |
Class C | |
Six Months Ended
June 30, 2021
(Unaudited) | | $ | 11.00 | | | | (0.10 | ) | | | 7.25 | | | | 7.15 | | | | — | | | | — | | |
Year Ended
December 31, 2020 | | $ | 8.71 | | | | (0.07 | ) | | | 2.36 | | | | 2.29 | | | | — | | | | — | | |
December 31, 2019 | | $ | 11.63 | | | | (0.08 | ) | | | (2.84 | ) | | | (2.92 | ) | | | — | | | | — | | |
December 31, 2018 | | $ | 21.63 | | | | (0.28 | ) | | | (9.72 | ) | | | (10.00 | ) | | | — | | | | — | | |
December 31, 2017 | | $ | 21.59 | | | | (0.36 | ) | | | 0.40 | | | | 0.04 | | | | — | | | | — | | |
December 31, 2016 | | $ | 14.21 | | | | (0.24 | ) | | | 7.62 | | | | 7.38 | | | | — | | | | — | | |
Class R | |
Six Months Ended
June 30, 2021
(Unaudited) | | $ | 11.62 | | | | (0.06 | ) | | | 7.65 | | | | 7.59 | | | | — | | | | — | | |
Year Ended
December 31, 2020 | | $ | 9.16 | | | | (0.04 | ) | | | 2.50 | | | | 2.46 | | | | — | | | | — | | |
December 31, 2019 | | $ | 12.18 | | | | (0.04 | ) | | | (2.98 | ) | | | (3.02 | ) | | | — | | | | — | | |
December 31, 2018 | | $ | 22.56 | | | | (0.20 | ) | | | (10.18 | ) | | | (10.38 | ) | | | — | | | | — | | |
December 31, 2017 | | $ | 22.42 | | | | (0.29 | ) | | | 0.43 | | | | 0.14 | | | | — | | | | — | | |
December 31, 2016 | | $ | 14.68 | | | | (0.15 | ) | | | 7.89 | | | | 7.74 | | | | — | | | | — | | |
Class Y | |
Six Months Ended
June 30, 2021
(Unaudited) | | $ | 12.88 | | | | (0.01 | ) | | | 8.48 | | | | 8.47 | | | | — | | | | — | | |
Year Ended
December 31, 2020 | | $ | 10.11 | | | | 0.02 | | | | 2.78 | | | | 2.80 | | | | (0.03 | ) | | | (0.03 | ) | |
December 31, 2019 | | $ | 13.38 | | | | 0.03 | | | | (3.27 | ) | | | (3.24 | ) | | | (0.03 | ) | | | (0.03 | ) | |
December 31, 2018 | | $ | 24.60 | | | | (0.06 | ) | | | (11.16 | ) | | | (11.22 | ) | | | — | | | | — | | |
December 31, 2017 | | $ | 24.28 | | | | (0.14 | ) | | | 0.46 | | | | 0.32 | | | | — | | | | — | | |
December 31, 2016 | | $ | 15.80 | | | | (0.04 | ) | | | 8.52 | | | | 8.48 | | | | — | | | | — | | |
* Includes adjustments in accordance with U.S. Generally Accepted Accounting Principles.
(a) Per share net investment income (loss) has been calculated using the average daily shares method.
(b) The Fund received monies related to a nonrecurring refund from the prior custodian. The corresponding impact to the total return was less than 0.005% for the period shown.
(c) Not annualized for periods less than one year.
(d) Annualized for periods less than one year.
(e) Portfolio turnover is calculated on the basis of the Fund as a whole without distinguishing between the classes of shares issued.
(f) Amount is less than $0.005 per share.
(g) Amount is less than 0.005%.
(h) Portfolio turnover increased due to change within the portfolio holdings during the year.
See notes to financial statements.
42
Victory Portfolios | | Financial Highlights — continued | |
For a Share Outstanding Throughout Each Period
| | | | | Ratios to Average Net Assets | | Supplemental Data | |
| | | Capital
Contributions
from Prior
Custodian,
Net(b) | | Net Asset
Value,
End of
Period | | Total
Return
(Excludes
Sales
Charge)*(c) | | Net
Expenses(d) | | Net
Investment
Income
(Loss)(d) | | Gross
Expenses(d) | | Net Assets,
End of
Period
(000's) | | Portfolio
Turnover(c)(e) | |
Victory Global Energy Transition Fund | |
Class A | |
Six Months Ended
June 30, 2021
(Unaudited) | | | — | | | $ | 20.46 | | | | 65.53 | % | | | 1.48 | % | | | (0.44 | )% | | | 1.55 | % | | $ | 76,054 | | | | 35 | % | |
Year Ended
December 31, 2020 | | | — | | | $ | 12.36 | | | | 27.35 | % | | | 1.48 | % | | | (0.15 | )% | | | 1.79 | % | | $ | 36,803 | | | | 46 | % | |
December 31, 2019 | | | — | | | $ | 9.71 | | | | (24.49 | )% | | | 1.48 | % | | | — | %(f) | | | 1.69 | % | | $ | 32,630 | | | | 24 | % | |
December 31, 2018 | | | — | | | $ | 12.86 | | | | (45.81 | )% | | | 1.48 | % | | | (0.65 | )% | | | 1.54 | % | | $ | 64,001 | | | | 26 | % | |
December 31, 2017 | | | — | | | $ | 23.73 | | | | 1.02 | % | | | 1.48 | % | | | (0.93 | )% | | | 1.55 | % | | $ | 262,455 | | | | 57 | %(h) | |
December 31, 2016 | | | — | (f) | | $ | 23.49 | | | | 53.13 | %(b) | | | 1.48 | % | | | (0.51 | )% | | | 1.48 | % | | $ | 545,778 | | | | 29 | % | |
Class C | |
Six Months Ended
June 30, 2021
(Unaudited) | | | — | | | $ | 18.15 | | | | 65.00 | % | | | 2.28 | % | | | (1.28 | )% | | | 2.55 | % | | $ | 3,120 | | | | 35 | % | |
Year Ended
December 31, 2020 | | | — | | | $ | 11.00 | | | | 26.29 | % | | | 2.28 | % | | | (0.92 | )% | | | 3.32 | % | | $ | 2,385 | | | | 46 | % | |
December 31, 2019 | | | — | | | $ | 8.71 | | | | (25.11 | )% | | | 2.28 | % | | | (0.81 | )% | | | 2.75 | % | | $ | 2,949 | | | | 24 | % | |
December 31, 2018 | | | — | | | $ | 11.63 | | | | (46.26 | )% | | | 2.28 | % | | | (1.42 | )% | | | 2.38 | % | | $ | 6,939 | | | | 26 | % | |
December 31, 2017 | | | — | | | $ | 21.63 | | | | 0.23 | % | | | 2.28 | % | | | (1.72 | )% | | | 2.35 | % | | $ | 20,428 | | | | 57 | %(h) | |
December 31, 2016 | | | — | (f) | | $ | 21.59 | | | | 51.94 | %(b) | | | 2.28 | % | | | (1.32 | )% | | | 2.31 | % | | $ | 30,789 | | | | 29 | % | |
Class R | |
Six Months Ended
June 30, 2021
(Unaudited) | | | — | | | $ | 19.21 | | | | 65.32 | % | | | 1.86 | % | | | (0.79 | )% | | | 1.89 | % | | $ | 2,201 | | | | 35 | % | |
Year Ended
December 31, 2020 | | | — | | | $ | 11.62 | | | | 26.86 | % | | | 1.86 | % | | | (0.51 | )% | | | 5.74 | % | | $ | 680 | | | | 46 | % | |
December 31, 2019 | | | — | | | $ | 9.16 | | | | (24.79 | )% | | | 1.86 | % | | | (0.37 | )% | | | 4.31 | % | | $ | 621 | | | | 24 | % | |
December 31, 2018 | | | — | | | $ | 12.18 | | | | (46.01 | )% | | | 1.86 | % | | | (0.99 | )% | | | 2.50 | % | | $ | 920 | | | | 26 | % | |
December 31, 2017 | | | — | | | $ | 22.56 | | | | 0.62 | % | | | 1.86 | % | | | (1.31 | )% | | | 2.20 | % | | $ | 2,442 | | | | 57 | %(h) | |
December 31, 2016 | | | — | (f) | | $ | 22.42 | | | | 52.72 | %(b) | | | 1.74 | % | | | (0.80 | )% | | | 1.74 | % | | $ | 4,611 | | | | 29 | % | |
Class Y | |
Six Months Ended
June 30, 2021
(Unaudited) | | | — | | | $ | 21.35 | | | | 65.76 | % | | | 1.15 | % | | | (0.11 | )% | | | 1.18 | % | | $ | 231,396 | | | | 35 | % | |
Year Ended
December 31, 2020 | | | — | | | $ | 12.88 | | | | 27.73 | % | | | 1.15 | % | | | 0.18 | % | | | 1.28 | % | | $ | 119,237 | | | | 46 | % | |
December 31, 2019 | | | — | | | $ | 10.11 | | | | (24.25 | )% | | | 1.15 | % | | | 0.27 | % | | | 1.26 | % | | $ | 114,972 | | | | 24 | % | |
December 31, 2018 | | | — | | | $ | 13.38 | | | | (45.63 | )% | | | 1.15 | % | | | (0.29 | )% | | | 1.20 | % | | $ | 393,581 | | | | 26 | % | |
December 31, 2017 | | | — | | | $ | 24.60 | | | | 1.36 | % | | | 1.15 | % | | | (0.58 | )% | | | 1.19 | % | | $ | 1,126,533 | | | | 57 | %(h) | |
December 31, 2016 | | | — | (f) | | $ | 24.28 | | | | 53.67 | %(b) | | | 1.15 | % | | | (0.19 | )% | | | 1.17 | % | | $ | 1,300,024 | | | | 29 | % | |
See notes to financial statements.
43
Victory Portfolios | | Notes to Financial Statements
June 30, 2021 | |
(Unaudited)
1. Organization:
Victory Portfolios (the "Trust") is organized as a Delaware statutory trust and the Trust is registered under the Investment Company Act of 1940, as amended (the "1940 Act"), as an open-end investment company. The Trust is comprised of 41 funds and is authorized to issue an unlimited number of shares, which are units of beneficial interest with a par value of $0.001 per share.
The accompanying financial statements are those of the following five Funds (collectively, the "Funds" and individually, a "Fund"). Each Fund, with the exception of RS Investors Fund and Global Energy Transition Fund (formerly, Global Natural Resources Fund), is classified as diversified under the 1940 Act.
Funds (Legal Name) | | Funds (Short Name) | | Investment Share
Classes Offered | |
Victory RS Partners Fund | | RS Partners Fund | | Classes A, R, Y and Member Class* | |
Victory RS Value Fund | | RS Value Fund | | Classes A, C, R and Y | |
Victory RS Large Cap Alpha Fund | | RS Large Cap Alpha Fund | | Classes A, C, R and Y | |
Victory RS Investors Fund | | RS Investors Fund | | Classes A, C, R and Y | |
Victory Global Energy Transition
Fund (Formerly Victory Global
Natural Resources Fund) | | Global Energy Transition Fund | | Classes A, C, R and Y | |
* Member Class commenced operations on November 3, 2020
Each class of shares of a Fund has substantially identical rights and privileges except with respect to sales charges, fees paid under distribution plans, expenses allocable exclusively to each class of shares, voting rights on matters solely affecting a single class of shares, and the exchange privilege of each class of shares.
Under the Trust's organizational documents, its officers and trustees are indemnified against certain liabilities arising out of the performance of their duties to the Funds. In addition, in the normal course of business, the Funds enter into contracts with their vendors and others that provide for general indemnifications. A Fund's maximum exposure under these arrangements is unknown, as this would involve future claims that may be made against the Funds. However, based on experience, the Funds expect that risk of loss to be remote.
2. Significant Accounting Policies:
The following is a summary of significant accounting policies followed by the Trust in the preparation of its financial statements. The policies are in conformity with Generally Accepted Accounting Principles in the United States of America ("GAAP"). The preparation of financial statements in accordance with GAAP requires management to make estimates and assumptions that affect the reported amounts of assets and liabilities and disclosure of contingent assets and liabilities at the date of the financial statements and the reported amounts of income and expenses for the period. Actual results could differ from those estimates. The Fund follows the specialized accounting and reporting requirements under GAAP that are applicable to investment companies under Accounting Standards Codification 946.
Investment Valuation:
The Funds record investments at fair value. Fair value is defined as the price that would be received to sell an asset or paid to transfer a liability in an orderly transaction between market participants at the measurement date.
The valuation techniques described below maximize the use of observable inputs and minimize the use of unobservable inputs in determining fair value. The inputs used for valuing the Funds' investments are summarized in the three broad levels listed below:
• Level 1 — quoted prices in active markets for identical securities
• Level 2 — other significant observable inputs (including quoted prices for similar securities or interest rates applicable to those securities, etc.)
44
Victory Portfolios | | Notes to Financial Statements — continued
June 30, 2021 | |
(Unaudited)
• Level 3 — significant unobservable inputs (including the Funds' own assumptions in determining the fair value of investments)
Changes in valuation techniques may result in transfers in or out of an assigned level within the disclosure hierarchy. The inputs or methodologies used for valuation techniques are not necessarily an indication of the risk associated with entering into those investments.
Victory Capital Management Inc. ("VCM" or the "Adviser") has established the Pricing and Liquidity Committee (the "Committee"), and subject to Trust's Board of Trustees' (the "Board") oversight, the Committee administers and oversees the Funds' valuation policies and procedures, which are approved by the Board.
Portfolio securities listed or traded on securities exchanges, including exchange-traded funds ("ETFs") and American Depositary Receipts ("ADRs"), are valued at the closing price on the exchange or system where the security is principally traded, if available, or at the Nasdaq Official Closing Price. If there have been no sales for that day on the exchange or system, then a security is valued at the last available bid quotation on the exchange or system where the security is principally traded. In each of these situations, valuations are typically categorized as Level 1 in the fair value hierarchy.
Investments in open-end investment companies are valued at net asset value ("NAV"). These valuations are typically categorized as Level 1 in the fair value hierarchy.
In the event that price quotations or valuations are not readily available, investments are valued at fair value in accordance with procedures established by and under the general supervision and responsibility of the Board. These valuations are typically categorized as Level 2 or Level 3 in the fair value hierarchy, based on the observability of inputs used to determine the fair value. The effect of fair value pricing is that securities may not be priced on the basis of quotations from the primary market in which they are traded and the actual price realized from the sale of a security may differ materially from the fair value price. Valuing these securities at fair value is intended to cause the Fund's NAV to be more reliable than it otherwise would be.
A summary of the valuations as of June 30, 2021, is included in the table below while the breakdown, by category, of investments is disclosed on the Schedules of Portfolio Investments:
| | | Level 1 | | Level 2 | | Level 3 | | Total | |
RS Partners Fund | |
Common Stocks | | $ | 376,840,942 | | | $ | — | | | $ | — | | | $ | 376,840,942 | | |
Preferred Stocks | | | — | | | | — | | | | 587,369 | | | | 587,369 | | |
Collateral for Securities Loaned | | | 14,006,617 | | | | — | | | | — | | | | 14,006,617 | | |
Total | | $ | 390,847,559 | | | $ | — | | | $ | 587,369 | | | $ | 391,434,928 | | |
RS Value Fund | |
Common Stocks | | $ | 336,349,006 | | | $ | — | | | $ | — | | | $ | 336,349,006 | | |
Collateral for Securities Loaned | | | 12,062,813 | | | | — | | | | — | | | | 12,062,813 | | |
Total | | $ | 348,411,819 | | | $ | — | | | $ | — | | | $ | 348,411,819 | | |
RS Large Cap Alpha Fund | |
Common Stocks | | $ | 513,126,379 | | | $ | — | | | $ | — | | | $ | 513,126,379 | | |
Total | | $ | 513,126,379 | | | $ | — | | | $ | — | | | $ | 513,126,379 | | |
RS Investors Fund | |
Common Stocks | | $ | 30,215,090 | | | $ | — | | | $ | — | | | $ | 30,215,090 | | |
Total | | $ | 30,215,090 | | | $ | — | | | $ | — | | | $ | 30,215,090 | | |
Global Energy Transition Fund | |
Common Stocks | | $ | 282,900,376 | | | $ | — | | | $ | — | | | $ | 282,900,376 | | |
Collateral for Securities Loaned | | | 17,593,103 | | | | — | | | | — | | | | 17,593,103 | | |
Total | | $ | 300,493,479 | | | $ | — | | | $ | — | | | $ | 300,493,479 | | |
For the six months ended June 30, 2021, there were no transfers in or out of Level 3 in the fair value hierarchy.
45
Victory Portfolios | | Notes to Financial Statements — continued
June 30, 2021 | |
(Unaudited)
Real Estate Investment Trusts ("REITs"):
The Funds may invest in REITs, which report information on the source of their distributions annually. REITs are pooled investment vehicles that invest primarily in income-producing real estate or real-estate related loans or interests (such as mortgages). Certain distributions received from REITs during the year are recorded as realized gains or return of capital as estimated by the Funds or when such information becomes known.
Investment Companies:
Open-End Funds:
The Funds may invest in portfolios of open-end investment companies. These investment companies value securities in their portfolios for which market quotations are readily available at their market values (generally the last reported sale price) and all other securities and assets at their fair value by the methods established by the board of directors of the underlying funds.
Investment Transactions and Related Income:
Changes in holdings of investments are accounted for no later than one business day following the trade date. For financial reporting purposes, however, investment transactions are accounted for on trade date on the last business day of the reporting period. Interest income is determined on the basis of coupon interest accrued using the effective interest method which adjusts, where applicable, the amortization of premiums or accretion of discounts. Dividend income is recorded on the ex-dividend date. Gains or losses realized on sales of securities are recorded on the identified cost basis. Paydown gains or losses on applicable securities, if any, are recorded as components of Interest income on the Statements of Operations.
Withholding taxes on interest, dividends and gains as a result of certain investments in ADRs by the Funds have been provided for in accordance with each investment's applicable country's tax rules and rates.
Securities Lending:
The Trust has entered into a Master Securities Lending Agreement ("MSLA") with Citibank, N.A. ("Citibank"). Under the terms of the MSLA, the Funds may lend securities to certain broker-dealers, and banks, in exchange for collateral in the amount of at least 102% of the value of U.S. securities loaned or at least 105% of the value of non-U.S. securities loaned, marked-to-market daily. Any collateral shortfalls associated with increases in the valuation of the securities loaned are adjusted the next business day. The collateral can be received in the form of cash collateral and/or non-cash collateral. Non-cash collateral can include U.S. Government Securities, letters of credit and certificates of deposit. The cash collateral is invested in short-term instruments or cash equivalents, primarily open-end investment companies, as noted on the Funds' Schedules of Portfolio Investments. The Trust does not have effective control of the non-cash collateral and therefore it is not disclosed on the Funds' Schedules of Portfolio Investments. During the time portfolio securities are on loan, the borrower will pay the Funds any dividends or interest paid on such securities plus any fee negotiated between the parties to the lending agreement. The Funds also earn a return from the collateral. The Funds pay Citibank various fees in connection with the investment of cash collateral and fees based on the investment income received from securities lending activities. Securities lending income (net of these fees) is disclosed on the Statements of Operations. Although risk is mitigated by the collateral, the Fund could experience a delay in recovering its securities and possible loss of income or value if the borrower fails to return them.
Securities lending transactions are entered into by a Fund under the MSLA, which permits the Fund, under certain circumstances such as an event of default, to offset amounts payable by the Fund to the same counterparty against amounts receivable from the counterparty to create a net payment due to or from the Fund.
46
Victory Portfolios | | Notes to Financial Statements — continued
June 30, 2021 | |
(Unaudited)
The following table is a summary of the Funds' securities lending transactions which are subject to offset under the MSLA as of June 30, 2021. These transactions are accounted for as secured borrowings with an overnight and continuous contractual maturity for cash collateral, and greater than overnight and continuous contractual maturity for non-cash collateral.
| | | Gross Amount of
Recognized | | Value of
Cash | | Value of Non-cash Collateral
Received by Maturity | | | |
| | | Assets (Value of
Securities on Loan) | | Collateral
Received* | | <30
Days | | Between
30 & 90 Days | | >90
Days | | Net
Amount | |
RS Partners Fund | | $ | 13,563,229 | | | $ | 13,563,229 | | | $ | — | | | $ | — | | | $ | — | | | $ | — | | |
RS Value Fund | | | 12,055,234 | | | | 12,055,234 | | | | — | | | | — | | | | — | | | | — | | |
Global Energy Transition Fund | | | 17,206,403 | | | | 17,206,403 | | | | — | | | | — | | | | — | | | | — | | |
* Collateral received in excess of the market value of securities on loan is not presented in this table. The total cash collateral received by each Fund is disclosed on the Statements of Assets and Liabilities.
Foreign Currency Translations:
The accounting records of the Funds are maintained in U.S. dollars. Investment securities and other assets and liabilities of a Fund denominated in a foreign currency are translated into U.S. dollars at current exchange rates. Purchases and sales of securities, income receipts and expense payments are translated into U.S. dollars at the exchange rates on the date of the transactions. The Funds do not isolate the portion of the results of operations resulting from changes in foreign exchange rates on investments from fluctuations arising from changes in market prices of securities held. Such fluctuations are disclosed as Net change in unrealized appreciation/depreciation on investment securities and foreign currency translations on the Statements of Operations. Any realized gains or losses from these fluctuations are disclosed as Net realized gains (losses) from investment securities and foreign currency translations on the Statements of Operations.
Federal Income Taxes:
It is the policy of each Fund to continue to qualify as a regulated investment company by complying with the provisions available to certain investment companies, as defined in applicable sections of the Internal Revenue Code, and to make distributions of net investment income and net realized gains sufficient to relieve it from all, or substantially all, federal income taxes. Accordingly, no provision for federal income taxes is required in the financial statements. The Funds have a tax year end of December 31.
Management of the Funds has reviewed tax positions taken in tax years that remain subject to examination by all major tax jurisdictions, including federal (i.e., the last four tax years, which includes the current fiscal tax year end). Management believes that there is no tax liability resulting from unrecognized tax benefits related to uncertain tax positions taken.
Allocations:
Expenses directly attributable to the Funds are charged to the Funds, while expenses that are attributable to more than one fund in the Trust, or jointly with an affiliated trust, are allocated among the respective funds in the Trust and/or affiliated trust based upon net assets or another appropriate basis.
Income, expenses (other than class-specific expenses such as transfer agent fees, state registration fees, 12b-1 fees, and printing fees), and realized and unrealized gains or losses on investments are allocated to each class of shares based on its relative net assets on the date income is earned or expenses and realized and unrealized gains and losses are incurred.
47
Victory Portfolios | | Notes to Financial Statements — continued
June 30, 2021 | |
(Unaudited)
3. Purchases and Sales:
Purchases and sales of securities (excluding securities maturing less than one year from acquisition) for the six months ended June 30, 2021, were as follows.
| | | Excluding
U.S. Government Securities | |
| | | Purchases | | Sales | |
RS Partners Fund | | $ | 110,942,599 | | | $ | 140,898,568 | | |
| RS Value Fund | | | 112,702,265 | | | | 138,147,566 | | |
| RS Large Cap Alpha Fund | | | 101,223,872 | | | | 138,632,626 | | |
| RS Investors Fund | | | 12,097,281 | | | | 14,499,584 | | |
| Global Energy Transition Fund | | | 100,452,535 | | | | 76,494,205 | | |
For the six months ended June 30, 2021, there were no purchases or sales of U.S. Government Securities.
4. Fees and Transactions with Affiliates and Related Parties:
Investment Advisory Fees:
Investment advisory services are provided to the Fund by the Adviser, which is a New York corporation registered as an investment adviser with the Securities and Exchange Commission ("SEC"). The Adviser is an indirect wholly owned subsidiary of Victory Capital Holdings, Inc., a publicly traded Delaware corporation, and a wholly owned direct subsidiary of Victory Capital Operating, LLC.
VCM has entered into a Sub-Advisory Agreement with SailingStone Capital Partners LLC ("SailingStone"). SailingStone is responsible for providing day-to-day investment advisory services to the Global Energy Transition Fund, subject to the oversight of the Board. Sub-investment advisory fees paid by VCM to SailingStone do not represent a separate or additional expense to the Funds.
Under the terms of the Investment Advisory Agreement, the Adviser is entitled to receive fees based on a percentage of the average daily net assets of each Fund. The rates at which the Adviser is paid by each Fund are included in the table below.
| | | Flat Rate | |
RS Partners Fund | | | 1.00 | % | |
RS Value Fund | | | 0.85 | % | |
RS Large Cap Alpha Fund | | | 0.50 | % | |
RS Investors Fund | | | 1.00 | % | |
Global Energy Transition Fund | | | 1.00 | % | |
Amounts incurred and paid to VCM for the six months ended June 30, 2021, are reflected on the Statements of Operations as Investment advisory fees.
Administration and Servicing Fees:
VCM serves as the Funds' administrator and fund accountant. Under the Administration and Fund Accounting Agreement, VCM is entitled to receive fees based on a percentage of the average daily net assets of the Trust, Victory Variable Insurance Funds and Victory Portfolios II (collectively, the "Victory Funds Complex"). The tiered rates at which VCM is paid by the Funds are shown in the table below:
| Assets up to $15 billion | | Assets $15 billion — $30 billion | | Assets over $30 billion | |
| | 0.08 | %, plus | | | 0.05 | %, plus | | | 0.04 | % | |
Amounts incurred for the six months ended June 30, 2021, are reflected on the Statements of Operations as Administration fees.
Citi Fund Services Ohio, Inc. ("Citi"), an affiliate of Citibank, acts as sub-administrator and sub-fund accountant to the Fund pursuant to the Sub-Administration and Sub-Fund Accounting Services Agreement between VCM and Citi. VCM pays Citi a fee for providing these services. The Trust reimburses
48
Victory Portfolios | | Notes to Financial Statements — continued
June 30, 2021 | |
(Unaudited)
VCM and Citi for out-of-pocket expenses incurred in providing these services and certain other expenses specifically allocated to the Fund. Amounts incurred for the six months ended June 30, 2021, are reflected on the Statements of Operations as Sub-Administration fees.
The Chief Compliance Officer ("CCO") is an employee of the Adviser, which pays the compensation of the CCO and his support staff. The Trust has entered into an agreement to provide compliance services with the Adviser, pursuant to which the Adviser furnishes its compliance personnel, including the services of the CCO, and other resources reasonably necessary to provide the Trust with compliance oversight services related to the design, administration and oversight of a compliance program for the Trust in accordance with Rule 38a-1 under the 1940 Act. The funds in the Victory Funds Complex, in aggregate, compensate the Adviser for these services. Amounts incurred for the six months ended June 30, 2021, are reflected on the Statements of Operations as Compliance fees.
Transfer Agency Fees:
FIS Investor Services, LLC ("FIS") serves as the Funds' transfer agent. Under the Transfer Agent Agreement, the Trust pays FIS a fee for its services and reimburses FIS for all of their reasonable out-of-pocket expenses incurred in providing these services. Amounts incurred for the six months ended June 30, 2021, are reflected on the Statements of Operations as Transfer agent fees.
Victory Capital Transfer Agency, Inc., an affiliate of the Adviser, serves as sub-transfer agent for the Member Class shares of the Funds and receives no fee or other compensation for these services.
Distributor/Underwriting Services:
Victory Capital Services, Inc. (the "Distributor"), an affiliate of the Adviser, serves as distributor for the continuous offering of the shares of the Funds pursuant to a Distribution Agreement between the Distributor and the Trust. Pursuant to the Distribution and Service Plans adopted in accordance with Rule 12b-1 under the 1940 Act, the Distributor may receive a monthly distribution and service fee as shown in the table below:
| | | Class A | | Class C | | Class R | | Class Y | | Member Class | |
RS Partners Fund | | | 0.25 | % | | | N/A | | | | 0.50 | % | | | 0.00 | % | | | 0.00 | % | |
RS Value Fund | | | 0.25 | % | | | 1.00 | % | | | 0.50 | % | | | 0.00 | % | | | N/A | | |
RS Large Cap Alpha Fund | | | 0.25 | % | | | 1.00 | % | | | 0.50 | % | | | 0.00 | % | | | N/A | | |
RS Investors Fund | | | 0.25 | % | | | 1.00 | % | | | 0.50 | % | | | 0.00 | % | | | N/A | | |
Global Energy Transition Fund | | | 0.25 | % | | | 1.00 | % | | | 0.50 | % | | | 0.00 | % | | | N/A | | |
The distribution and service fees paid to the Distributor may be used by the Distributor to pay for activities primarily intended to result in the sale of Class A, Class C, and Class R. Amounts incurred for the six months ended June 30, 2021, are reflected on the Statements of Operations as 12b-1 fees.
In addition, the Distributor is entitled to receive commissions on sale of the Class A. For the six months ended June 30, 2021, the Distributor received approximately $9,493 from commissions earned on the sale of Class A.
Other Fees:
Citibank serves as the Funds' custodian. The Funds pay Citibank a fee for providing these services. Amounts incurred for the six months ended June 30, 2021, are reflected on the Statements of Operations as Custodian fees.
Sidley Austin LLP provides legal services to the Trust.
The Adviser has entered into expense limitation agreements with certain Funds. Under the terms of the agreements, the Adviser has agreed to waive fees or reimburse certain expenses to the extent that ordinary operating expenses incurred by certain classes of a Fund in any fiscal year exceed the expense limit for such classes of the Fund. Such excess amounts will be the liability of the Adviser. Acquired fund fees and expense, interest, taxes, brokerage commissions, other expenditures that are capitalized
49
Victory Portfolios | | Notes to Financial Statements — continued
June 30, 2021 | |
(Unaudited)
in accordance with GAAP, and other extraordinary expenses not incurred in the ordinary course of a Fund's business are excluded from the expense limits. As of June 30, 2021, the expense limits (excluding voluntary waivers) are as follows:
| | | In effect until April 30, 2022 | |
| | | Class A | | Class C | | Class R | | Class Y | | Member Class | |
RS Partners Fund | | | 1.45 | % | | | N/A | | | | 1.81 | % | | | 1.12 | % | | | 1.25 | % | |
RS Value Fund | | | 1.30 | % | | | 2.07 | % | | | 1.69 | % | | | 1.06 | % | | | N/A | | |
RS Large Cap Alpha Fund | | | 0.89 | % | | | 1.69 | % | | | 1.26 | % | | | 0.68 | % | | | N/A | | |
RS Investors Fund | | | 1.33 | % | | | 2.07 | % | | | 1.95 | % | | | 1.05 | % | | | N/A | | |
Global Energy Transition Fund | | | 1.48 | % | | | 2.28 | % | | | 1.86 | % | | | 1.15 | % | | | N/A | | |
Under the terms of the expense limitation agreements, amended May 1, 2021, the Funds have agreed to repay fees and expenses that were waived or reimbursed by the Adviser for a period of up to three years (thirty six (36) months) after the waiver or reimbursement took place, subject to the lesser of any operating expense limits in effect at the time of: (a) the original waiver or expense reimbursement; or (b) the recoupment, after giving effect to the recoupment amount. Prior to May 1, 2021, the Funds were permitted to recoup fees waived and expenses reimbursed for up to three years after the fiscal year in which the waiver or reimbursement took place, subject to the limitations above. This change did not have any effect on the amounts previously reported for recoupment.
As of June 30, 2021, the following amounts are available to be repaid to the Adviser. The Funds have not recorded any amounts available to be repaid as a liability due to an assessment that such repayment is not probable at June 30, 2021.
| | | Expires
2021 | | Expires
2022 | | Expires
2023 | | Expires
2024 | | Total | |
RS Partners Fund | | $ | 170,752 | | | $ | 344,191 | | | $ | 316,786 | | | $ | 109,648 | | | $ | 941,377 | | |
RS Value Fund | | | 56,479 | | | | 154,554 | | | | 199,071 | | | | 34,976 | | | | 445,080 | | |
RS Large Cap Alpha Fund | | | 122,945 | | | | 327,684 | | | | 314,607 | | | | 105,955 | | | | 871,191 | | |
RS Investors Fund | | | 78,376 | | | | 162,310 | | | | 146,600 | | | | 46,765 | | | | 434,051 | | |
Global Energy Transition Fund | | | 265,146 | | | | 429,505 | | | | 234,015 | | | | 48,721 | | | | 977,387 | | |
The Adviser may voluntarily waive or reimburse additional fees to assist the Funds in maintaining competitive expense ratios. Voluntary waivers and reimbursements applicable to the Funds are not available to be recouped at a future time. There were no voluntary waivers or reimbursements for the six months ended June 30, 2021.
Certain officers and/or interested trustees of the Funds are also officers and/or employees of the Adviser, administrator, fund accountant, sub-administrator, sub-fund accountant, custodian, legal counsel and Distributor.
5. Risks:
The Funds may be subject to other risks in addition to these identified risks.
Equity Risk — An investment in the Funds' shares represents an indirect investment in the securities owned by the Funds, some of which will be traded on a national securities exchange or in the over-the-counter markets. The value of the securities in which the Funds invest, like other market investments, may move up or down, sometimes rapidly and unpredictably. The value of the securities in which the Funds invest may affect the value of the Funds' shares. An investment in the Funds' shares at any point in time may be worth less than the original investment, even after taking into account the reinvestment of the Funds' distributions.
Sector Risk — To the extent the Funds focus in one or more sectors, market or economic factors impacting those sectors could have a significant effect on the value of the Funds' investments and could make the Funds' performance more volatile. For example, the values of companies in the Information
50
Victory Portfolios | | Notes to Financial Statements — continued
June 30, 2021 | |
(Unaudited)
Technology sector are particularly vulnerable to economic downturns, short product cycles and aggressive pricing, market competition and changes in government regulation.
Concentration Risk — The Global Energy Transition Fund (herein, the "Fund") may concentrate its investments in a particular industry, as the term "concentration is used in the 1940 Act. Concentrating investments in the Natural Resources sector increases the risk of loss because the stocks of many or all of the companies in the sector may decline in value due to developments adversely affecting the sector. In addition, investors may buy or sell substantial amounts of the Fund's shares in response to factors affecting or expected to affect the natural resources sector, resulting in extreme inflows and outflows of cash into and out of the Fund. Such inflows or outflows might affect management of the Fund adversely to the extent they cause the Fund's cash position or cash requirements to exceed normal levels.
Geopolitical/Natural Disaster Risk — Global economies and financial markets are increasingly interconnected, which increases the possibilities that conditions in one country or region might adversely affect issuers in another country or region. Geopolitical and other risks, including war, terrorism, trade disputes, political or economic dysfunction within some nations, public health crises and related geopolitical events, as well as environmental disasters such as earthquakes, fires, and floods, may add to instability in world economies and markets generally. Changes in trade policies and international trade agreements could affect the economies of many countries in unpredictable ways. Likewise, systemic market dislocations of the kind that occurred during the financial crisis that began in 2008, if repeated, would be highly disruptive to economies and markets, adversely affecting individual companies and industries, securities markets, interest rates, credit ratings, inflation, investor sentiment, and other factors affecting the value of a Fund's investments. Some countries, including the United States, are adopting more protectionist trade policies and moving away from the tighter financial industry regulations that followed the 2008 financial crisis, which may also affect the value of a Fund's investments.
Political events within the United States at times have resulted, and may in the future result, in a shutdown of government services, which could negatively affect the U.S. economy, decrease the value of a Fund's investments, increase uncertainty in or impair the operation of the U.S. or other securities markets, and degrade investor and consumer confidence, perhaps suddenly and to a significant degree.
6. Borrowing and Interfund Lending:
Line of Credit:
The Victory Funds Complex participates in a short-term demand note "Line of Credit" agreement with Citibank. The Line of Credit agreement with Citibank was renewed on June 29, 2021, with a termination date of June 27, 2022. Under the agreement with Citibank, the Victory Funds Complex may borrow up to $600 million, of which $300 million is committed and $300 million is uncommitted. $40 million of the Line of Credit is reserved for use by the Victory Floating Rate Fund, another series of the Victory Funds Complex, with Victory Floating Rate Fund paying the related commitment fees for that amount. The purpose of the Line of Credit is to meet temporary or emergency cash needs. For the six months ended June 30, 2021, Citibank received an annual commitment fee of 0.15% on $300 million for providing the Line of Credit. Each fund in the Victory Funds Complex pays a pro-rata portion of the commitment fees plus any interest (one month LIBOR plus one percent) on amounts borrowed. For the period June 29, 2020, through April 30, 2021, under an amended Line of Credit agreement, Citibank received an annual upfront fee of 0.10% on the $300 million committed line of credit. Each fund in the Victory Funds Complex paid a pro-rata portion of the upfront fee. Effective with the renewal, the annual commitment fee of 0.15% remains unchanged and the upfront fee of 0.10% was discontinued. Interest charged to each Fund during the period, if applicable, is reflected on the Statements of Operations under Line of credit fees.
The Funds had no borrowings under the Line of Credit during the six months ended June 30, 2021.
51
Victory Portfolios | | Notes to Financial Statements — continued
June 30, 2021 | |
(Unaudited)
Interfund Lending:
The Trust and Adviser rely on an exemptive order granted by the SEC in March 2017 (the "Order"), permitting the establishment and operation of an Interfund Lending Facility (the "Facility"). The Facility allows each Fund to directly lend and borrow money to or from any other fund in the Victory Funds Complex that is permitted to participate in the Facility, relying upon the Order at rates beneficial to both the borrowing and lending funds. Advances under the Facility are allowed for temporary or emergency purposes, including the meeting of redemption requests that otherwise might require the untimely disposition of securities, and are subject to each Fund's borrowing restrictions. The interfund loan rate is determined, as specified in the Order, by averaging the current repurchase agreement rate and the current bank loan rate. As a Borrower, interest charged to each Fund during the period, if applicable, is presented on the Statements of Operations under Interfund lending fees. As a Lender, interest earned by each Fund during the period, if applicable, is presented on the Statements of Operations under Interest expense on interfund lending.
The Funds did not utilize or participate in the Facility during the six months ended June 30, 2021.
7. Federal Income Tax Information:
Dividends from net investment income, if any, are declared and paid as noted in the table below. Distributable net realized gains, if any, are declared and distributed at least annually from each Fund.
| | | Declared | | Paid | |
RS Partners Fund | | Annually | | Annually | |
RS Value Fund | | Annually | | Annually | |
RS Large Cap Alpha Fund | | Annually | | Annually | |
RS Investors Fund | | Annually | | Annually | |
Global Energy Transition Fund | | Annually | | Annually | |
The amounts of dividends from net investment income and distributions from net realized gains (collectively, distributions to shareholders) are determined in accordance with federal income tax regulations, which may differ from GAAP. To the extent these "book/tax" differences are permanent in nature (e.g., net operating loss and distribution reclassification), such amounts are reclassified within the components of net assets based on their federal tax-basis treatment; temporary differences (e.g., wash sales) do not require reclassification. To the extent dividends and distributions exceed net investment income and net realized gains for tax purposes, they are reported as distributions of capital. Net investment losses incurred by a Fund may be reclassified as an offset to capital on the accompanying Statements of Assets and Liabilities.
The tax character of current year distributions paid and the tax basis of the current components of accumulated earnings (deficit) will be determined at the end of the current tax year ending December 31, 2021.
As of the tax year ended December 31, 2020, the Funds had net capital loss carryforwards as shown in the table below. It is unlikely that the Board will authorize a distribution of capital gains realized in the future until the capital loss carryforwards have been used.
| | | Short-Term
Amount | | Long-Term
Amount | | Total | |
RS Partners Fund | | $ | 9,328,334 | | | $ | — | | | $ | 9,328,334 | | |
RS Value Fund | | | 11,867,080 | | | | — | | | | 11,867,080 | | |
RS Large Cap Alpha Fund | | | 577,913 | | | | — | | | | 577,913 | | |
RS Investors Fund | | | 2,106,442 | | | | — | | | | 2,106,442 | | |
Global Energy Transition Fund | | | 9,316,769 | | | | 1,818,972,760 | | | | 1,828,289,529 | | |
52
Victory Portfolios | | Supplemental Information
June 30, 2021 | |
(Unaudited)
Proxy Voting and Portfolio Holdings Information
Proxy Voting:
Information regarding the policies and procedures the Funds used to determine how to vote proxies relating to portfolio securities is available without charge, upon request, by calling 800-539-3863. The information is also included in the Funds' Statement of Additional Information, which is available on the SEC's website at www.sec.gov.
Information relating to how the Funds voted proxies relating to portfolio securities held during the most recent 12 months ended June 30 is available on the SEC's website at www.sec.gov.
Availability of Schedules of Portfolio Investments:
The Trust files a complete list of Schedules of Portfolio Investments with the SEC for the first and third quarter of each fiscal year on Form N-PORT. Forms N-PORT is available on the SEC's website at www.sec.gov.
Expense Examples
As a shareholder of the Funds, you may incur two types of costs: (1) transaction costs, including sales charges (loads) on purchases; and (2) ongoing costs, including management fees, distribution and service (12b-1) fees and other Fund expenses. These examples are intended to help you understand your ongoing costs (in dollars) of investing in the Funds and to compare these costs with the ongoing costs of investing in other mutual funds.
These examples are based on an investment of $1,000 invested at the beginning of the period and held for the entire period from January 1, 2021, through June 30, 2021.
The Actual Expense figures in the table below provide information about actual account values and actual expenses. You may use the information below, together with the amount you invested, to estimate the expenses that you paid over the period. Simply divide your account value by $1,000 (for example, an $8,600 account value divided by $1,000 = 8.6), then multiply the result by the number in the table under the heading entitled "Actual Expenses Paid During Period" to estimate the expenses you paid on your account during this period.
The Hypothetical Expense figures in the table below provide information about hypothetical account values and hypothetical expenses based on the Fund's actual expense ratio and an assumed rate of return of 5% per year before expenses, which is not the Fund's actual return. The hypothetical account values and expenses may not be used to estimate the actual ending account balance or expenses you paid for the period. You may use this information to compare this 5% hypothetical example with the 5% hypothetical examples that appear in shareholder reports of other funds.
Please note the expenses shown in the table below are meant to highlight your ongoing costs only and do not reflect any transactional costs. If these transactional costs were included, your costs would have been higher.
| | | Beginning
Account
Value
1/1/21 | | Actual
Ending
Account
Value
6/30/21 | | Hypothetical
Ending
Account
Value
6/30/21 | | Actual
Expenses Paid
During Period
1/1/21-6/30/21* | | Hypothetical
Expenses Paid
During Period
1/1/21-6/30/21* | | Annualized
Expense Ratio
During Period
1/1/21-6/30/21 | |
RS Partners Fund | |
Class A | | $ | 1,000.00 | | | $ | 1,253.60 | | | $ | 1,017.60 | | | $ | 8.10 | | | $ | 7.25 | | | | 1.45 | % | |
Class R | | | 1,000.00 | | | | 1,251.70 | | | | 1,015.82 | | | | 10.11 | | | | 9.05 | | | | 1.81 | % | |
Class Y | | | 1,000.00 | | | | 1,255.80 | | | | 1,019.24 | | | | 6.26 | | | | 5.61 | | | | 1.12 | % | |
Member Class | | | 1,000.00 | | | | 1,255.20 | | | | 1,018.60 | | | | 6.99 | | | | 6.26 | | | | 1.25 | % | |
RS Value Fund | |
Class A | | | 1,000.00 | | | | 1,188.30 | | | | 1,018.35 | | | | 7.05 | | | | 6.51 | | | | 1.30 | % | |
Class C | | | 1,000.00 | | | | 1,184.00 | | | | 1,014.53 | | | | 11.21 | | | | 10.34 | | | | 2.07 | % | |
Class R | | | 1,000.00 | | | | 1,185.80 | | | | 1,016.41 | | | | 9.16 | | | | 8.45 | | | | 1.69 | % | |
Class Y | | | 1,000.00 | | | | 1,189.90 | | | | 1,019.59 | | | | 5.70 | | | | 5.26 | | | | 1.05 | % | |
53
Victory Portfolios | | Supplemental Information — continued
June 30, 2021 | |
(Unaudited)
| | | Beginning
Account
Value
1/1/21 | | Actual
Ending
Account
Value
6/30/21 | | Hypothetical
Ending
Account
Value
6/30/21 | | Actual
Expenses Paid
During Period
1/1/21-6/30/21* | | Hypothetical
Expenses Paid
During Period
1/1/21-6/30/21* | | Annualized
Expense Ratio
During Period
1/1/21-6/30/21 | |
RS Large Cap Alpha Fund | |
Class A | | $ | 1,000.00 | | | $ | 1,168.00 | | | $ | 1,020.38 | | | $ | 4.78 | | | $ | 4.46 | | | | 0.89 | % | |
Class C | | | 1,000.00 | | | | 1,163.50 | | | | 1,016.41 | | | | 9.07 | | | | 8.45 | | | | 1.69 | % | |
Class R | | | 1,000.00 | | | | 1,165.90 | | | | 1,018.55 | | | | 6.77 | | | | 6.31 | | | | 1.26 | % | |
Class Y | | | 1,000.00 | | | | 1,169.30 | | | | 1,021.42 | | | | 3.66 | | | | 3.41 | | | | 0.68 | % | |
RS Investors Fund | |
Class A | | | 1,000.00 | | | | 1,179.10 | | | | 1,018.20 | | | | 7.19 | | | | 6.66 | | | | 1.33 | % | |
Class C | | | 1,000.00 | | | | 1,174.70 | | | | 1,014.53 | | | | 11.16 | | | | 10.34 | | | | 2.07 | % | |
Class R | | | 1,000.00 | | | | 1,175.30 | | | | 1,015.12 | | | | 10.52 | | | | 9.74 | | | | 1.95 | % | |
Class Y | | | 1,000.00 | | | | 1,180.50 | | | | 1,019.59 | | | | 5.68 | | | | 5.26 | | | | 1.05 | % | |
Global Energy Transition Fund | |
Class A | | | 1,000.00 | | | | 1,655.30 | | | | 1,017.46 | | | | 9.74 | | | | 7.40 | | | | 1.48 | % | |
Class C | | | 1,000.00 | | | | 1,650.00 | | | | 1,013.49 | | | | 14.98 | | | | 11.38 | | | | 2.28 | % | |
Class R | | | 1,000.00 | | | | 1,653.20 | | | | 1,015.57 | | | | 12.24 | | | | 9.30 | | | | 1.86 | % | |
Class Y | | | 1,000.00 | | | | 1,657.60 | | | | 1,019.09 | | | | 7.58 | | | | 5.76 | | | | 1.15 | % | |
* Expenses are equal to the average account value multiplied by the Fund's annualized expense ratio multiplied by 181/365 (the number of days in the most recent fiscal half-year divided by the number of days in the fiscal year).
54
Victory Portfolios | | Supplemental Information — continued
June 30, 2021 | |
(Unaudited)
Liquidity Risk Management Program:
The Victory Funds have adopted and implemented a written liquidity risk management program (the "LRMP") as required by Rule 22e-4 under the Investment Company Act of 1940, as amended. The LRMP is reasonably designed to assess and manage each Fund's liquidity risk, taking into consideration each Fund's investment strategy and the liquidity of its portfolio investments during normal and reasonably foreseeable stressed market conditions; its short- and long-term cash flow projections; and its cash holdings and access to other liquidity management tools such as available funding sources including the Victory Funds Complex Interfund Lending Facility and Line of Credit (discussed in the Notes to Financial Statements). The Victory Funds' Board of Trustees approved the appointment of the Funds' investment adviser, Victory Capital Management Inc. ("Victory Capital"), as the administrator of the LRMP.
Victory Capital manages liquidity risks associated with the Funds' investments by monitoring, among other things, cash and cash equivalents, any use of derivatives, the concentration of investments, the appropriateness of each Fund's investment strategy, and by classifying every Fund investment as either highly liquid, moderately liquid, less liquid or illiquid on at least a monthly basis. To assist with the classification of Fund investments, Victory Capital has retained a third-party provider of liquidity evaluation services. This provider determines preliminary liquidity classifications for all portfolio holdings based upon portfolio-level data and certain assumptions provided by Victory Capital. Victory Capital reviews the preliminary liquidity classifications and, when appropriate, considers other information including input from the Funds' portfolio managers (including the portfolio managers employed by any investment sub-advisers) in determining final liquidity classifications.
At a meeting held on February 18, 2021, Victory Capital provided an oral and written report to the Trustees on the operation and effectiveness of the LRMP during the previous year. The report from Victory Capital concluded that the Funds did not experience any significant liquidity challenges during the covered period, and the Funds' LRMP is reasonably designed to assess and manage its liquidity risk. The report also concluded that the LRMP continues to operate adequately and effectively to enable Victory Capital to oversee and manage liquidity risk and ensure each Fund is able to meet redemption requests without significant dilution to the remaining investors' interest in each Fund. During the review period, each Fund's portfolio consisted primarily of highly liquid investments, which are defined as cash and any investments that the Fund reasonably expects to be converted to cash in current market conditions in three business days or less without significantly changing the market value of the investment. Therefore, the Funds have not adopted a highly liquid investment minimum. The Funds' investments were below the limitation on illiquid investments during the review period. Additionally, Victory Capital indicated that no events occurred that would require the filing of Form N-LIQUID and recommended no material changes to the LRMP.
55
Privacy Policy
Protecting the Privacy of Information
The Trust respects your right to privacy. We also know that you expect us to conduct and process your business in an accurate and efficient manner. To do so, we must collect and maintain certain personal information about you. This is the information we collect from you on applications or other forms, and from the transactions you make with us or third parties. It may include your name, address, social security number, account transactions and balances, and information about investment goals and risk tolerance.
We do not disclose any information about you or about former customers to anyone except as permitted or required by law. Specifically, we may disclose the information we collect to companies that perform services on our behalf, such as the transfer agent that processes shareholder accounts and printers and mailers that assist us in the distribution of investor materials. We may also disclose this information to companies that perform marketing services on our behalf. This allows us to continue to offer you Victory investment products and services that meet your investing needs, and to effect transactions that you request or authorize. These companies will use this information only in connection with the services for which we hired them. They are not permitted to use or share this information for any other purpose.
To protect your personal information internally, we permit access only by authorized employees and maintain physical, electronic, and procedural safeguards to guard your personal information.*
* You may have received communications regarding information about privacy policies from other financial institutions which gave you the opportunity to "opt-out" of certain information sharing with companies which are not affiliated with that financial institution. The Trust does not share information with other companies for purposes of marketing solicitations for products other than the Trust. Therefore, the Trust does not provide opt-out options to their shareholders.
Victory Funds
P.O. Box 182593
Columbus, Ohio 43218-2593

Visit our website at: | | Call Victory at: | |
www.vcm.com | | 800-539-FUND (800-539-3863) | |
| | | 800-235-8396 for Member Class | |

June 30, 2021
Semi Annual Report
Victory RS Small Cap Growth Fund
Victory RS Select Growth Fund
Victory RS Mid Cap Growth Fund
Victory RS Growth Fund
Victory RS Science and Technology Fund
Victory RS Small Cap Equity Fund
www.vcm.com
News, Information And Education 24 Hours A Day, 7 Days A Week
The Victory Funds site gives fund shareholders, prospective shareholders, and investment professionals a convenient way to access fund information, get guidance, and track fund performance anywhere they can access the Internet. The site includes:
• Detailed performance records
• Daily share prices
• The latest fund news
• Investment resources to help you become a better investor
• A section dedicated to investment professionals
Whether you're a potential investor searching for the fund that matches your investment philosophy, a seasoned investor interested in planning tools, or an investment professional, www.vcm.com has what you seek. Visit us anytime. We're always open.
TABLE OF CONTENTS
Investment Objective and Portfolio
Holdings | | | 3 | | |
Schedules of Portfolio Investments | |
Victory RS Small Cap Growth Fund | | | 9 | | |
Victory RS Select Growth Fund | | | 13 | | |
Victory RS Mid Cap Growth Fund | | | 16 | | |
Victory RS Growth Fund | | | 19 | | |
Victory RS Science and Technology Fund | | | 22 | | |
Victory RS Small Cap Equity Fund | | | 27 | | |
Financial Statements | |
Statements of Assets and Liabilities | | | 29 | | |
Statements of Operations | | | 31 | | |
Statements of Changes in Net Assets | | | 33 | | |
Financial Highlights | | | 40 | | |
Notes to Financial Statements | | | 64 | | |
Supplemental Information | | | 75 | | |
Proxy Voting and Portfolio Holdings Information | | | 75 | | |
Expense Examples | | | 75 | | |
Liquidity Risk Management Program | | | 77 | | |
Privacy Policy (inside back cover) | | | |
1
IRA DISTRIBUTION WITHHOLDING DISCLOSURE
We generally must withhold federal income tax at a rate of 10% of the taxable portion of your distribution and, if you live in a state that requires state income tax withholding, at your state's tax rate. However, you may elect not to have withholding apply or to have income tax withheld at a higher rate. Any withholding election that you make will apply to any subsequent distribution unless and until you change or revoke the election. If you wish to make a withholding election, or change or revoke a prior withholding election, call 800-539-3863 (800-235-8396 for Member Class) and form W-4P (OMB No. 1545-0074 withholding certificate for pension or annuity payments) will be electronically sent.
If you do not have a withholding election in place by the date of a distribution, federal income tax will be withheld from the taxable portion of your distribution at a rate of 10%. If you must pay estimated taxes, you may be subject to estimated tax penalties if your estimated tax payments are not sufficient and sufficient tax is not withheld from your distribution.
For more specific information, please consult your tax adviser.
The Funds are distributed by Victory Capital Services, Inc. Victory Capital Management Inc. is the investment adviser to the Funds and receives fees from the Funds for performing services for the Funds.
This report is not authorized for distribution to prospective investors unless preceded or accompanied by a current prospectus of the Victory Funds.
For additional information about any Victory Fund, including fees, expenses, and risks, view our prospectus online at vcm.com or call 800-539-3863 (800-235-8396 for Member Class). Read it carefully before you invest or send money.
The information in this report is based on data obtained from recognized services and sources and is believed to be reliable. Any opinions, projections, or recommendations in this report are subject to change without notice and are not intended as individual investment advice. Past investment performance of the Funds, markets or securities mentioned herein should not be considered to be indicative of future results.
• NOT FDIC INSURED • NO BANK GUARANTEE • MAY LOSE VALUE

Call Victory at:
800-539-FUND (800-539-3863)
800-235-8396 for Member Class
Visit our website at:
www.vcm.com
2
Victory Portfolios
Victory RS Small Cap Growth Fund | | June 30, 2021 | |
(Unaudited)
Investment Objective and Portfolio Holdings:
The Fund's investment objective seeks to provide long-term capital growth.
Top 10 Holdings*:
June 30, 2021
(% of Net Assets)
Avaya Holdings Corp. | | | 3.1 | % | |
Bandwidth, Inc. | | | 2.6 | % | |
Varonis Systems, Inc. | | | 2.3 | % | |
MACOM Technology Solutions Holdings, Inc. | | | 2.3 | % | |
Lattice Semiconductor Corp. | | | 2.2 | % | |
Freshpet, Inc. | | | 2.1 | % | |
Evoqua Water Technologies Corp. | | | 1.9 | % | |
Advanced Energy Industries, Inc. | | | 1.9 | % | |
Itron, Inc. | | | 1.8 | % | |
Saia, Inc. | | | 1.7 | % | |
Sector Allocation*:
June 30, 2021
(% of Net Assets)
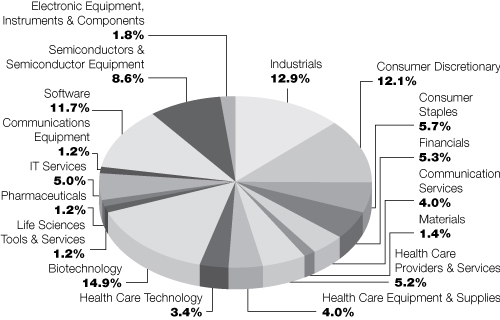
* Does not include futures contracts, money market instruments, and short-term investments purchased with cash collateral from securities loaned.
Percentages are of the net assets of the Fund and may not equal 100%.
Refer to the Schedule of Portfolio Investments for a complete list of securities.
3
Victory Portfolios
Victory RS Select Growth Fund | | June 30, 2021 | |
(Unaudited)
Investment Objective and Portfolio Holdings:
The Fund's investment objective seeks to provide long-term capital growth.
Top 10 Holdings*:
June 30, 2021
(% of Net Assets)
Dynatrace, Inc. | | | 3.0 | % | |
Five9, Inc. | | | 2.9 | % | |
Tempur Sealy International, Inc. | | | 2.7 | % | |
West Pharmaceutical Services, Inc. | | | 2.5 | % | |
Avantor, Inc. | | | 2.5 | % | |
Horizon Therapeutics PLC | | | 2.5 | % | |
Halozyme Therapeutics, Inc. | | | 2.4 | % | |
The Middleby Corp. | | | 2.3 | % | |
RingCentral, Inc. | | | 2.3 | % | |
Jazz Pharmaceuticals PLC | | | 2.2 | % | |
Sector Allocation*:
June 30, 2021
(% of Net Assets)
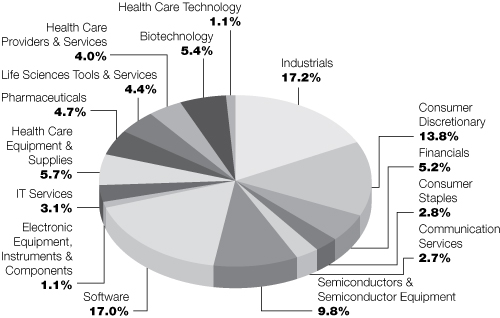
* Does not include futures contracts, money market instruments, and short-term investments purchased with cash collateral from securities loaned.
Percentages are of the net assets of the Fund and may not equal 100%.
Refer to the Schedule of Portfolio Investments for a complete list of securities.
4
Victory Portfolios
Victory RS Mid Cap Growth Fund | | June 30, 2021 | |
(Unaudited)
Investment Objective and Portfolio Holdings:
The Fund's investment objective seeks to provide long-term capital growth.
Top 10 Holdings*:
June 30, 2021
(% of Net Assets)
Wix.com Ltd. | | | 4.0 | % | |
RingCentral, Inc.,Class A | | | 3.4 | % | |
West Pharmaceutical Services, Inc. | | | 3.1 | % | |
Synopsys, Inc. | | | 2.3 | % | |
Roku, Inc. | | | 2.2 | % | |
Twilio, Inc.,Class A | | | 2.2 | % | |
Chipotle Mexican Grill, Inc. | | | 2.2 | % | |
Pool Corp. | | | 2.1 | % | |
MSCI, Inc. | | | 2.0 | % | |
DocuSign, Inc. | | | 1.9 | % | |
Sector Allocation*:
June 30, 2021
(% of Net Assets)
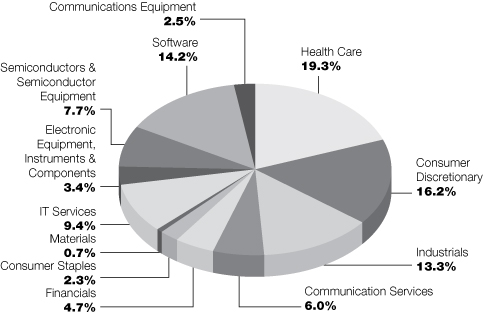
* Does not include futures contracts, money market instruments, and short-term investments purchased with cash collateral from securities loaned.
Percentages are of the net assets of the Fund and may not equal 100%.
Refer to the Schedule of Portfolio Investments for a complete list of securities.
5
Victory Portfolios
Victory RS Growth Fund | | June 30, 2021 | |
(Unaudited)
Investment Objective and Portfolio Holdings:
The Fund's investment objective seeks to provide long-term capital growth.
Top 10 Holdings*:
June 30, 2021
(% of Net Assets)
Microsoft Corp. | | | 10.3 | % | |
Apple, Inc. | | | 7.6 | % | |
Alphabet, Inc., Class C | | | 7.5 | % | |
Facebook, Inc., Class A | | | 4.9 | % | |
Amazon.com, Inc. | | | 4.9 | % | |
Visa, Inc., Class A | | | 3.5 | % | |
Twilio, Inc. | | | 3.4 | % | |
NVIDIA Corp. | | | 2.6 | % | |
Tesla, Inc. | | | 2.4 | % | |
Twitter, Inc. | | | 2.0 | % | |
Sector Allocation*:
June 30, 2021
(% of Net Assets)

* Does not include futures contracts, money market instruments, and short-term investments purchased with cash collateral from securities loaned.
Percentages are of the net assets of the Fund and may not equal 100%.
Refer to the Schedule of Portfolio Investments for a complete list of securities.
6
Victory Portfolios
Victory RS Science and Technology Fund | | June 30, 2021 | |
(Unaudited)
Investment Objective and Portfolio Holdings:
The Fund's investment objective seeks to provide long-term capital growth.
Top 10 Holdings*:
June 30, 2021
(% of Net Assets)
Microsoft Corp. | | | 4.9 | % | |
RingCentral, Inc., Class A | | | 4.4 | % | |
Twilio, Inc.,Class A | | | 4.2 | % | |
Wix.com Ltd. | | | 2.9 | % | |
Amazon.com, Inc. | | | 2.7 | % | |
Lam Research Corp. | | | 2.6 | % | |
MACOM Technology Solutions Holdings, Inc. | | | 2.6 | % | |
Lattice Semiconductor Corp. | | | 2.3 | % | |
DocuSign, Inc. | | | 2.1 | % | |
NVIDIA Corp. | | | 1.9 | % | |
Sector Allocation*:
June 30, 2021
(% of Net Assets)
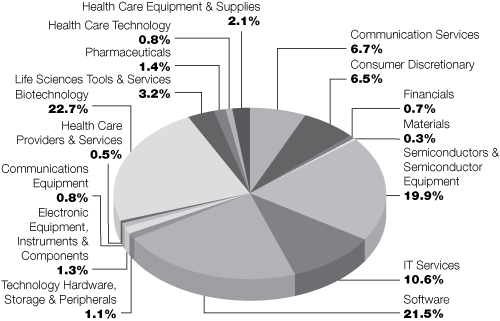
* Does not include futures contracts, money market instruments, and short-term investments purchased with cash collateral from securities loaned.
Percentages are of the net assets of the Fund and may not equal 100%.
Refer to the Schedule of Portfolio Investments for a complete list of securities.
7
Victory Portfolios
Victory RS Small Cap Equity Fund | | June 30, 2021 | |
(Unaudited)
Investment Objective and Portfolio Holdings:
The Fund's investment objective seeks to provide long-term capital growth.
Top 10 Holdings*:
June 30, 2021
(% of Net Assets)
Avaya Holdings Corp. | | | 5.7 | % | |
PROG Holdings, Inc. | | | 5.1 | % | |
Evoqua Water Technologies Corp. | | | 4.8 | % | |
Open Lending Corp. | | | 4.7 | % | |
ACI Worldwide, Inc. | | | 4.4 | % | |
Itron, Inc. | | | 4.4 | % | |
MACOM Technology Solutions Holdings, Inc. | | | 3.9 | % | |
SiTime Corp. | | | 3.4 | % | |
Chart Industries, Inc. | | | 3.4 | % | |
CryoPort, Inc. | | | 3.3 | % | |
Sector Allocation*:
June 30, 2021
(% of Net Assets)
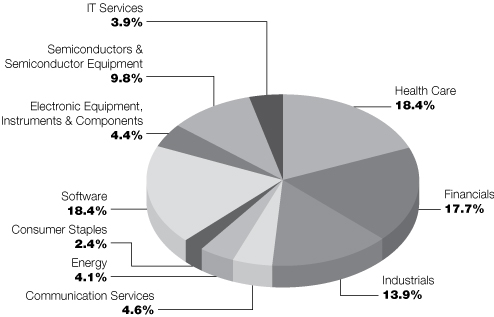
* Does not include futures contracts, money market instruments, and short-term investments purchased with cash collateral from securities loaned.
Percentages are of the net assets of the Fund and may not equal 100%.
Refer to the Schedule of Portfolio Investments for a complete list of securities.
8
Victory Portfolios
Victory RS Small Cap Growth Fund | | Schedule of Portfolio Investments
June 30, 2021 | |
(Unaudited)
Security Description | | Shares | | Value | |
Common Stocks (99.6%) | |
Biotechnology (14.9%): | |
Apellis Pharmaceuticals, Inc. (a) (b) | | | 679,940 | | | $ | 42,972,208 | | |
Avidity Biosciences, Inc. (a) (b) | | | 560,420 | | | | 13,847,978 | | |
Beam Therapeutics, Inc. (a) | | | 270,700 | | | | 34,841,797 | | |
bluebird bio, Inc. (a) | | | 600,939 | | | | 19,218,029 | | |
Blueprint Medicines Corp. (a) (b) | | | 287,158 | | | | 25,258,418 | | |
Celyad SA, ADR (a) (b) | | | 43,874 | | | | 230,338 | | |
CytomX Therapeutics, Inc. (a) | | | 1,568,240 | | | | 9,926,959 | | |
DermTech, Inc. (a) (b) | | | 345,320 | | | | 14,354,952 | | |
Equillium, Inc. (a) (b) | | | 1,515,010 | | | | 8,923,409 | | |
Fate Therapeutics, Inc. (a) | | | 415,620 | | | | 36,071,660 | | |
Generation Bio Co. (a) (b) | | | 598,560 | | | | 16,101,264 | | |
Intellia Therapeutics, Inc. (a) | | | 182,250 | | | | 29,508,097 | | |
Jounce Therapeutics, Inc. (a) (b) | | | 220,350 | | | | 1,498,380 | | |
MacroGenics, Inc. (a) | | | 854,090 | | | | 22,940,857 | | |
Opthea Ltd., ADR (a) | | | 765,040 | | | | 6,074,418 | | |
ORIC Pharmaceuticals, Inc. (a) (b) | | | 691,350 | | | | 12,229,982 | | |
Protagonist Therapeutics, Inc. (a) | | | 458,810 | | | | 20,591,393 | | |
Replimune Group, Inc. (a) | | | 497,470 | | | | 19,112,797 | | |
Rubius Therapeutics, Inc. (a) (b) | | | 852,350 | | | | 20,805,864 | | |
Scholar Rock Holding Corp. (a) (b) | | | 420,870 | | | | 12,163,143 | | |
SpringWorks Therapeutics, Inc. (a) (b) | | | 447,660 | | | | 36,891,661 | | |
Twist Bioscience Corp. (a) (b) | | | 197,130 | | | | 26,267,573 | | |
| | | | 429,831,177 | | |
Communication Services (4.0%): | |
Bandwidth, Inc., Class A (a) (b) | | | 544,650 | | | | 75,118,128 | | |
EverQuote, Inc., Class A (a) (b) | | | 568,720 | | | | 18,585,770 | | |
Vonage Holdings Corp. (a) | | | 1,539,720 | | | | 22,187,365 | | |
| | | | 115,891,263 | | |
Communications Equipment (1.2%): | |
Viavi Solutions, Inc. (a) | | | 2,019,910 | | | | 35,671,611 | | |
Consumer Discretionary (12.1%): | |
Arco Platform Ltd., Class A (a) (b) | | | 545,970 | | | | 16,739,440 | | |
Bally's Corp. (a) (b) | | | 439,160 | | | | 23,762,948 | | |
Brinker International, Inc. (a) (b) | | | 487,140 | | | | 30,129,609 | | |
Canada Goose Holdings, Inc. (a) (b) | | | 575,960 | | | | 25,192,490 | | |
Churchill Downs, Inc. (b) | | | 158,260 | | | | 31,376,628 | | |
Fox Factory Holding Corp. (a) (b) | | | 287,840 | | | | 44,805,174 | | |
Latham Group, Inc. (a) (b) | | | 266,160 | | | | 8,506,474 | | |
Lithia Motors, Inc., Class A | | | 70,110 | | | | 24,092,601 | | |
Meritage Homes Corp. (a) | | | 224,180 | | | | 21,090,854 | | |
Skyline Champion Corp. (a) | | | 580,580 | | | | 30,944,914 | | |
Steven Madden Ltd. | | | 749,500 | | | | 32,798,120 | | |
Wingstop, Inc. | | | 207,140 | | | | 32,651,478 | | |
YETI Holdings, Inc. (a) | | | 312,820 | | | | 28,723,132 | | |
| | | | 350,813,862 | | |
See notes to financial statements.
9
Victory Portfolios
Victory RS Small Cap Growth Fund | | Schedule of Portfolio Investments — continued
June 30, 2021 | |
(Unaudited)
Security Description | | Shares | | Value | |
Consumer Staples (5.7%): | |
BellRing Brands, Inc., Class A (a) (b) | | | 572,630 | | | $ | 17,946,224 | | |
BJ's Wholesale Club Holdings, Inc. (a) | | | 678,250 | | | | 32,271,135 | | |
Celsius Holdings, Inc. (a) | | | 148,670 | | | | 11,312,300 | | |
elf Beauty, Inc. (a) | | | 1,357,180 | | | | 36,833,865 | | |
Freshpet, Inc. (a) | | | 377,860 | | | | 61,576,066 | | |
Lancaster Colony Corp. | | | 23,440 | | | | 4,535,875 | | |
| | | | 164,475,465 | | |
Electronic Equipment, Instruments & Components (1.8%): | |
Itron, Inc. (a) (b) | | | 511,480 | | | | 51,137,771 | | |
Financials (5.3%): | |
Green Dot Corp., Class A (a) (b) | | | 262,315 | | | | 12,289,458 | | |
Open Lending Corp., Class A (a) (b) | | | 891,750 | | | | 38,425,507 | | |
PRA Group, Inc. (a) | | | 707,980 | | | | 27,235,991 | | |
PROG Holdings, Inc. (a) | | | 727,730 | | | | 35,025,645 | | |
Walker & Dunlop, Inc. | | | 388,020 | | | | 40,501,527 | | |
| | | | 153,478,128 | | |
Health Care Equipment & Supplies (4.0%): | |
CONMED Corp. (b) | | | 122,220 | | | | 16,796,695 | | |
CryoPort, Inc. (a) (b) | | | 431,380 | | | | 27,220,078 | | |
Eargo, Inc. (a) (b) | | | 529,010 | | | | 21,112,789 | | |
Nevro Corp. (a) (b) | | | 239,860 | | | | 39,766,389 | | |
Silk Road Medical, Inc. (a) (b) | | | 204,950 | | | | 9,808,907 | | |
| | | | 114,704,858 | | |
Health Care Providers & Services (5.2%): | |
HealthEquity, Inc. (a) (b) | | | 562,030 | | | | 45,232,175 | | |
Innovage Holding Corp. (a) (b) | | | 751,970 | | | | 16,024,481 | | |
LHC Group, Inc. (a) | | | 196,770 | | | | 39,405,160 | | |
LifeStance Health Group, Inc. (a) (b) | | | 622,690 | | | | 17,348,143 | | |
Surgery Partners, Inc. (a) (b) | | | 481,270 | | | | 32,062,207 | | |
| | | | 150,072,166 | | |
Health Care Technology (3.4%): | |
Health Catalyst, Inc. (a) (b) | | | 514,560 | | | | 28,563,226 | | |
Inspire Medical Systems, Inc. (a) | | | 206,670 | | | | 39,941,044 | | |
Omnicell, Inc. (a) | | | 202,720 | | | | 30,701,944 | | |
| | | | 99,206,214 | | |
Industrials (12.9%): | |
Advanced Drainage Systems, Inc. | | | 282,480 | | | | 32,928,694 | | |
Arcosa, Inc. (b) | | | 588,910 | | | | 34,592,573 | | |
Builders FirstSource, Inc. (a) (b) | | | 7,360 | | | | 313,978 | | |
Chart Industries, Inc. (a) (b) | | | 242,880 | | | | 35,538,201 | | |
Driven Brands Holdings, Inc. (a) | | | 293,340 | | | | 9,070,073 | | |
ESCO Technologies, Inc. | | | 367,180 | | | | 34,445,156 | | |
Evoqua Water Technologies Corp. (a) | | | 1,616,320 | | | | 54,599,290 | | |
Kornit Digital Ltd. (a) | | | 279,030 | | | | 34,691,800 | | |
Saia, Inc. (a) | | | 238,840 | | | | 50,034,591 | | |
Simpson Manufacturing Co., Inc. | | | 289,180 | | | | 31,937,039 | | |
See notes to financial statements.
10
Victory Portfolios
Victory RS Small Cap Growth Fund | | Schedule of Portfolio Investments — continued
June 30, 2021 | |
(Unaudited)
Security Description | | Shares | | Value | |
SiteOne Landscape Supply, Inc. (a) | | | 171,540 | | | $ | 29,034,860 | | |
The AZEK Co., Inc. (a) | | | 569,960 | | | | 24,200,502 | | |
| | | | 371,386,757 | | |
IT Services (5.0%): | |
DigitalOcean Holdings, Inc. (a) (b) | | | 591,740 | | | | 32,894,827 | | |
Paymentus Holdings, Inc., Class A (a) | | | 325,120 | | | | 11,541,760 | | |
Repay Holdings Corp. (a) | | | 873,930 | | | | 21,009,277 | | |
Shift4 Payments, Inc., Class A (a) | | | 114,240 | | | | 10,706,573 | | |
Wix.com Ltd. (a) (b) | | | 123,750 | | | | 35,922,150 | | |
WNS Holdings Ltd., ADR (a) | | | 417,097 | | | | 33,313,537 | | |
| | | | 145,388,124 | | |
Life Sciences Tools & Services (1.2%): | |
NeoGenomics, Inc. (a) (b) | | | 163,910 | | | | 7,403,814 | | |
NeoGenomics, Inc. PIPE (a) (c) (d) (f) | | | 170,580 | | | | 7,242,827 | | |
Quanterix Corp. (a) | | | 331,080 | | | | 19,421,153 | | |
| | | | 34,067,794 | | |
Materials (1.4%): | |
Kronos Bio, Inc. (a) (b) | | | 603,900 | | | | 14,463,405 | | |
Summit Materials, Inc., Class A (a) (b) | | | 737,280 | | | | 25,694,208 | | |
| | | | 40,157,613 | | |
Pharmaceuticals (1.2%): | |
Compass Pathways PLC, ADR (a) (b) | | | 428,580 | | | | 16,350,327 | | |
PMV Pharmaceuticals, Inc. (a) (b) | | | 504,640 | | | | 17,238,502 | | |
| | | | 33,588,829 | | |
Semiconductors & Semiconductor Equipment (8.6%): | |
Advanced Energy Industries, Inc. (b) | | | 475,630 | | | | 53,608,257 | | |
CMC Materials, Inc. | | | 186,900 | | | | 28,173,306 | | |
Lattice Semiconductor Corp. (a) | | | 1,132,900 | | | | 63,646,322 | | |
MACOM Technology Solutions Holdings, Inc. (a) | | | 1,018,843 | | | | 65,287,459 | | |
Silicon Laboratories, Inc. (a) | | | 253,070 | | | | 38,782,978 | | |
| | | | 249,498,322 | | |
Software (11.7%): | |
ACI Worldwide, Inc. (a) | | | 977,800 | | | | 36,315,492 | | |
Avaya Holdings Corp. (a) (b) | | | 3,364,680 | | | | 90,509,892 | | |
Everbridge, Inc. (a) | | | 279,310 | | | | 38,008,505 | | |
Five9, Inc. (a) | | | 77,790 | | | | 14,265,908 | | |
Medallia, Inc. (a) (b) | | | 945,370 | | | | 31,906,237 | | |
Q2 Holdings, Inc. (a) | | | 244,930 | | | | 25,124,919 | | |
Telos Corp. (a) (b) | | | 1,024,150 | | | | 34,831,342 | | |
Varonis Systems, Inc. (a) | | | 1,173,550 | | | | 67,619,951 | | |
| | | | 338,582,246 | | |
Total Common Stocks (Cost $2,003,389,471) | | | 2,877,952,200 | | |
See notes to financial statements.
11
Victory Portfolios
Victory RS Small Cap Growth Fund | | Schedule of Portfolio Investments — continued
June 30, 2021 | |
(Unaudited)
Security Description | | Shares | | Value | |
Collateral for Securities Loaned^ (9.7%) | |
BlackRock Liquidity Funds TempFund Portfolio, Institutional
Class, 0.04% (e) | | | 5,559,599 | | | $ | 5,559,599 | | |
Fidelity Investments Money Market Government Portfolio
I Shares, 0.01% (e) | | | 150,591,621 | | | | 150,591,621 | | |
Goldman Sachs Financial Square Prime Obligations Fund, Institutional
Class, 0.02% (e) | | | 2,774,515 | | | | 2,774,515 | | |
JPMorgan Prime Money Market Fund, Capital Class, 0.07% (e) | | | 22,123,119 | | | | 22,123,119 | | |
Morgan Stanley Institutional Liquidity Prime Portfolio, Institutional
Class, 0.06% (e) | | | 99,469,860 | | | | 99,469,860 | | |
Total Collateral for Securities Loaned (Cost $280,518,714) | | | 280,518,714 | | |
Total Investments (Cost $2,283,908,185) — 109.3% | | | 3,158,470,914 | | |
Liabilities in excess of other assets — (9.3)% | | | (268,239,672 | ) | |
NET ASSETS — 100.00% | | $ | 2,890,231,242 | | |
^ Purchased with cash collateral from securities on loan.
(a) Non-income producing security.
(b) All or a portion of this security is on loan.
(c) The Fund's Adviser has deemed this security to be illiquid based upon procedures approved by the Board of Trustees. As of June 30, 2021, illiquid securities were 0.3% of net assets.
(d) Security was fair valued based upon procedures approved by the Board of Trustees and represents 0.3% of net assets as of June 30, 2021. (See Note 2 in the Notes to Financial Statements).
(e) Rate disclosed is the daily yield on June 30, 2021.
(f) Restricted security that is not registered under the Securities Act of 1933.
ADR — American Depositary Receipt
PIPE — Private Investment in Public Equity
PLC — Public Limited Company
See notes to financial statements.
12
Victory Portfolios
Victory RS Select Growth Fund | | Schedule of Portfolio Investments
June 30, 2021 | |
(Unaudited)
Security Description | | Shares | | Value | |
Common Stocks (98.0%) | |
Biotechnology (5.4%): | |
Castle Biosciences, Inc. (a) | | | 52,150 | | | $ | 3,824,159 | | |
Halozyme Therapeutics, Inc. (a) | | | 124,770 | | | | 5,665,806 | | |
Twist Bioscience Corp. (a) (b) | | | 23,480 | | | | 3,128,710 | | |
| | | | 12,618,675 | | |
Communication Services (2.7%): | |
Bandwidth, Inc., Class A (a) | | | 26,520 | | | | 3,657,638 | | |
IAC/InterActiveCorp. (a) | | | 17,680 | | | | 2,725,726 | | |
| | | | 6,383,364 | | |
Consumer Discretionary (13.8%): | |
Brinker International, Inc. (a) (b) | | | 44,720 | | | | 2,765,932 | | |
Chegg, Inc. (a) | | | 51,040 | | | | 4,241,934 | | |
Churchill Downs, Inc. | | | 17,290 | | | | 3,427,916 | | |
Marriott Vacations Worldwide Corp. (a) | | | 17,530 | | | | 2,792,529 | | |
Ollie's Bargain Outlet Holdings, Inc. (a) (b) | | | 26,880 | | | | 2,261,414 | | |
Planet Fitness, Inc., Class A (a) | | | 39,170 | | | | 2,947,543 | | |
Pool Corp. | | | 11,210 | | | | 5,141,579 | | |
Tempur Sealy International, Inc. (b) | | | 161,470 | | | | 6,328,009 | | |
Wolverine World Wide, Inc. | | | 69,950 | | | | 2,353,118 | | |
| | | | 32,259,974 | | |
Consumer Staples (2.8%): | |
Beyond Meat, Inc. (a) (b) | | | 11,660 | | | | 1,836,333 | | |
Freshpet, Inc. (a) | | | 28,630 | | | | 4,665,545 | | |
| | | | 6,501,878 | | |
Electronic Equipment, Instruments & Components (1.1%): | |
Dolby Laboratories, Inc., Class A | | | 27,060 | | | | 2,659,727 | | |
Financials (5.2%): | |
Focus Financial Partners, Inc., Class A (a) | | | 90,230 | | | | 4,376,155 | | |
LPL Financial Holdings, Inc. | | | 27,220 | | | | 3,674,156 | | |
Western Alliance Bancorp (b) | | | 43,720 | | | | 4,059,402 | | |
| | | | 12,109,713 | | |
Health Care Equipment & Supplies (5.7%): | |
Novocure Ltd. (a) (b) | | | 23,280 | | | | 5,163,970 | | |
Tandem Diabetes Care, Inc. (a) | | | 24,370 | | | | 2,373,638 | | |
West Pharmaceutical Services, Inc. | | | 16,316 | | | | 5,859,075 | | |
| | | | 13,396,683 | | |
Health Care Providers & Services (4.0%): | |
Encompass Health Corp. | | | 31,440 | | | | 2,453,263 | | |
HealthEquity, Inc. (a) | | | 45,980 | | | | 3,700,471 | | |
LHC Group, Inc. (a) | | | 15,400 | | | | 3,084,004 | | |
| | | | 9,237,738 | | |
Health Care Technology (1.1%): | |
Omnicell, Inc. (a) | | | 17,310 | | | | 2,621,600 | | |
See notes to financial statements.
13
Victory Portfolios
Victory RS Select Growth Fund | | Schedule of Portfolio Investments — continued
June 30, 2021 | |
(Unaudited)
Security Description | | Shares | | Value | |
Industrials (17.2%): | |
Advanced Drainage Systems, Inc. | | | 41,000 | | | $ | 4,779,370 | | |
Axon Enterprise, Inc. (a) | | | 22,340 | | | | 3,949,712 | | |
Builders FirstSource, Inc. (a) | | | 64,720 | | | | 2,760,955 | | |
Chart Industries, Inc. (a) | | | 22,970 | | | | 3,360,970 | | |
Enphase Energy, Inc. (a) | | | 19,040 | | | | 3,496,315 | | |
Evoqua Water Technologies Corp. (a) | | | 145,410 | | | | 4,911,950 | | |
Generac Holdings, Inc. (a) | | | 4,750 | | | | 1,971,963 | | |
MSA Safety, Inc. | | | 21,690 | | | | 3,591,430 | | |
SiteOne Landscape Supply, Inc. (a) | | | 21,360 | | | | 3,615,394 | | |
The Middleby Corp. (a) | | | 31,520 | | | | 5,461,155 | | |
Trex Co., Inc. (a) | | | 23,480 | | | | 2,399,891 | | |
| | | | 40,299,105 | | |
IT Services (3.1%): | |
GoDaddy, Inc., Class A (a) | | | 26,107 | | | | 2,270,264 | | |
Shift4 Payments, Inc., Class A (a) | | | 23,740 | | | | 2,224,913 | | |
Wix.com Ltd. (a) | | | 9,210 | | | | 2,673,479 | | |
| | | | 7,168,656 | | |
Life Sciences Tools & Services (4.4%): | |
Avantor, Inc. (a) | | | 163,990 | | | | 5,823,285 | | |
Charles River Laboratories International, Inc. (a) | | | 11,730 | | | | 4,339,161 | | |
| | | | 10,162,446 | | |
Pharmaceuticals (4.7%): | |
Horizon Therapeutics PLC (a) | | | 61,700 | | | | 5,777,588 | | |
Jazz Pharmaceuticals PLC (a) | | | 29,520 | | | | 5,243,933 | | |
| | | | 11,021,521 | | |
Semiconductors & Semiconductor Equipment (9.8%): | |
Entegris, Inc. | | | 42,530 | | | | 5,229,914 | | |
Lattice Semiconductor Corp. (a) | | | 70,370 | | | | 3,953,387 | | |
MACOM Technology Solutions Holdings, Inc. (a) | | | 52,120 | | | | 3,339,850 | | |
MKS Instruments, Inc. | | | 25,490 | | | | 4,535,945 | | |
Monolithic Power Systems, Inc. | | | 7,255 | | | | 2,709,380 | | |
SiTime Corp. (a) | | | 24,290 | | | | 3,074,871 | | |
| | | | 22,843,347 | | |
Software (17.0%): | |
ACI Worldwide, Inc. (a) | | | 104,740 | | | | 3,890,043 | | |
Avaya Holdings Corp. (a) | | | 93,990 | | | | 2,528,331 | | |
Dynatrace, Inc. (a) | | | 121,490 | | | | 7,097,446 | | |
Fair Isaac Corp. (a) (b) | | | 6,890 | | | | 3,463,465 | | |
Five9, Inc. (a) | | | 36,980 | | | | 6,781,762 | | |
Q2 Holdings, Inc. (a) | | | 26,610 | | | | 2,729,654 | | |
RingCentral, Inc., Class A (a) | | | 18,530 | | | | 5,384,447 | | |
Varonis Systems, Inc. (a) (b) | | | 53,480 | | | | 3,081,518 | | |
Zendesk, Inc. (a) | | | 33,420 | | | | 4,823,843 | | |
| | | | 39,780,509 | | |
Total Common Stocks (Cost $157,477,884) | | | 229,064,936 | | |
See notes to financial statements.
14
Victory Portfolios
Victory RS Select Growth Fund | | Schedule of Portfolio Investments — continued
June 30, 2021 | |
(Unaudited)
Security Description | | Shares | | Value | |
Collateral for Securities Loaned^ (2.2%) | |
BlackRock Liquidity Funds TempFund Portfolio, Institutional Class, 0.04% (c) | | | 103,060 | | | $ | 103,060 | | |
Fidelity Investments Money Market Government Portfolio I Shares, 0.01% (c) | | | 2,791,575 | | | | 2,791,575 | | |
Goldman Sachs Financial Square Prime Obligations Fund, Institutional
Class, 0.02% (c) | | | 51,432 | | | | 51,432 | | |
JPMorgan Prime Money Market Fund, Capital Class, 0.07% (c) | | | 410,105 | | | | 410,105 | | |
Morgan Stanley Institutional Liquidity Prime Portfolio, Institutional
Class, 0.06% (c) | | | 1,843,911 | | | | 1,843,911 | | |
Total Collateral for Securities Loaned (Cost $5,200,083) | | | 5,200,083 | | |
Total Investments (Cost $162,677,967) — 100.2% | | | 234,265,019 | | |
Liabilities in excess of other assets — (0.2)% | | | (546,466 | ) | |
NET ASSETS — 100.00% | | $ | 233,718,553 | | |
^ Purchased with cash collateral from securities on loan.
(a) Non-income producing security.
(b) All or a portion of this security is on loan.
(c) Rate disclosed is the daily yield on June 30, 2021.
PLC — Public Limited Company
See notes to financial statements.
15
Victory Portfolios
Victory RS Mid Cap Growth Fund | | Schedule of Portfolio Investments
June 30, 2021 | |
(Unaudited)
Security Description | | Shares | | Value | |
Common Stocks (99.7%) | |
Communication Services (6.0%): | |
IAC/InterActiveCorp. (a) | | | 39,220 | | | $ | 6,046,547 | | |
Match Group, Inc. (a) | | | 45,734 | | | | 7,374,608 | | |
Take-Two Interactive Software, Inc. (a) | | | 24,290 | | | | 4,299,816 | | |
Twitter, Inc. (a) | | | 108,230 | | | | 7,447,306 | | |
Vimeo, Inc. (a) | | | 47,544 | | | | 2,329,656 | | |
| | | | 27,497,933 | | |
Communications Equipment (2.5%): | |
Arista Networks, Inc. (a) | | | 8,500 | | | | 3,079,635 | | |
Palo Alto Networks, Inc. (a) | | | 22,870 | | | | 8,485,913 | | |
| | | | 11,565,548 | | |
Consumer Discretionary (16.2%): | |
Burlington Stores, Inc. (a) | | | 16,720 | | | | 5,383,673 | | |
Caesars Entertainment, Inc. (a) | | | 40,300 | | | | 4,181,125 | | |
CarMax, Inc. (a) | | | 19,200 | | | | 2,479,680 | | |
Chewy, Inc., Class A (a) (b) | | | 65,426 | | | | 5,215,106 | | |
Chipotle Mexican Grill, Inc. (a) (b) | | | 6,400 | | | | 9,922,176 | | |
Darden Restaurants, Inc. | | | 20,470 | | | | 2,988,415 | | |
Farfetch Ltd., Class A (a) (b) | | | 87,880 | | | | 4,425,637 | | |
Lululemon Athletica, Inc. (a) | | | 13,140 | | | | 4,795,706 | | |
Marriott Vacations Worldwide Corp. (a) | | | 17,590 | | | | 2,802,087 | | |
Meritage Homes Corp. (a) | | | 27,830 | | | | 2,618,246 | | |
Nordstrom, Inc. (a) (b) | | | 70,730 | | | | 2,586,596 | | |
O'Reilly Automotive, Inc. (a) | | | 12,040 | | | | 6,817,168 | | |
Pool Corp. (b) | | | 21,000 | | | | 9,631,860 | | |
Roku, Inc. (a) | | | 22,270 | | | | 10,227,498 | | |
| | | | 74,074,973 | | |
Consumer Staples (2.3%): | |
Freshpet, Inc. (a) | | | 42,160 | | | | 6,870,394 | | |
The Boston Beer Co., Inc., Class A (a) | | | 3,450 | | | | 3,521,760 | | |
| | | | 10,392,154 | | |
Electronic Equipment, Instruments & Components (3.4%): | |
Dolby Laboratories, Inc., Class A | | | 49,810 | | | | 4,895,825 | | |
Keysight Technologies, Inc. (a) | | | 33,310 | | | | 5,143,397 | | |
Trimble, Inc. (a) | | | 68,270 | | | | 5,586,534 | | |
| | | | 15,625,756 | | |
Financials (4.7%): | |
LPL Financial Holdings, Inc. | | | 45,700 | | | | 6,168,586 | | |
MSCI, Inc. | | | 17,050 | | | | 9,089,014 | | |
Western Alliance Bancorp | | | 69,140 | | | | 6,419,649 | | |
| | | | 21,677,249 | | |
Health Care (19.3%): | |
Align Technology, Inc. (a) | | | 11,110 | | | | 6,788,210 | | |
AmerisourceBergen Corp. | | | 38,810 | | | | 4,443,357 | | |
Apellis Pharmaceuticals, Inc. (a) | | | 50,090 | | | | 3,165,688 | | |
See notes to financial statements.
16
Victory Portfolios
Victory RS Mid Cap Growth Fund | | Schedule of Portfolio Investments — continued
June 30, 2021 | |
(Unaudited)
Security Description | | Shares | | Value | |
Avantor, Inc. (a) (b) | | | 132,890 | | | $ | 4,718,924 | | |
Centene Corp. (a) | | | 48,911 | | | | 3,567,079 | | |
Charles River Laboratories International, Inc. (a) | | | 21,710 | | | | 8,030,963 | | |
DexCom, Inc. (a) | | | 12,730 | | | | 5,435,710 | | |
Fate Therapeutics, Inc. (a) | | | 34,680 | | | | 3,009,877 | | |
Horizon Therapeutics PLC (a) | | | 53,600 | | | | 5,019,104 | | |
Insulet Corp. (a) | | | 18,830 | | | | 5,169,024 | | |
Jazz Pharmaceuticals PLC (a) | | | 34,480 | | | | 6,125,027 | | |
Novocure Ltd. (a) (b) | | | 28,010 | | | | 6,213,178 | | |
ResMed, Inc. | | | 24,600 | | | | 6,064,392 | | |
Veeva Systems, Inc., Class A (a) | | | 21,170 | | | | 6,582,812 | | |
West Pharmaceutical Services, Inc. | | | 39,550 | | | | 14,202,405 | | |
| | | | 88,535,750 | | |
Industrials (13.3%): | |
Advanced Drainage Systems, Inc. | | | 28,030 | | | | 3,267,457 | | |
Axon Enterprise, Inc. (a) (b) | | | 35,320 | | | | 6,244,576 | | |
Builders FirstSource, Inc. (a) (b) | | | 80,730 | | | | 3,443,942 | | |
Carrier Global Corp. | | | 116,360 | | | | 5,655,096 | | |
Chart Industries, Inc. (a) | | | 27,240 | | | | 3,985,757 | | |
CoStar Group, Inc. (a) | | | 78,700 | | | | 6,517,934 | | |
Enphase Energy, Inc. (a) | | | 24,820 | | | | 4,557,697 | | |
Generac Holdings, Inc. (a) | | | 14,860 | | | | 6,169,129 | | |
IDEX Corp. | | | 13,290 | | | | 2,924,464 | | |
Pentair PLC | | | 48,500 | | | | 3,273,265 | | |
Ritchie Bros. Auctioneers, Inc. | | | 67,440 | | | | 3,997,843 | | |
The Middleby Corp. (a) | | | 43,130 | | | | 7,472,704 | | |
Trex Co., Inc. (a) | | | 32,510 | | | | 3,322,847 | | |
| | | | 60,832,711 | | |
IT Services (9.4%): | |
Gartner, Inc. (a) | | | 14,700 | | | | 3,560,340 | | |
GoDaddy, Inc., Class A (a) | | | 65,580 | | | | 5,702,837 | | |
Square, Inc., Class A (a) | | | 8,720 | | | | 2,125,936 | | |
Twilio, Inc., Class A (a) | | | 25,790 | | | | 10,165,386 | | |
WEX, Inc. (a) | | | 17,200 | | | | 3,335,080 | | |
Wix.com Ltd. (a) | | | 62,910 | | | | 18,261,515 | | |
| | | | 43,151,094 | | |
Materials (0.7%): | |
The Scotts Miracle-Gro Co. | | | 16,920 | | | | 3,247,286 | | |
Semiconductors & Semiconductor Equipment (7.7%): | |
Entegris, Inc. | | | 58,320 | | | | 7,171,610 | | |
KLA Corp. | | | 15,040 | | | | 4,876,118 | | |
Lattice Semiconductor Corp. (a) | | | 79,140 | | | | 4,446,085 | | |
Marvell Technology, Inc. | | | 116,760 | | | | 6,810,611 | | |
Microchip Technology, Inc. | | | 42,690 | | | | 6,392,401 | | |
Monolithic Power Systems, Inc. (b) | | | 15,310 | | | | 5,717,520 | | |
| | | | 35,414,345 | | |
See notes to financial statements.
17
Victory Portfolios
Victory RS Mid Cap Growth Fund | | Schedule of Portfolio Investments — continued
June 30, 2021 | |
(Unaudited)
Security Description | | Shares | | Value | |
Software (14.2%): | |
Bill.com Holdings, Inc. (a) (b) | | | 22,560 | | | $ | 4,132,541 | | |
Crowdstrike Holdings, Inc., Class A (a) | | | 24,840 | | | | 6,242,540 | | |
DocuSign, Inc. (a) | | | 30,890 | | | | 8,635,917 | | |
Dropbox, Inc., Class A (a) | | | 100,060 | | | | 3,032,819 | | |
Fair Isaac Corp. (a) | | | 9,730 | | | | 4,891,076 | | |
Lightspeed POS, Inc. (a) | | | 57,080 | | | | 4,772,459 | | |
RingCentral, Inc., Class A (a) | | | 52,910 | | | | 15,374,588 | | |
Synopsys, Inc. (a) | | | 39,040 | | | | 10,766,842 | | |
Zendesk, Inc. (a) | | | 51,750 | | | | 7,469,595 | | |
| | | | 65,318,377 | | |
Total Common Stocks (Cost $287,333,866) | | | 457,333,176 | | |
Collateral for Securities Loaned^ (4.9%) | |
BlackRock Liquidity Funds TempFund Portfolio, Institutional Class, 0.04% (c) | | | 448,762 | | | | 448,762 | | |
Fidelity Investments Money Market Government Portfolio I Shares, 0.01% (c) | | | 12,155,507 | | | | 12,155,507 | | |
Goldman Sachs Financial Square Prime Obligations Fund, Institutional
Class, 0.02% (c) | | | 223,954 | | | | 223,954 | | |
JPMorgan Prime Money Market Fund, Capital Class, 0.07% (c) | | | 1,785,742 | | | | 1,785,742 | | |
Morgan Stanley Institutional Liquidity Prime Portfolio, Institutional
Class, 0.06% (c) | | | 8,029,043 | | | | 8,029,043 | | |
Total Collateral for Securities Loaned (Cost $22,643,008) | | | 22,643,008 | | |
Total Investments (Cost $309,976,874) — 104.6% | | | 479,976,184 | | |
Liabilities in excess of other assets — (4.6)% | | | (21,287,755 | ) | |
NET ASSETS — 100.00% | | $ | 458,688,429 | | |
^ Purchased with cash collateral from securities on loan.
(a) Non-income producing security.
(b) All or a portion of this security is on loan.
(c) Rate disclosed is the daily yield on June 30, 2021.
PLC — Public Limited Company
See notes to financial statements.
18
Victory Portfolios
Victory RS Growth Fund | | Schedule of Portfolio Investments
June 30, 2021 | |
(Unaudited)
Security Description | | Shares | | Value | |
Common Stocks (98.3%) | |
Communication Services (15.6%): | |
Activision Blizzard, Inc. | | | 42,010 | | | $ | 4,009,434 | | |
Alphabet, Inc., Class C (a) | | | 9,821 | | | | 24,614,569 | | |
Facebook, Inc., Class A (a) | | | 46,450 | | | | 16,151,129 | | |
Twitter, Inc. (a) | | | 98,070 | | | | 6,748,197 | | |
| | | | 51,523,329 | | |
Communications Equipment (1.1%): | |
Palo Alto Networks, Inc. (a) | | | 10,010 | | | | 3,714,211 | | |
Consumer Discretionary (18.6%): | |
Amazon.com, Inc. (a) | | | 4,660 | | | | 16,031,146 | | |
Aptiv PLC (a) | | | 37,980 | | | | 5,975,393 | | |
Booking Holdings, Inc. (a) | | | 1,780 | | | | 3,894,800 | | |
Caesars Entertainment, Inc. (a) | | | 34,850 | | | | 3,615,687 | | |
Chipotle Mexican Grill, Inc. (a) (b) | | | 2,890 | | | | 4,480,483 | | |
Dollar General Corp. | | | 12,830 | | | | 2,776,284 | | |
NIKE, Inc., Class B | | | 38,370 | | | | 5,927,781 | | |
Target Corp. | | | 16,090 | | | | 3,889,596 | | |
Tesla, Inc. (a) | | | 11,830 | | | | 8,040,851 | | |
The Home Depot, Inc. | | | 13,515 | | | | 4,309,798 | | |
The TJX Cos., Inc. | | | 34,080 | | | | 2,297,674 | | |
| | | | 61,239,493 | | |
Consumer Staples (2.5%): | |
Constellation Brands, Inc., Class A | | | 16,320 | | | | 3,817,085 | | |
Freshpet, Inc. (a) | | | 12,980 | | | | 2,115,221 | | |
The Boston Beer Co., Inc., Class A (a) | | | 2,220 | | | | 2,266,176 | | |
| | | | 8,198,482 | | |
Health Care (9.9%): | |
Align Technology, Inc. (a) | | | 7,230 | | | | 4,417,530 | | |
Charles River Laboratories International, Inc. (a) | | | 16,320 | | | | 6,037,094 | | |
DexCom, Inc. (a) | | | 5,600 | | | | 2,391,200 | | |
Fate Therapeutics, Inc. (a) | | | 21,730 | | | | 1,885,947 | | |
Horizon Therapeutics PLC (a) | | | 26,100 | | | | 2,444,004 | | |
Jazz Pharmaceuticals PLC (a) | | | 20,250 | | | | 3,597,210 | | |
Novocure Ltd. (a) (b) | | | 7,990 | | | | 1,772,342 | | |
Royalty Pharma PLC, Class A (b) | | | 99,940 | | | | 4,096,541 | | |
West Pharmaceutical Services, Inc. | | | 16,770 | | | | 6,022,107 | | |
| | | | 32,663,975 | | |
Industrials (3.4%): | |
IDEX Corp. | | | 13,710 | | | | 3,016,886 | | |
IHS Markit Ltd. | | | 23,090 | | | | 2,601,319 | | |
United Parcel Service, Inc., Class B | | | 27,000 | | | | 5,615,190 | | |
| | | | 11,233,395 | | |
IT Services (12.5%): | |
Fiserv, Inc. (a) | | | 52,630 | | | | 5,625,621 | | |
Gartner, Inc. (a) | | | 12,220 | | | | 2,959,684 | | |
See notes to financial statements.
19
Victory Portfolios
Victory RS Growth Fund | | Schedule of Portfolio Investments — continued
June 30, 2021 | |
(Unaudited)
Security Description | | Shares | | Value | |
PayPal Holdings, Inc. (a) | | | 22,980 | | | $ | 6,698,210 | | |
Square, Inc., Class A (a) | | | 13,310 | | | | 3,244,978 | | |
Twilio, Inc., Class A (a) | | | 28,350 | | | | 11,174,436 | | |
Visa, Inc., Class A | | | 49,137 | | | | 11,489,213 | | |
| | | | 41,192,142 | | |
Materials (0.9%): | |
The Scotts Miracle-Gro Co. | | | 16,050 | | | | 3,080,316 | | |
Real Estate (1.1%): | |
SBA Communications Corp. | | | 11,280 | | | | 3,594,936 | | |
Semiconductors & Semiconductor Equipment (8.2%): | |
Advanced Micro Devices, Inc. (a) | | | 31,600 | | | | 2,968,188 | | |
Lam Research Corp. | | | 8,410 | | | | 5,472,387 | | |
Marvell Technology, Inc. | | | 61,590 | | | | 3,592,545 | | |
Microchip Technology, Inc. | | | 20,530 | | | | 3,074,162 | | |
NVIDIA Corp. | | | 10,900 | | | | 8,721,090 | | |
STMicroelectronics NV, NYS (b) | | | 76,480 | | | | 2,782,342 | | |
| | | | 26,610,714 | | |
Software (16.9%): | |
Fair Isaac Corp. (a) | | | 6,310 | | | | 3,171,911 | | |
Microsoft Corp. | | | 125,700 | | | | 34,052,130 | | |
RingCentral, Inc., Class A (a) | | | 22,630 | | | | 6,575,825 | | |
ServiceNow, Inc. (a) | | | 9,370 | | | | 5,149,284 | | |
Synopsys, Inc. (a) | | | 10,670 | | | | 2,942,679 | | |
Zoom Video Communications, Inc., Class A (a) | | | 9,230 | | | | 3,572,287 | | |
| | | | 55,464,116 | | |
Technology Hardware, Storage & Peripherals (7.6%): | |
Apple, Inc. | | | 183,578 | | | | 25,142,843 | | |
Total Common Stocks (Cost $171,721,114) | | | 323,657,952 | | |
Collateral for Securities Loaned^ (3.0%) | |
BlackRock Liquidity Funds TempFund Portfolio, Institutional
Class, 0.04% (c) | | | 197,161 | | | | 197,161 | | |
Fidelity Investments Money Market Government Portfolio
I Shares, 0.01% (c) | | | 5,340,459 | | | | 5,340,459 | | |
Goldman Sachs Financial Square Prime Obligations Fund, Institutional
Class, 0.02% (c) | | | 98,393 | | | | 98,393 | | |
JPMorgan Prime Money Market Fund, Capital Class, 0.07% (c) | | | 784,556 | | | | 784,556 | | |
Morgan Stanley Institutional Liquidity Prime Portfolio, Institutional
Class, 0.06% (c) | | | 3,527,518 | | | | 3,527,518 | | |
Total Collateral for Securities Loaned (Cost $9,948,087) | | | 9,948,087 | | |
Total Investments (Cost $181,669,201) — 101.3% | | | 333,606,039 | | |
Liabilities in excess of other assets — (1.3)% | | | (4,361,595 | ) | |
NET ASSETS — 100.00% | | $ | 329,244,444 | | |
^ Purchased with cash collateral from securities on loan.
(a) Non-income producing security.
See notes to financial statements.
20
Victory Portfolios
Victory RS Growth Fund | | Schedule of Portfolio Investments — continued
June 30, 2021 | |
(Unaudited)
(b) All or a portion of this security is on loan.
(c) Rate disclosed is the daily yield on June 30, 2021.
NYS — New York Registered Shares
PLC — Public Limited Company
See notes to financial statements.
21
Victory Portfolios
Victory RS Science and Technology Fund | | Schedule of Portfolio Investments
June 30, 2021 | |
(Unaudited)
Security Description | | Shares | | Value | |
Common Stocks (100.1%) | |
Biotechnology (22.7%): | |
Akouos, Inc. (a) (b) | | | 29,560 | | | $ | 370,978 | | |
Albireo Pharma, Inc. (a) | | | 21,060 | | | | 740,891 | | |
Allogene Therapeutics, Inc. (a) | | | 31,860 | | | | 830,909 | | |
Alpha Teknova, Inc. (a) | | | 59,780 | | | | 1,418,579 | | |
Apellis Pharmaceuticals, Inc. (a) | | | 62,633 | | | | 3,958,406 | | |
Arcus Biosciences, Inc. (a) | | | 35,660 | | | | 979,224 | | |
Avidity Biosciences, Inc. (a) (b) | | | 54,370 | | | | 1,343,483 | | |
Avrobio, Inc. (a) | | | 66,170 | | | | 588,251 | | |
Beam Therapeutics, Inc. (a) (b) | | | 26,820 | | | | 3,452,002 | | |
Bicycle Therapeutics PLC, ADR (a) | | | 64,929 | | | | 1,971,244 | | |
bluebird bio, Inc. (a) | | | 79,050 | | | | 2,528,019 | | |
Blueprint Medicines Corp. (a) | | | 9,220 | | | | 810,991 | | |
Celcuity, Inc. (a) | | | 62,050 | | | | 1,489,200 | | |
Celyad SA, ADR (a) (b) | | | 5,040 | | | | 26,460 | | |
Codiak Biosciences, Inc. (a) (b) | | | 92,250 | | | | 1,709,392 | | |
Crinetics Pharmaceuticals, Inc. (a) (b) | | | 51,908 | | | | 978,466 | | |
Cullinan Oncology, Inc. (a) | | | 22,640 | | | | 582,980 | | |
CytomX Therapeutics, Inc. (a) (b) (c) | | | 148,890 | | | | 942,474 | | |
DermTech, Inc. (a) (b) | | | 94,083 | | | | 3,911,030 | | |
Editas Medicine, Inc. (a) (b) | | | 22,140 | | | | 1,254,010 | | |
Equillium, Inc. (a) (b) | | | 223,930 | | | | 1,318,948 | | |
Exact Sciences Corp. (a) | | | 17,610 | | | | 2,189,099 | | |
Fate Therapeutics, Inc. (a) | | | 49,560 | | | | 4,301,312 | | |
Fusion Pharmaceuticals, Inc. (a) (b) | | | 138,510 | | | | 1,119,161 | | |
Generation Bio Co. (a) | | | 59,400 | | | | 1,597,860 | | |
Gracell Biotechnologies, Inc., ADR (a) (b) | | | 38,120 | | | | 495,560 | | |
Halozyme Therapeutics, Inc. (a) | | | 31,090 | | | | 1,411,797 | | |
IGM Biosciences, Inc. (a) (b) | | | 14,650 | | | | 1,218,880 | | |
Ikena Oncology, Inc. (a) (b) | | | 68,290 | | | | 958,792 | | |
Impel Neuropharma, Inc. (a) (b) | | | 83,690 | | | | 740,657 | | |
Inhibrx, Inc. (a) | | | 46,570 | | | | 1,281,606 | | |
Intellia Therapeutics, Inc. (a) | | | 30,780 | | | | 4,983,590 | | |
Invitae Corp. (a) (b) | | | 31,215 | | | | 1,052,882 | | |
Iovance Biotherapeutics, Inc. (a) | | | 248,450 | | | | 6,464,669 | | |
Jounce Therapeutics, Inc. (a) (b) | | | 76,990 | | | | 523,532 | | |
Kezar Life Sciences, Inc. (a) (b) | | | 283,686 | | | | 1,540,415 | | |
Kinnate Biopharma, Inc. (a) (b) | | | 67,090 | | | | 1,561,855 | | |
Kura Oncology, Inc. (a) (b) | | | 46,350 | | | | 966,397 | | |
Lyell Immunopharma, Inc. (a) (b) | | | 145,030 | | | | 2,355,287 | | |
MacroGenics, Inc. (a) | | | 90,070 | | | | 2,419,280 | | |
Marker Therapeutics, Inc. (a) (b) | | | 659,700 | | | | 1,840,563 | | |
Matinas BioPharma Holdings, Inc. (a) (b) | | | 602,250 | | | | 466,684 | | |
Merus NV (a) | | | 30,210 | | | | 636,525 | | |
Mountain Crest Acquisition Corp. II PIPE (a) (d) (e) (h) (i) | | | 276,000 | | | | 2,660,640 | | |
Opthea Ltd., ADR (a) | | | 96,734 | | | | 768,068 | | |
ORIC Pharmaceuticals, Inc. (a) (b) | | | 87,540 | | | | 1,548,583 | | |
Passage Bio, Inc. (a) | | | 39,660 | | | | 525,098 | | |
See notes to financial statements.
22
Victory Portfolios
Victory RS Science and Technology Fund | | Schedule of Portfolio Investments — continued
June 30, 2021 | |
(Unaudited)
Security Description | | Shares | | Value | |
Protagonist Therapeutics, Inc. (a) | | | 44,900 | | | $ | 2,015,112 | | |
Rain Therapeutics, Inc. (a) (b) | | | 81,580 | | | | 1,267,753 | | |
Regulus Therapeutics, Inc. (a) (b) | | | 1,768,489 | | | | 1,437,958 | | |
Replimune Group, Inc. (a) | | | 41,640 | | | | 1,599,809 | | |
Rubius Therapeutics, Inc. (a) (b) | | | 75,160 | | | | 1,834,656 | | |
Scholar Rock Holding Corp. (a) | | | 29,950 | | | | 865,555 | | |
Shattuck Labs, Inc. (a) (b) | | | 59,200 | | | | 1,716,208 | | |
Sigilon Therapeutics, Inc. (a) | | | 40,900 | | | | 438,857 | | |
Silverback Therapeutics, Inc. (a) (b) | | | 19,940 | | | | 615,947 | | |
SpringWorks Therapeutics, Inc. (a) | | | 50,300 | | | | 4,145,223 | | |
Stoke Therapeutics, Inc. (a) (b) | | | 20,410 | | | | 687,001 | | |
Surface Oncology, Inc. (a) (b) | | | 230,040 | | | | 1,716,098 | | |
Sutro Biopharma, Inc. (a) | | | 64,450 | | | | 1,198,125 | | |
TCR2 Therapeutics, Inc. (a) | | | 28,000 | | | | 459,480 | | |
Twist Bioscience Corp. (a) | | | 13,700 | | | | 1,825,525 | | |
VistaGen Therapeutics, Inc. (a) | | | 319,610 | | | | 1,006,771 | | |
Zymeworks, Inc. (a) | | | 24,780 | | | | 859,618 | | |
| | | | 100,524,425 | | |
Communication Services (6.7%): | |
Facebook, Inc., Class A (a) | | | 20,370 | | | | 7,082,853 | | |
IAC/InterActiveCorp. (a) | | | 16,130 | | | | 2,486,762 | | |
Match Group, Inc. (a) | | | 39,336 | | | | 6,342,930 | | |
Take-Two Interactive Software, Inc. (a) | | | 23,840 | | | | 4,220,157 | | |
Twitter, Inc. (a) | | | 118,600 | | | | 8,160,866 | | |
Vimeo, Inc. (a) | | | 26,187 | | | | 1,283,163 | | |
| | | | 29,576,731 | | |
Communications Equipment (0.8%): | |
Viavi Solutions, Inc. (a) | | | 197,350 | | | | 3,485,201 | | |
Consumer Discretionary (6.5%): | |
Amazon.com, Inc. (a) | | | 3,430 | | | | 11,799,749 | | |
Arco Platform Ltd., Class A (a) (b) | | | 49,010 | | | | 1,502,647 | | |
Booking Holdings, Inc. (a) | | | 1,870 | | | | 4,091,728 | | |
Chegg, Inc. (a) | | | 44,740 | | | | 3,718,341 | | |
Farfetch Ltd., Class A (a) (b) | | | 44,870 | | | | 2,259,653 | | |
Roku, Inc. (a) | | | 11,960 | | | | 5,492,630 | | |
| | | | 28,864,748 | | |
Electronic Equipment, Instruments & Components (1.3%): | |
908 Devices, Inc. (a) | | | 22,500 | | | | 871,875 | | |
Dolby Laboratories, Inc., Class A | | | 50,710 | | | | 4,984,286 | | |
| | | | 5,856,161 | | |
Financials (0.7%): | |
Omega Alpha SPAC, Class A (a) | | | 101,380 | | | | 1,008,731 | | |
Panacea Acquisition Corp. II (a) | | | 212,010 | | | | 2,120,100 | | |
| | | | 3,128,831 | | |
Health Care Equipment & Supplies (2.1%): | |
BioLife Solutions, Inc. (a) | | | 47,960 | | | | 2,134,699 | | |
Butterfly Network, Inc. (a) (b) | | | 250,310 | | | | 3,624,489 | | |
See notes to financial statements.
23
Victory Portfolios
Victory RS Science and Technology Fund | | Schedule of Portfolio Investments — continued
June 30, 2021 | |
(Unaudited)
Security Description | | Shares | | Value | |
CryoPort, Inc. (a) (b) | | | 56,253 | | | $ | 3,549,564 | | |
Quotient Ltd. (a) (b) | | | 24,020 | | | | 87,433 | | |
| | | | 9,396,185 | | |
Health Care Providers & Services (0.5%): | |
Exagen, Inc. (a) | | | 36,345 | | | | 544,811 | | |
Lifesci Acquisition II Corp. PIPE (a) (d) (e) (h) (i) | | | 178,320 | | | | 1,665,509 | | |
| | | | 2,210,320 | | |
Health Care Technology (0.8%): | |
Veeva Systems, Inc., Class A (a) | | | 10,980 | | | | 3,414,231 | | |
IT Services (10.6%): | |
GoDaddy, Inc., Class A (a) | | | 44,060 | | | | 3,831,458 | | |
PayPal Holdings, Inc. (a) (b) | | | 15,830 | | | | 4,614,128 | | |
Twilio, Inc., Class A (a) | | | 47,100 | | | | 18,564,936 | | |
Visa, Inc., Class A | | | 29,010 | | | | 6,783,118 | | |
Wix.com Ltd. (a) | | | 44,940 | | | | 13,045,183 | | |
| | | | 46,838,823 | | |
Life Sciences Tools & Services (3.2%): | |
10X Genomics, Inc., Class A (a) (b) | | | 19,630 | | | | 3,843,946 | | |
Berkeley Lights, Inc. (a) | | | 41,460 | | | | 1,857,823 | | |
NeoGenomics, Inc. (a) | | | 47,740 | | | | 2,156,416 | | |
Quanterix Corp. (a) | | | 48,330 | | | | 2,835,038 | | |
Singular Genomics Systems, Inc. (a) | | | 129,560 | | | | 3,560,309 | | |
| | | | 14,253,532 | | |
Materials (0.3%): | |
Kronos Bio, Inc. (a) (b) | | | 49,570 | | | | 1,187,201 | | |
Pharmaceuticals (1.4%): | |
Angion Biomedica Corp. (a) | | | 54,380 | | | | 708,028 | | |
Compass Pathways PLC, ADR (a) | | | 49,500 | | | | 1,888,425 | | |
Marinus Pharmaceuticals, Inc. (a) (b) | | | 60,764 | | | | 1,090,106 | | |
Nuvation Bio, Inc. (a) (b) | | | 143,070 | | | | 1,331,982 | | |
PMV Pharmaceuticals, Inc. (a) (b) | | | 37,470 | | | | 1,279,975 | | |
| | | | 6,298,516 | | |
Semiconductors & Semiconductor Equipment (19.9%): | |
Ambarella, Inc. (a) | | | 42,450 | | | | 4,526,443 | | |
Applied Materials, Inc. | | | 42,560 | | | | 6,060,544 | | |
Cohu, Inc. (a) (b) | | | 165,930 | | | | 6,104,565 | | |
Ichor Holdings Ltd. (a) | | | 98,660 | | | | 5,307,908 | | |
Lam Research Corp. | | | 17,890 | | | | 11,641,023 | | |
Lattice Semiconductor Corp. (a) | | | 181,430 | | | | 10,192,737 | | |
MACOM Technology Solutions Holdings, Inc. (a) | | | 176,210 | | | | 11,291,537 | | |
Marvell Technology, Inc. | | | 100,290 | | | | 5,849,916 | | |
MKS Instruments, Inc. | | | 33,900 | | | | 6,032,505 | | |
Monolithic Power Systems, Inc. | | | 10,420 | | | | 3,891,349 | | |
NVIDIA Corp. | | | 10,290 | | | | 8,233,029 | | |
SiTime Corp. (a) | | | 35,110 | | | | 4,444,575 | | |
STMicroelectronics NV, NYS (b) | | | 121,620 | | | | 4,424,536 | | |
| | | | 88,000,667 | | |
See notes to financial statements.
24
Victory Portfolios
Victory RS Science and Technology Fund | | Schedule of Portfolio Investments — continued
June 30, 2021 | |
(Unaudited)
Security Description | | Shares | | Value | |
Software (21.5%): | |
Avaya Holdings Corp. (a) | | | 169,350 | | | $ | 4,555,515 | | |
Coupa Software, Inc. (a) | | | 12,470 | | | | 3,268,512 | | |
DocuSign, Inc. (a) | | | 33,770 | | | | 9,441,079 | | |
Domo, Inc., Class B (a) | | | 63,890 | | | | 5,164,229 | | |
Dropbox, Inc., Class A (a) | | | 142,440 | | | | 4,317,356 | | |
Fair Isaac Corp. (a) | | | 7,420 | | | | 3,729,886 | | |
Microsoft Corp. (c) | | | 80,450 | | | | 21,793,905 | | |
Paycom Software, Inc. (a) | | | 13,490 | | | | 4,903,210 | | |
RingCentral, Inc., Class A (a) | | | 67,380 | | | | 19,579,280 | | |
ServiceNow, Inc. (a) (c) | | | 12,540 | | | | 6,891,357 | | |
Varonis Systems, Inc. (a) | | | 130,350 | | | | 7,510,767 | | |
Zendesk, Inc. (a) | | | 26,320 | | | | 3,799,029 | | |
| | | | 94,954,125 | | |
Technology Hardware, Storage & Peripherals (1.1%): | |
Western Digital Corp. (a) | | | 66,570 | | | | 4,737,787 | | |
Total Common Stocks (Cost $236,742,462) | | | 442,727,484 | | |
Warrants (0.0%) (f) | |
Health Care (0.0%) (f): | |
Nuvation Bio, Inc. | | | 48,570 | | | | 126,287 | | |
Regulus Therapeutics, Inc. PIPE (a) (d) (e) | | | 1,326,367 | | | | 92,846 | | |
| | | | 219,133 | | |
Total Warrants (Cost $165,796) | | | 219,133 | | |
Collateral for Securities Loaned^ (8.1%) | |
BlackRock Liquidity Funds TempFund Portfolio, Institutional
Class, 0.04% (g) | | | 706,975 | | | | 706,975 | | |
Fidelity Investments Money Market Government Portfolio
I Shares, 0.01% (g) | | | 19,149,679 | | | | 19,149,679 | | |
Goldman Sachs Financial Square Prime Obligations Fund, Institutional
Class, 0.02% (g) | | | 352,816 | | | | 352,816 | | |
JPMorgan Prime Money Market Fund, Capital Class, 0.07% (g) | | | 2,813,242 | | | | 2,813,242 | | |
Morgan Stanley Institutional Liquidity Prime Portfolio, Institutional
Class, 0.06% (g) | | | 12,648,883 | | | | 12,648,883 | | |
Total Collateral for Securities Loaned (Cost $35,671,595) | | | 35,671,595 | | |
Total Investments (Cost $272,579,853) — 108.2% | | | 478,618,212 | | |
Liabilities in excess of other assets — (8.2)% | | | (36,299,776 | ) | |
NET ASSETS — 100.00% | | $ | 442,318,436 | | |
^ Purchased with cash collateral from securities on loan.
(a) Non-income producing security.
(b) All or a portion of this security is on loan.
(c) All or a portion of the security has been segregated as collateral for securities purchased on a delayed-delivery and/or when-issued basis.
See notes to financial statements.
25
Victory Portfolios
Victory RS Science and Technology Fund | | Schedule of Portfolio Investments — continued
June 30, 2021 | |
(Unaudited)
(d) The Fund's Adviser has deemed this security to be illiquid based upon procedures approved by the Board of Trustees. As of June 30, 2021, illiquid securities were 1.0% of net assets.
(e) Security was fair valued based upon procedures approved by the Board of Trustees and represents 1.0% of net assets as of June 30, 2021. (See Note 2 in the Notes to Financial Statements).
(f) Amount represents less than 0.05% of net assets.
(g) Rate disclosed is the daily yield on June 30, 2021.
(h) Security or portion of security purchased on a delayed-delivery and/or when-issued basis.
(i) Restricted security that is not registered under the Securities Act of 1933.
ADR — American Depositary Receipt
NYS — New York Registered Shares
PIPE — Private Investment in Public Equity
PLC — Public Limited Company
See notes to financial statements.
26
Victory Portfolios
Victory RS Small Cap Equity Fund | | Schedule of Portfolio Investments
June 30, 2021 | |
(Unaudited)
Security Description | | Shares | | Value | |
Common Stocks (97.6%) | |
Communication Services (4.6%): | |
Bandwidth, Inc., Class A (a) (b) | | | 10,040 | | | $ | 1,384,717 | | |
EverQuote, Inc., Class A (a) | | | 74,890 | | | | 2,447,405 | | |
| | | | 3,832,122 | | |
Consumer Staples (2.4%): | |
elf Beauty, Inc. (a) | | | 72,040 | | | | 1,955,166 | | |
Electronic Equipment, Instruments & Components (4.4%): | |
Itron, Inc. (a) | | | 36,400 | | | | 3,639,272 | | |
Energy (4.1%): | |
Amyris, Inc. (a) (b) | | | 75,740 | | | | 1,239,864 | | |
Renewable Energy Group, Inc. (a) (b) | | | 34,500 | | | | 2,150,730 | | |
| | | | 3,390,594 | | |
Financials (17.7%): | |
Green Dot Corp., Class A (a) | | | 49,230 | | | | 2,306,425 | | |
Open Lending Corp., Class A (a) (b) | | | 89,630 | | | | 3,862,157 | | |
PRA Group, Inc. (a) | | | 55,560 | | | | 2,137,393 | | |
PROG Holdings, Inc. (a) | | | 87,360 | | | | 4,204,637 | | |
Trupanion, Inc. (a) | | | 18,220 | | | | 2,097,122 | | |
| | | | 14,607,734 | | |
Health Care (18.4%): | |
Apellis Pharmaceuticals, Inc. (a) | | | 19,110 | | | | 1,207,752 | | |
Blueprint Medicines Corp. (a) | | | 10,280 | | | | 904,229 | | |
Butterfly Network, Inc. (a) (b) | | | 59,790 | | | | 865,759 | | |
CryoPort, Inc. (a) (b) | | | 43,440 | | | | 2,741,064 | | |
DermTech, Inc. (a) (b) | | | 26,790 | | | | 1,113,660 | | |
Eargo, Inc. (a) | | | 22,040 | | | | 879,616 | | |
Fate Therapeutics, Inc. (a) | | | 11,560 | | | | 1,003,292 | | |
Inspire Medical Systems, Inc. (a) | | | 6,100 | | | | 1,178,886 | | |
MacroGenics, Inc. (a) | | | 28,890 | | | | 775,986 | | |
Quanterix Corp. (a) | | | 19,550 | | | | 1,146,803 | | |
Scholar Rock Holding Corp. (a) | | | 21,180 | | | | 612,102 | | |
SpringWorks Therapeutics, Inc. (a) | | | 17,090 | | | | 1,408,387 | | |
Twist Bioscience Corp. (a) (b) | | | 9,890 | | | | 1,317,843 | | |
| | | | 15,155,379 | | |
Industrials (13.9%): | |
Chart Industries, Inc. (a) | | | 18,960 | | | | 2,774,227 | | |
Evoqua Water Technologies Corp. (a) | | | 117,070 | | | | 3,954,624 | | |
Karat Packaging, Inc. (a) | | | 80,110 | | | | 1,631,841 | | |
Kornit Digital Ltd. (a) | | | 14,890 | | | | 1,851,274 | | |
SiteOne Landscape Supply, Inc. (a) | | | 7,420 | | | | 1,255,909 | | |
| | | | 11,467,875 | | |
See notes to financial statements.
27
Victory Portfolios
Victory RS Small Cap Equity Fund | | Schedule of Portfolio Investments — continued
June 30, 2021 | |
(Unaudited)
Security Description | | Shares | | Value | |
IT Services (3.9%): | |
Paymentus Holdings, Inc., Class A (a) | | | 18,040 | | | $ | 640,420 | | |
Repay Holdings Corp. (a) | | | 107,824 | | | | 2,592,089 | | |
| | | | 3,232,509 | | |
Semiconductors & Semiconductor Equipment (9.8%): | |
Lattice Semiconductor Corp. (a) | | | 37,510 | | | | 2,107,312 | | |
MACOM Technology Solutions Holdings, Inc. (a) | | | 50,560 | | | | 3,239,885 | | |
SiTime Corp. (a) | | | 21,950 | | | | 2,778,650 | | |
| | | | 8,125,847 | | |
Software (18.4%): | |
ACI Worldwide, Inc. (a) | | | 98,680 | | | | 3,664,975 | | |
Avaya Holdings Corp. (a) (b) | | | 175,380 | | | | 4,717,722 | | |
BTRS Holdings, Inc. (a) (b) | | | 176,830 | | | | 2,231,595 | | |
Q2 Holdings, Inc. (a) | | | 21,900 | | | | 2,246,502 | | |
Varonis Systems, Inc. (a) | | | 41,150 | | | | 2,371,063 | | |
| | | | 15,231,857 | | |
Total Common Stocks (Cost $68,102,214) | | | 80,638,355 | | |
Collateral for Securities Loaned^ (18.5%) | |
BlackRock Liquidity Funds TempFund Portfolio, Institutional
Class, 0.04% (c) | | | 302,004 | | | | 302,004 | | |
Fidelity Investments Money Market Government Portfolio
I Shares, 0.01% (c) | | | 8,180,302 | | | | 8,180,302 | | |
Goldman Sachs Financial Square Prime Obligations Fund, Institutional
Class, 0.02% (c) | | | 150,715 | | | | 150,715 | | |
JPMorgan Prime Money Market Fund, Capital Class, 0.07% (c) | | | 1,201,752 | | | | 1,201,752 | | |
Morgan Stanley Institutional Liquidity Prime Portfolio, Institutional
Class, 0.06% (c) | | | 5,403,312 | | | | 5,403,312 | | |
Total Collateral for Securities Loaned (Cost $15,238,085) | | | 15,238,085 | | |
Total Investments (Cost $83,340,299) — 116.1% | | | 95,876,440 | | |
Liabilities in excess of other assets — (16.1)% | | | (13,294,262 | ) | |
NET ASSETS — 100.00% | | $ | 82,582,178 | | |
^ Purchased with cash collateral from securities on loan.
(a) Non-income producing security.
(b) All or a portion of this security is on loan.
(c) Rate disclosed is the daily yield on June 30, 2021.
See notes to financial statements.
28
Victory Portfolios | | Statements of Assets and Liabilities
June 30, 2021 | |
(Unaudited)
| | | Victory
RS Small Cap
Growth Fund | | Victory
RS Select
Growth Fund | | Victory
RS Mid Cap
Growth Fund | |
Assets: | |
Investments, at value (Cost $2,283,908,185,
$162,677,967 and $309,976,874) | | $ | 3,158,470,914 | (a) | | $ | 234,265,019 | (b) | | $ | 479,976,184 | (c) | |
Cash | | | 74,187,213 | | | | 3,111,493 | | | | 2,101,499 | | |
Receivables: | |
Interest and dividends | | | 261,550 | | | | 21,422 | | | | 21,703 | | |
Capital shares issued | | | 1,711,067 | | | | 192,208 | | | | 221,755 | | |
Investments sold | | | 68,496,436 | | | | 10,299,129 | | | | 822,505 | | |
From Adviser | | | 104,567 | | | | 32,547 | | | | 143,434 | | |
Prepaid expenses | | | 58,092 | | | | 16,129 | | | | 31,186 | | |
Total Assets | | | 3,303,289,839 | | | | 247,937,947 | | | | 483,318,266 | | |
Liabilities: | |
Payables: | |
Collateral received on loaned securities | | | 280,518,714 | | | | 5,200,083 | | | | 22,643,008 | | |
Investments purchased | | | 125,775,339 | | | | 8,436,906 | | | | 1,309,048 | | |
Capital shares redeemed | | | 3,900,469 | | | | 315,279 | | | | 189,255 | | |
Accrued expenses and other payables: | |
Investment advisory fees | | | 2,201,093 | | | | 190,532 | | | | 308,538 | | |
Administration fees | | | 146,021 | | | | 11,713 | | | | 23,717 | | |
Custodian fees | | | 14,659 | | | | 2,016 | | | | 4,784 | | |
Transfer agent fees | | | 275,197 | | | | 25,343 | | | | 101,162 | | |
Compliance fees | | | 1,399 | | | | 120 | | | | 244 | | |
| 12b-1 fees | | | 88,180 | | | | 19,565 | | | | 16,008 | | |
Other accrued expenses | | | 137,526 | | | | 17,837 | | | | 34,073 | | |
Total Liabilities | | | 413,058,597 | | | | 14,219,394 | | | | 24,629,837 | | |
Net Assets: | |
Capital | | | 1,768,029,191 | | | | 102,082,808 | | | | 217,575,460 | | |
Total accumulated earnings/(loss) | | | 1,122,202,051 | | | | 131,635,745 | | | | 241,112,969 | | |
Net Assets | | $ | 2,890,231,242 | | | $ | 233,718,553 | | | $ | 458,688,429 | | |
Net Assets: | |
Class A | | $ | 790,942,711 | | | $ | 126,788,392 | | | $ | 95,161,240 | | |
Class C | | | 15,385,408 | | | | 16,089,261 | | | | 15,585,001 | | |
Class R | | | 7,641,141 | | | | 440,228 | | | | 632,535 | | |
Class R6 | | | 720,574,623 | | | | 1,198,832 | | | | 22,862,708 | | |
Class Y | | | 1,355,687,359 | | | | 89,201,840 | | | | 323,804,210 | | |
Member Class | | | — | | | | — | | | | 642,735 | | |
Total | | $ | 2,890,231,242 | | | $ | 233,718,553 | | | $ | 458,688,429 | | |
Shares (unlimited number of shares authorized
with a par value of $0.001 per share): | |
Class A | | | 8,091,733 | | | | 3,057,567 | | | | 2,818,171 | | |
Class C | | | 194,712 | | | | 521,262 | | | | 549,376 | | |
Class R | | | 88,148 | | | | 13,857 | | | | 20,902 | | |
Class R6 | | | 6,933,786 | | | | 26,721 | | | | 644,871 | | |
Class Y | | | 13,092,306 | | | | 2,000,344 | | | | 9,142,055 | | |
Member Class | | | — | | | | — | | | | 19,009 | | |
Total | | | 28,400,685 | | | | 5,619,751 | | | | 13,194,384 | | |
Net asset value, offering (except Class A)
and redemption price per share: | |
Class A | | $ | 97.75 | | | $ | 41.47 | | | $ | 33.77 | | |
Class C (d) | | | 79.02 | | | | 30.87 | | | | 28.37 | | |
Class R | | | 86.69 | | | | 31.77 | | | | 30.26 | | |
Class R6 | | | 103.92 | | | | 44.86 | | | | 35.45 | | |
Class Y | | | 103.55 | | | | 44.59 | | | | 35.42 | | |
Member Class | | | — | | | | — | | | | 33.81 | | |
Maximum Sales Charge — Class A | | | 5.75 | % | | | 5.75 | % | | | 5.75 | % | |
Maximum offering price
(100%/(100%-maximum sales charge) of
net asset value adjusted to the nearest cent)
per share — Class A | | $ | 103.71 | | | $ | 44.00 | | | $ | 35.83 | | |
(a) Includes $274,460,222 of securities on loan.
(b) Includes $5,100,591 of securities on loan.
(c) Includes $21,939,015 of securities on loan.
(d) Redemption price per share varies by the length of time shares are held.
See notes to financial statements.
29
Victory Portfolios | | Statements of Assets and Liabilities
June 30, 2021 | |
(Unaudited)
| | | Victory
RS Growth Fund | | Victory
RS Science and
Technology Fund | | Victory
RS Small Cap
Equity Fund | |
Assets: | |
Investments, at value (Cost $181,669,201,
$272,579,853 and $83,340,299) | | $ | 333,606,039 | (a) | | $ | 478,618,212 | (b) | | $ | 95,876,440 | (c) | |
Cash | | | 684,219 | | | | 9,249,972 | | | | 2,001,594 | | |
Receivables: | |
Interest and dividends | | | 21,609 | | | | 54,020 | | | | 5,239 | | |
Capital shares issued | | | 366 | | | | 122,749 | | | | 1,311 | | |
Investments sold | | | 5,158,659 | | | | 3,560,266 | | | | 161,727 | | |
From Adviser | | | 38,331 | | | | — | | | | 11,040 | | |
Prepaid expenses | | | 2,429 | | | | 3,857 | | | | 26,517 | | |
Total Assets | | | 339,511,652 | | | | 491,609,076 | | | | 98,083,868 | | |
Liabilities: | |
Payables: | |
Collateral received on loaned securities | | | 9,948,087 | | | | 35,671,595 | | | | 15,238,085 | | |
Investments purchased | | | — | | | | 7,988,103 | | | | 45,374 | | |
Investments purchased-forward settlements | | | — | | | | 4,543,200 | | | | — | | |
Capital shares redeemed | | | 26,230 | | | | 602,685 | | | | 133,859 | | |
Accrued expenses and other payables: | |
Investment advisory fees | | | 196,452 | | | | 353,102 | | | | 49,942 | | |
Administration fees | | | 16,347 | | | | 22,218 | | | | 4,179 | | |
Custodian fees | | | 2,236 | | | | 2,734 | | | | 801 | | |
Transfer agent fees | | | 23,885 | | | | 35,681 | | | | 9,705 | | |
Compliance fees | | | 162 | | | | 208 | | | | 39 | | |
| 12b-1 fees | | | 30,753 | | | | 38,349 | | | | 8,396 | | |
Other accrued expenses | | | 23,056 | | | | 32,765 | | | | 11,310 | | |
Total Liabilities | | | 10,267,208 | | | | 49,290,640 | | | | 15,501,690 | | |
Net Assets: | |
Capital | | | 159,235,027 | | | | 198,154,756 | | | | 55,585,759 | | |
Total accumulated earnings/(loss) | | | 170,009,417 | | | | 244,163,680 | | | | 26,996,419 | | |
Net Assets | | $ | 329,244,444 | | | $ | 442,318,436 | | | $ | 82,582,178 | | |
Net Assets | |
Class A | | $ | 294,722,887 | | | $ | 319,254,241 | | | $ | 73,558,807 | | |
Class C | | | 2,294,109 | | | | 14,068,428 | | | | 498,215 | | |
Class R | | | 490,699 | | | | 1,322,357 | | | | 3,244,560 | | |
Class Y | | | 31,736,749 | | | | 107,673,410 | | | | 4,112,286 | | |
Member Class | | | — | | | | — | | | | 1,168,310 | | |
Total | | $ | 329,244,444 | | | $ | 442,318,436 | | | $ | 82,582,178 | | |
Shares (unlimited number of shares authorized
with a par value of $0.001 per share): | |
Class A | | | 11,175,001 | | | | 8,484,872 | | | | 3,973,654 | | |
Class C | | | 110,765 | | | | 509,000 | | | | 318,199 | | |
Class R | | | 21,102 | | | | 42,702 | | | | 247,604 | | |
Class Y | | | 1,140,319 | | | | 2,615,144 | | | | 213,830 | | |
Member Class | | | — | | | | — | | | | 63,044 | | |
Total | | | 12,447,187 | | | | 11,651,718 | | | | 4,816,331 | | |
Net asset value, offering (except Class A)
and redemption price per share: | |
Class A | | $ | 26.37 | | | $ | 37.63 | | | $ | 18.51 | | |
Class C (d) | | | 20.71 | | | | 27.64 | | | | 1.57 | | |
Class R | | | 23.25 | | | | 30.97 | | | | 13.10 | | |
Class Y | | | 27.83 | | | | 41.17 | | | | 19.23 | | |
Member Class | | | — | | | | — | | | | 18.53 | | |
Maximum Sales Charge — Class A | | | 5.75 | % | | | 5.75 | % | | | 5.75 | % | |
Maximum offering price
(100%/(100%-maximum sales charge) of
net asset value adjusted to the nearest cent)
per share — Class A | | $ | 27.98 | | | $ | 39.93 | | | $ | 19.64 | | |
(a) Includes $9,707,512 of securities on loan.
(b) Includes $34,745,817 of securities on loan.
(c) Includes $14,707,983 of securities on loan.
(d) Redemption price per share varies by the length of time shares are held.
See notes to financial statements.
30
Victory Portfolios | | Statements of Operations
For the Six Months Ended June 30, 2021 | |
(Unaudited)
| | | Victory
RS Small Cap
Growth Fund | | Victory
RS Select
Growth Fund | | Victory
RS Mid Cap
Growth Fund | |
Investment Income: | | | |
Dividends | | $ | 1,392,853 | | | $ | 244,421 | | | $ | 622,521 | | |
Interest | | | 5,155 | | | | 278 | | | | 324 | | |
Securities lending (net of fees) | | | 458,532 | | | | 7,919 | | | | 8,836 | | |
Foreign tax withholding | | | — | | | | — | | | | (5,014 | ) | |
Total Income | | | 1,856,540 | | | | 252,618 | | | | 626,667 | | |
Expenses: | | | |
Investment advisory fees | | | 13,962,324 | | | | 1,175,933 | | | | 2,347,286 | | |
Administration fees | | | 824,675 | | | | 65,956 | | | | 155,152 | | |
Sub-Administration fees | | | 8,288 | | | | 8,287 | | | | 8,288 | | |
| 12b-1 fees — Class A | | | 1,018,030 | | | | 152,474 | | | | 114,460 | | |
| 12b-1 fees — Class C | | | 89,265 | | | | 91,903 | | | | 80,446 | | |
| 12b-1 fees — Class R | | | 21,030 | | | | 1,176 | | | | 1,488 | | |
Custodian fees | | | 83,236 | | | | 5,941 | | | | 13,821 | | |
Transfer agent fees — Class A | | | 532,320 | | | | 67,232 | | | | 59,154 | | |
Transfer agent fees — Class C | | | 9,981 | | | | 13,585 | | | | 6,806 | | |
Transfer agent fees — Class R | | | 7,160 | | | | 1,068 | | | | 732 | | |
Transfer agent fees — Class R6 | | | 11,700 | | | | 104 | | | | 374 | | |
Transfer agent fees — Class Y | | | 689,429 | | | | 45,054 | | | | 313,075 | | |
Transfer agent fees — Member Class | | | — | | | | — | | | | 320 | | |
Trustees' fees | | | 98,030 | | | | 8,482 | | | | 20,189 | | |
Compliance fees | | | 10,866 | | | | 871 | | | | 2,170 | | |
Legal and audit fees | | | 88,448 | | | | 10,478 | | | | 21,156 | | |
State registration and filing fees | | | 51,370 | | | | 24,082 | | | | 39,470 | | |
Interfund lending fees | | | — | | | | 108 | | | | 187 | | |
Other expenses | | | 115,498 | | | | 14,378 | | | | 42,258 | | |
Total Expenses | | | 17,621,650 | | | | 1,687,112 | | | | 3,226,832 | | |
Expenses waived/reimbursed by Adviser | | | (122,065 | ) | | | (90,962 | ) | | | (402,127 | ) | |
Net Expenses | | | 17,499,585 | | | | 1,596,150 | | | | 2,824,705 | | |
Net Investment Income (Loss) | | | (15,643,045 | ) | | | (1,343,532 | ) | | | (2,198,038 | ) | |
Realized/Unrealized Gains (Losses) from
Investments: | | | |
Net realized gains (losses) from investment
securities | | | 209,704,366 | | | | 26,144,147 | | | | 80,759,953 | | |
Net change in unrealized appreciation/depreciation
on investment securities | | | (184,791,486 | ) | | | (5,428,876 | ) | | | (43,623,739 | ) | |
Net realized/unrealized gains (losses)
on investments | | | 24,912,880 | | | | 20,715,271 | | | | 37,136,214 | | |
Change in net assets resulting from operations | | $ | 9,269,835 | | | $ | 19,371,739 | | | $ | 34,938,176 | | |
See notes to financial statements.
31
Victory Portfolios | | Statements of Operations
For the Six Months Ended June 30, 2021 | |
(Unaudited)
| | | Victory
RS Growth Fund | | Victory
RS Science and
Technology Fund | | Victory
RS Small Cap
Equity Fund | |
Investment Income: | | | |
Dividends | | $ | 689,539 | | | $ | 247,841 | | | $ | — | | |
Interest | | | 66 | | | | 1,595 | | | | 183 | | |
Securities lending (net of fees) | | | 3,510 | | | | 167,977 | | | | 30,008 | | |
Total Income | | | 693,115 | | | | 417,413 | | | | 30,191 | | |
Expenses: | | | |
Investment advisory fees | | | 1,164,950 | | | | 2,238,150 | | | | 310,993 | | |
Administration fees | | | 87,087 | | | | 125,596 | | | | 23,271 | | |
Sub-Administration fees | | | 7,683 | | | | 8,287 | | | | 7,185 | | |
| 12b-1 fees — Class A | | | 346,896 | | | | 403,316 | | | | 92,293 | | |
| 12b-1 fees — Class C | | | 13,185 | | | | 70,746 | | | | 2,711 | | |
| 12b-1 fees — Class R | | | 1,100 | | | | 3,240 | | | | 8,246 | | |
Custodian fees | | | 7,133 | | | | 15,234 | | | | 2,602 | | |
Transfer agent fees — Class A | | | 104,842 | | | | 169,188 | | | | 33,053 | | |
Transfer agent fees — Class C | | | 1,616 | | | | 7,292 | | | | 350 | | |
Transfer agent fees — Class R | | | 406 | | | | 1,138 | | | | 2,728 | | |
Transfer agent fees — Class Y | | | 9,907 | | | | 62,592 | | | | 2,068 | | |
Transfer agent fees — Member Class | | | — | | | | — | | | | 626 | | |
Trustees' fees | | | 10,922 | | | | 15,112 | | | | 3,496 | | |
Compliance fees | | | 1,143 | | | | 1,642 | | | | 307 | | |
Legal and audit fees | | | 12,548 | | | | 16,682 | | | | 7,092 | | |
State registration and filing fees | | | 13,796 | | | | 17,274 | | | | 34,837 | | |
Interfund lending fees | | | 21 | | | | 28 | | | | — | | |
Interest fees | | | 199 | | | | — | | | | — | | |
Other expenses | | | 15,513 | | | | 29,594 | | | | 11,913 | | |
Total Expenses | | | 1,798,947 | | | | 3,185,111 | | | | 543,771 | | |
Expenses waived/reimbursed by Adviser | | | (117,801 | ) | | | (288 | ) | | | (29,335 | ) | |
Net Expenses | | | 1,681,146 | | | | 3,184,823 | | | | 514,436 | | |
Net Investment Income (Loss) | | | (988,031 | ) | | | (2,767,410 | ) | | | (484,245 | ) | |
Realized/Unrealized Gains (Losses) from
Investments: | | | |
Net realized gains (losses) from investment
securities | | | 18,191,351 | | | | 41,593,772 | | | | 8,611,406 | | |
Net change in unrealized appreciation/depreciation
on investment securities | | | 14,779,857 | | | | (24,189,804 | ) | | | (6,089,626 | ) | |
Net realized/unrealized gains (losses) on
investments | | | 32,971,208 | | | | 17,403,968 | | | | 2,521,780 | | |
Change in net assets resulting from operations | | $ | 31,983,177 | | | $ | 14,636,558 | | | $ | 2,037,535 | | |
See notes to financial statements.
32
Victory Portfolios | | Statements of Changes in Net Assets | |
| | | Victory
RS Small Cap Growth Fund | | Victory
RS Select Growth Fund | | Victory
RS Mid Cap Growth Fund | |
| | | Six
Months
Ended
June 30,
2021
(Unaudited) | | Year
Ended
December 31,
2020 | | Six
Months
Ended
June 30,
2021
(Unaudited) | | Year
Ended
December 31,
2020 | | Six
Months
Ended
June 30,
2021
(Unaudited) | | Year
Ended
December 31,
2020 | |
From Investment
Activities: | |
Operations: | |
Net investment
income (loss) | | $ | (15,643,045 | ) | | $ | (23,079,075 | ) | | $ | (1,343,532 | ) | | $ | (2,301,900 | ) | | $ | (2,198,038 | ) | | $ | (3,021,997 | ) | |
Net realized gains
(losses) from
investments | | | 209,704,366 | | | | 162,042,534 | | | | 26,144,147 | | | | 43,552,171 | | | | 80,759,953 | | | | 51,251,043 | | |
Net change in
unrealized
appreciation/
depreciation
on investments | | | (184,791,486 | ) | | | 661,220,255 | | | | (5,428,876 | ) | | | 17,335,883 | | | | (43,623,739 | ) | | | 117,050,286 | | |
Change in net assets
resulting from
operations | | | 9,269,835 | | | | 800,183,714 | | | | 19,371,739 | | | | 58,586,154 | | | | 34,938,176 | | | | 165,279,332 | | |
Distributions to
Shareholders: | |
Class A | | | — | | | | (68,841,797 | ) | | | — | | | | (17,578,995 | ) | | | (3,857,886 | ) | | | (3,686,081 | ) | |
Class C | | | — | | | | (2,041,419 | ) | | | — | | | | (4,596,824 | ) | | | (785,424 | ) | | | (808,992 | ) | |
Class R | | | — | | | | (815,880 | ) | | | — | | | | (91,912 | ) | | | (28,225 | ) | | | (25,936 | ) | |
Class R6 | | | — | | | | (54,388,578 | ) | | | — | | | | (97,926 | ) | | | (1,099,157 | ) | | | (1,071,652 | ) | |
Class Y | | | — | | | | (112,328,839 | ) | | | — | | | | (13,684,054 | ) | | | (18,801,227 | ) | | | (18,217,120 | ) | |
Member Class (a) | | | — | | | | — | | | | — | | | | — | | | | (17,517 | ) | | | (3,963 | ) | |
Change in net assets
resulting from
distributions to
shareholders | | | — | | | | (238,416,513 | ) | | | — | | | | (36,049,711 | ) | | | (24,589,436 | ) | | | (23,813,744 | ) | |
Change in net assets
resulting from
capital transactions | | | (56,323,502 | ) | | | 88,379,490 | | | | (19,557,049 | ) | | | (8,797,091 | ) | | | (156,964,943 | ) | | | (56,148,955 | ) | |
Change in net assets | | | (47,053,667 | ) | | | 650,146,691 | | | | (185,310 | ) | | | 13,739,352 | | | | (146,616,203 | ) | | | 85,316,633 | | |
Net Assets: | |
Beginning of period | | | 2,937,284,909 | | | | 2,287,138,218 | | | | 233,903,863 | | | | 220,164,511 | | | | 605,304,632 | | | | 519,987,999 | | |
End of period | | $ | 2,890,231,242 | | | $ | 2,937,284,909 | | | $ | 233,718,553 | | | $ | 233,903,863 | | | $ | 458,688,429 | | | $ | 605,304,632 | | |
(a) Victory RS Mid Cap Growth Fund Member Class commenced operations on November 3, 2020.
(continues on next page)
See notes to financial statements.
33
Victory Portfolios | | Statements of Changes in Net Assets | |
(continued)
| | | Victory
RS Small Cap Growth Fund | | Victory
RS Select Growth Fund | | Victory
RS Mid Cap Growth Fund | |
| | | Six
Months
Ended
June 30,
2021
(Unaudited) | | Year
Ended
December 31,
2020 | | Six
Months
Ended
June 30,
2021
(Unaudited) | | Year
Ended
December 31,
2020 | | Six
Months
Ended
June 30,
2021
(Unaudited) | | Year
Ended
December 31,
2020 | |
Capital Transactions: | |
Class A | |
Proceeds from
shares issued | | $ | 64,083,052 | | | $ | 77,354,531 | | | $ | 9,264,823 | | | $ | 9,681,283 | | | $ | 3,821,161 | | | $ | 5,412,915 | | |
Distributions
reinvested | | | — | | | | 66,397,165 | | | | — | | | | 16,848,625 | | | | 3,583,795 | | | | 3,428,512 | | |
Cost of shares
redeemed | | | (95,331,596 | ) | | | (169,500,751 | ) | | | (7,490,815 | ) | | | (20,693,842 | ) | | | (7,406,827 | ) | | | (20,027,246 | ) | |
Total Class A | | $ | (31,248,544 | ) | | $ | (25,749,055 | ) | | $ | 1,774,008 | | | $ | 5,836,066 | | | $ | (1,871 | ) | | $ | (11,185,819 | ) | |
Class C | |
Proceeds from
shares issued | | $ | 1,610,399 | | | $ | 3,029,369 | | | $ | 169,206 | | | $ | 376,083 | | | $ | 114,561 | | | $ | 424,825 | | |
Distributions
reinvested | | | — | | | | 1,949,346 | | | | — | | | | 4,562,487 | | | | 761,156 | | | | 777,691 | | |
Cost of shares
redeemed | | | (6,576,168 | ) | | | (6,820,282 | ) | | | (9,459,256 | ) | | | (9,757,197 | ) | | | (2,778,390 | ) | | | (7,717,057 | ) | |
Total Class C | | $ | (4,965,769 | ) | | $ | (1,841,567 | ) | | $ | (9,290,050 | ) | | $ | (4,818,627 | ) | | $ | (1,902,673 | ) | | $ | (6,514,541 | ) | |
Class R | |
Proceeds from
shares issued | | $ | 1,910,482 | | | $ | 2,753,580 | | | $ | 27,579 | | | $ | 176,233 | | | $ | 28,661 | | | $ | 172,986 | | |
Distributions
reinvested | | | — | | | | 815,880 | | | | — | | | | 71,719 | | | | 28,225 | | | | 25,936 | | |
Cost of shares
redeemed | | | (2,757,333 | ) | | | (4,331,623 | ) | | | (134,196 | ) | | | (403,650 | ) | | | (30,898 | ) | | | (691,488 | ) | |
Total Class R | | $ | (846,851 | ) | | $ | (762,163 | ) | | $ | (106,617 | ) | | $ | (155,698 | ) | | $ | 25,988 | | | $ | (492,566 | ) | |
Class R6 | |
Proceeds from
shares issued | | $ | 124,664,766 | | | $ | 212,153,078 | | | $ | 527,109 | | | $ | 313,429 | | | $ | 2,644,902 | | | $ | 8,791,051 | | |
Distributions
reinvested | | | — | | | | 38,383,633 | | | | — | | | | 77,795 | | | | 370,607 | | | | 341,886 | | |
Cost of shares
redeemed | | | (83,774,948 | ) | | | (146,162,351 | ) | | | (141,740 | ) | | | (20,684 | ) | | | (8,411,605 | ) | | | (8,265,488 | ) | |
Total Class R6 | | $ | 40,889,818 | | | $ | 104,374,360 | | | $ | 385,369 | | | $ | 370,540 | | | $ | (5,396,096 | ) | | $ | 867,449 | | |
Class Y | |
Proceeds from
shares issued | | $ | 193,047,399 | | | $ | 320,717,460 | | | $ | 4,533,387 | | | $ | 19,406,953 | | | $ | 21,176,421 | | | $ | 81,010,960 | | |
Distributions
reinvested | | | — | | | | 101,937,080 | | | | — | | | | 12,776,316 | | | | 18,321,056 | | | | 17,755,174 | | |
Cost of shares
redeemed | | | (253,199,555 | ) | | | (410,296,625 | ) | | | (16,853,146 | ) | | | (42,212,641 | ) | | | (189,701,641 | ) | | | (137,693,578 | ) | |
Total Class Y | | $ | (60,152,156 | ) | | $ | 12,357,915 | | | $ | (12,319,759 | ) | | $ | (10,029,372 | ) | | $ | (150,204,164 | ) | | $ | (38,927,444 | ) | |
Member Class (a) | |
Proceeds from
shares issued | | $ | — | | | $ | — | | | $ | — | | | $ | — | | | $ | 764,813 | | | $ | 100,003 | | |
Distributions
reinvested | | | — | | | | — | | | | — | | | | — | | | | 17,517 | | | | 3,963 | | |
Cost of shares
redeemed | | | — | | | | — | | | | — | | | | — | | | | (268,457 | ) | | | — | | |
Total Member
Class | | $ | — | | | $ | — | | | $ | — | | | $ | — | | | $ | 513,873 | | | $ | 103,966 | | |
Change in net assets
resulting from capital
transactions | | $ | (56,323,502 | ) | | $ | 88,379,490 | | | $ | (19,557,049 | ) | | $ | (8,797,091 | ) | | $ | (156,964,943 | ) | | $ | (56,148,955 | ) | |
(a) Victory RS Mid Cap Growth Fund Member Class commenced operations on November 3, 2020.
(continues on next page)
See notes to financial statements.
34
Victory Portfolios | | Statements of Changes in Net Assets | |
(continued)
| | | Victory
RS Small Cap Growth Fund | | Victory
RS Select Growth Fund | | Victory
RS Mid Cap Growth Fund | |
| | | Six
Months
Ended
June 30,
2021
(Unaudited) | | Year
Ended
December 31,
2020 | | Six
Months
Ended
June 30,
2021
(Unaudited) | | Year
Ended
December 31,
2020 | | Six
Months
Ended
June 30,
2021
(Unaudited) | | Year
Ended
December 31,
2020 | |
Share Transactions: | |
Class A | |
Issued | | | 643,983 | | | | 954,550 | | | | 233,386 | | | | 266,397 | | | | 114,111 | | | | 195,313 | | |
Reinvested | | | — | | | | 691,709 | | | | — | | | | 454,141 | | | | 105,561 | | | | 106,113 | | |
Redeemed | | | (966,933 | ) | | | (2,137,356 | ) | | | (187,128 | ) | | | (587,787 | ) | | | (222,424 | ) | | | (723,305 | ) | |
Total Class A | | | (322,950 | ) | | | (491,097 | ) | | | 46,258 | | | | 132,751 | | | | (2,752 | ) | | | (421,879 | ) | |
Class C | |
Issued | | | 20,090 | | | | 48,086 | | | | 5,743 | | | | 14,337 | | | | 4,059 | | | | 19,661 | | |
Reinvested | | | — | | | | 25,020 | | | | — | | | | 164,533 | | | | 26,642 | | | | 28,311 | | |
Redeemed | | | (82,388 | ) | | | (104,879 | ) | | | (319,464 | ) | | | (351,862 | ) | | | (99,050 | ) | | | (348,027 | ) | |
Total Class C | | | (62,298 | ) | | | (31,773 | ) | | | (313,721 | ) | | | (172,992 | ) | | | (68,349 | ) | | | (300,055 | ) | |
Class R | |
Issued | | | 21,471 | | | | 35,926 | | | | 900 | | | | 6,241 | | | | 947 | | | | 8,775 | | |
Reinvested | | | — | | | | 9,567 | | | | — | | | | 2,516 | | | | 927 | | | | 889 | | |
Redeemed | | | (31,663 | ) | | | (62,256 | ) | | | (4,231 | ) | | | (13,699 | ) | | | (972 | ) | | | (29,410 | ) | |
Total Class R | | | (10,192 | ) | | | (16,763 | ) | | | (3,331 | ) | | | (4,942 | ) | | | 902 | | | | (19,746 | ) | |
Class R6 | |
Issued | | | 1,195,775 | | | | 2,557,025 | | | | 12,804 | | | | 7,416 | | | | 76,302 | | | | 336,247 | | |
Reinvested | | | — | | | | 376,827 | | | | — | | | | 1,942 | | | | 10,402 | | | | 10,112 | | |
Redeemed | | | (809,316 | ) | | | (1,820,549 | ) | | | (3,307 | ) | | | (532 | ) | | | (248,657 | ) | | | (302,470 | ) | |
Total Class R6 | | | 386,459 | | | | 1,113,303 | | | | 9,497 | | | | 8,826 | | | | (161,953 | ) | | | 43,889 | | |
Class Y | |
Issued | | | 1,843,750 | | | | 3,896,904 | | | | 105,168 | | �� | | 488,847 | | | | 610,304 | | | | 3,062,234 | | |
Reinvested | | | — | | | | 1,003,911 | | | | — | | | | 320,691 | | | | 514,636 | | | | 525,612 | | |
Redeemed | | | (2,440,635 | ) | | | (5,171,416 | ) | | | (392,612 | ) | | | (1,170,335 | ) | | | (5,500,028 | ) | | | (4,935,082 | ) | |
Total Class Y | | | (596,885 | ) | | | (270,601 | ) | | | (287,444 | ) | | | (360,797 | ) | | | (4,375,088 | ) | | | (1,347,236 | ) | |
Member Class (a) | |
Issued | | | — | | | | — | | | | — | | | | — | | | | 23,403 | | | | 3,179 | | |
Reinvested | | | — | | | | — | | | | — | | | | — | | | | 515 | | | | 123 | | |
Redeemed | | | — | | | | — | | | | — | | | | — | | | | (8,211 | ) | | | — | | |
Total Member Class | | | — | | | | — | | | | — | | | | — | | | | 15,707 | | | | 3,302 | | |
Change in Shares | | | (605,866 | ) | | | 303,069 | | | | (548,741 | ) | | | (397,154 | ) | | | (4,591,533 | ) | | | (2,041,725 | ) | |
(a) Victory RS Mid Cap Growth Fund Member Class commenced operations on November 3, 2020.
See notes to financial statements.
35
Victory Portfolios | | Statements of Changes in Net Assets | |
| | | Victory
RS Growth Fund | | Victory
RS Science and
Technology Fund | | Victory
RS Small Cap Equity Fund | |
| | | Six
Months
Ended
June 30,
2021
(Unaudited) | | Year
Ended
December 31,
2020 | | Six
Months
Ended
June 30,
2021
(Unaudited) | | Year
Ended
December 31,
2020 | | Six
Months
Ended
June 30,
2021
(Unaudited) | | Year
Ended
December 31,
2020 | |
From Investment Activities: | |
Operations: | |
Net investment
income (loss) | | $ | (988,031 | ) | | $ | (937,740 | ) | | $ | (2,767,410 | ) | | $ | (3,936,287 | ) | | $ | (484,245 | ) | | $ | (782,920 | ) | |
Net realized gains
(losses) from
investments | | | 18,191,351 | | | | 24,256,089 | | | | 41,593,772 | | | | 28,360,305 | | | | 8,611,406 | | | | 16,158,866 | | |
Net change in
unrealized
appreciation/
depreciation on
investments | | | 14,779,857 | | | | 59,111,905 | | | | (24,189,804 | ) | | | 150,652,970 | | | | (6,089,626 | ) | | | 7,993,132 | | |
Change in net assets resulting
from operations | | | 31,983,177 | | | | 82,430,254 | | | | 14,636,558 | | | | 175,076,988 | | | | 2,037,535 | | | | 23,369,078 | | |
Distributions to Shareholders: | |
Class A | | | — | | | | (23,219,855 | ) | | | — | | | | (18,144,054 | ) | | | — | | | | (14,114,946 | ) | |
Class C | | | — | | | | (395,459 | ) | | | — | | | | (1,381,276 | ) | | | — | | | | (349,747 | ) | |
Class R | | | — | | | | (39,454 | ) | | | — | | | | (84,683 | ) | | | — | | | | (788,226 | ) | |
Class Y | | | — | | | | (2,406,716 | ) | | | — | | | | (5,656,725 | ) | | | — | | | | (770,522 | ) | |
Member Class (a) | | | — | | | | — | | | | — | | | | — | | | | — | | | | (19,278 | ) | |
Change in net assets resulting
from distributions to
shareholders | | | — | | | | (26,061,484 | ) | | | — | | | | (25,266,738 | ) | | | — | | | | (16,042,719 | ) | |
Change in net assets resulting
from capital transactions | | | (11,152,409 | ) | | | (7,609,479 | ) | | | (21,868,683 | ) | | | 7,415,321 | | | | (4,573,494 | ) | | | 7,918,374 | | |
Change in net assets | | | 20,830,768 | | | | 48,759,291 | | | | (7,232,125 | ) | | | 157,225,571 | | | | (2,535,959 | ) | | | 15,244,733 | | |
Net Assets: | |
Beginning of period | | | 308,413,676 | | | | 259,654,385 | | | | 449,550,561 | | | | 292,324,990 | | | | 85,118,137 | | | | 69,873,404 | | |
End of period | | $ | 329,244,444 | | | $ | 308,413,676 | | | $ | 442,318,436 | | | $ | 449,550,561 | | | $ | 82,582,178 | | | $ | 85,118,137 | | |
(a) Victory RS Small Cap Equity Fund Member Class commenced operations on November 3, 2020.
(continues on next page)
See notes to financial statements.
36
Victory Portfolios | | Statements of Changes in Net Assets | |
(continued)
| | | Victory
RS Growth Fund | | Victory
RS Science and
Technology Fund | | Victory
RS Small Cap Equity Fund | |
| | | Six
Months
Ended
June 30,
2021
(Unaudited) | | Year
Ended
December 31,
2020 | | Six
Months
Ended
June 30,
2021
(Unaudited) | | Year
Ended
December 31,
2020 | | Six
Months
Ended
June 30,
2021
(Unaudited) | | Year
Ended
December 31,
2020 | |
Capital Transactions: | |
Class A | |
Proceeds from shares
issued | | $ | 4,646,482 | | | $ | 6,628,865 | | | $ | 26,847,878 | | | $ | 50,371,770 | | | $ | 3,510,283 | | | $ | 3,788,883 | | |
Distributions reinvested | | | — | | | | 22,517,933 | | | | — | | | | 17,377,233 | | | | — | | | | 13,882,892 | | |
Cost of shares redeemed | | | (12,784,828 | ) | | | (28,523,565 | ) | | | (38,563,792 | ) | | | (52,685,540 | ) | | | (8,435,351 | ) | | | (11,228,707 | ) | |
Total Class A | | $ | (8,138,346 | ) | | $ | 623,233 | | | $ | (11,715,914 | ) | | $ | 15,063,463 | | | $ | (4,925,068 | ) | | $ | 6,443,068 | | |
Class C | |
Proceeds from shares
issued | | $ | 23,723 | | | $ | 364,542 | | | $ | 1,492,191 | | | $ | 2,622,340 | | | $ | 257,897 | | | $ | 86,888 | | |
Distributions reinvested | | | — | | | | 391,789 | | | | — | | | | 1,369,319 | | | | — | | | | 349,747 | | |
Cost of shares redeemed | | | (1,720,057 | ) | | | (1,944,758 | ) | | | (6,347,546 | ) | | | (5,505,843 | ) | | | (282,480 | ) | | | (175,402 | ) | |
Total Class C | | $ | (1,696,334 | ) | | $ | (1,188,427 | ) | | $ | (4,855,355 | ) | | $ | (1,514,184 | ) | | $ | (24,583 | ) | | $ | 261,233 | | |
Class R | |
Proceeds from shares
issued | | $ | 26,165 | | | $ | 42,253 | | | $ | 213,777 | | | $ | 481,852 | | | $ | 76,366 | | | $ | 296,464 | | |
Distributions reinvested | | | — | | | | 39,454 | | | | — | | | | 84,683 | | | | — | | | | 788,226 | | |
Cost of shares redeemed | | | (467 | ) | | | (162,227 | ) | | | (200,404 | ) | | | (378,781 | ) | | | (220,044 | ) | | | (812,095 | ) | |
Total Class R | | $ | 25,698 | | | $ | (80,520 | ) | | $ | 13,373 | | | $ | 187,754 | | | $ | (143,678 | ) | | $ | 272,595 | | |
Class Y | |
Proceeds from shares
issued | | $ | 2,819,931 | | | $ | 2,195,308 | | | $ | 16,666,171 | | | $ | 29,550,096 | | | $ | 331,922 | | | $ | 537,133 | | |
Distributions reinvested | | | — | | | | 2,295,343 | | | | — | | | | 5,344,192 | | | | — | | | | 768,918 | | |
Cost of shares redeemed | | | (4,163,358 | ) | | | (11,454,416 | ) | | | (21,976,958 | ) | | | (41,216,000 | ) | | | (763,341 | ) | | | (589,970 | ) | |
Total Class Y | | $ | (1,343,427 | ) | | $ | (6,963,765 | ) | | $ | (5,310,787 | ) | | $ | (6,321,712 | ) | | $ | (431,419 | ) | | $ | 716,081 | | |
Member Class (a) | |
Proceeds from shares
issued | | $ | — | | | $ | — | | | $ | — | | | $ | — | | | $ | 2,301,161 | | | $ | 241,917 | | |
Distributions reinvested | | | — | | | | — | | | | — | | | | — | | | | — | | | | 19,278 | | |
Cost of shares redeemed | | | — | | | | — | | | | — | | | | — | | | | (1,349,907 | ) | | | (35,798 | ) | |
Total Member Class | | $ | — | | | $ | — | | | $ | — | | | $ | — | | | $ | 951,254 | | | $ | 225,397 | | |
Change in net assets resulting
from capital transactions | | $ | (11,152,409 | ) | | $ | (7,609,479 | ) | | $ | (21,868,683 | ) | | $ | 7,415,321 | | | $ | (4,573,494 | ) | | $ | 7,918,374 | | |
(a) Victory RS Small Cap Equity Fund Member Class commenced operations on November 3, 2020.
(continues on next page)
See notes to financial statements.
37
Victory Portfolios | | Statements of Changes in Net Assets | |
(continued)
| | | Victory
RS Growth Fund | | Victory
RS Science and
Technology Fund | | Victory
RS Small Cap Equity Fund | |
| | | Six
Months
Ended
June 30,
2021
(Unaudited) | | Year
Ended
December 31,
2020 | | Six
Months
Ended
June 30,
2021
(Unaudited) | | Year
Ended
December 31,
2020 | | Six
Months
Ended
June 30,
2021
(Unaudited) | | Year
Ended
December 31,
2020 | |
Share Transactions: | |
Class A | |
Issued | | | 187,590 | | | | 304,224 | | | | 718,697 | | | | 1,824,265 | | | | 194,405 | | | | 210,814 | | |
Reinvested | | | — | | | | 961,073 | | | | — | | | | 489,775 | | | | — | | | | 792,855 | | |
Redeemed | | | (519,851 | ) | | | (1,386,023 | ) | | | (1,053,647 | ) | | | (2,033,344 | ) | | | (472,667 | ) | | | (691,975 | ) | |
Total Class A | | | (332,261 | ) | | | (120,726 | ) | | | (334,950 | ) | | | 280,696 | | | | (278,262 | ) | | | 311,694 | | |
Class C | |
Issued | | | 1,201 | | | | 21,225 | | | | 54,429 | | | | 134,359 | | | | 157,684 | | | | 27,881 | | |
Reinvested | | | — | | | | 21,201 | | | | — | | | | 52,324 | | | | — | | | | 234,729 | | |
Redeemed | | | (88,862 | ) | | | (115,239 | ) | | | (231,792 | ) | | | (293,019 | ) | | | (175,502 | ) | | | (42,161 | ) | |
Total Class C | | | (87,661 | ) | | | (72,813 | ) | | | (177,363 | ) | | | (106,336 | ) | | | (17,818 | ) | | | 220,449 | | |
Class R | |
Issued | | | 1,203 | | | | 2,271 | | | | 6,877 | | | | 21,258 | | | | 5,893 | | | | 25,117 | | |
Reinvested | | | — | | | | 1,903 | | | | — | | | | 2,892 | | | | — | | | | 63,413 | | |
Redeemed | | | (21 | ) | | | (9,571 | ) | | | (6,640 | ) | | | (16,429 | ) | | | (18,297 | ) | | | (61,871 | ) | |
Total Class R | | | 1,182 | | | | (5,397 | ) | | | 237 | | | | 7,721 | | | | (12,404 | ) | | | 26,659 | | |
Class Y | |
Issued | | | 112,312 | | | | 101,213 | | | | 407,979 | | | | 1,024,327 | | | | 18,033 | | | | 33,437 | | |
Reinvested | | | — | | | | 92,966 | | | | — | | | | 137,808 | | | | — | | | | 42,295 | | |
Redeemed | | | (160,861 | ) | | | (570,117 | ) | | | (543,248 | ) | | | (1,487,210 | ) | | | (42,001 | ) | | | (36,200 | ) | |
Total Class Y | | | (48,549 | ) | | | (375,938 | ) | | | (135,269 | ) | | | (325,075 | ) | | | (23,968 | ) | | | 39,532 | | |
Member Class (a) | |
Issued | | | — | | | | — | | | | — | | | | — | | | | 125,652 | | | | 12,775 | | |
Reinvested | | | — | | | | — | | | | — | | | | — | | | | — | | | | 1,100 | | |
Redeemed | | | — | | | | — | | | | — | | | | — | | | | (74,719 | ) | | | (1,764 | ) | |
Total Member Class | | | — | | | | — | | | | — | | | | — | | | | 50,933 | | | | 12,111 | | |
Change in Shares | | | (467,289 | ) | | | (574,874 | ) | | | (647,345 | ) | | | (142,994 | ) | | | (281,519 | ) | | | 610,445 | | |
(a) Victory RS Small Cap Equity Fund Member Class commenced operations on November 3, 2020.
See notes to financial statements.
38
This page is intentionally left blank.
39
Victory Portfolios | | Financial Highlights | |
For a Share Outstanding Throughout Each Period
| | | | | Investment Activities | | Distributions to
Shareholders From | |
| | | Net Asset
Value,
Beginning of
Period | | Net
Investment
Income
(Loss)(a) | | Net
Realized and
Unrealized
Gains
(Losses) on
Investments | | Total from
Investment
Activities | | Net
Investment
Income | | Net Realized
Gains from
Investments | |
Victory RS Small Cap Growth Fund | |
Class A | |
Six Months Ended
June 30, 2021
(Unaudited) | | $ | 97.45 | | | | (0.62 | ) | | | 0.92 | | | | 0.30 | | | | — | | | | — | | |
Year Ended: | |
December 31, 2020 | | $ | 77.19 | | | | (0.97 | ) | | | 30.04 | | | | 29.07 | | | | — | | | | (8.81 | ) | |
December 31, 2019 | | $ | 61.11 | | | | (0.80 | ) | | | 23.84 | | | | 23.04 | | | | — | | | | (6.96 | ) | |
December 31, 2018 | | $ | 80.96 | | | | (0.83 | ) | | | (6.54 | ) | | | (7.37 | ) | | | — | | | | (12.48 | ) | |
December 31, 2017 | | $ | 65.31 | | | | (0.75 | ) | | | 24.13 | | | | 23.38 | | | | — | | | | (7.73 | ) | |
December 31, 2016 | | $ | 64.73 | | | | (0.55 | ) | | | 1.13 | | | | 0.58 | | | | — | | | | — | | |
Class C | |
Six Months Ended
June 30, 2021
(Unaudited) | | $ | 79.07 | | | | (0.81 | ) | | | 0.76 | | | | (0.05 | ) | | | — | | | | — | | |
Year Ended: | |
December 31, 2020 | | $ | 64.34 | | | | (1.30 | ) | | | 24.84 | | | | 23.54 | | | | — | | | | (8.81 | ) | |
December 31, 2019 | | $ | 52.19 | | | | (1.17 | ) | | | 20.28 | | | | 19.11 | | | | — | | | | (6.96 | ) | |
December 31, 2018 | | $ | 71.70 | | | | (1.31 | ) | | | (5.72 | ) | | | (7.03 | ) | | | — | | | | (12.48 | ) | |
December 31, 2017 | | $ | 58.97 | | | | (1.18 | ) | | | 21.64 | | | | 20.46 | | | | — | | | | (7.73 | ) | |
December 31, 2016 | | $ | 58.90 | | | | (0.90 | ) | | | 0.97 | | | | 0.07 | | | | — | | | | — | | |
Class R | |
Six Months Ended
June 30, 2021
(Unaudited) | | $ | 86.56 | | | | (0.70 | ) | | | 0.83 | | | | 0.13 | | | | — | | | | — | | |
Year Ended: | |
December 31, 2020 | | $ | 69.61 | | | | (1.20 | ) | | | 26.96 | | | | 25.76 | | | | — | | | | (8.81 | ) | |
December 31, 2019 | | $ | 55.87 | | | | (1.05 | ) | | | 21.75 | | | | 20.70 | | | | — | | | | (6.96 | ) | |
December 31, 2018 | | $ | 75.55 | | | | (1.15 | ) | | | (6.05 | ) | | | (7.20 | ) | | | — | | | | (12.48 | ) | |
December 31, 2017 | | $ | 61.63 | | | | (1.04 | ) | | | 22.69 | | | | 21.65 | | | | — | | | | (7.73 | ) | |
December 31, 2016 | | $ | 61.27 | | | | (0.68 | ) | | | 1.04 | | | | 0.36 | | | | — | | | | — | | |
Class R6 | |
Six Months Ended
June 30, 2021
(Unaudited) | | $ | 103.42 | | | | (0.47 | ) | | | 0.97 | | | | 0.50 | | | | — | | | | — | | |
Year Ended: | |
December 31, 2020 | | $ | 81.24 | | | | (0.73 | ) | | | 31.72 | | | | 30.99 | | | | — | | | | (8.81 | ) | |
December 31, 2019 | | $ | 63.83 | | | | (0.58 | ) | | | 24.95 | | | | 24.37 | | | | — | | | | (6.96 | ) | |
December 31, 2018 | | $ | 83.67 | | | | (0.58 | ) | | | (6.78 | ) | | | (7.36 | ) | | | — | | | | (12.48 | ) | |
July 12, 2017(e)
through
December 31, 2017 | | $ | 79.23 | | | | (0.41 | ) | | | 12.58 | | | | 12.17 | | | | — | | | | (7.73 | ) | |
(a) Per share net investment income (loss) has been calculated using the average daily shares method.
(b) Not annualized for periods less than one year.
(c) Annualized for periods less than one year.
(d) Portfolio turnover is calculated on the basis of the Fund as a whole without distinguishing between the classes of shares issued.
(e) Commencement of operations.
See notes to financial statements.
40
Victory Portfolios | | Financial Highlights — continued | |
For a Share Outstanding Throughout Each Period
| | | | | Ratios to Average Net Assets | | Supplemental Data | |
| | |
Total
Distributions | | Net Asset
Value,
End of
Period | | Total
Return
(Excludes
Sales
Charge)(b) | | Net
Expenses(c) | | Net
Investment
Income
(Loss)(c) | | Gross
Expenses(c) | | Net Assets,
End of
Period
(000's) | | Portfolio
Turnover(b)(d) | |
Victory RS Small Cap Growth Fund | |
Class A | |
Six Months Ended
June 30, 2021
(Unaudited) | | | — | | | $ | 97.75 | | | | 0.27 | % | | | 1.40 | % | | | (1.27 | )% | | | 1.42 | % | | $ | 790,943 | | | | 48 | % | |
Year Ended: | |
December 31, 2020 | | | (8.81 | ) | | $ | 97.45 | | | | 37.84 | % | | | 1.40 | % | | | (1.20 | )% | | | 1.43 | % | | $ | 820,006 | | | | 72 | % | |
December 31, 2019 | | | (6.96 | ) | | $ | 77.19 | | | | 37.91 | % | | | 1.40 | % | | | (1.06 | )% | | | 1.44 | % | | $ | 687,425 | | | | 100 | % | |
December 31, 2018 | | | (12.48 | ) | | $ | 61.11 | | | | (8.97 | )% | | | 1.40 | % | | | (0.94 | )% | | | 1.45 | % | | $ | 499,350 | | | | 86 | % | |
December 31, 2017 | | | (7.73 | ) | | $ | 80.96 | | | | 36.86 | % | | | 1.40 | % | | | (1.00 | )% | | | 1.44 | % | | $ | 575,227 | | | | 107 | % | |
December 31, 2016 | | | — | | | $ | 65.31 | | | | 0.90 | % | | | 1.40 | % | | | (0.92 | )% | | | 1.45 | % | | $ | 481,125 | | | | 91 | % | |
Class C | |
Six Months Ended
June 30, 2021
(Unaudited) | | | — | | | $ | 79.02 | | | | (0.10 | )% | | | 2.16 | % | | | (2.04 | )% | | | 2.17 | % | | $ | 15,385 | | | | 48 | % | |
Year Ended: | |
December 31, 2020 | | | (8.81 | ) | | $ | 79.07 | | | | 36.78 | % | | | 2.16 | % | | | (1.96 | )% | | | 2.26 | % | | $ | 20,323 | | | | 72 | % | |
December 31, 2019 | | | (6.96 | ) | | $ | 64.34 | | | | 36.88 | % | | | 2.16 | % | | | (1.82 | )% | | | 2.27 | % | | $ | 18,581 | | | | 100 | % | |
December 31, 2018 | | | (12.48 | ) | | $ | 52.19 | | | | (9.66 | )% | | | 2.16 | % | | | (1.71 | )% | | | 2.26 | % | | $ | 13,602 | | | | 86 | % | |
December 31, 2017 | | | (7.73 | ) | | $ | 71.70 | | | | 35.84 | % | | | 2.16 | % | | | (1.75 | )% | | | 2.23 | % | | $ | 13,633 | | | | 107 | % | |
December 31, 2016 | | | — | | | $ | 58.97 | | | | 0.12 | % | | | 2.16 | % | | | (1.67 | )% | | | 2.22 | % | | $ | 13,035 | | | | 91 | % | |
Class R | |
Six Months Ended
June 30, 2021
(Unaudited) | | | — | | | $ | 86.69 | | | | 0.10 | % | | | 1.73 | % | | | (1.61 | )% | | | 1.73 | % | | $ | 7,641 | | | | 48 | % | |
Year Ended: | |
December 31, 2020 | | | (8.81 | ) | | $ | 86.56 | | | | 37.20 | % | | | 1.86 | % | | | (1.66 | )% | | | 1.97 | % | | $ | 8,513 | | | | 72 | % | |
December 31, 2019 | | | (6.96 | ) | | $ | 69.61 | | | | 37.28 | % | | | 1.86 | % | | | (1.52 | )% | | | 1.93 | % | | $ | 8,012 | | | | 100 | % | |
December 31, 2018 | | | (12.48 | ) | | $ | 55.87 | | | | (9.39 | )% | | | 1.86 | % | | | (1.40 | )% | | | 1.87 | % | | $ | 7,285 | | | | 86 | % | |
December 31, 2017 | | | (7.73 | ) | | $ | 75.55 | | | | 36.24 | % | | | 1.86 | % | | | (1.46 | )% | | | 1.94 | % | | $ | 7,698 | | | | 107 | % | |
December 31, 2016 | | | — | | | $ | 61.63 | | | | 0.59 | % | | | 1.70 | % | | | (1.20 | )% | | | 1.70 | % | | $ | 5,371 | | | | 91 | % | |
Class R6 | |
Six Months Ended
June 30, 2021
(Unaudited) | | | — | | | $ | 103.92 | | | | 0.44 | % | | | 1.04 | % | | | (0.91 | )% | | | 1.04 | % | | $ | 720,575 | | | | 48 | % | |
Year Ended: | |
December 31, 2020 | | | (8.81 | ) | | $ | 103.42 | | | | 38.32 | % | | | 1.06 | % | | | (0.86 | )% | | | 1.06 | % | | $ | 677,128 | | | | 72 | % | |
December 31, 2019 | | | (6.96 | ) | | $ | 81.24 | | | | 38.38 | % | | | 1.06 | % | | | (0.72 | )% | | | 1.06 | % | | $ | 441,471 | | | | 100 | % | |
December 31, 2018 | | | (12.48 | ) | | $ | 63.83 | | | | (8.66 | )% | | | 1.06 | % | | | (0.64 | )% | | | 1.10 | % | | $ | 113,288 | | | | 86 | % | |
July 12, 2017(e)
through
December 31, 2017 | | | (7.73 | ) | | $ | 83.67 | | | | 16.23 | % | | | 1.06 | % | | | (1.03 | )% | | | 1.41 | % | | $ | 25,551 | | | | 107 | % | |
(continues on next page)
See notes to financial statements.
41
Victory Portfolios | | Financial Highlights | |
For a Share Outstanding Throughout Each Period
| | | | | Investment Activities | | Distributions to
Shareholders From | |
| | | Net Asset
Value,
Beginning of
Period | | Net
Investment
Income
(Loss)(a) | | Net
Realized and
Unrealized
Gains
(Losses) on
Investments | | Total from
Investment
Activities | | Net
Investment
Income | | Net Realized
Gains from
Investments | |
Victory RS Small Cap Growth Fund | |
Class Y | |
Six Months Ended
June 30, 2021
(Unaudited) | | $ | 103.10 | | | | (0.52 | ) | | | 0.97 | | | | 0.45 | | | | — | | | | — | | |
Year Ended: | |
December 31, 2020 | | $ | 81.06 | | | | (0.79 | ) | | | 31.64 | | | | 30.85 | | | | — | | | | (8.81 | ) | |
December 31, 2019 | | $ | 63.75 | | | | (0.62 | ) | | | 24.89 | | | | 24.27 | | | | — | | | | (6.96 | ) | |
December 31, 2018 | | $ | 83.64 | | | | (0.61 | ) | | | (6.80 | ) | | | (7.41 | ) | | | — | | | | (12.48 | ) | |
December 31, 2017 | | $ | 67.08 | | | | (0.53 | ) | | | 24.82 | | | | 24.29 | | | | — | | | | (7.73 | ) | |
December 31, 2016 | | $ | 66.32 | | | | (0.39 | ) | | | 1.16 | | | | 0.77 | | | | (0.01 | ) | | | — | | |
(a) Per share net investment income (loss) has been calculated using the average daily shares method.
(b) Not annualized for periods less than one year.
(c) Annualized for periods less than one year.
(d) Portfolio turnover is calculated on the basis of the Fund as a whole without distinguishing between the classes of shares issued.
See notes to financial statements.
42
Victory Portfolios | | Financial Highlights — continued | |
For a Share Outstanding Throughout Each Period (continued)
| | | | | Ratios to Average Net Assets | | Supplemental Data | |
| | |
Total
Distributions | | Net Asset
Value,
End of
Period | | Total
Return(b) | | Net
Expenses(c) | | Net
Investment
Income
(Loss)(c) | | Gross
Expenses(c) | | Net Assets,
End of
Period
(000's) | | Portfolio
Turnover(b)(d) | |
Victory RS Small Cap Growth Fund | |
Class Y | |
Six Months Ended
June 30, 2021
(Unaudited) | | | — | | | $ | 103.55 | | | | 0.40 | % | | | 1.13 | % | | | (1.00 | )% | | | 1.14 | % | | $ | 1,355,687 | | | | 48 | % | |
Year Ended: | |
December 31, 2020 | | | (8.81 | ) | | $ | 103.10 | | | | 38.21 | % | | | 1.13 | % | | | (0.93 | )% | | | 1.15 | % | | $ | 1,411,316 | | | | 72 | % | |
December 31, 2019 | | | (6.96 | ) | | $ | 81.06 | | | | 38.29 | % | | | 1.13 | % | | | (0.79 | )% | | | 1.15 | % | | $ | 1,131,648 | | | | 100 | % | |
December 31, 2018 | | | (12.48 | ) | | $ | 63.75 | | | | (8.72 | )% | | | 1.13 | % | | | (0.67 | )% | | | 1.15 | % | | $ | 967,112 | | | | 86 | % | |
December 31, 2017 | | | (7.73 | ) | | $ | 83.64 | | | | 37.23 | % | | | 1.13 | % | | | (0.68 | )% | | | 1.17 | % | | $ | 1,081,427 | | | | 107 | % | |
December 31, 2016 | | | (0.01 | ) | | $ | 67.08 | | | | 1.16 | % | | | 1.13 | % | | | (0.64 | )% | | | 1.21 | % | | $ | 1,379,669 | | | | 91 | % | |
See notes to financial statements.
43
Victory Portfolios | | Financial Highlights | |
For a Share Outstanding Throughout Each Period
| | | | Investment Activities | | Distributions
to
Shareholders
From | | | |
| | | Net Asset
Value,
Beginning of
Period | | Net
Investment
Income
(Loss)(a) | | Net
Realized and
Unrealized
Gains
(Losses) on
Investments | | Total from
Investment
Activities | | Net Realized
Gains from
Investments | |
Total
Distributions | | Net Asset
Value,
End of
Period | | Total
Return
(Excludes
Sales
Charge)(b) | |
Victory RS Select Growth Fund | |
Class A | |
Six Months Ended June 30, 2021
(Unaudited) | | $ | 38.19 | | | | (0.23 | ) | | | 3.51 | | | | 3.28 | | | | — | | | | — | | | $ | 41.47 | | | | 8.59 | % | |
Year Ended: | |
December 31, 2020 | | $ | 33.81 | | | | (0.40 | ) | | | 11.43 | | | | 11.03 | | | | (6.65 | ) | | | (6.65 | ) | | $ | 38.19 | | | | 33.22 | % | |
December 31, 2019 | | $ | 28.96 | | | | (0.37 | ) | | | 9.68 | | | | 9.31 | | | | (4.46 | ) | | | (4.46 | ) | | $ | 33.81 | | | | 32.29 | % | |
December 31, 2018 | | $ | 46.03 | | | | (0.42 | ) | | | (3.12 | ) | | | (3.54 | ) | | | (13.53 | ) | | | (13.53 | ) | | $ | 28.96 | | | | (7.23 | )% | |
December 31, 2017 | | $ | 45.04 | | | | (0.43 | ) | | | 8.16 | | | | 7.73 | | | | (6.74 | ) | | | (6.74 | ) | | $ | 46.03 | | | | 17.10 | % | |
December 31, 2016 | | $ | 43.54 | | | | (0.32 | ) | | | 3.30 | | | | 2.98 | | | | (1.48 | ) | | | (1.48 | ) | | $ | 45.04 | | | | 6.85 | % | |
Class C | |
Six Months Ended June 30, 2021
(Unaudited) | | $ | 28.54 | | | | (0.29 | ) | | | 2.62 | | | | 2.33 | | | | — | | | | — | | | $ | 30.87 | | | | 8.16 | % | |
Year Ended: | |
December 31, 2020 | | $ | 26.77 | | | | (0.53 | ) | | | 8.95 | | | | 8.42 | | | | (6.65 | ) | | | (6.65 | ) | | $ | 28.54 | | | | 32.20 | % | |
December 31, 2019 | | $ | 23.82 | | | | (0.53 | ) | | | 7.94 | | | | 7.41 | | | | (4.46 | ) | | | (4.46 | ) | | $ | 26.77 | | | | 31.28 | % | |
December 31, 2018 | | $ | 40.80 | | | | (0.70 | ) | | | (2.75 | ) | | | (3.45 | ) | | | (13.53 | ) | | | (13.53 | ) | | $ | 23.82 | | | | (7.98 | )% | |
December 31, 2017 | | $ | 40.89 | | | | (0.73 | ) | | | 7.38 | | | | 6.65 | | | | (6.74 | ) | | | (6.74 | ) | | $ | 40.80 | | | | 16.19 | % | |
December 31, 2016 | | $ | 39.97 | | | | (0.60 | ) | | | 3.00 | | | | 2.40 | | | | (1.48 | ) | | | (1.48 | ) | | $ | 40.89 | | | | 6.04 | % | |
Class R | |
Six Months Ended June 30, 2021
(Unaudited) | | $ | 29.34 | | | | (0.26 | ) | | | 2.69 | | | | 2.43 | | | | — | | | | — | | | $ | 31.77 | | | | 8.28 | % | |
Year Ended: | |
December 31, 2020 | | $ | 27.30 | | | | (0.46 | ) | | | 9.15 | | | | 8.69 | | | | (6.65 | ) | | | (6.65 | ) | | $ | 29.34 | | | | 32.57 | % | |
December 31, 2019 | | $ | 24.16 | | | | (0.45 | ) | | | 8.05 | | | | 7.60 | | | | (4.46 | ) | | | (4.46 | ) | | $ | 27.30 | | | | 31.63 | % | |
December 31, 2018 | | $ | 41.06 | | | | (0.59 | ) | | | (2.78 | ) | | | (3.37 | ) | | | (13.53 | ) | | | (13.53 | ) | | $ | 24.16 | | | | (7.70 | )% | |
December 31, 2017 | | $ | 41.00 | | | | (0.61 | ) | | | 7.41 | | | | 6.80 | | | | (6.74 | ) | | | (6.74 | ) | | $ | 41.06 | | | | 16.51 | % | |
December 31, 2016 | | $ | 39.93 | | | | (0.46 | ) | | | 3.01 | | | | 2.55 | | | | (1.48 | ) | | | (1.48 | ) | | $ | 41.00 | | | | 6.39 | % | |
Class R6 | |
Six Months Ended June 30, 2021
(Unaudited) | | $ | 41.25 | | | | (0.18 | ) | | | 3.79 | | | | 3.61 | | | | — | | | | — | | | $ | 44.86 | | | | 8.75 | % | |
Year Ended: | |
December 31, 2020 | | $ | 35.99 | | | | (0.31 | ) | | | 12.22 | | | | 11.91 | | | | (6.65 | ) | | | (6.65 | ) | | $ | 41.25 | | | | 33.65 | % | |
December 31, 2019 | | $ | 30.50 | | | | (0.27 | ) | | | 10.22 | | | | 9.95 | | | | (4.46 | ) | | | (4.46 | ) | | $ | 35.99 | | | | 32.76 | % | |
December 31, 2018 | | $ | 47.53 | | | | (0.29 | ) | | | (3.21 | ) | | | (3.50 | ) | | | (13.53 | ) | | | (13.53 | ) | | $ | 30.50 | | | | (6.92 | )% | |
December 31, 2017 | | $ | 46.16 | | | | (0.28 | ) | | | 8.39 | | | | 8.11 | | | | (6.74 | ) | | | (6.74 | ) | | $ | 47.53 | | | | 17.48 | % | |
November 15, 2016(e)
through
December 31, 2016 | | $ | 46.65 | | | | (0.03 | ) | | | 1.02 | | | | 0.99 | | | | (1.48 | ) | | | (1.48 | ) | | $ | 46.16 | | | | 2.15 | % | |
(a) Per share net investment income (loss) has been calculated using the average daily shares method.
(b) Not annualized for periods less than one year.
(c) Annualized for periods less than one year.
(d) Portfolio turnover is calculated on the basis of the Fund as a whole without distinguishing between the classes of shares issued.
(e) Commencement of operations.
See notes to financial statements.
44
Victory Portfolios | | Financial Highlights — continued | |
For a Share Outstanding Throughout Each Period
| | | Ratios to Average Net Assets | | Supplemental Data | |
| | | Net
Expenses(c) | | Net
Investment
Income
(Loss)(c) | | Gross
Expenses(c) | | Net Assets,
End of
Period
(000's) | | Portfolio
Turnover(b)(d) | |
Victory RS Select Growth Fund | |
Class A | |
Six Months Ended June 30, 2021
(Unaudited) | | | 1.40 | % | | | (1.18 | )% | | | 1.47 | % | | $ | 126,788 | | | | 42 | % | |
Year Ended: | |
December 31, 2020 | | | 1.40 | % | | | (1.14 | )% | | | 1.49 | % | | $ | 115,014 | | | | 73 | % | |
December 31, 2019 | | | 1.40 | % | | | (1.06 | )% | | | 1.52 | % | | $ | 97,337 | | | | 74 | % | |
December 31, 2018 | | | 1.40 | % | | | (0.86 | )% | | | 1.50 | % | | $ | 94,393 | | | | 79 | % | |
December 31, 2017 | | | 1.40 | % | | | (0.88 | )% | | | 1.49 | % | | $ | 147,531 | | | | 69 | % | |
December 31, 2016 | | | 1.40 | % | | | (0.74 | )% | | | 1.47 | % | | $ | 170,825 | | | | 89 | % | |
Class C | |
Six Months Ended June 30, 2021
(Unaudited) | | | 2.18 | % | | | (1.97 | )% | | | 2.27 | % | | $ | 16,089 | | | | 42 | % | |
Year Ended: | |
December 31, 2020 | | | 2.18 | % | | | (1.92 | )% | | | 2.29 | % | | $ | 23,831 | | | | 73 | % | |
December 31, 2019 | | | 2.18 | % | | | (1.84 | )% | | | 2.30 | % | | $ | 26,988 | | | | 74 | % | |
December 31, 2018 | | | 2.18 | % | | | (1.64 | )% | | | 2.25 | % | | $ | 31,754 | | | | 79 | % | |
December 31, 2017 | | | 2.18 | % | | | (1.66 | )% | | | 2.24 | % | | $ | 51,208 | | | | 69 | % | |
December 31, 2016 | | | 2.18 | % | | | (1.52 | )% | | | 2.23 | % | | $ | 63,841 | | | | 89 | % | |
Class R | |
Six Months Ended June 30, 2021
(Unaudited) | | | 1.91 | % | | | (1.70 | )% | | | 2.67 | % | | $ | 440 | | | | 42 | % | |
Year Ended: | |
December 31, 2020 | | | 1.91 | % | | | (1.64 | )% | | | 5.35 | % | | $ | 504 | | | | 73 | % | |
December 31, 2019 | | | 1.91 | % | | | (1.57 | )% | | | 4.35 | % | | $ | 604 | | | | 74 | % | |
December 31, 2018 | | | 1.91 | % | | | (1.38 | )% | | | 3.60 | % | | $ | 701 | | | | 79 | % | |
December 31, 2017 | | | 1.91 | % | | | (1.39 | )% | | | 2.90 | % | | $ | 1,014 | | | | 69 | % | |
December 31, 2016 | | | 1.82 | % | | | (1.17 | )% | | | 1.82 | % | | $ | 1,440 | | | | 89 | % | |
Class R6 | |
Six Months Ended June 30, 2021
(Unaudited) | | | 1.06 | % | | | (0.85 | )% | | | 1.95 | % | | $ | 1,199 | | | | 42 | % | |
Year Ended: | |
December 31, 2020 | | | 1.06 | % | | | (0.80 | )% | | | 4.52 | % | | $ | 710 | | | | 73 | % | |
December 31, 2019 | | | 1.06 | % | | | (0.72 | )% | | | 5.46 | % | | $ | 302 | | | | 74 | % | |
December 31, 2018 | | | 1.06 | % | | | (0.59 | )% | | | 6.33 | % | | $ | 239 | | | | 79 | % | |
December 31, 2017 | | | 1.06 | % | | | (0.55 | )% | | | 27.47 | % | | $ | 151 | | | | 69 | % | |
November 15, 2016(e)
through
December 31, 2016 | | | 1.06 | % | | | (0.43 | )% | | | 26.37 | % | | $ | 51 | | | | 89 | % | |
See notes to financial statements.
45
Victory Portfolios | | Financial Highlights | |
For a Share Outstanding Throughout Each Period
| | | | | Investment Activities | | Distributions
to
Shareholders
From | | | |
| | | Net Asset
Value,
Beginning of
Period | | Net
Investment
Income
(Loss)(a) | | Net
Realized and
Unrealized
Gains
(Losses) on
Investments | | Total from
Investment
Activities | | Net Realized
Gains from
Investments | |
Total
Distributions | | Net Asset
Value,
End of
Period | | Total
Return(b) | |
Victory RS Select Growth Fund | |
Class Y | |
Six Months Ended June 30, 2021
(Unaudited) | | $ | 41.02 | | | | (0.20 | ) | | | 3.77 | | | | 3.57 | | | | — | | | | — | | | $ | 44.59 | | | | 8.70 | % | |
Year Ended: | |
December 31, 2020 | | $ | 35.84 | | | | (0.33 | ) | | | 12.16 | | | | 11.83 | | | | (6.65 | ) | | | (6.65 | ) | | $ | 41.02 | | | | 33.57 | % | |
December 31, 2019 | | $ | 30.41 | | | | (0.29 | ) | | | 10.18 | | | | 9.89 | | | | (4.46 | ) | | | (4.46 | ) | | $ | 35.84 | | | | 32.66 | % | |
December 31, 2018 | | $ | 47.47 | | | | (0.30 | ) | | | (3.23 | ) | | | (3.53 | ) | | | (13.53 | ) | | | (13.53 | ) | | $ | 30.41 | | | | (7.02 | )% | |
December 31, 2017 | | $ | 46.15 | | | | (0.31 | ) | | | 8.37 | | | | 8.06 | | | | (6.74 | ) | | | (6.74 | ) | | $ | 47.47 | | | | 17.40 | % | |
December 31, 2016 | | $ | 44.47 | | | | (0.21 | ) | | | 3.37 | | | | 3.16 | | | | (1.48 | ) | | | (1.48 | ) | | $ | 46.15 | | | | 7.13 | % | |
(a) Per share net investment income (loss) has been calculated using the average daily shares method.
(b) Not annualized for periods less than one year.
(c) Annualized for periods less than one year.
(d) Portfolio turnover is calculated on the basis of the Fund as a whole without distinguishing between the classes of shares issued.
See notes to financial statements.
46
Victory Portfolios | | Financial Highlights — continued | |
For a Share Outstanding Throughout Each Period (continued)
| | | Ratios to Average Net Assets | | Supplemental Data | |
| | | Net
Expenses(c) | | Net
Investment
Income
(Loss)(c) | | Gross
Expenses(c) | | Net Assets,
End of
Period
(000's) | | Portfolio
Turnover(b)(d) | |
Victory RS Select Growth Fund | |
Class Y | |
Six Months Ended June 30, 2021
(Unaudited) | | | 1.14 | % | | | (0.93 | )% | | | 1.21 | % | | $ | 89,202 | | | | 42 | % | |
Year Ended: | |
December 31, 2020 | | | 1.14 | % | | | (0.88 | )% | | | 1.24 | % | | $ | 93,844 | | | | 73 | % | |
December 31, 2019 | | | 1.14 | % | | | (0.80 | )% | | | 1.23 | % | | $ | 94,933 | | | | 74 | % | |
December 31, 2018 | | | 1.14 | % | | | (0.59 | )% | | | 1.21 | % | | $ | 120,696 | | | | 79 | % | |
December 31, 2017 | | | 1.14 | % | | | (0.62 | )% | | | 1.20 | % | | $ | 244,689 | | | | 69 | % | |
December 31, 2016 | | | 1.14 | % | | | (0.49 | )% | | | 1.20 | % | | $ | 287,970 | | | | 89 | % | |
See notes to financial statements.
47
Victory Portfolios | | Financial Highlights | |
For a Share Outstanding Throughout Each Period
| | | | Investment Activities | | Distributions to
Shareholders From | |
| | | Net Asset
Value,
Beginning of
Period | | Net
Investment
Income
(Loss)(a) | | Net Realized
and Unrealized
Gains (Losses)
on Investments | | Total from
Investment
Activities | | Net Realized
Gains from
Investments | | Return of
Capital | |
Victory RS Mid Cap Growth Fund | |
Class A | |
Six Months Ended
June 30, 2021
(Unaudited) | | $ | 32.99 | | | | (0.16 | ) | | | 2.36 | | | | 2.20 | | | | (1.42 | ) | | | — | | |
Year Ended: | |
December 31, 2020 | | $ | 25.56 | | | | (0.20 | ) | | | 8.98 | | | | 8.78 | | | | (1.35 | ) | | | — | | |
December 31, 2019 | | $ | 19.96 | | | | (0.17 | ) | | | 5.77 | | | | 5.60 | | | | — | | | | — | | |
December 31, 2018 | | $ | 25.77 | | | | (0.14 | ) | | | (1.79 | ) | | | (1.93 | ) | | | (3.00 | ) | | | (0.88 | ) | |
December 31, 2017 | | $ | 21.32 | | | | (0.10 | ) | | | 4.55 | | | | 4.45 | | | | — | | | | — | | |
December 31, 2016 | | $ | 20.29 | | | | (0.07 | ) | | | 1.10 | | | | 1.03 | | | | — | | | | — | | |
Class C | |
Six Months Ended
June 30, 2021
(Unaudited) | | $ | 28.05 | | | | (0.25 | ) | | | 1.99 | | | | 1.74 | | | | (1.42 | ) | | | — | | |
Year Ended: | |
December 31, 2020 | | $ | 22.08 | | | | (0.38 | ) | | | 7.70 | | | | 7.32 | | | | (1.35 | ) | | | — | | |
December 31, 2019 | | $ | 17.40 | | | | (0.34 | ) | | | 5.02 | | | | 4.68 | | | | — | | | | — | | |
December 31, 2018 | | $ | 23.22 | | | | (0.35 | ) | | | (1.59 | ) | | | (1.94 | ) | | | (3.65 | ) | | | (0.23 | ) | |
December 31, 2017 | | $ | 19.38 | | | | (0.28 | ) | | | 4.12 | | | | 3.84 | | | | — | | | | — | | |
December 31, 2016 | | $ | 18.61 | | | | (0.23 | ) | | | 1.00 | | | | 0.77 | | | | — | | | | — | | |
Class R | |
Six Months Ended
June 30, 2021
(Unaudited) | | $ | 29.79 | | | | (0.23 | ) | | | 2.12 | | | | 1.89 | | | | (1.42 | ) | | | — | | |
Year Ended: | |
December 31, 2020 | | $ | 23.32 | | | | (0.33 | ) | | | 8.15 | | | | 7.82 | | | | (1.35 | ) | | | — | | |
December 31, 2019 | | $ | 18.31 | | | | (0.28 | ) | | | 5.29 | | | | 5.01 | | | | — | | | | — | | |
December 31, 2018 | | $ | 24.14 | | | | (0.29 | ) | | | (1.66 | ) | | | (1.95 | ) | | | (3.86 | ) | | | (0.02 | ) | |
December 31, 2017 | | $ | 20.09 | | | | (0.23 | ) | | | 4.28 | | | | 4.05 | | | | — | | | | — | | |
December 31, 2016 | | $ | 19.22 | | | | (0.16 | ) | | | 1.03 | | | | 0.87 | | | | — | | | | — | | |
(a) Per share net investment income (loss) has been calculated using the average daily shares method.
(b) Not annualized for periods less than one year.
(c) Annualized for periods less than one year.
(d) Portfolio turnover is calculated on the basis of the Fund as a whole without distinguishing between the classes of shares issued.
See notes to financial statements.
48
Victory Portfolios | | Financial Highlights — continued | |
For a Share Outstanding Throughout Each Period
| | | | | Ratios to Average Net Assets | | Supplemental Data | |
| | | Total
Distributions | | Net Asset
Value,
End of
Period | | Total
Return
(Excludes
Sales
Charge)(b) | | Net
Expenses(c) | | Net
Investment
Income
(Loss)(c) | | Gross
Expenses(c) | | Net Assets,
End of
Period
(000's) | | Portfolio
Turnover(b)(d) | |
Victory RS Mid Cap Growth Fund | |
Class A | |
Six Months Ended
June 30, 2021
(Unaudited) | | | (1.42 | ) | | $ | 33.77 | | | | 6.64 | % | | | 1.20 | % | | | (0.98 | )% | | | 1.35 | % | | $ | 95,161 | | | | 41 | % | |
Year Ended: | |
December 31, 2020 | | | (1.35 | ) | | $ | 32.99 | | | | 34.47 | % | | | 1.20 | % | | | (0.75 | )% | | | 1.35 | % | | $ | 93,072 | | | | 92 | % | |
December 31, 2019 | | | — | | | $ | 25.56 | | | | 28.06 | % | | | 1.20 | % | | | (0.67 | )% | | | 1.35 | % | | $ | 82,888 | | | | 86 | % | |
December 31, 2018 | | | (3.88 | ) | | $ | 19.96 | | | | (7.37 | )% | | | 1.20 | % | | | (0.53 | )% | | | 1.34 | % | | $ | 75,451 | | | | 126 | % | |
December 31, 2017 | | | — | | | $ | 25.77 | | | | 20.87 | % | | | 1.20 | % | | | (0.44 | )% | | | 1.29 | % | | $ | 108,271 | | | | 86 | % | |
December 31, 2016 | | | — | | | $ | 21.32 | | | | 5.08 | % | | | 1.20 | % | | | (0.35 | )% | | | 1.27 | % | | $ | 231,056 | | | | 138 | % | |
Class C | |
Six Months Ended
June 30, 2021
(Unaudited) | | | (1.42 | ) | | $ | 28.37 | | | | 6.16 | % | | | 2.06 | % | | | (1.83 | )% | | | 2.06 | % | | $ | 15,585 | | | | 41 | % | |
Year Ended: | |
December 31, 2020 | | | (1.35 | ) | | $ | 28.05 | | | | 33.30 | % | | | 2.11 | % | | | (1.65 | )% | | | 2.14 | % | | $ | 17,325 | | | | 92 | % | |
December 31, 2019 | | | — | | | $ | 22.08 | | | | 26.90 | % | | | 2.11 | % | | | (1.58 | )% | | | 2.12 | % | | $ | 20,266 | | | | 86 | % | |
December 31, 2018 | | | (3.88 | ) | | $ | 17.40 | | | | (8.23 | )% | | | 2.11 | % | | | (1.44 | )% | | | 2.12 | % | | $ | 18,072 | | | | 126 | % | |
December 31, 2017 | | | — | | | $ | 23.22 | | | | 19.81 | % | | | 2.10 | % | | | (1.33 | )% | | | 2.10 | % | | $ | 23,264 | | | | 86 | % | |
December 31, 2016 | | | — | | | $ | 19.38 | | | | 4.14 | % | | | 2.11 | % | | | (1.25 | )% | | | 2.11 | % | | $ | 24,618 | | | | 138 | % | |
Class R | |
Six Months Ended
June 30, 2021
(Unaudited) | | | (1.42 | ) | | $ | 30.26 | | | | 6.30 | % | | | 1.80 | % | | | (1.58 | )% | | | 2.32 | % | | $ | 633 | | | | 41 | % | |
Year Ended: | |
December 31, 2020 | | | (1.35 | ) | | $ | 29.79 | | | | 33.67 | % | | | 1.80 | % | | | (1.34 | )% | | | 4.13 | % | | $ | 596 | | | | 92 | % | |
December 31, 2019 | | | — | | | $ | 23.32 | | | | 27.36 | % | | | 1.80 | % | | | (1.26 | )% | | | 3.41 | % | | $ | 927 | | | | 86 | % | |
December 31, 2018 | | | (3.88 | ) | | $ | 18.31 | | | | (7.99 | )% | | | 1.80 | % | | | (1.13 | )% | | | 2.68 | % | | $ | 1,144 | | | | 126 | % | |
December 31, 2017 | | | — | | | $ | 24.14 | | | | 20.21 | % | | | 1.80 | % | | | (1.03 | )% | | | 2.43 | % | | $ | 1,685 | | | | 86 | % | |
December 31, 2016 | | | — | | | $ | 20.09 | | | | 4.53 | % | | | 1.69 | % | | | (0.84 | )% | | | 1.69 | % | | $ | 1,486 | | | | 138 | % | |
See notes to financial statements.
49
Victory Portfolios | | Financial Highlights | |
For a Share Outstanding Throughout Each Period
| | | | Investment Activities | | Distributions to
Shareholders From | |
| | | Net Asset
Value,
Beginning of
Period | | Net
Investment
Income
(Loss)(a) | | Net Realized
and Unrealized
Gains (Losses)
on Investments | | Total from
Investment
Activities | | Net Realized
Gains from
Investments | | Return of
Capital | |
Victory RS Mid Cap Growth Fund | |
Class R6 | |
Six Months Ended
June 30, 2021
(Unaudited) | | $ | 34.53 | | | | (0.13 | ) | | | 2.47 | | | | 2.34 | | | | (1.42 | ) | | | — | | |
Year Ended: | |
December 31, 2020 | | $ | 26.63 | | | | (0.14 | ) | | | 9.39 | | | | 9.25 | | | | (1.35 | ) | | | — | | |
December 31, 2019 | | $ | 20.74 | | | | (0.11 | ) | | | 6.00 | | | | 5.89 | | | | — | | | | — | | |
December 31, 2018 | | $ | 26.55 | | | | (0.07 | ) | | | (1.86 | ) | | | (1.93 | ) | | | (3.84 | ) | | | (0.04 | ) | |
December 31, 2017 | | $ | 21.90 | | | | (0.04 | ) | | | 4.69 | | | | 4.65 | | | | — | | | | — | | |
November 15, 2016(e)
through
December 31, 2016 | | $ | 21.30 | | | | — | (f) | | | 0.60 | | | | 0.60 | | | | — | | | | — | | |
Class Y | |
Six Months Ended
June 30, 2021
(Unaudited) | | $ | 34.50 | | | | (0.12 | ) | | | 2.46 | | | | 2.34 | | | | (1.42 | ) | | | — | | |
Year Ended: | |
December 31, 2020 | | $ | 26.61 | | | | (0.14 | ) | | | 9.38 | | | | 9.24 | | | | (1.35 | ) | | | — | | |
December 31, 2019 | | $ | 20.73 | | | | (0.11 | ) | | | 5.99 | | | | 5.88 | | | | — | | | | — | | |
December 31, 2018 | | $ | 26.54 | | | | (0.08 | ) | | | (1.85 | ) | | | (1.93 | ) | | | (1.17 | ) | | | (2.71 | ) | |
December 31, 2017 | | $ | 21.90 | | | | (0.04 | ) | | | 4.68 | | | | 4.64 | | | | — | | | | — | | |
December 31, 2016 | | $ | 20.79 | | | | (0.02 | ) | | | 1.13 | | | | 1.11 | | | | — | | | | — | | |
Member Class | |
Six Months Ended
June 30, 2021
(Unaudited) | | $ | 33.00 | | | | (0.14 | ) | | | 2.37 | | | | 2.23 | | | | (1.42 | ) | | | — | | |
November 3, 2020(e)
through
December 31, 2020 | | $ | 29.16 | | | | (0.04 | ) | | | 5.23 | | | | 5.19 | | | | (1.35 | ) | | | — | | |
(a) Per share net investment income (loss) has been calculated using the average daily shares method.
(b) Not annualized for periods less than one year.
(c) Annualized for periods less than one year.
(d) Portfolio turnover is calculated on the basis of the Fund as a whole without distinguishing between the classes of shares issued.
(e) Commencement of operations.
(f) Amount is less than $0.005 per share.
See notes to financial statements.
50
Victory Portfolios | | Financial Highlights — continued | |
For a Share Outstanding Throughout Each Period (continued)
| | | | | Ratios to Average Net Assets | | Supplemental Data | |
| | | Total
Distributions | | Net Asset
Value,
End of
Period | | Total
Return(b) | | Net
Expenses(c) | | Net
Investment
Income
(Loss)(c) | | Gross
Expenses(c) | | Net Assets,
End of
Period
(000's) | | Portfolio
Turnover(b)(d) | |
Victory RS Mid Cap Growth Fund | |
Class R6 | |
Six Months Ended
June 30, 2021
(Unaudited) | | | (1.42 | ) | | $ | 35.45 | | | | 6.75 | % | | | 0.94 | % | | | (0.73 | )% | | | 0.98 | % | | $ | 22,863 | | | | 41 | % | |
Year Ended: | |
December 31, 2020 | | | (1.35 | ) | | $ | 34.53 | | | | 34.86 | % | | | 0.94 | % | | | (0.49 | )% | | | 1.01 | % | | $ | 27,861 | | | | 92 | % | |
December 31, 2019 | | | — | | | $ | 26.63 | | | | 28.40 | % | | | 0.94 | % | | | (0.44 | )% | | | 1.05 | % | | $ | 20,321 | | | | 86 | % | |
December 31, 2018 | | | (3.88 | ) | | $ | 20.74 | | | | (7.15 | )% | | | 0.94 | % | | | (0.26 | )% | | | 1.32 | % | | $ | 3,793 | | | | 126 | % | |
December 31, 2017 | | | — | | | $ | 26.55 | | | | 21.23 | % | | | 0.94 | % | | | (0.17 | )% | | | 2.26 | % | | $ | 2,132 | | | | 86 | % | |
November 15, 2016(e)
through
December 31, 2016 | | | — | | | $ | 21.90 | | | | 2.82 | % | | | 0.94 | % | | | (0.02 | )% | | | 25.90 | % | | $ | 60 | | | | 138 | % | |
Class Y | |
Six Months Ended
June 30, 2021
(Unaudited) | | | (1.42 | ) | | $ | 35.42 | | | | 6.75 | % | | | 0.95 | % | | | (0.72 | )% | | | 1.10 | % | | $ | 323,804 | | | | 41 | % | |
Year Ended: | |
December 31, 2020 | | | (1.35 | ) | | $ | 34.50 | | | | 34.84 | % | | | 0.95 | % | | | (0.50 | )% | | | 1.10 | % | | $ | 466,342 | | | | 92 | % | |
December 31, 2019 | | | — | | | $ | 26.61 | | | | 28.36 | % | | | 0.95 | % | | | (0.43 | )% | | | 1.10 | % | | $ | 395,586 | | | | 86 | % | |
December 31, 2018 | | | (3.88 | ) | | $ | 20.73 | | | | (7.15 | )% | | | 0.95 | % | | | (0.27 | )% | | | 1.05 | % | | $ | 243,009 | | | | 126 | % | |
December 31, 2017 | | | — | | | $ | 26.54 | | | | 21.19 | % | | | 0.95 | % | | | (0.18 | )% | | | 1.06 | % | | $ | 310,050 | | | | 86 | % | |
December 31, 2016 | | | — | | | $ | 21.90 | | | | 5.34 | % | | | 0.95 | % | | | (0.10 | )% | | | 1.05 | % | | $ | 168,936 | | | | 138 | % | |
Member Class | |
Six Months Ended
June 30, 2021
(Unaudited) | | | (1.42 | ) | | $ | 33.81 | | | | 6.69 | % | | | 1.05 | % | | | (0.84 | )% | | | 5.44 | % | | $ | 643 | | | | 41 | % | |
November 3, 2020(e)
through
December 31, 2020 | | | (1.35 | ) | | $ | 33.00 | | | | 17.94 | % | | | 1.05 | % | | | (0.71 | )% | | | 31.23 | % | | $ | 109 | | | | 92 | % | |
See notes to financial statements.
51
Victory Portfolios | | Financial Highlights | |
For a Share Outstanding Throughout Each Period
| | | | Investment Activities | | Distributions
to
Shareholders
From | | | |
| | | Net Asset
Value,
Beginning of
Period | | Net
Investment
Income
(Loss)(a) | | Net Realized
and Unrealized
Gains (Losses)
on Investments | | Total from
Investment
Activities | | Net Realized
Gains from
Investments | | Total
Distributions | | Net Asset
Value,
End of
Period | | Total
Return
(Excludes
Sales
Charge)(b) | |
Victory RS Growth Fund | |
Class A | |
Six Months Ended
June 30, 2021
(Unaudited) | | $ | 23.84 | | | | (0.08 | ) | | | 2.61 | | | | 2.53 | | | | — | | | | — | | | $ | 26.37 | | | | 10.61 | % | |
Year Ended: | |
December 31, 2020 | | $ | 19.22 | | | | (0.08 | ) | | | 6.89 | | | | 6.81 | | | | (2.19 | ) | | | (2.19 | ) | | $ | 23.84 | | | | 35.64 | % | |
December 31, 2019 | | $ | 16.40 | | | | (0.03 | ) | | | 4.90 | | | | 4.87 | | | | (2.05 | ) | | | (2.05 | ) | | $ | 19.22 | | | | 29.83 | % | |
December 31, 2018 | | $ | 20.60 | | | | (0.06 | ) | | | (1.36 | ) | | | (1.42 | ) | | | (2.78 | ) | | | (2.78 | ) | | $ | 16.40 | | | | (6.81 | )% | |
December 31, 2017 | | $ | 16.44 | | | | (0.02 | ) | | | 5.24 | | | | 5.22 | | | | (1.06 | ) | | | (1.06 | ) | | $ | 20.60 | | | | 31.75 | % | |
December 31, 2016 | | $ | 17.49 | | | | (0.02 | ) | | | 0.36 | | | | 0.34 | | | | (1.39 | ) | | | (1.39 | ) | | $ | 16.44 | | | | 1.86 | % | |
Class C | |
Six Months Ended
June 30, 2021
(Unaudited) | | $ | 18.80 | | | | (0.14 | ) | | | 2.05 | | | | 1.91 | | | | — | | | | — | | | $ | 20.71 | | | | 10.16 | % | |
Year Ended: | |
December 31, 2020 | | $ | 15.63 | | | | (0.20 | ) | | | 5.56 | | | | 5.36 | | | | (2.19 | ) | | | (2.19 | ) | | $ | 18.80 | | | | 34.55 | % | |
December 31, 2019 | | $ | 13.75 | | | | (0.16 | ) | | | 4.09 | | | | 3.93 | | | | (2.05 | ) | | | (2.05 | ) | | $ | 15.63 | | | | 28.74 | % | |
December 31, 2018 | | $ | 17.90 | | | | (0.21 | ) | | | (1.16 | ) | | | (1.37 | ) | | | (2.78 | ) | | | (2.78 | ) | | $ | 13.75 | | | | (7.56 | )% | |
December 31, 2017 | | $ | 14.51 | | | | (0.15 | ) | | | 4.60 | | | | 4.45 | | | | (1.06 | ) | | | (1.06 | ) | | $ | 17.90 | | | | 30.57 | % | |
December 31, 2016 | | $ | 15.73 | | | | (0.14 | ) | | | 0.31 | | | | 0.17 | | | | (1.39 | ) | | | (1.39 | ) | | $ | 14.51 | | | | 1.05 | % | |
Class R | |
Six Months Ended
June 30, 2021
(Unaudited) | | $ | 21.09 | | | | (0.14 | ) | | | 2.30 | | | | 2.16 | | | | — | | | | — | | | $ | 23.25 | | | | 10.24 | % | |
Year Ended: | |
December 31, 2020 | | $ | 17.29 | | | | (0.19 | ) | | | 6.18 | | | | 5.99 | | | | (2.19 | ) | | | (2.19 | ) | | $ | 21.09 | | | | 34.87 | % | |
December 31, 2019 | | $ | 15.00 | | | | (0.14 | ) | | | 4.48 | | | | 4.34 | | | | (2.05 | ) | | | (2.05 | ) | | $ | 17.29 | | | | 29.08 | % | |
December 31, 2018 | | $ | 19.22 | | | | (0.18 | ) | | | (1.26 | ) | | | (1.44 | ) | | | (2.78 | ) | | | (2.78 | ) | | $ | 15.00 | | | | (7.41 | )% | |
December 31, 2017 | | $ | 15.49 | | | | (0.13 | ) | | | 4.92 | | | | 4.79 | | | | (1.06 | ) | | | (1.06 | ) | | $ | 19.22 | | | | 30.92 | % | |
December 31, 2016 | | $ | 16.65 | | | | (0.11 | ) | | | 0.34 | | | | 0.23 | | | | (1.39 | ) | | | (1.39 | ) | | $ | 15.49 | | | | 1.29 | % | |
(a) Per share net investment income (loss) has been calculated using the average daily shares method.
(b) Not annualized for periods less than one year.
(c) Annualized for periods less than one year.
(d) Portfolio turnover is calculated on the basis of the Fund as a whole without distinguishing between the classes of shares issued.
See notes to financial statements.
52
Victory Portfolios | | Financial Highlights — continued | |
For a Share Outstanding Throughout Each Period
| | | Ratios to Average Net Assets | | Supplemental Data | |
| | | Net
Expenses(c) | | Net
Investment
Income
(Loss)(c) | | Gross
Expenses(c) | | Net Assets,
End of
Period
(000's) | | Portfolio
Turnover(b)(d) | |
Victory RS Growth Fund | |
Class A | |
Six Months Ended
June 30, 2021
(Unaudited) | | | 1.10 | % | | | (0.65 | )% | | | 1.17 | % | | $ | 294,723 | | | | 28 | % | |
Year Ended: | |
December 31, 2020 | | | 1.10 | % | | | (0.37 | )% | | | 1.19 | % | | $ | 274,388 | | | | 73 | % | |
December 31, 2019 | | | 1.10 | % | | | (0.16 | )% | | | 1.19 | % | | $ | 223,503 | | | | 95 | % | |
December 31, 2018 | | | 1.10 | % | | | (0.28 | )% | | | 1.19 | % | | $ | 188,220 | | | | 87 | % | |
December 31, 2017 | | | 1.10 | % | | | (0.09 | )% | | | 1.20 | % | | $ | 218,238 | | | | 74 | % | |
December 31, 2016 | | | 1.10 | % | | | (0.09 | )% | | | 1.20 | % | | $ | 189,921 | | | | 123 | % | |
Class C | |
Six Months Ended
June 30, 2021
(Unaudited) | | | 1.93 | % | | | (1.50 | )% | | | 2.08 | % | | $ | 2,294 | | | | 28 | % | |
Year Ended: | |
December 31, 2020 | | | 1.93 | % | | | (1.20 | )% | | | 2.43 | % | | $ | 3,731 | | | | 73 | % | |
December 31, 2019 | | | 1.93 | % | | | (0.99 | )% | | | 2.33 | % | | $ | 4,240 | | | | 95 | % | |
December 31, 2018 | | | 1.93 | % | | | (1.10 | )% | | | 2.20 | % | | $ | 4,409 | | | | 87 | % | |
December 31, 2017 | | | 1.93 | % | | | (0.92 | )% | | | 2.10 | % | | $ | 6,974 | | | | 74 | % | |
December 31, 2016 | | | 1.93 | % | | | (0.93 | )% | | | 2.06 | % | | $ | 8,487 | | | | 123 | % | |
Class R | |
Six Months Ended
June 30, 2021
(Unaudited) | | | 1.71 | % | | | (1.26 | )% | | | 2.15 | % | | $ | 491 | | | | 28 | % | |
Year Ended: | |
December 31, 2020 | | | 1.71 | % | | | (0.98 | )% | | | 6.08 | % | | $ | 420 | | | | 73 | % | |
December 31, 2019 | | | 1.71 | % | | | (0.77 | )% | | | 5.41 | % | | $ | 438 | | | | 95 | % | |
December 31, 2018 | | | 1.71 | % | | | (0.88 | )% | | | 3.49 | % | | $ | 516 | | | | 87 | % | |
December 31, 2017 | | | 1.71 | % | | | (0.70 | )% | | | 2.72 | % | | $ | 830 | | | | 74 | % | |
December 31, 2016 | | | 1.71 | % | | | (0.69 | )% | | | 1.77 | % | | $ | 1,054 | | | | 123 | % | |
See notes to financial statements.
53
Victory Portfolios | | Financial Highlights | |
For a Share Outstanding Throughout Each Period
| | | | | Investment Activities | | Distributions
to
Shareholders
From | | | |
| | | Net Asset
Value,
Beginning of
Period | | Net
Investment
Income
(Loss)(a) | | Net Realized
and Unrealized
Gains (Losses)
on Investments | | Total from
Investment
Activities | | Net Realized
Gains from
Investments | | Total
Distributions | | Net Asset
Value,
End of
Period | | Total
Return(b) | |
Victory RS Growth Fund | |
Class Y | |
Six Months Ended
June 30, 2021
(Unaudited) | | $ | 25.13 | | | | (0.05 | ) | | | 2.75 | | | | 2.70 | | | | — | | | | — | | | $ | 27.83 | | | | 10.74 | % | |
Year Ended: | |
December 31, 2020 | | $ | 20.11 | | | | (0.02 | ) | | | 7.23 | | | | 7.21 | | | | (2.19 | ) | | | (2.19 | ) | | $ | 25.13 | | | | 36.06 | % | |
December 31, 2019 | | $ | 17.04 | | | | 0.02 | | | | 5.10 | | | | 5.12 | | | | (2.05 | ) | | | (2.05 | ) | | $ | 20.11 | | | | 30.18 | % | |
December 31, 2018 | | $ | 21.23 | | | | — | (e) | | | (1.41 | ) | | | (1.41 | ) | | | (2.78 | ) | | | (2.78 | ) | | $ | 17.04 | | | | (6.56 | )% | |
December 31, 2017 | | $ | 16.88 | | | | 0.03 | | | | 5.38 | | | | 5.41 | | | | (1.06 | ) | | | (1.06 | ) | | $ | 21.23 | | | | 32.05 | % | |
December 31, 2016 | | $ | 17.87 | | | | 0.03 | | | | 0.37 | | | | 0.40 | | | | (1.39 | ) | | | (1.39 | ) | | $ | 16.88 | | | | 2.16 | % | |
(a) Per share net investment income (loss) has been calculated using the average daily shares method.
(b) Not annualized for periods less than one year.
(c) Annualized for periods less than one year.
(d) Portfolio turnover is calculated on the basis of the Fund as a whole without distinguishing between the classes of shares issued.
(e) Amount is less than $0.005 per share.
See notes to financial statements.
54
Victory Portfolios | | Financial Highlights — continued | |
For a Share Outstanding Throughout Each Period (continued)
| | | Ratios to Average Net Assets | | Supplemental Data | |
| | | Net
Expenses(c) | | Net
Investment
Income
(Loss)(c) | | Gross
Expenses(c) | | Net Assets,
End of
Period
(000's) | | Portfolio
Turnover(b)(d) | |
Victory RS Growth Fund | |
Class Y | |
Six Months Ended
June 30, 2021
(Unaudited) | | | 0.83 | % | | | (0.38 | )% | | | 0.92 | % | | $ | 31,737 | | | | 28 | % | |
Year Ended: | |
December 31, 2020 | | | 0.83 | % | | | (0.09 | )% | | | 0.99 | % | | $ | 29,875 | | | | 73 | % | |
December 31, 2019 | | | 0.83 | % | | | 0.11 | % | | | 0.98 | % | | $ | 31,473 | | | | 95 | % | |
December 31, 2018 | | | 0.83 | % | | | (0.01 | )% | | | 0.97 | % | | $ | 26,457 | | | | 87 | % | |
December 31, 2017 | | | 0.83 | % | | | 0.17 | % | | | 0.97 | % | | $ | 30,309 | | | | 74 | % | |
December 31, 2016 | | | 0.83 | % | | | 0.17 | % | | | 0.95 | % | | $ | 25,107 | | | | 123 | % | |
See notes to financial statements.
55
Victory Portfolios | | Financial Highlights | |
For a Share Outstanding Throughout Each Period
| | | | | Investment Activities | | Distributions
to
Shareholders
From | | | |
| | | Net Asset
Value,
Beginning of
Period | | Net
Investment
Income
(Loss)(a) | | Net
Realized and
Unrealized
Gains
(Losses) on
Investments | | Total from
Investment
Activities | | Net Realized
Gains from
Investments | | Total
Distributions | | Capital
Contributions
from Prior
Custodian,
Net(b) | | Net Asset
Value,
End of
Period | | Total
Return
(Excludes
Sales
Charge)(c) | |
Victory RS Science and Technology Fund | |
Class A | |
Six Months Ended
June 30, 2021
(Unaudited) | | $ | 36.35 | | | | (0.23 | ) | | | 1.51 | | | | 1.28 | | | | — | | | | — | | | | — | | | $ | 37.63 | | | | 3.49 | % | |
Year Ended: | |
December 31, 2020 | | $ | 23.37 | | | | (0.34 | ) | | | 15.48 | | | | 15.14 | | | | (2.16 | ) | | | (2.16 | ) | | | — | | | $ | 36.35 | | | | 65.03 | % | |
December 31, 2019 | | $ | 18.34 | | | | (0.26 | ) | | | 7.43 | | | | 7.17 | | | | (2.14 | ) | | | (2.14 | ) | | | — | | | $ | 23.37 | | | | 39.32 | % | |
December 31, 2018 | | $ | 21.56 | | | | (0.27 | ) | | | 0.06 | | | | (0.21 | ) | | | (3.01 | ) | | | (3.01 | ) | | | — | | | $ | 18.34 | | | | (0.73 | )% | |
December 31, 2017 | | $ | 17.49 | | | | (0.25 | ) | | | 8.04 | | | | 7.79 | | | | (3.72 | ) | | | (3.72 | ) | | | — | | | $ | 21.56 | | | | 44.74 | % | |
December 31, 2016 | | $ | 17.35 | | | | (0.22 | ) | | | 2.64 | | | | 2.42 | | | | (2.28 | ) | | | (2.28 | ) | | | — | (f) | | $ | 17.49 | | | | 13.80 | %(b) | |
Class C | |
Six Months Ended
June 30, 2021
(Unaudited) | | $ | 26.81 | | | | (0.27 | ) | | | 1.10 | | | | 0.83 | | | | — | | | | — | | | | — | | | $ | 27.64 | | | | 3.06 | % | |
Year Ended: | |
December 31, 2020 | | $ | 17.73 | | | | (0.41 | ) | | | 11.65 | | | | 11.24 | | | | (2.16 | ) | | | (2.16 | ) | | | — | | | $ | 26.81 | | | | 63.71 | % | |
December 31, 2019 | | $ | 14.40 | | | | (0.35 | ) | | | 5.82 | | | | 5.47 | | | | (2.14 | ) | | | (2.14 | ) | | | — | | | $ | 17.73 | | | | 38.27 | % | |
December 31, 2018 | | $ | 17.73 | | | | (0.38 | ) | | | 0.06 | | | | (0.32 | ) | | | (3.01 | ) | | | (3.01 | ) | | | — | | | $ | 14.40 | | | | (1.58 | )% | |
December 31, 2017 | | $ | 14.96 | | | | (0.36 | ) | | | 6.85 | | | | 6.49 | | | | (3.72 | ) | | | (3.72 | ) | | | — | | | $ | 17.73 | | | | 43.70 | % | |
December 31, 2016 | | $ | 15.25 | | | | (0.31 | ) | | | 2.30 | | | | 1.99 | | | | (2.28 | ) | | | (2.28 | ) | | | — | (f) | | $ | 14.96 | | | | 12.87 | %(b) | |
Class R | |
Six Months Ended
June 30, 2021
(Unaudited) | | $ | 29.99 | | | | (0.26 | ) | | | 1.24 | | | | 0.98 | | | | — | | | | — | | | | — | | | $ | 30.97 | | | | 3.23 | % | |
Year Ended: | |
December 31, 2020 | | $ | 19.60 | | | | (0.39 | ) | | | 12.94 | | | | 12.55 | | | | (2.16 | ) | | | (2.16 | ) | | | — | | | $ | 29.99 | | | | 64.32 | % | |
December 31, 2019 | | $ | 15.70 | | | | (0.31 | ) | | | 6.35 | | | | 6.04 | | | | (2.14 | ) | | | (2.14 | ) | | | — | | | $ | 19.60 | | | | 38.73 | % | |
December 31, 2018 | | $ | 18.99 | | | | (0.33 | ) | | | 0.05 | | | | (0.28 | ) | | | (3.01 | ) | | | (3.01 | ) | | | — | | | $ | 15.70 | | | | (1.20 | )% | |
December 31, 2017 | | $ | 15.78 | | | | (0.31 | ) | | | 7.24 | | | | 6.93 | | | | (3.72 | ) | | | (3.72 | ) | | | — | | | $ | 18.99 | | | | 44.05 | % | |
December 31, 2016 | | $ | 15.91 | | | | (0.26 | ) | | | 2.41 | | | | 2.15 | | | | (2.28 | ) | | | (2.28 | ) | | | — | (f) | | $ | 15.78 | | | | 13.41 | %(b) | |
(a) Per share net investment income (loss) has been calculated using the average daily shares method.
(b) The Fund received monies related to a nonrecurring refund from the prior custodian. The corresponding impact to the total return was less than 0.005% for the period shown.
(c) Not annualized for periods less than one year.
(d) Annualized for periods less than one year.
(e) Portfolio turnover is calculated on the basis of the Fund as a whole without distinguishing between the classes of shares issued.
(f) Amount is less than $0.005 per share.
See notes to financial statements.
56
Victory Portfolios | | Financial Highlights — continued | |
For a Share Outstanding Throughout Each Period
| | | Ratios to Average Net Assets | | Supplemental Data | |
| | | Net
Expenses(d) | | Net
Investment
Income
(Loss)(d) | | Gross
Expenses(d) | | Net
Assets,
End of
Period
(000's) | | Portfolio
Turnover(c)(e) | |
Victory RS Science and Technology Fund | |
Class A | |
Six Months Ended
June 30, 2021
(Unaudited) | | | 1.46 | % | | | (1.27 | )% | | | 1.46 | % | | $ | 319,254 | | | | 26 | % | |
Year Ended: | |
December 31, 2020 | | | 1.48 | % | | | (1.22 | )% | | | 1.48 | % | | $ | 320,605 | | | | 30 | % | |
December 31, 2019 | | | 1.48 | % | | | (1.14 | )% | | | 1.48 | % | | $ | 199,591 | | | | 88 | % | |
December 31, 2018 | | | 1.47 | % | | | (1.10 | )% | | | 1.47 | % | | $ | 140,389 | | | | 83 | % | |
December 31, 2017 | | | 1.49 | % | | | (1.18 | )% | | | 1.49 | % | | $ | 146,002 | | | | 89 | % | |
December 31, 2016 | | | 1.51 | % | | | (1.24 | )% | | | 1.52 | % | | $ | 105,041 | | | | 114 | % | |
Class C | |
Six Months Ended
June 30, 2021
(Unaudited) | | | 2.22 | % | | | (2.04 | )% | | | 2.22 | % | | $ | 14,068 | | | | 26 | % | |
Year Ended: | |
December 31, 2020 | | | 2.28 | % | | | (2.03 | )% | | | 2.32 | % | | $ | 18,398 | | | | 30 | % | |
December 31, 2019 | | | 2.28 | % | | | (1.94 | )% | | | 2.34 | % | | $ | 14,054 | | | | 88 | % | |
December 31, 2018 | | | 2.28 | % | | | (1.91 | )% | | | 2.31 | % | | $ | 11,857 | | | | 83 | % | |
December 31, 2017 | | | 2.28 | % | | | (1.97 | )% | | | 2.31 | % | | $ | 11,831 | | | | 89 | % | |
December 31, 2016 | | | 2.32 | % | | | (2.05 | )% | | | 2.32 | % | | $ | 10,332 | | | | 114 | % | |
Class R | |
Six Months Ended
June 30, 2021
(Unaudited) | | | 1.93 | % | | | (1.74 | )% | | | 1.97 | % | | $ | 1,322 | | | | 26 | % | |
Year Ended: | |
December 31, 2020 | | | 1.93 | % | | | (1.68 | )% | | | 3.69 | % | | $ | 1,273 | | | | 30 | % | |
December 31, 2019 | | | 1.93 | % | | | (1.59 | )% | | | 4.28 | % | | $ | 681 | | | | 88 | % | |
December 31, 2018 | | | 1.93 | % | | | (1.56 | )% | | | 2.75 | % | | $ | 707 | | | | 83 | % | |
December 31, 2017 | | | 1.93 | % | | | (1.62 | )% | | | 2.54 | % | | $ | 1,705 | | | | 89 | % | |
December 31, 2016 | | | 1.91 | % | | | (1.63 | )% | | | 1.91 | % | | $ | 1,394 | | | | 114 | % | |
See notes to financial statements.
57
Victory Portfolios | | Financial Highlights | |
For a Share Outstanding Throughout Each Period
| | | | | Investment Activities | | Distributions
to
Shareholders
From | | | |
| | | Net Asset
Value,
Beginning of
Period | | Net
Investment
Income
(Loss)(a) | | Net
Realized and
Unrealized
Gains
(Losses) on
Investments | | Total from
Investment
Activities | | Net Realized
Gains from
Investments | | Total
Distributions | | Capital
Contributions
from Prior
Custodian,
Net(b) | | Net Asset
Value,
End of
Period | | Total
Return(c) | |
Victory RS Science and Technology Fund | |
Class Y | |
Six Months Ended
June 30, 2021
(Unaudited) | | $ | 39.73 | | | | (0.21 | ) | | | 1.65 | | | | 1.44 | | | | — | | | | — | | | | — | | | $ | 41.17 | | | | 3.60 | % | |
Year Ended: | |
December 31, 2020 | | $ | 25.36 | | | | (0.29 | ) | | | 16.82 | | | | 16.53 | | | | (2.16 | ) | | | (2.16 | ) | | | — | | | $ | 39.73 | | | | 65.40 | % | |
December 31, 2019 | | $ | 19.72 | | | | (0.22 | ) | | | 8.00 | | | | 7.78 | | | | (2.14 | ) | | | (2.14 | ) | | | — | | | $ | 25.36 | | | | 39.66 | % | |
December 31, 2018 | | $ | 22.90 | | | | (0.22 | ) | | | 0.05 | | | | (0.17 | ) | | | (3.01 | ) | | | (3.01 | ) | | | — | | | $ | 19.72 | | | | (0.51 | )% | |
December 31, 2017 | | $ | 18.37 | | | | (0.21 | ) | | | 8.46 | | | | 8.25 | | | | (3.72 | ) | | | (3.72 | ) | | | — | | | $ | 22.90 | | | | 45.11 | % | |
December 31, 2016 | | $ | 18.08 | | | | (0.18 | ) | | | 2.75 | | | | 2.57 | | | | (2.28 | ) | | | (2.28 | ) | | | — | (f) | | $ | 18.37 | | | | 14.07 | %(b) | |
(a) Per share net investment income (loss) has been calculated using the average daily shares method.
(b) The Fund received monies related to a nonrecurring refund from the prior custodian. The corresponding impact to the total return was less than 0.005% for the period shown.
(c) Not annualized for periods less than one year.
(d) Annualized for periods less than one year.
(e) Portfolio turnover is calculated on the basis of the Fund as a whole without distinguishing between the classes of shares issued.
(f) Amount is less than $0.005 per share.
See notes to financial statements.
58
Victory Portfolios | | Financial Highlights — continued | |
For a Share Outstanding Throughout Each Period (continued)
| | | Ratios to Average Net Assets | | Supplemental Data | |
| | | Net
Expenses(d) | | Net
Investment
Income
(Loss)(d) | | Gross
Expenses(d) | | Net
Assets,
End of
Period
(000's) | | Portfolio
Turnover(c)(e) | |
Victory RS Science and Technology Fund | |
Class Y | |
Six Months Ended
June 30, 2021
(Unaudited) | | | 1.21 | % | | | (1.02 | )% | | | 1.21 | % | | $ | 107,673 | | | | 26 | % | |
Year Ended: | |
December 31, 2020 | | | 1.24 | % | | | (0.99 | )% | | | 1.26 | % | | $ | 109,275 | | | | 30 | % | |
December 31, 2019 | | | 1.24 | % | | | (0.89 | )% | | | 1.26 | % | | $ | 77,998 | | | | 88 | % | |
December 31, 2018 | | | 1.24 | % | | | (0.85 | )% | | | 1.25 | % | | $ | 53,395 | | | | 83 | % | |
December 31, 2017 | | | 1.24 | % | | | (0.92 | )% | | | 1.26 | % | | $ | 32,047 | | | | 89 | % | |
December 31, 2016 | | | 1.28 | % | | | (1.01 | )% | | | 1.29 | % | | $ | 19,335 | | | | 114 | % | |
See notes to financial statements.
59
Victory Portfolios | | Financial Highlights | |
For a Share Outstanding Throughout Each Period
| | | | | Investment Activities | | Distributions
to
Shareholders
From | | | |
| | | Net Asset
Value,
Beginning of
Period | | Net
Investment
Income
(Loss)(a) | | Net
Realized and
Unrealized
Gains
(Losses) on
Investments | | Total from
Investment
Activities | | Net Realized
Gains from
Investments | | Total
Distributions | | Capital
Contributions
from Prior
Custodian,
Net(b) | | Net Asset
Value,
End of
Period | | Total
Return
(Excludes
Sales
Charge)(c) | |
Victory RS Small Cap Equity Fund | |
Class A | |
Six Months Ended
June 30, 2021
(Unaudited) | | $ | 18.02 | | | | (0.10 | ) | | | 0.59 | | | | 0.49 | | | | — | | | | — | | | | — | | | $ | 18.51 | | | | 2.72 | % | |
Year Ended: | |
December 31, 2020 | | $ | 16.05 | | | | (0.19 | ) | | | 6.17 | | | | 5.98 | | | | (4.01 | ) | | | (4.01 | ) | | | — | | | $ | 18.02 | | | | 37.99 | % | |
December 31, 2019 | | $ | 12.97 | | | | (0.15 | ) | | | 5.11 | | | | 4.96 | | | | (1.88 | ) | | | (1.88 | ) | | | — | | | $ | 16.05 | | | | 38.49 | % | |
December 31, 2018 | | $ | 18.88 | | | | (0.16 | ) | | | (1.47 | ) | | | (1.63 | ) | | | (4.28 | ) | | | (4.28 | ) | | | — | | | $ | 12.97 | | | | (8.39 | )% | |
December 31, 2017 | | $ | 14.41 | | | | (0.14 | ) | | | 5.55 | | | | 5.41 | | | | (0.94 | ) | | | (0.94 | ) | | | — | | | $ | 18.88 | | | | 37.57 | % | |
December 31, 2016 | | $ | 14.24 | | | | (0.12 | ) | | | 0.28 | | | | 0.16 | | | | — | | | | — | | | | 0.01 | | | $ | 14.41 | | | | 1.19 | %(b) | |
Class C | |
Six Months Ended
June 30, 2021
(Unaudited) | | $ | 1.53 | | | | (0.02 | ) | | | 0.06 | | | | 0.04 | | | | — | | | | — | | | | — | | | $ | 1.57 | | | | 2.61 | % | |
Year Ended: | |
December 31, 2020 | | $ | 4.13 | | | | (0.07 | ) | | | 1.48 | | | | 1.41 | | | | (4.01 | ) | | | (4.01 | ) | | | — | | | $ | 1.53 | | | | 36.75 | % | |
December 31, 2019 | | $ | 4.40 | | | | (0.09 | ) | | | 1.70 | | | | 1.61 | | | | (1.88 | ) | | | (1.88 | ) | | | — | | | $ | 4.13 | | | | 37.26 | % | |
December 31, 2018 | | $ | 9.61 | | | | (0.17 | ) | | | (0.76 | ) | | | (0.93 | ) | | | (4.28 | ) | | | (4.28 | ) | | | — | | | $ | 4.40 | | | | (9.23 | )% | |
December 31, 2017 | | $ | 7.74 | | | | (0.15 | ) | | | 2.96 | | | | 2.81 | | | | (0.94 | ) | | | (0.94 | ) | | | — | | | $ | 9.61 | | | | 36.34 | % | |
December 31, 2016 | | $ | 7.71 | | | | (0.12 | ) | | | 0.14 | | | | 0.02 | | | | — | | | | — | | | | 0.01 | | | $ | 7.74 | | | | 0.39 | %(b) | |
Class R | |
Six Months Ended
June 30, 2021
(Unaudited) | | $ | 12.79 | | | | (0.11 | ) | | | 0.42 | | | | 0.31 | | | | — | | | | — | | | | — | | | $ | 13.10 | | | | 2.42 | % | |
Year Ended: | |
December 31, 2020 | | $ | 12.32 | | | | (0.20 | ) | | | 4.68 | | | | 4.48 | | | | (4.01 | ) | | | (4.01 | ) | | | — | | | $ | 12.79 | | | | 37.31 | % | |
December 31, 2019 | | $ | 10.32 | | | | (0.18 | ) | | | 4.06 | | | | 3.88 | | | | (1.88 | ) | | | (1.88 | ) | | | — | | | $ | 12.32 | | | | 37.91 | % | |
December 31, 2018 | | $ | 16.08 | | | | (0.23 | ) | | | (1.25 | ) | | | (1.48 | ) | | | (4.28 | ) | | | (4.28 | ) | | | — | | | $ | 10.32 | | | | (8.92 | )% | |
December 31, 2017 | | $ | 12.44 | | | | (0.20 | ) | | | 4.78 | | | | 4.58 | | | | (0.94 | ) | | | (0.94 | ) | | | — | | | $ | 16.08 | | | | 36.84 | % | |
December 31, 2016 | | $ | 12.33 | | | | (0.14 | ) | | | 0.24 | | | | 0.10 | | | | — | | | | — | | | | 0.01 | | | $ | 12.44 | | | | 0.89 | %(b) | |
(a) Per share net investment income (loss) has been calculated using the average daily shares method.
(b) The Fund received monies related to a nonrecurring refund from the prior custodian. The corresponding impact to the total return was 0.05% for the period shown.
(c) Not annualized for periods less than one year.
(d) Annualized for periods less than one year.
(e) Portfolio turnover is calculated on the basis of the Fund as a whole without distinguishing between the classes of shares issued.
See notes to financial statements.
60
Victory Portfolios | | Financial Highlights — continued | |
For a Share Outstanding Throughout Each Period
| | | Ratios to Average Net Assets | | Supplemental Data | |
| | | Net
Expenses(d) | | Net
Investment
Income
(Loss)(d) | | Gross
Expenses(d) | | Net
Assets,
End of
Period
(000's) | | Portfolio
Turnover(c)(e) | |
Victory RS Small Cap Equity Fund | |
Class A | |
Six Months Ended
June 30, 2021
(Unaudited) | | | 1.22 | % | | | (1.15 | )% | | | 1.22 | % | | $ | 73,559 | | | | 56 | % | |
Year Ended: | |
December 31, 2020 | | | 1.29 | % | | | (1.14 | )% | | | 1.29 | % | | $ | 76,611 | | | | 157 | % | |
December 31, 2019 | | | 1.26 | % | | | (0.93 | )% | | | 1.26 | % | | $ | 63,247 | | | | 89 | % | |
December 31, 2018 | | | 1.22 | % | | | (0.78 | )% | | | 1.22 | % | | $ | 51,619 | | | | 77 | % | |
December 31, 2017 | | | 1.25 | % | | | (0.84 | )% | | | 1.25 | % | | $ | 65,514 | | | | 79 | % | |
December 31, 2016 | | | 1.35 | % | | | (0.88 | )% | | | 1.36 | % | | $ | 52,075 | | | | 86 | % | |
Class C | |
Six Months Ended
June 30, 2021
(Unaudited) | | | 2.10 | % | | | (2.03 | )% | | | 4.04 | % | | $ | 498 | | | | 56 | % | |
Year Ended: | |
December 31, 2020 | | | 2.10 | % | | | (1.94 | )% | | | 5.26 | % | | $ | 515 | | | | 157 | % | |
December 31, 2019 | | | 2.10 | % | | | (1.76 | )% | | | 3.86 | % | | $ | 478 | | | | 89 | % | |
December 31, 2018 | | | 2.10 | % | | | (1.71 | )% | | | 4.24 | % | | $ | 616 | | | | 77 | % | |
December 31, 2017 | | | 2.10 | % | | | (1.69 | )% | | | 3.87 | % | | $ | 533 | | | | 79 | % | |
December 31, 2016 | | | 2.10 | % | | | (1.64 | )% | | | 3.14 | % | | $ | 410 | | | | 86 | % | |
Class R | |
Six Months Ended
June 30, 2021
(Unaudited) | | | 1.75 | % | | | (1.68 | )% | | | 1.87 | % | | $ | 3,245 | | | | 56 | % | |
Year Ended: | |
December 31, 2020 | | | 1.75 | % | | | (1.59 | )% | | | 2.05 | % | | $ | 3,325 | | | | 157 | % | |
December 31, 2019 | | | 1.75 | % | | | (1.42 | )% | | | 2.05 | % | | $ | 2,874 | | | | 89 | % | |
December 31, 2018 | | | 1.75 | % | | | (1.30 | )% | | | 1.88 | % | | $ | 2,303 | | | | 77 | % | |
December 31, 2017 | | | 1.75 | % | | | (1.34 | )% | | | 1.97 | % | | $ | 3,381 | | | | 79 | % | |
December 31, 2016 | | | 1.70 | % | | | (1.24 | )% | | | 1.70 | % | | $ | 2,954 | | | | 86 | % | |
See notes to financial statements.
61
Victory Portfolios | | Financial Highlights | |
For a Share Outstanding Throughout Each Period
| | | | | Investment Activities | | Distributions
to
Shareholders
From | | | |
| | | Net Asset
Value,
Beginning of
Period | | Net
Investment
Income
(Loss)(a) | | Net
Realized and
Unrealized
Gains
(Losses) on
Investments | | Total from
Investment
Activities | | Net Realized
Gains from
Investments | | Total
Distributions | | Capital
Contributions
from Prior
Custodian,
Net(b) | | Net Asset
Value,
End of
Period | | Total
Return(c) | |
Victory RS Small Cap Equity Fund | |
Class Y | |
Six Months Ended
June 30, 2021
(Unaudited) | | $ | 18.71 | | | | (0.10 | ) | | | 0.62 | | | | 0.52 | | | | — | | | | — | | | | — | | | $ | 19.23 | | | | 2.78 | % | |
Year Ended: | |
December 31, 2020 | | $ | 16.52 | | | | (0.16 | ) | | | 6.36 | | | | 6.20 | | | | (4.01 | ) | | | (4.01 | ) | | | — | | | $ | 18.71 | | | | 38.24 | % | |
December 31, 2019 | | $ | 13.29 | | | | (0.13 | ) | | | 5.24 | | | | 5.11 | | | | (1.88 | ) | | | (1.88 | ) | | | — | | | $ | 16.52 | | | | 38.69 | % | |
December 31, 2018 | | $ | 19.20 | | | | (0.14 | ) | | | (1.49 | ) | | | (1.63 | ) | | | (4.28 | ) | | | (4.28 | ) | | | — | | | $ | 13.29 | | | | (8.23 | )% | |
December 31, 2017 | | $ | 14.62 | | | | (0.14 | ) | | | 5.66 | | | | 5.52 | | | | (0.94 | ) | | | (0.94 | ) | | | — | | | $ | 19.20 | | | | 37.78 | % | |
December 31, 2016 | | $ | 14.39 | | | | (0.08 | ) | | | 0.30 | | | | 0.22 | | | | — | | | | — | | | | 0.01 | | | $ | 14.62 | | | | 1.60 | %(b) | |
Member Class | |
Six Months Ended
June 30, 2021
(Unaudited) | | $ | 18.04 | | | | (0.10 | ) | | | 0.59 | | | | 0.49 | | | | — | | | | — | | | | — | | | $ | 18.53 | | | | 2.72 | % | |
November 3, 2020(f)
through
December 31, 2020 | | $ | 17.72 | | | | (0.04 | ) | | | 4.37 | | | | 4.33 | | | | (4.01 | ) | | | (4.01 | ) | | | — | | | $ | 18.04 | | | | 25.09 | % | |
(a) Per share net investment income (loss) has been calculated using the average daily shares method.
(b) The Fund received monies related to a nonrecurring refund from the prior custodian. The corresponding impact to the total return was 0.05% for the period shown.
(c) Not annualized for periods less than one year.
(d) Annualized for periods less than one year.
(e) Portfolio turnover is calculated on the basis of the Fund as a whole without distinguishing between the classes of shares issued.
(f) Commencement of operations.
See notes to financial statements.
62
Victory Portfolios | | Financial Highlights — continued | |
For a Share Outstanding Throughout Each Period (continued)
| | | Ratios to Average Net Assets | | Supplemental Data | |
| | | Net
Expenses(d) | | Net
Investment
Income
(Loss)(d) | | Gross
Expenses(d) | | Net
Assets,
End of
Period
(000's) | | Portfolio
Turnover(c)(e) | |
Victory RS Small Cap Equity Fund | |
Class Y | |
Six Months Ended
June 30, 2021
(Unaudited) | | | 1.10 | % | | | (1.03 | )% | | | 1.11 | % | | $ | 4,112 | | | | 56 | % | |
Year Ended: | |
December 31, 2020 | | | 1.10 | % | | | (0.95 | )% | | | 1.58 | % | | $ | 4,449 | | | | 157 | % | |
December 31, 2019 | | | 1.10 | % | | | (0.77 | )% | | | 1.43 | % | | $ | 3,275 | | | | 89 | % | |
December 31, 2018 | | | 1.10 | % | | | (0.69 | )% | | | 1.68 | % | | $ | 2,750 | | | | 77 | % | |
December 31, 2017 | | | 1.10 | % | | | (0.78 | )% | | | 1.34 | % | | $ | 6,398 | | | | 79 | % | |
December 31, 2016 | | | 1.10 | % | | | (0.64 | )% | | | 1.24 | % | | $ | 1,834 | | | | 86 | % | |
Member Class | |
Six Months Ended
June 30, 2021
(Unaudited) | | | 1.15 | % | | | (1.07 | )% | | | 5.76 | % | | $ | 1,168 | | | | 56 | % | |
November 3, 2020(f)
through
December 31, 2020 | | | 1.15 | % | | | (1.14 | )% | | | 23.73 | % | | $ | 218 | | | | 157 | % | |
See notes to financial statements.
63
Victory Portfolios | | Notes to Financial Statements
June 30, 2021 | |
(Unaudited)
1. Organization:
Victory Portfolios (the "Trust") is organized as a Delaware statutory trust and the Trust is registered under the Investment Company Act of 1940, as amended (the "1940 Act"), as an open-end investment company. The Trust is comprised of 41 funds and is authorized to issue an unlimited number of shares, which are units of beneficial interest with a par value of $0.001 per share.
The accompanying financial statements are those of the following six Funds (collectively, the "Funds" and individually, a "Fund"). Each Fund is classified as diversified under the 1940 Act.
Funds (Legal Name) | | Funds (Short Name) | | Investment Share
Classes Offered | |
Victory RS Small Cap Growth Fund | | RS Small Cap Growth Fund | | Classes A, C, R, R6 and Y | |
Victory RS Select Growth Fund | | RS Select Growth Fund | | Classes A, C, R, R6 and Y | |
Victory RS Mid Cap Growth Fund
| | RS Mid Cap Growth Fund
| | Classes A, C, R, R6, Y and
Member Class* | |
Victory RS Growth Fund | | RS Growth Fund | | Classes A, C, R and Y | |
Victory RS Science and | | RS Science and | | Classes A, C, R and Y | |
Technology Fund | | Technology Fund | | | |
Victory RS Small Cap Equity Fund
| | RS Small Cap Equity Fund
| | Classes A, C, R, Y and
Member Class* | |
* Member Class commenced operations on November 3, 2020
Each class of shares of a Fund has substantially identical rights and privileges except with respect to sales charges, fees paid under distribution plans, expenses allocable exclusively to each class of shares, voting rights on matters solely affecting a single class of shares, and the exchange privilege of each class of shares.
Under the Trust's organizational documents, its officers and trustees are indemnified against certain liabilities arising out of the performance of their duties to the Funds. In addition, in the normal course of business, the Funds enter into contracts with their vendors and others that provide for general indemnifications. A Fund's maximum exposure under these arrangements is unknown, as this would involve future claims that may be made against the Funds. However, based on experience, the Funds expect that risk of loss to be remote.
2. Significant Accounting Policies:
The following is a summary of significant accounting policies followed by the Trust in the preparation of its financial statements. The policies are in conformity with Generally Accepted Accounting Principles in the United States of America ("GAAP"). The preparation of financial statements in accordance with GAAP requires management to make estimates and assumptions that affect the reported amounts of assets and liabilities and disclosure of contingent assets and liabilities at the date of the financial statements and the reported amounts of income and expenses for the period. Actual results could differ from those estimates. The Fund follows the specialized accounting and reporting requirements under GAAP that are applicable to investment companies under Accounting Standards Codification 946.
Investment Valuation:
The Funds record investments at fair value. Fair value is defined as the price that would be received to sell an asset or paid to transfer a liability in an orderly transaction between market participants at the measurement date.
The valuation techniques described below maximize the use of observable inputs and minimize the use of unobservable inputs in determining fair value. The inputs used for valuing the Funds' investments are summarized in the three broad levels listed below:
• Level 1 — quoted prices in active markets for identical securities
64
Victory Portfolios | | Notes to Financial Statements — continued
June 30, 2021 | |
(Unaudited)
• Level 2 — other significant observable inputs (including quoted prices for similar securities or interest rates applicable to those securities, etc.)
• Level 3 — significant unobservable inputs (including the Funds' own assumptions in determining the fair value of investments)
Changes in valuation techniques may result in transfers in or out of an assigned level within the disclosure hierarchy. The inputs or methodologies used for valuation techniques are not necessarily an indication of the risk associated with entering into those investments.
Victory Capital Management Inc. ("VCM" or the "Adviser") has established the Pricing and Liquidity Committee (the "Committee"), and subject to Trust's Board of Trustees' (the "Board") oversight, the Committee administers and oversees the Funds' valuation policies and procedures, which are approved by the Board.
Portfolio securities listed or traded on securities exchanges, including exchange-traded funds ("ETFs") and American Depositary Receipts ("ADRs"), are valued at the closing price on the exchange or system where the security is principally traded, if available, or at the Nasdaq Official Closing Price. If there have been no sales for that day on the exchange or system, then a security is valued at the last available bid quotation on the exchange or system where the security is principally traded. In each of these situations, valuations are typically categorized as Level 1 in the fair value hierarchy.
Investments in open-end investment companies are valued at net asset value ("NAV"). These valuations are typically categorized as Level 1 in the fair value hierarchy.
In the event that price quotations or valuations are not readily available, investments are valued at fair value in accordance with procedures established by and under the general supervision and responsibility of the Board. These valuations are typically categorized as Level 2 or Level 3 in the fair value hierarchy, based on the observability of inputs used to determine the fair value. The effect of fair value pricing is that securities may not be priced on the basis of quotations from the primary market in which they are traded and the actual price realized from the sale of a security may differ materially from the fair value price. Valuing these securities at fair value is intended to cause the Fund's NAV to be more reliable than it otherwise would be.
A summary of the valuations as of June 30, 2021, is included in the table below while the breakdown, by category, of investments is disclosed on the Schedules of Portfolio Investments:
| | | Level 1 | | Level 2 | | Level 3 | | Total | |
RS Small Cap Growth Fund | |
Common Stocks | | $ | 2,870,709,373 | | | $ | 7,242,827 | | | $ | — | | | $ | 2,877,952,200 | | |
Collateral for Securities Loaned | | | 280,518,714 | | | | — | | | | — | | | | 280,518,714 | | |
Total | | $ | 3,151,228,087 | | | $ | 7,242,827 | | | $ | — | | | $ | 3,158,470,914 | | |
RS Select Growth Fund | |
Common Stocks | | $ | 229,064,936 | | | $ | — | | | $ | — | | | $ | 229,064,936 | | |
Collateral for Securities Loaned | | | 5,200,083 | | | | — | | | | — | | | | 5,200,083 | | |
Total | | $ | 234,265,019 | | | $ | — | | | $ | — | | | $ | 234,265,019 | | |
RS Mid Cap Growth Fund | |
Common Stocks | | $ | 457,333,176 | | | $ | — | | | $ | — | | | $ | 457,333,176 | | |
Collateral for Securities Loaned | | | 22,643,008 | | | | — | | | | — | | | | 22,643,008 | | |
Total | | $ | 479,976,184 | | | $ | — | | | $ | — | | | $ | 479,976,184 | | |
RS Growth Fund | |
Common Stocks | | $ | 323,657,952 | | | $ | — | | | $ | — | | | $ | 323,657,952 | | |
Collateral for Securities Loaned | | | 9,948,087 | | | | — | | | | — | | | | 9,948,087 | | |
Total | | $ | 333,606,039 | | | $ | — | | | $ | — | | | $ | 333,606,039 | | |
65
Victory Portfolios | | Notes to Financial Statements — continued
June 30, 2021 | |
(Unaudited)
| | | Level 1 | | Level 2 | | Level 3 | | Total | |
RS Science and Technology Fund | |
Common Stocks | | $ | 438,401,335 | | | $ | 4,326,149 | | | $ | — | | | $ | 442,727,484 | | |
Warrants | | | 126,287 | | | | 92,846 | | | | — | | | | 219,133 | | |
Collateral for Securities Loaned | | | 35,671,595 | | | | — | | | | — | | | | 35,671,595 | | |
Total | | $ | 474,199,217 | | | $ | 4,418,995 | | | $ | — | | | $ | 478,618,212 | | |
RS Small Cap Equity Fund | |
Common Stocks | | $ | 80,638,355 | | | $ | — | | | $ | — | | | $ | 80,638,355 | | |
Collateral for Securities Loaned | | | 15,238,085 | | | | — | | | | — | | | | 15,238,085 | | |
Total | | $ | 95,876,440 | | | $ | — | | | $ | — | | | $ | 95,876,440 | | |
For the six months ended June 30, 2021, there were no transfers in or out of Level 3 in the fair value hierarchy.
Real Estate Investment Trusts ("REITs"):
The Funds may invest in REITs, which report information on the source of their distributions annually. REITs are pooled investment vehicles that invest primarily in income-producing real estate or real-estate related loans or interests (such as mortgages). Certain distributions received from REITs during the year are recorded as realized gains or return of capital as estimated by the Funds or when such information becomes known.
Investment Companies:
Open-End Funds:
The Funds may invest in portfolios of open-end investment companies. These investment companies value securities in their portfolios for which market quotations are readily available at their market values (generally the last reported sale price) and all other securities and assets at their fair value by the methods established by the board of directors of the underlying funds.
Securities Purchased on a Delayed-Delivery or When-Issued Basis:
The Funds may purchase securities on a delayed-delivery or when-issued basis. Delivery and payment for securities that have been purchased by a Fund on a delayed-delivery or when-issued basis or for delayed draws on loans can take place a month or more after the trade date. At the time a Fund makes the commitment to purchase a security on a when-issued basis, the Fund records the transaction and reflects the value of the security in determining net asset value. No interest accrues to the Fund until the transaction settles and payment takes place. Normally, the settlement date occurs within one month or more of the purchase. A segregated account is established and the Fund maintains cash and/or marketable securities at least equal in value to commitments for when-issued securities. If a Fund owns when-issued securities, these values are included in Payable for investments purchased on the accompanying Statements of Assets and Liabilities and the segregated assets are identified on the Schedules of Portfolio Investments.
Private Investments in Public Companies:
The RS Science and Technology Fund may acquire common stock or a security convertible into common stock, such as a warrant or convertible preferred stock, directly from an issuer seeking to raise capital in a private placement pursuant to Regulation D under the 1933 Act. These transactions are commonly referred to as a private placement in a publicly-held company, or "PIPE." The issuer's common stock is usually publicly traded on a U.S. securities exchange or in the OTC market, but the securities acquired will be subject to restrictions on resale imposed by U.S. securities laws absent an effective registration
66
Victory Portfolios | | Notes to Financial Statements — continued
June 30, 2021 | |
(Unaudited)
statement. In recognition of the illiquid nature of the securities being acquired, the purchase price paid in a PIPE transaction (or the conversion price of the convertible securities being acquired) will typically be fixed at a discount to the prevailing market price of the issuer's common stock at the time of the transaction. As part of a PIPE transaction, the issuer usually will be contractually obligated to seek to register within an agreed upon period of time for public resale under the U.S. securities laws the common stock or the shares of common stock issuable upon conversion of the convertible securities. If the issuer fails to so register the shares within that period, the buyer may be entitled to additional consideration from the issuer (e.g. warrants to acquire additional shares of common stock), but the buyer may not be able to sell its shares unless and until the registration process is successfully completed. Thus PIPE transactions present certain risks not associated with open market purchases of equities.
Investment Transactions and Related Income:
Changes in holdings of investments are accounted for no later than one business day following the trade date. For financial reporting purposes, however, investment transactions are accounted for on trade date on the last business day of the reporting period. Interest income is determined on the basis of coupon interest accrued using the effective interest method which adjusts, where applicable, the amortization of premiums or accretion of discounts. Dividend income is recorded on the ex-dividend date. Gains or losses realized on sales of securities are recorded on the identified cost basis. Paydown gains or losses on applicable securities, if any, are recorded as components of Interest income on the Statements of Operations.
Withholding taxes on interest, dividends and gains as a result of certain investments in ADRs by the Funds have been provided for in accordance with each investment's applicable country's tax rules and rates.
Securities Lending:
The Trust has entered into a Master Securities Lending Agreement ("MSLA") with Citibank, N.A. ("Citibank"). Under the terms of the MSLA, the Funds may lend securities to certain broker-dealers, and banks, in exchange for collateral in the amount of at least 102% of the value of U.S. securities loaned or at least 105% of the value of non-U.S. securities loaned, marked-to-market daily. Any collateral shortfalls associated with increases in the valuation of the securities loaned are adjusted the next business day. The collateral can be received in the form of cash collateral and/or non-cash collateral. Non-cash collateral can include U.S. Government Securities, letters of credit and certificates of deposit. The cash collateral is invested in short-term instruments or cash equivalents, primarily open-end investment companies, as noted on the Funds' Schedules of Portfolio Investments. The Trust does not have effective control of the non-cash collateral and therefore it is not disclosed on the Funds' Schedules of Portfolio Investments. During the time portfolio securities are on loan, the borrower will pay the Funds any dividends or interest paid on such securities plus any fee negotiated between the parties to the lending agreement. The Funds also earn a return from the collateral. The Funds pay Citibank various fees in connection with the investment of cash collateral and fees based on the investment income received from securities lending activities. Securities lending income (net of these fees) is disclosed on the Statements of Operations. Although risk is mitigated by the collateral, the Fund could experience a delay in recovering its securities and possible loss of income or value if the borrower fails to return them.
Securities lending transactions are entered into by a Fund under the MSLA, which permits the Fund, under certain circumstances such as an event of default, to offset amounts payable by the Fund to the same counterparty against amounts receivable from the counterparty to create a net payment due to or from the Fund.
67
Victory Portfolios | | Notes to Financial Statements — continued
June 30, 2021 | |
(Unaudited)
The following table is a summary of the Funds' securities lending transactions which are subject to offset under the MSLA as of June 30, 2021. These transactions are accounted for as secured borrowings with an overnight and continuous contractual maturity for cash collateral, and greater than overnight and continuous contractual maturity for non-cash collateral.
| | | Gross Amount of
Recognized | | Value of
Cash | | Value of Non-cash Collateral
Received by Maturity | | | |
| | | Assets (Value of
Securities on Loan) | | Collateral
Received* | | <30
Days | | Between
30 & 90 days | | >90
Days | | Net
Amount | |
RS Small Cap Growth Fund | | $ | 274,460,222 | | | $ | 274,460,222 | | | $ | — | | | $ | — | | | $ | — | | | $ | — | | |
RS Select Growth Fund | | | 5,100,591 | | | | 5,100,591 | | | | — | | | | — | | | | — | | | | — | | |
RS Mid Cap Growth Fund | | | 21,939,015 | | | | 21,939,015 | | | | — | | | | — | | | | — | | | | — | | |
RS Growth Fund | | | 9,707,512 | | | | 9,707,512 | | | | — | | | | — | | | | — | | | | — | | |
RS Science and Technology Fund | | | 34,745,817 | | | | 34,745,817 | | | | — | | | | — | | | | — | | | | — | | |
RS Small Cap Equity Fund | | | 14,707,983 | | | | 14,707,983 | | | | — | | | | — | | | | — | | | | — | | |
* Collateral received in excess of the market value of securities on loan is not presented in this table. The total cash collateral received by each Fund is disclosed on the Statements of Assets and Liabilities.
Federal Income Taxes:
It is the policy of each Fund to continue to qualify as a regulated investment company by complying with the provisions available to certain investment companies, as defined in applicable sections of the Internal Revenue Code, and to make distributions of net investment income and net realized gains sufficient to relieve it from all, or substantially all, federal income taxes. Accordingly, no provision for federal income taxes is required in the financial statements. The Funds have a tax year end of December 31.
Management of the Funds has reviewed tax positions taken in tax years that remain subject to examination by all major tax jurisdictions, including federal (i.e., the last four tax years, which includes the current fiscal tax year end). Management believes that there is no tax liability resulting from unrecognized tax benefits related to uncertain tax positions taken.
Allocations:
Expenses directly attributable to the Funds are charged to the Funds, while expenses that are attributable to more than one fund in the Trust, or jointly with an affiliated trust, are allocated among the respective funds in the Trust and/or affiliated trust based upon net assets or another appropriate basis.
Income, expenses (other than class-specific expenses such as transfer agent fees, state registration fees, 12b-1 fees, and printing fees), and realized and unrealized gains or losses on investments are allocated to each class of shares based on its relative net assets on the date income is earned or expenses and realized and unrealized gains and losses are incurred.
3. Purchases and Sales:
Purchases and sales of securities (excluding securities maturing less than one year from acquisition) for the six months ended June 30, 2021, were as follows.
| | | Excluding
U.S. Government Securities | |
| | | Purchases | | Sales | |
RS Small Cap Growth Fund | | $ | 1,380,860,095 | | | $ | 1,412,488,623 | | |
| RS Select Growth Fund | | | 97,264,964 | | | | 118,674,142 | | |
| RS Mid Cap Growth Fund | | | 225,234,150 | | | | 406,085,223 | | |
68
Victory Portfolios | | Notes to Financial Statements — continued
June 30, 2021 | |
(Unaudited)
| | | Excluding
U.S. Government Securities | |
| | | Purchases | | Sales | |
RS Growth Fund | | $ | 86,829,587 | | | $ | 101,848,998 | | |
| RS Science and Technology Fund | | | 115,792,189 | | | | 130,174,676 | | |
| RS Small Cap Equity Fund | | | 45,521,965 | | | | 50,495,149 | | |
For the six months ended June 30, 2021, there were no purchases or sales of U.S. Government Securities.
4. Fees and Transactions with Affiliates and Related Parties:
Investment Advisory Fees:
Investment advisory services are provided to the Funds by the Adviser, which is a New York corporation registered as an investment adviser with the Securities and Exchange Commission ("SEC"). The Adviser is an indirect wholly owned subsidiary of Victory Capital Holdings, Inc., a publicly traded Delaware corporation, and a wholly owned direct subsidiary of Victory Capital Operating, LLC.
Under the terms of the Investment Advisory Agreement, the Adviser is entitled to receive fees based on a percentage of the average daily net assets of each Fund. The rates at which the Adviser is paid by each Fund are included in the table below.
| | | Flat Rate | |
RS Small Cap Growth Fund | | | 0.95 | % | |
RS Select Growth Fund | | | 1.00 | % | |
RS Mid Cap Growth Fund | | | 0.85 | % | |
RS Growth Fund | | | 0.75 | % | |
RS Science and Technology Fund | | | 1.00 | % | |
RS Small Cap Equity Fund | | | 0.75 | % | |
Amounts incurred and paid to VCM for the six months ended June 30, 2021, are reflected on the Statements of Operations as Investment advisory fees.
Administration and Servicing Fees:
VCM serves as the Funds' administrator and fund accountant. Under the Administration and Fund Accounting Agreement, VCM is entitled to receive fees based on a percentage of the average daily net assets of the Trust, Victory Variable Insurance Funds and Victory Portfolios II (collectively, the "Victory Funds Complex"). The tiered rates at which VCM is paid by the Funds are shown in the table below:
| Assets up to $15 billion | | Assets $15 billion - $30 billion | | Assets over $30 billion | |
| | 0.08 | %, plus | | | 0.05 | %, plus | | | 0.04 | % | |
Amounts incurred for the six months ended June 30, 2021, are reflected on the Statements of Operations as Administration fees.
Citi Fund Services Ohio, Inc. ("Citi"), an affiliate of Citibank, acts as sub-administrator and sub-fund accountant to the Fund pursuant to the Sub-Administration and Sub-Fund Accounting Services Agreement between VCM and Citi. VCM pays Citi a fee for providing these services. The Trust reimburses VCM and Citi for out-of-pocket expenses incurred in providing these services and certain other expenses specifically allocated to the Fund. Amounts incurred for the six months ended June 30, 2021, are reflected on the Statements of Operations as Sub-Administration fees.
The Chief Compliance Officer ("CCO") is an employee of the Adviser, which pays the compensation of the CCO and his support staff. The Trust has entered into an agreement to provide compliance services with the Adviser, pursuant to which the Adviser furnishes its compliance personnel, including the services of the CCO, and other resources reasonably necessary to provide the Trust with compliance oversight services related to the design, administration and oversight of a compliance program for the Trust in accordance with Rule 38a-1 under the 1940 Act. The funds in the Victory Funds Complex, in aggregate, compensate the Adviser for these services. Amounts incurred for the six months ended June 30, 2021, are reflected on the Statements of Operations as Compliance fees.
69
Victory Portfolios | | Notes to Financial Statements — continued
June 30, 2021 | |
(Unaudited)
Transfer Agency Fees:
FIS Investor Services, LLC ("FIS") serves as the Funds' transfer agent. Under the Transfer Agent Agreement, the Trust pays FIS a fee for its services and reimburses FIS for all of their reasonable out-of-pocket expenses incurred in providing these services. Amounts incurred for the six months ended June 30, 2021, are reflected on the Statements of Operations as Transfer agent fees.
Victory Capital Transfer Agency, Inc., an affiliate of the Adviser, serves as sub-transfer agent for the Member Class shares of the Funds and receives no fee or other compensation for these services.
Distributor/Underwriting Services:
Victory Capital Services, Inc. (the "Distributor"), an affiliate of the Adviser, serves as distributor for the continuous offering of the shares of the Funds pursuant to a Distribution Agreement between the Distributor and the Trust. Pursuant to the Distribution and Service Plans adopted in accordance with Rule 12b-1 under the 1940 Act, the Distributor may receive a monthly distribution and service fee as shown in the table below:
| | | Class A | | Class C | | Class R | | Class R6 | | Class Y | | Member Class | |
RS Small Cap Growth Fund | | | 0.25 | % | | | 1.00 | % | | | 0.50 | % | | | 0.00 | % | | | 0.00 | % | | | N/A | | |
RS Select Growth Fund | | | 0.25 | % | | | 1.00 | % | | | 0.50 | % | | | 0.00 | % | | | 0.00 | % | | | N/A | | |
RS Mid Cap Growth Fund | | | 0.25 | % | | | 1.00 | % | | | 0.50 | % | | | 0.00 | % | | | 0.00 | % | | | 0.00 | % | |
RS Growth Fund | | | 0.25 | % | | | 1.00 | % | | | 0.50 | % | | | N/A | | | | 0.00 | % | | | N/A | | |
RS Science and Technology Fund | | | 0.25 | % | | | 1.00 | % | | | 0.50 | % | | | N/A | | | | 0.00 | % | | | N/A | | |
RS Small Cap Equity Fund | | | 0.25 | % | | | 1.00 | % | | | 0.50 | % | | | N/A | | | | 0.00 | % | | | 0.00 | % | |
The distribution and service fees paid to the Distributor may be used by the Distributor to pay for activities primarily intended to result in the sale of Class A, Class C, and Class R. Amounts incurred for the six months ended June 30, 2021, are reflected on the Statements of Operations as 12b-1 fees.
In addition, the Distributor is entitled to receive commissions on sale of the Class A. For the six months ended June 30, 2021, the Distributor received approximately $20,016 from commissions earned on the sale of Class A.
Other Fees:
Citibank serves as the Funds' custodian. The Funds pay Citibank a fee for providing these services. Amounts incurred for the six months ended June 30, 2021, are reflected on the Statements of Operations as Custodian fees.
Sidley Austin LLP provides legal services to the Trust.
The Adviser has entered into expense limitation agreements with certain Funds. Under the terms of the agreements, the Adviser has agreed to waive fees or reimburse certain expenses to the extent that ordinary operating expenses incurred by certain classes of a Fund in any fiscal year exceed the expense limit for such classes of the Fund. Such excess amounts will be the liability of the Adviser. Acquired fund fees and expense, interest, taxes, brokerage commissions, other expenditures that are capitalized in accordance with GAAP, and other extraordinary expenses not incurred in the ordinary course of a Fund's business are excluded from the expense limits. As of June 30, 2021, the expense limits (excluding voluntary waivers) are as follows:
| | | In effect until April 30, 2022 | |
| | | Class A | | Class C | | Class R | | Class R6 | | Class Y | | Member Class | |
RS Small Cap Growth Fund | | | 1.40 | % | | | 2.16 | % | | | 1.86 | % | | | 1.06 | % | | | 1.13 | % | | | N/A | | |
RS Select Growth Fund | | | 1.40 | % | | | 2.18 | % | | | 1.91 | % | | | 1.06 | % | | | 1.14 | % | | | N/A | | |
RS Mid Cap Growth Fund | | | 1.20 | % | | | 2.11 | % | | | 1.80 | % | | | 0.94 | % | | | 0.95 | % | | | 1.05 | % | |
RS Growth Fund | | | 1.10 | % | | | 1.93 | % | | | 1.71 | % | | | N/A | | | | 0.83 | % | | | N/A | | |
RS Science and Technology Fund | | | 1.49 | % | | | 2.28 | % | | | 1.93 | % | | | N/A | | | | 1.24 | % | | | N/A | | |
RS Small Cap Equity Fund | | | 1.35 | % | | | 2.10 | % | | | 1.75 | % | | | N/A | | | | 1.10 | % | | | 1.15 | % | |
70
Victory Portfolios | | Notes to Financial Statements — continued
June 30, 2021 | |
(Unaudited)
Under the terms of the expense limitation agreements, amended May 1, 2021, the Funds have agreed to repay fees and expenses that were waived or reimbursed by the Adviser for a period of up to three years (thirty six (36) months) after the waiver or reimbursement took place, subject to the lesser of any operating expense limits in effect at the time of: (a) the original waiver or expense reimbursement; or (b) the recoupment, after giving effect to the recoupment amount. Prior to May 1, 2021, the Funds were permitted to recoup fees waived and expenses reimbursed for up to three years after the fiscal year in which the waiver or reimbursement took place, subject to the limitations above. This change did not have any effect on the amounts previously reported for recoupment.
As of June 30, 2021, the following amounts are available to be repaid to the Adviser. The Funds have not recorded any amounts available to be repaid as a liability due to an assessment that such repayment is not probable at June 30, 2021.
| | | Expires
2021 | | Expires
2022 | | Expires
2023 | | Expires
2024 | | Total | |
RS Small Cap Growth Fund | | $ | 293,922 | | | $ | 506,151 | | | $ | 489,756 | | | $ | 122,065 | | | $ | 1,411,894 | | |
RS Select Growth Fund | | | 141,722 | | | | 285,457 | | | | 227,571 | | | | 90,962 | | | | 745,712 | | |
RS Mid Cap Growth Fund | | | 204,568 | | | | 681,628 | | | | 759,444 | | | | 402,127 | | | | 2,047,767 | | |
RS Growth Fund | | | 145,836 | | | | 288,176 | | | | 294,950 | | | | 117,801 | | | | 846,763 | | |
RS Science and Technology Fund | | | 17,418 | | | | 41,114 | | | | 37,306 | | | | 288 | | | | 96,126 | | |
RS Small Cap Equity Fund | | | 15,435 | | | | 30,362 | | | | 40,673 | | | | 29,335 | | | | 115,805 | | |
The Adviser may voluntarily waive or reimburse additional fees to assist the Funds in maintaining competitive expense ratios. Voluntary waivers and reimbursements applicable to the Funds are not available to be recouped at a future time. There were no voluntary waivers or reimbursements for the six months ended June 30, 2021.
Certain officers and/or interested trustees of the Fund are also officers and/or employees of the Adviser, administrator, fund accountant, sub-administrator, sub-fund accountant, custodian, legal counsel and Distributor.
5. Risks:
The Funds may be subject to other risks in addition to these identified risks.
Equity Risk — The value of the equity securities in which the Fund invests may decline in response to developments affecting individual companies and/or general economic conditions in the United States or abroad. A company's earnings or dividends may not increase as expected (or may decline) because of poor management, competitive pressures, reliance on particular suppliers or geographical regions, labor problems or shortages, corporate restructurings, fraudulent disclosures, man-made or natural disasters, military confrontations or wars, terrorism, public health crises, or other events, conditions and factors. Price changes may be temporary or last for extended periods.
Stock Market Risk — Overall stock market risks may affect the value of the Fund. Domestic and international factors such as political events, war, trade disputes, interest rate levels and other fiscal and monetary policy changes, pandemics and other public health crises and related geopolitical events, as well as environmental disasters such as earthquakes, fire and floods, may add to instability in world economies and markets generally. The impact of these and other factors may be short-term or may last for extended periods.
Sector Risk — To the extent the Funds focus in one or more sectors, market or economic factors impacting those sectors could have a significant effect on the value of the Funds' investments and could make the Funds' performance more volatile. For example, the values of companies in the Information Technology sector are particularly vulnerable to economic downturns, short product cycles and aggressive pricing, market competition and changes in government regulation.
Concentration Risk — The RS Science and Technology Fund (herein, the "Fund") may concentrate its investments in a particular industry, as the term "concentration" is used in the 1940 Act. Concentrating
71
Victory Portfolios | | Notes to Financial Statements — continued
June 30, 2021 | |
(Unaudited)
investments in the Science and Technology-related sectors increases the risk of loss because the stocks of many or all of the companies in the sectors may decline in value due to developments adversely affecting the sectors. In addition, investors may buy or sell substantial amounts of the Fund's shares in response to factors affecting or expected to affect the sectors, resulting in extreme inflows and outflows of cash into and out of the Fund. Such inflows or outflows might affect management of the Fund adversely to the extent they cause the Fund's cash position or cash requirements to exceed normal levels.
Geopolitical/Natural Disaster Risk — Global economies and financial markets are increasingly interconnected, which increases the possibilities that conditions in one country or region might adversely affect issuers in another country or region. Geopolitical and other risks, including war, terrorism, trade disputes, political or economic dysfunction within some nations, public health crises and related geopolitical events, as well as environmental disasters such as earthquakes, fires, and floods, may add to instability in world economies and markets generally. Changes in trade policies and international trade agreements could affect the economies of many countries in unpredictable ways. Likewise, systemic market dislocations of the kind that occurred during the financial crisis that began in 2008, if repeated, would be highly disruptive to economies and markets, adversely affecting individual companies and industries, securities markets, interest rates, credit ratings, inflation, investor sentiment, and other factors affecting the value of a Fund's investments. Some countries, including the United States, are adopting more protectionist trade policies and moving away from the tighter financial industry regulations that followed the 2008 financial crisis, which may also affect the value of a Fund's investments.
Political events within the United States at times have resulted, and may in the future result, in a shutdown of government services, which could negatively affect the U.S. economy, decrease the value of a Fund's investments, increase uncertainty in or impair the operation of the U.S. or other securities markets, and degrade investor and consumer confidence, perhaps suddenly and to a significant degree.
Private Investments in Public Companies Risk — The risks associated with PIPE transactions that the RS Science and Technology Fund invests is that the issuer may be unable to register the shares for public resale in a timely manner or at all, in which case the shares may be sold only in a privately negotiated transaction, typically at a price less than that paid, assuming a suitable buyer can be found. Disposing of the securities may involve time-consuming negotiation and legal expenses, and selling them promptly at an acceptable price may be difficult or impossible. Even if the shares are registered for public resale, the market for the issuer's securities may nevertheless be "thin" or illiquid, making the sale of securities at desired prices or in desired quantities difficult or impossible. While private placements may offer attractive opportunities not otherwise available in the open market, the securities purchased are usually "restricted securities" or are "not readily marketable." Restricted securities cannot be sold without being registered under the 1933 Act, unless they are sold pursuant to an exemption from registration (such as Rules 144 or 144A under the 1933 Act). Securities that are not readily marketable are subject to other legal or contractual restrictions on resale.
6. Borrowing and Interfund Lending:
Line of Credit:
The Victory Funds Complex participates in a short-term demand note "Line of Credit" agreement with Citibank. The Line of Credit agreement with Citibank was renewed on June 29, 2021, with a termination date of June 27, 2022. Under the agreement with Citibank, the Victory Funds Complex may borrow up to $600 million, of which $300 million is committed and $300 million is uncommitted. $40 million of the Line of Credit is reserved for use by the Victory Floating Rate Fund, another series of the Victory Funds Complex, with Victory Floating Rate Fund paying the related commitment fees for that amount. The purpose of the Line of Credit is to meet temporary or emergency cash needs. For the six months ended June 30, 2021, Citibank received an annual commitment fee of 0.15% on $300 million for providing the Line of Credit. Each fund in the Victory Funds Complex pays a pro-rata portion of the commitment fees plus any interest (one month LIBOR plus one percent) on amounts borrowed. For the period June 29, 2020, through April 30, 2021, under an amended Line of Credit agreement, Citibank received an annual upfront fee of 0.10% on the $300 million committed line of credit. Each fund in the
72
Victory Portfolios | | Notes to Financial Statements — continued
June 30, 2021 | |
(Unaudited)
Victory Funds Complex paid a pro-rata portion of the upfront fee. Effective with the renewal, the annual commitment fee of 0.15% remains unchanged and the upfront fee of 0.10% was discontinued. Interest charged to each Fund during the period, if applicable, is reflected on the Statements of Operations under Line of credit fees.
The Funds had no borrowings under the Line of Credit during the six months ended June 30, 2021.
Interfund Lending:
The Trust and Adviser rely on an exemptive order granted by the SEC in March 2017 (the "Order"), permitting the establishment and operation of an Interfund Lending Facility (the "Facility"). The Facility allows each Fund to directly lend and borrow money to or from any other fund in the Victory Funds Complex that is permitted to participate in the Facility, relying upon the Order at rates beneficial to both the borrowing and lending funds. Advances under the Facility are allowed for temporary or emergency purposes, including the meeting of redemption requests that otherwise might require the untimely disposition of securities, and are subject to each Fund's borrowing restrictions. The interfund loan rate is determined, as specified in the Order, by averaging the current repurchase agreement rate and the current bank loan rate. As a Borrower, interest charged to each Fund during the period, if applicable, is presented on the Statements of Operations under Interfund lending fees. As a Lender, interest earned by each Fund during the period, if applicable, is presented on the Statements of Operations under Interest expense on interfund lending.
The average borrowing or lending for the days outstanding and average interest rate for the Funds that utilized or participated in the Facility during the six months ended June 30, 2021, were as follows:
| | | Borrower
or Lender | | Amount
Outstanding at
June 30, 2021 | | Average
Borrowing* | | Days
Borrowing
Outstanding | | Average
Interest
Rate | | Maximum
Borrowing
During the
Period | |
RS Select Growth
Fund | | Borrower | | $ | — | | | $ | 3,492,500 | | | | 2 | | | | 0.57 | % | | $ | 3,837,000 | | |
RS Mid Cap Growth
Fund | | Borrower | | | — | | | | 6,020,000 | | | | 2 | | | | 0.56 | % | | | 10,776,000 | | |
RS Growth Fund | | Borrower | | | — | | | | 1,339,000 | | | | 1 | | | | 0.57 | % | | | 1,339,000 | | |
RS Science and
Technology Fund | | Borrower | | | — | | | | 1,781,000 | | | | 1 | | | | 0.57 | % | | | 1,781,000 | | |
* For the six months ended June 30, 2021, based on the number of days borrowings were outstanding.
7. Federal Income Tax Information:
Dividends from net investment income, if any, are declared and paid as noted in the table below. Distributable net realized gains, if any, are declared and distributed at least annually from each Fund.
| | | Declared | | Paid | |
RS Small Cap Growth Fund | | Annually | | Annually | |
RS Select Growth Fund | | Annually | | Annually | |
RS Mid Cap Growth Fund | | Annually | | Annually | |
RS Growth Fund | | Annually | | Annually | |
RS Science and Technology Fund | | Annually | | Annually | |
RS Small Cap Equity Fund | | Annually | | Annually | |
The amounts of dividends from net investment income and distributions from net realized gains (collectively, distributions to shareholders) are determined in accordance with federal income tax regulations, which may differ from GAAP. To the extent these "book/tax" differences are permanent in nature (e.g., net operating loss and distribution reclassification), such amounts are reclassified within the components of net assets based on their federal tax-basis treatment; temporary differences (e.g., wash sales) do not require reclassification. To the extent dividends and distributions exceed net investment income and net realized gains for tax purposes, they are reported as distributions of capital.
73
Victory Portfolios | | Notes to Financial Statements — continued
June 30, 2021 | |
(Unaudited)
Net investment losses incurred by a Fund may be reclassified as an offset to capital on the accompanying Statements of Assets and Liabilities.
The tax character of current year distributions paid and the tax basis of the current components of accumulated earnings (deficit) will be determined at the end of the current tax year ending December 31, 2021.
As of the tax year ended December 31, 2020, the Funds had no net capital loss carryforwards.
74
Victory Portfolios | | Supplemental Information
June 30, 2021 | |
(Unaudited)
Proxy Voting and Portfolio Holdings Information
Proxy Voting:
Information regarding the policies and procedures the Funds use to determine how to vote proxies relating to portfolio securities is available without charge, upon request, by calling 800-539-3863. The information is also included in the Funds' Statement of Additional Information, which is available on the SEC's website at www.sec.gov.
Information relating to how the Funds voted proxies relating to portfolio securities held during the most recent 12 months ended June 30 is available on the SEC's website at www.sec.gov.
Availability of Schedules of Portfolio Investments:
The Trust files a complete list of Schedules of Portfolio Investments with the SEC for the first and third quarter of each fiscal year on Form N-PORT. Forms N-PORT is available on the SEC's website at www.sec.gov.
Expense Examples
As a shareholder of the Funds, you may incur two types of costs: (1) transaction costs, including sales charges (loads) on purchases; and (2) ongoing costs, including management fees, distribution and service (12b-1) fees and other Fund expenses. These examples are intended to help you understand your ongoing costs (in dollars) of investing in the Funds and to compare these costs with the ongoing costs of investing in other mutual funds.
These examples are based on an investment of $1,000 invested at the beginning of the period and held for the entire period from January 1, 2021, through June 30, 2021.
The Actual Expense figures in the table below provide information about actual account values and actual expenses. You may use the information below, together with the amount you invested, to estimate the expenses that you paid over the period. Simply divide your account value by $1,000 (for example, an $8,600 account value divided by $1,000 = 8.6), then multiply the result by the number in the table under the heading entitled "Actual Expenses Paid During Period" to estimate the expenses you paid on your account during this period.
The Hypothetical Expense figures in the table below provide information about hypothetical account values and hypothetical expenses based on the Fund's actual expense ratio and an assumed rate of return of 5% per year before expenses, which is not the Fund's actual return. The hypothetical account values and expenses may not be used to estimate the actual ending account balance or expenses you paid for the period. You may use this information to compare this 5% hypothetical example with the 5% hypothetical examples that appear in shareholder reports of other funds.
Please note the expenses shown in the table below are meant to highlight your ongoing costs only and do not reflect any transactional costs. If these transactional costs were included, your costs would have been higher.
| | | Beginning
Account
Value
1/1/21 | | Actual
Ending
Account
Value
6/30/21 | | Hypothetical
Ending
Account
Value
6/30/21 | | Actual
Expenses
Paid
During
Period
1/1/21-
6/30/21* | | Hypothetical
Expenses
Paid
During
Period
1/1/21-
6/30/21* | | Annualized
Expense
Ratio
During
Period
1/1/21-
6/30/21 | |
RS Small Cap Growth Fund | |
Class A | | $ | 1,000.00 | | | $ | 1,002.70 | | | $ | 1,017.85 | | | $ | 6.95 | | | $ | 7.00 | | | | 1.40 | % | |
Class C | | | 1,000.00 | | | | 999.00 | | | | 1,014.08 | | | | 10.71 | | | | 10.79 | | | | 2.16 | % | |
Class R | | | 1,000.00 | | | | 1,001.00 | | | | 1,016.22 | | | | 8.58 | | | | 8.65 | | | | 1.73 | % | |
Class R6 | | | 1,000.00 | | | | 1,004.40 | | | | 1,019.64 | | | | 5.17 | | | | 5.21 | | | | 1.04 | % | |
Class Y | | | 1,000.00 | | | | 1,004.00 | | | | 1,019.19 | | | | 5.61 | | | | 5.66 | | | | 1.13 | % | |
RS Select Growth Fund | |
Class A | | | 1,000.00 | | | | 1,085.90 | | | | 1,017.85 | | | | 7.24 | | | | 7.00 | | | | 1.40 | % | |
Class C | | | 1,000.00 | | | | 1,081.60 | | | | 1,013.98 | | | | 11.25 | | | | 10.89 | | | | 2.18 | % | |
Class R | | | 1,000.00 | | | | 1,082.80 | | | | 1,015.32 | | | | 9.86 | | | | 9.54 | | | | 1.91 | % | |
Class R6 | | | 1,000.00 | | | | 1,087.50 | | | | 1,019.54 | | | | 5.49 | | | | 5.31 | | | | 1.06 | % | |
Class Y | | | 1,000.00 | | | | 1,087.00 | | | | 1,019.14 | | | | 5.90 | | | | 5.71 | | | | 1.14 | % | |
75
Victory Portfolios | | Supplemental Information — continued
June 30, 2021 | |
(Unaudited)
| | | Beginning
Account
Value
1/1/21 | | Actual
Ending
Account
Value
6/30/21 | | Hypothetical
Ending
Account
Value
6/30/21 | | Actual
Expenses
Paid
During
Period
1/1/21-
6/30/21* | | Hypothetical
Expenses
Paid
During
Period
1/1/21-
6/30/21* | | Annualized
Expense
Ratio
During
Period
1/1/21-
6/30/21 | |
RS Mid Cap Growth Fund | |
Class A | | $ | 1,000.00 | | | $ | 1,066.40 | | | $ | 1,018.84 | | | $ | 6.15 | | | $ | 6.01 | | | | 1.20 | % | |
Class C | | | 1,000.00 | | | | 1,061.60 | | | | 1,014.58 | | | | 10.53 | | | | 10.29 | | | | 2.06 | % | |
Class R | | | 1,000.00 | | | | 1,063.00 | | | | 1,015.87 | | | | 9.21 | | | | 9.00 | | | | 1.80 | % | |
Class R6 | | | 1,000.00 | | | | 1,067.50 | | | | 1,020.13 | | | | 4.82 | | | | 4.71 | | | | 0.94 | % | |
Class Y | | | 1,000.00 | | | | 1,067.50 | | | | 1,020.08 | | | | 4.87 | | | | 4.76 | | | | 0.95 | % | |
Member Class | | | 1,000.00 | | | | 1,066.90 | | | | 1,019.59 | | | | 5.38 | | | | 5.26 | | | | 1.05 | % | |
RS Growth Fund | |
Class A | | | 1,000.00 | | | | 1,106.10 | | | | 1,019.34 | | | | 5.74 | | | | 5.51 | | | | 1.10 | % | |
Class C | | | 1,000.00 | | | | 1,101.60 | | | | 1,015.22 | | | | 10.06 | | | | 9.64 | | | | 1.93 | % | |
Class R | | | 1,000.00 | | | | 1,102.40 | | | | 1,016.31 | | | | 8.91 | | | | 8.55 | | | | 1.71 | % | |
Class Y | | | 1,000.00 | | | | 1,107.40 | | | | 1,020.68 | | | | 4.34 | | | | 4.16 | | | | 0.83 | % | |
RS Science and Technology Fund | |
Class A | | | 1,000.00 | | | | 1,034.90 | | | | 1,017.55 | | | | 7.37 | | | | 7.30 | | | | 1.46 | % | |
Class C | | | 1,000.00 | | | | 1,030.60 | | | | 1,013.79 | | | | 11.18 | | | | 11.08 | | | | 2.22 | % | |
Class R | | | 1,000.00 | | | | 1,032.30 | | | | 1,015.22 | | | | 9.73 | | | | 9.64 | | | | 1.93 | % | |
Class Y | | | 1,000.00 | | | | 1,036.00 | | | | 1,018.79 | | | | 6.11 | | | | 6.06 | | | | 1.21 | % | |
RS Small Cap Equity Fund | |
Class A | | | 1,000.00 | | | | 1,027.20 | | | | 1,018.74 | | | | 6.13 | | | | 6.11 | | | | 1.22 | % | |
Class C | | | 1,000.00 | | | | 1,026.10 | | | | 1,014.38 | | | | 10.55 | | | | 10.49 | | | | 2.10 | % | |
Class R | | | 1,000.00 | | | | 1,024.20 | | | | 1,016.12 | | | | 8.78 | | | | 8.75 | | | | 1.75 | % | |
Class Y | | | 1,000.00 | | | | 1,027.80 | | | | 1,019.34 | | | | 5.53 | | | | 5.51 | | | | 1.10 | % | |
Member Class | | | 1,000.00 | | | | 1,027.20 | | | | 1,019.09 | | | | 5.78 | | | | 5.76 | | | | 1.15 | % | |
* Expenses are equal to the average account value multiplied by the Fund's annualized expense ratio multiplied by 181/365 (the number of days in the most recent fiscal half-year divided by the number of days in the fiscal year).
76
Victory Portfolios | | Supplemental Information — continued
June 30, 2021 | |
(Unaudited)
Liquidity Risk Management Program:
The Victory Funds have adopted and implemented a written liquidity risk management program (the "LRMP") as required by Rule 22e-4 under the Investment Company Act of 1940, as amended. The LRMP is reasonably designed to assess and manage each Fund's liquidity risk, taking into consideration each Fund's investment strategy and the liquidity of its portfolio investments during normal and reasonably foreseeable stressed market conditions; its short- and long-term cash flow projections; and its cash holdings and access to other liquidity management tools such as available funding sources including the Victory Funds Complex Interfund Lending Facility and Line of Credit (discussed in the Notes to Financial Statements). The Victory Funds' Board of Trustees approved the appointment of the Funds' investment adviser, Victory Capital Management Inc. ("Victory Capital"), as the administrator of the LRMP.
Victory Capital manages liquidity risks associated with the Funds' investments by monitoring, among other things, cash and cash equivalents, any use of derivatives, the concentration of investments, the appropriateness of each Fund's investment strategy, and by classifying every Fund investment as either highly liquid, moderately liquid, less liquid or illiquid on at least a monthly basis. To assist with the classification of Fund investments, Victory Capital has retained a third-party provider of liquidity evaluation services. This provider determines preliminary liquidity classifications for all portfolio holdings based upon portfolio-level data and certain assumptions provided by Victory Capital. Victory Capital reviews the preliminary liquidity classifications and, when appropriate, considers other information including input from the Funds' portfolio managers (including the portfolio managers employed by any investment sub-advisers) in determining final liquidity classifications.
At a meeting held on February 18, 2021, Victory Capital provided an oral and written report to the Trustees on the operation and effectiveness of the LRMP during the previous year. The report from Victory Capital concluded that the Funds did not experience any significant liquidity challenges during the covered period, and the Funds' LRMP is reasonably designed to assess and manage its liquidity risk. The report also concluded that the LRMP continues to operate adequately and effectively to enable Victory Capital to oversee and manage liquidity risk and ensure each Fund is able to meet redemption requests without significant dilution to the remaining investors' interest in each Fund. During the review period, each Fund's portfolio consisted primarily of highly liquid investments, which are defined as cash and any investments that the Fund reasonably expects to be converted to cash in current market conditions in three business days or less without significantly changing the market value of the investment. Therefore, the Funds have not adopted a highly liquid investment minimum. The Funds' investments were below the limitation on illiquid investments during the review period. Additionally, Victory Capital indicated that no events occurred that would require the filing of Form N-LIQUID and recommended no material changes to the LRMP.
77
Privacy Policy
Protecting the Privacy of Information
The Trust respects your right to privacy. We also know that you expect us to conduct and process your business in an accurate and efficient manner. To do so, we must collect and maintain certain personal information about you. This is the information we collect from you on applications or other forms, and from the transactions you make with us or third parties. It may include your name, address, social security number, account transactions and balances, and information about investment goals and risk tolerance.
We do not disclose any information about you or about former customers to anyone except as permitted or required by law. Specifically, we may disclose the information we collect to companies that perform services on our behalf, such as the transfer agent that processes shareholder accounts and printers and mailers that assist us in the distribution of investor materials. We may also disclose this information to companies that perform marketing services on our behalf. This allows us to continue to offer you Victory investment products and services that meet your investing needs, and to effect transactions that you request or authorize. These companies will use this information only in connection with the services for which we hired them. They are not permitted to use or share this information for any other purpose.
To protect your personal information internally, we permit access only by authorized employees and maintain physical, electronic, and procedural safeguards to guard your personal information.*
* You may have received communications regarding information about privacy policies from other financial institutions which gave you the opportunity to "opt-out" of certain information sharing with companies which are not affiliated with that financial institution. The Trust does not share information with other companies for purposes of marketing solicitations for products other than the Trust. Therefore, the Trust does not provide opt-out options to their shareholders.
Victory Funds
P.O. Box 182593
Columbus, Ohio 43218-2593

Visit our website at: | | Call Victory at: | |
www.vcm.com | | 800-539-FUND (800-539-3863) | |
| | | 800-235-8396 for Member Class | |

June 30, 2021
Semi Annual Report
Victory RS International Fund
Victory RS Global Fund
Victory Sophus Emerging Markets Fund
www.vcm.com
News, Information And Education 24 Hours A Day, 7 Days A Week
The Victory Funds site gives fund shareholders, prospective shareholders, and investment professionals a convenient way to access fund information, get guidance, and track fund performance anywhere they can access the Internet. The site includes:
• Detailed performance records
• Daily share prices
• The latest fund news
• Investment resources to help you become a better investor
• A section dedicated to investment professionals
Whether you're a potential investor searching for the fund that matches your investment philosophy, a seasoned investor interested in planning tools, or an investment professional, www.vcm.com has what you seek. Visit us anytime. We're always open.
TABLE OF CONTENTS
Investment Objective and Portfolio
Holdings | | | 3 | | |
Schedules of Portfolio Investments | |
Victory RS International Fund | | | 6 | | |
Victory RS Global Fund | | | 11 | | |
Victory Sophus Emerging Markets Fund | | | 17 | | |
Financial Statements | |
Statements of Assets and Liabilities | | | 24 | | |
Statements of Operations | | | 26 | | |
Statements of Changes in Net Assets | | | 27 | | |
Financial Highlights | | | 30 | | |
Notes to Financial Statements | | | 48 | | |
Supplemental Information | | | 58 | | |
Proxy Voting and Portfolio Holdings Information | | | 58 | | |
Expense Examples | | | 58 | | |
Liquidity Risk Management Program | | | 60 | | |
Privacy Policy (inside back cover) | | | |
1
IRA DISTRIBUTION WITHHOLDING DISCLOSURE
We generally must withhold federal income tax at a rate of 10% of the taxable portion of your distribution and, if you live in a state that requires state income tax withholding, at your state's tax rate. However, you may elect not to have withholding apply or to have income tax withheld at a higher rate. Any withholding election that you make will apply to any subsequent distribution unless and until you change or revoke the election. If you wish to make a withholding election, or change or revoke a prior withholding election, call 800-539-3863 and form W-4P (OMB No. 1545-0074 withholding certificate for pension or annuity payments) will be electronically sent.
If you do not have a withholding election in place by the date of a distribution, federal income tax will be withheld from the taxable portion of your distribution at a rate of 10%. If you must pay estimated taxes, you may be subject to estimated tax penalties if your estimated tax payments are not sufficient and sufficient tax is not withheld from your distribution.
For more specific information, please consult your tax adviser.
The Funds are distributed by Victory Capital Services, Inc. Victory Capital Management Inc. is the investment adviser to the Funds and receives fees from the Funds for performing services for the Funds.
This report is not authorized for distribution to prospective investors unless preceded or accompanied by a current prospectus of the Victory Funds.
For additional information about any Victory Fund, including fees, expenses, and risks, view our prospectus online at vcm.com or call 800-539-3863. Read it carefully before you invest or send money.
The information in this report is based on data obtained from recognized services and sources and is believed to be reliable. Any opinions, projections, or recommendations in this report are subject to change without notice and are not intended as individual investment advice. Past investment performance of the Funds, markets or securities mentioned herein should not be considered to be indicative of future results.
• NOT FDIC INSURED • NO BANK GUARANTEE • MAY LOSE VALUE

Call Victory at:
800-539-FUND (800-539-3863)
Visit our website at:
www.vcm.com
2
Victory Portfolios
Victory RS International Fund | | June 30, 2021 | |
(Unaudited)
Investment Objective and Portfolio Holdings:
The Fund's investment objective seeks to provide long-term capital appreciation.
Top 10 Holdings*:
June 30, 2021
(% of Net Assets)
Nestle SA, Registered Shares | | | 4.0 | % | |
Roche Holding AG | | | 3.5 | % | |
Toyota Motor Corp. | | | 3.2 | % | |
LVMH Moet Hennessy Louis Vuitton SE | | | 2.9 | % | |
SAP SE | | | 2.4 | % | |
Siemens AG, Registered Shares | | | 2.2 | % | |
Diageo PLC | | | 2.0 | % | |
Novartis AG, Registered Shares | | | 2.0 | % | |
Rio Tinto PLC | | | 1.9 | % | |
Hoya Corp. | | | 1.9 | % | |
Sector Allocation*:
June 30, 2021
(% of Net Assets)
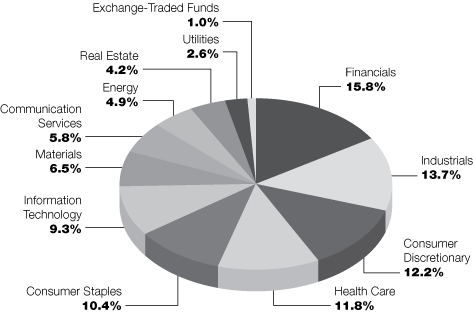
* Does not include futures contracts, money market instruments, and short-term investments purchased with cash collateral from securities loaned.
Percentages are of the net assets of the Fund and may not equal 100%.
Refer to the Schedule of Portfolio Investments for a complete list of securities.
3
Victory Portfolios
Victory RS Global Fund | | June 30, 2021 | |
(Unaudited)
Investment Objective and Portfolio Holdings:
The Fund's investment objective seeks to provide long-term capital appreciation.
Top 10 Holdings*:
June 30, 2021
(% of Net Assets)
Apple, Inc. | | | 4.8 | % | |
Microsoft Corp. | | | 4.1 | % | |
Amazon.com, Inc. | | | 2.9 | % | |
Alphabet, Inc., Class C | | | 2.7 | % | |
Facebook, Inc., Class A | | | 2.3 | % | |
NVIDIA Corp. | | | 2.2 | % | |
JPMorgan Chase & Co. | | | 1.9 | % | |
Mastercard, Inc., Class A | | | 1.8 | % | |
McDonald's Corp. | | | 1.8 | % | |
Texas Instruments, Inc. | | | 1.8 | % | |
Sector Allocation*:
June 30, 2021
(% of Net Assets)
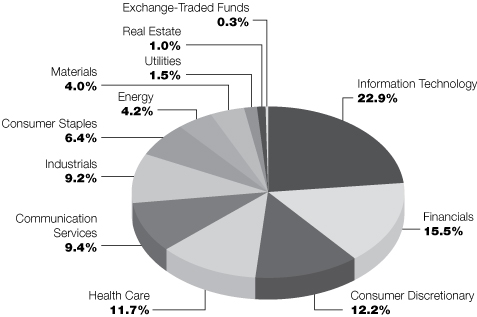
* Does not include futures contracts, money market instruments, and short-term investments purchased with cash collateral from securities loaned.
Percentages are of the net assets of the Fund and may not equal 100%.
Refer to the Schedule of Portfolio Investments for a complete list of securities.
4
Victory Portfolios
Victory Sophus Emerging Markets Fund | | June 30, 2021 | |
(Unaudited)
Investment Objective and Portfolio Holdings:
The Fund's investment objective seeks to provide long-term capital appreciation.
Top 10 Holdings*:
June 30, 2021
(% of Net Assets)
Taiwan Semiconductor Manufacturing Co. Ltd. | | | 5.8 | % | |
Tencent Holdings Ltd. | | | 5.0 | % | |
Samsung Electronics Co. Ltd. | | | 4.8 | % | |
Alibaba Group Holding Ltd. | | | 4.2 | % | |
Infosys Ltd. | | | 2.0 | % | |
SK Hynix, Inc. | | | 1.7 | % | |
China Merchants Bank Co. Ltd. | | | 1.6 | % | |
Meituan, Class B | | | 1.4 | % | |
NetEase, Inc. | | | 1.3 | % | |
Vale SA | | | 1.2 | % | |
Sector Allocation*:
June 30, 2021
(% of Net Assets)
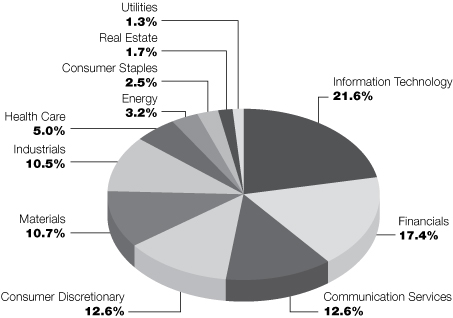
* Does not include futures contracts, money market instruments, and short-term investments purchased with cash collateral from securities loaned.
Percentages are of the net assets of the Fund and may not equal 100%.
Refer to the Schedule of Portfolio Investments for a complete list of securities.
5
Victory Portfolios
Victory RS International Fund | | Schedule of Portfolio Investments
June 30, 2021 | |
(Unaudited)
Security Description | | Shares | | Value | |
Common Stocks (97.2%) | |
Australia (6.0%): | |
Consumer Discretionary (1.0%): | |
Aristocrat Leisure Ltd. | | | 133,936 | | | $ | 4,322,926 | | |
Financials (1.0%): | |
Macquarie Group Ltd. | | | 35,386 | | | | 4,145,043 | | |
Health Care (1.3%): | |
CSL Ltd. | | | 25,071 | | | | 5,360,821 | | |
Materials (1.8%): | |
BHP Group Ltd. | | | 211,350 | | | | 7,687,435 | | |
Real Estate (0.9%): | |
Scentre Group | | | 1,799,317 | | | | 3,681,242 | | |
| | | | 25,197,467 | | |
Belgium (0.9%): | |
Information Technology (0.9%): | |
Melexis NV | | | 36,426 | | | | 3,786,569 | | |
China (1.7%): | |
Communication Services (0.7%): | |
Tencent Holdings Ltd. | | | 38,500 | | | | 2,898,836 | | |
Consumer Discretionary (0.6%): | |
China Meidong Auto Holdings Ltd. | | | 422,000 | | | | 2,299,051 | | |
Financials (0.4%): | |
China Merchants Bank Co. Ltd., Class H | | | 218,000 | | | | 1,857,014 | | |
| | | | 7,054,901 | | |
Denmark (1.2%): | |
Consumer Staples (1.2%): | |
Royal Unibrew A/S | | | 38,556 | | | | 4,913,663 | | |
France (9.3%): | |
Consumer Discretionary (4.4%): | |
Faurecia SE | | | 31,595 | | | | 1,553,031 | | |
La Francaise des Jeux SAEM (a) | | | 79,670 | | | | 4,685,433 | | |
LVMH Moet Hennessy Louis Vuitton SE | | | 15,522 | | | | 12,209,015 | | |
| | | | 18,447,479 | | |
Energy (1.2%): | |
Gaztransport Et Technigaz SA | | | 16,340 | | | | 1,321,885 | | |
TotalEnergies SE | | | 81,778 | | | | 3,704,243 | | |
| | | | 5,026,128 | | |
Industrials (1.0%): | |
Safran SA | | | 28,044 | | | | 3,891,558 | | |
Information Technology (1.7%): | |
Capgemini SE | | | 36,379 | | | | 6,995,329 | | |
See notes to financial statements.
6
Victory Portfolios
Victory RS International Fund | | Schedule of Portfolio Investments — continued
June 30, 2021 | |
(Unaudited)
Security Description | | Shares | | Value | |
Materials (1.0%): | |
Arkema SA | | | 33,923 | | | $ | 4,263,068 | | |
| | | | 38,623,562 | | |
Germany (8.2%): | |
Consumer Discretionary (1.0%): | |
Volkswagen AG, Preference Shares | | | 15,927 | | | | 3,992,918 | | |
Financials (1.8%): | |
Allianz SE, Registered Shares | | | 30,125 | | | | 7,516,995 | | |
Industrials (2.2%): | |
Siemens AG, Registered Shares | | | 57,396 | | | | 9,112,166 | | |
Information Technology (2.4%): | |
SAP SE | | | 72,108 | | | | 10,127,048 | | |
Real Estate (0.8%): | |
Vonovia SE | | | 51,226 | | | | 3,310,108 | | |
| | | | 34,059,235 | | |
Hong Kong (3.5%): | |
Financials (1.8%): | |
AIA Group Ltd. | | | 612,400 | | | | 7,597,372 | | |
Real Estate (1.7%): | |
CK Asset Holdings Ltd. | | | 1,004,500 | | | | 6,914,166 | | |
| | | | 14,511,538 | | |
Italy (4.6%): | |
Energy (1.0%): | |
Snam SpA (b) | | | 745,160 | | | | 4,310,048 | | |
Financials (0.9%): | |
Banca Generali SpA (c) | | | 88,565 | | | | 3,783,088 | | |
Health Care (1.0%): | |
Recordati Industria Chimica e Farmaceutica SpA | | | 73,367 | | | | 4,196,251 | | |
Utilities (1.7%): | |
Enel SpA | | | 758,843 | | | | 7,050,982 | | |
| | | | 19,340,369 | | |
Japan (22.5%): | |
Communication Services (1.9%): | |
Capcom Co. Ltd. | | | 130,000 | | | | 3,800,235 | | |
Kakaku.com, Inc. | | | 142,900 | | | | 4,299,600 | | |
| | | | 8,099,835 | | |
Consumer Discretionary (4.2%): | |
Toyota Motor Corp. | | | 152,800 | | | | 13,358,678 | | |
ZOZO, Inc. | | | 120,000 | | | | 4,069,237 | | |
| | | | 17,427,915 | | |
Consumer Staples (1.2%): | |
Toyo Suisan Kaisha Ltd. | | | 128,100 | | | | 4,937,965 | | |
See notes to financial statements.
7
Victory Portfolios
Victory RS International Fund | | Schedule of Portfolio Investments — continued
June 30, 2021 | |
(Unaudited)
Security Description | | Shares | | Value | |
Financials (2.4%): | |
JAFCO Group Co. Ltd. | | | 40,600 | | | $ | 2,531,853 | | |
Mitsubishi UFJ Financial Group, Inc. | | | 816,500 | | | | 4,398,474 | | |
Tokio Marine Holdings, Inc. | | | 67,500 | | | | 3,109,488 | | |
| | | | 10,039,815 | | |
Health Care (2.8%): | |
Hoya Corp. | | | 59,500 | | | | 7,871,149 | | |
Shionogi & Co. Ltd. | | | 72,800 | | | | 3,794,558 | | |
| | | | 11,665,707 | | |
Industrials (5.0%): | |
en Japan, Inc. | | | 75,700 | | | | 2,688,237 | | |
Fuji Electric Co. Ltd. | | | 157,500 | | | | 7,352,639 | | |
Nippon Yusen KK | | | 88,000 | | | | 4,466,438 | | |
OKUMA Corp. | | | 53,300 | | | | 2,611,629 | | |
Sanwa Holdings Corp. | | | 309,000 | | | | 3,800,852 | | |
| | | | 20,919,795 | | |
Information Technology (3.3%): | |
Fujitsu Ltd. | | | 41,200 | | | | 7,709,518 | | |
Oracle Corp. | | | 25,200 | | | | 1,925,760 | | |
Ulvac, Inc. | | | 78,000 | | | | 3,950,220 | | |
| | | | 13,585,498 | | |
Real Estate (0.8%): | |
Sumitomo Realty & Development Co. Ltd. | | | 89,400 | | | | 3,197,804 | | |
Utilities (0.9%): | |
Chubu Electric Power Co., Inc. | | | 303,100 | | | | 3,708,822 | | |
| | | | 93,583,156 | | |
Netherlands (4.2%): | |
Communication Services (1.0%): | |
Koninklijke KPN NV | | | 1,321,155 | | | | 4,131,616 | | |
Financials (1.2%): | |
ING Groep NV | | | 370,353 | | | | 4,915,602 | | |
Industrials (1.0%): | |
Wolters Kluwer NV | | | 44,672 | | | | 4,489,612 | | |
Information Technology (1.0%): | |
ASM International NV | | | 12,688 | | | | 4,184,343 | | |
| | | | 17,721,173 | | |
New Zealand (0.6%): | |
Health Care (0.6%): | |
Fisher & Paykel Healthcare Corp. Ltd. | | | 110,418 | | | | 2,401,400 | | |
Norway (1.4%): | |
Energy (0.5%): | |
Aker BP ASA | | | 68,655 | | | | 2,189,262 | | |
See notes to financial statements.
8
Victory Portfolios
Victory RS International Fund | | Schedule of Portfolio Investments — continued
June 30, 2021 | |
(Unaudited)
Security Description | | Shares | | Value | |
Financials (0.9%): | |
SpareBank 1 SMN | | | 278,424 | | | $ | 3,859,204 | | |
| | | | 6,048,466 | | |
Spain (1.2%): | |
Communication Services (1.2%): | |
Telefonica SA | | | 1,051,103 | | | | 4,905,405 | | |
Sweden (1.8%): | |
Industrials (1.8%): | |
Atlas Copco AB, Class B | | | 140,278 | | | | 7,390,103 | | |
Switzerland (14.8%): | |
Consumer Staples (4.9%): | |
Coca-Cola HBC AG | | | 106,867 | | | | 3,867,685 | | |
Nestle SA, Registered Shares | | | 132,929 | | | | 16,573,690 | | |
| | | | 20,441,375 | | |
Financials (3.0%): | |
Cembra Money Bank AG | | | 28,170 | | | | 3,161,266 | | |
Partners Group Holding AG | | | 3,406 | | | | 5,164,710 | | |
UBS Group AG | | | 269,132 | | | | 4,123,469 | | |
| | | | 12,449,445 | | |
Health Care (5.5%): | |
Novartis AG, Registered Shares | | | 89,686 | | | | 8,183,959 | | |
Roche Holding AG | | | 38,361 | | | | 14,459,795 | | |
| | | | 22,643,754 | | |
Industrials (1.4%): | |
Adecco Group AG | | | 87,764 | | | | 5,973,234 | | |
| | | | 61,507,808 | | |
United Kingdom (15.3%): | |
Communication Services (1.0%): | |
ITV PLC (c) | | | 2,348,090 | | | | 4,080,412 | | |
Consumer Discretionary (1.0%): | |
Next PLC (c) | | | 38,636 | | | | 4,204,315 | | |
Consumer Staples (3.1%): | |
Diageo PLC | | | 172,777 | | | | 8,279,790 | | |
Imperial Brands PLC | | | 212,008 | | | | 4,570,835 | | |
| | | | 12,850,625 | | |
Energy (2.2%): | |
| BP PLC | | | 773,342 | | | | 3,390,937 | | |
Royal Dutch Shell PLC, Class A | | | 281,690 | | | | 5,646,497 | | |
| | | | 9,037,434 | | |
See notes to financial statements.
9
Victory Portfolios
Victory RS International Fund | | Schedule of Portfolio Investments — continued
June 30, 2021 | |
(Unaudited)
Security Description | | Shares | | Value | |
Financials (2.4%): | |
Close Brothers Group PLC | | | 147,682 | | | $ | 3,094,629 | | |
Intermediate Capital Group PLC | | | 115,238 | | | | 3,389,040 | | |
Legal & General Group PLC | | | 1,037,644 | | | | 3,701,368 | | |
| | | | 10,185,037 | | |
Health Care (0.6%): | |
Smith & Nephew PLC | | | 116,427 | | | | 2,524,627 | | |
Industrials (1.3%): | |
Ashtead Group PLC | | | 72,468 | | | | 5,385,670 | | |
Materials (3.7%): | |
Croda International PLC | | | 56,761 | | | | 5,788,482 | | |
Evraz PLC | | | 244,456 | | | | 2,005,292 | | |
Rio Tinto PLC | | | 95,674 | | | | 7,900,375 | | |
| | | | 15,694,149 | | |
| | | | 63,962,269 | | |
Total Common Stocks (Cost $332,104,052) | | | 405,007,084 | | |
Exchange-Traded Funds (1.0%) | |
United States (1.0%): | |
iShares MSCI EAFE ETF (b) | | | 51,265 | | | | 4,043,783 | | |
Total Exchange-Traded Funds (Cost $4,001,297) | | | 4,043,783 | | |
Collateral for Securities Loaned^ (0.7%) | |
United States (0.7%): | |
BlackRock Liquidity Funds TempFund Portfolio, Institutional Class, 0.04% (d) | | | 57,455 | | | | 57,455 | | |
Fidelity Investments Money Market Government Portfolio I Shares, 0.01% (d) | | | 1,556,272 | | | | 1,556,272 | | |
Goldman Sachs Financial Square Prime Obligations Fund, Institutional
Class, 0.02% (d) | | | 28,673 | | | | 28,673 | | |
JPMorgan Prime Money Market Fund, Capital Class, 0.07% (d) | | | 228,629 | | | | 228,629 | | |
Morgan Stanley Institutional Liquidity Prime Portfolio, Institutional
Class, 0.06% (d) | | | 1,027,960 | | | | 1,027,960 | | |
Total Collateral for Securities Loaned (Cost $2,898,989) | | | 2,898,989 | | |
Total Investments (Cost $339,004,338) — 98.9% | | | 411,949,856 | | |
Other assets in excess of liabilities — 1.1% | | | 4,769,950 | | |
NET ASSETS — 100.00% | | $ | 416,719,806 | | |
^ Purchased with cash collateral from securities on loan.
(a) Rule 144A security or other security that is restricted as to resale to institutional investors. The Fund's Adviser has deemed this security to be liquid based upon procedures approved by the Board of Trustees. As of June 30, 2021, the fair value of these securities was $4,685,433 and amounted to 1.1% of net assets.
(b) All or a portion of this security is on loan.
(c) Non-income producing security.
(d) Rate disclosed is the daily yield on June 30, 2021.
ETF — Exchange-Traded Fund
PLC — Public Limited Company
See notes to financial statements.
10
Victory Portfolios
Victory RS Global Fund | | Schedule of Portfolio Investments
June 30, 2021 | |
(Unaudited)
Security Description | | Shares | | Value | |
Common Stocks (98.0%) | |
Australia (2.2%): | |
Consumer Discretionary (0.9%): | |
Aristocrat Leisure Ltd. | | | 76,437 | | | $ | 2,467,085 | | |
Financials (0.5%): | |
Macquarie Group Ltd. | | | 11,175 | | | | 1,309,016 | | |
Health Care (0.8%): | |
CSL Ltd. | | | 9,961 | | | | 2,129,917 | | |
| | | | 5,906,018 | | |
Belgium (0.6%): | |
Information Technology (0.6%): | |
Melexis NV | | | 14,883 | | | | 1,547,123 | | |
Bermuda (0.7%): | |
Industrials (0.7%): | |
Triton International Ltd. | | | 35,971 | | | | 1,882,722 | | |
Canada (3.1%): | |
Energy (0.5%): | |
Parex Resources, Inc. (a) | | | 87,558 | | | | 1,462,361 | | |
Industrials (0.9%): | |
Canadian Pacific Railway Ltd. | | | 32,424 | | | | 2,493,671 | | |
Information Technology (1.2%): | |
Constellation Software, Inc. | | | 2,120 | | | | 3,211,320 | | |
Materials (0.5%): | |
Kirkland Lake Gold Ltd. (b) | | | 34,277 | | | | 1,321,133 | | |
| | | | 8,488,485 | | |
China (3.5%): | |
Communication Services (1.7%): | |
Baidu, Inc., ADR (a) | | | 7,362 | | | | 1,501,112 | | |
Tencent Holdings Ltd. | | | 40,200 | | | | 3,026,837 | | |
| | | | 4,527,949 | | |
Consumer Discretionary (0.4%): | |
China Meidong Auto Holdings Ltd. | | | 204,000 | | | | 1,111,389 | | |
Consumer Staples (0.7%): | |
Foshan Haitan Flavouring & Food Co. Ltd., Class A | | | 99,772 | | | | 1,988,945 | | |
Financials (0.7%): | |
Industrial & Commercial Bank of China Ltd., Class H (b) | | | 3,372,000 | | | | 1,976,107 | | |
| | | | 9,604,390 | | |
Denmark (0.7%): | |
Consumer Staples (0.7%): | |
Royal Unibrew A/S | | | 15,639 | | | | 1,993,069 | | |
See notes to financial statements.
11
Victory Portfolios
Victory RS Global Fund | | Schedule of Portfolio Investments — continued
June 30, 2021 | |
(Unaudited)
Security Description | | Shares | | Value | |
France (3.5%): | |
Consumer Discretionary (0.7%): | |
La Francaise des Jeux SAEM (c) | | | 30,328 | | | $ | 1,783,605 | | |
Energy (0.4%): | |
Gaztransport Et Technigaz SA | | | 14,382 | | | | 1,163,486 | | |
Financials (0.8%): | |
BNP Paribas SA | | | 35,065 | | | | 2,200,401 | | |
Industrials (0.6%): | |
Safran SA | | | 12,487 | | | | 1,732,773 | | |
Materials (1.0%): | |
Arkema SA | | | 21,403 | | | | 2,689,693 | | |
| | | | 9,569,958 | | |
Germany (0.9%): | |
Consumer Discretionary (0.9%): | |
Volkswagen AG, Preference Shares | | | 9,578 | | | | 2,401,216 | | |
Indonesia (0.9%): | |
Communication Services (0.9%): | |
PT Telkom Indonesia Persero Tbk | | | 10,865,500 | | | | 2,362,495 | | |
Ireland (1.2%): | |
Industrials (1.2%): | |
Eaton Corp. PLC | | | 22,729 | | | | 3,367,983 | | |
Italy (2.9%): | |
Energy (0.9%): | |
Snam SpA (b) | | | 394,691 | | | | 2,282,915 | | |
Financials (0.4%): | |
Banca Generali SpA (a) | | | 22,714 | | | | 970,237 | | |
Health Care (0.9%): | |
Recordati Industria Chimica e Farmaceutica SpA | | | 43,251 | | | | 2,473,756 | | |
Utilities (0.7%): | |
Enel SpA | | | 215,454 | | | | 2,001,946 | | |
| | | | 7,728,854 | | |
Japan (5.9%): | |
Communication Services (1.3%): | |
Capcom Co. Ltd. | | | 61,100 | | | | 1,786,110 | | |
Kakaku.com, Inc. | | | 58,400 | | | | 1,757,150 | | |
| | | | 3,543,260 | | |
Consumer Discretionary (0.8%): | |
ZOZO, Inc. | | | 65,400 | | | | 2,217,734 | | |
Consumer Staples (0.5%): | |
Toyo Suisan Kaisha Ltd. | | | 34,000 | | | | 1,310,623 | | |
See notes to financial statements.
12
Victory Portfolios
Victory RS Global Fund | | Schedule of Portfolio Investments — continued
June 30, 2021 | |
(Unaudited)
Security Description | | Shares | | Value | |
Financials (1.0%): | |
JAFCO Group Co. Ltd. | | | 19,700 | | | $ | 1,228,510 | | |
Mitsubishi UFJ Financial Group, Inc. | | | 248,300 | | | | 1,337,588 | | |
| | | | 2,566,098 | | |
Health Care (0.6%): | |
Hoya Corp. | | | 11,900 | | | | 1,574,230 | | |
Industrials (1.2%): | |
Fuji Electric Co. Ltd. | | | 19,600 | | | | 914,995 | | |
Nippon Yusen KK | | | 47,400 | | | | 2,405,786 | | |
| | | | 3,320,781 | | |
Information Technology (0.5%): | |
Ulvac, Inc. | | | 29,000 | | | | 1,468,672 | | |
| | | | 16,001,398 | | |
Korea, Republic Of (1.5%): | |
Information Technology (1.5%): | |
Samsung Electronics Co. Ltd. | | | 56,721 | | | | 4,060,979 | | |
Netherlands (0.9%): | |
Information Technology (0.9%): | |
ASM International NV | | | 7,329 | | | | 2,417,012 | | |
New Zealand (0.5%): | |
Health Care (0.5%): | |
Fisher & Paykel Healthcare Corp. Ltd. | | | 56,106 | | | | 1,220,208 | | |
Norway (0.9%): | |
Energy (0.6%): | |
Aker BP ASA | | | 48,886 | | | | 1,558,871 | | |
Financials (0.3%): | |
SpareBank 1 SMN | | | 61,219 | | | | 848,550 | | |
| | | | 2,407,421 | | |
Singapore (0.8%): | |
Financials (0.8%): | |
Singapore Exchange Ltd. | | | 274,700 | | | | 2,288,452 | | |
South Africa (0.7%): | |
Consumer Discretionary (0.7%): | |
Mr. Price Group Ltd. (b) | | | 135,305 | | | | 1,987,975 | | |
Sweden (1.0%): | |
Industrials (1.0%): | |
Atlas Copco AB, Class B | | | 51,211 | | | | 2,697,890 | | |
Switzerland (3.1%): | |
Financials (0.7%): | |
Partners Group Holding AG | | | 1,304 | | | | 1,977,329 | | |
Health Care (1.4%): | |
Roche Holding AG | | | 10,023 | | | | 3,778,069 | | |
See notes to financial statements.
13
Victory Portfolios
Victory RS Global Fund | | Schedule of Portfolio Investments — continued
June 30, 2021 | |
(Unaudited)
Security Description | | Shares | | Value | |
Industrials (1.0%): | |
Adecco Group AG | | | 37,204 | | | $ | 2,532,111 | | |
| | | | 8,287,509 | | |
Taiwan (2.1%): | |
Financials (1.5%): | |
Cathay Financial Holding Co. Ltd. | | | 2,031,000 | | | | 3,927,174 | | |
Information Technology (0.6%): | |
Lite-On Technology Corp. | | | 844,000 | | | | 1,743,755 | | |
| | | | 5,670,929 | | |
United Kingdom (6.1%): | |
Communication Services (0.5%): | |
ITV PLC (a) | | | 724,848 | | | | 1,259,610 | | |
Consumer Discretionary (0.4%): | |
Next PLC (a) | | | 11,349 | | | | 1,234,982 | | |
Consumer Staples (0.6%): | |
Imperial Brands PLC | | | 72,745 | | | | 1,568,362 | | |
Financials (1.1%): | |
Close Brothers Group PLC | | | 80,009 | | | | 1,676,563 | | |
Intermediate Capital Group PLC | | | 42,567 | | | | 1,251,855 | | |
| | | | 2,928,418 | | |
Industrials (1.0%): | |
Ashtead Group PLC | | | 37,026 | | | | 2,751,695 | | |
Materials (2.5%): | |
Croda International PLC | | | 26,976 | | | | 2,751,010 | | |
Evraz PLC | | | 145,993 | | | | 1,197,592 | | |
Rio Tinto PLC | | | 34,625 | | | | 2,859,194 | | |
| | | | 6,807,796 | | |
| | | | 16,550,863 | | |
United States (54.3%): | |
Communication Services (5.0%): | |
Alphabet, Inc., Class C (a) | | | 2,930 | | | | 7,343,518 | | |
Facebook, Inc., Class A (a) | | | 17,958 | | | | 6,244,176 | | |
| | | | 13,587,694 | | |
Consumer Discretionary (7.4%): | |
Amazon.com, Inc. (a) | | | 2,250 | | | | 7,740,360 | | |
McDonald's Corp. | | | 20,842 | | | | 4,814,293 | | |
PulteGroup, Inc. | | | 55,352 | | | | 3,020,559 | | |
Ross Stores, Inc. | | | 29,330 | | | | 3,636,920 | | |
Tesla, Inc. (a) | | | 1,441 | | | | 979,448 | | |
| | | | 20,191,580 | | |
See notes to financial statements.
14
Victory Portfolios
Victory RS Global Fund | | Schedule of Portfolio Investments — continued
June 30, 2021 | |
(Unaudited)
Security Description | | Shares | | Value | |
Consumer Staples (3.9%): | |
Colgate-Palmolive Co. | | | 39,691 | | | $ | 3,228,863 | | |
PepsiCo, Inc. | | | 23,521 | | | | 3,485,107 | | |
The Estee Lauder Cos., Inc. | | | 12,389 | | | | 3,940,693 | | |
| | | | 10,654,663 | | |
Energy (1.8%): | |
Cactus, Inc., Class A | | | 33,473 | | | | 1,229,129 | | |
ConocoPhillips | | | 38,240 | | | | 2,328,816 | | |
Phillips 66 | | | 15,397 | | | | 1,321,370 | | |
| | | | 4,879,315 | | |
Financials (7.7%): | |
Bank of America Corp. | | | 102,308 | | | | 4,218,159 | | |
JPMorgan Chase & Co. | | | 32,675 | | | | 5,082,270 | | |
LPL Financial Holdings, Inc. | | | 15,269 | | | | 2,061,010 | | |
S&P Global, Inc. | | | 10,500 | | | | 4,309,725 | | |
The PNC Financial Services Group, Inc. | | | 12,715 | | | | 2,425,513 | | |
The Progressive Corp. | | | 27,258 | | | | 2,677,008 | | |
| | | | 20,773,685 | | |
Health Care (7.5%): | |
Amedisys, Inc. (a) | | | 4,760 | | | | 1,165,867 | | |
Amgen, Inc. | | | 12,236 | | | | 2,982,525 | | |
CVS Health Corp. | | | 43,506 | | | | 3,630,140 | | |
Eli Lilly & Co. | | | 15,209 | | | | 3,490,770 | | |
IDEXX Laboratories, Inc. (a) | | | 6,767 | | | | 4,273,699 | | |
Johnson & Johnson | | | 28,552 | | | | 4,703,656 | | |
| | | | 20,246,657 | | |
Industrials (1.6%): | |
Honeywell International, Inc. | | | 19,186 | | | | 4,208,449 | | |
Information Technology (17.6%): | |
Apple, Inc. | | | 95,073 | | | | 13,021,198 | | |
Cisco Systems, Inc. | | | 80,755 | | | | 4,280,015 | | |
Fortinet, Inc. (a) (b) | | | 15,192 | | | | 3,618,582 | | |
Mastercard, Inc., Class A | | | 13,241 | | | | 4,834,157 | | |
Microsoft Corp. | | | 41,055 | | | | 11,121,799 | | |
NVIDIA Corp. | | | 7,499 | | | | 5,999,950 | | |
Texas Instruments, Inc. | | | 24,779 | | | | 4,765,002 | | |
| | | | 47,640,703 | | |
Real Estate (1.0%): | |
Prologis, Inc. | | | 23,723 | | | | 2,835,610 | | |
Utilities (0.8%): | |
MGE Energy, Inc. (b) | | | 29,659 | | | | 2,207,816 | | |
| | | | 147,226,172 | | |
Total Common Stocks (Cost $197,210,876) | | | 265,669,121 | | |
See notes to financial statements.
15
Victory Portfolios
Victory RS Global Fund | | Schedule of Portfolio Investments — continued
June 30, 2021 | |
(Unaudited)
Security Description | | Shares | | Value | |
Exchange-Traded Funds (0.3%) | |
United States (0.3%): | |
iShares MSCI ACWI ETF | | | 7,844 | | | $ | 793,734 | | |
Total Exchange-Traded Funds (Cost $721,332) | | | 793,734 | | |
Collateral for Securities Loaned^ (3.3%) | |
United States (3.3%): | |
BlackRock Liquidity Funds TempFund Portfolio, Institutional Class, 0.04% (d) | | | 178,033 | | | | 178,033 | | |
Fidelity Investments Money Market Government Portfolio I Shares, 0.01% (d) | | | 4,822,330 | | | | 4,822,330 | | |
Goldman Sachs Financial Square Prime Obligations Fund, Institutional
Class, 0.02% (d) | | | 88,847 | | | | 88,847 | | |
JPMorgan Prime Money Market Fund, Capital Class, 0.07% (d) | | | 708,439 | | | | 708,439 | | |
Morgan Stanley Institutional Liquidity Prime Portfolio, Institutional
Class, 0.06% (d) | | | 3,185,280 | | | | 3,185,280 | | |
Total Collateral for Securities Loaned (Cost $8,982,929) | | | 8,982,929 | | |
Total Investments (Cost $206,915,137) — 101.6% | | | 275,445,784 | | |
Liabilities in excess of other assets — (1.6)% | | | (4,457,445 | ) | |
NET ASSETS — 100.00% | | $ | 270,988,339 | | |
^ Purchased with cash collateral from securities on loan.
(a) Non-income producing security.
(b) All or a portion of this security is on loan.
(c) Rule 144A security or other security that is restricted as to resale to institutional investors. The Fund's Adviser has deemed this security to be liquid based upon procedures approved by the Board of Trustees. As of June 30, 2021, the fair value of these securities was $1,783,605 and amounted to 0.7% of net assets.
(d) Rate disclosed is the daily yield on June 30, 2021.
ADR — American Depositary Receipt
ETF — Exchange-Traded Fund
PLC — Public Limited Company
See notes to financial statements.
16
Victory Portfolios
Victory Sophus Emerging Markets Fund | | Schedule of Portfolio Investments
June 30, 2021 | |
(Unaudited)
Security Description | | Shares | | Value | |
Common Stocks (99.1%) | |
Brazil (6.6%): | |
Communication Services (0.5%): | |
TIM SA | | | 1,133,343 | | | $ | 2,627,573 | | |
Consumer Discretionary (1.0%): | |
Lojas Quero Quero SA | | | 463,600 | | | | 2,135,662 | | |
Petrobras Distribuidora SA | | | 627,300 | | | | 3,365,311 | | |
| | | | 5,500,973 | | |
Consumer Staples (0.5%): | |
SLC Agricola SA | | | 284,600 | | | | 2,936,876 | | |
Financials (0.9%): | |
B3 SA — Brasil Bolsa Balcao | | | 1,548,300 | | | | 5,236,549 | | |
Industrials (1.0%): | |
Randon SA Implementos e Participacoes, Preference Shares | | | 941,100 | | | | 2,567,909 | | |
SIMPAR SA | | | 276,841 | | | | 3,096,175 | | |
| | | | 5,664,084 | | |
Materials (2.3%): | |
Duratex SA | | | 599,500 | | | | 2,868,998 | | |
Klabin SA (a) | | | 624,300 | | | | 3,306,535 | | |
Vale SA | | | 311,700 | | | | 7,098,051 | | |
| | | | 13,273,584 | | |
Utilities (0.4%): | |
Neoenergia SA | | | 635,400 | | | | 2,219,275 | | |
| | | | 37,458,914 | | |
Canada (0.5%): | |
Energy (0.5%): | |
Parex Resources, Inc. (a) | | | 159,019 | | | | 2,655,877 | | |
Chile (0.6%): | |
Financials (0.6%): | |
Banco de Chile | | | 32,358,637 | | | | 3,195,746 | | |
Banco de Credito e Inversiones SA | | | 1 | | | | 42 | | |
| | | | 3,195,788 | | |
China (32.7%): | |
Communication Services (7.4%): | |
Baidu, Inc., ADR (a) | | | 31,283 | | | | 6,378,603 | | |
NetEase, Inc., ADR | | | 64,371 | | | | 7,418,758 | | |
Tencent Holdings Ltd. | | | 379,215 | | | | 28,552,785 | | |
| | | | 42,350,146 | | |
Consumer Discretionary (8.0%): | |
Alibaba Group Holding Ltd., ADR (a) | | | 105,496 | | | | 23,924,383 | | |
China Yongda Automobiles Services Holdings Ltd. | | | 1,832,000 | | | | 3,278,838 | | |
JD.com, Inc., ADR (a) | | | 78,365 | | | | 6,254,311 | | |
Jiumaojiu International Holdings Ltd. (b) | | | 1,080,000 | | | | 4,414,397 | | |
Meituan, Class B (a) (b) | | | 187,900 | | | | 7,751,293 | | |
| | | | 45,623,222 | | |
See notes to financial statements.
17
Victory Portfolios
Victory Sophus Emerging Markets Fund | | Schedule of Portfolio Investments — continued
June 30, 2021 | |
(Unaudited)
Security Description | | Shares | | Value | |
Consumer Staples (1.6%): | |
By-health Co. Ltd., Class A | | | 471,800 | | | $ | 2,400,751 | | |
China Feihe Ltd. (b) | | | 1,356,000 | | | | 2,923,643 | | |
Wuliangye Yibin Co. Ltd., Class A (a) | | | 80,500 | | | | 3,704,722 | | |
| | | | 9,029,116 | | |
Energy (0.5%): | |
China Oilfield Services Ltd., Class H | | | 2,958,000 | | | | 2,649,980 | | |
Financials (3.1%): | |
China Merchants Bank Co. Ltd., Class H | | | 1,050,000 | | | | 8,944,333 | | |
Ping An Insurance Group Co. of China Ltd. | | | 452,500 | | | | 4,423,482 | | |
Postal Savings Bank of China Co. Ltd., Class H (a) (b) | | | 6,687,000 | | | | 4,497,078 | | |
| | | | 17,864,893 | | |
Health Care (2.5%): | |
Hygeia Healthcare Holdings Co. Ltd. (b) | | | 326,800 | | | | 4,290,404 | | |
Pharmaron Beijing Co. Ltd., Class H (b) | | | 133,900 | | | | 3,565,324 | | |
Wuxi Biologics Cayman, Inc. (a) (b) | | | 352,905 | | | | 6,461,960 | | |
| | | | 14,317,688 | | |
Industrials (3.2%): | |
Airtac International Group | | | 98,000 | | | | 3,775,293 | | |
COSCO SHIPPING Holdings Co. Ltd., Class H (a) (c) | | | 2,136,500 | | | | 5,368,895 | | |
Hangcha Group Co. Ltd., Class A | | | 677,760 | | | | 1,900,638 | | |
Luxshare Precision Industry Co. Ltd., Class A (a) | | | 443,300 | | | | 3,154,596 | | |
Zoomlion Heavy Industry Science and Technology Co. Ltd., Class H | | | 3,731,400 | | | | 3,905,827 | | |
| | | | 18,105,249 | | |
Information Technology (2.8%): | |
Chinasoft International Ltd. | | | 3,602,000 | | | | 6,551,756 | | |
WUS Printed Circuit Kunshan Co. Ltd., Class A (a) | | | 1,373,500 | | | | 3,287,135 | | |
Xiaomi Corp., Class B (a) (b) | | | 1,179,400 | | | | 4,101,958 | | |
Yonyou Network Technology Co. Ltd., Class A | | | 474,000 | | | | 2,437,390 | | |
| | | | 16,378,239 | | |
Materials (2.0%): | |
China Hongqiao Group Ltd. | | | 2,756,000 | | | | 3,731,999 | | |
China Molybdenum Co. Ltd., Class H | | | 5,337,000 | | | | 3,162,593 | | |
Wanhua Chemical Group Co. Ltd., Class A | | | 258,500 | | | | 4,350,520 | | |
| | | | 11,245,112 | | |
Real Estate (0.7%): | |
Shimao Services Holdings Ltd. (b) | | | 1,222,787 | | | | 4,214,691 | | |
Utilities (0.9%): | |
China Gas Holdings Ltd. | | | 523,200 | | | | 1,593,864 | | |
China Longyuan Power Group Corp. Ltd., Class H | | | 2,097,000 | | | | 3,610,522 | | |
| | | | 5,204,386 | | |
| | | | 186,982,722 | | |
See notes to financial statements.
18
Victory Portfolios
Victory Sophus Emerging Markets Fund | | Schedule of Portfolio Investments — continued
June 30, 2021 | |
(Unaudited)
Security Description | | Shares | | Value | |
Greece (1.0%): | |
Financials (0.5%): | |
National Bank of Greece SA (a) | | | 917,958 | | | $ | 2,616,042 | | |
Industrials (0.5%): | |
Mytilineos SA | | | 156,357 | | | | 2,843,734 | | |
| | | | 5,459,776 | | |
Hong Kong (2.6%): | |
Consumer Discretionary (0.7%): | |
JS Global Lifestyle Co. Ltd. (b) | | | 1,488,500 | | | | 4,190,690 | | |
Financials (0.8%): | |
BOC Hong Kong Holdings Ltd. | | | 1,331,500 | | | | 4,512,985 | | |
Industrials (0.5%): | |
Pacific Basin Shipping Ltd. (a) | | | 7,576,000 | | | | 3,052,389 | | |
Information Technology (0.6%): | |
ASM Pacific Technology Ltd. | | | 247,300 | | | | 3,350,067 | | |
| | | | 15,106,131 | | |
India (8.5%): | |
Energy (0.9%): | |
Hindustan Petroleum Corp. Ltd. | | | 1,306,587 | | | | 5,160,649 | | |
Financials (2.7%): | |
Cholamandalam Investment and Finance Co. Ltd. | | | 597,932 | | | | 4,136,793 | | |
Federal Bank Ltd. (a) | | | 2,796,834 | | | | 3,285,146 | | |
HDFC Bank Ltd., ADR (a) | | | 50,762 | | | | 3,711,717 | | |
LIC Housing Finance Ltd. | | | 664,794 | | | | 4,212,397 | | |
| | | | 15,346,053 | | |
Health Care (1.2%): | |
Divi's Laboratories Ltd. (a) | | | 54,467 | | | | 3,232,613 | | |
Dr. Reddy's Laboratories Ltd. | | | 49,030 | | | | 3,585,226 | | |
| | | | 6,817,839 | | |
Information Technology (2.0%): | |
Infosys Ltd., ADR | | | 532,593 | | | | 11,285,646 | | |
Materials (1.7%): | |
Dalmia Bharat Ltd. (a) | | | 78,212 | | | | 1,993,905 | | |
NMDC Ltd. | | | 1,860,228 | | | | 4,620,958 | | |
Tata Steel Ltd. | | | 214,984 | | | | 3,382,854 | | |
| | | | 9,997,717 | | |
| | | | 48,607,904 | | |
Indonesia (0.4%): | |
Financials (0.4%): | |
PT Bank Negara Indonesia Persero Tbk | | | 7,446,600 | | | | 2,383,420 | | |
See notes to financial statements.
19
Victory Portfolios
Victory Sophus Emerging Markets Fund | | Schedule of Portfolio Investments — continued
June 30, 2021 | |
(Unaudited)
Security Description | | Shares | | Value | |
Korea, Republic Of (16.1%): | |
Communication Services (2.0%): | |
LG Uplus Corp. | | | 343,384 | | | $ | 4,682,304 | | |
NAVER Corp. | | | 17,349 | | | | 6,438,529 | | |
| | | | 11,120,833 | | |
Financials (2.9%): | |
DB Insurance Co. Ltd. | | | 60,227 | | | | 2,933,254 | | |
Hana Financial Group, Inc. | | | 128,564 | | | | 5,269,436 | | |
Samsung Securities Co. Ltd. | | | 85,695 | | | | 3,419,281 | | |
Woori Financial Group, Inc. | | | 490,309 | | | | 4,992,430 | | |
| | | | 16,614,401 | | |
Health Care (1.3%): | |
Hugel, Inc. (a) | | | 14,019 | | | | 2,989,201 | | |
InBody Co. Ltd. | | | 65,841 | | | | 1,766,280 | | |
Samsung Biologics Co. Ltd. (a) (b) | | | 3,788 | | | | 2,822,792 | | |
| | | | 7,578,273 | | |
Industrials (2.8%): | |
CJ Corp. | | | 27,610 | | | | 2,621,261 | | |
CJ Logistics Corp. (a) | | | 13,787 | | | | 2,165,373 | | |
Hanwha Aerospace Co. Ltd. | | | 89,017 | | | | 3,713,215 | | |
Hyundai Engineering & Construction Co. Ltd. | | | 88,453 | | | | 4,579,512 | | |
LG Corp. | | | 33,703 | | | | 3,066,704 | | |
| | | | 16,146,065 | | |
Information Technology (6.5%): | |
Samsung Electronics Co. Ltd. | | | 387,173 | | | | 27,386,575 | | |
SK Hynix, Inc. | | | 84,267 | | | | 9,512,369 | | |
| | | | 36,898,944 | | |
Materials (0.6%): | |
PI Advanced Materials Co. Ltd. | | | 73,838 | | | | 3,598,571 | | |
| | | | 91,957,087 | | |
Luxembourg (0.8%): | |
Materials (0.8%): | |
Ternium SA, ADR | | | 114,237 | | | | 4,393,555 | | |
Malaysia (0.9%): | |
Consumer Discretionary (0.4%): | |
MR DIY Group M Bhd (b) | | | 3,081,400 | | | | 2,667,386 | | |
Financials (0.5%): | |
Public Bank Bhd | | | 2,698,500 | | | | 2,672,758 | | |
| | | | 5,340,144 | | |
Mexico (3.1%): | |
Consumer Discretionary (0.7%): | |
Alsea SAB de CV (a) | | | 1,237,946 | | | | 2,203,286 | | |
Betterware de Mexico SAB de CV | | | 36,986 | | | | 1,850,040 | | |
| | | | 4,053,326 | | |
See notes to financial statements.
20
Victory Portfolios
Victory Sophus Emerging Markets Fund | | Schedule of Portfolio Investments — continued
June 30, 2021 | |
(Unaudited)
Security Description | | Shares | | Value | |
Financials (0.4%): | |
Grupo Financiero Banorte SAB de CV, Class O | | | 102,386 | | | $ | 661,499 | | |
Regional SAB de CV | | | 204,663 | | | | 1,203,888 | | |
| | | | 1,865,387 | | |
Industrials (0.5%): | |
Controladora Vuela Cia de Aviacion SAB de CV, ADR (a) (c) | | | 154,463 | | | | 2,967,234 | | |
Materials (1.0%): | |
Cemex SAB de CV, ADR (a) | | | 688,013 | | | | 5,779,309 | | |
Real Estate (0.5%): | |
Corp Inmobiliaria Vesta SAB de CV | | | 1,452,117 | | | | 2,825,644 | | |
| | | | 17,490,900 | | |
Russian Federation (2.4%): | |
Consumer Discretionary (0.6%): | |
Detsky Mir PJSC (b) | | | 1,815,590 | | | | 3,756,575 | | |
Energy (0.6%): | |
Rosneft Oil Co. PJSC, GDR | | | 414,322 | | | | 3,213,453 | | |
Financials (1.2%): | |
Sberbank of Russia PJSC, ADR | | | 421,552 | | | | 7,009,244 | | |
| | | | 7,009,244 | | |
| | | | 13,979,272 | | |
Saudi Arabia (0.5%): | |
Financials (0.5%): | |
The Saudi National Bank | | | 194,573 | | | | 2,989,031 | | |
Singapore (0.5%): | |
Communication Services (0.5%): | |
Sea Ltd., ADR (a) (c) | | | 10,898 | | | | 2,992,591 | | |
South Africa (4.6%): | |
Communication Services (1.8%): | |
MTN Group (a) | | | 810,039 | | | | 5,855,274 | | |
Naspers Ltd., Class N | | | 21,747 | | | | 4,587,699 | | |
| | | | 10,442,973 | | |
Consumer Discretionary (0.7%): | |
Mr. Price Group Ltd. | | | 205,833 | | | | 3,024,211 | | |
The Foschini Group Ltd. | | | 85,390 | | | | 951,510 | | |
| | | | 3,975,721 | | |
Financials (1.3%): | |
Absa Group Ltd. (a) | | | 372,031 | | | | 3,535,756 | | |
Capitec Bank Holdings Ltd. | | | 31,845 | | | | 3,755,820 | | |
| | | | 7,291,576 | | |
Materials (0.8%): | |
Impala Platinum Holdings Ltd. | | | 289,043 | | | | 4,756,539 | | |
| | | | 26,466,809 | | |
See notes to financial statements.
21
Victory Portfolios
Victory Sophus Emerging Markets Fund | | Schedule of Portfolio Investments — continued
June 30, 2021 | |
(Unaudited)
Security Description | | Shares | | Value | |
Taiwan (13.1%): | |
Consumer Discretionary (0.5%): | |
Gourmet Master Co. Ltd. (a) | | | 380,000 | | | $ | 2,324,980 | | |
Topkey Corp. | | | 88,000 | | | | 495,739 | | |
| | | | 2,820,719 | | |
Financials (1.0%): | |
Yuanta Financial Holding Co. Ltd. | | | 6,124,760 | | | | 5,898,068 | | |
Industrials (1.6%): | |
China Airlines Ltd. (a) | | | 4,172,000 | | | | 2,854,202 | | |
Evergreen Marine Corp. Taiwan Ltd. (a) | | | 931,000 | | | | 6,576,670 | | |
| | | | 9,430,872 | | |
Information Technology (9.4%): | |
Hon Hai Precision Industry Co. Ltd. | | | 968,000 | | | | 3,886,876 | | |
MediaTek, Inc. | | | 196,000 | | | | 6,759,910 | | |
Nanya Technology Corp. | | | 1,840,000 | | | | 5,258,874 | | |
Taiwan Semiconductor Manufacturing Co. Ltd. | | | 1,553,998 | | | | 33,473,063 | | |
Walsin Technology Corp. | | | 525,000 | | | | 4,282,312 | | |
| | | | 53,661,035 | | |
Materials (0.6%): | |
Formosa Plastics Corp. | | | 925,000 | | | | 3,418,552 | | |
| | | | 75,229,246 | | |
Thailand (1.8%): | |
Energy (0.7%): | |
PTT PCL (c) | | | 3,187,000 | | | | 3,911,279 | | |
Financials (0.6%): | |
The Siam Commercial Bank PCL (c) | | | 1,194,200 | | | | 3,658,206 | | |
Real Estate (0.5%): | |
AP Thailand PCL | | | 10,944,500 | | | | 2,854,366 | | |
| | | | 10,423,851 | | |
Turkey (1.5%): | |
Communication Services (0.4%): | |
Turk Telekomunikasyon A/S | | | 3,147,949 | | | | 2,402,099 | | |
Consumer Staples (0.4%): | |
Anadolu Efes Biracilik Ve Malt Sanayii A/S | | | 789,050 | | | | 2,019,635 | | |
Industrials (0.4%): | |
Turkiye Sise ve Cam Fabrikalari A/S | | | 2,676,719 | | | | 2,351,882 | | |
Information Technology (0.3%): | |
Logo Yazilim Sanayi Ve Ticaret A/S | | | 498,776 | | | | 1,906,587 | | |
| | | | 8,680,203 | | |
United Kingdom (0.9%): | |
Materials (0.9%): | |
Anglo American PLC | | | 134,479 | | | | 5,350,733 | | |
Total Common Stocks (Cost $430,923,493) | | | 567,143,954 | | |
See notes to financial statements.
22
Victory Portfolios
Victory Sophus Emerging Markets Fund | | Schedule of Portfolio Investments — continued
June 30, 2021 | |
(Unaudited)
Security Description | | Shares | | Value | |
Collateral for Securities Loaned^ (1.3%) | |
United States (1.3%): | |
BlackRock Liquidity Funds TempFund Portfolio, Institutional Class, 0.04% (d) | | | 145,429 | | | $ | 145,429 | | |
Fidelity Investments Money Market Government Portfolio I Shares, 0.01% (d) | | | 3,939,189 | | | | 3,939,189 | | |
Goldman Sachs Financial Square Prime Obligations Fund, Institutional
Class, 0.02% (d) | | | 72,576 | | | | 72,576 | | |
JPMorgan Prime Money Market Fund, Capital Class, 0.07% (d) | | | 578,699 | | | | 578,699 | | |
Morgan Stanley Institutional Liquidity Prime Portfolio, Institutional
Class, 0.06% (d) | | | 2,601,941 | | | | 2,601,941 | | |
Total Collateral for Securities Loaned (Cost $7,337,834) | | | 7,337,834 | | |
Total Investments (Cost $438,261,327) — 100.4% | | | 574,481,788 | | |
Liabilities in excess of other assets — (0.4)% | | | (2,083,377 | ) | |
NET ASSETS — 100.00% | | $ | 572,398,411 | | |
^ Purchased with cash collateral from securities on loan.
(a) Non-income producing security.
(b) Rule 144A security or other security that is restricted as to resale to institutional investors. The Fund's Adviser has deemed this security to be liquid based upon procedures approved by the Board of Trustees. As of June 30, 2021, the fair value of these securities was $55,658,191 and amounted to 9.7% of net assets.
(c) All or a portion of this security is on loan.
(d) Rate disclosed is the daily yield on June 30, 2021.
ADR — American Depositary Receipt
GDR — Global Depositary Receipt
PCL — Public Company Limited
PLC — Public Limited Company
See notes to financial statements.
23
Victory Portfolios | | Statements of Assets and Liabilities
June 30, 2021 | |
(Unaudited)
| | | Victory
RS International
Fund | | Victory
RS Global
Fund | | Victory Sophus
Emerging
Markets Fund | |
Assets: | |
Investments, at value (Cost $339,004,338,
$206,915,137 and $438,261,327) | | $ | 411,949,856 | (a) | | $ | 275,445,784 | (b) | | $ | 574,481,788 | (c) | |
Foreign currency, at value (Cost $525,936,
$179,247 and $622,673) | | | 524,344 | | | | 179,087 | | | | 621,888 | | |
Cash | | | 8,142,000 | | | | 3,886,101 | | | | 11,638,811 | | |
Receivables: | |
Interest and dividends | | | 536,894 | | | | 461,779 | | | | 1,002,633 | | |
Capital shares issued | | | 49,274 | | | | 571,370 | | | | 264,969 | | |
Investments sold | | | 1,569,901 | | | | 832,494 | | | | 4,498,704 | | |
Reclaims | | | 820,684 | | | | 105,119 | | | | 4,861 | | |
From Adviser | | | 73,804 | | | | 194,050 | | | | 254,716 | | |
Prepaid expenses | | | 32,037 | | | | 45,398 | | | | 38,383 | | |
Total Assets | | | 423,698,794 | | | | 281,721,182 | | | | 592,806,753 | | |
Liabilities: | |
Payables: | |
Collateral received on loaned securities | | | 2,898,989 | | | | 8,982,929 | | | | 7,337,834 | | |
Investments purchased | | | 3,649,720 | | | | 1,239,990 | | | | 10,934,566 | | |
Capital shares redeemed | | | 57,909 | | | | 269,043 | | | | 284,534 | | |
To Custodian | | | — | | | | — | | | | 120,008 | | |
Accrued foreign capital gains taxes | | | — | | | | — | | | | 1,100,681 | | |
Accrued expenses and other payables: | |
Investment advisory fees | | | 277,838 | | | | 176,747 | | | | 462,539 | | |
Administration fees | | | 21,941 | | | | 13,523 | | | | 28,385 | | |
Custodian fees | | | 8,764 | | | | 7,492 | | | | 46,821 | | |
Transfer agent fees | | | 32,931 | | | | 21,447 | | | | 44,441 | | |
Compliance fees | | | 209 | | | | 110 | | | | 263 | | |
| 12b-1 fees | | | 3,526 | | | | 7,243 | | | | 10,482 | | |
Other accrued expenses | | | 27,161 | | | | 14,319 | | | | 37,788 | | |
Total Liabilities | | | 6,978,988 | | | | 10,732,843 | | | | 20,408,342 | | |
Net Assets: | |
Capital | | | 332,690,782 | | | | 196,155,398 | | | | 420,303,768 | | |
Total accumulated earnings/(loss) | | | 84,029,024 | | | | 74,832,941 | | | | 152,094,643 | | |
Net Assets | | $ | 416,719,806 | | | $ | 270,988,339 | | | $ | 572,398,411 | | |
Net Assets | |
Class A | | $ | 26,108,076 | | | $ | 45,529,145 | | | $ | 64,917,092 | | |
Class C | | | 1,171,345 | | | | 3,752,882 | | | | 2,614,979 | | |
Class R | | | 1,887,790 | | | | 5,152,741 | | | | 13,742,956 | | |
Class R6 | | | 270,038,620 | | | | 70,854,467 | | | | 160,786,762 | | |
Class Y | | | 117,513,975 | | | | 145,699,104 | | | | 330,336,622 | | |
Total | | $ | 416,719,806 | | | $ | 270,988,339 | | | $ | 572,398,411 | | |
(continues on next page)
See notes to financial statements.
24
Victory Portfolios | | Statements of Assets and Liabilities
June 30, 2021 | |
(Unaudited)
| | | Victory
RS International
Fund | | Victory
RS Global
Fund | | Victory Sophus
Emerging
Markets Fund | |
Shares (unlimited number of shares authorized
with a par value of $0.001 per share): | |
Class A | | | 1,739,985 | | | | 2,338,416 | | | | 2,379,233 | | |
Class C | | | 108,714 | | | | 200,265 | | | | 129,340 | | |
Class R | | | 135,003 | | | | 212,124 | | | | 538,589 | | |
Class R6 | | | 21,764,304 | | | | 4,874,871 | | | | 5,787,852 | | |
Class Y | | | 7,937,375 | | | | 7,538,159 | | | | 12,014,060 | | |
Total | | | 31,685,381 | | | | 15,163,835 | | | | 20,849,074 | | |
Net asset value, offering (except Class A)
and redemption price per share: | |
Class A | | $ | 15.00 | | | $ | 19.47 | | | $ | 27.28 | | |
Class C (d) | | | 10.77 | | | | 18.74 | | | | 20.22 | | |
Class R | | | 13.98 | | | | 24.29 | | | | 25.52 | | |
Class R6 | | | 12.41 | | | | 14.53 | | | | 27.78 | | |
Class Y | | | 14.81 | | | | 19.33 | | | | 27.50 | | |
Maximum Sales Charge — Class A | | | 5.75 | % | | | 5.75 | % | | | 5.75 | % | |
Maximum offering price (100%/(100%-maximum
sales charge) of net asset value adjusted to the
nearest cent) per share — Class A | | $ | 15.92 | | | $ | 20.66 | | | $ | 28.94 | | |
(a) Includes $2,406,530 of securities on loan.
(b) Includes $8,524,966 of securities on loan.
(c) Includes $6,969,687 of securities on loan.
(d) Redemption price per share varies by the length of time shares are held.
See notes to financial statements.
25
Victory Portfolios | | Statements of Operations
For the Six Months Ended June 30, 2021 | |
(Unaudited)
| | | Victory
RS International
Fund | | Victory
RS Global
Fund | | Victory Sophus
Emerging
Markets Fund | |
Investment Income: | | | |
Dividends | | $ | 8,361,914 | | | $ | 3,135,863 | | | $ | 5,511,777 | | |
Interest | | | 338 | | | | 48 | | | | 698 | | |
Securities lending (net of fees) | | | 12,877 | | | | 8,721 | | | | 9,049 | | |
Foreign tax withholding | | | (899,695 | ) | | | (262,763 | ) | | | (579,463 | ) | |
Total Income | | | 7,475,434 | | | | 2,881,869 | | | | 4,942,061 | | |
Expenses: | | | |
Investment advisory fees | | | 1,579,697 | | | | 965,435 | | | | 2,639,092 | | |
Administration fees | | | 110,659 | | | | 67,593 | | | | 147,880 | | |
Sub-Administration fees | | | 8,287 | | | | 8,287 | | | | 8,287 | | |
| 12b-1 fees — Class A | | | 31,438 | | | | 58,126 | | | | 79,543 | | |
| 12b-1 fees — Class C | | | 5,733 | | | | 17,432 | | | | 14,805 | | |
| 12b-1 fees — Class R | | | 5,086 | | | | 11,888 | | | | 34,834 | | |
Custodian fees | | | 28,462 | | | | 22,327 | | | | 155,787 | | |
Transfer agent fees — Class A | | | 23,332 | | | | 33,937 | | | | 48,674 | | |
Transfer agent fees — Class C | | | 888 | | | | 2,436 | | | | 2,042 | | |
Transfer agent fees — Class R | | | 2,140 | | | | 2,717 | | | | 10,733 | | |
Transfer agent fees — Class R6 | | | 209 | | | | 158 | | | | 1,274 | | |
Transfer agent fees — Class Y | | | 53,389 | | | | 63,464 | | | | 150,650 | | |
Trustees' fees | | | 13,162 | | | | 7,868 | | | | 16,958 | | |
Compliance fees | | | 1,420 | | | | 824 | | | | 1,855 | | |
Legal and audit fees | | | 15,644 | | | | 10,964 | | | | 23,351 | | |
State registration and filing fees | | | 34,284 | | | | 43,379 | | | | 38,900 | | |
Interfund lending fees | | | — | | | | — | | | | 72 | | |
Other expenses | | | 32,060 | | | | 18,344 | | | | 49,403 | | |
Total Expenses | | | 1,945,890 | | | | 1,335,179 | | | | 3,424,140 | | |
Expenses waived/reimbursed by Adviser | | | (229,808 | ) | | | (537,651 | ) | | | (708,613 | ) | |
Net Expenses | | | 1,716,082 | | | | 797,528 | | | | 2,715,527 | | |
Net Investment Income (Loss) | | | 5,759,352 | | | | 2,084,341 | | | | 2,226,534 | | |
Realized/Unrealized Gains (Losses) from
Investments: | | | |
Net realized gains (losses) from investment
securities and foreign currency translations | | | 12,736,941 | | | | 6,735,961 | | | | 42,321,100 | | |
Foreign taxes on realized gains | | | — | | | | (21,275 | ) | | | (230,452 | ) | |
Net change in unrealized appreciation/
depreciation on investment securities
and foreign currency translations | | | 24,033,548 | | | | 20,449,481 | | | | 7,593,220 | | |
Net change in accrued foreign taxes on
unrealized gains | | | — | | | | 42,924 | | | | (768,800 | ) | |
Net realized/unrealized gains (losses) on
investments | | | 36,770,489 | | | | 27,207,091 | | | | 48,915,068 | | |
Change in net assets resulting from operations | | $ | 42,529,841 | | | $ | 29,291,432 | | | $ | 51,141,602 | | |
See notes to financial statements.
26
Victory Portfolios | | Statements of Changes in Net Assets | |
| | | Victory
RS International Fund | | Victory RS Global Fund | | Victory Sophus
Emerging Markets Fund | |
| | | Six
Months
Ended
June 30,
2021
(Unaudited) | | Year
Ended
December 31,
2020 | | Six
Months
Ended
June 30,
2021
(Unaudited) | | Year
Ended
December 31,
2020 | | Six
Months
Ended
June 30,
2021
(Unaudited) | | Year
Ended
December 31,
2020 | |
From Investment
Activities: | |
Operations: | |
Net investment
income (loss) | | $ | 5,759,352 | | | $ | 6,233,926 | | | $ | 2,084,341 | | | $ | 1,597,803 | | | $ | 2,226,534 | | | $ | 2,682,534 | | |
Net realized gains
(losses) from
investments | | | 12,736,941 | | | | (8,724,622 | ) | | | 6,714,686 | | | | (1,393,847 | ) | | | 42,090,648 | | | | (8,613,532 | ) | |
Net change in
unrealized
appreciation/
depreciation
on investments | | | 24,033,548 | | | | 28,956,558 | | | | 20,492,405 | | | | 29,593,557 | | | | 6,824,420 | | | | 60,954,839 | | |
Change in net assets
resulting from
operations | | | 42,529,841 | | | | 26,465,862 | | | | 29,291,432 | | | | 29,797,513 | | | | 51,141,602 | | | | 55,023,841 | | |
Distributions to
Shareholders: | |
Class A | | | — | | | | (274,567 | ) | | | — | | | | (331,988 | ) | | | — | | | | (535,962 | ) | |
Class C | | | — | | | | (10,582 | ) | | | — | | | | (1,968 | ) | | | — | | | | (13,061 | ) | |
Class R | | | — | | | | (18,299 | ) | | | — | | | | (15,302 | ) | | | — | | | | (104,197 | ) | |
Class R6 | | | — | | | | (4,128,368 | ) | | | — | | | | (385,647 | ) | | | — | | | | (1,356,685 | ) | |
Class Y | | | — | | | | (1,376,768 | ) | | | — | | | | (921,568 | ) | | | — | | | | (3,274,466 | ) | |
Change in net assets
resulting from
distributions to
shareholders | | | — | | | | (5,808,584 | ) | | | — | | | | (1,656,473 | ) | | | — | | | | (5,284,371 | ) | |
Change in net assets
resulting from
capital transactions | | | (7,447,427 | ) | | | 80,166,899 | | | | 20,985,827 | | | | 107,968,352 | | | | 48,257,550 | | | | 13,691,046 | | |
Change in net assets | | | 35,082,414 | | | | 100,824,177 | | | | 50,277,259 | | | | 136,109,392 | | | | 99,399,152 | | | | 63,430,516 | | |
Net Assets: | |
Beginning of period | | | 381,637,392 | | | | 280,813,215 | | | | 220,711,080 | | | | 84,601,688 | | | | 472,999,259 | | | | 409,568,743 | | |
End of period | | $ | 416,719,806 | | | $ | 381,637,392 | | | $ | 270,988,339 | | | $ | 220,711,080 | | | $ | 572,398,411 | | | $ | 472,999,259 | | |
(continues on next page)
See notes to financial statements.
27
Victory Portfolios | | Statements of Changes in Net Assets | |
(continued)
| | | Victory
RS International Fund | | Victory RS Global Fund | | Victory Sophus
Emerging Markets Fund | |
| | | Six
Months
Ended
June 30,
2021
(Unaudited) | | Year
Ended
December 31,
2020 | | Six
Months
Ended
June 30,
2021
(Unaudited) | | Year
Ended
December 31,
2020 | | Six
Months
Ended
June 30,
2021
(Unaudited) | | Year
Ended
December 31,
2020 | |
Capital Transactions: | |
Class A | |
Proceeds from
shares issued | | $ | 2,924,310 | | | $ | 5,891,859 | | | $ | 4,558,410 | | | $ | 27,939,328 | | | $ | 6,197,512 | | | $ | 6,957,366 | | |
Distributions
reinvested | | | — | | | | 269,013 | | | | — | | | | 331,945 | | | | — | | | | 522,611 | | |
Cost of shares
redeemed | | | (3,538,432 | ) | | | (6,074,845 | ) | | | (15,560,305 | ) | | | (9,924,361 | ) | | | (7,687,317 | ) | | | (16,658,257 | ) | |
Total Class A | | $ | (614,122 | ) | | $ | 86,027 | | | $ | (11,001,895 | ) | | $ | 18,346,912 | | | $ | (1,489,805 | ) | | $ | (9,178,280 | ) | |
Class C | |
Proceeds from
shares issued | | $ | — | | | $ | 214,019 | | | $ | 230,127 | | | $ | 1,659,100 | | | $ | 71,161 | | | $ | 127,024 | | |
Distributions
reinvested | | | — | | | | 10,582 | | | | — | | | | 1,968 | | | | — | | | | 13,061 | | |
Cost of shares
redeemed | | | (189,634 | ) | | | (487,454 | ) | | | (375,655 | ) | | | (1,700,108 | ) | | | (1,017,754 | ) | | | (2,713,128 | ) | |
Total Class C | | $ | (189,634 | ) | | $ | (262,853 | ) | | $ | (145,528 | ) | | $ | (39,040 | ) | | $ | (946,593 | ) | | $ | (2,573,043 | ) | |
Class R | |
Proceeds from
shares issued | | $ | 107,170 | | | $ | 518,709 | | | $ | 239,809 | | | $ | 1,990,563 | | | $ | 628,399 | | | $ | 1,471,645 | | |
Distributions
reinvested | | | — | | | | 18,299 | | | | — | | | | 15,299 | | | | — | | | | 104,042 | | |
Cost of shares
redeemed | | | (440,081 | ) | | | (1,230,005 | ) | | | (109,048 | ) | | | (602,183 | ) | | | (1,786,555 | ) | | | (3,568,641 | ) | |
Total Class R | | $ | (332,911 | ) | | $ | (692,997 | ) | | $ | 130,761 | | | $ | 1,403,679 | | | $ | (1,158,156 | ) | | $ | (1,992,954 | ) | |
Class R6 | |
Proceeds from
shares issued | | $ | 3,203,106 | | | $ | 73,968,309 | | | $ | 19,335,036 | | | $ | 41,962,795 | | | $ | 43,305,065 | | | $ | 46,226,922 | | |
Distributions
reinvested | | | — | | | | 4,107,091 | | | | — | | | | 385,647 | | | | — | | | | 1,298,132 | | |
Cost of shares
redeemed | | | (12,907,604 | ) | | | (19,424,029 | ) | | | (2,560,835 | ) | | | (752,758 | ) | | | (11,189,168 | ) | | | (19,463,001 | ) | |
Total Class R6 | | $ | (9,704,498 | ) | | $ | 58,651,371 | | | $ | 16,774,201 | | | $ | 41,595,684 | | | $ | 32,115,897 | | | $ | 28,062,053 | | |
Class Y | |
Proceeds from
shares issued | | $ | 19,877,256 | | | $ | 71,266,377 | | | $ | 27,308,173 | | | $ | 68,083,654 | | | $ | 53,403,979 | | | $ | 107,294,571 | | |
Distributions
reinvested | | | — | | | | 1,374,919 | | | | — | | | | 915,332 | | | | — | | | | 3,263,776 | | |
Cost of shares
redeemed | | | (16,483,518 | ) | | | (50,255,945 | ) | | | (12,079,885 | ) | | | (22,337,869 | ) | | | (33,667,772 | ) | | | (111,185,077 | ) | |
Total Class Y | | $ | 3,393,738 | | | $ | 22,385,351 | | | $ | 15,228,288 | | | $ | 46,661,117 | | | $ | 19,736,207 | | | $ | (626,730 | ) | |
Change in net assets
resulting from capital
transactions | | $ | (7,447,427 | ) | | $ | 80,166,899 | | | $ | 20,985,827 | | | $ | 107,968,352 | | | $ | 48,257,550 | | | $ | 13,691,046 | | |
(continues on next page)
See notes to financial statements.
28
Victory Portfolios | | Statements of Changes in Net Assets | |
(continued)
| | | Victory
RS International Fund | | Victory RS Global Fund | | Victory Sophus
Emerging Markets Fund | |
| | | Six
Months
Ended
June 30,
2021
(Unaudited) | | Year
Ended
December 31,
2020 | | Six
Months
Ended
June 30,
2021
(Unaudited) | | Year
Ended
December 31,
2020 | | Six
Months
Ended
June 30,
2021
(Unaudited) | | Year
Ended
December 31,
2020 | |
Share Transactions: | |
Class A | |
Issued | | | 203,557 | | | | 520,901 | | | | 253,579 | | | | 1,818,428 | | | | 232,289 | | | | 341,798 | | |
Reinvested | | | — | | | | 20,398 | | | | — | | | | 19,660 | | | | — | | | | 22,091 | | |
Redeemed | | | (243,802 | ) | | | (510,652 | ) | | | (872,069 | ) | | | (662,112 | ) | | | (290,213 | ) | | | (843,984 | ) | |
Total Class A | | | (40,245 | ) | | | 30,647 | | | | (618,490 | ) | | | 1,175,976 | | | | (57,924 | ) | | | (480,095 | ) | |
Class C | |
Issued | | | — | | | | 24,911 | | | | 12,621 | | | | 114,694 | | | | 3,643 | | | | 7,996 | | |
Reinvested | | | — | | | | 1,110 | | | | — | | | | 120 | | | | — | | | | 742 | | |
Redeemed | | | (18,970 | ) | | | (56,413 | ) | | | (21,569 | ) | | | (121,250 | ) | | | (51,746 | ) | | | (194,273 | ) | |
Total Class C | | | (18,970 | ) | | | (30,392 | ) | | | (8,948 | ) | | | (6,436 | ) | | | (48,103 | ) | | | (185,535 | ) | |
Class R | |
Issued | | | 8,111 | | | | 47,273 | | | | 10,476 | | | | 112,039 | | | | 25,267 | | | | 80,371 | | |
Reinvested | | | — | | | | 1,485 | | | | — | | | | 725 | | | | — | | | | 4,697 | | |
Redeemed | | | (31,866 | ) | | | (109,795 | ) | | | (4,817 | ) | | | (33,773 | ) | | | (71,688 | ) | | | (189,786 | ) | |
Total Class R | | | (23,755 | ) | | | (61,037 | ) | | | 5,659 | | | | 78,991 | | | | (46,421 | ) | | | (104,718 | ) | |
Class R6 | |
Issued | | | 271,958 | | | | 7,441,337 | | | | 1,426,822 | | | | 3,654,266 | | | | 1,594,862 | | | | 2,177,920 | | |
Reinvested | | | — | | | | 377,160 | | | | — | | | | 30,626 | | | | — | | | | 54,021 | | |
Redeemed | | | (1,100,539 | ) | | | (1,925,957 | ) | | | (185,575 | ) | | | (62,426 | ) | | | (414,705 | ) | | | (954,262 | ) | |
Total Class R6 | | | (828,581 | ) | | | 5,892,540 | | | | 1,241,247 | | | | 3,622,466 | | | | 1,180,157 | | | | 1,277,679 | | |
Class Y | |
Issued | | | 1,382,784 | | | | 6,057,992 | | | | 1,501,054 | | | | 4,700,411 | | | | 1,985,740 | | | | 5,108,144 | | |
Reinvested | | | — | | | | 105,805 | | | | — | | | | 54,670 | | | | — | | | | 137,133 | | |
Redeemed | | | (1,180,393 | ) | | | (4,344,365 | ) | | | (674,722 | ) | | | (1,611,862 | ) | | | (1,253,330 | ) | | | (5,852,490 | ) | |
Total Class Y | | | 202,391 | | | | 1,819,432 | | | | 826,332 | | | | 3,143,219 | | | | 732,410 | | | | (607,213 | ) | |
Change in Shares | | | (709,160 | ) | | | 7,651,190 | | | | 1,445,800 | | | | 8,014,216 | | | | 1,760,119 | | | | (99,882 | ) | |
See notes to financial statements.
29
Victory Portfolios | | Financial Highlights | |
For a Share Outstanding Throughout Each Period
| | | | | Investment Activities | | Distributions to
Shareholders From | |
| | | Net Asset
Value,
Beginning of
Period | | Net
Investment
Income
(Loss)(a) | | Net
Realized and
Unrealized
Gains
(Losses) on
Investments | | Total from
Investment
Activities | | Net
Investment
Income | | Net Realized
Gains from
Investments | | Total
Distributions | |
Victory RS International Fund | |
Class A | |
Six Months
Ended
June 30, 2021
(Unaudited) | | $ | 13.49 | | | | 0.19 | | | | 1.32 | | | | 1.51 | | | | — | | | | — | | | | — | | |
Year Ended:
December 31,
2020 | | $ | 12.93 | | | | 0.21 | | | | 0.51 | | | | 0.72 | | | | (0.13 | ) | | | (0.03 | ) | | | (0.16 | ) | |
December 31,
2019 | | $ | 10.63 | | | | 0.26 | | | | 2.05 | | | | 2.31 | | | | — | (f) | | | (0.01 | ) | | | (0.01 | ) | |
December 31,
2018 | | $ | 12.12 | | | | 0.23 | | | | (1.52 | ) | | | (1.29 | ) | | | (0.20 | ) | | | — | | | | (0.20 | ) | |
December 31,
2017 | | $ | 9.84 | | | | 0.19 | | | | 2.29 | | | | 2.48 | | | | (0.20 | ) | | | — | | | | (0.20 | ) | |
December 31,
2016 | | $ | 9.78 | | | | 0.16 | | | | (0.07 | ) | | | 0.09 | | | | (0.17 | ) | | | — | | | | (0.17 | ) | |
Class C | |
Six Months
Ended
June 30, 2021
(Unaudited) | | $ | 9.72 | | | | 0.10 | | | | 0.95 | | | | 1.05 | | | | — | | | | — | | | | — | | |
Year Ended:
December 31,
2020 | | $ | 9.36 | | | | 0.10 | | | | 0.34 | | | | 0.44 | | | | (0.05 | ) | | | (0.03 | ) | | | (0.08 | ) | |
December 31,
2019 | | $ | 7.76 | | | | 0.12 | | | | 1.49 | | | | 1.61 | | | | — | | | | (0.01 | ) | | | (0.01 | ) | |
December 31,
2018 | | $ | 8.89 | | | | 0.11 | | | | (1.11 | ) | | | (1.00 | ) | | | (0.13 | ) | | | — | | | | (0.13 | ) | |
December 31,
2017 | | $ | 7.26 | | | | 0.08 | | | | 1.68 | | | | 1.76 | | | | (0.13 | ) | | | — | | | | (0.13 | ) | |
December 31,
2016 | | $ | 7.26 | | | | 0.07 | | | | (0.08 | ) | | | (0.01 | ) | | | (0.13 | ) | | | — | | | | (0.13 | ) | |
(a) Per share net investment income (loss) has been calculated using the average daily shares method.
(b) The Fund received monies related to a nonrecurring refund from the prior custodian. The corresponding impact to the total return was 1.45% for the period shown.
(c) Not annualized for periods less than one year.
(d) Annualized for periods less than one year.
(e) Portfolio turnover is calculated on the basis of the Fund as a whole without distinguishing between the classes of shares issued.
(f) Amount is less than $0.005 per share.
See notes to financial statements.
30
Victory Portfolios | | Financial Highlights — continued | |
For a Share Outstanding Throughout Each Period
| | | | | Ratios to Average Net Assets | | Supplemental Data | |
| | | Capital
Contributions
from Prior
Custodian,
Net(b) | | Net Asset
Value,
End of
Period | | Total
Return
(Excludes
Sales
Charge)(c) | | Net
Expenses(d) | | Net
Investment
Income
(Loss)(d) | | Gross
Expenses(d) | | Net Assets,
End of
Period
(000's) | | Portfolio
Turnover(c)(e) | |
Victory RS International Fund | |
Class A | |
Six Months
Ended
June 30, 2021
(Unaudited) | | | — | | | $ | 15.00 | | | | 11.19 | % | | | 1.13 | % | | | 2.68 | % | | | 1.40 | % | | $ | 26,108 | | | | 29 | % | |
Year Ended:
December 31,
2020 | | | — | | | $ | 13.49 | | | | 5.55 | % | | | 1.13 | % | | | 1.79 | % | | | 1.47 | % | | $ | 24,010 | | | | 52 | % | |
December 31,
2019 | | | — | | | $ | 12.93 | | | | 21.72 | % | | | 1.13 | % | | | 2.18 | % | | | 1.55 | % | | $ | 22,620 | | | | 20 | % | |
December 31,
2018 | | | — | | | $ | 10.63 | | | | (10.65 | )% | | | 1.13 | % | | | 1.97 | % | | | 1.61 | % | | $ | 15,716 | | | | 52 | % | |
December 31,
2017 | | | — | | | $ | 12.12 | | | | 25.26 | % | | | 1.20 | % | | | 1.66 | % | | | 1.81 | % | | $ | 18,512 | | | | 60 | % | |
December 31,
2016 | | | 0.14 | | | $ | 9.84 | | | | 2.41 | %(b) | | | 1.40 | % | | | 1.64 | % | | | 1.95 | % | | $ | 16,799 | | | | 103 | % | |
Class C | |
Six Months
Ended
June 30, 2021
(Unaudited) | | | — | | | $ | 10.77 | | | | 10.80 | % | | | 1.88 | % | | | 1.88 | % | | | 3.10 | % | | $ | 1,171 | | | | 29 | % | |
Year Ended:
December 31,
2020 | | | — | | | $ | 9.72 | | | | 4.76 | % | | | 1.88 | % | | | 1.14 | % | | | 3.07 | % | | $ | 1,241 | | | | 52 | % | |
December 31,
2019 | | | — | | | $ | 9.36 | | | | 20.70 | % | | | 1.88 | % | | | 1.39 | % | | | 3.14 | % | | $ | 1,480 | | | | 20 | % | |
December 31,
2018 | | | — | | | $ | 7.76 | | | | (11.24 | )% | | | 1.88 | % | | | 1.23 | % | | | 3.52 | % | | $ | 702 | | | | 52 | % | |
December 31,
2017 | | | — | | | $ | 8.89 | | | | 24.25 | % | | | 1.95 | % | | | 0.92 | % | | | 3.26 | % | | $ | 1,066 | | | | 60 | % | |
December 31,
2016 | | | 0.14 | | | $ | 7.26 | | | | 1.77 | %(b) | | | 2.15 | % | | | 0.97 | % | | | 3.05 | % | | $ | 1,228 | | | | 103 | % | |
(continues on next page)
See notes to financial statements.
31
Victory Portfolios | | Financial Highlights | |
For a Share Outstanding Throughout Each Period
| | | | | Investment Activities | | Distributions to
Shareholders From | |
| | | Net Asset
Value,
Beginning of
Period | | Net
Investment
Income
(Loss)(a) | | Net
Realized and
Unrealized
Gains
(Losses) on
Investments | | Total from
Investment
Activities | | Net
Investment
Income | | Net Realized
Gains from
Investments | | Total
Distributions | |
Victory RS International Fund | |
Class R | |
Six Months
Ended
June 30, 2021
(Unaudited) | | $ | 12.58 | | | | 0.16 | | | | 1.24 | | | | 1.40 | | | | — | | | | — | | | | — | | |
Year Ended:
December 31,
2020 | | $ | 12.07 | | | | 0.18 | | | | 0.45 | | | | 0.63 | | | | (0.09 | ) | | | (0.03 | ) | | | (0.12 | ) | |
December 31,
2019 | | $ | 9.95 | | | | 0.21 | | | | 1.92 | | | | 2.13 | | | | — | | | | (0.01 | ) | | | (0.01 | ) | |
December 31,
2018 | | $ | 11.35 | | | | 0.19 | | | | (1.42 | ) | | | (1.23 | ) | | | (0.17 | ) | | | — | | | | (0.17 | ) | |
December 31,
2017 | | $ | 9.23 | | | | 0.15 | | | | 2.14 | | | | 2.29 | | | | (0.17 | ) | | | — | | | | (0.17 | ) | |
December 31,
2016 | | $ | 9.18 | | | | 0.11 | | | | (0.06 | ) | | | 0.05 | | | | (0.14 | ) | | | — | | | | (0.14 | ) | |
Class R6 | |
Six Months
Ended
June 30, 2021
(Unaudited) | | $ | 11.14 | | | | 0.17 | | | | 1.10 | | | | 1.27 | | | | — | | | | — | | | | — | | |
Year Ended
December 31,
2020 | | $ | 10.70 | | | | 0.20 | | | | 0.43 | | | | 0.63 | | | | (0.16 | ) | | | (0.03 | ) | | | (0.19 | ) | |
May 2, 2019(f)
through
December 31,
2019 | | $ | 10.00 | | | | 0.06 | | | | 0.67 | | | | 0.73 | | | | (0.02 | ) | | | (0.01 | ) | | | (0.03 | ) | |
(a) Per share net investment income (loss) has been calculated using the average daily shares method.
(b) The Fund received monies related to a nonrecurring refund from the prior custodian. The corresponding impact to the total return was 1.45% for the period shown.
(c) Not annualized for periods less than one year.
(d) Annualized for periods less than one year.
(e) Portfolio turnover is calculated on the basis of the Fund as a whole without distinguishing between the classes of shares issued.
(f) Commencement of operations.
See notes to financial statements.
32
Victory Portfolios | | Financial Highlights — continued | |
For a Share Outstanding Throughout Each Period (continued)
| | | | | Ratios to Average Net Assets | | Supplemental Data | |
| | | Capital
Contributions
from Prior
Custodian,
Net(b) | | Net Asset
Value,
End of
Period | | Total
Return(c) | | Net
Expenses(d) | | Net
Investment
Income
(Loss)(d) | | Gross
Expenses(d) | | Net Assets,
End of
Period
(000's) | | Portfolio
Turnover(c)(e) | |
Victory RS International Fund | |
Class R | |
Six Months
Ended
June 30, 2021
(Unaudited) | | | — | | | $ | 13.98 | | | | 11.13 | % | | | 1.38 | % | | | 2.44 | % | | | 2.18 | % | | $ | 1,888 | | | | 29 | % | |
Year Ended:
December 31,
2020 | | | — | | | $ | 12.58 | | | | 5.21 | % | | | 1.38 | % | | | 1.60 | % | | | 2.24 | % | | $ | 1,998 | | | | 52 | % | |
December 31,
2019 | | | — | | | $ | 12.07 | | | | 21.37 | % | | | 1.38 | % | | | 1.87 | % | | | 2.32 | % | | $ | 2,652 | | | | 20 | % | |
December 31,
2018 | | | — | | | $ | 9.95 | | | | (10.85 | )% | | | 1.38 | % | | | 1.73 | % | | | 2.31 | % | | $ | 1,786 | | | | 52 | % | |
December 31,
2017 | | | — | | | $ | 11.35 | | | | 24.85 | % | | | 1.48 | % | | | 1.39 | % | | | 2.48 | % | | $ | 2,522 | | | | 60 | % | |
December 31,
2016 | | | 0.14 | | | $ | 9.23 | | | | 2.06 | %(b) | | | 1.80 | % | | | 1.26 | % | | | 2.29 | % | | $ | 2,279 | | | | 103 | % | |
Class R6 | |
Six Months
Ended
June 30, 2021
(Unaudited) | | | — | | | $ | 12.41 | | | | 11.40 | % | | | 0.83 | % | | | 2.96 | % | | | 0.91 | % | | $ | 270,039 | | | | 29 | % | |
Year Ended
December 31,
2020 | | | — | | | $ | 11.14 | | | | 5.90 | % | | | 0.83 | % | | | 2.03 | % | | | 0.93 | % | | $ | 251,586 | | | | 52 | % | |
May 2, 2019(f)
through
December 31,
2019 | | | — | | | $ | 10.70 | | | | 7.24 | % | | | 0.83 | % | | | 0.92 | % | | | 0.97 | % | | $ | 178,695 | | | | 20 | % | |
(continues on next page)
See notes to financial statements.
33
Victory Portfolios | | Financial Highlights | |
For a Share Outstanding Throughout Each Period
| | | | | Investment Activities | | Distributions to
Shareholders From | |
| | | Net Asset
Value,
Beginning of
Period | | Net
Investment
Income
(Loss)(a) | | Net
Realized and
Unrealized
Gains
(Losses) on
Investments | | Total from
Investment
Activities | | Net
Investment
Income | | Net Realized
Gains from
Investments | | Total
Distributions | |
Victory RS International Fund | |
Class Y | |
Six Months
Ended
June 30, 2021
(Unaudited) | | $ | 13.29 | | | | 0.20 | | | | 1.32 | | | | 1.52 | | | | — | | | | — | | | | — | | |
Year Ended:
December 31,
2020 | | $ | 12.74 | | | | 0.25 | | | | 0.49 | | | | 0.74 | | | | (0.16 | ) | | | (0.03 | ) | | | (0.19 | ) | |
December 31,
2019 | | $ | 10.47 | | | | 0.22 | | | | 2.08 | | | | 2.30 | | | | (0.02 | ) | | | (0.01 | ) | | | (0.03 | ) | |
December 31,
2018 | | $ | 11.93 | | | | 0.23 | | | | (1.47 | ) | | | (1.24 | ) | | | (0.22 | ) | | | — | | | | (0.22 | ) | |
December 31,
2017 | | $ | 9.69 | | | | 0.22 | | | | 2.26 | | | | 2.48 | | | | (0.24 | ) | | | — | | | | (0.24 | ) | |
December 31,
2016 | | $ | 9.62 | | | | 0.18 | | | | (0.06 | ) | | | 0.12 | | | | (0.19 | ) | | | — | | | | (0.19 | ) | |
(a) Per share net investment income (loss) has been calculated using the average daily shares method.
(b) The Fund received monies related to a nonrecurring refund from the prior custodian. The corresponding impact to the total return was 1.45% for the period shown.
(c) Not annualized for periods less than one year.
(d) Annualized for periods less than one year.
(e) Portfolio turnover is calculated on the basis of the Fund as a whole without distinguishing between the classes of shares issued.
See notes to financial statements.
34
Victory Portfolios | | Financial Highlights — continued | |
For a Share Outstanding Throughout Each Period (continued)
| | | | | Ratios to Average Net Assets | | Supplemental Data | |
| | | Capital
Contributions
from Prior
Custodian,
Net(b) | | Net Asset
Value,
End of
Period | |
Total
Return(c) | | Net
Expenses(d) | | Net
Investment
Income
(Loss)(d) | | Gross
Expenses(d) | | Net Assets,
End of
Period
(000's) | | Portfolio
Turnover(c)(e) | |
Victory RS International Fund | |
Class Y | |
Six Months
Ended
June 30, 2021
(Unaudited) | | | — | | | $ | 14.81 | | | | 11.44 | % | | | 0.88 | % | | | 2.89 | % | | | 1.02 | % | | $ | 117,514 | | | | 29 | % | |
Year Ended:
December 31,
2020 | | | — | | | $ | 13.29 | | | | 5.80 | % | | | 0.88 | % | | | 2.11 | % | | | 1.09 | % | | $ | 102,803 | | | | 52 | % | |
December 31,
2019 | | | — | | | $ | 12.74 | | | | 21.94 | % | | | 0.88 | % | | | 1.80 | % | | | 1.16 | % | | $ | 75,366 | | | | 20 | % | |
December 31,
2018 | | | — | | | $ | 10.47 | | | | (10.38 | )% | | | 0.88 | % | | | 1.97 | % | | | 1.62 | % | | $ | 5,979 | | | | 52 | % | |
December 31,
2017 | | | — | | | $ | 11.93 | | | | 25.56 | % | | | 0.94 | % | | | 1.98 | % | | | 1.85 | % | | $ | 3,122 | | | | 60 | % | |
December 31,
2016 | | | 0.14 | | | $ | 9.69 | | | | 2.69 | %(b) | | | 1.15 | % | | | 1.93 | % | | | 1.80 | % | | $ | 2,626 | | | | 103 | % | |
See notes to financial statements.
35
Victory Portfolios | | Financial Highlights | |
For a Share Outstanding Throughout Each Period
| | | | Investment Activities | | Distributions to
Shareholders From | |
| | | Net Asset
Value,
Beginning of
Period | | Net
Investment
Income
(Loss)(a) | | Net
Realized and
Unrealized
Gains
(Losses) on
Investments | | Total from
Investment
Activities | | Net
Investment
Income | | Net Realized
Gains from
Investments | | Return of
Capital | |
Victory RS Global Fund | |
Class A | |
Six Months
Ended
June 30, 2021
(Unaudited) | | $ | 17.27 | | | | 0.14 | | | | 2.06 | | | | 2.20 | | | | — | | | | — | | | | — | | |
Year Ended:
December 31,
2020 | | $ | 14.86 | | | | 0.18 | | | | 2.35 | | | | 2.53 | | | | (0.11 | ) | | | (0.01 | ) | | | — | | |
December 31,
2019 | | $ | 11.53 | | | | 0.21 | | | | 3.29 | | | | 3.50 | | | | (0.16 | ) | | | (0.01 | ) | | | — | | |
December 31,
2018 | | $ | 12.75 | | | | 0.20 | | | | (0.90 | ) | | | (0.70 | ) | | | (0.16 | ) | | | (0.36 | ) | | | — | | |
December 31,
2017 | | $ | 11.16 | | | | 0.15 | | | | 2.53 | | | | 2.68 | | | | — | | | | (1.00 | ) | | | (0.09 | ) | |
December 31,
2016 | | $ | 11.56 | | | | 0.13 | | | | 0.65 | | | | 0.78 | | | | (0.03 | ) | | | (1.15 | ) | | | — | | |
Class C | |
Six Months
Ended
June 30, 2021
(Unaudited) | | $ | 16.68 | | | | 0.07 | | | | 1.99 | | | | 2.06 | | | | — | | | | — | | | | — | | |
Year Ended:
December 31,
2020 | | $ | 14.38 | | | | 0.07 | | | | 2.24 | | | | 2.31 | | | | — | (e) | | | (0.01 | ) | | | — | | |
December 31,
2019 | | $ | 11.17 | | | | 0.14 | | | | 3.16 | | | | 3.30 | | | | (0.08 | ) | | | (0.01 | ) | | | — | | |
December 31,
2018 | | $ | 12.38 | | | | 0.10 | | | | (0.87 | ) | | | (0.77 | ) | | | (0.08 | ) | | | (0.36 | ) | | | — | | |
December 31,
2017 | | $ | 10.95 | | | | 0.05 | | | | 2.47 | | | | 2.52 | | | | — | | | | (1.00 | ) | | | (0.09 | ) | |
December 31,
2016 | | $ | 11.42 | | | | 0.05 | | | | 0.63 | | | | 0.68 | | | | — | | | | (1.15 | ) | | | — | | |
(a) Per share net investment income (loss) has been calculated using the average daily shares method.
(b) Not annualized for periods less than one year.
(c) Annualized for periods less than one year.
(d) Portfolio turnover is calculated on the basis of the Fund as a whole without distinguishing between the classes of shares issued.
(e) Amount is less than $0.005 per share.
See notes to financial statements.
36
Victory Portfolios | | Financial Highlights — continued | |
For a Share Outstanding Throughout Each Period
| | | | | Ratios to Average Net Assets | | Supplemental Data | |
| | |
Total
Distributions | | Net Asset
Value,
End of
Period | | Total
Return
(Excludes
Sales
Charge)(b) | | Net
Expenses(c) | | Net
Investment
Income
(Loss)(c) | | Gross
Expenses(c) | | Net Assets,
End of
Period
(000's) | | Portfolio
Turnover(b)(d) | |
Victory RS Global Fund | |
Class A | |
Six Months
Ended
June 30, 2021
(Unaudited) | | | — | | | $ | 19.47 | | | | 12.74 | % | | | 0.85 | % | | | 1.50 | % | | | 1.37 | % | | $ | 45,529 | | | | 30 | % | |
Year Ended:
December 31,
2020 | | | (0.12 | ) | | $ | 17.27 | | | | 17.00 | % | | | 0.85 | % | | | 1.22 | % | | | 1.40 | % | | $ | 51,066 | | | | 71 | % | |
December 31,
2019 | | | (0.17 | ) | | $ | 14.86 | | | | 30.36 | % | | | 0.85 | % | | | 1.51 | % | | | 1.53 | % | | $ | 26,471 | | | | 46 | % | |
December 31,
2018 | | | (0.52 | ) | | $ | 11.53 | | | | (5.45 | )% | | | 0.94 | % | | | 1.51 | % | | | 1.75 | % | | $ | 5,695 | | | | 58 | % | |
December 31,
2017 | | | (1.09 | ) | | $ | 12.75 | | | | 24.48 | % | | | 1.17 | % | | | 1.24 | % | | | 1.90 | % | | $ | 3,456 | | | | 187 | % | |
December 31,
2016 | | | (1.18 | ) | | $ | 11.16 | | | | 6.67 | % | | | 1.40 | % | | | 1.12 | % | | | 1.71 | % | | $ | 5,366 | | | | 184 | % | |
Class C | |
Six Months
Ended
June 30, 2021
(Unaudited) | | | — | | | $ | 18.74 | | | | 12.35 | % | | | 1.60 | % | | | 0.77 | % | | | 2.43 | % | | $ | 3,753 | | | | 30 | % | |
Year Ended:
December 31,
2020 | | | (0.01 | ) | | $ | 16.68 | | | | 16.06 | % | | | 1.60 | % | | | 0.48 | % | | | 2.53 | % | | $ | 3,491 | | | | 71 | % | |
December 31,
2019 | | | (0.09 | ) | | $ | 14.38 | | | | 29.52 | % | | | 1.60 | % | | | 1.07 | % | | | 2.59 | % | | $ | 3,101 | | | | 46 | % | |
December 31,
2018 | | | (0.44 | ) | | $ | 11.17 | | | | (6.20 | )% | | | 1.70 | % | | | 0.79 | % | | | 2.59 | % | | $ | 2,358 | | | | 58 | % | |
December 31,
2017 | | | (1.09 | ) | | $ | 12.38 | | | | 23.47 | % | | | 1.91 | % | | | 0.41 | % | | | 3.00 | % | | $ | 2,167 | | | | 187 | % | |
December 31,
2016 | | | (1.15 | ) | | $ | 10.95 | | | | 5.92 | % | | | 2.16 | % | | | 0.41 | % | | | 2.44 | % | | $ | 1,270 | | | | 184 | % | |
(continues on next page)
See notes to financial statements.
37
Victory Portfolios | | Financial Highlights | |
For a Share Outstanding Throughout Each Period
| | | | | Investment Activities | | Distributions to
Shareholders From | |
| | | Net Asset
Value,
Beginning of
Period | | Net
Investment
Income
(Loss)(a) | | Net
Realized and
Unrealized
Gains
(Losses) on
Investments | | Total from
Investment
Activities | | Net
Investment
Income | | Net Realized
Gains from
Investments | | Return of
Capital | |
Victory RS Global Fund | |
Class R | |
Six Months
Ended
June 30, 2021
(Unaudited) | | $ | 21.57 | | | | 0.14 | | | | 2.58 | | | | 2.72 | | | | — | | | | — | | | | — | | |
Year Ended:
December 31,
2020 | | $ | 18.55 | | | | 0.18 | | | | 2.92 | | | | 3.10 | | | | (0.07 | ) | | | (0.01 | ) | | | — | | |
December 31,
2019 | | $ | 14.37 | | | | 0.25 | | | | 4.07 | | | | 4.32 | | | | (0.13 | ) | | | (0.01 | ) | | | — | | |
December 31,
2018 | | $ | 15.76 | | | | 0.20 | | | | (1.10 | ) | | | (0.90 | ) | | | (0.13 | ) | | | (0.36 | ) | | | — | | |
December 31,
2017 | | $ | 13.62 | | | | 0.05 | | | | 3.18 | | | | 3.23 | | | | — | | | | (1.00 | ) | | | (0.09 | ) | |
December 31,
2016 | | $ | 11.50 | | | | 0.09 | | | | 3.43 | | | | 3.52 | | | | (0.25 | ) | | | (1.15 | ) | | | — | | |
Class R6 | |
Six Months
Ended
June 30, 2021
(Unaudited) | | $ | 12.87 | | | | 0.13 | | | | 1.53 | | | | 1.66 | | | | — | | | | — | | | | — | | |
Year Ended
December 31,
2020 | | $ | 11.07 | | | | 0.08 | | | | 1.83 | | | | 1.91 | | | | (0.10 | ) | | | (0.01 | ) | | | — | | |
May 2, 2019(f)
through
December 31,
2019 | | $ | 10.00 | | | | 0.13 | | | | 1.12 | | | | 1.25 | | | | (0.17 | ) | | | (0.01 | ) | | | — | | |
(a) Per share net investment income (loss) has been calculated using the average daily shares method.
(b) Not annualized for periods less than one year.
(c) Annualized for periods less than one year.
(d) Portfolio turnover is calculated on the basis of the Fund as a whole without distinguishing between the classes of shares issued.
(e) During the period, the share class recognized certain expense reimbursements and due to the fluctuation in average net assets during the same period the total return reflected is significantly higher than the other share classes of the Fund. The total return would have been 6.39% had the expense reimbursements not occurred.
(f) Commencement of operations.
See notes to financial statements.
38
Victory Portfolios | | Financial Highlights — continued | |
For a Share Outstanding Throughout Each Period (continued)
| | | | | Ratios to Average Net Assets | | Supplemental Data | |
| | |
Total
Distributions | | Net Asset
Value,
End of
Period | | Total
Return(b) | | Net
Expenses(c) | | Net
Investment
Income
(Loss)(c) | | Gross
Expenses(c) | | Net Assets,
End of
Period
(000's) | | Portfolio
Turnover(b)(d) | |
Victory RS Global Fund | |
Class R | |
Six Months
Ended
June 30, 2021
(Unaudited) | | | — | | | $ | 24.29 | | | | 12.61 | % | | | 1.10 | % | | | 1.27 | % | | | 1.78 | % | | $ | 5,153 | | | | 30 | % | |
Year Ended:
December 31,
2020 | | | (0.08 | ) | | $ | 21.57 | | | | 16.70 | % | | | 1.10 | % | | | 0.98 | % | | | 1.93 | % | | $ | 4,454 | | | | 71 | % | |
December 31,
2019 | | | (0.14 | ) | | $ | 18.55 | | | | 30.10 | % | | | 1.10 | % | | | 1.53 | % | | | 2.34 | % | | $ | 2,365 | | | | 46 | % | |
December 31,
2018 | | | (0.49 | ) | | $ | 14.37 | | | | (5.68 | )% | | | 1.20 | % | | | 1.25 | % | | | 2.34 | % | | $ | 1,920 | | | | 58 | % | |
December 31,
2017 | | | (1.09 | ) | | $ | 15.76 | | | | 24.09 | % | | | 1.61 | % | | | 0.38 | % | | | 2.76 | % | | $ | 2,281 | | | | 187 | % | |
December 31,
2016 | | | (1.40 | ) | | $ | 13.62 | | | | 30.57 | %(e) | | | 1.68 | % | | | 0.74 | % | | | 1.81 | % | | $ | 9,213 | | | | 184 | % | |
Class R6 | |
Six Months
Ended
June 30, 2021
(Unaudited) | | | — | | | $ | 14.53 | | | | 12.90 | % | | | 0.55 | % | | | 1.85 | % | | | 0.93 | % | | $ | 70,854 | | | | 30 | % | |
Year Ended
December 31,
2020 | | | (0.11 | ) | | $ | 12.87 | | | | 17.27 | % | | | 0.55 | % | | | 0.64 | % | | | 1.16 | % | | $ | 46,776 | | | | 71 | % | |
May 2, 2019(f)
through
December 31,
2019 | | | (0.18 | ) | | $ | 11.07 | | | | 12.47 | % | | | 0.55 | % | | | 1.85 | % | | | 28.85 | % | | $ | 124 | | | | 46 | % | |
(continues on next page)
See notes to financial statements.
39
Victory Portfolios | | Financial Highlights | |
For a Share Outstanding Throughout Each Period
| | | | Investment Activities | | Distributions to
Shareholders From | |
| | | Net Asset
Value,
Beginning of
Period | | Net
Investment
Income
(Loss)(a) | | Net
Realized and
Unrealized
Gains
(Losses) on
Investments | | Total from
Investment
Activities | | Net
Investment
Income | | Net Realized
Gains from
Investments | | Return of
Capital | |
Victory RS Global Fund | |
Class Y | |
Six Months
Ended
June 30, 2021
(Unaudited) | | $ | 17.12 | | | | 0.16 | | | | 2.05 | | | | 2.21 | | | | — | | | | — | | | | — | | |
Year Ended:
December 31,
2020 | | $ | 14.72 | | | | 0.20 | | | | 2.34 | | | | 2.54 | | | | (0.13 | ) | | | (0.01 | ) | | | — | | |
December 31,
2019 | | $ | 11.42 | | | | 0.26 | | | | 3.24 | | | | 3.50 | | | | (0.19 | ) | | | (0.01 | ) | | | — | | |
December 31,
2018 | | $ | 12.63 | | | | 0.23 | | | | (0.89 | ) | | | (0.66 | ) | | | (0.19 | ) | | | (0.36 | ) | | | — | | |
December 31,
2017 | | $ | 11.04 | | | | 0.18 | | | | 2.50 | | | | 2.68 | | | | — | | | | (1.00 | ) | | | (0.09 | ) | |
December 31,
2016 | | $ | 11.60 | | | | 0.15 | | | | 0.67 | | | | 0.82 | | | | (0.23 | ) | | | (1.15 | ) | | | — | | |
(a) Per share net investment income (loss) has been calculated using the average daily shares method.
(b) Not annualized for periods less than one year.
(c) Annualized for periods less than one year.
(d) Portfolio turnover is calculated on the basis of the Fund as a whole without distinguishing between the classes of shares issued.
See notes to financial statements.
40
Victory Portfolios | | Financial Highlights — continued | |
For a Share Outstanding Throughout Each Period (continued)
| | | | | Ratios to Average Net Assets | | Supplemental Data | |
| | |
Total
Distributions | | Net Asset
Value,
End of
Period | |
Total
Return(b) | | Net
Expenses(c) | | Net
Investment
Income
(Loss)(c) | | Gross
Expenses(c) | | Net Assets,
End of
Period
(000's) | | Portfolio
Turnover(b)(d) | |
Victory RS Global Fund | |
Class Y | |
Six Months
Ended
June 30, 2021
(Unaudited) | | | — | | | $ | 19.33 | | | | 12.91 | % | | | 0.60 | % | | | 1.79 | % | | | 1.03 | % | | $ | 145,699 | | | | 30 | % | |
Year Ended:
December 31,
2020 | | | (0.14 | ) | | $ | 17.12 | | | | 17.27 | % | | | 0.60 | % | | | 1.38 | % | | | 1.10 | % | | $ | 114,925 | | | | 71 | % | |
December 31,
2019 | | | (0.20 | ) | | $ | 14.72 | | | | 30.69 | % | | | 0.60 | % | | | 1.95 | % | | | 1.17 | % | | $ | 52,541 | | | | 46 | % | |
December 31,
2018 | | | (0.55 | ) | | $ | 11.42 | | | | (5.17 | )% | | | 0.70 | % | | | 1.80 | % | | | 1.20 | % | | $ | 25,544 | | | | 58 | % | |
December 31,
2017 | | | (1.09 | ) | | $ | 12.63 | | | | 24.75 | % | | | 0.88 | % | | | 1.44 | % | | | 1.32 | % | | $ | 24,657 | | | | 187 | % | |
December 31,
2016 | | | (1.38 | ) | | $ | 11.04 | | | | 7.01 | % | | | 1.09 | % | | | 1.30 | % | | | 1.36 | % | | $ | 13,430 | | | | 184 | % | |
See notes to financial statements.
41
Victory Portfolios | | Financial Highlights | |
For a Share Outstanding Throughout Each Period
| | | | | Investment Activities | | Distributions to
Shareholders From | |
| | | Net Asset
Value,
Beginning of
Period | | Net
Investment
Income
(Loss)(a) | | Net
Realized and
Unrealized
Gains
(Losses) on
Investments | | Total from
Investment
Activities | | Net
Investment
Income | | Net Realized
Gains from
Investments | | Total
Distributions | |
Victory Sophus Emerging Markets Fund | |
Class A | |
Six Months
Ended
June 30, 2021
(Unaudited) | | $ | 24.70 | | | | 0.07 | | | | 2.51 | | | | 2.58 | | | | — | | | | — | | | | — | | |
Year Ended:
December 31,
2020 | | $ | 21.37 | | | | 0.10 | | | | 3.45 | | | | 3.55 | | | | (0.22 | ) | | | — | | | | (0.22 | ) | |
December 31,
2019 | | $ | 17.45 | | | | 0.37 | | | | 3.65 | | | | 4.02 | | | | (0.10 | ) | | | — | | | | (0.10 | ) | |
December 31,
2018 | | $ | 22.52 | | | | 0.24 | | | | (4.54 | ) | | | (4.30 | ) | | | (0.13 | ) | | | (0.64 | ) | | | (0.77 | ) | |
December 31,
2017 | | $ | 15.98 | | | | 0.16 | | | | 6.55 | | | | 6.71 | | | | (0.17 | ) | | | — | | | | (0.17 | ) | |
December 31,
2016 | | $ | 14.60 | | | | 0.11 | | | | 1.38 | | | | 1.49 | | | | (0.15 | ) | | | — | | | | (0.15 | ) | |
Class C | |
Six Months
Ended
June 30, 2021
(Unaudited) | | $ | 18.38 | | | | (0.04 | ) | | | 1.88 | | | | 1.84 | | | | — | | | | — | | | | — | | |
Year Ended:
December 31,
2020 | | $ | 15.94 | | | | (0.07 | ) | | | 2.58 | | | | 2.51 | | | | (0.07 | ) | | | — | | | | (0.07 | ) | |
December 31,
2019 | | $ | 13.06 | | | | 0.14 | | | | 2.74 | | | | 2.88 | | | | — | | | | — | | | | — | | |
December 31,
2018 | | $ | 17.07 | | | | 0.05 | | | | (3.42 | ) | | | (3.37 | ) | | | — | (f) | | | (0.64 | ) | | | (0.64 | ) | |
December 31,
2017 | | $ | 12.17 | | | | — | (f) | | | 4.97 | | | | 4.97 | | | | (0.07 | ) | | | — | | | | (0.07 | ) | |
December 31,
2016 | | $ | 11.20 | | | | (0.01 | ) | | | 1.05 | | | | 1.04 | | | | (0.11 | ) | | | — | | | | (0.11 | ) | |
(a) Per share net investment income (loss) has been calculated using the average daily shares method.
(b) The Fund received monies related to a nonrecurring refund from the prior custodian. The corresponding impact to the total return was 1.45% for the period shown.
(c) Not annualized for periods less than one year.
(d) Annualized for periods less than one year.
(e) Portfolio turnover is calculated on the basis of the Fund as a whole without distinguishing between the classes of shares issued.
(f) Amount is less than $0.005 per share.
(g) Amount is less than 0.005%.
See notes to financial statements.
42
Victory Portfolios | | Financial Highlights — continued | |
For a Share Outstanding Throughout Each Period
| | | | | Ratios to Average Net Assets | | Supplemental Data | |
| | | Capital
Contributions
from Prior
Custodian,
Net(b) | | Net Asset
Value,
End of
Period | | Total
Return
(Excludes
Sales
Charge)(c) | | Net
Expenses(d) | | Net
Investment
Income
(Loss)(d) | | Gross
Expenses(d) | | Net Assets,
End of
Period
(000's) | | Portfolio
Turnover(c)(e) | |
Victory Sophus Emerging Markets Fund | |
Class A | |
Six Months
Ended
June 30, 2021
(Unaudited) | | | — | | | $ | 27.28 | | | | 10.45 | % | | | 1.34 | % | | | 0.50 | % | | | 1.58 | % | | $ | 64,917 | | | | 50 | % | |
Year Ended:
December 31,
2020 | | | — | | | $ | 24.70 | | | | 16.73 | % | | | 1.34 | % | | | 0.47 | % | | | 1.64 | % | | $ | 60,206 | | | | 109 | % | |
December 31,
2019 | | | — | | | $ | 21.37 | | | | 22.96 | % | | | 1.34 | % | | | 1.95 | % | | | 1.62 | % | | $ | 62,346 | | | | 96 | % | |
December 31,
2018 | | | — | | | $ | 17.45 | | | | (19.08 | )% | | | 1.34 | % | | | 1.11 | % | | | 1.61 | % | | $ | 56,823 | | | | 118 | % | |
December 31,
2017 | | | — | | | $ | 22.52 | | | | 42.08 | % | | | 1.54 | % | | | 0.80 | % | | | 1.66 | % | | $ | 76,485 | | | | 113 | % | |
December 31,
2016 | | | 0.04 | | | $ | 15.98 | | | | 10.50 | %(b) | | | 1.65 | % | | | 0.73 | % | | | 1.67 | % | | $ | 61,767 | | | | 120 | % | |
Class C | |
Six Months
Ended
June 30, 2021
(Unaudited) | | | — | | | $ | 20.22 | | | | 10.01 | % | | | 2.14 | % | | | (0.38 | )% | | | 2.69 | % | | $ | 2,615 | | | | 50 | % | |
Year Ended:
December 31,
2020 | | | — | | | $ | 18.38 | | | | 15.79 | % | | | 2.14 | % | | | (0.45 | )% | | | 2.69 | % | | $ | 3,261 | | | | 109 | % | |
December 31,
2019 | | | — | | | $ | 15.94 | | | | 22.05 | % | | | 2.14 | % | | | 0.99 | % | | | 2.48 | % | | $ | 5,787 | | | | 96 | % | |
December 31,
2018 | | | — | | | $ | 13.06 | | | | (19.75 | )% | | | 2.14 | % | | | 0.31 | % | | | 2.40 | % | | $ | 10,141 | | | | 118 | % | |
December 31,
2017 | | | — | | | $ | 17.07 | | | | 40.96 | % | | | 2.34 | % | | | — | %(g) | | | 2.46 | % | | $ | 15,854 | | | | 113 | % | |
December 31,
2016 | | | 0.04 | | | $ | 12.17 | | | | 9.62 | %(b) | | | 2.45 | % | | | (0.09 | )% | | | 2.48 | % | | $ | 12,273 | | | | 120 | % | |
(continues on next page)
See notes to financial statements.
43
Victory Portfolios | | Financial Highlights | |
For a Share Outstanding Throughout Each Period
| | | | | Investment Activities | | Distributions to
Shareholders From | |
| | | Net Asset
Value,
Beginning of
Period | | Net
Investment
Income
(Loss)(a) | | Net
Realized and
Unrealized
Gains
(Losses) on
Investments | | Total from
Investment
Activities | | Net
Investment
Income | | Net Realized
Gains from
Investments | | Total
Distributions | |
Victory Sophus Emerging Markets Fund | |
Class R | |
Six Months
Ended
June 30, 2021
(Unaudited) | | $ | 23.13 | | | | 0.03 | | | | 2.36 | | | | 2.39 | | | | — | | | | — | | | | — | | |
Year Ended:
December 31,
2020 | | $ | 20.03 | | | | 0.05 | | | | 3.23 | | | | 3.28 | | | | (0.18 | ) | | | — | | | | (0.18 | ) | |
December 31,
2019 | | $ | 16.37 | | | | 0.31 | | | | 3.41 | | | | 3.72 | | | | (0.06 | ) | | | — | | | | (0.06 | ) | |
December 31,
2018 | | $ | 21.18 | | | | 0.18 | | | | (4.26 | ) | | | (4.08 | ) | | | (0.09 | ) | | | (0.64 | ) | | | (0.73 | ) | |
December 31,
2017 | | $ | 15.03 | | | | 0.09 | | | | 6.17 | | | | 6.26 | | | | (0.11 | ) | | | — | | | | (0.11 | ) | |
December 31,
2016 | | $ | 13.76 | | | | 0.07 | | | | 1.30 | | | | 1.37 | | | | (0.14 | ) | | | — | | | | (0.14 | ) | |
Class R6 | |
Six Months
Ended
June 30, 2021
(Unaudited) | | $ | 25.10 | | | | 0.14 | | | | 2.54 | | | | 2.68 | | | | — | | | | — | | | | — | | |
Year Ended:
December 31,
2020 | | $ | 21.68 | | | | 0.20 | | | | 3.52 | | | | 3.72 | | | | (0.30 | ) | | | — | | | | (0.30 | ) | |
December 31,
2019 | | $ | 17.68 | | | | 0.52 | | | | 3.65 | | | | 4.17 | | | | (0.17 | ) | | | — | | | | (0.17 | ) | |
December 31,
2018 | | $ | 22.81 | | | | 0.34 | | | | (4.62 | ) | | | (4.28 | ) | | | (0.21 | ) | | | (0.64 | ) | | | (0.85 | ) | |
December 31,
2017 | | $ | 16.16 | | | | 0.34 | | | | 6.57 | | | | 6.91 | | | | (0.26 | ) | | | — | | | | (0.26 | ) | |
November 15,
2016(f)
through
December 31,
2016 | | $ | 15.91 | | | | 0.04 | | | | 0.25 | | | | 0.29 | | | | (0.04 | ) | | | — | | | | (0.04 | ) | |
(a) Per share net investment income (loss) has been calculated using the average daily shares method.
(b) The Fund received monies related to a nonrecurring refund from the prior custodian. The corresponding impact to the total return was 1.45% for the period shown.
(c) Not annualized for periods less than one year.
(d) Annualized for periods less than one year.
(e) Portfolio turnover is calculated on the basis of the Fund as a whole without distinguishing between the classes of shares issued.
(f) Commencement of operations.
See notes to financial statements.
44
Victory Portfolios | | Financial Highlights — continued | |
For a Share Outstanding Throughout Each Period (continued)
| | | | | Ratios to Average Net Assets | | Supplemental Data | |
| | | Capital
Contributions
from Prior
Custodian,
Net(b) | | Net Asset
Value,
End of
Period | |
Total
Return(c) | | Net
Expenses(d) | | Net
Investment
Income
(Loss)(d) | | Gross
Expenses(d) | | Net Assets,
End of
Period
(000's) | | Portfolio
Turnover(c)(e) | |
Victory Sophus Emerging Markets Fund | |
Class R | |
Six Months
Ended
June 30, 2021
(Unaudited) | | | — | | | $ | 25.52 | | | | 10.33 | % | | | 1.58 | % | | | 0.24 | % | | | 1.89 | % | | $ | 13,743 | | | | 50 | % | |
Year Ended:
December 31,
2020 | | | — | | | $ | 23.13 | | | | 16.46 | % | | | 1.58 | % | | | 0.25 | % | | | 1.95 | % | | $ | 13,531 | | | | 109 | % | |
December 31,
2019 | | | — | | | $ | 20.03 | | | | 22.64 | % | | | 1.58 | % | | | 1.71 | % | | | 1.94 | % | | $ | 13,817 | | | | 96 | % | |
December 31,
2018 | | | — | | | $ | 16.37 | | | | (19.24 | )% | | | 1.58 | % | | | 0.89 | % | | | 1.91 | % | | $ | 12,505 | | | | 118 | % | |
December 31,
2017 | | | — | | | $ | 21.18 | | | | 41.69 | % | | | 1.83 | % | | | 0.50 | % | | | 2.00 | % | | $ | 17,875 | | | | 113 | % | |
December 31,
2016 | | | 0.04 | | | $ | 15.03 | | | | 10.26 | %(b) | | | 1.87 | % | | | 0.50 | % | | | 1.87 | % | | $ | 15,923 | | | | 120 | % | |
Class R6 | |
Six Months
Ended
June 30, 2021
(Unaudited) | | | — | | | $ | 27.78 | | | | 10.68 | % | | | 0.89 | % | | | 1.01 | % | | | 1.16 | % | | $ | 160,787 | | | | 50 | % | |
Year Ended:
December 31,
2020 | | | — | | | $ | 25.10 | | | | 17.28 | % | | | 0.89 | % | | | 0.95 | % | | | 1.21 | % | | $ | 115,637 | | | | 109 | % | |
December 31,
2019 | | | — | | | $ | 21.68 | | | | 23.55 | % | | | 0.89 | % | | | 2.69 | % | | | 1.22 | % | | $ | 72,196 | | | | 96 | % | |
December 31,
2018 | | | — | | | $ | 17.68 | | | | (18.73 | )% | | | 0.89 | % | | | 1.59 | % | | | 1.24 | % | | $ | 29,228 | | | | 118 | % | |
December 31,
2017 | | | — | | | $ | 22.81 | | | | 42.77 | % | | | 1.03 | % | | | 1.66 | % | | | 1.39 | % | | $ | 18,762 | | | | 113 | % | |
November 15,
2016(f)
through
December 31,
2016 | | | — | | | $ | 16.16 | | | | 1.81 | %(b) | | | 1.16 | % | | | 1.79 | % | | | 21.70 | % | | $ | 64 | | | | 120 | % | |
(continues on next page)
See notes to financial statements.
45
Victory Portfolios | | Financial Highlights | |
For a Share Outstanding Throughout Each Period
| | | | | Investment Activities | | Distributions to
Shareholders From | |
| | | Net Asset
Value,
Beginning of
Period | | Net
Investment
Income
(Loss)(a) | | Net
Realized and
Unrealized
Gains
(Losses) on
Investments | | Total from
Investment
Activities | | Net
Investment
Income | | Net Realized
Gains from
Investments | | Total
Distributions | |
Victory Sophus Emerging Markets Fund | |
Class Y | |
Six Months
Ended
June 30, 2021
(Unaudited) | | $ | 24.85 | | | | 0.12 | | | | 2.53 | | | | 2.65 | | | | — | | | | — | | | | — | | |
Year Ended:
December 31,
2020 | | $ | 21.48 | | | | 0.16 | | | | 3.50 | | | | 3.66 | | | | (0.29 | ) | | | — | | | | (0.29 | ) | |
December 31,
2019 | | $ | 17.54 | | | | 0.45 | | | | 3.65 | | | | 4.10 | | | | (0.16 | ) | | | — | | | | (0.16 | ) | |
December 31,
2018 | | $ | 22.64 | | | | 0.35 | | | | (4.61 | ) | | | (4.26 | ) | | | (0.20 | ) | | | (0.64 | ) | | | (0.84 | ) | |
December 31,
2017 | | $ | 16.05 | | | | 0.21 | | | | 6.62 | | | | 6.83 | | | | (0.24 | ) | | | — | | | | (0.24 | ) | |
December 31,
2016 | | $ | 14.61 | | | | 0.18 | | | | 1.37 | | | | 1.55 | | | | (0.15 | ) | | | — | | | | (0.15 | ) | |
(a) Per share net investment income (loss) has been calculated using the average daily shares method.
(b) The Fund received monies related to a nonrecurring refund from the prior custodian. The corresponding impact to the total return was 1.45% for the period shown.
(c) Not annualized for periods less than one year.
(d) Annualized for periods less than one year.
(e) Portfolio turnover is calculated on the basis of the Fund as a whole without distinguishing between the classes of shares issued.
See notes to financial statements.
46
Victory Portfolios | | Financial Highlights — continued | |
For a Share Outstanding Throughout Each Period (continued)
| | | | | Ratios to Average Net Assets | | Supplemental Data | |
| | | Capital
Contributions
from Prior
Custodian,
Net(b) | | Net Asset
Value,
End of
Period | |
Total
Return(c) | | Net
Expenses(d) | | Net
Investment
Income
(Loss)(d) | | Gross
Expenses(d) | | Net Assets,
End of
Period
(000's) | | Portfolio
Turnover(c)(e) | |
Victory Sophus Emerging Markets Fund | |
Class Y | |
Six Months
Ended
June 30, 2021
(Unaudited) | | | — | | | $ | 27.50 | | | | 10.66 | % | | | 0.99 | % | | | 0.88 | % | | | 1.26 | % | | $ | 330,337 | | | | 50 | % | |
Year Ended:
December 31,
2020 | | | — | | | $ | 24.85 | | | | 17.10 | % | | | 0.99 | % | | | 0.79 | % | | | 1.31 | % | | $ | 280,364 | | | | 109 | % | |
December 31,
2019 | | | — | | | $ | 21.48 | | | | 23.40 | % | | | 0.99 | % | | | 2.32 | % | | | 1.30 | % | | $ | 255,423 | | | | 96 | % | |
December 31,
2018 | | | — | | | $ | 17.54 | | | | (18.77 | )% | | | 0.99 | % | | | 1.64 | % | | | 1.30 | % | | $ | 178,132 | | | | 118 | % | |
December 31,
2017 | | | — | | | $ | 22.64 | | | | 42.59 | % | | | 1.18 | % | | | 1.07 | % | | | 1.33 | % | | $ | 100,902 | | | | 113 | % | |
December 31,
2016 | | | 0.04 | | | $ | 16.05 | | | | 10.86 | %(b) | | | 1.32 | % | | | 1.17 | % | | | 1.38 | % | | $ | 60,277 | | | | 120 | % | |
See notes to financial statements.
47
Victory Portfolios | | Notes to Financial Statements
June 30, 2021 | |
(Unaudited)
1. Organization:
Victory Portfolios (the "Trust") is organized as a Delaware statutory trust and the Trust is registered under the Investment Company Act of 1940, as amended (the "1940 Act"), as an open-end investment company. The Trust is comprised of 41 funds and is authorized to issue an unlimited number of shares, which are units of beneficial interest with a par value of $0.001 per share.
The accompanying financial statements are those of the following three Funds (collectively, the "Funds" and individually, a "Fund"). Each Fund is classified as diversified under the 1940 Act.
Funds (Legal Name) | | Funds (Short Name) | | Investment Share
Classes Offered | |
Victory RS International Fund | | RS International Fund | | Classes A, C, R, R6 and Y | |
Victory RS Global Fund | | RS Global Fund | | Classes A, C, R, R6 and Y | |
Victory Sophus Emerging
Markets Fund | | Sophus Emerging Markets Fund | | Classes A, C, R, R6 and Y | |
Each class of shares of a Fund has substantially identical rights and privileges except with respect to sales charges, fees paid under distribution plans, expenses allocable exclusively to each class of shares, voting rights on matters solely affecting a single class of shares, and the exchange privilege of each class of shares.
Under the Trust's organizational documents, its officers and trustees are indemnified against certain liabilities arising out of the performance of their duties to the Funds. In addition, in the normal course of business, the Funds enter into contracts with their vendors and others that provide for general indemnifications. A Fund's maximum exposure under these arrangements is unknown, as this would involve future claims that may be made against the Funds. However, based on experience, the Funds expect that risk of loss to be remote.
2. Significant Accounting Policies:
The following is a summary of significant accounting policies followed by the Trust in the preparation of its financial statements. The policies are in conformity with Generally Accepted Accounting Principles in the United States of America ("GAAP"). The preparation of financial statements in accordance with GAAP requires management to make estimates and assumptions that affect the reported amounts of assets and liabilities and disclosure of contingent assets and liabilities at the date of the financial statements and the reported amounts of income and expenses for the period. Actual results could differ from those estimates. The Fund follows the specialized accounting and reporting requirements under GAAP that are applicable to investment companies under Accounting Standards Codification 946.
Investment Valuation:
The Funds record investments at fair value. Fair value is defined as the price that would be received to sell an asset or paid to transfer a liability in an orderly transaction between market participants at the measurement date.
The valuation techniques described below maximize the use of observable inputs and minimize the use of unobservable inputs in determining fair value. The inputs used for valuing the Funds' investments are summarized in the three broad levels listed below:
• Level 1 — quoted prices in active markets for identical securities
• Level 2 — other significant observable inputs (including quoted prices for similar securities or interest rates applicable to those securities, etc.)
• Level 3 — significant unobservable inputs (including the Funds' own assumptions in determining the fair value of investments)
48
Victory Portfolios | | Notes to Financial Statements — continued
June 30, 2021 | |
(Unaudited)
Changes in valuation techniques may result in transfers in or out of an assigned level within the disclosure hierarchy. The inputs or methodologies used for valuation techniques are not necessarily an indication of the risk associated with entering into those investments.
Victory Capital Management Inc. ("VCM" or the "Adviser") has established the Pricing and Liquidity Committee (the "Committee"), and subject to Trust's Board of Trustees' (the "Board") oversight, the Committee administers and oversees the Funds' valuation policies and procedures, which are approved by the Board.
Portfolio securities listed or traded on securities exchanges, including exchange-traded funds ("ETFs") and American Depositary Receipts ("ADRs"), are valued at the closing price on the exchange or system where the security is principally traded, if available, or at the Nasdaq Official Closing Price. If there have been no sales for that day on the exchange or system, then a security is valued at the last available bid quotation on the exchange or system where the security is principally traded. In each of these situations, valuations are typically categorized as Level 1 in the fair value hierarchy.
Investments in open-end investment companies are valued at net asset value ("NAV"). These valuations are typically categorized as Level 1 in the fair value hierarchy.
In the event that price quotations or valuations are not readily available, investments are valued at fair value in accordance with procedures established by and under the general supervision and responsibility of the Board. These valuations are typically categorized as Level 2 or Level 3 in the fair value hierarchy, based on the observability of inputs used to determine the fair value. The effect of fair value pricing is that securities may not be priced on the basis of quotations from the primary market in which they are traded and the actual price realized from the sale of a security may differ materially from the fair value price. Valuing these securities at fair value is intended to cause the Fund's NAV to be more reliable than it otherwise would be.
In accordance with procedures adopted by the Board, fair value pricing may be used if events materially affecting the value of foreign securities occur between the time the exchange on which they are traded closes and the time the Fund's net asset values are calculated. The Funds uses a systematic valuation model, provided daily by an independent third party to fair value their international equity securities. These valuations are considered as Level 2 in the fair value hierarchy.
A summary of the valuations as of June 30, 2021, is included in the table below while the breakdown, by category, of investments is disclosed on the Schedules of Portfolio Investments:
| | | Level 1 | | Level 2 | | Level 3 | | Total | |
RS International Fund | |
Common Stocks | | $ | — | | | $ | 405,007,084 | | | $ | — | | | $ | 405,007,084 | | |
Exchange-Traded Funds | | | 4,043,783 | | | | — | | | | — | | | | 4,043,783 | | |
Collateral for Securities Loaned | | | 2,898,989 | | | | — | | | | — | | | | 2,898,989 | | |
Total | | $ | 6,942,772 | | | $ | 405,007,084 | | | $ | — | | | $ | 411,949,856 | | |
RS Global Fund | |
Common Stocks | | $ | 162,466,475 | | | $ | 103,202,646 | | | $ | — | | | $ | 265,669,121 | | |
Exchange-Traded Funds | | | 793,734 | | | | — | | | | — | | | | 793,734 | | |
Collateral for Securities Loaned | | | 8,982,929 | | | | — | | | | — | | | | 8,982,929 | | |
Total | | $ | 172,243,138 | | | $ | 103,202,646 | | | $ | — | | | $ | 275,445,784 | | |
Sophus Emerging Markets Fund | |
Common Stocks | | $ | 129,099,249 | | | $ | 438,044,705 | | | $ | — | | | $ | 567,143,954 | | |
Collateral for Securities Loaned | | | 7,337,834 | | | | — | | | | — | | | | 7,337,834 | | |
Total | | $ | 136,437,083 | | | $ | 438,044,705 | | | $ | — | | | $ | 574,481,788 | | |
For the six months ended June 30, 2021, there were no transfers in or out of Level 3 in the fair value hierarchy.
49
Victory Portfolios | | Notes to Financial Statements — continued
June 30, 2021 | |
(Unaudited)
Real Estate Investment Trusts ("REITs"):
The Funds may invest in REITs, which report information on the source of their distributions annually. REITs are pooled investment vehicles that invest primarily in income-producing real estate or real-estate related loans or interests (such as mortgages). Certain distributions received from REITs during the year are recorded as realized gains or return of capital as estimated by the Funds or when such information becomes known.
Investment Companies:
Exchange-Traded Funds:
The Funds may invest in ETFs, the shares of which are bought and sold on a securities exchange. An ETF trades like common stock and represents a fixed portfolio of securities often designed to track the performance and dividend yield of a particular domestic or foreign market index. The Funds may purchase shares of an ETF to temporarily gain exposure to a portion of the U.S. or a foreign market while awaiting purchase of underlying securities. The risks of owning an ETF generally reflect the risks of owning the underlying securities they are designed to track, although the lack of liquidity of an ETF could result in it being more volatile. Additionally, ETFs have fees and expenses that reduce their value.
Open-End Funds:
The Funds may invest in portfolios of open-end investment companies. These investment companies value securities in their portfolios for which market quotations are readily available at their market values (generally the last reported sale price) and all other securities and assets at their fair value by the methods established by the board of directors of the underlying funds.
Foreign Exchange Currency Contracts:
Certain Funds may enter into foreign exchange currency contracts to convert U.S. dollars to and from various foreign currencies. A foreign exchange currency contract is an obligation by a Fund to purchase or sell a specific currency at a future date at a price (in U.S. dollars) set at the time of the contract. The Funds do not engage in "cross-currency" foreign exchange contracts (i.e., contracts to purchase or sell one foreign currency in exchange for another foreign currency). The Funds' foreign exchange currency contracts might be considered spot contracts (typically a contract of one week or less) or forward contracts (typically a contract term over one week). A spot contract is entered into for purposes of hedging against foreign currency fluctuations relating to a specific portfolio transaction, such as the delay between a security transaction trade date and settlement date. Forward contracts are entered into for purposes of hedging portfolio holdings or concentrations of such holdings. The Funds enter into foreign exchange currency contracts solely for spot or forward hedging purposes, and not for speculative purposes (i.e., the Funds do not enter into such contracts solely for the purpose of earning foreign currency gains). Each foreign exchange currency contract is adjusted daily by the prevailing spot or forward rate of the underlying currency, and any appreciation or depreciation is recorded for financial statement purposes as unrealized until the contract settlement date, at which time the Funds record realized gains or losses equal to the difference between the value of a contract at the time it was opened and the value at the time it was closed. The Funds could be exposed to risk if a counterparty is unable to meet the terms of a foreign exchange currency contract or if the value of the foreign currency changes unfavorably. In addition, the use of foreign exchange currency contracts does not eliminate fluctuations in the underlying prices of the securities. As of June 30, 2021, the Funds had no open forward foreign exchange currency contracts.
Investment Transactions and Related Income:
Changes in holdings of investments are accounted for no later than one business day following the trade date. For financial reporting purposes, however, investment transactions are accounted for on trade date on the last business day of the reporting period. Interest income is determined on the basis
50
Victory Portfolios | | Notes to Financial Statements — continued
June 30, 2021 | |
(Unaudited)
of coupon interest accrued using the effective interest method which adjusts, where applicable, the amortization of premiums or accretion of discounts. Dividend income is recorded on the ex-dividend date. Gains or losses realized on sales of securities are recorded on the identified cost basis. Paydown gains or losses on applicable securities, if any, are recorded as components of Interest income on the Statements of Operations.
Withholding taxes on interest, dividends and gains as a result of certain investments in ADRs by the Funds have been provided for in accordance with each investment's applicable country's tax rules and rates.
Securities Lending:
The Trust has entered into a Master Securities Lending Agreement ("MSLA") with Citibank, N.A. ("Citibank"). Under the terms of the MSLA, the Funds may lend securities to certain broker-dealers, and banks, in exchange for collateral in the amount of at least 102% of the value of U.S. securities loaned or at least 105% of the value of non-U.S. securities loaned, marked-to-market daily. Any collateral shortfalls associated with increases in the valuation of the securities loaned are adjusted the next business day. The collateral can be received in the form of cash collateral and/or non-cash collateral. Non-cash collateral can include U.S. Government Securities, letters of credit and certificates of deposit. The cash collateral is invested in short-term instruments or cash equivalents, primarily open-end investment companies, as noted on the Funds' Schedules of Portfolio Investments. The Trust does not have effective control of the non-cash collateral and therefore it is not disclosed on the Funds' Schedules of Portfolio Investments. During the time portfolio securities are on loan, the borrower will pay the Funds any dividends or interest paid on such securities plus any fee negotiated between the parties to the lending agreement. The Funds also earn a return from the collateral. The Funds pay Citibank various fees in connection with the investment of cash collateral and fees based on the investment income received from securities lending activities. Securities lending income (net of these fees) is disclosed on the Statements of Operations. Although risk is mitigated by the collateral, the Fund could experience a delay in recovering its securities and possible loss of income or value if the borrower fails to return them.
Securities lending transactions are entered into by a Fund under the MSLA, which permits the Fund, under certain circumstances such as an event of default, to offset amounts payable by the Fund to the same counterparty against amounts receivable from the counterparty to create a net payment due to or from the Fund.
The following table is a summary of the Funds' securities lending transactions which are subject to offset under the MSLA as of June 30, 2021. These transactions are accounted for as secured borrowings with an overnight and continuous contractual maturity for cash collateral, and greater than overnight and continuous contractual maturity for non-cash collateral.
| | | Gross Amount of
Recognized | | Value of
Cash | | Value of Non-cash Collateral
Received by Maturity | | | |
| | | Assets (Value of
Securities on Loan) | | Collateral
Received* | | <30
Days | | Between
30 & 90 days | | >90
Days | | Net
Amount | |
RS International Fund | | $ | 2,406,530 | | | $ | 2,406,530 | | | $ | — | | | $ | — | | | $ | — | | | $ | — | | |
RS Global Fund | | | 8,524,966 | | | | 8,524,966 | | | | — | | | | — | | | | — | | | | — | | |
Sophus Emerging Markets Fund | | | 6,969,687 | | | | 6,969,687 | | | | — | | | | — | | | | — | | | | — | | |
* Collateral received in excess of the market value of securities on loan is not presented in this table. The total cash collateral received by each Fund is disclosed on the Statements of Assets and Liabilities.
Foreign Currency Translations:
The accounting records of the Funds are maintained in U.S. dollars. Investment securities and other assets and liabilities of a Fund denominated in a foreign currency are translated into U.S. dollars at current exchange rates. Purchases and sales of securities, income receipts and expense payments are
51
Victory Portfolios | | Notes to Financial Statements — continued
June 30, 2021 | |
(Unaudited)
translated into U.S. dollars at the exchange rates on the date of the transactions. The Funds do not isolate the portion of the results of operations resulting from changes in foreign exchange rates on investments from fluctuations arising from changes in market prices of securities held. Such fluctuations are disclosed as Net change in unrealized appreciation/depreciation on investment securities and foreign currency translations on the Statements of Operations. Any realized gains or losses from these fluctuations are disclosed as Net realized gains (losses) from investment securities and foreign currency translations on the Statements of Operations.
Foreign Taxes:
The Funds may be subject to foreign taxes related to foreign income received (a portion of which may be reclaimable), capital gains on the sale of securities, and certain foreign currency transactions. All foreign taxes are recorded in accordance with the applicable regulations and rates that exist in the foreign jurisdictions in which the Funds invest.
Federal Income Taxes:
It is the policy of each Fund to continue to qualify as a regulated investment company by complying with the provisions available to certain investment companies, as defined in applicable sections of the Internal Revenue Code, and to make distributions of net investment income and net realized gains sufficient to relieve it from all, or substantially all, federal income taxes. Accordingly, no provision for federal income taxes is required in the financial statements. The Funds have a tax year end of December 31.
Management of the Funds has reviewed tax positions taken in tax years that remain subject to examination by all major tax jurisdictions, including federal (i.e., the last four tax years, which includes the current fiscal tax year end). Management believes that there is no tax liability resulting from unrecognized tax benefits related to uncertain tax positions taken.
Allocations:
Expenses directly attributable to the Funds are charged to the Funds, while expenses that are attributable to more than one fund in the Trust, or jointly with an affiliated trust, are allocated among the respective funds in the Trust and/or affiliated trust based upon net assets or another appropriate basis.
Income, expenses (other than class-specific expenses such as transfer agent fees, state registration fees, 12b-1 fees, and printing fees), and realized and unrealized gains or losses on investments are allocated to each class of shares based on its relative net assets on the date income is earned or expenses and realized and unrealized gains and losses are incurred.
3. Purchases and Sales:
Purchases and sales of securities (excluding securities maturing less than one year from acquisition) for the six months ended June 30, 2021, were as follows.
| | | Excluding
U.S. Government Securities | |
| | | Purchases | | Sales | |
RS International Fund | | $ | 112,961,642 | | | $ | 111,291,382 | | |
| RS Global Fund | | | 95,243,596 | | | | 71,418,323 | | |
| Sophus Emerging Markets Fund | | | 306,783,312 | | | | 258,096,839 | | |
For the six months ended June 30, 2021, there were no purchases or sales of U.S. Government Securities.
52
Victory Portfolios | | Notes to Financial Statements — continued
June 30, 2021 | |
(Unaudited)
4. Fees and Transactions with Affiliates and Related Parties:
Investment Advisory Fees:
Investment advisory services are provided to the Funds by the Adviser, which is a New York corporation registered as an investment adviser with the Securities and Exchange Commission ("SEC"). The Adviser is an indirect wholly owned subsidiary of Victory Capital Holdings, Inc., a publicly traded Delaware corporation, and a wholly owned direct subsidiary of Victory Capital Operating, LLC.
Under the terms of the Investment Advisory Agreement, the Adviser is entitled to receive fees based on a percentage of the average daily net assets of each Fund. The rates at which the Adviser is paid by each Fund are included in the table below.
| | | Flat Rate | |
RS International Fund | | | 0.80 | % | |
RS Global Fund | | | 0.80 | % | |
Sophus Emerging Markets Fund | | | 1.00 | % | |
Amounts incurred and paid to VCM for the six months ended June 30, 2021, are reflected on the Statements of Operations as Investment advisory fees.
Administration and Servicing Fees:
VCM serves as the Funds' administrator and fund accountant. Under the Administration and Fund Accounting Agreement, VCM is entitled to receive fees based on a percentage of the average daily net assets of the Trust, Victory Variable Insurance Funds and Victory Portfolios II (collectively, the "Victory Funds Complex"). The tiered rates at which VCM is paid by the Funds are shown in the table below:
| Assets up to $15 billion | | Assets $15 billion — $30 billion | | Assets over $30 billion | |
| 0.08%, plus | | 0.05%, plus | | 0.04% | |
Amounts incurred for the six months ended June 30, 2021, are reflected on the Statements of Operations as Administration fees.
Citi Fund Services Ohio, Inc. ("Citi"), an affiliate of Citibank, acts as sub-administrator and sub-fund accountant to the Fund pursuant to the Sub-Administration and Sub-Fund Accounting Services Agreement between VCM and Citi. VCM pays Citi a fee for providing these services. The Trust reimburses VCM and Citi for out-of-pocket expenses incurred in providing these services and certain other expenses specifically allocated to the Fund. Amounts incurred for the six months ended June 30, 2021, are reflected on the Statements of Operations as Sub-Administration fees.
The Chief Compliance Officer ("CCO") is an employee of the Adviser, which pays the compensation of the CCO and his support staff. The Trust has entered into an agreement to provide compliance services with the Adviser, pursuant to which the Adviser furnishes its compliance personnel, including the services of the CCO, and other resources reasonably necessary to provide the Trust with compliance oversight services related to the design, administration and oversight of a compliance program for the Trust in accordance with Rule 38a-1 under the 1940 Act. The funds in the Victory Funds Complex, in aggregate, compensate the Adviser for these services. Amounts incurred for the six months ended June 30, 2021, are reflected on the Statements of Operations as Compliance fees.
Transfer Agency Fees:
FIS Investor Services, LLC ("FIS") serves as the Funds' transfer agent. Under the Transfer Agent Agreement, the Trust pays FIS a fee for its services and reimburses FIS for all of their reasonable out-of-pocket expenses incurred in providing these services. Amounts incurred for the six months ended June 30, 2021, are reflected on the Statements of Operations as Transfer agent fees.
Distributor/Underwriting Services:
Victory Capital Services, Inc. (the "Distributor"), an affiliate of the Adviser, serves as distributor for the continuous offering of the shares of the Funds pursuant to a Distribution Agreement between the
53
Victory Portfolios | | Notes to Financial Statements — continued
June 30, 2021 | |
(Unaudited)
Distributor and the Trust. Pursuant to the Distribution and Service Plans adopted in accordance with Rule 12b-1 under the 1940 Act, the Distributor may receive a monthly distribution and service fee as shown in the table below:
| | | Class A | | Class C | | Class R | | Class R6 | | Class Y | |
RS International Fund | | | 0.25 | % | | | 1.00 | % | | | 0.50 | % | | | 0.00 | % | | | 0.00 | % | |
RS Global Fund | | | 0.25 | % | | | 1.00 | % | | | 0.50 | % | | | 0.00 | % | | | 0.00 | % | |
Sophus Emerging Markets Fund | | | 0.25 | % | | | 1.00 | % | | | 0.50 | % | | | 0.00 | % | | | 0.00 | % | |
The distribution and service fees paid to the Distributor may be used by the Distributor to pay for activities primarily intended to result in the sale of Class A, Class C, and Class R. Amounts incurred for the six months ended June 30, 2021, are reflected on the Statements of Operations as 12b-1 fees.
In addition, the Distributor is entitled to receive commissions on sale of the Class A. For the six months ended June 30, 2021, the Distributor received approximately $1,760 from commissions earned on the sale of Class A.
Other Fees:
Citibank serves as the Funds' custodian. The Funds pay Citibank a fee for providing these services. Amounts incurred for the six months ended June 30, 2021, are reflected on the Statements of Operations as Custodian fees.
Sidley Austin LLP provides legal services to the Trust.
The Adviser has entered into expense limitation agreements with certain Funds. Under the terms of the agreements, the Adviser has agreed to waive fees or reimburse certain expenses to the extent that ordinary operating expenses incurred by certain classes of a Fund in any fiscal year exceed the expense limit for such classes of the Fund. Such excess amounts will be the liability of the Adviser. Acquired fund fees and expense, interest, taxes, brokerage commissions, other expenditures that are capitalized in accordance with GAAP, and other extraordinary expenses not incurred in the ordinary course of a Fund's business are excluded from the expense limits. As of June 30, 2021, the expense limits (excluding voluntary waivers) are as follows:
| | | In effect until April 30, 2022 | |
| | | Class A | | Class C | | Class R | | Class R6 | | Class Y | |
RS International Fund | | | 1.13 | % | | | 1.88 | % | | | 1.38 | % | | | 0.83 | % | | | 0.88 | % | |
RS Global Fund | | | 0.85 | % | | | 1.60 | % | | | 1.10 | % | | | 0.55 | % | | | 0.60 | % | |
Sophus Emerging Markets Fund | | | 1.34 | % | | | 2.14 | % | | | 1.58 | % | | | 0.89 | % | | | 0.99 | % | |
Under the terms of the expense limitation agreements, amended May 1, 2021, the Funds have agreed to repay fees and expenses that were waived or reimbursed by the Adviser for a period of up to three years (thirty six (36) months) after the waiver or reimbursement took place, subject to the lesser of any operating expense limits in effect at the time of: (a) the original waiver or expense reimbursement; or (b) the recoupment, after giving effect to the recoupment amount. Prior to May 1, 2021, the Funds were permitted to recoup fees waived and expenses reimbursed for up to three years after the fiscal year in which the waiver or reimbursement took place, subject to the limitations above. This change did not have any effect on the amounts previously reported for recoupment.
As of June 30, 2021, the following amounts are available to be repaid to the Adviser. The Funds have not recorded any amounts available to be repaid as a liability due to an assessment that such repayment is not probable at June 30, 2021.
| | | Expires
2021 | | Expires
2022 | | Expires
2022 | | Expires
2024 | | Total | |
RS International Fund | | $ | 78,904 | | | $ | 266,869 | | | $ | 491,864 | | | $ | 229,808 | | | $ | 1,067,445 | | |
RS Global Fund | | | 129,522 | | | | 359,812 | | | | 690,062 | | | | 537,651 | | | | 1,717,047 | | |
Sophus Emerging Markets Fund | | | 522,270 | | | | 1,124,230 | | | | 1,137,721 | | | | 708,613 | | | | 3,492,834 | | |
54
Victory Portfolios | | Notes to Financial Statements — continued
June 30, 2021 | |
(Unaudited)
The Adviser may voluntarily waive or reimburse additional fees to assist the Funds in maintaining competitive expense ratios. Voluntary waivers and reimbursements applicable to the Funds are not available to be recouped at a future time. There were no voluntary waivers or reimbursements for the six months ended June 30, 2021.
Certain officers and/or interested trustees of the Fund are also officers and/or employees of the Adviser, administrator, fund accountant, sub-administrator, sub-fund accountant, custodian, legal counsel and Distributor.
5. Risks:
The Funds may be subject to other risks in addition to these identified risks.
Equity Risk — An investment in the Funds' shares represents an indirect investment in the securities owned by the Funds, some of which will be traded on a national securities exchange or in the over-the-counter markets. The value of the securities in which the Funds invest, like other market investments, may move up or down, sometimes rapidly and unpredictably. The value of the securities in which the Funds invest may affect the value of the Funds' shares. An investment in the Funds' shares at any point in time may be worth less than the original investment, even after taking into account the reinvestment of the Funds' distributions.
Foreign Securities Risk — Foreign securities (including depositary receipts) are subject to political, regulatory, and economic risks not present in domestic investments. Foreign securities could be affected by factors not present in the U.S., including expropriation, confiscation of property, and difficulties in enforcing contracts. Compared to U.S. companies, there generally is less publicly available information about foreign companies and there may be less governmental regulation and supervision of foreign companies. Foreign securities generally experience more volatility than their domestic counterparts. In addition, to the extent investments are made in a limited number of countries, events in those countries will have a more significant impact on the Fund. Fluctuations in the exchange rates between the U.S. dollar and foreign currencies, currency exchange control regulations, and restrictions or prohibitions on the repatriation of foreign currencies may negatively affect an investment.
Emerging Markets Risk — The risks related to investing in foreign securities are generally greater with respect to securities of companies that conduct their business activities in emerging markets or whose securities are traded principally in emerging markets. The risks of investing in emerging markets include the risks of illiquidity, increased price volatility, smaller market capitalizations, less government regulation, less extensive and less frequent accounting, financial and other reporting requirements, risk of loss resulting from problems in share registration and custody, substantial economic and political disruptions and the nationalization of foreign deposits or assets.
Geopolitical/Natural Disaster Risk — Global economies and financial markets are increasingly interconnected, which increases the possibilities that conditions in one country or region might adversely affect issuers in another country or region. Geopolitical and other risks, including war, terrorism, trade disputes, political or economic dysfunction within some nations, public health crises and related geopolitical events, as well as environmental disasters such as earthquakes, fires, and floods, may add to instability in world economies and markets generally. Changes in trade policies and international trade agreements could affect the economies of many countries in unpredictable ways. Likewise, systemic market dislocations of the kind that occurred during the financial crisis that began in 2008, if repeated, would be highly disruptive to economies and markets, adversely affecting individual companies and industries, securities markets, interest rates, credit ratings, inflation, investor sentiment, and other factors affecting the value of a Fund's investments. Some countries, including the United States, are adopting more protectionist trade policies and moving away from the tighter financial industry regulations that followed the 2008 financial crisis, which may also affect the value of a Fund's investments.
Political events within the United States at times have resulted, and may in the future result, in a shutdown of government services, which could negatively affect the U.S. economy, decrease the value
55
Victory Portfolios | | Notes to Financial Statements — continued
June 30, 2021 | |
(Unaudited)
of a Fund's investments, increase uncertainty in or impair the operation of the U.S. or other securities markets, and degrade investor and consumer confidence, perhaps suddenly and to a significant degree.
6. Borrowing and Interfund Lending:
Line of Credit:
The Victory Funds Complex participates in a short-term demand note "Line of Credit" agreement with Citibank. The Line of Credit agreement with Citibank was renewed on June 29, 2021, with a termination date of June 27, 2022. Under the agreement with Citibank, the Victory Funds Complex may borrow up to $600 million, of which $300 million is committed and $300 million is uncommitted. $40 million of the Line of Credit is reserved for use by the Victory Floating Rate Fund, another series of the Victory Funds Complex, with Victory Floating Rate Fund paying the related commitment fees for that amount. The purpose of the Line of Credit is to meet temporary or emergency cash needs. For the six months ended June 30, 2021, Citibank received an annual commitment fee of 0.15% on $300 million for providing the Line of Credit. Each fund in the Victory Funds Complex pays a pro-rata portion of the commitment fees plus any interest (one month LIBOR plus one percent) on amounts borrowed. For the period June 29, 2020, through April 30, 2021, under an amended Line of Credit agreement, Citibank received an annual upfront fee of 0.10% on the $300 million committed line of credit. Each fund in the Victory Funds Complex paid a pro-rata portion of the upfront fee. Effective with the renewal, the annual commitment fee of 0.15% remains unchanged and the upfront fee of 0.10% was discontinued. Interest charged to each Fund during the period, if applicable, is reflected on the Statements of Operations under Line of credit fees.
The Funds had no borrowings under the Line of Credit during the six months ended June 30, 2021.
Interfund Lending:
The Trust and Adviser rely on an exemptive order granted by the SEC in March 2017 (the "Order"), permitting the establishment and operation of an Interfund Lending Facility (the "Facility"). The Facility allows each Fund to directly lend and borrow money to or from any other fund in the Victory Funds Complex that is permitted to participate in the Facility, relying upon the Order at rates beneficial to both the borrowing and lending funds. Advances under the Facility are allowed for temporary or emergency purposes, including the meeting of redemption requests that otherwise might require the untimely disposition of securities, and are subject to each Fund's borrowing restrictions. The interfund loan rate is determined, as specified in the Order, by averaging the current repurchase agreement rate and the current bank loan rate. As a Borrower, interest charged to each Fund during the period, if applicable, is presented on the Statements of Operations under Interfund lending fees. As a Lender, interest earned by each Fund during the period, if applicable, is presented on the Statements of Operations under Interest expense on interfund lending.
The average borrowing or lending for the days outstanding and average interest rate for the Funds that utilized or participated in the Facility during the six months ended June 30, 2021, were as follows:
| | | Borrower or
Lender | | Amount
Outstanding at
June 30,
2021 | | Average
Borrowing* | | Days
Borrowing
Outstanding | | Average
Interest
Rate | | Maximum
Borrowing
During the
Period | |
Sophus Emerging
Markets Fund | | Borrower | | $ | — | | | $ | 1,570,000 | | | | 3 | | | | 0.56 | % | | $ | 1,570,000 | | |
* For the six months ended June 30, 2021, based on the number of days borrowings were outstanding.
56
Victory Portfolios | | Notes to Financial Statements — continued
June 30, 2021 | |
(Unaudited)
7. Federal Income Tax Information:
Dividends from net investment income, if any, are declared and paid as noted in the table below. Distributable net realized gains, if any, are declared and distributed at least annually from each Fund.
| | | Declared | | Paid | |
| RS International Fund | | Annually | | Annually | |
| RS Global Fund | | Annually | | Annually | |
| Sophus Emerging Markets Fund | | Annually | | Annually | |
The amounts of dividends from net investment income and distributions from net realized gains (collectively, distributions to shareholders) are determined in accordance with federal income tax regulations, which may differ from GAAP. To the extent these "book/tax" differences are permanent in nature (e.g., net operating loss and distribution reclassification), such amounts are reclassified within the components of net assets based on their federal tax-basis treatment; temporary differences (e.g., wash sales) do not require reclassification. To the extent dividends and distributions exceed net investment income and net realized gains for tax purposes, they are reported as distributions of capital. Net investment losses incurred by a Fund may be reclassified as an offset to capital on the accompanying Statements of Assets and Liabilities.
The tax character of current year distributions paid and the tax basis of the current components of accumulated earnings (deficit) will be determined at the end of the current tax year ending December 31, 2021.
As of the tax year ended December 31, 2020, the Funds had net capital loss carryforwards as shown in the table below. It is unlikely that the Board will authorize a distribution of capital gains realized in the future until the capital loss carryforwards have been used.
| | | Short-Term
Amount | | Long-Term
Amount | | Total | |
RS International Fund | | $ | 2,778,208 | | | $ | — | | | $ | 2,778,208 | | |
RS Global Fund | | | 26,270,363 | | | | — | | | | 26,270,363 | | |
Sophus Emerging Markets Fund | | | 127,143 | | | | 48,808 | | | | 175,951 | | |
57
Victory Portfolios | | Supplemental Information
June 30, 2021 | |
(Unaudited)
Proxy Voting and Portfolio Holdings Information
Proxy Voting:
Information regarding the policies and procedures the Funds use to determine how to vote proxies relating to portfolio securities is available without charge, upon request, by calling 800-539-3863. The information is also included in the Funds' Statement of Additional Information, which is available on the SEC's website at www.sec.gov.
Information relating to how the Funds voted proxies relating to portfolio securities held during the most recent 12 months ended June 30 is available on the SEC's website at www.sec.gov.
Availability of Schedules of Portfolio Investments:
The Trust files a complete list of Schedules of Portfolio Investments with the SEC for the first and third quarter of each fiscal year on Form N-PORT. Forms N-PORT is available on the SEC's website at www.sec.gov.
Expense Examples
As a shareholder of the Funds, you may incur two types of costs: (1) transaction costs, including sales charges (loads) on purchases; and (2) ongoing costs, including management fees, distribution and service (12b-1) fees and other Fund expenses. These examples are intended to help you understand your ongoing costs (in dollars) of investing in the Funds and to compare these costs with the ongoing costs of investing in other mutual funds.
These examples are based on an investment of $1,000 invested at the beginning of the period and held for the entire period from January 1, 2021, through June 30, 2021.
The Actual Expense figures in the table below provide information about actual account values and actual expenses. You may use the information below, together with the amount you invested, to estimate the expenses that you paid over the period. Simply divide your account value by $1,000 (for example, an $8,600 account value divided by $1,000 = 8.6), then multiply the result by the number in the table under the heading entitled "Actual Expenses Paid During Period" to estimate the expenses you paid on your account during this period.
The Hypothetical Expense figures in the table below provide information about hypothetical account values and hypothetical expenses based on the Fund's actual expense ratio and an assumed rate of return of 5% per year before expenses, which is not the Fund's actual return. The hypothetical account values and expenses may not be used to estimate the actual ending account balance or expenses you paid for the period. You may use this information to compare this 5% hypothetical example with the 5% hypothetical examples that appear in shareholder reports of other funds.
Please note the expenses shown in the table below are meant to highlight your ongoing costs only and do not reflect any transactional costs. If these transactional costs were included, your costs would have been higher.
| | Beginning
Account
Value
1/1/21 | | Actual
Ending
Account
Value
6/30/21 | | Hypothetical
Ending
Account
Value
6/30/21 | | Actual
Expenses Paid
During Period
1/1/21-6/30/21* | | Hypothetical
Expenses Paid
During Period
1/1/21-6/30/21* | | Annualized
Expense Ratio
During Period
1/1/21-6/30/21 | |
RS International Fund | |
Class A | | $ | 1,000.00 | | | $ | 1,111.90 | | | $ | 1,019.19 | | | $ | 5.92 | | | $ | 5.66 | | | | 1.13 | % | |
Class C | | | 1,000.00 | | | | 1,108.00 | | | | 1,015.47 | | | | 9.83 | | | | 9.39 | | | | 1.88 | % | |
Class R | | | 1,000.00 | | | | 1,111.30 | | | | 1,017.95 | | | | 7.22 | | | | 6.90 | | | | 1.38 | % | |
Class R6 | | | 1,000.00 | | | | 1,114.00 | | | | 1,020.68 | | | | 4.35 | | | | 4.16 | | | | 0.83 | % | |
Class Y | | | 1,000.00 | | | | 1,114.40 | | | | 1,020.43 | | | | 4.61 | | | | 4.41 | | | | 0.88 | % | |
RS Global Fund | |
Class A | | | 1,000.00 | | | | 1,127.40 | | | | 1,020.58 | | | | 4.48 | | | | 4.26 | | | | 0.85 | % | |
Class C | | | 1,000.00 | | | | 1,123.50 | | | | 1,016.86 | | | | 8.42 | | | | 8.00 | | | | 1.60 | % | |
Class R | | | 1,000.00 | | | | 1,126.10 | | | | 1,019.34 | | | | 5.80 | | | | 5.51 | | | | 1.10 | % | |
Class R6 | | | 1,000.00 | | | | 1,129.00 | | | | 1,022.07 | | | | 2.90 | | | | 2.76 | | | | 0.55 | % | |
Class Y | | | 1,000.00 | | | | 1,129.10 | | | | 1,021.82 | | | | 3.17 | | | | 3.01 | | | | 0.60 | % | |
58
Victory Portfolios | | Supplemental Information — continued
June 30, 2021 | |
(Unaudited)
| | Beginning
Account
Value
1/1/21 | | Actual
Ending
Account
Value
6/30/21 | | Hypothetical
Ending
Account
Value
6/30/21 | | Actual
Expenses Paid
During Period
1/1/21-6/30/21* | | Hypothetical
Expenses Paid
During Period
1/1/21-6/30/21* | | Annualized
Expense Ratio
During Period
1/1/21-6/30/21 | |
Sophus Emerging Markets Fund | |
Class A | | $ | 1,000.00 | | | $ | 1,104.50 | | | $ | 1,018.15 | | | $ | 6.99 | | | $ | 6.71 | | | | 1.34 | % | |
Class C | | | 1,000.00 | | | | 1,100.10 | | | | 1,014.18 | | | | 11.14 | | | | 10.69 | | | | 2.14 | % | |
Class R | | | 1,000.00 | | | | 1,103.30 | | | | 1,016.96 | | | | 8.24 | | | | 7.90 | | | | 1.58 | % | |
Class R6 | | | 1,000.00 | | | | 1,106.80 | | | | 1,020.38 | | | | 4.65 | | | | 4.46 | | | | 0.89 | % | |
Class Y | | | 1,000.00 | | | | 1,106.60 | | | | 1,019.89 | | | | 5.17 | | | | 4.96 | | | | 0.99 | % | |
* Expenses are equal to the average account value multiplied by the Fund's annualized expense ratio multiplied by 181/365 (the number of days in the most recent fiscal half-year divided by the number of days in the fiscal year).
59
Victory Portfolios | | Supplemental Information — continued
June 30, 2021 | |
(Unaudited)
Liquidity Risk Management Program:
The Victory Funds have adopted and implemented a written liquidity risk management program (the "LRMP") as required by Rule 22e-4 under the Investment Company Act of 1940, as amended. The LRMP is reasonably designed to assess and manage each Fund's liquidity risk, taking into consideration each Fund's investment strategy and the liquidity of its portfolio investments during normal and reasonably foreseeable stressed market conditions; its short- and long-term cash flow projections; and its cash holdings and access to other liquidity management tools such as available funding sources including the Victory Funds Complex Interfund Lending Facility and Line of Credit (discussed in the Notes to Financial Statements). The Victory Funds' Board of Trustees approved the appointment of the Funds' investment adviser, Victory Capital Management Inc. ("Victory Capital"), as the administrator of the LRMP.
Victory Capital manages liquidity risks associated with the Funds' investments by monitoring, among other things, cash and cash equivalents, any use of derivatives, the concentration of investments, the appropriateness of each Fund's investment strategy, and by classifying every Fund investment as either highly liquid, moderately liquid, less liquid or illiquid on at least a monthly basis. To assist with the classification of Fund investments, Victory Capital has retained a third-party provider of liquidity evaluation services. This provider determines preliminary liquidity classifications for all portfolio holdings based upon portfolio-level data and certain assumptions provided by Victory Capital. Victory Capital reviews the preliminary liquidity classifications and, when appropriate, considers other information including input from the Funds' portfolio managers (including the portfolio managers employed by any investment sub-advisers) in determining final liquidity classifications.
At a meeting held on February 18, 2021, Victory Capital provided an oral and written report to the Trustees on the operation and effectiveness of the LRMP during the previous year. The report from Victory Capital concluded that the Funds did not experience any significant liquidity challenges during the covered period, and the Funds' LRMP is reasonably designed to assess and manage its liquidity risk. The report also concluded that the LRMP continues to operate adequately and effectively to enable Victory Capital to oversee and manage liquidity risk and ensure each Fund is able to meet redemption requests without significant dilution to the remaining investors' interest in each Fund. During the review period, each Fund's portfolio consisted primarily of highly liquid investments, which are defined as cash and any investments that the Fund reasonably expects to be converted to cash in current market conditions in three business days or less without significantly changing the market value of the investment. Therefore, the Funds have not adopted a highly liquid investment minimum. The Funds' investments were below the limitation on illiquid investments during the review period. Additionally, Victory Capital indicated that no events occurred that would require the filing of Form N-LIQUID and recommended no material changes to the LRMP.
60
Privacy Policy
Protecting the Privacy of Information
The Trust respects your right to privacy. We also know that you expect us to conduct and process your business in an accurate and efficient manner. To do so, we must collect and maintain certain personal information about you. This is the information we collect from you on applications or other forms, and from the transactions you make with us or third parties. It may include your name, address, social security number, account transactions and balances, and information about investment goals and risk tolerance.
We do not disclose any information about you or about former customers to anyone except as permitted or required by law. Specifically, we may disclose the information we collect to companies that perform services on our behalf, such as the transfer agent that processes shareholder accounts and printers and mailers that assist us in the distribution of investor materials. We may also disclose this information to companies that perform marketing services on our behalf. This allows us to continue to offer you Victory investment products and services that meet your investing needs, and to effect transactions that you request or authorize. These companies will use this information only in connection with the services for which we hired them. They are not permitted to use or share this information for any other purpose.
To protect your personal information internally, we permit access only by authorized employees and maintain physical, electronic, and procedural safeguards to guard your personal information.*
* You may have received communications regarding information about privacy policies from other financial institutions which gave you the opportunity to "opt-out" of certain information sharing with companies which are not affiliated with that financial institution. The Trust does not share information with other companies for purposes of marketing solicitations for products other than the Trust. Therefore, the Trust does not provide opt-out options to their shareholders.
Victory Funds
P.O. Box 182593
Columbus, Ohio 43218-2593

Visit our website at: | | Call Victory at: | |
www.vcm.com | | 800-539-FUND (800-539-3863) | |

June 30, 2021
Semi Annual Report
Victory INCORE Investment Quality Bond Fund
Victory INCORE Low Duration Bond Fund
Victory High Yield Fund
Victory Tax-Exempt Fund
Victory High Income Municipal Bond Fund
Victory Floating Rate Fund
Victory Strategic Income Fund
www.vcm.com
News, Information And Education 24 Hours A Day, 7 Days A Week
The Victory Funds site gives fund shareholders, prospective shareholders, and investment professionals a convenient way to access fund information, get guidance, and track fund performance anywhere they can access the Internet. The site includes:
• Detailed performance records
• Daily share prices
• The latest fund news
• Investment resources to help you become a better investor
• A section dedicated to investment professionals
Whether you're a potential investor searching for the fund that matches your investment philosophy, a seasoned investor interested in planning tools, or an investment professional, www.vcm.com has what you seek. Visit us anytime. We're always open.
TABLE OF CONTENTS
Investment Objective and Portfolio
Holdings | | | 4 | | |
Schedules of Portfolio Investments | |
Victory INCORE Investment Quality Bond Fund | | | 11 | | |
Victory INCORE Low Duration Bond Fund | | | 20 | | |
Victory High Yield Fund | | | 28 | | |
Victory Tax-Exempt Fund | | | 35 | | |
Victory High Income Municipal Bond Fund | | | 39 | | |
Victory Floating Rate Fund | | | 44 | | |
Strategic Income Fund | | | 54 | | |
Financial Statements | |
Statements of Assets and Liabilities | | | 60 | | |
Statements of Operations | | | 63 | | |
Statements of Changes in Net Assets | | | 66 | | |
Financial Highlights | | | 74 | | |
Notes to Financial Statements | | | 92 | | |
Supplemental Information | | | 109 | | |
Proxy Voting and Portfolio Holdings Information | | | 109 | | |
Expense Examples | | | 109 | | |
Liquidity Risk Management Program | | | 111 | | |
Privacy Policy (inside back cover) | | | |
1
IRA DISTRIBUTION WITHHOLDING DISCLOSURE
We generally must withhold federal income tax at a rate of 10% of the taxable portion of your distribution and, if you live in a state that requires state income tax withholding, at your state's tax rate. However, you may elect not to have withholding apply or to have income tax withheld at a higher rate. Any withholding election that you make will apply to any subsequent distribution unless and until you change or revoke the election. If you wish to make a withholding election, or change or revoke a prior withholding election, call 800-539-3863 (800-235-8396 for Member Class) and form W-4P (OMB No. 1545-0074 withholding certificate for pension or annuity payments) will be electronically sent.
If you do not have a withholding election in place by the date of a distribution, federal income tax will be withheld from the taxable portion of your distribution at a rate of 10%. If you must pay estimated taxes, you may be subject to estimated tax penalties if your estimated tax payments are not sufficient and sufficient tax is not withheld from your distribution.
For more specific information, please consult your tax adviser.
The Funds are distributed by Victory Capital Services, Inc. Victory Capital Management Inc. is the investment adviser to the Funds and receives fees from the Funds for performing services for the Funds.
This report is not authorized for distribution to prospective investors unless preceded or accompanied by a current prospectus of the Victory Funds.
For additional information about any Victory Fund, including fees, expenses, and risks, view our prospectus online at vcm.com or call 800-539-3863 (800-235-8396 for Member Class). Read it carefully before you invest or send money.
The information in this report is based on data obtained from recognized services and sources and is believed to be reliable. Any opinions, projections, or recommendations in this report are subject to change without notice and are not intended as individual investment advice. Past investment performance of the Funds, markets or securities mentioned herein should not be considered to be indicative of future results.
• NOT FDIC INSURED • NO BANK GUARANTEE • MAY LOSE VALUE

Call Victory at:
800-539-FUND (800-539-3863)
800-235-8396 for Member Class
Visit our website at:
www.vcm.com
2
This page is intentionally left blank.
3
Victory Portfolios
Victory INCORE Investment Quality Bond Fund | | June 30, 2021 | |
(Unaudited)
Investment Objective and Portfolio Holdings:
The Fund's investment objective seeks to provide a high level of current income and capital appreciation without undue risk to principal.
Asset Allocation*:
June 30, 2021
(% of Net Assets)
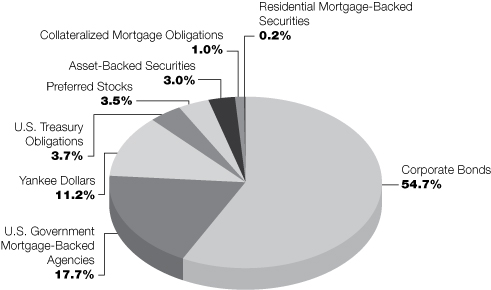
* Does not include futures contracts, money market instruments, and short-term investments purchased with cash collateral from securities loaned.
Percentages are of the net assets of the Fund and may not equal 100%.
Refer to the Schedule of Portfolio Investments for a complete list of securities.
4
Victory Portfolios
Victory INCORE Low Duration Bond Fund | | June 30, 2021 | |
(Unaudited)
Investment Objective and Portfolio Holdings:
The Fund's investment objective seeks to provide a high level of current income consistent with preservation of capital.
Asset Allocation*:
June 30, 2021
(% of Net Assets)

* Does not include futures contracts, money market instruments, and short-term investments purchased with cash collateral from securities loaned.
Percentages are of the net assets of the Fund and may not equal 100%.
Refer to the Schedule of Portfolio Investments for a complete list of securities.
5
Victory Portfolios
Victory High Yield Fund | | June 30, 2021 | |
(Unaudited)
Investment Objective and Portfolio Holdings:
The Fund's investment objective seeks to provide current income. Capital appreciation is a secondary objective.
Asset Allocation*:
June 30, 2021
(% of Net Assets)
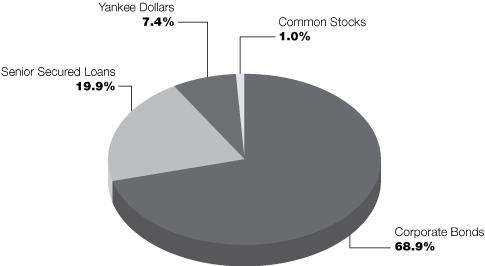
* Does not include futures contracts, money market instruments, and short-term investments purchased with cash collateral from securities loaned.
Percentages are of the net assets of the Fund and may not equal 100%.
Refer to the Schedule of Portfolio Investments for a complete list of securities.
6
Victory Portfolios
Victory Tax-Exempt Fund | | June 30, 2021 | |
(Unaudited)
Investment Objective and Portfolio Holdings:
The Fund's investment objective seeks to maximize current income exempt from federal income taxes, consistent with the preservation of capital.
Asset Allocation*:
June 30, 2021
(% of Net Assets)
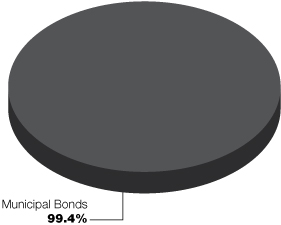
* Does not include futures contracts, money market instruments, and short-term investments purchased with cash collateral from securities loaned.
Percentages are of the net assets of the Fund and may not equal 100%.
Refer to the Schedule of Portfolio Investments for a complete list of securities.
7
Victory Portfolios
Victory High Income Municipal Bond Fund | | June 30, 2021 | |
(Unaudited)
Investment Objective and Portfolio Holdings:
The Fund's investment objective seeks to provide a high current income exempt from federal income taxes with a secondary objective of capital appreciation.
Asset Allocation*:
June 30, 2021
(% of Net Assets)
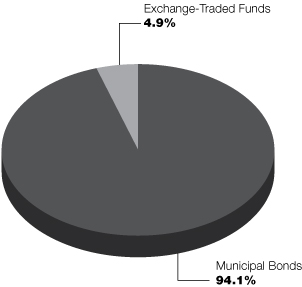
* Does not include futures contracts, money market instruments, and short-term investments purchased with cash collateral from securities loaned.
Percentages are of the net assets of the Fund and may not equal 100%.
Refer to the Schedule of Portfolio Investments for a complete list of securities.
8
Victory Portfolios
Victory Floating Rate Fund | | June 30, 2021 | |
(Unaudited)
Investment Objective and Portfolio Holdings:
The Fund's investment objective seeks to provide a high level of current income.
Top 10 Holdings*:
June 30, 2021
(% of Net Assets)
Petco Health & Wellness Co., Inc., Initial Term Loans, First Lien | | | 1.5 | % | |
The Michaels Cos., Inc., Term B Loans, First Lien | | | 1.4 | % | |
Jo-Ann Stores LLC, Loan, First Lien | | | 1.3 | % | |
ACProducts, Inc. Initial Term Loans, First Lien | | | 1.3 | % | |
Jo-Ann Stores LLC, Term Loan B, First Lien | | | 1.3 | % | |
iHeartCommunications, Inc., Term Loans, First Lien | | | 1.1 | % | |
U.S. Renal Care, Inc., Initial Term Loan, First Lien | | | 1.1 | % | |
CP ATLAS BUYER, Inc., Term B Loans, First Lien | | | 1.1 | % | |
Delta 2 (Lux) S.a.r.l., New Term Loan B, First Lien | | | 1.0 | % | |
PetSmart, Inc., Initial Term Loans, First Lien | | | 1.0 | % | |
Sector Allocation*
June 30, 2021
(% of Net Assets)
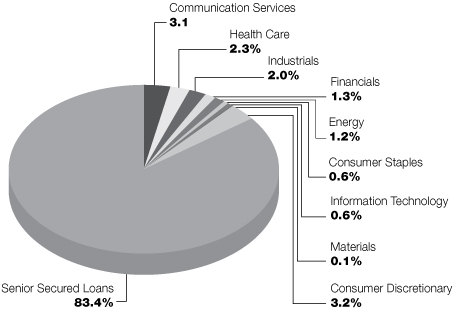
* Does not include futures contracts, money market instruments, and short-term investments purchased with cash collateral from securities loaned.
Percentages are of the net assets of the Fund and may not equal 100%.
Refer to the Schedule of Portfolio Investments for a complete list of securities.
9
Victory Portfolios
Victory Strategic Income Fund | | June 30, 2021 | |
(Unaudited)
Investment Objective and Portfolio Holdings:
The Fund's investment objective seeks to provide a high current income with a secondary objective of capital appreciation.
Asset Allocation*:
June 30, 2021
(% of Net Assets)
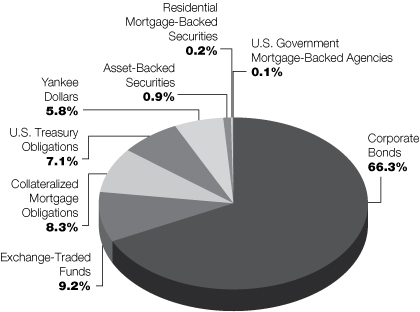
* Does not include futures contracts, money market instruments, and short-term investments purchased with cash collateral from securities loaned.
Percentages are of the net assets of the Fund and may not equal 100%.
Refer to the Schedule of Portfolio Investments for a complete list of securities.
10
Victory Portfolios
Victory INCORE Investment Quality Bond Fund | | Schedule of Portfolio Investments
June 30, 2021 | |
(Unaudited)
Security Description | | Shares or
Principal
Amount | | Value | |
Asset-Backed Securities (3.0%) | |
Drive Auto Receivables Trust, Series 2021-1, Class C, 1.02%, 6/15/27,
Callable 12/15/24 @ 100 | | $ | 125,000 | | | $ | 125,531 | | |
GM Financial Consumer Automobile Receivables Trust, Series 2021-2,
Class C, 1.28%, 1/19/27, Callable 7/16/24 @ 100 | | | 105,000 | | | | 104,674 | | |
Santander Retail Auto Lease Trust, Series 2021-A, Class C, 1.14%, 3/20/26,
Callable 6/20/24 @ 100 (a) (b) | | | 287,000 | | | | 287,163 | | |
Westlake Automobile Receivables Trust, Series 2021-1A, Class C, 0.95%, 3/16/26,
Callable 9/15/24 @ 100 (a) | | | 142,000 | | | | 141,838 | | |
Westlake Automobile Receivables Trust, Series 2021-2A, Class C, 0.89%, 7/15/26,
Callable 8/15/24 @ 100 (a) | | | 136,000 | | | | 135,983 | | |
Total Asset-Backed Securities (Cost $794,915) | | | 795,189 | | |
Collateralized Mortgage Obligations (1.0%) | |
BANK, Series 2020-BN26, Class AS, 2.69%, 3/15/63, Callable 3/15/30 @ 100 | | | 130,000 | | | | 135,887 | | |
Citigroup Commercial Mortgage Trust, Series 2020-GC46, Class AS, 2.92%,
2/15/53, Callable 2/15/30 @ 100 | | | 117,000 | | | | 124,342 | | |
Total Collateralized Mortgage Obligations (Cost $254,249) | | | 260,229 | | |
Preferred Stocks (3.5%) | |
Financials (1.4%): | |
AMG Capital Trust II, 10/15/37, 5.15% | | | 1,475 | | | | 88,653 | | |
Bank of America Corp., Series L, 7.25% (c) | | | 77 | | | | 109,032 | | |
KKR & Co., Inc., Series C, 9/15/23, 6.00% (d) | | | 865 | | | | 66,657 | | |
Wells Fargo & Co., Series L, 7.50% (c) | | | 75 | | | | 114,466 | | |
| | | | 378,808 | | |
Health Care (0.1%): | |
Danaher Corp., Series B, 4/15/23, 5.00% (d) | | | 17 | | | | 25,080 | | |
Industrials (0.5%): | |
Stanley Black & Decker, Inc., 11/15/22, 5.25% (d) | | | 981 | | | | 118,436 | | |
Utilities (1.5%): | |
American Electric Power Co., Inc., 8/15/23, 6.13% | | | 655 | | | | 33,562 | | |
Dominion Energy, Inc., Series A, 6/1/22, 7.25% | | | 1,090 | | | | 105,872 | | |
DTE Energy Co., 11/1/22, 6.25% | | | 1,476 | | | | 72,959 | | |
NextEra Energy, Inc., 3/1/23, 5.27% | | | 2,390 | | | | 117,014 | | |
The Southern Co., Series 2019, 8/1/22, 6.75% | | | 1,677 | | | | 84,906 | | |
| | | | 414,313 | | |
Total Preferred Stocks (Cost $895,165) | | | 936,637 | | |
Corporate Bonds (54.7%) | |
Communication Services (2.6%): | |
Alphabet, Inc., 2.05%, 8/15/50, Callable 2/15/50 @ 100 | | $ | 50,000 | | | | 44,254 | | |
AT&T, Inc.
4.25%, 3/1/27, Callable 12/1/26 @ 100 (b) | | | 46,000 | | | | 52,213 | | |
1.65%, 2/1/28, Callable 12/1/27 @ 100 | | | 51,000 | | | | 50,621 | | |
5.15%, 11/15/46, Callable 5/15/46 @ 100 (b) | | | 126,000 | | | | 161,398 | | |
See notes to financial statements.
11
Victory Portfolios
Victory INCORE Investment Quality Bond Fund | | Schedule of Portfolio Investments — continued
June 30, 2021 | |
(Unaudited)
Security Description | | Principal
Amount | | Value | |
CenturyLink, Inc., 6.75%, 12/1/23 | | $ | 50,000 | | | $ | 55,425 | | |
Comcast Corp.
3.45%, 2/1/50, Callable 8/1/49 @ 100 | | | 70,000 | | | | 75,826 | | |
2.80%, 1/15/51, Callable 7/15/50 @ 100 | | | 56,000 | | | | 53,894 | | |
Sirius XM Radio, Inc., 4.13%, 7/1/30, Callable 7/1/25 @ 102.06 (a) | | | 62,000 | | | | 62,723 | | |
Verizon Communications, Inc.
3.38%, 2/15/25 (b) | | | 38,000 | | | | 41,285 | | |
3.55%, 3/22/51, Callable 9/22/50 @ 100 (b) | | | 90,000 | | | | 96,170 | | |
| | | | 693,809 | | |
Consumer Discretionary (8.6%): | |
Aptiv PLC, 5.40%, 3/15/49, Callable 9/15/48 @ 100 (d) | | | 70,000 | | | | 95,023 | | |
Booking Holdings, Inc.
0.90%, 9/15/21 | | | 10,000 | | | | 10,875 | | |
0.75%, 5/1/25 | | | 75,000 | | | | 106,251 | | |
D.R. Horton, Inc., 2.50%, 10/15/24, Callable 9/15/24 @ 100 (b) | | | 315,000 | | | | 330,344 | | |
Dana, Inc., 5.63%, 6/15/28, Callable 6/15/23 @ 102.81 | | | 48,000 | | | | 51,858 | | |
Darden Restaurants, Inc., 3.85%, 5/1/27, Callable 2/1/27 @ 100 (b) | | | 75,000 | | | | 83,287 | | |
Expedia Group, Inc.
3.60%, 12/15/23, Callable 11/15/23 @ 100 | | | 87,000 | | | | 92,436 | | |
2/15/26 (a) (d) | | | 71,000 | | | | 76,858 | | |
General Motors Co., 4.88%, 10/2/23 (b) | | | 96,000 | | | | 104,497 | | |
Hasbro, Inc., 2.60%, 11/19/22 | | | 130,000 | | | | 133,697 | | |
Hilton Domestic Operating Co., Inc., 4.88%, 1/15/30, Callable 1/15/25 @ 102.44 | | | 48,000 | | | | 51,356 | | |
Hilton Worldwide Finance LLC/Hilton Worldwide Finance Corp., 4.88%, 4/1/27,
Callable 4/1/22 @ 102.44 | | | 55,000 | | | | 57,385 | | |
Lear Corp., 3.50%, 5/30/30, Callable 2/28/30 @ 100 | | | 18,000 | | | | 19,354 | | |
Lennar Corp., 5.00%, 6/15/27, Callable 12/15/26 @ 100 | | | 93,000 | | | | 107,638 | | |
Marriott International, Inc., 3.60%, 4/15/24, Callable 3/15/24 @ 100 | | | 142,000 | | | | 151,308 | | |
Meritage Homes Corp., 6.00%, 6/1/25, Callable 3/1/25 @ 100 | | | 27,000 | | | | 30,789 | | |
Murphy Oil USA, Inc., 3.75%, 2/15/31, Callable 2/15/26 @ 101.88 (a) | | | 43,000 | | | | 42,520 | | |
NIKE, Inc., 3.88%, 11/1/45, Callable 5/1/45 @ 100 | | | 100,000 | | | | 119,838 | | |
NVR, Inc.
3.95%, 9/15/22, Callable 6/15/22 @ 100 (b) | | | 126,000 | | | | 130,124 | | |
3.00%, 5/15/30, Callable 11/15/29 @ 100 | | | 118,000 | | | | 125,047 | | |
PulteGroup, Inc., 5.00%, 1/15/27, Callable 10/15/26 @ 100 (d) | | | 100,000 | | | | 116,857 | | |
Ross Stores, Inc.
3.38%, 9/15/24, Callable 6/15/24 @ 100 | | | 70,000 | | | | 74,200 | | |
0.88%, 4/15/26, Callable 3/15/26 @ 100 | | | 53,000 | | | | 51,916 | | |
Whirlpool Corp., 2.40%, 5/15/31, Callable 2/15/31 @ 100 | | | 80,000 | | | | 80,709 | | |
Yum! Brands, Inc., 3.63%, 3/15/31, Callable 12/15/30 @ 100 | | | 73,000 | | | | 72,934 | | |
| | | | 2,317,101 | | |
Consumer Staples (2.7%): | |
7-Eleven, Inc., 0.80%, 2/10/24, Callable 2/10/22 @ 100 (a) | | | 156,000 | | | | 155,644 | | |
Altria Group, Inc., 4.40%, 2/14/26, Callable 12/14/25 @ 100 (b) | | | 34,000 | | | | 38,461 | | |
BAT Capital Corp., 5.28%, 4/2/50, Callable 10/2/49 @ 100 | | | 75,000 | | | | 86,716 | | |
Estee Lauder Cos., Inc., 4.15%, 3/15/47, Callable 9/15/46 @ 100 | | | 52,000 | | | | 64,945 | | |
Hormel Foods Corp., 1.80%, 6/11/30, Callable 3/11/30 @ 100 | | | 160,000 | | | | 158,843 | | |
Molson Coors Beverage Co., 4.20%, 7/15/46, Callable 1/15/46 @ 100 | | | 42,000 | | | | 46,748 | | |
See notes to financial statements.
12
Victory Portfolios
Victory INCORE Investment Quality Bond Fund | | Schedule of Portfolio Investments — continued
June 30, 2021 | |
(Unaudited)
Security Description | | Principal
Amount | | Value | |
Reynolds American, Inc., 5.70%, 8/15/35, Callable 2/15/35 @ 100 | | $ | 92,000 | | | $ | 111,078 | | |
Tyson Foods, Inc., 5.10%, 9/28/48, Callable 3/28/48 @ 100 | | | 39,000 | | | | 51,452 | | |
| | | | 713,887 | | |
Energy (4.2%): | |
Chevron USA, Inc., 3.85%, 1/15/28, Callable 10/15/27 @ 100 | | | 135,000 | | | | 153,904 | | |
Continental Resources, Inc., 4.50%, 4/15/23, Callable 1/15/23 @ 100 (b) | | | 113,000 | | | | 117,852 | | |
EOG Resources, Inc., 4.95%, 4/15/50, Callable 10/15/49 @ 100 | | | 65,000 | | | | 86,838 | | |
EQM Midstream Partners LP, 4.75%, 7/15/23, Callable 6/15/23 @ 100 (b) | | | 39,000 | | | | 40,717 | | |
HollyFrontier Corp., 2.63%, 10/1/23 (d) | | | 116,000 | | | | 120,038 | | |
Marathon Oil Corp., 6.60%, 10/1/37 | | | 105,000 | | | | 139,821 | | |
Phillips 66 Partners LP, 4.90%, 10/1/46, Callable 4/1/46 @ 100 | | | 90,000 | | | | 107,045 | | |
Pioneer Natural Resources Co.
0.25%, 5/15/25 | | | 65,000 | | | | 103,680 | | |
1.90%, 8/15/30, Callable 5/15/30 @ 100 | | | 109,000 | | | | 105,045 | | |
Plains All American Pipeline LP/PAA Finance Corp., 2.85%, 1/31/23,
Callable 10/31/22 @ 100 (b) | | | 120,000 | | | | 123,169 | | |
Valero Energy Corp., 4.00%, 4/1/29, Callable 1/1/29 @ 100 (b) | | | 24,000 | | | | 26,798 | | |
| | | | 1,124,907 | | |
Financials (12.0%): | |
Aflac, Inc.
2.88%, 10/15/26, Callable 7/15/26 @ 100 | | | 185,000 | | | | 199,034 | | |
4.75%, 1/15/49, Callable 7/15/48 @ 100 (d) | | | 20,000 | | | | 26,324 | | |
Alleghany Corp., 3.63%, 5/15/30, Callable 2/15/30 @ 100 | | | 55,000 | | | | 60,687 | | |
Ares Capital Corp., 4.63%, 3/1/24 | | | 110,000 | | | | 120,745 | | |
Bank of America Corp.
4.20%, 8/26/24, MTN (b) | | | 51,000 | | | | 55,977 | | |
3.25%, 10/21/27, Callable 10/21/26 @ 100, MTN | | | 100,000 | | | | 108,474 | | |
Capital One Financial Corp., 3.30%, 10/30/24, Callable 9/30/24 @ 100 (b) | | | 72,000 | | | | 77,573 | | |
Cincinnati Financial Corp., 6.13%, 11/1/34 | | | 100,000 | | | | 136,559 | | |
Citigroup, Inc.
3.88%, 3/26/25 | | | 35,000 | | | | 38,413 | | |
4.60%, 3/9/26 (b) | | | 36,000 | | | | 41,007 | | |
4.45%, 9/29/27 (b) | | | 63,000 | | | | 71,952 | | |
3.88% (LIBOR03M+117bps), 1/24/39, Callable 1/24/38 @ 100 (e) | | | 51,000 | | | | 58,533 | | |
Fifth Third Bancorp
1.63%, 5/5/23, Callable 4/5/23 @ 100 | | | 55,000 | | | | 56,099 | | |
3.65%, 1/25/24, Callable 12/25/23 @ 100 (b) | | | 261,000 | | | | 279,727 | | |
Ford Motor Credit Co. LLC, 4.06%, 11/1/24, Callable 10/1/24 @ 100 | | | 200,000 | | | | 212,678 | | |
General Motors Financial Co., Inc., 4.15%, 6/19/23, Callable 5/19/23 @ 100 | | | 49,000 | | | | 52,051 | | |
Globe Life, Inc., 2.15%, 8/15/30, Callable 5/15/30 @ 100 | | | 110,000 | | | | 108,676 | | |
JPMorgan Chase & Co.
2.95%, 10/1/26, Callable 7/1/26 @ 100 (b) | | | 170,000 | | | | 183,168 | | |
5.60%, 7/15/41 | | | 52,000 | | | | 72,857 | | |
Level 3 Financing, Inc., 3.75%, 7/15/29, Callable 1/15/24 @ 101.88 (a) | | | 75,000 | | | | 72,934 | | |
Morgan Stanley
4.88%, 11/1/22 (b) | | | 144,000 | | | | 152,350 | | |
3.13%, 7/27/26, MTN (b) | | | 280,000 | | | | 303,125 | | |
Old Republic International Corp., 3.85%, 6/11/51, Callable 12/11/50 @ 100 | | | 42,000 | | | | 44,611 | | |
Sixth Street Specialty Lending, Inc., 4.50%, 8/1/22 | | | 40,000 | | | | 46,072 | | |
See notes to financial statements.
13
Victory Portfolios
Victory INCORE Investment Quality Bond Fund | | Schedule of Portfolio Investments — continued
June 30, 2021 | |
(Unaudited)
Security Description | | Principal
Amount | | Value | |
SVB Financial Group, 3.13%, 6/5/30, Callable 3/5/30 @ 100 | | $ | 164,000 | | | $ | 175,042 | | |
Unum Group
4.00%, 6/15/29, Callable 3/15/29 @ 100 | | | 92,000 | | | | 103,412 | | |
4.13%, 6/15/51, Callable 12/15/50 @ 100 | | | 67,000 | | | | 67,614 | | |
Wells Fargo & Co.
4.30%, 7/22/27, MTN (b) | | | 180,000 | | | | 205,114 | | |
4.90%, 11/17/45 (b) | | | 80,000 | | | | 102,399 | | |
| | | | 3,233,207 | | |
Health Care (5.2%): | |
AbbVie, Inc.
3.20%, 11/21/29, Callable 8/21/29 @ 100 | | | 66,000 | | | | 71,633 | | |
4.45%, 5/14/46, Callable 11/14/45 @ 100 | | | 62,000 | | | | 75,098 | | |
Amgen, Inc., 4.40%, 5/1/45, Callable 11/1/44 @ 100 | | | 70,000 | | | | 84,886 | | |
Anthem, Inc.
2.38%, 1/15/25, Callable 12/15/24 @ 100 | | | 65,000 | | | | 68,058 | | |
2.75%, 10/15/42 | | | 20,000 | | | | 107,738 | | |
Bristol-Myers Squibb Co., 3.40%, 7/26/29, Callable 4/26/29 @ 100 (b) | | | 220,000 | | | | 246,444 | | |
Centene Corp., 4.25%, 12/15/27, Callable 12/15/22 @ 102.13 | | | 73,000 | | | | 77,010 | | |
HCA, Inc., 4.13%, 6/15/29, Callable 3/15/29 @ 100 | | | 73,000 | | | | 82,321 | | |
Hologic, Inc., 3.25%, 2/15/29, Callable 9/28/23 @ 101.63 (a) | | | 114,000 | | | | 113,382 | | |
Humana, Inc., 2.90%, 12/15/22, Callable 11/15/22 @ 100 (b) | | | 65,000 | | | | 67,134 | | |
Illumina, Inc., 8/15/23 (d) | | | 85,000 | | | | 108,031 | | |
Merck & Co., Inc., 2.45%, 6/24/50, Callable 12/24/49 @ 100 | | | 59,000 | | | | 55,615 | | |
Mylan, Inc., 4.55%, 4/15/28, Callable 1/15/28 @ 100 | | | 91,000 | | | | 104,435 | | |
Regeneron Pharmaceuticals, Inc., 2.80%, 9/15/50, Callable 3/15/50 @ 100 | | | 63,000 | | | | 57,431 | | |
Universal Health Services, Inc., 2.65%, 10/15/30, Callable 7/15/30 @ 100 (a) | | | 44,000 | | | | 44,216 | | |
Upjohn, Inc., 2.30%, 6/22/27, Callable 4/22/27 @ 100 (a) | | | 40,000 | | | | 40,806 | | |
| | | | 1,404,238 | | |
Industrials (6.7%): | |
Acuity Brands Lighting, Inc., 2.15%, 12/15/30, Callable 9/15/30 @ 100 | | | 105,000 | | | | 104,103 | | |
Air Lease Corp., 0.70%, 2/15/24, MTN, Callable 1/15/24 @ 100 | | | 120,000 | | �� | | 119,424 | | |
Carlisle Cos., Inc., 2.75%, 3/1/30, Callable 12/1/29 @ 100 | | | 58,000 | | | | 60,510 | | |
CSX Corp., 3.35%, 9/15/49, Callable 3/15/49 @ 100 | | | 85,000 | | | | 90,050 | | |
Delta Air Lines, Inc., 3.80%, 4/19/23, Callable 3/19/23 @ 100 (b) | | | 130,000 | | | | 134,882 | | |
Fortive Corp., 0.88%, 2/15/22 | | | 120,000 | | | | 120,392 | | |
Hillenbrand, Inc., 5.00%, 9/15/26, Callable 7/15/26 @ 100 (b) | | | 195,000 | | | | 217,027 | | |
Norfolk Southern Corp., 2.30%, 5/15/31, Callable 2/15/31 @ 100 | | | 100,000 | | | | 101,339 | | |
Oshkosh Corp., 3.10%, 3/1/30, Callable 12/1/29 @ 100 | | | 60,000 | | | | 63,565 | | |
Rockwell Automation, Inc.
3.50%, 3/1/29, Callable 12/1/28 @ 100 | | | 65,000 | | | | 72,868 | | |
6.25%, 12/1/37 | | | 60,000 | | | | 84,901 | | |
Roper Technologies, Inc., 2.95%, 9/15/29, Callable 6/15/29 @ 100 (b) | | | 149,000 | | | | 159,348 | | |
Sensata Technologies, Inc., 3.75%, 2/15/31, Callable 2/15/26 @ 101.88 (a) | | | 57,000 | | | | 56,389 | | |
Snap-on, Inc., 4.10%, 3/1/48, Callable 9/1/47 @ 100 | | | 56,000 | | | | 68,701 | | |
Southwest Airlines Co., 1.25%, 5/1/25 | | | 75,000 | | | | 113,631 | | |
The Boeing Co., 2.20%, 2/4/26, Callable 2/4/23 @ 100 (b) | | | 170,000 | | | | 171,607 | | |
Valmont Industries, Inc., 5.00%, 10/1/44, Callable 4/1/44 @ 100 (b) | | | 60,000 | | | | 72,482 | | |
| | | | 1,811,219 | | |
See notes to financial statements.
14
Victory Portfolios
Victory INCORE Investment Quality Bond Fund | | Schedule of Portfolio Investments — continued
June 30, 2021 | |
(Unaudited)
Security Description | | Principal
Amount | | Value | |
Information Technology (6.0%): | |
Akamai Technologies, Inc., 0.13%, 5/1/25 | | $ | 35,000 | | | $ | 45,847 | | |
Apple, Inc., 4.65%, 2/23/46, Callable 8/23/45 @ 100 | | | 53,000 | | | | 70,325 | | |
Broadcom Corp./Broadcom Cayman Finance Ltd., 3.63%, 1/15/24,
Callable 11/15/23 @ 100 (b) | | | 57,000 | | | | 60,887 | | |
Broadcom, Inc., 5.00%, 4/15/30, Callable 1/15/30 @ 100 | | | 123,000 | | | | 145,386 | | |
Cadence Design Systems, Inc., 4.38%, 10/15/24, Callable 7/15/24 @ 100 (b) | | | 153,000 | | | | 168,275 | | |
Citrix Systems, Inc., 1.25%, 3/1/26, Callable 2/1/26 @ 100 | | | 106,000 | | | | 104,793 | | |
Euronet Worldwide, Inc., 0.75%, 3/15/49, Callable 3/20/25 @ 100 (d) | | | 100,000 | | | | 114,911 | | |
Intel Corp., 3.40%, 3/25/25, Callable 2/25/25 @ 100 | | | 102,000 | | | | 111,348 | | |
Lam Research Corp., 4.00%, 3/15/29, Callable 12/15/28 @ 100 (b) | | | 59,000 | | | | 68,621 | | |
Micron Technology, Inc., 5.33%, 2/6/29, Callable 11/6/28 @ 100 (b) | | | 167,000 | | | | 201,963 | | |
NCR Corp., 5.25%, 10/1/30, Callable 10/1/25 @ 102.63 (a) | | | 38,000 | | | | 39,530 | | |
NetApp, Inc., 3.25%, 12/15/22, Callable 9/15/22 @ 100 | | | 70,000 | | | | 72,026 | | |
ServiceNow, Inc., 6/1/22 | | | 2,000 | | | | 8,133 | | |
Square, Inc., 0.25%, 11/1/27 (a) (d) | | | 20,000 | | | | 23,277 | | |
Texas Instruments, Inc., 4.15%, 5/15/48, Callable 11/15/47 @ 100 | | | 51,000 | | | | 64,644 | | |
Vishay Intertechnology, Inc., 2.25%, 6/15/25 | | | 20,000 | | | | 21,045 | | |
VMware, Inc., 2.95%, 8/21/22, Callable 7/21/22 @ 100 | | | 170,000 | | | | 174,442 | | |
Western Digital Corp., 1.50%, 2/1/24 | | | 110,000 | | | | 117,401 | | |
| | | | 1,612,854 | | |
Materials (0.5%): | |
Celanese US Holdings LLC, 4.63%, 11/15/22 (b) | | | 100,000 | | | | 105,396 | | |
Nucor Corp., 2.00%, 6/1/25, Callable 5/1/25 @ 100 | | | 37,000 | | | | 38,269 | | |
| | | | 143,665 | | |
Real Estate (3.2%): | |
Highwoods Realty LP, 3.63%, 1/15/23, Callable 10/15/22 @ 100 (b) | | | 285,000 | | | | 294,402 | | |
Iron Mountain, Inc., 5.25%, 7/15/30, Callable 7/15/25 @ 102.63 (a) | | | 48,000 | | | | 50,830 | | |
Kite Realty Group LP, 0.75%, 4/1/27 (a) | | | 10,000 | | | | 10,497 | | |
Physicians Realty LP, 3.95%, 1/15/28, Callable 10/15/27 @ 100 | | | 60,000 | | | | 65,890 | | |
Piedmont Operating Partnership LP, 3.15%, 8/15/30, Callable 5/15/30 @ 100 | | | 58,000 | | | | 59,009 | | |
Regency Centers LP, 4.65%, 3/15/49, Callable 9/15/48 @ 100 | | | 49,000 | | | | 59,380 | | |
Retail Properties of America, Inc., 4.00%, 3/15/25, Callable 12/15/24 @ 100 | | | 155,000 | | | | 165,170 | | |
Sabra Health Care LP, 5.13%, 8/15/26, Callable 5/15/26 @ 100 | | | 65,000 | | | | 73,159 | | |
STORE Capital Corp., 2.75%, 11/18/30, Callable 8/18/30 @ 100 | | | 80,000 | | | | 80,799 | | |
| | | | 859,136 | | |
Utilities (3.0%): | |
Ameren Illinois Co., 1.55%, 11/15/30, Callable 8/15/30 @ 100 | | | 100,000 | | | | 96,234 | | |
American Water Capital Corp., 2.80%, 5/1/30, Callable 2/1/30 @ 100 | | | 55,000 | | | | 58,302 | | |
CenterPoint Energy, Inc., 4.57%, 9/15/29 | | | 455 | | | | 29,748 | | |
Consolidated Edison Co. of New York, Inc., 6.30%, 8/15/37 | | | 110,000 | | | | 154,380 | | |
NextEra Energy Capital Holdings, Inc., 2.80%, 1/15/23,
Callable 12/15/22 @ 100 (b) | | | 145,000 | | | | 149,876 | | |
Oklahoma G&E Co., 5.25%, 5/15/41, Callable 11/15/40 @ 100 | | | 105,000 | | | | 135,161 | | |
Public Service Electric & Gas Co., 4.00%, 6/1/44, Callable 12/1/43 @ 100 | | | 65,000 | | | | 75,844 | | |
Vistra Operations Co. LLC, 3.70%, 1/30/27, Callable 11/30/26 @ 100 (a) | | | 109,000 | | | | 116,449 | | |
| | | | 815,994 | | |
Total Corporate Bonds (Cost $14,018,058) | | | 14,730,017 | | |
See notes to financial statements.
15
Victory Portfolios
Victory INCORE Investment Quality Bond Fund | | Schedule of Portfolio Investments — continued
June 30, 2021 | |
(Unaudited)
Security Description | | Principal
Amount | | Value | |
Residential Mortgage-Backed Securities (0.2%) | |
Credit Suisse First Boston Mortgage Securities Corp., Series 2002-HE16,
Class M1, 1.41% (LIBOR01M+132bps), 10/25/32, Callable 7/25/21 @ 100 (e) | | $ | 59,497 | | | $ | 59,836 | | |
JPMorgan Mortgage Trust, Series 2004-S2, Class 1A3, 4.75%, 11/25/34,
Callable 7/25/21 @ 100 (b) | | | 3,690 | | | | 2,667 | | |
Total Residential Mortgage-Backed Securities (Cost $62,018) | | | 62,503 | | |
Yankee Dollars (11.2%) | |
Communication Services (0.4%): | |
Vodafone Group PLC, 5.25%, 5/30/48 | | | 89,000 | | | | 116,666 | | |
Consumer Staples (4.4%): | |
Barry Callebaut Services NV, 5.50%, 6/15/23 (a) | | | 275,000 | | | | 298,701 | | |
Kerry Group Financial Services Unlimited Co., 3.20%, 4/9/23,
Callable 1/9/23 @ 100 (a) (b) | | | 400,000 | | | | 414,432 | | |
Suntory Holdings Ltd.
2.55%, 6/28/22, Callable 5/28/22 @ 100 (a) (b) | | | 258,000 | | | | 263,056 | | |
2.25%, 10/16/24, Callable 9/16/24 @ 100 (a) | | | 200,000 | | | | 207,550 | | |
| | | | 1,183,739 | | |
Energy (0.9%): | |
Canadian Natural Resources Ltd., 2.95%, 1/15/23, Callable 12/15/22 @ 100 | | | 65,000 | | | | 67,346 | | |
Ecopetrol SA, 5.88%, 9/18/23 (b) | | | 133,000 | | | | 144,050 | | |
Statoil ASA, 3.95%, 5/15/43 | | | 20,000 | | | | 23,368 | | |
| | | | 234,764 | | |
Financials (2.8%): | |
Barclays Bank PLC
2/4/25 (b) | | | 45,000 | | | | 64,671 | | |
2/18/25 | | | 30,000 | | | | 34,280 | | |
Enel Finance International NV, 2.88%, 5/25/22 (a) (b) | | | 200,000 | | | | 204,426 | | |
Newcrest Finance Pty Ltd.
5.75%, 11/15/41 (a) | | | 95,000 | | | | 126,613 | | |
4.20%, 5/13/50, Callable 11/13/49 @ 100 (a) | | | 25,000 | | | | 28,696 | | |
NXP BV/NXP Funding LLC, 4.63%, 6/1/23 (a) | | | 200,000 | | | | 214,922 | | |
Total Capital International SA, 2.99%, 6/29/41, Callable 12/29/40 @ 100 | | | 85,000 | | | | 86,467 | | |
| | | | 760,075 | | |
Industrials (0.9%): | |
AerCap Ireland Capital DAC/AerCap Global Aviation Trust, 6.50%, 7/15/25,
Callable 6/15/25 @ 100 | | | 150,000 | | | | 175,879 | | |
Canadian National Railway Co., 3.20%, 8/2/46, Callable 2/2/46 @ 100 | | | 60,000 | | | | 62,179 | | |
| | | | 238,058 | | |
Materials (1.3%): | |
Anglo American Capital PLC, 2.88%, 3/17/31, Callable 12/17/30 @ 100 (a) | | | 200,000 | | | | 204,682 | | |
Rio Tinto Finance USA Ltd., 5.20%, 11/2/40 | | | 50,000 | | | | 68,534 | | |
Vale Overseas Ltd., 6.25%, 8/10/26 | | | 63,000 | | | | 75,714 | | |
| | | | 348,930 | | |
See notes to financial statements.
16
Victory Portfolios
Victory INCORE Investment Quality Bond Fund | | Schedule of Portfolio Investments — continued
June 30, 2021 | |
(Unaudited)
Security Description | | Principal
Amount | | Value | |
Utilities (0.5%): | |
Iberdrola International BV
6.75%, 9/15/33 | | $ | 35,000 | | | $ | 47,516 | | |
6.75%, 7/15/36 (d) | | | 47,000 | | | | 71,319 | | |
| | | | 118,835 | | |
Total Yankee Dollars (Cost $2,868,907) | | | 3,001,067 | | |
U.S. Government Mortgage-Backed Agencies (17.7%) | |
Federal Home Loan Mortgage Corp.
5.00%, 6/15/23 (b) | | | 8,784 | | | | 9,015 | | |
Series 4395, Class PA, 2.50%, 4/15/37 (b) | | | 97,631 | | | | 101,477 | | |
5.50%, 6/1/38 | | | 32,017 | | | | 37,354 | | |
7.00%, 9/1/38 (b) | | | 6,672 | | | | 8,012 | | |
Series 4320, Class AP, 3.50%, 7/15/39 – 10/15/40 (b) | | | 163,485 | | | | 170,440 | | |
4.50%, 1/1/41 – 7/1/44 (b) | | | 374,834 | | | | 416,185 | | |
Series 4444, Class CH, 3.00%, 1/15/41 (b) | | | 44,147 | | | | 44,786 | | |
2.50%, 7/1/50 | | | 121,942 | | | | 126,127 | | |
2.00%, 3/1/51 (b) | | | 281,355 | | | | 284,493 | | |
| | | | 1,197,889 | | |
Federal National Mortgage Association
6.00%, 8/1/21 – 2/1/37 (b) | | | 57,167 | | | | 66,965 | | |
5.50%, 4/1/22 – 1/1/38 (b) | | | 121,861 | | | | 140,775 | | |
7.00%, 8/1/23 – 12/1/28 | | | 1,033 | | | | 1,039 | | |
7.50%, 12/1/29 (b) | | | 3,624 | | | | 4,254 | | |
8.00%, 6/1/30 | | | 1,765 | | | | 2,112 | | |
8.00%, 9/1/30 (b) | | | 9,470 | | | | 11,133 | | |
7.50%, 2/1/31 | | | 10,863 | | | | 12,498 | | |
7.00%, 2/1/32 – 6/1/32 (b) | | | 14,910 | | | | 17,938 | | |
5.00%, 12/1/34 – 3/1/40 | | | 59,562 | | | | 67,738 | | |
2.16% (LIBOR12M+166bps), 12/1/36 (b) (e) | | | 25,792 | | | | 26,525 | | |
4.50%, 12/1/38 – 5/25/40 (b) | | | 236,753 | | | | 252,839 | | |
Series 2013-33, Class UD, 2.50%, 4/25/39 – 12/25/47 (b) | | | 171,918 | | | | 177,376 | | |
3.50%, 8/1/39 – 12/25/50 (b) | | | 733,976 | | | | 769,463 | | |
3.00%, 6/1/40 – 8/1/46 (b) | | | 589,859 | | | | 620,222 | | |
4.00%, 11/1/43 – 10/1/48 (b) | | | 628,603 | | | | 689,532 | | |
3.50%, 7/1/46 | | | 36,589 | | | | 39,623 | | |
3.00%, 9/1/46 – 5/1/48 | | | 280,559 | | | | 299,487 | | |
4.00%, 6/1/49 | | | 16,570 | | | | 17,688 | | |
2.00%, 3/1/51 (b) | | | 331,106 | | | | 335,183 | | |
| | | | 3,552,390 | | |
Government National Mortgage Association
6.00%, 12/15/33 (b) | | | 12,571 | | | | 14,667 | | |
Total U.S. Government Mortgage-Backed Agencies (Cost $4,640,773) | | | 4,764,946 | | |
See notes to financial statements.
17
Victory Portfolios
Victory INCORE Investment Quality Bond Fund | | Schedule of Portfolio Investments — continued
June 30, 2021 | |
(Unaudited)
Security Description | | Shares or
Principal
Amount | | Value | |
U.S. Treasury Obligations (3.7%) | |
U.S. Treasury Bonds, 1.25%, 5/15/50 (b) | | $ | 305,000 | | | $ | 249,004 | | |
U.S. Treasury Notes
0.75%, 4/30/26 | | | 679,000 | | | | 675,605 | | |
1.63%, 5/15/31 | | | 75,000 | | | | 76,172 | | |
Total U.S. Treasury Obligations (Cost $993,386) | | | 1,000,781 | | |
Collateral for Securities Loaned^ (3.1%) | |
BlackRock Liquidity Funds TempFund Portfolio, Institutional Class, 0.04% (f) | | | 16,444 | | | | 16,444 | | |
Fidelity Investments Money Market Government Portfolio I Shares, 0.01% (f) | | | 445,414 | | | | 445,414 | | |
Goldman Sachs Financial Square Prime Obligations Fund, Institutional
Class, 0.02% (f) | | | 8,206 | | | | 8,206 | | |
JPMorgan Prime Money Market Fund, Capital Class, 0.07% (f) | | | 65,435 | | | | 65,435 | | |
Morgan Stanley Institutional Liquidity Prime Portfolio, Institutional
Class, 0.06% (f) | | | 294,208 | | | | 294,208 | | |
Total Collateral for Securities Loaned (Cost $829,707) | | | 829,707 | | |
Total Investments (Cost $25,357,178) — 98.1% | | | 26,381,076 | | |
Other assets in excess of liabilities — 1.9% | | | 521,217 | | |
NET ASSETS — 100.00% | | $ | 26,902,293 | | |
^ Purchased with cash collateral from securities on loan.
(a) Rule 144A security or other security that is restricted as to resale to institutional investors. The Fund's Adviser has deemed this security to be liquid based upon procedures approved by the Board of Trustees. As of June 30, 2021, the fair value of these securities was $3,434,117 and amounted to 12.8% of net assets.
(b) All or a portion of this security has been segregated as collateral for derivative instruments.
(c) Security is perpetual and has no final maturity date but may be subject to calls at various dates in the future.
(d) All or a portion of this security is on loan.
(e) Variable or Floating-Rate Security. Rate disclosed is as of June 30, 2021.
(f) Rate disclosed is the daily yield on June 30, 2021.
bps — Basis points
LIBOR — London InterBank Offered Rate
LIBOR01M — 1 Month US Dollar LIBOR, rate disclosed as of June 30, 2021, based on the last reset date of the security
LIBOR03M — 3 Month US Dollar LIBOR, rate disclosed as of June 30, 2021, based on the last reset date of the security
LIBOR12M — 12 Month US Dollar LIBOR, rate disclosed as of June 30, 2021, based on the last reset date of the security
LLC — Limited Liability Company
LP — Limited Partnership
MTN — Medium Term Note
PLC — Public Limited Company
See notes to financial statements.
18
Victory Portfolios
Victory INCORE Investment Quality Bond Fund | | Schedule of Portfolio Investments — continued
June 30, 2021 | |
(Unaudited)
Futures Contracts Purchased
| | | Number of
Contracts | | Expiration
Date | | Notional
Amount | | Value | | Unrealized
Appreciation
(Depreciation) | |
2-Year U.S. Treasury Note Futures | | | 2 | | | 9/30/21 | | $ | 440,945 | | | $ | 440,641 | | | $ | (304 | ) | |
5-Year U.S. Treasury Note Futures | | | 13 | | | 9/30/21 | | | 1,606,967 | | | | 1,604,586 | | | | (2,381 | ) | |
Canadian Dollar Futures | | | 3 | | | 9/14/21 | | | 248,190 | | | | 241,860 | | | | (6,330 | ) | |
Ultra Long Term U.S. Treasury
Bond Futures | | | 6 | | | 9/21/21 | | | 1,111,156 | | | | 1,156,125 | | | | 44,969 | | |
| | | $ | 35,954 | | |
Futures Contracts Sold
| | | Number of
Contracts | | Expiration
Date | | Notional
Amount | | Value | | Unrealized
Appreciation
(Depreciation) | |
10-Year U.S. Treasury Note Futures | | | 12 | | | 9/21/21 | | $ | 1,579,928 | | | $ | 1,590,000 | | | $ | (10,072 | ) | |
Japanese Yen Futures | | | 3 | | | 9/13/21 | | | 341,250 | | | | 337,763 | | | | 3,487 | | |
Mexican Peso Currency Futures | | | 8 | | | 9/13/21 | | | 200,400 | | | | 198,800 | | | | 1,600 | | |
| | | $ | (4,985 | ) | |
Total unrealized appreciation | | $ | 50,056 | | |
Total unrealized depreciation | | | (19,087 | ) | |
Total net unrealized appreciation (depreciation) | | $ | 30,969 | | |
See notes to financial statements.
19
Victory Portfolios
Victory INCORE Low Duration Bond Fund | | Schedule of Portfolio Investments
June 30, 2021 | |
(Unaudited)
| Security Description | | Shares or
Principal
Amount | | Value | |
Asset-Backed Securities (5.3%) | |
AmeriCredit Automobile Receivables Trust, Series 2018-1, Class B, 3.26%,
1/18/24, Callable 8/18/22 @ 100 (a) | | $ | 2,019,455 | | | $ | 2,029,035 | | |
AmeriCredit Automobile Receivables Trust, Series 2021-1, Class C, 0.89%,
10/19/26, Callable 2/18/24 @ 100 | | | 1,815,000 | | | | 1,805,997 | | |
GM Financial Automobile Leasing Trust, Series 2021-1, Class C, 0.70%,
2/20/25, Callable 7/20/23 @ 100 | | | 1,168,000 | | | | 1,161,925 | | |
GM Financial Consumer Automobile Receivables Trust, Series 2021-2,
Class C, 1.28%, 1/19/27, Callable 7/16/24 @ 100 | | | 886,000 | | | | 883,249 | | |
Santander Drive Auto Receivables Trust, Series 2021-1, Class C, 0.75%,
2/17/26, Callable 12/15/23 @ 100 | | | 1,144,000 | | | | 1,146,646 | | |
Santander Drive Auto Receivables Trust, Series 2021-2, Class C, 0.90%,
6/15/26, Callable 5/15/25 @ 100 | | | 1,125,000 | | | | 1,124,756 | | |
Santander Retail Auto Lease Trust, Series 2021-A, Class C, 1.14%,
3/20/26, Callable 6/20/24 @ 100 (a) (b) | | | 2,200,000 | | | | 2,201,247 | | |
Westlake Automobile Receivables Trust, Series 2021-1A, Class C, 0.95%,
3/16/26, Callable 9/15/24 @ 100 (b) | | | 1,230,000 | | | | 1,228,598 | | |
Westlake Automobile Receivables Trust, Series 2021-2A, Class C, 0.89%,
7/15/26, Callable 8/15/24 @ 100 (b) | | | 1,223,000 | | | | 1,222,853 | | |
Total Asset-Backed Securities (Cost $12,809,050) | | | 12,804,306 | | |
Collateralized Mortgage Obligations (2.8%) | |
Galaxy CLO Ltd., Series 2017-24A, Class A, 1.30% (LIBOR03M+112bps),
1/15/31, Callable 7/15/21 @ 100 (a) (b) (c) | | | 2,000,000 | | | | 2,000,444 | | |
Steele Creek CLO Ltd., Series 2017-1A, Class A, 1.43% (LIBOR03M+125bps),
1/15/30, Callable 7/15/21 @ 100 (a) (b) (c) | | | 2,825,000 | | | | 2,817,827 | | |
Voya CLO Ltd., Series 2017-4A, Class A1, 1.31% (LIBOR03M+113bps),
10/15/30, Callable 7/15/21 @ 100 (a) (b) (c) | | | 2,000,000 | | | | 2,000,419 | | |
Total Collateralized Mortgage Obligations (Cost $6,825,000) | | | 6,818,690 | | |
Preferred Stocks (2.1%) | |
Financials (0.9%): | |
AMG Capital Trust II, 10/15/37, 5.15% | | | 7,530 | | | | 452,582 | | |
Bank of America Corp., Series L, 7.25% (d) | | | 370 | | | | 523,920 | | |
KKR & Co., Inc., Series C, 9/15/23, 6.00% (e) | | | 6,495 | | | | 500,505 | | |
Wells Fargo & Co., Series L, 7.50% (d) | | | 450 | | | | 686,795 | | |
| | | 2,163,802 | | |
Health Care (0.1%): | |
Danaher Corp., Series B, 4/15/23, 5.00% (e) | | | 146 | | | | 215,389 | | |
Industrials (0.3%): | |
Stanley Black & Decker, Inc., 11/15/22, 5.25% (e) | | | 5,055 | | | | 610,290 | | |
Utilities (0.8%): | |
American Electric Power Co., Inc., 8/15/23, 6.13% (e) | | | 3,530 | | | | 180,877 | | |
Dominion Energy, Inc., Series A, 6/1/22, 7.25% | | | 5,730 | | | | 556,555 | | |
DTE Energy Co., 11/1/22, 6.25% | | | 6,774 | | | | 334,839 | | |
See notes to financial statements.
20
Victory Portfolios
Victory INCORE Low Duration Bond Fund | | Schedule of Portfolio Investments — continued
June 30, 2021 | |
(Unaudited)
| Security Description | | Shares or
Principal
Amount | | Value | |
NextEra Energy, Inc., 3/1/23, 5.27% | | | 9,950 | | | $ | 487,152 | | |
The Southern Co., Series 2019, 8/1/22, 6.75% | | | 8,901 | | | | 450,658 | | |
| | | 2,010,081 | | |
Total Preferred Stocks (Cost $4,658,407) | | | 4,999,562 | | |
Corporate Bonds (52.1%) | |
Communication Services (3.5%): | |
AT&T, Inc., 1.70%, 3/25/26, Callable 3/25/23 @ 100 | | $ | 2,500,000 | | | | 2,526,850 | | |
CenturyLink, Inc., 6.75%, 12/1/23 | | | 424,000 | | | | 470,004 | | |
Charter Communications Operating LLC/Charter Communications
Operating Capital, 4.50%, 2/1/24, Callable 1/1/24 @ 100 | | | 496,000 | | | | 540,253 | | |
Comcast Corp., 3.10%, 4/1/25, Callable 3/1/25 @ 100 (a) (e) | | | 1,182,000 | | | | 1,275,094 | | |
Fox Corp., 4.03%, 1/25/24, Callable 12/25/23 @ 100 | | | 1,388,000 | | | | 1,503,690 | | |
Sirius XM Radio, Inc., 4.63%, 7/15/24, Callable 8/9/21 @ 102.31 (a) (b) | | | 836,000 | | | | 858,388 | | |
Verizon Communications, Inc.
3.38%, 2/15/25 (a) | | | 354,000 | | | | 384,607 | | |
1.26% (LIBOR03M+110bps), 5/15/25, Callable 3/15/25 @ 100 (a) (c) | | | 827,000 | | | | 852,331 | | |
| | | 8,411,217 | | |
Consumer Discretionary (8.5%): | |
Amazon.com, Inc., 1.00%, 5/12/26, Callable 4/12/26 @ 100 (e) | | | 2,500,000 | | | | 2,500,875 | | |
Aptiv Corp., 4.15%, 3/15/24, Callable 12/15/23 @ 100 | | | 1,599,000 | | | | 1,733,700 | | |
AutoZone, Inc., 3.13%, 4/18/24, Callable 3/18/24 @ 100 | | | 2,632,000 | | | | 2,802,185 | | |
Booking Holdings, Inc.
0.90%, 9/15/21 | | | 105,000 | | | | 114,186 | | |
0.75%, 5/1/25 (e) | | | 360,000 | | | | 510,005 | | |
D.R. Horton, Inc., 4.75%, 2/15/23, Callable 11/15/22 @ 100 (a) | | | 3,027,000 | | | | 3,199,781 | | |
Expedia Group, Inc.
3.60%, 12/15/23, Callable 11/15/23 @ 100 | | | 1,020,000 | | | | 1,083,730 | | |
2/15/26 (b) | | | 220,000 | | | | 238,152 | | |
General Motors Co., 4.88%, 10/2/23 (a) | | | 1,297,000 | | | | 1,411,798 | | |
Hilton Worldwide Finance LLC/Hilton Worldwide Finance Corp., 4.88%,
4/1/27, Callable 4/1/22 @ 102.44 | | | 620,000 | | | | 646,883 | | |
Kohl's Corp., 4.25%, 7/17/25, Callable 4/17/25 @ 100 (e) | | | 1,194,000 | | | | 1,304,421 | | |
LGI Homes, Inc., 6.88%, 7/15/26, Callable 7/15/21 @ 103.44 (a) (b) | | | 244,000 | | | | 252,786 | | |
Marriott International, Inc., 3.60%, 4/15/24, Callable 3/15/24 @ 100 (e) | | | 1,247,000 | | | | 1,328,741 | | |
NVR, Inc., 3.95%, 9/15/22, Callable 6/15/22 @ 100 (a) (e) | | | 3,283,000 | | | | 3,390,453 | | |
| | | 20,517,696 | | |
Consumer Staples (2.3%): | |
7-Eleven, Inc., 0.80%, 2/10/24, Callable 2/10/22 @ 100 (b) | | | 1,372,000 | | | | 1,368,872 | | |
Altria Group, Inc., 4.40%, 2/14/26, Callable 12/14/25 @ 100 (a) | | | 322,000 | | | | 364,250 | | |
Church & Dwight Co., Inc., 2.45%, 8/1/22, Callable 7/1/22 @ 100 (a) | | | 792,000 | | | | 808,656 | | |
Keurig Dr Pepper, Inc., 4.06%, 5/25/23, Callable 4/25/23 @ 100 (a) | | | 695,000 | | | | 740,786 | | |
Tyson Foods, Inc.
2.25%, 8/23/21, Callable 7/23/21 @ 100 | | | 1,080,000 | | | | 1,081,339 | | |
3.95%, 8/15/24, Callable 5/15/24 @ 100 | | | 1,170,000 | | | | 1,272,878 | | |
| | | 5,636,781 | | |
See notes to financial statements.
21
Victory Portfolios
Victory INCORE Low Duration Bond Fund | | Schedule of Portfolio Investments — continued
June 30, 2021 | |
(Unaudited)
| Security Description | | Principal
Amount | | Value | |
Energy (3.0%): | |
Boardwalk Pipelines LP, 3.38%, 2/1/23, Callable 11/1/22 @ 100 | | $ | 400,000 | | | $ | 412,884 | | |
Continental Resources, Inc., 4.50%, 4/15/23, Callable 1/15/23 @ 100 (a) | | | 801,000 | | | | 835,395 | | |
EQM Midstream Partners LP, 4.75%, 7/15/23, Callable 6/15/23 @ 100 (a) | | | 329,000 | | | | 343,483 | | |
HollyFrontier Corp., 2.63%, 10/1/23 (e) | | | 971,000 | | | | 1,004,800 | | |
Pioneer Natural Resources Co.
0.55%, 5/15/23 | | | 1,130,000 | | | | 1,130,723 | | |
0.25%, 5/15/25 | | | 365,000 | | | | 582,201 | | |
Plains All American Pipeline LP/PAA Finance Corp., 2.85%, 1/31/23,
Callable 10/31/22 @ 100 (a) | | | 1,010,000 | | | | 1,036,674 | | |
Valero Energy Corp.
2.70%, 4/15/23 (a) | | | 951,000 | | | | 986,120 | | |
1.20%, 3/15/24 | | | 1,020,000 | | | | 1,028,252 | | |
| | | 7,360,532 | | |
Financials (9.7%): | |
Ares Capital Corp., 4.63%, 3/1/24 | | | 590,000 | | | | 647,631 | | |
Bank of America Corp., 4.20%, 8/26/24, MTN (a) | | | 1,660,000 | | | | 1,822,016 | | |
Capital One Financial Corp., 3.30%, 10/30/24, Callable 9/30/24 @ 100 (a) | | | 684,000 | | | | 736,942 | | |
Dana Financing Luxembourg Sarl, 5.75%, 4/15/25,
Callable 8/9/21 @ 102.88 (a) (b) | | | 772,000 | | | | 796,472 | | |
Fifth Third Bancorp
1.63%, 5/5/23, Callable 4/5/23 @ 100 | | | 1,660,000 | | | | 1,693,167 | | |
3.65%, 1/25/24, Callable 12/25/23 @ 100 (a) | | | 799,000 | | | | 856,328 | | |
Ford Motor Credit Co. LLC, 3.10%, 5/4/23 (a) | | | 1,500,000 | | | | 1,530,420 | | |
General Motors Financial Co., Inc., 5.10%, 1/17/24, Callable 12/17/23 @ 100 | | | 1,549,000 | | | | 1,705,991 | | |
Harley-Davidson Financial Services, Inc., 3.35%, 2/15/23,
Callable 1/15/23 @ 100 (b) (e) | | | 1,488,000 | | | | 1,545,913 | | |
JPMorgan Chase Financial Co. LLC, 0.25%, 5/1/23 (b) | | | 435,000 | | | | 470,470 | | |
Morgan Stanley
4.88%, 11/1/22 (a) | | | 1,004,000 | | | | 1,062,222 | | |
0.53% (SOFR+46bps), 1/25/24, Callable 1/25/23 @ 100 (c) | | | 2,575,000 | | | | 2,574,176 | | |
Sixth Street Specialty Lending, Inc., 4.50%, 8/1/22 | | | 300,000 | | | | 345,540 | | |
The Bank of New York Mellon Corp., 0.75%, 1/28/26, MTN,
Callable 12/28/25 @ 100 (e) | | | 1,097,000 | | | | 1,085,844 | | |
The Goldman Sachs Group, Inc., 1.93% (LIBOR03M+175bps), 10/28/27,
Callable 10/28/26 @ 100 (a) (c) | | | 1,500,000 | | | | 1,583,460 | | |
Unum Group, 4.00%, 3/15/24 (e) | | | 1,310,000 | | | | 1,414,643 | | |
Wells Fargo & Co., 0.81% (SOFR+51bps), 5/19/25, MTN,
Callable 5/19/24 @ 100 (c) | | | 585,000 | | | | 583,941 | | |
Zions Bancorp NA
3.50%, 8/27/21 (a) | | | 1,785,000 | | | | 1,793,282 | | |
3.35%, 3/4/22, Callable 2/4/22 @ 100 (a) | | | 1,090,000 | | | | 1,108,759 | | |
| | | 23,357,217 | | |
Health Care (5.0%): | |
AbbVie, Inc., 3.85%, 6/15/24, Callable 3/15/24 @ 100 | | | 2,545,000 | | | | 2,759,442 | | |
Anthem, Inc., 2.75%, 10/15/42 | | | 110,000 | | | | 592,561 | | |
Biogen, Inc., 3.63%, 9/15/22 | | | 1,025,000 | | | | 1,064,339 | | |
Centene Corp., 4.25%, 12/15/27, Callable 12/15/22 @ 102.13 | | | 621,000 | | | | 655,112 | | |
See notes to financial statements.
22
Victory Portfolios
Victory INCORE Low Duration Bond Fund | | Schedule of Portfolio Investments — continued
June 30, 2021 | |
(Unaudited)
| Security Description | | Principal
Amount | | Value | |
HCA, Inc., 5.00%, 3/15/24 | | $ | 2,479,000 | | | $ | 2,739,964 | | |
Humana, Inc., 2.90%, 12/15/22, Callable 11/15/22 @ 100 (a) | | | 560,000 | | | | 578,385 | | |
Illumina, Inc., 8/15/23 (e) | | | 400,000 | | | | 508,380 | | |
Mylan, Inc., 3.13%, 1/15/23 (b) | | | 2,479,000 | | | | 2,569,707 | | |
Upjohn, Inc., 1.13%, 6/22/22 (b) | | | 525,000 | | | | 528,738 | | |
| | | 11,996,628 | | |
Industrials (4.3%): | |
Air Lease Corp., 0.70%, 2/15/24, MTN, Callable 1/15/24 @ 100 | | | 2,480,000 | | | | 2,468,096 | | |
Delta Air Lines, Inc., 3.80%, 4/19/23, Callable 3/19/23 @ 100 (a) | | | 1,115,000 | | | | 1,156,868 | | |
EnPro Industries, Inc., 5.75%, 10/15/26, Callable 10/15/21 @ 104.31 (a) | | | 725,000 | | | | 764,215 | | |
Fortive Corp., 0.88%, 2/15/22 | | | 580,000 | | | | 581,897 | | |
Roper Technologies, Inc., 0.45%, 8/15/22 | | | 1,019,000 | | | | 1,019,601 | | |
Southwest Airlines Co.
4.75%, 5/4/23 | | | 1,937,000 | | | | 2,078,944 | | |
1.25%, 5/1/25 | | | 315,000 | | | | 477,250 | | |
The Boeing Co., 2.20%, 2/4/26, Callable 2/4/23 @ 100 (a) | | | 1,784,000 | | | | 1,800,859 | | |
| | | 10,347,730 | | |
Information Technology (5.4%): | |
Akamai Technologies, Inc., 0.13%, 5/1/25 | | | 305,000 | | | | 399,526 | | |
Broadcom Corp./Broadcom Cayman Finance Ltd., 3.63%, 1/15/24,
Callable 11/15/23 @ 100 (a) (e) | | | 2,175,000 | | | | 2,323,335 | | |
Cadence Design Systems, Inc., 4.38%, 10/15/24, Callable 7/15/24 @ 100 (a) | | | 1,173,000 | | | | 1,290,112 | | |
Euronet Worldwide, Inc., 0.75%, 3/15/49, Callable 3/20/25 @ 100 (e) | | | 445,000 | | | | 511,354 | | |
KLA Corp., 4.65%, 11/1/24, Callable 8/1/24 @ 100 | | | 496,000 | | | | 553,843 | | |
Marvell Technology Group Ltd., 4.20%, 6/22/23, Callable 5/22/23 @ 100 | | | 941,000 | | | | 997,197 | | |
Maxim Integrated Products, Inc., 3.38%, 3/15/23, Callable 12/15/22 @ 100 | | | 901,000 | | | | 938,680 | | |
Micron Technology, Inc., 2.50%, 4/24/23 | | | 2,479,000 | | | | 2,561,799 | | |
NCR Corp., 5.00%, 10/1/28, Callable 10/1/23 @ 102.5 (b) | | | 642,000 | | | | 663,468 | | |
PayPal Holdings, Inc., 2.20%, 9/26/22 (a) | | | 757,000 | | | | 775,221 | | |
Seagate HDD Cayman, 4.88%, 3/1/24, Callable 1/1/24 @ 100 | | | 1,000,000 | | | | 1,082,580 | | |
ServiceNow, Inc., 6/1/22 | | | 20,000 | | | | 81,330 | | |
Square, Inc., 0.25%, 11/1/27 (b) (e) | | | 195,000 | | | | 226,947 | | |
Western Digital Corp., 1.50%, 2/1/24 | | | 505,000 | | | | 538,976 | | |
| | | 12,944,368 | | |
Materials (3.1%): | |
Celanese US Holdings LLC, 4.63%, 11/15/22 (a) | | | 855,000 | | | | 901,136 | | |
Graphic Packaging International LLC, 0.82%, 4/15/24,
Callable 3/15/24 @ 100 (b) (e) | | | 1,987,000 | | | | 1,973,965 | | |
Nucor Corp., 4.00%, 8/1/23, Callable 5/1/23 @ 100 (e) | | | 1,190,000 | | | | 1,267,279 | | |
Packaging Corp. of America, 4.50%, 11/1/23, Callable 8/1/23 @ 100 | | | 1,049,000 | | | | 1,133,958 | | |
Southern Copper Corp., 3.88%, 4/23/25 | | | 2,050,000 | | | | 2,234,090 | | |
| | | 7,510,428 | | |
Real Estate (3.3%): | |
American Tower Corp., 3.00%, 6/15/23 (a) | | | 1,000,000 | | | | 1,047,440 | | |
Brandywine Operating Partnership LP, 3.95%, 2/15/23, Callable 11/15/22 @ 100 | | | 750,000 | | | | 783,547 | | |
CyrusOne LP/CyrusOne Finance Corp., 2.90%, 11/15/24, Callable 10/15/24 @ 100 | | | 883,000 | | | | 932,201 | | |
See notes to financial statements.
23
Victory Portfolios
Victory INCORE Low Duration Bond Fund | | Schedule of Portfolio Investments — continued
June 30, 2021 | |
(Unaudited)
| Security Description | | Principal
Amount | | Value | |
Duke Realty LP, 3.63%, 4/15/23, Callable 1/15/23 @ 100 (a) | | $ | 1,230,000 | | | $ | 1,286,654 | | |
Iron Mountain, Inc., 5.25%, 7/15/30, Callable 7/15/25 @ 102.63 (b) | | | 638,000 | | | | 675,610 | | |
Kite Realty Group LP, 0.75%, 4/1/27 (b) | | | 90,000 | | | | 94,469 | | |
Piedmont Operating Partnership LP, 3.40%, 6/1/23, Callable 3/1/23 @ 100 (a) | | | 1,629,000 | | | | 1,693,264 | | |
Post Apartment Homes LP, 3.38%, 12/1/22, Callable 9/1/22 @ 100 | | | 500,000 | | | | 516,435 | | |
Weingarten Realty Investors
3.38%, 10/15/22, Callable 7/15/22 @ 100 (a) | | | 365,000 | | | | 375,359 | | |
3.50%, 4/15/23, Callable 1/15/23 @ 100 | | | 497,000 | | | | 518,451 | | |
| | | 7,923,430 | | |
Utilities (4.0%): | |
Ameren Corp., 2.50%, 9/15/24, Callable 8/15/24 @ 100 | | | 588,000 | | | | 619,358 | | |
CenterPoint Energy, Inc., 4.57%, 9/15/29 | | | 3,880 | | | | 253,675 | | |
Exelon Corp.
3.50%, 6/1/22, Callable 5/1/22 @ 100 (a) | | | 2,681,000 | | | | 2,749,339 | | |
3.95%, 6/15/25, Callable 3/15/25 @ 100 (a) | | | 591,000 | | | | 650,336 | | |
NextEra Energy Capital Holdings, Inc.
2.80%, 1/15/23, Callable 12/15/22 @ 100 (a) | | | 1,462,000 | | | | 1,511,167 | | |
0.65%, 3/1/23 | | | 1,129,000 | | | | 1,132,906 | | |
Vistra Operations Co. LLC, 3.55%, 7/15/24, Callable 6/15/24 @ 100 (b) | | | 2,500,000 | | | | 2,642,725 | | |
| | | 9,559,506 | | |
Total Corporate Bonds (Cost $122,704,807) | | | 125,565,533 | | |
Residential Mortgage-Backed Securities (3.1%) | |
Bear Stearns Alt-A Trust, Series 2003-3, Class 2A, 2.87%, 10/25/33,
Callable 7/25/21 @ 100 (a) (f) | | | 1,220,885 | | | | 1,220,885 | | |
Credit Suisse First Boston Mortgage Securities Corp., Series 2003-23,
Class 2A8, 4.50%, 10/31/33 (a) | | | 13,210 | | | | 13,773 | | |
Credit Suisse First Boston Mortgage Securities Corp., Series 2004-AR7,
Class 4A1, 2.60%, 11/25/34, Callable 7/25/21 @ 100 (a) (f) | | | 958,030 | | | | 958,030 | | |
GSR Mortgage Loan Trust, Series 2004-15F, Class 5A1, 5.50%, 10/25/20,
Callable 3/25/30 @ 100 (a) | | | 15,579 | | | | 15,409 | | |
JPMorgan Mortgage Trust, Series 2004-S2, Class 1A3, 4.75%, 11/25/34,
Callable 7/25/21 @ 100 (a) | | | 6,680 | | | | 4,828 | | |
JPMorgan Mortgage Trust, Series 2004-S1, Class 1A7, 5.00%, 9/25/34,
Callable 7/25/21 @ 100 (a) | | | 44,062 | | | | 42,011 | | |
JPMorgan Mortgage Trust, Series 2014-5, Class A11, 2.91%, 10/25/29,
Callable 5/25/22 @ 100 (a) (b) (f) | | | 1,933,066 | | | | 1,956,103 | | |
JPMorgan Mortgage Trust, Series 2017-3, Class 2A2, 2.50%, 8/25/47,
Callable 5/25/23 @ 100 (a) (b) (f) | | | 925,503 | | | | 931,560 | | |
Madison Park Funding Ltd., Series 2007-4A, Class AR, 1.38%
(LIBOR03M+120bps), 7/29/30, Callable 7/29/21 @ 100 (a) (b) (c) | | | 2,250,000 | | | | 2,249,994 | | |
Total Residential Mortgage-Backed Securities (Cost $7,386,816) | | | 7,392,593 | | |
Yankee Dollars (11.4%) | |
Communication Services (0.2%): | |
SES SA, 3.60%, 4/4/23 (b) | | | 503,000 | | | | 525,927 | | |
See notes to financial statements.
24
Victory Portfolios
Victory INCORE Low Duration Bond Fund | | Schedule of Portfolio Investments — continued
June 30, 2021 | |
(Unaudited)
| Security Description | | Principal
Amount | | Value | |
Consumer Discretionary (0.9%): | |
Stellantis NV, 5.25%, 4/15/23 | | $ | 2,048,000 | | | $ | 2,208,256 | | |
Consumer Staples (4.0%): | |
Barry Callebaut Services NV, 5.50%, 6/15/23 (b) | | | 2,346,000 | | | | 2,548,190 | | |
Heineken NV, 3.40%, 4/1/22 (b) (e) | | | 1,570,000 | | | | 1,605,152 | | |
Kerry Group Financial Services Unlimited Co., 3.20%, 4/9/23,
Callable 1/9/23 @ 100 (a) (b) | | | 2,391,000 | | | | 2,477,267 | | |
Pernod Ricard SA, 4.25%, 7/15/22 (a) (b) | | | 833,000 | | | | 864,621 | | |
Suntory Holdings Ltd., 2.55%, 6/28/22, Callable 5/28/22 @ 100 (a) (b) (e) | | | 2,122,000 | | | | 2,163,591 | | |
| | | 9,658,821 | | |
Energy (1.5%): | |
Canadian Natural Resources Ltd.
2.95%, 1/15/23, Callable 12/15/22 @ 100 | | | 1,305,000 | | | | 1,352,110 | | |
3.80%, 4/15/24, Callable 1/15/24 @ 100 | | | 1,180,000 | | | | 1,268,311 | | |
Ecopetrol SA, 5.88%, 9/18/23 (a) | | | 846,000 | | | | 916,286 | | |
| | | 3,536,707 | | |
Financials (2.5%): | |
Barclays Bank PLC
2/4/25 (a) | | | 270,000 | | | | 388,028 | | |
2/18/25 | | | 230,000 | | | | 262,809 | | |
Enel Finance International NV, 2.88%, 5/25/22 (a) (b) | | | 1,675,000 | | | | 1,712,068 | | |
NXP BV/NXP Funding LLC, 4.63%, 6/1/23 (b) | | | 3,406,000 | | | | 3,660,122 | | |
| | | 6,023,027 | | |
Industrials (0.7%): | |
Aercap Ireland Capital DAC/AerCap Global Aviation Trust, 1.75%, 1/30/26,
Callable 12/30/25 @ 100 | | | 1,100,000 | | | | 1,087,361 | | |
Sensata Technologies BV, 4.00%, 4/15/29, Callable 4/15/24 @ 102 (b) | | | 606,000 | | | | 615,508 | | |
| | | 1,702,869 | | |
Materials (1.3%): | |
Anglo American Capital PLC, 3.63%, 9/11/24 (b) (e) | | | 2,880,000 | | | | 3,109,421 | | |
Utilities (0.3%): | |
Enel Generacion Chile SA, 4.25%, 4/15/24, Callable 1/15/24 @ 100 (e) | | | 655,000 | | | | 700,974 | | |
Total Yankee Dollars (Cost $27,223,243) | | | 27,466,002 | | |
U.S. Government Mortgage-Backed Agencies (5.5%) | |
Federal Home Loan Mortgage Corp.
5.00%, 6/15/23 – 8/1/40 (a) | | | 613,617 | | | | 697,922 | | |
5.50%, 10/25/23 (a) | | | 2,486 | | | | 2,582 | | |
7.00%, 9/1/38 (a) | | | 3,203 | | | | 3,846 | | |
Series 4320, Class AP, 3.50%, 7/15/39 (a) | | | 928,860 | | | | 989,614 | | |
Series 3713, Class PA, 2.00%, 2/15/40 – 3/15/40 (a) | | | 2,975,602 | | | | 3,041,833 | | |
Series 4444, Class CH, 3.00%, 1/15/41 (a) | | | 809,352 | | | | 821,069 | | |
Series 4049, Class AB, 2.75%, 12/15/41 (a) | | | 293,909 | | | | 298,539 | | |
| | | 5,855,405 | | |
See notes to financial statements.
25
Victory Portfolios
Victory INCORE Low Duration Bond Fund | | Schedule of Portfolio Investments — continued
June 30, 2021 | |
(Unaudited)
| Security Description | | Shares or
Principal
Amount | | Value | |
Federal National Mortgage Association
6.00%, 2/1/37 (a) | | $ | 985,902 | | | $ | 1,155,745 | | |
Series 2013-33, Class UD, 2.50%, 4/25/39 (a) | | | 632,420 | | | | 650,919 | | |
Series 2011-21, Class PA, 4.50%, 5/25/40 (a) | | | 2,102,334 | | | | 2,227,718 | | |
Series 2011-101, Class LA, 3.00%, 10/25/40 (a) | | | 366,812 | | | | 372,087 | | |
5.00%, 2/1/41 – 10/1/41 (a) | | | 2,379,031 | | | | 2,706,305 | | |
Series 2018-29, Class PA, 3.50%, 3/25/44 (a) | | | 305,333 | | | | 307,088 | | |
| | | 7,419,862 | | |
Total U.S. Government Mortgage-Backed Agencies (Cost $12,986,438) | | | 13,275,267 | | |
U.S. Treasury Obligations (13.9%) | |
U.S. Treasury Notes
0.13%, 4/15/22 (a) | | | 6,435,362 | | | | 6,600,928 | | |
0.13%, 6/30/22 (a) | | | 11,526,000 | | | | 11,529,152 | | |
0.13%, 7/15/23 | | | 5,328,000 | | | | 5,314,264 | | |
0.13%, 2/15/24 | | | 10,000,000 | | | | 9,935,937 | | |
Total U.S. Treasury Obligations (Cost $33,258,024) | | | 33,380,281 | | |
Collateral for Securities Loaned^ (4.5%) | |
BlackRock Liquidity Funds TempFund Portfolio, Institutional Class, 0.04% (g) | | | 213,438 | | | | 213,438 | | |
Fidelity Investments Money Market Government Portfolio I Shares, 0.01% (g) | | | 5,781,345 | | | | 5,781,345 | | |
Goldman Sachs Financial Square Prime Obligations Fund, Institutional
Class, 0.02% (g) | | | 106,516 | | | | 106,516 | | |
JPMorgan Prime Money Market Fund, Capital Class, 0.07% (g) | | | 849,326 | | | | 849,326 | | |
Morgan Stanley Institutional Liquidity Prime Portfolio, Institutional
Class, 0.06% (g) | | | 3,818,735 | | | | 3,818,735 | | |
Total Collateral for Securities Loaned (Cost $10,769,360) | | | 10,769,360 | | |
Total Investments (Cost $238,621,145) — 100.7% | | | 242,471,594 | | |
Liabilities in excess of other assets — (0.7)% | | | (1,709,765 | ) | |
NET ASSETS — 100.00% | | $ | 240,761,829 | | |
^ Purchased with cash collateral from securities on loan.
(a) All or a portion of this security has been segregated as collateral for derivative instruments.
(b) Rule 144A security or other security that is restricted as to resale to institutional investors. The Fund's Adviser has deemed this security to be liquid based upon procedures approved by the Board of Trustees. As of June 30, 2021, the fair value of these securities was $50,797,594 and amounted to 21.1% of net assets.
(c) Variable or Floating-Rate Security. Rate disclosed is as of June 30, 2021.
(d) Security is perpetual and has no final maturity date but may be subject to calls at various dates in the future.
(e) All or a portion of this security is on loan.
(f) The rate for certain asset-backed and mortgage-backed securities may vary based on factors relating to the pool of assets underlying the security. The rate disclosed is the rate in effect at June 30, 2021.
(g) Rate disclosed is the daily yield on June 30, 2021.
bps — Basis points
LIBOR — London InterBank Offered Rate
See notes to financial statements.
26
Victory Portfolios
Victory INCORE Low Duration Bond Fund | | Schedule of Portfolio Investments — continued
June 30, 2021 | |
(Unaudited)
LIBOR03M — 3 Month US Dollar LIBOR, rate disclosed as of June 30, 2021, based on the last reset date of the security
LLC — Limited Liability Company
LP — Limited Partnership
MTN — Medium Term Note
PLC — Public Limited Company
SOFR — Secured Overnight Financing Rate
Futures Contracts Purchased
| | Number of
Contracts | | Expiration
Date | | Notional
Amount | | Value | | Unrealized
Appreciation
(Depreciation) | |
Canadian Dollar Futures | | | 29 | | | 9/14/21 | | $ | 2,399,170 | | | $ | 2,337,980 | | | $ | (61,190 | ) | |
Futures Contracts Sold
| | Number of
Contracts | | Expiration
Date | | Notional
Amount | | Value | | Unrealized
Appreciation
(Depreciation) | |
10-Year U.S. Treasury Note Futures | | | 23 | | | 9/21/21 | | $ | 3,025,499 | | | $ | 3,047,500 | | | $ | (22,001 | ) | |
5-Year U.S. Treasury Note Futures | | | 95 | | | 9/30/21 | | | 11,741,886 | | | | 11,725,820 | | | | 16,066 | | |
Japanese Yen Futures | | | 27 | | | 9/13/21 | | | 3,071,251 | | | | 3,039,863 | | | | 31,388 | | |
Mexican Peso Currency Futures | | | 68 | | | 9/13/21 | | | 1,703,399 | | | | 1,689,800 | | | | 13,599 | | |
Ultra Long Term U.S. Treasury
Bond Futures | | | 4 | | | 9/21/21 | | | 733,145 | | | | 770,750 | | | | (37,605 | ) | |
| | | $ | 1,447 | | |
Total unrealized appreciation | | $ | 61,053 | | |
Total unrealized depreciation | | | (120,796 | ) | |
Total net unrealized appreciation (depreciation) | | $ | (59,743 | ) | |
See notes to financial statements.
27
Victory Portfolios
Victory High Yield Fund | | Schedule of Portfolio Investments
June 30, 2021 | |
(Unaudited)
Security Description | | Shares or
Principal
Amount | | Value | |
Common Stocks (1.0%) | |
Communication Services (0.9%): | |
AMC Networks, Inc., Class A (a) (b) | | | 5,800 | | | $ | 387,440 | | |
iHeartMedia, Inc., Class A (a) | | | 30,500 | | | | 821,365 | | |
Nexstar Media Group, Inc., Class A | | | 5,900 | | | | 872,492 | | |
Sinclair Broadcast Group, Inc., Class A (b) | | | 17,500 | | | | 581,350 | | |
| | | | 2,662,647 | | |
Health Care (0.1%): | |
Surgery Partners, Inc. (a) | | | 3,090 | | | | 205,856 | | |
Total Common Stocks (Cost $2,081,723) | | | 2,868,503 | | |
Senior Secured Loans (19.9%) | |
Air Methods Corp., Initial Term Loans, First Lien, 4.50%
(LIBOR03M+350bps), 4/21/24 (c) | | $ | 1,969,231 | | | | 1,938,570 | | |
Alphabet Holding Co., Inc., Initial Term Loan, Second Lien, 7.84%
(LIBOR01M+775bps), 8/15/25 (c) | | | 568,750 | | | | 568,926 | | |
Caesars Resort Collection LLC, Term B-1 Loans, First Lien, 4.59%
(LIBOR01M+450bps), 6/19/25 (c) | | | 1,985,000 | | | | 1,989,963 | | |
Dayco Products LLC, Term Loans, First Lien, 4.39% (LIBOR03M+425bps),
5/19/24 (c) | | | 960,000 | | | | 910,800 | | |
Dynasty Acquisition Co., Inc., 2020 Specified Refi Term B-1 Loans,
First Lien, 3.70% (LIBOR03M+350bps), 4/8/26 (c) | | | 1,535,766 | | | | 1,494,808 | | |
Endo Luxembourg Finance Co. I S.a.r.l., Term B-1, First Lien, 5.75%
(LIBOR01M+500bps), 3/11/28 (c) | | | 1,995,000 | | | | 1,922,063 | | |
Global Medical Response, Inc., 2020 Term Loan, First Lien, 5.75%
(LIBOR06M+475bps), 10/2/25 (c) | | | 997,494 | | | | 1,001,234 | | |
Golden Nugget, Inc., Senior Secured Term Loan, First Lien, 3.25%
(LIBOR02M+250bps), 10/4/23 (c) | | | 1,977,556 | | | | 1,961,577 | | |
Graham Packaging Co., Inc., New Term Loans, First Lien, 3.75%
(LIBOR01M+300bps), 8/4/27 (c) | | | 2,743,125 | | | | 2,739,065 | | |
Great Outdoors Group LLC, Term B-1 Loan, First Lien, 5.00%
(LIBOR03M+425bps), 2/26/28 (c) | | | 2,985,000 | | | | 2,992,463 | | |
Hertz Corp., Term Loan B, First Lien, 6/14/28 (d) (e) | | | 2,524,272 | | | | 2,521,117 | | |
Hertz Corp., Term Loan C, First Lien, 6/14/28 (d) (e) | | | 475,728 | | | | 475,133 | | |
Holley Purchaser, Inc., Initial Term Loan, First Lien, 5.19%
(LIBOR03M+500bps), 10/26/25 (c) | | | 2,666,616 | | | | 2,657,736 | | |
Jo-Ann Stores LLC, Loan, First Lien, 6.00% (LIBOR01M+500bps), 10/16/23 (c) | | | 3,000,000 | | | | 2,995,500 | | |
Jo-Ann Stores LLC, Term Loan B, First Lien, 6/30/28 (d) | | | 3,000,000 | | | | 2,992,500 | | |
Life Time, Inc., 2021 Refinancing Term Loan, First Lien, 5.75%
(LIBOR03M+475bps), 12/15/24 (c) | | | 2,488,747 | | | | 2,494,969 | | |
LifeScan Global Corp., Initial Term Loan, First Lien, 6.20%
(LIBOR03M+600bps), 6/19/24 (c) | | | 2,169,537 | | | | 2,147,841 | | |
Men's Wearhouse, Inc., Term loan, First Lien | | | 31,563 | | | | 41,663 | | |
Navistar, Inc., Tranche B Term Loan, First Lien, 3.60% (LIBOR02M+350bps),
11/6/24 (c) | | | 2,944,669 | | | | 2,944,669 | | |
Petco Health & Wellness Co., Inc., Initial Term Loans, First Lien, 4.00%
(LIBOR03M+325bps), 2/25/28 (c) | | | 3,990,000 | | | | 3,980,743 | | |
PetSmart, Inc., Initial Term Loans, First Lien, 4.50% (LIBOR06M+375bps),
2/12/28 (c) | | | 1,675,000 | | | | 1,675,419 | | |
See notes to financial statements.
28
Victory Portfolios
Victory High Yield Fund | | Schedule of Portfolio Investments — continued
June 30, 2021 | |
(Unaudited)
Security Description | | Principal
Amount | | Value | |
Reynolds Group Holdings, Inc., 2017 Incremental U.S. Term Loans,
First Lien, 2.84% (LIBOR01M+275bps), 2/5/23 (c) | | $ | 1,671,629 | | | $ | 1,667,449 | | |
SIWF Holdings, Inc., Initial Term Loan, Second Lien, 8.59%
(LIBOR01M+850bps), 5/26/26 (c) | | | 1,000,000 | | | | 1,000,630 | | |
Spectacle Gary Holdings LLC, Closing Date Term Loan, First Lien, 11.00%
(LIBOR03M+900bps), 12/23/25 (c) | | | 1,864,865 | | | | 2,028,041 | | |
Spectacle Gary Holdings LLC, Delayed Draw Term Loan Commitment,
First Lien, 11.00% (LIBOR03M+900bps), 12/23/25 (c) | | | 135,135 | | | | 146,959 | | |
SRS Distribution, Inc., 2021 Refinancing Term Loans, First Lien, 4.25%
(LIBOR01M+375bps), 5/20/28 (c) | | | 500,000 | | | | 499,445 | | |
Standard Aero Ltd., 2020 SPCFD Refi Term B-2 Loans, First Lien, 3.70%
(LIBOR03M+350bps), 4/8/26 (c) | | | 825,681 | | | | 803,660 | | |
Stars Group Holdings BV, Term Loan, First Lien, 3.70% (LIBOR03M+350bps),
6/27/25 (c) | | | 870,665 | | | | 870,779 | | |
Team Health Holdings, Inc., Initial Term Loans, First Lien, 3.75%
(LIBOR01M+275bps), 2/6/24 (c) | | | 1,469,309 | | | | 1,423,394 | | |
The Men's Wearhouse LLC, Term Loan, First Lien, 9.00%
(LIBOR01M+800bps), 12/1/25 (c) | | | 1,677,874 | | | | 1,373,759 | | |
The Michaels Cos., Inc., Term B Loans, First Lien, 5.00%
(LIBOR03M+425bps), 4/15/28 (c) | | | 2,500,000 | | | | 2,509,100 | | |
Traverse Midstream Partners LLC, Advance, First Lien, 6.50%
(LIBOR01M+550bps), 9/27/24 (c) | | | 1,963,470 | | | | 1,969,616 | | |
United Airlines, Inc., Class B Term Loans, First Lien, 4.50%
(LIBOR03M+375bps), 4/21/28 (c) | | | 1,496,250 | | | | 1,514,534 | | |
Victoria's Secret & Co., Term B, First Lien, 6/30/28 | | | 900,000 | | | | 893,250 | | |
Total Senior Secured Loans (Cost $58,431,594) | | | 59,147,375 | | |
Corporate Bonds (68.9%) | |
Communication Services (13.7%): | |
AMC Networks, Inc., 4.75%, 8/1/25, Callable 8/9/21 @ 102.38 | | | 3,000,000 | | | | 3,079,350 | | |
Audacy Capital Corp., 6.50%, 5/1/27, Callable 5/1/22 @ 104.88 (b) (f) | | | 2,500,000 | | | | 2,599,250 | | |
CCO Holdings LLC/CCO Holdings Capital Corp., 5.00%, 2/1/28,
Callable 8/1/22 @ 102.5 (f) | | | 1,000,000 | | | | 1,049,260 | | |
Cinemark USA, Inc., 5.25%, 7/15/28, Callable 7/15/24 @ 102.63 (f) (g) | | | 2,600,000 | | | | 2,666,170 | | |
Cumulus Media New Holdings, Inc., 6.75%, 7/1/26, Callable 7/1/22 @ 103.38 (b) (f) | | | 4,210,000 | | | | 4,404,756 | | |
Entercom Media Corp., 6.75%, 3/31/29, Callable 3/31/24 @ 103.38 (f) | | | 1,800,000 | | | | 1,870,866 | | |
Frontier Communications Holdings LLC, 5.00%, 5/1/28,
Callable 5/1/24 @ 102.5 (f) | | | 2,250,000 | | | | 2,327,310 | | |
Gray Television, Inc., 4.75%, 10/15/30, Callable 10/15/25 @ 102.38 (b) (f) | | | 2,750,000 | | | | 2,738,340 | | |
iHeartCommunications, Inc., 8.38%, 5/1/27, Callable 5/1/22 @ 104.19 | | | 4,020,000 | | | | 4,312,776 | | |
Meredith Corp., 6.88%, 2/1/26, Callable 8/9/21 @ 103.44 | | | 2,968,000 | | | | 3,093,517 | | |
Nexstar Broadcasting, Inc., 5.63%, 7/15/27, Callable 7/15/22 @ 104.22 (f) | | | 3,000,000 | | | | 3,190,170 | | |
Sinclair Television Group, Inc., 5.50%, 3/1/30, Callable 12/1/24 @ 102.75 (f) (g) | | | 3,000,000 | | | | 3,056,460 | | |
Sirius XM Radio, Inc., 5.50%, 7/1/29, Callable 7/1/24 @ 102.75 (f) (g) | | | 2,350,000 | | | | 2,560,301 | | |
Univision Communications, Inc.
5.13%, 2/15/25, Callable 7/19/21 @ 101.71 (b) (f) | | | 2,500,000 | | | | 2,550,500 | | |
6.63%, 6/1/27, Callable 6/1/23 @ 103.31 (f) | | | 500,000 | | | | 541,765 | | |
4.50%, 5/1/29, Callable 5/1/24 @ 102.25 (f) | | | 550,000 | | | | 554,136 | | |
| | | | 40,594,927 | | |
See notes to financial statements.
29
Victory Portfolios
Victory High Yield Fund | | Schedule of Portfolio Investments — continued
June 30, 2021 | |
(Unaudited)
Security Description | | Principal
Amount | | Value | |
Consumer Discretionary (16.5%): | |
Academy Ltd., 6.00%, 11/15/27, Callable 11/15/23 @ 103 (f) | | $ | 1,800,000 | | | $ | 1,926,108 | | |
Affinity Gaming, 6.88%, 12/15/27, Callable 12/1/23 @ 103.44 (f) | | | 2,750,000 | | | | 2,923,882 | | |
Ambience Merger Sub, Inc., 7.13%, 7/15/29, Callable 7/15/24 @ 103.56 (e) (f) | | | 1,800,000 | | | | 1,816,254 | | |
Beazer Homes USA, Inc., 5.88%, 10/15/27, Callable 10/15/22 @ 102.94 (b) | | | 2,000,000 | | | | 2,100,860 | | |
Boyd Gaming Corp.
8.63%, 6/1/25, Callable 6/1/22 @ 104.31 (f) | | | 1,700,000 | | | | 1,872,312 | | |
4.75%, 6/15/31, Callable 6/15/26 @ 102.38 (f) | | | 700,000 | | | | 727,748 | | |
Caesars Resort Collection LLC/CRC Finco, Inc., 5.25%, 10/15/25,
Callable 7/19/21 @ 102.63 (f) | | | 2,500,000 | | | | 2,532,175 | | |
Clarios Global LP/Clarios US Finance Co., 8.50%, 5/15/27,
Callable 5/15/22 @ 104.25 (f) | | | 3,000,000 | | | | 3,270,210 | | |
Diamond Sports Group LLC/Diamond Sports Finance Co., 6.63%, 8/15/27,
Callable 8/15/22 @ 103.31 (b) (f) (g) | | | 6,000,000 | | | | 2,942,820 | | |
Ford Motor Co., 9.00%, 4/22/25, Callable 3/22/25 @ 100 (g) | | | 3,000,000 | | | | 3,696,780 | | |
Genting New York LLC/GENNY Capital, Inc., 3.30%, 2/15/26,
Callable 1/15/26 @ 100 (b) (f) | | | 2,750,000 | | | | 2,777,143 | | |
LBM Acquisition LLC, 6.25%, 1/15/29, Callable 1/15/24 @ 103.13 (f) | | | 1,800,000 | | | | 1,813,644 | | |
Life Time, Inc., 5.75%, 1/15/26, Callable 1/15/23 @ 102.88 (f) | | | 1,000,000 | | | | 1,036,180 | | |
Magic Mergeco, Inc., 7.88%, 5/1/29, Callable 5/1/24 @ 103.94 (f) | | | 2,200,000 | | | | 2,266,858 | | |
Mattel, Inc., 5.45%, 11/1/41, Callable 5/1/41 @ 100 | | | 2,000,000 | | | | 2,309,860 | | |
MGM Resorts International, 5.50%, 4/15/27, Callable 1/15/27 @ 100 | | | 2,475,000 | | | | 2,717,352 | | |
PetSmart, Inc./PetSmart Finance Corp., 7.75%, 2/15/29,
Callable 2/15/24 @ 103.88 (f) (g) | | | 2,600,000 | | | | 2,867,696 | | |
Scientific Games International, Inc., 8.25%, 3/15/26, Callable 3/15/22 @ 104.13 (f) | | | 3,000,000 | | | | 3,221,640 | | |
Tenneco, Inc.
5.00%, 7/15/26, Callable 8/9/21 @ 102.5 (b) | | | 2,350,000 | | | | 2,338,062 | | |
7.88%, 1/15/29, Callable 1/15/24 @ 103.94 (f) | | | 650,000 | | | | 734,006 | | |
Viking Cruises Ltd., 13.00%, 5/15/25, Callable 5/15/22 @ 109.75 (f) (g) | | | 2,700,000 | | | | 3,175,308 | | |
| | | | 49,066,898 | | |
Consumer Staples (4.0%): | |
Albertsons Cos., Inc./Safeway, Inc./New Albertsons LP/Albertsons LLC, 5.88%,
2/15/28, Callable 8/15/22 @ 104.41 (f) | | | 2,750,000 | | | | 2,962,905 | | |
Dole Food Co., Inc., 7.25%, 6/15/25, Callable 8/9/21 @ 101.81 (f) | | | 3,000,000 | | | | 3,060,510 | | |
Simmons Foods, Inc./Simmons prepared Foods, Inc./Simmons Pet Food, Inc./
Simmons Feed, 4.63%, 3/1/29, Callable 3/1/24 @ 102.31 (f) | | | 2,950,000 | | | | 2,977,730 | | |
Triton Water Holdings, Inc., 6.25%, 4/1/29, Callable 4/1/24 @ 103.13 (f) | | | 2,800,000 | | | | 2,819,404 | | |
| | | | 11,820,549 | | |
Energy (3.2%): | |
Antero Midstream Partners LP/Antero Midstream Finance Corp.,
5.38%, 6/15/29, Callable 6/15/24 @ 102.69 (f) | | | 950,000 | | | | 992,104 | | |
Antero Resources Corp.
8.38%, 7/15/26, Callable 1/15/24 @ 104.19 (f) | | | 3,000,000 | | | | 3,411,570 | | |
7.63%, 2/1/29, Callable 2/1/24 @ 103.81 (f) | | | 900,000 | | | | 1,000,728 | | |
5.38%, 3/1/30, Callable 3/1/25 @ 102.69 (f) | | | 500,000 | | | | 510,250 | | |
Comstock Resources, Inc., 6.75%, 3/1/29, Callable 3/1/24 @ 103.38 (f) | | | 900,000 | | | | 958,626 | | |
Occidental Petroleum Corp., 5.50%, 12/1/25, Callable 9/1/25 @ 100 | | | 950,000 | | | | 1,049,693 | | |
Range Resources Corp., 5.00%, 3/15/23, Callable 12/15/22 @ 100 | | | 1,350,000 | | | | 1,404,635 | | |
| | | | 9,327,606 | | |
See notes to financial statements.
30
Victory Portfolios
Victory High Yield Fund | | Schedule of Portfolio Investments — continued
June 30, 2021 | |
(Unaudited)
Security Description | | Principal
Amount | | Value | |
Financials (6.0%): | |
BCPE Cycle Merger Sub II, Inc., 10.63%, 7/15/27, Callable 7/15/22 @ 105.31 (f) | | $ | 3,000,000 | | | $ | 3,144,300 | | |
BCPE Ulysses Intermediate, Inc. PIK, 7.75%, 4/1/27,
Callable 4/1/23 @ 102 (f) (h) | | | 450,000 | | | | 461,754 | | |
Compass Group Diversified Holdings LLC, 5.25%, 4/15/29,
Callable 4/15/24 @ 102.63 (f) | | | 1,200,000 | | | | 1,249,200 | | |
Gray Television, Inc., 7.00%, 5/15/27, Callable 5/15/22 @ 105.25 (f) | | | 3,000,000 | | | | 3,256,950 | | |
LABL Escrow Issuer LLC, 10.50%, 7/15/27, Callable 7/15/22 @ 105.25 (f) (g) | | | 2,250,000 | | | | 2,478,555 | | |
Resideo Funding, Inc., 6.13%, 11/1/26, Callable 11/1/21 @ 104.59 (f) | | | 1,300,000 | | | | 1,371,175 | | |
Victors Merger Corp., 6.38%, 5/15/29, Callable 5/15/24 @ 103.19 (f) | | | 1,800,000 | | | | 1,814,184 | | |
White Capital Parent LLC PIK, 8.25%, 3/15/26, Callable 3/15/22 @ 102 (f) (h) | | | 2,100,000 | | | | 2,172,786 | | |
Wolverine Escrow LLC, 13.13%, 11/15/27, Callable 11/15/22 @ 109.84 (b) (f) | | | 2,200,000 | | | | 1,854,732 | | |
| | | | 17,803,636 | | |
Health Care (7.1%): | |
Air Methods Corp., 8.00%, 5/15/25, Callable 8/9/21 @ 102 (f) (g) | | | 2,500,000 | | | | 2,362,550 | | |
Bausch Health Cos., Inc.
4.88%, 6/1/28, Callable 6/1/24 @ 102.44 (f) | | | 500,000 | | | | 511,330 | | |
5.25%, 1/30/30, Callable 1/30/25 @ 102.63 (f) (g) | | | 250,000 | | | | 233,245 | | |
CHS/Community Health Systems, Inc., 6.13%, 4/1/30,
Callable 4/1/25 @ 103.06 (f) | | | 1,450,000 | | | | 1,471,721 | | |
Ortho-Clinical Diagnostics, Inc./Ortho-Clinical Diagnostics SA, 7.25%,
2/1/28, Callable 2/1/23 @ 103.63 (f) | | | 1,796,000 | | | | 1,963,710 | | |
Radiology Partners, Inc., 9.25%, 2/1/28, Callable 2/1/23 @ 104.63 (f) (g) | | | 2,500,000 | | | | 2,770,675 | | |
Regional Care Hospital Partners Holdings, Inc./LifePoint Health, Inc., 9.75%,
12/1/26, Callable 12/1/21 @ 104.88 (f) | | | 3,000,000 | | | | 3,231,360 | | |
Surgery Center Holdings, Inc., 10.00%, 4/15/27, Callable 4/15/22 @ 105 (b) (f) | | | 2,500,000 | | | | 2,745,700 | | |
Team Health Holdings, Inc., 6.38%, 2/1/25, Callable 7/23/21 @ 101.59 (f) | | | 2,750,000 | | | | 2,617,670 | | |
Tenet Healthcare Corp., 6.13%, 10/1/28, Callable 10/1/23 @ 103.06 (f) | | | 3,000,000 | | | | 3,192,180 | | |
| | | | 21,100,141 | | |
Industrials (11.6%): | |
Ahern Rentals, Inc., 7.38%, 5/15/23, Callable 8/9/21 @ 100 (b) (f) | | | 2,000,000 | | | | 1,812,280 | | |
American Airlines, Inc., 11.75%, 7/15/25 (f) | | | 3,000,000 | | | | 3,764,430 | | |
American Airlines, Inc./AAdvantage Loyalty IP Ltd.
5.50%, 4/20/26 (f) | | | 1,300,000 | | | | 1,380,132 | | |
5.75%, 4/20/29 (f) | | | 1,850,000 | | | | 2,000,627 | | |
Apex Tool Group LLC/BC Mountain Finance, Inc., 9.00%, 2/15/23,
Callable 8/9/21 @ 100 (b) (f) | | | 2,000,000 | | | | 2,009,400 | | |
Aramark Services, Inc., 6.38%, 5/1/25, Callable 5/1/22 @ 103.19 (f) | | | 3,000,000 | | | | 3,186,810 | | |
Cargo Aircraft Management, Inc., 4.75%, 2/1/28, Callable 2/1/23 @ 102.38 (f) | | | 1,800,000 | | | | 1,843,038 | | |
Hillenbrand, Inc., 3.75%, 3/1/31, Callable 3/1/26 @ 101.88 | | | 800,000 | | | | 794,000 | | |
Madison IAQ LLC
4.13%, 6/30/28, Callable 6/30/24 @ 102.06 (f) | | | 1,800,000 | | | | 1,817,694 | | |
5.88%, 6/30/29, Callable 6/30/24 @ 102.94 (f) | | | 1,800,000 | | | | 1,831,608 | | |
Mileage Plus Holdings LLC/Mileage Plus Intellectual Property Assets Ltd.,
6.50%, 6/20/27, Callable 6/30/23 @ 103.25 (f) | | | 3,000,000 | | | | 3,303,030 | | |
NESCO Holdings II, Inc., 5.50%, 4/15/29, Callable 4/15/24 @ 102.75 (f) | | | 2,050,000 | | | | 2,139,236 | | |
Pike Corp., 5.50%, 9/1/28, Callable 9/1/23 @ 102.75 (f) | | | 2,000,000 | | | | 2,079,240 | | |
SRS Distribution, Inc., 6.13%, 7/1/29, Callable 7/1/24 @ 103.06 (f) | | | 1,125,000 | | | | 1,160,460 | | |
TransDigm, Inc., 4.63%, 1/15/29, Callable 1/15/24 @ 102.31 (f) | | | 1,250,000 | | | | 1,253,850 | | |
See notes to financial statements.
31
Victory Portfolios
Victory High Yield Fund | | Schedule of Portfolio Investments — continued
June 30, 2021 | |
(Unaudited)
Security Description | | Principal
Amount | | Value | |
Triumph Group, Inc., 6.25%, 9/15/24, Callable 8/9/21 @ 103.13 (f) | | $ | 1,525,000 | | | $ | 1,548,424 | | |
WESCO Distribution, Inc., 7.25%, 6/15/28, Callable 6/15/23 @ 103.63 (f) | | | 2,250,000 | | | | 2,505,555 | | |
| | | | 34,429,814 | | |
Information Technology (1.5%): | |
Caesars Entertainment, Inc., 8.13%, 7/1/27, Callable 7/1/23 @ 104.06 (f) | | | 2,250,000 | | | | 2,503,868 | | |
Veritas U.S., Inc./Veritas Bermuda Ltd., 7.50%, 9/1/25,
Callable 9/1/21 @ 103.75 (f) | | | 1,800,000 | | | | 1,873,674 | | |
| | | | 4,377,542 | | |
Materials (3.8%): | |
Ardagh Packaging Finance PLC/Ardagh Holdings USA, Inc., 5.25%, 8/15/27,
Callable 8/15/22 @ 102.63 (f) | | | 3,000,000 | | | | 3,063,270 | | |
CVR Partners LP/CVR Nitrogen Finance Corp., 6.13%, 6/15/28,
Callable 6/15/24 @ 103.06 (b) (f) | | | 1,800,000 | | | | 1,844,622 | | |
Forterra Finance LLC/FRTA Finance Corp., 6.50%, 7/15/25,
Callable 7/15/22 @ 103.25 (f) | | | 1,200,000 | | | | 1,294,428 | | |
Greif, Inc., 6.50%, 3/1/27, Callable 3/1/22 @ 103.25 (f) | | | 2,000,000 | | | | 2,106,740 | | |
Plastipak Holdings, Inc., 6.25%, 10/15/25, Callable 8/9/21 @ 103.13 (b) (f) | | | 3,000,000 | | | | 3,067,500 | | |
| | | | 11,376,560 | | |
Real Estate (1.2%): | |
Adams Homes, Inc., 7.50%, 2/15/25, Callable 2/15/22 @ 103.75 (f) | | | 3,371,000 | | | | 3,534,325 | | |
Utilities (0.3%): | |
Vistra Operations Co. LLC, 4.38%, 5/1/29, Callable 5/1/24 @ 102.19 (f) | | | 900,000 | | | | 904,752 | | |
Total Corporate Bonds (Cost $195,153,812) | | | 204,336,750 | | |
Yankee Dollars (7.4%) | |
Consumer Discretionary (1.4%): | |
1011778 BC ULC/New Red Finance, Inc., 4.38%, 1/15/28, Callable
11/15/22 @ 102.19 (f) | | | 2,000,000 | | | | 2,029,760 | | |
International Game Technology PLC, 5.25%, 1/15/29,
Callable 1/15/24 @ 102.63 (f) | | | 2,000,000 | | | | 2,144,880 | | |
| | | | 4,174,640 | | |
Energy (1.3%): | |
Husky Holding Ltd. PIK, 13.00%, 2/15/25, Callable 8/9/21 @ 109.75 (b) (f) (g) (h) | | | 500,000 | | | | 542,365 | | |
TechnipFMC PLC, 6.50%, 2/1/26, Callable 2/1/23 @ 103.25 (f) | | | 3,000,000 | | | | 3,236,460 | | |
| | | | 3,778,825 | | |
Financials (0.4%): | |
Intelsat Jackson Holdings SA, 8.50%, 10/15/24,
Callable 8/9/21 @ 106.38 (b) (f) (i) | | | 2,000,000 | | | | 1,175,980 | | |
Health Care (1.0%): | |
Bausch Health Cos., Inc., 6.13%, 4/15/25, Callable 8/9/21 @ 102.04 (f) | | | 2,908,000 | | | | 2,979,769 | | |
Industrials (1.8%): | |
Algeco Global Finance 2 PLC, 10.00%, 8/15/23, Callable 7/19/21 @ 102.5 (f) (g) | | | 2,200,000 | | | | 2,282,456 | | |
Bombardier, Inc., 7.88%, 4/15/27, Callable 4/15/22 @ 103.94 (f) | | | 3,000,000 | | | | 3,109,920 | | |
| | | | 5,392,376 | | |
See notes to financial statements.
32
Victory Portfolios
Victory High Yield Fund | | Schedule of Portfolio Investments — continued
June 30, 2021 | |
(Unaudited)
Security Description | | Shares or
Principal
Amount | | Value | |
Information Technology (0.5%): | |
ION Trading Technologies Sarl, 5.75%, 5/15/28, Callable 5/15/24 @ 102.88 (f) | | $ | 1,500,000 | | | $ | 1,558,170 | | |
Materials (1.0%): | |
Titan Acquisition Ltd./Titan Co-Borrower LLC, 7.75%, 4/15/26,
Callable 8/9/21 @ 103.88 (f) (g) | | | 2,000,000 | | | | 2,073,580 | | |
Trinseo Materials Operating SCA/Trinseo Materials Finance, Inc.,
5.13%, 4/1/29, Callable 4/1/24 @ 102.56 (f) | | | 900,000 | | | | 919,188 | | |
| | | | 2,992,768 | | |
Total Yankee Dollars (Cost $21,525,673) | | | 22,052,528 | | |
Collateral for Securities Loaned^ (8.2%) | |
BlackRock Liquidity Funds TempFund Portfolio, Institutional Class, 0.04% (j) | | | 485,114 | | | | 485,114 | | |
Fidelity Investments Money Market Government Portfolio I Shares, 0.01% (j) | | | 13,140,170 | | | | 13,140,170 | | |
Goldman Sachs Financial Square Prime Obligations Fund,
Institutional Class, 0.02% (j) | | | 242,096 | | | | 242,096 | | |
JPMorgan Prime Money Market Fund, Capital Class, 0.07% (j) | | | 1,930,397 | | | | 1,930,397 | | |
Morgan Stanley Institutional Liquidity Prime Portfolio, Institutional
Class, 0.06% (j) | | | 8,679,439 | | | | 8,679,439 | | |
Total Collateral for Securities Loaned (Cost $24,477,216) | | | 24,477,216 | | |
Total Investments (Cost $301,670,018) — 105.4% | | | 312,882,372 | | |
Liabilities in excess of other assets — (5.4)% | | | (16,056,038 | ) | |
NET ASSETS — 100.00% | | $ | 296,826,334 | | |
^ Purchased with cash collateral from securities on loan.
(a) Non-income producing security.
(b) All or a portion of this security is on loan.
(c) Variable or Floating-Rate Security. Rate disclosed is as of June 30, 2021.
(d) The rates for this senior secured loan will be known on settlement date of the loan, subsequent to this report date. Senior secured loans have rates that will fluctuate over time in line with prevailing interest rates.
(e) Security or a portion of the security purchased on a delayed-delivery and/or when-issued basis.
(f) Rule 144A security or other security that is restricted as to resale to institutional investors. The Fund's Adviser has deemed this security to be liquid based upon procedures approved by the Board of Trustees. As of June 30, 2021, the fair value of these securities was $199,492,393 and amounted to 67.2% of net assets.
(g) All or a portion of the security has been segregated as collateral for securities purchased on a when-issued basis.
(h) All of the coupon is paid in kind.
(i) Defaulted security.
(j) Rate disclosed is the daily yield on June 30, 2021.
bps — Basis points
LIBOR — London InterBank Offered Rate
LIBOR01M — 1 Month US Dollar LIBOR, rate disclosed as of June 30, 2021, based on the last reset date of the security
See notes to financial statements.
33
Victory Portfolios
Victory High Yield Fund | | Schedule of Portfolio Investments — continued
June 30, 2021 | |
(Unaudited)
LIBOR02M — 2 Month US Dollar LIBOR, rate disclosed as of June 30, 2021, based on the last reset date of the security
LIBOR03M — 3 Month US Dollar LIBOR, rate disclosed as of June 30, 2021, based on the last reset date of the security
LIBOR06M — 6 Month US Dollar LIBOR, rate disclosed as of June 30, 2021, based on the last reset date of the security
LLC — Limited Liability Company
LP — Limited Partnership
PIK — Payment-in-Kind
PLC — Public Limited Company
ULC — Unlimited Liability Co.
See notes to financial statements.
34
Victory Portfolios
Victory Tax-Exempt Fund | | Schedule of Portfolio Investments
June 30, 2021 | |
(Unaudited)
Security Description | | Principal
Amount | | Value | |
Municipal Bonds (99.4%) | |
Alabama (0.9%): | |
Columbia Industrial Development Board Revenue, Series C, 0.04%,
12/1/37, Continuously Callable @ 100 (a) | | $ | 300,000 | | | $ | 300,000 | | |
Columbia Industrial Development Board Revenue (NBGA — Southern Co.),
Series A, 0.03%, 12/1/37, Continuously Callable @ 100 (a) | | | 200,000 | | | | 200,000 | | |
| | | | 500,000 | | |
Arkansas (2.0%): | |
Arkansas Development Finance Authority Revenue Bonds, 3.20%, 12/1/49,
Continuously Callable @ 100 | | | 750,000 | | | | 802,432 | | |
University of Central Arkansas Revenue Bonds, Series A, 3.00%, 11/1/49,
Continuously Callable @ 100 | | | 265,000 | | | | 279,257 | | |
| | | | 1,081,689 | | |
California (2.9%): | |
Golden State Tobacco Securitization Corp. Revenue Bonds, Series A2, 5.00%,
6/1/47, Continuously Callable @ 100 | | | 1,500,000 | | | | 1,553,490 | | |
Colorado (1.6%): | |
Colorado Health Facilities Authority Revenue, Series A, 4.00%, 12/1/50,
Continuously Callable @ 103 | | | 750,000 | | | | 853,118 | | |
Connecticut (4.5%): | |
Connecticut Health and Educational Facilities Authority Revenue Bonds,
Series 2016 CT, 5.00%, 12/1/41, Continuously Callable @ 100 | | | 2,000,000 | | | | 2,376,500 | | |
Florida (9.6%): | |
Capital Trust Agency, Inc. Revenue Bonds, 5.00%, 8/1/55, Continuously
Callable @ 100 | | | 400,000 | | | | 462,472 | | |
City of Jacksonville Revenue Bonds, 0.03%, 5/1/29, Continuously
Callable @ 100 (a) | | | 100,000 | | | | 100,000 | | |
City of Pompano Beach Revenue, 4.00%, 9/1/50, Continuously
Callable @ 103 | | | 500,000 | | | | 535,865 | | |
Florida Development Finance Corp. Revenue, Series A, 5.00%, 6/15/55,
Continuously Callable @ 100 (b) | | | 500,000 | | | | 569,380 | | |
Hillsborough County IDA Revenue Bonds, 4.00%, 8/1/50, Continuously
Callable @ 100 | | | 500,000 | | | | 584,250 | | |
Miami-Dade County Public Facilities Revenue Bonds, Series A, 5.00%,
6/1/33, Continuously Callable @ 100 | | | 2,000,000 | | | | 2,328,200 | | |
St. Johns County IDA Revenue, 4.00%, 8/1/55, Continuously Callable @ 103 | | | 500,000 | | | | 541,785 | | |
| | | | 5,121,952 | | |
Georgia (0.9%): | |
Appling County Development Authority Revenue, 0.06%, 9/1/41,
Continuously Callable @ 100 (a) | | | 400,000 | | | | 400,000 | | |
The Development Authority of Monroe County Revenue, 0.06%, 11/1/48,
Continuously Callable @ 100 (a) | | | 100,000 | | | | 100,000 | | |
| | | | 500,000 | | |
Guam (2.2%): | |
Port Authority of Guam Revenue, Series A, 5.00%, 7/1/48, Continuously
Callable @ 100 | | | 1,000,000 | | | | 1,174,760 | | |
See notes to financial statements.
35
Victory Portfolios
Victory Tax-Exempt Fund | | Schedule of Portfolio Investments — continued
June 30, 2021 | |
(Unaudited)
Security Description | | Principal
Amount | | Value | |
Illinois (25.1%): | |
Chicago Board of Education Revenue Bonds, 6.00%, 4/1/46, Continuously
Callable @ 100 | | $ | 2,275,000 | | | $ | 2,831,965 | | |
Chicago General Obligation Refunding Bonds, Series A, 5.75%, 1/1/33,
Continuously Callable @ 100 | | | 1,000,000 | | | | 1,234,470 | | |
Chicago Transit Authority Sales Tax Receipts Revenue Bonds,
Series 2014, 5.00%, 12/1/44, Continuously Callable @ 100 | | | 1,450,000 | | | | 1,640,994 | | |
City of Chicago General Obligation Bonds, Series A, 5.50%, 1/1/49,
Continuously Callable @ 100 | | | 1,000,000 | | | | 1,247,270 | | |
City of Chicago Wastewater Transmission Revenue
Series A, 5.00%, 1/1/47, Continuously Callable @ 100 | | | 1,000,000 | | | | 1,201,270 | | |
Series C, 5.00%, 1/1/34, Continuously Callable @ 100 | | | 1,000,000 | | | | 1,144,770 | | |
Illinois General Obligation Bonds, Series 2013, 5.50%, 7/1/27, Continuously
Callable @ 100 | | | 2,000,000 | | | | 2,183,640 | | |
Sales Tax Securitization Corp. Revenue Bonds, Series 2018 C, 5.00%,
1/1/43, Continuously Callable @ 100 | | | 1,500,000 | | | | 1,850,475 | | |
| | | | 13,334,854 | | |
Iowa (1.0%): | |
Iowa Finance Authority Revenue Bonds, Series A-1, 4.00%, 5/15/55,
Continuously Callable @ 103 | | | 500,000 | | | | 543,685 | | |
Massachusetts (1.8%): | |
University of Massachusetts Building Authority Revenue Bonds
5.00%, 11/1/39, Pre-refunded 11/1/24 @ 100 | | | 220,000 | | | | 253,974 | | |
Series 1-2021, 5.00%, 11/1/39, Pre-refunded 11/1/24 @ 100 | | | 190,000 | | | | 219,342 | | |
Series 1-2021, 5.00%, 11/1/39, Continuously Callable @ 100 | | | 410,000 | | | | 467,269 | | |
| | | | 940,585 | | |
Missouri (2.5%): | |
Health & Educational Facilities Authority of the State of Missouri Revenue
Bonds, 4.25%, 12/1/42, Continuously Callable @ 100 (b) | | | 1,150,000 | | | | 1,317,256 | | |
New Jersey (8.0%): | |
New Jersey Economic Development Authority Biomedical Research
Facilities Revenue Bonds, Series 2016 A, 5.00%, 7/15/29, Continuously
Callable @ 100 | | | 885,000 | | | | 1,062,195 | | |
New Jersey Transportation Trust Fund Authority Revenue Bonds
5.00%, 6/15/28, Continuously Callable @ 100 | | | 1,000,000 | | | | 1,182,590 | | |
Series BB, 3.50%, 6/15/46, Continuously Callable @ 100 | | | 200,000 | | | | 217,610 | | |
Tobacco Settlement Financing Corp. Revenue Bonds, Series 2018 A, 5.00%,
6/1/46, Continuously Callable @ 100 | | | 1,500,000 | | | | 1,795,785 | | |
| | | | 4,258,180 | | |
New York (12.3%): | |
Metropolitan Transportation Authority Dedicated Tax Green Fund Revenue
Bonds, Series 2016 B1, 5.00%, 11/15/56, Continuously Callable @ 100 | | | 1,545,000 | | | | 1,826,314 | | |
Metropolitan Transportation Authority Revenue, Series D-3, 4.00%,
11/15/49, Continuously Callable @ 100 | | | 500,000 | | | | 583,620 | | |
New York Counties Tobacco Trust II Revenue Bonds, 5.75%, 6/1/43,
Continuously Callable @ 100 | | | 200,000 | | | | 200,810 | | |
New York State Dormitory Authority Revenue, 6.00%, 7/1/40, Continuously
Callable @ 100 (c) | | | 500,000 | | | | 505,365 | | |
See notes to financial statements.
36
Victory Portfolios
Victory Tax-Exempt Fund | | Schedule of Portfolio Investments — continued
June 30, 2021 | |
(Unaudited)
Security Description | | Principal
Amount | | Value | |
Port Authority of New York & New Jersey Revenue Bonds, 5.00%, 12/1/32,
Continuously Callable @ 100 | | $ | 1,000,000 | | | $ | 1,105,330 | | |
TSASC, Inc. Revenue, Series A, 5.00%, 6/1/41, Continuously Callable @ 100 | | | 2,000,000 | | | | 2,324,200 | | |
| | | | 6,545,639 | | |
North Carolina (5.4%): | |
City of Charlotte Certificate of Participation, 4.00%, 6/1/49, Continuously
Callable @ 100 | | | 1,670,000 | | | | 1,934,895 | | |
North Carolina Medical Care Commission Revenue, Series A, 4.00%, 10/1/50,
Continuously Callable @ 103 | | | 350,000 | | | | 389,750 | | |
North Carolina Medical Care Commission Revenue Bonds, Series A, 4.00%,
9/1/50, Continuously Callable @ 100 | | | 500,000 | | | | 529,095 | | |
| | | | 2,853,740 | | |
Ohio (7.3%): | |
Buckeye Tobacco Settlement Financing Authority Revenue Bonds,
Series B-2, 5.00%, 6/1/55, Continuously Callable @ 100 | | | 1,000,000 | | | | 1,169,640 | | |
County of Franklin Revenue, Series B, 5.00%, 7/1/45, Continuously
Callable @ 103 | | | 500,000 | | | | 601,260 | | |
County of Hardin Economic Development Facilities Revenue Bonds, 5.00%,
5/1/30, Continuously Callable @ 103 | | | 350,000 | | | | 381,153 | | |
Logan Elm Local School District General Obligation Bonds, 4.00%, 11/1/55,
Continuously Callable @ 100 | | | 1,500,000 | | | | 1,717,065 | | |
| | | | 3,869,118 | | |
Pennsylvania (5.2%): | |
Philadelphia School District, GO, Series A, 5.00%, 9/1/44, Continuously
Callable @ 100 | | | 1,000,000 | | | | 1,259,740 | | |
The Philadelphia School District General Obligation Bonds, Series A, 5.00%,
9/1/38, Continuously Callable @ 100 | | | 1,200,000 | | | | 1,494,636 | | |
| | | | 2,754,376 | | |
Texas (2.8%): | |
New Hope Cultural Education Facilities Finance Corp. Revenue, 5.00%,
7/1/47, Continuously Callable @ 102 | | | 500,000 | | | | 448,160 | | |
Port of Port Arthur Navigation District Revenue
Series A, 0.06%, 4/1/40, Continuously Callable @ 100 (a) | | | 730,000 | | | | 730,000 | | |
Series B, 0.06%, 4/1/40, Continuously Callable @ 100 (a) | | | 300,000 | | | | 300,000 | | |
| | | | 1,478,160 | | |
Utah (3.4%): | |
Jordanelle Special Service District Special Assessment, Series C, 12.00%,
8/1/30, Continuously Callable @ 100 (b) | | | 600,000 | | | | 602,316 | | |
Utah Infrastructure Agency Revenue Bonds, Series A, 5.00%, 10/15/40,
Continuously Callable @ 100 | | | 1,000,000 | | | | 1,186,370 | | |
| | | | 1,788,686 | | |
Total Municipal Bonds (Cost $47,714,696) | | | 52,845,788 | | |
Total Investments (Cost $47,714,696) — 99.4% | | | 52,845,788 | | |
Other assets in excess of liabilities — 0.6% | | | 302,609 | | |
NET ASSETS — 100.00% | | $ | 53,148,397 | | |
See notes to financial statements.
37
Victory Portfolios
Victory Tax-Exempt Fund | | Schedule of Portfolio Investments — continued
June 30, 2021 | |
(Unaudited)
(a) Variable Rate Demand Notes that provide the rights to sell the security at face value on either that day or within the rate-reset period. The interest rate is reset on the put date at a stipulated daily, weekly, monthly, quarterly, or other specified time interval to reflect current market conditions. These securities do not indicate a reference rate and spread in their description.
(b) Rule 144A security or other security that is restricted as to resale to institutional investors. The Fund's Adviser has deemed this security to be liquid based upon procedures approved by the Board of Trustees. As of June 30, 2021, the fair value of these securities was $2,488,952 and amounted to 4.7% of net assets.
(c) Rule 144A security or other security that is restricted as to resale to institutional investors. The Fund's Adviser has deemed this security to be illiquid based upon procedures approved by the Board of Trustees. As of June 30, 2021, the fair value of these securities was $505,365 and amounted to 1.0% of net assets.
GO — General Obligation
IDA — Industrial Development Authority
See notes to financial statements.
38
Victory Portfolios
Victory High Income Municipal Bond Fund | | Schedule of Portfolio Investments
June 30, 2021 | |
(Unaudited)
Security Description | | Principal
Amount | | Value | |
Municipal Bonds (94.1%) | |
Arizona (2.1%): | |
Arizona IDA Revenue Bonds, 4.00%, 12/15/51, Continuously Callable @ 100 (a) | | $ | 700,000 | | | $ | 753,487 | | |
La Paz County IDA Revenue Bonds, 4.00%, 2/15/51, Continuously
Callable @ 100 | | | 280,000 | | | | 314,840 | | |
| | | | 1,068,327 | | |
California (2.7%): | |
California County Tobacco Securitization Agency Revenue Bonds,
Series B-1, 5.00%, 6/1/49, Continuously Callable @ 100 | | | 250,000 | | | | 310,320 | | |
Golden State Tobacco Securitization Corp. Revenue Bonds, Series A2, 5.00%,
6/1/47, Continuously Callable @ 100 | | | 1,000,000 | | | | 1,035,660 | | |
| | | | 1,345,980 | | |
District of Columbia (1.0%): | |
District of Columbia Tobacco Settlement Financing Corp. Revenue Bonds,
6.50%, 5/15/33 | | | 460,000 | | | | 512,895 | | |
Florida (5.7%): | |
Escambia County Health Facilities Authority Revenue Bonds, 3.00%, 8/15/50,
Continuously Callable @ 100 | | | 1,000,000 | | | | 1,038,630 | | |
Florida Development Finance Corp. Revenue, 4.00%, 7/1/55, Continuously
Callable @ 100 | | | 500,000 | | | | 527,755 | | |
Sumter County Village Community Development District No. 10 Special
Assessment Revenue Bonds, Series 2014, 5.75%, 5/1/31, Continuously
Callable @ 100 | | | 1,225,000 | | | | 1,311,583 | | |
| | | | 2,877,968 | | |
Georgia (2.5%): | |
The Burke County Development Authority Revenue, Series 1, 0.04%, 7/1/49,
Continuously Callable @ 100 (b) | | | 1,035,000 | | | | 1,035,000 | | |
The Burke County Development Authority Revenue (NBGA — Southern Co.),
0.06%, 11/1/52, Continuously Callable @ 100 (b) | | | 200,000 | | | | 200,000 | | |
| | | | 1,235,000 | | |
Illinois (14.3%): | |
Chicago Board of Education Revenue Bonds, 6.00%, 4/1/46, Continuously
Callable @ 100 | | | 1,500,000 | | | | 1,867,230 | | |
Chicago General Obligation Refunding Bonds, Series 2015 C, 5.00%, 1/1/38,
Continuously Callable @ 100 | | | 1,000,000 | | | | 1,144,840 | | |
City of Chicago General Obligation Bonds, Series A, 5.50%, 1/1/49,
Continuously Callable @ 100 | | | 1,000,000 | | | | 1,247,270 | | |
Illinois Finance Authority Revenue Bonds, 4.75%, 10/15/40,
(Put Date 8/01/30) (a) (c) | | | 500,000 | | | | 532,275 | | |
Illinois General Obligation Bonds
5.50%, 7/1/33, Continuously Callable @ 100 | | | 1,000,000 | | | | 1,084,800 | | |
5.50%, 7/1/38, Continuously Callable @ 100 | | | 1,250,000 | | | | 1,350,825 | | |
| | | | 7,227,240 | | |
Indiana (3.3%): | |
Indiana Finance Authority Revenue Bonds
4.13%, 12/1/26 | | | 1,000,000 | | | | 1,091,180 | | |
See notes to financial statements.
39
Victory Portfolios
Victory High Income Municipal Bond Fund | | Schedule of Portfolio Investments — continued
June 30, 2021 | |
(Unaudited)
Security Description | | Principal
Amount | | Value | |
Series A, 5.00%, 7/1/55, Continuously Callable @ 100 | | $ | 500,000 | | | $ | 569,825 | | |
| | | | 1,661,005 | | |
Iowa (2.2%): | |
Iowa Finance Authority Revenue Bonds
Series A, 5.00%, 5/15/48, Continuously Callable @ 100 | | | 500,000 | | | | 570,085 | | |
Series A-1, 4.00%, 5/15/55, Continuously Callable @ 103 | | | 500,000 | | | | 543,685 | | |
| | | | 1,113,770 | | |
Maryland (0.5%): | |
Maryland Economic Development Corp. Revenue Bonds, 4.25%, 7/1/50,
Continuously Callable @ 100 | | | 200,000 | | | | 233,826 | | |
Massachusetts (2.6%): | |
Massachusetts Development Finance Agency Revenue, 4.00%, 10/1/32,
Continuously Callable @ 105 (a) | | | 300,000 | | | | 326,604 | | |
Massachusetts Educational Financing Authority, Education Loan
Revenue Bonds, Issue J
Series 2011, 5.63%, 7/1/28, Continuously Callable @ 100 | | | 275,000 | | | | 275,283 | | |
Series 2011, 5.63%, 7/1/29, Continuously Callable @ 100 | | | 560,000 | | | | 560,577 | | |
Series 2011, 5.63%, 7/1/33, Continuously Callable @ 100 | | | 140,000 | | | | 140,144 | | |
| | | | 1,302,608 | | |
Minnesota (0.9%): | |
City of Woodbury Revenue Bonds, 4.00%, 7/1/51, Continuously Callable @ 103 | | | 400,000 | | | | 435,408 | | |
Missouri (1.1%): | |
Health & Educational Facilities Authority of the State of Missouri Revenue
Bonds, 4.25%, 12/1/42, Continuously Callable @ 100 (a) | | | 500,000 | | | | 572,720 | | |
New Hampshire (2.7%): | |
New Hampshire Business Finance Authority Revenue, 4.00%, 1/1/51,
Continuously Callable @ 103 | | | 500,000 | | | | 546,860 | | |
New Hampshire Business Finance Authority Revenue Bonds, Series B, 3.75%,
7/1/45, (Put Date 7/02/40) (a) (c) | | | 750,000 | | | | 796,448 | | |
| | | | 1,343,308 | | |
New Jersey (6.7%): | |
New Jersey Economic Development Authority Revenue Bonds, Series S,
4.00%, 6/15/50, Continuously Callable @ 100 | | | 450,000 | | | | 525,681 | | |
New Jersey Economic Development Authority School Facilities Construction
Revenue Bonds, Series 2015 WW, 5.25%, 6/15/32, Continuously
Callable @ 100 | | | 1,000,000 | | | | 1,163,490 | | |
New Jersey Economic Development Motor Vehicle Surcharges Subordinate
Revenue Bonds, Series A, 5.00%, 7/1/33, Continuously Callable @ 100 | | | 500,000 | | | | 591,125 | | |
New Jersey Higher Education Student Assistance Authority, Student Loan
Revenue Bonds, Series 2011-1, 5.75%, 12/1/28, Continuously
Callable @ 100 | | | 540,000 | | | | 550,028 | | |
New Jersey Transportation Trust Fund Authority Revenue Bonds,
Series BB, 3.50%, 6/15/46, Continuously Callable @ 100 | | | 500,000 | | | | 544,025 | | |
| | | | 3,374,349 | | |
See notes to financial statements.
40
Victory Portfolios
Victory High Income Municipal Bond Fund | | Schedule of Portfolio Investments — continued
June 30, 2021 | |
(Unaudited)
Security Description | | Principal
Amount | | Value | |
New Mexico (1.1%): | |
New Mexico Hospital Equipment Loan Council Revenue, Series A, 5.00%,
7/1/49, Continuously Callable @ 102 | | $ | 500,000 | | | $ | 555,250 | | |
New York (9.1%): | |
Build NYC Resource Corp. Revenue Bonds, 4.00%, 6/15/51, Continuously
Callable @ 100 | | | 500,000 | | | | 542,090 | | |
Huntington Local Development Corp. Revenue Bonds, Series S, 3.00%, 7/1/25 | | | 500,000 | | | | 523,435 | | |
Metropolitan Transportation Authority Revenue
Series A-2, 5.00%, 11/15/45, (Put Date 5/15/30) (c) | | | 365,000 | | | | 478,041 | | |
Series D-3, 4.00%, 11/15/49, Continuously Callable @ 100 | | | 500,000 | | | | 583,620 | | |
New York State Dormitory Authority Revenue, 6.00%, 7/1/40, Continuously
Callable @ 100 (d) | | | 1,000,000 | | | | 1,010,730 | | |
New York State Dormitory Authority Revenue Bonds, 4.00%, 7/1/40,
Continuously Callable @ 100 | | | 200,000 | | | | 221,634 | | |
New York Transportation Development Corp. Revenue Bonds, 5.00%, 10/1/40,
Continuously Callable @ 100 | | | 750,000 | | | | 948,555 | | |
Onondaga Civic Development Corp. Revenue, 5.00%, 10/1/40, Continuously
Callable @ 100 | | | 250,000 | | | | 264,132 | | |
| | | | 4,572,237 | | |
North Carolina (3.7%): | |
North Carolina Medical Care Commission Revenue Bonds, 5.00%, 10/1/50,
Continuously Callable @ 103 | | | 250,000 | | | | 286,410 | | |
University of North Carolina Hill Revenue Bonds, 5.00%, 2/1/49 | | | 1,000,000 | | | | 1,570,030 | | |
| | | | 1,856,440 | | |
North Dakota (2.0%): | |
Grand Forks, North Dakota Senior Housing and Nursing Facility Revenue
Bonds, 5.00%, 12/1/36, Continuously Callable @ 100 | | | 1,000,000 | | | | 1,033,230 | | |
Ohio (3.9%): | |
Buckeye Tobacco Settlement Financing Authority Revenue Bonds,
Series B-2, 5.00%, 6/1/55, Continuously Callable @ 100 | | | 1,000,000 | | | | 1,169,640 | | |
County of Hardin Revenue Bonds, 5.50%, 5/1/50, Continuously Callable @ 103 | | | 500,000 | | | | 541,025 | | |
Northeast Ohio Medical University Revenue Bonds, Series A, 4.00%, 12/1/45,
Continuously Callable @ 100 | | | 225,000 | | | | 251,136 | | |
| | | | 1,961,801 | | |
Oklahoma (0.0%): (e) | |
Oklahoma Development Finance Authority Continuing Care Retirement
Community Revenue Bonds, Series 2012, 6.00%, 1/1/32, Continuously
Callable @ 100 (f) (g) | | | 1,885,000 | | | | 21,037 | | |
Oregon (1.9%): | |
Clackamas County Hospital Facility Authority Revenue Bonds
Series A, 5.00%, 11/15/52, Continuously Callable @ 102 | | | 500,000 | | | | 549,875 | | |
Series A, 5.38%, 11/15/55, Continuously Callable @ 102 | | | 100,000 | | | | 110,521 | | |
Yamhill County Hospital Authority Revenue Bonds, Series A, 5.00%, 11/15/51,
Continuously Callable @ 103 | | | 250,000 | | | | 291,560 | | |
| | | | 951,956 | | |
See notes to financial statements.
41
Victory Portfolios
Victory High Income Municipal Bond Fund | | Schedule of Portfolio Investments — continued
June 30, 2021 | |
(Unaudited)
Security Description | | Principal
Amount | | Value | |
Pennsylvania (2.4%): | |
Bucks County IDA Revenue Bonds, 5.00%, 7/1/54, Continuously
Callable @ 100 | | $ | 500,000 | | | $ | 598,625 | | |
Pennsylvania Economic Development Financing Authority Revenue Bonds,
9.00%, 4/1/51, (Put Date 4/13/28) (a) (c) | | | 500,000 | | | | 603,100 | | |
| | | | 1,201,725 | | |
South Carolina (3.5%): | |
Lancaster County, Walnut Creek Improvement District Assessment Refunding
Revenue Bonds, Series 2016 A-1, 5.00%, 12/1/37, Continuously
Callable @ 100 | | | 1,675,000 | | | | 1,763,122 | | |
South Dakota (1.1%): | |
Oglala Sioux Tribe, Series 2012, 5.00%, 10/1/22, Callable 8/9/21 @ 100 (a) | | | 545,000 | | | | 545,820 | | |
Texas (5.6%): | |
New Hope Cultural Education Facilities Finance Corp. Revenue, 5.00%,
7/1/47, Continuously Callable @ 102 | | | 1,000,000 | | | | 703,400 | | |
Port of Port Arthur Navigation District Revenue
Series A, 0.06%, 4/1/40, Continuously Callable @ 100 (b) | | | 400,000 | | | | 400,000 | | |
Series C, 0.07%, 4/1/40, Continuously Callable @ 100 (b) | | | 600,000 | | | | 600,000 | | |
Texas Private Activity Bond Surface Transportation Corp. Revenue Bonds,
NTE Mobility Partners Segments 3 LLC — Segments 3A & 3B Facility,
Series 2013, 7.00%, 12/31/38, Continuously Callable @ 100 | | | 1,000,000 | | | | 1,123,500 | | |
| | | | 2,826,900 | | |
Utah (6.5%): | |
Jordanelle Special Service District Special Assessment, Series C, 12.00%,
8/1/30, Continuously Callable @ 100 (a) | | | 1,337,656 | | | | 1,342,819 | | |
Utah Charter School Finance Authority Revenue Bonds, 2.75%, 4/15/50,
Continuously Callable @ 100 | | | 525,000 | | | | 532,865 | | |
Utah Infrastructure Agency Revenue Bonds, Series A, 5.38%, 10/15/40,
Continuously Callable @ 100 | | | 1,150,000 | | | | 1,395,847 | | |
| | | | 3,271,531 | | |
Vermont (0.6%): | |
Vermont Educational & Health Buildings Financing Agency Revenue, 5.00%,
10/15/46, Continuously Callable @ 100 | | | 250,000 | | | | 284,987 | | |
West Virginia (2.3%): | |
The County Commission of Monongalia County, WV Special District Excise
Tax Revenue Bonds, Series 2017 A, 5.75%, 6/1/43, Continuously
Callable @ 100 (a) | | | 1,000,000 | | | | 1,166,300 | | |
Wisconsin (2.1%): | |
Public Finance Authority Revenue Bonds
Series A, 5.25%, 3/1/55, Continuously Callable @ 100 (a) | | | 500,000 | | | | 543,870 | | |
Series A, 5.00%, 7/1/55, Continuously Callable @ 100 (a) | | | 500,000 | | | | 545,875 | | |
| | | | 1,089,745 | | |
Total Municipal Bonds (Cost $44,345,649) | | | 47,406,485 | | |
See notes to financial statements.
42
Victory Portfolios
Victory High Income Municipal Bond Fund | | Schedule of Portfolio Investments — continued
June 30, 2021 | |
(Unaudited)
Security Description | | Shares | | Value | |
Exchange-Traded Funds (4.9%) | |
SPDR Nuveen Bloomberg Barclays High Yield Municipal Bond ETF | | | 8,000 | | | $ | 486,560 | | |
VanEck Vectors High-Yield Municipal Index ETF | | | 31,000 | | | | 1,971,910 | | |
Total Exchange-Traded Funds (Cost $2,163,378) | | | 2,458,470 | | |
Total Investments (Cost $46,509,027) — 99.0% | | | 49,864,955 | | |
Other assets in excess of liabilities — 1.0% | | | 500,461 | | |
NET ASSETS — 100.00% | | $ | 50,365,416 | | |
(a) Rule 144A security or other security that is restricted as to resale to institutional investors. The Fund's Adviser has deemed this security to be liquid based upon procedures approved by the Board of Trustees. As of June 30, 2021, the fair value of these securities was $7,729,318 and amounted to 15.3% of net assets.
(b) Variable Rate Demand Notes that provide the rights to sell the security at face value on either that day or within the rate-reset period. The interest rate is reset on the put date at a stipulated daily, weekly, monthly, quarterly, or other specified time interval to reflect current market conditions. These securities do not indicate a reference rate and spread in their description.
(c) Put Bond.
(d) Rule 144A security or other security that is restricted as to resale to institutional investors. The Fund's Adviser has deemed this security to be illiquid based upon procedures approved by the Board of Trustees. As of June 30, 2021, the fair value of these securities was $1,010,730 and amounted to 2.0% of net assets.
(e) Amount represents less than 0.05% of net assets.
(f) Defaulted security.
(g) The Fund's Adviser has deemed this security to be illiquid based upon procedures approved by the Board of Trustees. As of June 30, 2021, illiquid securities were less than 0.05% of net assets.
ETF — Exchange-Traded Fund
IDA — Industrial Development Authority
LLC — Limited Liability Company
See notes to financial statements.
43
Victory Portfolios
Victory Floating Rate Fund | | Schedule of Portfolio Investments
June 30, 2021 | |
(Unaudited)
Security Description | | Shares or
Principal
Amount | | Value | |
Warrants (0.0%) (a) | |
Communication Services (0.0%) (a): | |
Cineworld | | | 377,856 | | | $ | 240,403 | | |
Total Warrants (Cost $—) | | | 240,403 | | |
Senior Secured Loans (83.4%) | |
84 Lumber Co., Term B-1 Loans, First Lien (LIBOR01M+300bps),
11/13/26 (b) (c) (d) | | $ | 3,000,000 | | | | 2,997,000 | | |
84 Lumber Co., Term B-1 Loans, First Lien, 3.75% (LIBOR01M+300bps),
11/13/26 (b) | | | 13,947,456 | | | | 13,933,509 | | |
AAdvantage Loyalty IP Ltd., Initial Term Loan, First Lien, 5.50%
(LIBOR01M+475bps), 3/24/28 (b) | | | 10,500,000 | | | | 10,938,375 | | |
Academy Ltd., Refinancing Term Loans, First Lien, 4.50%
(LIBOR01M+375bps), 11/6/27 (b) | | | 8,216,250 | | | | 8,244,514 | | |
ACProducts, Inc. Initial Term Loans, First Lien, 5/6/28 (c) (d) | | | 3,000,000 | | | | 2,982,870 | | |
ACProducts, Inc. Initial Term Loans, First Lien, 4.75%
(LIBOR01M+425bps), 5/17/28 (b) | | | 23,000,000 | | | | 22,868,670 | | |
Acrisure LLC, Term Loan B 2020, First Lien, 3.70% (LIBOR03M+350bps),
2/15/27 (b) | | | 15,335,566 | | | | 15,156,600 | | |
Admi Corp. Amendment No. 4, Refinancing Term Loans, First Lien, 3.25%
(LIBOR01M+275bps), 12/23/27 (b) | | | 15,461,250 | | | | 15,277,725 | | |
Air Medical Group Holdings, Inc., Incremental Term Loan B, First Lien,
5.25% (LIBOR06M+425bps), 3/14/25 (b) | | | 4,886,076 | | | | 4,895,653 | | |
Air Methods Corp., Initial Term Loans, First Lien, 4.50%
(LIBOR03M+350bps), 4/21/24 (b) | | | 10,872,128 | | | | 10,702,848 | | |
Aldevron LLC, Term Loan B, First Lien, 4.25% (LIBOR01M+325bps),
10/11/26 (b) | | | 7,129,849 | | | | 7,127,639 | | |
Alliance Laundry Systems LLC, Initial Term B Loans, First Lien, 4.25%
(LIBOR03M+350bps), 10/8/27 (b) | | | 13,398,620 | | | | 13,409,071 | | |
Alliant Holdings Intermediate LLC, New Term Loan, First Lien,
11/6/27 (c) (d) | | | 1,200,000 | | | | 1,200,996 | | |
Alphabet Holding Co., Inc., Initial Term Loan, Second Lien, 7.84%
(LIBOR01M+775bps), 8/15/25 (b) | | | 1,859,375 | | | | 1,859,951 | | |
Alphabet Holding Co., Inc., Term Loan B, First Lien, 3.59%
(LIBOR01M+350bps), 9/28/24 (b) | | | 14,353,798 | | | | 14,330,831 | | |
American Axle & Manufacturing, Inc., Term Loan B, First Lien, 3.00%
(LIBOR01M+225bps), 4/6/24 (b) | | | 4,736,505 | | | | 4,715,380 | | |
Amneal Pharmaceuticals LLC, Initial Term Loans, First Lien, 3.63%
(LIBOR01M+350bps), 3/23/25 (b) | | | 7,716,670 | | | | 7,562,336 | | |
Anchor Packaging LLC, Initial Term Loans, First Lien, 4.09%
(LIBOR01M+400bps), 7/18/26 (b) | | | 8,918,102 | | | | 8,929,250 | | |
AOT Packaging Products Acquisitionco LLC, Closing Date Initial Term
Loans, First Lien, 3.75% (LIBOR06M+325bps), 3/3/28 (b) | | | 8,571,920 | | | | 8,504,459 | | |
AOT Packaging Products Acquisitionco LLC, Delayed Draw Term Loan
Commitment, First Lien, 3.75% (LIBOR06M+325bps), 1/29/28 (b) (d) (h) | | | 1,926,043 | | | | 1,910,885 | | |
Apex Tool Group LLC, 2019 Term Loan B, First Lien (LIBOR01M+525bps),
8/21/24 (b) (c) (d) | | | 2,000,000 | | | | 2,006,380 | | |
AT Home Group, Inc., Term Loan B, First Lien, 6/24/28 (c) (d) | | | 12,000,000 | | | | 12,000,000 | | |
See notes to financial statements.
44
Victory Portfolios
Victory Floating Rate Fund | | Schedule of Portfolio Investments — continued
June 30, 2021 | |
(Unaudited)
Security Description | | Principal
Amount | | Value | |
AthenaHealth, Inc., Additional Term B-1, First Lien, 4.41%
(LIBOR03M+425bps), 2/11/26 (b) | | $ | 12,468,750 | | | $ | 12,496,057 | | |
Blount International, Inc., Initial Term Loan Repricing, First Lien, 4.75%
(LIBOR01M+375bps), 4/12/23 (b) | | | 5,806,125 | | | | 5,819,595 | | |
Boyd Gaming Corp., Refinancing Term B Loans, First Lien, 2.34%
(LIBOR01M+225bps), 9/15/23 (b) (d) | | | 11,791,890 | | | | 11,772,669 | | |
Brand Energy and Infrastructure Services, Inc., Initial Term Loan,
First Lien, 5.25% (LIBOR03M+425bps), 6/21/24 (b) | | | 7,683,346 | | | | 7,552,498 | | |
Brookfield Property REIT, Inc., Initial Term B Loans, First Lien, 2.59%
(LIBOR01M+250bps), 8/24/25 (b) | | | 9,948,847 | | | | 9,700,126 | | |
BW NHHC Holdco, Inc., Term Loan Lien 2, Second Lien, 9.16%
(LIBOR03M+900bps), 5/15/26 (b) | | | 3,000,000 | | | | 1,800,000 | | |
BWAY Holding Co., Initial Term Loan, First Lien, 3.39%
(LIBOR01M+325bps), 4/3/24 (b) | | | 9,948,187 | | | | 9,701,074 | | |
Caesars Resort Collection LLC, Term B-1 Loans, First Lien, 4.59%
(LIBOR01M+450bps), 6/19/25 (b) | | | 7,947,462 | | | | 7,967,331 | | |
Calpine Corp., 2020 Term Loans, First Lien, 2.60% (LIBOR01M+250bps),
12/16/27 (b) | | | 2,980,143 | | | | 2,958,299 | | |
Chassix, Inc., Term Loan B, First Lien, 6.50% (LIBOR03M+550bps),
11/10/23 (b) | | | 1,854,079 | | | | 1,837,856 | | |
Chassix, Inc., Term Loan B, First Lien, 6.50% (LIBOR06M+550bps),
11/10/23 (b) | | | 1,991,336 | | | | 1,973,912 | | |
CityCenter Holdings LLC, Term B Loan, First Lien, 3.00%
(LIBOR01M+225bps), 4/18/24 (b) | | | 13,937,797 | | | | 13,815,841 | | |
CLARIOS GLOBAL LP, Term B-1, First Lien, 3.34% (LIBOR01M+325bps),
4/30/26 (b) | | | 8,234,783 | | | | 8,152,436 | | |
Consolidated Communications, Inc., 2020 Term B-1, First Lien, 4.25%
(LIBOR01M+350bps), 10/2/27 (b) (d) | | | 7,644,610 | | | | 7,654,165 | | |
Cornerstone Building Brands, Inc., New Term Loan B, First Lien, 3.75%
(LIBOR01M+325bps), 4/12/28 (b) | | | 16,770,406 | | | | 16,745,250 | | |
CP ATLAS BUYER, Inc., Term B Loans, First Lien, 4.25%
(LIBOR06M+375bps), 11/23/27 (b) | | | 18,952,500 | | | | 18,891,283 | | |
CPM Holdings, Inc., Initial Term Loans, First Lien, 3.59%
(LIBOR01M+350bps), 11/17/25 (b) | | | 2,924,996 | | | | 2,900,133 | | |
CPM Holdings, Inc., Initial Term Loans, Second Lien, 8.34%
(LIBOR01M+825bps), 11/16/26 (b) | | | 1,595,960 | | | | 1,574,685 | | |
Crown Finance US, Inc., Initial Term B-1 Loan, First Lien, 7.00%
(LIBOR+700bps), 5/23/24 (b) | | | 1,174,322 | | | | 1,476,710 | | |
Cumulus Media New Holdings, Inc., Initial Term Loan, First Lien, 4.75%
(LIBOR03M+375bps), 3/31/26 (b) | | | 3,044,142 | | | | 3,047,186 | | |
Dayco Products LLC, Term Loans, First Lien, 4.39% (LIBOR03M+425bps),
5/19/24 (b) | | | 7,680,000 | | | | 7,286,400 | | |
Delta 2 (Lux) S.a.r.l., New Term Loan B, First Lien, 3.50%
(LIBOR01M+250bps), 2/1/24 (b) (d) | | | 18,000,000 | | | | 17,890,380 | | |
DELTA AIR LINES, Inc. and SKYMILES IP Ltd., Initial Term Loan,
First Lien, 10/20/27 (c) (d) | | | 8,411,595 | | | | 8,880,037 | | |
DELTA AIR LINES, Inc. and SKYMILES IP Ltd., Initial Term Loan,
First Lien, 4.75% (LIBOR03M+375bps), 9/16/27 (b) | | | 7,500,000 | | | | 7,917,675 | | |
Dole Food Co., Inc., Tranche B Term Loan, First Lien, 3.75%
(LIBOR01M+275bps), 4/6/24 (b) | | | 13,634,129 | | | | 13,617,087 | | |
See notes to financial statements.
45
Victory Portfolios
Victory Floating Rate Fund | | Schedule of Portfolio Investments — continued
June 30, 2021 | |
(Unaudited)
Security Description | | Principal
Amount | | Value | |
Dynasty Acquisition Co., Inc., 2020 Specified Refi Term B-1 Loans,
First Lien, 3.70% (LIBOR03M+350bps), 4/8/26 (b) | | $ | 5,519,394 | | | $ | 5,372,192 | | |
Endo Luxembourg Finance Co. I S.a.r.l., Term B-1, First Lien, 5.75%
(LIBOR01M+500bps), 3/11/28 (b) | | | 15,071,729 | | | | 14,520,706 | | |
ENTERCOM MEDIA Corp., New Term Loan, First Lien, 2.60%
(LIBOR01M+250bps), 11/17/24 (b) | | | 15,629,292 | | | | 15,461,277 | | |
Eyemart Express LLC, Term Loan, First Lien, 4.00% (LIBOR01M+300bps),
8/2/24 (b) (d) | | | 3,994,819 | | | | 3,984,832 | | |
First Brands Group LLC, 2021 Term Loans, First Lien, 6.00%
(LIBOR03M+500bps), 3/24/27 (b) | | | 5,000,000 | | | | 5,052,100 | | |
Forterra Finance LLC, Replacement Term Loan, First Lien, 4.00%
(LIBOR01M+300bps), 10/25/23 (b) | | | 16,464,102 | | | | 16,459,986 | | |
Froneri International Ltd., Facility B2 Loan, First Lien, 2.34%
(LIBOR01M+225bps), 1/31/27 (b) | | | 6,934,962 | | | | 6,825,737 | | |
Frontier Communications Corp., DIP Term Loan, First Lien, 4.50%
(LIBOR01M+375bps), 10/8/27 (b) | | | 9,975,000 | | | | 9,975,000 | | |
Gates Global LLC, Initial B-3 Dollar Term Loan, First Lien, 3.50%
(LIBOR01M+275bps), 3/31/27 (b) | | | 10,984,115 | | | | 10,955,557 | | |
Global Medical Response, Inc., 2020 Term Loan, First Lien, 5.75%
(LIBOR06M+475bps), 10/2/25 (b) | | | 8,964,975 | | | | 8,998,594 | | |
Golden Nugget, Inc., Senior Secured Term Loan, First Lien, 3.25%
(LIBOR02M+250bps), 10/4/23 (b) | | | 11,024,589 | | | | 10,935,511 | | |
Graham Packaging Co., Inc., New Term Loans, First Lien, 3.75%
(LIBOR01M+300bps), 8/4/27 (b) | | | 15,817,983 | | | | 15,794,572 | | |
Great Outdoors Group LLC, Term B-1 Loan, First Lien, 5.00%
(LIBOR03M+425bps), 2/26/28 (b) | | | 16,915,000 | | | | 16,957,288 | | |
GTT Communications BV, Delayed Draw Term Loan, First Lien, 3.50%
(LIBOR01M+250bps), 12/28/21 (b) | | | 520,144 | | | | 524,414 | | |
Gulf Finance LLC, Term Loan B, First Lien, 6.25% (LIBOR01M+525bps),
8/25/23 (b) | | | 3,974,245 | | | | 3,365,351 | | |
Hertz Corp., Term Loan B, First Lien, 6/14/28 (c) (d) | | | 12,831,715 | | | | 12,815,676 | | |
Hertz Corp., Term Loan C, First Lien, 6/14/28 (c) (d) | | | 2,418,285 | | | | 2,415,262 | | |
Hillman Group, Inc., Delayed Draw Term loan, First Lien, 2/24/28 (c) (d) (h) | | | 1,603,376 | | | | 1,598,630 | | |
Hillman Group, Inc., Term Loan B, First Lien, 4.09% (LIBOR01M+400bps),
5/31/25 (b) | | | 5,931,297 | | | | 5,916,469 | | |
Hillman Group, Inc., Term Loan B1, First Lien, 2/24/28 (c) (d) | | | 1,202,532 | | | | 1,198,972 | | |
Hillman Group, Inc., Term Loan B1, First Lien, 2/24/28 (c) (d) | | | 6,694,093 | | | | 6,674,278 | | |
Holley Purchaser, Inc., Initial Term Loan, First Lien, 5.19%
(LIBOR03M+500bps), 10/26/25 (b) | | | 7,045,765 | | | | 7,022,303 | | |
Hub International Ltd., Term Loan B, First Lien, 2.93%
(LIBOR03M+275bps), 4/25/25 (b) | | | 10,259,615 | | | | 10,140,501 | | |
iHeartCommunications, Inc., Second Amendment Incremental Term Loan,
First Lien, 4.75% (LIBOR01M+400bps), 5/1/26 (b) | | | 4,969,887 | | | | 4,969,887 | | |
iHeartCommunications, Inc., Term Loan B, First Lien, 5/1/26 (c) (d) | | | 2,500,000 | | | | 2,500,000 | | |
iHeartCommunications, Inc., Term Loans, First Lien, 3.09%
(LIBOR01M+300bps), 5/1/26 (b) (d) | | | 20,136,806 | | | | 19,948,124 | | |
Ineos U.S Petrochem LLC, 2026 Tranche B Dollar Term Loans, First Lien,
3.25% (LIBOR03M+275bps), 1/29/26 (b) | | | 8,000,000 | | | | 7,972,480 | | |
Ingram Micro, Inc., Term Loan B, First Lien, 4/1/28 (c) (d) | | | 3,500,000 | | | | 3,504,375 | | |
Innio North America Holding, Inc., Facility B USD, First Lien, 3.20%
(LIBOR03M+300bps), 11/6/25 (b) | | | 8,893,785 | | | | 8,626,971 | | |
See notes to financial statements.
46
Victory Portfolios
Victory Floating Rate Fund | | Schedule of Portfolio Investments — continued
June 30, 2021 | |
(Unaudited)
Security Description | | Principal
Amount | | Value | |
Insulet Corp., Term Loan B, First Lien, 3.75% (LIBOR01M+325bps),
5/3/28 (b) | | $ | 4,000,000 | | | $ | 4,002,520 | | |
Intelsat Jackson Holdings S.A., DIP Term Loan Commitment, First Lien,
6.50% (LIBOR03M+550bps), 7/13/21 (b) | | | 4,172,613 | | | | 4,196,105 | | |
Intelsat Jackson Holdings S.A.,Term B-3, First Lien, 8.00%
(Prime+475bps), 11/27/23 (b) (d) | | | 11,750,000 | | | | 11,916,497 | | |
Janus International Group LLC Amendment No 3, Refinancing Term Loans,
First Lien, 4.25% (LIBOR01M+325bps), 2/15/25 (b) | | | 8,902,388 | | | | 8,902,388 | | |
Jo-Ann Stores LLC, Loan, First Lien, 6.00% (LIBOR01M+500bps),
10/16/23 (b) | | | 23,000,000 | | | | 22,965,500 | | |
Jo-Ann Stores LLC, Term Loan B, First Lien, 6/30/28 (c) | | | 22,500,000 | | | | 22,443,750 | | |
Kindred Healthcare LLC, Term Loan New, First Lien, 4.63%
(LIBOR01M+450bps), 7/2/25 (b) | | | 15,825,338 | | | | 15,785,774 | | |
LABL, Inc., Term B USD Facility, First Lien, 4.09% (LIBOR01M+400bps),
7/2/26 (b) | | | 6,409,636 | | | | 6,396,304 | | |
LBM Acquisition LLC, Initial Delayed Draw Term Loan Commitment,
First Lien, 12/8/27 (c) (d) (h) | | | 2,666,667 | | | | 2,646,107 | | |
LBM Acquisition LLC, Initial Delayed Draw Term Loan Commitment,
First Lien, 4.50% (LIBOR02M+375bps), 12/17/27 (b) | | | 362,955 | | | | 360,156 | | |
LBM Acquisition LLC, Initial Term Loan, First Lien, 4.50%
(LIBOR03M+375bps), 12/17/27 (b) | | | 9,545,455 | | | | 9,471,859 | | |
LBM Acquisition LLC, Initial Term Loan, First Lien, 12/17/27 (c) (d) | | | 4,090,909 | | | | 4,059,368 | | |
Leslie's Poolmart, Inc., Term Loan B, First Lien, 3.25%
(LIBOR03M+275bps), 3/9/28 (b) | | | 14,556,626 | | | | 14,493,014 | | |
Leslie's Poolmart, Inc., Term Loan B, First Lien, 3/9/28 (c) (d) | | | 6,000,000 | | | | 5,973,780 | | |
Life Time, Inc., 2021 Refinancing Term Loan, First Lien, 5.75%
(LIBOR03M+475bps), 12/15/24 (b) | | | 13,487,500 | | | | 13,492,356 | | |
Lifepoint Health, Inc., Term B Loans, First Lien, 3.84%
(LIBOR01M+375bps), 11/16/25 (b) | | | 4,934,991 | | | | 4,920,779 | | |
LifeScan Global Corp., Initial Term Loan, First Lien, 6.20%
(LIBOR03M+600bps), 6/19/24 (b) | | | 15,293,442 | | | | 15,140,508 | | |
LifeScan Global Corp., Initial Term Loan, Second Lien, 9.70%
(LIBOR03M+950bps), 6/19/25 (b) | | | 2,250,000 | | | | 2,118,757 | | |
Lower Cadence Holdings LLC, Initial Term Loans, First Lien, 4.09%
(LIBOR01M+400bps), 5/22/26 (b) (d) | | | 6,994,894 | | | | 6,942,432 | | |
Lucid Energy Group II Borrower LLC, Initial Term Loan, First Lien, 4.00%
(LIBOR01M+300bps), 2/18/25 (b) | | | 9,974,227 | | | | 9,870,894 | | |
Madison IAQ LLC, Initial Term Loans, First Lien, 3.75%
(LIBOR03M+325bps), 6/16/28 (b) | | | 9,000,000 | | | | 9,000,000 | | |
Majordrive Holdings IV LLC, Initial term Loans, First Lien, 4.50%
(LIBOR03M+400bps), 6/1/28 (b) | | | 3,750,000 | | | | 3,751,162 | | |
Men's Wearhouse, Inc., Term loan, First Lien | | | 51,299 | | | | 67,715 | | |
Meredith Corp., Term B-2 Facility, First Lien, 2.59% (LIBOR01M+250bps),
1/31/25 (b) | | | 5,000,000 | | | | 4,976,250 | | |
Meredith Corp., Tranche B-3 Term Loans, First Lien, 5.25%
(LIBOR03M+425bps), 1/31/25 (b) | | | 16,396,548 | | | | 16,744,975 | | |
MHI Holdings LLC, Initial Term Loans, First Lien, 5.10%
(LIBOR01M+500bps), 9/20/26 (b) | | | 8,879,857 | | | | 8,902,057 | | |
Mileage Plus Holdings LLC, Initial Term Loan, First Lien, 6.25%
(LIBOR03M+525bps), 6/20/27 (b) | | | 11,000,000 | | | | 11,738,760 | | |
See notes to financial statements.
47
Victory Portfolios
Victory Floating Rate Fund | | Schedule of Portfolio Investments — continued
June 30, 2021 | |
(Unaudited)
Security Description | | Principal
Amount | | Value | |
Momentive Performance Materials, Inc., Initial Dollar Term Loan,
First Lien, 3.35% (LIBOR01M+325bps), 5/15/24 (b) | | $ | 5,696,197 | | | $ | 5,655,868 | | |
Navicure, Inc., Initial Term Loans, First Lien, 4.09% (LIBOR01M+400bps),
10/23/26 (b) | | | 9,443,511 | | | | 9,450,876 | | |
Navistar, Inc., Tranche B Term Loan, First Lien, 3.60%
(LIBOR02M+350bps), 11/6/24 (b) | | | 9,943,548 | | | | 9,943,548 | | |
NorthRiver Midstream Finance LP, Initial Term Loan B, First Lien, 3.45%
(LIBOR03M+325bps), 10/1/25 (b) | | | 5,979,513 | | | | 5,924,681 | | |
Organon & Co., Dollar Term Loan, First Lien, 3.50% (LIBOR06M+300bps),
6/2/28 (b) | | | 10,000,000 | | | | 10,006,300 | | |
Ortho-Clinical Diagnostics, Inc., Term Loan B New, First Lien, 3.09%
(LIBOR01M+300bps), 5/22/25 (b) | | | 5,097,949 | | | | 5,092,494 | | |
Packaging Coordinators Midco, Inc., Term B Loans, First Lien, 4.25%
(LIBOR03M+350bps), 12/1/27 (b) | | | 9,476,250 | | | | 9,480,989 | | |
Park River Holdings, Inc., Initial Term Loans, First Lien, 4.00%
(LIBOR03M+325bps), 1/20/28 (b) | | | 10,000,000 | | | | 9,939,100 | | |
Peraton Corp., Term Loan B, First Lien, 4.50% (LIBOR01M+375bps),
2/1/28 (b) | | | 11,471,250 | | | | 11,495,110 | | |
Petco Health & Wellness Co., Inc., Initial Term Loans, First Lien, 4.00%
(LIBOR03M+325bps), 2/25/28 (b) | | | 25,286,625 | | | | 25,227,960 | | |
PetSmart, Inc., Initial Term Loans, First Lien, 4.50% (LIBOR06M+375bps),
2/12/28 (b) | | | 17,750,000 | | | | 17,754,438 | | |
PG&E Corp., Term Loan, First Lien, 3.50% (LIBOR03M+300bps),
6/23/25 (b) | | | 10,904,925 | | | | 10,748,221 | | |
Pluto Acquisition I, Inc., 2021 Term Loans, First Lien, 6/20/26 (c) (d) | | | 11,000,000 | | | | 11,000,000 | | |
PQ Group Holdings, Inc., Term Loan, First Lien, 4/30/28 (c) (d) | | | 4,000,000 | | | | 4,001,240 | | |
Presidio Holdings, Inc., Term Loan B, First Lien, 3.69%
(LIBOR03M+350bps), 12/19/26 (b) | | | 3,752,764 | | | | 3,744,545 | | |
Presidio Holdings, Inc., Term Loan B, First Lien, 3.60%
(LIBOR01M+350bps) (b) | | | 227,136 | | | | 226,638 | | |
Radiology Partners, Inc., Term Loan New, First Lien, 4.33%
(LIBOR01M+425bps), 7/9/25 (b) | | | 9,201,802 | | | | 9,194,165 | | |
Rent-A-Center, Initial Term Loans, First Lien, 4.75% (LIBOR01M+400bps),
1/17/28 (b) | | | 8,179,500 | | | | 8,179,500 | | |
Revint Intermediate II LLC, Initial Term Loans, First Lien, 5.75%
(LIBOR01M+500bps), 10/15/27 (b) | | | 9,975,000 | | | | 10,046,720 | | |
Reynolds Group Holdings, Inc., 2017 Incremental U.S. Term Loans,
First Lien, 2.84% (LIBOR01M+275bps), 2/5/23 (b) | | | 3,122,333 | | | | 3,114,528 | | |
Reynolds Group Holdings, Inc., Tranche B-2 U.S. Term Loans, First Lien,
3.34% (LIBOR01M+325bps), 2/16/26 (b) | | | 6,965,000 | | | | 6,915,270 | | |
Rising Tide Holdings, Inc., Initial Term Loan, First Lien, 6/1/28 (c) (d) | | | 6,000,000 | | | | 6,003,780 | | |
Robertshaw U.S. Holding Corp., 2nd Lien Initial Term Loans, Second Lien,
9.00% (LIBOR01M+800bps), 2/15/26 (b) | | | 4,000,000 | | | | 3,440,000 | | |
Robertshaw U.S. Holding Corp., Term Loan B, First Lien, 4.50%
(LIBOR01M+350bps), 2/28/25 (b) | | | 9,945,000 | | | | 9,596,925 | | |
Ryan Specialty Group LLC, Term Loan, First Lien, 3.75%
(LIBOR01M+300bps), 9/1/27 (b) | | | 7,947,462 | | | | 7,939,992 | | |
Sabert Corp., Initial Term Loans, First Lien, 5.50% (LIBOR01M+450bps),
12/10/26 (b) | | | 7,782,110 | | | | 7,767,558 | | |
Scientific Games International, Inc., Term Loan B-5, First Lien, 2.84%
(LIBOR01M+275bps), 8/14/24 (b) | | | 7,958,869 | | | | 7,899,177 | | |
See notes to financial statements.
48
Victory Portfolios
Victory Floating Rate Fund | | Schedule of Portfolio Investments — continued
June 30, 2021 | |
(Unaudited)
Security Description | | Principal
Amount | | Value | |
Sedgwick Claims Management Services, Inc., Initial Term Loans,
First Lien, 12/31/25 (c) (d) | | $ | 5,000,000 | | | $ | 4,943,750 | | |
Sinclair Television Group, Inc., Term Loan B-3, First Lien, 3.10%
(LIBOR01M+300bps), 3/25/28 (b) | | | 5,000,000 | | | | 4,950,000 | | |
SIWF Holdings, Inc., Initial Term Loan, First Lien, 4.34%
(LIBOR01M+425bps), 6/15/25 (b) | | | 11,821,306 | | | | 11,821,306 | | |
SIWF Holdings, Inc., Initial Term Loan, Second Lien, 8.59%
(LIBOR01M+850bps), 5/26/26 (b) | | | 1,500,000 | | | | 1,500,945 | | |
Spectacle Gary Holdings LLC, Closing Date Term Loan, First Lien, 11.00%
(LIBOR03M+900bps), 12/23/25 (b) | | | 5,594,595 | | | | 6,084,122 | | |
Spectacle Gary Holdings LLC, Delayed Draw Term Loan Commitment,
First Lien, 11.00% (LIBOR03M+900bps), 12/23/25 (b) | | | 405,405 | | | | 440,878 | | |
SRS Distribution, Inc., 2021 Refinancing Term Loans, First Lien, 4.25%
(LIBOR01M+375bps), 5/20/28 (b) (d) | | | 14,500,000 | | | | 14,483,905 | | |
Standard Aero Ltd., 2020 SPCFD Refi Term B-2 Loans, First Lien, 3.70%
(LIBOR03M+350bps), 4/8/26 (b) | | | 2,967,416 | | | | 2,888,275 | | |
Station Casinos LLC, Term B-1 Facility Loans, First Lien, 2.50%
(LIBOR01M+225bps), 2/8/27 (b) | | | 14,428,757 | | | | 14,251,428 | | |
Surgery Center Holdings, Inc., New Term Loans, First Lien, 4.50%
(LIBOR01M+375bps), 8/31/24 (b) | | | 12,005,681 | | | | 12,048,781 | | |
Surgery Center Holdings, Inc., New Term Loans, First Lien, 8/31/26 (c) | | | 500,000 | | | | 501,795 | | |
Tailwind Smith Cooper Intermediate Corp., Initial Term Loans,
Second Lien, 9.10% (LIBOR01M+900bps), 5/28/27 (b) | | | 3,000,000 | | | | 2,640,000 | | |
Team Health Holdings, Inc., Initial Term Loans, First Lien, 3.75%
(LIBOR01M+275bps), 2/6/24 (b) | | | 13,597,883 | | | | 13,172,949 | | |
Tenneco, Inc., Tranche B Term Loan, First Lien (LIBOR01M+300bps),
10/1/25 (b) (c) (d) | | | 2,322,746 | | | | 2,294,873 | | |
Tenneco, Inc., Tranche B Term Loan, First Lien, 3.09%
(LIBOR01M+300bps), 10/1/25 (b) | | | 13,322,103 | | | | 13,162,238 | | |
The Men's Wearhouse LLC, Term Loan, First Lien, 9.00%
(LIBOR01M+800bps), 12/1/25 (b) | | | 2,727,093 | | | | 2,232,807 | | |
The Michaels Cos., Inc., Term B Loans, First Lien, 5.00%
(LIBOR03M+425bps), 4/15/28 (b) | | | 24,000,000 | | | | 24,087,360 | | |
Thor Industries, Inc., Term B-1, First Lien, 3.13% (LIBOR01M+300bps),
2/1/26 (b) | | | 8,753,496 | | | | 8,742,554 | | |
Titan Acquisition Ltd., Initial Term Loan, First Lien, 3.27%
(LIBOR03M+300bps), 3/28/25 (b) | | | 13,830,391 | | | | 13,578,540 | | |
TransDigm, Inc., Tranche F Refinancing Term Loan, First Lien, 2.34%
(LIBOR01M+225bps), 12/9/25 (b) | | | 14,931,799 | | | | 14,699,759 | | |
Traverse Midstream Partners LLC, Advance, First Lien, 6.50%
(LIBOR01M+550bps), 9/27/24 (b) | | | 7,815,362 | | | | 7,839,824 | | |
TRUCK HERO, Inc., Initial Term Loans, First Lien, 4.50%
(LIBOR01M+375bps), 1/20/28 (b) | | | 8,977,500 | | | | 8,973,011 | | |
U.S. Renal Care, Inc., Initial Term Loan, First Lien, 5.13%
(LIBOR01M+500bps), 7/26/26 (b) (d) | | | 19,380,717 | | | | 19,449,325 | | |
United Airlines, Inc., Class B Term Loans, First Lien, 4.50%
(LIBOR03M+375bps), 4/21/28 (b) | | | 9,975,000 | | | | 10,096,895 | | |
Univision Communications, Inc., 2020 Replacement New First-Lien Term
Loans, First Lien, 4.75% (LIBOR01M+375bps), 3/24/26 (b) | | | 11,842,808 | | | | 11,855,716 | | |
Univision Communications, Inc., Term Loan B, First Lien, 5/7/28 (c) (d) | | | 3,500,000 | | | | 3,483,970 | | |
See notes to financial statements.
49
Victory Portfolios
Victory Floating Rate Fund | | Schedule of Portfolio Investments — continued
June 30, 2021 | |
(Unaudited)
Security Description | | Principal
Amount | | Value | |
USI, Inc., 2017 New Term Loans, First Lien, 3.20% (LIBOR03M+300bps),
5/16/24 (b) | | $ | 12,687,393 | | | $ | 12,562,549 | | |
Utz Quality Foodz LLC, 2021 New Term Loans, First Lien, 3.09%
(LIBOR01M+300bps), 1/20/28 (b) | | | 7,960,003 | | | | 7,947,187 | | |
Verscend Holding Corp., New Term Loan B-1 Facility, First Lien, 4.09%
(LIBOR01M+400bps), 8/27/25 (b) | | | 7,877,731 | | | | 7,890,414 | | |
Vertex Aerospace Services Corp., Term Loan, First Lien, 4.09%
(LIBOR01M+400bps), 6/29/27 (b) | | | 6,907,688 | | | | 6,901,194 | | |
Victoria's Secret & Co., Term B, First Lien, 6/30/28 | | | 3,000,000 | | | | 2,977,500 | | |
Weber-Stephen Products LLC, Initial Term B Loans, First Lien, 4.00%
(LIBOR01M+325bps), 10/30/27 (b) | | | 16,387,354 | | | | 16,407,839 | | |
Welbilt, Inc., Facility Term Loan, First Lien, 2.59% (LIBOR01M+250bps),
10/23/25 (b) | | | 15,000,000 | | | | 14,868,750 | | |
WestJet Airlines Ltd., Initial Term Loan, First Lien, 4.00%
(LIBOR06M+300bps), 12/11/26 (b) | | | 9,949,495 | | | | 9,750,505 | | |
WHITE CAP BUYER LLC, Initial Closing Date Term Loan, First Lien, 4.50%
(LIBOR03M+400bps), 10/19/27 (b) | | | 11,452,475 | | | | 11,466,791 | | |
WireCo WorldGroup, Inc., Term Loans, First Lien, 6.00%
(LIBOR06M+500bps), 9/30/23 (b) | | | 9,710,821 | | | | 9,707,325 | | |
WP CPP Holdings LLC, Term Loan, Second Lien, 8.75%
(LIBOR03M+775bps), 4/30/26 (b) | | | 2,000,000 | | | | 1,941,660 | | |
WP CPP Holdings LLC, Term Loans, First Lien, 4.75% (LIBOR03M+375bps),
4/30/25 (b) | | | 9,863,721 | | | | 9,656,583 | | |
Total Senior Secured Loans (Cost $1,446,637,016) | | | 1,448,843,365 | | |
Corporate Bonds (13.2%) | |
Communication Services (3.1%): | |
Audacy Capital Corp., 6.50%, 5/1/27, Callable 5/1/22 @ 104.88 (e) | | | 2,000,000 | | | | 2,079,400 | | |
CSC Holdings LLC, 6.50%, 2/1/29, Callable 2/1/24 @ 103.25 (e) | | | 4,500,000 | | | | 4,983,255 | | |
Cumulus Media New Holdings, Inc., 6.75%, 7/1/26,
Callable 7/1/22 @ 103.38 (e) | | | 10,997,000 | | | | 11,505,721 | | |
Frontier Communications Holdings LLC, 5.00%, 5/1/28,
Callable 5/1/24 @ 102.5 (e) | | | 8,460,000 | | | | 8,750,686 | | |
Nexstar Broadcasting, Inc., 4.75%, 11/1/28,
Callable 11/1/23 @ 102.38 (e) | | | 5,000,000 | | | | 5,139,800 | | |
Sinclair Television Group, Inc., 5.50%, 3/1/30,
Callable 12/1/24 @ 102.75 (e) (f) | | | 13,350,000 | | | | 13,601,247 | | |
Univision Communications, Inc.
6.63%, 6/1/27, Callable 6/1/23 @ 103.31 (e) | | | 6,500,000 | | | | 7,042,945 | | |
4.50%, 5/1/29, Callable 5/1/24 @ 102.25 (e) | | | 750,000 | | | | 755,640 | | |
| | | | 53,858,694 | | |
Consumer Discretionary (3.2%): | |
Academy Ltd., 6.00%, 11/15/27, Callable 11/15/23 @ 103 (e) | | | 2,000,000 | | | | 2,140,120 | | |
Affinity Gaming, 6.88%, 12/15/27, Callable 12/1/23 @ 103.44 (e) | | | 7,000,000 | | | | 7,442,610 | | |
Boyd Gaming Corp., 4.75%, 6/15/31, Callable 6/15/26 @ 102.38 (e) | | | 3,050,000 | | | | 3,170,902 | | |
Diamond Sports Group LLC/Diamond Sports Finance Co., 6.63%, 8/15/27,
Callable 8/15/22 @ 103.31 (e) (f) | | | 14,000,000 | | | | 6,866,580 | | |
Genting New York LLC/GENNY Capital, Inc., 3.30%, 2/15/26,
Callable 1/15/26 @ 100 (e) | | | 6,000,000 | | | | 6,059,220 | | |
See notes to financial statements.
50
Victory Portfolios
Victory Floating Rate Fund | | Schedule of Portfolio Investments — continued
June 30, 2021 | |
(Unaudited)
Security Description | | Principal
Amount | | Value | |
Life Time, Inc., 5.75%, 1/15/26, Callable 1/15/23 @ 102.88 (e) | | $ | 6,000,000 | | | $ | 6,217,080 | | |
Magic Mergeco, Inc., 7.88%, 5/1/29, Callable 5/1/24 @ 103.94 (e) | | | 2,000,000 | | | | 2,060,780 | | |
PetSmart, Inc./PetSmart Finance Corp., 7.75%, 2/15/29,
Callable 2/15/24 @ 103.88 (e) (f) | | | 1,650,000 | | | | 1,819,884 | | |
Scientific Games International, Inc.
8.63%, 7/1/25, Callable 7/1/22 @ 104.31 (e) | | | 1,000,000 | | | | 1,094,430 | | |
8.25%, 3/15/26, Callable 3/15/22 @ 104.13 (e) | | | 6,000,000 | | | | 6,443,280 | | |
Tenneco, Inc.
5.00%, 7/15/26, Callable 8/9/21 @ 102.5 | | | 3,840,000 | | | | 3,820,493 | | |
7.88%, 1/15/29, Callable 1/15/24 @ 103.94 (e) | | | 2,160,000 | | | | 2,439,158 | | |
Viking Cruises Ltd., 13.00%, 5/15/25, Callable 5/15/22 @ 109.75 (e) (f) | | | 6,000,000 | | | | 7,056,240 | | |
| | | | 56,630,777 | | |
Consumer Staples (0.6%): | |
Triton Water Holdings, Inc., 6.25%, 4/1/29, Callable 4/1/24 @ 103.13 (e) | | | 10,595,000 | | | | 10,668,423 | | |
Energy (0.7%): | |
Antero Midstream Partners LP/Antero Midstream Finance Corp., 5.38%,
6/15/29, Callable 6/15/24 @ 102.69 (e) | | | 2,000,000 | | | | 2,088,640 | | |
Antero Resources Corp.
8.38%, 7/15/26, Callable 1/15/24 @ 104.19 (e) | | | 5,000,000 | | | | 5,685,950 | | |
5.38%, 3/1/30, Callable 3/1/25 @ 102.69 (e) | | | 1,000,000 | | | | 1,020,500 | | |
Occidental Petroleum Corp., 5.50%, 12/1/25, Callable 9/1/25 @ 100 | | | 1,500,000 | | | | 1,657,410 | | |
Range Resources Corp., 5.00%, 3/15/23, Callable 12/15/22 @ 100 | | | 2,000,000 | | | | 2,080,940 | | |
| | | | 12,533,440 | | |
Financials (1.3%): | |
Compass Group Diversified Holdings LLC, 5.25%, 4/15/29,
Callable 4/15/24 @ 102.63 (e) | | | 4,000,000 | | | | 4,164,000 | | |
LABL Escrow Issuer LLC, 10.50%, 7/15/27,
Callable 7/15/22 @ 105.25 (e) (f) | | | 6,500,000 | | | | 7,160,270 | | |
White Capital Parent LLC PIK, 8.25%, 3/15/26,
Callable 3/15/22 @ 102 (e) (g) | | | 2,250,000 | | | | 2,327,985 | | |
Wolverine Escrow LLC
9.00%, 11/15/26, Callable 11/15/22 @ 106.75 (e) | | | 4,453,000 | | | | 4,341,764 | | |
13.13%, 11/15/27, Callable 11/15/22 @ 109.84 (e) | | | 4,750,000 | | | | 4,004,535 | | |
| | | | 21,998,554 | | |
Health Care (2.3%): | |
Air Methods Corp., 8.00%, 5/15/25, Callable 8/9/21 @ 102 (e) (f) | | | 13,250,000 | | | | 12,521,515 | | |
Bausch Health Cos., Inc.
4.88%, 6/1/28, Callable 6/1/24 @ 102.44 (e) | | | 2,500,000 | | | | 2,556,650 | | |
5.25%, 1/30/30, Callable 1/30/25 @ 102.63 (e) (f) | | | 3,000,000 | | | | 2,798,940 | | |
Ortho-Clinical Diagnostics, Inc./Ortho-Clinical Diagnostics SA, 7.38%,
6/1/25, Callable 6/1/22 @ 103.69 (e) (f) | | | 1,196,000 | | | | 1,283,691 | | |
Radiology Partners, Inc., 9.25%, 2/1/28, Callable 2/1/23 @ 104.63 (e) (f) | | | 2,500,000 | | | | 2,770,675 | | |
Surgery Center Holdings, Inc., 10.00%, 4/15/27,
Callable 4/15/22 @ 105 (e) | | | 2,150,000 | | | | 2,361,302 | | |
Team Health Holdings, Inc., 6.38%, 2/1/25, Callable 7/23/21 @ 101.59 (e) | | | 8,383,000 | | | | 7,979,610 | | |
Tenet Healthcare Corp., 6.13%, 10/1/28, Callable 10/1/23 @ 103.06 (e) | | | 7,000,000 | | | | 7,448,420 | | |
| | | | 39,720,803 | | |
See notes to financial statements.
51
Victory Portfolios
Victory Floating Rate Fund | | Schedule of Portfolio Investments — continued
June 30, 2021 | |
(Unaudited)
Security Description | | Principal
Amount | | Value | |
Industrials (1.4%): | |
American Airlines, Inc., 11.75%, 7/15/25 (e) | | $ | 12,185,000 | | | $ | 15,289,860 | | |
Apex Tool Group LLC/BC Mountain Finance, Inc., 9.00%, 2/15/23,
Callable 8/9/21 @ 100 (e) | | | 4,000,000 | | | | 4,018,800 | | |
Mileage Plus Holdings LLC/Mileage Plus Intellectual Property Assets Ltd.,
6.50%, 6/20/27, Callable 6/30/23 @ 103.25 (e) | | | 4,000,000 | | | | 4,404,040 | | |
| | | | 23,712,700 | | |
Information Technology (0.6%): | |
Caesars Entertainment, Inc., 8.13%, 7/1/27, Callable 7/1/23 @ 104.06 (e) | | | 8,800,000 | | | | 9,792,904 | | |
Total Corporate Bonds (Cost $223,558,740) | | | 228,916,295 | | |
Yankee Dollars (1.2%) | |
Energy (0.5%): | |
Husky Holding Ltd. PIK, 13.00%, 2/15/25,
Callable 8/9/21 @ 109.75 (e) (f) (g) | | | 4,500,000 | | | | 4,881,285 | | |
TechnipFMC PLC, 6.50%, 2/1/26, Callable 2/1/23 @ 103.25 (e) | | | 2,800,000 | | | | 3,020,696 | | |
| | | | 7,901,981 | | |
Industrials (0.6%): | |
Algeco Global Finance 2 PLC, 10.00%, 8/15/23,
Callable 7/19/21 @ 102.5 (e) (f) | | | 4,000,000 | | | | 4,149,920 | | |
Bombardier, Inc., 7.88%, 4/15/27, Callable 4/15/22 @ 103.94 (e) | | | 6,500,000 | | | | 6,738,160 | | |
| | | | 10,888,080 | | |
Materials (0.1%): | |
Titan Acquisition Ltd./Titan Co-Borrower LLC, 7.75%, 4/15/26,
Callable 8/9/21 @ 103.88 (e) (f) | | | 2,500,000 | | | | 2,591,975 | | |
Total Yankee Dollars (Cost $20,427,434) | | | 21,382,036 | | |
Total Investments (Cost $1,690,623,190) — 97.8% | | | 1,699,382,099 | | |
Other assets in excess of liabilities — 2.2% | | | 38,798,350 | | |
NET ASSETS — 100.00% | | $ | 1,738,180,449 | | |
(a) Amount represents less than 0.05% of net assets.
(b) Variable or Floating-Rate Security. Rate disclosed is as of June 30, 2021.
(c) The rates for this senior secured loan will be known on settlement date of the loan, subsequent to this report date. Senior secured loans have rates that will fluctuate over time in line with prevailing interest rates.
(d) Security or a portion of the security purchased on a delayed-delivery and/or when-issued basis.
(e) Rule 144A security or other security that is restricted as to resale to institutional investors. The Fund's Adviser has deemed this security to be liquid based upon procedures approved by the Board of Trustees. As of June 30, 2021, the fair value of these securities was $242,739,488 and amounted to 14.0% of net assets.
(f) All or a portion of the security has been segregated as collateral for securities purchased on a when-issued basis.
(g) All of the coupon is paid in kind.
See notes to financial statements.
52
Victory Portfolios
Victory Floating Rate Fund | | Schedule of Portfolio Investments — continued
June 30, 2021 | |
(Unaudited)
(h) The Fund may enter into certain credit agreements all or a portion of which may be unfunded. The Fund is obligated to fund these commitments at the borrower's discretion. At June 30, 2021, the Fund held unfunded or partially unfunded loan commitments of $4,450,085, which included a $30,563 unrealized loss.
bps — Basis points
LIBOR — London InterBank Offered Rate
LIBOR01M — 1 Month US Dollar LIBOR, rate disclosed as of June 30, 2021, based on the last reset date of the security
LIBOR02M — 2 Month US Dollar LIBOR, rate disclosed as of June 30, 2021, based on the last reset date of the security
LIBOR03M — 3 Month US Dollar LIBOR, rate disclosed as of June 30, 2021, based on the last reset date of the security
LIBOR06M — 6 Month US Dollar LIBOR, rate disclosed as of June 30, 2021, based on the last reset date of the security
LLC — Limited Liability Company
LP — Limited Partnership
PIK — Payment-in-Kind
PLC — Public Limited Company
PRIME — U.S. Prime Rate
REIT — Real Estate Investment Trust
See notes to financial statements.
53
Victory Portfolios
Victory Strategic Income Fund | | Schedule of Portfolio Investments
June 30, 2021 | |
(Unaudited)
Security Description | | Principal
Amount | | Value | |
Asset-Backed Securities (0.9%) | |
Commonbond Student Loan Trust, Series 2021-AGS, Class A, 1.20%, 8/25/50,
Callable 4/25/30 @ 100 (a) | | $ | 270,757 | | | $ | 269,420 | | |
Stack Infrastructure Issuer LLC, Series 2021-1A, Class A2, 1.88%, 3/26/46,
Callable 3/25/24 @ 100 (a) | | | 500,000 | | | | 502,026 | | |
Total Asset-Backed Securities (Cost $770,694) | | | 771,446 | | |
Collateralized Mortgage Obligations (8.3%) | |
AIMCO CLO, Series 2017-AA, Class DR, 3.34% (LIBOR03M+315bps), 4/20/34,
Callable 4/20/23 @ 100 (a) (b) | | | 400,000 | | | | 399,995 | | |
Aimco CLO 14 Ltd., Series 2021-14A, Class D (LIBOR03M+290bps), 4/20/34,
Callable 4/20/23 @ 100 (a) (b) (c) | | | 800,000 | | | | 793,439 | | |
Battalion CLO XIX Ltd., Series 2021-19A, Class D, 3.43% (LIBOR03M+325bps),
4/15/34 (a) (b) (c) | | | 800,000 | | | | 800,696 | | |
BB-UBS Trust, Series 2012-SHOW, Class A, 3.43%, 11/5/36,
Callable 11/5/24 @ 100 (a) | | | 300,000 | | | | 317,943 | | |
Grace Trust, Series 2020-GRCE, Class C, 2.77%, 12/10/40,
Callable 12/10/30 @ 100 (a) (c) (d) | | | 650,000 | | | | 662,579 | | |
Greywolf CLO II Ltd., Series 2013-1A, Class C2RR, 4.38% (LIBOR03M+420bps),
4/15/34, Callable 4/15/23 @ 100 (a) (b) (c) | | | 900,000 | | | | 899,985 | | |
GS Mortgage Securities Trust, Series 2017-FARM, Class B, 3.66%, 1/10/43,
Callable 1/10/28 @ 100 (a) (d) | | | 650,000 | | | | 704,277 | | |
GS Mortgage Securities Trust, Series 2012-GCJ7, Class A4, 3.38%, 5/10/45,
Callable 2/10/22 @ 100 (c) | | | 171,418 | | | | 172,367 | | |
Hilton USA Trust, Series 2016-SFP, Class A, 2.83%, 11/5/35 (a) (c) | | | 500,000 | | | | 502,106 | | |
JPMCC Mortgage Securities Trust, Series 2017-JP5, Class B, 4.08%,
3/15/50 (d) | | | 200,000 | | | | 220,507 | | |
OHA Credit Funding 2 Ltd., Series 2019-2A, Class CR, 2.39%
(LIBOR03M+220bps), 4/21/34, Callable 4/21/23 @ 100 (a) (b) | | | 600,000 | | | | 600,210 | | |
SLG Office Trust, Series 2021-OVA, Class A, 2.59%, 7/15/41 (a) | | | 600,000 | | | | 625,128 | | |
Wells Fargo Commercial Mortgage Trust, Series 2017-C42, Class B, 4.00%,
12/15/50 (d) | | | 150,000 | | | | 165,488 | | |
Total Collateralized Mortgage Obligations (Cost $6,856,966) | | | 6,864,720 | | |
Corporate Bonds (66.3%) | |
Communication Services (13.9%): | |
AMC Networks, Inc., 4.25%, 2/15/29, Callable 2/15/24 @ 102.13 (c) (e) | | | 1,000,000 | | | | 1,010,340 | | |
AT&T, Inc., 3.50%, 9/15/53, Callable 3/15/53 @ 100 (a) (c) | | | 1,000,000 | | | | 1,002,920 | | |
Charter Communications Operating LLC/Charter Communications
Operating Capital
2.30%, 2/1/32, Callable 11/1/31 @ 100 (c) | | | 800,000 | | | | 770,504 | | |
3.70%, 4/1/51, Callable 10/1/50 @ 100 | | | 130,000 | | | | 129,371 | | |
Cinemark USA, Inc., 5.25%, 7/15/28, Callable 7/15/24 @ 102.63 (a) (c) | | | 850,000 | | | | 871,633 | | |
Comcast Corp., 2.45%, 8/15/52, Callable 2/15/52 @ 100 | | | 400,000 | | | | 361,120 | | |
CSC Holdings LLC, 7.50%, 4/1/28, Callable 4/1/23 @ 103.75 (a) (c) | | | 1,000,000 | | | | 1,095,200 | | |
Frontier Communications Holdings LLC, 5.00%, 5/1/28,
Callable 5/1/24 @ 102.5 (a) | | | 500,000 | | | | 517,180 | | |
iHeartCommunications, Inc., 5.25%, 8/15/27, Callable 8/15/22 @ 102.63 (a) (c) | | | 1,000,000 | | | | 1,046,720 | | |
See notes to financial statements.
54
Victory Portfolios
Victory Strategic Income Fund | | Schedule of Portfolio Investments — continued
June 30, 2021 | |
(Unaudited)
Security Description | | Principal
Amount | | Value | |
Scripps Escrow, Inc., 5.88%, 7/15/27, Callable 7/15/22 @ 104.41 (a) | | $ | 250,000 | | | $ | 258,858 | | |
Sinclair Television Group, Inc., 5.50%, 3/1/30, Callable 12/1/24 @ 102.75 (a) (c) | | | 1,500,000 | | | | 1,528,230 | | |
Sirius XM Radio, Inc., 5.50%, 7/1/29, Callable 7/1/24 @ 102.75 (a) (c) | | | 500,000 | | | | 544,745 | | |
Sprint Corp., 7.63%, 3/1/26, Callable 11/1/25 @ 100 | | | 500,000 | | | | 611,670 | | |
TEGNA, Inc., 5.00%, 9/15/29, Callable 9/15/24 @ 102.5 (c) | | | 1,000,000 | | | | 1,046,820 | | |
Univision Communications, Inc., 4.50%, 5/1/29, Callable 5/1/24 @ 102.25 (a) | | | 200,000 | | | | 201,504 | | |
ViacomCBS, Inc.
4.38%, 3/15/43 | | | 150,000 | | | | 173,158 | | |
4.95%, 5/19/50, Callable 11/19/49 @ 100 (e) | | | 250,000 | | | | 315,905 | | |
| | | | 11,485,878 | | |
Consumer Discretionary (8.8%): | |
Expedia Group, Inc., 2.95%, 3/15/31, Callable 12/15/30 @ 100 | | | 1,500,000 | | | | 1,526,100 | | |
General Motors Co., 5.95%, 4/1/49, Callable 10/1/48 @ 100 | | | 300,000 | | | | 408,444 | | |
Kohl's Corp., 5.55%, 7/17/45, Callable 1/17/45 @ 100 (c) (e) | | | 400,000 | | | | 479,664 | | |
Magic Mergeco, Inc., 7.88%, 5/1/29, Callable 5/1/24 @ 103.94 (a) | | | 500,000 | | | | 515,195 | | |
Marriott International, Inc., 2.85%, 4/15/31, Callable 1/15/31 @ 100 (c) (e) | | | 1,750,000 | | | | 1,778,385 | | |
MGM Resorts International, 5.50%, 4/15/27, Callable 1/15/27 @ 100 | | | 500,000 | | | | 548,960 | | |
PetSmart, Inc./PetSmart Finance Corp., 7.75%, 2/15/29,
Callable 2/15/24 @ 103.88 (a) (c) | | | 750,000 | | | | 827,220 | | |
Viking Cruises Ltd., 13.00%, 5/15/25, Callable 5/15/22 @ 109.75 (a) (c) | | | 1,000,000 | | | | 1,176,040 | | |
| | | | 7,260,008 | | |
Consumer Staples (5.3%): | |
Altria Group, Inc., 2.45%, 2/4/32, Callable 11/4/31 @ 100 (c) | | | 1,400,000 | | | | 1,353,170 | | |
Constellation Brands, Inc.
2.88%, 5/1/30, Callable 2/1/30 @ 100 (c) (e) | | | 800,000 | | | | 840,200 | | |
4.10%, 2/15/48, Callable 8/15/47 @ 100 (c) | | | 500,000 | | | | 574,340 | | |
Kraft Heinz Foods Co., 4.25%, 3/1/31, Callable 12/1/30 @ 100 (c) | | | 1,400,000 | | | | 1,593,382 | | |
| | | | 4,361,092 | | |
Energy (6.3%): | |
Energy Transfer LP | |
3.75%, 5/15/30, Callable 2/15/30 @ 100 (c) (e) | | | 200,000 | | | | 217,436 | | |
5.00%, 5/15/50, Callable 11/15/49 @ 100 (c) | | | 400,000 | | | | 462,096 | | |
Hess Corp., 4.30%, 4/1/27, Callable 1/1/27 @ 100 (c) | | | 1,600,000 | | | | 1,782,336 | | |
Marathon Petroleum Corp., 4.50%, 4/1/48, Callable 10/1/47 @ 100 (c) | | | 280,000 | | | | 320,219 | | |
ONEOK, Inc., 3.40%, 9/1/29, Callable 6/1/29 @ 100 (c) (e) | | | 200,000 | | | | 213,236 | | |
Ovintiv Exploration, Inc., 5.38%, 1/1/26, Callable 10/1/25 @ 100 (c) (e) | | | 2,000,000 | | | | 2,255,120 | | |
| | | | 5,250,443 | | |
Financials (12.0%): | |
AON Corp., 2.80%, 5/15/30, Callable 2/15/30 @ 100 | | | 695,000 | | | | 731,168 | | |
Bank of America Corp.
2.69% (SOFR+110bps), 4/22/32, Callable 4/22/31 @ 100 (b) (c) | | | 1,000,000 | | | | 1,030,080 | | |
2.83% (SOFR+188bps), 10/24/51, Callable 10/24/50 @ 100, MTN (b) (c) | | | 700,000 | | | | 684,215 | | |
Chubb INA Holdings, Inc., 1.38%, 9/15/30, Callable 6/15/30 @ 100 | | | 1,000,000 | | | | 951,330 | | |
Citigroup, Inc., 4.65%, 7/23/48, Callable 6/23/48 @ 100 | | | 200,000 | | | | 261,968 | | |
CNA Financial Corp., 2.05%, 8/15/30, Callable 5/15/30 @ 100 (c) | | | 1,600,000 | | | | 1,572,880 | | |
Discover Bank, 2.70%, 2/6/30, Callable 11/6/29 @ 100 (c) (e) | | | 2,000,000 | | | | 2,093,960 | | |
General Motors Financial Co., Inc., 3.60%, 6/21/30, Callable 3/21/30 @ 100 (c) | | | 500,000 | | | | 541,980 | | |
See notes to financial statements.
55
Victory Portfolios
Victory Strategic Income Fund | | Schedule of Portfolio Investments — continued
June 30, 2021 | |
(Unaudited)
Security Description | | Principal
Amount | | Value | |
JPMorgan Chase & Co.
1.04% (SOFR+70bps), 2/4/27, Callable 2/4/26 @ 100 (b) (e) | | $ | 500,000 | | | $ | 491,455 | | |
3.33% (SOFR+158bps), 4/22/52, Callable 4/22/51 @ 100 (b) | | | 200,000 | | | | 213,446 | | |
Liberty Mutual Group, Inc., 3.95%, 10/15/50, Callable 4/15/50 @ 100 (a) | | | 200,000 | | | | 221,912 | | |
Morgan Stanley, 3.22% (SOFR+149bps), 4/22/42, Callable 4/22/41 @ 100 (b) | | | 200,000 | | | | 211,626 | | |
Willis North America, Inc., 2.95%, 9/15/29, Callable 6/15/29 @ 100 | | | 885,000 | | | | 930,816 | | |
| | | | 9,936,836 | | |
Health Care (2.6%): | |
AbbVie, Inc., 4.25%, 11/21/49, Callable 5/21/49 @ 100 (c) | | | 400,000 | | | | 479,596 | | |
Bausch Health Cos., Inc., 5.25%, 1/30/30, Callable 1/30/25 @ 102.63 (a) (c) | | | 1,000,000 | | | | 932,980 | | |
Surgery Center Holdings, Inc., 10.00%, 4/15/27, Callable 4/15/22 @ 105 (a) (e) | | | 500,000 | | | | 549,140 | | |
Team Health Holdings, Inc., 6.38%, 2/1/25, Callable 7/23/21 @ 101.59 (a) | | | 250,000 | | | | 237,970 | | |
| | | | 2,199,686 | | |
Industrials (8.6%): | |
Air Lease Corp.
4.63%, 10/1/28, Callable 7/1/28 @ 100 (c) (e) | | | 1,400,000 | | | | 1,582,154 | | |
3.00%, 2/1/30, Callable 11/1/29 @ 100, MTN | | | 400,000 | | | | 405,256 | | |
American Airlines, Inc., 11.75%, 7/15/25 (a) | | | 200,000 | | | | 250,962 | | |
Cargo Aircraft Management, Inc., 4.75%, 2/1/28, Callable 2/1/23 @ 102.38 (a) | | | 400,000 | | | | 409,564 | | |
Caterpillar, Inc.
1.90%, 3/12/31, Callable 12/12/30 @ 100 (e) | | | 500,000 | | | | 500,965 | | |
3.25%, 4/9/50, Callable 10/9/49 @ 100 | | | 100,000 | | | | 110,831 | | |
Cornerstone Building Brands, Inc., 6.13%, 1/15/29,
Callable 9/15/23 @ 103.06 (a) (c) | | | 1,000,000 | | | | 1,074,300 | | |
The Boeing Co.
5.15%, 5/1/30, Callable 2/1/30 @ 100 (c) | | | 800,000 | | | | 948,040 | | |
3.75%, 2/1/50, Callable 8/1/49 @ 100 | | | 400,000 | | | | 412,620 | | |
Waste Connections, Inc., 2.60%, 2/1/30, Callable 11/1/29 @ 100 | | | 1,000,000 | | | | 1,034,290 | | |
Waste Management, Inc.
1.50%, 3/15/31, Callable 12/15/30 @ 100 | | | 300,000 | | | | 283,923 | | |
2.50%, 11/15/50, Callable 5/15/50 @ 100 | | | 100,000 | | | | 93,246 | | |
| | | | 7,106,151 | | |
Information Technology (2.0%): | |
Broadcom, Inc., 4.30%, 11/15/32, Callable 8/15/32 @ 100 (c) | | | 1,450,000 | | | | 1,650,999 | | |
Materials (2.1%): | |
Amcor Flexibles North America, Inc., 2.69%, 5/25/31, Callable 2/25/31 @ 100 | | | 1,300,000 | | | | 1,325,337 | | |
Freeport-McMoRan, Inc., 5.45%, 3/15/43, Callable 9/15/42 @ 100 | | | 350,000 | | | | 427,896 | | |
| | | | 1,753,233 | | |
Real Estate (2.5%): | |
Simon Property Group LP, 2.20%, 2/1/31, Callable 11/1/30 @ 100 (c) (e) | | | 2,100,000 | | | | 2,074,401 | | |
Utilities (2.2%): | |
FirstEnergy Corp., 2.65%, 3/1/30, Callable 12/1/29 @ 100 (c) | | | 1,800,000 | | | | 1,790,100 | | |
Total Corporate Bonds (Cost $53,811,704) | | | 54,868,827 | | |
See notes to financial statements.
56
Victory Portfolios
Victory Strategic Income Fund | | Schedule of Portfolio Investments — continued
June 30, 2021 | |
(Unaudited)
Security Description | | Shares or
Principal
Amount | | Value | |
Residential Mortgage-Backed Securities (0.2%) | |
Bank of America Funding Corp., Series 2004-2, Class 1CB1, 5.75%, 9/20/34,
Callable 5/20/22 @ 100 (c) | | $ | 48,020 | | | $ | 50,123 | | |
Countrywide Home Loans, Inc., Series 2004-5, Class 2A9, 5.25%, 5/25/34,
Callable 7/25/21 @ 100 (c) | | | 71,546 | | | | 75,455 | | |
GSR Mortgage Loan Trust, Series 2004-15F, Class 5A1, 5.50%, 10/25/20,
Callable 3/25/30 @ 100 (c) | | | 1,614 | | | | 1,596 | | |
JPMorgan Mortgage Trust, Series 2005-A1, Class 6T1, 2.45%, 2/25/35,
Callable 7/25/21 @ 100 (c) (d) | | | 12,416 | | | | 12,416 | | |
JPMorgan Mortgage Trust, Series 2004-S2, Class 1A3, 4.75%, 11/25/34,
Callable 7/25/21 @ 100 (c) | | | 1,306 | | | | 944 | | |
Total Residential Mortgage-Backed Securities (Cost $137,301) | | | 140,534 | | |
Yankee Dollars (5.8%) | |
Energy (0.7%): | |
Cenovus Energy, Inc., 5.40%, 6/15/47, Callable 12/15/46 @ 100 | | | 500,000 | | | | 620,830 | | |
Financials (5.1%): | |
Credit Suisse Group AG, 3.87% (LIBOR03M+141bps), 1/12/29,
Callable 1/12/28 @ 100 (a) (b) (c) | | | 2,000,000 | | | | 2,200,960 | | |
NXP BV/NXP Funding LLC/NXP USA, Inc., 3.40%, 5/1/30,
Callable 2/1/30 @ 100 (a) (c) | | | 1,850,000 | | | | 2,016,759 | | |
| | | | 4,217,719 | | |
Total Yankee Dollars (Cost $4,749,126) | | | 4,838,549 | | |
U.S. Government Mortgage-Backed Agencies (0.1%) | |
Federal National Mortgage Association
3.50%, 7/1/43 (c) | | | 55,999 | | | | 60,090 | | |
Total U.S. Government Mortgage-Backed Agencies (Cost $57,244) | | | 60,090 | | |
U.S. Treasury Obligations (7.1%) | |
U.S. Treasury Bonds
1.88%, 2/15/41 (c) | | | 3,950,000 | | | | 3,867,914 | | |
1.38%, 8/15/50 | | | 500,000 | | | | 421,406 | | |
U.S. Treasury Notes
0.13%, 11/30/22 (c) | | | 700,000 | | | | 699,672 | | |
1.25%, 5/31/28 | | | 500,000 | | | | 501,328 | | |
1.63%, 5/15/31 | | | 390,000 | | | | 396,094 | | |
Total U.S. Treasury Obligations (Cost $5,792,336) | | | 5,886,414 | | |
Exchange-Traded Funds (9.2%) | |
Invesco Senior Loan ETF (c) | | | 171,700 | | | | 3,803,155 | | |
SPDR Blackstone Senior Loan ETF (c) | | | 82,000 | | | | 3,795,780 | | |
Total Exchange-Traded Funds (Cost $7,590,986) | | | 7,598,935 | | |
See notes to financial statements.
57
Victory Portfolios
Victory Strategic Income Fund | | Schedule of Portfolio Investments — continued
June 30, 2021 | |
(Unaudited)
Security Description | | Shares | | Value | |
Collateral for Securities Loaned^ (5.3%) | |
BlackRock Liquidity Funds TempFund Portfolio, Institutional Class, 0.04% (f) | | | 87,420 | | | $ | 87,420 | | |
Fidelity Investments Money Market Government Portfolio I Shares, 0.01% (f) | | | 2,367,939 | | | | 2,367,939 | | |
Goldman Sachs Financial Square Prime Obligations Fund, Institutional
Class, 0.02% (f) | | | 43,627 | | | | 43,627 | | |
JPMorgan Prime Money Market Fund, Capital Class, 0.07% (f) | | | 347,869 | | | | 347,869 | | |
Morgan Stanley Institutional Liquidity Prime Portfolio, Institutional
Class, 0.06% (f) | | | 1,564,088 | | | | 1,564,088 | | |
Total Collateral for Securities Loaned (Cost $4,410,943) | | | 4,410,943 | | |
Total Investments (Cost $84,177,300) — 103.2% | | | 85,440,458 | | |
Liabilities in excess of other assets — (3.2)% | | | (2,618,599 | ) | |
NET ASSETS — 100.00% | | $ | 82,821,859 | | |
^ Purchased with cash collateral from securities on loan.
(a) Rule 144A security or other security that is restricted as to resale to institutional investors. The Fund's Adviser has deemed this security to be liquid based upon procedures approved by the Board of Trustees. As of June 30, 2021, the fair value of these securities was $24,557,796 and amounted to 29.7% of net assets.
(b) Variable or Floating-Rate Security. Rate disclosed is as of June 30, 2021.
(c) All or a portion of this security has been segregated as collateral for derivative instruments.
(d) The rate for certain asset-backed and mortgage-backed securities may vary based on factors relating to the pool of assets underlying the security. The rate disclosed is the rate in effect at June 30, 2021.
(e) All or a portion of this security is on loan.
(f) Rate disclosed is the daily yield on June 30, 2021.
bps — Basis points
ETF — Exchange-Traded Fund
LIBOR — London InterBank Offered Rate
LIBOR03M — 3 Month US Dollar LIBOR, rate disclosed as of June 30, 2021, based on the last reset date of the security
LLC — Limited Liability Company
LP — Limited Partnership
MTN — Medium Term Note
SOFR — Secured Overnight Financing Rate
Futures Contracts Purchased
| | | Number of
Contracts | | Expiration
Date | | Notional
Amount | | Value | | Unrealized
Appreciation
(Depreciation) | |
2-Year U.S. Treasury Note Futures | | | 47 | | | 9/30/21 | | $ | 10,372,500 | | | $ | 10,355,055 | | | $ | (17,445 | ) | |
30-Year U.S. Treasury Bond Futures | | | 7 | | | 9/21/21 | | | 1,110,710 | | | | 1,125,250 | | | | 14,540 | | |
5-Year U.S. Treasury Note Futures | | | 17 | | | 9/30/21 | | | 2,098,493 | | | | 2,098,305 | | | | (188 | ) | |
Ultra Long Term U.S. Treasury Bond Futures | | | 14 | | | 9/21/21 | | | 2,649,358 | | | | 2,697,625 | | | | 48,267 | | |
| | | | | | | | | | | $ | 45,174 | | |
See notes to financial statements.
58
Victory Portfolios
Victory Strategic Income Fund | | Schedule of Portfolio Investments — continued
June 30, 2021 | |
(Unaudited)
Futures Contracts Sold
| | | Number of
Contracts | | Expiration
Date | | Notional
Amount | | Value | | Unrealized
Appreciation
(Depreciation) | |
U.S. 10-Year U.S. Treasury Note Futures | | | 158 | | | 9/21/21 | | $ | 22,972,522 | | | $ | 23,258,094 | | | $ | (285,572 | ) | |
Total unrealized appreciation | | $ | 62,807 | | |
Total unrealized depreciation | | | (303,205 | ) | |
Total net unrealized appreciation (depreciation) | | $ | (240,398 | ) | |
See notes to financial statements.
59
Victory Portfolios | | Statements of Assets and Liabilities
June 30, 2021 | |
(Unaudited)
| | | Victory INCORE
Investment Quality
Bond Fund | | Victory INCORE
Low Duration
Bond Fund | | Victory High
Yield Fund | |
Assets: | |
Investments, at value (Cost $25,357,178,
$238,621,145 and $301,670,018) | | $ | 26,381,076 | (a) | | $ | 242,471,594 | (b) | | $ | 312,882,372 | (c) | |
Cash | | | 673,866 | | | | 4,519,326 | | | | 12,680,800 | | |
Deposit with broker for futures contracts | | | 298,924 | | | | 1,222,681 | | | | — | | |
Deposit with broker for swap agreements | | | 274,872 | | | | 2,050,948 | | | | — | | |
Receivables: | |
Interest and dividends | | | 165,341 | | | | 1,316,059 | | | | 4,223,874 | | |
Capital shares issued | | | 1,046 | | | | 683,499 | | | | 1,163,893 | | |
Investments sold | | | 72,905 | | | | — | | | | 494,465 | | |
Variation margin on open futures contracts | | | 11,331 | | | | 27,249 | | | | — | | |
From Adviser | | | 22,028 | | | | 29,920 | | | | 25,104 | | |
Prepaid expenses | | | 25,472 | | | | 43,402 | | | | 50,332 | | |
Total Assets | | | 27,926,861 | | | | 252,364,678 | | | | 331,520,840 | | |
Liabilities: | |
Payables: | |
Collateral received on loaned securities | | | 829,707 | | | | 10,769,360 | | | | 24,477,216 | | |
Distributions | | | 776 | | | | 32,780 | | | | 189,183 | | |
Investments purchased | | | 146,018 | | | | — | | | | 9,150,625 | | |
Capital shares redeemed | | | 8,240 | | | | 594,421 | | | | 630,788 | | |
Variation margin on open futures contracts | | | 3,951 | | | | 18,003 | | | | — | | |
Accrued expenses and other payables: | |
Investment advisory fees | | | 11,129 | | | | 89,999 | | | | 142,255 | | |
Administration fees | | | 1,405 | | | | 12,448 | | | | 14,790 | | |
Custodian fees | | | 1,231 | | | | 2,911 | | | | 4,864 | | |
Transfer agent fees | | | 7,880 | | | | 40,593 | | | | 36,298 | | |
Compliance fees | | | 16 | | | | 130 | | | | 143 | | |
| 12b-1 fees | | | 3,089 | | | | 10,877 | | | | 20,825 | | |
Other accrued expenses | | | 11,126 | | | | 31,327 | | | | 27,519 | | |
Total Liabilities | | | 1,024,568 | | | | 11,602,849 | | | | 34,694,506 | | |
Net Assets: | |
Capital | | | 25,645,503 | | | | 266,092,296 | | | | 288,768,312 | | |
Total accumulated earnings/(loss) | | | 1,256,790 | | | | (25,330,467 | ) | | | 8,058,022 | | |
Net Assets | | $ | 26,902,293 | | | $ | 240,761,829 | | | $ | 296,826,334 | | |
Net Assets | |
Class A | | $ | 20,852,951 | | | $ | 79,264,829 | | | $ | 48,139,105 | | |
Class C | | | 625,689 | | | | 6,136,542 | | | | 29,172,834 | | |
Class R | | | 3,378,365 | | | | 1,066,556 | | | | 19,753,985 | | |
Class Y | | | 2,045,288 | | | | 154,293,902 | | | | 199,760,410 | | |
Total | | $ | 26,902,293 | | | $ | 240,761,829 | | | $ | 296,826,334 | | |
Shares (unlimited number of shares authorized
with a par value of $0.001 per share): | |
Class A | | | 2,065,137 | | | | 7,767,702 | | | | 6,934,448 | | |
Class C | | | 62,002 | | | | 601,292 | | | | 4,193,381 | | |
Class R | | | 333,736 | | | | 104,542 | | | | 2,838,131 | | |
Class Y | | | 202,810 | | | | 15,115,556 | | | | 28,915,822 | | |
Total | | | 2,663,685 | | | | 23,589,092 | | | | 42,881,782 | | |
Net asset value, offering (except Class A)
and redemption price per share: | |
Class A | | $ | 10.10 | | | $ | 10.20 | | | $ | 6.94 | | |
| Class C (d) | | | 10.09 | | | | 10.21 | | | | 6.96 | | |
| Class R | | | 10.12 | | | | 10.20 | | | | 6.96 | | |
| Class Y | | | 10.08 | | | | 10.21 | | | | 6.91 | | |
Maximum Sales Charge — Class A | | | 2.25 | % | | | 2.25 | % | | | 2.25 | % | |
Maximum offering price
(100%/(100%-maximum sales charge) of
net asset value adjusted to the nearest cent)
per share — Class A | | $ | 10.33 | | | $ | 10.43 | | | $ | 7.10 | | |
(a) Includes $807,442 of securities on loan.
(b) Includes $10,492,618 of securities on loan.
(c) Includes $23,579,203 of securities on loan.
(d) Redemption price per share varies by the length of time shares are held.
See notes to financial statements.
60
Victory Portfolios | | Statements of Assets and Liabilities
June 30, 2021 | |
(Unaudited)
| | | Victory
Tax-Exempt
Fund | | Victory
High Income
Municipal Bond
Fund | | Victory
Floating
Rate Fund | |
Assets: | |
Investments, at value (Cost $47,714,696,
$46,509,027 and $1,690,623,190) | | $ | 52,845,788 | | | $ | 49,864,955 | | | $ | 1,699,382,099 | | |
Cash | | | 34,223 | | | | 11,819 | | | | 212,290,903 | | |
Receivables: | |
Interest and dividends | | | 551,213 | | | | 570,307 | | | | 8,952,894 | | |
Capital shares issued | | | 5,473 | | | | 4,290 | | | | 6,694,890 | | |
Investments sold | | | — | | | | — | | | | 19,957,280 | | |
From Adviser | | | 26,792 | | | | 26,012 | | | | 143,500 | | |
Prepaid expenses | | | 20,006 | | | | 19,176 | | | | 155,395 | | |
Total Assets | | | 53,483,495 | | | | 50,496,559 | | | | 1,947,576,961 | | |
Liabilities: | |
Payables: | |
Distributions | | | 8,471 | | | | 8,398 | | | | 674,951 | | |
Investments purchased | | | — | | | | — | | | | 194,710,878 | | |
Capital shares redeemed | | | 269,808 | | | | 78,748 | | | | 12,913,307 | | |
Accrued expenses and other payables: | |
Investment advisory fees | | | 21,852 | | | | 20,577 | | | | 894,282 | | |
Administration fees | | | 2,743 | | | | 2,510 | | | | 80,282 | | |
Custodian fees | | | 1,303 | | | | 969 | | | | 39,262 | | |
Transfer agent fees | | | 14,970 | | | | 5,744 | | | | — | | |
Compliance fees | | | 28 | | | | 26 | | | | 687 | | |
Trustees' fees | | | — | | | | — | | | | 3,587 | | |
| 12b-1 fees | | | 4,698 | | | | 4,679 | | | | 61,153 | | |
Other accrued expenses | | | 11,225 | | | | 9,492 | | | | 18,123 | | |
Total Liabilities | | | 335,098 | | | | 131,143 | | | | 209,396,512 | | |
Net Assets: | |
Capital | | | 47,244,949 | | | | 46,858,331 | | | | 1,913,433,170 | | |
Total accumulated earnings/(loss) | | | 5,903,448 | | | | 3,507,085 | | | | (175,252,721 | ) | |
Net Assets | | $ | 53,148,397 | | | $ | 50,365,416 | | | $ | 1,738,180,449 | | |
Net Assets | |
Class A | | $ | 36,401,939 | | | $ | 34,458,002 | | | $ | 303,771,050 | | |
Class C | | | 2,266,730 | | | | 2,789,666 | | | | 75,492,711 | | |
Class R | | | — | | | | — | | | | 534,127 | | |
Class Y | | | 14,479,728 | | | | 12,246,848 | | | | 1,357,498,419 | | |
Member Class | | | — | | | | 870,900 | | | | 884,142 | | |
Total | | $ | 53,148,397 | | | $ | 50,365,416 | | | $ | 1,738,180,449 | | |
Shares (unlimited number of shares authorized
with a par value of $0.001 per share): | |
Class A | | | 3,594,247 | | | | 3,087,823 | | | | 32,230,449 | | |
Class C | | | 223,913 | | | | 250,020 | | | | 8,008,221 | | |
Class R | | | — | | | | — | | | | 56,694 | | |
Class Y | | | 1,430,220 | | | | 1,097,389 | | | | 143,956,027 | | |
Member Class | | | — | | | | 78,020 | | | | 93,837 | | |
Total | | | 5,248,380 | | | | 4,513,252 | | | | 184,345,228 | | |
Net asset value, offering (except Class A) and
redemption price per share: | |
Class A | | $ | 10.13 | | | $ | 11.16 | | | $ | 9.42 | | |
| Class C (a) | | | 10.12 | | | $ | 11.16 | | | | 9.43 | | |
| Class R | | | — | | | $ | — | | | | 9.42 | | |
| Class Y | | | 10.12 | | | $ | 11.16 | | | | 9.43 | | |
Member Class | | | — | | | | 11.16 | | | | 9.42 | | |
Maximum Sales Charge — Class A | | | 2.25 | % | | | 2.25 | % | | | 2.25 | % | |
Maximum offering price
(100%/(100%-maximum sales charge) of
net asset value adjusted to the nearest cent)
per share — Class A | | $ | 10.36 | | | $ | 11.42 | | | $ | 9.64 | | |
(a) Redemption price per share varies by the length of time shares are held.
See notes to financial statements.
61
Victory Portfolios | | Statement of Assets and Liabilities
June 30, 2021 | |
(Unaudited)
| | | Victory
Strategic
Income Fund | |
Assets: | |
Investments, at value (Cost $84,177,300) | | $ | 85,440,458 | (a) | |
Cash | | | 472,029 | | |
Deposit with broker for futures contracts | | | 457,773 | | |
Receivables: | |
Interest and dividends | | | 744,884 | | |
Capital shares issued | | | 18,674 | | |
Investments sold | | | 1,154,719 | | |
Variation margin on open futures contracts | | | 24,494 | | |
From Adviser | | | 27,198 | | |
Prepaid expenses | | | 13,122 | | |
Total Assets | | | 88,353,351 | | |
Liabilities: | |
Payables: | |
Collateral received on loaned securities | | | 4,410,943 | | |
Distributions | | | 73,940 | | |
Investments purchased | | | 807,720 | | |
Capital shares redeemed | | | 73,427 | | |
Variation margin on open futures contracts | | | 81,547 | | |
Accrued expenses and other payables: | |
Investment advisory fees | | | 42,330 | | |
Administration fees | | | 4,550 | | |
Custodian fees | | | 2,431 | | |
Transfer agent fees | | | 15,281 | | |
Compliance fees | | | 42 | | |
| 12b-1 fees | | | 7,565 | | |
Other accrued expenses | | | 11,716 | | |
Total Liabilities | | | 5,531,492 | | |
Net Assets: | |
Capital | | | 80,440,906 | | |
Total accumulated earnings/(loss) | | | 2,380,953 | | |
Net Assets | | $ | 82,821,859 | | |
Net Assets | |
Class A | | $ | 43,391,956 | | |
Class C | | | 6,164,883 | | |
Class R | | | 2,860,660 | | |
Class Y | | | 30,404,360 | | |
Total | | $ | 82,821,859 | | |
Shares (unlimited number of shares authorized with a par value of $0.001 per share): | |
Class A | | | 4,000,515 | | |
Class C | | | 565,765 | | |
Class R | | | 262,329 | | |
Class Y | | | 2,818,785 | | |
Total | | | 7,647,394 | | |
Net asset value, offering (except Class A) and redemption price per share: | |
Class A | | $ | 10.85 | | |
| Class C (b) | | | 10.90 | | |
| Class R | | | 10.90 | | |
| Class Y | | | 10.79 | | |
Maximum Sales Charge — Class A | | | 2.25 | % | |
Maximum offering price
(100%/(100%-maximum
sales charge) of net asset value adjusted to the
nearest cent) per share — Class A | | $ | 11.10 | | |
(a) Includes $4,274,943 of securities on loan.
(b) Redemption price per share varies by the length of time shares are held.
See notes to financial statements.
62
Victory Portfolios | | Statements of Operations
For the Six Months Ended June 30, 2021 | |
(Unaudited)
| | | Victory INCORE
Investment Quality
Bond Fund | | Victory
INCORE
Low Duration
Bond Fund | | Victory
High
Yield Fund | |
Investment Income: | | | |
Dividends | | $ | 17,876 | | | $ | 138,085 | | | $ | 16,550 | | |
Interest | | | 288,229 | | | | 2,116,908 | | | | 8,400,547 | | |
Securities lending (net of fees) | | | 552 | | | | 3,618 | | | | 42,443 | | |
Total Income | | | 306,657 | | | | 2,258,611 | | | | 8,459,540 | | |
Expenses: | | | |
Investment advisory fees | | | 71,111 | | | | 555,510 | | | | 792,514 | | |
Administration fees | | | 7,982 | | | | 69,260 | | | | 74,000 | | |
Sub-Administration fees | | | 8,287 | | | | 8,288 | | | | 8,287 | | |
| 12b-1 fees — Class A | | | 27,155 | | | | 101,801 | | | | 54,062 | | |
| 12b-1 fees — Class C | | | 4,559 | | | | 42,983 | | | | 132,949 | | |
| 12b-1 fees — Class R | | | 8,710 | | | | 2,769 | | | | 48,034 | | |
Custodian fees | | | 5,096 | | | | 9,605 | | | | 13,473 | | |
Transfer agent fees — Class A | | | 18,140 | | | | 40,476 | | | | 17,165 | | |
Transfer agent fees — Class C | | | 1,171 | | | | 9,787 | | | | 4,485 | | |
Transfer agent fees — Class R | | | 3,293 | | | | 1,007 | | | | 2,086 | | |
Transfer agent fees — Class Y | | | 1,549 | | | | 79,153 | | | | 87,776 | | |
Trustees' fees | | | 1,752 | | | | 9,268 | | | | 9,071 | | |
Compliance fees | | | 111 | | | | 940 | | | | 950 | | |
Legal and audit fees | | | 6,038 | | | | 12,316 | | | | 13,179 | | |
State registration and filing fees | | | 28,049 | | | | 33,911 | | | | 40,013 | | |
Other expenses | | | 10,635 | | | | 24,628 | | | | 23,003 | | |
Total Expenses | | | 203,638 | | | | 1,001,702 | | | | 1,321,047 | | |
Expenses waived/reimbursed by Adviser | | | (67,619 | ) | | | (96,850 | ) | | | (88,775 | ) | |
Net Expenses | | | 136,019 | | | | 904,852 | | | | 1,232,272 | | |
Net Investment Income (Loss) | | | 170,638 | | | | 1,353,759 | | | | 7,227,268 | | |
Realized/Unrealized Gains (Losses) from
Investments: | | | |
Net realized gains (losses) from investment
securities | | | 189,966 | | | | 1,498,762 | | | | 4,256,744 | | |
Net realized gains (losses) from futures contracts | | | (139,021 | ) | | | 294,726 | | | | — | | |
Net realized gains (losses) from swap agreements | | | 36,573 | | | | 211,736 | | | | — | | |
Net change in unrealized appreciation/depreciation
on investment securities | | | (586,845 | ) | | | (1,637,059 | ) | | | 24,535 | | |
Net change in unrealized appreciation/depreciation
on futures contracts | | | 28,554 | | | | (39,968 | ) | | | — | | |
Net realized/unrealized gains (losses) on investments | | | (470,773 | ) | | | 328,197 | | | | 4,281,279 | | |
Change in net assets resulting from operations | | $ | (300,135 | ) | | $ | 1,681,956 | | | $ | 11,508,547 | | |
See notes to financial statements.
63
Victory Portfolios | | Statements of Operations
For the Six Months Ended June 30, 2021 | |
(Unaudited)
| | | Victory
Tax-Exempt
Fund | | Victory
High Income
Municipal Bond
Fund | | Victory
Floating
Rate Fund | |
Investment Income: | | | |
Dividends | | $ | — | | | $ | 44,514 | | | $ | — | | |
Interest | | | 1,057,377 | | | | 971,205 | | | | 30,253,722 | | |
Securities lending (net of fees) | | | 507 | | | | — | | | | — | | |
Total Income | | | 1,057,884 | | | | 1,015,719 | | | | 30,253,722 | | |
Expenses: | | | |
Investment advisory fees | | | 130,318 | | | | 117,376 | | | | 3,997,586 | | |
Administration fees | | | 14,616 | | | | 13,156 | | | | 343,309 | | |
Sub-Administration fees | | | 8,101 | | | | 8,136 | | | | 8,287 | | |
| 12b-1 fees — Class A | | | 44,458 | | | | 40,231 | | | | 310,650 | | |
| 12b-1 fees — Class C | | | 13,503 | | | | 17,187 | | | | 342,101 | | |
| 12b-1 fees — Class R | | | — | | | | — | | | | 1,103 | | |
Custodian fees | | | 3,698 | | | | 3,752 | | | | 123,919 | | |
Transfer agent fees — Class A | | | 13,882 | | | | 9,592 | | | | 99,184 | | |
Transfer agent fees — Class C | | | 2,901 | | | | 2,850 | | | | 44,746 | | |
Transfer agent fees — Class R | | | — | | | | — | | | | 265 | | |
Transfer agent fees — Class Y | | | 17,358 | | | | 4,018 | | | | 238,055 | | |
Transfer agent fees — Member Class | | | — | | | | 315 | | | | 326 | | |
Trustees' fees | | | 2,635 | | | | 2,259 | | | | 31,576 | | |
Compliance fees | | | 202 | | | | 171 | | | | 3,743 | | |
Legal and audit fees | | | 5,948 | | | | 5,888 | | | | 67,601 | | |
State registration and filing fees | | | 21,758 | | | | 30,333 | | | | 55,942 | | |
Interfund lending fees | | | 139 | | | | — | | | | — | | |
Other expenses | | | 7,962 | | | | 9,506 | | | | 97,217 | | |
Total Expenses | | | 287,479 | | | | 264,770 | | | | 5,765,610 | | |
Expenses waived/reimbursed by Adviser | | | (75,897 | ) | | | (76,600 | ) | | | (320,963 | ) | |
Net Expenses | | | 211,582 | | | | 188,170 | | | | 5,444,647 | | |
Net Investment Income (Loss) | | | 846,302 | | | | 827,549 | | | | 24,809,075 | | |
Realized/Unrealized Gains (Losses) from
Investments: | | | |
Net realized gains (losses) from investment
securities | | | 1,035,711 | | | | 245,684 | | | | (129,865 | ) | |
Net change in unrealized appreciation/depreciation
on investment securities | | | (44,251 | ) | | | 1,171,904 | | | | 7,982,825 | | |
Net realized/unrealized gains (losses) on investments | | | 991,460 | | | | 1,417,588 | | | | 7,852,960 | | |
Change in net assets resulting from operations | | $ | 1,837,762 | | | $ | 2,245,137 | | | $ | 32,662,035 | | |
See notes to financial statements.
64
Victory Portfolios | | Statement of Operations
For the Six Months Ended June 30, 2021 | |
(Unaudited)
| | | Victory
Strategic
Income Fund | |
Investment Income: | | | |
Dividends | | $ | 128,498 | | |
Interest | | | 1,170,191 | | |
Securities lending (net of fees) | | | 17,778 | | |
Total Income | | | 1,316,467 | | |
Expenses: | | | |
Investment advisory fees | | | 293,419 | | |
Administration fees | | | 27,472 | | |
Sub-Administration fees | | | 8,287 | | |
| 12b-1 fees — Class A | | | 52,866 | | |
| 12b-1 fees — Class C | | | 33,845 | | |
| 12b-1 fees — Class R | | | 7,191 | | |
Custodian fees | | | 7,104 | | |
Transfer agent fees — Class A | | | 7,664 | | |
Transfer agent fees — Class C | | | 2,617 | | |
Transfer agent fees — Class R | | | 259 | | |
Transfer agent fees — Class Y | | | 31,017 | | |
Trustees' fees | | | 4,134 | | |
Compliance fees | | | 375 | | |
Legal and audit fees | | | 8,493 | | |
State registration and filing fees | | | 27,960 | | |
Interfund lending fees | | | 197 | | |
Other expenses | | | 10,375 | | |
Total Expenses | | | 523,275 | | |
Expenses waived/reimbursed by Adviser | | | (74,851 | ) | |
Net Expenses | | | 448,424 | | |
Net Investment Income (Loss) | | | 868,043 | | |
Realized/Unrealized Gains (Losses) from Investments: | | | |
Net realized gains (losses) from investment securities | | | 298,254 | | |
Net realized gains (losses) from futures contracts | | | 110,604 | | |
Net realized gains (losses) from swap agreements | | | 90,280 | | |
Net change in unrealized appreciation/depreciation on investment securities | | | (2,051,431 | ) | |
Net change in unrealized appreciation/depreciation on futures contracts | | | (212,430 | ) | |
Net realized/unrealized gains (losses) on investments | | | (1,764,723 | ) | |
Change in net assets resulting from operations | | $ | (896,680 | ) | |
See notes to financial statements.
65
Victory Portfolios | | Statements of Changes in Net Assets | |
| | | Victory
INCORE Investment
Quality Bond Fund | | Victory
INCORE Low Duration
Bond Fund | | Victory
High Yield Fund | |
| | | Six
Months
Ended
June 30,
2021
(Unaudited) | | Year
Ended
December 31,
2020 | | Six
Months
Ended
June 30,
2021
(Unaudited) | | Year
Ended
December 31,
2020 | | Six
Months
Ended
June 30,
2021
(Unaudited) | | Year
Ended
December 31,
2020 | |
From Investment Activities: | |
Operations: | |
Net investment
income (loss) | | $ | 170,638 | | | $ | 469,256 | | | $ | 1,353,759 | | | $ | 3,749,720 | | | $ | 7,227,268 | | | $ | 11,999,966 | | |
Net realized gains
(losses) from
investments | | | 87,518 | | | | 956,039 | | | | 2,005,224 | | | | 1,551,713 | | | | 4,256,744 | | | | (286,139 | ) | |
Net change in
unrealized
appreciation/
depreciation on
investments | | | (558,291 | ) | | | 884,218 | | | | (1,677,027 | ) | | | 4,094,555 | | | | 24,535 | | | | 6,963,613 | | |
Change in net assets resulting
from operations | | | (300,135 | ) | | | 2,309,513 | | | | 1,681,956 | | | | 9,395,988 | | | | 11,508,547 | | | | 18,677,440 | | |
Distributions to Shareholders: | |
Class A | | | (193,987 | ) | | | (443,929 | ) | | | (491,629 | ) | | | (868,824 | ) | | | (1,159,925 | ) | | | (1,891,442 | ) | |
Class C | | | (4,063 | ) | | | (31,603 | ) | | | (15,700 | ) | | | (238,443 | ) | | | (617,406 | ) | | | (1,103,322 | ) | |
Class R | | | (23,960 | ) | | | (56,460 | ) | | | (4,321 | ) | | | (10,980 | ) | | | (486,563 | ) | | | (990,013 | ) | |
Class Y | | | (23,573 | ) | | | (74,664 | ) | | | (1,112,755 | ) | | | (2,422,766 | ) | | | (4,935,344 | ) | | | (8,004,170 | ) | |
From return of capital: | |
Class A | | | — | | | | — | | | | — | | | | (220,729 | ) | | | — | | | | — | | |
Class C | | | — | | | | — | | | | — | | | | (60,578 | ) | | | — | | | | — | | |
Class R | | | — | | | | — | | | | — | | | | (2,790 | ) | | | — | | | | — | | |
Class Y | | | — | | | | — | | | | — | | | | (615,514 | ) | | | — | | | | — | | |
Change in net assets resulting
from distributions to
shareholders | | | (245,583 | ) | | | (606,656 | ) | | | (1,624,405 | ) | | | (4,440,624 | ) | | | (7,199,238 | ) | | | (11,988,947 | ) | |
Change in net assets resulting
from capital transactions | | | (2,873,525 | ) | | | (2,983,450 | ) | | | (19,615,716 | ) | | | (11,232,054 | ) | | | 39,898,502 | | | | 66,176,609 | | |
Change in net assets | | | (3,419,243 | ) | | | (1,280,593 | ) | | | (19,558,165 | ) | | | (6,276,690 | ) | | | 44,207,811 | | | | 72,865,102 | | |
Net Assets: | |
Beginning of period | | | 30,321,536 | | | | 31,602,129 | | | | 260,319,994 | | | | 266,596,684 | | | | 252,618,523 | | | | 179,753,421 | | |
End of period | | $ | 26,902,293 | | | $ | 30,321,536 | | | $ | 240,761,829 | | | $ | 260,319,994 | | | $ | 296,826,334 | | | $ | 252,618,523 | | |
(continues on next page)
See notes to financial statements.
66
Victory Portfolios | | Statements of Changes in Net Assets | |
(continued)
| | | Victory
INCORE Investment
Quality Bond Fund | | Victory
INCORE Low Duration
Bond Fund | | Victory
High Yield Fund | |
| | | Six
Months
Ended
June 30,
2021
(Unaudited) | | Year
Ended
December 31,
2020 | | Six
Months
Ended
June 30,
2021
(Unaudited) | | Year
Ended
December 31,
2020 | | Six
Months
Ended
June 30,
2021
(Unaudited) | | Year
Ended
December 31,
2020 | |
Capital Transactions: | |
Class A | |
Proceeds from shares
issued | | $ | 2,550,802 | | | $ | 3,741,042 | | | $ | 22,056,456 | | | $ | 26,390,247 | | | $ | 12,530,317 | | | $ | 11,313,136 | | |
Distributions reinvested | | | 188,528 | | | | 432,981 | | | | 445,209 | | | | 998,870 | | | | 782,179 | | | | 1,207,222 | | |
Cost of shares redeemed | | | (2,904,733 | ) | | | (5,934,340 | ) | | | (13,620,882 | ) | | | (20,255,290 | ) | | | (4,597,602 | ) | | | (6,047,019 | ) | |
Total Class A | | $ | (165,403 | ) | | $ | (1,760,317 | ) | | $ | 8,880,783 | | | $ | 7,133,827 | | | $ | 8,714,894 | | | $ | 6,473,339 | | |
Class C | |
Proceeds from shares
issued | | $ | 918 | | | $ | 371,418 | | | $ | 829,504 | | | $ | 1,293,466 | | | $ | 5,356,966 | | | $ | 6,325,319 | | |
Distributions reinvested | | | 4,020 | | | | 28,275 | | | | 14,577 | | | | 255,292 | | | | 285,153 | | | | 363,233 | | |
Cost of shares redeemed | | | (1,877,878 | ) | | | (853,248 | ) | | | (18,224,304 | ) | | | (17,694,441 | ) | | | (2,856,686 | ) | | | (2,370,736 | ) | |
Total Class C | | $ | (1,872,940 | ) | | $ | (453,555 | ) | | $ | (17,380,223 | ) | | $ | (16,145,683 | ) | | $ | 2,785,433 | | | $ | 4,317,816 | | |
Class R | |
Proceeds from shares
issued | | $ | 109,647 | | | $ | 520,871 | | | $ | 61,327 | | | $ | 440,750 | | | $ | 795,167 | | | $ | 573,952 | | |
Distributions reinvested | | | 23,927 | | | | 56,322 | | | | 4,300 | | | | 13,406 | | | | 50,588 | | | | 101,913 | | |
Cost of shares redeemed | | | (293,272 | ) | | | (529,270 | ) | | | (128,090 | ) | | | (494,683 | ) | | | (650,981 | ) | | | (503,868 | ) | |
Total Class R | | $ | (159,698 | ) | | $ | 47,923 | | | $ | (62,463 | ) | | $ | (40,527 | ) | | $ | 194,774 | | | $ | 171,997 | | |
Class Y | |
Proceeds from shares
issued | | $ | 363,404 | | | $ | 1,142,128 | | | $ | 32,831,262 | | | $ | 84,768,131 | | | $ | 98,404,996 | | | $ | 169,162,794 | | |
Distributions reinvested | | | 23,506 | | | | 73,672 | | | | 909,996 | | | | 2,450,105 | | | | 4,928,562 | | | | 7,507,572 | | |
Cost of shares redeemed | | | (1,062,394 | ) | | | (2,033,301 | ) | | | (44,795,071 | ) | | | (89,397,907 | ) | | | (75,130,157 | ) | | | (121,456,909 | ) | |
Total Class Y | | $ | (675,484 | ) | | $ | (817,501 | ) | | $ | (11,053,813 | ) | | $ | (2,179,671 | ) | | $ | 28,203,401 | | | $ | 55,213,457 | | |
Change in net assets resulting
from capital transactions | | $ | (2,873,525 | ) | | $ | (2,983,450 | ) | | $ | (19,615,716 | ) | | $ | (11,232,054 | ) | | $ | 39,898,502 | | | $ | 66,176,609 | | |
(continues on next page)
See notes to financial statements.
67
Victory Portfolios | | Statements of Changes in Net Assets | |
(continued)
| | | Victory
INCORE Investment
Quality Bond Fund | | Victory
INCORE Low Duration
Bond Fund | | Victory
High Yield Fund | |
| | | Six
Months
Ended
June 30,
2021
(Unaudited) | | Year
Ended
December 31,
2020 | | Six
Months
Ended
June 30,
2021
(Unaudited) | | Year
Ended
December 31,
2020 | | Six
Months
Ended
June 30,
2021
(Unaudited) | | Year
Ended
December 31,
2020 | |
Share Transactions: | |
Class A | |
Issued | | | 251,115 | | | | 374,189 | | | | 2,160,697 | | | | 2,611,845 | | | | 1,818,188 | | | | 1,750,643 | | |
Reinvested | | | 18,765 | | | | 42,958 | | | | 43,629 | | | | 99,098 | | | | 113,516 | | | | 188,872 | | |
Redeemed | | | (288,916 | ) | | | (596,219 | ) | | | (1,333,577 | ) | | | (2,017,103 | ) | | | (667,089 | ) | | | (962,364 | ) | |
Total Class A | | | (19,036 | ) | | | (179,072 | ) | | | 870,749 | | | | 693,840 | | | | 1,264,615 | | | | 977,151 | | |
Class C | |
Issued | | | 91 | | | | 37,380 | | | | 81,284 | | | | 128,943 | | | | 775,142 | | | | 971,560 | | |
Reinvested | | | 399 | | | | 2,808 | | | | 1,428 | | | | 25,402 | | | | 41,253 | | | | 56,460 | | |
Redeemed | | | (184,364 | ) | | | (84,915 | ) | | | (1,786,359 | ) | | | (1,751,574 | ) | | | (414,446 | ) | | | (372,697 | ) | |
Total Class C | | | (183,874 | ) | | | (44,727 | ) | | | (1,703,647 | ) | | | (1,597,229 | ) | | | 401,949 | | | | 655,323 | | |
Class R | |
Issued | | | 10,899 | | | | 51,521 | | | | 6,013 | | | | 43,544 | | | | 115,003 | | | | 87,110 | | |
Reinvested | | | 2,376 | | | | 5,574 | | | | 421 | | | | 1,331 | | | | 7,320 | | | | 15,967 | | |
Redeemed | | | (29,168 | ) | | | (52,365 | ) | | | (12,542 | ) | | | (49,038 | ) | | | (94,299 | ) | | | (80,100 | ) | |
Total Class R | | | (15,893 | ) | | | 4,730 | | | | (6,108 | ) | | | (4,163 | ) | | | 28,024 | | | | 22,977 | | |
Class Y | |
Issued | | | 35,752 | | | | 114,222 | | | | 3,214,294 | | | | 8,403,448 | | | | 14,341,854 | | | | 27,361,536 | | |
Reinvested | | | 2,342 | | | | 7,320 | | | | 89,140 | | | | 242,992 | | | | 718,357 | | | | 1,177,131 | | |
Redeemed | | | (105,091 | ) | | | (203,029 | ) | | | (4,388,959 | ) | | | (8,905,756 | ) | | | (10,957,168 | ) | | | (19,870,790 | ) | |
Total Class Y | | | (66,997 | ) | | | (81,487 | ) | | | (1,085,525 | ) | | | (259,316 | ) | | | 4,103,043 | | | | 8,667,877 | | |
Change in Shares | | | (285,800 | ) | | | (300,556 | ) | | | (1,924,531 | ) | | | (1,166,868 | ) | | | 5,797,631 | | | | 10,323,328 | | |
See notes to financial statements.
68
Victory Portfolios | | Statements of Changes in Net Assets | |
| | | Victory
Tax-Exempt Fund | | Victory
High Income
Municipal Bond Fund | | Victory
Floating Rate Fund | |
| | | Six
Months
Ended
June 30,
2021
(Unaudited) | | Year
Ended
December 31,
2020 | | Six
Months
Ended
June 30,
2021
(Unaudited) | | Year
Ended
December 31,
2020 | | Six
Months
Ended
June 30,
2021
(Unaudited) | | Year
Ended
December 31,
2020 | |
From Investment Activities: | |
Operations: | |
Net investment
income (loss) | | $ | 846,302 | | | $ | 1,817,046 | | | $ | 827,549 | | | $ | 1,501,425 | | | $ | 24,809,075 | | | $ | 29,438,801 | | |
Net realized gains
(losses) from
investments | | | 1,035,711 | | | | 799,972 | | | | 245,684 | | | | 894,229 | | | | (129,865 | ) | | | (12,797,385 | ) | |
Net change in
unrealized
appreciation/
depreciation on
investments | | | (44,251 | ) | | | 651,008 | | | | 1,171,904 | | | | (455,689 | ) | | | 7,982,825 | | | | 6,115,431 | | |
Change in net assets resulting
from operations | | | 1,837,762 | | | | 3,268,026 | | | | 2,245,137 | | | | 1,939,965 | | | | 32,662,035 | | | | 22,756,847 | | |
Distributions to Shareholders: | |
Class A | | | (580,253 | ) | | | (1,310,488 | ) | | | (568,557 | ) | | | (900,322 | ) | | | (4,924,181 | ) | | | (7,509,760 | ) | |
Class C | | | (32,997 | ) | | | (275,865 | ) | | | (46,006 | ) | | | (416,434 | ) | | | (1,078,764 | ) | | | (5,483,129 | ) | |
Class R | | | — | | | | — | | | | — | | | | — | | | | (7,407 | ) | | | (13,890 | ) | |
Class Y | | | (232,892 | ) | | | (993,693 | ) | | | (203,111 | ) | | | (434,615 | ) | | | (18,944,390 | ) | | | (16,288,620 | ) | |
Member Class (a) | | | — | | | | — | | | | (9,750 | ) | | | (633 | ) | | | (8,640 | ) | | | (293 | ) | |
Change in net assets resulting
from distributions to
shareholders | | | (846,142 | ) | | | (2,580,046 | ) | | | (827,424 | ) | | | (1,752,004 | ) | | | (24,963,382 | ) | | | (29,295,692 | ) | |
Change in net assets resulting
from capital transactions | | | (9,339,313 | ) | | | (5,160,426 | ) | | | 3,418,509 | | | | 1,573,250 | | | | 1,066,519,725 | | | | 84,613,158 | | |
Change in net assets | | | (8,347,693 | ) | | | (4,472,446 | ) | | | 4,836,222 | | | | 1,761,211 | | | | 1,074,218,378 | | | | 78,074,313 | | |
Net Assets: | |
Beginning of period | | | 61,496,090 | | | | 65,968,536 | | | | 45,529,194 | | | | 43,767,983 | | | | 663,962,071 | | | | 585,887,758 | | |
End of period | | $ | 53,148,397 | | | $ | 61,496,090 | | | $ | 50,365,416 | | | $ | 45,529,194 | | | $ | 1,738,180,449 | | | $ | 663,962,071 | | |
(a) Victory High Income Municipal Bond Fund and Victory Floating Rate Fund Member Class commenced operations on November 3, 2020.
(continues on next page)
See notes to financial statements.
69
Victory Portfolios | | Statements of Changes in Net Assets | |
(continued)
| | | Victory
Tax-Exempt Fund | | Victory
High Income
Municipal Bond Fund | | Victory
Floating Rate Fund | |
| | | Six
Months
Ended
June 30,
2021
(Unaudited) | | Year
Ended
December 31,
2020 | | Six
Months
Ended
June 30,
2021
(Unaudited) | | Year
Ended
December 31,
2020 | | Six
Months
Ended
June 30,
2021
(Unaudited) | | Year
Ended
December 31,
2020 | |
Capital Transactions: | |
Class A | |
Proceeds from shares
issued | | $ | 5,418,762 | | | $ | 5,775,996 | | | $ | 8,862,450 | | | $ | 9,315,877 | | | $ | 169,648,085 | | | $ | 79,846,398 | | |
Distributions
reinvested | | | 532,806 | | | | 1,202,398 | | | | 528,493 | | | | 818,111 | | | | 4,367,922 | | | | 6,658,816 | | |
Cost of shares
redeemed | | | (2,210,291 | ) | | | (5,606,292 | ) | | | (2,225,065 | ) | | | (3,158,508 | ) | | | (36,899,762 | ) | | | (66,492,431 | ) | |
Total Class A | | $ | 3,741,277 | | | $ | 1,372,102 | | | $ | 7,165,878 | | | $ | 6,975,480 | | | $ | 137,116,245 | | | $ | 20,012,783 | | |
Class C | |
Proceeds from
shares issued | | $ | 108,177 | | | $ | 658,815 | | | $ | 147,257 | | | $ | 382,792 | | | $ | 31,267,162 | | | $ | 8,695,794 | | |
Distributions
reinvested | | | 30,841 | | | | 245,751 | | | | 42,521 | | | | 379,132 | | | | 999,186 | | | | 4,727,020 | | |
Cost of shares
redeemed | | | (4,434,483 | ) | | | (5,678,979 | ) | | | (6,888,045 | ) | | | (5,351,211 | ) | | | (52,462,719 | ) | | | (63,036,997 | ) | |
Total Class C | | $ | (4,295,465 | ) | | $ | (4,774,413 | ) | | $ | (6,698,267 | ) | | $ | (4,589,287 | ) | | $ | (20,196,371 | ) | | $ | (49,614,183 | ) | |
Class R | |
Proceeds from
shares issued | | $ | — | | | $ | — | | | $ | — | | | $ | — | | | $ | 293,259 | | | $ | 81,023 | | |
Distributions
reinvested | | | — | | | | — | | | | — | | | | — | | | | 7,293 | | | | 13,070 | | |
Cost of shares
redeemed | | | — | | | | — | | | | — | | | | — | | | | (69,240 | ) | | | (245,870 | ) | |
Total Class R | | $ | — | | | $ | — | | | $ | — | | | $ | — | | | $ | 231,312 | | | $ | (151,777 | ) | |
Class Y | |
Proceeds from
shares issued | | $ | 2,432,242 | | | $ | 4,408,153 | | | $ | 3,016,825 | | | $ | 2,332,661 | | | $ | 1,051,360,740 | | | $ | 286,860,980 | | |
Distributions
reinvested | | | 225,519 | | | | 974,393 | | | | 197,094 | | | | 417,909 | | | | 16,588,186 | | | | 14,104,888 | | |
Cost of shares
redeemed | | | (11,442,886 | ) | | | (7,140,661 | ) | | | (975,734 | ) | | | (3,702,429 | ) | | | (119,400,144 | ) | | | (186,660,948 | ) | |
Total Class Y | | $ | (8,785,125 | ) | | $ | (1,758,115 | ) | | $ | 2,238,185 | | | $ | (951,859 | ) | | $ | 948,548,782 | | | $ | 114,304,920 | | |
Member Class (a) | |
Proceeds from shares
issued | | $ | — | | | $ | — | | | $ | 753,397 | | | $ | 138,283 | | | $ | 914,225 | | | $ | 69,505 | | |
Distributions
reinvested | | | — | | | | — | | | | 9,749 | | | | 633 | | | | 8,640 | | | | 290 | | |
Cost of shares
redeemed | | | — | | | | — | | | | (50,433 | ) | | | — | | | | (103,108 | ) | | | (8,380 | ) | |
Total Member
Class | | $ | — | | | $ | — | | | $ | 712,713 | | | $ | 138,916 | | | $ | 819,757 | | | $ | 61,415 | | |
Change in net assets resulting from
capital transactions | | $ | (9,339,313 | ) | | $ | (5,160,426 | ) | | $ | 3,418,509 | | | $ | 1,573,250 | | | $ | 1,066,519,725 | | | $ | 84,613,158 | | |
(a) Victory High Income Municipal Bond Fund and Victory Floating Rate Fund Member Class commenced operations on November 3, 2020.
(continues on next page)
See notes to financial statements.
70
Victory Portfolios | | Statements of Changes in Net Assets | |
(continued)
| | | Victory
Tax-Exempt Fund | | Victory
High Income
Municipal Bond Fund | | Victory
Floating Rate Fund | |
| | | Six
Months
Ended
June 30,
2021
(Unaudited) | | Year
Ended
December 31,
2020 | | Six
Months
Ended
June 30,
2021
(Unaudited) | | Year
Ended
December 31,
2020 | | Six
Months
Ended
June 30,
2021
(Unaudited) | | Year
Ended
December 31,
2020 | |
Share Transactions: | |
Class A | |
Issued | | | 541,610 | | | | 591,255 | | | | 812,342 | | | | 869,235 | | | | 18,031,799 | | | | 8,856,174 | | |
Reinvested | | | 53,144 | | | | 122,799 | | | | 48,131 | | | | 76,906 | | | | 464,414 | | | | 752,843 | | |
Redeemed | | | (219,955 | ) | | | (568,616 | ) | | | (202,486 | ) | | | (297,732 | ) | | | (3,920,227 | ) | | | (7,516,037 | ) | |
Total Class A | | | 374,799 | | | | 145,438 | | | | 657,987 | | | | 648,409 | | | | 14,575,986 | | | | 2,092,980 | | |
Class C | |
Issued | | | 10,887 | | | | 67,589 | | | | 13,381 | | | | 35,772 | | | | 3,321,874 | | | | 966,114 | | |
Reinvested | | | 3,076 | | | | 25,122 | | | | 3,874 | | | | 35,679 | | | | 106,227 | | | | 535,700 | | |
Redeemed | | | (443,941 | ) | | | (583,439 | ) | | | (632,737 | ) | | | (507,680 | ) | | | (5,577,497 | ) | | | (7,162,986 | ) | |
Total Class C | | | (429,978 | ) | | | (490,728 | ) | | | (615,482 | ) | | | (436,229 | ) | | | (2,149,396 | ) | | | (5,661,172 | ) | |
Class R | |
Issued | | | — | | | | — | | | | — | | | | — | | | | 31,169 | | | | 8,818 | | |
Reinvested | | | — | | | | — | | | | — | | | | — | | | | 776 | | | | 1,480 | | |
Redeemed | | | — | | | | — | | | | — | | | | — | | | | (7,355 | ) | | | (26,479 | ) | |
Total Class R | | | — | | | | — | | | | — | | | | — | | | | 24,590 | | | | (16,181 | ) | |
Class Y | |
Issued | | | 242,463 | | | | 454,324 | | | | 274,860 | | | | 219,079 | | | | 111,661,895 | | | | 32,140,981 | | |
Reinvested | | | 22,495 | | | | 99,525 | | | | 17,943 | | | | 39,262 | | | | 1,762,364 | | | | 1,588,219 | | |
Redeemed | | | (1,149,416 | ) | | | (725,840 | ) | | | (88,822 | ) | | | (352,658 | ) | | | (12,683,600 | ) | | | (21,256,634 | ) | |
Total Class Y | | | (884,458 | ) | | | (171,991 | ) | | | 203,981 | | | | (94,317 | ) | | | 100,740,659 | | | | 12,472,566 | | |
Member Class (a) | |
Issued | | | — | | | | — | | | | 68,837 | | | | 12,839 | | | | 97,210 | | | | 7,549 | | |
Reinvested | | | — | | | | — | | | | 887 | | | | 59 | | | | 919 | | | | 31 | | |
Redeemed | | | — | | | | — | | | | (4,602 | ) | | | — | | | | (10,973 | ) | | | (899 | ) | |
Total Member Class | | | — | | | | — | | | | 65,122 | | | | 12,898 | | | | 87,156 | | | | 6,681 | | |
Change in Shares | | | (939,637 | ) | | | (517,281 | ) | | | 311,608 | | | | 130,761 | | | | 113,278,995 | | | | 8,894,874 | | |
(a) Victory High Income Municipal Bond Fund and Victory Floating Rate Fund Member Class commenced operations on November 3, 2020.
See notes to financial statements.
71
Victory Portfolios | | Statements of Changes in Net Assets | |
| | | Victory
Strategic Income Fund | |
| | | Six
Months
Ended
June 30,
2021
(Unaudited) | | Year
Ended
December 31,
2020 | |
From Investment Activities: | |
Operations: | |
Net investment income (loss) | | $ | 868,043 | | | $ | 1,095,766 | | |
Net realized gains (losses) from investments | | | 499,138 | | | | 3,530,799 | | |
Net change in unrealized appreciation/depreciation on investments | | | (2,263,861 | ) | | | 1,693,463 | | |
Change in net assets resulting from operations | | | (896,680 | ) | | | 6,320,028 | | |
Distributions to Shareholders: | |
Class A | | | (387,824 | ) | | | (1,174,119 | ) | |
Class C | | | (33,714 | ) | | | (212,356 | ) | |
Class R | | | (20,574 | ) | | | (78,861 | ) | |
Class Y | | | (450,108 | ) | | | (1,372,240 | ) | |
Change in net assets resulting from distributions to shareholders | | | (892,220 | ) | | | (2,837,576 | ) | |
Change in net assets resulting from capital transactions | | | (21,908,574 | ) | | | 52,004,480 | | |
Change in net assets | | | (23,697,474 | ) | | | 55,486,932 | | |
Net Assets: | |
Beginning of period | | | 106,519,333 | | | | 51,032,401 | | |
End of period | | $ | 82,821,859 | | | $ | 106,519,333 | | |
(continues on next page)
See notes to financial statements.
72
Victory Portfolios | | Statements of Changes in Net Assets | |
(continued)
| | | Victory
Strategic Income Fund | |
| | | Six
Months
Ended
June 30,
2021
(Unaudited) | | Year
Ended
December 31,
2020 | |
Capital Transactions: | |
Class A | |
Proceeds from shares issued | | $ | 5,461,461 | | | $ | 6,584,986 | | |
Distributions reinvested | | | 117,071 | | | | 249,590 | | |
Cost of shares redeemed | | | (2,766,377 | ) | | | (1,612,948 | ) | |
Total Class A | | $ | 2,812,155 | | | $ | 5,221,628 | | |
Class C | |
Proceeds from shares issued | | $ | 17,175 | | | $ | 1,041,663 | | |
Distributions reinvested | | | 20,498 | | | | 153,572 | | |
Cost of shares redeemed | | | (3,249,406 | ) | | | (1,365,907 | ) | |
Total Class C | | $ | (3,211,733 | ) | | $ | (170,672 | ) | |
Class R | |
Proceeds from shares issued | | $ | 2,208 | | | $ | 119,388 | | |
Distributions reinvested | | | 2,126 | | | | 9,184 | | |
Cost of shares redeemed | | | (101,689 | ) | | | (169,583 | ) | |
Total Class R | | $ | (97,355 | ) | | $ | (41,011 | ) | |
Class Y | |
Proceeds from shares issued | | $ | 24,097,911 | | | $ | 82,375,402 | | |
Distributions reinvested | | | 423,222 | | | | 1,284,394 | | |
Cost of shares redeemed | | | (45,932,774 | ) | | | (36,665,261 | ) | |
Total Class Y | | $ | (21,411,641 | ) | | $ | 46,994,535 | | |
Change in net assets resulting from capital transactions | | $ | (21,908,574 | ) | | $ | 52,004,480 | | |
Share Transactions: | |
Class A | |
Issued | | | 505,077 | | | | 608,160 | | |
Reinvested | | | 10,901 | | | | 23,022 | | |
Redeemed | | | (257,552 | ) | | | (150,322 | ) | |
Total Class A | | | 258,426 | | | | 480,860 | | |
Class C | |
Issued | | | 1,591 | | | | 98,031 | | |
Reinvested | | | 1,900 | | | | 14,102 | | |
Redeemed | | | (298,706 | ) | | | (128,480 | ) | |
Total Class C | | | (295,215 | ) | | | (16,347 | ) | |
Class R | |
Issued | | | 207 | | | | 10,816 | | |
Reinvested | | | 197 | | | | 845 | | |
Redeemed | | | (9,457 | ) | | | (15,565 | ) | |
Total Class R | | | (9,053 | ) | | | (3,904 | ) | |
Class Y | |
Issued | | | 2,238,873 | | | | 7,730,049 | | |
Reinvested | | | 39,659 | | | | 118,940 | | |
Redeemed | | | (4,330,504 | ) | | | (3,490,501 | ) | |
Total Class Y | | | (2,051,972 | ) | | | 4,358,488 | | |
Change in Shares | | | (2,097,814 | ) | | | 4,819,097 | | |
See notes to financial statements.
73
Victory Portfolios | | Financial Highlights | |
For a Share Outstanding Throughout Each Period
| | | | Investment Activities | | Distributions to
Shareholders From | |
| | | Net Asset
Value,
Beginning of
Period | | Net
Investment
Income
(Loss)(a) | | Net Realized
and Unrealized
Gains (Losses)
on Investments | | Total from
Investment
Activities | | Net
Investment
Income | | Net Realized
Gains from
Investments | |
Victory INCORE Investment Quality Bond Fund | |
Class A | |
Six Months Ended
June 30, 2021
(Unaudited) | | $ | 10.28 | | | | 0.06 | | | | (0.15 | ) | | | (0.09 | ) | | | (0.09 | ) | | | — | | |
Year Ended: | |
December 31, 2020 | | $ | 9.72 | | | | 0.16 | | | | 0.61 | | | | 0.77 | | | | (0.21 | ) | | | — | | |
December 31, 2019 | | $ | 9.26 | | | | 0.20 | | | | 0.49 | | | | 0.69 | | | | (0.23 | ) | | | — | | |
December 31, 2018 | | $ | 9.59 | | | | 0.21 | | | | (0.29 | ) | | | (0.08 | ) | | | (0.25 | ) | | | — | | |
December 31, 2017 | | $ | 9.48 | | | | 0.18 | | | | 0.16 | | | | 0.34 | | | | (0.23 | ) | | | — | | |
December 31, 2016 | | $ | 9.57 | | | | 0.22 | | | | 0.16 | | | | 0.38 | | | | (0.23 | ) | | | (0.24 | ) | |
Class C | |
Six Months Ended
June 30, 2021
(Unaudited) | | $ | 10.27 | | | | 0.03 | | | | (0.16 | ) | | | (0.13 | ) | | | (0.05 | ) | | | — | | |
Year Ended: | |
December 31, 2020 | | $ | 9.72 | | | | 0.08 | | | | 0.59 | | | | 0.67 | | | | (0.12 | ) | | | — | | |
December 31, 2019 | | $ | 9.25 | | | | 0.12 | | | | 0.49 | | | | 0.61 | | | | (0.14 | ) | | | — | | |
December 31, 2018 | | $ | 9.58 | | | | 0.13 | | | | (0.29 | ) | | | (0.16 | ) | | | (0.17 | ) | | | — | | |
December 31, 2017 | | $ | 9.47 | | | | 0.10 | | | | 0.16 | | | | 0.26 | | | | (0.15 | ) | | | — | | |
December 31, 2016 | | $ | 9.56 | | | | 0.14 | | | | 0.16 | | | | 0.30 | | | | (0.15 | ) | | | (0.24 | ) | |
Class R | |
Six Months Ended
June 30, 2021
(Unaudited) | | $ | 10.30 | | | | 0.04 | | | | (0.15 | ) | | | (0.11 | ) | | | (0.07 | ) | | | — | | |
Year Ended: | |
December 31, 2020 | | $ | 9.75 | | | | 0.12 | | | | 0.59 | | | | 0.71 | | | | (0.16 | ) | | | — | | |
December 31, 2019 | | $ | 9.28 | | | | 0.16 | | | | 0.50 | | | | 0.66 | | | | (0.19 | ) | | | — | | |
December 31, 2018 | | $ | 9.61 | | | | 0.18 | | | | (0.30 | ) | | | (0.12 | ) | | | (0.21 | ) | | | — | | |
December 31, 2017 | | $ | 9.50 | | | | 0.14 | | | | 0.16 | | | | 0.30 | | | | (0.19 | ) | | | — | | |
December 31, 2016 | | $ | 9.58 | | | | 0.19 | | | | 0.17 | | | | 0.36 | | | | (0.20 | ) | | | (0.24 | ) | |
Class Y | |
Six Months Ended
June 30, 2021
(Unaudited) | | $ | 10.27 | | | | 0.08 | | | | (0.17 | ) | | | (0.09 | ) | | | (0.10 | ) | | | — | | |
Year Ended: | |
December 31, 2020 | | $ | 9.71 | | | | 0.19 | | | | 0.60 | | | | 0.79 | | | | (0.23 | ) | | | — | | |
December 31, 2019 | | $ | 9.25 | | | | 0.22 | | | | 0.49 | | | | 0.71 | | | | (0.25 | ) | | | — | | |
December 31, 2018 | | $ | 9.58 | | | | 0.23 | | | | (0.29 | ) | | | (0.06 | ) | | | (0.27 | ) | | | — | | |
December 31, 2017 | | $ | 9.47 | | | | 0.20 | | | | 0.16 | | | | 0.36 | | | | (0.25 | ) | | | — | | |
December 31, 2016 | | $ | 9.56 | | | | 0.25 | | | | 0.16 | | | | 0.41 | | | | (0.26 | ) | | | (0.24 | ) | |
(a) Per share net investment income (loss) has been calculated using the average daily shares method.
(b) Not annualized for periods less than one year.
(c) Annualized for periods less than one year.
(d) Portfolio turnover is calculated on the basis of the Fund as a whole without distinguishing between the classes of shares issued.
See notes to financial statements.
74
Victory Portfolios | | Financial Highlights — continued | |
For a Share Outstanding Throughout Each Period
| | | | | Ratios to Average Net Assets | | Supplemental Data | |
| | | Total
Distributions | | Net Asset
Value,
End of
Period | | Total
Return
(Excludes
Sales
Charge)(b) | | Net
Expenses(c) | | Net
Investment
Income
(Loss)(c) | | Gross
Expenses(c) | | Net Assets,
End of
Period
(000's) | | Portfolio
Turnover(b)(d) | |
Victory INCORE Investment Quality Bond Fund | |
Class A | |
Six Months Ended
June 30, 2021
(Unaudited) | | | (0.09 | ) | | $ | 10.10 | | | | (0.88 | )% | | | 0.90 | % | | | 1.25 | % | | | 1.29 | % | | $ | 20,853 | | | | 33 | % | |
Year Ended: | |
December 31, 2020 | | | (0.21 | ) | | $ | 10.28 | | | | 7.94 | % | | | 0.90 | % | | | 1.60 | % | | | 1.27 | % | | $ | 21,423 | | | | 80 | % | |
December 31, 2019 | | | (0.23 | ) | | $ | 9.72 | | | | 7.49 | % | | | 0.90 | % | | | 2.13 | % | | | 1.23 | % | | $ | 22,004 | | | | 92 | % | |
December 31, 2018 | | | (0.25 | ) | | $ | 9.26 | | | | (0.80 | )% | | | 0.90 | % | | | 2.27 | % | | | 1.13 | % | | $ | 24,049 | | | | 115 | % | |
December 31, 2017 | | | (0.23 | ) | | $ | 9.59 | | | | 3.62 | % | | | 0.90 | % | | | 1.86 | % | | | 1.07 | % | | $ | 31,306 | | | | 70 | % | |
December 31, 2016 | | | (0.47 | ) | | $ | 9.48 | | | | 4.01 | % | | | 0.90 | % | | | 2.29 | % | | | 1.14 | % | | $ | 40,510 | | | | 148 | % | |
Class C | |
Six Months Ended
June 30, 2021
(Unaudited) | | | (0.05 | ) | | $ | 10.09 | | | | (1.30 | )% | | | 1.77 | % | | | 0.52 | % | | | 3.46 | % | | $ | 626 | | | | 33 | % | |
Year Ended: | |
December 31, 2020 | | | (0.12 | ) | | $ | 10.27 | | | | 6.89 | % | | | 1.77 | % | | | 0.76 | % | | | 2.39 | % | | $ | 2,526 | | | | 80 | % | |
December 31, 2019 | | | (0.14 | ) | | $ | 9.72 | | | | 6.65 | % | | | 1.77 | % | | | 1.28 | % | | | 2.23 | % | | $ | 2,824 | | | | 92 | % | |
December 31, 2018 | | | (0.17 | ) | | $ | 9.25 | | | | (1.66 | )% | | | 1.77 | % | | | 1.42 | % | | | 2.10 | % | | $ | 3,634 | | | | 115 | % | |
December 31, 2017 | | | (0.15 | ) | | $ | 9.58 | | | | 2.74 | % | | | 1.77 | % | | | 0.99 | % | | | 1.91 | % | | $ | 6,127 | | | | 70 | % | |
December 31, 2016 | | | (0.39 | ) | | $ | 9.47 | | | | 3.11 | % | | | 1.77 | % | | | 1.42 | % | | | 1.92 | % | | $ | 8,915 | | | | 148 | % | |
Class R | |
Six Months Ended
June 30, 2021
(Unaudited) | | | (0.07 | ) | | $ | 10.12 | | | | (1.07 | )% | | | 1.30 | % | | | 0.84 | % | | | 1.79 | % | | $ | 3,378 | | | | 33 | % | |
Year Ended: | |
December 31, 2020 | | | (0.16 | ) | | $ | 10.30 | | | | 7.37 | % | | | 1.30 | % | | | 1.16 | % | | | 1.84 | % | | $ | 3,603 | | | | 80 | % | |
December 31, 2019 | | | (0.19 | ) | | $ | 9.75 | | | | 7.14 | % | | | 1.30 | % | | | 1.71 | % | | | 1.83 | % | | $ | 3,362 | | | | 92 | % | |
December 31, 2018 | | | (0.21 | ) | | $ | 9.28 | | | | (1.20 | )% | | | 1.30 | % | | | 1.88 | % | | | 1.69 | % | | $ | 3,192 | | | | 115 | % | |
December 31, 2017 | | | (0.19 | ) | | $ | 9.61 | | | | 3.16 | % | | | 1.30 | % | | | 1.44 | % | | | 1.65 | % | | $ | 3,940 | | | | 70 | % | |
December 31, 2016 | | | (0.44 | ) | | $ | 9.50 | | | | 3.71 | % | | | 1.30 | % | | | 1.90 | % | | | 1.44 | % | | $ | 4,477 | | | | 148 | % | |
Class Y | |
Six Months Ended
June 30, 2021
(Unaudited) | | | (0.10 | ) | | $ | 10.08 | | | | (0.86 | )% | | | 0.66 | % | | | 1.54 | % | | | 1.48 | % | | $ | 2,045 | | | | 33 | % | |
Year Ended: | |
December 31, 2020 | | | (0.23 | ) | | $ | 10.27 | | | | 8.21 | % | | | 0.66 | % | | | 1.91 | % | | | 1.31 | % | | $ | 2,770 | | | | 80 | % | |
December 31, 2019 | | | (0.25 | ) | | $ | 9.71 | | | | 7.76 | % | | | 0.66 | % | | | 2.35 | % | | | 1.24 | % | | $ | 3,412 | | | | 92 | % | |
December 31, 2018 | | | (0.27 | ) | | $ | 9.25 | | | | (0.56 | )% | | | 0.66 | % | | | 2.51 | % | | | 1.12 | % | | $ | 3,265 | | | | 115 | % | |
December 31, 2017 | | | (0.25 | ) | | $ | 9.58 | | | | 3.87 | % | | | 0.66 | % | | | 2.09 | % | | | 0.98 | % | | $ | 4,421 | | | | 70 | % | |
December 31, 2016 | | | (0.50 | ) | | $ | 9.47 | | | | 4.26 | % | | | 0.66 | % | | | 2.53 | % | | | 0.94 | % | | $ | 6,133 | | | | 148 | % | |
See notes to financial statements.
75
Victory Portfolios | | Financial Highlights | |
For a Share Outstanding Throughout Each Period
| | | | | Investment Activities | | Distributions to
Shareholders From | |
| | | Net Asset
Value,
Beginning of
Period | | Net
Investment
Income
(Loss)(a) | | Net
Realized and
Unrealized
Gains
(Losses) on
Investments | | Total from
Investment
Activities | | Net
Investment
Income | | Return of
Capital | | Total
Distributions | |
Victory INCORE Low Duration Bond Fund | |
Class A | |
Six Months Ended
June 30, 2021
(Unaudited) | | $ | 10.20 | | | | 0.05 | | | | 0.01 | | | | 0.06 | | | | (0.06 | ) | | | — | | | | (0.06 | ) | |
Year Ended: | |
December 31,
2020 | | $ | 9.99 | | | | 0.14 | | | | 0.24 | | | | 0.38 | | | | (0.14 | ) | | | (0.03 | ) | | | (0.17 | ) | |
December 31,
2019 | | $ | 9.86 | | | | 0.19 | | | | 0.15 | | | | 0.34 | | | | (0.20 | ) | | | (0.01 | ) | | | (0.21 | ) | |
December 31,
2018 | | $ | 9.99 | | | | 0.16 | | | | (0.08 | ) | | | 0.08 | | | | (0.21 | ) | | | — | | | | (0.21 | ) | |
December 31,
2017 | | $ | 10.03 | | | | 0.12 | | | | 0.02 | | | | 0.14 | | | | (0.18 | ) | | | — | | | | (0.18 | ) | |
December 31,
2016 | | $ | 9.95 | | | | 0.12 | | | | 0.06 | | | | 0.18 | | | | (0.10 | ) | | | — | | | | (0.10 | ) | |
Class C | |
Six Months Ended
June 30, 2021
(Unaudited) | | $ | 10.20 | | | | 0.01 | | | | 0.02 | | | | 0.03 | | | | (0.02 | ) | | | — | | | | (0.02 | ) | |
Year Ended: | |
December 31,
2020 | | $ | 9.99 | | | | 0.08 | | | | 0.22 | | | | 0.30 | | | | (0.07 | ) | | | (0.02 | ) | | | (0.09 | ) | |
December 31,
2019 | | $ | 9.85 | | | | 0.12 | | | | 0.16 | | | | 0.28 | | | | (0.14 | ) | | | — | (f) | | | (0.14 | ) | |
December 31,
2018 | | $ | 9.99 | | | | 0.09 | | | | (0.09 | ) | | | — | (f) | | | (0.14 | ) | | | — | | | | (0.14 | ) | |
December 31,
2017 | | $ | 10.02 | | | | 0.04 | | | | 0.03 | | | | 0.07 | | | | (0.10 | ) | | | — | | | | (0.10 | ) | |
December 31,
2016 | | $ | 9.95 | | | | 0.04 | | | | 0.05 | | | | 0.09 | | | | (0.02 | ) | | | — | | | | (0.02 | ) | |
(a) Per share net investment income (loss) has been calculated using the average daily shares method.
(b) The Fund received monies related to a nonrecurring refund from the prior custodian. The corresponding impact to the total return was less than 0.005% for the period shown.
(c) Not annualized for periods less than one year.
(d) Annualized for periods less than one year.
(e) Portfolio turnover is calculated on the basis of the Fund as a whole without distinguishing between the classes of shares issued.
(f) Amount is less than $0.005 per share.
See notes to financial statements.
76
Victory Portfolios | | Financial Highlights — continued | |
For a Share Outstanding Throughout Each Period
| | | | | Ratios to Average Net Assets | | Supplemental Data | |
| | | Capital
Contributions
from Prior
Custodian,
Net(b) | | Net Asset
Value,
End of
Period | | Total
Return
(Excludes
Sales
Charge)(c) | | Net
Expenses(d) | | Net
Investment
Income
(Loss)(d) | | Gross
Expenses(d) | | Net Assets,
End of
Period
(000's) | | Portfolio
Turnover(c)(e) | |
Victory INCORE Low Duration Bond Fund | |
Class A | |
Six Months Ended
June 30, 2021
(Unaudited) | | | — | | | $ | 10.20 | | | | 0.60 | % | | | 0.85 | % | | | 0.99 | % | | | 0.93 | % | | $ | 79,265 | | | | 41 | % | |
Year Ended: | |
December 31,
2020 | | | — | | | $ | 10.20 | | | | 3.85 | % | | | 0.85 | % | | | 1.39 | % | | | 0.95 | % | | $ | 70,357 | | | | 85 | % | |
December 31,
2019 | | | — | | | $ | 9.99 | | | | 3.51 | % | | | 0.85 | % | | | 1.93 | % | | | 0.95 | % | | $ | 61,972 | | | | 50 | % | |
December 31,
2018 | | | — | | | $ | 9.86 | | | | 0.73 | % | | | 0.85 | % | | | 1.66 | % | | | 0.90 | % | | $ | 96,210 | | | | 45 | % | |
December 31,
2017 | | | — | | | $ | 9.99 | | | | 1.47 | % | | | 0.85 | % | | | 1.21 | % | | | 0.90 | % | | $ | 149,287 | | | | 62 | % | |
December 31,
2016 | | | — | (f) | | $ | 10.03 | | | | 1.80 | %(b) | | | 0.85 | % | | | 1.21 | % | | | 0.89 | % | | $ | 214,825 | | | | 49 | % | |
Class C | |
Six Months Ended
June 30, 2021
(Unaudited) | | | — | | | $ | 10.21 | | | | 0.30 | % | | | 1.62 | % | | | 0.22 | % | | | 1.99 | % | | $ | 6,137 | | | | 41 | % | |
Year Ended: | |
December 31,
2020 | | | — | | | $ | 10.20 | | | | 3.05 | % | | | 1.62 | % | | | 0.76 | % | | | 1.72 | % | | $ | 23,504 | | | | 85 | % | |
December 31,
2019 | | | — | | | $ | 9.99 | | | | 2.81 | % | | | 1.62 | % | | | 1.17 | % | | | 1.70 | % | | $ | 38,969 | | | | 50 | % | |
December 31,
2018 | | | — | | | $ | 9.85 | | | | (0.04 | )% | | | 1.62 | % | | | 0.88 | % | | | 1.68 | % | | $ | 62,103 | | | | 45 | % | |
December 31,
2017 | | | — | | | $ | 9.99 | | | | 0.70 | % | | | 1.62 | % | | | 0.44 | % | | | 1.65 | % | | $ | 82,847 | | | | 62 | % | |
December 31,
2016 | | | — | (f) | | $ | 10.02 | | | | 0.94 | %(b) | | | 1.62 | % | | | 0.44 | % | | | 1.65 | % | | $ | 117,544 | | | | 49 | % | |
See notes to financial statements.
77
Victory Portfolios | | Financial Highlights | |
For a Share Outstanding Throughout Each Period
| | | | Investment Activities | | Distributions to
Shareholders From | |
| | | Net Asset
Value,
Beginning of
Period | | Net
Investment
Income
(Loss)(a) | | Net
Realized and
Unrealized
Gains
(Losses) on
Investments | | Total from
Investment
Activities | | Net
Investment
Income | | Return of
Capital | | Total
Distributions | |
Victory INCORE Low Duration Bond Fund | |
Class R | |
Six Months Ended
June 30, 2021
(Unaudited) | | $ | 10.20 | | | | 0.03 | | | | 0.01 | | | | 0.04 | | | | (0.04 | ) | | | — | | | | (0.04 | ) | |
Year Ended: | |
December 31,
2020 | | $ | 9.99 | | | | 0.10 | | | | 0.24 | | | | 0.34 | | | | (0.10 | ) | | | (0.03 | ) | | | (0.13 | ) | |
December 31,
2019 | | $ | 9.86 | | | | 0.15 | | | | 0.15 | | | | 0.30 | | | | (0.16 | ) | | | (0.01 | ) | | | (0.17 | ) | |
December 31,
2018 | | $ | 9.99 | | | | 0.12 | | | | (0.08 | ) | | | 0.04 | | | | (0.17 | ) | | | — | | | | (0.17 | ) | |
December 31,
2017 | | $ | 10.02 | | | | 0.08 | | | | 0.03 | | | | 0.11 | | | | (0.14 | ) | | | — | | | | (0.14 | ) | |
December 31,
2016 | | $ | 9.95 | | | | 0.08 | | | | 0.05 | | | | 0.13 | | | | (0.06 | ) | | | — | | | | (0.06 | ) | |
Class Y | |
Six Months Ended
June 30, 2021
(Unaudited) | | $ | 10.20 | | | | 0.06 | | | | 0.02 | | | | 0.08 | | | | (0.07 | ) | | | — | | | | (0.07 | ) | |
Year Ended: | |
December 31,
2020 | | $ | 9.99 | | | | 0.17 | | | | 0.23 | | | | 0.40 | | | | (0.15 | ) | | | (0.04 | ) | | | (0.19 | ) | |
December 31,
2019 | | $ | 9.86 | | | | 0.21 | | | | 0.16 | | | | 0.37 | | | | (0.23 | ) | | | (0.01 | ) | | | (0.24 | ) | |
December 31,
2018 | | $ | 10.00 | | | | 0.19 | | | | (0.10 | ) | | | 0.09 | | | | (0.23 | ) | | | — | | | | (0.23 | ) | |
December 31,
2017 | | $ | 10.03 | | | | 0.15 | | | | 0.02 | | | | 0.17 | | | | (0.20 | ) | | | — | | | | (0.20 | ) | |
December 31,
2016 | | $ | 9.95 | | | | 0.14 | | | | 0.06 | | | | 0.20 | | | | (0.12 | ) | | | — | | | | (0.12 | ) | |
(a) Per share net investment income (loss) has been calculated using the average daily shares method.
(b) The Fund received monies related to a nonrecurring refund from the prior custodian. The corresponding impact to the total return was less than 0.005% for the period shown.
(c) Not annualized for periods less than one year.
(d) Annualized for periods less than one year.
(e) Portfolio turnover is calculated on the basis of the Fund as a whole without distinguishing between the classes of shares issued.
(f) Amount is less than $0.005 per share.
See notes to financial statements.
78
Victory Portfolios | | Financial Highlights — continued | |
For a Share Outstanding Throughout Each Period (continued)
| | | | | Ratios to Average Net Assets | | Supplemental Data | |
| | | Capital
Contribution
from Prior
Custodian,
Net(b) | | Net Asset
Value,
End of
Period | |
Total
Return(c) | | Net
Expenses(d) | | Net
Investment
Income
(Loss)(d) | | Gross
Expenses(d) | | Net Assets,
End of
Period
(000's) | | Portfolio
Turnover(c)(e) | |
Victory INCORE Low Duration Bond Fund | |
Class R | |
Six Months Ended
June 30, 2021
(Unaudited) | | | — | | | $ | 10.20 | | | | 0.39 | % | | | 1.27 | % | | | 0.57 | % | | | 2.31 | % | | $ | 1,067 | | | | 41 | % | |
Year Ended: | |
December 31,
2020 | | | — | | | $ | 10.20 | | | | 3.41 | % | | | 1.27 | % | | | 0.99 | % | | | 2.38 | % | | $ | 1,129 | | | | 85 | % | |
December 31,
2019 | | | — | | | $ | 9.99 | | | | 3.17 | % | | | 1.27 | % | | | 1.50 | % | | | 2.13 | % | | $ | 1,147 | | | | 50 | % | |
December 31,
2018 | | | — | | | $ | 9.86 | | | | 0.31 | % | | | 1.27 | % | | | 1.20 | % | | | 1.87 | % | | $ | 1,554 | | | | 45 | % | |
December 31,
2017 | | | — | | | $ | 9.99 | | | | 1.05 | % | | | 1.27 | % | | | 0.79 | % | | | 1.68 | % | | $ | 2,078 | | | | 62 | % | |
December 31,
2016 | | | — | (f) | | $ | 10.02 | | | | 1.33 | %(b) | | | 1.23 | % | | | 0.83 | % | | | 1.25 | % | | $ | 2,583 | | | | 49 | % | |
Class Y | |
Six Months Ended
June 30, 2021
(Unaudited) | | | — | | | $ | 10.21 | | | | 0.81 | % | | | 0.62 | % | | | 1.21 | % | | | 0.67 | % | | $ | 154,294 | | | | 41 | % | |
Year Ended: | |
December 31,
2020 | | | — | | | $ | 10.20 | | | | 4.08 | % | | | 0.62 | % | | | 1.64 | % | | | 0.68 | % | | $ | 165,330 | | | | 85 | % | |
December 31,
2019 | | | — | | | $ | 9.99 | | | | 3.76 | % | | | 0.62 | % | | | 2.12 | % | | | 0.69 | % | | $ | 164,509 | | | | 50 | % | |
December 31,
2018 | | | — | | | $ | 9.86 | | | | 0.96 | % | | | 0.62 | % | | | 1.87 | % | | | 0.68 | % | | $ | 180,034 | | | | 45 | % | |
December 31,
2017 | | | — | | | $ | 10.00 | | | | 1.71 | % | | | 0.62 | % | | | 1.44 | % | | | 0.65 | % | | $ | 271,294 | | | | 62 | % | |
December 31,
2016 | | | — | (f) | | $ | 10.03 | | | | 2.04 | %(b) | | | 0.60 | % | | | 1.42 | % | | | 0.63 | % | | $ | 334,841 | | | | 49 | % | |
See notes to financial statements.
79
Victory Portfolios | | Financial Highlights | |
For a Share Outstanding Throughout Each Period
| | | | | Investment Activities | | Distributions
to
Shareholders
From | | | |
| | | Net Asset
Value,
Beginning of
Period | | Net
Investment
Income
(Loss)(a) | | Net
Realized and
Unrealized
Gains
(Losses) on
Investments | | Total from
Investment
Activities | | Net
Investment
Income | |
Total
Distributions | | Net Asset
Value,
End of
Period | | Total
Return
(Excludes
Sales
Charge)*(b) | |
Victory High Yield Fund | |
Class A | |
Six Months Ended June 30, 2021
(Unaudited) | | $ | 6.83 | | | | 0.18 | | | | 0.11 | | | | 0.29 | | | | (0.18 | ) | | | (0.18 | ) | | $ | 6.94 | | | | 4.34 | % | |
Year Ended: | |
December 31, 2020 | | $ | 6.73 | | | | 0.37 | | | | 0.10 | | | | 0.47 | | | | (0.37 | ) | | | (0.37 | ) | | $ | 6.83 | | | | 7.61 | % | |
December 31, 2019 | | $ | 6.20 | | | | 0.37 | | | | 0.54 | | | | 0.91 | | | | (0.38 | ) | | | (0.38 | ) | | $ | 6.73 | | | | 14.90 | % | |
December 31, 2018 | | $ | 6.57 | | | | 0.39 | | | | (0.37 | ) | | | 0.02 | | | | (0.39 | ) | | | (0.39 | ) | | $ | 6.20 | | | | 0.28 | % | |
December 31, 2017 | | $ | 6.34 | | | | 0.39 | | | | 0.22 | | | | 0.61 | | | | (0.38 | ) | | | (0.38 | ) | | $ | 6.57 | | | | 9.93 | % | |
December 31, 2016 | | $ | 5.85 | | | | 0.38 | | | | 0.49 | | | | 0.87 | | | | (0.38 | ) | | | (0.38 | ) | | $ | 6.34 | | | | 15.40 | % | |
Class C | |
Six Months Ended June 30, 2021
(Unaudited) | | $ | 6.85 | | | | 0.16 | | | | 0.11 | | | | 0.27 | | | | (0.16 | ) | | | (0.16 | ) | | $ | 6.96 | | | | 3.97 | % | |
Year Ended: | |
December 31, 2020 | | $ | 6.75 | | | | 0.33 | | | | 0.10 | | | | 0.43 | | | | (0.33 | ) | | | (0.33 | ) | | $ | 6.85 | | | | 6.84 | % | |
December 31, 2019 | | $ | 6.21 | | | | 0.33 | | | | 0.54 | | | | 0.87 | | | | (0.33 | ) | | | (0.33 | ) | | $ | 6.75 | | | | 14.24 | % | |
December 31, 2018 | | $ | 6.58 | | | | 0.34 | | | | (0.36 | ) | | | (0.02 | ) | | | (0.35 | ) | | | (0.35 | ) | | $ | 6.21 | | | | (0.43 | )% | |
December 31, 2017 | | $ | 6.35 | | | | 0.34 | | | | 0.23 | | | | 0.57 | | | | (0.34 | ) | | | (0.34 | ) | | $ | 6.58 | | | | 9.19 | % | |
December 31, 2016 | | $ | 5.86 | | | | 0.34 | | | | 0.49 | | | | 0.83 | | | | (0.34 | ) | | | (0.34 | ) | | $ | 6.35 | | | | 14.58 | % | |
Class R | |
Six Months Ended June 30, 2021
(Unaudited) | | $ | 6.85 | | | | 0.17 | | | | 0.11 | | | | 0.28 | | | | (0.17 | ) | | | (0.17 | ) | | $ | 6.96 | | | | 4.19 | % | |
Year Ended: | |
December 31, 2020 | | $ | 6.75 | | | | 0.35 | | | | 0.10 | | | | 0.45 | | | | (0.35 | ) | | | (0.35 | ) | | $ | 6.85 | | | | 7.24 | % | |
December 31, 2019 | | $ | 6.22 | | | | 0.35 | | | | 0.53 | | | | 0.88 | | | | (0.35 | ) | | | (0.35 | ) | | $ | 6.75 | | | | 14.48 | % | |
December 31, 2018 | | $ | 6.59 | | | | 0.37 | | | | (0.37 | ) | | | — | (e) | | | (0.37 | ) | | | (0.37 | ) | | $ | 6.22 | | | | (0.07 | )% | |
December 31, 2017 | | $ | 6.35 | | | | 0.37 | | | | 0.23 | | | | 0.60 | | | | (0.36 | ) | | | (0.36 | ) | | $ | 6.59 | | | | 9.64 | % | |
December 31, 2016 | | $ | 5.87 | | | | 0.36 | | | | 0.48 | | | | 0.84 | | | | (0.36 | ) | | | (0.36 | ) | | $ | 6.35 | | | | 14.78 | % | |
Class Y | |
Six Months Ended June 30, 2021
(Unaudited) | | $ | 6.80 | | | | 0.19 | | | | 0.11 | | | | 0.30 | | | | (0.19 | ) | | | (0.19 | ) | | $ | 6.91 | | | | 4.50 | % | |
Year Ended: | |
December 31, 2020 | | $ | 6.70 | | | | 0.39 | | | | 0.10 | | | | 0.49 | | | | (0.39 | ) | | | (0.39 | ) | | $ | 6.80 | | | | 7.88 | % | |
December 31, 2019 | | $ | 6.17 | | | | 0.39 | | | | 0.53 | | | | 0.92 | | | | (0.39 | ) | | | (0.39 | ) | | $ | 6.70 | | | | 15.25 | % | |
December 31, 2018 | | $ | 6.54 | | | | 0.41 | | | | (0.37 | ) | | | 0.04 | | | | (0.41 | ) | | | (0.41 | ) | | $ | 6.17 | | | | 0.52 | % | |
December 31, 2017 | | $ | 6.31 | | | | 0.40 | | | | 0.23 | | | | 0.63 | | | | (0.40 | ) | | | (0.40 | ) | | $ | 6.54 | | | | 10.24 | % | |
December 31, 2016 | | $ | 5.82 | | | | 0.39 | | | | 0.49 | | | | 0.88 | | | | (0.39 | ) | | | (0.39 | ) | | $ | 6.31 | | | | 15.72 | % | |
* Includes adjustments in accordance with U.S. Generally Accepted Accounting Principles.
(a) Per share net investment income (loss) has been calculated using the average daily shares method.
(b) Not annualized for periods less than one year.
(c) Annualized for periods less than one year.
(d) Portfolio turnover is calculated on the basis of the Fund as a whole without distinguishing between the classes of shares issued.
(e) Amount is less than $0.005 per share.
See notes to financial statements.
80
Victory Portfolios | | Financial Highlights — continued | |
For a Share Outstanding Throughout Each Period
| | | Ratios to Average Net Assets | | Supplemental Data | |
| | | Net
Expenses(c) | | Net
Investment
Income
(Loss)(c) | | Gross
Expenses(c) | | Net Assets,
End of
Period
(000's) | | Portfolio
Turnover(b)(d) | |
Victory High Yield Fund | |
Class A | |
Six Months Ended June 30, 2021
(Unaudited) | | | 1.00 | % | | | 5.38 | % | | | 1.07 | % | | $ | 48,139 | | | | 42 | % | |
Year Ended: | |
December 31, 2020 | | | 1.00 | % | | | 5.85 | % | | | 1.12 | % | | $ | 38,735 | | | | 124 | % | |
December 31, 2019 | | | 1.00 | % | | | 5.70 | % | | | 1.12 | % | | $ | 31,602 | | | | 87 | % | |
December 31, 2018 | | | 1.00 | % | | | 6.01 | % | | | 1.12 | % | | $ | 23,797 | | | | 87 | % | |
December 31, 2017 | | | 1.00 | % | | | 5.99 | % | | | 1.13 | % | | $ | 21,882 | | | | 174 | % | |
December 31, 2016 | | | 1.00 | % | | | 6.32 | % | | | 1.18 | % | | $ | 25,530 | | | | 165 | % | |
Class C | |
Six Months Ended June 30, 2021
(Unaudited) | | | 1.70 | % | | | 4.67 | % | | | 1.78 | % | | $ | 29,173 | | | | 42 | % | |
Year Ended: | |
December 31, 2020 | | | 1.70 | % | | | 5.14 | % | | | 1.81 | % | | $ | 25,957 | | | | 124 | % | |
December 31, 2019 | | | 1.70 | % | | | 5.00 | % | | | 1.82 | % | | $ | 21,163 | | | | 87 | % | |
December 31, 2018 | | | 1.70 | % | | | 5.29 | % | | | 1.84 | % | | $ | 19,432 | | | | 87 | % | |
December 31, 2017 | | | 1.70 | % | | | 5.27 | % | | | 1.84 | % | | $ | 22,283 | | | | 174 | % | |
December 31, 2016 | | | 1.70 | % | | | 5.61 | % | | | 1.91 | % | | $ | 22,498 | | | | 165 | % | |
Class R | |
Six Months Ended June 30, 2021
(Unaudited) | | | 1.29 | % | | | 5.09 | % | | | 1.29 | % | | $ | 19,754 | | | | 42 | % | |
Year Ended: | |
December 31, 2020 | | | 1.33 | % | | | 5.51 | % | | | 1.33 | % | | $ | 19,248 | | | | 124 | % | |
December 31, 2019 | | | 1.33 | % | | | 5.37 | % | | | 1.33 | % | | $ | 18,818 | | | | 87 | % | |
December 31, 2018 | | | 1.35 | % | | | 5.64 | % | | | 1.35 | % | | $ | 17,595 | | | | 87 | % | |
December 31, 2017 | | | 1.35 | % | | | 5.61 | % | | | 1.36 | % | | $ | 19,217 | | | | 174 | % | |
December 31, 2016 | | | 1.35 | % | | | 5.96 | % | | | 1.45 | % | | $ | 18,742 | | | | 165 | % | |
Class Y | |
Six Months Ended June 30, 2021
(Unaudited) | | | 0.76 | % | | | 5.65 | % | | | 0.83 | % | | $ | 199,760 | | | | 42 | % | |
Year Ended: | |
December 31, 2020 | | | 0.76 | % | | | 6.11 | % | | | 0.90 | % | | $ | 168,677 | | | | 124 | % | |
December 31, 2019 | | | 0.76 | % | | | 5.96 | % | | | 0.92 | % | | $ | 108,171 | | | | 87 | % | |
December 31, 2018 | | | 0.76 | % | | | 6.32 | % | | | 0.97 | % | | $ | 21,060 | | | | 87 | % | |
December 31, 2017 | | | 0.76 | % | | | 6.27 | % | | | 1.04 | % | | $ | 5,213 | | | | 174 | % | |
December 31, 2016 | | | 0.76 | % | | | 6.54 | % | | | 1.00 | % | | $ | 6,938 | | | | 165 | % | |
See notes to financial statements.
81
Victory Portfolios | | Financial Highlights | |
For a Share Outstanding Throughout Each Period
| | | | Investment Activities | | Distributions to
Shareholders From | |
| | | Net Asset
Value,
Beginning of
Period | | Net
Investment
Income
(Loss)(a) | | Net Realized
and Unrealized
Gains (Losses)
on Investments | | Total from
Investment
Activities | | Net
Investment
Income | | Net Realized
Gains from
Investments | |
Victory Tax-Exempt Fund | |
Class A | |
Six Months Ended
June 30, 2021
(Unaudited) | | $ | 9.94 | | | | 0.16 | | | | 0.19 | | | | 0.35 | | | | (0.16 | ) | | | — | | |
Year Ended: | |
December 31, 2020 | | $ | 9.84 | | | | 0.29 | | | | 0.23 | | | | 0.52 | | | | (0.32 | ) | | | (0.10 | ) | |
December 31, 2019 | | $ | 9.47 | | | | 0.30 | | | | 0.53 | | | | 0.83 | | | | (0.34 | ) | | | (0.12 | ) | |
December 31, 2018 | | $ | 9.91 | | | | 0.36 | | | | (0.30 | ) | | | 0.06 | | | | (0.36 | ) | | | (0.14 | ) | |
December 31, 2017 | | $ | 9.65 | | | | 0.36 | | | | 0.39 | | | | 0.75 | | | | (0.37 | ) | | | (0.12 | ) | |
December 31, 2016 | | $ | 10.53 | | | | 0.35 | | | | (0.49 | ) | | | (0.14 | ) | | | (0.35 | ) | | | (0.39 | ) | |
Class C | |
Six Months Ended
June 30, 2021
(Unaudited) | | $ | 9.94 | | | | 0.12 | | | | 0.18 | | | | 0.30 | | | | (0.12 | ) | | | — | | |
Year Ended: | |
December 31, 2020 | | $ | 9.84 | | | | 0.22 | | | | 0.22 | | | | 0.44 | | | | (0.24 | ) | | | (0.10 | ) | |
December 31, 2019 | | $ | 9.47 | | | | 0.23 | | | | 0.52 | | | | 0.75 | | | | (0.26 | ) | | | (0.12 | ) | |
December 31, 2018 | | $ | 9.90 | | | | 0.28 | | | | (0.29 | ) | | | (0.01 | ) | | | (0.28 | ) | | | (0.14 | ) | |
December 31, 2017 | | $ | 9.65 | | | | 0.29 | | | | 0.37 | | | | 0.66 | | | | (0.29 | ) | | | (0.12 | ) | |
December 31, 2016 | | $ | 10.53 | | | | 0.26 | | | | (0.48 | ) | | | (0.22 | ) | | | (0.27 | ) | | | (0.39 | ) | |
Class Y | |
Six Months Ended
June 30, 2021
(Unaudited) | | $ | 9.94 | | | | 0.17 | | | | 0.18 | | | | 0.35 | | | | (0.17 | ) | | | — | | |
Year Ended: | |
December 31, 2020 | | $ | 9.84 | | | | 0.30 | | | | 0.23 | | | | 0.53 | | | | (0.33 | ) | | | (0.10 | ) | |
December 31, 2019 | | $ | 9.46 | | | | 0.30 | | | | 0.55 | | | | 0.85 | | | | (0.35 | ) | | | (0.12 | ) | |
December 31, 2018 | | $ | 9.90 | | | | 0.37 | | | | (0.30 | ) | | | 0.07 | | | | (0.37 | ) | | | (0.14 | ) | |
December 31, 2017 | | $ | 9.65 | | | | 0.37 | | | | 0.38 | | | | 0.75 | | | | (0.38 | ) | | | (0.12 | ) | |
December 31, 2016 | | $ | 10.52 | | | | 0.36 | | | | (0.48 | ) | | | (0.12 | ) | | | (0.36 | ) | | | (0.39 | ) | |
(a) Per share net investment income (loss) has been calculated using the average daily shares method.
(b) Not annualized for periods less than one year.
(c) Annualized for periods less than one year.
(d) Portfolio turnover is calculated on the basis of the Fund as a whole without distinguishing between the classes of shares issued.
See notes to financial statements.
82
Victory Portfolios | | Financial Highlights — continued | |
For a Share Outstanding Throughout Each Period
| | | | | Ratios to Average Net Assets | | Supplemental Data | |
| | | Total
Distributions | | Net Asset
Value,
End of
Period | | Total
Return
(Excludes
Sales
Charge)(b) | | Net
Expenses(c) | | Net
Investment
Income
(Loss)(c) | | Gross
Expenses(c) | | Net Assets,
End of
Period
(000's) | | Portfolio
Turnover(b)(d) | |
Victory Tax-Exempt Fund | |
Class A | |
Six Months Ended
June 30, 2021
(Unaudited) | | | (0.16 | ) | | $ | 10.13 | | | | 3.57 | % | | | 0.80 | % | | | 3.26 | % | | | 1.03 | % | | $ | 36,402 | | | | 1 | % | |
Year Ended: | |
December 31, 2020 | | | (0.42 | ) | | $ | 9.94 | | | | 5.39 | % | | | 0.80 | % | | | 3.00 | % | | | 1.04 | % | | $ | 32,001 | | | | 44 | % | |
December 31, 2019 | | | (0.46 | ) | | $ | 9.84 | | | | 8.82 | % | | | 0.80 | % | | | 3.04 | % | | | 1.02 | % | | $ | 30,251 | | | | 64 | % | |
December 31, 2018 | | | (0.50 | ) | | $ | 9.47 | | | | 0.69 | % | | | 0.80 | % | | | 3.68 | % | | | 0.97 | % | | $ | 29,993 | | | | 42 | % | |
December 31, 2017 | | | (0.49 | ) | | $ | 9.91 | | | | 7.89 | % | | | 0.80 | % | | | 3.70 | % | | | 0.96 | % | | $ | 37,570 | | | | 84 | % | |
December 31, 2016 | | | (0.74 | ) | | $ | 9.65 | | | | (1.40 | )% | | | 0.80 | % | | | 3.30 | % | | | 0.95 | % | | $ | 54,658 | | | | 39 | % | |
Class C | |
Six Months Ended
June 30, 2021
(Unaudited) | | | (0.12 | ) | | $ | 10.12 | | | | 3.07 | % | | | 1.60 | % | | | 2.46 | % | | | 2.40 | % | | $ | 2,267 | | | | 1 | % | |
Year Ended: | |
December 31, 2020 | | | (0.34 | ) | | $ | 9.94 | | | | 4.56 | % | | | 1.60 | % | | | 2.28 | % | | | 1.91 | % | | $ | 6,497 | | | | 44 | % | |
December 31, 2019 | | | (0.38 | ) | | $ | 9.84 | | | | 7.97 | % | | | 1.60 | % | | | 2.34 | % | | | 1.82 | % | | $ | 11,259 | | | | 64 | % | |
December 31, 2018 | | | (0.42 | ) | | $ | 9.47 | | | | (0.01 | )% | | | 1.60 | % | | | 2.88 | % | | | 1.78 | % | | $ | 17,986 | | | | 42 | % | |
December 31, 2017 | | | (0.41 | ) | | $ | 9.90 | | | | 6.92 | % | | | 1.60 | % | | | 2.89 | % | | | 1.74 | % | | $ | 26,520 | | | | 84 | % | |
December 31, 2016 | | | (0.66 | ) | | $ | 9.65 | | | | (2.19 | )% | | | 1.60 | % | | | 2.51 | % | | | 1.71 | % | | $ | 33,369 | | | | 39 | % | |
Class Y | |
Six Months Ended
June 30, 2021
(Unaudited) | | | (0.17 | ) | | $ | 10.12 | | | | 3.53 | % | | | 0.69 | % | | | 3.37 | % | | | 1.03 | % | | $ | 14,480 | | | | 1 | % | |
Year Ended: | |
December 31, 2020 | | | (0.43 | ) | | $ | 9.94 | | | | 5.51 | % | | | 0.69 | % | | | 3.12 | % | | | 0.85 | % | | $ | 22,998 | | | | 44 | % | |
December 31, 2019 | | | (0.47 | ) | | $ | 9.84 | | | | 9.06 | % | | | 0.69 | % | | | 3.07 | % | | | 0.83 | % | | $ | 24,459 | | | | 64 | % | |
December 31, 2018 | | | (0.51 | ) | | $ | 9.46 | | | | 0.80 | % | | | 0.69 | % | | | 3.79 | % | | | 0.77 | % | | $ | 20,260 | | | | 42 | % | |
December 31, 2017 | | | (0.50 | ) | | $ | 9.90 | | | | 7.90 | % | | | 0.69 | % | | | 3.80 | % | | | 0.73 | % | | $ | 27,420 | | | | 84 | % | |
December 31, 2016 | | | (0.75 | ) | | $ | 9.65 | | | | (1.20 | )% | | | 0.69 | % | | | 3.41 | % | | | 0.71 | % | | $ | 31,762 | | | | 39 | % | |
See notes to financial statements.
83
Victory Portfolios | | Financial Highlights | |
For a Share Outstanding Throughout Each Period
| | | | Investment Activities | | Distributions to
Shareholders From | |
| | | Net Asset
Value,
Beginning of
Period | | Net
Investment
Income
(Loss)(a) | | Net Realized
and Unrealized
Gains (Losses)
on Investments | | Total from
Investment
Activities | | Net
Investment
Income | | Net Realized
Gains from
Investments | |
Victory High Income Municipal Bond Fund | |
Class A | |
Six Months Ended
June 30, 2021
(Unaudited) | | $ | 10.84 | | | | 0.19 | | | | 0.32 | | | | 0.51 | | | | (0.19 | ) | | | — | | |
Year Ended: | |
December 31, 2020 | | $ | 10.75 | | | | 0.42 | | | | 0.15 | | | | 0.57 | | | | (0.39 | ) | | | (0.09 | ) | |
December 31, 2019 | | $ | 10.39 | | | | 0.35 | | | | 0.47 | | | | 0.82 | | | | (0.40 | ) | | | (0.06 | ) | |
December 31, 2018 | | $ | 10.79 | | | | 0.43 | | | | (0.40 | ) | | | 0.03 | | | | (0.43 | ) | | | — | | |
December 31, 2017 | | $ | 10.35 | | | | 0.46 | | | | 0.44 | | | | 0.90 | | | | (0.46 | ) | | | — | | |
December 31, 2016 | | $ | 10.89 | | | | 0.44 | | | | (0.54 | ) | | | (0.10 | ) | | | (0.44 | ) | | | — | | |
Class C | |
Six Months Ended
June 30, 2021
(Unaudited) | | $ | 10.84 | | | | 0.15 | | | | 0.32 | | | | 0.47 | | | | (0.15 | ) | | | — | | |
Year Ended: | |
December 31, 2020 | | $ | 10.75 | | | | 0.33 | | | | 0.16 | | | | 0.49 | | | | (0.31 | ) | | | (0.09 | ) | |
December 31, 2019 | | $ | 10.39 | | | | 0.28 | | | | 0.46 | | | | 0.74 | | | | (0.32 | ) | | | (0.06 | ) | |
December 31, 2018 | | $ | 10.79 | | | | 0.35 | | | | (0.40 | ) | | | (0.05 | ) | | | (0.35 | ) | | | — | | |
December 31, 2017 | | $ | 10.35 | | | | 0.38 | | | | 0.44 | | | | 0.82 | | | | (0.38 | ) | | | — | | |
December 31, 2016 | | $ | 10.89 | | | | 0.36 | | | | (0.54 | ) | | | (0.18 | ) | | | (0.36 | ) | | | — | | |
Class Y | |
Six Months Ended
June 30, 2021
(Unaudited) | | $ | 10.84 | | | | 0.20 | | | | 0.32 | | | | 0.52 | | | | (0.20 | ) | | | — | | |
Year Ended: | |
December 31, 2020 | | $ | 10.75 | | | | 0.44 | | | | 0.16 | | | | 0.60 | | | | (0.42 | ) | | | (0.09 | ) | |
December 31, 2019 | | $ | 10.39 | | | | 0.38 | | | | 0.47 | | | | 0.85 | | | | (0.43 | ) | | | (0.06 | ) | |
December 31, 2018 | | $ | 10.79 | | | | 0.46 | | | | (0.40 | ) | | | 0.06 | | | | (0.46 | ) | | | — | | |
December 31, 2017 | | $ | 10.35 | | | | 0.48 | | | | 0.44 | | | | 0.92 | | | | (0.48 | ) | | | — | | |
December 31, 2016 | | $ | 10.89 | | | | 0.47 | | | | (0.54 | ) | | | (0.07 | ) | | | (0.47 | ) | | | — | | |
Member Class | |
Six Months Ended
June 30, 2021
(Unaudited) | | $ | 10.84 | | | | 0.20 | | | | 0.32 | | | | 0.52 | | | | (0.20 | ) | | | — | | |
November 3, 2020(e)
through
December 31, 2020 | | $ | 10.56 | | | | 0.12 | | | | 0.31 | | | | 0.43 | | | | (0.06 | ) | | | (0.09 | ) | |
(a) Per share net investment income (loss) has been calculated using the average daily shares method.
(b) Not annualized for periods less than one year.
(c) Annualized for periods less than one year.
(d) Portfolio turnover is calculated on the basis of the Fund as a whole without distinguishing between the classes of shares issued.
(e) Commencement of operations.
See notes to financial statements.
84
Victory Portfolios | | Financial Highlights — continued | |
For a Share Outstanding Throughout Each Period
| | | | | Ratios to Average Net Assets | | Supplemental Data | |
| | | Total
Distributions | | Net Asset
Value,
End of
Period | | Total
Return
(Excludes
Sales
Charge)(b) | | Net
Expenses(c) | | Net
Investment
Income
(Loss)(c) | | Gross
Expenses(c) | | Net Assets,
End of
Period
(000's) | | Portfolio
Turnover(b)(d) | |
Victory High Income Municipal Bond Fund | |
Class A | |
Six Months Ended
June 30, 2021
(Unaudited) | | | (0.19 | ) | | $ | 11.16 | | | | 4.76 | % | | | 0.80 | % | | | 3.53 | % | | | 1.02 | % | | $ | 34,458 | | | | 9 | % | |
Year Ended: | |
December 31, 2020 | | | (0.48 | ) | | $ | 10.84 | | | | 5.52 | % | | | 0.80 | % | | | 3.95 | % | | | 1.10 | % | | $ | 26,330 | | | | 74 | % | |
December 31, 2019 | | | (0.46 | ) | | $ | 10.75 | | | | 8.04 | % | | | 0.80 | % | | | 3.27 | % | | | 1.09 | % | | $ | 19,153 | | | | 49 | % | |
December 31, 2018 | | | (0.43 | ) | | $ | 10.39 | | | | 0.34 | % | | | 0.80 | % | | | 4.13 | % | | | 1.02 | % | | $ | 16,483 | | | | 48 | % | |
December 31, 2017 | | | (0.46 | ) | | $ | 10.79 | | | | 8.85 | % | | | 0.80 | % | | | 4.31 | % | | | 0.96 | % | | $ | 25,831 | | | | 66 | % | |
December 31, 2016 | | | (0.44 | ) | | $ | 10.35 | | | | (1.04 | )% | | | 0.80 | % | | | 4.02 | % | | | 0.96 | % | | $ | 32,943 | | | | 49 | % | |
Class C | |
Six Months Ended
June 30, 2021
(Unaudited) | | | (0.15 | ) | | $ | 11.16 | | | | 4.38 | % | | | 1.57 | % | | | 2.71 | % | | | 2.23 | % | | $ | 2,790 | | | | 9 | % | |
Year Ended: | |
December 31, 2020 | | | (0.40 | ) | | $ | 10.84 | | | | 4.72 | % | | | 1.57 | % | | | 3.11 | % | | | 1.90 | % | | $ | 9,378 | | | | 74 | % | |
December 31, 2019 | | | (0.38 | ) | | $ | 10.75 | | | | 7.22 | % | | | 1.57 | % | | | 2.61 | % | | | 1.85 | % | | $ | 13,995 | | | | 49 | % | |
December 31, 2018 | | | (0.35 | ) | | $ | 10.39 | | | | (0.43 | )% | | | 1.57 | % | | | 3.35 | % | | | 1.78 | % | | $ | 19,282 | | | | 48 | % | |
December 31, 2017 | | | (0.38 | ) | | $ | 10.79 | | | | 8.01 | % | | | 1.57 | % | | | 3.54 | % | | | 1.73 | % | | $ | 25,175 | | | | 66 | % | |
December 31, 2016 | | | (0.36 | ) | | $ | 10.35 | | | | (1.79 | )% | | | 1.57 | % | | | 3.26 | % | | | 1.73 | % | | $ | 29,563 | | | | 49 | % | |
Class Y | |
Six Months Ended
June 30, 2021
(Unaudited) | | | (0.20 | ) | | $ | 11.16 | | | | 4.88 | % | | | 0.57 | % | | | 3.76 | % | | | 0.85 | % | | $ | 12,247 | | | | 9 | % | |
Year Ended: | |
December 31, 2020 | | | (0.51 | ) | | $ | 10.84 | | | | 5.76 | % | | | 0.57 | % | | | 4.14 | % | | | 0.93 | % | | $ | 9,682 | | | | 74 | % | |
December 31, 2019 | | | (0.49 | ) | | $ | 10.75 | | | | 8.29 | % | | | 0.57 | % | | | 3.56 | % | | | 0.88 | % | | $ | 10,620 | | | | 49 | % | |
December 31, 2018 | | | (0.46 | ) | | $ | 10.39 | | | | 0.57 | % | | | 0.57 | % | | | 4.36 | % | | | 0.78 | % | | $ | 11,683 | | | | 48 | % | |
December 31, 2017 | | | (0.48 | ) | | $ | 10.79 | | | | 9.10 | % | | | 0.57 | % | | | 4.55 | % | | | 0.73 | % | | $ | 26,864 | | | | 66 | % | |
December 31, 2016 | | | (0.47 | ) | | $ | 10.35 | | | | (0.81 | )% | | | 0.57 | % | | | 4.26 | % | | | 0.72 | % | | $ | 36,603 | | | | 49 | % | |
Member Class | |
Six Months Ended
June 30, 2021
(Unaudited) | | | (0.20 | ) | | $ | 11.16 | | | | 4.84 | % | | | 0.65 | % | | | 3.68 | % | | | 5.86 | % | | $ | 871 | | | | 9 | % | |
November 3, 2020(e)
through
December 31, 2020 | | | (0.15 | ) | | $ | 10.84 | | | | 4.12 | % | | | 0.65 | % | | | 6.78 | % | | | 42.32 | % | | $ | 140 | | | | 74 | % | |
See notes to financial statements.
85
Victory Portfolios | | Financial Highlights | |
For a Share Outstanding Throughout Each Period
| | | | | Investment Activities | | Distributions
to
Shareholders
From | | | |
| | | Net Asset
Value,
Beginning of
Period | | Net
Investment
Income
(Loss)(a) | | Net
Realized and
Unrealized
Gains
(Losses) on
Investments | | Total from
Investment
Activities | | Net
Investment
Income | | Total
Distributions | | Net Asset
Value,
End of
Period | | Total
Return
(Excludes
Sales
Charge)*(b) | |
Victory Floating Rate Fund | |
Class A | |
Six Months Ended June 30, 2021
(Unaudited) | | $ | 9.34 | | | | 0.18 | | | | 0.09 | | | | 0.27 | | | | (0.19 | ) | | | (0.19 | ) | | $ | 9.42 | | | | 2.86 | % | |
Year Ended: | |
December 31, 2020 | | $ | 9.42 | | | | 0.49 | | | | (0.08 | ) | | | 0.41 | | | | (0.49 | ) | | | (0.49 | ) | | $ | 9.34 | | | | 4.81 | % | |
December 31, 2019 | | $ | 9.13 | | | | 0.55 | | | | 0.29 | | | | 0.84 | | | | (0.55 | ) | | | (0.55 | ) | | $ | 9.42 | | | | 9.43 | % | |
December 31, 2018 | | $ | 9.60 | | | | 0.52 | | | | (0.47 | ) | | | 0.05 | | | | (0.52 | ) | | | (0.52 | ) | | $ | 9.13 | | | | 0.43 | % | |
December 31, 2017 | | $ | 9.71 | | | | 0.46 | | | | (0.10 | ) | | | 0.36 | | | | (0.47 | ) | | | (0.47 | ) | | $ | 9.60 | | | | 3.76 | % | |
December 31, 2016 | | $ | 9.08 | | | | 0.46 | | | | 0.63 | | | | 1.09 | | | | (0.46 | ) | | | (0.46 | ) | | $ | 9.71 | | | | 12.35 | % | |
Class C | |
Six Months Ended June 30, 2021
(Unaudited) | | $ | 9.34 | | | | 0.15 | | | | 0.09 | | | | 0.24 | | | | (0.15 | ) | | | (0.15 | ) | | $ | 9.43 | | | | 2.56 | % | |
Year Ended: | |
December 31, 2020 | | $ | 9.42 | | | | 0.43 | | | | (0.09 | ) | | | 0.34 | | | | (0.42 | ) | | | (0.42 | ) | | $ | 9.34 | | | | 3.96 | % | |
December 31, 2019 | | $ | 9.14 | | | | 0.48 | | | | 0.28 | | | | 0.76 | | | | (0.48 | ) | | | (0.48 | ) | | $ | 9.42 | | | | 8.49 | % | |
December 31, 2018 | | $ | 9.61 | | | | 0.44 | | | | (0.47 | ) | | | (0.03 | ) | | | (0.44 | ) | | | (0.44 | ) | | $ | 9.14 | | | | (0.38 | )% | |
December 31, 2017 | | $ | 9.72 | | | | 0.38 | | | | (0.10 | ) | | | 0.28 | | | | (0.39 | ) | | | (0.39 | ) | | $ | 9.61 | | | | 2.93 | % | |
December 31, 2016 | | $ | 9.08 | | | | 0.39 | | | | 0.64 | | | | 1.03 | | | | (0.39 | ) | | | (0.39 | ) | | $ | 9.72 | | | | 11.57 | % | |
Class R | |
Six Months Ended June 30, 2021
(Unaudited) | | $ | 9.33 | | | | 0.16 | | | | 0.09 | | | | 0.25 | | | | (0.16 | ) | | | (0.16 | ) | | $ | 9.42 | | | | 2.68 | % | |
Year Ended: | |
December 31, 2020 | | $ | 9.41 | | | | 0.45 | | | | (0.09 | ) | | | 0.36 | | | | (0.44 | ) | | | (0.44 | ) | | $ | 9.33 | | | | 4.23 | % | |
December 31, 2019 | | $ | 9.13 | | | | 0.50 | | | | 0.28 | | | | 0.78 | | | | (0.50 | ) | | | (0.50 | ) | | $ | 9.41 | | | | 8.75 | % | |
December 31, 2018 | | $ | 9.60 | | | | 0.46 | | | | (0.46 | ) | | | — | (e) | | | (0.47 | ) | | | (0.47 | ) | | $ | 9.13 | | | | (0.13 | )% | |
December 31, 2017 | | $ | 9.72 | | | | 0.41 | | | | (0.12 | ) | | | 0.29 | | | | (0.41 | ) | | | (0.41 | ) | | $ | 9.60 | | | | 3.07 | % | |
December 31, 2016 | | $ | 9.08 | | | | 0.42 | | | | 0.63 | | | | 1.05 | | | | (0.41 | ) | | | (0.41 | ) | | $ | 9.72 | | | | 11.88 | % | |
Class Y | |
Six Months Ended June 30, 2021
(Unaudited) | | $ | 9.35 | | | | 0.19 | | | | 0.09 | | | | 0.28 | | | | (0.20 | ) | | | (0.20 | ) | | $ | 9.43 | | | | 2.98 | % | |
Year Ended: | |
December 31, 2020 | | $ | 9.43 | | | | 0.51 | | | | (0.08 | ) | | | 0.43 | | | | (0.51 | ) | | | (0.51 | ) | | $ | 9.35 | | | | 5.03 | % | |
December 31, 2019 | | $ | 9.14 | | | | 0.57 | | | | 0.29 | | | | 0.86 | | | | (0.57 | ) | | | (0.57 | ) | | $ | 9.43 | | | | 9.65 | % | |
December 31, 2018 | | $ | 9.61 | | | | 0.54 | | | | (0.47 | ) | | | 0.07 | | | | (0.54 | ) | | | (0.54 | ) | | $ | 9.14 | | | | 0.64 | % | |
December 31, 2017 | | $ | 9.72 | | | | 0.48 | | | | (0.10 | ) | | | 0.38 | | | | (0.49 | ) | | | (0.49 | ) | | $ | 9.61 | | | | 3.98 | % | |
December 31, 2016 | | $ | 9.08 | | | | 0.49 | | | | 0.63 | | | | 1.12 | | | | (0.48 | ) | | | (0.48 | ) | | $ | 9.72 | | | | 12.71 | % | |
Member Class | |
Six Months Ended June 30, 2021
(Unaudited) | | $ | 9.34 | | | | 0.19 | | | | 0.08 | | | | 0.27 | | | | (0.19 | ) | | | (0.19 | ) | | $ | 9.42 | | | | 2.93 | % | |
November 3, 2020(f) through
December 31, 2020 | | $ | 9.02 | | | | 0.08 | | | | 0.32 | (g) | | | 0.40 | | | | (0.08 | ) | | | (0.08 | ) | | $ | 9.34 | | | | 4.41 | % | |
* Includes adjustments in accordance with U.S. Generally Accepted Accounting Principles.
(a) Per share net investment income (loss) has been calculated using the average daily shares method.
(b) Not annualized for periods less than one year.
(c) Annualized for periods less than one year.
(d) Portfolio turnover is calculated on the basis of the Fund as a whole without distinguishing between the classes of shares issued.
See notes to financial statements.
86
Victory Portfolios | | Financial Highlights — continued | |
For a Share Outstanding Throughout Each Period
| | | Ratios to Average Net Assets | | Supplemental Data | |
| | | Net
Expenses(c) | | Net
Investment
Income
(Loss)(c) | | Gross
Expenses(c) | | Net Assets,
End of
Period
(000's) | | Portfolio
Turnover(b)(d) | |
Victory Floating Rate Fund | |
Class A | |
Six Months Ended June 30, 2021
(Unaudited) | | | 1.00 | % | | | 3.92 | % | | | 1.10 | % | | $ | 303,771 | | | | 18 | % | |
Year Ended: | |
December 31, 2020 | | | 1.00 | % | | | 5.54 | % | | | 1.17 | % | | $ | 164,864 | | | | 54 | % | |
December 31, 2019 | | | 1.00 | % | | | 5.89 | % | | | 1.17 | % | | $ | 146,584 | | | | 35 | % | |
December 31, 2018 | | | 1.00 | % | | | 5.41 | % | | | 1.14 | % | | $ | 118,672 | | | | 48 | % | |
December 31, 2017 | | | 1.00 | % | | | 4.76 | % | | | 1.10 | % | | $ | 148,060 | | | | 57 | % | |
December 31, 2016 | | | 1.00 | % | | | 4.95 | % | | | 1.11 | % | | $ | 221,022 | | | | 56 | % | |
Class C | |
Six Months Ended June 30, 2021
(Unaudited) | | | 1.80 | % | | | 3.16 | % | | | 1.92 | % | | $ | 75,493 | | | | 18 | % | |
Year Ended: | |
December 31, 2020 | | | 1.80 | % | | | 4.81 | % | | | 1.94 | % | | $ | 94,885 | | | | 54 | % | |
December 31, 2019 | | | 1.80 | % | | | 5.08 | % | | | 1.92 | % | | $ | 149,054 | | | | 35 | % | |
December 31, 2018 | | | 1.80 | % | | | 4.60 | % | | | 1.90 | % | | $ | 211,462 | | | | 48 | % | |
December 31, 2017 | | | 1.80 | % | | | 3.97 | % | | | 1.87 | % | | $ | 265,486 | | | | 57 | % | |
December 31, 2016 | | | 1.80 | % | | | 4.18 | % | | | 1.89 | % | | $ | 341,169 | | | | 56 | % | |
Class R | |
Six Months Ended June 30, 2021
(Unaudited) | | | 1.56 | % | | | 3.35 | % | | | 3.57 | % | | $ | 534 | | | | 18 | % | |
Year Ended: | |
December 31, 2020 | | | 1.56 | % | | | 5.01 | % | | | 6.20 | % | | $ | 300 | | | | 54 | % | |
December 31, 2019 | | | 1.56 | % | | | 5.34 | % | | | 3.73 | % | | $ | 455 | | | | 35 | % | |
December 31, 2018 | | | 1.56 | % | | | 4.84 | % | | | 2.99 | % | | $ | 716 | | | | 48 | % | |
December 31, 2017 | | | 1.56 | % | | | 4.20 | % | | | 2.26 | % | | $ | 916 | | | | 57 | % | |
December 31, 2016 | | | 1.53 | % | | | 4.48 | % | | | 1.53 | % | | $ | 1,319 | | | | 56 | % | |
Class Y | |
Six Months Ended June 30, 2021
(Unaudited) | | | 0.78 | % | | | 4.10 | % | | | 0.81 | % | | $ | 1,357,498 | | | | 18 | % | |
Year Ended: | |
December 31, 2020 | | | 0.78 | % | | | 5.73 | % | | | 0.93 | % | | $ | 403,852 | | | | 54 | % | |
December 31, 2019 | | | 0.78 | % | | | 6.10 | % | | | 0.92 | % | | $ | 289,796 | | | | 35 | % | |
December 31, 2018 | | | 0.78 | % | | | 5.64 | % | | | 0.89 | % | | $ | 281,545 | | | | 48 | % | |
December 31, 2017 | | | 0.78 | % | | | 4.99 | % | | | 0.88 | % | | $ | 276,195 | | | | 57 | % | |
December 31, 2016 | | | 0.78 | % | | | 5.21 | % | | | 0.88 | % | | $ | 370,035 | | | | 56 | % | |
Member Class | |
Six Months Ended June 30, 2021
(Unaudited) | | | 0.85 | % | | | 3.99 | % | | | 6.95 | % | | $ | 884 | | | | 18 | % | |
November 3, 2020(f) through
December 31, 2020 | | | 0.85 | % | | | 5.46 | % | | | 56.41 | % | | $ | 62 | | | | 54 | % | |
(e) Amount is less than $0.005 per share.
(f) Commencement of operations.
(g) The amount shown reflects a net realized and unrealized gain per share, whereas the statement of operations reflected a net realized and unrealized loss for the period for the Fund in total. The difference in realized and unrealized gains and losses for the Fund versus the class is due to the timing of sales and repurchases of the class in relation to fluctuating market values during the period.
See notes to financial statements.
87
Victory Portfolios | | Financial Highlights | |
For a Share Outstanding Throughout Each Period
| | | | Investment Activities | | Distributions to
Shareholders From | | | |
| | | Net Asset
Value,
Beginning of
Period | | Net
Investment
Income
(Loss)(a) | | Net
Realized and
Unrealized
Gains
(Losses) on
Investments | | Total from
Investment
Activities | | Net
Investment
Income | | Net Realized
Gains From
Investments | | Return of
Capital | | Total
Distributions | |
Victory Strategic Income Fund | |
Class A | |
Six Months Ended
June 30, 2021
(Unaudited) | | $ | 10.95 | | | | 0.10 | | | | (0.10 | ) | | | — | (e) | | | (0.10 | ) | | | — | | | | — | | | | (0.10 | ) | |
Year Ended: | |
December 31,
2020 | | $ | 10.35 | | | | 0.15 | | | | 0.78 | | | | 0.93 | | | | (0.15 | ) | | | (0.18 | ) | | | — | | | | (0.33 | ) | |
December 31,
2019 | | $ | 9.74 | | | | 0.27 | | | | 0.61 | | | | 0.88 | | | | (0.25 | ) | | | — | | | | (0.02 | ) | | | (0.27 | ) | |
December 31,
2018 | | $ | 10.14 | | | | 0.34 | | | | (0.41 | ) | | | (0.07 | ) | | | (0.33 | ) | | | — | | | | — | | | | (0.33 | ) | |
December 31,
2017 | | $ | 9.99 | | | | 0.33 | | | | 0.17 | | | | 0.50 | | | | (0.35 | ) | | | — | | | | — | | | | (0.35 | ) | |
December 31,
2016 | | $ | 9.68 | | | | 0.23 | | | | 0.36 | | | | 0.59 | | | | (0.27 | ) | | | — | | | | (0.01 | ) | | | (0.28 | ) | |
Class C | |
Six Months Ended
June 30, 2021
(Unaudited) | | $ | 11.01 | | | | 0.05 | | | | (0.10 | ) | | | (0.05 | ) | | | (0.06 | ) | | | — | | | | — | | | | (0.06 | ) | |
Year Ended: | |
December 31,
2020 | | $ | 10.40 | | | | 0.06 | | | | 0.80 | | | | 0.86 | | | | (0.07 | ) | | | (0.18 | ) | | | — | | | | (0.25 | ) | |
December 31,
2019 | | $ | 9.79 | | | | 0.19 | | | | 0.61 | | | | 0.80 | | | | (0.18 | ) | | | — | | | | (0.01 | ) | | | (0.19 | ) | |
December 31,
2018 | | $ | 10.19 | | | | 0.26 | | | | (0.41 | ) | | | (0.15 | ) | | | (0.25 | ) | | | — | | | | — | | | | (0.25 | ) | |
December 31,
2017 | | $ | 10.04 | | | | 0.25 | | | | 0.17 | | | | 0.42 | | | | (0.27 | ) | | | — | | | | — | | | | (0.27 | ) | |
December 31,
2016 | | $ | 9.72 | | | | 0.15 | | | | 0.38 | | | | 0.53 | | | | (0.20 | ) | | | — | | | | (0.01 | ) | | | (0.21 | ) | |
(a) Per share net investment income (loss) has been calculated using the average daily shares method.
(b) Not annualized for periods less than one year.
(c) Annualized for periods less than one year.
(d) Portfolio turnover is calculated on the basis of the Fund as a whole without distinguishing between the classes of shares issued.
(e) Amount is less than $0.005 per share.
See notes to financial statements.
88
Victory Portfolios | | Financial Highlights — continued | |
For a Share Outstanding Throughout Each Period
| | | | | | | Ratios to Average Net Assets | | Supplemental Data | |
| | | Net Asset
Value,
End of
Period | | Total
Return
(Excludes
Sales
Charge)(b) | | Net
Expenses(c) | | Net
Investment
Income
(Loss)(c) | | Gross
Expenses(c) | | Net Assets,
End of
Period
(000's) | | Portfolio
Turnover(b)(d) | |
Victory Strategic Income Fund | |
Class A | |
Six Months Ended
June 30, 2021
(Unaudited) | | $ | 10.85 | | | | (0.01 | )% | | | 0.95 | % | | | 1.78 | % | | | 1.05 | % | | $ | 43,392 | | | | 142 | % | |
Year Ended: | |
December 31,
2020 | | $ | 10.95 | | | | 9.09 | % | | | 0.95 | % | | | 1.39 | % | | | 1.08 | % | | $ | 40,993 | | | | 194 | % | |
December 31,
2019 | | $ | 10.35 | | | | 9.17 | % | | | 0.95 | % | | | 2.61 | % | | | 1.11 | % | | $ | 33,767 | | | | 106 | % | |
December 31,
2018 | | $ | 9.74 | | | | (0.66 | )% | | | 0.95 | % | | | 3.46 | % | | | 1.09 | % | | $ | 32,053 | | | | 115 | % | |
December 31,
2017 | | $ | 10.14 | | | | 5.12 | % | | | 0.95 | % | | | 3.24 | % | | | 1.07 | % | | $ | 34,957 | | | | 138 | % | |
December 31,
2016 | | $ | 9.99 | | | | 6.20 | % | | | 0.95 | % | | | 2.28 | % | | | 1.17 | % | | $ | 37,121 | | | | 79 | % | |
Class C | |
Six Months Ended
June 30, 2021
(Unaudited) | | $ | 10.90 | | | | (0.49 | )% | | | 1.74 | % | | | 0.94 | % | | | 1.97 | % | | $ | 6,165 | | | | 142 | % | |
Year Ended: | |
December 31,
2020 | | $ | 11.01 | | | | 8.28 | % | | | 1.74 | % | | | 0.59 | % | | | 1.96 | % | | $ | 9,477 | | | | 194 | % | |
December 31,
2019 | | $ | 10.40 | | | | 8.26 | % | | | 1.74 | % | | | 1.83 | % | | | 2.00 | % | | $ | 9,126 | | | | 106 | % | |
December 31,
2018 | | $ | 9.79 | | | | (1.45 | )% | | | 1.74 | % | | | 2.65 | % | | | 1.97 | % | | $ | 10,221 | | | | 115 | % | |
December 31,
2017 | | $ | 10.19 | | | | 4.27 | % | | | 1.74 | % | | | 2.44 | % | | | 1.89 | % | | $ | 11,671 | | | | 138 | % | |
December 31,
2016 | | $ | 10.04 | | | | 5.46 | % | | | 1.74 | % | | | 1.49 | % | | | 2.00 | % | | $ | 11,547 | | | | 79 | % | |
See notes to financial statements.
89
Victory Portfolios | | Financial Highlights | |
For a Share Outstanding Throughout Each Period
| | | | Investment Activities | | Distributions to
Shareholders From | | | |
| | | Net Asset
Value,
Beginning of
Period | | Net
Investment
Income
(Loss)(a) | | Net
Realized and
Unrealized
Gains
(Losses) on
Investments | | Total from
Investment
Activities | | Net
Investment
Income | | Net Realized
Gains From
Investments | | Return of
Capital | | Total
Distributions | |
Victory Strategic Income Fund | |
Class R | |
Six Months Ended
June 30, 2021
(Unaudited) | | $ | 11.01 | | | | 0.07 | | | | (0.10 | ) | | | (0.03 | ) | | | (0.08 | ) | | | — | | | | — | | | | (0.08 | ) | |
Year Ended: | |
December 31,
2020 | | $ | 10.41 | | | | 0.11 | | | | 0.78 | | | | 0.89 | | | | (0.11 | ) | | | (0.18 | ) | | | — | | | | (0.29 | ) | |
December 31,
2019 | | $ | 9.79 | | | | 0.23 | | | | 0.62 | | | | 0.85 | | | | (0.22 | ) | | | — | | | | (0.01 | ) | | | (0.23 | ) | |
December 31,
2018 | | $ | 10.20 | | | | 0.30 | | | | (0.42 | ) | | | (0.12 | ) | | | (0.29 | ) | | | — | | | | — | | | | (0.29 | ) | |
December 31,
2017 | | $ | 10.04 | | | | 0.29 | | | | 0.18 | | | | 0.47 | | | | (0.31 | ) | | | — | | | | — | | | | (0.31 | ) | |
December 31,
2016 | | $ | 9.73 | | | | 0.19 | | | | 0.37 | | | | 0.56 | | | | (0.24 | ) | | | — | | | | (0.01 | ) | | | (0.25 | ) | |
Class Y | |
Six Months Ended
June 30, 2021
(Unaudited) | | $ | 10.89 | | | | 0.10 | | | | (0.09 | ) | | | 0.01 | | | | (0.11 | ) | | | — | | | | — | | | | (0.11 | ) | |
Year Ended: | |
December 31,
2020 | | $ | 10.29 | | | | 0.16 | | | | 0.80 | | | | 0.96 | | | | (0.18 | ) | | | (0.18 | ) | | | — | | | | (0.36 | ) | |
December 31,
2019 | | $ | 9.69 | | | | 0.29 | | | | 0.61 | | | | 0.90 | | | | (0.28 | ) | | | — | | | | (0.02 | ) | | | (0.30 | ) | |
December 31,
2018 | | $ | 10.09 | | | | 0.36 | | | | (0.41 | ) | | | (0.05 | ) | | | (0.35 | ) | | | — | | | | — | | | | (0.35 | ) | |
December 31,
2017 | | $ | 9.94 | | | | 0.35 | | | | 0.18 | | | | 0.53 | | | | (0.38 | ) | | | — | | | | — | | | | (0.38 | ) | |
December 31,
2016 | | $ | 9.63 | | | | 0.25 | | | | 0.36 | | | | 0.61 | | | | (0.29 | ) | | | — | | | | (0.01 | ) | | | (0.30 | ) | |
(a) Per share net investment income (loss) has been calculated using the average daily shares method.
(b) Not annualized for periods less than one year.
(c) Annualized for periods less than one year.
(d) Portfolio turnover is calculated on the basis of the Fund as a whole without distinguishing between the classes of shares issued.
See notes to financial statements.
90
Victory Portfolios | | Financial Highlights — continued | |
For a Share Outstanding Throughout Each Period
| | | | | | | Ratios to Average Net Assets | | Supplemental Data | |
| | | Net Asset
Value,
End of
Period | | Total
Return(b) | | Net
Expenses(c) | | Net
Investment
Income
(Loss)(c) | | Gross
Expenses(c) | | Net Assets,
End of
Period
(000's) | | Portfolio
Turnover(b)(d) | |
Victory Strategic Income Fund | |
Class R | |
Six Months Ended
June 30, 2021
(Unaudited) | | $ | 10.90 | | | | (0.29 | )% | | | 1.34 | % | | | 1.37 | % | | | 1.60 | % | | $ | 2,861 | | | | 142 | % | |
Year Ended: | |
December 31,
2020 | | $ | 11.01 | | | | 8.61 | % | | | 1.34 | % | | | 0.99 | % | | | 1.72 | % | | $ | 2,989 | | | | 194 | % | |
December 31,
2019 | | $ | 10.41 | | | | 8.79 | % | | | 1.34 | % | | | 2.21 | % | | | 1.77 | % | | $ | 2,866 | | | | 106 | % | |
December 31,
2018 | | $ | 9.79 | | | | (1.15 | )% | | | 1.34 | % | | | 3.05 | % | | | 1.70 | % | | $ | 2,761 | | | | 115 | % | |
December 31,
2017 | | $ | 10.20 | | | | 4.78 | % | | | 1.34 | % | | | 2.83 | % | | | 1.61 | % | | $ | 2,927 | | | | 138 | % | |
December 31,
2016 | | $ | 10.04 | | | | 5.77 | % | | | 1.34 | % | | | 1.89 | % | | | 1.53 | % | | $ | 2,979 | | | | 79 | % | |
Class Y | |
Six Months Ended
June 30, 2021
(Unaudited) | | $ | 10.79 | | | | 0.10 | % | | | 0.74 | % | | | 1.92 | % | | | 0.92 | % | | $ | 30,404 | | | | 142 | % | |
Year Ended: | |
December 31,
2020 | | $ | 10.89 | | | | 9.37 | % | | | 0.74 | % | | | 1.53 | % | | | 0.91 | % | | $ | 53,060 | | | | 194 | % | |
December 31,
2019 | | $ | 10.29 | | | | 9.35 | % | | | 0.74 | % | | | 2.83 | % | | | 1.11 | % | | $ | 5,274 | | | | 106 | % | |
December 31,
2018 | | $ | 9.69 | | | | (0.45 | )% | | | 0.74 | % | | | 3.72 | % | | | 1.06 | % | | $ | 4,798 | | | | 115 | % | |
December 31,
2017 | | $ | 10.09 | | | | 5.38 | % | | | 0.74 | % | | | 3.46 | % | | | 0.95 | % | | $ | 10,180 | | | | 138 | % | |
December 31,
2016 | | $ | 9.94 | | | | 6.45 | % | | | 0.74 | % | | | 2.50 | % | | | 0.99 | % | | $ | 11,768 | | | | 79 | % | |
See notes to financial statements.
91
Victory Portfolios | | Notes to Financial Statements
June 30, 2021 | |
(Unaudited)
1. Organization:
Victory Portfolios (the "Trust") is organized as a Delaware statutory trust and the Trust is registered under the Investment Company Act of 1940, as amended (the "1940 Act"), as an open-end investment company. The Trust is comprised of 41 funds and is authorized to issue an unlimited number of shares, which are units of beneficial interest with a par value of $0.001 per share.
The accompanying financial statements are those of the following seven Funds (collectively, the "Funds" and individually, a "Fund"). Each Fund is classified as diversified under the 1940 Act.
Funds (Legal Name) | | Funds (Short Name) | | Investment Share
Classes Offered | |
Victory INCORE Investment Quality
Bond Fund | | INCORE Investment Quality Bond
Fund | | Classes A, C, R and Y | |
Victory INCORE Low Duration Bond Fund | | INCORE Low Duration Bond Fund | | Classes A, C, R and Y | |
Victory High Yield Fund | | High Yield Fund | | Classes A, C, R and Y | |
Victory Tax-Exempt Fund | | Tax-Exempt Fund | | Classes A, C and Y | |
Victory High Income Municipal Bond Fund | | High Income Municipal Bond
Fund | | Classes A, C, Y and
Member Class* | |
Victory Floating Rate Fund
| | Floating Rate Fund
| | Classes A, C, R, Y and
Member Class* | |
Victory Strategic Income Fund | | Strategic Income Fund | | Classes A, C, R and Y | |
* Member Class commenced operations on November 3, 2020
Each class of shares of a Fund has substantially identical rights and privileges except with respect to sales charges, fees paid under distribution plans, expenses allocable exclusively to each class of shares, voting rights on matters solely affecting a single class of shares, and the exchange privilege of each class of shares.
Under the Trust's organizational documents, its officers and trustees are indemnified against certain liabilities arising out of the performance of their duties to the Funds. In addition, in the normal course of business, the Funds enter into contracts with their vendors and others that provide for general indemnifications. A Fund's maximum exposure under these arrangements is unknown, as this would involve future claims that may be made against the Funds. However, based on experience, the Funds expect that risk of loss to be remote.
2. Significant Accounting Policies:
The following is a summary of significant accounting policies followed by the Trust in the preparation of its financial statements. The policies are in conformity with Generally Accepted Accounting Principles in the United States of America ("GAAP"). The preparation of financial statements in accordance with GAAP requires management to make estimates and assumptions that affect the reported amounts of assets and liabilities and disclosure of contingent assets and liabilities at the date of the financial statements and the reported amounts of income and expenses for the period. Actual results could differ from those estimates. The Fund follows the specialized accounting and reporting requirements under GAAP that are applicable to investment companies under Accounting Standards Codification 946.
Investment Valuation:
The Funds record investments at fair value. Fair value is defined as the price that would be received to sell an asset or paid to transfer a liability in an orderly transaction between market participants at the measurement date.
92
Victory Portfolios | | Notes to Financial Statements — continued
June 30, 2021 | |
(Unaudited)
The valuation techniques described below maximize the use of observable inputs and minimize the use of unobservable inputs in determining fair value. The inputs used for valuing the Funds' investments are summarized in the three broad levels listed below:
• Level 1 — quoted prices in active markets for identical securities
• Level 2 — other significant observable inputs (including quoted prices for similar securities or interest rates applicable to those securities, etc.)
• Level 3 — significant unobservable inputs (including the Funds' own assumptions in determining the fair value of investments)
Changes in valuation techniques may result in transfers in or out of an assigned level within the disclosure hierarchy. The inputs or methodologies used for valuation techniques are not necessarily an indication of the risk associated with entering into those investments.
Victory Capital Management Inc. ("VCM" or the "Adviser") has established the Pricing and Liquidity Committee (the "Committee"), and subject to Trust's Board of Trustees' (the "Board") oversight, the Committee administers and oversees the Funds' valuation policies and procedures, which are approved by the Board.
Portfolio securities listed or traded on securities exchanges, including exchange-traded funds ("ETFs"), are valued at the closing price on the exchange or system where the security is principally traded, if available, or at the Nasdaq Official Closing Price. If there have been no sales for that day on the exchange or system, then a security is valued at the last available bid quotation on the exchange or system where the security is principally traded. In each of these situations, valuations are typically categorized as Level 1 in the fair value hierarchy.
Investments in open-end investment companies are valued at net asset value ("NAV"). These valuations are typically categorized as Level 1 in the fair value hierarchy.
Debt securities are valued each business day by a pricing service approved by the Board. The approved pricing service uses the evaluated bid or the last sale price to value securities. Debt obligations maturing within 60 days may be valued at amortized cost, provided that the amortized cost represents the fair value of such securities. These valuations are typically categorized as Level 2 in the fair value hierarchy.
Futures contracts are valued at the settlement price established each day by the board of trade or an exchange on which they are traded. These valuations are typically categorized as Level 1 in the fair value hierarchy.
Swap agreements are valued at the mean between the current bid and ask prices. These valuations are typically categorized as Level 2 in the fair value hierarchy.
In the event that price quotations or valuations are not readily available, investments are valued at fair value in accordance with procedures established by and under the general supervision and responsibility of the Board. These valuations are typically categorized as Level 2 or Level 3 in the fair value hierarchy, based on the observability of inputs used to determine the fair value. The effect of fair value pricing is that securities may not be priced on the basis of quotations from the primary market in which they are traded and the actual price realized from the sale of a security may differ materially from the fair value price. Valuing these securities at fair value is intended to cause the Fund's NAV to be more reliable than it otherwise would be.
93
Victory Portfolios | | Notes to Financial Statements — continued
June 30, 2021 | |
(Unaudited)
A summary of the valuations as of June 30, 2021, is included in the table below while the breakdown, by category, of investments is disclosed on the Schedules of Portfolio Investments:
| | | Level 1 | | Level 2 | | Level 3 | | Total | |
INCORE Investment Quality Bond Fund | |
Asset-Backed Securities | | $ | — | | | $ | 795,189 | | | $ | — | | | $ | 795,189 | | |
Collateralized Mortgage Obligations | | | — | | | | 260,229 | | | | — | | | | 260,229 | | |
Preferred Stocks | | | 847,984 | | | | 88,653 | | | | — | | | | 936,637 | | |
Corporate Bonds | | | — | | | | 14,730,017 | | | | — | | | | 14,730,017 | | |
Residential Mortgage-Backed
Securities | | | — | | | | 62,503 | | | | — | | | | 62,503 | | |
Yankee Dollars | | | — | | | | 3,001,067 | | | | — | | | | 3,001,067 | | |
U.S. Government Mortgage-Backed
Agencies | | | — | | | | 4,764,946 | | | | — | | | | 4,764,946 | | |
U.S. Treasury Obligations | | | — | | | | 1,000,781 | | | | — | | | | 1,000,781 | | |
Collateral for Securities Loaned | | | 829,707 | | | | — | | | | — | | | | 829,707 | | |
Total | | $ | 1,677,691 | | | $ | 24,703,385 | | | $ | — | | | $ | 26,381,076 | | |
Other Financial Investments^: | |
Assets: | |
Futures Contracts | | $ | 50,056 | | | $ | — | | | $ | — | | | $ | 50,056 | | |
Liabilities: | |
| Futures Contracts | | | (19,087 | ) | | | — | | | | — | | | | (19,087 | ) | |
Total | | $ | 30,969 | | | $ | — | | | $ | — | | | $ | 30,969 | | |
INCORE Low Duration Bond Fund | |
Asset-Backed Securities | | $ | — | | | $ | 12,804,306 | | | $ | — | | | $ | 12,804,306 | | |
Collateralized Mortgage Obligations | | | — | | | | 6,818,690 | | | | — | | | | 6,818,690 | | |
Preferred Stocks | | | 4,546,980 | | | | 452,582 | | | | — | | | | 4,999,562 | | |
Corporate Bonds | | | — | | | | 125,565,533 | | | | — | | | | 125,565,533 | | |
Residential Mortgage-Backed
Securities | | | — | | | | 7,392,593 | | | | — | | | | 7,392,593 | | |
Yankee Dollars | | | — | | | | 27,466,002 | | | | — | | | | 27,466,002 | | |
U.S. Government Mortgage-Backed
Agencies | | | — | | | | 13,275,267 | | | | — | | | | 13,275,267 | | |
U.S. Treasury Obligations | | | — | | | | 33,380,281 | | | | — | | | | 33,380,281 | | |
Collateral for Securities Loaned | | | 10,769,360 | | | | — | | | | — | | | | 10,769,360 | | |
Total | | $ | 15,316,340 | | | $ | 227,155,254 | | | $ | — | | | $ | 242,471,594 | | |
Other Financial Investments^: | |
Assets: | |
Futures Contracts | | $ | 61,053 | | | $ | — | | | $ | — | | | $ | 61,053 | | |
Liabilities: | |
| Futures Contracts | | | (120,796 | ) | | | — | | | | — | | | | (120,796 | ) | |
Total | | $ | (59,743 | ) | | $ | — | | | $ | — | | | $ | (59,743 | ) | |
High Yield Fund | |
Common Stocks | | $ | 2,868,503 | | | $ | — | | | $ | — | | | $ | 2,868,503 | | |
Senior Secured Loans | | | 41,663 | | | | 59,105,712 | | | | — | | | | 59,147,375 | | |
Corporate Bonds | | | — | | | | 204,336,750 | | | | — | | | | 204,336,750 | | |
Yankee Dollars | | | — | | | | 22,052,528 | | | | — | | | | 22,052,528 | | |
Collateral for Securities Loaned | | | 24,477,216 | | | | — | | | | — | | | | 24,477,216 | | |
Total | | $ | 27,387,382 | | | $ | 285,494,990 | | | $ | — | | | $ | 312,882,372 | | |
94
Victory Portfolios | | Notes to Financial Statements — continued
June 30, 2021 | |
(Unaudited)
| | | Level 1 | | Level 2 | | Level 3 | | Total | |
Tax-Exempt Fund | |
Municipal Bonds | | $ | — | | | $ | 52,845,788 | | | $ | — | | | $ | 52,845,788 | | |
Total | | $ | — | | | $ | 52,845,788 | | | $ | — | | | $ | 52,845,788 | | |
High Income Municipal Bond Fund | |
Municipal Bonds | | $ | — | | | $ | 47,406,485 | | | $ | — | | | $ | 47,406,485 | | |
Exchange-Traded Funds | | | 2,458,470 | | | | — | | | | — | | | | 2,458,470 | | |
Total | | $ | 2,458,470 | | | $ | 47,406,485 | | | $ | — | | | $ | 49,864,955 | | |
Floating Rate Fund | |
Warrants | | $ | 240,403 | | | $ | — | | | $ | — | | | $ | 240,403 | | |
Senior Secured Loans | | | 67,715 | | | | 1,448,775,650 | | | | — | | | | 1,448,843,365 | | |
Corporate Bonds | | | — | | | | 228,916,295 | | | | — | | | | 228,916,295 | | |
Yankee Dollars | | | — | | | | 21,382,036 | | | | — | | | | 21,382,036 | | |
Total | | $ | 308,118 | | | $ | 1,699,073,981 | | | $ | — | | | $ | 1,699,382,099 | | |
Strategic Income Fund | |
Asset-Backed Securities | | $ | — | | | $ | 771,446 | | | $ | — | | | $ | 771,446 | | |
Collateralized Mortgage
Obligations | | | — | | | | 6,864,720 | | | | — | | | | 6,864,720 | | |
Corporate Bonds | | | — | | | | 54,868,827 | | | | — | | | | 54,868,827 | | |
Residential Mortgage-Backed
Securities | | | — | | | | 140,534 | | | | — | | | | 140,534 | | |
Yankee Dollars | | | — | | | | 4,838,549 | | | | — | | | | 4,838,549 | | |
U.S. Government Mortgage-Backed
Agencies | | | — | | | | 60,090 | | | | — | | | | 60,090 | | |
U.S. Treasury Obligations | | | — | | | | 5,886,414 | | | | — | | | | 5,886,414 | | |
Exchange-Traded Funds | | | 7,598,935 | | | | — | | | | — | | | | 7,598,935 | | |
Collateral for Securities Loaned | | | 4,410,943 | | | | — | | | | — | | | | 4,410,943 | | |
Total | | $ | 12,009,878 | | | $ | 73,430,580 | | | $ | — | | | $ | 85,440,458 | | |
Other Financial Investments^: | |
Assets: | |
Futures Contracts | | $ | 62,807 | | | $ | — | | | $ | — | | | $ | 62,807 | | |
Liabilities: | |
| Futures Contracts | | | (303,205 | ) | | | — | | | | — | | | | (303,205 | ) | |
Total | | $ | (240,398 | ) | | $ | — | | | $ | — | | | $ | (240,398 | ) | |
^ Futures contracts are valued at the unrealized appreciation (depreciation) on the investment.
For the six months ended June 30, 2021, there were no transfers in or out of Level 3 in the fair value hierarchy.
Real Estate Investment Trusts ("REITs"):
The Funds may invest in REITs, which report information on the source of their distributions annually. REITs are pooled investment vehicles that invest primarily in income-producing real estate or real-estate related loans or interests (such as mortgages). Certain distributions received from REITs during the year are recorded as realized gains or return of capital as estimated by the Funds or when such information becomes known.
Investment Companies:
Exchange-Traded Funds:
The Funds may invest in ETFs, the shares of which are bought and sold on a securities exchange. An ETF trades like common stock and represents a fixed portfolio of securities often designed to track the
95
Victory Portfolios | | Notes to Financial Statements — continued
June 30, 2021 | |
(Unaudited)
performance and dividend yield of a particular domestic or foreign market index. The Funds may purchase shares of an ETF to temporarily gain exposure to a portion of the U.S. or a foreign market while awaiting purchase of underlying securities. The risks of owning an ETF generally reflect the risks of owning the underlying securities they are designed to track, although the lack of liquidity of an ETF could result in it being more volatile. Additionally, ETFs have fees and expenses that reduce their value.
Open-End Funds:
The Funds may invest in portfolios of open-end investment companies. These investment companies value securities in their portfolios for which market quotations are readily available at their market values (generally the last reported sale price) and all other securities and assets at their fair value by the methods established by the board of directors of the underlying funds.
Securities Purchased on a Delayed-Delivery or When-Issued Basis:
The Funds may purchase securities on a delayed-delivery or when-issued basis. Delivery and payment for securities that have been purchased by a Fund on a delayed-delivery or when-issued basis or for delayed draws on loans can take place a month or more after the trade date. At the time a Fund makes the commitment to purchase a security on a when-issued basis, the Fund records the transaction and reflects the value of the security in determining net asset value. No interest accrues to the Fund until the transaction settles and payment takes place. Normally, the settlement date occurs within one month of the purchase. A segregated account is established and the Fund maintains cash and/or marketable securities at least equal in value to commitments for when-issued securities. If a Fund owns when-issued securities, these values are included in Payable for investments purchased on the accompanying Statements of Assets and Liabilities and the segregated assets are identified on the Schedules of Portfolio Investments.
Municipal Obligations:
The values of municipal obligations can fluctuate and may be affected by adverse tax, legislative, or political changes, and by financial developments affecting municipal issuers. Payment of municipal obligations may depend on a relatively limited source of revenue, resulting in greater credit risk. Future changes in federal tax laws or the activity of an issuer may adversely affect the tax-exempt status of municipal obligations.
Mortgage- and Asset-Backed Securities:
The values of some mortgage-related or asset-backed securities may be particularly sensitive to changes in prevailing interest rates. Early repayment of principal on some mortgage-related securities may expose a Fund to a lower rate of return upon reinvestment of principal. The values of mortgage- and asset-backed securities depend in part on the credit quality and adequacy of the underlying assets or collateral and may fluctuate in response to the market's perception of these factors as well as current and future repayment rates. Some mortgage-backed securities are backed by the full faith and credit of the U.S. government (e.g., mortgage-backed securities issued by the Government National Mortgage Association, commonly known as "Ginnie Mae"), while other mortgage-backed securities (e.g., mortgage- backed securities issued by the Federal National Mortgage Association and the Federal Home Loan Mortgage Corporation, commonly known as "Fannie Mae" and "Freddie Mac," respectively), are backed only by the credit of the government entity issuing them. In addition, some mortgage-backed securities are issued by private entities and, as such, are not guaranteed by the U.S. government or any agency or instrumentality of the U.S. government.
Loans:
Floating rate loans in which a Fund invests are primarily "senior" loans. Senior floating rate loans typically hold a senior position in the capital structures of the borrower, are typically secured by specific collateral, and have a claim on the assets and/or stock of the borrower that is senior to that held by
96
Victory Portfolios | | Notes to Financial Statements — continued
June 30, 2021 | |
(Unaudited)
subordinated debtholders and stockholders of the borrower. While these protections may reduce risk, these investments still present significant credit risk. A significant portion of a Fund's floating rate investments may be issued in connection with highly leveraged transactions such as leveraged buyouts, leveraged recapitalization loans, and other types of acquisition financing. Obligations in these types of transactions are subject to greater credit risk (including default and bankruptcy) than many other investments and may be, or become, illiquid. See the note below regarding below investment grade securities.
A Fund may purchase second-lien loans (secured loans with a claim on collateral subordinate to a senior lender's claim on such collateral), fixed rate loans, unsecured loans, and other debt obligations.
Transactions in loans often settle on a delayed basis, and a Fund may not receive the proceeds from the sale of a loan or pay for a loan purchase for a substantial period of time after entering into the transactions.
Below-Investment-Grade-Securities:
Certain Funds may invest in below-investment-grade securities (i.e., lower-quality, "junk" debt), which are subject to various risks. Lower-quality debt is considered to be speculative because it is less certain that the issuer will be able to pay interest or repay the principal than in the case of investment-grade debt. These securities can involve a substantially greater risk of default than higher-rated securities, and their values can decline significantly over short periods of time. Lower-quality debt securities tend to be more sensitive to adverse news about their issuers, the market and the economy in general, than higher-quality debt securities. The market for these securities can be less liquid, especially during periods of recession or general market decline.
Derivative Instruments:
Futures Contracts:
The Funds may enter into contracts for the future delivery of securities or foreign currencies and futures contracts based on a specific security, class of securities, foreign currency or an index, and purchase or sell options on any such futures contracts. A futures contract on a securities index is an agreement obligating either party to pay, and entitling the other party to receive, while the contract is outstanding, cash payments based on the level of a specified securities index. No physical delivery of the underlying asset is made. The Funds may enter into futures contracts in an effort to hedge against market risks. The acquisition of put and call options on futures contracts will give the Funds the right (but not the obligation), for a specified price, to sell or to purchase the underlying futures contract, upon exercise of the option, at any time during the option period. Futures transactions involve brokerage costs and require the Funds to segregate assets to cover contracts that would require it to purchase securities or currencies. A good faith margin deposit, known as initial margin, of cash or government securities with a broker or custodian is required to initiate and maintain open positions in futures contracts. Subsequent payments, known as variation margin, are made or received by the Funds based on the change in the market value of the position and are recorded as unrealized appreciation or depreciation until the contract is closed out, at which time the gain or loss is realized. The Funds may lose the expected benefit of futures transactions if interest rates, exchange rates or securities prices change in an unanticipated manner. Such unanticipated changes may also result in lower overall performance than if the Funds had not entered into any futures transactions. In addition, the value of the Funds' futures positions may not prove to be perfectly or even highly correlated with the value of its portfolio securities or foreign currencies, limiting the Funds' ability to hedge effectively against interest rate, exchange rate and/or market risk and giving rise to additional risks. There is no assurance of liquidity in the secondary market for purposes of closing out futures positions. The collateral held by the Funds is presented on the Statements of Assets and Liabilities under Deposit with broker for futures contracts.
During the six months ended June 30, 2021, the Funds entered into futures contracts primarily for the strategy of hedging or other purposes, including but not limited to, providing liquidity and equitizing cash.
97
Victory Portfolios | | Notes to Financial Statements — continued
June 30, 2021 | |
(Unaudited)
Credit Derivatives:
The Funds may enter into credit derivatives, including centrally cleared credit default swaps on individual obligations or credit indices. The Funds may use these investments (i) as alternatives to direct long or short investment in a particular security or securities, (ii) to adjust the Funds' asset allocations or risk exposures, or (iii) for hedging purposes. The use by the Funds of centrally cleared credit default swaps may have the effect of creating a short position in a security. Credit derivatives can create investment leverage and may create additional investment risks that may subject the Funds to greater volatility than investments in more traditional securities, as described in the Funds' Statement of Additional Information.
Centrally cleared credit default swap ("CDS") agreements on credit indices involve one party making a stream of payments (referred to as the buyer of protection) to another party (the seller of protection) in exchange for the right to receive a specified return in the event of a write-down, principal shortfall, interest shortfall or default of all or part of the referenced entities comprising the credit index. A credit index is a basket of credit instruments or exposures designed to be representative of a specific sector of the credit market as a whole. These indices are made up of reference credits that are judged by a poll of dealers to be the most liquid entities in the CDS.
The counterparty risk for cleared swap agreements is generally lower than uncleared over-the-counter swap agreements because generally a clearing organization becomes substituted for each counterparty to a centrally cleared swap agreement and, in effect, guarantees each party's performance under the contract as each party to a trade looks only to the clearing organization for performance of financial obligations. However, there can be no assurance that the clearing organization, or its members, will satisfy its obligations to the Fund.
The Funds may enter into CDS agreements either as a buyer or seller. The Funds may buy protection under a CDS to attempt to mitigate the risk of default or credit quality deterioration in one or more individual holdings or in a segment of the fixed income securities market. The Funds may sell protection under a CDS in an attempt to gain exposure to an underlying issuer's credit quality characteristics without investing directly in that issuer.
For swaps entered with an individual counterparty, the Funds bear the risk of loss of the uncollateralized amount expected to be received under a CDS agreement in the event of the default or bankruptcy of the counterparty. CDS agreements are generally valued at a price at which the counterparty to such agreement would terminate the agreement. The Funds may also enter into cleared swaps.
Upon entering into a cleared CDS, the Funds may be required to deposit with the broker an amount of cash or cash equivalents in the range of approximately 3% to 6% of the notional amount for CDS on high yield debt issuers (this amount is subject to change by the clearing organization that clears the trade). This amount, known as "initial margin," is in the nature of a performance bond or good faith deposit on the CDS and is returned to a Fund upon termination of the CDS, assuming all contractual obligations have been satisfied. Subsequent payments, known as "variation margin," to and from the broker will be made daily as the price of the CDS fluctuates, making the long and short positions in the CDS contract more or less valuable, a process known as "marking-to-market". The premium (discount) payments are built into the daily price of the CDS and thus are amortized through the variation margin. The variation margin payment also includes the daily portion of the periodic payment stream.
The maximum potential amount of future payments (undiscounted) that the Funds as a seller of protection could be required to make under a CDS agreement equals the notional amount of the agreement. Notional amounts of each individual CDS agreement outstanding as of period end for which the Funds are the sellers of protection are disclosed on the Schedules of Portfolio Investments. These potential amounts would be partially offset by any recovery values of the respective referenced obligations, upfront payments received upon entering into the agreement, periodic interest payments, or net amounts received from the settlement of buy protection CDS agreements entered into by the Funds for the same referenced entity or entities. The collateral held by the Funds is presented on the Statements of Assets and Liabilities under Deposit with broker for swap agreements.
98
Victory Portfolios | | Notes to Financial Statements — continued
June 30, 2021 | |
(Unaudited)
As of June 30, 2021, the INCORE Investment Quality Bond Fund, INCORE Low Duration Bond Fund and Strategic Income Fund entered into centrally cleared CDS agreements primarily for the strategy of asset allocation and risk management.
Offsetting of Financial Assets and Derivatives Assets:
The Funds are subject to various Master Netting Arrangements, which govern the terms of certain transactions with select counterparties. The Master Netting Arrangements allow the Funds to close out and net total exposure to a counterparty in the event of a default with respect to all the transactions governed under a single agreement with a counterparty. The Master Netting Arrangements also specify collateral posting arrangements at pre-arranged exposure levels. Under the Master Netting Arrangements, collateral is routinely transferred if the total net exposure to certain transactions (net of existing collateral already in place) governed under the relevant Master Netting Arrangement with a counterparty in a given account exceeds a specified threshold depending on the counterparty and the type of Master Netting Arrangement.
The table below, as of June 30, 2021, discloses both gross information and net information about instruments and transactions eligible for offset on the Statements of Assets and Liabilities and instruments and transactions that are subject to an agreement similar to a master netting agreement as well as amounts related to collateral held at clearing brokers and counterparties.
| | | | | | | Net Amounts
Presented in the | | Gross Amounts not offset in the
Statements of Assets and Liabilities | |
| | | Gross Amounts
of Recognized
Assets | | Gross Amounts
Available for
Offset | | Statements of
Assets and
Liabilities | | Financial
Instruments
for Offset | | Cash
Collateral
Received | | Net
Amount | |
INCORE Investment Quality Bond Fund | |
Futures Contracts — Goldman
Sachs & Co. | | $ | 11,331 | | | $ | — | | | $ | 11,331 | | | $ | (3,951 | ) | | $ | — | | | $ | 7,380 | | |
INCORE Low Duration Bond Fund | |
Futures Contracts — Goldman
Sachs & Co. | | | 27,249 | | | | — | | | | 27,249 | | | | (18,003 | ) | | | — | | | | 9,246 | | |
Strategic Income Fund | |
Futures Contracts — Goldman
Sachs & Co. | | | 24,494 | | | | — | | | | 24,494 | | | | (24,494 | ) | | | — | | | | — | | |
| | | | | | | Net Amounts
Presented in the | | Gross Amounts not offset in the
Statements of Assets and Liabilities | |
| | | Gross Amounts
of Recognized
Liabilities | | Gross Amounts
Available for
Offset | | Statements of
Assets and
Liabilities | | Financial
Instruments
for Offset | | Cash
Collateral
Pledged* | | Net
Amount | |
INCORE Investment Quality Bond Fund | |
Futures Contracts — Goldman
Sachs & Co. | | $ | 3,951 | | | $ | — | | | $ | 3,951 | | | $ | (3,951 | ) | | $ | — | | | $ | — | | |
INCORE Low Duration Bond Fund | |
Futures Contracts — Goldman
Sachs & Co. | | | 18,003 | | | | — | | | | 18,003 | | | | (18,003 | ) | | | — | | | | — | | |
Strategic Income Fund | |
Futures Contracts — Goldman
Sachs & Co. | | | 81,547 | | | | — | | | | 81,547 | | | | (24,494 | ) | | | (57,053 | ) | | | — | | |
* Cash collateral pledged may be in excess of the amounts shown in the table. The total cash collateral pledged by each Fund is disclosed in the Statements of Assets and Liabilities.
99
Victory Portfolios | | Notes to Financial Statements — continued
June 30, 2021 | |
(Unaudited)
Summary of Derivative Instruments:
The following table summarizes the fair values of derivative instruments on the Statements of Assets and Liabilities, categorized by risk exposure, as of June 30, 2021:
| | | Assets | | Liabilities | |
| | | Variation Margin
Receivable on Open
Futures Contracts* | | Variation Margin
Payable on Open
Futures Contracts* | |
Interest Rate Risk Exposure: | |
INCORE Investment Quality Bond Fund | | $ | 50,056 | | | $ | 19,087 | | |
INCORE Low Duration Bond Fund | | | 61,053 | | | | 120,796 | | |
Strategic Income Fund | | | 62,807 | | | | 303,205 | | |
* Includes cumulative appreciation/depreciation of futures contracts as reported on the Schedules of Portfolio Investments. Only current day's variation margin for futures contracts are reported within the Statements of Assets and Liabilities.
The following table presents the effect of derivative instruments on the Statements of Operations, categorized by risk exposure, for the six months ended June 30, 2021:
| | | Net Realized Gains (Losses)
on Derivatives
Recognized as a
Result from Operations | | Net Change in Unrealized
Appreciation/Depreciation
on Derivatives Recognized
as a Result of Operations | |
| | | Net Realized
Gains (Losses)
from Futures
Contracts | | Net Realized
Gains (Losses)
from Swap
Agreements | | Net Change in
Unrealized
Appreciation/
Depreciation
on Futures
Contracts | | Net Change in
Unrealized
Appreciation/
Depreciation
on Swap
Agreements | |
Credit Risk Exposure: | |
INCORE Investment Quality Bond Fund | | $ | — | | | $ | 36,573 | | | $ | — | | | $ | — | | |
INCORE Low Duration Bond Fund | | | — | | | | 211,736 | | | | — | | | | — | | |
Strategic Income Fund | | | — | | | | 90,280 | | | | — | | | | — | | |
Interest Rate Risk Exposure: | |
INCORE Investment Quality Bond Fund | | | (139,021 | ) | | | — | | | | 28,554 | | | | — | | |
INCORE Low Duration Bond Fund | | | 294,726 | | | | — | | | | (39,968 | ) | | | — | | |
Strategic Income Fund | | | 110,604 | | | | — | | | | (212,430 | ) | | | — | | |
All open derivative positions at period end are reflected on each respective Fund's Schedule of Portfolio Investments. The underlying face value of open derivative positions relative to each Fund's net assets at period end is generally representative of the notional amount of open positions to net assets throughout the period.
Investment Transactions and Related Income:
Changes in holdings of investments are accounted for no later than one business day following the trade date. For financial reporting purposes, however, investment transactions are accounted for on trade date on the last business day of the reporting period. Interest income is determined on the basis of coupon interest accrued using the effective interest method which adjusts, where applicable, the amortization of premiums or accretion of discounts. Dividend income is recorded on the ex-dividend date. Gains or losses realized on sales of securities are recorded on the identified cost basis. Paydown gains or losses on applicable securities, if any, are recorded as components of Interest income on the Statements of Operations.
100
Victory Portfolios | | Notes to Financial Statements — continued
June 30, 2021 | |
(Unaudited)
The Funds may receive other income from investments in loan assignments and/or unfunded commitments, including amendment fees, consent fees, and commitment fees. These fees are recorded as income when received. These amounts, if received, are included in Interest income on the Statements of Operations.
Securities Lending:
The Trust has entered into a Master Securities Lending Agreement ("MSLA") with Citibank, N.A. ("Citibank"). Under the terms of the MSLA, the Funds may lend securities to certain broker-dealers, and banks, in exchange for collateral in the amount of at least 102% of the value of U.S. securities loaned or at least 105% of the value of non-U.S. securities loaned, marked-to-market daily. Any collateral shortfalls associated with increases in the valuation of the securities loaned are adjusted the next business day. The collateral can be received in the form of cash collateral and/or non-cash collateral. Non-cash collateral can include U.S. Government Securities, letters of credit and certificates of deposit. The cash collateral is invested in short-term instruments or cash equivalents, primarily open-end investment companies, as noted on the Funds' Schedules of Portfolio Investments. The Trust does not have effective control of the non-cash collateral and therefore it is not disclosed on the Funds' Schedules of Portfolio Investments. During the time portfolio securities are on loan, the borrower will pay the Funds any dividends or interest paid on such securities plus any fee negotiated between the parties to the lending agreement. The Funds also earn a return from the collateral. The Funds pay Citibank various fees in connection with the investment of cash collateral and fees based on the investment income received from securities lending activities. Securities lending income (net of these fees) is disclosed on the Statements of Operations. Although risk is mitigated by the collateral, the Fund could experience a delay in recovering its securities and possible loss of income or value if the borrower fails to return them.
Securities lending transactions are entered into by a Fund under the MSLA, which permits the Fund, under certain circumstances such as an event of default, to offset amounts payable by the Fund to the same counterparty against amounts receivable from the counterparty to create a net payment due to or from the Fund.
The following table is a summary of the Funds' securities lending transactions which are subject to offset under the MSLA as of June 30, 2021. These transactions are accounted for as secured borrowings with an overnight and continuous contractual maturity for cash collateral, and greater than overnight and continuous contractual maturity for non-cash collateral.
| | | Gross Amount of
Recognized | | Value of
Cash | | Value of Non-cash Collateral
Received by Maturity | | | |
| | | Assets (Value of
Securities on Loan) | | Collateral
Received* | | <30
days | | Between
30 & 90 days | | >90
days | | Net
Amount | |
INCORE Investment
Quality Bond Fund | | $ | 807,442 | | | $ | 807,442 | | | $ | — | | | $ | — | | | $ | — | | | $ | — | | |
INCORE Low Duration
Bond Fund | | | 10,492,618 | | | | 10,492,618 | | | | — | | | | — | | | | — | | | | — | | |
High Yield Fund | | | 23,579,203 | | | | 23,579,203 | | | | — | | | | — | | | | — | | | | — | | |
Strategic Income Fund | | | 4,274,943 | | | | 4,274,943 | | | | — | | | | — | | | | — | | | | — | | |
* Collateral received in excess of the market value of securities on loan is not presented in this table. The total cash collateral received by each Fund is disclosed on the Statements of Assets and Liabilities.
101
Victory Portfolios | | Notes to Financial Statements — continued
June 30, 2021 | |
(Unaudited)
Foreign Currency Translations:
The accounting records of the Funds are maintained in U.S. dollars. Investment securities and other assets and liabilities of a Fund denominated in a foreign currency are translated into U.S. dollars at current exchange rates. Purchases and sales of securities, income receipts and expense payments are translated into U.S. dollars at the exchange rates on the date of the transactions. The Funds do not isolate the portion of the results of operations resulting from changes in foreign exchange rates on investments from fluctuations arising from changes in market prices of securities held. Such fluctuations are disclosed as Net change in unrealized appreciation/depreciation on investment securities and foreign currency translations on the Statements of Operations. Any realized gains or losses from these fluctuations are disclosed as Net realized gains (losses) from investment securities and foreign currency translations on the Statements of Operations.
Federal Income Taxes:
It is the policy of each Fund to continue to qualify as a regulated investment company by complying with the provisions available to certain investment companies, as defined in applicable sections of the Internal Revenue Code, and to make distributions of net investment income and net realized gains sufficient to relieve it from all, or substantially all, federal income taxes. Accordingly, no provision for federal income taxes is required in the financial statements. The Funds have a tax year end of December 31.
Management of the Funds has reviewed tax positions taken in tax years that remain subject to examination by all major tax jurisdictions, including federal (i.e., the last four tax years, which includes the current fiscal tax year end). Management believes that there is no tax liability resulting from unrecognized tax benefits related to uncertain tax positions taken.
Allocations:
Expenses directly attributable to the Funds are charged to the Funds, while expenses that are attributable to more than one fund in the Trust, or jointly with an affiliated trust, are allocated among the respective funds in the Trust and/or affiliated trust based upon net assets or another appropriate basis.
Income, expenses (other than class-specific expenses such as transfer agent fees, state registration fees, 12b-1 fees, and printing fees), and realized and unrealized gains or losses on investments are allocated to each class of shares based on its relative net assets on the date income is earned or expenses and realized and unrealized gains and losses are incurred.
Cross-Trade Transactions:
Pursuant to Rule 17a-7 under the 1940 Act, the Funds may engage in securities transactions with affiliated investment companies and advisory accounts managed by the Adviser and any applicable sub-adviser. Any such purchase or sale transaction must be effected without brokerage commission or other remuneration, except for customary transfer fees. The transaction must be effected at the current market price, which is either the security's last sale price on an exchange or, if there are no transactions in the security that day, at the average of the highest bid and lowest asked price. For the six months ended June 30, 2021, the Funds below engaged in the following securities transactions with affiliated funds, which resulted in the following net realized gains (losses):
| | | Purchases | | Sales | | Net Realized
Gains (Losses) | |
Tax-Exempt Fund | | $ | 2,300,000 | | | $ | 1,400,000 | | | $ | — | | |
High Income Municipal Bond Fund | | | 2,963,720 | | | | 5,600,000 | | | | — | | |
102
Victory Portfolios | | Notes to Financial Statements — continued
June 30, 2021 | |
(Unaudited)
3. Purchases and Sales:
Purchases and sales of securities (excluding securities maturing less than one year from acquisition) for the six months ended June 30, 2021, were as follows.
| | | Excluding
U.S. Government Securities | | U.S. Government Securities | |
| | | Purchases | | Sales | | Purchases | | Sales | |
INCORE Investment Quality
Bond Fund | | $ | 4,412,557 | | | $ | 5,293,382 | | | $ | 4,609,419 | | | $ | 7,163,556 | | |
INCORE Low Duration
Bond Fund | | | 83,045,193 | | | | 47,461,890 | | | | 13,968,203 | | | | 70,720,915 | | |
| High Yield Fund | | | 147,851,352 | | | | 107,355,952 | | | | — | | | | — | | |
| Tax-Exempt Fund | | | 600,000 | | | | 11,179,159 | | | | — | | | | — | | |
High Income Municipal
Bond Fund | | | 9,859,810 | | | | 4,126,103 | | | | — | | | | — | | |
| Floating Rate Fund | | | 1,252,892,417 | | | | 210,526,068 | | | | — | | | | — | | |
| Strategic Income Fund | | | 122,456,147 | | | | 123,588,984 | | | | 14,007,920 | | | | 33,852,552 | | |
4. Fees and Transactions with Affiliates and Related Parties:
Investment Advisory Fees:
Investment advisory services are provided to the Funds by the Adviser, which is a New York corporation registered as an investment adviser with the Securities and Exchange Commission ("SEC"). The Adviser is an indirect wholly owned subsidiary of Victory Capital Holdings, Inc., a publicly traded Delaware corporation, and a wholly owned direct subsidiary of Victory Capital Operating, LLC.
VCM has entered into a Sub-Advisory Agreement with Park Avenue Institutional Advisers LLC ("Park Avenue"). Park Avenue is responsible for providing day-to-day investment advisory services to the High Yield Fund, the Floating Rate Fund and the Strategic Income Fund, subject to the oversight of the Board. Prior to April 2020, Park Avenue provided investment advisory services to the Tax-Exempt Fund and the High Income Municipal Bond Fund.
Under the terms of the Investment Advisory Agreement, the Adviser is entitled to receive fees based on a percentage of the average daily net assets of each Fund. The rates at which the Adviser is paid by each Fund are included in the table below.
| | | Flat Rate | |
INCORE Investment Quality Bond Fund | | | 0.50 | % | |
INCORE Low Duration Bond Fund | | | 0.45 | % | |
High Yield Fund | | | 0.60 | % | |
Tax-Exempt Fund | | | 0.50 | % | |
High Income Municipal Bond Fund | | | 0.50 | % | |
Floating Rate Fund | | | 0.65 | % | |
Strategic Income Fund | | | 0.60 | % | |
Amounts incurred and paid to VCM for the six months ended June 30, 2021, are reflected on the Statements of Operations as Investment advisory fees.
Administration and Servicing Fees:
VCM serves as the Funds' administrator and fund accountant. Under the Administration and Fund Accounting Agreement, VCM is entitled to receive fees based on a percentage of the average daily net assets of the Trust, Victory Variable Insurance Funds and Victory Portfolios II (collectively, the "Victory Funds Complex"). The tiered rates at which VCM is paid by the Funds are shown in the table below:
| Assets up to $15 billion | | Assets $15 billion - $30 billion | | Assets over $30 billion | |
| | 0.08 | %, plus | | | 0.05 | %, plus | | | 0.04 | % | |
103
Victory Portfolios | | Notes to Financial Statements — continued
June 30, 2021 | |
(Unaudited)
Amounts incurred for the six months ended June 30, 2021, are reflected on the Statements of Operations as Administration fees.
Citi Fund Services Ohio, Inc. ("Citi"), an affiliate of Citibank, acts as sub-administrator and sub-fund accountant to the Fund pursuant to the Sub-Administration and Sub-Fund Accounting Services Agreement between VCM and Citi. VCM pays Citi a fee for providing these services. The Trust reimburses VCM and Citi for out-of-pocket expenses incurred in providing these services and certain other expenses specifically allocated to the Fund. Amounts incurred for the six months ended June 30, 2021, are reflected on the Statements of Operations as Sub-Administration fees.
The Chief Compliance Officer ("CCO") is an employee of the Adviser, which pays the compensation of the CCO and his support staff. The Trust has entered into an agreement to provide compliance services with the Adviser, pursuant to which the Adviser furnishes its compliance personnel, including the services of the CCO, and other resources reasonably necessary to provide the Trust with compliance oversight services related to the design, administration and oversight of a compliance program for the Trust in accordance with Rule 38a-1 under the 1940 Act. The funds in the Victory Funds Complex, in aggregate, compensate the Adviser for these services. Amounts incurred for the six months ended June 30, 2021, are reflected on the Statements of Operations as Compliance fees.
Transfer Agency Fees:
FIS Investor Services, LLC ("FIS") serves as the Funds' transfer agent. Under the Transfer Agent Agreement, the Trust pays FIS a fee for its services and reimburses FIS for all of their reasonable out-of-pocket expenses incurred in providing these services. Amounts incurred for the six months ended June 30, 2021, are reflected on the Statements of Operations as Transfer agent fees.
Victory Capital Transfer Agency, Inc., an affiliate of the Adviser, serves as sub-transfer agent for the Member Class shares of the Funds and receives no fee or other compensation for these services.
Distributor/Underwriting Services:
Victory Capital Services, Inc. (the "Distributor"), an affiliate of the Adviser, serves as distributor for the continuous offering of the shares of the Funds pursuant to a Distribution Agreement between the Distributor and the Trust. Pursuant to the Distribution and Service Plans adopted in accordance with Rule 12b-1 under the 1940 Act, the Distributor may receive a monthly distribution and service fee as shown in the table below:
| | | Class A | | Class C | | Class R | | Class Y | | Member
Class | |
INCORE Investment Quality Bond Fund | | | 0.25 | % | | | 1.00 | % | | | 0.50 | % | | | 0.00 | % | | | N/A | | |
INCORE Low Duration Bond Fund | | | 0.25 | % | | | 1.00 | % | | | 0.50 | % | | | 0.00 | % | | | N/A | | |
High Yield Fund | | | 0.25 | % | | | 1.00 | % | | | 0.50 | % | | | 0.00 | % | | | N/A | | |
Tax-Exempt Fund | | | 0.25 | % | | | 1.00 | % | | | 0.50 | % | | | 0.00 | % | | | N/A | | |
High Income Municipal Bond Fund | | | 0.25 | % | | | 1.00 | % | | | N/A | | | | 0.00 | % | | | 0.00 | % | |
Floating Rate Fund | | | 0.25 | % | | | 1.00 | % | | | 0.50 | % | | | 0.00 | % | | | 0.00 | % | |
Strategic Income Fund | | | 0.25 | % | | | 1.00 | % | | | 0.50 | % | | | 0.00 | % | | | N/A | | |
The distribution and service fees paid to the Distributor may be used by the Distributor to pay for activities primarily intended to result in the sale of Class A, Class C, and Class R. Amounts incurred for the six months ended June 30, 2021, are reflected on the Statements of Operations as 12b-1 fees.
In addition, the Distributor is entitled to receive commissions on sale of the Class A. For the six months ended June 30, 2021, the Distributor received approximately $18,871 from commissions earned on the sale of Class A.
Other Fees:
Citibank serves as the Funds' custodian. The Funds pay Citibank a fee for providing these services. Amounts incurred for the six months ended June 30, 2021, are reflected on the Statements of Operations as Custodian fees.
104
Victory Portfolios | | Notes to Financial Statements — continued
June 30, 2021 | |
(Unaudited)
Sidley Austin LLP provides legal services to the Trust.
The Adviser has entered into expense limitation agreements with the Funds. Under the terms of the agreements, the Adviser has agreed to waive fees or reimburse certain expenses to the extent that ordinary operating expenses incurred by certain classes of a Fund in any fiscal year exceed the expense limit for such classes of the Fund. Such excess amounts will be the liability of the Adviser. Acquired fund fees and expense, interest, taxes, brokerage commissions, other expenditures that are capitalized in accordance with GAAP, and other extraordinary expenses not incurred in the ordinary course of a Fund's business are excluded from the expense limits. As of June 30, 2021, the expense limits (excluding voluntary waivers) are as follows:
| | | In effect until April 30, 2022 | |
| | | Class A | | Class C | | Class R | | Class Y | | Member
Class | |
INCORE Investment Quality Bond Fund | | | 0.90 | % | | | 1.77 | % | | | 1.30 | % | | | 0.66 | % | | | N/A | | |
INCORE Low Duration Bond Fund | | | 0.85 | % | | | 1.62 | % | | | 1.27 | % | | | 0.62 | % | | | N/A | | |
High Yield Fund | | | 1.00 | % | | | 1.70 | % | | | 1.35 | % | | | 0.76 | % | | | N/A | | |
Tax-Exempt Fund | | | 0.80 | % | | | 1.60 | % | | | N/A | | | | 0.69 | % | | | N/A | | |
High Income Municipal Bond Fund | | | 0.80 | % | | | 1.57 | % | | | N/A | | | | 0.57 | % | | | 0.65 | % | |
Floating Rate Fund | | | 1.00 | % | | | 1.80 | % | | | 1.56 | % | | | 0.78 | % | | | 0.85 | % | |
Strategic Income Fund | | | 0.95 | % | | | 1.74 | % | | | 1.34 | % | | | 0.74 | % | | | N/A | | |
Under the terms of the expense limitation agreements, amended May 1, 2021, the Funds have agreed to repay fees and expenses that were waived or reimbursed by the Adviser for a period of up to three years (thirty six (36) months) after the waiver or reimbursement took place, subject to the lesser of any operating expense limits in effect at the time of: (a) the original waiver or expense reimbursement; or (b) the recoupment, after giving effect to the recoupment amount. Prior to May 1, 2021, the Funds were permitted to recoup fees waived and expenses reimbursed for up to three years after the fiscal year in which the waiver or reimbursement took place, subject to the limitations above. This change did not have any effect on the amounts previously reported for recoupment.
As of June 30, 2021, the following amounts are available to be repaid to the Adviser. The Funds have not recorded any amounts available to be repaid as a liability due to an assessment that such repayment is not probable at June 30, 2021.
| | | Expires
2021 | | Expires
2022 | | Expires
2023 | | Expires
2024 | | Total | |
INCORE Investment Quality Bond Fund | | $ | 55,524 | | | $ | 127,606 | | | $ | 136,293 | | | $ | 67,619 | | | $ | 387,042 | | |
INCORE Low Duration Bond Fund | | | 50,056 | | | | 163,391 | | | | 131,941 | | | | 50,953 | | | | 396,341 | | |
High Yield Fund | | | 42,016 | | | | 181,413 | | | | 253,784 | | | | 88,775 | | | | 565,988 | | |
Tax-Exempt Fund | | | 56,636 | | | | 132,065 | | | | 135,204 | | | | 75,897 | | | | 399,802 | | |
High Income Municipal Bond Fund | | | 54,443 | | | | 132,417 | | | | 131,713 | | | | 76,600 | | | | 395,173 | | |
Floating Rate Fund | | | 364,778 | | | | 841,458 | | | | 827,922 | | | | 320,963 | | | | 2,355,121 | | |
Strategic Income Fund | | | 47,053 | | | | 110,089 | | | | 134,256 | | | | 74,851 | | | | 366,249 | | |
The Adviser may voluntarily waive or reimburse additional fees to assist the Funds in maintaining competitive expense ratios. Voluntary waivers and reimbursements applicable to the Funds are not available to be recouped at a future time. For the six months ended June 30, 2021, the Adviser voluntarily waived the following amounts:
INCORE Low Duration Bond Fund | | $ | 45,897 | | |
Certain officers and/or interested trustees of the Fund are also officers and/or employees of the Adviser, administrator, fund accountant, sub-administrator, sub-fund accountant, custodian, legal counsel and Distributor.
105
Victory Portfolios | | Notes to Financial Statements — continued
June 30, 2021 | |
(Unaudited)
5. Risks:
The Funds may be subject to other risks in addition to these identified risks.
Debt Securities Risk — The value of a debt security or other income-producing security changes in response to various factors, including, for example, market-related factors (such as changes in interest rates or changes in the risk appetite of investors generally) and changes in the actual or perceived ability of the issuer (or of issuers generally) to meet its (or their) obligations. Other factors that may affect the value of debt securities, include, among others, public health crises and responses by governments and companies to such crises. These and other events may affect the creditworthiness of the issuer of a debt security and may impair an issuers ability to timely meet its debt obligations as they come due.
Credit Risk — The Funds will be subject to credit risk with respect to the amount each expects to receive from counterparties for financial instruments entered into by the Funds. The Funds may be negatively impacted if a counterparty becomes bankrupt or otherwise fails to perform its obligations due to financial difficulties. The Funds may experience significant delays in obtaining any recovery in bankruptcy or other reorganization proceeding and the Funds may obtain only limited recovery or may obtain no recovery in such circumstances. The Funds typically enter into transactions with counterparties whose credit ratings are investment grade, as determined by a nationally recognized statistical rating organization or, if unrated, judged by the Adviser to be of comparable quality.
LIBOR Discontinuation Risk — Many debt securities, derivatives and other financial instruments, including some of the Funds' investments, use the London Interbank Offered Rate ("LIBOR") as the reference or benchmark rate for variable interest rate calculations. In June 2017, the Alternative Reference Rates Committee, a group of large U.S. banks working with the Federal Reserve, announced its selection of a new Secured Overnight Funding Rate ("SOFR"), which is intended to be a broad measure of secured overnight U.S. Treasury repo rates, as an appropriate replacement for LIBOR. The Federal Reserve Bank of New York began publishing the SOFR in 2018, expecting that it could be used on a voluntary basis in new instruments and transactions. Bank working groups and regulators in other countries have suggested other alternatives for their markets, including the Sterling Overnight Interbank Average Rate ("SONIA") in England. In July 2017, the Financial Conduct Authority (the "FCA"), the United Kingdom financial regulatory body, announced that after 2021 it will cease its active encouragement of UK banks to provide the quotations needed to sustain LIBOR. That announcement suggests that LIBOR may cease to be published after that time. For U.S. dollar LIBOR, however, the relevant date may be deferred to June 30, 2023, for the most common tenors (overnight and one, three, six and 12 months). As to those tenors, the LIBOR administrator has published a consultation regarding its intention to cease publication of U.S. dollar LIBOR as of June 30, 2023 (instead of December 31, 2021, as previously expected), apparently based on continued rate submissions from banks. It is expected that there will be enough time for market participants to transition to the use of a different benchmark for both new and existing securities and transactions. Various financial industry groups have begun planning for that transition, but there are obstacles to converting certain longer-term securities and transactions to a new benchmark. Transition planning is at an early stage, and neither the effect of the transition process nor its ultimate success can yet be known. Although the foregoing may provide some sense of timing, there is no assurance that LIBOR, nor any particular currency and tenor, will continue to be published until any particular date, and it appears highly likely that LIBOR will be discontinued or modified after December 31, 2021, or June 30, 2023, depending on the currency and tenor. The transition process might lead to increased volatility and illiquidity in markets that currently rely on the LIBOR to determine interest rates. It could also lead to a reduction in the value of some LIBOR-based investments and reduce the effectiveness of new hedges placed against existing LIBOR-based instruments. Since the usefulness of LIBOR as a benchmark could deteriorate during the transition period, these effects could occur before the end of 2021.
106
Victory Portfolios | | Notes to Financial Statements — continued
June 30, 2021 | |
(Unaudited)
6. Borrowing and Interfund Lending:
Line of Credit:
The Victory Funds Complex participates in a short-term demand note "Line of Credit" agreement with Citibank. The Line of Credit agreement with Citibank was renewed on June 29, 2021, with a termination date of June 27, 2022. Under the agreement with Citibank, the Victory Funds Complex may borrow up to $600 million, of which $300 million is committed and $300 million is uncommitted. $40 million of the Line of Credit is reserved for use by the Victory Floating Rate Fund, another series of the Victory Funds Complex, with Victory Floating Rate Fund paying the related commitment fees for that amount. The purpose of the Line of Credit is to meet temporary or emergency cash needs. For the six months ended June 30, 2021, Citibank received an annual commitment fee of 0.15% on $300 million for providing the Line of Credit. Each fund in the Victory Funds Complex pays a pro-rata portion of the commitment fees plus any interest (one month LIBOR plus one percent) on amounts borrowed. For the period June 29, 2020, through April 30, 2021, under an amended Line of Credit agreement, Citibank received an annual upfront fee of 0.10% on the $300 million committed line of credit. Each fund in the Victory Funds Complex paid a pro-rata portion of the upfront fee. Effective with the renewal, the annual commitment fee of 0.15% remains unchanged and the upfront fee of 0.10% was discontinued. Interest charged to each Fund during the period, if applicable, is reflected on the Statements of Operations under Line of credit fees.
The Funds had no borrowings under the Line of Credit during the six months ended June 30, 2021.
Interfund Lending:
The Trust and Adviser rely on an exemptive order granted by the SEC in March 2017 (the "Order"), permitting the establishment and operation of an Interfund Lending Facility (the "Facility"). The Facility allows each Fund to directly lend and borrow money to or from any other fund in the Victory Funds Complex that is permitted to participate in the Facility, relying upon the Order at rates beneficial to both the borrowing and lending funds. Advances under the Facility are allowed for temporary or emergency purposes, including the meeting of redemption requests that otherwise might require the untimely disposition of securities, and are subject to each Fund's borrowing restrictions. The interfund loan rate is determined, as specified in the Order, by averaging the current repurchase agreement rate and the current bank loan rate. As a Borrower, interest charged to each Fund during the period, if applicable, is presented on the Statements of Operations under Interfund lending fees. As a Lender, interest earned by each Fund during the period, if applicable, is presented on the Statements of Operations under Interest expense on interfund lending.
The average borrowing or lending for the days outstanding and average interest rate for the Funds that utilized or participated in the Facility during the six months ended June 30, 2021, were as follows:
| | | Borrower or
Lender | | Amount
Outstanding at
June 30,
2021 | | Average
Borrowing* | | Days
Borrowing
Outstanding | | Average
Interest
Rate | | Maximum
Borrowing
During the
Period | |
Tax-Exempt Fund | | Borrower | | $ | — | | | $ | 4,130,000 | | | | 2 | | | | 0.61 | % | | $ | 6,130,000 | | |
Strategic Income
Fund | | Borrower | | | — | | | | 3,107,000 | | | | 4 | | | | 0.58 | % | | | 3,108,000 | | |
* For the six months ended June 30, 2021, based on the number of days borrowings were outstanding.
7. Federal Income Tax Information:
Dividends from net investment income, if any, are declared and paid as noted in the table below. Distributable net realized gains, if any, are declared and distributed at least annually from each Fund.
107
Victory Portfolios | | Notes to Financial Statements — continued
June 30, 2021 | |
(Unaudited)
| | | Declared | | Paid | |
INCORE Investment Quality Bond Fund | | Monthly | | Monthly | |
INCORE Low Duration Bond Fund | | Monthly | | Monthly | |
High Yield Fund | | Monthly | | Monthly | |
Tax-Exempt Fund | | Monthly | | Monthly | |
High Income Municipal Bond Fund | | Monthly | | Monthly | |
Floating Rate Fund | | Monthly | | Monthly | |
Strategic Income Fund | | Monthly | | Monthly | |
The amounts of dividends from net investment income and distributions from net realized gains (collectively, distributions to shareholders) are determined in accordance with federal income tax regulations, which may differ from GAAP. To the extent these "book/tax" differences are permanent in nature (e.g., net operating loss and distribution reclassification), such amounts are reclassified within the components of net assets based on their federal tax-basis treatment; temporary differences (e.g., wash sales) do not require reclassification. To the extent dividends and distributions exceed net investment income and net realized gains for tax purposes, they are reported as distributions of capital. Net investment losses incurred by a Fund may be reclassified as an offset to capital on the accompanying Statements of Assets and Liabilities.
The tax character of current year distributions paid and the tax basis of the current components of accumulated earnings (deficit) will be determined at the end of the current tax year ending December 31, 2021.
As of the tax year ended December 31, 2020, the Funds had net capital loss carryforwards as shown in the table below. It is unlikely that the Board will authorize a distribution of capital gains realized in the future until the capital loss carryforwards have been used.
| | | Short-Term
Amount | | Long-Term
Amount | | Total | |
INCORE Low Duration Bond Fund | | $ | 11,509,008 | | | $ | 19,103,147 | | | $ | 30,612,155 | | |
High Yield Fund | | | — | | | | 6,751,308 | | | | 6,751,308 | | |
Floating Rate Fund | | | 28,124,571 | | | | 155,201,348 | | | | 183,325,919 | | |
108
Victory Portfolios | | Supplemental Information
June 30, 2021 | |
(Unaudited)
Proxy Voting and Portfolio Holdings Information
Proxy Voting:
Information regarding the policies and procedures the Funds use to determine how to vote proxies relating to portfolio securities is available without charge, upon request, by calling 800-539-3863. The information is also included in the Funds' Statement of Additional Information, which is available on the SEC's website at www.sec.gov.
Information relating to how the Funds voted proxies relating to portfolio securities held during the most recent 12 months ended June 30 is available on the SEC's website at www.sec.gov.
Availability of Schedules of Portfolio Investments:
The Trust files a complete list of Schedules of Portfolio Investments with the SEC for the first and third quarter of each fiscal year on Form N-PORT. Forms N-PORT is available on the SEC's website at www.sec.gov.
Expense Examples
As a shareholder of the Funds, you may incur two types of costs: (1) transaction costs, including sales charges (loads) on purchases; and (2) ongoing costs, including management fees, distribution and service (12b-1) fees and other Fund expenses. These examples are intended to help you understand your ongoing costs (in dollars) of investing in the Funds and to compare these costs with the ongoing costs of investing in other mutual funds.
These examples are based on an investment of $1,000 invested at the beginning of the period and held for the entire period from January 1, 2021, through June 30, 2021.
The Actual Expense figures in the table below provide information about actual account values and actual expenses. You may use the information below, together with the amount you invested, to estimate the expenses that you paid over the period. Simply divide your account value by $1,000 (for example, an $8,600 account value divided by $1,000 = 8.6), then multiply the result by the number in the table under the heading entitled "Actual Expenses Paid During Period" to estimate the expenses you paid on your account during this period.
The Hypothetical Expense figures in the table below provide information about hypothetical account values and hypothetical expenses based on the Fund's actual expense ratio and an assumed rate of return of 5% per year before expenses, which is not the Fund's actual return. The hypothetical account values and expenses may not be used to estimate the actual ending account balance or expenses you paid for the period. You may use this information to compare this 5% hypothetical example with the 5% hypothetical examples that appear in shareholder reports of other funds.
Please note the expenses shown in the table below are meant to highlight your ongoing costs only and do not reflect any transactional costs. If these transactional costs were included, your costs would have been higher.
| | Beginning
Account
Value
1/1/21 | | Actual
Ending
Account
Value
6/30/21 | | Hypothetical
Ending
Account
Value
6/30/21 | | Actual
Expenses
Paid
During
Period
1/1/21-
6/30/21* | | Hypothetical
Expenses
Paid
During
Period
1/1/21-
6/30/21* | | Annualized
Expense
Ratio
During
Period
1/1/21-
6/30/21 | |
INCORE Investment Quality Bond Fund | |
Class A | | $ | 1,000.00 | | | $ | 991.20 | | | $ | 1,020.33 | | | $ | 4.44 | | | $ | 4.51 | | | | 0.90 | % | |
Class C | | | 1,000.00 | | | | 987.00 | | | | 1,016.02 | | | | 8.72 | | | | 8.85 | | | | 1.77 | | |
Class R | | | 1,000.00 | | | | 989.30 | | | | 1,018.35 | | | | 6.41 | | | | 6.51 | | | | 1.30 | | |
Class Y | | | 1,000.00 | | | | 991.40 | | | | 1,021.52 | | | | 3.26 | | | | 3.31 | | | | 0.66 | | |
INCORE Low Duration Bond Fund | |
Class A | | | 1,000.00 | | | | 1,006.00 | | | | 1,020.58 | | | | 4.23 | | | | 4.26 | | | | 0.85 | | |
Class C | | | 1,000.00 | | | | 1,003.00 | | | | 1,016.76 | | | | 8.05 | | | | 8.10 | | | | 1.62 | | |
Class R | | | 1,000.00 | | | | 1,003.90 | | | | 1,018.50 | | | | 6.31 | | | | 6.36 | | | | 1.27 | | |
Class Y | | | 1,000.00 | | | | 1,008.10 | | | | 1,021.72 | | | | 3.09 | | | | 3.11 | | | | 0.62 | | |
109
Victory Portfolios | | Supplemental Information — continued
June 30, 2021 | |
(Unaudited)
| | Beginning
Account
Value
1/1/21 | | Actual
Ending
Account
Value
6/30/21 | | Hypothetical
Ending
Account
Value
6/30/21 | | Actual
Expenses
Paid
During
Period
1/1/21-
6/30/21* | | Hypothetical
Expenses
Paid
During
Period
1/1/21-
6/30/21* | | Annualized
Expense
Ratio
During
Period
1/1/21-
6/30/21 | |
High Yield Fund | |
Class A | | $ | 1,000.00 | | | $ | 1,043.40 | | | $ | 1,019.84 | | | $ | 5.07 | | | $ | 5.01 | | | | 1.00 | % | |
Class C | | | 1,000.00 | | | | 1,039.70 | | | | 1,016.36 | | | | 8.60 | | | | 8.50 | | | | 1.70 | | |
Class R | | | 1,000.00 | | | | 1,041.90 | | | | 1,018.40 | | | | 6.53 | | | | 6.46 | | | | 1.29 | | |
Class Y | | | 1,000.00 | | | | 1,045.00 | | | | 1,021.03 | | | | 3.86 | | | | 3.81 | | | | 0.76 | | |
Tax-Exempt Fund | |
Class A | | | 1,000.00 | | | | 1,035.70 | | | | 1,020.83 | | | | 4.04 | | | | 4.01 | | | | 0.80 | | |
Class C | | | 1,000.00 | | | | 1,030.70 | | | | 1,016.86 | | | | 8.06 | | | | 8.00 | | | | 1.60 | | |
Class Y | | | 1,000.00 | | | | 1,035.30 | | | | 1,021.37 | | | | 3.48 | | | | 3.46 | | | | 0.69 | | |
High Income Municipal Bond Fund | |
Class A | | | 1,000.00 | | | | 1,047.60 | | | | 1,020.83 | | | | 4.06 | | | | 4.01 | | | | 0.80 | | |
Class C | | | 1,000.00 | | | | 1,043.80 | | | | 1,017.01 | | | | 7.96 | | | | 7.85 | | | | 1.57 | | |
Class Y | | | 1,000.00 | | | | 1,048.80 | | | | 1,021.97 | | | | 2.90 | | | | 2.86 | | | | 0.57 | | |
Member Class | | | 1,000.00 | | | | 1,048.40 | | | | 1,021.57 | | | | 3.30 | | | | 3.26 | | | | 0.65 | | |
Floating Rate Fund | |
Class A | | | 1,000.00 | | | | 1,028.60 | | | | 1,019.84 | | | | 5.03 | | | | 5.01 | | | | 1.00 | | |
Class C | | | 1,000.00 | | | | 1,025.60 | | | | 1,015.87 | | | | 9.04 | | | | 9.00 | | | | 1.80 | | |
Class R | | | 1,000.00 | | | | 1,026.80 | | | | 1,017.06 | | | | 7.84 | | | | 7.80 | | | | 1.56 | | |
Class Y | | | 1,000.00 | | | | 1,029.80 | | | | 1,020.93 | | | | 3.93 | | | | 3.91 | | | | 0.78 | | |
Member Class | | | 1,000.00 | | | | 1,029.30 | | | | 1,020.58 | | | | 4.28 | | | | 4.26 | | | | 0.85 | | |
Strategic Income Fund | |
Class A | | | 1,000.00 | | | | 999.90 | | | | 1,020.08 | | | | 4.71 | | | | 4.76 | | | | 0.95 | | |
Class C | | | 1,000.00 | | | | 995.10 | | | | 1,016.17 | | | | 8.61 | | | | 8.70 | | | | 1.74 | | |
Class R | | | 1,000.00 | | | | 997.10 | | | | 1,018.15 | | | | 6.64 | | | | 6.71 | | | | 1.34 | | |
Class Y | | | 1,000.00 | | | | 1,001.00 | | | | 1,021.12 | | | | 3.67 | | | | 3.71 | | | | 0.74 | | |
* Expenses are equal to the average account value multiplied by the Fund's annualized expense ratio multiplied by 181/365 (the number of days in the most recent fiscal half-year divided by the number of days in the fiscal year).
110
Victory Portfolios | | Supplemental Information — continued
June 30, 2021 | |
(Unaudited)
Liquidity Risk Management Program:
The Victory Funds have adopted and implemented a written liquidity risk management program (the "LRMP") as required by Rule 22e-4 under the Investment Company Act of 1940, as amended. The LRMP is reasonably designed to assess and manage each Fund's liquidity risk, taking into consideration each Fund's investment strategy and the liquidity of its portfolio investments during normal and reasonably foreseeable stressed market conditions; its short- and long-term cash flow projections; and its cash holdings and access to other liquidity management tools such as available funding sources including the Victory Funds Complex Interfund Lending Facility and Line of Credit (discussed in the Notes to Financial Statements). The Victory Funds' Board of Trustees approved the appointment of the Funds' investment adviser, Victory Capital Management Inc. ("Victory Capital"), as the administrator of the LRMP.
Victory Capital manages liquidity risks associated with the Funds' investments by monitoring, among other things, cash and cash equivalents, any use of derivatives, the concentration of investments, the appropriateness of each Fund's investment strategy, and by classifying every Fund investment as either highly liquid, moderately liquid, less liquid or illiquid on at least a monthly basis. To assist with the classification of Fund investments, Victory Capital has retained a third-party provider of liquidity evaluation services. This provider determines preliminary liquidity classifications for all portfolio holdings based upon portfolio-level data and certain assumptions provided by Victory Capital. Victory Capital reviews the preliminary liquidity classifications and, when appropriate, considers other information including input from the Funds' portfolio managers (including the portfolio managers employed by any investment sub-advisers) in determining final liquidity classifications.
At a meeting held on February 18, 2021, Victory Capital provided an oral and written report to the Trustees on the operation and effectiveness of the LRMP during the previous year. The report from Victory Capital concluded that the Funds did not experience any significant liquidity challenges during the covered period, and the Funds' LRMP is reasonably designed to assess and manage its liquidity risk. The report also concluded that the LRMP continues to operate adequately and effectively to enable Victory Capital to oversee and manage liquidity risk and ensure each Fund is able to meet redemption requests without significant dilution to the remaining investors' interest in each Fund. During the review period, each Fund's portfolio consisted primarily of highly liquid investments, which are defined as cash and any investments that the Fund reasonably expects to be converted to cash in current market conditions in three business days or less without significantly changing the market value of the investment. Therefore, the Funds have not adopted a highly liquid investment minimum. The Funds' investments were below the limitation on illiquid investments during the review period. Additionally, Victory Capital indicated that no events occurred that would require the filing of Form N-LIQUID and recommended no material changes to the LRMP.
111
Privacy Policy
Protecting the Privacy of Information
The Trust respects your right to privacy. We also know that you expect us to conduct and process your business in an accurate and efficient manner. To do so, we must collect and maintain certain personal information about you. This is the information we collect from you on applications or other forms, and from the transactions you make with us or third parties. It may include your name, address, social security number, account transactions and balances, and information about investment goals and risk tolerance.
We do not disclose any information about you or about former customers to anyone except as permitted or required by law. Specifically, we may disclose the information we collect to companies that perform services on our behalf, such as the transfer agent that processes shareholder accounts and printers and mailers that assist us in the distribution of investor materials. We may also disclose this information to companies that perform marketing services on our behalf. This allows us to continue to offer you Victory investment products and services that meet your investing needs, and to effect transactions that you request or authorize. These companies will use this information only in connection with the services for which we hired them. They are not permitted to use or share this information for any other purpose.
To protect your personal information internally, we permit access only by authorized employees and maintain physical, electronic, and procedural safeguards to guard your personal information.*
* You may have received communications regarding information about privacy policies from other financial institutions which gave you the opportunity to "opt-out" of certain information sharing with companies which are not affiliated with that financial institution. The Trust does not share information with other companies for purposes of marketing solicitations for products other than the Trust. Therefore, the Trust does not provide opt-out options to their shareholders.
Victory Funds
P.O. Box 182593
Columbus, Ohio 43218-2593

Visit our website at: | | Call Victory at: | |
www.vcm.com | | 800-539-FUND (800-539-3863) | |
| | | 800-235-8396 for Member Class | |
Item 2. Code of Ethics.
Not applicable — only for annual reports.
Item 3. Audit Committee Financial Expert.
Not applicable — only for annual reports.
Item 4. Principal Accountant Fees and Services.
Not applicable — only for annual reports.
Item 5. Audit Committee of Listed Registrants.
Not applicable.
Item 6. Investments.
(a) Not applicable.
(b) Not applicable.
Item 7. Disclosure of Proxy Voting Policies and Procedures for Closed-End Management Investment Companies.
Not applicable.
Item 8. Portfolio Managers of Closed-End Management Investment Companies.
Not applicable.
Item 9. Purchases of Equity Securities by Closed-End Management Investment Company and Affiliated Purchasers.
Not applicable.
Item 10. Submission of Matters to a Vote of Security Holders.
Not applicable.
Item 11. Controls and Procedures.
| (a) | The registrant’s principal executive officer and principal financial officer have concluded, based on their evaluation of the registrant's disclosure controls and procedures as conducted within 90 days of the filing date of this report, that these disclosure controls and procedures are adequately designed and are operating effectively to ensure that information required to be disclosed by the registrant on Form N-CSR is recorded, processed, summarized and reported within the time periods specified in the Securities and Exchange Commission's rules and forms. |
| (b) | There were no changes in the registrant’s internal control over financial reporting (as defined in Rule 30a-3(d) under the Investment Company Act of 1940 (17 CFR 270.30a-3(d)) that occurred during the period covered by this report that have materially affected or are reasonably likely to materially affect, the registrant’s internal control over financial reporting. |
Item 12. Disclosure of Securities Lending Activities for Closed-End Management Investment Companies.
(a)(1) Not applicable.
(a)(2) Not applicable.
(a)(3) Not applicable.
(a)(4) Not applicable.
(b) Not applicable.
Item 13. Exhibits.
(a)(1) Not applicable.
(a)(2) Certifications pursuant to Rule 30a-2(a) are attached hereto.
(a)(3) Not applicable.
(b) Certifications pursuant to Rule 30a-2(b) are furnished herewith.
SIGNATURES
Pursuant to the requirements of the Securities Exchange Act of 1934 and the Investment Company Act of 1940, the registrant has duly caused this report to be signed on its behalf by the undersigned, thereunto duly authorized.
| (Registrant) | Victory Portfolios | |
| By (Signature and Title)* | /s/ Allan Shaer | | |
| | Allan Shaer, Principal Financial Officer | |
Pursuant to the requirements of the Securities Exchange Act of 1934 and the Investment Company Act of 1940, this report has been signed below by the following persons on behalf of the registrant and in the capacities and on the dates indicated.
| By (Signature and Title)* | /s/ Christopher K. Dyer | |
| | Christopher K. Dyer, Principal Executive Officer | |
| By (Signature and Title)* | /s/ Allan Shaer | |
| | Allan Shaer, Principal Financial Officer | |