UNITED STATES
SECURITIES AND EXCHANGE COMMISSION
Washington, D.C. 20549
FORM N-CSR
CERTIFIED SHAREHOLDER REPORT OF REGISTERED
MANAGEMENT INVESTMENT COMPANIES
Investment Company Act file number: 811-04852
Victory Portfolios
(Exact name of registrant as specified in charter)
| 4900 Tiedeman Road, 4th Floor, Brooklyn, Ohio | 44144 |
| (Address of principal executive offices) | (Zip code) |
Citi Fund Services Ohio, Inc., 4400 Easton Commons, Suite 200, Columbus, OH 43219
(Name and address of agent for service)
Registrant’s telephone number, including area code: 800-539-3863
Date of fiscal year end: October 31
Date of reporting period: April 30, 2022
Item 1. Reports to Stockholders.

April 30, 2022
Semi Annual Report
Victory Diversified Stock Fund
Victory NewBridge Large Cap Growth Fund
Victory Special Value Fund
Victory THB US Small Opportunities Fund
Victory Strategic Allocation Fund
Victory INCORE Fund for Income
Victory INCORE Investment Grade Convertible Fund
www.vcm.com
News, Information And Education 24 Hours A Day, 7 Days A Week
The Victory Capital website gives fund shareholders, prospective shareholders, and investment professionals a convenient way to access fund information, get guidance, and track fund performance anywhere they can access the Internet. The site includes:
• Detailed performance records
• Daily share prices
• The latest fund news
• Investment resources to help you become a better investor
• A section dedicated to investment professionals
Whether you're a potential investor searching for the fund that matches your investment philosophy, a seasoned investor interested in planning tools, or an investment professional, www.vcm.com has what you seek. Visit us anytime. We're always open.
TABLE OF CONTENTS
Investment Objectives and Portfolio
Holdings (Unaudited) | | | 3 | | |
Schedule of Portfolio Investments | |
Victory Diversified Stock Fund | | | 10 | | |
Victory NewBridge Large Cap Growth Fund | | | 13 | | |
Victory Special Value Fund | | | 15 | | |
Victory THB US Small Opportunities Fund | | | 18 | | |
Victory Strategic Allocation Fund | | | 21 | | |
Victory INCORE Fund for Income | | | 22 | | |
Victory INCORE Investment Grade Convertible Fund | | | 24 | | |
Financial Statements | | | |
Statements of Assets and Liabilities | | | 27 | | |
Statements of Operations | | | 32 | | |
Statements of Changes in Net Assets | | | 35 | | |
Financial Highlights | | | 44 | | |
Notes to Financial Statements | | | 64 | | |
Supplemental Information (Unaudited) | | | 77 | | |
Proxy Voting and Portfolio Holdings Information | | | 77 | | |
Expense Examples | | | 77 | | |
Advisory Contract Approval | | | 79 | | |
Liquidity Risk Management Program | | | 83 | | |
Privacy Policy (inside back cover) | | | |
1
IRA DISTRIBUTION WITHHOLDING DISCLOSURE
We generally must withhold federal income tax at a rate of 10% of the taxable portion of your distribution and, if you live in a state that requires state income tax withholding, at your state's tax rate. However, you may elect not to have withholding apply or to have income tax withheld at a higher rate. Any withholding election that you make will apply to any subsequent distribution unless and until you change or revoke the election. If you wish to make a withholding election, or change or revoke a prior withholding election, call 800-539-3863 (800-235-8396 for Member Class) and form W-4P (OMB No. 1545-0074 withholding certificate for pension or annuity payments) will be electronically sent.
If you do not have a withholding election in place by the date of a distribution, federal income tax will be withheld from the taxable portion of your distribution at a rate of 10%. If you must pay estimated taxes, you may be subject to estimated tax penalties if your estimated tax payments are not sufficient and sufficient tax is not withheld from your distribution.
For more specific information, please consult your tax adviser.
The Funds are distributed by Victory Capital Services, Inc. Victory Capital Management Inc. is the investment adviser to the Funds and receives fees from the Funds for performing services for the Funds.
This report is not authorized for distribution to prospective investors unless preceded or accompanied by a current prospectus of the Victory Funds.
For additional information about any Victory Fund, including fees, expenses, and risks, view our prospectus online at vcm.com or call 800-539-3863 (800-235-8396 for Member Class). Read it carefully before you invest or send money.
The information in this report is based on data obtained from recognized services and sources and is believed to be reliable. Any opinions, projections, or recommendations in this report are subject to change without notice and are not intended as individual investment advice. Past investment performance of the Funds, markets or securities mentioned herein should not be considered to be indicative of future results.
• NOT FDIC INSURED • NO BANK GUARANTEE • MAY LOSE VALUE

Call Victory at:
800-539-FUND (800-539-3863)
800-235-8396 for Member Class
Visit our website at:
www.vcm.com
2
Victory Portfolios
Victory Diversified Stock Fund April 30, 2022
(Unaudited)
Investment Objective and Portfolio Holdings:
The Fund seeks to provide long-term growth of capital.
Top 10 Holdings*:
April 30, 2022
(% of Net Assets)
Apple, Inc. | | | 6.7 | % | |
Microsoft Corp. | | | 5.3 | % | |
Alphabet, Inc., Class C | | | 4.6 | % | |
NVIDIA Corp. | | | 2.3 | % | |
SPDR S&P 500 ETF Trust | | | 2.3 | % | |
Broadcom, Inc. | | | 2.1 | % | |
UnitedHealth Group, Inc. | | | 2.0 | % | |
Regeneron Pharmaceuticals, Inc. | | | 1.9 | % | |
PepsiCo, Inc. | | | 1.8 | % | |
Tesla, Inc. | | | 1.7 | % | |
Sector Allocation*:
April 30, 2022
(% of Net Assets)
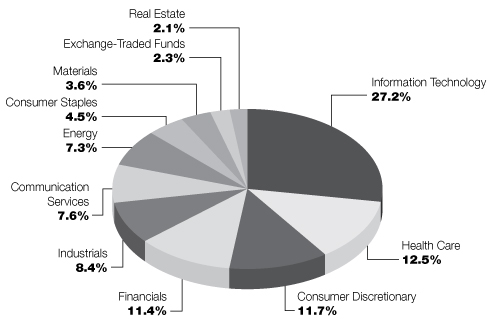
* Does not include futures contracts, money market instruments, and short-term investments purchased with cash collateral from securities loaned.
Percentages are of the net assets of the Fund and may not equal 100%.
Refer to the Schedule of Portfolio Investments for a complete list of securities.
3
Victory Portfolios
Victory NewBridge Large Cap Growth Fund April 30, 2022
(Unaudited)
Investment Objective and Portfolio Holdings:
The Fund seeks to provide long-term capital appreciation.
Top 10 Holdings*:
April 30, 2022
(% of Net Assets)
Amazon.com, Inc. | | | 7.0 | % | |
Alphabet, Inc., Class C | | | 6.7 | % | |
NVIDIA Corp. | | | 5.6 | % | |
Visa, Inc., Class A | | | 5.3 | % | |
Thermo Fisher Scientific, Inc. | | | 4.2 | % | |
ServiceNow, Inc. | | | 4.1 | % | |
Zoetis, Inc. | | | 3.9 | % | |
Cadence Design Systems, Inc. | | | 3.9 | % | |
Lululemon Athletica, Inc. | | | 3.6 | % | |
Microsoft Corp. | | | 3.5 | % | |
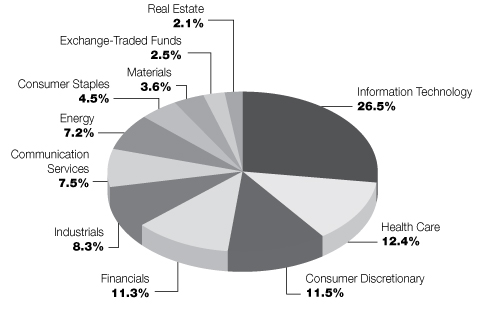
Sector Allocation*:
April 30, 2022
(% of Net Assets)

* Does not include futures contracts, money market instruments, and short-term investments purchased with cash collateral from securities loaned.
Percentages are of the net assets of the Fund and may not equal 100%.
Refer to the Schedule of Portfolio Investments for a complete list of securities.
4
Victory Portfolios
Victory Special Value Fund April 30, 2022
(Unaudited)
Investment Objective and Portfolio Holdings:
The Fund seeks to provide long-term growth of capital and dividend income.
Top 10 Holdings*:
April 30, 2022
(% of Net Assets)
Apple, Inc. | | | 6.2 | % | |
Microsoft Corp. | | | 5.2 | % | |
Alphabet, Inc., Class C | | | 4.5 | % | |
SPDR S&P 500 ETF Trust | | | 2.5 | % | |
NVIDIA Corp. | | | 2.3 | % | |
UnitedHealth Group, Inc. | | | 2.0 | % | |
Broadcom, Inc. | | | 2.0 | % | |
Regeneron Pharmaceuticals, Inc. | | | 1.9 | % | |
PepsiCo, Inc. | | | 1.8 | % | |
Tesla, Inc. | | | 1.7 | % | |
Sector Allocation*:
April 30, 2022
(% of Net Assets)
* Does not include futures contracts, money market instruments, and short-term investments purchased with cash collateral from securities loaned.
Percentages are of the net assets of the Fund and may not equal 100%.
Refer to the Schedule of Portfolio Investments for a complete list of securities.
5
Victory Portfolios
Victory THB US Small Opportunities Fund April 30, 2022
(Unaudited)
Investment Objective and Portfolio Holdings:
The Fund seeks to provide capital appreciation.
Top 10 Holdings*:
April 30, 2022
(% of Net Assets)
RPC, Inc. | | | 3.2 | % | |
Transcat, Inc. | | | 3.0 | % | |
First Busey Corp. | | | 2.9 | % | |
ePlus, Inc. | | | 2.9 | % | |
TETRA Technologies, Inc. | | | 2.6 | % | |
Movado Group, Inc. | | | 2.4 | % | |
The Greenbrier Cos., Inc. | | | 2.1 | % | |
Insteel Industries, Inc. | | | 2.1 | % | |
Universal Technical Institute, Inc. | | | 2.0 | % | |
Old Second Bancorp, Inc. | | | 1.9 | % | |
Sector Allocation*:
April 30, 2022
(% of Net Assets)
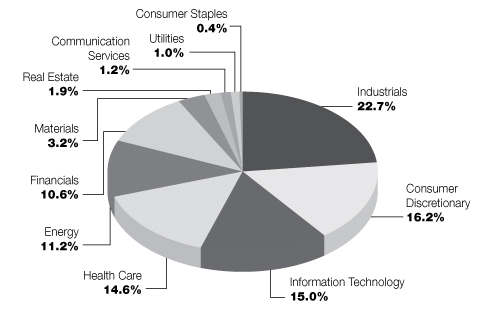
* Does not include futures contracts, money market instruments, and short-term investments purchased with cash collateral from securities loaned.
Percentages are of the net assets of the Fund and may not equal 100%.
Refer to the Schedule of Portfolio Investments for a complete list of securities.
6
Victory Portfolios
Victory Strategic Allocation Fund April 30, 2022
(Unaudited)
Investment Objective and Portfolio Holdings:
The Fund seeks to provide income and long-term growth of capital.
Top 10 Holdings*:
April 30, 2022
(% of Net Assets)
Victory RS Global Fund, Class Y | | | 26.8 | % | |
Victory Market Neutral Income Fund, Class I | | | 20.6 | % | |
Victory INCORE Total Return Bond Fund, Class R6 | | | 9.9 | % | |
Victory Sophus Emerging Markets Fund, Class R6 | | | 8.8 | % | |
VictoryShares U.S. Multi-Factor Minimum Volatility ETF | | | 7.4 | % | |
Victory INCORE Investment Grade Convertible Fund, Class I | | | 6.3 | % | |
Victory Global Energy Transition Fund, Class Y | | | 5.9 | % | |
Victory Trivalent International Small-Cap Fund, Class I | | | 5.8 | % | |
Victory Integrity Discovery Fund, Class Y | | | 3.9 | % | |
Victory RS Partners Fund, Class Y | | | 3.9 | % | |
Asset Allocation*:
April 30, 2022
(% of Net Assets)

* Does not include futures contracts, money market instruments, and short-term investments purchased with cash collateral from securities loaned.
Percentages are of the net assets of the Fund and may not equal 100%.
Refer to the Schedule of Portfolio Investments for a complete list of securities.
7
Victory Portfolios
Victory INCORE Fund for Income April 30, 2022
(Unaudited)
Investment Objective and Portfolio Holdings:
The Fund seeks to provide a high level of current income consistent with preservation of shareholders' capital.
Asset Allocation*:
April 30, 2022
(% of Net Assets)

* Does not include futures contracts, money market instruments, and short-term investments purchased with cash collateral from securities loaned.
Percentages are of the net assets of the Fund and may not equal 100%.
Refer to the Schedule of Portfolio Investments for a complete list of securities.
8
Victory Portfolios
Victory INCORE Investment Grade Convertible Fund April 30, 2022
(Unaudited)
Investment Objective and Portfolio Holdings:
The Fund seeks to provide a high level of current income together with long-term capital appreciation.
Top 10 Holdings*:
April 30, 2022
(% of Net Assets)
Anthem, Inc. | | | 5.4 | % | |
Booking Holdings, Inc. | | | 5.3 | % | |
Southwest Airlines Co. | | | 5.1 | % | |
Western Digital Corp. | | | 5.1 | % | |
Pioneer Natural Resources Co. | | | 4.9 | % | |
Euronet Worldwide, Inc. | | | 4.9 | % | |
Illumina, Inc. | | | 4.5 | % | |
Wells Fargo & Co. | | | 4.1 | % | |
Bank of America Corp. | | | 4.0 | % | |
Expedia Group, Inc. | | | 3.9 | % | |
Sector Allocation*:
April 30, 2022
(% of Net Assets)
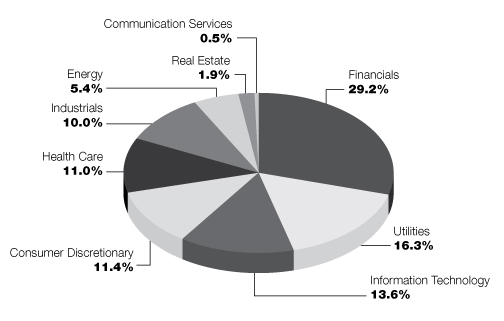
* Does not include futures contracts, money market instruments, and short-term investments purchased with cash collateral from securities loaned.
Percentages are of the net assets of the Fund and may not equal 100%.
Refer to the Schedule of Portfolio Investments for a complete list of securities.
9
Victory Portfolios
Victory Diversified Stock Fund | | Schedule of Portfolio Investments
April 30, 2022 | |
(Amounts in Thousands, Except for Shares) (Unaudited)
Security Description | | Shares | | Value | |
Common Stocks (96.3%) | |
Communication Services (7.6%): | |
Alphabet, Inc., Class C (a) | | | 5,629 | | | $ | 12,943 | | |
Nexstar Media Group, Inc., Class A | | | 27,603 | | | | 4,373 | | |
World Wrestling Entertainment, Inc., Class A (b) | | | 71,712 | | | | 4,187 | | |
| | | | 21,503 | | |
Communications Equipment (1.0%): | |
Lumentum Holdings, Inc. (a) | | | 33,710 | | | | 2,738 | | |
Consumer Discretionary (11.7%): | |
Amazon.com, Inc. (a) | | | 1,327 | | | | 3,298 | | |
Asbury Automotive Group, Inc. (a) | | | 23,205 | | | | 4,263 | | |
Brunswick Corp. | | | 34,144 | | | | 2,582 | | |
Crocs, Inc. (a) | | | 30,051 | | | | 1,996 | | |
D.R. Horton, Inc. | | | 28,033 | | | | 1,951 | | |
Group 1 Automotive, Inc. | | | 15,601 | | | | 2,717 | | |
Lithia Motors, Inc. | | | 10,881 | | | | 3,081 | | |
MarineMax, Inc. (a) | | | 71,156 | | | | 2,912 | | |
Meritage Homes Corp. (a) | | | 17,952 | | | | 1,482 | | |
Tesla, Inc. (a) | | | 5,664 | | | | 4,932 | | |
Vista Outdoor, Inc. (a) | | | 42,080 | | | | 1,482 | | |
Winnebago Industries, Inc. (b) | | | 45,072 | | | | 2,397 | | |
| | | | 33,093 | | |
Consumer Staples (4.5%): | |
BJ's Wholesale Club Holdings, Inc. (a) | | | 60,555 | | | | 3,897 | | |
Darling Ingredients, Inc. (a) | | | 23,402 | | | | 1,717 | | |
PepsiCo, Inc. | | | 29,561 | | | | 5,076 | | |
Philip Morris International, Inc. | | | 21,496 | | | | 2,150 | | |
| | | | 12,840 | | |
Electronic Equipment, Instruments & Components (3.0%): | |
Fabrinet (a) | | | 43,730 | | | | 4,294 | | |
Jabil, Inc. | | | 75,539 | | | | 4,361 | | |
| | | | 8,655 | | |
Energy (7.3%): | |
Chevron Corp. | | | 24,976 | | | | 3,913 | | |
Diamondback Energy, Inc. | | | 16,780 | | | | 2,118 | | |
EOG Resources, Inc. | | | 40,902 | | | | 4,776 | | |
Matador Resources Co. | | | 46,846 | | | | 2,287 | | |
Pioneer Natural Resources Co. | | | 13,895 | | | | 3,230 | | |
Schlumberger NV | | | 110,187 | | | | 4,298 | | |
| | | | 20,622 | | |
Financials (11.4%): | |
Ally Financial, Inc. | | | 42,078 | | | | 1,681 | | |
Ameriprise Financial, Inc. | | | 14,519 | | | | 3,855 | | |
Bank of America Corp. | | | 99,159 | | | | 3,538 | | |
Chubb Ltd. | | | 22,637 | | | | 4,673 | | |
See notes to financial statements.
10
Victory Portfolios
Victory Diversified Stock Fund | | Schedule of Portfolio Investments — continued
April 30, 2022 | |
(Amounts in Thousands, Except for Shares) (Unaudited)
Security Description | | Shares | | Value | |
Customers Bancorp, Inc. (a) | | | 36,678 | | | $ | 1,543 | | |
JPMorgan Chase & Co. | | | 30,419 | | | | 3,631 | | |
Morgan Stanley | | | 38,306 | | | | 3,087 | | |
ServisFirst Bancshares, Inc. | | | 48,502 | | | | 3,896 | | |
Signature Bank | | | 13,449 | | | | 3,258 | | |
Western Alliance Bancorp | | | 42,454 | | | | 3,231 | | |
| | | | 32,393 | | |
Health Care (12.5%): | |
AbbVie, Inc. | | | 11,218 | | | | 1,648 | | |
AmerisourceBergen Corp. | | | 28,538 | | | | 4,318 | | |
AMN Healthcare Services, Inc. (a) | | | 29,318 | | | | 2,866 | | |
Cigna Corp. | | | 19,697 | | | | 4,861 | | |
ICON PLC (a) | | | 14,015 | | | | 3,170 | | |
McKesson Corp. | | | 14,846 | | | | 4,596 | | |
Regeneron Pharmaceuticals, Inc. (a) | | | 8,006 | | | | 5,277 | | |
Stryker Corp. | | | 6,030 | | | | 1,455 | | |
Thermo Fisher Scientific, Inc. | | | 2,697 | | | | 1,491 | | |
UnitedHealth Group, Inc. | | | 11,099 | | | | 5,644 | | |
| | | | 35,326 | | |
Industrials (8.4%): | |
Builders FirstSource, Inc. (a) | | | 28,893 | | | | 1,779 | | |
Chart Industries, Inc. (a) | | | 26,685 | | | | 4,505 | | |
GXO Logistics, Inc. (a) | | | 24,271 | | | | 1,437 | | |
Marten Transport Ltd. | | | 232,948 | | | | 4,049 | | |
Old Dominion Freight Line, Inc. | | | 8,997 | | | | 2,520 | | |
Parker-Hannifin Corp. | | | 9,731 | | | | 2,635 | | |
Saia, Inc. (a) | | | 11,982 | | | | 2,468 | | |
Trex Co., Inc. (a) | | | 26,264 | | | | 1,528 | | |
UFP Industries, Inc. | | | 37,528 | | | | 2,903 | | |
| | | | 23,824 | | |
Materials (3.6%): | |
Graphic Packaging Holding Co. | | | 78,601 | | | | 1,714 | | |
Greif, Inc., Class A | | | 24,925 | | | | 1,512 | | |
Materion Corp. | | | 21,744 | | | | 1,851 | | |
Summit Materials, Inc., Class A (a) | | | 80,494 | | | | 2,238 | | |
Valvoline, Inc. | | | 96,420 | | | | 2,915 | | |
| | | | 10,230 | | |
Real Estate (2.1%): | |
American Tower Corp. | | | 8,303 | | | | 2,001 | | |
CBRE Group, Inc., Class A (a) | | | 17,634 | | | | 1,464 | | |
Simon Property Group, Inc. | | | 20,940 | | | | 2,471 | | |
| | | | 5,936 | | |
Semiconductors & Semiconductor Equipment (9.1%): | |
Advanced Micro Devices, Inc. (a) | | | 46,984 | | | | 4,018 | | |
Alpha & Omega Semiconductor Ltd. (a) | | | 45,573 | | | | 1,955 | | |
Applied Materials, Inc. | | | 26,468 | | | | 2,921 | | |
Broadcom, Inc. | | | 10,471 | | | | 5,805 | | |
See notes to financial statements.
11
Victory Portfolios
Victory Diversified Stock Fund | | Schedule of Portfolio Investments — continued
April 30, 2022 | |
(Amounts in Thousands, Except for Shares) (Unaudited)
Security Description | | Shares | | Value | |
NVIDIA Corp. | | | 35,269 | | | $ | 6,541 | | |
QUALCOMM, Inc. | | | 31,875 | | | | 4,453 | | |
| | | | 25,693 | | |
Software (6.3%): | |
Cadence Design Systems, Inc. (a) | | | 18,802 | | | | 2,836 | | |
Microsoft Corp. | | | 53,699 | | | | 14,903 | | |
| | | | 17,739 | | |
Technology Hardware, Storage & Peripherals (7.8%): | |
Apple, Inc. | | | 119,996 | | | | 18,918 | | |
HP, Inc. | | | 84,721 | | | | 3,103 | | |
| | | | 22,021 | | |
Total Common Stocks (Cost $206,083) | | | 272,613 | | |
Exchange-Traded Funds (2.3%) | |
SPDR S&P 500 ETF Trust | | | 15,644 | | | | 6,445 | | |
Total Exchange-Traded Funds (Cost $6,102) | | | 6,445 | | |
Collateral for Securities Loaned (1.9%)^ | |
BlackRock Liquidity Funds TempFund, Institutional Shares, 0.31% (c) | | | 105,008 | | | | 105 | | |
Fidelity Investments Money Market Government Portfolio, Institutional Shares,
0.19% (c) | | | 2,907,766 | | | | 2,908 | | |
Goldman Sachs Financial Square Prime Obligations Fund, Institutional Shares,
0.45% (c) | | | 52,404 | | | | 52 | | |
JPMorgan Prime Money Market Fund, Capital Shares, 0.40% (c) | | | 417,853 | | | | 418 | | |
Morgan Stanley Institutional Liquidity Prime Portfolio, Institutional Shares,
0.37% (c) | | | 1,878,750 | | | | 1,879 | | |
Total Collateral for Securities Loaned (Cost $5,362) | | | 5,362 | | |
Total Investments (Cost $217,547) — 100.5% | | | 284,420 | | |
Liabilities in excess of other assets — (0.5)% | | | (1,387 | ) | |
NET ASSETS — 100.00% | | $ | 283,033 | | |
^ Purchased with cash collateral from securities on loan.
(a) Non-income producing security.
(b) All or a portion of this security is on loan.
(c) Rate disclosed is the daily yield on April 30, 2022.
ETF — Exchange-Traded Fund
PLC — Public Limited Company
See notes to financial statements.
12
Victory Portfolios
Victory NewBridge Large Cap Growth Fund | | Schedule of Portfolio Investments
April 30, 2022 | |
(Amounts in Thousands, Except for Shares) (Unaudited)
Security Description | | Shares | | Value | |
Common Stocks (98.3%) | |
Communication Services (8.3%): | |
Alphabet, Inc., Class C (a) | | | 298 | | | $ | 685 | | |
Meta Platforms, Inc., Class A (a) | | | 830 | | | | 167 | | |
| | | | 852 | | |
Communications Equipment (5.0%): | |
Arista Networks, Inc. (a) | | | 2,604 | | | | 301 | | |
Motorola Solutions, Inc. | | | 982 | | | | 210 | | |
| | | | 511 | | |
Consumer Discretionary (24.3%): | |
Airbnb, Inc., Class A (a) | | | 1,776 | | | | 272 | | |
Amazon.com, Inc. (a) | | | 290 | | | | 721 | | |
Aptiv PLC (a) | | | 1,736 | | | | 185 | | |
Burlington Stores, Inc. (a) | | | 1,105 | | | | 225 | | |
Lululemon Athletica, Inc. (a) | | | 1,050 | | | | 372 | | |
NIKE, Inc., Class B | | | 2,598 | | | | 324 | | |
O'Reilly Automotive, Inc. (a) | | | 466 | | | | 283 | | |
Tractor Supply Co. | | | 513 | | | | 103 | | |
| | | | 2,485 | | |
Electronic Equipment, Instruments & Components (2.5%): | |
CDW Corp. | | | 1,590 | | | | 259 | | |
Financials (4.7%): | |
Blackstone, Inc. | | | 2,372 | | | | 241 | | |
MSCI, Inc. | | | 559 | | | | 235 | | |
| | | | 476 | | |
Health Care (14.6%): | |
Align Technology, Inc. (a) | | | 626 | | | | 181 | | |
Dexcom, Inc. (a) | | | 630 | | | | 257 | | |
Thermo Fisher Scientific, Inc. | | | 775 | | | | 429 | | |
Veeva Systems, Inc., Class A (a) | | | 1,226 | | | | 223 | | |
Zoetis, Inc. | | | 2,282 | | | | 405 | | |
| | | | 1,495 | | |
Industrials (7.1%): | |
CoStar Group, Inc. (a) | | | 3,179 | | | | 202 | | |
Generac Holdings, Inc. (a) | | | 1,060 | | | | 233 | | |
Uber Technologies, Inc. (a) | | | 9,126 | | | | 287 | | |
| | | | 722 | | |
IT Services (5.3%): | |
Visa, Inc., Class A | | | 2,542 | | | | 542 | | |
Semiconductors & Semiconductor Equipment (7.2%): | |
Broadcom, Inc. | | | 288 | | | | 160 | | |
NVIDIA Corp. | | | 3,116 | | | | 578 | | |
| | | | 738 | | |
See notes to financial statements.
13
Victory Portfolios
Victory NewBridge Large Cap Growth Fund | | Schedule of Portfolio Investments — continued
April 30, 2022 | |
(Amounts in Thousands, Except for Shares) (Unaudited)
Security Description | | Shares | | Value | |
Software (19.3%): | |
Adobe, Inc. (a) | | | 779 | | | $ | 308 | | |
Cadence Design Systems, Inc. (a) | | | 2,608 | | | | 393 | | |
Crowdstrike Holdings, Inc., Class A (a) | | | 848 | | | | 169 | | |
Microsoft Corp. | | | 1,304 | | | | 362 | | |
Palo Alto Networks, Inc. (a) | | | 177 | | | | 99 | | |
ServiceNow, Inc. (a) | | | 882 | | | | 422 | | |
The Trade Desk, Inc., Class A (a) | | | 3,618 | | | | 213 | | |
| | | | 1,966 | | |
Total Common Stocks (Cost $7,093) | | | 10,046 | | |
Total Investments (Cost $7,093) — 98.3% | | | 10,046 | | |
Other assets in excess of liabilities — 1.7% | | | 174 | | |
NET ASSETS — 100.00% | | $ | 10,220 | | |
(a) Non-income producing security.
PLC — Public Limited Company
See notes to financial statements.
14
Victory Portfolios
Victory Special Value Fund | | Schedule of Portfolio Investments
April 30, 2022 | |
(Amounts in Thousands, Except for Shares) (Unaudited)
Security Description | | Shares | | Value | |
Common Stocks (94.9%) | |
Communication Services (7.5%): | |
Alphabet, Inc., Class C (a) | | | 849 | | | $ | 1,952 | | |
Nexstar Media Group, Inc., Class A | | | 4,107 | | | | 651 | | |
World Wrestling Entertainment, Inc., Class A | | | 10,816 | | | | 631 | | |
| | | | 3,234 | | |
Communications Equipment (0.9%): | |
Lumentum Holdings, Inc. (a) | | | 5,010 | | | | 407 | | |
Consumer Discretionary (11.5%): | |
Amazon.com, Inc. (a) | | | 197 | | | | 490 | | |
Asbury Automotive Group, Inc. (a) | | | 3,509 | | | | 645 | | |
Brunswick Corp. | | | 5,313 | | | | 402 | | |
Crocs, Inc. (a) | | | 4,576 | | | | 304 | | |
D.R. Horton, Inc. | | | 4,225 | | | | 294 | | |
Group 1 Automotive, Inc. | | | 2,291 | | | | 399 | | |
Lithia Motors, Inc. | | | 1,588 | | | | 449 | | |
MarineMax, Inc. (a) | | | 11,072 | | | | 453 | | |
Meritage Homes Corp. (a) | | | 2,706 | | | | 223 | | |
Tesla, Inc. (a) | | | 854 | | | | 744 | | |
Vista Outdoor, Inc. (a) | | | 6,141 | | | | 216 | | |
Winnebago Industries, Inc. | | | 6,885 | | | | 366 | | |
| | | | 4,985 | | |
Consumer Staples (4.5%): | |
BJ's Wholesale Club Holdings, Inc. (a) | | | 9,038 | | | | 582 | | |
Darling Ingredients, Inc. (a) | | | 3,436 | | | | 252 | | |
PepsiCo, Inc. | | | 4,598 | | | | 789 | | |
Philip Morris International, Inc. | | | 3,272 | | | | 327 | | |
| | | | 1,950 | | |
Electronic Equipment, Instruments & Components (3.0%): | |
Fabrinet (a) | | | 6,615 | | | | 649 | | |
Jabil, Inc. | | | 11,517 | | | | 665 | | |
| | | | 1,314 | | |
Energy (7.2%): | |
Chevron Corp. | | | 3,768 | | | | 590 | | |
Diamondback Energy, Inc. | | | 2,563 | | | | 324 | | |
EOG Resources, Inc. | | | 6,222 | | | | 727 | | |
Matador Resources Co. | | | 6,909 | | | | 337 | | |
Pioneer Natural Resources Co. | | | 2,096 | | | | 487 | | |
Schlumberger NV | | | 16,769 | | | | 654 | | |
| | | | 3,119 | | |
Financials (11.3%): | |
Ally Financial, Inc. | | | 6,264 | | | | 250 | | |
Ameriprise Financial, Inc. | | | 2,190 | | | | 582 | | |
Bank of America Corp. | | | 15,312 | | | | 546 | | |
Chubb Ltd. | | | 3,372 | | | | 696 | | |
Customers Bancorp, Inc. (a) | | | 5,533 | | | | 233 | | |
See notes to financial statements.
15
Victory Portfolios
Victory Special Value Fund | | Schedule of Portfolio Investments — continued
April 30, 2022 | |
(Amounts in Thousands, Except for Shares) (Unaudited)
Security Description | | Shares | | Value | |
JPMorgan Chase & Co. | | | 4,608 | | | $ | 550 | | |
Morgan Stanley | | | 5,694 | | | | 459 | | |
ServisFirst Bancshares, Inc. | | | 7,326 | | | | 589 | | |
Signature Bank | | | 2,094 | | | | 507 | | |
Western Alliance Bancorp | | | 6,244 | | | | 475 | | |
| | | | 4,887 | | |
Health Care (12.4%): | |
AbbVie, Inc. | | | 1,711 | | | | 251 | | |
AmerisourceBergen Corp. | | | 4,345 | | | | 657 | | |
AMN Healthcare Services, Inc. (a) | | | 4,464 | | | | 436 | | |
Cigna Corp. | | | 2,875 | | | | 710 | | |
ICON PLC (a) | | | 2,091 | | | | 473 | | |
McKesson Corp. | | | 2,261 | | | | 700 | | |
Regeneron Pharmaceuticals, Inc. (a) | | | 1,210 | | | | 798 | | |
Stryker Corp. | | | 918 | | | | 222 | | |
Thermo Fisher Scientific, Inc. | | | 412 | | | | 228 | | |
UnitedHealth Group, Inc. | | | 1,727 | | | | 878 | | |
| | | | 5,353 | | |
Industrials (8.4%): | |
Builders FirstSource, Inc. (a) | | | 4,467 | | | | 275 | | |
Chart Industries, Inc. (a) | | | 4,025 | | | | 680 | | |
GXO Logistics, Inc. (a) | | | 3,641 | | | | 216 | | |
Marten Transport Ltd. | | | 35,470 | | | | 616 | | |
Old Dominion Freight Line, Inc. | | | 1,336 | | | | 374 | | |
Parker-Hannifin Corp. | | | 1,514 | | | | 410 | | |
Saia, Inc. (a) | | | 1,760 | | | | 362 | | |
Trex Co., Inc. (a) | | | 4,057 | | | | 236 | | |
UFP Industries, Inc. | | | 5,660 | | | | 438 | | |
| | | | 3,607 | | |
Materials (3.6%): | |
Graphic Packaging Holding Co. | | | 11,857 | | | | 258 | | |
Greif, Inc., Class A | | | 3,760 | | | | 228 | | |
Materion Corp. | | | 3,300 | | | | 281 | | |
Summit Materials, Inc., Class A (a) | | | 11,748 | | | | 327 | | |
Valvoline, Inc. | | | 14,607 | | | | 442 | | |
| | | | 1,536 | | |
Real Estate (2.1%): | |
American Tower Corp. | | | 1,250 | | | | 301 | | |
CBRE Group, Inc., Class A (a) | | | 2,632 | | | | 219 | | |
Simon Property Group, Inc. | | | 3,172 | | | | 374 | | |
| | | | 894 | | |
Semiconductors & Semiconductor Equipment (9.0%): | |
Advanced Micro Devices, Inc. (a) | | | 7,113 | | | | 608 | | |
Alpha & Omega Semiconductor Ltd. (a) | | | 6,894 | | | | 296 | | |
Applied Materials, Inc. | | | 3,892 | | | | 429 | | |
Broadcom, Inc. | | | 1,584 | | | | 878 | | |
See notes to financial statements.
16
Victory Portfolios
Victory Special Value Fund | | Schedule of Portfolio Investments — continued
April 30, 2022 | |
(Amounts in Thousands, Except for Shares) (Unaudited)
Security Description | | Shares | | Value | |
NVIDIA Corp. | | | 5,343 | | | $ | 991 | | |
QUALCOMM, Inc. | | | 4,829 | | | | 675 | | |
| | | | 3,877 | | |
Software (6.2%): | |
Cadence Design Systems, Inc. (a) | | | 2,796 | | | | 422 | | |
Microsoft Corp. | | | 8,204 | | | | 2,277 | | |
| | | | 2,699 | | |
Technology Hardware, Storage & Peripherals (7.3%): | |
Apple, Inc. | | | 16,845 | | | | 2,656 | | |
HP, Inc. | | | 13,189 | | | | 483 | | |
| | | | 3,139 | | |
Total Common Stocks (Cost $31,440) | | | 41,001 | | |
Exchange-Traded Funds (2.5%) | |
SPDR S&P 500 ETF Trust | | | 2,658 | | | | 1,095 | | |
Total Exchange-Traded Funds (Cost $1,266) | | | 1,095 | | |
Total Investments (Cost $32,706) — 97.4% | | | 42,096 | | |
Other assets in excess of liabilities — 2.6% | | | 1,120 | | |
NET ASSETS — 100.00% | | $ | 43,216 | | |
(a) Non-income producing security.
ETF — Exchange-Traded Fund
PLC — Public Limited Company
See notes to financial statements.
17
Victory Portfolios
Victory THB US Small Opportunities Fund | | Schedule of Portfolio Investments
April 30, 2022 | |
(Amounts in Thousands, Except for Shares) (Unaudited)
Security Description | | Shares | | Value | |
Common Stocks (98.0%) | |
Communication Services (1.2%): | |
EverQuote, Inc., Class A (a) | | | 64,430 | | | $ | 894 | | |
Consumer Discretionary (16.2%): | |
America's Car-Mart, Inc. (a) | | | 6,210 | | | | 502 | | |
Bassett Furniture Industries, Inc. | | | 63,130 | | | | 1,045 | | |
BJ's Restaurants, Inc. (a) | | | 23,634 | | | | 657 | | |
Brilliant Earth Group, Inc. (a) | | | 24,010 | | | | 185 | | |
Century Communities, Inc. | | | 15,640 | | | | 825 | | |
Charles & Colvard Ltd. (a) | | | 113,330 | | | | 159 | | |
Chuy's Holdings, Inc. (a) | | | 14,844 | | | | 371 | | |
Holley, Inc. (a) | | | 57,570 | | | | 607 | | |
Lazydays Holdings, Inc. (a) | | | 47,160 | | | | 916 | | |
M/I Homes, Inc. (a) | | | 13,565 | | | | 601 | | |
MasterCraft Boat Holdings, Inc. (a) | | | 22,680 | | | | 546 | | |
Movado Group, Inc. | | | 49,780 | | | | 1,791 | | |
Red Robin Gourmet Burgers, Inc. (a) | | | 28,120 | | | | 371 | | |
Ruth's Hospitality Group, Inc. (b) | | | 63,110 | | | | 1,323 | | |
Universal Technical Institute, Inc. (a) | | | 141,550 | | | | 1,466 | | |
Vera Bradley, Inc. (a) | | | 100,190 | | | | 616 | | |
| | | | 11,981 | | |
Consumer Staples (0.4%): | |
Vital Farms, Inc. (a) | | | 24,300 | | | | 279 | | |
Energy (11.2%): | |
Clean Energy Fuels Corp. (a) | | | 155,720 | | | | 913 | | |
Expro Group Holdings NV (a) | | | 53,136 | | | | 812 | | |
Geospace Technologies Corp. (a) | | | 49,200 | | | | 284 | | |
Natural Gas Services Group, Inc. (a) | | | 11,768 | | | | 145 | | |
Profire Energy, Inc. (a) | | | 552,220 | | | | 746 | | |
RPC, Inc. (a) | | | 228,260 | | | | 2,360 | | |
Select Energy Services, Inc., Class A (a) | | | 89,180 | | | | 692 | | |
Solaris Oilfield Infrastructure, Inc., Class A | | | 38,590 | | | | 434 | | |
TETRA Technologies, Inc. (a) | | | 513,150 | | | | 1,888 | | |
| | | | 8,274 | | |
Financials (10.6%): | |
BayCom Corp. | | | 34,506 | | | | 781 | | |
Coastal Financial Corp. (a) | | | 12,190 | | | | 500 | | |
Colony Bankcorp, Inc. | | | 29,920 | | | | 513 | | |
First Busey Corp. | | | 96,091 | | | | 2,159 | | |
Heritage Financial Corp. | | | 55,485 | | | | 1,344 | | |
Old Second Bancorp, Inc. | | | 105,012 | | | | 1,446 | | |
P10, Inc., Class A (a) | | | 36,050 | | | | 436 | | |
The First Bancshares, Inc. | | | 20,617 | | | | 664 | | |
| | | | 7,843 | | |
Health Care (14.6%): | |
Addus HomeCare Corp. (a) | | | 8,691 | | | | 733 | | |
Amneal Pharmaceuticals, Inc. (a) | | | 240,048 | | | | 927 | | |
See notes to financial statements.
18
Victory Portfolios
Victory THB US Small Opportunities Fund | | Schedule of Portfolio Investments — continued
April 30, 2022 | |
(Amounts in Thousands, Except for Shares) (Unaudited)
Security Description | | Shares | | Value | |
Atrion Corp. | | | 1,034 | | | $ | 648 | | |
BioLife Solutions, Inc. (a) | | | 37,744 | | | | 478 | | |
Catalyst Pharmaceuticals, Inc. (a) | | | 40,330 | | | | 307 | | |
CryoLife, Inc. (a) | | | 23,795 | | | | 483 | | |
Lantheus Holdings, Inc. (a) | | | 18,021 | | | | 1,197 | | |
LeMaitre Vascular, Inc. | | | 30,566 | | | | 1,321 | | |
Meridian Bioscience, Inc. (a) | | | 21,800 | | | | 558 | | |
Mesa Laboratories, Inc. | | | 2,463 | | | | 526 | | |
ModivCare, Inc. (a) | | | 5,452 | | | | 567 | | |
Organogenesis Holdings, Inc. (a) | | | 55,000 | | | | 354 | | |
Orthofix Medical, Inc. (a) | | | 36,626 | | | | 1,135 | | |
Retractable Technologies, Inc. (a) (b) | | | 64,170 | | | | 246 | | |
The Joint Corp. (a) | | | 10,657 | | | | 325 | | |
Vanda Pharmaceuticals, Inc. (a) | | | 24,930 | | | | 247 | | |
Vericel Corp. (a) | | | 25,020 | | | | 713 | | |
| | | | 10,765 | | |
Industrials (22.7%): | |
Allied Motion Technologies, Inc. | | | 33,337 | | | | 811 | | |
ARC Document Solutions, Inc. | | | 233,850 | | | | 889 | | |
Bowman Consulting Group Ltd. (a) | | | 44,030 | | | | 735 | | |
CIRCOR International, Inc. (a) (b) | | | 34,080 | | | | 670 | | |
Concrete Pumping Holdings, Inc. (a) | | | 92,450 | | | | 516 | | |
Energy Recovery, Inc. (a) | | | 20,500 | | | | 380 | | |
Graham Corp. | | | 52,040 | | | | 379 | | |
Great Lakes Dredge & Dock Corp. (a) | | | 27,380 | | | | 378 | | |
Harsco Corp. (a) | | | 56,420 | | | | 577 | | |
Hydrofarm Holdings Group, Inc. (a) (b) | | | 16,120 | | | | 154 | | |
Hyster-Yale Materials Handling, Inc. | | | 27,610 | | | | 848 | | |
IES Holdings, Inc. (a) | | | 10,300 | | | | 302 | | |
Insteel Industries, Inc. | | | 35,925 | | | | 1,524 | | |
Karat Packaging, Inc. (a) | | | 34,000 | | | | 624 | | |
Limbach Holdings, Inc. (a) | | | 53,160 | | | | 335 | | |
MYR Group, Inc. (a) | | | 4,851 | | | | 384 | | |
NN, Inc. (a) | | | 134,130 | | | | 406 | | |
Northwest Pipe Co. (a) | | | 21,420 | | | | 572 | | |
Preformed Line Products Co. | | | 11,290 | | | | 672 | | |
Quest Resource Holding Corp. (a) | | | 65,050 | | | | 356 | | |
The Greenbrier Cos., Inc. | | | 37,000 | | | | 1,580 | | |
The Shyft Group, Inc. | | | 17,216 | | | | 438 | | |
Transcat, Inc. (a) | | | 29,961 | | | | 2,187 | | |
Twin Disc, Inc. (a) | | | 44,300 | | | | 620 | | |
Willdan Group, Inc. (a) | | | 16,780 | | | | 451 | | |
| | | | 16,788 | | |
Information Technology (15.0%): | |
CEVA, Inc. (a) | | | 13,800 | | | | 501 | | |
ePlus, Inc. (a) | | | 37,722 | | | | 2,130 | | |
Grid Dynamics Holdings, Inc. (a) | | | 84,820 | | | | 1,181 | | |
Ichor Holdings Ltd. (a) | | | 36,570 | | | | 1,065 | | |
Immersion Corp. (a) | | | 89,360 | | | | 417 | | |
See notes to financial statements.
19
Victory Portfolios
Victory THB US Small Opportunities Fund | | Schedule of Portfolio Investments — continued
April 30, 2022 | |
(Amounts in Thousands, Except for Shares) (Unaudited)
Security Description | | Shares | | Value | |
Iteris, Inc. (a) | | | 137,160 | | | $ | 354 | | |
Luna Innovations, Inc. (a) | | | 140,270 | | | | 774 | | |
Napco Security Technologies, Inc. (a) | | | 59,180 | | | | 1,036 | | |
PAR Technology Corp. (a) (b) | | | 25,316 | | | | 836 | | |
Perficient, Inc. (a) | | | 9,240 | | | | 919 | | |
Ultra Clean Holdings, Inc. (a) | | | 28,733 | | | | 896 | | |
Upland Software, Inc. (a) | | | 24,790 | | | | 370 | | |
Wayside Technology Group, Inc. | | | 18,010 | | | | 617 | | |
| | | | 11,096 | | |
Materials (3.2%): | |
Hawkins, Inc. | | | 8,860 | | | | 330 | | |
Koppers Holdings, Inc. | | | 45,237 | | | | 1,098 | | |
UFP Technologies, Inc. (a) | | | 12,900 | | | | 886 | | |
| | | | 2,314 | | |
Real Estate (1.9%): | |
Gladstone Land Corp. | | | 28,080 | | | | 1,022 | | |
Postal Realty Trust, Inc., Class A | | | 21,350 | | | | 359 | | |
| | | | 1,381 | | |
Utilities (1.0%): | |
The York Water Co. | | | 18,790 | | | | 727 | | |
Total Common Stocks (Cost $64,974) | | | 72,342 | | |
Collateral for Securities Loaned (1.9%)^ | |
BlackRock Liquidity Funds TempFund, Institutional Shares, 0.31% (c) | | | 28,204 | | | | 28 | | |
Fidelity Investments Money Market Government Portfolio, Institutional Shares,
0.19% (c) | | | 780,997 | | | | 781 | | |
Goldman Sachs Financial Square Prime Obligations Fund, Institutional Shares,
0.45% (c) | | | 14,075 | | | | 14 | | |
JPMorgan Prime Money Market Fund, Capital Shares, 0.40% (c) | | | 112,231 | | | | 112 | | |
Morgan Stanley Institutional Liquidity Prime Portfolio, Institutional Shares,
0.37% (c) | | | 504,614 | | | | 505 | | |
Total Collateral for Securities Loaned (Cost $1,440) | | | 1,440 | | |
Total Investments (Cost $66,414) — 99.9% | | | 73,782 | | |
Other assets in excess of liabilities — 0.1% | | | 95 | | |
NET ASSETS — 100.00% | | $ | 73,877 | | |
^ Purchased with cash collateral from securities on loan.
(a) Non-income producing security.
(b) All or a portion of this security is on loan.
(c) Rate disclosed is the daily yield on April 30, 2022.
See notes to financial statements.
20
Victory Portfolios
Victory Strategic Allocation Fund | | Schedule of Portfolio Investments
April 30, 2022 | |
(Amounts in Thousands, Except for Shares) (Unaudited)
Security Description | | Shares | | Value | |
Affiliated Exchange-Traded Funds (7.4%) | |
VictoryShares U.S. Multi-Factor Minimum Volatility ETF | | | 50,160 | | | $ | 1,976 | | |
Total Affiliated Exchange-Traded Funds (Cost $1,273) | | | 1,976 | | |
Affiliated Mutual Funds (91.9%) | |
Victory Global Energy Transition Fund, Class Y | | | 49,394 | | | | 1,578 | | |
Victory INCORE Investment Grade Convertible Fund, Class I | | | 96,168 | | | | 1,679 | | |
Victory INCORE Total Return Bond Fund, Class R6 | | | 299,534 | | | | 2,648 | | |
Victory Integrity Discovery Fund, Class Y | | | 23,542 | | | | 1,043 | | |
Victory Market Neutral Income Fund, Class I | | | 576,422 | | | | 5,505 | | |
Victory RS Global Fund, Class Y | | | 409,071 | | | | 7,159 | | |
Victory RS Partners Fund, Class Y | | | 37,452 | | | | 1,039 | | |
Victory Sophus Emerging Markets Fund, Class R6 | | | 115,473 | | | | 2,342 | | |
Victory Trivalent International Small-Cap Fund, Class I | | | 110,274 | | | | 1,558 | | |
Total Affiliated Mutual Funds (Cost $22,372) | | | 24,551 | | |
Total Investments (Cost $23,645) — 99.3% | | | 26,527 | | |
Other assets in excess of liabilities — 0.7% | | | 192 | | |
NET ASSETS — 100.00% | | $ | 26,719 | | |
ETF — Exchange-Traded Fund
See notes to financial statements.
21
Victory Portfolios
Victory INCORE Fund for Income | | Schedule of Portfolio Investments
April 30, 2022 | |
(Amounts in Thousands, Except for Shares) (Unaudited)
Security Description | | Principal
Amount | | Value | |
Government National Mortgage Association (80.2%) | |
Multi-family (0.3%): | |
Pass-throughs (0.3%): | |
Government National Mortgage Assoc. | |
7.92%, 7/1/23 | | $ | 94 | | | $ | 94 | | |
8.00%, 1/15/31 – 11/15/33 | | | 1,002 | | | | 1,003 | | |
7.75%, 9/15/33 | | | 371 | | | | 371 | | |
| | | | 1,468 | | |
Single Family (79.9%): | |
Collateralized Mortgage Obligations (3.1%): | |
Government National Mortgage Assoc. | |
Series 1999-4, Class ZB, 6.00%, 2/20/29 | | | 128 | | | | 128 | | |
Series 2001-10, Class PE, 6.50%, 3/16/31 | | | 106 | | | | 106 | | |
Series 2005-74, Class HB, 7.50%, 9/16/35 | | | 7 | | | | 7 | | |
Series 2005-74, Class HC, 7.50%, 9/16/35 | | | 41 | | | | 45 | | |
Series 2011-166, Class NT, 7.73%, 11/20/31 (a) | | | 640 | | | | 692 | | |
Series 2012-106, Class JM, 7.35%, 10/20/34 (a) | | | 468 | | | | 513 | | |
Series 2012-30, Class WB, 7.01%, 11/20/39 (a) | | | 1,662 | | | | 1,794 | | |
Series 2013-190, Class KT, 8.10%, 9/20/30 (a) | | | 189 | | | | 206 | | |
Series 2013-51, Class BL, 6.07%, 4/20/34 (a) | | | 1,376 | | | | 1,482 | | |
Series 2013-64, Class KY, 6.74%, 12/20/38 (a) | | | 717 | | | | 768 | | |
Series 2013-70, Class KP, 7.03%, 2/20/39 (a) | | | 668 | | | | 727 | | |
Series 2014-69, Class W, 7.21%, 11/20/34 (a) | | | 93 | | | | 101 | | |
Series 2014-74, Class PT, 7.86%, 5/16/44 (a) | | | 131 | | | | 140 | | |
Series 2015-77, Class PT, 7.24%, 6/20/39 (a) | | | 256 | | | | 278 | | |
Series 2019-22, Class PT, 7.93%, 2/20/49 (a) | | | 4,659 | | | | 5,057 | | |
Series 2021-1, Class WT, 7.82%, 1/20/51 (a) | | | 4,976 | | | | 5,456 | | |
| | | | 17,500 | | |
Pass-throughs (76.8%): | |
Government National Mortgage Assoc. | |
8.00%, 6/15/22 – 5/15/49 | | | 28,245 | | | | 31,015 | | |
7.50%, 9/15/22 – 5/15/49 | | | 47,510 | | | | 51,501 | | |
7.00%, 12/20/22 – 9/20/50 | | | 73,183 | | | | 79,842 | | |
8.50%, 2/15/23 – 7/15/32 | | | 3,799 | | | | 4,113 | | |
7.13%, 3/15/23 – 7/15/25 | | | 49 | | | | 49 | | |
6.50%, 6/15/23 – 2/20/41 | | | 112,362 | | | | 121,688 | | |
5.50%, 7/15/23 – 11/15/45 | | | 24,717 | | | | 27,060 | | |
6.00%, 9/20/23 – 9/20/50 | | | 69,792 | | | | 76,394 | | |
9.00%, 4/15/25 – 9/15/30 | | | 1,043 | | | | 1,128 | | |
10.00%, 4/15/25 | | | — | (b) | | | — | (b) | |
6.13%, 6/20/28 – 11/20/28 | | | 253 | | | | 257 | | |
6.28%, 10/20/28 – 9/20/29 | | | 506 | | | | 525 | | |
6.10%, 5/20/29 – 7/20/31 | | | 414 | | | | 427 | | |
7.30%, 4/20/30 – 2/20/31 | | | 169 | | | | 173 | | |
6.49%, 5/20/31 – 3/20/32 | | | 720 | | | | 751 | | |
4.50%, 12/15/33 – 5/15/41 | | | 8,731 | | | | 9,277 | | |
5.00%, 1/20/34 – 2/20/42 | | | 20,006 | | | | 21,071 | | |
See notes to financial statements.
22
Victory Portfolios
Victory INCORE Fund for Income | | Schedule of Portfolio Investments — continued
April 30, 2022 | |
(Amounts in Thousands, Except for Shares) (Unaudited)
Security Description | | Shares or
Principal
Amount | | Value | |
4.00%, 8/15/41 | | $ | 567 | | | $ | 595 | | |
| | | | 425,866 | | |
Total Government National Mortgage Association (Cost $467,604) | | | 444,834 | | |
U.S. Treasury Obligations (19.1%) | |
U.S. Treasury Bills, 1.01%, 8/11/22 (c) | | | 24,069 | | | | 24,003 | | |
U.S. Treasury Bonds, 7.50%, 11/15/24 | | | 73,386 | | | | 81,759 | | |
Total U.S. Treasury Obligations (Cost $108,709) | | | 105,762 | | |
Investment Companies (0.0%) (d) | |
BlackRock Liquidity Funds Fedfund Portfolio, 0.23% (c) | | | 99,710 | | | | 100 | | |
Total Investment Companies (Cost $100) | | | 100 | | |
Total Investments (Cost $576,413) — 99.3% | | | 550,696 | | |
Other assets in excess of liabilities — 0.7% | | | 3,910 | | |
NET ASSETS — 100.00% | | $ | 554,606 | | |
(a) The rate for certain asset-backed and mortgage-backed securities may vary based on factors relating to the pool of assets underlying the security. The rate disclosed is the rate in effect at April 30, 2022.
(b) Rounds to less than $1 thousand.
(c) Rate represents the effective yield at April 30, 2022.
(d) Amount represents less than 0.05% of net assets.
See notes to financial statements.
23
Victory Portfolios
Victory INCORE Investment Grade Convertible Fund | | Schedule of Portfolio Investments
April 30, 2022 | |
(Amounts in Thousands, Except for Shares) (Unaudited)
| Security Description | | Principal
Amount | | Value | |
Convertible Corporate Bonds (64.9%) | |
Communication Services (0.5%): | |
Snap, Inc., 0.75%, 8/1/26 | | $ | 1,595 | | | $ | 2,345 | | |
Consumer Discretionary (11.4%): | |
Booking Holdings, Inc., 0.75%, 5/1/25 (a) | | | 17,060 | | | | 23,880 | | |
Expedia Group, Inc., 2/15/26 (a) (b) | | | 14,881 | | | | 17,689 | | |
Ford Motor Co., 3/15/26 (b) | | | 9,175 | | | | 9,795 | | |
| | | 51,364 | | |
Energy (5.4%): | |
EQT Corp., 1.75%, 5/1/26 | | | 705 | | | | 1,922 | | |
Pioneer Natural Resources Co., 0.25%, 5/15/25 | | | 10,101 | | | | 22,317 | | |
| | | 24,239 | | |
Financials (14.8%): | |
Ares Capital Corp., 4.63%, 3/1/24 | | | 12,453 | | | | 13,625 | | |
Barclays Bank PLC | |
2/4/25 (b) | | | 7,120 | | | | 10,367 | | |
2/18/25 (b) | | | 4,330 | | | | 4,756 | | |
BlackRock Capital Investment Corp., 5.00%, 6/15/22 | | | 3,712 | | | | 3,721 | | |
GSK Finance NO 3 PLC, 3.32%, 6/22/23 (c) | | | 4,418 | | | | 4,256 | | |
Hannon Armstrong Sustainable Infrastructure Capital, Inc., 8/15/23 (b) | | | 2,435 | | | | 2,458 | | |
JPMorgan Chase Financial Co. LLC, 0.25%, 5/1/23 (c) | | | 12,505 | | | | 13,295 | | |
MGIC Investment Corp., Convertible Subordinated Notes, 9.00%, 4/1/63 | | | 4,342 | | | | 5,790 | | |
TPG Specialty Lending, Inc., 4.50%, 8/1/22 | | | 7,062 | | | | 8,614 | | |
| | | 66,882 | | |
Health Care (11.0%): | |
Anthem, Inc., 2.75%, 10/15/42 | | | 3,415 | | | | 24,421 | | |
Bristol-Myers Squibb Co., 0.33% (LIBOR03M-50bps), 9/15/23,
Callable 6/6/22 @ 100 (d) | | | 2,466 | | | | 4,994 | | |
Illumina, Inc., 8/15/23 (a) (b) | | | 19,617 | | | | 20,207 | | |
| | | 49,622 | | |
Industrials (6.3%): | |
Parsons Corp., 0.25%, 8/15/25 | | | 5,270 | | | | 5,464 | | |
Southwest Airlines Co., 1.25%, 5/1/25 | | | 16,930 | | | | 23,126 | | |
| | | 28,590 | | |
Information Technology (13.6%): | |
Akamai Technologies, Inc., 0.13%, 5/1/25 | | | 3,024 | | | | 3,809 | | |
Block, Inc., 0.25%, 11/1/27 (a) | | | 7,625 | | | | 6,306 | | |
Euronet Worldwide, Inc., 0.75%, 3/15/49, Callable 3/20/25 @ 100 (a) | | | 19,715 | | | | 22,041 | | |
Vishay Intertechnology, Inc., 2.25%, 6/15/25 | | | 6,655 | | | | 6,525 | | |
Western Digital Corp., 1.50%, 2/1/24 | | | 24,003 | | | | 23,025 | | |
| | | 61,706 | | |
Real Estate (1.9%): | |
Kite Realty Group LP, 0.75%, 4/1/27 (c) | | | 8,280 | | | | 8,460 | | |
Total Convertible Corporate Bonds (Cost $267,623) | | | 293,208 | | |
See notes to financial statements.
24
Victory Portfolios
Victory INCORE Investment Grade Convertible Fund | | Schedule of Portfolio Investments — continued
April 30, 2022 | |
(Amounts in Thousands, Except for Shares) (Unaudited)
| Security Description | | Shares | | Value | |
Convertible Preferred Stocks (34.4%) | |
Financials (14.4%): | |
AMG Capital Trust II, 4.73%, 10/15/37 | | | 172,005 | | | $ | 9,367 | | |
Bank of America Corp., Series L, 5.96% (e) | | | 15,010 | | | | 18,264 | | |
KKR & Co., Inc., Series C, 0.22%, 9/15/23 | | | 247,895 | | | | 16,252 | | |
New York Community Capital Trust, 6.19%, 11/1/51 | | | 53,619 | | | | 2,601 | | |
Wells Fargo & Co., Series L, 0.02% (e) | | | 15,384 | | | | 18,638 | | |
| | | 65,122 | | |
Industrials (3.7%): | |
Stanley Black & Decker, Inc., 1.01%, 11/15/22 (a) | | | 211,840 | | | | 16,649 | | |
Utilities (16.3%): | |
American Electric Power Co., Inc., 6.13%, 8/15/23 (a) | | | 116,330 | | | | 6,514 | | |
CenterPoint Energy, Inc., 4.57%, 9/15/29 | | | 55,000 | | | | 2,529 | | |
Dominion Energy, Inc., Series A, 1.80%, 6/1/22 | | | 130,978 | | | | 13,214 | | |
DTE Energy Co., 1.49%, 11/1/22 | | | 267,298 | | | | 14,006 | | |
NextEra Energy, Inc., 0.65%, 9/1/22 | | | 127,545 | | | | 6,817 | | |
NextEra Energy, Inc., 0.91%, 3/1/23 | | | 274,805 | | | | 12,891 | | |
NiSource, Inc., 0.07%, 3/1/24 | | | 42,090 | | | | 4,787 | | |
The Southern Co., Series 2019, 1.20%, 8/1/22 | | | 229,220 | | | | 12,577 | | |
| | | 73,335 | | |
Total Convertible Preferred Stocks (Cost $164,301) | | | 155,106 | | |
Collateral for Securities Loaned (19.3%)^ | |
BlackRock Liquidity Funds TempFund, Institutional Class, 0.31% (f) | | | 1,703,859 | | | | 1,704 | | |
Fidelity Investments Money Market Government Portfolio, Institutional
Shares, 0.19% (f) | | | 47,181,526 | | | | 47,181 | | |
Goldman Sachs Financial Square Prime Obligations Fund, Institutional
Class, 0.45% (f) | | | 850,310 | | | | 850 | | |
JPMorgan Prime Money Market Fund, Capital Class, 0.40% (f) | | | 6,780,106 | | | | 6,780 | | |
Morgan Stanley Institutional Liquidity Prime Portfolio, Institutional
Class, 0.37% (f) | | | 30,484,680 | | | | 30,485 | | |
Total Collateral for Securities Loaned (Cost $87,000) | | | 87,000 | | |
Total Investments (Cost $518,924) — 118.6% | | | 535,314 | | |
Liabilities in excess of other assets — (18.6)% | | | (83,778 | ) | |
NET ASSETS — 100.00% | | $ | 451,536 | | |
^ Purchased with cash collateral from securities on loan.
(a) All or a portion of this security is on loan.
(b) Zero-coupon bond.
(c) Rule 144A security or other security that is restricted as to resale to institutional investors. The Fund's Adviser has deemed this security to be liquid (unless otherwise noted as illiquid) based upon procedures approved by the Board of Trustees. As of April 30, 2022, the fair value of these securities was $26,011 (thousands) and amounted to 5.8% of net assets.
(d) Variable or Floating-Rate Security. Rate disclosed is as of April 30, 2022.
(e) Security is perpetual and has no final maturity date but may be subject to calls at various dates in the future.
See notes to financial statements.
25
Victory Portfolios
Victory INCORE Investment Grade Convertible Fund | | Schedule of Portfolio Investments — continued
April 30, 2022 | |
(Unaudited)
(f) Rate disclosed is the daily yield on April 30, 2022.
bps — Basis points
LIBOR — London Interbank Offered Rate
LIBOR03M — 3 Month US Dollar LIBOR, rate disclosed as of April 30, 2022, based on the last reset date of the security
LLC — Limited Liability Company
LP — Limited Partnership
PLC — Public Limited Company
See notes to financial statements.
26
Victory Portfolios | | Statements of Assets and Liabilities
April 30, 2022 | |
(Amounts in Thousands, Except Per Share Amounts) (Unaudited)
| | | Victory
Diversified
Stock Fund | | Victory
NewBridge
Large Cap
Growth Fund | | Victory
Special
Value Fund | |
Assets: | |
Investments, at value (Cost $217,547, $7,093 and
$32,706) | | $ | 284,420 | (a) | | $ | 10,046 | | | $ | 42,096 | | |
Cash | | | 3,211 | | | | 152 | | | | 946 | | |
Receivables: | |
Interest and dividends | | | 119 | | | | 4 | | | | 18 | | |
Capital shares issued | | | 20 | | | | — | (b) | | | 5 | | |
Investments sold | | | 1,103 | | | | — | | | | 167 | | |
From Adviser | | | 5 | | | | 14 | | | | 7 | | |
Prepaid expenses | | | 43 | | | | 23 | | | | 32 | | |
Total Assets | | | 288,921 | | | | 10,239 | | | | 43,271 | | |
Liabilities: | |
Payables: | |
Collateral received on loaned securities | | | 5,362 | | | | — | | | | — | | |
Capital shares redeemed | | | 261 | | | | 1 | | | | — | (b) | |
Accrued expenses and other payables: | |
Investment advisory fees | | | 160 | | | | 7 | | | | 28 | | |
Administration fees | | | 15 | | | | 1 | | | | 2 | | |
Custodian fees | | | 3 | | | | — | (b) | | | 1 | | |
Transfer agent fees | | | 38 | | | | 4 | | | | 12 | | |
Compliance fees | | | — | (b) | | | — | (b) | | | — | (b) | |
| 12b-1 fees | | | 32 | | | | 1 | | | | 6 | | |
Other accrued expenses | | | 17 | | | | 5 | | | | 6 | | |
Total Liabilities | | | 5,888 | | | | 19 | | | | 55 | | |
Net Assets: | |
Capital | | | 193,295 | | | | 5,595 | | | | 29,742 | | |
Total accumulated earnings/(loss) | | | 89,738 | | | | 4,625 | | | | 13,474 | | |
Net Assets | | $ | 283,033 | | | $ | 10,220 | | | $ | 43,216 | | |
Net Assets | |
Class A | | $ | 211,232 | | | $ | 5,315 | | | $ | 25,068 | | |
Class C | | | 1,840 | | | | 405 | | | | 870 | | |
Class I | | | 24,177 | | | | 3,727 | | | | 3,056 | | |
Class R | | | 40,351 | | | | — | | | | 13,523 | | |
Class R6 | | | 941 | | | | — | | | | — | | |
Class Y | | | 4,492 | | | | 773 | | | | 699 | | |
Total | | $ | 283,033 | | | $ | 10,220 | | | $ | 43,216 | | |
Shares (unlimited number of shares authorized with
a par value of $0.001 per share): | |
Class A | | | 10,902 | | | | 1,432 | | | | 889 | | |
Class C | | | 106 | | | | 92 | | | | 37 | | |
Class I | | | 1,248 | | | | 821 | | | | 106 | | |
Class R | | | 2,147 | | | | — | | | | 512 | | |
Class R6 | | | 49 | | | | — | | | | — | | |
Class Y | | | 231 | | | | 185 | | | | 24 | | |
Total | | | 14,683 | | | | 2,530 | | | | 1,568 | | |
(continues on next page)
See notes to financial statements.
27
Victory Portfolios | | Statements of Assets and Liabilities
April 30, 2022 | |
(Amounts in Thousands, Except Per Share Amounts) (Unaudited) (continued)
| | | Victory
Diversified
Stock Fund | | Victory
NewBridge
Large Cap
Growth Fund | | Victory
Special
Value Fund | |
Net asset value, offering (except Class A) and
redemption price per share: (c) | |
Class A | | $ | 19.38 | | | $ | 3.71 | | | $ | 28.24 | | |
Class C (d) | | | 17.34 | | | | 4.39 | | | | 23.27 | | |
Class I | | | 19.37 | | | | 4.54 | | | | 28.75 | | |
Class R | | | 18.79 | | | | — | | | | 26.39 | | |
Class R6 | | | 19.39 | | | | — | | | | — | | |
Class Y | | | 19.41 | | | | 4.18 | | | | 28.55 | | |
Maximum Sales Charge — Class A | | | 5.75 | % | | | 5.75 | % | | | 5.75 | % | |
Maximum offering price
(100%/(100%-maximum sales charge) of net asset
value adjusted to the nearest cent) per share —
Class A | | $ | 20.56 | | | $ | 3.94 | | | $ | 29.96 | | |
(a) Includes $5,073 of securities on loan.
(b) Rounds to less than $1 thousand.
(c) Per share amount may not recalculate due to rounding of net assets and/or shares outstanding.
(d) Redemption price per share varies by the length of time shares are held.
See notes to financial statements.
28
Victory Portfolios | | Statements of Assets and Liabilities
April 30, 2022 | |
(Amounts in Thousands, Except Per Share Amounts) (Unaudited)
| | | Victory
THB US
Small
Opportunities
Fund | | Victory
Strategic
Allocation
Fund | | Victory
INCORE
Fund for
Income | |
Assets: | |
Affiliated investments, at value (Cost $—,
$23,645 and $—) | | $ | — | | | $ | 26,527 | | | $ | — | | |
Unaffiliated investments, at value (Cost $66,414,
$— and $576,413) | | | 73,782 | (a) | | | — | | | | 550,696 | | |
Cash | | | 1,558 | | | | — | | | | — | | |
Receivables: | |
Interest and dividends | | | 27 | | | | — | | | | 4,796 | | |
Capital shares issued | | | 3 | | | | 169 | | | | 196 | | |
Investments sold | | | — | | | | 54 | | | | — | | |
From Adviser | | | 25 | | | | 22 | | | | 46 | | |
Prepaid expenses | | | 24 | | | | 29 | | | | 56 | | |
Total Assets | | | 75,419 | | | | 26,801 | | | | 555,790 | | |
Liabilities: | |
Payables: | |
Collateral received on loaned securities | | | 1,440 | | | | — | | | | — | | |
To custodian | | | — | | | | 13 | | | | — | | |
Capital shares redeemed | | | 15 | | | | 48 | | | | 712 | | |
Accrued expenses and other payables: | |
Investment advisory fees | | | 74 | | | | 2 | | | | 224 | | |
Administration fees | | | 3 | | | | 1 | | | | 32 | | |
Custodian fees | | | — | (b) | | | — | (b) | | | 4 | | |
Transfer agent fees | | | 9 | | | | 7 | | | | 128 | | |
Compliance fees | | | — | (b) | | | — | (b) | | | — | (b) | |
Trustees' fees | | | — | | | | — | | | | — | (b) | |
| 12b-1 fees | | | — | (b) | | | 3 | | | | 16 | | |
Other accrued expenses | | | 1 | | | | 8 | | | | 68 | | |
Total Liabilities | | | 1,542 | | | | 82 | | | | 1,184 | | |
Net Assets: | |
Capital | | | 62,614 | | | | 23,261 | | | | 970,235 | | |
Total accumulated earnings/(loss) | | | 11,263 | | | | 3,458 | | | | (415,629 | ) | |
Net Assets | | $ | 73,877 | | | $ | 26,719 | | | $ | 554,606 | | |
Net Assets | |
Class A | | $ | 1,318 | | | $ | 14,715 | | | $ | 106,953 | | |
Class C | | | — | | | | 2,202 | | | | 7,669 | | |
Class I | | | 72,559 | | | | 8,651 | | | | 300,973 | | |
Class R | | | — | | | | 1,151 | | | | 19,099 | | |
Class R6 | | | — | | | | — | | | | 27,504 | | |
Class Y | | | — | | | | — | | | | 91,196 | | |
Member Class | | | — | | | | — | | | | 1,212 | | |
Total | | $ | 73,877 | | | $ | 26,719 | | | $ | 554,606 | | |
(continues on next page)
See notes to financial statements.
29
Victory Portfolios | | Statements of Assets and Liabilities
April 30, 2022 | |
(Amounts in Thousands, Except Per Share Amounts) (Unaudited) (continued)
| | | Victory
THB US
Small
Opportunities
Fund | | Victory
Strategic
Allocation
Fund | | Victory
INCORE
Fund for
Income | |
Shares (unlimited number of shares authorized with
a par value of $0.001 per share): | |
Class A | | | 73 | | | | 808 | | | | 14,496 | | |
Class C | | | — | | | | 123 | | | | 1,051 | | |
Class I | | | 3,806 | | | | 472 | | | | 40,801 | | |
Class R | | | — | | | | 63 | | | | 2,586 | | |
Class R6 | | | — | | | | — | | | | 3,734 | | |
Class Y | | | — | | | | — | | | | 12,366 | | |
Member Class | | | — | | | | — | | | | 164 | | |
Total | | | 3,879 | | | | 1,466 | | | | 75,198 | | |
Net asset value, offering (except Class A)
and redemption price per share: (c) | |
Class A | | $ | 18.09 | | | $ | 18.22 | | | $ | 7.38 | | |
Class C (d) | | | — | | | | 17.86 | | | | 7.30 | | |
Class I | | | 19.07 | | | | 18.33 | | | | 7.38 | | |
Class R | | | — | | | | 18.17 | | | | 7.39 | | |
Class R6 | | | — | | | | — | | | | 7.36 | | |
Class Y | | | — | | | | — | | | | 7.37 | | |
Member Class | | | — | | | | — | | | | 7.40 | | |
Maximum Sales Charge — Class A | | | 5.75 | % | | | 2.25 | % | | | 2.25 | % | |
Maximum offering price
(100%/(100%-maximum sales charge) of net asset
value adjusted to the nearest cent) per share —
Class A | | $ | 19.19 | | | $ | 18.64 | | | $ | 7.55 | | |
(a) Includes $1,372 of securities on loan.
(b) Rounds to less than $1 thousand.
(c) Per share amount may not recalculate due to rounding of net assets and/or shares outstanding.
(d) Redemption price per share varies by the length of time shares are held.
See notes to financial statements.
30
Victory Portfolios | | Statements of Assets and Liabilities
April 30, 2022 | |
(Amounts in Thousands, Except Per Share Amounts) (Unaudited)
| | | Victory INCORE
Investment Grade
Convertible Fund | |
Assets: | |
Investments, at value (Cost $518,924) | | $ | 535,314 | (a) | |
Cash | | | 3,921 | | |
Receivables: | |
Interest and dividends | | | 1,463 | | |
Capital shares issued | | | 569 | | |
Investments sold | | | 736 | | |
From Adviser | | | 4 | | |
Prepaid expenses | | | 30 | | |
Total Assets | | | 542,037 | | |
Liabilities: | |
Payables: | |
Collateral received on loaned securities | | | 87,000 | | |
Investments purchased | | | 1,245 | | |
Capital shares redeemed | | | 1,859 | | |
Accrued expenses and other payables: | |
Investment advisory fees | | | 282 | | |
Administration fees | | | 23 | | |
Custodian fees | | | 3 | | |
Transfer agent fees | | | 61 | | |
Compliance fees | | | — | (b) | |
| 12b-1 fees | | | 2 | | |
Other accrued expenses | | | 26 | | |
Total Liabilities | | | 90,501 | | |
Net Assets: | |
Capital | | | 433,448 | | |
Total accumulated earnings/(loss) | | | 18,088 | | |
Net Assets | | $ | 451,536 | | |
Net Assets | |
Class A | | $ | 20,295 | | |
Class I | | | 430,245 | | |
Member Class | | | 996 | | |
Total | | $ | 451,536 | | |
Shares (unlimited number of shares authorized with
a par value of $0.001 per share): | |
Class A | | | 1,163 | | |
Class I | | | 24,646 | | |
Member Class | | | 55 | | |
Total | | | 25,864 | | |
Net asset value, offering (except Class A)
and redemption price per share: (c) | |
Class A | | $ | 17.46 | | |
Class I | | | 17.46 | | |
Member Class | | | 18.16 | | |
Maximum Sales Charge — Class A | | | 2.25 | % | |
Maximum offering price
(100%/(100%-maximum sales charge) of net asset
value adjusted to the nearest cent) per share —
Class A | | $ | 17.86 | | |
(a) Includes $84,020 of securities on loan.
(b) Rounds to less than $1 thousand.
(c) Per share amount may not recalculate due to rounding of net assets and/or shares outstanding.
See notes to financial statements.
31
Victory Portfolios | | Statements of Operations
For the Six Months Ended April 30, 2022 | |
(Amounts in Thousands) (Unaudited)
| | | Victory
Diversified
Stock Fund | | Victory
NewBridge
Large Cap
Growth Fund | | Victory
Special
Value Fund | |
Investment Income: | | | |
Dividends | | $ | 2,027 | | | $ | 15 | | | $ | 308 | | |
Interest | | | 1 | | | | — | (a) | | | — | | |
Securities lending (net of fees) | | | 2 | | | | — | (a) | | | — | (a) | |
Total Income | | | 2,030 | | | | 15 | | | | 308 | | |
Expenses: | | | |
Investment advisory fees | | | 1,043 | | | | 51 | | | | 183 | | |
Administration fees | | | 87 | | | | 4 | | | | 13 | | |
Sub-Administration fees | | | 8 | | | | 7 | | | | 8 | | |
| 12b-1 fees — Class A | | | 297 | | | | 9 | | | | 35 | | |
| 12b-1 fees — Class C | | | 11 | | | | 3 | | | | 5 | | |
| 12b-1 fees — Class R | | | 115 | | | | — | | | | 39 | | |
Custodian fees | | | 8 | | | | 1 | | | | 2 | | |
Transfer agent fees — Class A | | | 77 | | | | 4 | | | | 15 | | |
Transfer agent fees — Class C | | | 2 | | | | — | (a) | | | — | (a) | |
Transfer agent fees — Class I | | | 8 | | | | 2 | | | | 1 | | |
Transfer agent fees — Class R | | | 16 | | | | — | | | | 11 | | |
Transfer agent fees — Class R6 | | | — | (a) | | | — | | | | — | | |
Transfer agent fees — Class Y | | | 3 | | | | 1 | | | | — | (a) | |
Trustees' fees | | | 10 | | | | 1 | | | | 2 | | |
Compliance fees | | | 1 | | | | — | (a) | | | — | (a) | |
Legal and audit fees | | | 10 | | | | 5 | | | | 6 | | |
State registration and filing fees | | | 40 | | | | 26 | | | | 31 | | |
Other expenses | | | 22 | | | | 6 | | | | 8 | | |
Total Expenses | | | 1,758 | | | | 120 | | | | 359 | | |
Expenses waived/reimbursed by Adviser | | | (13 | ) | | | (37 | ) | | | (34 | ) | |
Net Expenses | | | 1,745 | | | | 83 | | | | 325 | | |
Net Investment Income (Loss) | | | 285 | | | | (68 | ) | | | (17 | ) | |
Realized/Unrealized Gains (Losses) from Investments: | | | |
Net realized gains (losses) from investment securities | | | 23,757 | | | | 1,935 | | | | 4,256 | | |
Net change in unrealized appreciation/depreciation on
investment securities | | | (56,395 | ) | | | (6,785 | ) | | | (9,048 | ) | |
Net realized/unrealized gains (losses) on investments | | | (32,638 | ) | | | (4,850 | ) | | | (4,792 | ) | |
Change in net assets resulting from operations | | $ | (32,353 | ) | | $ | (4,918 | ) | | $ | (4,809 | ) | |
(a) Rounds to less than $1 thousand.
See notes to financial statements.
32
Victory Portfolios | | Statements of Operations
For the Six Months Ended April 30, 2022 | |
(Amounts in Thousands) (Unaudited)
| | | Victory
THB US
Small
Opportunities
Fund | | Victory
Strategic
Allocation
Fund | | Victory
INCORE
Fund for
Income | |
Investment Income: | | | |
Income distributions from affiliated funds | | $ | — | | | $ | 629 | | | $ | — | | |
Dividends from unaffiliated investments | | | 496 | | | | — | | | | — | (a) | |
Interest from unaffiliated investments | | | — | | | | — | | | | 4,250 | | |
Securities lending (net of fees) | | | 3 | | | | — | | | | — | | |
Total Income | | | 499 | | | | 629 | | | | 4,250 | | |
Expenses: | | | |
Investment advisory fees | | | 460 | | | | 14 | | | | 1,496 | | |
Administration fees | | | 22 | | | | 8 | | | | 167 | | |
Sub-Administration fees | | | 8 | | | | 6 | | | | 11 | | |
| 12b-1 fees — Class A | | | 2 | | | | 20 | | | | 148 | | |
| 12b-1 fees — Class C | | | — | | | | 12 | | | | 44 | | |
| 12b-1 fees — Class R | | | — | | | | 3 | | | | 26 | | |
Custodian fees | | | 2 | | | | 1 | | | | 15 | | |
Transfer agent fees — Class A | | | 2 | | | | 9 | | | | 56 | | |
Transfer agent fees — Class C | | | — | | | | 2 | | | | 5 | | |
Transfer agent fees — Class I | | | 36 | | | | 4 | | | | 173 | | |
Transfer agent fees — Class R | | | — | | | | 1 | | | | 9 | | |
Transfer agent fees — Class R6 | | | — | | | | — | | | | 1 | | |
Transfer agent fees — Class Y | | | — | | | | — | | | | 57 | | |
Transfer agent fees — Member Class | | | — | | | | — | | | | 1 | | |
Trustees' fees | | | 3 | | | | 2 | | | | 18 | | |
Compliance fees | | | — | (a) | | | — | (a) | | | 2 | | |
Legal and audit fees | | | 7 | | | | 5 | | | | 7 | | |
State registration and filing fees | | | 26 | | | | 29 | | | | 67 | | |
Line of credit fees | | | — | (a) | | | — | | | | — | | |
Interfund lending fees | | | — | | | | — | | | | — | (a) | |
Other expenses | | | 7 | | | | 7 | | | | 77 | | |
Recoupment of prior expenses waived/reimbursed by Adviser | | | — | | | | — | | | | 1 | | |
Total Expenses | | | 575 | | | | 123 | | | | 2,381 | | |
Expenses waived/reimbursed by Adviser | | | (71 | ) | | | (67 | ) | | | (129 | ) | |
Net Expenses | | | 504 | | | | 56 | | | | 2,252 | | |
Net Investment Income (Loss) | | | (5 | ) | | | 573 | | | | 1,998 | | |
Realized/Unrealized Gains (Losses) from Investments: | | | |
Net realized gains (losses) from sales of affiliated funds | | | — | | | | 313 | | | | — | | |
Net realized gains (losses) from unaffiliated investment
securities | | | 4,536 | | | | 6 | | | | (1,221 | ) | |
Capital gain distributions received from affiliated funds | | | — | | | | 447 | | | | — | | |
Net change in unrealized appreciation/depreciation on
affiliated funds | | | — | | | | (3,298 | ) | | | — | | |
Net change in unrealized appreciation/depreciation on
unaffiliated investment securities | | | (18,999 | ) | | | — | | | | (28,390 | ) | |
Net realized/unrealized gains (losses) on investments | | | (14,463 | ) | | | (2,532 | ) | | | (29,611 | ) | |
Change in net assets resulting from operations | | $ | (14,468 | ) | | $ | (1,959 | ) | | $ | (27,613 | ) | |
(a) Rounds to less than $1 thousand.
See notes to financial statements.
33
Victory Portfolios | | Statements of Operations
For the Six Months Ended April 30, 2022 | |
(Amounts in Thousands) (Unaudited)
| | | Victory INCORE
Investment Grade
Convertible Fund | |
Investment Income: | |
Dividends | | $ | 4,055 | | |
Interest | | | 1,355 | | |
Securities lending (net of fees) | | | 424 | | |
Total Income | | | 5,834 | | |
Expenses: | |
Investment advisory fees | | | 1,652 | | |
Administration fees | | | 121 | | |
Sub-Administration fees | | | 8 | | |
| 12b-1 fees — Class A | | | 26 | | |
Custodian fees | | | 9 | | |
Transfer agent fees — Class A | | | 8 | | |
Transfer agent fees — Class I | | | 139 | | |
Transfer agent fees — Member Class | | | 1 | | |
Trustees' fees | | | 13 | | |
Compliance fees | | | 2 | | |
Legal and audit fees | | | 13 | | |
State registration and filing fees | | | 33 | | |
Interfund lending fees | | | — | (a) | |
Recoupment of prior expenses waived/reimbursed by Adviser | | | 5 | | |
Other expenses | | | 24 | | |
Total Expenses | | | 2,054 | | |
Expenses waived/reimbursed by Adviser | | | (10 | ) | |
Net Expenses | | | 2,044 | | |
Net Investment Income (Loss) | | | 3,790 | | |
Realized/Unrealized Gains (Losses) from Investments: | |
Net realized gains (losses) from investment securities | | | 4,965 | | |
Net change in unrealized appreciation/depreciation on investment securities | | | (29,606 | ) | |
Net realized/unrealized gains (losses) on investments | | | (24,641 | ) | |
Change in net assets resulting from operations | | $ | (20,851 | ) | |
(a) Rounds to less than $1 thousand.
See notes to financial statements.
34
Victory Portfolios | | Statements of Changes in Net Assets | |
(Amounts in Thousands)
| | | Victory
Diversified Stock Fund | | Victory
NewBridge Large Cap
Growth Fund | | Victory
Special Value Fund | |
| | | Six
Months
Ended
April 30,
2022
(Unaudited) | | Year
Ended
October 31,
2021 | | Six
Months
Ended
April 30,
2022
(Unaudited) | | Year
Ended
October 31,
2021 | | Six
Months
Ended
April 30,
2022
(Unaudited) | | Year
Ended
October 31,
2021 | |
From Investment Activities: | |
Operations: | |
Net Investment Income (Loss) | | $ | 285 | | | $ | (66 | ) | | $ | (68 | ) | | $ | (185 | ) | | $ | (17 | ) | | $ | (125 | ) | |
Net realized gains (losses) | | | 23,757 | | | | 48,095 | | | | 1,935 | | | | 4,481 | | | | 4,256 | | | | 9,190 | | |
Net change in unrealized
appreciation/depreciation | | | (56,395 | ) | | | 64,146 | | | | (6,785 | ) | | | 660 | | | | (9,048 | ) | | | 8,963 | | |
Change in net assets resulting from
operations | | | (32,353 | ) | | | 112,175 | | | | (4,918 | ) | | | 4,956 | | | | (4,809 | ) | | | 18,028 | | |
Distributions to Shareholders: | |
Class A | | | (33,219 | ) | | | (4,846 | ) | | | (2,162 | ) | | | (924 | ) | | | (4,420 | ) | | | (913 | ) | |
Class C | | | (349 | ) | | | (83 | ) | | | (149 | ) | | | (429 | ) | | | (178 | ) | | | (36 | ) | |
Class I | | | (4,092 | ) | | | (570 | ) | | | (1,267 | ) | | | (641 | ) | | | (565 | ) | | | (121 | ) | |
Class R | | | (6,603 | ) | | | (1,037 | ) | | | — | | | | — | | | | (2,680 | ) | | | (543 | ) | |
Class R6 | | | (552 | ) | | | (85 | ) | | | — | | | | — | | | | — | | | | — | | |
Class Y | | | (679 | ) | | | (99 | ) | | | (277 | ) | | | (148 | ) | | | (126 | ) | | | (23 | ) | |
Change in net assets resulting from
distributions to shareholders | | | (45,494 | ) | | | (6,720 | ) | | | (3,855 | ) | | | (2,142 | ) | | | (7,969 | ) | | | (1,636 | ) | |
Change in net assets resulting from
capital transactions | | | 26,541 | | | | (25,722 | ) | | | 1,151 | | | | (1,834 | ) | | | 4,789 | | | | (8,094 | ) | |
Change in net assets | | | (51,306 | ) | | | 79,733 | | | | (7,622 | ) | | | 980 | | | | (7,989 | ) | | | 8,298 | | |
Net Assets: | |
Beginning of period | | | 334,339 | | | | 254,606 | | | | 17,842 | | | | 16,862 | | | | 51,205 | | | | 42,907 | | |
End of period | | $ | 283,033 | | | $ | 334,339 | | | $ | 10,220 | | | $ | 17,842 | | | $ | 43,216 | | | $ | 51,205 | | |
(continues on next page)
See notes to financial statements.
35
Victory Portfolios | | Statements of Changes in Net Assets | |
(Amounts in Thousands) (continued)
| | | Victory
Diversified Stock Fund | | Victory
NewBridge Large Cap
Growth Fund | | Victory
Special Value Fund | |
| | | Six
Months
Ended
April 30,
2022
(Unaudited) | | Year
Ended
October 31,
2021 | | Six
Months
Ended
April 30,
2022
(Unaudited) | | Year
Ended
October 31,
2021 | | Six
Months
Ended
April 30,
2022
(Unaudited) | | Year
Ended
October 31,
2021 | |
Capital Transactions: | |
Class A | |
Proceeds from shares issued | | $ | 5,800 | | | $ | 7,876 | | | $ | 377 | | | $ | 701 | | | $ | 2,454 | | | $ | 1,518 | | |
Distributions reinvested | | | 30,579 | | | | 4,436 | | | | 1,813 | | | | 740 | | | | 4,020 | | | | 831 | | |
Cost of shares redeemed | | | (13,893 | ) | | | (27,454 | ) | | | (902 | ) | | | (1,851 | ) | | | (3,145 | ) | | | (7,055 | ) | |
Total Class A | | $ | 22,486 | | | $ | (15,142 | ) | | $ | 1,288 | | | $ | (410 | ) | | $ | 3,329 | | | $ | (4,706 | ) | |
Class C | |
Proceeds from shares issued | | $ | 95 | | | $ | 80 | | | $ | 42 | | | $ | 93 | | | $ | 2 | | | $ | 36 | | |
Distributions reinvested | | | 349 | | | | 82 | | | | 106 | | | | 338 | | | | 178 | | | | 36 | | |
Cost of shares redeemed | | | (396 | ) | | | (1,782 | ) | | | (80 | ) | | | (752 | ) | | | (9 | ) | | | (249 | ) | |
Total Class C | | $ | 48 | | | $ | (1,620 | ) | | $ | 68 | | | $ | (321 | ) | | $ | 171 | | | $ | (177 | ) | |
Class I | |
Proceeds from shares issued | | $ | 3,885 | | | $ | 1,886 | | | $ | 187 | | | $ | 1,047 | | | $ | 2 | | | $ | 406 | | |
Distributions reinvested | | | 3,926 | | | | 537 | | | | 1,213 | | | | 624 | | | | 503 | | | | 101 | | |
Cost of shares redeemed | | | (4,512 | ) | | | (4,406 | ) | | | (1,712 | ) | | | (2,047 | ) | | | (413 | ) | | | (1,187 | ) | |
Total Class I | | $ | 3,299 | | | $ | (1,983 | ) | | $ | (312 | ) | | $ | (376 | ) | | $ | 92 | | | $ | (680 | ) | |
Class R | |
Proceeds from shares issued | | $ | 539 | | | $ | 721 | | | $ | — | | | $ | — | | | $ | 1,176 | | | $ | 1,962 | | |
Distributions reinvested | | | 6,442 | | | | 1,016 | | | | — | | | | — | | | | 2,661 | | | | 530 | | |
Cost of shares redeemed | | | (4,356 | ) | | | (8,082 | ) | | | — | | | | — | | | | (2,725 | ) | | | (5,022 | ) | |
Total Class R | | $ | 2,625 | | | $ | (6,345 | ) | | $ | — | | | $ | — | | | $ | 1,112 | | | $ | (2,530 | ) | |
Class R6 | |
Proceeds from shares issued | | $ | 82 | | | $ | 183 | | | $ | — | | | $ | — | | | $ | — | | | $ | — | | |
Distributions reinvested | | | 552 | | | | 85 | | | | — | | | | — | | | | — | | | | — | | |
Cost of shares redeemed | | | (3,190 | ) | | | (618 | ) | | | — | | | | — | | | | — | | | | — | | |
Total Class R6 | | $ | (2,556 | ) | | $ | (350 | ) | | $ | — | | | $ | — | | | $ | — | | | $ | — | | |
Class Y | |
Proceeds from shares issued | | $ | 265 | | | $ | 284 | | | $ | 37 | | | $ | 266 | | | $ | 20 | | | $ | 82 | | |
Distributions reinvested | | | 570 | | | | 83 | | | | 251 | | | | 131 | | | | 99 | | | | 18 | | |
Cost of shares redeemed | | | (196 | ) | | | (649 | ) | | | (181 | ) | | | (1,124 | ) | | | (34 | ) | | | (101 | ) | |
Total Class Y | | $ | 639 | | | $ | (282 | ) | | $ | 107 | | | $ | (727 | ) | | $ | 85 | | | $ | (1 | ) | |
Change in net assets resulting from
capital transactions | | $ | 26,541 | | | $ | (25,722 | ) | | $ | 1,151 | | | $ | (1,834 | ) | | $ | 4,789 | | | $ | (8,094 | ) | |
(continues on next page)
See notes to financial statements.
36
Victory Portfolios | | Statements of Changes in Net Assets | |
(Amounts in Thousands) (continued)
| | | Victory
Diversified Stock Fund | | Victory
NewBridge Large Cap
Growth Fund | | Victory
Special Value Fund | |
| | | Six
Months
Ended
April 30,
2022
(Unaudited) | | Year
Ended
October 31,
2021 | | Six
Months
Ended
April 30,
2022
(Unaudited) | | Year
Ended
October 31,
2021 | | Six
Months
Ended
April 30,
2022
(Unaudited) | | Year
Ended
October 31,
2021 | |
Share Transactions: | |
Class A | |
Issued | | | 258 | | | | 378 | | | | 76 | | | | 110 | | | | 78 | | | | 48 | | |
Reinvested | | | 1,382 | | | | 231 | | | | 356 | | | | 118 | | | | 125 | | | | 29 | | |
Redeemed | | | (623 | ) | | | (1,303 | ) | | | (181 | ) | | | (277 | ) | | | (96 | ) | | | (222 | ) | |
Total Class A | | | 1,017 | | | | (694 | ) | | | 251 | | | | (49 | ) | | | 107 | | | | (145 | ) | |
Class C (a) | |
Issued | | | 5 | | | | 3 | | | | 7 | | | | 13 | | | | — | (b) | | | 2 | | |
Reinvested | | | 18 | | | | 5 | | | | 18 | | | | 47 | | | | 6 | | | | 1 | | |
Redeemed | | | (21 | ) | | | (94 | ) | | | (15 | ) | | | (99 | ) | | | — | (b) | | | (10 | ) | |
Total Class C | | | 2 | | | | (86 | ) | | | 10 | | | | (39 | ) | | | 6 | | | | (7 | ) | |
Class I | |
Issued | | | 163 | | | | 86 | | | | 36 | | | | 139 | | | | — | (b) | | | 13 | | |
Reinvested | | | 177 | | | | 28 | | | | 195 | | | | 86 | | | | 16 | | | | 3 | | |
Redeemed | | | (211 | ) | | | (208 | ) | | | (234 | ) | | | (260 | ) | | | (12 | ) | | | (37 | ) | |
Total Class I | | | 129 | | | | (94 | ) | | | (3 | ) | | | (35 | ) | | | 4 | | | | (21 | ) | |
Class R | |
Issued | | | 23 | | | | 35 | | | | — | | | | — | | | | 39 | | | | 65 | | |
Reinvested | | | 300 | | | | 54 | | | | — | | | | — | | | | 88 | | | | 20 | | |
Redeemed | | | (196 | ) | | | (387 | ) | | | — | | | | — | | | | (90 | ) | | | (167 | ) | |
Total Class R | | | 127 | | | | (298 | ) | | | — | | | | — | | | | 37 | | | | (82 | ) | |
Class R6 | |
Issued | | | 5 | | | | 8 | | | | — | | | | — | | | | — | | | | — | | |
Reinvested | | | 25 | | | | 4 | | | | — | | | | — | | | | — | | | | — | | |
Redeemed | | | (143 | ) | | | (29 | ) | | | — | | | | — | | | | — | | | | — | | |
Total Class R6 | | | (113 | ) | | | (17 | ) | | | — | | | | — | | | | — | | | | — | | |
Class Y | |
Issued | | | 11 | | | | 14 | | | | 8 | | | | 38 | | | | 1 | | | | 2 | | |
Reinvested | | | 26 | | | | 4 | | | | 44 | | | | 19 | | | | 2 | | | | 1 | | |
Redeemed | | | (8 | ) | | | (31 | ) | | | (29 | ) | | | (152 | ) | | | (1 | ) | | | (3 | ) | |
Total Class Y | | | 29 | | | | (13 | ) | | | 23 | | | | (95 | ) | | | 2 | | | | — | (b) | |
Change in Shares | | | 1,191 | | | | (1,202 | ) | | | 281 | | | | (218 | ) | | | 156 | | | | (255 | ) | |
(a) As described in Note 9 in the Notes to Financial Statements, Victory NewBridge Large Cap Growth Fund Class C share amounts have been adjusted for a 1:5 reverse stock split.
(b) Rounds to less than 1 thousand.
See notes to financial statements.
37
Victory Portfolios | | Statements of Changes in Net Assets | |
(Amounts in Thousands)
| | | Victory
THB US Small
Opportunities Fund(a) | | Victory
Strategic
Allocation Fund | | Victory INCORE
Fund for Income | |
| | | Six
Months
Ended
April 30,
2022
(Unaudited) | | Year
Ended
October 31,
2021 | | Six
Months
Ended
April 30,
2022
(Unaudited) | | Year
Ended
October 31,
2021 | | Six
Months
Ended
April 30,
2022
(Unaudited) | | Year
Ended
October 31,
2021 | |
From Investment Activities: | |
Operations: | |
Net Investment
Income (Loss) | | $ | (5 | ) | | $ | (624 | ) | | $ | 573 | | | $ | 823 | | | $ | 1,998 | | | $ | 3,362 | | |
Net realized gains (losses) | | | 4,536 | | | | 12,921 | | | | 766 | | | | 128 | | | | (1,221 | ) | | | (1,300 | ) | |
Net change in unrealized
appreciation/
depreciation | | | (18,999 | ) | | | 17,176 | | | | (3,298 | ) | | | 5,000 | | | | (28,390 | ) | | | (8,573 | ) | |
Change in net assets resulting
from operations | | | (14,468 | ) | | | 29,473 | | | | (1,959 | ) | | | 5,951 | | | | (27,613 | ) | | | (6,511 | ) | |
Distributions to Shareholders: | |
Class A | | | (192 | ) | | | — | | | | (318 | ) | | | (464 | ) | | | (2,919 | ) | | | (6,501 | ) | |
Class C | | | — | | | | — | | | | (39 | ) | | | (54 | ) | | | (185 | ) | | | (542 | ) | |
Class I | | | (8,253 | ) | | | — | | | | (193 | ) | | | (264 | ) | | | (8,815 | ) | | | (23,178 | ) | |
Class R | | | — | | | | — | | | | (23 | ) | | | (34 | ) | | | (510 | ) | | | (1,747 | ) | |
Class R6 | | | — | | | | — | | | | — | | | | — | | | | (749 | ) | | | (1,851 | ) | |
Class Y | | | — | | | | — | | | | — | | | | — | | | | (2,679 | ) | | | (7,361 | ) | |
Member Class | | | — | | | | — | | | | — | | | | — | | | | (25 | ) | | | (33 | )(b) | |
Change in net assets resulting
from distributions to
shareholders | | | (8,445 | ) | | | — | | | | (573 | ) | | | (816 | ) | | | (15,882 | ) | | | (41,213 | ) | |
Change in net assets resulting
from capital transactions | | | 7,406 | | | | 9,212 | | | | (181 | ) | | | (341 | ) | | | (100,868 | ) | | | (295,207 | ) | |
Change in net assets | | | (15,507 | ) | | | 38,685 | | | | (2,713 | ) | | | 4,794 | | | | (144,363 | ) | | | (342,931 | ) | |
Net Assets: | |
Beginning of period | | | 89,384 | | | | 50,699 | | | | 29,432 | | | | 24,638 | | | | 698,969 | | | | 1,041,900 | | |
End of period | | $ | 73,877 | | | $ | 89,384 | | | $ | 26,719 | | | $ | 29,432 | | | $ | 554,606 | | | $ | 698,969 | | |
(a) On May 3, 2021, the THB Asset Management Microcap Fund (the "Predecessor Fund") was reorganized into the Victory THB US Small Opportunities Fund (the "Victory THB Fund"). Investor Class and Institutional Class shares of the Predecessor Fund were exchanged on a tax-free basis for Class A and Class I shares, respectively, of the Victory THB Fund. Information presented prior to May 3, 2021, is that of the Predecessor Fund. See Note 1 in the Notes to Financial Statements.
(b) Member Class activity is for the period November 3, 2020 (commencement of operations) to October 31, 2021.
(continues on next page)
See notes to financial statements.
38
Victory Portfolios | | Statements of Changes in Net Assets | |
(Amounts in Thousands) (continued)
| | | Victory
THB US Small
Opportunities Fund(a) | | Victory
Strategic
Allocation Fund | |
Victory INCORE
Fund for Income | |
| | | Six
Months
Ended
April 30,
2022
(Unaudited) | | Year
Ended
October 31,
2021 | | Six
Months
Ended
April 30,
2022
(Unaudited) | | Year
Ended
October 31,
2021 | | Six
Months
Ended
April 30,
2022
(Unaudited) | | Year
Ended
October 31,
2021 | |
Capital Transactions: | |
Class A | |
Proceeds from shares issued | | $ | 168 | | | $ | 5,749 | | | $ | 790 | | | $ | 1,793 | | | $ | 9,502 | | | $ | 43,381 | | |
Distributions reinvested | | | 190 | | | | — | | | | 306 | | | | 448 | | | | 2,604 | | | | 5,738 | | |
Redemption fees (b) | | | — | | | | 1 | | | | — | | | | — | | | | — | | | | — | | |
Cost of shares redeemed | | | (1,023 | ) | | | (3,959 | ) | | | (1,348 | ) | | | (3,213 | ) | | | (25,635 | ) | | | (63,627 | ) | |
Total Class A | | $ | (665 | ) | | $ | 1,791 | | | $ | (252 | ) | | $ | (972 | ) | | $ | (13,529 | ) | | $ | (14,508 | ) | |
Class C | |
Proceeds from shares issued | | $ | — | | | $ | — | | | $ | 268 | | | $ | 650 | | | $ | 328 | | | $ | 1,685 | | |
Distributions reinvested | | | — | | | | — | | | | 39 | | | | 53 | | | | 175 | | | | 505 | | |
Cost of shares redeemed | | | — | | | | — | | | | (406 | ) | | | (623 | ) | | | (2,280 | ) | | | (12,166 | ) | |
Total Class C | | $ | — | | | $ | — | | | $ | (99 | ) | | $ | 80 | | | $ | (1,777 | ) | | $ | (9,976 | ) | |
Class I | |
Proceeds from shares issued | | $ | 10,187 | | | $ | 15,429 | | | $ | 825 | | | $ | 1,842 | | | $ | 43,105 | | | $ | 163,315 | | |
Distributions reinvested | | | 7,418 | | | | — | | | | 191 | | | | 261 | | | | 7,469 | | | | 20,000 | | |
Redemption fees (b) | | | — | | | | 2 | | | | — | | | | — | | | | — | | | | — | | |
Cost of shares redeemed | | | (9,534 | ) | | | (8,010 | ) | | | (842 | ) | | | (1,305 | ) | | | (111,167 | ) | | | (362,435 | ) | |
Total Class I | | $ | 8,071 | | | $ | 7,421 | | | $ | 174 | | | $ | 798 | | | $ | (60,593 | ) | | $ | (179,120 | ) | |
Class R | |
Proceeds from shares issued | | $ | — | | | $ | — | | | $ | 9 | | | $ | 93 | | | $ | 735 | | | $ | 4,576 | | |
Distributions reinvested | | | — | | | | — | | | | 23 | | | | 34 | | | | 497 | | | | 1,705 | | |
Cost of shares redeemed | | | — | | | | — | | | | (36 | ) | | | (374 | ) | | | (4,291 | ) | | | (24,238 | ) | |
Total Class R | | $ | — | | | $ | — | | | $ | (4 | ) | | $ | (247 | ) | | $ | (3,059 | ) | | $ | (17,957 | ) | |
Class R6 | |
Proceeds from shares issued | | $ | — | | | $ | — | | | $ | — | | | $ | — | | | $ | 5,251 | | | $ | 11,111 | | |
Distributions reinvested | | | — | | | | — | | | | — | | | | — | | | | 740 | | | | 1,831 | | |
Cost of shares redeemed | | | — | | | | — | | | | — | | | | — | | | | (6,126 | ) | | | (30,159 | ) | |
Total Class R6 | | $ | — | | | $ | — | | | $ | — | | | $ | — | | | $ | (135 | ) | | $ | (17,217 | ) | |
Class Y | |
Proceeds from shares issued | | $ | — | | | $ | — | | | $ | — | | | $ | — | | | $ | 16,399 | | | $ | 94,608 | | |
Distributions reinvested | | | — | | | | — | | | | — | | | | — | | | | 2,676 | | | | 7,353 | | |
Cost of shares redeemed | | | — | | | | — | | | | — | | | | — | | | | (41,254 | ) | | | (159,309 | ) | |
Total Class Y | | $ | — | | | $ | — | | | $ | — | | | $ | — | | | $ | (22,179 | ) | | $ | (57,348 | ) | |
Member Class | |
Proceeds from shares issued | | $ | — | | | $ | — | | | $ | — | | | $ | — | | | $ | 754 | | | $ | 1,372 | (c) | |
Distributions reinvested | | | — | | | | — | | | | — | | | | — | | | | 25 | | | | 33 | (c) | |
Cost of shares redeemed | | | — | | | | — | | | | — | | | | — | | | | (375 | ) | | | (486 | )(c) | |
Total Member Class | | $ | — | | | $ | — | | | $ | — | | | $ | — | | | $ | 404 | | | $ | 919 | | |
Change in net assets resulting
from capital transactions | | $ | 7,406 | | | $ | 9,212 | | | $ | (181 | ) | | $ | (341 | ) | | $ | (100,868 | ) | | $ | (295,207 | ) | |
(a) On May 3, 2021, the THB Asset Management Microcap Fund (the "Predecessor Fund") was reorganized into the Victory THB US Small Opportunities Fund (the "Victory THB Fund"). Investor Class and Institutional Class shares of the Predecessor Fund were exchanged on a tax-free basis for Class A and Class I shares, respectively, of the Victory THB Fund. Information presented prior to May 3, 2021, is that of the Predecessor Fund. See Note 1 in the Notes to Financial Statements.
(b) Redemptions Fees — see Note 2 in the Notes to Financial Statements
(c) Member Class activity is for the period November 3, 2020 (commencement of operations) to October 31, 2021.
(continues on next page)
See notes to financial statements.
39
Victory Portfolios | | Statements of Changes in Net Assets | |
(Amounts in Thousands) (continued)
| | | Victory
THB US Small
Opportunities Fund(a) | | Victory
Strategic
Allocation Fund | |
Victory INCORE
Fund for Income | |
| | | Six
Months
Ended
April 30,
2022
(Unaudited) | | Year
Ended
October 31,
2021 | | Six
Months
Ended
April 30,
2022
(Unaudited) | | Year
Ended
October 31,
2021 | | Six
Months
Ended
April 30,
2022
(Unaudited) | | Year
Ended
October 31,
2021 | |
Share Transactions: | |
Class A | |
Issued | | | 7 | | | | 227 | | | | 41 | | | | 95 | | | | 1,235 | | | | 5,258 | | |
Reinvested | | | 9 | | | | — | | | | 16 | | | | 23 | | | | 340 | | | | 703 | | |
Redeemed | | | (43 | ) | | | (159 | ) | | | (70 | ) | | | (168 | ) | | | (3,333 | ) | | | (7,717 | ) | |
Total Class A | | | (27 | ) | | | 68 | | | | (13 | ) | | | (50 | ) | | | (1,758 | ) | | | (1,756 | ) | |
Class C | |
Issued | | | — | | | | — | | | | 14 | | | | 35 | | | | 43 | | | | 206 | | |
Reinvested | | | — | | | | — | | | | 2 | | | | 3 | | | | 23 | | | | 62 | | |
Redeemed | | | — | | | | — | | | | (21 | ) | | | (34 | ) | | | (299 | ) | | | (1,486 | ) | |
Total Class C | | | — | | | | — | | | | (5 | ) | | | 4 | | | | (233 | ) | | | (1,218 | ) | |
Class I | |
Issued | | | 482 | | | | 639 | | | | 42 | | | | 96 | | | | 5,608 | | | | 19,802 | | |
Reinvested | | | 342 | | | | — | | | | 10 | | | | 13 | | | | 974 | | | | 2,447 | | |
Redeemed | | | (438 | ) | | | (319 | ) | | | (43 | ) | | | (69 | ) | | | (14,424 | ) | | | (43,989 | ) | |
Total Class I | | | 386 | | | | 320 | | | | 9 | | | | 40 | | | | (7,842 | ) | | | (21,740 | ) | |
Class R | |
Issued | | | — | | | | — | | | | — | (b) | | | 5 | | | | 95 | | | | 552 | | |
Reinvested | | | — | | | | — | | | | 1 | | | | 2 | | | | 65 | | | | 208 | | |
Redeemed | | | — | | | | — | | | | (2 | ) | | | (20 | ) | | | (551 | ) | | | (2,981 | ) | |
Total Class R | | | — | | | | — | | | | (1 | ) | | | (13 | ) | | | (391 | ) | | | (2,221 | ) | |
Class R6 | |
Issued | | | — | | | | — | | | | — | | | | — | | | | 680 | | | | 1,349 | | |
Reinvested | | | — | | | | — | | | | — | | | | — | | | | 97 | | | | 224 | | |
Redeemed | | | — | | | | — | | | | — | | | | — | | | | (797 | ) | | | (3,665 | ) | |
Total Class R6 | | | — | | | | — | | | | — | | | | — | | | | (20 | ) | | | (2,092 | ) | |
Class Y | |
Issued | | | — | | | | — | | | | — | | | | — | | | | 2,129 | | | | 11,518 | | |
Reinvested | | | — | | | | — | | | | — | | | | — | | | | 349 | | | | 900 | | |
Redeemed | | | — | | | | — | | | | — | | | | — | | | | (5,333 | ) | | | (19,398 | ) | |
Total Class Y | | | — | | | | — | | | | — | | | | — | | | | (2,855 | ) | | | (6,980 | ) | |
Member Class | |
Issued | | | — | | | | — | | | | — | | | | — | | | | 99 | | | | 166 | (c) | |
Reinvested | | | — | | | | — | | | | — | | | | — | | | | 3 | | | | 4 | (c) | |
Redeemed | | | — | | | | — | | | | — | | | | — | | | | (48 | ) | | | (60 | )(c) | |
Total Member Class | | | — | | | | — | | | | — | | | | — | | | | 54 | | | | 110 | | |
Change in Shares | | | 359 | | | | 388 | | | | (10 | ) | | | (19 | ) | | | (13,045 | ) | | | (35,897 | ) | |
(a) On May 3, 2021, the THB Asset Management Microcap Fund (the "Predecessor Fund") was reorganized into the Victory THB US Small Opportunities Fund (the "Victory THB Fund"). Investor Class and Institutional Class shares of the Predecessor Fund were exchanged on a tax-free basis for Class A and Class I shares, respectively, of the Victory THB Fund. Information presented prior to May 3, 2021, is that of the Predecessor Fund. See Note 1 in the Notes to Financial Statements.
(b) Rounds to less than 1 thousand.
(c) Member Class activity is for the period November 3, 2020 (commencement of operations) to October 31, 2021.
See notes to financial statements.
40
Victory Portfolios | | Statements of Changes in Net Assets | |
(Amounts in Thousands)
| | | Victory
INCORE Investment Grade
Convertible Fund | |
| | | Six
Months
Ended
April 30,
2022
(Unaudited) | | Year
Ended
October 31,
2021 | |
From Investment Activities: | |
Operations: | |
Net Investment Income (Loss) | | $ | 3,790 | | | $ | 5,579 | | |
Net realized gains (losses) | | | 4,965 | | | | 35,138 | | |
Net change in unrealized appreciation/depreciation | | | (29,606 | ) | | | 21,029 | | |
Change in net assets resulting from operations | | | (20,851 | ) | | | 61,746 | | |
Distributions to Shareholders: | |
Class A | | | (1,893 | ) | | | (820 | ) | |
Class I | | | (35,608 | ) | | | (14,821 | ) | |
Member Class | | | (54 | ) | | | (3 | )(a) | |
Change in net assets resulting from distributions to shareholders | | | (37,555 | ) | | | (15,644 | ) | |
Change in net assets resulting from capital transactions | | | 84,664 | | | | 85,682 | | |
Change in net assets | | | 26,258 | | | | 131,784 | | |
Net Assets: | |
Beginning of period | | | 425,278 | | | | 293,494 | | |
End of period | | $ | 451,536 | | | $ | 425,278 | | |
(a) Member Class activity is for the period November 3, 2020 (commencement of operations) to October 31, 2021.
(continues on next page)
See notes to financial statements.
41
Victory Portfolios | | Statements of Changes in Net Assets | |
(Amounts in Thousands) (continued)
| | | Victory
INCORE Investment Grade
Convertible Fund | |
| | | Six
Months
Ended
April 30,
2022
(Unaudited) | | Year
Ended
October 31,
2021 | |
Capital Transactions: | |
Class A | |
Proceeds from shares issued | | $ | 2,214 | | | $ | 8,473 | | |
Distributions reinvested | | | 1,647 | | | | 711 | | |
Cost of shares redeemed | | | (2,413 | ) | | | (6,798 | ) | |
Total Class A | | $ | 1,448 | | | $ | 2,386 | | |
Class I | |
Proceeds from shares issued | | $ | 165,522 | | | $ | 174,838 | | |
Distributions reinvested | | | 34,273 | | | | 14,661 | | |
Cost of shares redeemed | | | (117,156 | ) | | | (106,697 | ) | |
Total Class I | | $ | 82,639 | | | $ | 82,802 | | |
Member Class | |
Proceeds from shares issued | | $ | 746 | | | $ | 657 | (a) | |
Distributions reinvested | | | 54 | | | | 3 | (a) | |
Cost of shares redeemed | | | (223 | ) | | | (166 | )(a) | |
Total Member Class | | $ | 577 | | | $ | 494 | | |
Change in net assets resulting from capital transactions | | $ | 84,664 | | | $ | 85,682 | | |
Share Transactions: | |
Class A | |
Issued | | | 121 | | | | 441 | | |
Reinvested | | | 89 | | | | 39 | | |
Redeemed | | | (131 | ) | | | (353 | ) | |
Total Class A | | | 79 | | | | 127 | | |
Class I | |
Issued | | | 8,946 | | | | 8,995 | | |
Reinvested | | | 1,855 | | | | 797 | | |
Redeemed | | | (6,335 | ) | | | (5,604 | ) | |
Total Class I | | | 4,466 | | | | 4,188 | | |
Member Class | |
Issued | | | 38 | | | | 33 | (a) | |
Reinvested | | | 3 | | | | — | (a)(b) | |
Redeemed | | | (11 | ) | | | (8 | )(a) | |
Total Member Class | | | 30 | | | | 25 | | |
Change in Shares | | | 4,575 | | | | 4,340 | | |
(a) Member Class activity is for the period November 3, 2020 (commencement of operations) to October 31, 2021.
(b) Rounds to less than 1 thousand.
See notes to financial statements.
42
This page is intentionally left blank.
43
Victory Portfolios | | Financial Highlights | |
For a Share Outstanding Throughout Each Period
| | | | | Investment Activities | | Distributions to
Shareholders From | |
| | | Net Asset
Value,
Beginning of
Period | | Net
Investment
Income
(Loss)(a) | | Net Realized
and Unrealized
Gains (Losses) | | Total from
Investment
Activities | | Net
Investment
Income | | Net Realized
Gains from
Investments | |
Victory Diversified Stock Fund | | | |
Class A | | | |
Six Months Ended
April 30, 2022
(Unaudited) | | $ | 24.89 | | | | 0.02 | | | | (2.14 | ) | | | (2.12 | ) | | | (0.03 | ) | | | (3.36 | ) | |
Year Ended October 31:
2021 | | $ | 17.41 | | | | — | (e) | | | 7.95 | | | | 7.95 | | | | (0.01 | ) | | | (0.46 | ) | |
2020 | | $ | 17.65 | | | | 0.05 | | | | 0.90 | | | | 0.95 | | | | (0.04 | ) | | | (1.15 | ) | |
2019 | | $ | 17.90 | | | | 0.09 | | | | 1.65 | | | | 1.74 | | | | (0.08 | ) | | | (1.91 | ) | |
2018 | | $ | 22.03 | | | | 0.06 | | | | 0.17 | | | | 0.23 | | | | (0.06 | ) | | | (4.30 | ) | |
2017 | | $ | 18.01 | | | | 0.13 | | | | 4.28 | | | | 4.41 | | | | (0.17 | ) | | | (0.22 | ) | |
Class C | | | |
Six Months Ended
April 30, 2022
(Unaudited) | | $ | 22.70 | | | | (0.07 | ) | | | (1.93 | ) | | | (2.00 | ) | | | — | | | | (3.36 | ) | |
Year Ended October 31:
2021 | | $ | 16.05 | | | | (0.18 | ) | | | 7.29 | | | | 7.11 | | | | — | | | | (0.46 | ) | |
2020 | | $ | 16.46 | | | | (0.10 | ) | | | 0.84 | | | | 0.74 | | | | — | | | | (1.15 | ) | |
2019 | | $ | 16.90 | | | | (0.05 | ) | | | 1.52 | | | | 1.47 | | | | — | | | | (1.91 | ) | |
2018 | | $ | 21.12 | | | | (0.10 | ) | | | 0.18 | | | | 0.08 | | | | — | | | | (4.30 | ) | |
2017 | | $ | 17.30 | | | | (0.02 | ) | | | 4.10 | | | | 4.08 | | | | (0.04 | ) | | | (0.22 | ) | |
Class I | | | |
Six Months Ended
April 30, 2022
(Unaudited) | | $ | 24.88 | | | | 0.05 | | | | (2.15 | ) | | | (2.10 | ) | | | (0.05 | ) | | | (3.36 | ) | |
Year Ended October 31:
2021 | | $ | 17.37 | | | | 0.05 | | | | 7.94 | | | | 7.99 | | | | (0.02 | ) | | | (0.46 | ) | |
2020 | | $ | 17.61 | | | | 0.09 | | | | 0.90 | | | | 0.99 | | | | (0.08 | ) | | | (1.15 | ) | |
2019 | | $ | 17.87 | | | | 0.13 | | | | 1.65 | | | | 1.78 | | | | (0.13 | ) | | | (1.91 | ) | |
2018 | | $ | 22.00 | | | | 0.11 | | | | 0.16 | | | | 0.27 | | | | (0.10 | ) | | | (4.30 | ) | |
2017 | | $ | 17.98 | | | | 0.19 | | | | 4.27 | | | | 4.46 | | | | (0.22 | ) | | | (0.22 | ) | |
* Does not include acquired fund fees and expenses, if any.
(a) Per share net investment income (loss) has been calculated using the average daily shares method.
(b) Not annualized for periods less than one year.
(c) Annualized for periods less than one year.
(d) Portfolio turnover is calculated on the basis of the Fund as a whole without distinguishing between the classes of shares issued.
(e) Amount is less than $0.005 per share.
(f) Amount is less than 0.005%.
See notes to financial statements.
44
Victory Portfolios | | Financial Highlights — continued | |
For a Share Outstanding Throughout Each Period
| | | | | Ratios to Average Net Assets | | Supplemental Data | |
| | | Total
Distributions | | Net Asset
Value,
End of
Period | | Total
Return
(Excludes
Sales
Charge)(b) | | Net
Expenses*(c) | | Net
Investment
Income
(Loss)(c) | | Gross
Expenses*(c) | | Net Assets,
End of
Period
(000's) | | Portfolio
Turnover(b)(d) | |
Victory Diversified Stock Fund | |
Class A | |
Six Months Ended
April 30, 2022
(Unaudited) | | | (3.39 | ) | | $ | 19.38 | | | | (10.23 | )% | | | 1.07 | % | | | 0.20 | % | | | 1.07 | % | | $ | 211,232 | | | | 38 | % | |
Year Ended October 31:
2021 | | | (0.47 | ) | | $ | 24.89 | | | | 46.50 | % | | | 1.07 | % | | | 0.00 | %(f) | | | 1.07 | % | | $ | 246,063 | | | | 61 | % | |
2020 | | | (1.19 | ) | | $ | 17.41 | | | | 5.47 | % | | | 1.09 | % | | | 0.29 | % | | | 1.09 | % | | $ | 184,217 | | | | 95 | % | |
2019 | | | (1.99 | ) | | $ | 17.65 | | | | 12.27 | % | | | 1.08 | % | | | 0.55 | % | | | 1.08 | % | | $ | 204,945 | | | | 132 | % | |
2018 | | | (4.36 | ) | | $ | 17.90 | | | | (0.20 | )% | | | 1.05 | % | | | 0.32 | % | | | 1.05 | % | | $ | 264,297 | | | | 112 | % | |
2017 | | | (0.39 | ) | | $ | 22.03 | | | | 24.85 | % | | | 1.05 | % | | | 0.66 | % | | | 1.05 | % | | $ | 311,255 | | | | 133 | % | |
Class C | |
Six Months Ended
April 30, 2022
(Unaudited) | | | (3.36 | ) | | $ | 17.34 | | | | (10.67 | )% | | | 2.02 | % | | | (0.75 | )% | | | 2.41 | % | | $ | 1,840 | | | | 38 | % | |
Year Ended October 31:
2021 | | | (0.46 | ) | | $ | 22.70 | | | | 45.01 | % | | | 2.02 | % | | | (0.93 | )% | | | 2.32 | % | | $ | 2,371 | | | | 61 | % | |
2020 | | | (1.15 | ) | | $ | 16.05 | | | | 4.53 | % | | | 2.05 | % | | | (0.64 | )% | | | 2.14 | % | | $ | 3,046 | | | | 95 | % | |
2019 | | | (1.91 | ) | | $ | 16.46 | | | | 11.19 | % | | | 2.02 | % | | | (0.35 | )% | | | 2.02 | % | | $ | 5,909 | | | | 132 | % | |
2018 | | | (4.30 | ) | | $ | 16.90 | | | | (1.02 | )% | | | 1.89 | % | | | (0.53 | )% | | | 1.89 | % | | $ | 11,586 | | | | 112 | % | |
2017 | | | (0.26 | ) | | $ | 21.12 | | | | 23.82 | % | | | 1.87 | % | | | (0.12 | )% | | | 1.87 | % | | $ | 36,001 | | | | 133 | % | |
Class I | |
Six Months Ended
April 30, 2022
(Unaudited) | | | (3.41 | ) | | $ | 19.37 | | | | (10.14 | )% | | | 0.83 | % | | | 0.43 | % | | | 0.84 | % | | $ | 24,177 | | | | 38 | % | |
Year Ended October 31:
2021 | | | (0.48 | ) | | $ | 24.88 | | | | 46.79 | % | | | 0.83 | % | | | 0.24 | % | | | 0.85 | % | | $ | 27,856 | | | | 61 | % | |
2020 | | | (1.23 | ) | | $ | 17.37 | | | | 5.81 | % | | | 0.84 | % | | | 0.56 | % | | | 0.86 | % | | $ | 21,071 | | | | 95 | % | |
2019 | | | (2.04 | ) | | $ | 17.61 | | | | 12.52 | % | | | 0.84 | % | | | 0.81 | % | | | 0.84 | % | | $ | 31,619 | | | | 132 | % | |
2018 | | | (4.40 | ) | | $ | 17.87 | | | | 0.05 | % | | | 0.79 | % | | | 0.58 | % | | | 0.79 | % | | $ | 46,122 | | | | 112 | % | |
2017 | | | (0.44 | ) | | $ | 22.00 | | | | 25.21 | % | | | 0.80 | % | | | 0.99 | % | | | 0.80 | % | | $ | 74,466 | | | | 133 | % | |
(continues on next page)
See notes to financial statements.
45
Victory Portfolios | | Financial Highlights | |
For a Share Outstanding Throughout Each Period
| | | | | Investment Activities | | Distributions to
Shareholders From | |
| | | Net Asset
Value,
Beginning of
Period | | Net
Investment
Income
(Loss)(a) | | Net Realized
and Unrealized
Gains (Losses) | | Total from
Investment
Activities | | Net
Investment
Income | | Net Realized
Gains from
Investments | |
Victory Diversified Stock Fund | | | |
Class R | | | |
Six Months Ended
April 30, 2022
(Unaudited) | | $ | 24.25 | | | | (0.01 | ) | | | (2.08 | ) | | | (2.09 | ) | | | (0.01 | ) | | | (3.36 | ) | |
Year Ended October 31:
2021 | | $ | 17.01 | | | | (0.06 | ) | | | 7.76 | | | | 7.70 | | | | — | | | | (0.46 | ) | |
2020 | | $ | 17.29 | | | | — | (e) | | | 0.88 | | | | 0.88 | | | | (0.01 | ) | | | (1.15 | ) | |
2019 | | $ | 17.58 | | | | 0.04 | | | | 1.62 | | | | 1.66 | | | | (0.04 | ) | | | (1.91 | ) | |
2018 | | $ | 21.71 | | | | 0.01 | | | | 0.16 | | | | 0.17 | | | | — | (e) | | | (4.30 | ) | |
2017 | | $ | 17.75 | | | | 0.07 | | | | 4.23 | | | | 4.30 | | | | (0.12 | ) | | | (0.22 | ) | |
Class R6 | | | |
Six Months Ended
April 30, 2022
(Unaudited) | | $ | 24.91 | | | | 0.06 | | | | (2.16 | ) | | | (2.10 | ) | | | (0.06 | ) | | | (3.36 | ) | |
Year Ended October 31:
2021 | | $ | 17.38 | | | | 0.06 | | | | 7.95 | | | | 8.01 | | | | (0.02 | ) | | | (0.46 | ) | |
2020 | | $ | 17.62 | | | | 0.08 | | | | 0.92 | | | | 1.00 | | | | (0.09 | ) | | | (1.15 | ) | |
2019 | | $ | 17.88 | | | | 0.14 | | | | 1.64 | | | | 1.78 | | | | (0.13 | ) | | | (1.91 | ) | |
2018 | | $ | 22.00 | | | | 0.11 | | | | 0.17 | | | | 0.28 | | | | (0.10 | ) | | | (4.30 | ) | |
2017 | | $ | 17.98 | | | | 0.18 | | | | 4.29 | | | | 4.47 | | | | (0.23 | ) | | | (0.22 | ) | |
Class Y | | | |
Six Months Ended
April 30, 2022
(Unaudited) | | $ | 24.93 | | | | 0.04 | | | | (2.15 | ) | | | (2.11 | ) | | | (0.05 | ) | | | (3.36 | ) | |
Year Ended October 31:
2021 | | $ | 17.41 | | | | 0.05 | | | | 7.95 | | | | 8.00 | | | | (0.02 | ) | | | (0.46 | ) | |
2020 | | $ | 17.65 | | | | 0.09 | | | | 0.90 | | | | 0.99 | | | | (0.08 | ) | | | (1.15 | ) | |
2019 | | $ | 17.90 | | | | 0.12 | | | | 1.66 | | | | 1.78 | | | | (0.12 | ) | | | (1.91 | ) | |
2018 | | $ | 22.02 | | | | 0.11 | | | | 0.16 | | | | 0.27 | | | | (0.09 | ) | | | (4.30 | ) | |
2017 | | $ | 18.00 | | | | 0.17 | | | | 4.28 | | | | 4.45 | | | | (0.21 | ) | | | (0.22 | ) | |
* Does not include acquired fund fees and expenses, if any.
(a) Per share net investment income (loss) has been calculated using the average daily shares method.
(b) Not annualized for periods less than one year.
(c) Annualized for periods less than one year.
(d) Portfolio turnover is calculated on the basis of the Fund as a whole without distinguishing between the classes of shares issued.
(e) Amount is less than $0.005 per share.
See notes to financial statements.
46
Victory Portfolios | | Financial Highlights — continued | |
For a Share Outstanding Throughout Each Period (continued)
| | | | | Ratios to Average Net Assets | | Supplemental Data | |
| | | Total
Distributions | | Net Asset
Value,
End of
Period | | Total
Return
(Excludes
Sales
Charge)(b) | | Net
Expenses*(c) | | Net
Investment
Income
(Loss)(c) | | Gross
Expenses*(c) | | Net Assets,
End of
Period
(000's) | | Portfolio
Turnover(b)(d) | |
Victory Diversified Stock Fund | |
Class R | |
Six Months Ended
April 30, 2022
(Unaudited) | | | (3.37 | ) | | $ | 18.79 | | | | (10.37 | )% | | | 1.35 | % | | | (0.08 | )% | | | 1.35 | % | | $ | 40,351 | | | | 38 | % | |
Year Ended October 31:
2021 | | | (0.46 | ) | | $ | 24.25 | | | | 46.02 | % | | | 1.35 | % | | | (0.28 | )% | | | 1.35 | % | | $ | 48,980 | | | | 61 | % | |
2020 | | | (1.16 | ) | | $ | 17.01 | | | | 5.25 | % | | | 1.37 | % | | | 0.01 | % | | | 1.37 | % | | $ | 39,432 | | | | 95 | % | |
2019 | | | (1.95 | ) | | $ | 17.29 | | | | 11.90 | % | | | 1.37 | % | | | 0.26 | % | | | 1.37 | % | | $ | 47,981 | | | | 132 | % | |
2018 | | | (4.30 | ) | | $ | 17.58 | | | | (0.47 | )% | | | 1.34 | % | | | 0.03 | % | | | 1.34 | % | | $ | 54,776 | | | | 112 | % | |
2017 | | | (0.34 | ) | | $ | 21.71 | | | | 24.56 | % | | | 1.33 | % | | | 0.38 | % | | | 1.33 | % | | $ | 66,310 | | | | 133 | % | |
Class R6 | |
Six Months Ended
April 30, 2022
(Unaudited) | | | (3.42 | ) | | $ | 19.39 | | | | (10.11 | )% | | | 0.78 | % | | | 0.56 | % | | | 1.27 | % | | $ | 941 | | | | 38 | % | |
Year Ended October 31:
2021 | | | (0.48 | ) | | $ | 24.91 | | | | 46.89 | % | | | 0.78 | % | | | 0.29 | % | | | 1.10 | % | | $ | 4,040 | | | | 61 | % | |
2020 | | | (1.24 | ) | | $ | 17.38 | | | | 5.86 | % | | | 0.78 | % | | | 0.49 | % | | | 1.34 | % | | $ | 3,103 | | | | 95 | % | |
2019 | | | (2.04 | ) | | $ | 17.62 | | | | 12.58 | % | | | 0.78 | % | | | 0.83 | % | | | 1.24 | % | | $ | 2,313 | | | | 132 | % | |
2018 | | | (4.40 | ) | | $ | 17.88 | | | | 0.10 | % | | | 0.78 | % | | | 0.58 | % | | | 1.21 | % | | $ | 2,189 | | | | 112 | % | |
2017 | | | (0.45 | ) | | $ | 22.00 | | | | 25.24 | % | | | 0.78 | % | | | 0.94 | % | | | 1.29 | % | | $ | 2,427 | | | | 133 | % | |
Class Y | |
Six Months Ended
April 30, 2022
(Unaudited) | | | (3.41 | ) | | $ | 19.41 | | | | (10.14 | )% | | | 0.86 | % | | | 0.40 | % | | | 0.94 | % | | $ | 4,492 | | | | 38 | % | |
Year Ended October 31:
2021 | | | (0.48 | ) | | $ | 24.93 | | | | 46.75 | % | | | 0.86 | % | | | 0.21 | % | | | 0.96 | % | | $ | 5,029 | | | | 61 | % | |
2020 | | | (1.23 | ) | | $ | 17.41 | | | | 5.72 | % | | | 0.86 | % | | | 0.52 | % | | | 1.31 | % | | $ | 3,737 | | | | 95 | % | |
2019 | | | (2.03 | ) | | $ | 17.65 | | | | 12.53 | % | | | 0.86 | % | | | 0.76 | % | | | 1.33 | % | | $ | 4,249 | | | | 132 | % | |
2018 | | | (4.39 | ) | | $ | 17.90 | | | | 0.01 | % | | | 0.86 | % | | | 0.54 | % | | | 1.13 | % | | $ | 4,373 | | | | 112 | % | |
2017 | | | (0.43 | ) | | $ | 22.02 | | | | 25.11 | % | | | 0.86 | % | | | 0.88 | % | | | 0.94 | % | | $ | 8,843 | | | | 133 | % | |
See notes to financial statements.
47
Victory Portfolios | | Financial Highlights | |
For a Share Outstanding Throughout Each Period
| | | | | Investment Activities | | Distributions to
Shareholders From | |
| | | Net Asset
Value,
Beginning of
Period | | Net
Investment
Income
(Loss)(a) | | Net Realized
and Unrealized
Gains (Losses) | | Total from
Investment
Activities | | Net Realized
Gains from
Investments | | Total
Distributions | |
Victory NewBridge Large Cap Growth Fund | | | |
Class A | | | |
Six Months Ended
April 30, 2022
(Unaudited) | | $ | 7.41 | | | | (0.03 | ) | | | (1.82 | ) | | | (1.85 | ) | | | (1.85 | ) | | | (1.85 | ) | |
Year Ended October 31:
2021 | | $ | 6.31 | | | | (0.08 | ) | | | 1.94 | | | | 1.86 | | | | (0.76 | ) | | | (0.76 | ) | |
2020 | | $ | 5.52 | | | | (0.06 | ) | | | 1.91 | | | | 1.85 | | | | (1.06 | ) | | | (1.06 | ) | |
2019 | | $ | 7.94 | | | | (0.05 | ) | | | 0.05 | | | | — | (e) | | | (2.42 | ) | | | (2.42 | ) | |
2018 | | $ | 10.23 | | | | (0.09 | ) | | | 0.85 | | | | 0.76 | | | | (3.05 | ) | | | (3.05 | ) | |
2017 | | $ | 12.79 | | | | (0.09 | ) | | | 1.82 | | | | 1.73 | | | | (4.29 | ) | | | (4.29 | ) | |
Class C | | | |
Six Months Ended
April 30, 2022
(Unaudited) (f) | | $ | 8.43 | | | | (0.06 | ) | | | (2.13 | ) | | | (2.19 | ) | | | (1.85 | ) | | | (1.85 | ) | |
Year Ended October 31:
2021 (f) | | $ | 9.87 | | | | (0.15 | ) | | | 2.51 | | | | 2.36 | | | | (3.80 | ) | | | (3.80 | ) | |
| 2020 (f) | | $ | 12.15 | | | | (0.15 | ) | | | 3.17 | | | | 3.02 | | | | (5.30 | ) | | | (5.30 | ) | |
| 2019 (f) | | $ | 25.00 | | | | (0.30 | ) | | | (0.45 | ) | | | (0.75 | ) | | | (12.10 | ) | | | (12.10 | ) | |
| 2018 (f) | | $ | 37.93 | | | | (0.50 | ) | | | 2.82 | | | | 2.32 | | | | (15.25 | ) | | | (15.25 | ) | |
| 2017 (f) | | $ | 53.25 | | | | (0.60 | ) | | | 6.73 | | | | 6.13 | | | | (21.45 | ) | | | (21.45 | ) | |
Class I | | | |
Six Months Ended
April 30, 2022
(Unaudited) | | $ | 8.60 | | | | (0.02 | ) | | | (2.19 | ) | | | (2.21 | ) | | | (1.85 | ) | | | (1.85 | ) | |
Year Ended October 31:
2021 | | $ | 7.18 | | | | (0.06 | ) | | | 2.24 | | | | 2.18 | | | | (0.76 | ) | | | (0.76 | ) | |
2020 | | $ | 6.13 | | | | (0.04 | ) | | | 2.15 | | | | 2.11 | | | | (1.06 | ) | | | (1.06 | ) | |
2019 | | $ | 8.49 | | | | (0.04 | ) | | | 0.10 | | | | 0.06 | | | | (2.42 | ) | | | (2.42 | ) | |
2018 | | $ | 10.71 | | | | (0.06 | ) | | | 0.89 | | | | 0.83 | | | | (3.05 | ) | | | (3.05 | ) | |
2017 | | $ | 13.13 | | | | (0.05 | ) | | | 1.92 | | | | 1.87 | | | | (4.29 | ) | | | (4.29 | ) | |
Class Y | | | |
Six Months Ended
April 30, 2022
(Unaudited) | | $ | 8.08 | | | | (0.02 | ) | | | (2.03 | ) | | | (2.05 | ) | | | (1.85 | ) | | | (1.85 | ) | |
Year Ended October 31:
2021 | | $ | 6.79 | | | | (0.06 | ) | | | 2.11 | | | | 2.05 | | | | (0.76 | ) | | | (0.76 | ) | |
2020 | | $ | 5.86 | | | | (0.04 | ) | | | 2.03 | | | | 1.99 | | | | (1.06 | ) | | | (1.06 | ) | |
2019 | | $ | 8.24 | | | | (0.04 | ) | | | 0.08 | | | | 0.04 | | | | (2.42 | ) | | | (2.42 | ) | |
2018 | | $ | 10.48 | | | | (0.06 | ) | | | 0.87 | | | | 0.81 | | | | (3.05 | ) | | | (3.05 | ) | |
2017 | | $ | 12.96 | | | | (0.06 | ) | | | 1.87 | | | | 1.81 | | | | (4.29 | ) | | | (4.29 | ) | |
* Does not include acquired fund fees and expenses, if any.
(a) Per share net investment income (loss) has been calculated using the average daily shares method.
(b) Not annualized for periods less than one year.
(c) Annualized for periods less than one year.
See notes to financial statements.
48
Victory Portfolios | | Financial Highlights — continued | |
For a Share Outstanding Throughout Each Period
| | | | | Ratios to Average Net Assets | | Supplemental Data | |
| | | Net Asset
Value,
End of
Period | | Total
Return
(Excludes
Sales
Charge)(b) | | Net
Expenses*(c) | | Net
Investment
Income
(Loss)(c) | | Gross
Expenses*(c) | | Net Assets,
End of
Period
(000's) | | Portfolio
Turnover(b)(d) | |
Victory NewBridge Large Cap Growth Fund | |
Class A | |
Six Months Ended
April 30, 2022
(Unaudited) | | $ | 3.71 | | | | (31.71 | )% | | | 1.36 | % | | | (1.14 | )% | | | 1.72 | % | | $ | 5,315 | | | | 23 | % | |
Year Ended October 31:
2021 | | $ | 7.41 | | | | 31.73 | % | | | 1.36 | % | | | (1.20 | )% | | | 1.56 | % | | $ | 8,749 | | | | 39 | % | |
2020 | | $ | 6.31 | | | | 39.61 | % | | | 1.36 | % | | | (1.08 | )% | | | 1.52 | % | | $ | 7,757 | | | | 39 | % | |
2019 | | $ | 5.52 | | | | 4.56 | % | | | 1.36 | % | | | (0.97 | )% | | | 1.60 | % | | $ | 5,732 | | | | 62 | % | |
2018 | | $ | 7.94 | | | | 9.41 | % | | | 1.36 | % | | | (1.05 | )% | | | 1.47 | % | | $ | 5,546 | | | | 41 | % | |
2017 | | $ | 10.23 | | | | 20.84 | % | | | 1.40 | % | | | (0.94 | )% | | | 1.40 | % | | $ | 7,639 | | | | 60 | % | |
Class C | |
Six Months Ended
April 30, 2022
(Unaudited) (f) | | $ | 4.39 | | | | (32.08 | )% | | | 2.10 | % | | | (1.88 | )% | | | 4.49 | % | | $ | 405 | | | | 23 | % | |
Year Ended October 31:
2021 (f) | | $ | 8.43 | | | | 31.44 | % | | | 2.10 | % | | | (1.93 | )% | | | 3.58 | % | | $ | 695 | | | | 39 | % | |
| 2020 (f) | | $ | 9.87 | | | | 37.97 | % | | | 2.10 | % | | | (1.79 | )% | | | 2.67 | % | | $ | 1,190 | | | | 39 | % | |
| 2019 (f) | | $ | 12.15 | | | | 3.92 | % | | | 2.10 | % | | | (1.71 | )% | | | 2.70 | % | | $ | 1,768 | | | | 62 | % | |
| 2018 (f) | | $ | 25.00 | | | | 8.47 | % | | | 2.10 | % | | | (1.78 | )% | | | 2.40 | % | | $ | 3,042 | | | | 41 | % | |
| 2017 (f) | | $ | 37.93 | | | | 20.06 | % | | | 2.10 | % | | | (1.64 | )% | | | 2.27 | % | | $ | 4,201 | | | | 60 | % | |
Class I | |
Six Months Ended
April 30, 2022
(Unaudited) | | $ | 4.54 | | | | (31.46 | )% | | | 0.95 | % | | | (0.73 | )% | | | 1.49 | % | | $ | 3,727 | | | | 23 | % | |
Year Ended October 31:
2021 | | $ | 8.60 | | | | 32.38 | % | | | 0.95 | % | | | (0.79 | )% | | | 1.34 | % | | $ | 7,085 | | | | 39 | % | |
2020 | | $ | 7.18 | | | | 39.95 | % | | | 0.95 | % | | | (0.66 | )% | | | 1.31 | % | | $ | 6,171 | | | | 39 | % | |
2019 | | $ | 6.13 | | | | 5.11 | % | | | 0.95 | % | | | (0.56 | )% | | | 1.26 | % | | $ | 6,043 | | | | 62 | % | |
2018 | | $ | 8.49 | | | | 9.74 | % | | | 0.95 | % | | | (0.63 | )% | | | 1.09 | % | | $ | 10,633 | | | | 41 | % | |
2017 | | $ | 10.71 | | | | 21.52 | % | | | 0.95 | % | | | (0.47 | )% | | | 1.01 | % | | $ | 16,103 | | | | 60 | % | |
Class Y | |
Six Months Ended
April 30, 2022
(Unaudited) | | $ | 4.18 | | | | (31.51 | )% | | | 1.02 | % | | | (0.80 | )% | | | 1.78 | % | | $ | 773 | | | | 23 | % | |
Year Ended October 31:
2021 | | $ | 8.08 | | | | 32.32 | % | | | 1.02 | % | | | (0.86 | )% | | | 1.49 | % | | $ | 1,313 | | | | 39 | % | |
2020 | | $ | 6.79 | | | | 39.72 | % | | | 1.02 | % | | | (0.73 | )% | | | 1.78 | % | | $ | 1,744 | | | | 39 | % | |
2019 | | $ | 5.86 | | | | 5.06 | % | | | 1.02 | % | | | (0.63 | )% | | | 1.69 | % | | $ | 2,498 | | | | 62 | % | |
2018 | | $ | 8.24 | | | | 9.75 | % | | | 1.02 | % | | | (0.72 | )% | | | 1.48 | % | | $ | 3,411 | | | | 41 | % | |
2017 | | $ | 10.48 | | | | 21.30 | % | | | 1.02 | % | | | (0.55 | )% | | | 1.42 | % | | $ | 2,128 | | | | 60 | % | |
(d) Portfolio turnover is calculated on the basis of the Fund as a whole without distinguishing between the classes of shares issued.
(e) Amount is less than $0.005 per share.
(f) As described in Note 9 in the Notes to Financial Statements, per share amounts adjusted for a 1:5 reverse stock split.
See notes to financial statements.
49
Victory Portfolios | | Financial Highlights | |
For a Share Outstanding Throughout Each Period
| | | | | Investment Activities | | Distributions to
Shareholders From | |
| | | Net Asset
Value,
Beginning of
Period | | Net
Investment
Income
(Loss)(a) | | Net Realized
and Unrealized
Gains (Losses) | | Total from
Investment
Activities | | Net
Investment
Income | | Net Realized
Gains from
Investments | |
Victory Special Value Fund | | | |
Class A | | | |
Six Months Ended
April 30, 2022
(Unaudited) | | $ | 37.00 | | | | — | (e) | | | (3.04 | ) | | | (3.04 | ) | | | — | | | | (5.72 | ) | |
Year Ended October 31:
2021 | | $ | 26.23 | | | | (0.05 | ) | | | 11.82 | | | | 11.77 | | | | — | (e) | | | (1.00 | ) | |
2020 | | $ | 25.78 | | | | 0.04 | | | | 1.29 | | | | 1.33 | | | | (0.09 | ) | | | (0.79 | ) | |
2019 | | $ | 26.10 | | | | 0.10 | | | | 2.26 | | | | 2.36 | | | | (0.03 | ) | | | (2.65 | ) | |
2018 | | $ | 26.31 | | | | 0.05 | | | | (0.15 | ) | | | (0.10 | ) | | | (0.11 | ) | | | — | | |
2017 | | $ | 21.48 | | | | 0.13 | | | | 4.95 | | | | 5.08 | | | | (0.25 | ) | | | — | | |
Class C | | | |
Six Months Ended
April 30, 2022
(Unaudited) | | $ | 31.59 | | | | (0.11 | ) | | | (2.49 | ) | | | (2.60 | ) | | | — | | | | (5.72 | ) | |
Year Ended October 31:
2021 | | $ | 22.72 | | | | (0.28 | ) | | | 10.15 | | | | 9.87 | | | | — | | | | (1.00 | ) | |
2020 | | $ | 22.54 | | | | (0.16 | ) | | | 1.13 | | | | 0.97 | | | | — | | | | (0.79 | ) | |
2019 | | $ | 23.34 | | | | (0.09 | ) | | | 1.94 | | | | 1.85 | | | | — | | | | (2.65 | ) | |
2018 | | $ | 23.66 | | | | (0.18 | ) | | | (0.14 | ) | | | (0.32 | ) | | | — | | | | — | | |
2017 | | $ | 19.34 | | | | (0.08 | ) | | | 4.45 | | | | 4.37 | | | | (0.05 | ) | | | — | | |
Class I | | | |
Six Months Ended
April 30, 2022
(Unaudited) | | $ | 37.54 | | | | 0.04 | | | | (3.11 | ) | | | (3.07 | ) | | | — | | | | (5.72 | ) | |
Year Ended October 31:
2021 | | $ | 26.59 | | | | 0.01 | | | | 11.99 | | | | 12.00 | | | | (0.05 | ) | | | (1.00 | ) | |
2020 | | $ | 26.13 | | | | 0.08 | | | | 1.31 | | | | 1.39 | | | | (0.14 | ) | | | (0.79 | ) | |
2019 | | $ | 26.39 | | | | 0.14 | | | | 2.30 | | | | 2.44 | | | | (0.05 | ) | | | (2.65 | ) | |
2018 | | $ | 26.62 | | | | 0.09 | | | | (0.15 | ) | | | (0.06 | ) | | | (0.17 | ) | | | — | | |
2017 | | $ | 21.76 | | | | 0.13 | | | | 5.01 | | | | 5.14 | | | | (0.28 | ) | | | — | | |
* Does not include acquired fund fees and expenses, if any.
(a) Per share net investment income (loss) has been calculated using the average daily shares method.
(b) Not annualized for periods less than one year.
(c) Annualized for periods less than one year.
(d) Portfolio turnover is calculated on the basis of the Fund as a whole without distinguishing between the classes of shares issued.
(e) Amount is less than $0.005 per share.
(f) During the year, additional fees were voluntarily waived or reimbursed. Had these fees not been waived or reimbursed, the net expense ratio for each class would have been 0.10% higher.
See notes to financial statements.
50
Victory Portfolios | | Financial Highlights — continued | |
For a Share Outstanding Throughout Each Period
| | | | | Ratios to Average Net Assets | | Supplemental Data | |
| | | Total
Distributions | | Net Asset
Value,
End of
Period | | Total
Return
(Excludes
Sales
Charge)(b) | | Net
Expenses*(c) | | Net
Investment
Income
(Loss)(c) | | Gross
Expenses*(c) | | Net Assets,
End of
Period
(000's) | | Portfolio
Turnover(b)(d) | |
Victory Special Value Fund | |
Class A | |
Six Months Ended
April 30, 2022
(Unaudited) | | | (5.72 | ) | | $ | 28.24 | | | | (10.12 | )% | | | 1.23 | %(f) | | | 0.03 | % | | | 1.33 | % | | $ | 25,068 | | | | 41 | % | |
Year Ended October 31:
2021 | | | (1.00 | ) | | $ | 37.00 | | | | 46.06 | % | | | 1.23 | %(f) | | | (0.16 | )% | | | 1.33 | % | | $ | 28,945 | | | | 70 | % | |
2020 | | | (0.88 | ) | | $ | 26.23 | | | | 5.15 | % | | | 1.23 | %(f) | | | 0.14 | % | | | 1.33 | % | | $ | 24,302 | | | | 102 | % | |
2019 | | | (2.68 | ) | | $ | 25.78 | | | | 11.32 | % | | | 1.21 | % | | | 0.41 | % | | | 1.31 | % | | $ | 27,818 | | | | 126 | % | |
2018 | | | (0.11 | ) | | $ | 26.10 | | | | (0.42 | )% | | | 1.17 | % | | | 0.19 | % | | | 1.27 | % | | $ | 32,565 | | | | 113 | % | |
2017 | | | (0.25 | ) | | $ | 26.31 | | | | 23.84 | % | | | 1.17 | % | | | 0.53 | % | | | 1.27 | % | | $ | 35,223 | | | | 135 | % | |
Class C | |
Six Months Ended
April 30, 2022
(Unaudited) | | | (5.72 | ) | | $ | 23.27 | | | | (10.55 | )% | | | 2.10 | %(f) | | | (0.84 | )% | | | 3.18 | % | | $ | 870 | | | | 41 | % | |
Year Ended October 31:
2021 | | | (1.00 | ) | | $ | 31.59 | | | | 44.81 | % | | | 2.10 | %f) | | | (1.02 | )% | | | 3.53 | % | | $ | 978 | | | | 70 | % | |
2020 | | | (0.79 | ) | | $ | 22.72 | | | | 4.26 | % | | | 2.10 | %(f) | | | (0.72 | )% | | | 2.99 | % | | $ | 863 | | | | 102 | % | |
2019 | | | (2.65 | ) | | $ | 22.54 | | | | 10.34 | % | | | 2.10 | % | | | (0.44 | )% | | | 2.79 | % | | $ | 1,241 | | | | 126 | % | |
2018 | | | — | | | $ | 23.34 | | | | (1.35 | )% | | | 2.10 | % | | | (0.75 | )% | | | 2.27 | % | | $ | 2,145 | | | | 113 | % | |
2017 | | | (0.05 | ) | | $ | 23.66 | | | | 22.65 | % | | | 2.10 | % | | | (0.38 | )% | | | 2.21 | % | | $ | 7,296 | | | | 135 | % | |
Class I | |
Six Months Ended
April 30, 2022
(Unaudited) | | | (5.72 | ) | | $ | 28.75 | | | | (10.05 | )% | | | 1.05 | %(f) | | | 0.22 | % | | | 1.33 | % | | $ | 3,056 | | | | 41 | % | |
Year Ended October 31:
2021 | | | (1.05 | ) | | $ | 37.54 | | | | 46.29 | % | | | 1.05 | %(f) | | | 0.02 | % | | | 1.33 | % | | $ | 3,861 | | | | 70 | % | |
2020 | | | (0.93 | ) | | $ | 26.59 | | | | 5.35 | % | | | 1.05 | %(f) | | | 0.32 | % | | | 1.31 | % | | $ | 3,283 | | | | 102 | % | |
2019 | | | (2.70 | ) | | $ | 26.13 | | | | 11.52 | % | | | 1.05 | % | | | 0.58 | % | | | 1.34 | % | | $ | 3,274 | | | | 126 | % | |
2018 | | | (0.17 | ) | | $ | 26.39 | | | | (0.28 | )% | | | 1.02 | % | | | 0.31 | % | | | 1.16 | % | | $ | 3,678 | | | | 113 | % | |
2017 | | | (0.28 | ) | | $ | 26.62 | | | | 23.86 | % | | | 1.15 | % | | | 0.56 | % | | | 1.25 | % | | $ | 3,703 | | | | 135 | % | |
(continues on next page)
See notes to financial statements.
51
Victory Portfolios | | Financial Highlights | |
For a Share Outstanding Throughout Each Period
| | | | Investment Activities | | Distributions to
Shareholders From | |
| | | Net Asset
Value,
Beginning of
Period | | Net
Investment
Income
(Loss)(a) | | Net Realized
and Unrealized
Gains (Losses) | | Total from
Investment
Activities | | Net
Investment
Income | | Net Realized
Gains from
Investments | |
Victory Special Value Fund | | | |
Class R | | | |
Six Months Ended
April 30, 2022
(Unaudited) | | $ | 34.99 | | | | (0.04 | ) | | | (2.84 | ) | | | (2.88 | ) | | | — | | | | (5.72 | ) | |
Year Ended October 31:
2021 | | $ | 24.93 | | | | (0.14 | ) | | | 11.20 | | | | 11.06 | | | | — | | | | (1.00 | ) | |
2020 | | $ | 24.55 | | | | (0.04 | ) | | | 1.23 | | | | 1.19 | | | | (0.02 | ) | | | (0.79 | ) | |
2019 | | $ | 25.02 | | | | 0.03 | | | | 2.15 | | | | 2.18 | | | | — | | | | (2.65 | ) | |
2018 | | $ | 25.24 | | | | (0.03 | ) | | | (0.15 | ) | | | (0.18 | ) | | | (0.04 | ) | | | — | | |
2017 | | $ | 20.63 | | | | 0.05 | | | | 4.75 | | | | 4.80 | | | | (0.19 | ) | | | — | | |
Class Y | | | |
Six Months Ended
April 30, 2022
(Unaudited) | | $ | 37.31 | | | | 0.04 | | | | (3.08 | ) | | | (3.04 | ) | | | — | | | | (5.72 | ) | |
Year Ended October 31:
2021 | | $ | 26.44 | | | | 0.02 | | | | 11.92 | | | | 11.94 | | | | (0.07 | ) | | | (1.00 | ) | |
2020 | | $ | 25.98 | | | | 0.09 | | | | 1.32 | | | | 1.41 | | | | (0.16 | ) | | | (0.79 | ) | |
2019 | | $ | 26.25 | | | | 0.15 | | | | 2.28 | | | | 2.43 | | | | (0.05 | ) | | | (2.65 | ) | |
2018 | | $ | 26.47 | | | | 0.12 | | | | (0.17 | ) | | | (0.05 | ) | | | (0.17 | ) | | | — | | |
2017 | | $ | 21.62 | | | | 0.18 | | | | 4.98 | | | | 5.16 | | | | (0.31 | ) | | | — | | |
* Does not include acquired fund fees and expenses, if any.
(a) Per share net investment income (loss) has been calculated using the average daily shares method.
(b) Not annualized for periods less than one year.
(c) Annualized for periods less than one year.
(d) Portfolio turnover is calculated on the basis of the Fund as a whole without distinguishing between the classes of shares issued.
(e) During the year, additional fees were voluntarily waived or reimbursed. Had these fees not been waived or reimbursed, the net expense ratio for each class would have been 0.10% higher.
See notes to financial statements.
52
Victory Portfolios | | Financial Highlights — continued | |
For a Share Outstanding Throughout Each Period (continued)
| | | | | Ratios to Average Net Assets | | Supplemental Data | |
| | | Total
Distributions | | Net Asset
Value,
End of
Period | | Total
Return
(Excludes
Sales
Charge)(b) | | Net
Expenses*(c) | | Net
Investment
Income
(Loss)(c) | | Gross
Expenses*(c) | | Net Assets,
End of
Period
(000's) | | Portfolio
Turnover(b)(d) | |
Victory Special Value Fund | |
Class R | |
Six Months Ended
April 30, 2022
(Unaudited) | | | (5.72 | ) | | $ | 26.39 | | | | (10.27 | )% | | | 1.55 | %(e) | | | (0.28 | )% | | | 1.65 | % | | $ | 13,523 | | | | 41 | % | |
Year Ended October 31:
2021 | | | (1.00 | ) | | $ | 34.99 | | | | 45.59 | % | | | 1.54 | %(e) | | | (0.47 | )% | | | 1.64 | % | | $ | 16,605 | | | | 70 | % | |
2020 | | | (0.81 | ) | | $ | 24.93 | | | | 4.82 | % | | | 1.54 | %(e) | | | (0.16 | )% | | | 1.64 | % | | $ | 13,875 | | | | 102 | % | |
2019 | | | (2.65 | ) | | $ | 24.55 | | | | 11.03 | % | | | 1.50 | % | | | 0.13 | % | | | 1.60 | % | | $ | 21,084 | | | | 126 | % | |
2018 | | | (0.04 | ) | | $ | 25.02 | | | | (0.71 | )% | | | 1.46 | % | | | (0.10 | )% | | | 1.56 | % | | $ | 26,532 | | | | 113 | % | |
2017 | | | (0.19 | ) | | $ | 25.24 | | | | 23.43 | % | | | 1.47 | % | | | 0.24 | % | | | 1.57 | % | | $ | 36,688 | | | | 135 | % | |
Class Y | |
Six Months Ended
April 30, 2022
(Unaudited) | | | (5.72 | ) | | $ | 28.55 | | | | (10.03 | )% | | | 1.00 | %(e) | | | 0.27 | % | | | 1.55 | % | | $ | 699 | | | | 41 | % | |
Year Ended October 31:
2021 | | | (1.07 | ) | | $ | 37.31 | | | | 46.39 | % | | | 1.00 | %(e) | | | 0.07 | % | | | 1.77 | % | | $ | 816 | | | | 70 | % | |
2020 | | | (0.95 | ) | | $ | 26.44 | | | | 5.40 | % | | | 1.00 | %(e) | | | 0.36 | % | | | 3.68 | % | | $ | 584 | | | | 102 | % | |
2019 | | | (2.70 | ) | | $ | 25.98 | | | | 11.57 | % | | | 1.00 | % | | | 0.60 | % | | | 4.50 | % | | $ | 520 | | | | 126 | % | |
2018 | | | (0.17 | ) | | $ | 26.25 | | | | (0.21 | )% | | | 0.97 | % | | | 0.42 | % | | | 2.82 | % | | $ | 436 | | | | 113 | % | |
2017 | | | (0.31 | ) | | $ | 26.47 | | | | 24.12 | % | | | 0.93 | % | | | 0.77 | % | | | 2.07 | % | | $ | 1,219 | | | | 135 | % | |
See notes to financial statements.
53
Victory Portfolios | | Financial Highlights | |
For a Share Outstanding Throughout Each Period
| | | | | Investment Activities | | Distributions to
Shareholders From | |
| | | Net Asset
Value,
Beginning of
Period | | Net
Investment
Income
(Loss)(a) | | Net Realized
and Unrealized
Gains (Losses) | | Total from
Investment
Activities | | Net Realized
Gains from
Investments | | Total
Distributions | |
Victory THB US Small Opportunities Fund (e) | | | |
Class A | | | |
Six Months Ended
April 30, 2022
(Unaudited) | | $ | 24.30 | | | | (0.05 | ) | | | (3.76 | ) | | | (3.81 | ) | | | (2.40 | ) | | | (2.40 | ) | |
Year Ended October 31:
2021 | | $ | 15.55 | | | | (0.20 | ) | | | 8.95 | | | | 8.75 | | | | — | | | | — | | |
2020 | | $ | 15.00 | | | | (0.17 | ) | | | 0.81 | (f) | | | 0.64 | | | | (0.09 | ) | | | (0.09 | ) | |
2019 | | $ | 16.08 | | | | (0.14 | ) | | | (0.44 | ) | | | (0.58 | ) | | | (0.50 | ) | | | (0.50 | ) | |
2018 | | $ | 18.14 | | | | (0.15 | ) | | | 0.24 | | | | 0.09 | | | | (2.15 | ) | | | (2.15 | ) | |
2017 | | $ | 13.49 | | | | (0.16 | ) | | | 4.81 | | | | 4.65 | | | | — | | | | — | | |
Class I | | | |
Six Months Ended
April 30, 2022
(Unaudited) | | $ | 25.42 | | | | — | (f) | | | (3.95 | ) | | | (3.95 | ) | | | (2.40 | ) | | | (2.40 | ) | |
Year Ended October 31:
2021 | | $ | 16.20 | | | | (0.18 | ) | | | 9.40 | | | | 9.22 | | | | — | | | | — | | |
2020 | | $ | 15.56 | | | | (0.10 | ) | | | 0.83 | (f) | | | 0.73 | | | | (0.09 | ) | | | (0.09 | ) | |
2019 | | $ | 16.58 | | | | (0.08 | ) | | | (0.44 | ) | | | (0.52 | ) | | | (0.50 | ) | | | (0.50 | ) | |
2018 | | $ | 18.59 | | | | (0.10 | ) | | | 0.24 | | | | 0.14 | | | | (2.15 | ) | | | (2.15 | ) | |
2017 | | $ | 13.75 | | | | (0.08 | ) | | | 4.92 | | | | 4.84 | | | | — | | | | — | | |
* Does not include acquired fund fees and expenses, if any.
(a) Per share net investment income (loss) has been calculated using the average daily shares method.
(b) Not annualized for periods less than one year.
(c) Annualized for periods less than one year.
(d) Portfolio turnover is calculated on the basis of the Fund as a whole without distinguishing between the classes of shares issued.
(e) On May 3, 2021, the THB Asset Management Microcap Fund (the "Predecessor Fund") was reorganized into the Victory THB US Small Opportunities Fund (the "Victory THB Fund"). Investor Class and Institutional Class shares of the Predecessor Fund were exchanged on a tax-free basis for Class A and Class I shares, respectively, of the Victory THB Fund. Information presented prior to May 3, 2021, is that of the Predecessor Fund. See Note 1 in the Notes to Financial Statements.
(f) Amount is less than $0.005 per share.
(g) Amount is less than 0.005%.
See notes to financial statements.
54
Victory Portfolios | | Financial Highlights — continued | |
For a Share Outstanding Throughout Each Period
| | | | | Ratios to Average Net Assets | | Supplemental Data | |
| | | Redemption
Fees | | Net Asset
Value,
End of
Period | | Total
Return
(Excludes
Sales
Charge)(b) | | Net
Expenses*(c) | | Net
Investment
Income
(Loss)(c) | | Gross
Expenses*(c) | | Net Assets,
End of
Period
(000's) | | Portfolio
Turnover(b)(d) | |
Victory THB US Small Opportunities Fund (e) | |
Class A | |
Six Months Ended
April 30, 2022
(Unaudited) | | | — | | | $ | 18.09 | | | | (16.88 | )% | | | 1.70 | % | | | (0.48 | )% | | | 2.70 | % | | $ | 1,318 | | | | 31 | % | |
Year Ended October 31:
2021 | | | — | | | $ | 24.30 | | | | 56.27 | % | | | 1.70 | % | | | (1.20 | )% | | | 2.45 | % | | $ | 2,437 | | | | 50 | % | |
2020 | | | — | | | $ | 15.55 | | | | 4.25 | % | | | 1.70 | % | | | (1.17 | )% | | | 2.45 | % | | $ | 493 | | | | 62 | % | |
2019 | | | — | | | $ | 15.00 | | | | (3.34 | )% | | | 1.70 | % | | | (0.92 | )% | | | 2.20 | % | | $ | 627 | | | | 31 | % | |
2018 | | | — | | | $ | 16.08 | | | | 0.45 | % | | | 1.55 | % | | | (0.86 | )% | | | 2.00 | % | | $ | 1,041 | | | | 35 | % | |
2017 | | | — | | | $ | 18.14 | | | | 34.47 | % | | | 1.75 | % | | | (0.97 | )% | | | 2.29 | % | | $ | 679 | | | | 58 | % | |
Class I | |
Six Months Ended
April 30, 2022
(Unaudited) | | | — | | | $ | 19.07 | | | | (16.70 | )% | | | 1.25 | % | | | 0.00 | %(g) | | | 1.41 | % | | $ | 72,559 | | | | 31 | % | |
Year Ended October 31:
2021 | | | — | (f) | | $ | 25.42 | | | | 56.98 | % | | | 1.25 | % | | | (0.73 | )% | | | 1.67 | % | | $ | 86,947 | | | | 50 | % | |
2020 | | | — | | | $ | 16.20 | | | | 4.68 | % | | | 1.25 | % | | | (0.70 | )% | | | 1.98 | % | | $ | 50,206 | | | | 62 | % | |
2019 | | | — | | | $ | 15.56 | | | | (2.86 | )% | | | 1.25 | % | | | (0.48 | )% | | | 1.75 | % | | $ | 73,403 | | | | 31 | % | |
2018 | | | — | | | $ | 16.58 | | | | 0.73 | % | | | 1.25 | % | | | (0.55 | )% | | | 1.70 | % | | $ | 89,159 | | | | 35 | % | |
2017 | | | — | | | $ | 18.59 | | | | 35.20 | % | | | 1.25 | % | | | (0.48 | )% | | | 1.78 | % | | $ | 81,076 | | | | 58 | % | |
See notes to financial statements.
55
Victory Portfolios | | Financial Highlights | |
For a Share Outstanding Throughout Each Period
| | | | | Investment Activities | | Distributions to
Shareholders From | |
| | | Net Asset
Value,
Beginning of
Period | | Net
Investment
Income
(Loss)(a) | | Net Realized
and Unrealized
Gains (Losses) | | Total from
Investment
Activities | | Net
Investment
Income | | Net Realized
Gains from
Investments | |
Victory Strategic Allocation Fund | | | |
Class A | | | |
Six Months Ended
April 30, 2022
(Unaudited) | | $ | 19.94 | | | | 0.39 | | | | (1.72 | ) | | | (1.33 | ) | | | (0.39 | ) | | | — | | |
Year Ended October 31:
2021 | | $ | 16.48 | | | | 0.56 | | | | 3.46 | | | | 4.02 | | | | (0.56 | ) | | | — | | |
2020 | | $ | 16.47 | | | | 0.23 | | | | 0.41 | | | | 0.64 | | | | (0.23 | ) | | | (0.40 | ) | |
2019 | | $ | 15.44 | | | | 0.43 | | | | 1.12 | | | | 1.55 | | | | (0.39 | ) | | | (0.13 | ) | |
2018 | | $ | 16.41 | | | | 0.29 | | | | (0.68 | ) | | | (0.39 | ) | | | (0.39 | ) | | | (0.19 | ) | |
2017 | | $ | 14.80 | | | | 0.50 | | | | 1.51 | | | | 2.01 | | | | (0.40 | ) | | | — | | |
Class C | | | |
Six Months Ended
April 30, 2022
(Unaudited) | | $ | 19.56 | | | | 0.31 | | | | (1.69 | ) | | | (1.38 | ) | | | (0.32 | ) | | | — | | |
Year Ended October 31:
2021 | | $ | 16.19 | | | | 0.40 | | | | 3.40 | | | | 3.80 | | | | (0.43 | ) | | | — | | |
2020 | | $ | 16.18 | | | | 0.13 | | | | 0.39 | | | | 0.52 | | | | (0.11 | ) | | | (0.40 | ) | |
2019 | | $ | 15.19 | | | | 0.30 | | | | 1.10 | | | | 1.40 | | | | (0.28 | ) | | | (0.13 | ) | |
2018 | | $ | 16.19 | | | | 0.21 | | | | (0.71 | ) | | | (0.50 | ) | | | (0.31 | ) | | | (0.19 | ) | |
2017 | | $ | 14.65 | | | | 0.43 | | | | 1.44 | | | | 1.87 | | | | (0.33 | ) | | | — | | |
Class I | | | |
Six Months Ended
April 30, 2022
(Unaudited) | | $ | 20.06 | | | | 0.42 | | | | (1.73 | ) | | | (1.31 | ) | | | (0.42 | ) | | | — | | |
Year Ended October 31:
2021 | | $ | 16.57 | | | | 0.61 | | | | 3.48 | | | | 4.09 | | | | (0.60 | ) | | | — | | |
2020 | | $ | 16.56 | | | | 0.27 | | | | 0.41 | | | | 0.68 | | | | (0.27 | ) | | | (0.40 | ) | |
2019 | | $ | 15.52 | | | | 0.46 | | | | 1.13 | | | | 1.59 | | | | (0.42 | ) | | | (0.13 | ) | |
2018 | | $ | 16.48 | | | | 0.35 | | | | (0.70 | ) | | | (0.35 | ) | | | (0.42 | ) | | | (0.19 | ) | |
2017 | | $ | 14.86 | | | | 0.55 | | | | 1.50 | | | | 2.05 | | | | (0.43 | ) | | | — | | |
Class R | | | |
Six Months Ended
April 30, 2022
(Unaudited) | | $ | 19.89 | | | | 0.36 | | | | (1.71 | ) | | | (1.35 | ) | | | (0.37 | ) | | | — | | |
Year Ended October 31:
2021 | | $ | 16.44 | | | | 0.51 | | | | 3.45 | | | | 3.96 | | | | (0.51 | ) | | | — | | |
2020 | | $ | 16.43 | | | | 0.19 | | | | 0.42 | | | | 0.61 | | | | (0.20 | ) | | | (0.40 | ) | |
2019 | | $ | 15.41 | | | | 0.36 | | | | 1.14 | | | | 1.50 | | | | (0.35 | ) | | | (0.13 | ) | |
2018 | | $ | 16.38 | | | | 0.27 | | | | (0.70 | ) | | | (0.43 | ) | | | (0.35 | ) | | | (0.19 | ) | |
2017 | | $ | 14.79 | | | | 0.46 | | | | 1.49 | | | | 1.95 | | | | (0.36 | ) | | | — | | |
* Does not include acquired fund fees and expenses, if any.
(a) Per share net investment income (loss) has been calculated using the average daily shares method.
(b) Not annualized for periods less than one year.
(c) Annualized for periods less than one year.
See notes to financial statements.
56
Victory Portfolios | | Financial Highlights — continued | |
For a Share Outstanding Throughout Each Period
| | | | | Ratios to Average Net Assets | | Supplemental Data | |
| | | Total
Distributions | | Net Asset
Value,
End of
Period | | Total
Return
(Excludes
Sales
Charge)(b) | | Net
Expenses*(c) | | Net
Investment
Income
(Loss)(c) | | Gross
Expenses*(c) | | Net Assets,
End of
Period
(000's) | | Portfolio
Turnover(b)(d) | |
Victory Strategic Allocation Fund | |
Class A | |
Six Months Ended
April 30, 2022
(Unaudited) | | | (0.39 | ) | | $ | 18.22 | | | | (6.79 | )% | | | 0.40 | % | | | 4.05 | % | | | 0.79 | % | | $ | 14,715 | | | | 8 | % | |
Year Ended October 31:
2021 | | | (0.56 | ) | | $ | 19.94 | | | | 24.51 | % | | | 0.40 | % | | | 2.92 | % | | | 0.80 | % | | $ | 16,378 | | | | 22 | % | |
2020 | | | (0.63 | ) | | $ | 16.48 | | | | 3.99 | % | | | 0.40 | % | | | 1.45 | % | | | 0.81 | % | | $ | 14,364 | | | | 13 | % | |
2019 | | | (0.52 | ) | | $ | 16.47 | | | | 10.37 | % | | | 0.40 | % | | | 2.69 | % | | | 0.77 | % | | $ | 15,365 | | | | 5 | % | |
2018 | | | (0.58 | ) | | $ | 15.44 | | | | (2.56 | )% | | | 0.40 | % | | | 1.77 | % | | | 0.28 | %(e) | | $ | 18,747 | | | | 40 | % | |
2017 | | | (0.40 | ) | | $ | 16.41 | | | | 13.72 | % | | | 0.30 | % | | | 3.19 | % | | | 0.79 | % | | $ | 14,820 | | | | 51 | % | |
Class C | |
Six Months Ended
April 30, 2022
(Unaudited) | | | (0.32 | ) | | $ | 17.86 | | | | (7.16 | )% | | | 1.15 | % | | | 3.28 | % | | | 1.97 | % | | $ | 2,202 | | | | 8 | % | |
Year Ended October 31:
2021 | | | (0.43 | ) | | $ | 19.56 | | | | 23.57 | % | | | 1.15 | % | | | 2.10 | % | | | 2.02 | % | | $ | 2,507 | | | | 22 | % | |
2020 | | | (0.51 | ) | | $ | 16.19 | | | | 3.23 | % | | | 1.15 | % | | | 0.82 | % | | | 1.90 | % | | $ | 2,009 | | | | 13 | % | |
2019 | | | (0.41 | ) | | $ | 16.18 | | | | 9.53 | % | | | 1.15 | % | | | 1.94 | % | | | 1.72 | % | | $ | 3,193 | | | | 5 | % | |
2018 | | | (0.50 | ) | | $ | 15.19 | | | | (3.26 | )% | | | 1.15 | % | | | 1.30 | % | | | 1.08 | %(e) | | $ | 4,445 | | | | 40 | % | |
2017 | | | (0.33 | ) | | $ | 16.19 | | | | 12.88 | % | | | 1.03 | % | | | 2.78 | % | | | 1.58 | % | | $ | 8,814 | | | | 51 | % | |
Class I | |
Six Months Ended
April 30, 2022
(Unaudited) | | | (0.42 | ) | | $ | 18.33 | | | | (6.69 | )% | | | 0.15 | % | | | 4.30 | % | | | 0.58 | % | | $ | 8,651 | | | | 8 | % | |
Year Ended October 31:
2021 | | | (0.60 | ) | | $ | 20.06 | | | | 24.86 | % | | | 0.15 | % | | | 3.13 | % | | | 0.56 | % | | $ | 9,283 | | | | 22 | % | |
2020 | | | (0.67 | ) | | $ | 16.57 | | | | 4.22 | % | | | 0.15 | % | | | 1.66 | % | | | 0.59 | % | | $ | 7,006 | | | | 13 | % | |
2019 | | | (0.55 | ) | | $ | 16.56 | | | | 10.63 | % | | | 0.15 | % | | | 2.90 | % | | | 0.59 | % | | $ | 5,743 | | | | 5 | % | |
2018 | | | (0.61 | ) | | $ | 15.52 | | | | (2.29 | )% | | | 0.15 | % | | | 2.11 | % | | | 0.01 | %(e) | | $ | 8,811 | | | | 40 | % | |
2017 | | | (0.43 | ) | | $ | 16.48 | | | | 13.95 | % | | | 0.10 | % | | | 3.48 | % | | | 0.61 | % | | $ | 9,153 | | | | 51 | % | |
Class R | |
Six Months Ended
April 30, 2022
(Unaudited) | | | (0.37 | ) | | $ | 18.17 | | | | (6.92 | )% | | | 0.65 | % | | | 3.81 | % | | | 1.90 | % | | $ | 1,151 | | | | 8 | % | |
Year Ended October 31:
2021 | | | (0.51 | ) | | $ | 19.89 | | | | 24.20 | % | | | 0.65 | % | | | 2.69 | % | | | 1.82 | % | | $ | 1,264 | | | | 22 | % | |
2020 | | | (0.60 | ) | | $ | 16.44 | | | | 3.74 | % | | | 0.65 | % | | | 1.18 | % | | | 1.76 | % | | $ | 1,259 | | | | 13 | % | |
2019 | | | (0.48 | ) | | $ | 16.43 | | | | 10.08 | % | | | 0.65 | % | | | 2.30 | % | | | 1.87 | % | | $ | 1,308 | | | | 5 | % | |
2018 | | | (0.54 | ) | | $ | 15.41 | | | | (2.77 | )% | | | 0.65 | % | | | 1.63 | % | | | 1.01 | %(e) | | $ | 1,529 | | | | 40 | % | |
2017 | | | (0.36 | ) | | $ | 16.38 | | | | 13.36 | % | | | 0.56 | % | | | 2.96 | % | | | 1.80 | % | | $ | 1,892 | | | | 51 | % | |
(d) Portfolio turnover is calculated on the basis of the Fund as a whole without distinguishing between the classes of shares issued.
(e) The amount includes a change in accounting estimate. Without this change in accounting estimate, the gross expense ratio would have been 0.67%, 1.54%, 0.42% and 1.43% for Class A, C, I and R, respectively.
See notes to financial statements.
57
Victory Portfolios | | Financial Highlights | |
For a Share Outstanding Throughout Each Period
| | | | Investment Activities | | Distributions to
Shareholders From | |
| | | Net Asset
Value,
Beginning of
Period | | Net
Investment
Income
(Loss)(a) | | Net Realized
and Unrealized
Gains (Losses) | | Total from
Investment
Activities | | Net
Investment
Income | | Total
Distributions | |
Victory INCORE Fund for Income | | | |
Class A | | | |
Six Months Ended
April 30, 2022
(Unaudited) | | $ | 7.92 | | | | 0.02 | | | | (0.37 | ) | | | (0.35 | ) | | | (0.19 | ) | | | (0.19 | ) | |
Year Ended October 31:
2021 | | $ | 8.40 | | | | 0.02 | | | | (0.11 | ) | | | (0.09 | ) | | | (0.39 | ) | | | (0.39 | ) | |
2020 | | $ | 8.56 | | | | 0.06 | | | | 0.17 | | | | 0.23 | | | | (0.39 | ) | | | (0.39 | ) | |
2019 | | $ | 8.56 | | | | 0.18 | | | | 0.28 | | | | 0.46 | | | | (0.46 | ) | | | (0.46 | ) | |
2018 | | $ | 9.09 | | | | 0.15 | (e) | | | (0.23 | )(e) | | | (0.08 | ) | | | (0.45 | ) | | | (0.45 | ) | |
2017 | | $ | 9.63 | | | | 0.10 | | | | (0.15 | ) | | | (0.05 | ) | | | (0.49 | ) | | | (0.49 | ) | |
Class C | | | |
Six Months Ended
April 30, 2022
(Unaudited) | | $ | 7.84 | | | | (0.01 | ) | | | (0.37 | ) | | | (0.38 | ) | | | (0.16 | ) | | | (0.16 | ) | |
Year Ended October 31:
2021 | | $ | 8.31 | | | | (0.05 | ) | | | (0.10 | ) | | | (0.15 | ) | | | (0.32 | ) | | | (0.32 | ) | |
2020 | | $ | 8.48 | | | | — | (f) | | | 0.16 | | | | 0.16 | | | | (0.33 | ) | | | (0.33 | ) | |
2019 | | $ | 8.48 | | | | 0.13 | | | | 0.26 | | | | 0.39 | | | | (0.39 | ) | | | (0.39 | ) | |
2018 | | $ | 9.01 | | | | 0.08 | (e) | | | (0.23 | )(e) | | | (0.15 | ) | | | (0.38 | ) | | | (0.38 | ) | |
2017 | | $ | 9.56 | | | | 0.03 | | | | (0.16 | ) | | | (0.13 | ) | | | (0.42 | ) | | | (0.42 | ) | |
Class I | | | |
Six Months Ended
April 30, 2022
(Unaudited) | | $ | 7.92 | | | | 0.03 | | | | (0.37 | ) | | | (0.34 | ) | | | (0.20 | ) | | | (0.20 | ) | |
Year Ended October 31:
2021 | | $ | 8.39 | | | | 0.04 | | | | (0.10 | ) | | | (0.06 | ) | | | (0.41 | ) | | | (0.41 | ) | |
2020 | | $ | 8.55 | | | | 0.08 | | | | 0.17 | | | | 0.25 | | | | (0.41 | ) | | | (0.41 | ) | |
2019 | | $ | 8.55 | | | | 0.16 | | | | 0.32 | | | | 0.48 | | | | (0.48 | ) | | | (0.48 | ) | |
2018 | | $ | 9.08 | | | | 0.15 | (e) | | | (0.21 | )(e) | | | (0.06 | ) | | | (0.47 | ) | | | (0.47 | ) | |
2017 | | $ | 9.63 | | | | 0.13 | | | | (0.16 | ) | | | (0.03 | ) | | | (0.52 | ) | | | (0.52 | ) | |
* Does not include acquired fund fees and expenses, if any.
(a) Per share net investment income (loss) has been calculated using the average daily shares method.
(b) Not annualized for periods less than one year.
(c) Annualized for periods less than one year.
(d) Portfolio turnover is calculated on the basis of the Fund as a whole without distinguishing between the classes of shares issued.
(e) The Fund restated certain elements of its 2018 financial statements resulting from the identification of a GAAP reclassification error for the Fund's paydown gain (loss) transactions. However, this reclassification had no impact on the Fund's net assets, NAV, performance, or taxable distributions paid and reported to shareholders for the fiscal and tax years ended 2018.
(f) Amount is less than $0.005 per share.
See notes to financial statements.
58
Victory Portfolios | | Financial Highlights — continued | |
For a Share Outstanding Throughout Each Period
| | | | | Ratios to Average Net Assets | | Supplemental Data | |
| | | Net Asset
Value,
End of
Period | | Total
Return
(Excludes
Sales
Charge)(b) | | Net
Expenses*(c) | | Net
Investment
Income
(Loss)(c) | | Gross
Expenses*(c) | | Net Assets,
End of
Period
(000's) | | Portfolio
Turnover(b)(d) | |
Victory INCORE Fund for Income | |
Class A | |
Six Months Ended
April 30, 2022
(Unaudited) | | $ | 7.38 | | | | (4.49 | )% | | | 0.91 | % | | | 0.47 | % | | | 0.94 | % | | $ | 106,953 | | | | 19 | % | |
Year Ended October 31:
2021 | | $ | 7.92 | | | | (1.14 | )% | | | 0.91 | % | | | 0.25 | % | | | 0.92 | % | | $ | 128,802 | | | | 27 | % | |
2020 | | $ | 8.40 | | | | 2.75 | % | | | 0.91 | % | | | 0.75 | % | | | 0.92 | % | | $ | 151,236 | | | | 55 | % | |
2019 | | $ | 8.56 | | | | 5.50 | % | | | 0.92 | % | | | 2.12 | % | | | 0.94 | % | | $ | 136,570 | | | | 29 | % | |
2018 | | $ | 8.56 | | | | (0.91 | )% | | | 0.92 | % | | | 1.64 | %(e) | | | 0.93 | % | | $ | 153,574 | | | | 27 | % | |
2017 | | $ | 9.09 | | | | (0.51 | )% | | | 0.88 | % | | | 1.08 | % | | | 0.88 | % | | $ | 224,822 | | | | 30 | % | |
Class C | |
Six Months Ended
April 30, 2022
(Unaudited) | | $ | 7.30 | | | | (5.02 | )% | | | 1.71 | % | | | (0.34 | )% | | | 1.84 | % | | $ | 7,669 | | | | 19 | % | |
Year Ended October 31:
2021 | | $ | 7.84 | | | | (1.81 | )% | | | 1.71 | % | | | (0.62 | )% | | | 1.79 | % | | $ | 10,066 | | | | 27 | % | |
2020 | | $ | 8.31 | | | | 1.85 | % | | | 1.71 | % | | | (0.01 | )% | | | 1.74 | % | | $ | 20,801 | | | | 55 | % | |
2019 | | $ | 8.48 | | | | 4.72 | % | | | 1.72 | % | | | 1.53 | % | | | 1.73 | % | | $ | 22,541 | | | | 29 | % | |
2018 | | $ | 8.48 | | | | (1.69 | )% | | | 1.70 | % | | | 0.94 | %(e) | | | 1.71 | % | | $ | 31,976 | | | | 27 | % | |
2017 | | $ | 9.01 | | | | (1.41 | )% | | | 1.67 | % | | | 0.29 | % | | | 1.67 | % | | $ | 50,316 | | | | 30 | % | |
Class I | |
Six Months Ended
April 30, 2022
(Unaudited) | | $ | 7.38 | | | | (4.37 | )% | | | 0.64 | % | | | 0.73 | % | | | 0.69 | % | | $ | 300,973 | | | | 19 | % | |
Year Ended October 31:
2021 | | $ | 7.92 | | | | (0.77 | )% | | | 0.64 | % | | | 0.48 | % | | | 0.67 | % | | $ | 385,332 | | | | 27 | % | |
2020 | | $ | 8.39 | | | | 3.01 | % | | | 0.64 | % | | | 0.95 | % | | | 0.66 | % | | $ | 590,749 | | | | 55 | % | |
2019 | | $ | 8.55 | | | | 5.79 | % | | | 0.64 | % | | | 1.84 | % | | | 0.65 | % | | $ | 447,735 | | | | 29 | % | |
2018 | | $ | 8.55 | | | | (0.64 | )% | | | 0.63 | % | | | 1.69 | %(e) | | | 0.63 | % | | $ | 331,338 | | | | 27 | % | |
2017 | | $ | 9.08 | | | | (0.34 | )% | | | 0.61 | % | | | 1.34 | % | | | 0.61 | % | | $ | 520,056 | | | | 30 | % | |
(continues on next page)
See notes to financial statements.
59
Victory Portfolios | | Financial Highlights | |
For a Share Outstanding Throughout Each Period
| | | | | Investment Activities | | Distributions to
Shareholders From | |
| | | Net Asset
Value,
Beginning of
Period | | Net
Investment
Income
(Loss)(a) | | Net Realized
and Unrealized
Gains (Losses) | | Total from
Investment
Activities | | Net
Investment
Income | | Total
Distributions | |
Victory INCORE Fund for Income | | | |
Class R | | | |
Six Months Ended
April 30, 2022
(Unaudited) | | $ | 7.93 | | | | 0.02 | | | | (0.37 | ) | | | (0.35 | ) | | | (0.19 | ) | | | (0.19 | ) | |
Year Ended October 31:
2021 | | $ | 8.40 | | | | 0.02 | | | | (0.10 | ) | | | (0.08 | ) | | | (0.39 | ) | | | (0.39 | ) | |
2020 | | $ | 8.56 | | | | 0.06 | | | | 0.17 | | | | 0.23 | | | | (0.39 | ) | | | (0.39 | ) | |
2019 | | $ | 8.57 | | | | 0.18 | | | | 0.27 | | | | 0.45 | | | | (0.46 | ) | | | (0.46 | ) | |
2018 | | $ | 9.09 | | | | 0.15 | (e) | | | (0.22 | )(e) | | | (0.07 | ) | | | (0.45 | ) | | | (0.45 | ) | |
2017 | | $ | 9.64 | | | | 0.10 | | | | (0.16 | ) | | | (0.06 | ) | | | (0.49 | ) | | | (0.49 | ) | |
Class R6 | | | |
Six Months Ended
April 30, 2022
(Unaudited) | | $ | 7.91 | | | | 0.03 | | | | (0.38 | ) | | | (0.35 | ) | | | (0.20 | ) | | | (0.20 | ) | |
Year Ended October 31:
2021 | | $ | 8.38 | | | | 0.04 | | | | (0.10 | ) | | | (0.06 | ) | | | (0.41 | ) | | | (0.41 | ) | |
2020 | | $ | 8.54 | | | | 0.08 | | | | 0.18 | | | | 0.26 | | | | (0.42 | ) | | | (0.42 | ) | |
2019 | | $ | 8.55 | | | | 0.17 | | | | 0.30 | | | | 0.47 | | | | (0.48 | ) | | | (0.48 | ) | |
2018 | | $ | 9.07 | | | | 0.13 | (e) | | | (0.18 | )(e) | | | (0.05 | ) | | | (0.47 | ) | | | (0.47 | ) | |
2017 | | $ | 9.62 | | | | 0.12 | | | | (0.16 | ) | | | (0.04 | ) | | | (0.51 | ) | | | (0.51 | ) | |
Class Y | | | |
Six Months Ended
April 30, 2022
(Unaudited) | | $ | 7.92 | | | | 0.03 | | | | (0.38 | ) | | | (0.35 | ) | | | (0.20 | ) | | | (0.20 | ) | |
Year Ended October 31:
2021 | | $ | 8.40 | | | | 0.03 | | | | (0.11 | ) | | | (0.08 | ) | | | (0.40 | ) | | | (0.40 | ) | |
2020 | | $ | 8.56 | | | | 0.06 | | | | 0.19 | | | | 0.25 | | | | (0.41 | ) | | | (0.41 | ) | |
2019 | | $ | 8.56 | | | | 0.13 | | | | 0.35 | | | | 0.48 | | | | (0.48 | ) | | | (0.48 | ) | |
2018 | | $ | 9.08 | | | | 0.19 | (e) | | | (0.25 | )(e) | | | (0.06 | ) | | | (0.46 | ) | | | (0.46 | ) | |
2017 | | $ | 9.64 | | | | 0.10 | | | | (0.15 | ) | | | (0.05 | ) | | | (0.51 | ) | | | (0.51 | ) | |
Member Class | | | |
Six Months Ended
April 30, 2022
(Unaudited) | | $ | 7.95 | | | | 0.02 | | | | (0.37 | ) | | | (0.35 | ) | | | (0.20 | ) | | | (0.20 | ) | |
November 3, 2020 (f)
through
October 31, 2021 | | $ | 8.41 | | | | 0.04 | | | | (0.13 | ) | | | (0.09 | ) | | | (0.37 | ) | | | (0.37 | ) | |
* Does not include acquired fund fees and expenses, if any.
(a) Per share net investment income (loss) has been calculated using the average daily shares method.
(b) Not annualized for periods less than one year.
(c) Annualized for periods less than one year.
(d) Portfolio turnover is calculated on the basis of the Fund as a whole without distinguishing between the classes of shares issued.
See notes to financial statements.
60
Victory Portfolios | | Financial Highlights — continued | |
For a Share Outstanding Throughout Each Period (continued)
| | | | | Ratios to Average Net Assets | | Supplemental Data | |
| | | Net Asset
Value,
End of
Period | | Total
Return
(Excludes
Sales
Charge)(b) | | Net
Expenses*(c) | | Net
Investment
Income
(Loss)(c) | | Gross
Expenses*(c) | | Net Assets,
End of
Period
(000's) | | Portfolio
Turnover(b)(d) | |
Victory INCORE Fund for Income | |
Class R | |
Six Months Ended
April 30, 2022
(Unaudited) | | $ | 7.39 | | | | (4.49 | )% | | | 0.91 | % | | | 0.47 | % | | | 0.98 | % | | $ | 19,099 | | | | 19 | % | |
Year Ended October 31:
2021 | | $ | 7.93 | | | | (1.03 | )% | | | 0.91 | % | | | 0.23 | % | | | 0.93 | % | | $ | 23,613 | | | | 27 | % | |
2020 | | $ | 8.40 | | | | 2.74 | % | | | 0.91 | % | | | 0.76 | % | | | 0.92 | % | | $ | 43,684 | | | | 55 | % | |
2019 | | $ | 8.56 | | | | 5.37 | % | | | 0.92 | % | | | 2.04 | % | | | 0.94 | % | | $ | 38,596 | | | | 29 | % | |
2018 | | $ | 8.57 | | | | (0.79 | )% | | | 0.91 | % | | | 1.67 | %(e) | | | 0.91 | % | | $ | 43,405 | | | | 27 | % | |
2017 | | $ | 9.09 | | | | (0.62 | )% | | | 0.88 | % | | | 1.08 | % | | | 0.88 | % | | $ | 58,783 | | | | 30 | % | |
Class R6 | |
Six Months Ended
April 30, 2022
(Unaudited) | | $ | 7.36 | | | | (4.50 | )% | | | 0.63 | % | | | 0.76 | % | | | 0.63 | % | | $ | 27,504 | | | | 19 | % | |
Year Ended October 31:
2021 | | $ | 7.91 | | | | (0.77 | )% | | | 0.63 | % | | | 0.46 | % | | | 0.64 | % | | $ | 29,691 | | | | 27 | % | |
2020 | | $ | 8.38 | | | | 3.06 | % | | | 0.63 | % | | | 0.88 | % | | | 0.64 | % | | $ | 49,009 | | | | 55 | % | |
2019 | | $ | 8.54 | | | | 5.68 | % | | | 0.63 | % | | | 2.00 | % | | | 0.66 | % | | $ | 15,864 | | | | 29 | % | |
2018 | | $ | 8.55 | | | | (0.52 | )% | | | 0.63 | % | | | 1.43 | %(e) | | | 0.69 | % | | $ | 13,741 | | | | 27 | % | |
2017 | | $ | 9.07 | | | | (0.36 | )% | | | 0.63 | % | | | 1.31 | % | | | 0.73 | % | | $ | 9,407 | | | | 30 | % | |
Class Y | |
Six Months Ended
April 30, 2022
(Unaudited) | | $ | 7.37 | | | | (4.49 | )% | | | 0.71 | % | | | 0.66 | % | | | 0.72 | % | | $ | 91,196 | | | | 19 | % | |
Year Ended October 31:
2021 | | $ | 7.92 | | | | (0.94 | )% | | | 0.71 | % | | | 0.40 | % | | | 0.71 | % | | $ | 120,588 | | | | 27 | % | |
2020 | | $ | 8.40 | | | | 2.95 | % | | | 0.71 | % | | | 0.67 | % | | | 0.74 | % | | $ | 186,421 | | | | 55 | % | |
2019 | | $ | 8.56 | | | | 5.72 | % | | | 0.71 | % | | | 1.48 | % | | | 0.79 | % | | $ | 54,950 | | | | 29 | % | |
2018 | | $ | 8.56 | | | | (0.61 | )% | | | 0.71 | % | | | 2.14 | %(e) | | | 0.79 | % | | $ | 31,975 | | | | 27 | % | |
2017 | | $ | 9.08 | | | | (0.53 | )% | | | 0.68 | % | | | 1.09 | % | | | 0.68 | % | | $ | 62,408 | | | | 30 | % | |
Member Class | |
Six Months Ended
April 30, 2022
(Unaudited) | | $ | 7.40 | | | | (4.52 | )% | | | 0.75 | % | | | 0.64 | % | | | 2.97 | % | | $ | 1,212 | | | | 19 | % | |
November 3, 2020 (f)
through
October 31, 2021 | | $ | 7.95 | | | | (1.08 | )% | | | 0.75 | % | | | 0.52 | % | | | 4.45 | % | | $ | 877 | | | | 27 | % | |
(e) The Fund restated certain elements of its 2018 financial statements resulting from the identification of a GAAP reclassification error for the Fund's paydown gain (loss) transactions. However, this reclassification had no impact on the Fund's net assets, NAV, performance, or taxable distributions paid and reported to shareholders for the fiscal and tax years ended 2018.
(f) Commencement of operations.
See notes to financial statements.
61
Victory Portfolios | | Financial Highlights | |
For a Share Outstanding Throughout Each Period
| | | | | Investment Activities | | Distributions to
Shareholders From | |
| | | Net Asset
Value,
Beginning of
Period | | Net
Investment
Income
(Loss)(a) | | Net Realized
and Unrealized
Gains (Losses) | | Total from
Investment
Activities | | Net
Investment
Income | | Net Realized
Gains from
Investments | |
Victory INCORE Investment Grade Convertible Fund | | | |
Class A | | | |
Six Months Ended
April 30, 2022
(Unaudited) | | $ | 19.97 | | | | 0.12 | | | | (0.89 | ) | | | (0.77 | ) | | | (1.41 | ) | | | (0.33 | ) | |
Year Ended October 31:
2021 | | $ | 17.31 | | | | 0.22 | | | | 3.27 | | | | 3.49 | | | | (0.83 | ) | | | — | | |
2020 | | $ | 17.51 | | | | 0.27 | | | | 0.47 | | | | 0.74 | | | | (0.35 | ) | | | (0.59 | ) | |
2019 | | $ | 16.22 | | | | 0.21 | | | | 1.84 | | | | 2.05 | | | | (0.28 | ) | | | (0.48 | ) | |
2018 | | $ | 16.53 | | | | 0.30 | | | | 0.01 | | | | 0.31 | | | | (0.53 | ) | | | (0.09 | ) | |
2017 | | $ | 13.72 | | | | 0.17 | | | | 2.89 | | | | 3.06 | | | | (0.25 | ) | | | — | | |
Class I | | | |
Six Months Ended
April 30, 2022
(Unaudited) | | $ | 19.98 | | | | 0.16 | | | | (0.91 | ) | | | (0.75 | ) | | | (1.44 | ) | | | (0.33 | ) | |
Year Ended October 31:
2021 | | $ | 17.32 | | | | 0.31 | | | | 3.27 | | | | 3.58 | | | | (0.92 | ) | | | — | | |
2020 | | $ | 17.50 | | | | 0.33 | | | | 0.49 | | | | 0.82 | | | | (0.41 | ) | | | (0.59 | ) | |
2019 | | $ | 16.21 | | | | 0.31 | | | | 1.83 | | | | 2.14 | | | | (0.37 | ) | | | (0.48 | ) | |
2018 | | $ | 16.53 | | | | 0.36 | | | | (0.01 | ) | | | 0.35 | | | | (0.58 | ) | | | (0.09 | ) | |
2017 | | $ | 13.71 | | | | 0.22 | | | | 2.90 | | | | 3.12 | | | | (0.30 | ) | | | — | | |
Member Class | | | |
Six Months Ended
April 30, 2022
(Unaudited) | | $ | 20.71 | | | | 0.14 | | | | (0.93 | ) | | | (0.79 | ) | | | (1.43 | ) | | | (0.33 | ) | |
November 3, 2020 (e)
through
October 31, 2021 | | $ | 17.36 | | | | 0.26 | | | | 3.31 | | | | 3.57 | | | | (0.22 | ) | | | — | | |
* Does not include acquired fund fees and expenses, if any.
(a) Per share net investment income (loss) has been calculated using the average daily shares method.
(b) Not annualized for periods less than one year.
(c) Annualized for periods less than one year.
(d) Portfolio turnover is calculated on the basis of the Fund as a whole without distinguishing between the classes of shares issued.
(e) Commencement of operations.
See notes to financial statements.
62
Victory Portfolios | | Financial Highlights — continued | |
For a Share Outstanding Throughout Each Period
| | | | | Ratios to Average Net Assets | | Supplemental Data | |
| | | Total
Distributions | | Net Asset
Value,
End of
Period | | Total
Return
(Excludes
Sales
Charge)(b) | | Net
Expenses*(c) | | Net
Investment
Income
(Loss)(c) | | Gross
Expenses*(c) | | Net Assets,
End of
Period
(000's) | | Portfolio
Turnover(b)(d) | |
Victory INCORE Investment Grade Convertible Fund | |
Class A | |
Six Months Ended
April 30, 2022
(Unaudited) | | | (1.74 | ) | | $ | 17.46 | | | | (4.23 | )% | | | 1.24 | % | | | 1.34 | % | | | 1.24 | % | | $ | 20,295 | | | | 10 | % | |
Year Ended October 31:
2021 | | | (0.83 | ) | | $ | 19.97 | | | | 20.62 | % | | | 1.39 | % | | | 1.12 | % | | | 1.41 | % | | $ | 21,644 | | | | 28 | % | |
2020 | | | (0.94 | ) | | $ | 17.31 | | | | 4.43 | % | | | 1.38 | % | | | 1.63 | % | | | 1.38 | % | | $ | 16,571 | | | | 34 | % | |
2019 | | | (0.76 | ) | | $ | 17.51 | | | | 13.35 | % | | | 1.49 | % | | | 1.31 | % | | | 1.49 | % | | $ | 16,349 | | | | 35 | % | |
2018 | | | (0.62 | ) | | $ | 16.22 | | | | 1.87 | % | | | 1.27 | % | | | 1.79 | % | | | 1.27 | % | | $ | 14,268 | | | | 41 | % | |
2017 | | | (0.25 | ) | | $ | 16.53 | | | | 22.57 | % | | | 1.30 | % | | | 1.12 | % | | | 1.30 | % | | $ | 33,040 | | | | 39 | % | |
Class I | |
Six Months Ended
April 30, 2022
(Unaudited) | | | (1.77 | ) | | $ | 17.46 | | | | (4.09 | )% | | | 0.90 | % | | | 1.71 | % | | | 0.90 | % | | $ | 430,245 | | | | 10 | % | |
Year Ended October 31:
2021 | | | (0.92 | ) | | $ | 19.98 | | | | 21.19 | % | | | 0.93 | % | | | 1.59 | % | | | 0.93 | % | | $ | 403,122 | | | | 28 | % | |
2020 | | | (1.00 | ) | | $ | 17.32 | | | | 4.91 | % | | | 0.96 | % | | | 1.98 | % | | | 0.96 | % | | $ | 276,923 | | | | 34 | % | |
2019 | | | (0.85 | ) | | $ | 17.50 | | | | 13.99 | % | | | 0.96 | % | | | 1.87 | % | | | 0.96 | % | | $ | 263,981 | | | | 35 | % | |
2018 | | | (0.67 | ) | | $ | 16.21 | | | | 2.16 | % | | | 0.94 | % | | | 2.17 | % | | | 0.94 | % | | $ | 126,871 | | | | 41 | % | |
2017 | | | (0.30 | ) | | $ | 16.53 | | | | 23.07 | % | | | 0.94 | % | | | 1.47 | % | | | 0.94 | % | | $ | 78,879 | | | | 39 | % | |
Member Class | |
Six Months Ended
April 30, 2022
(Unaudited) | | | (1.76 | ) | | $ | 18.16 | | | | (4.16 | )% | | | 1.10 | % | | | 1.51 | % | | | 3.92 | % | | $ | 996 | | | | 10 | % | |
November 3, 2020 (e)
through
October 31, 2021 | | | (0.22 | ) | | $ | 20.71 | | | | 20.63 | % | | | 1.10 | % | | | 1.30 | % | | | 9.99 | % | | $ | 512 | | | | 28 | % | |
See notes to financial statements.
63
Victory Portfolios | | Notes to Financial Statements
April 30, 2022 | |
(Unaudited)
1. Organization:
Victory Portfolios (the "Trust") is organized as a Delaware statutory trust and the Trust is registered under the Investment Company Act of 1940, as amended (the "1940 Act"), as an open-end investment company. The Trust is comprised of 40 funds and is authorized to issue an unlimited number of shares, which are units of beneficial interest with a par value of $0.001 per share.
The accompanying financial statements are those of the following seven Funds (collectively, the "Funds" and individually, a "Fund"). Each Fund is classified as diversified under the 1940 Act.
Funds (Legal Name) | | Funds (Short Name) | | Investment Share
Classes Offered | |
Victory Diversified Stock Fund | | Diversified Stock Fund | | A, C, I, R, R6, and Y | |
Victory NewBridge Large Cap
Growth Fund | | NewBridge Large Cap
Growth Fund | | A, C, I, and Y
| |
Victory Special Value Fund | | Special Value Fund | | A, C, I, R, and Y | |
Victory THB US Small
Opportunities Fund | | THB US Small Opportunities Fund
| | A and I
| |
Victory Strategic Allocation Fund | | Strategic Allocation Fund | | A, C, I, and R | |
Victory INCORE Fund for Income
| | INCORE Fund for Income
| | A, C, I, R, R6, Y, and
Member Class | |
Victory INCORE Investment Grade
Convertible Fund | | INCORE Investment Grade
Convertible Fund | | A, I, and
Member Class | |
On February 2, 2021, the Board of Trustees (the "Board") of the Trust approved an Agreement and Plan of Reorganization ("Reorganization"), dated February 26, 2021, which provided for the newly formed Victory THB US Small Opportunities Fund ("Acquiring Fund") and its tax-free exchange of shares of the THB Asset Management Microcap Fund's ("Predecessor Fund") shares, valued at the Predecessor Fund's net assets for the exact same shares and value of the Acquiring Fund's shares. Investor Class and Institutional Class shares of the Predecessor Fund were exchanged for Class A and Class I shares, respectively, of the Acquiring Fund. The Acquiring Fund commenced operations on May 3, 2021, upon the completion of the Reorganization, which occurred as of the close of business on April 30, 2021.
Each class of shares of a Fund has substantially identical rights and privileges except with respect to sales charges, fees paid under distribution plans, expenses allocable exclusively to each class of shares, voting rights on matters solely affecting a single class of shares, and the exchange privilege of each class of shares.
Strategic Allocation Fund is a "fund of funds" in that it invests in a selection of affiliated mutual funds and exchange-traded funds ("ETFs") managed by Victory Capital Management Inc. ("VCM" or the Adviser), an affiliate of the Fund.
Strategic Allocation Fund may rely on various exemptions contained in 1940 Act and in exemptive rules or orders thereunder issued by the Securities and Exchange Commission ("SEC") that permit funds, subject to certain conditions, to invest in one or more ETFs and certain other types of investment companies in amounts that exceed limits set forth in the 1940 Act that would otherwise be applicable.
Under the Trust's organizational documents, its officers and trustees are indemnified against certain liabilities arising out of the performance of their duties to the Funds. In addition, in the normal course of business, the Funds enter into contracts with their vendors and others that provide for general indemnifications. The Funds' maximum exposure under these arrangements is unknown, as this would involve future claims that may be made against the Funds. However, based on experience, the Funds expect that risk of loss to be remote.
2. Significant Accounting Policies:
The following is a summary of significant accounting policies followed by the Trust in the preparation of its financial statements. The policies are in conformity with U.S. Generally Accepted Accounting Principles ("GAAP"). The preparation of financial statements in accordance with GAAP requires management to make estimates and assumptions that affect the reported amounts of assets and liabilities and disclosure of contingent assets and liabilities at the date of the financial statements and
64
Victory Portfolios | | Notes to Financial Statements — continued
April 30, 2022 | |
(Unaudited)
the reported amounts of income and expenses for the period. Actual results could differ from those estimates. The Funds follow the specialized accounting and reporting requirements under GAAP that are applicable to investment companies under Accounting Standards Codification Topic 946.
Investment Valuation:
The Funds record investments at fair value. Fair value is defined as the price that would be received to sell an asset or paid to transfer a liability in an orderly transaction between market participants at the measurement date.
The valuation techniques described below maximize the use of observable inputs and minimize the use of unobservable inputs in determining fair value. The inputs used for valuing the Funds' investments are summarized in the three broad levels listed below:
• Level 1 — quoted prices in active markets for identical securities
• Level 2 — other significant observable inputs (including quoted prices for similar securities or interest rates applicable to those securities, etc.)
• Level 3 — significant unobservable inputs (including the Funds' own assumptions in determining the fair value of investments)
Changes in valuation techniques may result in transfers in or out of an assigned level within the disclosure hierarchy. The inputs or methodologies used for valuation techniques are not necessarily an indication of the risk associated with entering into those investments.
The Adviser has established the Pricing and Liquidity Committee (the "Committee"), and subject to the Board's oversight, the Committee administers and oversees the Funds' valuation policies and procedures, which are approved by the Board.
Portfolio securities listed or traded on securities exchanges, including ETFs, are valued at the closing price on the exchange or system where the security is principally traded, if available, or at the Nasdaq Official Closing Price. If there have been no sales for that day on the exchange or system, then a security is valued at the last available bid quotation on the exchange or system where the security is principally traded. In each of these situations, valuations are typically categorized as Level 1 in the fair value hierarchy.
Investments in open-end investment companies are valued at their net asset value ("NAV"). These valuations are typically categorized as Level 1 in the fair value hierarchy.
Investments in the underlying affiliated Funds of the Strategic Allocation Fund, and other open-end investment companies, other than ETFs, are valued at their NAV at the end of each business day and are typically categorized in Level 1 of the fair value hierarchy.
The underlying affiliated Funds of the Strategic Allocation Fund, have specific valuation procedures. In the event that price quotations or valuations are not readily available, are not reflective of market value, or a significant event has been recognized in relation to a security or class of securities, the securities are valued in good faith by the Committee in accordance with valuation procedures approved by the Board. The effect of fair value pricing is that securities may not be priced on the basis of quotations from the primary market in which they are traded and the actual price realized from the sale of a security may differ materially from the fair value price. Valuing these securities at fair value is intended to cause the Fund's NAV to be more reliable than it otherwise would be.
Debt securities are valued each business day by a pricing service approved by the Board. The approved pricing service uses the evaluated bid or the last sale price to value securities. Debt obligations maturing within 60 days may be valued at amortized cost, provided that the amortized cost represents the fair value of such securities. These valuations are typically categorized as Level 2 in the fair value hierarchy.
In the event that price quotations or valuations are not readily available, investments are valued at fair value in accordance with procedures established by and under the general supervision and responsibility of the Board. These valuations are typically categorized as Level 2 or Level 3 in the fair value hierarchy, based on the observability of inputs used to determine the fair value. The effect of fair value pricing is that securities may not be priced on the basis of quotations from the primary market
65
Victory Portfolios | | Notes to Financial Statements — continued
April 30, 2022 | |
(Unaudited)
in which they are traded and the actual price realized from the sale of a security may differ materially from the fair value price. Valuing these securities at fair value is intended to cause the Fund's NAV to be more reliable than it otherwise would be.
A summary of the valuations as of April 30, 2022, is included in the table below while the breakdown, by category, of investments is disclosed on the Schedules of Portfolio Investments (amounts in thousands):
| | | Level 1 | | Level 2 | | Level 3 | | Total | |
Diversified Stock Fund | |
Common Stocks | | $ | 272,613 | | | $ | — | | | $ | — | | | $ | 272,613 | | |
Exchange-Traded Funds | | | 6,445 | | | | — | | | | — | | | | 6,445 | | |
Collateral for Securities Loaned | | | 5,362 | | | | — | | | | — | | | | 5,362 | | |
Total | | $ | 284,420 | | | $ | — | | | $ | — | | | $ | 284,420 | | |
NewBridge Large Cap Growth Fund | |
Common Stocks | | $ | 10,046 | | | $ | — | | | $ | — | | | $ | 10,046 | | |
Total | | $ | 10,046 | | | $ | — | | | $ | — | | | $ | 10,046 | | |
Special Value Fund | |
Common Stocks | | $ | 41,001 | | | $ | — | | | $ | — | | | $ | 41,001 | | |
Exchange-Traded Funds | | | 1,095 | | | | — | | | | — | | | | 1,095 | | |
Total | | $ | 42,096 | | | $ | — | | | $ | — | | | $ | 42,096 | | |
THB US Small Opportunities Fund | |
Common Stocks | | $ | 72,342 | | | $ | — | | | $ | — | | | $ | 72,342 | | |
Collateral for Securities Loaned | | | 1,440 | | | | — | | | | — | | | | 1,440 | | |
Total | | $ | 73,782 | | | $ | — | | | $ | — | | | $ | 73,782 | | |
Strategic Allocation Fund | |
Affiliated Exchange-Traded Funds | | $ | 1,976 | | | $ | — | | | $ | — | | | $ | 1,976 | | |
Affiliated Mutual Funds | | | 24,551 | | | | — | | | | — | | | | 24,551 | | |
Total | | $ | 26,527 | | | $ | — | | | $ | — | | | $ | 26,527 | | |
INCORE Fund for Income | |
Government National Mortgage Association | | $ | — | | | $ | 444,834 | | | $ | — | | | $ | 444,834 | | |
U.S. Treasury Obligations | | | — | | | | 105,762 | | | | — | | | | 105,762 | | |
Investment Companies | | | 100 | | | | — | | | | — | | | | 100 | | |
Total | | $ | 100 | | | $ | 550,596 | | | $ | — | | | $ | 550,696 | | |
INCORE Investment Grade Convertible Fund | |
Convertible Corporate Bonds | | $ | — | | | $ | 293,208 | | | $ | — | | | $ | 293,208 | | |
| Convertible Preferred Stocks | | | 152,577 | | | | 2,529 | | | | — | | | | 155,106 | | |
Collateral for Securities Loaned | | | 87,000 | | | | — | | | | — | | | | 87,000 | | |
Total | | $ | 239,577 | | | $ | 295,737 | | | $ | — | | | $ | 535,314 | | |
For the six months ended April 30, 2022, there were no transfers in or out of Level 3 in the fair value hierarchy.
Real Estate Investment Trusts ("REITs"):
The Funds may invest in REITs, which report information on the source of their distributions annually. REITs are pooled investment vehicles that invest primarily in income-producing real estate or real-estate related loans or interests (such as mortgages). Certain distributions received from REITs during the year are recorded as realized gains or return of capital as estimated by the Funds or when such information becomes known.
66
Victory Portfolios | | Notes to Financial Statements — continued
April 30, 2022 | |
(Unaudited)
Investment Companies:
Exchange-Traded Funds:
The Funds may invest in ETFs, the shares of which are bought and sold on a securities exchange. An ETF trades like common stock and represents a fixed portfolio of securities often designed to track the performance and dividend yield of a particular domestic or foreign market index. The Funds may purchase shares of an ETF to temporarily gain exposure to a portion of the U.S. or a foreign market while awaiting purchase of underlying securities. The risks of owning an ETF generally reflect the risks of owning the underlying securities they are designed to track, although the lack of liquidity of an ETF could result in it being more volatile. Additionally, ETFs have fees and expenses that reduce their value.
Open-End Funds:
The Funds may invest in portfolios of open-end investment companies. These investment companies value securities in their portfolios for which market quotations are readily available at their market values (generally the last reported sale price) and all other securities and assets at their fair value by the methods established by the board of directors of the underlying funds.
Investment Transactions and Related Income:
Changes in holdings of investments are accounted for no later than one business day following the trade date. For financial reporting purposes, however, investment transactions are accounted for on trade date or the last business day of the reporting period. Interest income is determined on the basis of coupon interest accrued using the effective interest method which adjusts, where applicable, the amortization of premiums or accretion of discounts. Dividend income is recorded on the ex-dividend date. Gains or losses realized on sales of securities are recorded on the identified cost basis. Paydown gains or losses on applicable securities, if any, are recorded as components of Interest income on the Statements of Operations.
Securities Lending:
The Funds, through a Securities Lending Agreement with Citibank, N.A. ("Citibank"), may lend their securities to qualified financial institutions, such as certain broker-dealers and banks, to earn additional income, net of income retained by Citibank. Borrowers are required to initially secure their loans for collateral in the amount of at least 102% of the value of U.S. securities loaned or at least 105% of the value of non-U.S. securities loaned, marked-to-market daily. Any collateral shortfalls associated with increases in the valuation of the securities loaned are generally cured the next business day. The collateral can be received in the form of cash collateral and/or non-cash collateral. Non-cash collateral can include U.S. Government Securities and other securities as permitted by SEC guidelines. The cash collateral is invested in short-term instruments or cash equivalents, primarily open-end investment companies, as noted on the Funds' Schedules of Portfolio Investments. The Funds effectively do not have control of the non-cash collateral and therefore it is not disclosed on the Funds' Schedules of Portfolio Investments. Collateral requirements are determined daily based on the value of the Funds' securities on loan as of the end of the prior business day. During the time portfolio securities are on loan, the borrower will pay the Funds any dividends or interest paid on such securities plus any fee negotiated between the parties to the lending agreement. The Funds also earn a return from the collateral. The Funds pay Citibank various fees in connection with the investment of cash collateral and fees based on the investment income received from securities lending activities. Securities lending income (net of these fees) is disclosed on the Statements of Operations. Loans are terminable upon demand and the borrower must return the loaned securities within the lesser of one standard settlement period or five business days. Although risk is mitigated by the collateral, a Fund could experience a delay in recovering its securities and possible loss of income or value if the borrower fails to return them. In addition, there is a risk that the value of the short-term investments will be less than the amount of cash collateral required to be returned to the borrower.
67
Victory Portfolios | | Notes to Financial Statements — continued
April 30, 2022 | |
(Unaudited)
The Funds' agreement with Citibank does not include master netting provisions. Non-cash collateral received by the Funds may not be sold or repledged, except to satisfy borrower default.
The following table (amounts in thousands) is a summary of the Funds' securities lending transactions as of April 30, 2022.
| | | Value of
Securities on Loan | | Non-Cash Collateral | | Cash Collateral | |
Diversified Stock Fund | | $ | 5,073 | | | $ | — | | | $ | 5,362 | | |
THB US Small Opportunities Fund | | | 1,372 | | | | — | | | | 1,440 | | |
INCORE Investment Grade
Convertible Fund | | | 84,020 | | | | — | | | | 87,000 | | |
Federal Income Taxes:
Each Fund intends to continue to qualify as a regulated investment company by complying with the provisions available to certain investment companies, as defined in applicable sections of the Internal Revenue Code, and to make distributions of net investment income and net realized gains sufficient to relieve it from all, or substantially all, federal income taxes. Accordingly, no provision for federal income taxes is required in the financial statements. The Funds have a tax year end of October 31.
For the six months ended April 30, 2022, the Funds did not incur any income tax, interest, or penalties, and have recorded no liability for net unrecognized tax benefits relating to uncertain tax positions.
Management of the Funds has reviewed tax positions taken in tax years that remain subject to examination by all major tax jurisdictions, including federal (i.e., the last four tax years, which includes the current fiscal tax year end). Management believes that there is no tax liability resulting from unrecognized tax benefits related to uncertain tax positions taken.
Allocations:
Expenses directly attributable to a Fund are charged to that Fund, while expenses that are attributable to more than one fund in the Trust, or jointly with an affiliated trust, are allocated among the respective funds in the Trust and/or an affiliated trust based upon net assets or another appropriate basis.
Income, expenses (other than class-specific expenses such as transfer agent fees, state registration fees, printing fees, and 12b-1 fees), and realized and unrealized gains or losses on investments are allocated to each class of shares based on its relative net assets on the date income is earned or expenses and realized and unrealized gains and losses are incurred.
Redemption Fees:
The Funds currently do not receive a redemption fee. Prior to acquisition, the Predecessor Fund retained redemption fees of 2.00% on redemptions of fund shares held for less than 30 days. Class I (formerly Institutional Class shares) and Class A (formerly Investor Class shares) had approximately $2 thousand and $1 thousand in redemptions fees, respectively, as presented on the Statements of Changes in Net Assets.
3. Purchases and Sales:
Purchases and sales of securities (excluding securities maturing less than one year from acquisition) for the six months ended April 30, 2022, were as follows (amounts in thousands):
| | | Excluding
U.S. Government Securities | | U.S. Government Securities | |
| | | Purchases | | Sales | | Purchases | | Sales | |
Diversified Stock Fund | | $ | 119,045 | | | $ | 136,008 | | | $ | — | | | $ | — | | |
NewBridge Large Cap Growth Fund | | | 3,156 | | | | 5,947 | | | | — | | | | — | | |
Special Value Fund | | | 19,691 | | | | 23,264 | | | | — | | | | — | | |
THB US Small Opportunities Fund | | | 24,645 | | | | 26,162 | | | | — | | | | — | | |
68
Victory Portfolios | | Notes to Financial Statements — continued
April 30, 2022 | |
(Unaudited)
| | | Excluding
U.S. Government Securities | | U.S. Government Securities | |
| | | Purchases | | Sales | | Purchases | | Sales | |
Strategic Allocation Fund | | $ | 2,389 | | | $ | 2,234 | | | $ | — | | | $ | — | | |
INCORE Fund for Income | | | — | | | | — | | | | 111,832 | | | | 229,590 | | |
INCORE Investment Grade
Convertible Fund | | | 109,037 | | | | 42,958 | | | | — | | | | — | | |
4. Fees and Transactions with Affiliates and Related Parties:
Investment Advisory Fees:
Investment advisory services are provided to the Funds by the Adviser, which is a New York corporation registered as an investment adviser with the SEC. The Adviser is an indirect wholly owned subsidiary of Victory Capital Holdings, Inc., a publicly traded Delaware corporation, and a wholly owned direct subsidiary of Victory Capital Operating, LLC.
Under the terms of the Investment Advisory Agreement, the Adviser is entitled to receive fees based on a percentage of the average daily net assets of each Fund. The rates at which the Adviser is paid by each Fund are included in the table below.
| | | Adviser Fee Tier Rates | |
| | | Up to $800 million | | $800 million – $2.4 billion | | Over $2.4 billion | |
Diversified Stock Fund | | | 0.65 | % | | | 0.60 | % | | | 0.55 | % | |
| | | Up to $400 million | | $400 million – $800 million | | Over $800 million | |
NewBridge Large Cap Growth
Fund | | | 0.75 | % | | | 0.65 | % | | | 0.60 | % | |
Special Value Fund | | | 0.75 | % | | | 0.65 | % | | | 0.60 | % | |
| | | Flat Rate | | | | | |
THB US Small Opportunities Fund | | | 1.15 | % | | | | | | | | | |
Strategic Allocation Fund | | | 0.10 | % | | | | | | | | | |
| | | Up to $400 million | | $400 million – $800 million | | Over $800 million | |
INCORE Fund for Income | | | 0.50 | % | | | 0.45 | % | | | 0.40 | % | |
INCORE Investment Grade
Convertible Fund | | | 0.75 | % | | | 0.65 | % | | | 0.60 | % | |
Amounts incurred and paid to VCM for the six months ended April 30, 2022, are reflected on the Statements of Operations as Investment advisory fees.
Administration and Servicing Fees:
VCM also serves as the Funds' administrator and fund accountant. Under the Administration and Fund Accounting Agreement, VCM is entitled to receive fees based on a percentage of the average daily net assets of the Trust, Victory Variable Insurance Funds and Victory Portfolios II. The tiered rates at which VCM is paid by the Funds are shown in the table below:
Net Assets | |
Up to $15 billion | | $15 billion – $30 billion | | Over $30 billion | |
| | 0.08 | %, plus | | | 0.05 | %, plus | | | 0.04 | % | |
Amounts incurred for the six months ended April 30, 2022, are reflected on the Statements of Operations as Administration fees.
Citi Fund Services Ohio, Inc. ("Citi"), an affiliate of Citibank, acts as sub-administrator and sub-fund accountant to the Funds pursuant to the Sub-Administration and Sub-Fund Accounting Services Agreement between VCM and Citi. VCM pays Citi a fee for providing these services. The Trust reimburses VCM and Citi for out-of-pocket expenses incurred in providing these services and certain other expenses
69
Victory Portfolios | | Notes to Financial Statements — continued
April 30, 2022 | |
(Unaudited)
specifically allocated to the Funds. Amounts incurred for the six months ended April 30, 2022, are reflected on the Statements of Operations as Sub-Administration fees.
The Funds (as part of the Trust) have entered into an agreement with the Adviser to provide compliance services, pursuant to which the Adviser furnishes its compliance personnel, including the services of the Chief Compliance Officer ("CCO"), and other resources reasonably necessary to provide the Trust with compliance oversight services related to the design, administration, and oversight of a compliance program for the Trust in accordance with Rule 38a-1 under the 1940 Act. The CCO is an employee of the Adviser, which pays the compensation of the CCO and support staff. The funds in the Trust, Victory Variable Insurance Funds, Victory Portfolios II and USAA Mutual Funds (collectively, the "Victory Funds Complex"), in aggregate, compensate the Adviser for these services. Amounts incurred for the six months ended April 30, 2022, are reflected on the Statements of Operations as Compliance fees.
Transfer Agency Fees:
FIS Investor Services, LLC ("FIS") serves as the Funds' transfer agent. Under the Transfer Agent Agreement, the Trust pays FIS a fee for its services and reimburses FIS for all of their reasonable out-of-pocket expenses incurred in providing these services. Amounts incurred for the six months ended April 30, 2022, are reflected on the Statements of Operations as Transfer agent fees.
Victory Capital Transfer Agency, Inc., an affiliate of the Adviser, serves as sub-transfer agent for the Member Class. Victory Capital Transfer Agency, Inc. receives no fee or other compensation for these services.
Distributor/Underwriting Services:
Victory Capital Services, Inc. (the "Distributor"), an affiliate of the Adviser, serves as Distributor for the continuous offering of the shares of the Funds pursuant to a Distribution Agreement between the Distributor and the Trust.
Pursuant to the Distribution and Service Plans adopted in accordance with Rule 12b-1 under the 1940 Act, the Distributor may receive a monthly distribution and service fee up to the annual rate shown in the table below:
| | | Class A | | Class C | | Class R | |
Diversified Stock Fund | | | 0.25 | % | | | 1.00 | % | | | 0.50 | % | |
NewBridge Large Cap Growth Fund | | | 0.25 | % | | | 1.00 | % | | | N/A | | |
Special Value Fund | | | 0.25 | % | | | 1.00 | % | | | 0.50 | % | |
THB US Small Opportunities Fund | | | 0.25 | % | | | N/A | | | | N/A | | |
Strategic Allocation Fund | | | 0.25 | % | | | 1.00 | % | | | 0.50 | % | |
INCORE Fund for Income | | | 0.25 | % | | | 1.00 | % | | | 0.25 | % | |
INCORE Investment Grade Convertible Fund | | | 0.25 | % | | | N/A | | | | N/A | | |
The distribution and service fees paid to the Distributor may be used by the Distributor to pay for activities primarily intended to result in the sale of Class A, Class C, and Class R. Amounts incurred for the six months ended April 30, 2022, are reflected on the Statements of Operations as 12b-1 fees.
In addition, the Distributor is entitled to receive commissions in connection with sales of Class A. For the six months ended April 30, 2022, the Distributor received approximately $10 thousand from commissions earned in connection with sales of Class A.
Other Fees:
Citibank serves as the Funds' custodian. The Funds pay Citibank a fee for providing these services. Amounts incurred for the six months ended April 30, 2022, are reflected on the Statements of Operations as Custodian fees.
Sidley Austin LLP provides legal services to the Trust.
The Adviser has entered into expense limitation agreements with certain Funds. Under the terms of the agreements, the Adviser has agreed to waive fees or reimburse certain expenses to the extent that
70
Victory Portfolios | | Notes to Financial Statements — continued
April 30, 2022 | |
(Unaudited)
ordinary operating expenses incurred by certain classes of a Fund in any fiscal year exceed the expense limit for such classes of the Fund. Such excess amounts will be the liability of the Adviser. Acquired fund fees and expenses, interest, taxes, brokerage commissions, other expenditures which are capitalized in accordance with GAAP, and other extraordinary expenses not incurred in the ordinary course of a Fund's business are excluded from the expense limits. As of April 30, 2022, the expense limits (excluding voluntary waivers) are as follows:
| | | In Effect Until February 28, 2023 | |
| | | Class A | | Class C | | Class I | | Class R | | Class R6 | | Class Y | | Member
Class | |
Diversified Stock Fund | | | N/A | | | | 2.02 | % | | | 0.83 | % | | | N/A | | | | 0.78 | % | | | 0.86 | % | | | N/A | | |
NewBridge Large Cap
Growth Fund | | | 1.36 | % | | | 2.10 | % | | | 0.95 | % | | | N/A | | | | N/A | | | | 1.02 | % | | | N/A | | |
Special Value Fund | | | N/A | | | | 2.20 | % | | | 1.15 | % | | | N/A | | | | N/A | | | | 1.10 | % | | | N/A | | |
THB US Small
Opportunities Fund | | | 1.70 | %(a) | | | N/A | | | | 1.25 | %(a) | | | N/A | | | | N/A | | | | N/A | | | | N/A | | |
Strategic Allocation Fund | | | 0.40 | % | | | 1.15 | % | | | 0.15 | % | | | 0.65 | % | | | N/A | | | | N/A | | | | N/A | | |
INCORE Fund for Income | | | 0.91 | % | | | 1.71 | % | | | 0.64 | % | | | 0.91 | % | | | 0.63 | % | | | 0.71 | % | | | 0.75 | % | |
INCORE Investment Grade
Convertible Fund | | | 1.39 | % | | | N/A | | | | N/A | | | | N/A | | | | N/A | | | | N/A | | | | 1.10 | % | |
(a) In effect until May 3, 2023.
Under the terms of the expense limitation agreements, as amended May 1, 2021, the Funds (except Strategic Allocation Fund) have agreed to repay fees and expenses that were waived or reimbursed by the Adviser for a period of up to three years (thirty-six (36) months) after the waiver or reimbursement took place, subject to the lesser of any operating expense limits in effect at the time of: (a) the original waiver or expense reimbursement; or (b) the recoupment, after giving effect to the recoupment amount. Prior to May 1, 2021, the Funds were permitted to recoup fees waived and expenses reimbursed for up to three years after the fiscal year in which the waiver or reimbursement took place, subject to the limitations above. This change did not have any effect on the amounts previously reported for recoupment.
As of April 30, 2022, the following amounts are available to be repaid to the Adviser (amounts in thousands). The Funds have not recorded any amounts available to be repaid as a liability due to an assessment that such repayments are not probable at April 30, 2022.
| | | Expires
2022 | | Expires
2023 | | Expires
2024 | | Expires
2025 | | Total | |
Diversified Stock Fund | | $ | 15 | | | $ | 36 | | | $ | 28 | | | $ | 13 | | | $ | 92 | | |
NewBridge Large Cap Growth Fund | | | 40 | | | | 58 | | | | 63 | | | | 37 | | | | 198 | | |
Special Value Fund | | | 17 | | | | 28 | | | | 23 | | | | 10 | | | | 78 | | |
| THB US Small Opportunities Fund | | | — | | | | — | | | | 13 | | | | 71 | | | | 84 | | |
INCORE Fund for Income | | | 37 | | | | 105 | | | | 197 | | | | 129 | | | | 468 | | |
INCORE Investment Grade
Convertible Fund | | | — | | | | — | | | | 23 | | | | 10 | | | | 33 | | |
The Adviser may voluntarily waive or reimburse additional fees to assist the Funds in maintaining competitive expense ratios. Voluntary waivers and reimbursements applicable to the Funds are not available to be recouped at a future time. For the six months ended April 30, 2022, the Adviser voluntarily waived the following amounts (amounts in thousands):
Certain officers and/or interested trustees of the Funds are also officers and/or employees of the Adviser, administrator, fund accountant, sub-administrator, sub-fund accountant, custodian, legal counsel, and Distributor.
71
Victory Portfolios | | Notes to Financial Statements — continued
April 30, 2022 | |
(Unaudited)
5. Risks:
The Funds may be subject to other risks in addition to these identified risks.
Convertible Securities Risk — Convertible securities rank senior to the issuer's common stock, but may be subordinate to senior debt obligations. In part, the total return for a convertible security may depend upon the performance of the underlying stock into which it can be converted. Synthetic convertibles may respond differently to market fluctuations than traditional convertible securities. They are also subject to counterparty risk.
Equity Risk — The value of the equity securities in which a Fund invests may decline in response to developments affecting individual companies and/or general economic conditions in the United States or abroad. A company's earnings or dividends may not increase as expected (or may decline) because of poor management, competitive pressures, reliance on particular suppliers or geographical regions, labor problems or shortages, corporate restructurings, fraudulent disclosures, man-made or natural disasters, military confrontations or wars, terrorism, public health crises, or other events, conditions and factors. Price changes may be temporary or last for extended periods.
Market Risk — Overall market risks may affect the value of the Fund. Domestic and international factors such as political events, war, terrorism, trade disputes, inflation rates, interest rate levels and other fiscal and monetary policy changes, cybersecurity incidents, pandemics and other public health crises, sanctions against a particular foreign country, its nationals, businesses or industries and related geopolitical events, as well as environmental disasters such as earthquakes, fires, and floods, or other catastrophes, may add to instability in global economies and markets generally, and may lead to increased market volatility. Global economies and financial markets are highly interconnected, which increases the possibility that conditions in one country or region might adversely affect issuers in another country or region. The impact of these and other factors may be short-term or may last for extended periods.
Micro-Capitalization Stock Risk — Micro-capitalization companies tend to be less seasoned and may lose market share or profits to a greater extent than larger, more established companies. Since micro-capitalization company stocks typically have narrower markets and are traded in lower volumes than larger company stocks, they may be more difficult to purchase and sell. Micro-capitalization companies may have limited markets, product lines, or financial resources and lack management experience and may experience higher failure rates than larger companies.
Debt Securities and Interest Rate Risk — The INCORE Fund for Income and the INCORE Investment Grade Convertible Bond Fund are subject to debt securities and interest rate risk. The value of a debt security or other income-producing security changes in response to various factors including, for example, market-related factors (such as changes in interest rates or changes in the risk appetite of investors generally) and changes in the actual or perceived ability of the issuer (or of issuers generally) to meet its (or their) obligations. Interest rates may rise or the rate of inflation may increase, impacting the value of investments in fixed income securities. A debt issuer's credit quality may be downgraded or an issuer may default. Interest rates may fluctuate due to changes in governmental fiscal policy initiatives and resulting market reaction to those initiatives.
High-Yield/Junk Bond Risk — Lower-quality debt securities can involve a substantially greater risk of default than higher quality debt securities, and their values can decline significantly over short and longer periods of time. Lower-quality debt securities tend to be more sensitive to adverse news about the issuer, or the market or economy in general.
LIBOR Discontinuation Risk — The London Interbank Offered Rate ("LIBOR") discontinuation may adversely affect the financial markets generally and the Funds' operations, finances and investments specifically. LIBOR has been the principal floating-rate benchmark in the financial markets, and a large portion of the Funds' assets are tied to LIBOR. However, LIBOR has been or will be discontinued as a floating rate benchmark. The date of discontinuation depends on the LIBOR currency and tenor. With limited exceptions, no new LIBOR obligations will be entered into after December 31, 2021. Existing LIBOR obligations have transitioned or will transition to another benchmark, depending on the LIBOR currency and tenor. For some existing LIBOR-based obligations, the contractual consequences of the discontinuation of LIBOR may not be clear.
Non-LIBOR floating-rate obligations, including Secured Overnight Financing Rate ("SOFR")-based obligations, may have returns and values that fluctuate more than those of floating-rate debt obligations
72
Victory Portfolios | | Notes to Financial Statements — continued
April 30, 2022 | |
(Unaudited)
that are based on LIBOR or other rates. Also, because SOFR and some alternative floating rates are relatively new market indexes, markets for certain non-LIBOR obligations may never develop or may not be liquid. Market terms for non-LIBOR floating rate obligations, such as the spread over the index reflected in interest-rate provisions, may evolve over time, and prices of non-LIBOR floating rate obligations may be different depending on when they are issued and changing views about correct spread levels.
Various SOFR-based rates, including SOFR-based term rates, and various non-SOFR-based rates are expected to develop in response to the discontinuation of U.S. dollar LIBOR, which may create various risks for the Funds and the financial markets more generally. There are non-LIBOR forward-looking floating rates that are not based on SOFR and that may be considered by participants in the financial markets as LIBOR alternatives. Such rates include AMERIBOR (American Interbank Offered Rate), BSBY (Bloomberg Short-Term Bank Yield Index) and BYI (Bank Yield Index). Unlike forward-looking SOFR-based term rates, such rates are intended to reflect a bank credit spread component.
It is not clear how replacement rates for LIBOR — including SOFR-based rates and non-SOFR-based rates — will develop and to what extent they will be used. There is no assurance that these replacement rates will be suitable substitutes for LIBOR, and thus the substitution of such rates for LIBOR could have an adverse effect on the Funds and the financial markets more generally. Concerns about market depth and stability could affect the development of non-SOFR-based term rates, and such rates may create various risks, which may or may not be similar to the risks relating to SOFR.
6. Borrowing and Interfund Lending:
Line of Credit:
The Victory Funds Complex participates in a short-term demand note "Line of Credit" agreement with Citibank. The Line of Credit agreement with Citibank was renewed on June 28, 2021, with a termination date of June 27, 2022. Under the agreement with Citibank, the Victory Funds Complex may borrow up to $600 million, of which $300 million is committed and $300 million is uncommitted. $40 million of the Line of Credit is reserved for use by the Victory Floating Rate Fund, another series of the Victory Funds Complex, with Victory Floating Rate Fund paying the related commitment fees for that amount. The purpose of the Line of Credit is to meet temporary or emergency cash needs. For the six months ended April 30, 2022, Citibank received an annual commitment fee of 0.15% on $300 million for providing the Line of Credit. Each fund in the Victory Funds Complex pays a pro-rata portion of the commitment fees plus any interest (one-month LIBOR plus one percent, with LIBOR to be replaced by a different benchmark rate in accordance with the terms of the agreement) on amounts borrowed. Effective with the June 27, 2022, agreement renewal, the interest rate formal on amounts borrowed based on the published 1-month LIBOR rate plus one percent was changed to an interest rate based on the published 1-month SOFR plus 1.10 percent. Prior to June 28, 2021, the Victory Funds Complex paid an annual commitment fee of 0.15% and an upfront fee of 0.10%. Each fund in the Victory Funds Complex paid a pro-rata portion of the upfront fee. Interest charged to each fund during the period, if applicable, is reflected on the Statements of Operations under Line of credit fees.
The average borrowing for the days outstanding and average interest rate for each Fund that utilized the Line of Credit during the period ended April 30, 2022, were as follows (amounts in thousands):
| | | Amount
Outstanding at
April 30, 2022 | | Average
Borrowing* | | Days
Borrowings
Outstanding | | Average
Interest
Rate | | Maximum
Borrowing
During the
Period | |
THB US Small Opportunities
Fund | | $ | — | | | $ | 4,463 | | | | 8 | | | | 1.21 | % | | $ | 5,600 | | |
* For the period ended April 30, 2022, based on the number of days borrowings were outstanding.
73
Victory Portfolios | | Notes to Financial Statements — continued
April 30, 2022 | |
(Unaudited)
Interfund Lending:
The Trust and the Adviser rely on an exemptive order granted by the SEC in March 2017 (the "Order"), permitting the establishment and operation of an Interfund Lending Facility (the "Facility"). The Facility allows each Fund to directly lend and borrow money to or from any other fund in the Victory Funds Complex that is permitted to participate in the Facility, relying upon the Order at rates beneficial to both the borrowing and lending funds. Advances under the Facility are allowed for temporary or emergency purposes, including the meeting of redemption requests that otherwise might require the untimely disposition of securities, and are subject to each Fund's borrowing restrictions. The interfund loan rate is determined, as specified in the Order, by averaging the current repurchase agreement rate and the current bank loan rate. As a Borrower, interest charged to each Fund, if any, during the period, is reflected on the Statements of Operations under Interfund lending fees. As a Lender, interest earned by each Fund, if any, during the period, is reflected on the Statements of Operations under Interfund lending.
The average borrowing or lending for the days outstanding and average interest rate for each Fund during the six months ended April 30, 2022, were as follows (amounts in thousands):
| | | Borrower or
Lender | | Amount
Outstanding at
April 30, 2022 | | Average
Borrowing* | | Days
Borrowing
Outstanding | | Average
Interest
Rate* | | Maximum
Borrowing
During the
Period | |
INCORE Fund for Income | | Borrower | | $ | — | | | $ | 4,065 | | | | 4 | | | | 0.83 | % | | $ | 10,000 | | |
INCORE Investment Grade
Convertible Fund | | Borrower | | | — | | | | 1,670 | | | | 4 | | | | 0.58 | % | | | 1,670 | | |
* For the six months ended April 30, 2022, based on the number of days borrowings were outstanding.
7. Federal Income Tax Information:
Distributable net realized gains, if any, are declared and distributed at least annually from each Fund. Dividends from net investment income, if any, are declared and paid as noted in the table below.
| | | Declared | | Paid | |
Diversified Stock Fund | | Quarterly | | Quarterly | |
NewBridge Large Cap Growth Fund | | Annually | | Annually | |
Special Value Fund | | Annually | | Annually | |
THB US Small Opportunities Fund | | Quarterly | | Quarterly | |
Strategic Allocation Fund | | Quarterly | | Quarterly | |
INCORE Fund for Income | | Monthly | | Monthly | |
INCORE Investment Grade Convertible Fund | | Quarterly | | Quarterly | |
The amounts of dividends from net investment income and distributions from net realized gains (collectively, distributions to shareholders) are determined in accordance with federal income tax regulations, which may differ from GAAP. To the extent these "book/tax" differences are permanent in nature (e.g., net operating loss and distribution reclassification), such amounts are reclassified within the components of net assets based on their federal tax-basis treatment; temporary differences (e.g., wash sales) do not require reclassification. To the extent dividends and distributions exceed net investment income and net realized gains for tax purposes, they are reported as distributions of capital. Net investment losses incurred by the Funds may be reclassified as an offset to capital on the accompanying Statements of Assets and Liabilities.
The tax character of current year distributions paid and the tax basis of the current components of accumulated earnings (loss) will be determined at the end of the current tax year ending October 31, 2022.
74
Victory Portfolios | | Notes to Financial Statements — continued
April 30, 2022 | |
(Unaudited)
At the tax year ended October 31, 2021, the Funds had net capital loss carryforwards as shown in the table below (amounts in thousands). It is unlikely that the Board will authorize a distribution of capital gains realized in the future until the capital loss carryforwards have been used.
| | | Short-Term
Amount | | Long-Term
Amount | | Total | |
Strategic Allocation Fund | | $ | — | | | $ | (122 | ) | | $ | (122 | ) | |
INCORE Fund for Income | | | (127,550 | ) | | | (223,983 | ) | | | (351,533 | ) | |
8. Affiliated Securities:
An affiliated security is a security in which a Fund has ownership of at least 5% of the security's outstanding voting shares, or an investment company managed by VCM. The Funds do not invest in affiliated underlying funds for the purpose of exercising management or control. These underlying funds are noted as affiliated on the Funds' Schedules of Portfolio Investments. The affiliated underlying funds' annual or semiannual reports may be viewed at www.vcm.com. Transactions in affiliated securities during the six months ended April 30, 2022, were as follows (amounts in thousands):
| | | Fair
Value
10/31/2021 | | Purchases
at Cost | | Proceeds
from
Sales | | Realized
Gains
(Losses) | | Capital Gain
Distribution | | Net
Change
in Unrealized
Appreciation/
Depreciation | | Fair
Value
4/30/22 | | Dividend
Income | |
Strategic Allocation Fund | |
Victory INCORE Total
Return Bond Fund
Class R6 | | $ | 3,201 | | | $ | 37 | | | $ | (277 | ) | | $ | (16 | ) | | $ | — | | | $ | (297 | ) | | $ | 2,648 | | | $ | 37 | | |
Victory Integrity Discovery
Fund Class Y | | | 1,178 | | | | 48 | | | | (28 | ) | | | 8 | | | | 48 | | | | (163 | ) | | | 1,043 | | | | — | | |
Victory Market
Neutral Income
Fund Class I | | | 5,661 | | | | 67 | | | | (274 | ) | | | (1 | ) | | | — | | | | 52 | | | | 5,505 | | | | 67 | | |
Victory RS Global
Fund Class Y | | | 9,197 | | | | 303 | | | | (1,076 | ) | | | 274 | | | | 88 | | | | (1,540 | ) | | | 7,159 | | | | 214 | | |
Victory RS Partners
Fund Class Y | | | 1,130 | | | | 151 | | | | (41 | ) | | | — | | | | 89 | | | | (201 | ) | | | 1,039 | | | | 62 | | |
Victory INCORE
Investment Grade
Convertible Fund | | | 1,849 | | | | 166 | | | | (96 | ) | | | (11 | ) | | | 26 | | | | (229 | ) | | | 1,679 | | | | 141 | | |
Victory Sophus
Emerging Markets
Fund Class R6 | | | 2,770 | | | | 114 | | | | — | | | | — | | | | 59 | | | | (542 | ) | | | 2,342 | | | | 55 | | |
Victory Global Energy
Transition Fund | | | — | | | | 1,330 | | | | — | | | | — | | | | — | | | | 248 | | | | 1,578 | | | | — | | |
Victory Trivalent
International
Small-Cap Fund
Class I | | | 2,200 | | | | 174 | | | | (276 | ) | | | 19 | | | | 137 | | | | (559 | ) | | | 1,558 | | | | 37 | | |
VictoryShares
U.S. Multi-Factor
Minimum
Volatility ETF | | | 2,171 | | | | — | | | | (168 | ) | | | 40 | | | | — | | | | (67 | ) | | | 1,976 | | | | 16 | | |
| | | $ | 29,357 | | | $ | 2,390 | | | $ | (2,236 | ) | | $ | 313 | | | $ | 447 | | | $ | (3,298 | ) | | $ | 26,527 | | | $ | 629 | | |
75
Victory Portfolios | | Notes to Financial Statements — continued
April 30, 2022 | |
(Unaudited)
9. Stock Split:
Effective December 3, 2021, the Victory NewBridge Large Cap Growth Fund underwent a 1-for-5 reverse stock split of the issued and outstanding Class C shares of the Fund. The reverse stock split was not a taxable event, nor did it have an impact on the Fund's holdings or performance. No changes are contemplated at this time for the other share classes offered by the Fund.
10. Subsequent Event
The Board approved a change in fiscal year-end from October 31 to June 30. This change in fiscal year-end is effective May 19, 2022.
76
Victory Portfolios | | Supplemental Information
April 30, 2022 | |
(Unaudited)
Proxy Voting and Portfolio Holdings Information
Proxy Voting:
Information regarding the policies and procedures each Fund uses to determine how to vote proxies relating to portfolio securities is available without charge, upon request, by calling 800-539-3863. The information is also included in the Funds' Statement of Additional Information, which is available on the SEC's website at www.sec.gov.
Information relating to how the Funds voted proxies relating to portfolio securities held during the most recent 12 months ended June 30 is available on the SEC's website at www.sec.gov.
Availability of Schedules of Portfolio Investments:
The Trust files a complete list of Schedules of Portfolio Investments with the SEC for the first and third quarter of each fiscal year on Form N-PORT. Forms N-PORT are available on the SEC's website at www.sec.gov.
Expense Examples
As a shareholder of a Fund, you may incur two types of costs: (1) transaction costs, including sales charges (loads) on purchases; and (2) ongoing costs, including management fees and other Fund expenses. These examples are intended to help you understand your ongoing costs (in dollars) of investing in a Fund and to compare these costs with the ongoing costs of investing in other mutual funds.
These examples are based on an investment of $1,000 invested at the beginning of the period and held for the entire period from November 1, 2021, through April 30, 2022.
The Actual Expense figures in the table below provide information about actual account values and actual expenses. You may use the information below, together with the amount you invested, to estimate the expenses that you paid over the period. Simply divide your account value by $1,000 (for example, an $8,600 account value divided by $1,000 = 8.6), then multiply the result by the number in the table under the heading entitled "Actual Expenses Paid During Period" to estimate the expenses you paid on your account during this period.
The Hypothetical Expense figures in the table below provide information about hypothetical account values and hypothetical expenses based on the Fund's actual expense ratio and an assumed rate of return of 5% per year before expenses, which is not the Fund's actual return. The hypothetical account values and expenses may not be used to estimate the actual ending account balance or expenses you paid for the period. You may use this information to compare this 5% hypothetical example with the 5% hypothetical examples that appear in shareholder reports of other funds.
Please note the expenses shown in the table below are meant to highlight your ongoing costs only and do not reflect any transactional costs. Therefore, the hypothetical expenses in the table are useful in comparing ongoing costs only and will not help you determine the relative total costs of owning different funds. In addition, if these transactional costs were included, your costs would have been higher.
| | | Beginning
Account
Value
11/1/21 | | Actual
Ending
Account
Value
4/30/22 | | Hypothetical
Ending
Account
Value
4/30/22 | | Actual
Expenses Paid
During Period
11/1/21-
4/30/22* | | Hypothetical
Expenses Paid
During Period
11/1/21-
4/30/22* | | Annualized
Expense Ratio
During Period
11/1/21-
4/30/22 | |
Diversified Stock Fund | |
Class A | | $ | 1,000.00 | | | $ | 897.70 | | | $ | 1,019.49 | | | $ | 5.03 | | | $ | 5.36 | | | | 1.07 | % | |
Class C | | | 1,000.00 | | | | 893.30 | | | | 1,014.78 | | | | 9.48 | | | | 10.09 | | | | 2.02 | % | |
Class I | | | 1,000.00 | | | | 898.60 | | | | 1,020.68 | | | | 3.91 | | | | 4.16 | | | | 0.83 | % | |
Class R | | | 1,000.00 | | | | 896.30 | | | | 1,018.10 | | | | 6.35 | | | | 6.76 | | | | 1.35 | % | |
Class R6 | | | 1,000.00 | | | | 898.90 | | | | 1,020.93 | | | | 3.67 | | | | 3.91 | | | | 0.78 | % | |
Class Y | | | 1,000.00 | | | | 898.60 | | | | 1,020.53 | | | | 4.05 | | | | 4.31 | | | | 0.86 | % | |
77
Victory Portfolios | | Supplemental Information — continued
April 30, 2022 | |
(Unaudited)
| | | Beginning
Account
Value
11/1/21 | | Actual
Ending
Account
Value
4/30/22 | | Hypothetical
Ending
Account
Value
4/30/22 | | Actual
Expenses Paid
During Period
11/1/21-
4/30/22* | | Hypothetical
Expenses Paid
During Period
11/1/21-
4/30/22* | | Annualized
Expense Ratio
During Period
11/1/21-
4/30/22 | |
NewBridge Large Cap Growth Fund | |
Class A | | $ | 1,000.00 | | | $ | 682.90 | | | $ | 1,018.05 | | | $ | 5.67 | | | $ | 6.80 | | | | 1.36 | % | |
Class C | | | 1,000.00 | | | | 679.20 | | | | 1,014.38 | | | | 8.74 | | | | 10.49 | | | | 2.10 | % | |
Class I | | | 1,000.00 | | | | 685.40 | | | | 1,020.08 | | | | 3.97 | | | | 4.76 | | | | 0.95 | % | |
Class Y | | | 1,000.00 | | | | 684.90 | | | | 1,019.74 | | | | 4.26 | | | | 5.11 | | | | 1.02 | % | |
Special Value Fund | |
Class A | | $ | 1,000.00 | | | $ | 898.80 | | | $ | 1,018.70 | | | $ | 5.79 | | | $ | 6.16 | | | | 1.23 | % | |
Class C | | | 1,000.00 | | | | 894.50 | | | | 1,014.38 | | | | 9.86 | | | | 10.49 | | | | 2.10 | % | |
Class I | | | 1,000.00 | | | | 899.50 | | | | 1,019.59 | | | | 4.95 | | | | 5.26 | | | | 1.05 | % | |
Class R | | | 1,000.00 | | | | 897.30 | | | | 1,017.11 | | | | 7.29 | | | | 7.75 | | | | 1.55 | % | |
Class Y | | | 1,000.00 | | | | 899.70 | | | | 1,019.84 | | | | 4.71 | | | | 5.01 | | | | 1.00 | % | |
THB US Small Opportunities Fund | |
Class A | | $ | 1,000.00 | | | $ | 831.20 | | | $ | 1,016.36 | | | $ | 7.72 | | | $ | 8.50 | | | | 1.70 | % | |
Class I | | | 1,000.00 | | | | 833.00 | | | | 1,018.60 | | | | 5.68 | | | | 6.26 | | | | 1.25 | % | |
Strategic Allocation Fund | |
Class A | | $ | 1,000.00 | | | $ | 932.10 | | | $ | 1,022.81 | | | $ | 1.92 | | | $ | 2.01 | | | | 0.40 | % | |
Class C | | | 1,000.00 | | | | 928.40 | | | | 1,019.09 | | | | 5.50 | | | | 5.76 | | | | 1.15 | % | |
Class I | | | 1,000.00 | | | | 933.10 | | | | 1,024.05 | | | | 0.72 | | | | 0.75 | | | | 0.15 | % | |
Class R | | | 1,000.00 | | | | 930.80 | | | | 1,021.57 | | | | 3.11 | | | | 3.26 | | | | 0.65 | % | |
INCORE Fund for Income | |
Class A | | $ | 1,000.00 | | | $ | 955.10 | | | $ | 1,020.28 | | | $ | 4.41 | | | $ | 4.56 | | | | 0.91 | % | |
Class C | | | 1,000.00 | | | | 949.80 | | | | 1,016.31 | | | | 8.27 | | | | 8.55 | | | | 1.71 | % | |
Class I | | | 1,000.00 | | | | 956.30 | | | | 1,021.62 | | | | 3.10 | | | | 3.21 | | | | 0.64 | % | |
Class R | | | 1,000.00 | | | | 955.10 | | | | 1,020.28 | | | | 4.41 | | | | 4.56 | | | | 0.91 | % | |
Class R6 | | | 1,000.00 | | | | 955.00 | | | | 1,021.67 | | | | 3.05 | | | | 3.16 | | | | 0.63 | % | |
Class Y | | | 1,000.00 | | | | 955.10 | | | | 1,021.27 | | | | 3.44 | | | | 3.56 | | | | 0.71 | % | |
Member Class | | | 1,000.00 | | | | 954.80 | | | | 1,021.08 | | | | 3.64 | | | | 3.76 | | | | 0.75 | % | |
INCORE Investment Grade Convertible Fund | |
Class A | | $ | 1,000.00 | | | $ | 957.70 | | | $ | 1,018.65 | | | $ | 6.02 | | | $ | 6.21 | | | | 1.24 | % | |
Class I | | | 1,000.00 | | | | 959.10 | | | | 1,020.33 | | | | 4.37 | | | | 4.51 | | | | 0.90 | % | |
Member Class | | | 1,000.00 | | | | 958.40 | | | | 1,019.34 | | | | 5.34 | | | | 5.51 | | | | 1.10 | % | |
* Expenses are equal to the average account value multiplied by the Fund's annualized expense ratio multiplied by 181/365 (the number of days in the most recent fiscal half-year divided by the number of days in the fiscal year).
78
Victory Portfolios | | Supplemental Information — continued
April 30, 2022 | |
(Unaudited)
Considerations of the Board in Continuing the Investment Advisory Agreement (the "Agreement")
The Board approved the Agreement on behalf of each of the Funds at a meeting, which was called for that purpose, on November 30, 2021. The Board also considered information relating to the Funds and the Agreement provided throughout the year and, more specifically, at the meetings on October 19, 2021, and November 30, 2021. In considering whether to approve the Agreement, the Board requested, and the Adviser provided, information that the Board believed to be reasonably necessary to reach its conclusions.
The Board, including the Independent Trustees, evaluated this information along with other information obtained throughout the year and was advised by legal counsel to the Funds and independent legal counsel to the Independent Trustees. In addition, the Independent Trustees considered a past review of their overall process for conducting the annual review of the Funds' advisory arrangements by a consultant retained through their counsel.
The Board took into consideration regular reports from the Adviser throughout the COVID-19 pandemic public health crisis concerning how the ongoing pandemic has affected market volatility, investment risk, liquidity and valuation of portfolio securities, and the implementation and effectiveness of business continuity plans. These reports also had confirmed that the pandemic had no material impact on the Adviser's operations.
The Board considered each Fund's advisory fee, expense ratio and investment performance as significant factors in determining whether the Agreement should be continued. In considering whether the compensation paid to the Adviser was fair and reasonable, the Board also evaluated, among other things, the following factors:
• The requirements of the Funds for the services provided by the Adviser;
• The nature, quality and extent of the services provided and expected to be provided;
• The performance of the Funds as compared to comparable funds;
• The fees payable for the services and whether the fee arrangements provided for economies of scale that would benefit Fund shareholders as the Funds grow (acknowledging that economies of scale can be complex to assess and typically are not directly measurable);
• Whether the fee would be sufficient to enable the Adviser to attract and retain experienced personnel and continue to provide quality services to the Funds;
• The fees paid by other clients of the Adviser whose accounts are managed in a similar investment style and any differences in the services provided to the other clients compared to those provided to the Funds;
• The total expenses of each Fund;
• Management's commitment to operating the Funds at competitive expense levels;
• The profitability of the Adviser (as reflected by comparing fees earned against an estimate of the Adviser's costs) with respect to the Adviser's relationship with the Funds;
• Research and other service benefits received by the Adviser obtained through payment of client commissions for securities transactions;
• Other indirect benefits received by the Adviser, and its affiliates, including revenues paid to the Adviser, or its affiliates, by the Funds for administration and fund accounting services, and distribution;
• The capabilities and financial condition of the Adviser;
• Current economic and industry trends; and
• The historical relationship between each Fund and the Adviser.
For Funds with total net expense ratios that ranked within the fourth quartile (most expensive) in relation to their peers as evaluated by a consultant, the Board also considered a memorandum that it requested the Adviser to prepare. The Adviser reviewed additional relevant circumstances, which included, among other things, specialized strategies, small or decreasing assets, or rapid or recent changes in peer expense ratios.
The Board reviewed each Fund's current management fee, comprised of the advisory fee plus the administrative services fee paid to the Adviser, in the context of the Adviser's profitability with respect to each Fund individually.
79
Victory Portfolios | | Supplemental Information — continued
April 30, 2022 | |
(Unaudited)
The Board retained a consultant to provide comparative information about fees and performance. The Board met with the consultant to review its inputs and methodologies, among other things. The Board compared each Fund's gross management fees and total operating expense ratio on a net and gross basis with the median gross management fee and median expense ratio of a universe of comparable mutual funds compiled by the consultant and a peer group of funds with similar investment strategies selected by that consultant from the universe. The Board reviewed the factors and methodology used by the consultant in the selection of each Fund's peer group, including the consultant's selection of a broad universe of funds, the more specific universe of comparable funds, and peer groups of funds with comparable investment strategies and asset levels, among other factors. The Board also reviewed any changes to the consultant's methodology as compared to the prior year, including those resulting from the Adviser's input, if any. With respect to certain Funds, the Board also reviewed fees and other information related to the Adviser's management of similarly managed institutional or private accounts, and the differences in the services provided to these other accounts. The Board also noted that the breakpoints in the advisory fee schedule for some of the Funds evidenced one way in which the Adviser has shown a willingness to share in its economies of scale.
The Board also reviewed the compliance and administrative services provided to the Funds by the Adviser and its affiliates, including the Adviser's oversight of the Funds' day-to-day operations and oversight of Fund accounting, assistance in meeting legal and regulatory requirements, and other services necessary for the operation of the Funds and the Trust.
The Board found that the gross annual management fee paid by each Fund was within the range of management fees paid by each Fund's respective peer group. The Board noted that, except for the Strategic Allocation Fund, each Fund's advisory fee structure contained at least one breakpoint. The Board also noted that the Adviser contractually agreed to waive the advisory fee payable by the Strategic Allocation Fund through February 28, 2023, and that any advisory fees charged under the Agreement are based on services provided that will be in addition to, rather than duplicative of, the services provided under the advisory contract of any fund in which the Strategic Allocation Fund invests. The Board also found that each Fund's Class A net annual expense ratio, taking into account any shareholder servicing or distribution fees, was reasonable as compared with each Fund's respective peer group. The Board considered the Adviser's contractual agreement with each Fund to waive its fees and reimburse expenses of certain classes for a specified period of time, as described in the Fund's prospectus.
The Board reviewed each Fund's performance over one-, three-, five- and ten-year periods (as applicable) against the performance of the Fund's selected peer group and benchmark index. The Board recognized that the performance of the Funds and the peer group funds are net of expenses, while the performance of the benchmark index reflects gross returns.
The Board reviewed various other specific factors with respect to each Fund, as described below. In their deliberations, the Trustees did not rank the importance of any particular information or factor considered and each Trustee may have attributed different weights to various factors.
Victory Diversified Stock Fund
The Board compared the Fund's Class A performance for the one-, three-, five- and ten-year periods ended June 30, 2021, to that of the median performance of the Fund's peer group and benchmark index for the same periods and considered the fact that the Fund outperformed both the benchmark index and the peer group median for the one-year period, and underperformed both the benchmark index and the peer group median for the three-, five- and ten-year periods. The Board noted that the Fund's portfolio management team changed in May 2017. The Board discussed the Fund's investment strategy, the Adviser's implementation of the strategy, and related market conditions, together with relevant fee and expense considerations. The Board also discussed the steps that had been or could be taken by the Adviser to enhance performance in the future, and the Board's continued monitoring of the Fund's performance.
Having considered, among other things: (1) the Fund's management fee compared to comparable mutual funds; (2) the Fund's total expense ratio compared to comparable mutual funds; (3) that the Adviser's willingness to limit the expenses of certain classes for a period of time would provide stability to the Fund's expenses for those
80
Victory Portfolios | | Supplemental Information — continued
April 30, 2022 | |
(Unaudited)
share classes during that period; and (4) the Fund's performance during the periods reviewed, the Board concluded that the Agreement continued to be in the best interests of the Fund's shareholders.
NewBridge Large Cap Growth Fund
The Board compared the Fund's Class A performance for the one-, three-, five- and ten-year periods ended June 30, 2021, to that of the median performance of the Fund's peer group and benchmark index for the same periods and considered the fact that the Fund underperformed both the benchmark index and the peer group median for all of the periods reviewed. The Adviser discussed the Fund's performance in the context of the Fund's investment strategy. The Board discussed the Fund's investment strategy, the Adviser's implementation of the strategy, and related market conditions, together with relevant fee and expense considerations. The Board also discussed the steps that had been or could be taken by the Adviser to enhance performance in the future, and the Board's continued monitoring of the Fund's performance.
Having considered, among other things: (1) the Fund's management fee compared to comparable mutual funds; (2) the Fund's total expense ratio compared to comparable mutual funds; (3) that the Adviser's willingness to limit the expenses of certain classes for a period of time would provide stability to the Fund's expenses for those share classes during that period; and (4) the Fund's performance during the periods reviewed, the Board concluded that the Agreement continued to be in the best interests of the Fund's shareholders.
Special Value Fund
The Board compared the Fund's Class A performance for the one-, three-, five- and ten-year periods ended June 30, 2021, to that of the median performance of the Fund's peer group and benchmark index for the same periods and considered the fact that the Fund underperformed the benchmark index for all of the periods reviewed, matched the peer group median for the one-year period, and underperformed the peer group median for the three-, five- and ten-year periods. The Board noted that the Fund's portfolio management team changed in May 2017. The Board discussed the Fund's investment strategy, the Adviser's implementation of the strategy, and related market conditions, together with relevant fee and expense considerations. The Board also discussed the steps that had been or could be taken by the Adviser to enhance performance in the future, and the Board's continued monitoring of the Fund's performance.
Having considered, among other things: (1) the Fund's management fee compared to comparable mutual funds; (2) the Fund's total expense ratio compared to comparable mutual funds; (3) that one way the Adviser is addressing the Fund's underperformance is through its change of the Fund's portfolio management team; (4) that the Adviser's willingness to limit the expenses of certain classes for a period of time would provide stability to the Fund's expenses for those share classes during that period; and (5) the Fund's performance during the periods reviewed, the Board concluded that the Agreement continued to be in the best interests of the Fund's shareholders.
Strategic Allocation Fund
The Board compared the Fund's Class A performance for the one-, three-, five- and ten-year periods ended June 30, 2021, to that of the median performance of the Fund's peer group and benchmark index for the same periods and considered the fact that the Fund underperformed the benchmark index for all of the periods reviewed, and outperformed the peer group median for all of the periods reviewed. The Board noted that the Fund changed its investment strategy and its benchmark index in December 2015.
Having considered, among other things: (1) the Fund's management fee compared to comparable mutual funds; (2) the Fund's total expense ratio compared to comparable mutual funds; (3) that the Adviser's willingness to limit the expenses of certain classes for a period of time would provide stability to the Fund's expenses for those share classes during that period; and (4) the Fund's performance during the periods reviewed, the Board concluded that the Agreement continued to be in the best interests of the Fund's shareholders.
INCORE Fund for Income
The Board compared the Fund's Class A performance for the one-, three-, five- and ten-year periods ended June 30, 2021, to that of the median performance of the Fund's peer group and benchmark index for the same
81
Victory Portfolios | | Supplemental Information — continued
April 30, 2022 | |
(Unaudited)
periods and considered the fact that the Fund underperformed the benchmark index for all of the periods reviewed, underperformed the peer group median for the one- and five-year periods, and outperformed the peer group median for the three- and ten-year periods. The Board discussed the Fund's investment strategy, the Adviser's implementation of the strategy, and related market conditions, together with relevant fee and expense considerations. The Board also discussed the steps that had been or could be taken by the Adviser to enhance performance in the future, and the Board's continued monitoring of the Fund's performance.
Having considered, among other things: (1) the Fund's management fee compared to comparable mutual funds; (2) the Fund's total expense ratio compared to comparable mutual funds; (3) that the Adviser's willingness to limit the expenses of certain classes for a period of time would provide stability to the Fund's expenses for those share classes during that period; and (4) the Fund's performance during the periods reviewed, the Board concluded that the Agreement continued to be in the best interests of the Fund's shareholders.
INCORE Investment Grade Convertible Fund
The Board compared the Fund's Class A performance for the one-, three-, five- and ten-year periods ended June 30, 2021, to that of the median performance of the Fund's peer group and benchmark index for the same periods and considered the fact that the Fund outperformed the benchmark index for the one- and three-year periods, underperformed the benchmark index for the five- and ten-year periods, and underperformed the peer group median for all of the periods reviewed. The Board noted that the Fund changed its benchmark index in August 2017. The Board discussed with the Adviser how market conditions affected the Fund given the Fund's investment strategy, benchmark index, and fee and expense profile.
Having considered, among other things: (1) the Fund's management fee compared to comparable mutual funds; (2) the Fund's total expense ratio compared to comparable mutual funds; (3) that the Adviser's willingness to limit the expenses of certain classes for a period of time would provide stability to the Fund's expenses for those share classes during that period; and (4) the Fund's performance during the periods reviewed, the Board concluded that the Agreement continued to be in the best interests of the Fund's shareholders.
Conclusion
Based on its review of the information requested and provided, and following extended discussions, the Board determined that the Agreement, on behalf of the Funds discussed above, was consistent with the best interests of each Fund and its shareholders, and the Board unanimously approved the Agreement, on behalf of each Fund, for an additional annual period on the basis of the foregoing review and discussions and the following considerations, among others:
• The fairness and reasonableness of the investment advisory fee payable to the Adviser under the Agreement in light of the investment advisory services provided, the costs of these services, the profitability of the Adviser's relationship with the Fund and the comparability of the fee paid to the fees paid by other investment companies;
• The nature, quality and extent of the investment advisory services provided by the Adviser;
• The Adviser's entrepreneurial commitment to the management of the Funds and the creation of a broad-based family of funds, which could entail a substantial commitment of the Adviser's resources to the successful operation of the Funds;
• The Adviser's representations regarding its staffing and capabilities to manage the Funds, including the retention of personnel with relevant portfolio management experience;
• The Adviser's efforts to enhance investment results by, among other things, developing quality portfolio management teams; and
• The overall high quality of the personnel, operations, financial condition, investment management capabilities, methodologies and performance of the Adviser.
82
Victory Portfolios | | Supplemental Information — continued
April 30, 2022 | |
(Unaudited)
Liquidity Risk Management Program:
The Victory Funds have adopted and implemented a written liquidity risk management program (the "LRMP") as required by Rule 22e-4 under the Investment Company Act of 1940, as amended. The LRMP is reasonably designed to assess and manage each Fund's liquidity risk, taking into consideration each Fund's investment strategy and the liquidity of its portfolio investments during normal and reasonably foreseeable stressed market conditions; its short- and long-term cash flow projections; and its cash holdings and access to other liquidity management tools such as available funding sources including the Victory Funds Complex Interfund Lending Facility and Line of Credit (discussed in the Notes to Financial Statements). The Victory Funds' Board of Trustees approved the appointment of the Funds' investment adviser, Victory Capital Management Inc. ("Victory Capital"), as the administrator of the LRMP.
Victory Capital manages liquidity risks associated with the Funds' investments by monitoring, among other things, cash and cash equivalents, any use of derivatives, the concentration of investments, the appropriateness of each Fund's investment strategy, and by classifying every Fund investment as either highly liquid, moderately liquid, less liquid, or illiquid on at least a monthly basis. To assist with the classification of Fund investments, Victory Capital has retained a third-party provider of liquidity evaluation services. This provider determines preliminary liquidity classifications for all portfolio holdings based upon portfolio-level data and certain assumptions provided by Victory Capital. Victory Capital reviews the preliminary liquidity classifications and, when appropriate, considers other information including input from the Funds' portfolio managers (including the portfolio managers employed by any investment sub-advisers) in determining final liquidity classifications.
At a meeting held on February 24, 2022, Victory Capital provided an oral and written report to the Trustees on the operation and effectiveness of the LRMP during the previous year. The report from Victory Capital concluded that the Funds did not experience any significant liquidity challenges during the covered period, and the Funds' LRMP is reasonably designed to assess and manage its liquidity risk. The report also concluded that the LRMP continues to operate adequately and effectively to enable Victory Capital to oversee and manage liquidity risk and ensure each Fund is able to meet redemption requests without significant dilution to the remaining investors' interest in each Fund. During the review period, each Fund's portfolio consisted primarily of highly liquid investments, which are defined as cash and any investments that each Fund reasonably expects to be converted to cash in current market conditions in three business days or less without significantly changing the market value of the investment. Therefore, the Funds have not adopted a highly liquid investment minimum. The Funds' investments were below the limitation on illiquid investments during the review period. Additionally, Victory Capital indicated that no events occurred that would require the filing of Form N-LIQUID and recommended no material changes to the LRMP.
83
Privacy Policy
Protecting the Privacy of Information
The Trust respects your right to privacy. We also know that you expect us to conduct and process your business in an accurate and efficient manner. To do so, we must collect and maintain certain personal information about you. This is the information we collect from you on applications or other forms, and from the transactions you make with us or third parties. It may include your name, address, social security number, account transactions and balances, and information about investment goals and risk tolerance.
We do not disclose any information about you or about former customers to anyone except as permitted or required by law. Specifically, we may disclose the information we collect to companies that perform services on our behalf, such as the transfer agent that processes shareholder accounts and printers and mailers that assist us in the distribution of investor materials. We may also disclose this information to companies that perform marketing services on our behalf. This allows us to continue to offer you Victory investment products and services that meet your investing needs, and to effect transactions that you request or authorize. These companies will use this information only in connection with the services for which we hired them. They are not permitted to use or share this information for any other purpose.
To protect your personal information internally, we permit access only by authorized employees and maintain physical, electronic, and procedural safeguards to guard your personal information.*
* You may have received communications regarding information about privacy policies from other financial institutions which gave you the opportunity to "opt-out" of certain information sharing with companies which are not affiliated with that financial institution. The Trust does not share information with other companies for purposes of marketing solicitations for products other than the Trust. Therefore, the Trust does not provide opt-out options to their shareholders.
Victory Funds
P.O. Box 182593
Columbus, Ohio 43218-2593

Visit our website at: | | Call Victory at: | |
www.vcm.com | | 800-539-FUND (800-539-3863) | |
| | | | | 800-235-8396 for Member Class | |

April 30, 2022
Semi Annual Report
Victory Sycamore Established Value Fund
Victory Sycamore Small Company Opportunity Fund
www.vcm.com
News, Information And Education 24 Hours A Day, 7 Days A Week
The Victory Capital website gives fund shareholders, prospective shareholders, and investment professionals a convenient way to access fund information, get guidance, and track fund performance anywhere they can access the Internet. The site includes:
• Detailed performance records
• Daily share prices
• The latest fund news
• Investment resources to help you become a better investor
• A section dedicated to investment professionals
Whether you're a potential investor searching for the fund that matches your investment philosophy, a seasoned investor interested in planning tools, or an investment professional, www.vcm.com has what you seek. Visit us anytime. We're always open.
TABLE OF CONTENTS
Investment Objective and Portfolio
Holdings (Unaudited) | | | 4 | | |
Schedule of Portfolio Investments | |
Victory Sycamore Established Value Fund | | | 6 | | |
Victory Sycamore Small Company Opportunity Fund | | | 9 | | |
Financial Statements | |
Statements of Assets and Liabilities | | | 13 | | |
Statements of Operations | | | 15 | | |
Statements of Changes in Net Assets | | | 16 | | |
Financial Highlights | | | 20 | | |
Notes to Financial Statements | | | 28 | | |
Supplemental Information (Unaudited) | | | 37 | | |
Proxy Voting and Portfolio Holdings Information | | | 37 | | |
Expense Examples | | | 37 | | |
Advisory Contract Approval | | | 39 | | |
Liquidity Risk Management Program | | | 42 | | |
Privacy Policy (inside back cover) | | | |
1
IRA DISTRIBUTION WITHHOLDING DISCLOSURE
We generally must withhold federal income tax at a rate of 10% of the taxable portion of your distribution and, if you live in a state that requires state income tax withholding, at your state's tax rate. However, you may elect not to have withholding apply or to have income tax withheld at a higher rate. Any withholding election that you make will apply to any subsequent distribution unless and until you change or revoke the election. If you wish to make a withholding election, or change or revoke a prior withholding election, call 800-539-3863 and form W-4P (OMB No. 1545-0074 withholding certificate for pension or annuity payments) will be electronically sent.
If you do not have a withholding election in place by the date of a distribution, federal income tax will be withheld from the taxable portion of your distribution at a rate of 10%. If you must pay estimated taxes, you may be subject to estimated tax penalties if your estimated tax payments are not sufficient and sufficient tax is not withheld from your distribution.
For more specific information, please consult your tax adviser.
The Funds are distributed by Victory Capital Services, Inc. Victory Capital Management Inc. is the investment adviser to the Funds and receives fees from the Funds for performing services for the Funds.
This report is not authorized for distribution to prospective investors unless preceded or accompanied by a current prospectus of the Victory Funds.
For additional information about any Victory Fund, including fees, expenses, and risks, view our prospectus online at vcm.com or call 800-539-3863. Read it carefully before you invest or send money.
The information in this report is based on data obtained from recognized services and sources and is believed to be reliable. Any opinions, projections, or recommendations in this report are subject to change without notice and are not intended as individual investment advice. Past investment performance of the Funds, markets or securities mentioned herein should not be considered to be indicative of future results.
• NOT FDIC INSURED • NO BANK GUARANTEE • MAY LOSE VALUE

Call Victory at:
800-539-FUND (800-539-3863)
Visit our website at:
www.vcm.com
2
This page is intentionally left blank.
3
Victory Portfolios
Victory Sycamore Established Value Fund | | April 30, 2022 | |
(Unaudited)
Investment Objective and Portfolio Holdings:
The Fund seeks to provide long-term capital growth by investing primarily in common stocks.
Top 10 Holdings*:
April 30, 2022
(% of Net Assets)
Alleghany Corp. | | | 2.5 | % | |
Sysco Corp. | | | 2.2 | % | |
Packaging Corp. of America | | | 2.0 | % | |
Westlake Corp. | | | 1.9 | % | |
Valero Energy Corp. | | | 1.9 | % | |
Coterra Energy, Inc. | | | 1.9 | % | |
American Financial Group, Inc. | | | 1.9 | % | |
W.R. Berkley Corp. | | | 1.9 | % | |
Zions Bancorp NA | | | 1.7 | % | |
Xcel Energy, Inc. | | | 1.7 | % | |
Sector Allocation*:
April 30, 2022
(% of Net Assets)
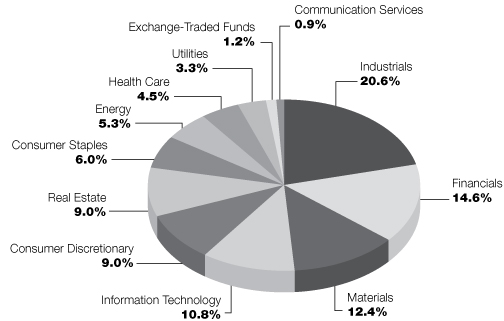
* Does not include futures contracts, money market instruments, and short-term investments purchased with cash collateral from securities loaned.
Percentages are of the net assets of the Fund and may not equal 100%.
Refer to the Schedule of Portfolio Investments for a complete list of securities.
4
Victory Portfolios
Victory Sycamore Small Company Opportunity Fund | | April 30, 2022 | |
(Unaudited)
Investment Objective and Portfolio Holdings:
The Fund seeks to provide capital appreciation.
Top 10 Holdings*:
April 30, 2022
(% of Net Assets)
PDC Energy, Inc. | | | 2.0 | % | |
Independent Bank Corp. | | | 1.7 | % | |
Applied Industrial Technologies, Inc. | | | 1.6 | % | |
SouthState Corp. | | | 1.6 | % | |
Rayonier, Inc. | | | 1.5 | % | |
EMCOR Group, Inc. | | | 1.5 | % | |
UMB Financial Corp. | | | 1.4 | % | |
Verint Systems, Inc. | | | 1.4 | % | |
Performance Food Group Co. | | | 1.4 | % | |
Apple Hospitality REIT, Inc. | | | 1.4 | % | |
Sector Allocation*:
April 30, 2022
(% of Net Assets)
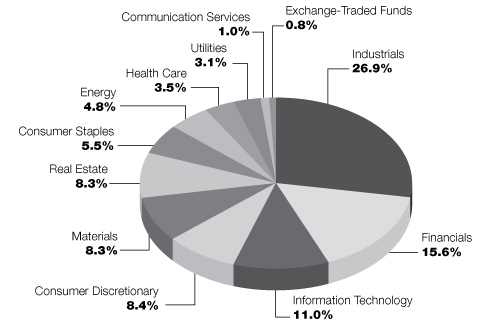
* Does not include futures contracts, money market instruments, and short-term investments purchased with cash collateral from securities loaned.
Percentages are of the net assets of the Fund and may not equal 100%.
Refer to the Schedule of Portfolio Investments for a complete list of securities.
5
Victory Portfolios
Victory Sycamore Established Value Fund | | Schedule of Portfolio Investments
April 30, 2022 | |
(Amounts in Thousands, Except for Shares) (Unaudited)
Security Description | | Shares | | Value | |
Common Stocks (96.4%) | |
Communication Services (0.9%): | |
Live Nation Entertainment, Inc. (a) | | | 1,400,000 | | | $ | 146,832 | | |
Consumer Discretionary (9.0%): | |
Aptiv PLC (a) | | | 1,395,000 | | | | 148,428 | | |
BorgWarner, Inc. | | | 7,175,000 | | | | 264,255 | | |
Hilton Worldwide Holdings, Inc. (a) | | | 1,485,000 | | | | 230,606 | | |
Newell Brands, Inc. | | | 9,575,000 | | | | 221,661 | | |
Ross Stores, Inc. | | | 2,363,500 | | | | 235,806 | | |
VF Corp. | | | 2,428,200 | | | | 126,267 | | |
Yum! Brands, Inc. | | | 2,215,000 | | | | 259,177 | | |
| | | | 1,486,200 | | |
Consumer Staples (6.0%): | |
Archer-Daniels-Midland Co. | | | 1,850,000 | | | | 165,686 | | |
Sysco Corp. | | | 4,220,000 | | | | 360,725 | �� | |
The Hershey Co. | | | 880,000 | | | | 198,678 | | |
Tyson Foods, Inc., Class A | | | 2,910,000 | | | | 271,096 | | |
| | | | 996,185 | | |
Energy (5.3%): | |
Coterra Energy, Inc. | | | 10,875,000 | | | | 313,091 | | |
Devon Energy Corp. | | | 4,220,000 | | | | 245,477 | | |
Valero Energy Corp. | | | 2,810,000 | | | | 313,259 | | |
| | | | 871,827 | | |
Financials (14.6%): | |
Alleghany Corp. (a) | | | 500,000 | | | | 418,250 | | |
American Financial Group, Inc. | | | 2,227,300 | | | | 308,437 | | |
Everest Re Group Ltd. | | | 615,000 | | | | 168,947 | | |
Huntington Bancshares, Inc. | | | 13,800,000 | | | | 181,470 | | |
Old Republic International Corp. | | | 5,811,100 | | | | 127,902 | | |
Prosperity Bancshares, Inc. | | | 2,725,000 | | | | 178,160 | | |
The Bank of New York Mellon Corp. | | | 5,157,200 | | | | 216,912 | | |
The Progressive Corp. | | | 2,025,000 | | | | 217,404 | | |
W.R. Berkley Corp. | | | 4,625,000 | | | | 307,516 | | |
Zions Bancorp NA | | | 5,100,000 | | | | 288,201 | | |
| | | | 2,413,199 | | |
Health Care (4.5%): | |
Hologic, Inc. (a) | | | 1,865,000 | | | | 134,261 | | |
Molina Healthcare, Inc. (a) | | | 446,700 | | | | 140,018 | | |
Quest Diagnostics, Inc. | | | 1,900,000 | | | | 254,296 | | |
The Cooper Cos., Inc. | | | 615,000 | | | | 222,040 | | |
| | | | 750,615 | | |
Industrials (20.6%): | |
AGCO Corp. | | | 1,790,000 | | | | 228,046 | | |
Alaska Air Group, Inc. (a) | | | 4,370,000 | | | | 237,684 | | |
Hubbell, Inc. | | | 1,400,000 | | | | 273,504 | | |
See notes to financial statements.
6
Victory Portfolios
Victory Sycamore Established Value Fund | | Schedule of Portfolio Investments — continued
April 30, 2022 | |
(Amounts in Thousands, Except for Shares) (Unaudited)
Security Description | | Shares | | Value | |
J.B. Hunt Transport Services, Inc. | | | 845,000 | | | $ | 144,368 | | |
Landstar System, Inc. | | | 1,130,000 | | | | 175,037 | | |
Leidos Holdings, Inc. | | | 2,450,000 | | | | 253,600 | | |
Lincoln Electric Holdings, Inc. | | | 1,230,000 | | | | 165,718 | | |
ManpowerGroup, Inc. | | | 1,730,000 | | | | 156,046 | | |
Oshkosh Corp. | | | 1,725,000 | | | | 159,459 | | |
Owens Corning | | | 1,845,000 | | | | 167,766 | | |
Parker-Hannifin Corp. | | | 830,000 | | | | 224,781 | | |
Republic Services, Inc. | | | 1,335,000 | | | | 179,250 | | |
Textron, Inc. | | | 4,120,000 | | | | 285,310 | | |
The Middleby Corp. (a) | | | 1,554,300 | | | | 239,191 | | |
The Toro Co. | | | 2,960,000 | | | | 237,185 | | |
United Rentals, Inc. (a) | | | 520,000 | | | | 164,590 | | |
Xylem, Inc. | | | 1,515,000 | | | | 121,958 | | |
| | | | 3,413,493 | | |
Information Technology (10.8%): | |
Amphenol Corp., Class A | | | 3,037,500 | | | | 217,181 | | |
DXC Technology Co. (a) | | | 5,520,000 | | | | 158,424 | | |
Flex Ltd. (a) | | | 14,650,000 | | | | 241,579 | | |
Genpact Ltd. | | | 5,770,000 | | | | 232,358 | | |
Global Payments, Inc. | | | 1,745,000 | | | | 239,030 | | |
Hewlett Packard Enterprise Co. | | | 11,195,600 | | | | 172,524 | | |
Maximus, Inc. (b) | | | 3,455,000 | | | | 251,800 | | |
MKS Instruments, Inc. | | | 1,315,000 | | | | 149,884 | | |
Motorola Solutions, Inc. | | | 610,000 | | | | 130,351 | | |
| | | | 1,793,131 | | |
Materials (12.4%): | |
AptarGroup, Inc. | | | 1,510,000 | | | | 173,393 | | |
Avery Dennison Corp. | | | 1,455,000 | | | | 262,773 | | |
Corteva, Inc. | | | 3,280,000 | | | | 189,223 | | |
International Flavors & Fragrances, Inc. | | | 1,150,000 | | | | 139,495 | | |
Packaging Corp. of America | | | 2,005,000 | | | | 323,146 | | |
Reliance Steel & Aluminum Co. | | | 1,285,000 | | | | 254,751 | | |
RPM International, Inc. | | | 1,975,000 | | | | 163,728 | | |
Steel Dynamics, Inc. | | | 2,585,000 | | | | 221,664 | | |
Westlake Corp. | | | 2,480,000 | | | | 313,844 | | |
| | | | 2,042,017 | | |
Real Estate (9.0%): | |
Alexandria Real Estate Equities, Inc. | | | 1,310,000 | | | | 238,630 | | |
American Homes 4 Rent, Class A | | | 4,975,000 | | | | 197,060 | | |
Camden Property Trust | | | 1,205,000 | | | | 189,052 | | |
Duke Realty Corp. | | | 2,483,300 | | | | 135,961 | | |
Equity LifeStyle Properties, Inc. | | | 3,000,000 | | | | 231,840 | | |
Lamar Advertising Co., Class A | | | 2,240,000 | | | | 247,318 | | |
National Retail Properties, Inc. (c) | | | 5,525,000 | | | | 242,216 | | |
| | | | 1,482,077 | | |
See notes to financial statements.
7
Victory Portfolios
Victory Sycamore Established Value Fund | | Schedule of Portfolio Investments — continued
April 30, 2022 | |
(Amounts in Thousands, Except for Shares) (Unaudited)
Security Description | | Shares | | Value | |
Utilities (3.3%): | |
Alliant Energy Corp. | | | 4,520,000 | | | $ | 265,821 | | |
Xcel Energy, Inc. | | | 3,900,000 | | | | 285,714 | | |
| | | | 551,535 | | |
Total Common Stocks (Cost $12,272,815) | | | 15,947,111 | | |
Exchange-Traded Funds (1.2%) | |
iShares Russell Mid-Cap Value ETF (c) | | | 1,800,000 | | | | 202,338 | | |
Total Exchange-Traded Funds (Cost $140,770) | | | 202,338 | | |
Collateral for Securities Loaned (0.2%)^ | |
BlackRock Liquidity Funds TempFund, Institutional Shares, 0.31% (d) | | | 525,486 | | | | 525 | | |
Fidelity Investments Money Market Government Portfolio, Institutional
Shares, 0.19% (d) | | | 14,551,230 | | | | 14,551 | | |
Goldman Sachs Financial Square Prime Obligations Fund, Institutional
Shares, 0.45% (d) | | | 262,244 | | | | 262 | | |
JPMorgan Prime Money Market Fund, Capital Shares, 0.40% (d) | | | 2,091,049 | | | | 2,092 | | |
Morgan Stanley Institutional Liquidity Prime Portfolio, Institutional
Shares, 0.37% (d) | | | 9,401,764 | | | | 9,402 | | |
Total Collateral for Securities Loaned (Cost $26,832) | | | 26,832 | | |
Total Investments (Cost $12,440,417) — 97.8% | | | 16,176,281 | | |
Other assets in excess of liabilities — 2.2% | | | 357,715 | | |
NET ASSETS — 100.00% | | $ | 16,533,996 | | |
^ Purchased with cash collateral from securities on loan.
(a) Non-income producing security.
(b) Affiliated security (See Note 8 in the Notes to Financial Statements).
(c) All or a portion of this security is on loan.
(d) Rate disclosed is the daily yield on April 30, 2022.
ETF — Exchange-Traded Fund
PLC — Public Limited Company
See notes to financial statements.
8
Victory Portfolios
Victory Sycamore Small Company Opportunity Fund | | Schedule of Portfolio Investments
April 30, 2022 | |
(Amounts in Thousands, Except for Shares) (Unaudited)
Security Description | | Shares | | Value | |
Common Stocks (96.4%) | |
Aerospace & Defense (1.2%): | |
Hexcel Corp. | | | 1,400,000 | | | $ | 76,104 | | |
Air Freight & Logistics (1.3%): | |
Forward Air Corp. | | | 330,000 | | | | 32,000 | | |
Hub Group, Inc., Class A (a) | | | 780,000 | | | | 52,385 | | |
| | | | 84,385 | | |
Airlines (0.3%): | |
Frontier Group Holdings, Inc. (a) (b) | | | 1,700,000 | | | | 18,037 | | |
Building Products (1.9%): | |
Gibraltar Industries, Inc. (a) | | | 775,000 | | | | 29,326 | | |
UFP Industries, Inc. | | | 1,140,000 | | | | 88,202 | | |
| | | | 117,528 | | |
Commercial Services & Supplies (3.7%): | |
ABM Industries, Inc. | | | 1,207,000 | | | | 58,262 | | |
McGrath RentCorp | | | 805,000 | | | | 67,185 | | |
UniFirst Corp. | | | 305,000 | | | | 52,552 | | |
Viad Corp. (a) (c) | | | 1,720,000 | | | | 56,330 | | |
| | | | 234,329 | | |
Communication Services (1.0%): | |
The E.W. Scripps Co., Class A (a) (c) | | | 3,640,000 | | | | 59,914 | | |
Construction & Engineering (3.2%): | |
Comfort Systems USA, Inc. | | | 505,000 | | | | 42,632 | | |
EMCOR Group, Inc. | | | 860,000 | | | | 91,573 | | |
MYR Group, Inc. (a) | | | 315,000 | | | | 24,913 | | |
Valmont Industries, Inc. | | | 182,000 | | | | 45,284 | | |
| | | | 204,402 | | |
Consumer Discretionary (8.4%): | |
Carter's, Inc. (b) | | | 540,000 | | | | 45,490 | | |
Choice Hotels International, Inc. | | | 218,000 | | | | 30,620 | | |
Citi Trends, Inc. (a) (b) (c) | | | 515,500 | | | | 14,418 | | |
Columbia Sportswear Co. | | | 490,000 | | | | 40,258 | | |
Helen of Troy Ltd. (a) | | | 210,000 | | | | 45,047 | | |
Hyatt Hotels Corp., Class A (a) | | | 620,000 | | | | 58,875 | | |
LCI Industries (b) | | | 380,000 | | | | 36,982 | | |
Mattel, Inc. (a) | | | 3,535,000 | | | | 85,936 | | |
Murphy USA, Inc. | | | 251,400 | | | | 58,727 | | |
Signet Jewelers Ltd. (b) | | | 580,000 | | | | 40,716 | | |
Visteon Corp. (a) | | | 656,000 | | | | 68,690 | | |
| | | | 525,759 | | |
Consumer Staples (5.5%): | |
Central Garden & Pet Co., Class A (a) | | | 742,800 | | | | 30,737 | | |
Edgewell Personal Care Co. (b) | | | 886,500 | | | | 33,811 | | |
Ingredion, Inc. | | | 835,000 | | | | 71,067 | | |
Lancaster Colony Corp. | | | 260,000 | | | | 40,347 | | |
See notes to financial statements.
9
Victory Portfolios
Victory Sycamore Small Company Opportunity Fund | | Schedule of Portfolio Investments — continued
April 30, 2022 | |
(Amounts in Thousands, Except for Shares) (Unaudited)
Security Description | | Shares | | Value | |
Performance Food Group Co. (a) | | | 1,810,000 | | | $ | 89,143 | | |
Spectrum Brands Holdings, Inc. | | | 635,000 | | | | 54,019 | | |
The Hain Celestial Group, Inc. (a) | | | 819,500 | | | | 27,486 | | |
| | | | 346,610 | | |
Energy (4.8%): | |
Delek U.S. Holdings, Inc. (a) (c) | | | 3,670,000 | | | | 88,814 | | |
Helix Energy Solutions Group, Inc. (a) | | | 5,568,000 | | | | 22,885 | | |
Magnolia Oil & Gas Corp., Class A | | | 2,794,500 | | | | 64,944 | | |
PDC Energy, Inc. | | | 1,815,000 | | | | 126,578 | | |
| | | | 303,221 | | |
Financials (15.6%): | |
AMERISAFE, Inc. (c) | | | 985,000 | | | | 45,655 | | |
Bank of Hawaii Corp. | | | 1,125,000 | | | | 83,632 | | |
Cohen & Steers, Inc. | | | 736,200 | | | | 57,195 | | |
Eagle Bancorp, Inc. | | | 1,105,000 | | | | 55,637 | | |
First American Financial Corp. | | | 871,400 | | | | 50,811 | | |
Independent Bank Corp. | | | 1,370,000 | | | | 105,709 | | |
Lakeland Financial Corp. (b) | | | 610,000 | | | | 44,420 | | |
Pinnacle Financial Partners, Inc. | | | 505,000 | | | | 39,163 | | |
RenaissanceRe Holdings Ltd. | | | 158,300 | | | | 22,719 | | |
Renasant Corp. | | | 2,000,000 | | | | 59,580 | | |
Ryan Specialty Group Holdings, Inc., Class A (a) (b) | | | 1,180,000 | | | | 43,648 | | |
Selective Insurance Group, Inc. | | | 725,000 | | | | 59,711 | | |
SouthState Corp. | | | 1,270,000 | | | | 98,349 | | |
Stewart Information Services Corp. | | | 715,000 | | | | 36,894 | | |
The Hanover Insurance Group, Inc. | | | 159,200 | | | | 23,374 | | |
UMB Financial Corp. | | | 1,000,000 | | | | 90,180 | | |
Wintrust Financial Corp. | | | 780,000 | | | | 68,110 | | |
| | | | 984,787 | | |
Health Care (3.5%): | |
AngioDynamics, Inc. (a) (c) | | | 1,970,000 | | | | 41,468 | | |
Chemed Corp. | | | 109,000 | | | | 53,562 | | |
Hanger, Inc. (a) (c) | | | 2,570,000 | | | | 42,251 | | |
Integer Holdings Corp. (a) | | | 470,000 | | | | 35,330 | | |
Natus Medical, Inc. (a) | | | 1,361,000 | | | | 45,280 | | |
| | | | 217,891 | | |
Industrial Conglomerates (0.5%): | |
Carlisle Cos., Inc. | | | 130,000 | | | | 33,717 | | |
Information Technology (11.0%): | |
ADTRAN, Inc. | | | 811,600 | | | | 14,114 | | |
Advanced Energy Industries, Inc. | | | 657,000 | | | | 50,274 | | |
Avnet, Inc. | | | 2,005,000 | | | | 87,538 | | |
Belden, Inc. | | | 1,100,000 | | | | 56,793 | | |
Cognyte Software Ltd. (a) | | | 3,179,800 | | | | 21,559 | | |
Cohu, Inc. (a) | | | 1,760,000 | | | | 46,746 | | |
Fabrinet (a) | | | 490,000 | | | | 48,113 | | |
Kulicke & Soffa Industries, Inc. (b) | | | 990,000 | | | | 45,946 | | |
See notes to financial statements.
10
Victory Portfolios
Victory Sycamore Small Company Opportunity Fund | | Schedule of Portfolio Investments — continued
April 30, 2022 | |
(Amounts in Thousands, Except for Shares) (Unaudited)
Security Description | | Shares | | Value | |
Littelfuse, Inc. | | | 206,400 | | | $ | 47,317 | | |
Maximus, Inc. | | | 520,000 | | | | 37,898 | | |
NETGEAR, Inc. (a) (c) | | | 2,100,000 | | | | 45,570 | | |
Plexus Corp. (a) (b) | | | 585,000 | | | | 47,467 | | |
ScanSource, Inc. (a) (c) | | | 1,535,000 | | | | 52,558 | | |
Verint Systems, Inc. (a) | | | 1,645,000 | | | | 89,751 | | |
| | | | 691,644 | | |
Machinery (6.7%): | |
Alamo Group, Inc. | | | 435,000 | | | | 55,002 | | |
Altra Industrial Motion Corp. | | | 1,290,000 | | | | 50,310 | | |
Astec Industries, Inc. | | | 1,050,000 | | | | 41,055 | | |
Columbus McKinnon Corp. (b) | | | 940,000 | | | | 33,323 | | |
Crane Co. (b) | | | 610,000 | | | | 58,700 | | |
Hillenbrand, Inc. | | | 1,010,000 | | | | 41,228 | | |
Kennametal, Inc. | | | 1,614,000 | | | | 41,528 | | |
Mueller Industries, Inc. | | | 1,000,000 | | | | 54,150 | | |
The Manitowoc Co., Inc. (a) | | | 1,400,000 | | | | 18,536 | | |
Watts Water Technologies, Inc., Class A | | | 226,400 | | | | 28,857 | | |
| | | | 422,689 | | |
Materials (8.3%): | |
Cabot Corp. | | | 745,000 | | | | 49,058 | | |
Eagle Materials, Inc. | | | 255,000 | | | | 31,447 | | |
Innospec, Inc. | | | 646,100 | | | | 61,580 | | |
Kaiser Aluminum Corp. | | | 735,000 | | | | 70,928 | | |
Minerals Technologies, Inc. | | | 796,100 | | | | 50,640 | | |
Silgan Holdings, Inc. | | | 1,834,400 | | | | 81,392 | | |
Sonoco Products Co. | | | 1,395,000 | | | | 86,364 | | |
TriMas Corp. | | | 1,800,000 | | | | 53,172 | | |
Worthington Industries, Inc. | | | 800,000 | | | | 38,056 | | |
| | | | 522,637 | | |
Professional Services (3.2%): | |
CBIZ, Inc. (a) | | | 1,150,000 | | | | 48,174 | | |
ICF International, Inc. | | | 740,000 | | | | 73,119 | | |
Korn Ferry | | | 487,600 | | | | 29,958 | | |
ManTech International Corp., Class A | | | 660,000 | | | | 53,024 | | |
| | | | 204,275 | | |
Real Estate (8.3%): | |
Apple Hospitality REIT, Inc. | | | 5,029,600 | | | | 88,974 | | |
Colliers International Group, Inc. | | | 394,000 | | | | 43,438 | | |
Corporate Office Properties Trust | | | 3,110,000 | | | | 83,006 | | |
Cushman & Wakefield PLC (a) | | | 3,125,000 | | | | 55,938 | | |
First Industrial Realty Trust, Inc. | | | 1,320,000 | | | | 76,560 | | |
Four Corners Property Trust, Inc. (b) | | | 2,828,500 | | | | 77,671 | | |
Rayonier, Inc. | | | 2,187,000 | | | | 94,478 | | |
| | | | 520,065 | | |
See notes to financial statements.
11
Victory Portfolios
Victory Sycamore Small Company Opportunity Fund | | Schedule of Portfolio Investments — continued
April 30, 2022 | |
(Amounts in Thousands, Except for Shares) (Unaudited)
Security Description | | Shares | | Value | |
Road & Rail (2.4%): | |
Marten Transport Ltd. | | | 4,090,000 | | | $ | 71,084 | | |
Werner Enterprises, Inc. | | | 2,000,000 | | | | 79,260 | | |
| | | | 150,344 | | |
Trading Companies & Distributors (2.5%): | |
Applied Industrial Technologies, Inc. | | | 985,000 | | | | 103,120 | | |
Core & Main, Inc., Class A (a) (b) | | | 2,240,000 | | | | 53,222 | | |
| | | | 156,342 | | |
Utilities (3.1%): | |
ALLETE, Inc. | | | 785,000 | | | | 46,582 | | |
MGE Energy, Inc. | | | 601,700 | | | | 46,854 | | |
NorthWestern Corp. | | | 885,000 | | | | 50,171 | | |
ONE Gas, Inc. | | | 595,000 | | | | 50,200 | | |
| | | | 193,807 | | |
Total Common Stocks (Cost $5,121,659) | | | 6,068,487 | | |
Exchange-Traded Funds (0.8%) | |
iShares Russell 2000 Value ETF (b) | | | 340,600 | | | | 50,688 | | |
Total Exchange-Traded Funds (Cost $38,751) | | | 50,688 | | |
Collateral for Securities Loaned (1.9%)^ | |
BlackRock Liquidity Funds TempFund, Institutional Shares, 0.31% (d) | | | 2,360,965 | | | | 2,361 | | |
Fidelity Investments Money Market Government Portfolio, Institutional
Shares, 0.19% (d) | | | 65,377,433 | | | | 65,378 | | |
Goldman Sachs Financial Square Prime Obligations Fund, Institutional
Shares, 0.45% (d) | | | 1,178,238 | | | | 1,178 | | |
JPMorgan Prime Money Market Fund, Capital Shares, 0.40% (d) | | | 9,394,905 | | | | 9,395 | | |
Morgan Stanley Institutional Liquidity Prime Portfolio, Institutional
Shares, 0.37% (d) | | | 42,241,325 | | | | 42,241 | | |
Total Collateral for Securities Loaned (Cost $120,553) | | | 120,553 | | |
Total Investments (Cost $5,280,963) — 99.1% | | | 6,239,728 | | |
Other assets in excess of liabilities — 0.9% | | | 55,603 | | |
NET ASSETS — 100.00% | | $ | 6,295,331 | | |
^ Purchased with cash collateral from securities on loan.
(a) Non-income producing security.
(b) All or a portion of this security is on loan.
(c) Affiliated security (See Note 8 in the Notes to Financial Statements).
(d) Rate disclosed is the daily yield on April 30, 2022.
ETF — Exchange-Traded Fund
PLC — Public Limited Company
REIT — Real Estate Investment Trust
See notes to financial statements.
12
Victory Portfolios | | Statements of Assets and Liabilities
April 30, 2022 | |
(Amounts in Thousands, Except Per Share Amounts) (Unaudited)
| | | Victory
Sycamore
Established
Value Fund | | Victory
Sycamore
Small Company
Opportunity
Fund | |
Assets: | |
Affiliated investments, at value (Cost $222,456 and $495,136) | | $ | 251,800 | | | $ | 446,978 | | |
Unaffiliated investments, at value (Cost $12,217,961 and
$4,785,827) | | | 15,924,481 | (a) | | | 5,792,750 | (b) | |
Cash | | | 385,273 | | | | 166,602 | | |
Receivables: | |
Interest and dividends | | | 7,172 | | | | 1,487 | | |
From affiliate on interfund lending | | | 34,798 | | | | — | | |
Capital shares issued | | | 23,580 | | | | 4,281 | | |
Investments sold | | | 25,111 | | | | 28,860 | | |
Prepaid expenses | | | 243 | | | | 113 | | |
Total Assets | | | 16,652,458 | | | | 6,441,071 | | |
Liabilities: | |
Payables: | |
Collateral received on loaned securities | | | 26,832 | | | | 120,553 | | |
Investments purchased | | | 24,147 | | | | 13,477 | | |
Capital shares redeemed | | | 58,030 | | | | 6,315 | | |
Accrued expenses and other payables: | |
Investment advisory fees | | | 6,306 | | | | 4,080 | | |
Administration fees | | | 846 | | | | 334 | | |
Custodian fees | | | 119 | | | | 52 | | |
Transfer agent fees | | | 1,117 | | | | 415 | | |
Compliance fees | | | 9 | | | | 4 | | |
Trustees' fees | | | 6 | | | | 2 | | |
| 12b-1 fees | | | 390 | | | | 87 | | |
Other accrued expenses | | | 660 | | | | 421 | | |
Total Liabilities | | | 118,462 | | | | 145,740 | | |
Net Assets: | |
Capital | | | 12,291,732 | | | | 5,106,775 | | |
Total accumulated earnings/(loss) | | | 4,242,264 | | | | 1,188,556 | | |
Net Assets | | $ | 16,533,996 | | | $ | 6,295,331 | | |
Net Assets | |
Class A | | $ | 1,717,386 | | | $ | 361,104 | | |
Class C | | | 62,368 | | | | — | | |
Class I | | | 5,283,133 | | | | 3,457,789 | | |
Class R | | | 863,670 | | | | 226,564 | | |
Class R6 | | | 7,890,628 | | | | 2,224,247 | | |
Class Y | | | 716,811 | | | | 25,627 | | |
Total | | $ | 16,533,996 | | | $ | 6,295,331 | | |
Shares (unlimited number of shares authorized with a
par value of $0.001 per share): | |
Class A | | | 35,734 | | | | 7,643 | | |
Class C | | | 1,335 | | | | — | | |
Class I | | | 109,811 | | | | 72,174 | | |
Class R | | | 18,280 | | | | 5,228 | | |
Class R6 | | | 163,929 | | | | 46,507 | | |
Class Y | | | 14,901 | | | | 539 | | |
Total | | | 343,990 | | | | 132,091 | | |
(continues on next page)
See notes to financial statements.
13
Victory Portfolios | | Statements of Assets and Liabilities
April 30, 2022 | |
(Amounts in Thousands, Except Per Share Amounts) (Unaudited) (continued)
| | | Victory
Sycamore
Established
Value Fund | | Victory
Sycamore
Small Company
Opportunity
Fund | |
Net asset value, offering (except Class A)
and redemption price per share: (c) | |
Class A | | $ | 48.06 | | | $ | 47.25 | | |
Class C | | | 46.70 | | | | — | | |
Class I | | | 48.11 | | | | 47.91 | | |
Class R | | | 47.25 | | | | 43.34 | | |
Class R6 | | | 48.13 | | | | 47.83 | | |
Class Y | | | 48.10 | | | | 47.53 | | |
Maximum Sales Charge — Class A | | | 5.75 | % | | | 5.75 | % | |
Maximum offering price
(100%/(100%-maximum sales charge) of net asset value
adjusted to the nearest cent) per share — Class A | | $ | 50.99 | | | $ | 50.13 | | |
(a) Includes $25,189 of securities on loan.
(b) Includes $112,733 of securities on loan.
(c) Per share amount may not recalculate due to rounding of net assets and/or shares outstanding.
See notes to financial statements.
14
Victory Portfolios | | Statements of Operations
For the Six Months Ended April 30, 2022 | |
(Amounts in Thousands, Except Per Share Amounts) (Unaudited)
| | | Victory
Sycamore
Established
Value Fund | | Victory
Sycamore
Small Company
Opportunity
Fund | |
Investment Income: | | | |
Dividends from affiliated investments | | $ | 1,746 | | | $ | 4,669 | | |
Dividends from unaffiliated investments | | | 177,935 | | | | 45,508 | | |
Interest from unaffiliated investments | | | 49 | | | | 19 | | |
Interfund lending | | | 12 | | | | — | | |
Securities lending (net of fees) | | | 1 | | | | 76 | | |
Foreign tax withholding | | | — | | | | (9 | ) | |
Total Income | | | 179,743 | | | | 50,263 | | |
Expenses: | | | |
Investment advisory fees | | | 37,596 | | | | 26,295 | | |
Administration fees | | | 4,491 | | | | 1,874 | | |
Sub-Administration fees | | | 8 | | | | 8 | | |
| 12b-1 fees — Class A | | | 2,188 | | | | 499 | | |
| 12b-1 fees — Class C | | | 328 | | | | — | | |
| 12b-1 fees — Class R | | | 2,265 | | | | 623 | | |
Custodian fees | | | 352 | | | | 152 | | |
Transfer agent fees — Class A | | | 972 | | | | 309 | | |
Transfer agent fees — Class C | | | 34 | | | | — | | |
Transfer agent fees — Class I | | | 1,363 | | | | 987 | | |
Transfer agent fees — Class R | | | 350 | | | | 103 | | |
Transfer agent fees — Class R6 | | | 121 | | | | 20 | | |
Transfer agent fees — Class Y | | | 364 | | | | 14 | | |
Trustees' fees | | | 449 | | | | 191 | | |
Compliance fees | | | 58 | | | | 24 | | |
Legal and audit fees | | | 289 | | | | 125 | | |
State registration and filing fees | | | 164 | | | | 91 | | |
Other expenses | | | 816 | | | | 496 | | |
Total Expenses | | | 52,208 | | | | 31,811 | | |
Net Investment Income (Loss) | | | 127,535 | | | | 18,452 | | |
Realized/Unrealized Gains (Losses) from Investments: | | | |
Net realized gains (losses) from affiliated investment securities | | | — | | | | (7,909 | ) | |
Net realized gains (losses) from unaffiliated investment securities | | | 520,208 | | | | 250,282 | | |
Net change in unrealized appreciation/depreciation on
affiliated investment securities | | | (37,068 | ) | | | (73,782 | ) | |
Net change in unrealized appreciation/depreciation on
unaffiliated investment securities | | | (538,694 | ) | | | (565,532 | ) | |
Net realized/unrealized gains (losses) on investments | | | (55,554 | ) | | | (396,941 | ) | |
Change in net assets resulting from operations | | $ | 71,981 | | | $ | (378,489 | ) | |
See notes to financial statements.
15
Victory Portfolios | | Statements of Change in Net Assets | |
(Amounts in Thousands)
| | | Victory Sycamore
Established
Value Fund | | Victory Sycamore
Small Company
Opportunity Fund | |
| | | Six
Months
Ended
April 30,
2022
(Unaudited) | | Year
Ended
October 31,
2021 | | Six
Months
Ended
April 30,
2022
(Unaudited) | | Year
Ended
October 31,
2021 | |
From Investment Activities: | |
Operations: | |
Net Investment Income (Loss) | | $ | 127,535 | | | $ | 230,697 | | | $ | 18,452 | | | $ | 25,280 | | |
Net realized gains (losses) | | | 520,208 | | | | 1,200,711 | | | | 242,373 | | | | 891,810 | | |
Net change in unrealized appreciation/
depreciation | | | (575,762 | ) | | | 4,048,780 | | | | (639,314 | ) | | | 1,501,409 | | |
Change in net assets resulting from
operations | | | 71,981 | | | | 5,480,188 | | | | (378,489 | ) | | | 2,418,499 | | |
Distributions to Shareholders: | |
Class A | | | (128,008 | ) | | | (82,155 | ) | | | (47,738 | ) | | | (2,698 | ) | |
Class C | | | (4,754 | ) | | | (2,825 | ) | | | — | | | | — | | |
Class I | | | (395,148 | ) | | | (215,656 | ) | | | (441,800 | ) | | | (30,516 | ) | |
Class R | | | (68,057 | ) | | | (38,781 | ) | | | (31,189 | ) | | | (1,442 | ) | |
Class R6 | | | (570,373 | ) | | | (304,092 | ) | | | (301,384 | ) | | | (20,349 | ) | |
Class Y | | | (63,130 | ) | | | (38,108 | ) | | | (3,832 | ) | | | (228 | ) | |
Change in net assets resulting from
distributions to shareholders | | | (1,229,470 | ) | | | (681,617 | ) | | | (825,943 | ) | | | (55,233 | ) | |
Change in net assets resulting from capital
transactions | | | 1,161,043 | | | | 1,258,292 | | | | 426,314 | | | | (135,276 | ) | |
Change in net assets | | | 3,554 | | | | 6,056,863 | | | | (778,118 | ) | | | 2,227,990 | | |
Net Assets: | |
Beginning of period | | | 16,530,442 | | | | 10,473,579 | | | | 7,073,449 | | | | 4,845,459 | | |
End of period | | $ | 16,533,996 | | | $ | 16,530,442 | | | $ | 6,295,331 | | | $ | 7,073,449 | | |
(continues on next page)
See notes to financial statements.
16
Victory Portfolios | | Statements of Change in Net Assets | |
(Amounts in Thousands) (continued)
| | | Victory Sycamore
Established
Value Fund | | Victory Sycamore
Small Company
Opportunity Fund | |
| | | Six
Months
Ended
April 30,
2022
(Unaudited) | | Year
Ended
October 31,
2021 | | Six
Months
Ended
April 30,
2022
(Unaudited) | | Year
Ended
October 31,
2021 | |
Capital Transactions: | |
Class A | |
Proceeds from shares issued | | $ | 198,207 | | | $ | 316,369 | | | $ | 36,818 | | | $ | 91,245 | | |
Distributions reinvested | | | 108,796 | | | | 69,394 | | | | 39,941 | | | | 2,255 | | |
Cost of shares redeemed | | | (255,149 | ) | | | (578,155 | ) | | | (71,404 | ) | | | (161,535 | ) | |
Total Class A | | $ | 51,854 | | | $ | (192,392 | ) | | $ | 5,355 | | | $ | (68,035 | ) | |
Class C | |
Proceeds from shares issued | | $ | 466 | | | $ | 1,691 | | | $ | — | | | $ | — | | |
Distributions reinvested | | | 4,625 | | | | 2,735 | | | | — | | | | — | | |
Cost of shares redeemed | | | (5,713 | ) | | | (14,289 | ) | | | — | | | | — | | |
Total Class C | | $ | (622 | ) | | $ | (9,863 | ) | | $ | — | | | $ | — | | |
Class I | |
Proceeds from shares issued | | $ | 606,782 | | | $ | 1,448,698 | | | $ | 292,789 | | | $ | 753,269 | | |
Distributions reinvested | | | 334,784 | | | | 184,882 | | | | 415,540 | | | | 28,267 | | |
Cost of shares redeemed | | | (602,946 | ) | | | (1,151,120 | ) | | | (447,140 | ) | | | (917,576 | ) | |
Total Class I | | $ | 338,620 | | | $ | 482,460 | | | $ | 261,189 | | | $ | (136,040 | ) | |
Class R | |
Proceeds from shares issued | | $ | 89,216 | | | $ | 184,333 | | | $ | 21,200 | | | $ | 45,316 | | |
Distributions reinvested | | | 67,190 | | | | 38,246 | | | | 30,913 | | | | 1,426 | | |
Cost of shares redeemed | | | (164,023 | ) | | | (206,480 | ) | | | (37,622 | ) | | | (83,973 | ) | |
Total Class R | | $ | (7,617 | ) | | $ | 16,099 | | | $ | 14,491 | | | $ | (37,231 | ) | |
Class R6 | |
Proceeds from shares issued | | $ | 1,193,216 | | | $ | 2,058,418 | | | $ | 369,806 | | | $ | 696,838 | | |
Distributions reinvested | | | 559,414 | | | | 298,880 | | | | 289,072 | | | | 19,320 | | |
Cost of shares redeemed | | | (874,119 | ) | | | (1,400,472 | ) | | | (511,388 | ) | | | (617,635 | ) | |
Total Class R6 | | $ | 878,511 | | | $ | 956,826 | | | $ | 147,490 | | | $ | 98,523 | | |
Class Y | |
Proceeds from shares issued | | $ | 150,903 | | | $ | 367,701 | | | $ | 3,112 | | | $ | 15,804 | | |
Distributions reinvested | | | 59,336 | | | | 36,208 | | | | 3,515 | | | | 207 | | |
Cost of shares redeemed | | | (309,942 | ) | | | (398,747 | ) | | | (8,838 | ) | | | (8,504 | ) | |
Total Class Y | | $ | (99,703 | ) | | $ | 5,162 | | | $ | (2,211 | ) | | $ | 7,507 | | |
Change in net assets resulting from
capital transactions | | $ | 1,161,043 | | | $ | 1,258,292 | | | $ | 426,314 | | | $ | (135,276 | ) | |
(continues on next page)
See notes to financial statements.
17
Victory Portfolios | | Statements of Change in Net Assets | |
(Amounts in Thousands) (continued)
| | | Victory Sycamore
Established
Value Fund | | Victory Sycamore
Small Company
Opportunity Fund | |
| | | Six
Months
Ended
April 30,
2022
(Unaudited) | | Year
Ended
October 31,
2021 | | Six
Months
Ended
April 30,
2022
(Unaudited) | | Year
Ended
October 31,
2021 | |
Share Transactions: | |
Class A | |
Issued | | | 4,010 | | | | 6,696 | | | | 719 | | | | 1,750 | | |
Reinvested | | | 2,237 | | | | 1,666 | | | | 797 | | | | 49 | | |
Redeemed | | | (5,153 | ) | | | (12,340 | ) | | | (1,384 | ) | | | (3,154 | ) | |
Total Class A | | | 1,094 | | | | (3,978 | ) | | | 132 | | | | (1,355 | ) | |
Class C | |
Issued | | | 9 | | | | 37 | | | | — | | | | — | | |
Reinvested | | | 98 | | | | 69 | | | | — | | | | — | | |
Redeemed | | | (119 | ) | | | (315 | ) | | | — | | | | — | | |
Total Class C | | | (12 | ) | | | (209 | ) | | | — | | | | — | | |
Class I | |
Issued | | | 12,263 | | | | 30,624 | | | | 5,625 | | | | 14,282 | | |
Reinvested | | | 6,875 | | | | 4,393 | | | | 8,163 | | | | 605 | | |
Redeemed | | | (12,212 | ) | | | (24,567 | ) | | | (8,622 | ) | | | (17,329 | ) | |
Total Class I | | | 6,926 | | | | 10,450 | | | | 5,166 | | | | (2,442 | ) | |
Class R | |
Issued | | | 1,829 | | | | 4,046 | | | | 453 | | | | 918 | | |
Reinvested | | | 1,405 | | | | 935 | | | | 673 | | | | 33 | | |
Redeemed | | | (3,386 | ) | | | (4,524 | ) | | | (804 | ) | | | (1,751 | ) | |
Total Class R | | | (152 | ) | | | 457 | | | | 322 | | | | (800 | ) | |
Class R6 | |
Issued | | | 24,098 | | | | 43,452 | | | | 6,940 | | | | 12,955 | | |
Reinvested | | | 11,482 | | | | 7,091 | | | | 5,687 | | | | 414 | | |
Redeemed | | | (17,699 | ) | | | (30,224 | ) | | | (10,135 | ) | | | (11,730 | ) | |
Total Class R6 | | | 17,881 | | | | 20,319 | | | | 2,492 | | | | 1,639 | | |
Class Y | |
Issued | | | 3,037 | | | | 7,724 | | | | 61 | | | | 320 | | |
Reinvested | | | 1,219 | | | | 861 | | | | 70 | | | | 4 | | |
Redeemed | | | (6,270 | ) | | | (8,452 | ) | | | (177 | ) | | | (160 | ) | |
Total Class Y | | | (2,014 | ) | | | 133 | | | | (46 | ) | | | 164 | | |
Change in Shares | | | 23,723 | | | | 27,172 | | | | 8,066 | | | | (2,794 | ) | |
See notes to financial statements.
18
This page is intentionally left blank.
19
Victory Portfolios | | Financial Highlights | |
For a Share Outstanding Throughout Each Period
| | | | Investment Activities | | Distributions to
Shareholders From | |
| | | Net Asset
Value,
Beginning of
Period | | Net
Investment
Income
(Loss)(a) | | Net Realized
and Unrealized
Gains (Losses) | | Total from
Investment
Activities | | Net
Investment
Income | | Net Realized
Gains from
Investments | |
Victory Sycamore Established Value Fund | | | |
Class A | | | |
Six Months Ended
April 30, 2022
(Unaudited) | | $ | 51.62 | | | | 0.31 | | | | (0.13 | ) | | | 0.18 | | | | (0.43 | ) | | | (3.31 | ) | |
Year Ended October 31: | |
2021 | | $ | 35.75 | | | | 0.62 | | | | 17.44 | | | | 18.06 | | | | (0.52 | ) | | | (1.67 | ) | |
2020 | | $ | 40.09 | | | | 0.48 | | | | (2.44 | ) | | | (1.96 | ) | | | (0.48 | ) | | | (1.90 | ) | |
2019 | | $ | 39.52 | | | | 0.40 | | | | 3.61 | | | | 4.01 | | | | (0.39 | ) | | | (3.05 | ) | |
2018 | | $ | 40.01 | | | | 0.35 | | | | 0.48 | | | | 0.83 | | | | (0.33 | ) | | | (0.99 | ) | |
2017 | | $ | 33.82 | | | | 0.22 | | | | 6.53 | | | | 6.75 | | | | (0.21 | ) | | | (0.35 | ) | |
Class C | | | |
Six Months Ended
April 30, 2022
(Unaudited) | | $ | 50.28 | | | | 0.12 | | | | (0.12 | ) | | | — | (e) | | | (0.27 | ) | | | (3.31 | ) | |
Year Ended October 31: | |
2021 | | $ | 34.89 | | | | 0.26 | | | | 17.00 | | | | 17.26 | | | | (0.20 | ) | | | (1.67 | ) | |
2020 | | $ | 39.16 | | | | 0.20 | | | | (2.35 | ) | | | (2.15 | ) | | | (0.22 | ) | | | (1.90 | ) | |
2019 | | $ | 38.69 | | | | 0.11 | | | | 3.53 | | | | 3.64 | | | | (0.12 | ) | | | (3.05 | ) | |
2018 | | $ | 39.22 | | | | 0.03 | | | | 0.46 | | | | 0.49 | | | | (0.03 | ) | | | (0.99 | ) | |
2017 | | $ | 33.26 | | | | (0.09 | ) | | | 6.44 | | | | 6.35 | | | | (0.04 | ) | | | (0.35 | ) | |
Class I | | | |
Six Months Ended
April 30, 2022
(Unaudited) | | $ | 51.66 | | | | 0.39 | | | | (0.13 | ) | | | 0.26 | | | | (0.50 | ) | | | (3.31 | ) | |
Year Ended October 31: | |
2021 | | $ | 35.77 | | | | 0.77 | | | | 17.44 | | | | 18.21 | | | | (0.65 | ) | | | (1.67 | ) | |
2020 | | $ | 40.12 | | | | 0.59 | | | | (2.45 | ) | | | (1.86 | ) | | | (0.59 | ) | | | (1.90 | ) | |
2019 | | $ | 39.55 | | | | 0.52 | | | | 3.62 | | | | 4.14 | | | | (0.52 | ) | | | (3.05 | ) | |
2018 | | $ | 40.04 | | | | 0.47 | | | | 0.48 | | | | 0.95 | | | | (0.45 | ) | | | (0.99 | ) | |
2017 | | $ | 33.83 | | | | 0.32 | | | | 6.56 | | | | 6.88 | | | | (0.32 | ) | | | (0.35 | ) | |
* Does not include acquired fund fees and expenses, if any.
(a) Per share net investment income (loss) has been calculated using the average daily shares method.
(b) Not annualized for periods less than one year.
(c) Annualized for periods less than one year.
(d) Portfolio turnover is calculated on the basis of the Fund as a whole without distinguishing between the classes of shares issued.
(e) Amount is less than $0.005 per share.
See notes to financial statements.
20
Victory Portfolios | | Financial Highlights — continued | |
For a Share Outstanding Throughout Each Period
| | | | | Ratios to Average Net Assets | | Supplemental Data | |
| | | Total
Distributions | | Net Asset
Value,
End of
Period | | Total
Return
(Excludes
Sales
Charge)(b) | | Net
Expenses*(c) | | Net
Investment
Income
(Loss)(c) | | Gross
Expenses*(c) | | Net Assets,
End of
Period
(000's) | | Portfolio
Turnover(b)(d) | |
Victory Sycamore Established Value Fund | |
Class A | |
Six Months Ended
April 30, 2022
(Unaudited) | | | (3.74 | ) | | $ | 48.06 | | | | 0.32 | % | | | 0.89 | % | | | 1.27 | % | | | 0.89 | % | | $ | 1,717,386 | | | | 17 | % | |
Year Ended October 31: | |
2021 | | | (2.19 | ) | | $ | 51.62 | | | | 52.05 | % | | | 0.90 | % | | | 1.32 | % | | | 0.90 | % | | $ | 1,788,115 | | | | 32 | % | |
2020 | | | (2.38 | ) | | $ | 35.75 | | | | (5.22 | )% | | | 0.92 | % | | | 1.34 | % | | | 0.92 | % | | $ | 1,380,509 | | | | 44 | % | |
2019 | | | (3.44 | ) | | $ | 40.09 | | | | 11.96 | % | | | 0.92 | % | | | 1.06 | % | | | 0.92 | % | | $ | 1,802,034 | | | | 34 | % | |
2018 | | | (1.32 | ) | | $ | 39.52 | | | | 2.01 | % | | | 0.89 | % | | | 0.85 | % | | | 0.89 | % | | $ | 2,008,143 | | | | 36 | % | |
2017 | | | (0.56 | ) | | $ | 40.01 | | | | 20.12 | % | | | 0.90 | % | | | 0.58 | % | | | 0.90 | % | | $ | 2,386,049 | | | | 32 | % | |
Class C | |
Six Months Ended
April 30, 2022
(Unaudited) | | | (3.58 | ) | | $ | 46.70 | | | | (0.07 | )% | | | 1.65 | % | | | 0.51 | % | | | 1.65 | % | | $ | 62,368 | | | | 17 | % | |
Year Ended October 31: | |
2021 | | | (1.87 | ) | | $ | 50.28 | | | | 50.91 | % | | | 1.66 | % | | | 0.56 | % | | | 1.66 | % | | $ | 67,718 | | | | 32 | % | |
2020 | | | (2.12 | ) | | $ | 34.89 | | | | (5.93 | )% | | | 1.69 | % | | | 0.58 | % | | | 1.69 | % | | $ | 54,271 | | | | 44 | % | |
2019 | | | (3.17 | ) | | $ | 39.16 | | | | 11.10 | % | | | 1.68 | % | | | 0.30 | % | | | 1.68 | % | | $ | 79,066 | | | | 34 | % | |
2018 | | | (1.02 | ) | | $ | 38.69 | | | | 1.19 | % | | | 1.68 | % | | | 0.07 | % | | | 1.68 | % | | $ | 90,128 | | | | 36 | % | |
2017 | | | (0.39 | ) | | $ | 39.22 | | | | 19.20 | % | | | 1.70 | % | | | (0.24 | )% | | | 1.70 | % | | $ | 101,506 | | | | 32 | % | |
Class I | |
Six Months Ended
April 30, 2022
(Unaudited) | | | (3.81 | ) | | $ | 48.11 | | | | 0.47 | % | | | 0.58 | % | | | 1.58 | % | | | 0.58 | % | | $ | 5,283,133 | | | | 17 | % | |
Year Ended October 31: | |
2021 | | | (2.32 | ) | | $ | 51.66 | | | | 52.54 | % | | | 0.58 | % | | | 1.63 | % | | | 0.58 | % | | $ | 5,315,482 | | | | 32 | % | |
2020 | | | (2.49 | ) | | $ | 35.77 | | | | (4.92 | )% | | | 0.60 | % | | | 1.64 | % | | | 0.60 | % | | $ | 3,306,226 | | | | 44 | % | |
2019 | | | (3.57 | ) | | $ | 40.12 | | | | 12.31 | % | | | 0.60 | % | | | 1.37 | % | | | 0.60 | % | | $ | 3,501,630 | | | | 34 | % | |
2018 | | | (1.44 | ) | | $ | 39.55 | | | | 2.30 | % | | | 0.59 | % | | | 1.14 | % | | | 0.59 | % | | $ | 3,509,093 | | | | 36 | % | |
2017 | | | (0.67 | ) | | $ | 40.04 | | | | 20.50 | % | | | 0.62 | % | | | 0.85 | % | | | 0.62 | % | | $ | 5,263,053 | | | | 32 | % | |
(continues on next page)
See notes to financial statements.
21
Victory Portfolios | | Financial Highlights — continued | |
For a Share Outstanding Throughout Each Period
| | | | Investment Activities | | Distributions to
Shareholders From | |
| | | Net Asset
Value,
Beginning of
Period | | Net
Investment
Income
(Loss)(a) | | Net Realized
and Unrealized
Gains (Losses) | | Total from
Investment
Activities | | Net
Investment
Income | | Net Realized
Gains from
Investments | |
Victory Sycamore Established Value Fund | | | |
Class R | | | |
Six Months Ended
April 30, 2022
(Unaudited) | | $ | 50.81 | | | | 0.26 | | | | (0.13 | ) | | | 0.13 | | | | (0.38 | ) | | | (3.31 | ) | |
Year Ended October 31: | |
2021 | | $ | 35.23 | | | | 0.52 | | | | 17.16 | | | | 17.68 | | | | (0.43 | ) | | | (1.67 | ) | |
2020 | | $ | 39.54 | | | | 0.40 | | | | (2.40 | ) | | | (2.00 | ) | | | (0.41 | ) | | | (1.90 | ) | |
2019 | | $ | 39.03 | | | | 0.31 | | | | 3.57 | | | | 3.88 | | | | (0.32 | ) | | | (3.05 | ) | |
2018 | | $ | 39.54 | | | | 0.26 | | | | 0.48 | | | | 0.74 | | | | (0.26 | ) | | | (0.99 | ) | |
2017 | | $ | 33.43 | | | | 0.14 | | | | 6.46 | | | | 6.60 | | | | (0.14 | ) | | | (0.35 | ) | |
Class R6 | | | |
Six Months Ended
April 30, 2022
(Unaudited) | | $ | 51.69 | | | | 0.40 | | | | (0.14 | ) | | | 0.26 | | | | (0.51 | ) | | | (3.31 | ) | |
Year Ended October 31: | |
2021 | | $ | 35.78 | | | | 0.80 | | | | 17.45 | | | | 18.25 | | | | (0.67 | ) | | | (1.67 | ) | |
2020 | | $ | 40.13 | | | | 0.60 | | | | (2.45 | ) | | | (1.85 | ) | | | (0.60 | ) | | | (1.90 | ) | |
2019 | | $ | 39.55 | | | | 0.52 | | | | 3.63 | | | | 4.15 | | | | (0.52 | ) | | | (3.05 | ) | |
2018 | | $ | 40.05 | | | | 0.49 | | | | 0.48 | | | | 0.97 | | | | (0.48 | ) | | | (0.99 | ) | |
2017 | | $ | 33.85 | | | | 0.35 | | | | 6.54 | | | | 6.89 | | | | (0.34 | ) | | | (0.35 | ) | |
Class Y | | | |
Six Months Ended
April 30, 2022
(Unaudited) | | $ | 51.66 | | | | 0.39 | | | | (0.15 | ) | | | 0.24 | | | | (0.49 | ) | | | (3.31 | ) | |
Year Ended October 31: | |
2021 | | $ | 35.76 | | | | 0.77 | | | | 17.45 | | | | 18.22 | | | | (0.65 | ) | | | (1.67 | ) | |
2020 | | $ | 40.11 | | | | 0.58 | | | | (2.45 | ) | | | (1.87 | ) | | | (0.58 | ) | | | (1.90 | ) | |
2019 | | $ | 39.54 | | | | 0.50 | | | | 3.63 | | | | 4.13 | | | | (0.51 | ) | | | (3.05 | ) | |
2018 | | $ | 40.04 | | | | 0.46 | | | | 0.48 | | | | 0.94 | | | | (0.45 | ) | | | (0.99 | ) | |
2017 | | $ | 33.83 | | | | 0.31 | | | | 6.57 | | | | 6.88 | | | | (0.32 | ) | | | (0.35 | ) | |
* Does not include acquired fund fees and expenses, if any.
(a) Per share net investment income (loss) has been calculated using the average daily shares method.
(b) Not annualized for periods less than one year.
(c) Annualized for periods less than one year.
(d) Portfolio turnover is calculated on the basis of the Fund as a whole without distinguishing between the classes of shares issued.
See notes to financial statements.
22
Victory Portfolios | | Financial Highlights — continued | |
For a Share Outstanding Throughout Each Period (continued)
| | | | | Ratios to Average Net Assets | | Supplemental Data | |
| | | Total
Distributions | | Net Asset
Value,
End of
Period | | Total
Return(b) | | Net
Expenses*(c) | | Net
Investment
Income
(Loss)(c) | | Gross
Expenses*(c) | | Net Assets,
End of
Period
(000's) | | Portfolio
Turnover(b)(d) | |
Victory Sycamore Established Value Fund | |
Class R | |
Six Months Ended
April 30, 2022
(Unaudited) | | | (3.69 | ) | | $ | 47.25 | | | | 0.21 | % | | | 1.11 | % | | | 1.06 | % | | | 1.11 | % | | $ | 863,670 | | | | 17 | % | |
Year Ended October 31: | |
2021 | | | (2.10 | ) | | $ | 50.81 | | | | 51.74 | % | | | 1.11 | % | | | 1.11 | % | | | 1.11 | % | | $ | 936,593 | | | | 32 | % | |
2020 | | | (2.31 | ) | | $ | 35.23 | | | | (5.41 | )% | | | 1.12 | % | | | 1.14 | % | | | 1.12 | % | | $ | 633,244 | | | | 44 | % | |
2019 | | | (3.37 | ) | | $ | 39.54 | | | | 11.72 | % | | | 1.13 | % | | | 0.84 | % | | | 1.13 | % | | $ | 823,796 | | | | 34 | % | |
2018 | | | (1.25 | ) | | $ | 39.03 | | | | 1.80 | % | | | 1.10 | % | | | 0.65 | % | | | 1.10 | % | | $ | 897,277 | | | | 36 | % | |
2017 | | | (0.49 | ) | | $ | 39.54 | | | | 19.89 | % | | | 1.10 | % | | | 0.38 | % | | | 1.10 | % | | $ | 1,005,561 | | | | 32 | % | |
Class R6 | |
Six Months Ended
April 30, 2022
(Unaudited) | | | (3.82 | ) | | $ | 48.13 | | | | 0.51 | % | | | 0.54 | % | | | 1.62 | % | | | 0.54 | % | | $ | 7,890,628 | | | | 17 | % | |
Year Ended October 31: | |
2021 | | | (2.34 | ) | | $ | 51.69 | | | | 52.62 | % | | | 0.54 | % | | | 1.68 | % | | | 0.54 | % | | $ | 7,548,781 | | | | 32 | % | |
2020 | | | (2.50 | ) | | $ | 35.78 | | | | (4.89 | )% | | | 0.57 | % | | | 1.68 | % | | | 0.57 | % | | $ | 4,499,129 | | | | 44 | % | |
2019 | | | (3.57 | ) | | $ | 40.13 | | | | 12.35 | % | | | 0.58 | % | | | 1.38 | % | | | 0.58 | % | | $ | 4,762,844 | | | | 34 | % | |
2018 | | | (1.47 | ) | | $ | 39.55 | | | | 2.34 | % | | | 0.57 | % | | | 1.19 | % | | | 0.57 | % | | $ | 3,822,378 | | | | 36 | % | |
2017 | | | (0.69 | ) | | $ | 40.05 | | | | 20.54 | % | | | 0.54 | % | | | 0.91 | % | | | 0.54 | % | | $ | 1,314,843 | | | | 32 | % | |
Class Y | |
Six Months Ended
April 30, 2022
(Unaudited) | | | (3.80 | ) | | $ | 48.10 | | | | 0.45 | % | | | 0.61 | % | | | 1.57 | % | | | 0.61 | % | | $ | 716,811 | | | | 17 | % | |
Year Ended October 31: | |
2021 | | | (2.32 | ) | | $ | 51.66 | | | | 52.49 | % | | | 0.61 | % | | | 1.62 | % | | | 0.61 | % | | $ | 873,753 | | | | 32 | % | |
2020 | | | (2.48 | ) | | $ | 35.76 | | | | (4.92 | )% | | | 0.63 | % | | | 1.63 | % | | | 0.63 | % | | $ | 600,200 | | | | 44 | % | |
2019 | | | (3.56 | ) | | $ | 40.11 | | | | 12.28 | % | | | 0.63 | % | | | 1.32 | % | | | 0.63 | % | | $ | 659,111 | | | | 34 | % | |
2018 | | | (1.44 | ) | | $ | 39.54 | | | | 2.27 | % | | | 0.62 | % | | | 1.13 | % | | | 0.62 | % | | $ | 448,543 | | | | 36 | % | |
2017 | | | (0.67 | ) | | $ | 40.04 | | | | 20.51 | % | | | 0.60 | % | | | 0.81 | % | | | 0.60 | % | | $ | 487,044 | | | | 32 | % | |
See notes to financial statements.
23
Victory Portfolios | | Financial Highlights | |
For a Share Outstanding Throughout Each Period
| | | | | Investment Activities | | Distributions to
Shareholders From | |
| | | Net Asset
Value,
Beginning of
Period | | Net
Investment
Income
(Loss)(a) | | Net Realized
and Unrealized
Gains
(Losses) | | Total from
Investment
Activities | | Net
Investment
Income | | Net Realized
Gains from
Investments | |
Victory Sycamore Small Company Opportunity Fund | | | |
Class A | | | |
Six Months Ended
April 30, 2022
(Unaudited) | | $ | 56.52 | | | | 0.05 | | | | (2.85 | ) | | | (2.80 | ) | | | (0.05 | ) | | | (6.42 | ) | |
Year Ended October 31: | |
2021 | | $ | 37.91 | | | | 0.04 | | | | 18.89 | | | | 18.93 | | | | (0.17 | ) | | | (0.15 | ) | |
2020 | | $ | 45.16 | | | | 0.17 | | | | (5.14 | ) | | | (4.97 | ) | | | (0.20 | ) | | | (2.08 | ) | |
2019 | | $ | 45.91 | | | | 0.22 | | | | 4.22 | | | | 4.44 | | | | (0.10 | ) | | | (5.09 | ) | |
2018 | | $ | 48.23 | | | | 0.22 | | | | (0.09 | ) | | | 0.13 | | | | (0.21 | ) | | | (2.24 | ) | |
2017 | | $ | 39.74 | | | | 0.11 | | | | 10.44 | | | | 10.55 | | | | (0.12 | ) | | | (1.94 | ) | |
Class I | | | |
Six Months Ended
April 30, 2022
(Unaudited) | | $ | 57.31 | | | | 0.14 | | | | (2.89 | ) | | | (2.75 | ) | | | (0.23 | ) | | | (6.42 | ) | |
Year Ended October 31: | |
2021 | | $ | 38.40 | | | | 0.22 | | | | 19.13 | | | | 19.35 | | | | (0.29 | ) | | | (0.15 | ) | |
2020 | | $ | 45.71 | | | | 0.31 | | | | (5.20 | ) | | | (4.89 | ) | | | (0.34 | ) | | | (2.08 | ) | |
2019 | | $ | 46.43 | | | | 0.35 | | | | 4.28 | | | | 4.63 | | | | (0.26 | ) | | | (5.09 | ) | |
2018 | | $ | 48.75 | | | | 0.37 | | | | (0.09 | ) | | | 0.28 | | | | (0.36 | ) | | | (2.24 | ) | |
2017 | | $ | 40.12 | | | | 0.25 | | | | 10.55 | | | | 10.80 | | | | (0.23 | ) | | | (1.94 | ) | |
Class R | | | |
Six Months Ended
April 30, 2022
(Unaudited) | | $ | 52.37 | | | | 0.01 | | | | (2.62 | ) | | | (2.61 | ) | | | — | | | | (6.42 | ) | |
Year Ended October 31: | |
2021 | | $ | 35.16 | | | | (0.05 | ) | | | 17.52 | | | | 17.47 | | | | (0.11 | ) | | | (0.15 | ) | |
2020 | | $ | 42.05 | | | | 0.09 | | | | (4.76 | ) | | | (4.67 | ) | | | (0.14 | ) | | | (2.08 | ) | |
2019 | | $ | 43.13 | | | | 0.13 | | | | 3.91 | | | | 4.04 | | | | (0.03 | ) | | | (5.09 | ) | |
2018 | | $ | 45.47 | | | | 0.10 | | | | (0.08 | ) | | | 0.02 | | | | (0.12 | ) | | | (2.24 | ) | |
2017 | | $ | 37.59 | | | | 0.01 | | | | 9.86 | | | | 9.87 | | | | (0.05 | ) | | | (1.94 | ) | |
* Does not include acquired fund fees and expenses, if any.
(a) Per share net investment income (loss) has been calculated using the average daily shares method.
(b) Not annualized for periods less than one year.
(c) Annualized for periods less than one year.
(d) Portfolio turnover is calculated on the basis of the Fund as a whole without distinguishing between the classes of shares issued.
See notes to financial statements.
24
Victory Portfolios | | Financial Highlights — continued | |
For a Share Outstanding Throughout Each Period
| | | | | Ratios to Average Net Assets | | Supplemental Data | |
| | | Total
Distributions | | Net Asset
Value,
End of
Period | | Total
Return
(Excludes
sales
charge)(b) | | Net
Expenses*(c) | | Net
Investment
Income
(Loss)(c) | | Gross
Expenses*(c) | | Net Assets,
End of
Period
(000's) | | Portfolio
Turnover(b)(d) | |
Victory Sycamore Small Company Opportunity Fund | |
Class A | |
Six Months Ended
April 30, 2022
(Unaudited) | | | (6.47 | ) | | $ | 47.25 | | | | (5.60 | )% | | | 1.24 | % | | | 0.21 | % | | | 1.24 | % | | $ | 361,104 | | | | 16 | % | |
Year Ended October 31: | |
2021 | | | (0.32 | ) | | $ | 56.52 | | | | 50.11 | % | | | 1.24 | % | | | 0.07 | % | | | 1.24 | % | | $ | 424,496 | | | | 41 | % | |
2020 | | | (2.28 | ) | | $ | 37.91 | | | | (11.80 | )% | | | 1.26 | % | | | 0.43 | % | | | 1.26 | % | | $ | 336,083 | | | | 37 | % | |
2019 | | | (5.19 | ) | | $ | 45.16 | | | | 12.10 | % | | | 1.25 | % | | | 0.51 | % | | | 1.25 | % | | $ | 451,310 | | | | 34 | % | |
2018 | | | (2.45 | ) | | $ | 45.91 | | | | 0.17 | % | | | 1.22 | % | | | 0.46 | % | | | 1.22 | % | | $ | 486,622 | | | | 43 | % | |
2017 | | | (2.06 | ) | | $ | 48.23 | | | | 27.02 | % | | | 1.23 | % | | | 0.25 | % | | | 1.23 | % | | $ | 603,851 | | | | 36 | % | |
Class I | |
Six Months Ended
April 30, 2022
(Unaudited) | | | (6.65 | ) | | $ | 47.91 | | | | (5.44 | )% | | | 0.89 | % | | | 0.56 | % | | | 0.89 | % | | $ | 3,457,789 | | | | 16 | % | |
Year Ended October 31: | |
2021 | | | (0.44 | ) | | $ | 57.31 | | | | 50.66 | % | | | 0.89 | % | | | 0.41 | % | | | 0.89 | % | | $ | 3,840,013 | | | | 41 | % | |
2020 | | | (2.42 | ) | | $ | 38.40 | | | | (11.51 | )% | | | 0.93 | % | | | 0.78 | % | | | 0.93 | % | | $ | 2,666,852 | | | | 37 | % | |
2019 | | | (5.35 | ) | | $ | 45.71 | | | | 12.49 | % | | | 0.92 | % | | | 0.82 | % | | | 0.92 | % | | $ | 4,584,086 | | | | 34 | % | |
2018 | | | (2.60 | ) | | $ | 46.43 | | | | 0.49 | % | | | 0.88 | % | | | 0.76 | % | | | 0.88 | % | | $ | 4,127,411 | | | | 43 | % | |
2017 | | | (2.17 | ) | | $ | 48.75 | | | | 27.44 | % | | | 0.90 | % | | | 0.56 | % | | | 0.90 | % | | $ | 4,003,419 | | | | 36 | % | |
Class R | |
Six Months Ended
April 30, 2022
(Unaudited) | | | (6.42 | ) | | $ | 43.34 | | | | (5.68 | )% | | | 1.42 | % | | | 0.02 | % | | | 1.42 | % | | $ | 226,564 | | | | 16 | % | |
Year Ended October 31: | |
2021 | | | (0.26 | ) | | $ | 52.37 | | | | 49.85 | % | | | 1.42 | % | | | (0.11 | )% | | | 1.42 | % | | $ | 256,938 | | | | 41 | % | |
2020 | | | (2.22 | ) | | $ | 35.16 | | | | (11.94 | )% | | | 1.44 | % | | | 0.25 | % | | | 1.44 | % | | $ | 200,617 | | | | 37 | % | |
2019 | | | (5.12 | ) | | $ | 42.05 | | | | 11.89 | % | | | 1.44 | % | | | 0.32 | % | | | 1.44 | % | | $ | 279,090 | | | | 34 | % | |
2018 | | | (2.36 | ) | | $ | 43.13 | | | | (0.06 | )% | | | 1.44 | % | | | 0.23 | % | | | 1.44 | % | | $ | 286,480 | | | | 43 | % | |
2017 | | | (1.99 | ) | | $ | 45.47 | | | | 26.73 | % | | | 1.45 | % | | | 0.03 | % | | | 1.45 | % | | $ | 333,944 | | | | 36 | % | |
(continues on next page)
See notes to financial statements.
25
Victory Portfolios | | Financial Highlights — continued | |
For a Share Outstanding Throughout Each Period
| | | | | Investment Activities | | Distributions to
Shareholders From | |
| | | Net Asset
Value,
Beginning of
Period | | Net
Investment
Income
(Loss)(a) | | Net Realized
and Unrealized
Gains
(Losses) | | Total from
Investment
Activities | | Net
Investment
Income | | Net Realized
Gains from
Investments | |
Victory Sycamore Small Company Opportunity Fund | | | |
Class R6 | | | |
Six Months Ended
April 30, 2022
(Unaudited) | | $ | 57.22 | | | | 0.15 | | | | (2.88 | ) | | | (2.73 | ) | | | (0.24 | ) | | | (6.42 | ) | |
Year Ended October 31: | |
2021 | | $ | 38.37 | | | | 0.24 | | | | 19.10 | | | | 19.34 | | | | (0.34 | ) | | | (0.15 | ) | |
2020 | | $ | 45.66 | | | | 0.19 | | | | (5.03 | ) | | | (4.84 | ) | | | (0.37 | ) | | | (2.08 | ) | |
2019 | | $ | 46.38 | | | | 0.36 | | | | 4.28 | | | | 4.64 | | | | (0.27 | ) | | | (5.09 | ) | |
2018 | | $ | 48.69 | | | | 0.30 | | | | — | (e) | | | 0.30 | | | | (0.37 | ) | | | (2.24 | ) | |
2017 | | $ | 40.08 | | | | 0.21 | | | | 10.58 | | | | 10.79 | | | | (0.24 | ) | | | (1.94 | ) | |
Class Y | | | |
Six Months Ended
April 30, 2022
(Unaudited) | | $ | 56.88 | | | | 0.14 | | | | (2.88 | ) | | | (2.74 | ) | | | (0.19 | ) | | | (6.42 | ) | |
Year Ended October 31: | |
2021 | | $ | 38.10 | | | | 0.16 | | | | 19.00 | | | | 19.16 | | | | (0.23 | ) | | | (0.15 | ) | |
2020 | | $ | 45.39 | | | | 0.24 | | | | (5.16 | ) | | | (4.92 | ) | | | (0.29 | ) | | | (2.08 | ) | |
2019 | | $ | 46.13 | | | | 0.30 | | | | 4.24 | | | | 4.54 | | | | (0.19 | ) | | | (5.09 | ) | |
2018 | | $ | 48.33 | | | | 0.29 | | | | (0.09 | ) | | | 0.20 | | | | (0.16 | ) | | | (2.24 | ) | |
2017 | | $ | 39.84 | | | | 0.20 | | | | 10.40 | | | | 10.60 | | | | (0.17 | ) | | | (1.94 | ) | |
* Does not include acquired fund fees and expenses, if any.
(a) Per share net investment income (loss) has been calculated using the average daily shares method.
(b) Not annualized for periods less than one year.
(c) Annualized for periods less than one year.
(d) Portfolio turnover is calculated on the basis of the Fund as a whole without distinguishing between the classes of shares issued.
(e) Amount is less than $0.005 per share.
See notes to financial statements.
26
Victory Portfolios | | Financial Highlights — continued | |
For a Share Outstanding Throughout Each Period (continued)
| | | | | Ratios to Average Net Assets | | Supplemental Data | |
| | | Total
Distributions | | Net Asset
Value,
End of
Period | | Total
Return
(Excludes
sales
charge)(b) | | Net
Expenses*(c) | | Net
Investment
Income
(Loss)(c) | | Gross
Expenses*(c) | | Net Assets,
End of
Period
(000's) | | Portfolio
Turnover(b)(d) | |
Victory Sycamore Small Company Opportunity Fund | |
Class R6 | |
Six Months Ended
April 30, 2022
(Unaudited) | | | (6.66 | ) | | $ | 47.83 | | | | (5.42 | )% | | | 0.85 | % | | | 0.60 | % | | | 0.85 | % | | $ | 2,224,247 | | | | 16 | % | |
Year Ended October 31: | |
2021 | | | (0.49 | ) | | $ | 57.22 | | | | 50.71 | % | | | 0.85 | % | | | 0.44 | % | | | 0.85 | % | | $ | 2,518,726 | | | | 41 | % | |
2020 | | | (2.45 | ) | | $ | 38.37 | | | | (11.43 | )% | | | 0.86 | % | | | 0.48 | % | | | 0.86 | % | | $ | 1,625,853 | | | | 37 | % | |
2019 | | | (5.36 | ) | | $ | 45.66 | | | | 12.52 | % | | | 0.87 | % | | | 0.84 | % | | | 0.87 | % | | $ | 277,218 | | | | 34 | % | |
2018 | | | (2.61 | ) | | $ | 46.38 | | | | 0.52 | % | | | 0.87 | % | | | 0.62 | % | | | 0.87 | % | | $ | 195,360 | | | | 43 | % | |
2017 | | | (2.18 | ) | | $ | 48.69 | | | | 27.44 | % | | | 0.90 | % | | | 0.46 | % | | | 0.90 | % | | $ | 85,307 | | | | 36 | % | |
Class Y | |
Six Months Ended
April 30, 2022
(Unaudited) | | | (6.61 | ) | | $ | 47.53 | | | | (5.47 | )% | | | 0.95 | % | | | 0.53 | % | | | 0.95 | % | | $ | 25,627 | | | | 16 | % | |
Year Ended October 31: | |
2021 | | | (0.38 | ) | | $ | 56.88 | | | | 50.55 | % | | | 0.95 | % | | | 0.31 | % | | | 0.95 | % | | $ | 33,276 | | | | 41 | % | |
2020 | | | (2.37 | ) | | $ | 38.10 | | | | (11.65 | )% | | | 1.08 | % | | | 0.62 | % | | | 1.08 | % | | $ | 16,054 | | | | 37 | % | |
2019 | | | (5.28 | ) | | $ | 45.39 | | | | 12.31 | % | | | 1.07 | % | | | 0.69 | % | | | 1.07 | % | | $ | 31,016 | | | | 34 | % | |
2018 | | | (2.40 | ) | | $ | 46.13 | | | | 0.33 | % | | | 1.06 | % | | | 0.61 | % | | | 1.06 | % | | $ | 32,592 | | | | 43 | % | |
2017 | | | (2.11 | ) | | $ | 48.33 | | | | 27.10 | % | | | 1.15 | % | | | 0.45 | % | | | 1.25 | % | | $ | 35,416 | | | | 36 | % | |
See notes to financial statements.
27
Victory Portfolios | | Notes to Financial Statements
April 30, 2022 | |
(Unaudited)
1. Organization:
Victory Portfolios (the "Trust") is organized as a Delaware statutory trust and the Trust is registered under the Investment Company Act of 1940, as amended (the "1940 Act"), as an open-end investment company. The Trust is comprised of 40 funds and is authorized to issue an unlimited number of shares, which are units of beneficial interest with a par value of $0.001 per share.
The accompanying financial statements are those of the following two Funds (collectively, the "Funds" and individually, a "Fund"). Each Fund is classified as diversified under the 1940 Act.
Funds (Legal Name)* | | Funds (Short Name) | | Investment Share
Classes Offered | |
Victory Sycamore Established
Value Fund | | Sycamore Established Value Fund | | A, C, I, R, R6, and Y | |
Victory Sycamore Small Company
Opportunity Fund | | Sycamore Small Company
Opportunity Fund | | A, I, R, R6, and Y | |
* The Funds are generally closed to new investors. The Funds will continue to be available for investment (by direct purchase or exchange) by the following: existing shareholders, investors that purchase shares through certain intermediaries, retirement plans that purchase shares through certain record keepers, and current and retired Fund trustees, officers, employees of Victory Capital Management Inc. ("VCM" or the "Adviser") and affiliated providers, and their family members.
Each class of shares of a Fund has substantially identical rights and privileges except with respect to sales charges, fees paid under distribution plans, expenses allocable exclusively to each class of shares, voting rights on matters solely affecting a single class of shares, and the exchange privilege of each class of shares.
Under the Trust's organizational documents, its officers and trustees are indemnified against certain liabilities arising out of the performance of their duties to the Funds. In addition, in the normal course of business, the Funds enter into contracts with their vendors and others that provide for general indemnifications. The Funds' maximum exposure under these arrangements is unknown, as this would involve future claims that may be made against the Funds. However, based on experience, the Funds expect that risk of loss to be remote.
2. Significant Accounting Policies:
The following is a summary of significant accounting policies followed by the Trust in the preparation of its financial statements. The policies are in conformity with U.S. Generally Accepted Accounting Principles ("GAAP"). The preparation of financial statements in accordance with GAAP requires management to make estimates and assumptions that affect the reported amounts of assets and liabilities and disclosure of contingent assets and liabilities at the date of the financial statements and the reported amounts of income and expenses for the period. Actual results could differ from those estimates. The Funds follow the specialized accounting and reporting requirements under GAAP that are applicable to investment companies under Accounting Standards Codification Topic 946.
Investment Valuation:
The Funds record investments at fair value. Fair value is defined as the price that would be received to sell an asset or paid to transfer a liability in an orderly transaction between market participants at the measurement date.
The valuation techniques described below maximize the use of observable inputs and minimize the use of unobservable inputs in determining fair value. The inputs used for valuing the Funds' investments are summarized in the three broad levels listed below:
• Level 1 — quoted prices in active markets for identical securities
• Level 2 — other significant observable inputs (including quoted prices for similar securities or interest rates applicable to those securities, etc.)
28
Victory Portfolios | | Notes to Financial Statements — continued
April 30, 2022 | |
(Unaudited)
• Level 3 — significant unobservable inputs (including the Funds' own assumptions in determining the fair value of investments)
Changes in valuation techniques may result in transfers in or out of an assigned level within the disclosure hierarchy. The inputs or methodologies used for valuation techniques are not necessarily an indication of the risk associated with entering into those investments.
The Adviser has established the Pricing and Liquidity Committee (the "Committee"), and subject to the Trust's Board of Trustees' (the "Board") oversight, the Committee administers and oversees the Funds' valuation policies and procedures, which are approved by the Board.
Portfolio securities listed or traded on securities exchanges, including Exchange-Traded Funds ("ETFs"), and American Depositary Receipts ("ADRs"), are valued at the closing price on the exchange or system where the security is principally traded, if available, or at the Nasdaq Official Closing Price. If there have been no sales for that day on the exchange or system, then a security is valued at the last available bid quotation on the exchange or system where the security is principally traded. In each of these situations, valuations are typically categorized as Level 1 in the fair value hierarchy.
Investments in open-end investment companies are valued at their net asset value ("NAV"). These valuations are typically categorized as Level 1 in the fair value hierarchy.
In the event that price quotations or valuations are not readily available, investments are valued at fair value in accordance with procedures established by and under the general supervision and responsibility of the Board. These valuations are typically categorized as Level 2 or Level 3 in the fair value hierarchy, based on the observability of inputs used to determine the fair value. The effect of fair value pricing is that securities may not be priced on the basis of quotations from the primary market in which they are traded and the actual price realized from the sale of a security may differ materially from the fair value price. Valuing these securities at fair value is intended to cause the Fund's NAV to be more reliable than it otherwise would be.
A summary of the valuations as of April 30, 2022, based upon the three levels defined above, is included in the table below while the breakdown, by category, of investments is disclosed on the Schedules of Portfolio Investments (amounts in thousands):
| | | Level 1 | | Level 2 | | Level 3 | | Total | |
Sycamore Established Value Fund | |
Common Stocks | | $ | 15,947,111 | | | $ | — | | | $ | — | | | $ | 15,947,111 | | |
Exchange-Traded Funds | | | 202,338 | | | | — | | | | — | | | | 202,338 | | |
Collateral for Securities Loaned | | | 26,832 | | | | — | | | | — | | | | 26,832 | | |
Total | | $ | 16,176,281 | | | $ | — | | | $ | — | | | $ | 16,176,281 | | |
Sycamore Small Company Opportunity Fund | |
Common Stocks | | $ | 6,068,487 | | | $ | — | | | $ | — | | | $ | 6,068,487 | | |
Exchange-Traded Funds | | | 50,688 | | | | — | | | | — | | | | 50,688 | | |
Collateral for Securities Loaned | | | 120,553 | | | | — | | | | — | | | | 120,553 | | |
Total | | $ | 6,239,728 | | | $ | — | | | $ | — | | | $ | 6,239,728 | | |
For the six months ended April 30, 2022, there were no transfers in or out of Level 3 in the fair value hierarchy.
Real Estate Investment Trusts ("REITs"):
The Funds may invest in REITs, which report information on the source of their distributions annually. REITs are pooled investment vehicles that invest primarily in income-producing real estate or real-estate related loans or interests (such as mortgages). Certain distributions received from REITs during the year are recorded as realized gains or return of capital as estimated by the Funds or when such information becomes known.
29
Victory Portfolios | | Notes to Financial Statements — continued
April 30, 2022 | |
(Unaudited)
Investment Companies:
Exchange-Traded Funds:
The Funds may invest in ETFs, the shares of which are bought and sold on a securities exchange. An ETF trades like common stock and represents a fixed portfolio of securities often designed to track the performance and dividend yield of a particular domestic or foreign market index. The Funds may purchase shares of an ETF to temporarily gain exposure to a portion of the U.S. or a foreign market while awaiting purchase of underlying securities. The risks of owning an ETF generally reflect the risks of owning the underlying securities they are designed to track, although the lack of liquidity of an ETF could result in it being more volatile. Additionally, ETFs have fees and expenses that reduce their value.
Open-End Funds:
The Funds may invest in portfolios of open-end investment companies. These investment companies value securities in their portfolios for which market quotations are readily available at their market values (generally the last reported sale price) and all other securities and assets at their fair value by the methods established by the board of directors of the underlying funds.
Investment Transactions and Related Income:
Changes in holdings of investments are accounted for no later than one business day following the trade date. For financial reporting purposes, however, investment transactions are accounted for on trade date or the last business day of the reporting period. Interest income is determined on the basis of coupon interest accrued using the effective interest method which adjusts, where applicable, the amortization of premiums or accretion of discounts. Dividend income is recorded on the ex-dividend date. Gains or losses realized on sales of securities are recorded on the identified cost basis.
Withholding taxes on interest, dividends, and gains as a result of certain investments in ADRs by the Funds have been provided for in accordance with each investment's applicable country's tax rules and rates.
Securities Lending:
The Funds, through a Securities Lending Agreement with Citibank, N.A. ("Citibank"), may lend their securities to qualified financial institutions, such as certain broker-dealers and banks, to earn additional income, net of income retained by Citibank. Borrowers are required to initially secure their loans for collateral in the amount of at least 102% of the value of U.S. securities loaned or at least 105% of the value of non-U.S. securities loaned, marked-to-market daily. Any collateral shortfalls associated with increases in the valuation of the securities loaned are generally cured the next business day. The collateral can be received in the form of cash collateral and/or non-cash collateral. Non-cash collateral can include U.S. Government Securities and other securities as permitted by Securities and Exchange Commission ("SEC") guidelines. The cash collateral is invested in short-term instruments or cash equivalents, primarily open-end investment companies, as noted on the Funds' Schedules of Portfolio Investments. The Funds effectively do not have control of the non-cash collateral and therefore it is not disclosed on the Funds' Schedules of Portfolio Investments. Collateral requirements are determined daily based on the value of the Funds' securities on loan as of the end of the prior business day. During the time portfolio securities are on loan, the borrower will pay the Funds any dividends or interest paid on such securities plus any fee negotiated between the parties to the lending agreement. The Funds also earn a return from the collateral. The Funds pay Citibank various fees in connection with the investment of cash collateral and fees based on the investment income received from securities lending activities. Securities lending income (net of these fees) is disclosed on the Statements of Operations. Loans are terminable upon demand and the borrower must return the loaned securities within the lesser of one standard settlement period or five business days. Although risk is mitigated by the collateral, a Fund could experience a delay in recovering its securities and possible loss of income
30
Victory Portfolios | | Notes to Financial Statements — continued
April 30, 2022 | |
(Unaudited)
or value if the borrower fails to return them. In addition, there is a risk that the value of the short-term investments will be less than the amount of cash collateral required to be returned to the borrower.
The Funds' agreement with Citibank does not include master netting provisions. Non-cash collateral received by the Funds may not be sold or repledged, except to satisfy borrower default.
The following table (amounts in thousands) is a summary of the Funds' securities lending transactions as of April 30, 2022.
| | | Value of
Securities on Loan | | Non-Cash
Collateral | | Cash
Collateral | |
Sycamore Established Value Fund | | $ | 25,189 | | | $ | — | | | $ | 26,832 | | |
Sycamore Small Company Opportunity Fund | | | 112,733 | | | | — | | | | 120,553 | | |
Federal Income Taxes:
Each Fund intends to continue to qualify as a regulated investment company by complying with the provisions available to certain investment companies, as defined in applicable sections of the Internal Revenue Code, and to make distributions of net investment income and net realized gains sufficient to relieve it from all, or substantially all, federal income taxes. Accordingly, no provision for federal income taxes is required in the financial statements. The Funds have a tax year end of October 31.
For the six months ended April 30, 2022, the Funds did not incur any income tax, interest, or penalties, and have recorded no liability for net unrecognized tax benefits relating to uncertain tax positions.
Management of the Funds has reviewed tax positions taken in tax years that remain subject to examination by all major tax jurisdictions, including federal (i.e., the last four tax years, which includes the current fiscal tax year end). Management believes that there is no tax liability resulting from unrecognized tax benefits related to uncertain tax positions taken.
Allocations:
Expenses directly attributable to a Fund are charged to that Fund, while expenses that are attributable to more than one fund in the Trust, or jointly with an affiliated trust, are allocated among the respective funds in the Trust and/or an affiliated trust based upon net assets or another appropriate basis.
Income, expenses (other than class-specific expenses such as transfer agent fees, state registration fees, printing fees, and 12b-1 fees), and realized and unrealized gains or losses on investments are allocated to each class of shares based on its relative net assets on the date income is earned or expenses and realized and unrealized gains and losses are incurred.
3. Purchases and Sales:
Purchases and sales of securities (excluding securities maturing less than one year from acquisition) for the six months ended April 30, 2022, were as follows (amounts in thousands):
| | | Excluding
U.S. Government Securities | |
| | | Purchases | | Sales | |
Sycamore Established Value Fund | | $ | 2,747,796 | | | $ | 2,828,846 | | |
Sycamore Small Company Opportunity Fund | | | 1,076,333 | | | | 1,518,747 | | |
4. Fees and Transactions with Affiliates and Related Parties:
Investment Advisory Fees:
Investment advisory services are provided to the Funds by the Adviser, which is a New York corporation registered as an investment adviser with the SEC. The Adviser is an indirect wholly owned subsidiary
31
Victory Portfolios | | Notes to Financial Statements — continued
April 30, 2022 | |
(Unaudited)
of Victory Capital Holdings, Inc., a publicly traded Delaware corporation, and a wholly owned direct subsidiary of Victory Capital Operating, LLC.
Under the terms of the Investment Advisory Agreement, the Adviser is entitled to receive fees based on a percentage of the average daily net assets of each Fund. The rates at which the Adviser is paid by each Fund are included in the table below.
| | | Adviser Fee Tier Rates | |
| | | Up to $100 million | | $100 million – $200 million | | Over $200 million | |
Sycamore Established Value Fund | | | 0.65 | % | | | 0.55 | % | | | 0.45 | % | |
| | | Up to $500 million | | | | Over $500 million | |
Sycamore Small Company
Opportunity Fund | | | 0.85 | % | | | | | | | 0.75 | % | |
Amounts incurred and paid to VCM for the six months ended April 30, 2022, are reflected on the Statements of Operations as Investment advisory fees.
Administration and Servicing Fees:
VCM also serves as the Funds' administrator and fund accountant. Under the Administration and Fund Accounting Agreement, VCM is entitled to receive fees based on a percentage of the average daily net assets of the Trust, Victory Variable Insurance Funds and Victory Portfolios II. The tiered rates at which VCM is paid by the Funds are shown in the table below:
Net Assets | |
Up to $15 billion | | $15 billion – $30 billion | | Over $30 billion | |
| | 0.08 | %, plus | | | 0.05 | %, plus | | | 0.04 | % | |
Amounts incurred for the six months ended April 30, 2022, are reflected on the Statements of Operations as Administration fees.
Citi Fund Services Ohio, Inc. ("Citi"), an affiliate of Citibank, acts as sub-administrator and sub-fund accountant to the Funds pursuant to the Sub-Administration and Sub-Fund Accounting Services Agreement between VCM and Citi. VCM pays Citi a fee for providing these services. The Trust reimburses VCM and Citi for out-of-pocket expenses incurred in providing these services and certain other expenses specifically allocated to the Funds. Amounts incurred for the six months ended April 30, 2022, are reflected on the Statements of Operations as Sub-Administration fees.
The Funds (as part of the Trust) have entered into an agreement with the Adviser to provide compliance services, pursuant to which the Adviser furnishes its compliance personnel, including the services of the Chief Compliance Officer ("CCO"), and other resources reasonably necessary to provide the Trust with compliance oversight services related to the design, administration, and oversight of a compliance program for the Trust in accordance with Rule 38a-1 under the 1940 Act. The CCO is an employee of the Adviser, which pays the compensation of the CCO and support staff. The funds in the Trust, Victory Variable Insurance Funds, Victory Portfolios II and USAA Mutual Funds (collectively, the "Victory Funds Complex"), in aggregate, compensate the Adviser for these services. Amounts incurred for the six months ended April 30, 2022, are reflected on the Statements of Operations as Compliance fees.
Transfer Agency Fees:
FIS Investor Services, LLC ("FIS") serves as the Funds' transfer agent. Under the Transfer Agent Agreement, the Trust pays FIS a fee for its services and reimburses FIS for all of their reasonable out-of-pocket expenses incurred in providing these services. Amounts incurred for the six months ended April 30, 2022, are reflected on the Statements of Operations as Transfer agent fees.
32
Victory Portfolios | | Notes to Financial Statements — continued
April 30, 2022 | |
(Unaudited)
Distributor/Underwriting Services:
Victory Capital Services, Inc. (the "Distributor"), an affiliate of the Adviser, serves as Distributor for the continuous offering of the shares of the Funds pursuant to a Distribution Agreement between the Distributor and the Trust.
Pursuant to the Distribution and Service Plans adopted in accordance with Rule 12b-1 under the 1940 Act, the Distributor may receive a monthly distribution and service fee up to the annual rate shown in the table below:
| | | Class A | | Class C | | Class R | |
Sycamore Established Value Fund | | | 0.25 | % | | | 1.00 | % | | | 0.50 | % | |
Sycamore Small Company Opportunity Fund | | | 0.25 | % | | | N/A | | | | 0.50 | % | |
The distribution and service fees paid to the Distributor may be used by the Distributor to pay for activities primarily intended to result in the sale of Class A, Class C, and Class R. Amounts incurred for the six months ended April 30, 2022, are reflected on the Statements of Operations as 12b-1 fees.
In addition, the Distributor is entitled to receive commissions in connection with sales of Class A. For the six months ended April 30, 2022, the Distributor received approximately $10 thousand from commissions earned in connection with sales of Class A.
Other Fees:
Citibank serves as the Funds' custodian. The Funds pay Citibank a fee for providing these services. Amounts incurred for the six months ended April 30, 2022, are reflected on the Statements of Operations as Custodian fees.
Sidley Austin LLP provides legal services to the Trust.
The Adviser has entered into expense limitation agreements with the Funds. Under the terms of the agreements, the Adviser has agreed to waive fees or reimburse certain expenses to the extent that ordinary operating expenses incurred by certain classes of a Fund in any fiscal year exceed the expense limit for such classes of the Fund. Such excess amounts will be the liability of the Adviser. Acquired fund fees and expenses, interest, taxes, brokerage commissions, other expenditures which are capitalized in accordance with GAAP, and other extraordinary expenses not incurred in the ordinary course of a Fund's business are excluded from the expense limits. As of April 30, 2022, the expense limits (excluding voluntary waivers) are as follows:
| | | In effect until February 28, 2023 | |
| | | Class C | | Class Y | |
Sycamore Established Value Fund | | | 1.84 | % | | | N/A | | |
Sycamore Small Company Opportunity Fund | | | N/A | | | | 1.15 | % | |
Under the terms of the expense limitation agreements, as amended May 1, 2021, the Funds have agreed to repay fees and expenses that were waived or reimbursed by the Adviser for a period of up to three years (thirty-six (36) months) after the waiver or reimbursement took place, subject to the lesser of any operating expense limits in effect at the time of: (a) the original waiver or expense reimbursement; or (b) the recoupment, after giving effect to the recoupment amount. Prior to May 1, 2021, the Funds were permitted to recoup fees waived and expenses reimbursed for up to three years after the fiscal year in which the waiver or reimbursement took place, subject to the limitations above. This change did not have any effect on the amounts previously reported for recoupment.
As of April 30, 2022, the Funds had no amounts available to be repaid to the Adviser. The Funds have not recorded any amounts available to be repaid as a liability due to an assessment that such repayments are not probable at April 30, 2022.
The Adviser may voluntarily waive or reimburse additional fees to assist the Funds in maintaining competitive expense ratios. Voluntary waivers and reimbursements applicable to the Funds are not
33
Victory Portfolios | | Notes to Financial Statements — continued
April 30, 2022 | |
(Unaudited)
available to be recouped at a future time. There were no voluntary waivers or reimbursements for the six months ended April 30, 2022.
Certain officers and/or interested trustees of the Funds are also officers and/or employees of the Adviser, administrator, fund accountant, sub-administrator, sub-fund accountant, custodian, legal counsel, and Distributor.
5. Risks:
The Funds may be subject to other risks in addition to these identified risks.
Equity Risk — The value of the equity securities in which the Fund invests may decline in response to developments affecting individual companies and/or general economic conditions in the United States or abroad. A company's earnings or dividends may not increase as expected (or may decline) because of poor management, competitive pressures, reliance on particular suppliers or geographical regions, labor problems or shortages, corporate restructurings, fraudulent disclosures, man-made or natural disasters, military confrontations or wars, terrorism, public health crises, or other events, conditions and factors. Price changes may be temporary or last for extended periods.
Market Risk — Overall market risks may affect the value of the Fund. Domestic and international factors such as political events, war, terrorism, trade disputes, inflation rates, interest rate levels and other fiscal and monetary policy changes, cybersecurity incidents, pandemics and other public health crises, sanctions against a particular foreign country, its nationals, businesses or industries and related geopolitical events, as well as environmental disasters such as earthquakes, fires, and floods, or other catastrophes, may add to instability in global economies and markets generally, and may lead to increased market volatility. Global economies and financial markets are highly interconnected, which increases the possibility that conditions in one country or region might adversely affect issuers in another country or region. The impact of these and other factors may be short-term or may last for extended periods.
Small-Capitalization Stock Risk — Small-capitalization companies are subject to a number of risks not associated with larger, more established companies, potentially making their stock prices more volatile and increasing the risk of loss. Smaller companies may have limited markets, product lines, or financial resources and lack management experience and may experience higher failure rates than larger companies.
Mid-Capitalization Stock Risk — Mid-sized companies may be subject to a number of risks not associated with larger, more established companies, potentially making their stock prices more volatile and increasing the risk of loss.
6. Borrowing and Interfund Lending:
Line of Credit:
The Victory Funds Complex participates in a short-term demand note "Line of Credit" agreement with Citibank. The Line of Credit agreement with Citibank was renewed on June 28, 2021, with a termination date of June 27, 2022. Under the agreement with Citibank, the Victory Funds Complex may borrow up to $600 million, of which $300 million is committed and $300 million is uncommitted. $40 million of the Line of Credit is reserved for use by the Victory Floating Rate Fund, another series of the Victory Funds Complex, with Victory Floating Rate Fund paying the related commitment fees for that amount. The purpose of the Line of Credit is to meet temporary or emergency cash needs. For the six months ended April 30, 2022, Citibank received an annual commitment fee of 0.15% on $300 million for providing the Line of Credit. Each fund in the Victory Funds Complex pays a pro-rata portion of the commitment fees plus any interest (one-month London Interbank Offered Rate ("LIBOR") plus one percent, with LIBOR to be replaced by a different benchmark rate in accordance with the terms of the agreement) on amounts borrowed. Effective with the June 27, 2022 agreement renewal, the interest rate formal on amounts borrowed based on the published 1-month LIBOR rate plus one percent was changed to an interest rate based on the published 1-month Secured Overnight Financing Rate ("SOFR")
34
Victory Portfolios | | Notes to Financial Statements — continued
April 30, 2022 | |
(Unaudited)
plus 1.10 percent. Prior to June 28, 2021, the Victory Funds Complex paid an annual commitment fee of 0.15% and an upfront fee of 0.10%. Each fund in the Victory Funds Complex paid a pro-rata portion of the upfront fee. Interest charged to each fund during the period, if applicable, is reflected on the Statements of Operations under Line of credit fees.
The Funds had no borrowings under the Line of Credit agreement during the six months ended April 30, 2022.
Interfund Lending:
The Trust and the Adviser rely on an exemptive order granted by the SEC in March 2017 (the "Order"), permitting the establishment and operation of an Interfund Lending Facility (the "Facility"). The Facility allows each Fund to directly lend and borrow money to or from any other fund in the Victory Funds Complex that is permitted to participate in the Facility, relying upon the Order at rates beneficial to both the borrowing and lending funds. Advances under the Facility are allowed for temporary or emergency purposes, including the meeting of redemption requests that otherwise might require the untimely disposition of securities, and are subject to each Fund's borrowing restrictions. The interfund loan rate is determined, as specified in the Order, by averaging the current repurchase agreement rate and the current bank loan rate. As a Borrower, interest charged to each Fund, if any, during the period, is reflected on the Statements of Operations under Interfund lending fees. As a Lender, interest earned by each Fund, if any, during the period, is reflected on the Statements of Operations under Interfund lending.
The average borrowing or lending for the days outstanding and average interest rate for the Funds that utilized this Facility during the period ended April 30, 2022, were as follows (amounts in thousands):
| | | Borrower or
Lender | | Amount
Outstanding at
April 30, 2022 | | Average
Lending* | | Days
Lending
Outstanding | | Average
Interest
Rate | | Maximum
Lending
During the
Period | |
Sycamore Established
Value Fund | | Lender | | $ | 34,798 | | | $ | 12,162 | | | | 54 | | | | 0.71 | % | | $ | 55,786 | | |
* For the six months ended April 30, 2022, based on the number of days borrowings were outstanding.
7. Federal Income Tax Information:
Distributable net realized gains, if any, are declared and distributed at least annually from each Fund. Dividends from net investment income, if any, are declared and paid as noted in the table below.
| | | Declared | | Paid | |
Sycamore Established Value Fund | | Quarterly | | Quarterly | |
Sycamore Small Company Opportunity Fund | | Annually | | Annually | |
The amounts of dividends from net investment income and distributions from net realized gains (collectively, distributions to shareholders) are determined in accordance with federal income tax regulations, which may differ from GAAP. To the extent these "book/tax" differences are permanent in nature (e.g., net operating loss and distribution reclassification), such amounts are reclassified within the components of net assets based on their federal tax-basis treatment; temporary differences (e.g., wash sales) do not require reclassification. To the extent dividends and distributions exceed net investment income and net realized gains for tax purposes, they are reported as distributions of capital. Net investment losses incurred by the Funds may be reclassified as an offset to capital on the accompanying Statements of Assets and Liabilities.
The tax character of current year distributions paid and the tax basis of the current components of accumulated earnings (deficit) will be determined at the end of the current tax year ending October 31, 2022.
As of the tax year ended October 31, 2021, the Funds had no capital loss carryforwards for federal income tax purposes.
35
Victory Portfolios | | Notes to Financial Statements — continued
April 30, 2022 | |
(Unaudited)
8. Affiliated Securities:
An affiliated security is a security in which a Fund has ownership of at least 5% of the security's outstanding voting shares, an investment company managed by VCM, or an issuer under common control with a Fund or VCM as of the six months ended April 30, 2022. The Funds do not invest in affiliated securities for the purpose of exercising management or control. These securities are noted as affiliated on a Fund's Schedule of Portfolio Investments. Transactions in affiliated securities during the six months ended April 30, 2022, were as follows (amounts in thousands):
| | | Fair Value
10/31/21 | | Purchases
at Cost | | Proceeds
from
Sales | | Realized
Gains
(Losses) | | Capital
Gain
Distribution | | Net
Change in
Unrealized
Appreciation/
Depreciation | | Fair
Value
4/30/22 | | Dividend
Income | |
Sycamore Established Value Fund | |
Maximus, Inc. | | $ | 251,165 | | | $ | 37,703 | | | $ | — | | | $ | — | | | $ | — | | | $ | (37,068 | ) | | $ | 251,800 | | | $ | 1,746 | | |
Sycamore Small Company Opportunity Fund | |
AMERISAFE, Inc. | | $ | 60,179 | | | $ | — | | | $ | (1,433 | ) | | $ | (594 | ) | | $ | — | | | $ | (12,497 | ) | | $ | 45,655 | | | $ | 4,669 | | |
AngioDynamics, Inc. | | | 46,378 | | | | 10,858 | | | | (3,040 | ) | | | (172 | ) | | | — | | | | (12,556 | ) | | | 41,468 | | | | — | | |
Citi Trends, Inc. | | | 39,879 | | | | — | | | | — | | | | — | | | | — | | | | (25,461 | ) | | | 14,418 | | | | — | | |
Delek U.S. Holdings, Inc. | | | 56,835 | | | | 17,059 | | | | (6,081 | ) | | | (5,098 | ) | | | — | | | | 26,099 | | | | 88,814 | | | | — | | |
Hanger, Inc. | | | 48,101 | | | | 820 | | | | (921 | ) | | | (352 | ) | | | — | | | | (5,397 | ) | | | 42,251 | | | | — | | |
NETGEAR, Inc. | | | 56,939 | | | | 4,518 | | | | (769 | ) | | | (585 | ) | | | — | | | | (14,533 | ) | | | 45,570 | | | | — | | |
ScanSource, Inc. | | | 57,248 | | | | — | | | | (2,185 | ) | | | (15 | ) | | | — | | | | (2,490 | ) | | | 52,558 | | | | — | | |
The E.W. Scripps Co.,
Class A | | | 60,822 | | | | 10,214 | | | | (2,888 | ) | | | (159 | ) | | | — | | | | (8,075 | ) | | | 59,914 | | | | — | | |
Viad Corp. | | | 61,416 | | | | 16,308 | | | | (1,588 | ) | | | (934 | ) | | | — | | | | (18,872 | ) | | | 56,330 | | | | — | | |
| | | $ | 487,797 | | | $ | 59,777 | | | $ | (18,905 | ) | | $ | (7,909 | ) | | $ | — | | | $ | (73,782 | ) | | $ | 446,978 | | | $ | 4,669 | | |
9. Subsequent Event
The Board approved a change in fiscal year-end from October 31 to June 30. This change in fiscal year-end is effective May 19, 2022.
36
Victory Portfolios | | Supplemental Information
April 30, 2022 | |
(Unaudited)
Proxy Voting and Portfolio Holdings Information
Proxy Voting:
Information regarding the policies and procedures each Fund uses to determine how to vote proxies relating to portfolio securities is available without charge, upon request, by calling 800-539-3863. The information is also included in the Funds' Statement of Additional Information, which is available on the SEC's website at www.sec.gov.
Information relating to how the Funds voted proxies relating to portfolio securities held during the most recent 12 months ended June 30 is available on the SEC's website at www.sec.gov.
Availability of Schedules of Portfolio Investments:
The Trust files a complete list of Schedules of Portfolio Investments with the SEC for the first and third quarter of each fiscal year on Form N-PORT. Forms N-PORT are available on the SEC's website at www.sec.gov.
Expense Examples
As a shareholder of a Fund, you may incur two types of costs: (1) transaction costs, including sales charges (loads) on purchases; and (2) ongoing costs, including management fees and other Fund expenses. These examples are intended to help you understand your ongoing costs (in dollars) of investing in a Fund and to compare these costs with the ongoing costs of investing in other mutual funds.
These examples are based on an investment of $1,000 invested at the beginning of the period and held for the entire period from November 1, 2021, through April 30, 2022.
The Actual Expense figures in the table below provide information about actual account values and actual expenses. You may use the information below, together with the amount you invested, to estimate the expenses that you paid over the period. Simply divide your account value by $1,000 (for example, an $8,600 account value divided by $1,000 = 8.6), then multiply the result by the number in the table under the heading entitled "Actual Expenses Paid During Period" to estimate the expenses you paid on your account during this period.
The Hypothetical Expense figures in the table below provide information about hypothetical account values and hypothetical expenses based on the Fund's actual expense ratio and an assumed rate of return of 5% per year before expenses, which is not the Fund's actual return. The hypothetical account values and expenses may not be used to estimate the actual ending account balance or expenses you paid for the period. You may use this information to compare this 5% hypothetical example with the 5% hypothetical examples that appear in shareholder reports of other funds.
Please note the expenses shown in the table below are meant to highlight your ongoing costs only and do not reflect any transactional costs. Therefore, the hypothetical expenses in the table are useful in comparing ongoing costs only and will not help you determine the relative total costs of owning different funds. In addition, if these transactional costs were included, your costs would have been higher.
| | | Beginning
Account
Value
11/1/21 | | Actual
Ending
Account
Value
4/30/22 | | Hypothetical
Ending
Account
Value
4/30/22 | | Actual
Expenses
Paid During
Period
11/1/21-4/30/22* | | Hypothetical
Expenses
Paid During
Period
11/1/21-4/30/22* | | Annualized
Expense Ratio
During Period
11/1/21-4/30/22 | |
Sycamore Established Value Fund | |
Class A | | $ | 1,000.00 | | | $ | 1,003.20 | | | $ | 1,020.38 | | | $ | 4.42 | | | $ | 4.46 | | | | 0.89 | % | |
Class C | | | 1,000.00 | | | | 999.30 | | | | 1,016.61 | | | | 8.18 | | | | 8.25 | | | | 1.65 | % | |
Class I | | | 1,000.00 | | | | 1,004.70 | | | | 1,021.92 | | | | 2.88 | | | | 2.91 | | | | 0.58 | % | |
Class R | | | 1,000.00 | | | | 1,002.10 | | | | 1,019.29 | | | | 5.51 | | | | 5.56 | | | | 1.11 | % | |
Class R6 | | | 1,000.00 | | | | 1,005.10 | | | | 1,022.12 | | | | 2.68 | | | | 2.71 | | | | 0.54 | % | |
Class Y | | | 1,000.00 | | | | 1,004.50 | | | | 1,021.77 | | | | 3.03 | | | | 3.06 | | | | 0.61 | % | |
37
Victory Portfolios | | Supplemental Information — continued
April 30, 2022 | |
(Unaudited)
| | | Beginning
Account
Value
11/1/21 | | Actual
Ending
Account
Value
4/30/22 | | Hypothetical
Ending
Account
Value
4/30/22 | | Actual
Expenses
Paid During
Period
11/1/21-4/30/22* | | Hypothetical
Expenses
Paid During
Period
11/1/21-4/30/22* | | Annualized
Expense Ratio
During Period
11/1/21-4/30/22 | |
Sycamore Small Company Opportunity Fund | |
Class A | | $ | 1,000.00 | | | $ | 944.00 | | | $ | 1,018.65 | | | $ | 5.98 | | | $ | 6.21 | | | | 1.24 | % | |
Class I | | | 1,000.00 | | | | 945.60 | | | | 1,020.38 | | | | 4.29 | | | | 4.46 | | | | 0.89 | % | |
Class R | | | 1,000.00 | | | | 943.20 | | | | 1,017.75 | | | | 6.84 | | | | 7.10 | | | | 1.42 | % | |
Class R6 | | | 1,000.00 | | | | 945.80 | | | | 1,020.58 | | | | 4.10 | | | | 4.26 | | | | 0.85 | % | |
Class Y | | | 1,000.00 | | | | 945.30 | | | | 1,020.08 | | | | 4.58 | | | | 4.76 | | | | 0.95 | % | |
* Expenses are equal to the average account value multiplied by the Fund's annualized expense ratio multiplied by 181/365 (the number of days in the most recent fiscal half-year divided by the number of days in the fiscal year).
38
Victory Portfolios | | Supplemental Information — continued
April 30, 2022 | |
(Unaudited)
Considerations of the Board in Continuing the Investment Advisory Agreement (the "Agreement")
The Board approved the Agreement on behalf of each of the Funds at a meeting, which was called for that purpose, on November 30, 2021. The Board also considered information relating to the Funds and the Agreement provided throughout the year and, more specifically, at the meetings on October 19, 2021, and November 30, 2021. In considering whether to approve the Agreement, the Board requested, and the Adviser provided, information that the Board believed to be reasonably necessary to reach its conclusions.
The Board, including the Independent Trustees, evaluated this information along with other information obtained throughout the year and was advised by legal counsel to the Funds and independent legal counsel to the Independent Trustees. In addition, the Independent Trustees considered a past review of their overall process for conducting the annual review of the Funds' advisory arrangements by a consultant retained through their counsel.
The Board took into consideration regular reports from the Adviser throughout the COVID-19 pandemic public health crisis concerning how the ongoing pandemic has affected market volatility, investment risk, liquidity and valuation of portfolio securities, and the implementation and effectiveness of business continuity plans. These reports also had confirmed that the pandemic had no material impact on the Adviser's operations.
The Board considered each Fund's advisory fee, expense ratio and investment performance as significant factors in determining whether the Agreement should be continued. In considering whether the compensation paid to the Adviser was fair and reasonable, the Board also evaluated, among other things, the following factors:
• The requirements of the Funds for the services provided by the Adviser;
• The nature, quality and extent of the services provided and expected to be provided;
• The performance of the Funds as compared to comparable funds;
• The fees payable for the services and whether the fee arrangements provided for economies of scale that would benefit Fund shareholders as the Funds grow (acknowledging that economies of scale can be complex to assess and typically are not directly measurable);
• Whether the fee would be sufficient to enable the Adviser to attract and retain experienced personnel and continue to provide quality services to the Funds;
• The fees paid by other clients of the Adviser whose accounts are managed in a similar investment style and any differences in the services provided to the other clients compared to those provided to the Funds;
• The total expenses of each Fund;
• Management's commitment to operating the Funds at competitive expense levels;
• The profitability of the Adviser (as reflected by comparing fees earned against an estimate of the Adviser's costs) with respect to the Adviser's relationship with the Funds;
• Research and other service benefits received by the Adviser obtained through payment of client commissions for securities transactions;
• Other indirect benefits received by the Adviser, and its affiliates, including revenues paid to the Adviser, or its affiliates, by the Funds for administration and fund accounting services, and distribution;
• The capabilities and financial condition of the Adviser;
• Current economic and industry trends; and
• The historical relationship between each Fund and the Adviser.
For Funds with total net expense ratios that ranked within the fourth quartile (most expensive) in relation to their peers as evaluated by a consultant, the Board also considered a memorandum that it requested the Adviser to prepare. The Adviser reviewed additional relevant circumstances, which included, among other things, specialized strategies, small or decreasing assets, or rapid or recent changes in peer expense ratios.
The Board reviewed each Fund's current management fee, comprised of the advisory fee plus the administrative services fee paid to the Adviser, in the context of the Adviser's profitability with respect to each Fund individually.
39
Victory Portfolios | | Supplemental Information — continued
April 30, 2022 | |
(Unaudited)
The Board retained a consultant to provide comparative information about fees and performance. The Board met with the consultant to review its inputs and methodologies, among other things. The Board compared each Fund's gross management fees and total operating expense ratio on a net and gross basis with the median gross management fee and median expense ratio of a universe of comparable mutual funds compiled by the consultant and a peer group of funds with similar investment strategies selected by that consultant from the universe. The Board reviewed the factors and methodology used by the consultant in the selection of each Fund's peer group, including the consultant's selection of a broad universe of funds, the more specific universe of comparable funds, and peer groups of funds with comparable investment strategies and asset levels, among other factors. The Board also reviewed any changes to the consultant's methodology as compared to the prior year, including those resulting from the Adviser's input, if any. With respect to certain Funds, the Board also reviewed fees and other information related to the Adviser's management of similarly managed institutional or private accounts, and the differences in the services provided to these other accounts. The Board also noted that the breakpoints in the advisory fee schedule for the Funds evidenced one way in which the Adviser has shown a willingness to share in its economies of scale.
The Board also reviewed the compliance and administrative services provided to the Funds by the Adviser and its affiliates, including the Adviser's oversight of the Funds' day-to-day operations and oversight of Fund accounting, assistance in meeting legal and regulatory requirements, and other services necessary for the operation of the Funds and the Trust.
The Board found that the gross annual management fee paid by each Fund was within the range of management fees paid by each Fund's respective peer group. The Board noted that each Fund's advisory fee structure contained at least one breakpoint. The Board also found that each Fund's Class A net annual expense ratio, taking into account any shareholder servicing or distribution fees, was reasonable as compared with each Fund's respective peer group. The Board considered the Adviser's contractual agreement with each Fund to waive its fees and reimburse expenses of certain classes for a specified period of time, as described in the Fund's prospectus.
The Board reviewed each Fund's performance over one-, three-, five- and ten-year periods against the performance of the Fund's selected peer group and benchmark index. The Board recognized that the performance of the Funds and the peer group funds are net of expenses, while the performance of the benchmark index reflects gross returns.
The Board reviewed various other specific factors with respect to each Fund, as described below. In their deliberations, the Trustees did not rank the importance of any particular information or factor considered and each Trustee may have attributed different weights to various factors.
Sycamore Established Value Fund
The Board compared the Fund's Class A performance for the one-, three-, five- and ten-year periods ended June 30, 2021, to that of the median performance of the Fund's peer group and benchmark index for the same periods and considered the fact that the Fund outperformed both the benchmark index and the peer group median for all of the periods reviewed.
Having considered, among other things: (1) the Fund's management fee compared to comparable mutual funds; (2) the Fund's total expense ratio compared to comparable mutual funds; (3) that the Adviser's willingness to limit the expenses of certain classes for a period of time would provide stability to the Fund's expenses for those share classes during that period; and (4) the Fund's performance during the periods reviewed, the Board concluded that the Agreement continued to be in the best interests of the Fund's shareholders.
Sycamore Small Company Opportunity Fund
The Board compared the Fund's Class A performance for the one-, three-, five- and ten-year periods ended June 30, 2021, to that of the median performance of the Fund's peer group and benchmark index for the same periods and considered the fact that the Fund underperformed both the benchmark index and the peer group median for the one-year period, and outperformed both the benchmark index and the peer group median for the three-, five- and ten-year periods.
40
Victory Portfolios | | Supplemental Information — continued
April 30, 2022 | |
(Unaudited)
Having considered, among other things: (1) the Fund's management fee compared to comparable mutual funds; (2) the Fund's total expense ratio compared to comparable mutual funds; (3) that the Adviser's willingness to limit the expenses of certain classes for a period of time would provide stability to the Fund's expenses for those share classes during that period; and (4) the Fund's performance during the periods reviewed, the Board concluded that the Agreement continued to be in the best interests of the Fund's shareholders.
Conclusion
Based on its review of the information requested and provided, and following extended discussions, the Board determined that the Agreement, on behalf of the Funds discussed above, was consistent with the best interests of each Fund and its shareholders, and the Board unanimously approved the Agreement, on behalf of each Fund, for an additional annual period on the basis of the foregoing review and discussions and the following considerations, among others:
• The fairness and reasonableness of the investment advisory fee payable to the Adviser under the Agreement in light of the investment advisory services provided, the costs of these services, the profitability of the Adviser's relationship with the Fund and the comparability of the fee paid to the fees paid by other investment companies;
• The nature, quality and extent of the investment advisory services provided by the Adviser;
• The Adviser's entrepreneurial commitment to the management of the Funds and the creation of a broad-based family of funds, which could entail a substantial commitment of the Adviser's resources to the successful operation of the Funds;
• The Adviser's representations regarding its staffing and capabilities to manage the Funds, including the retention of personnel with relevant portfolio management experience;
• The Adviser's efforts to enhance investment results by, among other things, developing quality portfolio management teams; and
• The overall high quality of the personnel, operations, financial condition, investment management capabilities, methodologies and performance of the Adviser.
41
Victory Portfolios | | Supplemental Information — continued
April 30, 2022 | |
(Unaudited)
Liquidity Risk Management Program:
The Victory Funds have adopted and implemented a written liquidity risk management program (the "LRMP") as required by Rule 22e-4 under the Investment Company Act of 1940, as amended. The LRMP is reasonably designed to assess and manage each Fund's liquidity risk, taking into consideration each Fund's investment strategy and the liquidity of its portfolio investments during normal and reasonably foreseeable stressed market conditions; its short- and long-term cash flow projections; and its cash holdings and access to other liquidity management tools such as available funding sources including the Victory Funds Complex Interfund Lending Facility and Line of Credit (discussed in the Notes to Financial Statements). The Victory Funds' Board of Trustees approved the appointment of the Funds' investment adviser, Victory Capital Management Inc. ("Victory Capital"), as the administrator of the LRMP.
Victory Capital manages liquidity risks associated with the Funds' investments by monitoring, among other things, cash and cash equivalents, any use of derivatives, the concentration of investments, the appropriateness of each Fund's investment strategy, and by classifying every Fund investment as either highly liquid, moderately liquid, less liquid, or illiquid on at least a monthly basis. To assist with the classification of Fund investments, Victory Capital has retained a third-party provider of liquidity evaluation services. This provider determines preliminary liquidity classifications for all portfolio holdings based upon portfolio-level data and certain assumptions provided by Victory Capital. Victory Capital reviews the preliminary liquidity classifications and, when appropriate, considers other information including input from the Funds' portfolio managers (including the portfolio managers employed by any investment sub-advisers) in determining final liquidity classifications.
At a meeting held on February 24, 2022, Victory Capital provided an oral and written report to the Trustees on the operation and effectiveness of the LRMP during the previous year. The report from Victory Capital concluded that the Funds did not experience any significant liquidity challenges during the covered period, and the Funds' LRMP is reasonably designed to assess and manage its liquidity risk. The report also concluded that the LRMP continues to operate adequately and effectively to enable Victory Capital to oversee and manage liquidity risk and ensure each Fund is able to meet redemption requests without significant dilution to the remaining investors' interest in each Fund. During the review period, each Fund's portfolio consisted primarily of highly liquid investments, which are defined as cash and any investments that each Fund reasonably expects to be converted to cash in current market conditions in three business days or less without significantly changing the market value of the investment. Therefore, the Funds have not adopted a highly liquid investment minimum. The Funds' investments were below the limitation on illiquid investments during the review period. Additionally, Victory Capital indicated that no events occurred that would require the filing of Form N-LIQUID and recommended no material changes to the LRMP.
42
Privacy Policy
Protecting the Privacy of Information
The Trust respects your right to privacy. We also know that you expect us to conduct and process your business in an accurate and efficient manner. To do so, we must collect and maintain certain personal information about you. This is the information we collect from you on applications or other forms, and from the transactions you make with us or third parties. It may include your name, address, social security number, account transactions and balances, and information about investment goals and risk tolerance.
We do not disclose any information about you or about former customers to anyone except as permitted or required by law. Specifically, we may disclose the information we collect to companies that perform services on our behalf, such as the transfer agent that processes shareholder accounts and printers and mailers that assist us in the distribution of investor materials. We may also disclose this information to companies that perform marketing services on our behalf. This allows us to continue to offer you Victory investment products and services that meet your investing needs, and to effect transactions that you request or authorize. These companies will use this information only in connection with the services for which we hired them. They are not permitted to use or share this information for any other purpose.
To protect your personal information internally, we permit access only by authorized employees and maintain physical, electronic, and procedural safeguards to guard your personal information.*
* You may have received communications regarding information about privacy policies from other financial institutions which gave you the opportunity to "opt-out" of certain information sharing with companies which are not affiliated with that financial institution. The Trust does not share information with other companies for purposes of marketing solicitations for products other than the Trust. Therefore, the Trust does not provide opt-out options to their shareholders.
Victory Funds
P.O. Box 182593
Columbus, Ohio 43218-2593

Visit our website at: | | Call Victory at: | |
www.vcm.com | | 800-539-FUND (800-539-3863) | |
Item 2. Code of Ethics.
Not applicable – only for annual reports.
Item 3. Audit Committee Financial Expert.
Not applicable – only for annual reports.
Item 4. Principal Accountant Fees and Services.
Not applicable – only for annual reports.
Item 5. Audit Committee of Listed Registrants.
Not applicable.
Item 6. Investments.
(a) Not applicable.
(b) Not applicable.
Item 7. Disclosure of Proxy Voting Policies and Procedures for Closed-End Management Investment Companies.
Not applicable.
Item 8. Portfolio Managers of Closed-End Management Investment Companies.
Not applicable.
Item 9. Purchases of Equity Securities by Closed-End Management Investment Company and Affiliated Purchasers.
Not applicable.
Item 10. Submission of Matters to a Vote of Security Holders.
Not applicable.
Item 11. Controls and Procedures.
(a)The registrant’s principal executive officer and principal financial officer have concluded, based on their evaluation of the registrant's disclosure controls and procedures as conducted within 90 days of the filing date of this report, that these disclosure controls and procedures are adequately designed and are operating effectively to ensure that information required to be disclosed by the registrant on Form N-CSR is recorded, processed, summarized and reported within the time periods specified in the Securities and Exchange Commission's rules and forms.
(b)There were no changes in the registrant’s internal control over financial reporting (as defined in Rule 30a-3(d) under the Investment Company Act of 1940 (17 CFR 270.30a-3(d)) that occurred during the period covered by this report that have materially affected or are reasonably likely to materially affect, the registrant’s internal control over financial reporting.
Item 12. Disclosure of Securities Lending Activities for Closed-End Management Investment Companies.
(a)(1) Not applicable.
(a)(2) Not applicable.
(a)(3) Not applicable.
(a)(4) Not applicable.
(b) Not applicable.
Item 13. Exhibits.
(a)(1) Not applicable.
(a)(2) Certifications pursuant to Rule 30a-2(a) are attached hereto.
(a)(3) Not applicable.
(b) Certifications pursuant to Rule 30a-2(b) are furnished herewith.
SIGNATURES
Pursuant to the requirements of the Securities Exchange Act of 1934 and the Investment Company Act of 1940, the registrant has duly caused this report to be signed on its behalf by the undersigned, thereunto duly authorized.
| (Registrant) | Victory Portfolios | |
| | |
| By (Signature and Title)* | /s/ Allan Shaer | |
| | Allan Shaer, Principal Financial Officer | |
Pursuant to the requirements of the Securities Exchange Act of 1934 and the Investment Company Act of 1940, this report has been signed below by the following persons on behalf of the registrant and in the capacities and on the dates indicated.
| By (Signature and Title)* | /s/ Christopher K. Dyer | |
| | Christopher K. Dyer, Principal Executive Officer | |
| | | |
| By (Signature and Title)* | /s/ Allan Shaer | |
| | Allan Shaer, Principal Financial Officer | |