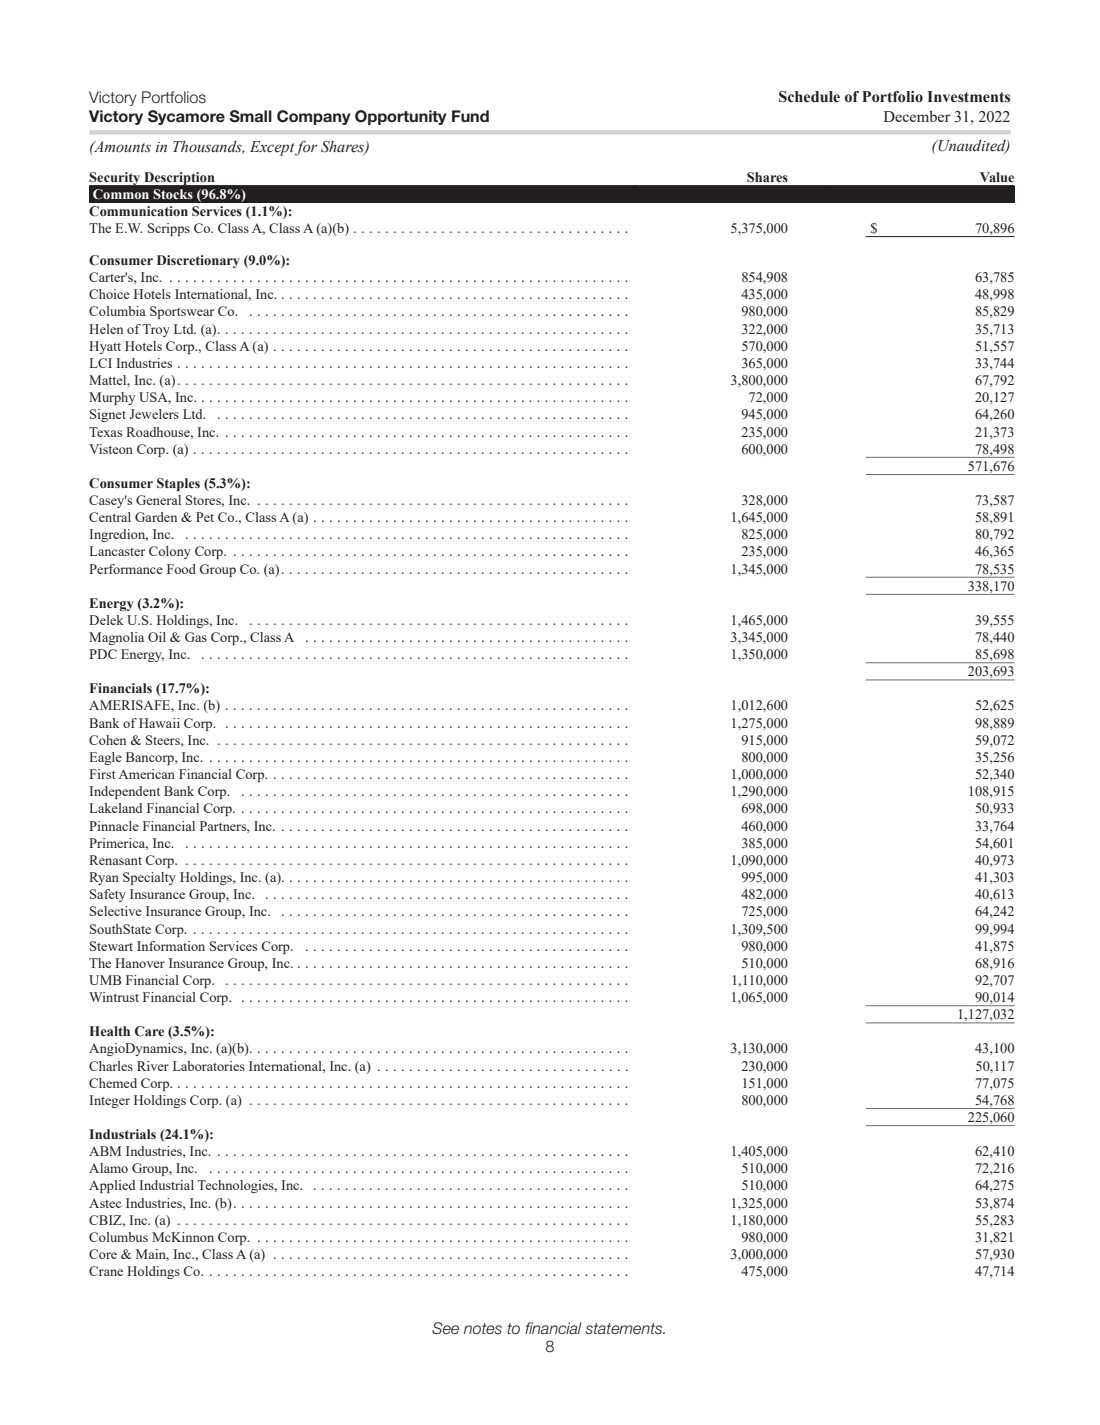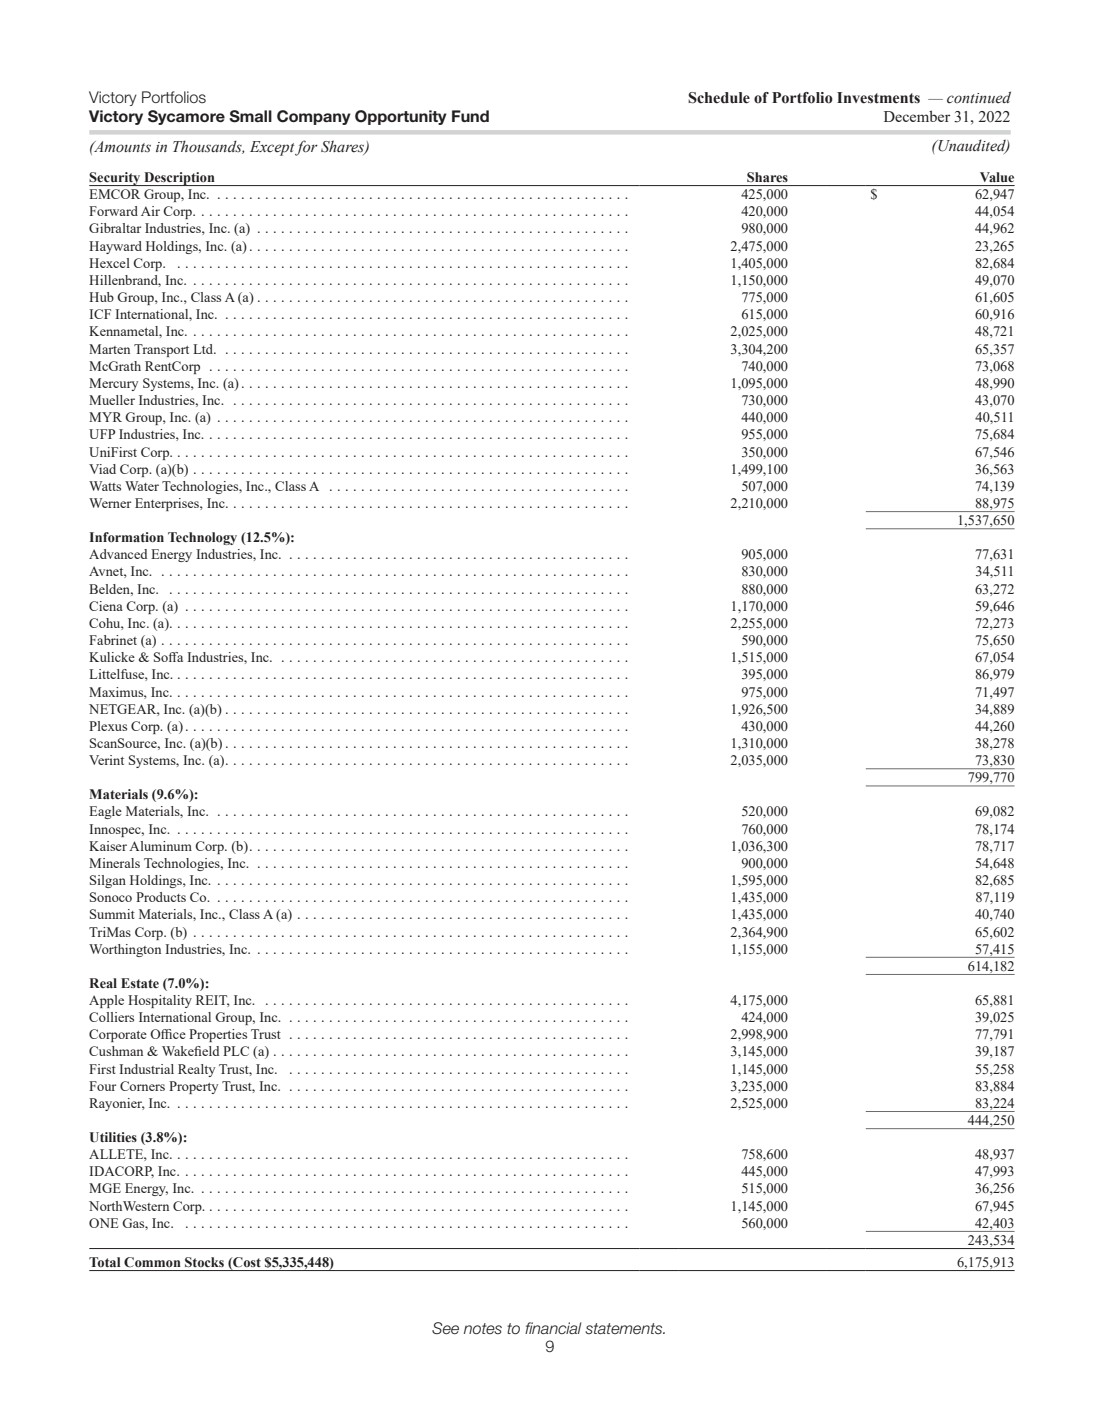
| Victory Portfolios Victory Sycamore Small Company Opportunity Fund 9 (Amounts in Thousands, Except for Shares) (Unaudited) Schedule of Portfolio Investments — continued December 31, 2022 See notes to financial statements. Security Description Shares Value EMCOR Group, Inc. .................................................... 425,000 $ 62,947 Forward Air Corp. ...................................................... 420,000 44,054 Gibraltar Industries, Inc. (a) ............................................... 980,000 44,962 Hayward Holdings, Inc. (a)................................................ 2,475,000 23,265 Hexcel Corp. ......................................................... 1,405,000 82,684 Hillenbrand, Inc. ....................................................... 1,150,000 49,070 Hub Group, Inc., Class A (a) ............................................... 775,000 61,605 ICF International, Inc. ................................................... 615,000 60,916 Kennametal, Inc. ....................................................... 2,025,000 48,721 Marten Transport Ltd. ................................................... 3,304,200 65,357 McGrath RentCorp ..................................................... 740,000 73,068 Mercury Systems, Inc. (a)................................................. 1,095,000 48,990 Mueller Industries, Inc. .................................................. 730,000 43,070 MYR Group, Inc. (a) .................................................... 440,000 40,511 UFP Industries, Inc. ..................................................... 955,000 75,684 UniFirst Corp. ......................................................... 350,000 67,546 Viad Corp. (a)(b) ....................................................... 1,499,100 36,563 Watts Water Technologies, Inc., Class A ...................................... 507,000 74,139 Werner Enterprises, Inc. .................................................. 2,210,000 88,975 1,537,650 Information Technology (12.5%): Advanced Energy Industries, Inc. ........................................... 905,000 77,631 Avnet, Inc. ........................................................... 830,000 34,511 Belden, Inc. .......................................................... 880,000 63,272 Ciena Corp. (a) ........................................................ 1,170,000 59,646 Cohu, Inc. (a).......................................................... 2,255,000 72,273 Fabrinet (a) ........................................................... 590,000 75,650 Kulicke & Soffa Industries, Inc. ............................................ 1,515,000 67,054 Littelfuse, Inc. ......................................................... 395,000 86,979 Maximus, Inc. ......................................................... 975,000 71,497 NETGEAR, Inc. (a)(b) ................................................... 1,926,500 34,889 Plexus Corp. (a)........................................................ 430,000 44,260 ScanSource, Inc. (a)(b) ................................................... 1,310,000 38,278 Verint Systems, Inc. (a)................................................... 2,035,000 73,830 799,770 Materials (9.6%): Eagle Materials, Inc. .................................................... 520,000 69,082 Innospec, Inc. ......................................................... 760,000 78,174 Kaiser Aluminum Corp. (b)................................................ 1,036,300 78,717 Minerals Technologies, Inc. ............................................... 900,000 54,648 Silgan Holdings, Inc. .................................................... 1,595,000 82,685 Sonoco Products Co. .................................................... 1,435,000 87,119 Summit Materials, Inc., Class A (a) .......................................... 1,435,000 40,740 TriMas Corp. (b) ....................................................... 2,364,900 65,602 Worthington Industries, Inc. ............................................... 1,155,000 57,415 614,182 Real Estate (7.0%): Apple Hospitality REIT, Inc. .............................................. 4,175,000 65,881 Colliers International Group, Inc. ........................................... 424,000 39,025 Corporate Office Properties Trust ........................................... 2,998,900 77,791 Cushman & Wakefield PLC (a) ............................................. 3,145,000 39,187 First Industrial Realty Trust, Inc. ........................................... 1,145,000 55,258 Four Corners Property Trust, Inc. ........................................... 3,235,000 83,884 Rayonier, Inc. ......................................................... 2,525,000 83,224 444,250 Utilities (3.8%): ALLETE, Inc. ......................................................... 758,600 48,937 IDACORP, Inc. ........................................................ 445,000 47,993 MGE Energy, Inc. ...................................................... 515,000 36,256 NorthWestern Corp. ..................................................... 1,145,000 67,945 ONE Gas, Inc. ........................................................ 560,000 42,403 243,534 Total Common Stocks (Cost $5,335,448) a a a 6,175,913 |