UNITED STATES
SECURITIES AND EXCHANGE COMMISSION
Washington, D.C. 20549
FORM N-CSR
CERTIFIED SHAREHOLDER REPORT OF REGISTERED
MANAGEMENT INVESTMENT COMPANIES
Investment Company Act file number: 811-04852
Victory Portfolios
(Exact name of registrant as specified in charter)
4900 Tiedeman Road, 4th Floor, Brooklyn, Ohio 44144
(Address of principal executive offices) (Zip code)
Citi Fund Services Ohio, Inc., 4400 Easton Commons, Suite 200, Columbus, Ohio 43219
(Name and address of agent for service)
Registrant’s telephone number, including area code: 800-539-3863
Date of fiscal year end: December 31
Date of reporting period: June 30, 2022
Item 1. Reports to Stockholders.

June 30, 2022
Semi Annual Report
Victory RS Partners Fund
Victory RS Value Fund
Victory RS Large Cap Alpha Fund
Victory RS Investors Fund
Victory Global Energy Transition Fund
www.vcm.com
News, Information And Education 24 Hours A Day, 7 Days A Week
The Victory Capital website gives fund shareholders, prospective shareholders, and investment professionals a convenient way to access fund information, get guidance, and track fund performance anywhere they can access the Internet. The site includes:
• Detailed performance records
• Daily share prices
• The latest fund news
• Investment resources to help you become a better investor
• A section dedicated to investment professionals
Whether you're a potential investor searching for the fund that matches your investment philosophy, a seasoned investor interested in planning tools, or an investment professional, www.vcm.com has what you seek. Visit us anytime. We're always open.
TABLE OF CONTENTS
Investment Objective and Portfolio
Holdings | | | 3 | | |
Schedules of Portfolio Investments | |
Victory RS Partners Fund | | | 8 | | |
Victory RS Value Fund | | | 11 | | |
Victory RS Large Cap Alpha Fund | | | 14 | | |
Victory RS Investors Fund | | | 16 | | |
Victory Global Energy Transition Fund | | | 18 | | |
Financial Statements | |
Statements of Assets and Liabilities | | | 20 | | |
Statements of Operations | | | 22 | | |
Statements of Changes in Net Assets | | | 24 | | |
Financial Highlights | | | 30 | | |
Notes to Financial Statements | | | 40 | | |
Supplemental Information | | | 51 | | |
Proxy Voting and Portfolio Holdings Information | | | 51 | | |
Expense Examples | | | 51 | | |
Liquidity Risk Management Program | | | 53 | | |
Privacy Policy (inside back cover) | | | |
1
IRA DISTRIBUTION WITHHOLDING DISCLOSURE
We generally must withhold federal income tax at a rate of 10% of the taxable portion of your distribution and, if you live in a state that requires state income tax withholding, at your state's tax rate. However, you may elect not to have withholding apply or to have income tax withheld at a higher rate. Any withholding election that you make will apply to any subsequent distribution unless and until you change or revoke the election. If you wish to make a withholding election, or change or revoke a prior withholding election, call 800-539-3863 (800-235-8396 for Member Class) and form W-4P (OMB No. 1545-0074 withholding certificate for pension or annuity payments) will be electronically sent.
If you do not have a withholding election in place by the date of a distribution, federal income tax will be withheld from the taxable portion of your distribution at a rate of 10%. If you must pay estimated taxes, you may be subject to estimated tax penalties if your estimated tax payments are not sufficient and sufficient tax is not withheld from your distribution.
For more specific information, please consult your tax adviser.
The Funds are distributed by Victory Capital Services, Inc. Victory Capital Management Inc. is the investment adviser to the Funds and receives fees from the Funds for performing services for the Funds.
This report is not authorized for distribution to prospective investors unless preceded or accompanied by a current prospectus of the Victory Funds.
For additional information about any Victory Fund, including fees, expenses, and risks, view our prospectus online at vcm.com or call 800-539-3863 (800-235-8396 for Member Class). Read it carefully before you invest or send money.
The information in this report is based on data obtained from recognized services and sources and is believed to be reliable. Any opinions, projections, or recommendations in this report are subject to change without notice and are not intended as individual investment advice. Past investment performance of the Funds, markets or securities mentioned herein should not be considered to be indicative of future results.
• NOT FDIC INSURED • NO BANK GUARANTEE • MAY LOSE VALUE

Call Victory at:
800-539-FUND (800-539-3863)
800-235-8396 for Member Class
Visit our website at:
www.vcm.com
2
Victory Portfolios
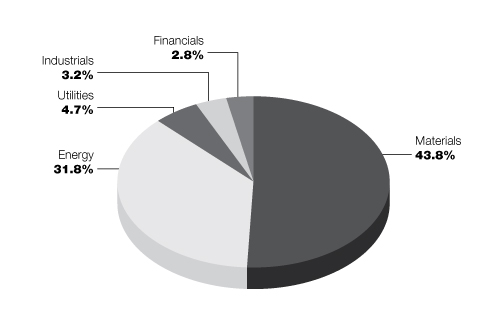
Victory RS Partners Fund | | June 30, 2022 | |
(Unaudited)
Investment Objective and Portfolio Holdings:
The Fund seeks to provide long-term capital appreciation.
Top 10 Holdings*:
June 30, 2022
(% of Net Assets)
White Mountains Insurance Group Ltd. | | | 4.0 | % | |
Equity Commonwealth | | | 3.8 | % | |
Kemper Corp. | | | 3.4 | % | |
Four Corners Property Trust, Inc. | | | 3.1 | % | |
Federated Hermes, Inc. | | | 3.0 | % | |
Globe Life, Inc. | | | 3.0 | % | |
Graphic Packaging Holding Co. | | | 2.9 | % | |
Eastern Bankshares, Inc. | | | 2.8 | % | |
NCR Corp. | | | 2.6 | % | |
Halozyme Therapeutics, Inc. | | | 2.6 | % | |
Sector Allocation*:
June 30, 2022
(% of Net Assets)
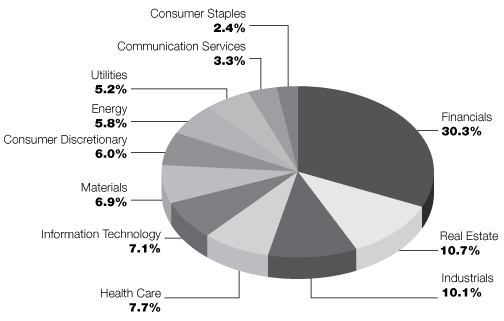
* Does not include futures contracts, money market instruments, and short-term investments purchased with cash collateral from securities loaned.
Percentages are of the net assets of the Fund and may not equal 100%.
Refer to the Schedule of Portfolio Investments for a complete list of securities.
3
Victory Portfolios
Victory RS Value Fund | | June 30, 2022 | |
(Unaudited)
Investment Objective and Portfolio Holdings:
The Fund seeks to provide long-term capital appreciation.
Top 10 Holdings*:
June 30, 2022
(% of Net Assets)
Fairfax Financial Holdings Ltd. | | | 3.8 | % | |
Globe Life, Inc. | | | 3.7 | % | |
Equity Commonwealth | | | 3.7 | % | |
Vistra Corp. | | | 3.4 | % | |
The Progressive Corp. | | | 3.4 | % | |
Humana, Inc. | | | 2.9 | % | |
LKQ Corp. | | | 2.8 | % | |
Federated Hermes, Inc. | | | 2.8 | % | |
Graphic Packaging Holding Co. | | | 2.7 | % | |
Sotera Health Co. | | | 2.7 | % | |
Sector Allocation*:
June 30, 2022
(% of Net Assets)
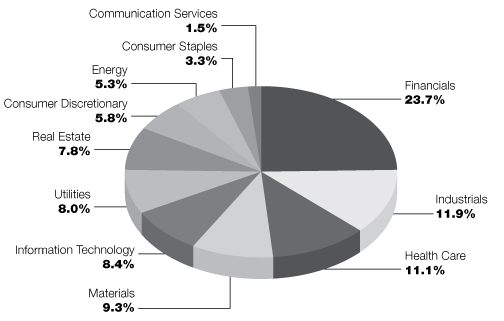
* Does not include futures contracts, money market instruments, and short-term investments purchased with cash collateral from securities loaned.
Percentages are of the net assets of the Fund and may not equal 100%.
Refer to the Schedule of Portfolio Investments for a complete list of securities.
4
Victory Portfolios
Victory RS Large Cap Alpha Fund | | June 30, 2022 | |
(Unaudited)
Investment Objective and Portfolio Holdings:
The Fund seeks to provide long-term capital appreciation.
Top 10 Holdings*:
June 30, 2022
(% of Net Assets)
Fairfax Financial Holdings Ltd. | | | 4.7 | % | |
The Progressive Corp. | | | 4.7 | % | |
Humana, Inc. | | | 4.2 | % | |
Vistra Corp. | | | 3.6 | % | |
Cigna Corp. | | | 3.4 | % | |
Cboe Global Markets, Inc. | | | 3.1 | % | |
Comerica, Inc. | | | 2.9 | % | |
Willis Towers Watson PLC | | | 2.8 | % | |
Medtronic PLC | | | 2.8 | % | |
LKQ Corp. | | | 2.8 | % | |
Sector Allocation*:
June 30, 2022
(% of Net Assets)
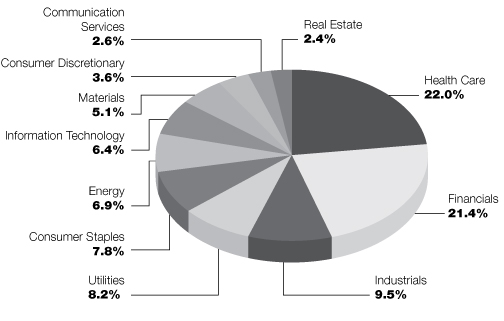
* Does not include futures contracts, money market instruments, and short-term investments purchased with cash collateral from securities loaned.
Percentages are of the net assets of the Fund and may not equal 100%.
Refer to the Schedule of Portfolio Investments for a complete list of securities.
5
Victory Portfolios
Victory RS Investors Fund | | June 30, 2022 | |
(Unaudited)
Investment Objective and Portfolio Holdings:
The Fund seeks to provide long-term capital appreciation.
Top 10 Holdings*:
June 30, 2022
(% of Net Assets)
Fairfax Financial Holdings Ltd. | | | 6.2 | % | |
Alleghany Corp. | | | 4.8 | % | |
White Mountains Insurance Group Ltd. | | | 4.7 | % | |
Humana, Inc. | | | 4.2 | % | |
Cboe Global Markets, Inc. | | | 4.0 | % | |
Vistra Corp. | | | 4.0 | % | |
Willis Towers Watson PLC | | | 3.9 | % | |
Graphic Packaging Holding Co. | | | 3.9 | % | |
The Progressive Corp. | | | 3.7 | % | |
Federated Hermes, Inc. | | | 3.1 | % | |
Sector Allocation*:
June 30, 2022
(% of Net Assets)
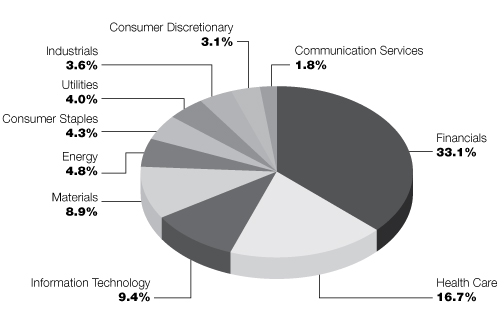
* Does not include futures contracts, money market instruments, and short-term investments purchased with cash collateral from securities loaned.
Percentages are of the net assets of the Fund and may not equal 100%.
Refer to the Schedule of Portfolio Investments for a complete list of securities.
6
Victory Portfolios
Victory Global Energy Transition Fund | | June 30, 2022 | |
(Unaudited)
Investment Objective and Portfolio Holdings:
The Fund seeks to provide long-term capital appreciation.
Top 10 Holdings*:
June 30, 2022
(% of Net Assets)
Turquoise Hill Resources Ltd. | | | 18.4 | % | |
Whitecap Resources, Inc. | | | 6.7 | % | |
Cameco Corp. | | | 6.6 | % | |
Antero Resources Corp. | | | 5.2 | % | |
First Quantum Minerals Ltd. | | | 5.0 | % | |
Linde PLC | | | 4.8 | % | |
NextEra Energy, Inc. | | | 4.7 | % | |
Newmont Corp. | | | 4.6 | % | |
Tourmaline Oil Corp. | | | 4.1 | % | |
Iluka Resources Ltd. | | | 4.1 | % | |
Sector Allocation*:
June 30, 2022
(% of Net Assets)
* Does not include futures contracts, money market instruments, and short-term investments purchased with cash collateral from securities loaned.
Percentages are of the net assets of the Fund and may not equal 100%.
Refer to the Schedule of Portfolio Investments for a complete list of securities.
7
Victory Portfolios
Victory RS Partners Fund | | Schedule of Portfolio Investments
June 30, 2022 | |
(Unaudited)
Security Description | | Shares | | Value | |
Common Stocks (95.3%) | |
Banks (12.7%): | |
Banner Corp. | | | 80,970 | | | $ | 4,551,324 | | |
Eastern Bankshares, Inc. | | | 522,640 | | | | 9,647,934 | | |
First BanCorp/Puerto Rico | | | 594,780 | | | | 7,678,610 | | |
Pinnacle Financial Partners, Inc. | | | 35,970 | | | | 2,600,991 | | |
SouthState Corp. | | | 47,270 | | | | 3,646,881 | | |
Synovus Financial Corp. | | | 99,030 | | | | 3,570,031 | | |
The Bank of NT Butterfield & Son Ltd. | | | 281,170 | | | | 8,769,692 | | |
UMB Financial Corp. | | | 43,062 | | | | 3,707,638 | | |
| | | | 44,173,101 | | |
Capital Markets (3.0%): | |
Federated Hermes, Inc. | | | 332,170 | | | | 10,559,684 | | |
Communication Services (3.3%): | |
Madison Square Garden Sports Corp. (a) | | | 41,860 | | | | 6,320,860 | | |
World Wrestling Entertainment, Inc., Class A (b) | | | 81,050 | | | | 5,064,815 | | |
| | | | 11,385,675 | | |
Consumer Discretionary (6.0%): | |
Carter's, Inc. | | | 32,680 | | | | 2,303,286 | | |
Dana, Inc. | | | 175,070 | | | | 2,463,235 | | |
Dine Brands Global, Inc. | | | 76,990 | | | | 5,010,509 | | |
Light & Wonder, Inc. (a) | | | 70,430 | | | | 3,309,506 | | |
The Wendy's Co. | | | 157,720 | | | | 2,977,754 | | |
Wolverine World Wide, Inc. | | | 235,120 | | | | 4,740,019 | | |
| | | | 20,804,309 | | |
Consumer Staples (2.4%): | |
Spectrum Brands Holdings, Inc. | | | 68,060 | | | | 5,582,282 | | |
U.S. Foods Holding Corp. (a) | | | 90,140 | | | | 2,765,495 | | |
| | | | 8,347,777 | | |
Energy (5.8%): | |
California Resources Corp. | | | 118,480 | | | | 4,561,480 | | |
Comstock Resources, Inc. (a) | | | 134,870 | | | | 1,629,230 | | |
Northern Oil and Gas, Inc. | | | 188,310 | | | | 4,756,711 | | |
PDC Energy, Inc. | | | 84,780 | | | | 5,223,296 | | |
Plains GP Holdings LP, Class A | | | 393,870 | | | | 4,064,738 | | |
| | | | 20,235,455 | | |
Health Care (7.5%): | |
Encompass Health Corp. | | | 101,560 | | | | 5,692,438 | | |
Halozyme Therapeutics, Inc. (a) | | | 203,300 | | | | 8,945,200 | | |
The Ensign Group, Inc. | | | 100,100 | | | | 7,354,347 | | |
Zimvie, Inc. (a) | | | 273,830 | | | | 4,384,018 | | |
| | | | 26,376,003 | | |
See notes to financial statements.
8
Victory Portfolios
Victory RS Partners Fund | | Schedule of Portfolio Investments — continued
June 30, 2022 | |
(Unaudited)
Security Description | | Shares | | Value | |
Industrials (10.1%): | |
Altra Industrial Motion Corp. | | | 51,800 | | | $ | 1,825,950 | | |
Applied Industrial Technologies, Inc. | | | 37,390 | | | | 3,595,796 | | |
Atkore, Inc. (a) | | | 20,990 | | | | 1,742,380 | | |
Finning International, Inc. | | | 86,290 | | | | 1,816,314 | | |
Fluor Corp. (a) | | | 281,280 | | | | 6,846,355 | | |
GMS, Inc. (a) | | | 26,100 | | | | 1,161,450 | | |
H&E Equipment Services, Inc. | | | 88,520 | | | | 2,564,424 | | |
IAA, Inc. (a) | | | 101,420 | | | | 3,323,534 | | |
ICF International, Inc. | | | 50,420 | | | | 4,789,900 | | |
McGrath RentCorp | | | 34,090 | | | | 2,590,840 | | |
Primoris Services Corp. | | | 62,250 | | | | 1,354,560 | | |
SkyWest, Inc. (a) | | | 65,960 | | | | 1,401,650 | | |
Triton International Ltd. | | | 44,400 | | | | 2,337,660 | | |
| | | | 35,350,813 | | |
Information Technology (7.1%): | |
Euronet Worldwide, Inc. (a) | | | 42,220 | | | | 4,246,910 | | |
NCR Corp. (a) | | | 288,580 | | | | 8,977,724 | | |
Verint Systems, Inc. (a) | | | 122,390 | | | | 5,183,216 | | |
Verra Mobility Corp. (a) | | | 410,410 | | | | 6,447,541 | | |
| | | | 24,855,391 | | |
Insurance (14.6%): | |
Alleghany Corp. (a) | | | 7,340 | | | | 6,114,954 | | |
Globe Life, Inc. | | | 107,790 | | | | 10,506,291 | | |
Kemper Corp. | | | 244,510 | | | | 11,712,029 | | |
Primerica, Inc. | | | 72,813 | | | | 8,714,988 | | |
White Mountains Insurance Group Ltd. | | | 11,100 | | | | 13,832,043 | | |
| | | | 50,880,305 | | |
Materials (6.9%): | |
AdvanSix, Inc. | | | 52,650 | | | | 1,760,616 | | |
Constellium SE (a) | | | 140,130 | | | | 1,851,117 | | |
Graphic Packaging Holding Co. | | | 483,350 | | | | 9,908,675 | | |
Olin Corp. | | | 153,490 | | | | 7,103,517 | | |
Summit Materials, Inc., Class A (a) | | | 70,147 | | | | 1,633,724 | | |
Victoria Gold Corp. (a) | | | 235,630 | | | | 1,829,016 | | |
| | | | 24,086,665 | | |
Real Estate (10.7%): | |
Corporate Office Properties Trust | | | 272,570 | | | | 7,138,608 | | |
Equity Commonwealth (a) | | | 477,060 | | | | 13,133,462 | | |
Four Corners Property Trust, Inc. | | | 405,280 | | | | 10,776,395 | | |
Kennedy-Wilson Holdings, Inc. | | | 325,190 | | | | 6,159,099 | | |
| | | | 37,207,564 | | |
Utilities (5.2%): | |
Black Hills Corp. | | | 85,555 | | | | 6,225,837 | | |
NorthWestern Corp. | | | 99,840 | | | | 5,883,571 | | |
ONE Gas, Inc. | | | 76,430 | | | | 6,205,352 | | |
| | | | 18,314,760 | | |
Total Common Stocks (Cost $303,657,100) | | | 332,577,502 | | |
See notes to financial statements.
9
Victory Portfolios
Victory RS Partners Fund | | Schedule of Portfolio Investments — continued
June 30, 2022 | |
(Unaudited)
Security Description | | Shares | | Value | |
Preferred Stocks (0.2%) | |
Health Care (0.2%): | |
WellDoc, Inc. Series B (c) (d) | | | 1,587,483 | | | $ | 587,369 | | |
Total Preferred Stocks (Cost $1,942,920) | | | 587,369 | | |
Collateral for Securities Loaned (0.7%)^ | |
BlackRock Liquidity Funds TempFund, Institutional Shares, 1.47% (e) | | | 72,843 | | | | 72,843 | | |
Goldman Sachs Financial Square Prime Obligations Fund, Institutional
Shares, 1.42% (e) | | | 36,352 | | | | 36,352 | | |
HSBC U.S. Government Money Market Fund I Shares, 1.46% (e) | | | 453,387 | | | | 453,387 | | |
JPMorgan Prime Money Market Fund, Capital Shares, 1.50% (e) | | | 289,862 | | | | 289,862 | | |
Morgan Stanley Institutional Liquidity Government Portfolio, Institutional
Shares, 1.39% (e) | | | 193,305 | | | | 193,305 | | |
Morgan Stanley Institutional Liquidity Prime Portfolio, Institutional
Shares, 1.53% (e) | | | 1,303,278 | | | | 1,303,278 | | |
Total Collateral for Securities Loaned (Cost $2,349,027) | | | 2,349,027 | | |
Total Investments (Cost $307,949,047) — 96.2% | | | 335,513,898 | | |
Other assets in excess of liabilities — 3.8% | | | 13,266,407 | | |
NET ASSETS — 100.00% | | $ | 348,780,305 | | |
^ Purchased with cash collateral from securities on loan.
(a) Non-income producing security.
(b) All or a portion of this security is on loan.
(c) The Fund's Adviser has deemed this security to be illiquid based upon procedures approved by the Board of Trustees. As of June 30, 2022, illiquid securities were 0.2% of net assets.
(d) Security was fair valued based upon procedures approved by the Board of Trustees and represents 0.2% of net assets as of June 30, 2022. This security is classified as Level 3 within the fair value hierarchy. (See Note 2 in the Notes to Financial Statements)
(e) Rate disclosed is the daily yield on June 30, 2022.
LP — Limited Partnership
See notes to financial statements.
10
Victory Portfolios
Victory RS Value Fund | | Schedule of Portfolio Investments
June 30, 2022 | |
(Unaudited)
Security Description | | Shares | | Value | |
Common Stocks (96.1%) | |
Communication Services (1.5%): | |
World Wrestling Entertainment, Inc., Class A (a) | | | 69,200 | | | $ | 4,324,308 | | |
Consumer Discretionary (5.8%): | |
Carter's, Inc. | | | 26,670 | | | | 1,879,702 | | |
LKQ Corp. | | | 166,690 | | | | 8,182,812 | | |
O'Reilly Automotive, Inc. (b) | | | 3,440 | | | | 2,173,254 | | |
The Wendy's Co. | | | 234,570 | | | | 4,428,682 | | |
| | | | 16,664,450 | | |
Consumer Staples (3.3%): | |
Keurig Dr Pepper, Inc. | | | 131,645 | | | | 4,658,916 | | |
U.S. Foods Holding Corp. (b) | | | 157,770 | | | | 4,840,384 | | |
| | | | 9,499,300 | | |
Energy (5.3%): | |
Baker Hughes Co. | | | 130,300 | | | | 3,761,761 | | |
Chesapeake Energy Corp. (a) | | | 48,350 | | | | 3,921,185 | | |
Marathon Oil Corp. | | | 173,430 | | | | 3,898,706 | | |
Ovintiv, Inc. | | | 82,510 | | | | 3,646,117 | | |
| | | | 15,227,769 | | |
Financials (23.7%): | |
Alleghany Corp. (b) | | | 5,140 | | | | 4,282,134 | | |
Cboe Global Markets, Inc. | | | 48,440 | | | | 5,482,924 | | |
Fairfax Financial Holdings Ltd. | | | 20,810 | | | | 11,029,138 | | |
Federated Hermes, Inc. | | | 254,460 | | | | 8,089,283 | | |
Globe Life, Inc. | | | 110,010 | | | | 10,722,675 | | |
Interactive Brokers Group, Inc. | | | 97,640 | | | | 5,371,176 | | |
KeyCorp | | | 75,080 | | | | 1,293,628 | | |
State Street Corp. | | | 21,980 | | | | 1,355,067 | | |
The Progressive Corp. | | | 84,060 | | | | 9,773,656 | | |
White Mountains Insurance Group Ltd. | | | 5,330 | | | | 6,641,873 | | |
Willis Towers Watson PLC | | | 20,040 | | | | 3,955,696 | | |
| | | | 67,997,250 | | |
Health Care (11.1%): | |
Encompass Health Corp. | | | 67,580 | | | | 3,787,859 | | |
Halozyme Therapeutics, Inc. (b) | | | 156,570 | | | | 6,889,080 | | |
Humana, Inc. | | | 17,970 | | | | 8,411,218 | | |
Sotera Health Co. (b) | | | 395,900 | | | | 7,755,681 | | |
Zimmer Biomet Holdings, Inc. | | | 48,500 | | | | 5,095,410 | | |
| | | | 31,939,248 | | |
Industrials (11.9%): | |
AGCO Corp. | | | 28,630 | | | | 2,825,781 | | |
Crane Holdings Co. | | | 30,030 | | | | 2,629,427 | | |
Curtiss-Wright Corp. | | | 25,090 | | | | 3,313,385 | | |
Fluor Corp. (b) | | | 215,070 | | | | 5,234,804 | | |
L3Harris Technologies, Inc. | | | 7,340 | | | | 1,774,078 | | |
Leidos Holdings, Inc. | | | 59,740 | | | | 6,016,415 | | |
See notes to financial statements.
11
Victory Portfolios
Victory RS Value Fund | | Schedule of Portfolio Investments — continued
June 30, 2022 | |
(Unaudited)
Security Description | | Shares | | Value | |
nVent Electric PLC | | | 67,890 | | | $ | 2,126,994 | | |
Sensata Technologies Holding PLC | | | 135,670 | | | | 5,604,528 | | |
The Timken Co. | | | 65,570 | | | | 3,478,488 | | |
Triton International Ltd. | | | 25,310 | | | | 1,332,572 | | |
| | | | 34,336,472 | | |
Information Technology (8.4%): | |
Euronet Worldwide, Inc. (b) | | | 33,933 | | | | 3,413,320 | | |
Fiserv, Inc. (b) | | | 75,400 | | | | 6,708,338 | | |
Global Payments, Inc. | | | 30,470 | | | | 3,371,201 | | |
NCR Corp. (b) | | | 224,620 | | | | 6,987,928 | | |
Verint Systems, Inc. (b) | | | 86,730 | | | | 3,673,016 | | |
| | | | 24,153,803 | | |
Materials (9.3%): | |
Agnico Eagle Mines Ltd. | | | 111,490 | | | | 5,101,782 | | |
Graphic Packaging Holding Co. | | | 381,580 | | | | 7,822,390 | | |
Olin Corp. | | | 116,860 | | | | 5,408,281 | | |
Sealed Air Corp. | | | 124,040 | | | | 7,159,589 | | |
Summit Materials, Inc., Class A (b) | | | 56,310 | | | | 1,311,460 | | |
| | | | 26,803,502 | | |
Real Estate (7.8%): | |
Americold Realty Trust, Inc. | | | 44,430 | | | | 1,334,677 | | |
Equity Commonwealth (b) | | | 382,540 | | | | 10,531,326 | | |
Healthcare Trust of America, Inc., Class A | | | 74,990 | | | | 2,092,971 | | |
Highwoods Properties, Inc. | | | 75,460 | | | | 2,579,978 | | |
Invitation Homes, Inc. | | | 162,380 | | | | 5,777,480 | | |
| | | | 22,316,432 | | |
Utilities (8.0%): | |
Constellation Energy Corp. | | | 35,450 | | | | 2,029,867 | | |
Evergy, Inc. | | | 54,480 | | | | 3,554,820 | | |
FirstEnergy Corp. | | | 89,650 | | | | 3,441,664 | | |
The AES Corp. | | | 189,110 | | | | 3,973,201 | | |
Vistra Corp. | | | 432,160 | | | | 9,874,856 | | |
| | | | 22,874,408 | | |
Total Common Stocks (Cost $254,196,912) | | | 276,136,942 | | |
Collateral for Securities Loaned (2.7%)^ | |
BlackRock Liquidity Funds TempFund, Institutional Shares, 1.47% (c) | | | 240,267 | | | | 240,267 | | |
Goldman Sachs Financial Square Prime Obligations Fund, Institutional
Shares, 1.42% (c) | | | 119,905 | | | | 119,905 | | |
HSBC U.S. Government Money Market Fund I Shares, 1.46% (c) | | | 1,495,459 | | | | 1,495,459 | | |
JPMorgan Prime Money Market Fund, Capital Shares, 1.50% (c) | | | 956,087 | | | | 956,087 | | |
Morgan Stanley Institutional Liquidity Government Portfolio, Institutional
Shares, 1.39% (c) | | | 637,602 | | | | 637,602 | | |
See notes to financial statements.
12
Victory Portfolios
Victory RS Value Fund | | Schedule of Portfolio Investments — continued
June 30, 2022 | |
(Unaudited)
Security Description | | Shares | | Value | |
Morgan Stanley Institutional Liquidity Prime Portfolio, Institutional
Shares, 1.53% (c) | | | 4,298,754 | | | $ | 4,298,754 | | |
Total Collateral for Securities Loaned (Cost $7,748,074) | | | 7,748,074 | | |
Total Investments (Cost $261,944,986) — 98.8% | | | 283,885,016 | | |
Other assets in excess of liabilities — 1.2% | | | 3,428,165 | | |
NET ASSETS — 100.00% | | $ | 287,313,181 | | |
^ Purchased with cash collateral from securities on loan.
(a) All or a portion of this security is on loan.
(b) Non-income producing security.
(c) Rate disclosed is the daily yield on June 30, 2022.
PLC — Public Limited Company
See notes to financial statements.
13
Victory Portfolios
Victory RS Large Cap Alpha Fund | | Schedule of Portfolio Investments
June 30, 2022 | |
(Unaudited)
Security Description | | Shares | | Value | |
Common Stocks (95.9%) | |
Communication Services (2.6%): | |
Alphabet, Inc., Class A (a) | | | 2,050 | | | $ | 4,467,483 | | |
Meta Platforms, Inc., Class A (a) | | | 48,350 | | | | 7,796,438 | | |
| | | | 12,263,921 | | |
Consumer Discretionary (3.6%): | |
LKQ Corp. | | | 267,060 | | | | 13,109,975 | | |
Target Corp. | | | 29,150 | | | | 4,116,855 | | |
| | | | 17,226,830 | | |
Consumer Staples (7.8%): | |
Keurig Dr Pepper, Inc. | | | 313,220 | | | | 11,084,856 | | |
Lamb Weston Holdings, Inc. | | | 98,100 | | | | 7,010,226 | | |
Mondelez International, Inc., Class A | | | 175,300 | | | | 10,884,377 | | |
U.S. Foods Holding Corp. (a) | | | 255,190 | | | | 7,829,229 | | |
| | | | 36,808,688 | | |
Energy (6.9%): | |
Enterprise Products Partners LP | | | 395,670 | | | | 9,642,478 | | |
Hess Corp. | | | 47,040 | | | | 4,983,417 | | |
Marathon Oil Corp. | | | 302,380 | | | | 6,797,502 | | |
Ovintiv, Inc. | | | 157,840 | | | | 6,974,950 | | |
Valero Energy Corp. | | | 41,610 | | | | 4,422,311 | | |
| | | | 32,820,658 | | |
Financials (21.4%): | |
Cboe Global Markets, Inc. | | | 128,690 | | | | 14,566,421 | | |
Comerica, Inc. | | | 189,020 | | | | 13,870,288 | | |
Fairfax Financial Holdings Ltd. | | | 42,320 | | | | 22,429,271 | | |
Interactive Brokers Group, Inc. | | | 173,950 | | | | 9,568,990 | | |
KeyCorp | | | 147,750 | | | | 2,545,732 | | |
State Street Corp. | | | 41,340 | | | | 2,548,611 | | |
The Progressive Corp. | | | 192,020 | | | | 22,326,165 | | |
Willis Towers Watson PLC | | | 68,140 | | | | 13,450,155 | | |
| | | | 101,305,633 | | |
Health Care (22.0%): | |
AbbVie, Inc. | | | 85,350 | | | | 13,072,206 | | |
Cigna Corp. | | | 61,740 | | | | 16,269,725 | | |
Humana, Inc. | | | 42,360 | | | | 19,827,445 | | |
Johnson & Johnson | | | 47,780 | | | | 8,481,428 | | |
Medtronic PLC | | | 148,200 | | | | 13,300,950 | | |
Merck & Co., Inc. | | | 137,220 | | | | 12,510,347 | | |
Sotera Health Co. (a) | | | 464,370 | | | | 9,097,008 | | |
UnitedHealth Group, Inc. | | | 23,155 | | | | 11,893,103 | | |
| | | | 104,452,212 | | |
Industrials (9.5%): | |
FedEx Corp. | | | 21,000 | | | | 4,760,910 | | |
Johnson Controls International PLC | | | 95,760 | | | | 4,584,989 | | |
L3Harris Technologies, Inc. | | | 24,040 | | | | 5,810,468 | | |
See notes to financial statements.
14
Victory Portfolios
Victory RS Large Cap Alpha Fund | | Schedule of Portfolio Investments — continued
June 30, 2022 | |
(Unaudited)
Security Description | | Shares | | Value | |
Leidos Holdings, Inc. | | | 97,130 | | | $ | 9,781,962 | | |
PACCAR, Inc. | | | 28,720 | | | | 2,364,805 | | |
Raytheon Technologies Corp. | | | 59,462 | | | | 5,714,893 | | |
Sensata Technologies Holding PLC | | | 182,250 | | | | 7,528,747 | | |
Union Pacific Corp. | | | 21,560 | | | | 4,598,317 | | |
| | | | 45,145,091 | | |
Information Technology (6.4%): | |
Euronet Worldwide, Inc. (a) | | | 63,320 | | | | 6,369,359 | | |
Fidelity National Information Services, Inc. | | | 122,870 | | | | 11,263,493 | | |
FleetCor Technologies, Inc. (a) | | | 30,080 | | | | 6,320,109 | | |
Global Payments, Inc. | | | 58,880 | | | | 6,514,483 | | |
| | | | 30,467,444 | | |
Materials (5.1%): | |
Newmont Corp. | | | 140,790 | | | | 8,400,939 | | |
PPG Industries, Inc. | | | 32,640 | | | | 3,732,058 | | |
Sealed Air Corp. | | | 206,982 | | | | 11,947,001 | | |
| | | | 24,079,998 | | |
Real Estate (2.4%): | |
Host Hotels & Resorts, Inc. | | | 196,940 | | | | 3,088,019 | | |
Invitation Homes, Inc. | | | 236,750 | | | | 8,423,565 | | |
| | | | 11,511,584 | | |
Utilities (8.2%): | |
Constellation Energy Corp. | | | 109,633 | | | | 6,277,586 | | |
Exelon Corp. | | | 195,760 | | | | 8,871,843 | | |
FirstEnergy Corp. | | | 178,330 | | | | 6,846,089 | | |
Vistra Corp. | | | 741,030 | | | | 16,932,535 | | |
| | | | 38,928,053 | | |
Total Common Stocks (Cost $408,737,001) | | | 455,010,112 | | |
Total Investments (Cost $408,737,001) — 95.9% | | | 455,010,112 | | |
Other assets in excess of liabilities — 4.1% | | | 19,494,170 | | |
NET ASSETS — 100.00% | | $ | 474,504,282 | | |
(a) Non-income producing security.
LP — Limited Partnership
PLC — Public Limited Company
See notes to financial statements.
15
Victory Portfolios
Victory RS Investors Fund | | Schedule of Portfolio Investments
June 30, 2022 | |
(Unaudited)
Security Description | | Shares | | Value | |
Common Stocks (89.7%) | |
Banks (2.7%): | |
Comerica, Inc. | | | 11,240 | | | $ | 824,791 | | |
Capital Markets (7.1%): | |
Cboe Global Markets, Inc. | | | 10,620 | | | | 1,202,078 | | |
Federated Hermes, Inc. | | | 29,030 | | | | 922,864 | | |
| | | | 2,124,942 | | |
Communication Services (1.8%): | |
Meta Platforms, Inc., Class A (a) | | | 3,470 | | | | 559,538 | | |
Consumer Discretionary (3.1%): | |
LKQ Corp. | | | 18,770 | | | | 921,419 | | |
Consumer Staples (4.3%): | |
Keurig Dr Pepper, Inc. | | | 19,300 | | | | 683,027 | | |
U.S. Foods Holding Corp. (a) | | | 19,450 | | | | 596,726 | | |
| | | | 1,279,753 | | |
Energy (4.8%): | |
Northern Oil and Gas, Inc. | | | 21,400 | | | | 540,564 | | |
PDC Energy, Inc. | | | 14,490 | | | | 892,729 | | |
| | | | 1,433,293 | | |
Health Care (16.7%): | |
Cigna Corp. | | | 2,950 | | | | 777,384 | | |
Humana, Inc. | | | 2,700 | | | | 1,263,789 | | |
Medtronic PLC | | | 8,520 | | | | 764,670 | | |
Merck & Co., Inc. | | | 8,500 | | | | 774,945 | | |
Sotera Health Co. (a) | | | 38,280 | | | | 749,905 | | |
Zimmer Biomet Holdings, Inc. | | | 6,460 | | | | 678,688 | | |
| | | | 5,009,381 | | |
Industrials (3.6%): | |
Fluor Corp. (a) | | | 29,810 | | | | 725,575 | | |
Sensata Technologies Holding PLC | | | 9,000 | | | | 371,790 | | |
| | | | 1,097,365 | | |
Information Technology (9.4%): | |
Euronet Worldwide, Inc. (a) | | | 4,920 | | | | 494,903 | | |
Fidelity National Information Services, Inc. | | | 9,850 | | | | 902,949 | | |
NCR Corp. (a) | | | 24,000 | | | | 746,640 | | |
Verint Systems, Inc. (a) | | | 15,860 | | | | 671,671 | | |
| | | | 2,816,163 | | |
Insurance (23.3%): | |
Alleghany Corp. (a) | | | 1,730 | | | | 1,441,263 | | |
Fairfax Financial Holdings Ltd. | | | 3,520 | | | | 1,865,573 | | |
The Progressive Corp. | | | 9,500 | | | | 1,104,565 | | |
White Mountains Insurance Group Ltd. | | | 1,120 | | | | 1,395,665 | | |
Willis Towers Watson PLC | | | 5,980 | | | | 1,180,392 | | |
| | | | 6,987,458 | | |
See notes to financial statements.
16
Victory Portfolios
Victory RS Investors Fund | | Schedule of Portfolio Investments — continued
June 30, 2022 | |
(Unaudited)
Security Description | | Shares | | Value | |
Materials (8.9%): | |
Graphic Packaging Holding Co. | | | 57,010 | | | $ | 1,168,705 | | |
Olin Corp. | | | 16,100 | | | | 745,108 | | |
Sealed Air Corp. | | | 13,190 | | | | 761,327 | | |
| | | | 2,675,140 | | |
Utilities (4.0%): | |
Vistra Corp. | | | 52,420 | | | | 1,197,797 | | |
Total Common Stocks (Cost $24,597,140) | | | 26,927,040 | | |
Total Investments (Cost $24,597,140) — 89.7% | | | 26,927,040 | | |
Other assets in excess of liabilities — 10.3% | | | 3,079,671 | | |
NET ASSETS — 100.00% | | $ | 30,006,711 | | |
(a) Non-income producing security.
PLC — Public Limited Company
See notes to financial statements.
17
Victory Portfolios
Victory Global Energy Transition Fund | | Schedule of Portfolio Investments
June 30, 2022 | |
(Unaudited)
Security Description | | Shares or
Principal
Amount | | Value | |
Common Stocks (85.0%) | |
Chemicals (4.8%): | |
Linde PLC | | | 62,522 | | | $ | 17,976,951 | | |
Financials (2.8%): | |
Ivanhoe (a) (b) (d) (e) | | | 1,370,663 | | | | 10,745,546 | | |
Industrials (3.2%): | |
Energy Vault Holdings, Inc. (a) (c) | | | 534,964 | | | | 5,360,337 | | |
NuScale Power Corp. (PIPE) (a) (b) | | | 563,808 | | | | 5,361,814 | | |
NuScale Power Corp. (a) (c) | | | 142,608 | | | | 1,424,654 | | |
| | | | 12,146,805 | | |
Metals & Mining (39.0%): | |
First Quantum Minerals Ltd. | | | 993,719 | | | | 18,855,181 | | |
Iluka Resources Ltd. | | | 2,378,770 | | | | 15,496,552 | | |
Ivanhoe Electric, Inc. (a) | | | 594,049 | | | | 5,168,226 | | |
Lundin Mining Corp. | | | 944,011 | | | | 5,985,338 | | |
Newmont Corp. | | | 290,871 | | | | 17,356,272 | | |
Norsk Hydro ASA | | | 1,365,557 | | | | 7,650,770 | | |
Sunrise Energy Metals, Ltd. (a) (c) | | | 4,606,042 | | | | 7,151,894 | | |
Turquoise Hill Resources Ltd. (a) | | | 2,608,571 | | | | 69,857,531 | | |
| | | | 147,521,764 | | |
Oil, Gas & Consumable Fuels (30.5%): | |
Antero Resources Corp. (a) | | | 648,006 | | | | 19,861,384 | | |
Cameco Corp. | | | 1,195,215 | | | | 25,130,161 | | |
Cheniere Energy, Inc. | | | 49,576 | | | | 6,595,095 | | |
Peyto Exploration & Development Corp. | | | 1,238,790 | | | | 11,588,991 | | |
Range Resources Corp. (a) | | | 466,388 | | | | 11,543,103 | | |
Tourmaline Oil Corp. | | | 298,761 | | | | 15,536,965 | | |
Whitecap Resources, Inc. | | | 3,669,315 | | | | 25,488,482 | | |
| | | | 115,744,181 | | |
Utilities (4.7%): | |
NextEra Energy, Inc. | | | 226,960 | | | | 17,580,321 | | |
Total Common Stocks (Cost $220,122,619) | | | 321,715,568 | | |
Preferred Stocks (0.6%) | |
Oil, Gas & Consumable Fuels (0.6%): | |
Energy Vault SA (a) (b) (d) (e) | | | 248,310 | | | | 2,458,269 | | |
Total Preferred Stocks (Cost $2,323,956) | | | 2,458,269 | | |
Convertible Corporate Bonds (0.7%) | |
Oil & Gas (0.7%): | |
Ipulse (PIK), 2.00%, 7/31/23 (b) (d) (e) | | $ | 1,608,540 | | | | 2,706,273 | | |
Total Convertible Corporate Bonds (Cost $1,608,540) | | | 2,706,273 | | |
See notes to financial statements.
18
Victory Portfolios
Victory Global Energy Transition Fund | | Schedule of Portfolio Investments — continued
June 30, 2022 | |
(Unaudited)
Security Description | | Shares | | Value | |
Collateral for Securities Loaned (1.3%)^ | |
BlackRock Liquidity Funds TempFund, Institutional Shares, 1.47% (f) | | | 148,615 | | | $ | 148,615 | | |
Goldman Sachs Financial Square Prime Obligations Fund, Institutional
Shares, 1.42% (f) | | | 74,166 | | | | 74,166 | | |
HSBC U.S. Government Money Market Fund I Shares, 1.46% (f) | | | 925,001 | | | | 925,001 | | |
JPMorgan Prime Money Market Fund, Capital Shares, 1.50% (f) | | | 591,378 | | | | 591,378 | | |
Morgan Stanley Institutional Liquidity Government Portfolio, Institutional
Shares, 1.39% (f) | | | 394,382 | | | | 394,382 | | |
Morgan Stanley Institutional Liquidity Prime Portfolio, Institutional
Shares, 1.53% (f) | | | 2,658,950 | | | | 2,658,950 | | |
Total Collateral for Securities Loaned (Cost $4,792,492) | | | 4,792,492 | | |
Total Investments (Cost $228,847,607) — 87.6% | | | 331,672,602 | | |
Other assets in excess of liabilities — 12.4% | | | 46,916,241 | | |
NET ASSETS — 100.00% | | $ | 378,588,843 | | |
^ Purchased with cash collateral from securities on loan.
(a) Non-income producing security.
(b) The Fund's Adviser has deemed this security to be illiquid based upon procedures approved by the Board of Trustees. As of June 30, 2022, illiquid securities were 5.6% of net assets.
(c) All or a portion of this security is on loan.
(d) Restricted security that is not registered under the Securities Act of 1933.
(e) The following table details the acquisition date and cost of the Fund's restricted securities at June 30, 2022:
Security Name | | Acquisition Date | | Cost | |
Energy Vault SA | | 8/24/2021 | | $ | 5,006,775 | | |
Ipulse | | 7/28/2021 | | | 1,608,540 | | |
Ivanhoe | | 7/28/2021 | | | 11,366,610 | | |
(f) Rate disclosed is the daily yield on June 30, 2022.
PIK — Paid In-Kind
PLC — Public Limited Company
See notes to financial statements.
19
Victory Portfolios | | Statements of Assets and Liabilities
June 30, 2022 | |
(Unaudited)
| | | Victory
RS Partners
Fund | | Victory
RS Value
Fund | | Victory
RS Large
Cap Alpha
Fund | |
Assets: | |
Investments, at value (Cost $307,949,047,
$261,944,986 and $408,737,001) | | $ | 335,513,898 | (a) | | $ | 283,885,016 | (b) | | $ | 455,010,112 | | |
Cash | | | 15,016,423 | | | | 11,206,615 | | | | 19,376,751 | | |
Receivables: | |
Interest and dividends | | | 493,101 | | | | 123,249 | | | | 605,774 | | |
Capital shares issued | | | 151,191 | | | | 189,637 | | | | 7,686 | | |
Investments sold | | | 415,439 | | | | — | | | | — | | |
From Adviser | | | 44,305 | | | | 13,406 | | | | 35,146 | | |
Prepaid expenses | | | 43,791 | | | | 31,625 | | | | 30,991 | | |
Total Assets | | | 351,678,148 | | | | 295,449,548 | | | | 475,066,460 | | |
Liabilities: | |
Payables: | |
Collateral received on loaned securities | | | 2,349,027 | | | | 7,748,074 | | | | — | | |
Capital shares redeemed | | | 99,983 | | | | 41,855 | | | | 178,761 | | |
Accrued expenses and other payables: | |
Investment advisory fees | | | 301,369 | | | | 209,067 | | | | 200,188 | | |
Administration fees | | | 16,258 | | | | 13,310 | | | | 21,680 | | |
Custodian fees | | | 3,153 | | | | 4,555 | | | | 3,888 | | |
Transfer agent fees | | | 78,318 | | | | 72,551 | | | | 87,063 | | |
Compliance fees | | | 207 | | | | 172 | | | | 283 | | |
| 12b-1 fees | | | 17,718 | | | | 17,462 | | | | 48,138 | | |
Other accrued expenses | | | 31,810 | | | | 29,321 | | | | 22,177 | | |
Total Liabilities | | | 2,897,843 | | | | 8,136,367 | | | | 562,178 | | |
Net Assets: | |
Capital | | | 291,204,408 | | | | 241,526,000 | | | | 368,466,344 | | |
Total accumulated earnings/(loss) | | | 57,575,897 | | | | 45,787,181 | | | | 106,037,938 | | |
Net Assets | | $ | 348,780,305 | | | $ | 287,313,181 | | | $ | 474,504,282 | | |
Net Assets | |
Class A | | $ | 168,493,660 | | | $ | 164,701,282 | | | $ | 443,808,799 | | |
Class C | | | — | | | | 1,029,322 | | | | 3,888,387 | | |
Class R | | | 1,373,750 | | | | 628,643 | | | | 5,980,808 | | |
Class Y | | | 175,081,311 | | | | 120,953,934 | | | | 20,826,288 | | |
Member Class | | | 3,831,584 | | | | — | | | | — | | |
Total | | $ | 348,780,305 | | | $ | 287,313,181 | | | $ | 474,504,282 | | |
Shares (unlimited number of shares authorized
with a par value of $0.001 per share): | |
Class A | | | 6,972,284 | | | | 6,898,666 | | | | 8,657,827 | | |
Class C | | | — | | | | 50,900 | | | | 93,950 | | |
Class R | | | 65,244 | | | | 28,308 | | | | 117,785 | | |
Class Y | | | 6,642,321 | | | | 4,891,916 | | | | 407,809 | | |
Member Class | | | 158,143 | | | | — | | | | — | | |
Total | | | 13,837,992 | | | | 11,869,790 | | | | 9,277,371 | | |
Net asset value, offering (except Class A)
and redemption price per share: | |
Class A | | $ | 24.17 | | | $ | 23.87 | | | $ | 51.26 | | |
Class C (c) | | | — | | | | 20.22 | | | | 41.39 | | |
Class R | | | 21.06 | | | | 22.21 | | | | 50.78 | | |
Class Y | | | 26.36 | | | | 24.73 | | | | 51.07 | | |
Member Class | | | 24.23 | | | | — | | | | — | | |
Maximum Sales Charge — Class A | | | 5.75 | % | | | 5.75 | % | | | 5.75 | % | |
Maximum offering price (100%/(100%-maximum
sales charge) of net asset value adjusted to the
nearest cent) per share — Class A | | $ | 25.64 | | | $ | 25.33 | | | $ | 54.39 | | |
(a) Includes $2,315,629 of securities on loan.
(b) Includes $7,339,014 of securities on loan.
(c) Redemption price per share varies by the length of time shares are held.
See notes to financial statements.
20
Victory Portfolios | | Statements of Assets and Liabilities
June 30, 2022 | |
(Unaudited)
| | | Victory
RS Investors
Fund | | Victory
Global Energy
Transition
Fund | |
Assets: | |
Investments, at value (Cost $24,597,140 and $228,847,607) | | $ | 26,927,040 | | | $ | 331,672,602 | (a) | |
Foreign currency, at value (Cost $— and $44,397) | | | — | | | | 44,397 | | |
Cash | | | 3,190,741 | | | | 50,829,442 | | |
Receivables: | |
Interest and dividends | | | 39,843 | | | | 537,711 | | |
Capital shares issued | | | 29,000 | | | | 146,127 | | |
Investments sold | | | — | | | | 11,549,302 | | |
From Adviser | | | 19,904 | | | | 29,329 | | |
Prepaid expenses | | | 18,636 | | | | 33,522 | | |
Total Assets | | | 30,225,164 | | | | 394,842,432 | | |
Liabilities: | |
Payables: | |
Collateral received on loaned securities | | | — | | | | 4,792,492 | | |
Investments purchased | | | 170,906 | | | | 10,589,952 | | |
Capital shares redeemed | | | 4,704 | | | | 399,045 | | |
Accrued expenses and other payables: | |
Investment advisory fees | | | 25,181 | | | | 354,911 | | |
Administration fees | | | 1,364 | | | | 19,106 | | |
Custodian fees | | | 625 | | | | 3,881 | | |
Transfer agent fees | | | 7,850 | | | | 56,762 | | |
Compliance fees | | | 18 | | | | 249 | | |
Trustees' fees | | | 1 | | | | 920 | | |
| 12b-1 fees | | | 2,187 | | | | 11,263 | | |
Other accrued expenses | | | 5,617 | | | | 25,008 | | |
Total Liabilities | | | 218,453 | | | | 16,253,589 | | |
Net Assets: | |
Capital | | | 25,649,348 | | | | 2,109,477,885 | | |
Total accumulated earnings/(loss) | | | 4,357,363 | | | | (1,730,889,042 | ) | |
Net Assets | | $ | 30,006,711 | | | $ | 378,588,843 | | |
Net Assets | |
Class A | | $ | 14,213,352 | | | $ | 89,795,550 | | |
Class C | | | 1,387,702 | | | | 2,604,961 | | |
Class R | | | 800,102 | | | | 1,683,165 | | |
Class Y | | | 13,605,555 | | | | 284,505,167 | | |
Total | | $ | 30,006,711 | | | $ | 378,588,843 | | |
Shares (unlimited number of shares authorized with a
par value of $0.001 per share): | |
Class A | | | 1,072,075 | | | | 3,224,419 | | |
Class C | | | 124,108 | | | | 106,325 | | |
Class R | | | 70,009 | | | | 64,635 | | |
Class Y | | | 988,278 | | | | 9,760,551 | | |
Total | | | 2,254,470 | | | | 13,155,930 | | |
Net asset value, offering (except Class A) and
redemption price per share: | |
Class A | | $ | 13.26 | | | $ | 27.85 | | |
Class C (b) | | | 11.18 | | | | 24.50 | | |
Class R | | | 11.43 | | | | 26.04 | | |
Class Y | | | 13.77 | | | | 29.15 | | |
Maximum Sales Charge — Class A | | | 5.75 | % | | | 5.75 | % | |
Maximum offering price (100%/(100%-maximum
sales charge) of net asset value adjusted to the
nearest cent) per share — Class A | | $ | 14.07 | | | $ | 29.55 | | |
(a) Includes $4,718,454 of securities on loan.
(b) Redemption price per share varies by the length of time shares are held.
See notes to financial statements.
21
Victory Portfolios | | Statements of Operations
For the Six Months Ended June 30, 2022 | |
(Unaudited)
| | | Victory
RS Partners
Fund | | Victory
RS Value
Fund | | Victory
RS Large
Cap Alpha
Fund | |
Investment Income: | | | |
Dividends | | $ | 3,033,129 | | | $ | 2,601,916 | | | $ | 4,625,949 | | |
Interest | | | 7,049 | | | | 5,310 | | | | 9,308 | | |
Securities lending (net of fees) | | | 1,701 | | | | 3,639 | | | | 421 | | |
Foreign tax withholding | | | (22,134 | ) | | | (6,690 | ) | | | — | | |
Total Income | | | 3,019,745 | | | | 2,604,175 | | | | 4,635,678 | | |
Expenses: | | | |
Investment advisory fees | | | 1,859,434 | | | | 1,335,899 | | | | 1,271,813 | | |
Administration fees | | | 100,475 | | | | 84,920 | | | | 137,440 | | |
Sub-Administration fees | | | 8,428 | | | | 8,418 | | | | 7,530 | | |
| 12b-1 fees — Class A | | | 231,838 | | | | 223,103 | | | | 595,518 | | |
| 12b-1 fees — Class C | | | — | | | | 6,181 | | | | 25,835 | | |
| 12b-1 fees — Class R | | | 3,791 | | | | 1,613 | | | | 15,808 | | |
Custodian fees | | | 10,119 | | | | 6,649 | | | | 12,158 | | |
Transfer agent fees — Class A | | | 127,824 | | | | 112,893 | | | | 200,518 | | |
Transfer agent fees — Class C | | | — | | | | 613 | | | | 1,415 | | |
Transfer agent fees — Class R | | | 1,444 | | | | 792 | | | | 5,226 | | |
Transfer agent fees — Class Y | | | 78,911 | | | | 71,237 | | | | 8,214 | | |
Transfer agent fees — Member Class | | | 2,852 | | | | — | | | | — | | |
Trustees' fees | | | 11,263 | | | | 9,702 | | | | 15,059 | | |
Compliance fees | | | 1,310 | | | | 1,118 | | | | 1,800 | | |
Legal and audit fees | | | 13,709 | | | | 12,300 | | | | 17,688 | | |
State registration and filing fees | | | 37,495 | | | | 27,578 | | | | 27,461 | | |
Other expenses | | | 22,978 | | | | 17,381 | | | | 21,194 | | |
Recoupment of prior expenses waived/reimbursed
by Adviser | | | — | | | | 66 | | | | 430 | | |
Total Expenses | | | 2,511,871 | | | | 1,920,463 | | | | 2,365,107 | | |
Expenses waived/reimbursed by Adviser | | | (116,671 | ) | | | (33,574 | ) | | | (92,078 | ) | |
Net Expenses | | | 2,395,200 | | | | 1,886,889 | | | | 2,273,029 | | |
Net Investment Income (Loss) | | | 624,545 | | | | 717,286 | | | | 2,362,649 | | |
Realized/Unrealized Gains (Losses) from
Investments: | | | |
Net realized gains (losses) from investment
securities and foreign currency transactions | | | 22,945,689 | | | | 13,023,905 | | | | 32,177,665 | | |
Net change in unrealized appreciation/depreciation
on investment securities | | | (61,571,514 | ) | | | (43,444,642 | ) | | | (70,978,568 | ) | |
Net realized/unrealized gains (losses) on
investments | | | (38,625,825 | ) | | | (30,420,737 | ) | | | (38,800,903 | ) | |
Change in net assets resulting from operations | | $ | (38,001,280 | ) | | $ | (29,703,451 | ) | | $ | (36,438,254 | ) | |
See notes to financial statements.
22
Victory Portfolios | | Statements of Operations
For the Six Months Ended June 30, 2022 | |
(Unaudited)
| | | Victory RS
Investors
Fund | | Victory
Global Energy
Transition
Fund | |
Investment Income: | | | |
Dividends | | $ | 203,305 | | | $ | 3,802,781 | | |
Interest | | | 935 | | | | 125,640 | | |
Securities lending (net of fees) | | | 10 | | | | 653,869 | | |
Foreign tax withholding | | | — | | | | (532,519 | ) | |
Total Income | | | 204,250 | | | | 4,049,771 | | |
Expenses: | | | |
Investment advisory fees | | | 150,738 | | | | 1,966,591 | | |
Administration fees | | | 8,146 | | | | 106,277 | | |
Sub-Administration fees | | | 6,693 | | | | 6,693 | | |
| 12b-1 fees — Class A | | | 18,477 | | | | 123,943 | | |
| 12b-1 fees — Class C | | | 9,700 | | | | 15,946 | | |
| 12b-1 fees — Class R | | | 2,029 | | | | 3,740 | | |
Custodian fees | | | 2,057 | | | | 16,233 | | |
Transfer agent fees — Class A | | | 8,021 | | | | 73,908 | | |
Transfer agent fees — Class C | | | 1,273 | | | | 1,683 | | |
Transfer agent fees — Class R | | | 711 | | | | 1,010 | | |
Transfer agent fees — Class Y | | | 6,702 | | | | 110,959 | | |
Trustees' fees | | | 1,565 | | | | 10,516 | | |
Compliance fees | | | 106 | | | | 1,295 | | |
Legal and audit fees | | | 4,501 | | | | 15,007 | | |
State registration and filing fees | | | 20,926 | | | | 38,406 | | |
Other expenses | | | 6,372 | | | | 21,728 | | |
Recoupment of prior expenses waived/reimbursed by Adviser | | | 187 | | | | 35 | | |
Total Expenses | | | 248,204 | | | | 2,513,970 | | |
Expenses waived/reimbursed by Adviser | | | (55,760 | ) | | | (62,308 | ) | |
Net Expenses | | | 192,444 | | | | 2,451,662 | | |
Net Investment Income (Loss) | | | 11,806 | | | | 1,598,109 | | |
Realized/Unrealized Gains (Losses) from Investments: | | | |
Net realized gains (losses) from investment securities and
foreign currency transactions | | | 1,934,815 | | | | 65,039,968 | | |
Net change in unrealized appreciation/depreciation on
investment securities and foreign currency translations | | | (3,387,668 | ) | | | (3,734,188 | ) | |
Net realized/unrealized gains (losses) on investments | | | (1,452,853 | ) | | | 61,305,780 | | |
Change in net assets resulting from operations | | $ | (1,441,047 | ) | | $ | 62,903,889 | | |
See notes to financial statements.
23
Victory Portfolios | | Statements of Changes in Net Assets | |
| | | Victory RS Partners
Fund | | Victory RS Value
Fund | | Victory RS Large Cap Alpha
Fund | |
| | | Six Months
Ended
June 30,
2022
(Unaudited) | | Year
Ended
December 31,
2021 | | Six Months
Ended
June 30,
2022
(Unaudited) | | Year
Ended
December 31,
2021 | | Six Months
Ended
June 30,
2022
(Unaudited) | | Year
Ended
December 31,
2021 | |
From Investment Activities: | |
Operations: | |
Net Investment
Income (Loss) | | $ | 624,545 | | | $ | (449,102 | ) | | $ | 717,286 | | | $ | 748,848 | | | $ | 2,362,649 | | | $ | 5,769,360 | | |
Net realized gains
(losses) from
investments | | | 22,945,689 | | | | 80,047,267 | | | | 13,023,905 | | | | 67,085,450 | | | | 32,177,665 | | | | 79,181,305 | | |
Net change in
unrealized
appreciation/
depreciation
on investments | | | (61,571,514 | ) | | | 13,032,470 | | | | (43,444,642 | ) | | | 11,836,881 | | | | (70,978,568 | ) | | | 20,032,914 | | |
Change in net assets
resulting from
operations | | | (38,001,280 | ) | | | 92,630,635 | | | | (29,703,451 | ) | | | 79,671,179 | | | | (36,438,254 | ) | | | 104,983,579 | | |
Distributions to
Shareholders: | |
Class A | | | — | | | | (28,047,422 | ) | | | — | | | | (23,751,997 | ) | | | — | | | | (55,880,468 | ) | |
Class C | | | — | | | | — | | | | — | | | | (199,127 | ) | | | — | | | | (812,225 | ) | |
Class R | | | — | | | | (261,917 | ) | | | — | | | | (83,609 | ) | | | — | | | | (699,959 | ) | |
Class Y | | | — | | | | (24,006,515 | ) | | | — | | | | (17,934,828 | ) | | | — | | | | (2,330,388 | ) | |
Member Class | | | — | | | | (434,976 | ) | | | — | | | | — | | | | — | | | | — | | |
Change in net assets
resulting from
distributions to
shareholders | | | — | | | | (52,750,830 | ) | | | — | | | | (41,969,561 | ) | | | — | | | | (59,723,040 | ) | |
Change in net assets
resulting from
capital transactions | | | 9,804,037 | | | | 10,857,122 | | | | (17,682,484 | ) | | | (10,957,822 | ) | | | (17,774,707 | ) | | | 5,894,424 | | |
Change in net assets | | | (28,197,243 | ) | | | 50,736,927 | | | | (47,385,935 | ) | | | 26,743,796 | | | | (54,212,961 | ) | | | 51,154,963 | | |
Net Assets: | |
Beginning of period | | | 376,977,548 | | | | 326,240,621 | | | | 334,699,116 | | | | 307,955,320 | | | | 528,717,243 | | | | 477,562,280 | | |
End of period | | $ | 348,780,305 | | | $ | 376,977,548 | | | $ | 287,313,181 | | | $ | 334,699,116 | | | $ | 474,504,282 | | | $ | 528,717,243 | | |
(continues on next page)
See notes to financial statements.
24
Victory Portfolios | | Statements of Changes in Net Assets | |
(continued)
| | | Victory RS Partners
Fund | | Victory RS Value
Fund | | Victory RS Large Cap Alpha
Fund | |
| | | Six Months
Ended
June 30,
2022
(Unaudited) | | Year
Ended
December 31,
2021 | | Six Months
Ended
June 30,
2022
(Unaudited) | | Year
Ended
December 31,
2021 | | Six Months
Ended
June 30,
2022
(Unaudited) | | Year
Ended
December 31,
2021 | |
Capital Transactions: | |
Class A | |
Proceeds from
shares issued | | $ | 5,945,049 | | | $ | 32,378,102 | | | $ | 4,078,373 | | | $ | 12,582,595 | | | $ | 6,746,770 | | | $ | 18,537,698 | | |
Distributions
reinvested | | | — | | | | 27,357,527 | | | | — | | | | 23,208,972 | | | | — | | | | 54,292,632 | | |
Cost of shares
redeemed | | | (13,745,261 | ) | | | (38,380,359 | ) | | | (11,161,457 | ) | | | (27,845,087 | ) | | | (24,744,311 | ) | | | (63,635,769 | ) | |
Total Class A | | $ | (7,800,212 | ) | | $ | 21,355,270 | | | $ | (7,083,084 | ) | | $ | 7,946,480 | | | $ | (17,997,541 | ) | | $ | 9,194,561 | | |
Class C | |
Proceeds from
shares issued | | $ | — | | | $ | — | | | $ | 87,546 | | | $ | 93,397 | | | $ | 210,440 | | | $ | 183,579 | | |
Distributions
reinvested | | | — | | | | — | | | | — | | | | 199,127 | | | | — | | | | 784,649 | | |
Cost of shares
redeemed | | | — | | | | — | | | | (338,215 | ) | | | (1,731,042 | ) | | | (2,191,871 | ) | | | (6,904,121 | ) | |
Total Class C | | $ | — | | | $ | — | | | $ | (250,669 | ) | | $ | (1,438,518 | ) | | $ | (1,981,431 | ) | | $ | (5,935,893 | ) | |
Class R | |
Proceeds from
shares issued | | $ | 52,857 | | | $ | 102,925 | | | $ | 67,848 | | | $ | 79,653 | | | $ | 342,144 | | | $ | 569,839 | | |
Distributions
reinvested | | | — | | | | 261,917 | | | | — | | | | 78,836 | | | | — | | | | 695,951 | | |
Cost of shares
redeemed | | | (172,704 | ) | | | (278,653 | ) | | | (13,476 | ) | | | (280,742 | ) | | | (317,031 | ) | | | (1,527,178 | ) | |
Total Class R | | $ | (119,847 | ) | | $ | 86,189 | | | $ | 54,372 | | | $ | (122,253 | ) | | $ | 25,113 | | | $ | (261,388 | ) | |
Class Y | |
Proceeds from
shares issued | | $ | 34,014,942 | | | $ | 64,038,117 | | | $ | 4,387,104 | | | $ | 12,404,934 | | | $ | 4,119,994 | | | $ | 4,827,781 | | |
Distributions
reinvested | | | — | | | | 23,949,470 | | | | — | | | | 17,722,595 | | | | — | | | | 2,275,335 | | |
Cost of shares
redeemed | | | (17,535,644 | ) | | | (101,782,209 | ) | | | (14,790,207 | ) | | | (47,471,060 | ) | | | (1,940,842 | ) | | | (4,205,972 | ) | |
Total Class Y | | $ | 16,479,298 | | | $ | (13,794,622 | ) | | $ | (10,403,103 | ) | | $ | (17,343,531 | ) | | $ | 2,179,152 | | | $ | 2,897,144 | | |
Member Class | |
Proceeds from
shares issued | | $ | 1,778,175 | | | $ | 4,042,884 | | | $ | — | | | $ | — | | | $ | — | | | $ | — | | |
Distributions
reinvested | | | — | | | | 434,976 | | | | — | | | | — | | | | — | | | | — | | |
Cost of shares
redeemed | | | (533,377 | ) | | | (1,267,575 | ) | | | — | | | | — | | | | — | | | | — | | |
Total Member Class | | $ | 1,244,798 | | | $ | 3,210,285 | | | $ | — | | | $ | — | | | $ | — | | | $ | — | | |
Change in net assets
resulting from capital
transactions | | $ | 9,804,037 | | | $ | 10,857,122 | | | $ | (17,682,484 | ) | | $ | (10,957,822 | ) | | $ | (17,774,707 | ) | | $ | 5,894,424 | | |
(continues on next page)
See notes to financial statements.
25
Victory Portfolios | | Statements of Changes in Net Assets | |
(continued)
| | | Victory RS Partners
Fund | | Victory RS Value
Fund | | Victory RS Large Cap Alpha
Fund | |
| | | Six Months
Ended
June 30,
2022
(Unaudited) | | Year
Ended
December 31,
2021 | | Six Months
Ended
June 30,
2022
(Unaudited) | | Year
Ended
December 31,
2021 | | Six Months
Ended
June 30,
2022
(Unaudited) | | Year
Ended
December 31,
2021 | |
Share Transactions: | |
Class A | |
Issued | | | 226,181 | | | | 1,071,551 | | | | 159,420 | | | | 459,952 | | | | 123,184 | | | | 327,763 | | |
Reinvested | | | — | | | | 1,045,777 | | | | — | | | | 900,018 | | | | — | | | | 1,000,925 | | |
Redeemed | | | (525,913 | ) | | | (1,316,022 | ) | | | (435,157 | ) | | | (1,031,826 | ) | | | (454,839 | ) | | | (1,117,937 | ) | |
Total Class A | | | (299,732 | ) | | | 801,306 | | | | (275,737 | ) | | | 328,144 | | | | (331,655 | ) | | | 210,751 | | |
Class C | |
Issued | | | — | | | | — | | | | 4,051 | | | | 3,951 | | | | 4,886 | | | | 3,697 | | |
Reinvested | | | — | | | | — | | | | — | | | | 9,118 | | | | — | | | | 17,967 | | |
Redeemed | | | — | | | | — | | | | (15,592 | ) | | | (77,404 | ) | | | (50,255 | ) | | | (151,544 | ) | |
Total Class C | | | — | | | | — | | | | (11,541 | ) | | | (64,335 | ) | | | (45,369 | ) | | | (129,880 | ) | |
Class R | |
Issued | | | 2,290 | | | | 3,946 | | | | 2,880 | | | | 3,060 | | | | 6,333 | | | | 10,041 | | |
Reinvested | | | — | | | | 11,467 | | | | — | | | | 3,293 | | | | — | | | | 12,969 | | |
Redeemed | | | (7,603 | ) | | | (10,507 | ) | | | (565 | ) | | | (10,767 | ) | | | (5,976 | ) | | | (26,224 | ) | |
Total Class R | | | (5,313 | ) | | | 4,906 | | | | 2,315 | | | | (4,414 | ) | | | 357 | | | | (3,214 | ) | |
Class Y | |
Issued | | | 1,187,148 | | | | 1,974,973 | | | | 165,482 | | | | 451,850 | | | | 76,191 | | | | 81,687 | | |
Reinvested | | | — | | | | 839,425 | | | | — | | | | 663,195 | | | | — | | | | 42,077 | | |
Redeemed | | | (614,464 | ) | | | (3,210,913 | ) | | | (553,450 | ) | | | (1,681,077 | ) | | | (35,754 | ) | | | (74,261 | ) | |
Total Class Y | | | 572,684 | | | | (396,515 | ) | | | (387,968 | ) | | | (566,032 | ) | | | 40,437 | | | | 49,503 | | |
Member Class | |
Issued | | | 67,292 | | | | 132,546 | | | | — | | | | — | | | | — | | | | — | | |
Reinvested | | | — | | | | 16,583 | | | | — | | | | — | | | | — | | | | — | | |
Redeemed | | | (20,595 | ) | | | (41,908 | ) | | | — | | | | — | | | | — | | | | — | | |
Total Member Class | | | 46,697 | | | | 107,221 | | | | — | | | | — | | | | — | | | | — | | |
Change in Shares | | | 314,336 | | | | 516,918 | | | | (672,931 | ) | | | (306,637 | ) | | | (336,230 | ) | | | 127,160 | | |
See notes to financial statements.
26
Victory Portfolios | | Statements of Changes in Net Assets | |
| | | Victory RS
Investors Fund | | Victory Global Energy
Transition Fund | |
| | | Six Months
Ended
June 30,
2022
(Unaudited) | | Year
Ended
December 31,
2021 | | Six Months
Ended
June 30,
2022
(Unaudited) | | Year
Ended
December 31,
2021 | |
From Investment Activities: | |
Operations: | |
Net Investment Income (Loss) | | $ | 11,806 | | | $ | 45,520 | | | $ | 1,598,109 | | | $ | 12,401 | | |
Net realized gains (losses) from
investments | | | 1,934,815 | | | | 6,937,784 | | | | 65,039,968 | | | | 8,906,170 | | |
Net change in unrealized
appreciation/depreciation
on investments | | | (3,387,668 | ) | | | (144,539 | ) | | | (3,734,188 | ) | | | 121,511,876 | | |
Change in net assets resulting
from operations | | | (1,441,047 | ) | | | 6,838,765 | | | | 62,903,889 | | | | 130,430,447 | | |
Distributions to Shareholders: | |
Class A | | | — | | | | (2,084,214 | ) | | | — | | | | — | | |
Class C | | | — | | | | (430,072 | ) | | | — | | | | — | | |
Class R | | | — | | | | (124,797 | ) | | | — | | | | — | | |
Class Y | | | — | | | | (1,716,122 | ) | | | — | | | | (86,748 | ) | |
Change in net assets resulting
from distributions to shareholders | | | — | | | | (4,355,205 | ) | | | — | | | | (86,748 | ) | |
Change in net assets resulting
from capital transactions | | | 324,073 | | | | 762,677 | | | | 22,516,131 | | | | 3,720,084 | | |
Change in net assets | | | (1,116,974 | ) | | | 3,246,237 | | | | 85,420,020 | | | | 134,063,783 | | |
Net Assets: | |
Beginning of period | | | 31,123,685 | | | | 27,877,448 | | | | 293,168,823 | | | | 159,105,040 | | |
End of period | | $ | 30,006,711 | | | $ | 31,123,685 | | | $ | 378,588,843 | | | $ | 293,168,823 | | |
(continues on next page)
See notes to financial statements.
27
Victory Portfolios | | Statements of Changes in Net Assets | |
(continued)
| | | Victory RS
Investors Fund | | Victory Global Energy
Transition Fund | |
| | | Six Months
Ended
June 30,
2022
(Unaudited) | | Year
Ended
December 31,
2021 | | Six Months
Ended
June 30,
2022
(Unaudited) | | Year
Ended
December 31,
2021 | |
Capital Transactions: | |
Class A | |
Proceeds from shares issued | | $ | 1,384,596 | | | $ | 1,456,481 | | | $ | 32,058,551 | | | $ | 45,428,214 | | |
Distributions reinvested | | | — | | | | 1,959,510 | | | | — | | | | — | | |
Cost of shares redeemed | | | (1,534,796 | ) | | | (2,154,752 | ) | | | (39,029,470 | ) | | | (36,106,014 | ) | |
Total Class A | | $ | (150,200 | ) | | $ | 1,261,239 | | | $ | (6,970,919 | ) | | $ | 9,322,200 | | |
Class C | |
Proceeds from shares issued | | $ | 10,680 | | | $ | 115,128 | | | $ | 165,958 | | | $ | 1,198,233 | | |
Distributions reinvested | | | — | | | | 430,072 | | | | — | | | | — | | |
Cost of shares redeemed | | | (1,225,296 | ) | | | (1,412,389 | ) | | | (1,474,474 | ) | | | (1,858,895 | ) | |
Total Class C | | $ | (1,214,616 | ) | | $ | (867,189 | ) | | $ | (1,308,516 | ) | | $ | (660,662 | ) | |
Class R | |
Proceeds from shares issued | | $ | 53,767 | | | $ | 37,764 | | | $ | 608,775 | | | $ | 1,274,162 | | |
Distributions reinvested | | | — | | | | 124,797 | | | | — | | | | — | | |
Cost of shares redeemed | | | (19,759 | ) | | | (47,693 | ) | | | (124,588 | ) | | | (1,575,801 | ) | |
Total Class R | | $ | 34,008 | | | $ | 114,868 | | | $ | 484,187 | | | $ | (301,639 | ) | |
Class Y | |
Proceeds from shares issued | | $ | 3,973,969 | | | $ | 1,797,156 | | | $ | 115,815,616 | | | $ | 102,421,824 | | |
Distributions reinvested | | | — | | | | 1,711,171 | | | | — | | | | 81,976 | | |
Cost of shares redeemed | | | (2,319,088 | ) | | | (3,254,568 | ) | | | (85,504,237 | ) | | | (107,143,615 | ) | |
Total Class Y | | $ | 1,654,881 | | | $ | 253,759 | | | $ | 30,311,379 | | | $ | (4,639,815 | ) | |
Change in net assets resulting from
capital transactions | | $ | 324,073 | | | $ | 762,677 | | | $ | 22,516,131 | | | $ | 3,720,084 | | |
(continues on next page)
See notes to financial statements.
28
Victory Portfolios | | Statements of Changes in Net Assets | |
(continued)
| | | Victory RS
Investors Fund | | Victory Global Energy
Transition Fund | |
| | | Six Months
Ended
June 30,
2022
(Unaudited) | | Year
Ended
December 31,
2021 | | Six Months
Ended
June 30,
2022
(Unaudited) | | Year
Ended
December 31,
2021 | |
Share Transactions: | |
Class A | |
Issued | | | 101,195 | | | | 99,952 | | | | 1,101,081 | | | | 2,394,815 | | |
Reinvested | | | — | | | | 143,240 | | | | — | | | | — | | |
Redeemed | | | (111,304 | ) | | | (147,295 | ) | | | (1,338,538 | ) | | | (1,910,846 | ) | |
Total Class A | | | (10,109 | ) | | | 95,897 | | | | (237,457 | ) | | | 483,969 | | |
Class C | |
Issued | | | 901 | | | | 9,121 | | | | 6,594 | | | | 78,427 | | |
Reinvested | | | — | | | | 37,139 | | | | — | | | | — | | |
Redeemed | | | (106,452 | ) | | | (111,183 | ) | | | (62,430 | ) | | | (133,023 | ) | |
Total Class C | | | (105,551 | ) | | | (64,923 | ) | | | (55,836 | ) | | | (54,596 | ) | |
Class R | |
Issued | | | 4,563 | | | | 2,913 | | | | 20,948 | | | | 83,535 | | |
Reinvested | | | — | | | | 10,549 | | | | — | | | | — | | |
Redeemed | | | (1,615 | ) | | | (3,805 | ) | | | (4,723 | ) | | | (93,632 | ) | |
Total Class R | | | 2,948 | | | | 9,657 | | | | 16,225 | | | | (10,097 | ) | |
Class Y | |
Issued | | | 277,519 | | | | 117,213 | | | | 3,630,819 | | | | 5,277,694 | | |
Reinvested | | | — | | | | 120,357 | | | | — | | | | 3,515 | | |
Redeemed | | | (162,067 | ) | | | (214,659 | ) | | | (2,778,561 | ) | | | (5,630,485 | ) | |
Total Class Y | | | 115,452 | | | | 22,911 | | | | 852,258 | | | | (349,276 | ) | |
Change in Shares | | | 2,740 | | | | 63,542 | | | | 575,190 | | | | 70,000 | | |
See notes to financial statements.
29
Victory Portfolios | | Financial Highlights | |
For a Share Outstanding Throughout Each Period
| | | | | Investment Activities | | Distributions to
Shareholders From | |
| | | Net Asset
Value,
Beginning of
Period | | Net
Investment
Income
(Loss)(a) | |
Net Realized
and Unrealized
Gains (Losses) | | Total from
Investment
Activities | | Net
Investment
Income | | Net Realized
Gains from
Investments | |
Victory RS Partners Fund | | | |
Class A | | | |
Six Months Ended
June 30, 2022
(Unaudited) | | $ | 26.82 | | | | 0.02 | | | | (2.67 | ) | | | (2.65 | ) | | | — | | | | — | | |
Year Ended December 31: | |
2021 | | $ | 24.21 | | | | (0.09 | ) | | | 7.14 | | | | 7.05 | | | | — | | | | (4.44 | ) | |
2020 | | $ | 24.47 | | | | 0.04 | | | | 0.07 | | | | 0.11 | | | | — | | | | (0.37 | ) | |
2019 | | $ | 20.66 | | | | 0.12 | | | | 6.12 | | | | 6.24 | | | | (0.21 | ) | | | (2.22 | ) | |
2018 | | $ | 29.21 | | | | 0.04 | | | | (3.52 | ) | | | (3.48 | ) | | | (0.08 | ) | | | (4.99 | ) | |
2017 | | $ | 31.58 | | | | (0.25 | ) | | | 4.78 | | | | 4.53 | | | | — | | | | (6.90 | ) | |
Class R | | | |
Six Months Ended
June 30, 2022
(Unaudited) | | $ | 23.41 | | | | (0.02 | ) | | | (2.33 | ) | | | (2.35 | ) | | | — | | | | — | | |
Year Ended December 31: | |
2021 | | $ | 21.65 | | | | (0.17 | ) | | | 6.37 | | | | 6.20 | | | | — | | | | (4.44 | ) | |
2020 | | $ | 22.01 | | | | (0.03 | ) | | | 0.04 | | | | 0.01 | | | | — | | | | (0.37 | ) | |
2019 | | $ | 18.79 | | | | 0.03 | | | | 5.55 | | | | 5.58 | | | | (0.14 | ) | | | (2.22 | ) | |
2018 | | $ | 27.09 | | | | (0.04 | ) | | | (3.27 | ) | | | (3.31 | ) | | | — | | | | (4.99 | ) | |
2017 | | $ | 29.84 | | | | (0.44 | ) | | | 4.59 | | | | 4.15 | | | | — | | | | (6.90 | ) | |
Class Y | | | |
Six Months Ended
June 30, 2022
(Unaudited) | | $ | 29.21 | | | | 0.07 | | | | (2.92 | ) | | | (2.85 | ) | | | — | | | | — | | |
Year Ended December 31: | |
2021 | | $ | 25.99 | | | | 0.02 | | | | 7.69 | | | | 7.71 | | | | (0.05 | ) | | | (4.44 | ) | |
2020 | | $ | 26.17 | | | | 0.12 | | | | 0.07 | | | | 0.19 | | | | — | | | | (0.37 | ) | |
2019 | | $ | 21.94 | | | | 0.21 | | | | 6.52 | | | | 6.73 | | | | (0.28 | ) | | | (2.22 | ) | |
2018 | | $ | 30.67 | | | | 0.14 | | | | (3.71 | ) | | | (3.57 | ) | | | (0.17 | ) | | | (4.99 | ) | |
2017 | | $ | 32.75 | | | | (0.04 | ) | | | 4.86 | | | | 4.82 | | | | — | | | | (6.90 | ) | |
Member Class | | | |
Six Months Ended
June 30, 2022
(Unaudited) | | $ | 26.87 | | | | 0.05 | | | | (2.69 | ) | | | (2.64 | ) | | | — | | | | — | | |
Year Ended December 31: | |
2021 | | $ | 24.22 | | | | (0.04 | ) | | | 7.17 | | | | 7.13 | | | | (0.04 | ) | | | (4.44 | ) | |
November 3, 2020 (g)
through
December 31, 2020 | | $ | 19.64 | | | | 0.01 | | | | 4.94 | | | | 4.95 | | | | — | | | | (0.37 | ) | |
(a) Per share net investment income (loss) has been calculated using the average daily shares method.
(b) Not annualized for periods less than one year.
(c) Annualized for periods less than one year.
(d) Does not include acquired fund fees and expenses, if any.
(e) Portfolio turnover is calculated on the basis of the Fund as a whole without distinguishing between the classes of shares issued.
(f) Reflects an increase in trading activity due to asset allocation shifts.
(g) Commencement of operations.
See notes to financial statements.
30
Victory Portfolios | | Financial Highlights — continued | |
For a Share Outstanding Throughout Each Period
| | | | | Ratios to Average Net Assets | | Supplemental Data | |
| | | Total
Distributions | | Net Asset
Value,
End of
Period | | Total
Return
(Excludes
Sales
Charge)(b) | | Net
Expenses(c)(d) | | Net
Investment
Income
(Loss)(c) | | Gross
Expenses(c)(d) | | Net Assets,
End of
Period
(000's) | | Portfolio
Turnover(b)(e) | |
Victory RS Partners Fund | |
Class A | |
Six Months Ended
June 30, 2022
(Unaudited) | | | — | | | $ | 24.17 | | | | (9.88 | )% | | | 1.45 | % | | | 0.16 | % | | | 1.49 | % | | $ | 168,494 | | | | 53 | % | |
Year Ended December 31: | |
2021 | | | (4.44 | ) | | $ | 26.82 | | | | 29.58 | % | | | 1.45 | % | | | (0.29 | )% | | | 1.49 | % | | $ | 195,053 | | | | 64 | % | |
2020 | | | (0.37 | ) | | $ | 24.21 | | | | 0.46 | % | | | 1.45 | % | | | 0.20 | % | | | 1.53 | % | | $ | 156,629 | | | | 108 | %(f) | |
2019 | | | (2.43 | ) | | $ | 24.47 | | | | 30.69 | % | | | 1.45 | % | | | 0.49 | % | | | 1.52 | % | | $ | 193,630 | | | | 57 | % | |
2018 | | | (5.07 | ) | | $ | 20.66 | | | | (12.04 | )% | | | 1.45 | % | | | 0.14 | % | | | 1.52 | % | | $ | 175,723 | | | | 62 | % | |
2017 | | | (6.90 | ) | | $ | 29.21 | | | | 14.21 | % | | | 1.45 | % | | | (0.75 | )% | | | 1.50 | % | | $ | 259,050 | | | | 38 | % | |
Class R | |
Six Months Ended
June 30, 2022
(Unaudited) | | | — | | | $ | 21.06 | | | | (10.04 | )% | | | 1.81 | % | | | (0.21 | )% | | | 2.54 | % | | $ | 1,374 | | | | 53 | % | |
Year Ended December 31: | |
2021 | | | (4.44 | ) | | $ | 23.41 | | | | 29.15 | % | | | 1.81 | % | | | (0.65 | )% | | | 2.48 | % | | $ | 1,652 | | | | 64 | % | |
2020 | | | (0.37 | ) | | $ | 21.65 | | | | 0.06 | % | | | 1.81 | % | | | (0.15 | )% | | | 2.87 | % | | $ | 1,421 | | | | 108 | %(f) | |
2019 | | | (2.36 | ) | | $ | 22.01 | | | | 30.26 | % | | | 1.81 | % | | | 0.12 | % | | | 2.63 | % | | $ | 1,510 | | | | 57 | % | |
2018 | | | (4.99 | ) | | $ | 18.79 | | | | (12.39 | )% | | | 1.81 | % | | | (0.16 | )% | | | 2.37 | % | | $ | 1,207 | | | | 62 | % | |
2017 | | | (6.90 | ) | | $ | 27.09 | | | | 13.81 | % | | | 1.81 | % | | | (1.40 | )% | | | 2.28 | % | | $ | 2,168 | | | | 38 | % | |
Class Y | |
Six Months Ended
June 30, 2022
(Unaudited) | | | — | | | $ | 26.36 | | | | (9.76 | )% | | | 1.12 | % | | | 0.52 | % | | | 1.19 | % | | $ | 175,081 | | | | 53 | % | |
Year Ended December 31: | |
2021 | | | (4.49 | ) | | $ | 29.21 | | | | 30.03 | % | | | 1.12 | % | | | 0.05 | % | | | 1.19 | % | | $ | 177,278 | | | | 64 | % | |
2020 | | | (0.37 | ) | | $ | 25.99 | | | | 0.77 | % | | | 1.12 | % | | | 0.54 | % | | | 1.23 | % | | $ | 168,087 | | | | 108 | %(f) | |
2019 | | | (2.50 | ) | | $ | 26.17 | | | | 31.18 | % | | | 1.12 | % | | | 0.82 | % | | | 1.21 | % | | $ | 232,432 | | | | 57 | % | |
2018 | | | (5.16 | ) | | $ | 21.94 | | | | (11.77 | )% | | | 1.12 | % | | | 0.48 | % | | | 1.19 | % | | $ | 250,709 | | | | 62 | % | |
2017 | | | (6.90 | ) | | $ | 30.67 | | | | 14.59 | % | | | 1.12 | % | | | (0.11 | )% | | | 1.21 | % | | $ | 349,022 | | | | 38 | % | |
Member Class | |
Six Months Ended
June 30, 2022
(Unaudited) | | | — | | | $ | 24.23 | | | | (9.83 | )% | | | 1.25 | % | | | 0.42 | % | | | 1.79 | % | | $ | 3,832 | | | | 53 | % | |
Year Ended December 31: | |
2021 | | | (4.48 | ) | | $ | 26.87 | | | | 29.90 | % | | | 1.25 | % | | | (0.14 | )% | | | 3.05 | % | | $ | 2,994 | | | | 64 | % | |
November 3, 2020 (g)
through
December 31, 2020 | | | (0.37 | ) | | $ | 24.22 | | | | 25.22 | % | | | 1.25 | % | | | 0.36 | % | | | 33.63 | % | | $ | 102 | | | | 108 | %(f) | |
See notes to financial statements.
31
Victory Portfolios | | Financial Highlights | |
For a Share Outstanding Throughout Each Period
| | | | | Investment Activities | | Distributions to
Shareholders From | |
| | | Net Asset
Value,
Beginning of
Period | | Net
Investment
Income
(Loss)(a) | |
Net Realized
and Unrealized
Gains (Losses) | | Total from
Investment
Activities | | Net
Investment
Income | | Net Realized
Gains from
Investments | |
Victory RS Value Fund | | | |
Class A | | | |
Six Months Ended
June 30, 2022
(Unaudited) | | $ | 26.33 | | | | 0.05 | | | | (2.51 | ) | | | (2.46 | ) | | | — | | | | — | | |
Year Ended December 31: | |
2021 | | $ | 23.68 | | | | 0.03 | | | | 6.34 | | | | 6.37 | | | | (0.11 | ) | | | (3.61 | ) | |
2020 | | $ | 24.79 | | | | 0.03 | | | | (0.68 | ) | | | (0.65 | ) | | | — | | | | (0.46 | ) | |
2019 | | $ | 20.28 | | | | 0.07 | | | | 6.28 | | | | 6.35 | | | | (0.14 | ) | | | (1.70 | ) | |
2018 | | $ | 26.21 | | | | 0.06 | | | | (2.85 | ) | | | (2.79 | ) | | | (0.14 | ) | | | (3.00 | ) | |
2017 | | $ | 27.94 | | | | 0.03 | | | | 4.80 | | | | 4.83 | | | | (0.04 | ) | | | (6.52 | ) | |
Class C | | | |
Six Months Ended
June 30, 2022
(Unaudited) | | $ | 22.38 | | | | (0.04 | ) | | | (2.12 | ) | | | (2.16 | ) | | | — | | | | — | | |
Year Ended December 31: | |
2021 | | $ | 20.65 | | | | (0.16 | ) | | | 5.50 | | | | 5.34 | | | | — | | | | (3.61 | ) | |
2020 | | $ | 21.85 | | | | (0.11 | ) | | | (0.63 | ) | | | (0.74 | ) | | | — | | | | (0.46 | ) | |
2019 | | $ | 18.08 | | | | (0.11 | ) | | | 5.58 | | | | 5.47 | | | | — | | | | (1.70 | ) | |
2018 | | $ | 23.76 | | | | (0.13 | ) | | | (2.55 | ) | | | (2.68 | ) | | | — | | | | (3.00 | ) | |
2017 | | $ | 26.01 | | | | (0.08 | ) | | | 4.35 | | | | 4.27 | | | | — | | | | (6.52 | ) | |
Class R | | | |
Six Months Ended
June 30, 2022
(Unaudited) | | $ | 24.54 | | | | — | (f) | | | (2.33 | ) | | | (2.33 | ) | | | — | | | | — | | |
Year Ended December 31: | |
2021 | | $ | 22.27 | | | | (0.07 | ) | | | 5.95 | | | | 5.88 | | | | — | (f) | | | (3.61 | ) | |
2020 | | $ | 23.44 | | | | (0.05 | ) | | | (0.66 | ) | | | (0.71 | ) | | | — | | | | (0.46 | ) | |
2019 | | $ | 19.26 | | | | (0.03 | ) | | | 5.95 | | | | 5.92 | | | | (0.04 | ) | | | (1.70 | ) | |
2018 | | $ | 25.06 | | | | (0.03 | ) | | | (2.72 | ) | | | (2.75 | ) | | | (0.05 | ) | | | (3.00 | ) | |
2017 | | $ | 27.03 | | | | (0.03 | ) | | | 4.58 | | | | 4.55 | | | | — | | | | (6.52 | ) | |
Class Y | | | |
Six Months Ended
June 30, 2022
(Unaudited) | | $ | 27.23 | | | | 0.08 | | | | (2.58 | ) | | | (2.50 | ) | | | — | | | | — | | |
Year Ended December 31: | |
2021 | | $ | 24.38 | | | | 0.10 | | | | 6.53 | | | | 6.63 | | | | (0.17 | ) | | | (3.61 | ) | |
2020 | | $ | 25.45 | | | | 0.08 | | | | (0.69 | ) | | | (0.61 | ) | | | — | | | | (0.46 | ) | |
2019 | | $ | 20.77 | | | | 0.13 | | | | 6.44 | | | | 6.57 | | | | (0.19 | ) | | | (1.70 | ) | |
2018 | | $ | 26.77 | | | | 0.13 | | | | (2.92 | ) | | | (2.79 | ) | | | (0.21 | ) | | | (3.00 | ) | |
2017 | | $ | 28.40 | | | | 0.06 | | | | 4.94 | | | | 5.00 | | | | (0.11 | ) | | | (6.52 | ) | |
(a) Per share net investment income (loss) has been calculated using the average daily shares method.
(b) Not annualized for periods less than one year.
(c) Annualized for periods less than one year.
(d) Does not include acquired fund fees and expenses, if any.
(e) Portfolio turnover is calculated on the basis of the Fund as a whole without distinguishing between the classes of shares issued.
(f) Amount is less than $0.005 per share.
See notes to financial statements.
32
Victory Portfolios | | Financial Highlights — continued | |
For a Share Outstanding Throughout Each Period
| | | | | Ratios to Average Net Assets | | Supplemental Data | |
| | | Total
Distributions | | Net Asset
Value,
End of
Period | | Total
Return
(Excludes
Sales
Charge)(b) | | Net
Expenses(c)(d) | | Net
Investment
Income
(Loss)(c) | | Gross
Expenses(c)(d) | | Net Assets,
End of
Period
(000's) | | Portfolio
Turnover(b)(e) | |
Victory RS Value Fund | |
Class A | |
Six Months Ended
June 30, 2022
(Unaudited) | | | — | | | $ | 23.87 | | | | (9.34 | )% | | | 1.30 | % | | | 0.36 | % | | | 1.32 | % | | $ | 164,701 | | | | 36 | % | |
Year Ended December 31: | |
2021 | | | (3.72 | ) | | $ | 26.33 | | | | 27.31 | % | | | 1.30 | % | | | 0.12 | % | | | 1.34 | % | | $ | 188,881 | | | | 69 | % | |
2020 | | | (0.46 | ) | | $ | 23.68 | | | | (2.59 | )% | | | 1.30 | % | | | 0.14 | % | | | 1.37 | % | | $ | 162,145 | | | | 73 | % | |
2019 | | | (1.84 | ) | | $ | 24.79 | | | | 31.35 | % | | | 1.30 | % | | | 0.28 | % | | | 1.35 | % | | $ | 207,200 | | | | 54 | % | |
2018 | | | (3.14 | ) | | $ | 20.28 | | | | (10.75 | )% | | | 1.30 | % | | | 0.24 | % | | | 1.34 | % | | $ | 179,535 | | | | 65 | % | |
2017 | | | (6.56 | ) | | $ | 26.21 | | | | 17.41 | % | | | 1.30 | % | | | 0.09 | % | | | 1.33 | % | | $ | 239,994 | | | | 64 | % | |
Class C | |
Six Months Ended
June 30, 2022
(Unaudited) | | | — | | | $ | 20.22 | | | | (9.65 | )% | | | 2.07 | % | | | (0.41 | )% | | | 2.90 | % | | $ | 1,029 | | | | 36 | % | |
Year Ended December 31: | |
2021 | | | (3.61 | ) | | $ | 22.38 | | | | 26.28 | % | | | 2.07 | % | | | (0.67 | )% | | | 2.33 | % | | $ | 1,398 | | | | 69 | % | |
2020 | | | (0.46 | ) | | $ | 20.65 | | | | (3.35 | )% | | | 2.07 | % | | | (0.62 | )% | | | 2.60 | % | | $ | 2,618 | | | | 73 | % | |
2019 | | | (1.70 | ) | | $ | 21.85 | | | | 30.32 | % | | | 2.07 | % | | | (0.50 | )% | | | 2.29 | % | | $ | 4,872 | | | | 54 | % | |
2018 | | | (3.00 | ) | | $ | 18.08 | | | | (11.41 | )% | | | 2.07 | % | | | (0.54 | )% | | | 2.14 | % | | $ | 9,428 | | | | 65 | % | |
2017 | | | (6.52 | ) | | $ | 23.76 | | | | 16.53 | % | | | 2.07 | % | | | (0.30 | )% | | | 2.08 | % | | $ | 16,916 | | | | 64 | % | |
Class R | |
Six Months Ended
June 30, 2022
(Unaudited) | | | — | | | $ | 22.21 | | | | (9.49 | )% | | | 1.69 | % | | | (0.03 | )% | | | 2.94 | % | | $ | 629 | | | | 36 | % | |
Year Ended December 31: | |
2021 | | | (3.61 | ) | | $ | 24.54 | | | | 26.77 | % | | | 1.69 | % | | | (0.27 | )% | | | 1.80 | % | | $ | 638 | | | | 69 | % | |
2020 | | | (0.46 | ) | | $ | 22.27 | | | | (2.95 | )% | | | 1.69 | % | | | (0.23 | )% | | | 4.03 | % | | $ | 677 | | | | 73 | % | |
2019 | | | (1.74 | ) | | $ | 23.44 | | | | 30.89 | % | | | 1.69 | % | | | (0.13 | )% | | | 3.47 | % | | $ | 1,022 | | | | 54 | % | |
2018 | | | (3.05 | ) | | $ | 19.26 | | | | (11.12 | )% | | | 1.69 | % | | | (0.11 | )% | | | 2.82 | % | | $ | 1,019 | | | | 65 | % | |
2017 | | | (6.52 | ) | | $ | 25.06 | | | | 16.95 | % | | | 1.69 | % | | | (0.11 | )% | | | 2.29 | % | | $ | 1,625 | | | | 64 | % | |
Class Y | |
Six Months Ended
June 30, 2022
(Unaudited) | | | — | | | $ | 24.73 | | | | (9.18 | )% | | | 1.06 | % | | | 0.60 | % | | | 1.07 | % | | $ | 120,954 | | | | 36 | % | |
Year Ended December 31: | |
2021 | | | (3.78 | ) | | $ | 27.23 | | | | 27.57 | % | | | 1.06 | % | | | 0.36 | % | | | 1.06 | % | | $ | 143,783 | | | | 69 | % | |
2020 | | | (0.46 | ) | | $ | 24.38 | | | | (2.37 | )% | | | 1.06 | % | | | 0.38 | % | | | 1.10 | % | | $ | 142,515 | | | | 73 | % | |
2019 | | | (1.89 | ) | | $ | 25.45 | | | | 31.69 | % | | | 1.06 | % | | | 0.51 | % | | | 1.07 | % | | $ | 176,749 | | | | 54 | % | |
2018 | | | (3.21 | ) | | $ | 20.77 | | | | (10.54 | )% | | | 1.06 | % | | | 0.49 | % | | | 1.06 | % | | $ | 166,538 | | | | 65 | % | |
2017 | | | (6.63 | ) | | $ | 26.77 | | | | 17.71 | % | | | 1.06 | % | | | 0.20 | % | | | 1.06 | % | | $ | 247,528 | | | | 64 | % | |
See notes to financial statements.
33
Victory Portfolios | | Financial Highlights | |
For a Share Outstanding Throughout Each Period
| | | | | Investment Activities | | Distributions to
Shareholders From | |
| | | Net Asset
Value,
Beginning of
Period | | Net
Investment
Income
(Loss)(a) | |
Net Realized
and Unrealized
Gains (Losses) | | Total from
Investment
Activities | | Net
Investment
Income | | Net Realized
Gains from
Investments | |
Victory RS Large Cap Alpha Fund | | | |
Class A | | | |
Six Months Ended
June 30, 2022
(Unaudited) | | $ | 55.16 | | | | 0.25 | | | | (4.15 | ) | | | (3.90 | ) | | | — | | | | — | | |
Year Ended December 31: | |
2021 | | $ | 50.59 | | | | 0.65 | | | | 10.81 | | | | 11.46 | | | | (0.57 | ) | | | (6.32 | ) | |
2020 | | $ | 53.11 | | | | 0.52 | | | | (1.12 | ) | | | (0.60 | ) | | | (0.15 | ) | | | (1.77 | ) | |
2019 | | $ | 42.20 | | | | 0.51 | | | | 12.44 | | | | 12.95 | | | | (0.37 | ) | | | (1.67 | ) | |
2018 | | $ | 56.61 | | | | 0.44 | | | | (5.67 | ) | | | (5.23 | ) | | | (0.38 | ) | | | (8.80 | ) | |
2017 | | $ | 51.86 | | | | 0.38 | | | | 9.10 | | | | 9.48 | | | | — | (f) | | | (4.73 | ) | |
Class C | | | |
Six Months Ended
June 30, 2022
(Unaudited) | | $ | 44.72 | | | | 0.02 | | | | (3.35 | ) | | | (3.33 | ) | | | — | | | | — | | |
Year Ended December 31: | |
2021 | | $ | 42.07 | | | | 0.13 | | | | 8.97 | | | | 9.10 | | | | (0.13 | ) | | | (6.32 | ) | |
2020 | | $ | 44.70 | | | | 0.14 | | | | (1.00 | ) | | | (0.86 | ) | | | — | | | | (1.77 | ) | |
2019 | | $ | 35.78 | | | | 0.10 | | | | 10.50 | | | | 10.60 | | | | (0.01 | ) | | | (1.67 | ) | |
2018 | | $ | 49.50 | | | | (0.03 | ) | | | (4.89 | ) | | | (4.92 | ) | | | — | (f) | | | (8.80 | ) | |
2017 | | $ | 46.22 | | | | (0.04 | ) | | | 8.05 | | | | 8.01 | | | | — | | | | (4.73 | ) | |
Class R | | | |
Six Months Ended
June 30, 2022
(Unaudited) | | $ | 54.74 | | | | 0.15 | | | | (4.11 | ) | | | (3.96 | ) | | | — | | | | — | | |
Year Ended December 31: | |
2021 | | $ | 50.28 | | | | 0.43 | | | | 10.73 | | | | 11.16 | | | | (0.38 | ) | | | (6.32 | ) | |
2020 | | $ | 52.83 | | | | 0.35 | | | | (1.13 | ) | | | (0.78 | ) | | | — | | | | (1.77 | ) | |
2019 | | $ | 42.01 | | | | 0.32 | | | | 12.36 | | | | 12.68 | | | | (0.19 | ) | | | (1.67 | ) | |
2018 | | $ | 56.35 | | | | 0.22 | | | | (5.61 | ) | | | (5.39 | ) | | | (0.15 | ) | | | (8.80 | ) | |
2017 | | $ | 51.83 | | | | 0.18 | | | | 9.07 | | | | 9.25 | | | | — | | | | (4.73 | ) | |
Class Y | | | |
Six Months Ended
June 30, 2022
(Unaudited) | | $ | 54.90 | | | | 0.31 | | | | (4.14 | ) | | | (3.83 | ) | | | — | | | | — | | |
Year Ended December 31: | |
2021 | | $ | 50.37 | | | | 0.78 | | | | 10.76 | | | | 11.54 | | | | (0.69 | ) | | | (6.32 | ) | |
2020 | | $ | 52.87 | | | | 0.62 | | | | (1.10 | ) | | | (0.48 | ) | | | (0.25 | ) | | | (1.77 | ) | |
2019 | | $ | 42.01 | | | | 0.61 | | | | 12.38 | | | | 12.99 | | | | (0.46 | ) | | | (1.67 | ) | |
2018 | | $ | 56.38 | | | | 0.55 | | | | (5.64 | ) | | | (5.09 | ) | | | (0.48 | ) | | | (8.80 | ) | |
2017 | | $ | 51.66 | | | | 0.49 | | | | 9.07 | | | | 9.56 | | | | (0.11 | ) | | | (4.73 | ) | |
(a) Per share net investment income (loss) has been calculated using the average daily shares method.
(b) Not annualized for periods less than one year.
(c) Annualized for periods less than one year.
(d) Does not include acquired fund fees and expenses, if any.
(e) Portfolio turnover is calculated on the basis of the Fund as a whole without distinguishing between the classes of shares issued.
(f) Amount is less than $0.005 per share.
See notes to financial statements.
34
Victory Portfolios | | Financial Highlights — continued | |
For a Share Outstanding Throughout Each Period
| | | | | Ratios to Average Net Assets | | Supplemental Data | |
| | | Total
Distributions | | Net Asset
Value,
End of
Period | | Total
Return
(Excludes
Sales
Charge)(b) | | Net
Expenses(c)(d) | | Net
Investment
Income
(Loss)(c) | | Gross
Expenses(c)(d) | | Net Assets,
End of
Period
(000's) | | Portfolio
Turnover(b)(e) | |
Victory RS Large Cap Alpha Fund | |
Class A | |
Six Months Ended
June 30, 2022
(Unaudited) | | | — | | | $ | 51.26 | | | | (7.07 | )% | | | 0.89 | % | | | 0.93 | % | | | 0.92 | % | | $ | 443,809 | | | | 31 | % | |
Year Ended December 31: | |
2021 | | | (6.89 | ) | | $ | 55.16 | | | | 23.00 | % | | | 0.89 | % | | | 1.13 | % | | | 0.93 | % | | $ | 495,890 | | | | 52 | % | |
2020 | | | (1.92 | ) | | $ | 50.59 | | | | (1.03 | )% | | | 0.89 | % | | | 1.13 | % | | | 0.95 | % | | $ | 444,160 | | | | 95 | % | |
2019 | | | (2.04 | ) | | $ | 53.11 | | | | 30.73 | % | | | 0.89 | % | | | 1.03 | % | | | 0.95 | % | | $ | 520,159 | | | | 51 | % | |
2018 | | | (9.18 | ) | | $ | 42.20 | | | | (9.31 | )% | | | 0.89 | % | | | 0.77 | % | | | 0.93 | % | | $ | 439,035 | | | | 59 | % | |
2017 | | | (4.73 | ) | | $ | 56.61 | | | | 18.32 | % | | | 0.89 | % | | | 0.68 | % | | | 0.94 | % | | $ | 540,762 | | | | 55 | % | |
Class C | |
Six Months Ended
June 30, 2022
(Unaudited) | | | — | | | $ | 41.39 | | | | (7.45 | )% | | | 1.69 | % | | | 0.10 | % | | | 1.88 | % | | $ | 3,888 | | | | 31 | % | |
Year Ended December 31: | |
2021 | | | (6.45 | ) | | $ | 44.72 | | | | 22.05 | % | | | 1.69 | % | | | 0.27 | % | | | 1.80 | % | | $ | 6,230 | | | | 52 | % | |
2020 | | | (1.77 | ) | | $ | 42.07 | | | | (1.85 | )% | | | 1.69 | % | | | 0.37 | % | | | 1.79 | % | | $ | 11,326 | | | | 95 | % | |
2019 | | | (1.68 | ) | | $ | 44.70 | | | | 29.70 | % | | | 1.69 | % | | | 0.24 | % | | | 1.74 | % | | $ | 17,028 | | | | 51 | % | |
2018 | | | (8.80 | ) | | $ | 35.78 | | | | (10.03 | )% | | | 1.69 | % | | | (0.06 | )% | | | 1.75 | % | | $ | 18,227 | | | | 59 | % | |
2017 | | | (4.73 | ) | | $ | 49.50 | | | | 17.36 | % | | | 1.69 | % | | | (0.08 | )% | | | 1.71 | % | | $ | 29,771 | | | | 55 | % | |
Class R | |
Six Months Ended
June 30, 2022
(Unaudited) | | | — | | | $ | 50.78 | | | | (7.23 | )% | | | 1.26 | % | | | 0.57 | % | | | 1.43 | % | | $ | 5,981 | | | | 31 | % | |
Year Ended December 31: | |
2021 | | | (6.70 | ) | | $ | 54.74 | | | | 22.55 | % | | | 1.26 | % | | | 0.75 | % | | | 1.44 | % | | $ | 6,428 | | | | 52 | % | |
2020 | | | (1.77 | ) | | $ | 50.28 | | | | (1.41 | )% | | | 1.26 | % | | | 0.77 | % | | | 1.50 | % | | $ | 6,066 | | | | 95 | % | |
2019 | | | (1.86 | ) | | $ | 52.83 | | | | 30.23 | % | | | 1.26 | % | | | 0.66 | % | | | 1.48 | % | | $ | 7,232 | | | | 51 | % | |
2018 | | | (8.95 | ) | | $ | 42.01 | | | | (9.63 | )% | | | 1.26 | % | | | 0.38 | % | | | 1.40 | % | | $ | 6,348 | | | | 59 | % | |
2017 | | | (4.73 | ) | | $ | 56.35 | | | | 17.87 | % | | | 1.26 | % | | | 0.33 | % | | | 1.42 | % | | $ | 10,229 | | | | 55 | % | |
Class Y | |
Six Months Ended
June 30, 2022
(Unaudited) | | | — | | | $ | 51.07 | | | | (6.98 | )% | | | 0.68 | % | | | 1.16 | % | | | 0.71 | % | | $ | 20,826 | | | | 31 | % | |
Year Ended December 31: | |
2021 | | | (7.01 | ) | | $ | 54.90 | | | | 23.28 | % | | | 0.68 | % | | | 1.35 | % | | | 0.68 | % | | $ | 20,169 | | | | 52 | % | |
2020 | | | (2.02 | ) | | $ | 50.37 | | | | (0.83 | )% | | | 0.68 | % | | | 1.34 | % | | | 0.82 | % | | $ | 16,011 | | | | 95 | % | |
2019 | | | (2.13 | ) | | $ | 52.87 | | | | 30.99 | % | | | 0.68 | % | | | 1.24 | % | | | 0.78 | % | | $ | 20,021 | | | | 51 | % | |
2018 | | | (9.28 | ) | | $ | 42.01 | | | | (9.11 | )% | | | 0.68 | % | | | 0.96 | % | | | 0.75 | % | | $ | 21,827 | | | | 59 | % | |
2017 | | | (4.84 | ) | | $ | 56.38 | | | | 18.56 | % | | | 0.68 | % | | | 0.88 | % | | | 0.72 | % | | $ | 33,638 | | | | 55 | % | |
See notes to financial statements.
35
Victory Portfolios | | Financial Highlights | |
For a Share Outstanding Throughout Each Period
| | | | | Investment Activities | | Distributions to
Shareholders From | |
| | | Net Asset
Value,
Beginning of
Period | | Net
Investment
Income
(Loss)(a) | |
Net Realized
and Unrealized
Gains (Losses) | | Total from
Investment
Activities | | Net
Investment
Income | | Net Realized
Gains from
Investments | |
Victory RS Investors Fund | | | |
Class A | | | |
Six Months Ended
June 30, 2022
(Unaudited) | | $ | 13.90 | | | | — | (f) | | | (0.64 | ) | | | (0.64 | ) | | | — | | | | — | | |
Year Ended December 31: | |
2021 | | $ | 12.84 | | | | 0.02 | | | | 3.25 | | | | 3.27 | | | | — | (f) | | | (2.21 | ) | |
2020 | | $ | 13.10 | | | | (0.01 | ) | | | (0.21 | ) | | | (0.22 | ) | | | — | | | | (0.04 | ) | |
2019 | | $ | 10.68 | | | | — | (f) | | | 2.99 | | | | 2.99 | | | | — | | | | (0.57 | ) | |
2018 | | $ | 13.86 | | | | — | (f) | | | (1.27 | ) | | | (1.27 | ) | | | — | | | | (1.91 | ) | |
2017 | | $ | 13.65 | | | | (0.03 | ) | | | 2.23 | | | | 2.20 | | | | — | | | | (1.99 | ) | |
Class C | | | |
Six Months Ended
June 30, 2022
(Unaudited) | | $ | 11.76 | | | | (0.05 | ) | | | (0.53 | ) | | | (0.58 | ) | | | — | | | | — | | |
Year Ended December 31: | |
2021 | | $ | 11.22 | | | | (0.08 | ) | | | 2.83 | | | | 2.75 | | | | — | | | | (2.21 | ) | |
2020 | | $ | 11.54 | | | | (0.08 | ) | | | (0.20 | ) | | | (0.28 | ) | | | — | | | | (0.04 | ) | |
2019 | | $ | 9.53 | | | | (0.08 | ) | | | 2.66 | | | | 2.58 | | | | — | | | | (0.57 | ) | |
2018 | | $ | 12.68 | | | | (0.10 | ) | | | (1.14 | ) | | | (1.24 | ) | | | — | | | | (1.91 | ) | |
2017 | | $ | 12.73 | | | | (0.19 | ) | | | 2.13 | | | | 1.94 | | | | — | | | | (1.99 | ) | |
Class R | | | |
Six Months Ended
June 30, 2022
(Unaudited) | | $ | 12.02 | | | | (0.03 | ) | | | (0.56 | ) | | | (0.59 | ) | | | — | | | | — | | |
Year Ended December 31: | |
2021 | | $ | 11.41 | | | | (0.06 | ) | | | 2.88 | | | | 2.82 | | | | — | | | | (2.21 | ) | |
2020 | | $ | 11.72 | | | | (0.07 | ) | | | (0.20 | ) | | | (0.27 | ) | | | — | | | | (0.04 | ) | |
2019 | | $ | 9.66 | | | | (0.07 | ) | | | 2.70 | | | | 2.63 | | | | — | | | | (0.57 | ) | |
2018 | | $ | 12.81 | | | | (0.08 | ) | | | (1.16 | ) | | | (1.24 | ) | | | — | | | | (1.91 | ) | |
2017 | | $ | 12.83 | | | | (0.17 | ) | | | 2.14 | | | | 1.97 | | | | — | | | | (1.99 | ) | |
Class Y | | | |
Six Months Ended
June 30, 2022
(Unaudited) | | $ | 14.41 | | | | 0.02 | | | | (0.66 | ) | | | (0.64 | ) | | | — | | | | — | | |
Year Ended December 31: | |
2021 | | $ | 13.24 | | | | 0.06 | | | | 3.36 | | | | 3.42 | | | | (0.04 | ) | | | (2.21 | ) | |
2020 | | $ | 13.47 | | | | 0.02 | | | | (0.21 | ) | | | (0.19 | ) | | | — | | | | (0.04 | ) | |
2019 | | $ | 10.94 | | | | 0.03 | | | | 3.07 | | | | 3.10 | | | | — | | | | (0.57 | ) | |
2018 | | $ | 14.10 | | | | 0.03 | | | | (1.28 | ) | | | (1.25 | ) | | | — | | | | (1.91 | ) | |
2017 | | $ | 13.82 | | | | 0.03 | | | | 2.24 | | | | 2.27 | | | | — | | | | (1.99 | ) | |
(a) Per share net investment income (loss) has been calculated using the average daily shares method.
(b) Not annualized for periods less than one year.
(c) Annualized for periods less than one year.
(d) Does not include acquired fund fees and expenses, if any.
(e) Portfolio turnover is calculated on the basis of the Fund as a whole without distinguishing between the classes of shares issued.
(f) Amount is less than $0.005 per share.
See notes to financial statements.
36
Victory Portfolios | | Financial Highlights — continued | |
For a Share Outstanding Throughout Each Period
| | | | | Ratios to Average Net Assets | | Supplemental Data | |
| | | Total
Distributions | | Net Asset
Value,
End of
Period | | Total
Return
(Excludes
Sales
Charge)(b) | | Net
Expenses(c)(d) | | Net
Investment
Income
(Loss)(c) | | Gross
Expenses(c)(d) | | Net Assets,
End of
Period
(000's) | | Portfolio
Turnover(b)(e) | |
Victory RS Investors Fund | |
Class A | |
Six Months Ended
June 30, 2022
(Unaudited) | | | — | | | $ | 13.26 | | | | (4.60 | )% | | | 1.33 | % | | | 0.02 | % | | | 1.65 | % | | $ | 14,213 | | | | 38 | % | |
Year Ended December 31: | |
2021 | | | (2.21 | ) | | $ | 13.90 | | | | 25.74 | % | | | 1.33 | % | | | 0.13 | % | | | 1.66 | % | | $ | 15,039 | | | | 68 | % | |
2020 | | | (0.04 | ) | | $ | 12.84 | | | | (1.68 | )% | | | 1.33 | % | | | (0.08 | )% | | | 1.71 | % | | $ | 12,663 | | | | 66 | % | |
2019 | | | (0.57 | ) | | $ | 13.10 | | | | 28.01 | % | | | 1.33 | % | | | 0.03 | % | | | 1.62 | % | | $ | 16,906 | | | | 64 | % | |
2018 | | | (1.91 | ) | | $ | 10.68 | | | | (9.36 | )% | | | 1.33 | % | | | (0.03 | )% | | | 1.58 | % | | $ | 15,682 | | | | 56 | % | |
2017 | | | (1.99 | ) | | $ | 13.86 | | | | 16.28 | % | | | 1.33 | % | | | (0.24 | )% | | | 1.54 | % | | $ | 20,419 | | | | 80 | % | |
Class C | |
Six Months Ended
June 30, 2022
(Unaudited) | | | — | | | $ | 11.18 | | | | (4.93 | )% | | | 2.07 | % | | | (0.80 | )% | | | 2.77 | % | | $ | 1,388 | | | | 38 | % | |
Year Ended December 31: | |
2021 | | | (2.21 | ) | | $ | 11.76 | | | | 24.78 | % | | | 2.07 | % | | | (0.64 | )% | | | 2.42 | % | | $ | 2,702 | | | | 68 | % | |
2020 | | | (0.04 | ) | | $ | 11.22 | | | | (2.43 | )% | | | 2.07 | % | | | (0.85 | )% | | | 2.75 | % | | $ | 3,306 | | | | 66 | % | |
2019 | | | (0.57 | ) | | $ | 11.54 | | | | 27.08 | % | | | 2.07 | % | | | (0.73 | )% | | | 2.54 | % | | $ | 6,898 | | | | 64 | % | |
2018 | | | (1.91 | ) | | $ | 9.53 | | | | (10.08 | )% | | | 2.07 | % | | | (0.82 | )% | | | 2.44 | % | | $ | 7,282 | | | | 56 | % | |
2017 | | | (1.99 | ) | | $ | 12.68 | | | | 15.48 | % | | | 2.07 | % | | | (1.42 | )% | | | 2.35 | % | | $ | 11,149 | | | | 80 | % | |
Class R | |
Six Months Ended
June 30, 2022
(Unaudited) | | | — | | | $ | 11.43 | | | | (4.91 | )% | | | 1.95 | % | | | (0.60 | )% | | | 2.89 | % | | $ | 800 | | | | 38 | % | |
Year Ended December 31: | |
2021 | | | (2.21 | ) | | $ | 12.02 | | | | 25.00 | % | | | 1.95 | % | | | (0.49 | )% | | | 1.96 | % | | $ | 806 | | | | 68 | % | |
2020 | | | (0.04 | ) | | $ | 11.41 | | | | (2.30 | )% | | | 1.95 | % | | | (0.71 | )% | | | 4.41 | % | | $ | 655 | | | | 66 | % | |
2019 | | | (0.57 | ) | | $ | 11.72 | | | | 27.24 | % | | | 1.95 | % | | | (0.59 | )% | | | 3.85 | % | | $ | 844 | | | | 64 | % | |
2018 | | | (1.91 | ) | | $ | 9.66 | | | | (9.91 | )% | | | 1.95 | % | | | (0.64 | )% | | | 3.15 | % | | $ | 831 | | | | 56 | % | |
2017 | | | (1.99 | ) | | $ | 12.81 | | | | 15.50 | % | | | 1.95 | % | | | (1.27 | )% | | | 2.72 | % | | $ | 1,379 | | | | 80 | % | |
Class Y | |
Six Months Ended
June 30, 2022
(Unaudited) | | | — | | | $ | 13.77 | | | | (4.44 | )% | | | 1.05 | % | | | 0.32 | % | | | 1.39 | % | | $ | 13,606 | | | | 38 | % | |
Year Ended December 31: | |
2021 | | | (2.25 | ) | | $ | 14.41 | | | | 26.07 | % | | | 1.05 | % | | | 0.40 | % | | | 1.32 | % | | $ | 12,577 | | | | 68 | % | |
2020 | | | (0.04 | ) | | $ | 13.24 | | | | (1.41 | )% | | | 1.05 | % | | | 0.17 | % | | | 1.50 | % | | $ | 11,253 | | | | 66 | % | |
2019 | | | (0.57 | ) | | $ | 13.47 | | | | 28.35 | % | | | 1.05 | % | | | 0.27 | % | | | 1.43 | % | | $ | 19,146 | | | | 64 | % | |
2018 | | | (1.91 | ) | | $ | 10.94 | | | | (9.06 | )% | | | 1.05 | % | | | 0.18 | % | | | 1.37 | % | | $ | 14,669 | | | | 56 | % | |
2017 | | | (1.99 | ) | | $ | 14.10 | | | | 16.59 | % | | | 1.05 | % | | | 0.19 | % | | | 1.25 | % | | $ | 27,131 | | | | 80 | % | |
See notes to financial statements.
37
Victory Portfolios | | Financial Highlights | |
For a Share Outstanding Throughout Each Period
| | | | Investment Activities | | Distributions to
Shareholders From | |
| | | Net Asset
Value,
Beginning of
Period | | Net
Investment
Income
(Loss)(a) | |
Net Realized
and Unrealized
Gains (Losses) | | Total from
Investment
Activities | | Net
Investment
Income | | Total
Distributions | |
Victory Global Energy Transition Fund | | | |
Class A | | | |
Six Months Ended
June 30, 2022
(Unaudited) | | $ | 22.62 | | | | 0.08 | | | | 5.15 | | | | 5.23 | | | | — | | | | — | | |
Year Ended December 31: | |
2021 | | $ | 12.36 | | | | (0.04 | ) | | | 10.30 | | | | 10.26 | | | | — | | | | — | | |
2020 | | $ | 9.71 | | | | (0.01 | ) | | | 2.67 | | | | 2.66 | | | | (0.01 | ) | | | (0.01 | ) | |
2019 | | $ | 12.86 | | | | — | (g) | | | (3.15 | ) | | | (3.15 | ) | | | — | | | | — | | |
2018 | | $ | 23.73 | | | | (0.14 | ) | | | (10.73 | ) | | | (10.87 | ) | | | — | | | | — | | |
2017 | | $ | 23.49 | | | | (0.22 | ) | | | 0.46 | | | | 0.24 | | | | — | | | | — | | |
Class C | | | |
Six Months Ended
June 30, 2022
(Unaudited) | | $ | 19.98 | | | | (0.04 | ) | | | 4.56 | | | | 4.52 | | | | — | | | | — | | |
Year Ended December 31: | |
2021 | | $ | 11.00 | | | | (0.17 | ) | | | 9.15 | | | | 8.98 | | | | — | | | | — | | |
2020 | | $ | 8.71 | | | | (0.07 | ) | | | 2.36 | | | | 2.29 | | | | — | | | | — | | |
2019 | | $ | 11.63 | | | | (0.08 | ) | | | (2.84 | ) | | | (2.92 | ) | | | — | | | | — | | |
2018 | | $ | 21.63 | | | | (0.28 | ) | | | (9.72 | ) | | | (10.00 | ) | | | — | | | | — | | |
2017 | | $ | 21.59 | | | | (0.36 | ) | | | 0.40 | | | | 0.04 | | | | — | | | | — | | |
Class R | | | |
Six Months Ended
June 30, 2022
(Unaudited) | | $ | 21.19 | | | | 0.03 | | | | 4.82 | | | | 4.85 | | | | — | | | | — | | |
Year Ended December 31: | |
2021 | | $ | 11.62 | | | | (0.12 | ) | | | 9.69 | | | | 9.57 | | | | — | | | | — | | |
2020 | | $ | 9.16 | | | | (0.04 | ) | | | 2.50 | | | | 2.46 | | | | — | | | | — | | |
2019 | | $ | 12.18 | | | | (0.04 | ) | | | (2.98 | ) | | | (3.02 | ) | | | — | | | | — | | |
2018 | | $ | 22.56 | | | | (0.20 | ) | | | (10.18 | ) | | | (10.38 | ) | | | — | | | | — | | |
2017 | | $ | 22.42 | | | | (0.29 | ) | | | 0.43 | | | | 0.14 | | | | — | | | | — | | |
Class Y | | | |
Six Months Ended
June 30, 2022
(Unaudited) | | $ | 23.64 | | | | 0.14 | | | | 5.37 | | | | 5.51 | | | | — | | | | — | | |
Year Ended December 31: | |
2021 | | $ | 12.88 | | | | 0.02 | | | | 10.75 | | | | 10.77 | | | | (0.01 | ) | | | (0.01 | ) | |
2020 | | $ | 10.11 | | | | 0.02 | | | | 2.78 | | | | 2.80 | | | | (0.03 | ) | | | (0.03 | ) | |
2019 | | $ | 13.38 | | | | 0.03 | | | | (3.27 | ) | | | (3.24 | ) | | | (0.03 | ) | | | (0.03 | ) | |
2018 | | $ | 24.60 | | | | (0.06 | ) | | | (11.16 | ) | | | (11.22 | ) | | | — | | | | — | | |
2017 | | $ | 24.28 | | | | (0.14 | ) | | | 0.46 | | | | 0.32 | | | | — | | | | — | | |
(a) Per share net investment income (loss) has been calculated using the average daily shares method.
(b) Not annualized for periods less than one year.
(c) Includes adjustments in accordance with U.S. Generally Accepted Accounting Principles.
(d) Annualized for periods less than one year.
(e) Does not include acquired fund fees and expenses, if any.
(f) Portfolio turnover is calculated on the basis of the Fund as a whole without distinguishing between the classes of shares issued.
(g) Amount is less than $0.005 per share.
(h) Amount is less than 0.005%.
(i) Portfolio turnover increased due to change within the portfolio holdings during the year.
See notes to financial statements.
38
Victory Portfolios | | Financial Highlights — continued | |
For a Share Outstanding Throughout Each Period
| | | | | Ratios to Average Net Assets | | Supplemental Data | |
| | | Net Asset
Value,
End of
Period | | Total
Return
(Excludes
Sales
Charge)(b)(c) | | Net
Expenses(d)(e) | | Net
Investment
Income
(Loss)(d) | | Gross
Expenses(d)(e) | | Net Assets,
End of
Period
(000's) | | Portfolio
Turnover(b)(f) | |
Victory Global Energy Transition Fund | |
Class A | |
Six Months Ended
June 30, 2022
(Unaudited) | | $ | 27.85 | | | | 23.12 | % | | | 1.48 | % | | | 0.55 | % | | | 1.52 | % | | $ | 89,796 | | | | 35 | % | |
Year Ended December 31: | |
2021 | | $ | 22.62 | | | | 83.01 | % | | | 1.48 | % | | | (0.21 | )% | | | 1.58 | % | | $ | 78,317 | | | | 79 | % | |
2020 | | $ | 12.36 | | | | 27.35 | % | | | 1.48 | % | | | (0.15 | )% | | | 1.79 | % | | $ | 36,803 | | | | 46 | % | |
2019 | | $ | 9.71 | | | | (24.49 | )% | | | 1.48 | % | | | — | %(h) | | | 1.69 | % | | $ | 32,630 | | | | 24 | % | |
2018 | | $ | 12.86 | | | | (45.81 | )% | | | 1.48 | % | | | (0.65 | )% | | | 1.54 | % | | $ | 64,001 | | | | 26 | % | |
2017 | | $ | 23.73 | | | | 1.02 | % | | | 1.48 | % | | | (0.93 | )% | | | 1.55 | % | | $ | 262,455 | | | | 57 | %(i) | |
Class C | |
Six Months Ended
June 30, 2022
(Unaudited) | | $ | 24.50 | | | | 22.62 | % | | | 2.28 | % | | | (0.31 | )% | | | 2.55 | % | | $ | 2,605 | | | | 35 | % | |
Year Ended December 31: | |
2021 | | $ | 19.98 | | | | 81.64 | % | | | 2.28 | % | | | (1.02 | )% | | | 2.41 | % | | $ | 3,240 | | | | 79 | % | |
2020 | | $ | 11.00 | | | | 26.29 | % | | | 2.28 | % | | | (0.92 | )% | | | 3.32 | % | | $ | 2,385 | | | | 46 | % | |
2019 | | $ | 8.71 | | | | (25.11 | )% | | | 2.28 | % | | | (0.81 | )% | | | 2.75 | % | | $ | 2,949 | | | | 24 | % | |
2018 | | $ | 11.63 | | | | (46.26 | )% | | | 2.28 | % | | | (1.42 | )% | | | 2.38 | % | | $ | 6,939 | | | | 26 | % | |
2017 | | $ | 21.63 | | | | 0.23 | % | | | 2.28 | % | | | (1.72 | )% | | | 2.35 | % | | $ | 20,428 | | | | 57 | %(i) | |
Class R | |
Six Months Ended
June 30, 2022
(Unaudited) | | $ | 26.04 | | | | 22.89 | % | | | 1.86 | % | | | 0.25 | % | | | 2.34 | % | | $ | 1,683 | | | | 35 | % | |
Year Ended December 31: | |
2021 | | $ | 21.19 | | | | 82.36 | % | | | 1.86 | % | | | (0.70 | )% | | | 1.89 | % | | $ | 1,026 | | | | 79 | % | |
2020 | | $ | 11.62 | | | | 26.86 | % | | | 1.86 | % | | | (0.51 | )% | | | 5.74 | % | | $ | 680 | | | | 46 | % | |
2019 | | $ | 9.16 | | | | (24.79 | )% | | | 1.86 | % | | | (0.37 | )% | | | 4.31 | % | | $ | 621 | | | | 24 | % | |
2018 | | $ | 12.18 | | | | (46.01 | )% | | | 1.86 | % | | | (0.99 | )% | | | 2.50 | % | | $ | 920 | | | | 26 | % | |
2017 | | $ | 22.56 | | | | 0.62 | % | | | 1.86 | % | | | (1.31 | )% | | | 2.20 | % | | $ | 2,442 | | | | 57 | %(i) | |
Class Y | |
Six Months Ended
June 30, 2022
(Unaudited) | | $ | 29.15 | | | | 23.31 | % | | | 1.15 | % | | | 0.92 | % | | | 1.18 | % | | $ | 284,505 | | | | 35 | % | |
Year Ended December 31: | |
2021 | | $ | 23.64 | | | | 83.62 | % | | | 1.15 | % | | | 0.10 | % | | | 1.21 | % | | $ | 210,586 | | | | 79 | % | |
2020 | | $ | 12.88 | | | | 27.73 | % | | | 1.15 | % | | | 0.18 | % | | | 1.28 | % | | $ | 119,237 | | | | 46 | % | |
2019 | | $ | 10.11 | | | | (24.25 | )% | | | 1.15 | % | | | 0.27 | % | | | 1.26 | % | | $ | 114,972 | | | | 24 | % | |
2018 | | $ | 13.38 | | | | (45.63 | )% | | | 1.15 | % | | | (0.29 | )% | | | 1.20 | % | | $ | 393,581 | | | | 26 | % | |
2017 | | $ | 24.60 | | | | 1.36 | % | | | 1.15 | % | | | (0.58 | )% | | | 1.19 | % | | $ | 1,126,533 | | | | 57 | %(i) | |
See notes to financial statements.
39
Victory Portfolios | | Notes to Financial Statements
June 30, 2022 | |
(Unaudited)
1. Organization:
Victory Portfolios (the "Trust") is organized as a Delaware statutory trust and the Trust is registered under the Investment Company Act of 1940, as amended (the "1940 Act"), as an open-end investment company. The Trust is comprised of 40 funds and is authorized to issue an unlimited number of shares, which are units of beneficial interest with a par value of $0.001 per share.
The accompanying financial statements are those of the following five Funds (collectively, the "Funds" and individually, a "Fund"). Each Fund, with the exception of Victory RS Investors Fund and Victory Global Energy Transition Fund, is classified as diversified under the 1940 Act.
Funds (Legal Name) | | Funds (Short Name) | | Investment Share
Classes Offered | |
Victory RS Partners Fund | | RS Partners Fund | | A, C, R, Y, and Member Class | |
Victory RS Value Fund | | RS Value Fund | | A, C, R, and Y | |
Victory RS Large Cap Alpha Fund | | RS Large Cap Alpha Fund | | A, C, R, and Y | |
Victory RS Investors Fund | | RS Investors Fund | | A, C, R, and Y | |
Victory Global Energy
Transition Fund | | Global Energy Transition Fund | | A, C, R, and Y | |
Each class of shares of a Fund has substantially identical rights and privileges except with respect to sales charges, fees paid under distribution plans, expenses allocable exclusively to each class of shares, voting rights on matters solely affecting a single class of shares, and the exchange privilege of each class of shares.
Under the Trust's organizational documents, its officers and trustees are indemnified against certain liabilities arising out of the performance of their duties to the Funds. In addition, in the normal course of business, the Funds enter into contracts with their vendors and others that provide for general indemnifications. The Funds' maximum exposure under these arrangements is unknown, as this would involve future claims that may be made against the Funds. However, based on experience, the Funds expect that risk of loss to be remote.
2. Significant Accounting Policies:
The following is a summary of significant accounting policies followed by the Trust in the preparation of its financial statements. The policies are in conformity with U.S. Generally Accepted Accounting Principles ("GAAP"). The preparation of financial statements in accordance with GAAP requires management to make estimates and assumptions that affect the reported amounts of assets and liabilities and disclosure of contingent assets and liabilities at the date of the financial statements and the reported amounts of income and expenses for the period. Actual results could differ from those estimates. The Funds follow the specialized accounting and reporting requirements under GAAP that are applicable to investment companies under Accounting Standards Codification Topic 946.
Investment Valuation:
The Funds record investments at fair value. Fair value is defined as the price that would be received to sell an asset or paid to transfer a liability in an orderly transaction between market participants at the measurement date.
The valuation techniques described below maximize the use of observable inputs and minimize the use of unobservable inputs in determining fair value. The inputs used for valuing the Funds' investments are summarized in the three broad levels listed below:
• Level 1 — quoted prices in active markets for identical securities
• Level 2 — other significant observable inputs (including quoted prices for similar securities or interest rates applicable to those securities, etc.)
• Level 3 — significant unobservable inputs (including the Funds' own assumptions in determining the fair value of investments)
40
Victory Portfolios | | Notes to Financial Statements — continued
June 30, 2022 | |
(Unaudited)
Changes in valuation techniques may result in transfers in or out of an assigned level within the disclosure hierarchy. The inputs or methodologies used for valuation techniques are not necessarily an indication of the risk associated with entering into those investments.
Victory Capital Management Inc. ("VCM" or the "Adviser") has established the Pricing and Liquidity Committee (the "Committee"), and subject to the Trust's Board of Trustees' (the "Board") oversight, the Committee administers and oversees the Funds' valuation policies and procedures, which are approved by the Board.
Portfolio securities listed or traded on securities exchanges, including Exchange-Traded Funds ("ETFs"), and American Depositary Receipts ("ADRs"), are valued at the closing price on the exchange or system where the security is principally traded, if available, or at the Nasdaq Official Closing Price. If there have been no sales for that day on the exchange or system, then a security is valued at the last available bid quotation on the exchange or system where the security is principally traded. In each of these situations, valuations are typically categorized as Level 1 in the fair value hierarchy.
Investments in open-end investment companies, other than ETFs, are valued at their net asset value ("NAV"). These valuations are typically categorized as Level 1 in the fair value hierarchy.
Debt securities are valued each business day by a pricing service approved by the Board. The approved pricing service uses the evaluated bid or the last sale price to value securities. Debt obligations maturing within 60 days may be valued at amortized cost, provided that the amortized cost represents the fair value of such securities. These valuations are typically categorized as Level 2 in the fair value hierarchy.
In the event that price quotations or valuations are not readily available, investments are valued at fair value in accordance with procedures established by and under the general supervision and responsibility of the Board. These valuations are typically categorized as Level 2 or Level 3 in the fair value hierarchy, based on the observability of inputs used to determine the fair value. The effect of fair value pricing is that securities may not be priced on the basis of quotations from the primary market in which they are traded and the actual price realized from the sale of a security may differ materially from the fair value price. Valuing these securities at fair value is intended to cause the Fund's NAV to be more reliable than it otherwise would be.
In accordance with procedures adopted by the Board, fair value pricing may be used if events materially affecting the value of foreign securities occur between the time the exchange on which they are traded closes and the time a Fund's NAV is calculated. The Funds use a systematic valuation model, provided daily by an independent third party to fair value its international equity securities. The valuations are categorized as Level 2 in the fair value hierarchy.
A summary of the valuations as of June 30, 2022, based upon the three levels defined above, is included in the table below while the breakdown, by category, of investments is disclosed on the Schedules of Portfolio Investments:
| | | Level 1 | | Level 2 | | Level 3 | | Total | |
RS Partners Fund | |
Common Stocks | | $ | 332,577,502 | | | $ | — | | | $ | — | | | $ | 332,577,502 | | |
Preferred Stocks | | | — | | | | — | | | | 587,369 | | | | 587,369 | | |
Collateral for Securities Loaned | | | 2,349,027 | | | | — | | | | — | | | | 2,349,027 | | |
Total | | $ | 334,926,529 | | | $ | — | | | $ | 587,369 | | | $ | 335,513,898 | | |
RS Value Fund | |
Common Stocks | | $ | 276,136,942 | | | $ | — | | | $ | — | | | $ | 276,136,942 | | |
Collateral for Securities Loaned | | | 7,748,074 | | | | — | | | | — | | | | 7,748,074 | | |
Total | | $ | 283,885,016 | | | $ | — | | | $ | — | | | $ | 283,885,016 | | |
RS Large Cap Alpha Fund | |
Common Stocks | | $ | 455,010,112 | | | $ | — | | | $ | — | | | $ | 455,010,112 | | |
Total | | $ | 455,010,112 | | | $ | — | | | $ | — | | | $ | 455,010,112 | | |
41
Victory Portfolios | | Notes to Financial Statements — continued
June 30, 2022 | |
(Unaudited)
| | | Level 1 | | Level 2 | | Level 3 | | Total | |
RS Investors Fund | |
Common Stocks | | $ | 26,927,040 | | | $ | — | | | $ | — | | | $ | 26,927,040 | | |
Total | | $ | 26,927,040 | | | $ | — | | | $ | — | | | $ | 26,927,040 | | |
Global Energy Transition Fund | |
Common Stocks | | $ | 305,608,208 | | | $ | 16,107,360 | | | $ | — | | | $ | 321,715,568 | | |
Preferred Stocks | | | 2,458,269 | | | | — | | | | — | | | | 2,458,269 | | |
Convertible Corporate Bonds | | | — | | | | 2,706,273 | | | | — | | | | 2,706,273 | | |
Collateral for Securities Loaned | | | 4,792,492 | | | | — | | | | — | | | | 4,792,492 | | |
Total | | $ | 312,858,969 | | | $ | 18,813,633 | | | $ | — | | | $ | 331,672,602 | | |
For the six months ended June 30, 2022, Global Energy Transition Fund had transfers out of Level 3 of 2.17% of net assets.
The following is a reconciliation of assets in which significant unobservable inputs (Level 3) were used in determining fair value (amounts in thousands):
Global Energy Transition Fund | |
Balance as of December 31, 2021 | | $ | 8,231 | | |
Accrued discount (premium) | | | — | | |
Realized Gain (Loss) | | | — | | |
Change in Unrealized Appreciation/Depreciation | | | — | | |
Purchases | | | — | | |
Sales Proceeds | | | — | | |
Transfers into Level 3 | | | — | | |
Transfers out of Level 3 | | | (8,231 | ) | |
Balance as of June 30, 2022 | | $ | — | | |
Real Estate Investment Trusts ("REITs"):
The Funds may invest in REITs, which report information on the source of their distributions annually. REITs are pooled investment vehicles that invest primarily in income-producing real estate or real-estate related loans or interests (such as mortgages). Certain distributions received from REITs during the year are recorded as realized gains or return of capital as estimated by the Funds or when such information becomes known.
Investment Companies:
Open-End Funds:
The Funds may invest in portfolios of open-end investment companies. These investment companies value securities in their portfolios for which market quotations are readily available at their market values (generally the last reported sale price) and all other securities and assets at their fair value by the methods established by the board of directors of the underlying funds.
Special Purpose Acquisition Companies ("SPAC"):
The Funds may invest in stock, warrants and other securities of special purpose acquisition companies ("SPACs"). A SPAC typically is a publicly traded company that raises funds through an initial public offering ("IPO") for the purpose of acquiring or merging with another company to be identified subsequent to the SPAC's IPO. If a Fund purchases shares of a SPAC in an IPO it generally will bear a sales commission, which may be significant. The securities of a SPAC are often issued in "units" that include one share of common stock and one right or warrant (or partial right or warrant) conveying the right to purchase additional shares or partial shares. Unless and until a transaction is completed, a SPAC generally invests its assets (less a portion retained to cover expenses) in U.S. government securities, money market funds and similar investments whose returns or yields may be significantly
42
Victory Portfolios | | Notes to Financial Statements — continued
June 30, 2022 | |
(Unaudited)
lower than those of the Fund's other investments. If an acquisition or merger that meets the requirements for the SPAC is not completed within a pre-established period of time, the invested funds are returned to the SPAC's shareholders, less certain permitted expenses, and any rights or warrants issued by the SPAC will expire worthless.
Private Investments in Public Equities:
The Funds may acquire common stock or a security convertible into common stock, such as a warrant or convertible preferred stock, directly from an issuer seeking to raise capital in a private placement pursuant to Regulation D under the 1933 Act. These transactions are commonly referred to as a private placement in a publicly held company, or "PIPE." The issuer's common stock is usually publicly traded on a U.S. securities exchange or in the over-the-counter market, but the securities acquired will be subject to restrictions on resale imposed by U.S. securities laws absent an effective registration statement. In recognition of the illiquid nature of the securities being acquired, the purchase price paid in a PIPE transaction (or the conversion price of the convertible securities being acquired) will typically be fixed at a discount to the prevailing market price of the issuer's common stock at the time of the transaction. As part of a PIPE transaction, the issuer usually will be contractually obligated to seek to register, within an agreed upon period of time for public resale under the U.S. securities laws, the common stock or the shares of common stock issuable upon conversion of the convertible securities. PIPE transactions typically involve the purchase of securities directly from a publicly traded company or its affiliates in a private placement transaction, including through a SPAC, typically at a discount to the market price of the issuer's securities. If the issuer fails to so register the shares within that period, the buyer may be entitled to additional consideration from the issuer (e.g., warrants to acquire additional shares of common stock), but the buyer may not be able to sell its shares unless and until the registration process is successfully completed. Thus PIPE transactions present certain risks not associated with open market purchases of equities.
Investment Transactions and Related Income:
Changes in holdings of investments are accounted for no later than one business day following the trade date. For financial reporting purposes, however, investment transactions are accounted for on trade date or the last business day of the reporting period. Interest income is determined on the basis of coupon interest accrued using the effective interest method which adjusts, where applicable, the amortization of premiums or accretion of discounts. Dividend income is recorded on the ex-dividend date. Gains or losses realized on sales of securities are recorded on the identified cost basis.
Litigation income received during the year is recorded as realized gains by the Funds when such information becomes known. Gains of this type are infrequent to the Funds and are not expected to reoccur on a consistent basis. Class action litigation income received by the RS Investors Fund for the six months ended June 30, 2022, amounted to $332,485 and is reflected on the Statements of Operations within Net realized gains (losses) from investment securities and foreign currency transactions.
Withholding taxes on interest, dividends, and gains as a result of certain investments by the Funds have been provided for in accordance with each investment's applicable country's tax rules and rates.
Securities Lending:
The Funds, through a Securities Lending Agreement with Citibank, N.A. ("Citibank"), may lend their securities to qualified financial institutions, such as certain broker-dealers and banks, to earn additional income, net of income retained by Citibank. Borrowers are required to initially secure their loans for collateral in the amount of at least 102% of the value of U.S. securities loaned or at least 105% of the value of non-U.S. securities loaned, marked-to-market daily. Any collateral shortfalls associated with increases in the valuation of the securities loaned are generally cured the next business day. The collateral can be received in the form of cash collateral and/or non-cash collateral. Non-cash collateral can include U.S. Government Securities and other securities as permitted by Securities and Exchange Commission ("SEC") guidelines. The cash collateral is invested in short-term instruments or cash equivalents, primarily open-end investment companies, as noted on the Funds' Schedules of Portfolio Investments. The Funds effectively do not have control of the non-cash collateral and therefore it is not
43
Victory Portfolios | | Notes to Financial Statements — continued
June 30, 2022 | |
(Unaudited)
disclosed on the Funds' Schedules of Portfolio Investments. Collateral requirements are determined daily based on the value of the Funds' securities on loan as of the end of the prior business day. During the time portfolio securities are on loan, the borrower will pay the Funds any dividends or interest paid on such securities plus any fee negotiated between the parties to the lending agreement. The Funds also earn a return from the collateral. The Funds pay Citibank various fees in connection with the investment of cash collateral and fees based on the investment income received from securities lending activities. Securities lending income (net of these fees) is disclosed on the Statements of Operations. Loans are terminable upon demand and the borrower must return the loaned securities within the lesser of one standard settlement period or five business days. Although risk is mitigated by the collateral, a Fund could experience a delay in recovering its securities and possible loss of income or value if the borrower fails to return them. In addition, there is a risk that the value of the short-term investments will be less than the amount of cash collateral required to be returned to the borrower.
The Funds' agreement with Citibank does not include master netting provisions. Non-cash collateral received by the Funds may not be sold or repledged, except to satisfy borrower default.
The following table is a summary of the Funds' securities lending transactions as of June 30, 2022.
| | | Value of
Securities on Loan | | Non-Cash
Collateral | | Cash
Collateral | |
RS Partners Fund | | $ | 2,315,629 | | | $ | — | | | $ | 2,349,027 | | |
RS Value Fund | | | 7,339,014 | | | | — | | | | 7,748,074 | | |
Global Energy Transition Fund | | | 4,718,454 | | | | — | | | | 4,792,492 | | |
Foreign Currency Translations:
The accounting records of the Funds are maintained in U.S. dollars. Investment securities and other assets and liabilities of a Fund denominated in a foreign currency are translated into U.S. dollars at current exchange rates. Purchases and sales of securities, income receipts and expense payments are translated into U.S. dollars at the exchange rates on the date of the transactions. The Funds do not isolate the portion of the results of operations resulting from changes in foreign exchange rates on investments from fluctuations arising from changes in market prices of securities held. Such fluctuations are disclosed as Net change in unrealized appreciation/depreciation on investment securities and foreign currency translations on the Statements of Operations. Any realized gains or losses from these fluctuations are disclosed as Net realized gains (losses) from investment securities and foreign currency transactions on the Statements of Operations.
Federal Income Taxes:
Each Fund intends to continue to qualify as a regulated investment company by complying with the provisions available to certain investment companies, as defined in applicable sections of the Internal Revenue Code, and to make distributions of net investment income and net realized gains sufficient to relieve it from all, or substantially all, federal income taxes. Accordingly, no provision for federal income taxes is required in the financial statements. The Funds have a tax year end of December 31.
For the six months ended June 30, 2022, the Funds did not incur any income tax, interest, or penalties, and have recorded no liability for net unrecognized tax benefits relating to uncertain tax positions.
Management of the Funds has reviewed tax positions taken in tax years that remain subject to examination by all major tax jurisdictions, including federal (i.e., the last four tax years, which includes the current fiscal tax year end). Management believes that there is no tax liability resulting from unrecognized tax benefits related to uncertain tax positions taken.
Allocations:
Expenses directly attributable to a Fund are charged to that Fund, while expenses that are attributable to more than one fund in the Trust, or jointly with an affiliated trust, are allocated among the respective funds in the Trust and/or an affiliated trust based upon net assets or another appropriate basis.
44
Victory Portfolios | | Notes to Financial Statements — continued
June 30, 2022 | |
(Unaudited)
Income, expenses (other than class-specific expenses such as transfer agent fees, state registration fees, printing fees, and 12b-1 fees), and realized and unrealized gains or losses on investments are allocated to each class of shares based on its relative net assets on the date income is earned or expenses and realized and unrealized gains and losses are incurred.
3. Purchases and Sales:
Purchases and sales of securities (excluding securities maturing less than one year from acquisition) for the six months ended June 30, 2022, were as follows:
| | | Excluding
U.S. Government Securities | |
| | | Purchases | | Sales | |
RS Partners Fund | | $ | 194,972,059 | | | $ | 191,285,644 | | |
RS Value Fund | | | 110,454,239 | | | | 131,220,508 | | |
RS Large Cap Alpha Fund | | | 151,187,984 | | | | 168,163,352 | | |
RS Investors Fund | | | 10,904,165 | | | | 12,771,474 | | |
Global Energy Transition Fund | | | 119,424,681 | | | | 131,113,296 | | |
4. Affiliated Fund Ownership:
The Funds offer shares for investment by other funds. The fund-of-funds do not invest in the underlying funds for the purpose of exercising management or control, and the affiliated fund-of-funds annual and semi-annual reports may be viewed at vcm.com. As of June 30, 2022, certain fund-of-funds owned total outstanding shares of the Funds as follows:
Global Energy Transition Fund | | Ownership % | |
Victory Strategic Allocation Fund | | | 0.4 | | |
RS Partners Fund | | Ownership % | |
Victory Strategic Allocation Fund | | | 0.3 | | |
5. Fees and Transactions with Affiliates and Related Parties:
Investment Advisory Fees:
Investment advisory services are provided to the Funds by the Adviser, which is a New York corporation registered as an investment adviser with the SEC. The Adviser is an indirect wholly owned subsidiary of Victory Capital Holdings, Inc., a publicly traded Delaware corporation, and a wholly owned direct subsidiary of Victory Capital Operating, LLC.
VCM has entered into a Sub-Advisory Agreement with SailingStone Capital Partners LLC ("SailingStone"). SailingStone is responsible for providing day-to-day investment advisory services to the Global Energy Transition Fund, subject to the oversight of the Board. Sub-investment advisory fees paid by VCM to SailingStone do not represent a separate or additional expense to the Funds.
Under the terms of the Investment Advisory Agreement, the Adviser is entitled to receive fees based on a percentage of the average daily net assets of each Fund. The rates at which the Adviser is paid by each Fund are included in the table below.
RS Partners Fund | | | 1.00 | % | |
RS Value Fund | | | 0.85 | % | |
RS Large Cap Alpha Fund | | | 0.50 | % | |
RS Investors Fund | | | 1.00 | % | |
Global Energy Transition Fund | | | 1.00 | % | |
Amounts incurred and paid to VCM for the six months ended June 30, 2022, are reflected on the Statements of Operations as Investment advisory fees.
45
Victory Portfolios | | Notes to Financial Statements — continued
June 30, 2022 | |
(Unaudited)
Administration and Servicing Fees:
VCM also serves as the Funds' administrator and fund accountant. Under the Administration and Fund Accounting Agreement, VCM is entitled to receive fees based on a percentage of the average daily net assets of the Trust, Victory Variable Insurance Funds and Victory Portfolios II. The tiered rates at which VCM is paid by the Funds are shown in the table below:
Net Assets | |
Up to $15 billion | | $15 billion – $30 billion | | Over $30 billion | |
| | 0.08 | %, plus | | | 0.05 | %, plus | | | 0.04 | % | |
Amounts incurred for the six months ended June 30, 2022, are reflected on the Statements of Operations as Administration fees.
Citi Fund Services Ohio, Inc. ("Citi"), an affiliate of Citibank, acts as sub-administrator and sub-fund accountant to the Funds pursuant to the Sub-Administration and Sub-Fund Accounting Services Agreement between VCM and Citi. VCM pays Citi a fee for providing these services. The Trust reimburses VCM and Citi for out-of-pocket expenses incurred in providing these services and certain other expenses specifically allocated to the Funds. Amounts incurred for the six months ended June 30, 2022, are reflected on the Statements of Operations as Sub-Administration fees.
The Funds (as part of the Trust) have entered into an agreement with the Adviser to provide compliance services, pursuant to which the Adviser furnishes its compliance personnel, including the services of the Chief Compliance Officer ("CCO"), and other resources reasonably necessary to provide the Trust with compliance oversight services related to the design, administration, and oversight of a compliance program for the Trust in accordance with Rule 38a-1 under the 1940 Act. The CCO is an employee of the Adviser, which pays the compensation of the CCO and support staff. The funds in the Trust, Victory Variable Insurance Funds, Victory Portfolios II and USAA Mutual Funds (collectively, the "Victory Funds Complex"), in aggregate, compensate the Adviser for these services. Amounts incurred for the six months ended June 30, 2022, are reflected on the Statements of Operations as Compliance fees.
Transfer Agency Fees:
FIS Investor Services, LLC ("FIS") serves as the Funds' transfer agent. Under the Transfer Agent Agreement, the Trust pays FIS a fee for its services and reimburses FIS for all of their reasonable out-of-pocket expenses incurred in providing these services. Amounts incurred for the six months ended June 30, 2022, are reflected on the Statements of Operations as Transfer agent fees.
Victory Capital Transfer Agency, Inc., an affiliate of the Adviser, serves as sub-transfer agent for the Member Class. Victory Capital Transfer Agency, Inc. receives no fee or other compensation for these services.
Distributor/Underwriting Services:
Victory Capital Services, Inc. (the "Distributor"), an affiliate of the Adviser, serves as Distributor for the continuous offering of the shares of the Funds pursuant to a Distribution Agreement between the Distributor and the Trust.
Pursuant to the Distribution and Service Plans adopted in accordance with Rule 12b-1 under the 1940 Act, the Distributor may receive a monthly distribution and service fee up to the annual rate shown in the table below:
| | | Class A | | Class C | | Class R | |
RS Partners Fund | | | 0.25 | % | | | N/A | | | | 0.50 | % | |
RS Value Fund | | | 0.25 | % | | | 1.00 | % | | | 0.50 | % | |
RS Large Cap Alpha Fund | | | 0.25 | % | | | 1.00 | % | | | 0.50 | % | |
RS Investors Fund | | | 0.25 | % | | | 1.00 | % | | | 0.50 | % | |
Global Energy Transition Fund | | | 0.25 | % | | | 1.00 | % | | | 0.50 | % | |
46
Victory Portfolios | | Notes to Financial Statements — continued
June 30, 2022 | |
(Unaudited)
The distribution and service fees paid to the Distributor may be used by the Distributor to pay for activities primarily intended to result in the sale of Class A, Class C, and Class R. Amounts incurred for the six-months ended June 30, 2022, are reflected on the Statements of Operations as 12b-1 fees.
In addition, the Distributor is entitled to receive commissions in connection with sales of the Class A. For the six months ended June 30, 2022, the Distributor received $13,664 from commissions earned in connection with sales of Class A.
Other Fees:
Citibank serves as the Funds' custodian. The Funds pay Citibank a fee for providing these services. Amounts incurred for the six months ended June 30, 2022, are reflected on the Statements of Operations as Custodian fees.
Sidley Austin LLP provides legal services to the Trust.
The Adviser has entered into expense limitation agreements with the Funds. Under the terms of the agreements, the Adviser has agreed to waive fees or reimburse certain expenses to the extent that ordinary operating expenses incurred by certain classes of a Fund in any fiscal year exceed the expense limit for such classes of the Fund. Such excess amounts will be the liability of the Adviser. Acquired fund fees and expenses, interest, taxes, brokerage commissions, other expenditures which are capitalized in accordance with GAAP, and other extraordinary expenses not incurred in the ordinary course of a Fund's business are excluded from the expense limits. As of June 30, 2022, the expense limits (excluding voluntary waivers) are as follows:
| | | In effect until April 30, 2023 | |
| | | Class A | | Class C | | Class R | | Class Y | | Member Class | |
RS Partners Fund | | | 1.45 | % | | | N/A | | | | 1.81 | % | | | 1.12 | % | | | 1.25 | % | |
RS Value Fund | | | 1.30 | % | | | 2.07 | % | | | 1.69 | % | | | 1.06 | % | | | N/A | | |
RS Large Cap Alpha Fund | | | 0.89 | % | | | 1.69 | % | | | 1.26 | % | | | 0.68 | % | | | N/A | | |
RS Investors Fund | | | 1.33 | % | | | 2.07 | % | | | 1.95 | % | | | 1.05 | % | | | N/A | | |
Global Energy Transition Fund | | | 1.48 | % | | | 2.28 | % | | | 1.86 | % | | | 1.15 | % | | | N/A | | |
Under the terms of the expense limitation agreements, as amended May 1, 2022, the Funds have agreed to repay fees and expenses that were waived or reimbursed by the Adviser for a period of up to three years (thirty-six (36) months) after the waiver or reimbursement took place, subject to the lesser of any operating expense limits in effect at the time of: (a) the original waiver or expense reimbursement; or (b) the recoupment, after giving effect to the recoupment amount.
As of June 30, 2022, the following amounts are available to be repaid to the Adviser. The Funds have not recorded any amounts available to be repaid as a liability due to an assessment that such repayments are not probable at June 30, 2022.
| | | Expires
2022 | | Expires
2023 | | Expires
2024 | | Expires
2025 | | Total | |
RS Partners Fund | | $ | 154,596 | | | $ | 316,786 | | | $ | 229,651 | | | $ | 116,671 | | | $ | 817,704 | | |
RS Value Fund | | | 69,767 | | | | 199,071 | | | | 70,218 | | | | 33,574 | | | | 372,630 | | |
RS Large Cap Alpha Fund | | | 153,277 | | | | 314,607 | | | | 211,774 | | | | 92,078 | | | | 771,736 | | |
RS Investors Fund | | | 83,503 | | | | 146,600 | | | | 90,433 | | | | 55,760 | | | | 376,296 | | |
Global Energy Transition Fund | | | 112,827 | | | | 234,015 | | | | 186,151 | | | | 62,308 | | | | 595,301 | | |
The Adviser may voluntarily waive or reimburse additional fees to assist the Funds in maintaining competitive expense ratios. Voluntary waivers and reimbursements applicable to the Funds are not available to be recouped at a future time. There were no voluntary waivers or reimbursements for the six months ended June 30, 2022.
Certain officers and/or interested trustees of the Funds are also officers and/or employees of the Adviser, administrator, fund accountant, sub-administrator, sub-fund accountant, custodian, legal counsel, and Distributor.
47
Victory Portfolios | | Notes to Financial Statements — continued
June 30, 2022 | |
(Unaudited)
6. Risks:
The Funds may be subject to other risks in addition to these identified risks.
Equity Risk — The value of the equity securities in which the Funds invests may decline in response to developments affecting individual companies and/or general economic conditions in the United States or abroad. A company's earnings or dividends may not increase as expected (or may decline) because of poor management, competitive pressures, reliance on particular suppliers or geographical regions, labor problems or shortages, corporate restructurings, fraudulent disclosures, man-made or natural disasters, military confrontations or wars, terrorism, public health crises, or other events, conditions and factors. Price changes may be temporary or last for extended periods.
Private Investments in Public Equities Risk — The risks associated with PIPE transactions that the RS Science and Technology Fund invests is that the issuer may be unable to register the shares for public resale in a timely manner or at all, in which case the shares may be sold only in a privately negotiated transaction, typically at a price less than that paid, assuming a suitable buyer can be found. Disposing of the securities may involve time-consuming negotiation and legal expenses, and selling them promptly at an acceptable price may be difficult or impossible. Even if the shares are registered for public resale, the market for the issuer's securities may nevertheless be "thin" or illiquid, making the sale of securities at desired prices or in desired quantities difficult or impossible. While private placements may offer attractive opportunities not otherwise available in the open market, the securities purchased are usually "restricted securities" or are "not readily marketable." Restricted securities cannot be sold without being registered under the 1933 Act, unless they are sold pursuant to an exemption from registration (such as Rules 144 or 144A under the 1933 Act). Securities that are not readily marketable are subject to other legal or contractual restrictions on resale.
Special Purpose Acquisition Company Risk — An investment in a SPAC is subject to a variety of risks, including that (1) a portion of the monies raised by the SPAC for the purpose of effecting an acquisition or merger may be expended prior to the transaction for payment of taxes and other expenses; (2) the Fund generally will not receive significant income from its investments in SPACs (both prior to and after any acquisition or merger) and, therefore, the Fund's investments in SPACs will not significantly contribute to the Fund's distributions to shareholders; (3) an attractive acquisition or merger target may not be identified at all or a proposed merger or acquisition may be unable to obtain the requisite approval, if any, of SPAC shareholders and/or antitrust and securities regulators; (4) the warrants or other rights with respect to the SPAC held by the Fund may expire worthless or may be redeemed by the SPAC at an unfavorable price; (5) the Fund may be subject to opportunity costs to the extent that alternative investments would have produced higher returns; (6) an acquisition or merger once effected may prove unsuccessful and an investment in the SPAC may lose value; (7) while a SPAC is seeking a transaction target, its stock may be thinly traded and/or illiquid and there can be no assurance that a market will develop, leaving the Fund unable to sell its interest in a SPAC or to sell its interest only at a price below what the Fund believes is the SPAC interest's intrinsic value, (8) an investment in a SPAC may be diluted by additional later offerings of interests in the SPAC or by other investors exercising existing rights to purchase shares of the SPAC; and (9) the values of investments in SPACs may be highly volatile and may depreciate significantly over time. The proceeds of a SPAC IPO that are placed in trust are subject to risks, including the risk of insolvency of the custodian of the funds, fraud by the trustee, interest rate risk and credit and liquidity risk relating to the securities and money market funds in which the proceeds are invested.
Sector Risk — To the extent the Funds focus in one or more sectors, market or economic factors impacting those sectors could have a significant effect on the value of the Funds' investments and could make the Funds' performance more volatile. For example, the values of companies in the Information Technology sector are particularly vulnerable to economic downturns, short product cycles and aggressive pricing, market competition and changes in government regulation.
Concentration Risk — The Global Energy Transition Fund (herein, the Fund) may concentrate its investments in a particular industry, as the term "concentration is used in the 1940 Act. Concentrating investments in the Natural Resources sector increases the risk of loss because the stocks of many or all of the companies in the sector may decline in value due to developments adversely affecting the sector.
48
Victory Portfolios | | Notes to Financial Statements — continued
June 30, 2022 | |
(Unaudited)
In addition, investors may buy or sell substantial amounts of the Fund's shares in response to factors affecting or expected to affect the natural resources sector, resulting in extreme inflows and outflows of cash into and out of the Fund. Such inflows or outflows might affect management of the Fund adversely to the extent they cause the Fund's cash position or cash requirements to exceed normal levels.
Natural Resources Investment Risk — Investment in companies in natural resources industries (including those in the energy sector) can be significantly affected by (often rapid) changes in supply of, or demand for, various natural resources. They may also be affected by changes in energy prices, international political and economic developments, environmental incidents, energy conservation, the success of exploration projects, changes in commodity prices, and tax and other government regulations. For example, the COVID-19 pandemic has drastically reduced the demand for various natural resources and has drastically increased the price volatility of natural resources and companies within the natural resources industry. An extended period of reduced (or negative) prices may significantly lengthen the time that companies within the natural resources industries would need to recover after a stabilization of prices. Investments in interests in gas or mineral exploration or development programs, including pipelines, may be held through master limited partnerships, which are generally subject to many of the risks that apply to partnerships and may also be subject to certain tax risks.
Market Risk — Overall market risks may affect the value of the Fund. Domestic and international factors such as political events, war, terrorism, trade disputes, inflation rates, interest rate levels and other fiscal and monetary policy changes, cybersecurity incidents, pandemics and other public health crises, sanctions against a particular foreign country, its nationals, businesses or industries and related geopolitical events, as well as environmental disasters such as earthquakes, fires, and floods or other catastrophes, may add to instability in global economies and markets generally, and may lead to increased market volatility. Global economies and financial markets are highly interconnected, which increases the possibility that conditions in one country or region might adversely affect issuers in another country or region. The impact of these and other factors may be short-term or may last for extended periods.
7. Borrowing and Interfund Lending:
Line of Credit:
The Victory Funds Complex participates in a short-term demand note "Line of Credit" agreement with Citibank. The Line of Credit agreement with Citibank was renewed on June 27, 2022, with a termination date of June 26, 2023. Under the agreement with Citibank, the Victory Funds Complex may borrow up to $600 million, of which $300 million is committed and $300 million is uncommitted. $40 million of the Line of Credit is reserved for use by the Victory Floating Rate Fund, another series of the Victory Funds Complex, with Victory Floating Rate Fund paying the related commitment fees for that amount. The purpose of the Line of Credit is to meet temporary or emergency cash needs. For the six months ended June 30, 2022, Citibank received an annual commitment fee of 0.15% on $300 million for providing the Line of Credit. Each fund in the Victory Funds Complex paid a pro-rata portion of the commitment fees plus any interest on amounts borrowed. For the period from January 1, 2022, through June 27, 2022, interest was based on the one-month London Interbank Offered Rate ("LIBOR") plus one percent. Effective with the renewal, for the period June 28, 2022, through June 30, 2022, interest was based on the one-month Secured Overnight Financing Rate (SOFR) plus 1.10 percent. Interest charged to each fund during the period, if applicable, is reflected on the Statements of Operations under Line of credit fees.
The Funds had no borrowings under the Line of Credit agreement during the six months ended June 30, 2022.
49
Victory Portfolios | | Notes to Financial Statements — continued
June 30, 2022 | |
(Unaudited)
Interfund Lending:
The Trust and the Adviser rely on an exemptive order granted by the SEC in March 2017 (the "Order"), permitting the establishment and operation of an Interfund Lending Facility (the "Facility"). The Facility allows each Fund to directly lend and borrow money to or from any other fund in the Victory Funds Complex that is permitted to participate in the Facility, relying upon the Order at rates beneficial to both the borrowing and lending funds. Advances under the Facility are allowed for temporary or emergency purposes, including the meeting of redemption requests that otherwise might require the untimely disposition of securities, and are subject to each Fund's borrowing restrictions. The interfund loan rate is determined, as specified in the Order, by averaging the current repurchase agreement rate and the current bank loan rate. As a Borrower, interest charged to each Fund, if any, during the period, is reflected on the Statements of Operations under Interfund lending fees. As a Lender, interest earned by each Fund, if any, during the period, is reflected on the Statements of Operations under Interfund lending.
The Funds did not utilize or participate in the Facility during the six months ended June 30, 2022.
8. Federal Income Tax Information:
Dividends from net investment income, if any, are declared and paid as noted in the table below. Distributable net realized gains, if any, are declared and distributed at least annually from each Fund.
| | | Declared | | Paid | |
RS Partners Fund | | Annually | | Annually | |
RS Value Fund | | Annually | | Annually | |
RS Large Cap Alpha Fund | | Annually | | Annually | |
RS Investors Fund | | Annually | | Annually | |
Global Energy Transition Fund | | Annually | | Annually | |
The amounts of dividends from net investment income and distributions from net realized gains (collectively, distributions to shareholders) are determined in accordance with federal income tax regulations, which may differ from GAAP. To the extent these "book/tax" differences are permanent in nature (e.g., net operating loss and distribution reclassification), such amounts are reclassified within the components of net assets based on their federal tax-basis treatment; temporary differences (e.g., wash sales) do not require reclassification. To the extent dividends and distributions exceed net investment income and net realized gains for tax purposes, they are reported as distributions of capital. Net investment losses incurred by the Funds may be reclassified as an offset to capital on the accompanying Statements of Assets and Liabilities.
The tax character of current year distributions paid and the tax basis of the current components of accumulated earnings (loss) will be determined at the end of the current tax year ending December 31, 2022.
As of tax year ended December 31, 2021, the Funds had net capital loss carryforwards as shown in the table below. It is unlikely that the Board will authorize a distribution of capital gains realized in the future until the capital loss carryforwards have been used.
| | | Short-Term
Amount | | Long-Term
Amount | | Total | |
Global Energy Transition Fund | | $ | — | | | $ | 1,823,189,805 | | | $ | 1,823,189,805 | | |
50
Victory Portfolios | | Supplemental Information
June 30, 2022 | |
(Unaudited)
Proxy Voting and Portfolio Holdings Information
Proxy Voting:
Information regarding the policies and procedures each Fund uses to determine how to vote proxies relating to portfolio securities is available without charge, upon request, by calling 800-539-3863. The information is also included in the Funds' Statement of Additional Information, which is available on the SEC's website at www.sec.gov.
Information relating to how the Funds voted proxies relating to portfolio securities held during the most recent 12 months ended June 30 is available on the SEC's website at www.sec.gov.
Availability of Schedules of Portfolio Investments:
The Trust files a complete list of Schedules of Portfolio Investments with the SEC for the first and third quarter of each fiscal year on Form N-PORT. Forms N-PORT are available on the SEC's website at www.sec.gov.
Expense Examples
As a shareholder of a Fund, you may incur two types of costs: (1) transaction costs, including sales charges (loads) on purchases; and (2) ongoing costs, including management fees and other Fund expenses. These examples are intended to help you understand your ongoing costs (in dollars) of investing in a Fund and to compare these costs with the ongoing costs of investing in other mutual funds.
These examples are based on an investment of $1,000 invested at the beginning of the period and held for the entire period from January 1, 2022, through June 30, 2022.
The Actual Expense figures in the table below provide information about actual account values and actual expenses. You may use the information below, together with the amount you invested, to estimate the expenses that you paid over the period. Simply divide your account value by $1,000 (for example, an $8,600 account value divided by $1,000 = 8.6), then multiply the result by the number in the table under the heading entitled "Actual Expenses Paid During Period" to estimate the expenses you paid on your account during this period.
The Hypothetical Expense figures in the table below provide information about hypothetical account values and hypothetical expenses based on the Fund's actual expense ratio and an assumed rate of return of 5% per year before expenses, which is not the Fund's actual return. The hypothetical account values and expenses may not be used to estimate the actual ending account balance or expenses you paid for the period. You may use this information to compare this 5% hypothetical example with the 5% hypothetical examples that appear in shareholder reports of other funds.
Please note the expenses shown in the table below are meant to highlight your ongoing costs only and do not reflect any transactional costs. Therefore, the hypothetical expenses in the table are useful in comparing ongoing costs only and will not help you determine the relative total costs of owning different funds. In addition, if these transactional costs were included, your costs would have been higher.
| | | Beginning
Account
Value
1/1/22 | | Actual
Ending
Account
Value
6/30/22 | | Hypothetical
Ending
Account
Value
6/30/22 | | Actual
Expenses Paid
During Period
1/1/22-6/30/22* | | Hypothetical
Expenses Paid
During Period
1/1/22-6/30/22* | | Annualized
Expense Ratio
During Period
1/1/22-6/30/22 | |
RS Partners Fund | |
Class A | | $ | 1,000.00 | | | $ | 901.20 | | | $ | 1,017.60 | | | $ | 6.84 | | | $ | 7.25 | | | | 1.45 | % | |
Class R | | | 1,000.00 | | | | 899.60 | | | | 1,015.82 | | | | 8.53 | | | | 9.05 | | | | 1.81 | % | |
Class Y | | | 1,000.00 | | | | 902.40 | | | | 1,019.24 | | | | 5.28 | | | | 5.61 | | | | 1.12 | % | |
Member Class | | | 1,000.00 | | | | 901.70 | | | | 1,018.60 | | | | 5.89 | | | | 6.26 | | | | 1.25 | % | |
RS Value Fund | |
Class A | | | 1,000.00 | | | | 906.60 | | | | 1,018.35 | | | | 6.15 | | | | 6.51 | | | | 1.30 | % | |
Class C | | | 1,000.00 | | | | 903.50 | | | | 1,014.53 | | | | 9.77 | | | | 10.34 | | | | 2.07 | % | |
Class R | | | 1,000.00 | | | | 905.10 | | | | 1,016.41 | | | | 7.98 | | | | 8.45 | | | | 1.69 | % | |
Class Y | | | 1,000.00 | | | | 908.20 | | | | 1,019.54 | | | | 5.02 | | | | 5.31 | | | | 1.06 | % | |
51
Victory Portfolios | | Supplemental Information — continued
June 30, 2022 | |
(Unaudited)
| | | Beginning
Account
Value
1/1/22 | | Actual
Ending
Account
Value
6/30/22 | | Hypothetical
Ending
Account
Value
6/30/22 | | Actual
Expenses Paid
During Period
1/1/22-6/30/22* | | Hypothetical
Expenses Paid
During Period
1/1/22-6/30/22* | | Annualized
Expense Ratio
During Period
1/1/22-6/30/22 | |
RS Large Cap Alpha Fund | |
Class A | | $ | 1,000.00 | | | $ | 929.30 | | | $ | 1,020.38 | | | $ | 4.26 | | | $ | 4.46 | | | | 0.89 | % | |
Class C | | | 1,000.00 | | | | 925.50 | | | | 1,016.41 | | | | 8.07 | | | | 8.45 | | | | 1.69 | % | |
Class R | | | 1,000.00 | | | | 927.70 | | | | 1,018.55 | | | | 6.02 | | | | 6.31 | | | | 1.26 | % | |
Class Y | | | 1,000.00 | | | | 930.20 | | | | 1,021.42 | | | | 3.25 | | | | 3.41 | | | | 0.68 | % | |
RS Investors Fund | |
Class A | | | 1,000.00 | | | | 954.00 | | | | 1,018.20 | | | | 6.44 | | | | 6.66 | | | | 1.33 | % | |
Class C | | | 1,000.00 | | | | 950.70 | | | | 1,014.53 | | | | 10.01 | | | | 10.34 | | | | 2.07 | % | |
Class R | | | 1,000.00 | | | | 950.90 | | | | 1,015.12 | | | | 9.43 | | | | 9.74 | | | | 1.95 | % | |
Class Y | | | 1,000.00 | | | | 955.60 | | | | 1,019.59 | | | | 5.09 | | | | 5.26 | | | | 1.05 | % | |
Global Energy Transition Fund | |
Class A | | | 1,000.00 | | | | 1,231.20 | | | | 1,017.46 | | | | 8.19 | | | | 7.40 | | | | 1.48 | % | |
Class C | | | 1,000.00 | | | | 1,226.20 | | | | 1,013.49 | | | | 12.59 | | | | 11.38 | | | | 2.28 | % | |
Class R | | | 1,000.00 | | | | 1,228.90 | | | | 1,015.57 | | | | 10.28 | | | | 9.30 | | | | 1.86 | % | |
Class Y | | | 1,000.00 | | | | 1,233.10 | | | | 1,019.09 | | | | 6.37 | | | | 5.76 | | | | 1.15 | % | |
* Expenses are equal to the average account value multiplied by the Fund's annualized expense ratio multiplied by 181/365 (the number of days in the most recent fiscal half-year divided by the number of days in the fiscal year).
52
Victory Portfolios | | Supplemental Information — continued
June 30, 2022 | |
(Unaudited)
Liquidity Risk Management Program:
The Victory Funds have adopted and implemented a written liquidity risk management program (the "LRMP") as required by Rule 22e-4 under the Investment Company Act of 1940, as amended. The LRMP is reasonably designed to assess and manage each Fund's liquidity risk, taking into consideration each Fund's investment strategy and the liquidity of its portfolio investments during normal and reasonably foreseeable stressed market conditions; its short- and long-term cash flow projections; and its cash holdings and access to other liquidity management tools such as available funding sources including the Victory Funds Complex Interfund Lending Facility and Line of Credit (discussed in the Notes to Financial Statements). The Victory Funds' Board of Trustees approved the appointment of the Funds' investment adviser, Victory Capital Management Inc. ("Victory Capital"), as the administrator of the LRMP.
Victory Capital manages liquidity risks associated with the Funds' investments by monitoring, among other things, cash and cash equivalents, any use of derivatives, the concentration of investments, the appropriateness of each Fund's investment strategy, and by classifying every Fund investment as either highly liquid, moderately liquid, less liquid, or illiquid on at least a monthly basis. To assist with the classification of Fund investments, Victory Capital has retained a third-party provider of liquidity evaluation services. This provider determines preliminary liquidity classifications for all portfolio holdings based upon portfolio-level data and certain assumptions provided by Victory Capital. Victory Capital reviews the preliminary liquidity classifications and, when appropriate, considers other information including input from the Funds' portfolio managers (including the portfolio managers employed by any investment sub-advisers) in determining final liquidity classifications.
At a meeting held on February 24, 2022, Victory Capital provided an oral and written report to the Trustees on the operation and effectiveness of the LRMP during the previous year. The report from Victory Capital concluded that the Funds did not experience any significant liquidity challenges during the covered period, and the Funds' LRMP is reasonably designed to assess and manage its liquidity risk. The report also concluded that the LRMP continues to operate adequately and effectively to enable Victory Capital to oversee and manage liquidity risk and ensure each Fund is able to meet redemption requests without significant dilution to the remaining investors' interest in each Fund. During the review period, each Fund's portfolio consisted primarily of highly liquid investments, which are defined as cash and any investments that each Fund reasonably expects to be converted to cash in current market conditions in three business days or less without significantly changing the market value of the investment. Therefore, the Funds have not adopted a highly liquid investment minimum. The Funds' investments were below the limitation on illiquid investments during the review period. Additionally, Victory Capital indicated that no events occurred that would require the filing of Form N-LIQUID and recommended no material changes to the LRMP.
53
Privacy Policy
Protecting the Privacy of Information
The Trust respects your right to privacy. We also know that you expect us to conduct and process your business in an accurate and efficient manner. To do so, we must collect and maintain certain personal information about you. This is the information we collect from you on applications or other forms, and from the transactions you make with us or third parties. It may include your name, address, social security number, account transactions and balances, and information about investment goals and risk tolerance.
We do not disclose any information about you or about former customers to anyone except as permitted or required by law. Specifically, we may disclose the information we collect to companies that perform services on our behalf, such as the transfer agent that processes shareholder accounts and printers and mailers that assist us in the distribution of investor materials. We may also disclose this information to companies that perform marketing services on our behalf. This allows us to continue to offer you Victory investment products and services that meet your investing needs, and to effect transactions that you request or authorize. These companies will use this information only in connection with the services for which we hired them. They are not permitted to use or share this information for any other purpose.
To protect your personal information internally, we permit access only by authorized employees and maintain physical, electronic, and procedural safeguards to guard your personal information.*
* You may have received communications regarding information about privacy policies from other financial institutions which gave you the opportunity to "opt-out" of certain information sharing with companies which are not affiliated with that financial institution. The Trust does not share information with other companies for purposes of marketing solicitations for products other than the Trust. Therefore, the Trust does not provide opt-out options to their shareholders.
Victory Funds
P.O. Box 182593
Columbus, Ohio 43218-2593

Visit our website at: | | Call Victory at: | |
www.vcm.com | | 800-539-FUND (800-539-3863) | |
| | | 800-235-8396 for Member Class | |

June 30, 2022
Semi Annual Report
Victory RS Small Cap Growth Fund
Victory RS Select Growth Fund
Victory RS Mid Cap Growth Fund
Victory RS Growth Fund
Victory RS Science and Technology Fund
Victory RS Small Cap Equity Fund
www.vcm.com
News, Information And Education 24 Hours A Day, 7 Days A Week
The Victory Capital website gives fund shareholders, prospective shareholders, and investment professionals a convenient way to access fund information, get guidance, and track fund performance anywhere they can access the Internet. The site includes:
• Detailed performance records
• Daily share prices
• The latest fund news
• Investment resources to help you become a better investor
• A section dedicated to investment professionals
Whether you're a potential investor searching for the fund that matches your investment philosophy, a seasoned investor interested in planning tools, or an investment professional, www.vcm.com has what you seek. Visit us anytime. We're always open.
TABLE OF CONTENTS
Investment Objective and Portfolio
Holdings | | | 3 | | |
Schedules of Portfolio Investments | |
Victory RS Small Cap Growth Fund | | | 9 | | |
Victory RS Select Growth Fund | | | 13 | | |
Victory RS Mid Cap Growth Fund | | | 15 | | |
Victory RS Growth Fund | | | 18 | | |
Victory RS Science and Technology Fund | | | 20 | | |
Victory RS Small Cap Equity Fund | | | 24 | | |
Financial Statements | |
Statements of Assets and Liabilities | | | 26 | | |
Statements of Operations | | | 28 | | |
Statements of Changes in Net Assets | | | 30 | | |
Financial Highlights | | | 36 | | |
Notes to Financial Statements | | | 58 | | |
Supplemental Information | | | 67 | | |
Proxy Voting and Portfolio Holdings Information | | | 67 | | |
Expense Examples | | | 67 | | |
Liquidity Risk Management Program | | | 69 | | |
Privacy Policy (inside back cover) | | | |
1
IRA DISTRIBUTION WITHHOLDING DISCLOSURE
We generally must withhold federal income tax at a rate of 10% of the taxable portion of your distribution and, if you live in a state that requires state income tax withholding, at your state's tax rate. However, you may elect not to have withholding apply or to have income tax withheld at a higher rate. Any withholding election that you make will apply to any subsequent distribution unless and until you change or revoke the election. If you wish to make a withholding election, or change or revoke a prior withholding election, call 800-539-3863 (800-235-8396 for Member Class) and form W-4P (OMB No. 1545-0074 withholding certificate for pension or annuity payments) will be electronically sent.
If you do not have a withholding election in place by the date of a distribution, federal income tax will be withheld from the taxable portion of your distribution at a rate of 10%. If you must pay estimated taxes, you may be subject to estimated tax penalties if your estimated tax payments are not sufficient and sufficient tax is not withheld from your distribution.
For more specific information, please consult your tax adviser.
The Funds are distributed by Victory Capital Services, Inc. Victory Capital Management Inc. is the investment adviser to the Funds and receives fees from the Funds for performing services for the Funds.
This report is not authorized for distribution to prospective investors unless preceded or accompanied by a current prospectus of the Victory Funds.
For additional information about any Victory Fund, including fees, expenses, and risks, view our prospectus online at vcm.com or call 800-539-3863 (800-235-8396 for Member Class). Read it carefully before you invest or send money.
The information in this report is based on data obtained from recognized services and sources and is believed to be reliable. Any opinions, projections, or recommendations in this report are subject to change without notice and are not intended as individual investment advice. Past investment performance of the Funds, markets or securities mentioned herein should not be considered to be indicative of future results.
• NOT FDIC INSURED • NO BANK GUARANTEE • MAY LOSE VALUE

Call Victory at:
800-539-FUND (800-539-3863)
800-235-8396 for Member Class
Visit our website at:
www.vcm.com
2
Victory Portfolios
Victory RS Small Cap Growth Fund | | June 30, 2022 | |
(Unaudited)
Investment Objective and Portfolio Holdings:
The Fund seeks to provide long-term capital growth.
Top 10 Holdings*:
June 30, 2022
(% of Net Assets)
MACOM Technology Solutions Holdings, Inc. | | | 3.1 | % | |
Evoqua Water Technologies Corp. | | | 2.7 | % | |
Advanced Energy Industries, Inc. | | | 2.5 | % | |
WNS Holdings Ltd. | | | 2.5 | % | |
Acushnet Holdings Corp. | | | 2.2 | % | |
Inspire Medical Systems, Inc. | | | 2.1 | % | |
Chart Industries, Inc. | | | 2.0 | % | |
HealthEquity, Inc. | | | 1.9 | % | |
Matador Resources Co. | | | 1.9 | % | |
Varonis Systems, Inc. | | | 1.9 | % | |
Sector Allocation*:
June 30, 2022
(% of Net Assets)
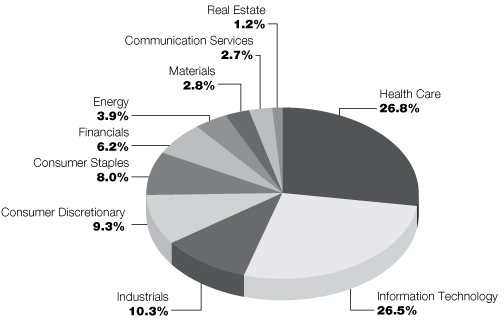
* Does not include futures contracts, money market instruments, and short-term investments purchased with cash collateral from securities loaned.
Percentages are of the net assets of the Fund and may not equal 100%.
Refer to the Schedule of Portfolio Investments for a complete list of securities.
3
Victory Portfolios
Victory RS Select Growth Fund | | June 30, 2022 | |
(Unaudited)
Investment Objective and Portfolio Holdings:
The Fund seeks to provide long-term capital growth.
Top 10 Holdings*:
June 30, 2022
(% of Net Assets)
Evoqua Water Technologies Corp. | | | 3.5 | % | |
Jazz Pharmaceuticals PLC | | | 3.0 | % | |
Chart Industries, Inc. | | | 2.8 | % | |
Intra-Cellular Therapies, Inc. | | | 2.8 | % | |
MACOM Technology Solutions Holdings, Inc. | | | 2.8 | % | |
Varonis Systems, Inc. | | | 2.7 | % | |
BioCryst Pharmaceuticals, Inc. | | | 2.7 | % | |
Acadia Healthcare Co., Inc. | | | 2.7 | % | |
YETI Holdings, Inc. | | | 2.7 | % | |
Five9, Inc. | | | 2.4 | % | |
Sector Allocation*:
June 30, 2022
(% of Net Assets)

* Does not include futures contracts, money market instruments, and short-term investments purchased with cash collateral from securities loaned.
Percentages are of the net assets of the Fund and may not equal 100%.
Refer to the Schedule of Portfolio Investments for a complete list of securities.
4
Victory Portfolios
Victory RS Mid Cap Growth Fund | | June 30, 2022 | |
(Unaudited)
Investment Objective and Portfolio Holdings:
The Fund seeks to provide long-term capital growth.
Top 10 Holdings*:
June 30, 2022
(% of Net Assets)
Synopsys, Inc. | | | 3.5 | % | |
Chipotle Mexican Grill, Inc. | | | 2.6 | % | |
Datadog, Inc., Class A | | | 2.5 | % | |
ZoomInfo Technologies, Inc. | | | 2.5 | % | |
West Pharmaceutical Services, Inc. | | | 2.4 | % | |
AmerisourceBergen Corp. | | | 2.3 | % | |
Chart Industries, Inc. | | | 2.3 | % | |
Palo Alto Networks, Inc. | | | 2.3 | % | |
Teledyne Technologies, Inc. | | | 2.3 | % | |
Diamondback Energy, Inc. | | | 2.3 | % | |
Sector Allocation*:
June 30, 2022
(% of Net Assets)
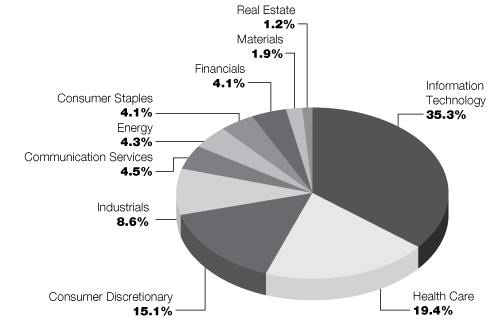
* Does not include futures contracts, money market instruments, and short-term investments purchased with cash collateral from securities loaned.
Percentages are of the net assets of the Fund and may not equal 100%.
Refer to the Schedule of Portfolio Investments for a complete list of securities.
5
Victory Portfolios
Victory RS Growth Fund | | June 30, 2022 | |
(Unaudited)
Investment Objective and Portfolio Holdings:
The Fund seeks to provide long-term capital growth.
Top 10 Holdings*:
June 30, 2022
(% of Net Assets)
Microsoft Corp. | | | 13.7 | % | |
Apple, Inc. | | | 10.9 | % | |
Alphabet, Inc., Class C | | | 8.3 | % | |
Visa, Inc., Class A | | | 5.0 | % | |
Amazon.com, Inc. | | | 4.7 | % | |
Vertex Pharmaceuticals, Inc. | | | 3.7 | % | |
Tesla, Inc. | | | 3.2 | % | |
ServiceNow, Inc. | | | 2.7 | % | |
Constellation Brands, Inc., Class A | | | 2.4 | % | |
Jazz Pharmaceuticals PLC | | | 2.4 | % | |
Sector Allocation*:
June 30, 2022
(% of Net Assets)
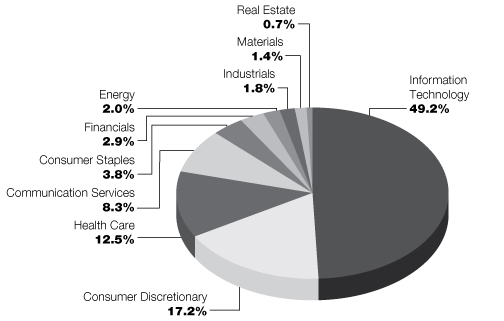
* Does not include futures contracts, money market instruments, and short-term investments purchased with cash collateral from securities loaned.
Percentages are of the net assets of the Fund and may not equal 100%.
Refer to the Schedule of Portfolio Investments for a complete list of securities.
6
Victory Portfolios
Victory RS Science and Technology Fund | | June 30, 2022 | |
(Unaudited)
Investment Objective and Portfolio Holdings:
The Fund seeks to provide long-term capital growth.
Top 10 Holdings*:
June 30, 2022
(% of Net Assets)
Microsoft Corp. | | | 9.8 | % | |
Vertex Pharmaceuticals, Inc. | | | 5.7 | % | |
Amazon.com, Inc. | | | 3.6 | % | |
MACOM Technology Solutions Holdings, Inc. | | | 3.2 | % | |
ServiceNow, Inc. | | | 2.9 | % | |
Impinj, Inc. | | | 2.7 | % | |
Jazz Pharmaceuticals PLC | | | 2.4 | % | |
Visa, Inc., Class A | | | 2.0 | % | |
MKS Instruments, Inc. | | | 2.0 | % | |
Lattice Semiconductor Corp. | | | 2.0 | % | |
Sector Allocation*:
June 30, 2022
(% of Net Assets)
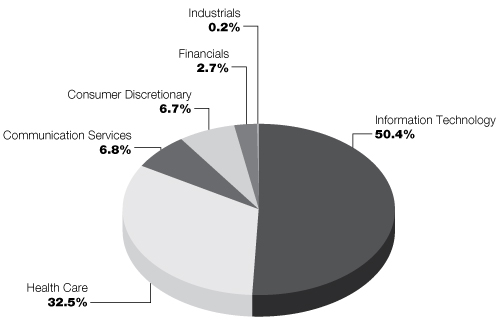
* Does not include futures contracts, money market instruments, and short-term investments purchased with cash collateral from securities loaned.
Percentages are of the net assets of the Fund and may not equal 100%.
Refer to the Schedule of Portfolio Investments for a complete list of securities.
7
Victory Portfolios
Victory RS Small Cap Equity Fund | | June 30, 2022 | |
(Unaudited)
Investment Objective and Portfolio Holdings:
The Fund seeks to provide long-term capital growth.
Top 10 Holdings*:
June 30, 2022
(% of Net Assets)
Evoqua Water Technologies Corp. | | | 6.7 | % | |
Chart Industries, Inc. | | | 5.5 | % | |
Shift4 Payments, Inc., Class A | | | 4.5 | % | |
Trupanion, Inc. | | | 4.1 | % | |
Acushnet Holdings Corp. | | | 4.0 | % | |
ACI Worldwide, Inc. | | | 3.9 | % | |
MACOM Technology Solutions Holdings, Inc. | | | 3.2 | % | |
CBIZ, Inc. | | | 3.2 | % | |
YETI Holdings, Inc. | | | 3.2 | % | |
Impinj, Inc. | | | 3.2 | % | |
Sector Allocation*:
June 30, 2022
(% of Net Assets)
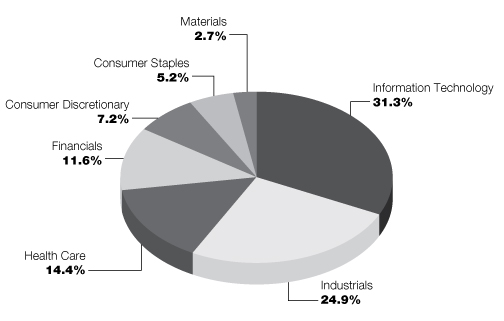
* Does not include futures contracts, money market instruments, and short-term investments purchased with cash collateral from securities loaned.
Percentages are of the net assets of the Fund and may not equal 100%.
Refer to the Schedule of Portfolio Investments for a complete list of securities.
8
Victory Portfolios
Victory RS Small Cap Growth Fund | | Schedule of Portfolio Investments
June 30, 2022 | |
(Unaudited)
Security Description | | Shares | | Value | |
Common Stocks (97.7%) | |
Biotechnology (10.4%): | |
Alkermes PLC (a) | | | 451,510 | | | $ | 13,450,483 | | |
Apellis Pharmaceuticals, Inc. (a) | | | 264,400 | | | | 11,956,168 | | |
BioCryst Pharmaceuticals, Inc. (a) | | | 1,403,360 | | | | 14,847,549 | | |
DermTech, Inc. (a) (b) | | | 455,490 | | | | 2,523,415 | | |
Equillium, Inc. (a) | | | 1,620,354 | | | | 3,305,522 | | |
Fate Therapeutics, Inc. (a) (b) | | | 418,800 | | | | 10,377,864 | | |
Halozyme Therapeutics, Inc. (a) | | | 337,450 | | | | 14,847,800 | | |
Karuna Therapeutics, Inc. (a) | | | 87,670 | | | | 11,091,132 | | |
Kezar Life Sciences, Inc. (a) | | | 1,076,530 | | | | 8,902,903 | | |
Kura Oncology, Inc. (a) | | | 307,500 | | | | 5,636,475 | | |
Opthea Ltd., ADR (a) (c) | | | 769,820 | | | | 4,849,866 | | |
SpringWorks Therapeutics, Inc. (a) (b) | | | 390,570 | | | | 9,615,833 | | |
| | | | 111,405,010 | | |
Communication Services (2.7%): | |
World Wrestling Entertainment, Inc., Class A (b) | | | 280,810 | | | | 17,547,817 | | |
ZipRecruiter, Inc. (a) | | | 745,700 | | | | 11,051,274 | | |
| | | | 28,599,091 | | |
Consumer Discretionary (9.3%): | |
Acushnet Holdings Corp. | | | 556,630 | | | | 23,200,338 | | |
Boot Barn Holdings, Inc. (a) | | | 181,080 | | | | 12,478,223 | | |
Funko, Inc., Class A (a) | | | 336,830 | | | | 7,518,046 | | |
Gentherm, Inc. (a) | | | 182,900 | | | | 11,414,789 | | |
Ollie's Bargain Outlet Holdings, Inc. (a) | | | 143,290 | | | | 8,418,287 | | |
Papa John's International, Inc. | | | 105,620 | | | | 8,821,382 | | |
Wingstop, Inc. | | | 128,480 | | | | 9,606,450 | | |
YETI Holdings, Inc. (a) | | | 421,160 | | | | 18,223,593 | | |
| | | | 99,681,108 | | |
Consumer Staples (8.0%): | |
BellRing Brands, Inc. (a) | | | 691,660 | | | | 17,215,417 | | |
e.l.f. Beauty, Inc. (a) | | | 512,530 | | | | 15,724,420 | | |
Freshpet, Inc. (a) | | | 148,250 | | | | 7,692,693 | | |
Grocery Outlet Holding Corp. (a) | | | 339,270 | | | | 14,463,080 | | |
Hostess Brands, Inc. (a) | | | 254,540 | | | | 5,398,793 | | |
The Beauty Health Co. (a) (b) | | | 768,420 | | | | 9,881,881 | | |
The Simply Good Foods Co. (a) | | | 414,450 | | | | 15,653,777 | | |
| | | | 86,030,061 | | |
Energy (3.9%): | |
Callon Petroleum Co. (a) | | | 213,750 | | | | 8,379,000 | | |
Matador Resources Co. | | | 431,560 | | | | 20,106,380 | | |
Ranger Oil Corp. (a) | | | 393,970 | | | | 12,949,794 | | |
| | | | 41,435,174 | | |
Financials (6.2%): | |
Customers Bancorp, Inc. (a) | | | 292,430 | | | | 9,913,377 | | |
Focus Financial Partners, Inc., Class A (a) | | | 387,470 | | | | 13,197,228 | | |
See notes to financial statements.
9
Victory Portfolios
Victory RS Small Cap Growth Fund | | Schedule of Portfolio Investments — continued
June 30, 2022 | |
(Unaudited)
Security Description | | Shares | | Value | |
PRA Group, Inc. (a) | | | 371,300 | | | $ | 13,500,468 | | |
Walker & Dunlop, Inc. | | | 105,750 | | | | 10,187,955 | | |
Wintrust Financial Corp. | | | 236,890 | | | | 18,986,734 | | |
| | | | 65,785,762 | | |
Health Care Equipment & Supplies (5.5%): | |
Axonics, Inc. (a) (b) | | | 171,380 | | | | 9,712,105 | | |
CONMED Corp. | | | 6,430 | | | | 615,737 | | |
CryoPort, Inc. (a) (b) | | | 449,270 | | | | 13,918,384 | | |
LivaNova PLC (a) | | | 185,870 | | | | 11,611,299 | | |
Nevro Corp. (a) | | | 207,570 | | | | 9,097,793 | | |
Shockwave Medical, Inc. (a) | | | 75,230 | | | | 14,381,719 | | |
| | | | 59,337,037 | | |
Health Care Providers & Services (6.0%): | |
Acadia Healthcare Co., Inc. (a) | | | 275,680 | | | | 18,644,238 | | |
HealthEquity, Inc. (a) | | | 337,800 | | | | 20,737,542 | | |
Option Care Health, Inc. (a) | | | 415,580 | | | | 11,548,968 | | |
Surgery Partners, Inc. (a) | | | 458,490 | | | | 13,259,531 | | |
| | | | 64,190,279 | | |
Health Care Technology (3.1%): | |
Evolent Health, Inc., Class A (a) | | | 185,860 | | | | 5,707,760 | | |
Health Catalyst, Inc. (a) | | | 383,400 | | | | 5,555,466 | | |
Inspire Medical Systems, Inc. (a) | | | 121,580 | | | | 22,209,019 | | |
| | | | 33,472,245 | | |
Industrials (10.3%): | |
AAON, Inc. | | | 24,710 | | | | 1,353,120 | | |
AAR Corp. (a) | | | 224,760 | | | | 9,403,958 | | |
Applied Industrial Technologies, Inc. | | | 109,990 | | | | 10,577,738 | | |
Chart Industries, Inc. (a) | | | 128,979 | | | | 21,588,505 | | |
Evoqua Water Technologies Corp. (a) | | | 898,870 | | | | 29,222,264 | | |
Mercury Systems, Inc. (a) | | | 108,950 | | | | 7,008,754 | | |
Simpson Manufacturing Co., Inc. | | | 123,470 | | | | 12,422,317 | | |
Trex Co., Inc. (a) | | | 99,020 | | | | 5,388,668 | | |
Zurn Water Solutions Corp. | | | 471,680 | | | | 12,848,563 | | |
| | | | 109,813,887 | | |
IT Services (6.4%): | |
DigitalOcean Holdings, Inc. (a) (b) | | | 373,510 | | | | 15,448,374 | | |
Evo Payments, Inc., Class A (a) | | | 200,340 | | | | 4,711,997 | | |
Flywire Corp. (a) | | | 371,380 | | | | 6,547,429 | | |
Marqeta, Inc., Class A (a) | | | 674,850 | | | | 5,473,033 | | |
Paya Holdings, Inc. (a) | | | 828,210 | | | | 5,441,340 | | |
Paymentus Holdings, Inc., Class A (a) (b) | | | 347,600 | | | | 4,647,412 | | |
WNS Holdings Ltd., ADR (a) | | | 356,037 | | | | 26,574,602 | | |
| | | | 68,844,187 | | |
Materials (2.8%): | |
Avient Corp. | | | 274,460 | | | | 11,000,357 | | |
Silgan Holdings, Inc. | | | 132,280 | | | | 5,469,778 | | |
See notes to financial statements.
10
Victory Portfolios
Victory RS Small Cap Growth Fund | | Schedule of Portfolio Investments — continued
June 30, 2022 | |
(Unaudited)
Security Description | | Shares | | Value | |
Summit Materials, Inc., Class A (a) | | | 578,940 | | | $ | 13,483,512 | | |
| | | | 29,953,647 | | |
Pharmaceuticals (1.8%): | |
Intra-Cellular Therapies, Inc. (a) | | | 334,660 | | | | 19,102,393 | | |
Real Estate (1.2%): | |
National Storage Affiliates Trust | | | 246,380 | | | | 12,336,247 | | |
Semiconductors & Semiconductor Equipment (9.3%): | |
Advanced Energy Industries, Inc. | | | 373,380 | | | | 27,249,273 | | |
Impinj, Inc. (a) | | | 235,890 | | | | 13,839,666 | | |
Lattice Semiconductor Corp. (a) | | | 216,640 | | | | 10,507,040 | | |
MACOM Technology Solutions Holdings, Inc. (a) | | | 709,823 | | | | 32,722,840 | | |
Silicon Laboratories, Inc. (a) | | | 67,810 | | | | 9,508,318 | | |
SiTime Corp. (a) | | | 32,890 | | | | 5,362,057 | | |
| | | | 99,189,194 | | |
Software (10.8%): | |
ACI Worldwide, Inc. (a) | | | 598,500 | | | | 15,495,165 | | |
Avaya Holdings Corp. (a) (b) | | | 640,690 | | | | 1,435,146 | | |
Box, Inc., Class A (a) | | | 409,060 | | | | 10,283,768 | | |
Gitlab, Inc., Class A (a) (b) | | | 131,240 | | | | 6,974,094 | | |
Jamf Holding Corp. (a) (b) | | | 585,560 | | | | 14,504,321 | | |
Smartsheet, Inc., Class A (a) | | | 271,920 | | | | 8,546,446 | | |
Sprout Social, Inc., Class A (a) | | | 267,770 | | | | 15,549,404 | | |
Telos Corp. (a) | | | 777,890 | | | | 6,285,351 | | |
Tenable Holdings, Inc. (a) | | | 364,120 | | | | 16,534,689 | | |
Varonis Systems, Inc. (a) | | | 676,900 | | | | 19,846,708 | | |
| | | | 115,455,092 | | |
Total Common Stocks (Cost $1,090,815,144) | | | 1,044,630,414 | | |
Collateral for Securities Loaned (5.3%)^ | |
BlackRock Liquidity Funds TempFund, Institutional Shares, 1.47% (d) | | | 1,747,271 | | | | 1,747,271 | | |
Goldman Sachs Financial Square Prime Obligations Fund, Institutional
Shares, 1.42% (d) | | | 871,974 | | | | 871,974 | | |
HSBC U.S. Government Money Market Fund I Shares, 1.46% (d) | | | 10,875,275 | | | | 10,875,275 | | |
JPMorgan Prime Money Market Fund, Capital Shares, 1.50% (d) | | | 6,952,853 | | | | 6,952,853 | | |
Morgan Stanley Institutional Liquidity Government Portfolio, Institutional
Shares, 1.39% (d) | | | 4,636,768 | | | | 4,636,768 | | |
Morgan Stanley Institutional Liquidity Prime Portfolio, Institutional
Shares, 1.53% (d) | | | 31,261,382 | | | | 31,261,382 | | |
Total Collateral for Securities Loaned (Cost $56,345,523) | | | 56,345,523 | | |
Total Investments (Cost $1,147,160,667) — 103.0% | | | 1,100,975,937 | | |
Liabilities in excess of other assets — (3.0)% | | | (32,142,134 | ) | |
NET ASSETS — 100.00% | | $ | 1,068,833,803 | | |
^ Purchased with cash collateral from securities on loan.
(a) Non-income producing security.
(b) All or a portion of this security is on loan.
See notes to financial statements.
11
Victory Portfolios
Victory RS Small Cap Growth Fund | | Schedule of Portfolio Investments — continued
June 30, 2022 | |
(Unaudited)
(c) The Fund's Adviser has deemed this security to be illiquid based upon procedures approved by the Board of Trustees. As of June 30, 2022, illiquid securities were 0.5% of net assets.
(d) Rate disclosed is the daily yield on June 30, 2022.
ADR — American Depositary Receipt
PLC — Public Limited Company
See notes to financial statements.
12
Victory Portfolios
Victory RS Select Growth Fund | | Schedule of Portfolio Investments
June 30, 2022 | |
(Unaudited)
Security Description | | Shares | | Value | |
Common Stocks (96.1%) | |
Communication Services (4.1%): | |
IAC/InterActiveCorp (a) | | | 15,120 | | | $ | 1,148,666 | | |
World Wrestling Entertainment, Inc., Class A | | | 42,990 | | | | 2,686,445 | | |
ZoomInfo Technologies, Inc. (a) | | | 31,560 | | | | 1,049,055 | | |
| | | | 4,884,166 | | |
Consumer Discretionary (11.5%): | |
Churchill Downs, Inc. | | | 10,050 | | | | 1,924,876 | | |
Five Below, Inc. (a) | | | 15,730 | | | | 1,784,254 | | |
Hyatt Hotels Corp., Class A (a) | | | 16,950 | | | | 1,252,774 | | |
Mattel, Inc. (a) | | | 118,390 | | | | 2,643,649 | | |
Ollie's Bargain Outlet Holdings, Inc. (a) | | | 26,110 | | | | 1,533,963 | | |
Wingstop, Inc. | | | 17,860 | | | | 1,335,392 | | |
YETI Holdings, Inc. (a) | | | 72,250 | | | | 3,126,258 | | |
| | | | 13,601,166 | | |
Consumer Staples (4.2%): | |
BellRing Brands, Inc. (a) | | | 66,660 | | | | 1,659,167 | | |
Freshpet, Inc. (a) | | | 23,940 | | | | 1,242,247 | | |
The Simply Good Foods Co. (a) | | | 55,380 | | | | 2,091,703 | | |
| | | | 4,993,117 | | |
Electronic Equipment, Instruments & Components (1.6%): | |
Teledyne Technologies, Inc. (a) | | | 4,950 | | | | 1,856,794 | | |
Energy (4.3%): | |
Diamondback Energy, Inc. | | | 21,560 | | | | 2,611,994 | | |
Matador Resources Co. | | | 52,060 | | | | 2,425,475 | | |
| | | | 5,037,469 | | |
Financials (4.7%): | |
Focus Financial Partners, Inc., Class A (a) | | | 49,320 | | | | 1,679,839 | | |
LPL Financial Holdings, Inc. | | | 10,700 | | | | 1,973,936 | | |
Western Alliance Bancorp | | | 26,320 | | | | 1,858,192 | | |
| | | | 5,511,967 | | |
Health Care (23.3%): | |
Acadia Healthcare Co., Inc. (a) | | | 46,440 | | | | 3,140,737 | | |
BioCryst Pharmaceuticals, Inc. (a) | | | 303,170 | | | | 3,207,539 | | |
Charles River Laboratories International, Inc. (a) | | | 4,400 | | | | 941,468 | | |
CryoPort, Inc. (a) | | | 52,820 | | | | 1,636,364 | | |
Envista Holdings Corp. (a) | | | 46,520 | | | | 1,792,881 | | |
Horizon Therapeutics PLC (a) | | | 35,340 | | | | 2,818,718 | | |
Intra-Cellular Therapies, Inc. (a) | | | 58,230 | | | | 3,323,768 | | |
Jazz Pharmaceuticals PLC (a) | | | 22,450 | | | | 3,502,425 | | |
Option Care Health, Inc. (a) | | | 75,700 | | | | 2,103,703 | | |
Penumbra, Inc. (a) | | | 10,400 | | | | 1,295,008 | | |
Shockwave Medical, Inc. (a) | | | 7,760 | | | | 1,483,479 | | |
Tandem Diabetes Care, Inc. (a) | | | 17,990 | | | | 1,064,828 | | |
Tenet Healthcare Corp. (a) | | | 23,470 | | | | 1,233,583 | | |
| | | | 27,544,501 | | |
See notes to financial statements.
13
Victory Portfolios
Victory RS Select Growth Fund | | Schedule of Portfolio Investments — continued
June 30, 2022 | |
(Unaudited)
Security Description | | Shares | | Value | |
Industrials (14.8%): | |
Advanced Drainage Systems, Inc. | | | 25,840 | | | $ | 2,327,409 | | |
Builders FirstSource, Inc. (a) | | | 38,770 | | | | 2,081,949 | | |
Chart Industries, Inc. (a) | | | 20,080 | | | | 3,360,990 | | |
Evoqua Water Technologies Corp. (a) | | | 127,350 | | | | 4,140,148 | | |
Mercury Systems, Inc. (a) | | | 15,360 | | | | 988,109 | | |
Regal Rexnord Corp. | | | 13,090 | | | | 1,485,977 | | |
Trex Co., Inc. (a) | | | 27,350 | | | | 1,488,387 | | |
WillScot Mobile Mini Holdings Corp. (a) | | | 47,580 | | | | 1,542,544 | | |
| | | | 17,415,513 | | |
IT Services (2.5%): | |
Jack Henry & Associates, Inc. | | | 10,500 | | | | 1,890,210 | | |
Shift4 Payments, Inc., Class A (a) | | | 30,590 | | | | 1,011,305 | | |
| | | | 2,901,515 | | |
Materials (1.5%): | |
Sealed Air Corp. | | | 15,600 | | | | 900,432 | | |
Silgan Holdings, Inc. | | | 20,040 | | | | 828,654 | | |
| | | | 1,729,086 | | |
Real Estate (1.2%): | |
National Storage Affiliates Trust | | | 28,740 | | | | 1,439,012 | | |
Semiconductors & Semiconductor Equipment (9.0%): | |
Enphase Energy, Inc. (a) | | | 9,380 | | | | 1,831,351 | | |
Entegris, Inc. | | | 19,480 | | | | 1,794,693 | | |
Lattice Semiconductor Corp. (a) | | | 57,250 | | | | 2,776,625 | | |
MACOM Technology Solutions Holdings, Inc. (a) | | | 70,630 | | | | 3,256,043 | | |
Onto Innovation, Inc. (a) | | | 13,880 | | | | 967,991 | | |
| | | | 10,626,703 | | |
Software (13.4%): | |
ACI Worldwide, Inc. (a) | | | 88,580 | | | | 2,293,336 | | |
Dynatrace, Inc. (a) | | | 51,300 | | | | 2,023,272 | | |
Five9, Inc. (a) | | | 31,270 | | | | 2,849,948 | | |
Globant SA (a) | | | 12,200 | | | | 2,122,800 | | |
Paylocity Holding Corp. (a) | | | 15,400 | | | | 2,686,068 | | |
RingCentral, Inc., Class A (a) | | | 11,300 | | | | 590,538 | | |
Varonis Systems, Inc. (a) | | | 109,880 | | | | 3,221,682 | | |
| | | | 15,787,644 | | |
Total Common Stocks (Cost $121,312,946) | | | 113,328,653 | | |
Total Investments (Cost $121,312,946) — 96.1% | | | 113,328,653 | | |
Other assets in excess of liabilities — 3.9% | | | 4,638,394 | | |
NET ASSETS — 100.00% | | $ | 117,967,047 | | |
(a) Non-income producing security.
PLC — Public Limited Company
See notes to financial statements.
14
Victory Portfolios
Victory RS Mid Cap Growth Fund | | Schedule of Portfolio Investments
June 30, 2022 | |
(Unaudited)
Security Description | | Shares | | Value | |
Common Stocks (98.5%) | |
Communication Services (4.5%): | |
Take-Two Interactive Software, Inc. (a) | | | 31,330 | | | $ | 3,838,865 | | |
ZoomInfo Technologies, Inc. (a) | | | 139,570 | | | | 4,639,307 | | |
| | | | 8,478,172 | | |
Communications Equipment (0.9%): | |
Arista Networks, Inc. (a) | | | 18,640 | | | | 1,747,314 | | |
Consumer Discretionary (15.1%): | |
Chipotle Mexican Grill, Inc. (a) | | | 3,760 | | | | 4,915,298 | | |
Churchill Downs, Inc. | | | 10,830 | | | | 2,074,270 | | |
Dollar Tree, Inc. (a) | | | 10,040 | | | | 1,564,734 | | |
Expedia Group, Inc. (a) | | | 9,810 | | | | 930,282 | | |
Five Below, Inc. (a) | | | 16,000 | | | | 1,814,880 | | |
Hyatt Hotels Corp., Class A (a) | | | 15,650 | | | | 1,156,692 | | |
Mattel, Inc. (a) | | | 154,250 | | | | 3,444,402 | | |
O'Reilly Automotive, Inc. (a) | | | 5,910 | | | | 3,733,702 | | |
Tractor Supply Co. | | | 14,010 | | | | 2,715,839 | | |
Ulta Beauty, Inc. (a) | | | 7,480 | | | | 2,883,390 | | |
YETI Holdings, Inc. (a) | | | 78,920 | | | | 3,414,868 | | |
| | | | 28,648,357 | | |
Consumer Staples (4.1%): | |
Church & Dwight Co., Inc. | | | 29,590 | | | | 2,741,809 | | |
Constellation Brands, Inc., Class A | | | 8,480 | | | | 1,976,349 | | |
Freshpet, Inc. (a) | | | 20,600 | | | | 1,068,934 | | |
The Hershey Co. | | | 9,660 | | | | 2,078,446 | | |
| | | | 7,865,538 | | |
Electronic Equipment, Instruments & Components (3.5%): | |
Keysight Technologies, Inc. (a) | | | 16,340 | | | | 2,252,469 | | |
Teledyne Technologies, Inc. (a) | | | 11,550 | | | | 4,332,520 | | |
| | | | 6,584,989 | | |
Energy (4.3%): | |
Diamondback Energy, Inc. | | | 35,610 | | | | 4,314,151 | | |
Matador Resources Co. | | | 47,480 | | | | 2,212,093 | | |
Pioneer Natural Resources Co. | | | 7,460 | | | | 1,664,177 | | |
| | | | 8,190,421 | | |
Financials (4.1%): | |
LPL Financial Holdings, Inc. | | | 16,140 | | | | 2,977,507 | | |
MSCI, Inc. | | | 7,150 | | | | 2,946,873 | | |
Western Alliance Bancorp | | | 27,200 | | | | 1,920,320 | | |
| | | | 7,844,700 | | |
Health Care (19.4%): | |
AmerisourceBergen Corp. | | | 31,460 | | | | 4,450,961 | | |
Avantor, Inc. (a) | | | 112,860 | | | | 3,509,946 | | |
Charles River Laboratories International, Inc. (a) | | | 8,410 | | | | 1,799,488 | | |
Dexcom, Inc. (a) | | | 51,770 | | | | 3,858,418 | | |
See notes to financial statements.
15
Victory Portfolios
Victory RS Mid Cap Growth Fund | | Schedule of Portfolio Investments — continued
June 30, 2022 | |
(Unaudited)
Security Description | | Shares | | Value | |
Horizon Therapeutics PLC (a) | | | 44,880 | | | $ | 3,579,629 | | |
IDEXX Laboratories, Inc. (a) | | | 2,720 | | | | 953,986 | | |
Incyte Corp. (a) | | | 31,450 | | | | 2,389,256 | | |
Jazz Pharmaceuticals PLC (a) | | | 25,510 | | | | 3,979,815 | | |
ResMed, Inc. | | | 12,970 | | | | 2,718,901 | | |
Tenet Healthcare Corp. (a) | | | 31,250 | | | | 1,642,500 | | |
Veeva Systems, Inc., Class A (a) | | | 17,160 | | | | 3,398,366 | | |
West Pharmaceutical Services, Inc. | | | 14,940 | | | | 4,517,408 | | |
| | | | 36,798,674 | | |
Industrials (8.6%): | |
Advanced Drainage Systems, Inc. | | | 17,470 | | | | 1,573,523 | | |
Axon Enterprise, Inc. (a) | | | 13,250 | | | | 1,234,502 | | |
Builders FirstSource, Inc. (a) | | | 25,800 | | | | 1,385,460 | | |
Carrier Global Corp. | | | 42,460 | | | | 1,514,124 | | |
Chart Industries, Inc. (a) | | | 26,340 | | | | 4,408,789 | | |
Evoqua Water Technologies Corp. (a) | | | 89,960 | | | | 2,924,600 | | |
Regal Rexnord Corp. | | | 19,670 | | | | 2,232,938 | | |
WillScot Mobile Mini Holdings Corp. (a) | | | 35,890 | | | | 1,163,554 | | |
| | | | 16,437,490 | | |
IT Services (4.5%): | |
Block, Inc. (a) | | | 17,150 | | | | 1,054,039 | | |
Gartner, Inc. (a) | | | 13,360 | | | | 3,230,849 | | |
Jack Henry & Associates, Inc. | | | 18,470 | | | | 3,324,970 | | |
Shift4 Payments, Inc., Class A (a) | | | 30,190 | | | | 998,081 | | |
| | | | 8,607,939 | | |
Materials (1.9%): | |
Ball Corp. | | | 21,070 | | | | 1,448,984 | | |
Sealed Air Corp. | | | 38,430 | | | | 2,218,179 | | |
| | | | 3,667,163 | | |
Real Estate (1.2%): | |
Extra Space Storage, Inc. | | | 12,920 | | | | 2,197,950 | | |
Semiconductors & Semiconductor Equipment (7.5%): | |
Enphase Energy, Inc. (a) | | | 13,980 | | | | 2,729,455 | | |
Entegris, Inc. | | | 34,690 | | | | 3,195,990 | | |
Lattice Semiconductor Corp. (a) | | | 72,850 | | | | 3,533,225 | | |
Monolithic Power Systems, Inc. | | | 7,330 | | | | 2,815,013 | | |
Teradyne, Inc. | | | 21,550 | | | | 1,929,802 | | |
| | | | 14,203,485 | | |
Software (18.9%): | |
AppLovin Corp., Class A (a) (b) | | | 48,310 | | | | 1,663,796 | | |
Bill.com Holdings, Inc. (a) | | | 13,540 | | | | 1,488,588 | | |
Datadog, Inc., Class A (a) | | | 49,210 | | | | 4,686,760 | | |
Dropbox, Inc., Class A (a) | | | 149,930 | | | | 3,147,031 | | |
Dynatrace, Inc. (a) | | | 61,420 | | | | 2,422,405 | | |
Five9, Inc. (a) | | | 25,550 | | | | 2,328,627 | | |
Palo Alto Networks, Inc. (a) | | | 8,820 | | | | 4,356,551 | | |
Paycom Software, Inc. (a) | | | 10,180 | | | | 2,851,622 | | |
See notes to financial statements.
16
Victory Portfolios
Victory RS Mid Cap Growth Fund | | Schedule of Portfolio Investments — continued
June 30, 2022 | |
(Unaudited)
Security Description | | Shares | | Value | |
RingCentral, Inc., Class A (a) | | | 18,030 | | | $ | 942,248 | | |
Splunk, Inc. (a) | | | 36,120 | | | | 3,195,175 | | |
Synopsys, Inc. (a) | | | 22,170 | | | | 6,733,029 | | |
Zscaler, Inc. (a) | | | 14,330 | | | | 2,142,478 | | |
| | | | 35,958,310 | | |
Total Common Stocks (Cost $189,975,500) | | | 187,230,502 | | |
Collateral for Securities Loaned (0.9%)^ | |
BlackRock Liquidity Funds TempFund, Institutional Shares, 1.47% (c) | | | 53,559 | | | | 53,559 | | |
Goldman Sachs Financial Square Prime Obligations Fund, Institutional
Shares, 1.42% (c) | | | 26,729 | | | | 26,729 | | |
HSBC U.S. Government Money Market Fund, I Shares, 1.46% (c) | | | 333,362 | | | | 333,362 | | |
JPMorgan Prime Money Market Fund, Capital Shares, 1.50% (c) | | | 213,127 | | | | 213,127 | | |
Morgan Stanley Institutional Liquidity Government Portfolio, Institutional
Shares, 1.39% (c) | | | 142,132 | | | | 142,132 | | |
Morgan Stanley Institutional Liquidity Prime Portfolio, Institutional
Shares, 1.53% (c) | | | 958,262 | | | | 958,262 | | |
Total Collateral for Securities Loaned (Cost $1,727,171) | | | 1,727,171 | | |
Total Investments (Cost $191,702,671) — 99.4% | | | 188,957,673 | | |
Other assets in excess of liabilities — 0.6% | | | 1,132,751 | | |
NET ASSETS — 100.00% | | $ | 190,090,424 | | |
^ Purchased with cash collateral from securities on loan.
(a) Non-income producing security.
(b) All or a portion of this security is on loan.
(c) Rate disclosed is the daily yield on June 30, 2022.
PLC — Public Limited Company
See notes to financial statements.
17
Victory Portfolios
Victory RS Growth Fund | | Schedule of Portfolio Investments
June 30, 2022 | |
(Unaudited)
Security Description | | Shares | | Value | |
Common Stocks (99.8%) | |
Communication Services (8.3%): | |
Alphabet, Inc., Class C (a) | | | 8,821 | | | $ | 19,295,497 | | |
Consumer Discretionary (17.2%): | |
Amazon.com, Inc. (a) | | | 101,500 | | | | 10,780,315 | | |
Booking Holdings, Inc. (a) | | | 2,310 | | | | 4,040,167 | | |
Chipotle Mexican Grill, Inc. (a) | | | 2,060 | | | | 2,692,956 | | |
Dollar Tree, Inc. (a) | | | 19,650 | | | | 3,062,452 | | |
O'Reilly Automotive, Inc. (a) | | | 6,650 | | | | 4,201,204 | | |
Tesla, Inc. (a) | | | 11,080 | | | | 7,461,494 | | |
Tractor Supply Co. | | | 19,350 | | | | 3,750,997 | | |
Ulta Beauty, Inc. (a) | | | 10,250 | | | | 3,951,170 | | |
| | | | 39,940,755 | | |
Consumer Staples (3.8%): | |
Church & Dwight Co., Inc. | | | 35,730 | | | | 3,310,742 | | |
Constellation Brands, Inc., Class A | | | 24,230 | | | | 5,647,044 | | |
| | | | 8,957,786 | | |
Electronic Equipment, Instruments & Components (1.6%): | |
Teledyne Technologies, Inc. (a) | | | 9,700 | | | | 3,638,567 | | |
Energy (2.0%): | |
Diamondback Energy, Inc. | | | 38,180 | | | | 4,625,507 | | |
Financials (2.9%): | |
LPL Financial Holdings, Inc. | | | 13,250 | | | | 2,444,360 | | |
MSCI, Inc. | | | 5,870 | | | | 2,419,321 | | |
The Charles Schwab Corp. | | | 28,690 | | | | 1,812,634 | | |
| | | | 6,676,315 | | |
Health Care (12.5%): | |
Dexcom, Inc. (a) | | | 35,200 | | | | 2,623,456 | | |
Edwards Lifesciences Corp. (a) | | | 28,880 | | | | 2,746,199 | | |
Jazz Pharmaceuticals PLC (a) | | | 35,730 | | | | 5,574,237 | | |
Tenet Healthcare Corp. (a) | | | 34,300 | | | | 1,802,808 | | |
UnitedHealth Group, Inc. | | | 8,000 | | | | 4,109,040 | | |
Vertex Pharmaceuticals, Inc. (a) | | | 30,620 | | | | 8,628,410 | | |
West Pharmaceutical Services, Inc. | | | 11,670 | | | | 3,528,658 | | |
| | | | 29,012,808 | | |
Industrials (1.8%): | |
Deere & Co. | | | 7,460 | | | | 2,234,046 | | |
Generac Holdings, Inc. (a) | | | 9,250 | | | | 1,947,865 | | |
| | | | 4,181,911 | | |
IT Services (8.9%): | |
Block, Inc. (a) | | | 29,890 | | | | 1,837,039 | | |
Fidelity National Information Services, Inc. | | | 20,100 | | | | 1,842,567 | | |
Gartner, Inc. (a) | | | 13,930 | | | | 3,368,692 | | |
Snowflake, Inc., Class A (a) | | | 15,150 | | | | 2,106,759 | | |
Visa, Inc., Class A | | | 58,537 | | | | 11,525,350 | | |
| | | | 20,680,407 | | |
See notes to financial statements.
18
Victory Portfolios
Victory RS Growth Fund | | Schedule of Portfolio Investments — continued
June 30, 2022 | |
(Unaudited)
Security Description | | Shares | | Value | |
Materials (1.4%): | |
Ball Corp. | | | 20,400 | | | $ | 1,402,908 | | |
Sealed Air Corp. | | | 31,660 | | | | 1,827,415 | | |
| | | | 3,230,323 | | |
Real Estate (0.7%): | |
Extra Space Storage, Inc. | | | 9,310 | | | | 1,583,817 | | |
Semiconductors & Semiconductor Equipment (7.5%): | |
Advanced Micro Devices, Inc. (a) | | | 37,520 | | | | 2,869,154 | | |
Lam Research Corp. | | | 9,330 | | | | 3,975,980 | | |
Marvell Technology, Inc. | | | 45,470 | | | | 1,979,309 | | |
Monolithic Power Systems, Inc. | | | 5,940 | | | | 2,281,198 | | |
NVIDIA Corp. | | | 33,260 | | | | 5,041,883 | | |
Teradyne, Inc. | | | 16,120 | | | | 1,443,546 | | |
| | | | 17,591,070 | | |
Software (20.3%): | |
AppLovin Corp., Class A (a) (b) | | | 36,590 | | | | 1,260,160 | | |
Microsoft Corp. | | | 123,600 | | | | 31,744,188 | | |
Palo Alto Networks, Inc. (a) | | | 9,870 | | | | 4,875,188 | | |
ServiceNow, Inc. (a) | | | 13,050 | | | | 6,205,536 | | |
Synopsys, Inc. (a) | | | 10,010 | | | | 3,040,037 | | |
| | | | 47,125,109 | | |
Technology Hardware, Storage & Peripherals (10.9%): | |
Apple, Inc. | | | 185,038 | | | | 25,298,395 | | |
Total Common Stocks (Cost $161,120,831) | | | 231,838,267 | | |
Collateral for Securities Loaned (0.6%)^ | |
BlackRock Liquidity Funds TempFund, Institutional Shares, 1.47% (c) | | | 39,859 | | | | 39,859 | | |
Goldman Sachs Financial Square Prime Obligations Fund, Institutional
Shares, 1.42% (c) | | | 19,891 | | | | 19,891 | | |
HSBC U.S. Government Money Market Fund, I Shares, 1.46% (c) | | | 248,086 | | | | 248,086 | | |
JPMorgan Prime Money Market Fund, Capital Shares, 1.50% (c) | | | 158,608 | | | | 158,608 | | |
Morgan Stanley Institutional Liquidity Government Portfolio, Institutional
Shares, 1.39% (c) | | | 105,774 | | | | 105,774 | | |
Morgan Stanley Institutional Liquidity Prime Portfolio, Institutional
Shares, 1.53% (c) | | | 713,133 | | | | 713,133 | | |
Total Collateral for Securities Loaned (Cost $1,285,351) | | | 1,285,351 | | |
Total Investments (Cost $162,406,182) — 100.4% | | | 233,123,618 | | |
Liabilities in excess of other assets — (0.4)% | | | (760,731 | ) | |
NET ASSETS — 100.00% | | $ | 232,362,887 | | |
^ Purchased with cash collateral from securities on loan.
(a) Non-income producing security.
(b) All or a portion of this security is on loan.
(c) Rate disclosed is the daily yield on June 30, 2022.
PLC — Public Limited Company
See notes to financial statements.
19
Victory Portfolios
Victory RS Science and Technology Fund | | Schedule of Portfolio Investments
June 30, 2022 | |
(Unaudited)
Security Description | | Shares | | Value | |
Common Stocks (99.3%) | |
Biotechnology (22.3%): | |
Albireo Pharma, Inc. (a) (b) | | | 15,750 | | | $ | 312,795 | | |
Alkermes PLC (a) | | | 41,190 | | | | 1,227,050 | | |
Alpha Teknova, Inc. (a) | | | 53,170 | | | | 446,628 | | |
Amicus Therapeutics, Inc. (a) | | | 37,250 | | | | 400,065 | | |
Apellis Pharmaceuticals, Inc. (a) | | | 36,453 | | | | 1,648,405 | | |
Ardelyx, Inc. (a) | | | 202,040 | | | | 119,183 | | |
BioCryst Pharmaceuticals, Inc. (a) | | | 202,960 | | | | 2,147,317 | | |
Bridgebio Pharma, Inc. (a) (b) | | | 58,870 | | | | 534,540 | | |
Cara Therapeutics, Inc. (a) | | | 85,200 | | | | 777,876 | | |
Crinetics Pharmaceuticals, Inc. (a) | | | 71,858 | | | | 1,340,152 | | |
Cytokinetics, Inc. (a) | | | 31,040 | | | | 1,219,562 | | |
DermTech, Inc. (a) (b) | | | 85,743 | | | | 475,016 | | |
Dynavax Technologies Corp. (a) (b) | | | 54,870 | | | | 690,813 | | |
Equillium, Inc. (a) | | | 261,851 | | | | 534,176 | | |
Fate Therapeutics, Inc. (a) | | | 42,540 | | | | 1,054,141 | | |
Fusion Pharmaceuticals, Inc. (a) | | | 87,980 | | | | 219,070 | | |
Halozyme Therapeutics, Inc. (a) | | | 39,670 | | | | 1,745,480 | | |
IGM Biosciences, Inc. (a) (b) | | | 48,830 | | | | 880,405 | | |
Inhibrx, Inc. (a) (b) | | | 60,580 | | | | 687,583 | | |
Iovance Biotherapeutics, Inc. (a) | | | 107,340 | | | | 1,185,034 | | |
Karuna Therapeutics, Inc. (a) | | | 13,330 | | | | 1,686,378 | | |
Kezar Life Sciences, Inc. (a) | | | 170,416 | | | | 1,409,340 | | |
Kinnate Biopharma, Inc. (a) (b) | | | 81,630 | | | | 1,029,354 | | |
Krystal Biotech, Inc. (a) | | | 14,660 | | | | 962,576 | | |
Kura Oncology, Inc. (a) | | | 42,760 | | | | 783,791 | | |
Merus NV (a) (b) | | | 44,920 | | | | 1,016,989 | | |
Mirum Pharmaceuticals, Inc. (a) | | | 36,200 | | | | 704,452 | | |
Nuvalent, Inc., Class A (a) (b) | | | 44,220 | | | | 599,623 | | |
Opthea Ltd., ADR (a) (c) | | | 80,050 | | | | 504,315 | | |
Regulus Therapeutics, Inc. (a) (b) | | | 176,849 | | | | 366,077 | | |
Relay Therapeutics, Inc. (a) | | | 45,550 | | | | 762,962 | | |
Sarepta Therapeutics, Inc. (a) | | | 17,000 | | | | 1,274,320 | | |
Shattuck Labs, Inc. (a) | | | 130,370 | | | | 529,302 | | |
SpringWorks Therapeutics, Inc. (a) | | | 53,550 | | | | 1,318,401 | | |
Vertex Pharmaceuticals, Inc. (a) | | | 37,520 | | | | 10,572,761 | | |
| | | | 41,165,932 | | |
Communication Services (6.8%): | |
Bandwidth, Inc., Class A (a) | | | 36,920 | | | | 694,834 | | |
Chicken Soup For The Soul Entertainment, Inc. (a) (b) | | | 58,010 | | | | 429,854 | | |
IAC/InterActiveCorp (a) | | | 14,130 | | | | 1,073,456 | | |
Match Group, Inc. (a) | | | 36,366 | | | | 2,534,347 | | |
Meta Platforms, Inc., Class A (a) | | | 17,430 | | | | 2,810,587 | | |
Snap, Inc., Class A (a) | | | 75,270 | | | | 988,295 | | |
Take-Two Interactive Software, Inc. (a) | | | 20,600 | | | | 2,524,118 | | |
Vimeo, Inc. (a) | | | 22,137 | | | | 133,265 | | |
ZoomInfo Technologies, Inc. (a) | | | 38,520 | | | | 1,280,405 | | |
| | | | 12,469,161 | | |
See notes to financial statements.
20
Victory Portfolios
Victory RS Science and Technology Fund | | Schedule of Portfolio Investments — continued
June 30, 2022 | |
(Unaudited)
Security Description | | Shares | | Value | |
Consumer Discretionary (6.7%): | |
2U, Inc. (a) | | | 158,470 | | | $ | 1,659,181 | | |
Amazon.com, Inc. (a) | | | 62,600 | | | | 6,648,746 | | |
Arco Platform Ltd., Class A (a) (b) | | | 52,710 | | | | 786,960 | | |
Booking Holdings, Inc. (a) | | | 1,580 | | | | 2,763,404 | | |
Peloton Interactive, Inc., Class A (a) (b) | | | 51,930 | | | | 476,718 | | |
| | | | 12,335,009 | | |
Financials (2.7%): | |
DA32 Life Science Tech Acquisition Corp., Class A (a) (c) | | | 235,925 | | | | 2,286,113 | | |
Omega Alpha SPAC, Class A (a) (b) | | | 90,570 | | | | 892,115 | | |
Panacea Acquisition Corp. II (a) (b) (c) | | | 188,540 | | | | 1,840,150 | | |
| | | | 5,018,378 | | |
Health Care Equipment & Supplies (1.9%): | |
CryoPort, Inc. (a) | | | 48,463 | | | | 1,501,384 | | |
West Pharmaceutical Services, Inc. | | | 6,700 | | | | 2,025,879 | | |
| | | | 3,527,263 | | |
Health Care Providers & Services (0.2%): | |
Science 37 Holdings, Inc. (a) | | | 178,320 | | | | 358,423 | | |
Health Care Technology (1.0%): | |
Veeva Systems, Inc., Class A (a) | | | 9,260 | | | | 1,833,850 | | |
Industrials (0.2%): | |
Enovix Corp. (a) | | | 47,030 | | | | 419,037 | | |
IT Services (4.7%): | |
Backblaze, Inc., Class A (a) | | | 39,210 | | | | 205,068 | | |
GoDaddy, Inc., Class A (a) | | | 39,920 | | | | 2,776,835 | | |
Shift4 Payments, Inc., Class A (a) | | | 28,210 | | | | 932,623 | | |
Visa, Inc., Class A | | | 18,950 | | | | 3,731,065 | | |
Wix.com Ltd. (a) | | | 16,050 | | | | 1,052,078 | | |
| | | | 8,697,669 | | |
Life Sciences Tools & Services (1.0%): | |
Absci Corp. (a) (b) | | | 60,310 | | | | 200,229 | | |
PerkinElmer, Inc. | | | 8,310 | | | | 1,181,848 | | |
Singular Genomics Systems, Inc. (a) (b) | | | 113,280 | | | | 432,730 | | |
| | | | 1,814,807 | | |
Pharmaceuticals (6.1%): | |
Intra-Cellular Therapies, Inc. (a) | | | 59,250 | | | | 3,381,990 | | |
Jazz Pharmaceuticals PLC (a) | | | 28,000 | | | | 4,368,280 | | |
Marinus Pharmaceuticals, Inc. (a) | | | 73,144 | | | | 354,017 | | |
PMV Pharmaceuticals, Inc. (a) (b) | | | 32,310 | | | | 460,418 | | |
Theravance Biopharma, Inc. (a) | | | 43,570 | | | | 394,744 | | |
Tricida, Inc. (a) (b) | | | 115,340 | | | | 1,116,491 | | |
Vaxcyte, Inc. (a) | | | 50,710 | | | | 1,103,450 | | |
| | | | 11,179,390 | | |
See notes to financial statements.
21
Victory Portfolios
Victory RS Science and Technology Fund | | Schedule of Portfolio Investments — continued
June 30, 2022 | |
(Unaudited)
Security Description | | Shares | | Value | |
Semiconductors & Semiconductor Equipment (19.7%): | |
Ambarella, Inc. (a) | | | 38,090 | | | $ | 2,493,371 | | |
Applied Materials, Inc. | | | 20,920 | | | | 1,903,302 | | |
Ichor Holdings Ltd. (a) | | | 11,800 | | | | 306,564 | | |
Impinj, Inc. (a) (b) | | | 86,760 | | | | 5,090,209 | | |
Lam Research Corp. | | | 6,440 | | | | 2,744,406 | | |
Lattice Semiconductor Corp. (a) | | | 74,520 | | | | 3,614,220 | | |
MACOM Technology Solutions Holdings, Inc. (a) | | | 129,340 | | | | 5,962,574 | | |
Marvell Technology, Inc. | | | 52,300 | | | | 2,276,619 | | |
MaxLinear, Inc. (a) | | | 31,030 | | | | 1,054,399 | | |
MKS Instruments, Inc. | | | 35,380 | | | | 3,631,050 | | |
Monolithic Power Systems, Inc. | | | 9,350 | | | | 3,590,774 | | |
NVIDIA Corp. | | | 16,790 | | | | 2,545,196 | | |
SiTime Corp. (a) | | | 7,510 | | | | 1,224,355 | | |
| | | | 36,437,039 | | |
Software (25.6%): | |
AppLovin Corp., Class A (a) (b) | | | 46,860 | | | | 1,613,858 | | |
Avaya Holdings Corp. (a) | | | 160,940 | | | | 360,506 | | |
Datadog, Inc., Class A (a) | | | 15,090 | | | | 1,437,172 | | |
Domo, Inc., Class B (a) | | | 57,360 | | | | 1,594,608 | | |
Dropbox, Inc., Class A (a) | | | 131,480 | | | | 2,759,765 | | |
Dynatrace, Inc. (a) | | | 44,020 | | | | 1,736,149 | | |
Fair Isaac Corp. (a) | | | 6,670 | | | | 2,674,003 | | |
Gitlab, Inc., Class A (a) (b) | | | 25,560 | | | | 1,358,258 | | |
Microsoft Corp. | | | 70,470 | | | | 18,098,810 | | |
Monday.com Ltd. (a) (b) | | | 15,970 | | | | 1,647,465 | | |
Paycom Software, Inc. (a) | | | 12,370 | | | | 3,465,084 | | |
RingCentral, Inc., Class A (a) | | | 6,990 | | | | 365,298 | | |
ServiceNow, Inc. (a) | | | 11,330 | | | | 5,387,642 | | |
Sprout Social, Inc., Class A (a) | | | 21,830 | | | | 1,267,668 | | |
Varonis Systems, Inc. (a) | | | 119,540 | | | | 3,504,913 | | |
| | | | 47,271,199 | | |
Software & Tech Services (0.4%): | |
HashiCorp., Inc., Class A (a) (b) | | | 27,020 | | | | 795,469 | | |
Total Common Stocks (Cost $161,684,636) | | | 183,322,626 | | |
Warrants (0.0%) (d) | |
Health Care (0.0%): | |
Nuvation Bio, Inc. | | | 45,320 | | | | 12,690 | | |
| Regulus Therapeutics, Inc. (a) (c) (e) (f) | | | 132,636 | | | | — | | |
| | | | 12,690 | | |
Total Warrants (Cost $165,796) | | | 12,690 | | |
Collateral for Securities Loaned (8.7%)^ | |
BlackRock Liquidity Funds TempFund, Institutional Shares, 1.47% (g) | | | 497,146 | | | | 497,146 | | |
Goldman Sachs Financial Square Prime Obligations Fund, Institutional
Shares, 1.42% (g) | | | 248,100 | | | | 248,100 | | |
See notes to financial statements.
22
Victory Portfolios
Victory RS Science and Technology Fund | | Schedule of Portfolio Investments — continued
June 30, 2022 | |
(Unaudited)
Security Description | | Shares | | Value | |
HSBC U.S. Government Money Market Fund I Shares, 1.46% (g) | | | 3,094,313 | | | $ | 3,094,313 | | |
JPMorgan Prime Money Market Fund, Capital Shares, 1.50% (g) | | | 1,978,276 | | | | 1,978,276 | | |
Morgan Stanley Institutional Liquidity Government Portfolio, Institutional
Shares, 1.39% (g) | | | 1,319,287 | | | | 1,319,287 | | |
Morgan Stanley Institutional Liquidity Prime Portfolio, Institutional
Shares, 1.53% (g) | | | 8,894,716 | | | | 8,894,716 | | |
Total Collateral for Securities Loaned (Cost $16,031,838) | | | 16,031,838 | | |
Total Investments (Cost $177,882,270) — 108.0% | | | 199,367,154 | | |
Liabilities in excess of other assets — (8.0)% | | | (14,725,069 | ) | |
NET ASSETS — 100.00% | | $ | 184,642,085 | | |
^ Purchased with cash collateral from securities on loan.
(a) Non-income producing security.
(b) All or a portion of this security is on loan.
(c) The Fund's Adviser has deemed this security to be illiquid based upon procedures approved by the Board of Trustees. As of June 30, 2022, illiquid securities were 2.5% of net assets.
(d) Amount represents less than 0.05% of net assets.
(e) Restricted security that is not registered under the Securities Act of 1933.
(f) The following table details the acquisition date and cost of the Fund's restricted securities at June 30, 2022:
Security Name | | Acquisition
Date | | Cost | |
Regulus Therapeutics, Inc. | | 12/3/2020 | | $ | 165,796 | | |
(g) Rate disclosed is the daily yield on June 30, 2022.
ADR — American Depositary Receipt
PLC — Public Limited Company
See notes to financial statements.
23
Victory Portfolios
Victory RS Small Cap Equity Fund | | Schedule of Portfolio Investments
June 30, 2022 | |
(Unaudited)
Security Description | | Shares | | Value | |
Common Stocks (97.3%) | |
Consumer Discretionary (7.2%): | |
Acushnet Holdings Corp. (a) | | | 38,660 | | | $ | 1,611,349 | | |
YETI Holdings, Inc. (b) | | | 29,020 | | | | 1,255,695 | | |
| | | | 2,867,044 | | |
Consumer Staples (5.2%): | |
e.l.f. Beauty, Inc. (b) | | | 36,090 | | | | 1,107,241 | | |
The Simply Good Foods Co. (b) | | | 25,690 | | | | 970,312 | | |
| | | | 2,077,553 | | |
Financials (11.6%): | |
Customers Bancorp, Inc. (b) | | | 23,050 | | | | 781,395 | | |
Green Dot Corp., Class A (b) | | | 44,250 | | | | 1,111,117 | | |
PRA Group, Inc. (b) | | | 29,850 | | | | 1,085,346 | | |
Trupanion, Inc. (a) (b) | | | 26,750 | | | | 1,611,955 | | |
| | | | 4,589,813 | | |
Health Care (14.4%): | |
Apellis Pharmaceuticals, Inc. (b) | | | 12,600 | | | | 569,772 | | |
BioCryst Pharmaceuticals, Inc. (b) | | | 51,140 | | | | 541,061 | | |
CryoPort, Inc. (b) | | | 16,300 | | | | 504,974 | | |
Fate Therapeutics, Inc. (b) | | | 15,550 | | | | 385,329 | | |
Halozyme Therapeutics, Inc. (b) | | | 17,750 | | | | 781,000 | | |
Inspire Medical Systems, Inc. (b) | | | 3,630 | | | | 663,092 | | |
Intra-Cellular Therapies, Inc. (b) | | | 14,530 | | | | 829,372 | | |
Karuna Therapeutics, Inc. (b) | | | 5,600 | | | | 708,456 | | |
Shockwave Medical, Inc. (b) | | | 3,780 | | | | 722,623 | | |
| | | | 5,705,679 | | |
Industrials (24.9%): | |
Ameresco, Inc., Class A (b) | | | 11,960 | | | | 544,897 | | |
Axon Enterprise, Inc. (b) | | | 9,810 | | | | 913,998 | | |
Bloom Energy Corp., Class A (b) | | | 31,650 | | | | 522,225 | | |
CBIZ, Inc. (b) | | | 31,990 | | | | 1,278,320 | | |
ChargePoint Holdings, Inc. (a) (b) | | | 26,220 | | | | 358,952 | | |
Chart Industries, Inc. (b) | | | 12,960 | | | | 2,169,245 | | |
Evoqua Water Technologies Corp. (b) | | | 82,260 | | | | 2,674,273 | | |
Kornit Digital Ltd. (b) | | | 13,950 | | | | 442,215 | | |
Zurn Water Solutions Corp. | | | 35,670 | | | | 971,651 | | |
| | | | 9,875,776 | | |
IT Services (16.6%): | |
DigitalOcean Holdings, Inc. (a) (b) | | | 8,710 | | | | 360,245 | | |
Evo Payments, Inc., Class A (b) | | | 21,950 | | | | 516,264 | | |
Flywire Corp. (b) | | | 68,920 | | | | 1,215,060 | | |
Marqeta, Inc., Class A (b) | | | 123,170 | | | | 998,909 | | |
Paya Holdings, Inc. (b) | | | 130,810 | | | | 859,422 | | |
Paymentus Holdings, Inc., Class A (a) (b) | | | 63,330 | | | | 846,722 | | |
Shift4 Payments, Inc., Class A (b) | | | 54,390 | | | | 1,798,133 | | |
| | | | 6,594,755 | | |
See notes to financial statements.
24
Victory Portfolios
Victory RS Small Cap Equity Fund | | Schedule of Portfolio Investments — continued
June 30, 2022 | |
(Unaudited)
Security Description | | Shares | | Value | |
Materials (2.7%): | |
Livent Corp. (b) | | | 47,180 | | | $ | 1,070,514 | | |
Semiconductors & Semiconductor Equipment (7.9%): | |
Impinj, Inc. (a) (b) | | | 21,400 | | | | 1,255,538 | | |
MACOM Technology Solutions Holdings, Inc. (b) | | | 27,920 | | | | 1,287,112 | | |
SiTime Corp. (b) | | | 3,750 | | | | 611,363 | | |
| | | | 3,154,013 | | |
Software (6.8%): | |
ACI Worldwide, Inc. (b) | | | 59,780 | | | | 1,547,704 | | |
Q2 Holdings, Inc. (b) | | | 20,450 | | | | 788,756 | | |
Varonis Systems, Inc. (b) | | | 12,780 | | | | 374,710 | | |
| | | | 2,711,170 | | |
Total Common Stocks (Cost $44,704,019) | | | 38,646,317 | | |
Collateral for Securities Loaned (7.6%)^ | |
BlackRock Liquidity Funds TempFund, Institutional Shares, 1.47% (c) | | | 93,131 | | | | 93,131 | | |
Goldman Sachs Financial Square Prime Obligations Fund, Institutional
Shares, 1.42% (c) | | | 46,477 | | | | 46,477 | | |
HSBC U.S. Government Money Market Fund I Shares, 1.46% (c) | | | 579,660 | | | | 579,660 | | |
JPMorgan Prime Money Market Fund, Capital Shares, 1.50% (c) | | | 370,592 | | | | 370,592 | | |
Morgan Stanley Institutional Liquidity Government Portfolio, Institutional
Shares, 1.39% (c) | | | 247,143 | | | | 247,143 | | |
Morgan Stanley Institutional Liquidity Prime Portfolio, Institutional
Shares, 1.53% (c) | | | 1,666,254 | | | | 1,666,254 | | |
Total Collateral for Securities Loaned (Cost $3,003,257) | | | 3,003,257 | | |
Total Investments (Cost $47,707,276) — 104.9% | | | 41,649,574 | | |
Liabilities in excess of other assets — (4.9)% | | | (1,929,460 | ) | |
NET ASSETS — 100.00% | | $ | 39,720,114 | | |
^ Purchased with cash collateral from securities on loan.
(a) All or a portion of this security is on loan.
(b) Non-income producing security.
(c) Rate disclosed is the daily yield on June 30, 2022.
See notes to financial statements.
25
Victory Portfolios | | Statements of Assets and Liabilities
June 30, 2022 | |
(Unaudited)
| | | Victory
RS Small Cap
Growth Fund | | Victory
RS Select
Growth Fund | | Victory
RS Mid Cap
Growth Fund | |
Assets: | |
Investments, at value (Cost $1,147,160,667,
$121,312,946 and $191,702,671) | | $ | 1,100,975,937 | (a) | | $ | 113,328,653 | | | $ | 188,957,673 | (b) | |
Cash | | | 22,722,543 | | | | 2,785,203 | | | | 4,997,003 | | |
Receivables: | |
Interest and dividends | | | 92,633 | | | | 4,674 | | | | 21,840 | | |
Capital shares issued | | | 1,079,027 | | | | 22,289 | | | | 19,149 | | |
Investments sold | | | 24,542,649 | | | | 3,312,427 | | | | 2,423,329 | | |
From Adviser | | | 109,011 | | | | 32,595 | | | | 69,306 | | |
Prepaid expenses | | | 47,907 | | | | 33,341 | | | | 38,537 | | |
Total Assets | | | 1,149,569,707 | | | | 119,519,182 | | | | 196,526,837 | | |
Liabilities: | |
Payables: | |
Collateral received on loaned securities | | | 56,345,523 | | | | — | | | | 1,727,171 | | |
Investments purchased | | | 16,477,369 | | | | 1,297,101 | | | | 3,361,329 | | |
Capital shares redeemed | | | 6,394,425 | | | | 75,197 | | | | 1,042,470 | | |
Accrued expenses and other payables: | |
Investment advisory fees | | | 872,446 | | | | 101,713 | | | | 144,049 | | |
Administration fees | | | 50,492 | | | | 5,518 | | | | 9,292 | | |
Custodian fees | | | 30,435 | | | | 1,779 | | | | 4,540 | | |
Transfer agent fees | | | 428,858 | | | | 47,422 | | | | 102,866 | | |
Compliance fees | | | 660 | | | | 72 | | | | 131 | | |
Trustees' fees | | | 668 | | | | — | | | | — | | |
| 12b-1 fees | | | 38,985 | | | | 9,509 | | | | 7,923 | | |
Other accrued expenses | | | 96,043 | | | | 13,824 | | | | 36,642 | | |
Total Liabilities | | | 80,735,904 | | | | 1,552,135 | | | | 6,436,413 | | |
Net Assets: | |
Capital | | | 1,359,922,452 | | | | 104,835,831 | | | | 209,543,201 | | |
Total accumulated earnings/(loss) | | | (291,088,649 | ) | | | 13,131,216 | | | | (19,452,777 | ) | |
Net Assets | | $ | 1,068,833,803 | | | $ | 117,967,047 | | | $ | 190,090,424 | | |
Net Assets | |
Class A | | $ | 349,573,623 | | | $ | 75,269,801 | | | $ | 52,410,575 | | |
Class C | | | 6,070,734 | | | | 4,069,057 | | | | 5,785,257 | | |
Class R | | | 2,912,974 | | | | 360,317 | | | | 386,925 | | |
Class R6 | | | 272,997,889 | | | | 665,455 | | | | 5,115,996 | | |
Class Y | | | 437,278,583 | | | | 37,602,417 | | | | 125,299,198 | | |
Member Class | | | — | | | | — | | | | 1,092,473 | | |
Total | | $ | 1,068,833,803 | | | $ | 117,967,047 | | | $ | 190,090,424 | | |
Shares (unlimited number of shares authorized
with a par value of $0.001 per share): | |
Class A | | | 7,534,855 | | | | 3,608,596 | | | | 3,214,092 | | |
Class C | | | 170,308 | | | | 295,487 | | | | 456,397 | | |
Class R | | | 72,862 | | | | 25,012 | | | | 27,752 | | |
Class R6 | | | 5,456,666 | | | | 28,714 | | | | 293,121 | | |
Class Y | | | 8,784,959 | | | | 1,636,611 | | | | 7,191,273 | | |
Member Class | | | — | | | | — | | | | 66,751 | | |
Total | | | 22,019,650 | | | | 5,594,420 | | | | 11,249,386 | | |
Net asset value, offering (except Class A)
and redemption price per share: | |
Class A | | $ | 46.39 | | | $ | 20.86 | | | $ | 16.31 | | |
Class C (c) | | | 35.65 | | | | 13.77 | | | | 12.68 | | |
Class R | | | 39.98 | | | | 14.41 | | | | 13.94 | | |
Class R6 | | | 50.03 | | | | 23.18 | | | | 17.45 | | |
Class Y | | | 49.78 | | | | 22.98 | | | | 17.42 | | |
Member Class | | | — | | | | — | | | | 16.37 | | |
Maximum Sales Charge — Class A | | | 5.75 | % | | | 5.75 | % | | | 5.75 | % | |
Maximum offering price
(100%/(100%-maximum sales charge) of
net asset value adjusted to the nearest cent)
per share — Class A | | $ | 49.22 | | | $ | 22.13 | | | $ | 17.31 | | |
(a) Includes $53,491,274 of securities on loan.
(b) Includes $1,632,835 of securities on loan.
(c) Redemption price per share varies by the length of time shares are held.
See notes to financial statements.
26
Victory Portfolios | | Statements of Assets and Liabilities
June 30, 2022 | |
(Unaudited)
| | | Victory
RS Growth Fund | | Victory
RS Science and
Technology Fund | | Victory
RS Small Cap
Equity Fund | |
Assets: | |
Investments, at value (Cost $162,406,182,
$177,882,270 and $47,707,276) | | $ | 233,123,618 | (a) | | $ | 199,367,154 | (b) | | $ | 41,649,574 | (c) | |
Cash | | | 1,737,458 | | | | 2,114,015 | | | | 1,040,324 | | |
Receivables: | |
Interest and dividends | | | 27,930 | | | | 35,308 | | | | 1,991 | | |
Capital shares issued | | | 3,656 | | | | 33,050 | | | | 1,381 | | |
Investments sold | | | 3,302,848 | | | | 1,238,592 | | | | 225,704 | | |
From Adviser | | | 45,932 | | | | 7,449 | | | | 7,941 | | |
Prepaid expenses | | | 21,142 | | | | 26,466 | | | | 32,767 | | |
Total Assets | | | 238,262,584 | | | | 202,822,034 | | | | 42,959,682 | | |
Liabilities: | |
Payables: | |
Collateral received on loaned securities | | | 1,285,351 | | | | 16,031,838 | | | | 3,003,257 | | |
Investments purchased | | | 4,270,328 | | | | 1,787,901 | | | | 178,512 | | |
Capital shares redeemed | | | 97,226 | | | | 67,959 | | | | 3,518 | | |
Accrued expenses and other payables: | |
Investment advisory fees | | | 148,365 | | | | 155,601 | | | | 25,102 | | |
Administration fees | | | 10,695 | | | | 8,467 | | | | 1,809 | | |
Custodian fees | | | 2,611 | | | | 6,948 | | | | 790 | | |
Transfer agent fees | | | 48,671 | | | | 82,006 | | | | 15,957 | | |
Compliance fees | | | 147 | | | | 111 | | | | 24 | | |
| 12b-1 fees | | | 22,191 | | | | 16,821 | | | | 3,931 | | |
Other accrued expenses | | | 14,112 | | | | 22,297 | | | | 6,668 | | |
Total Liabilities | | | 5,899,697 | | | | 18,179,949 | | | | 3,239,568 | | |
Net Assets: | |
Capital | | | 165,218,119 | | | | 187,322,904 | | | | 61,427,210 | | |
Total accumulated earnings/(loss) | | | 67,144,768 | | | | (2,680,819 | ) | | | (21,707,096 | ) | |
Net Assets | | $ | 232,362,887 | | | $ | 184,642,085 | | | $ | 39,720,114 | | |
Net Assets | |
Class A | | $ | 209,882,837 | | | $ | 141,315,337 | | | $ | 34,914,419 | | |
Class C | | | 905,537 | | | | 5,389,912 | | | | 172,790 | | |
Class R | | | 386,911 | | | | 588,630 | | | | 1,498,950 | | |
Class Y | | | 21,187,602 | | | | 37,348,206 | | | | 1,930,490 | | |
Member Class | | | — | | | | — | | | | 1,203,465 | | |
Total | | $ | 232,362,887 | | | $ | 184,642,085 | | | $ | 39,720,114 | | |
Shares (unlimited number of shares authorized
with a par value of $0.001 per share): | |
Class A | | | 11,391,793 | | | | 8,570,396 | | | | 4,262,696 | | |
Class C | | | 64,716 | | | | 477,383 | | | | 20,905 | | |
Class R | | | 24,251 | | | | 45,175 | | | | 290,329 | | |
Class Y | | | 1,083,876 | | | | 2,036,152 | | | | 224,238 | | |
Member Class | | | — | | | | — | | | | 146,524 | | |
Total | | | 12,564,636 | | | | 11,129,106 | | | | 4,944,692 | | |
Net asset value, offering (except Class A)
and redemption price per share: | |
Class A | | $ | 18.42 | | | $ | 16.49 | | | $ | 8.19 | | |
Class C (d) | | | 13.99 | | | | 11.29 | | | | 8.27 | | |
Class R | | | 15.95 | | | | 13.03 | | | | 5.16 | | |
Class Y | | | 19.55 | | | | 18.34 | | | | 8.61 | | |
Member Class | | | — | | | | — | | | | 8.21 | | |
Maximum Sales Charge — Class A | | | 5.75 | % | | | 5.75 | % | | | 5.75 | % | |
Maximum offering price
(100%/(100%-maximum sales charge) of
net asset value adjusted to the nearest cent)
per share — Class A | | $ | 19.54 | | | $ | 17.50 | | | $ | 8.69 | | |
(a) Includes $1,215,147 of securities on loan.
(b) Includes $15,510,403 of securities on loan.
(c) Includes $2,916,343 of securities on loan.
(d) Redemption price per share varies by the length of time shares are held.
See notes to financial statements.
27
Victory Portfolios | | Statements of Operations
For the Six Months Ended June 30, 2022 | |
(Unaudited)
| | | Victory
RS Small Cap
Growth Fund | | Victory
RS Select
Growth Fund | | Victory
RS Mid Cap
Growth Fund | |
Investment Income: | | | |
Dividends | | $ | 2,522,403 | | | $ | 256,240 | | | $ | 515,018 | | |
Interest | | | 7,403 | | | | 581 | | | | 2,022 | | |
Securities lending (net of fees) | | | 43,376 | | | | 538 | | | | 3,638 | | |
Total Income | | | 2,573,182 | | | | 257,359 | | | | 520,678 | | |
Expenses: | | | |
Investment advisory fees | | | 7,142,077 | | | | 753,862 | | | | 1,102,582 | | |
Administration fees | | | 406,093 | | | | 40,725 | | | | 70,072 | | |
Sub-Administration fees | | | 8,428 | | | | 8,428 | | | | 8,428 | | |
| 12b-1 fees — Class A | | | 572,117 | | | | 115,095 | | | | 82,830 | | |
| 12b-1 fees — Class C | | | 39,177 | | | | 30,415 | | | | 41,715 | | |
| 12b-1 fees — Class R | | | 9,029 | | | | 1,087 | | | | 1,151 | | |
Custodian fees | | | 54,007 | | | | 4,697 | | | | 8,974 | | |
Transfer agent fees — Class A | | | 380,996 | | | | 62,936 | | | | 53,361 | | |
Transfer agent fees — Class C | | | 6,137 | | | | 5,662 | | | | 4,632 | | |
Transfer agent fees — Class R | | | 4,379 | | | | 489 | | | | 405 | | |
Transfer agent fees — Class R6 | | | 15,715 | | | | 107 | | | | 380 | | |
Transfer agent fees — Class Y | | | 468,843 | | | | 28,830 | | | | 150,747 | | |
Transfer agent fees — Member Class | | | — | | | | — | | | | 777 | | |
Trustees' fees | | | 52,456 | | | | 5,581 | | | | 9,749 | | |
Compliance fees | | | 6,019 | | | | 578 | | | | 1,039 | | |
Legal and audit fees | | | 45,327 | | | | 7,891 | | | | 10,970 | | |
State registration and filing fees | | | 50,985 | | | | 29,408 | | | | 41,331 | | |
Line of credit fees | | | — | | | | — | | | | 7,431 | | |
Interfund lending fees | | | 4,922 | | | | — | | | | 618 | | |
Other expenses | | | 98,176 | | | | 14,662 | | | | 32,534 | | |
Recoupment of prior expenses waived/reimbursed
by Adviser | | | 143 | | | | 105 | | | | 101 | | |
Total Expenses | | | 9,365,026 | | | | 1,110,558 | | | | 1,629,827 | | |
Expenses waived/reimbursed by Adviser | | | (359,869 | ) | | | (101,407 | ) | | | (261,278 | ) | |
Net Expenses | | | 9,005,157 | | | | 1,009,151 | | | | 1,368,549 | | |
Net Investment Income (Loss) | | | (6,431,975 | ) | | | (751,792 | ) | | | (847,871 | ) | |
Realized/Unrealized Gains (Losses) from
Investments: | | | |
Net realized gains (losses) from investment
securities | | | (244,848,803 | ) | | | (7,417,928 | ) | | | (10,515,439 | ) | |
Net change in unrealized appreciation/depreciation
on investment securities | | | (488,834,584 | ) | | | (54,899,049 | ) | | | (104,113,665 | ) | |
Net realized/unrealized gains (losses)
on investments | | | (733,683,387 | ) | | | (62,316,977 | ) | | | (114,629,104 | ) | |
Change in net assets resulting from operations | | $ | (740,115,362 | ) | | $ | (63,068,769 | ) | | $ | (115,476,975 | ) | |
See notes to financial statements.
28
Victory Portfolios | | Statements of Operations
For the Six Months Ended June 30, 2022 | |
(Unaudited)
| | | Victory
RS Growth Fund | | Victory
RS Science and
Technology Fund | | Victory
RS Small Cap
Equity Fund | |
Investment Income: | | | |
Dividends | | $ | 738,798 | | | $ | 219,298 | | | $ | 20,538 | | |
Interest | | | 1,334 | | | | 2,723 | | | | 267 | | |
Securities lending (net of fees) | | | 708 | | | | 99,104 | | | | 5,124 | | |
Total Income | | | 740,840 | | | | 321,125 | | | | 25,929 | | |
Expenses: | | | |
Investment advisory fees | | | 1,044,222 | | | | 1,195,252 | | | | 186,150 | | |
Administration fees | | | 75,220 | | | | 64,568 | | | | 13,408 | | |
Sub-Administration fees | | | 8,155 | | | | 8,428 | | | | 6,703 | | |
| 12b-1 fees — Class A | | | 312,850 | | | | 224,042 | | | | 54,831 | | |
| 12b-1 fees — Class C | | | 6,090 | | | | 36,650 | | | | 1,226 | | |
| 12b-1 fees — Class R | | | 1,098 | | | | 1,816 | | | | 4,949 | | |
Custodian fees | | | 7,149 | | | | 10,581 | | | | 2,349 | | |
Transfer agent fees — Class A | | | 108,821 | | | | 120,342 | | | | 26,256 | | |
Transfer agent fees — Class C | | | 880 | | | | 6,175 | | | | 309 | | |
Transfer agent fees — Class R | | | 503 | | | | 1,151 | | | | 2,619 | | |
Transfer agent fees — Class Y | | | 10,840 | | | | 40,560 | | | | 743 | | |
Transfer agent fees — Member Class | | | — | | | | — | | | | 1,854 | | |
Trustees' fees | | | 9,236 | | | | 8,739 | | | | 2,339 | | |
Compliance fees | | | 1,041 | | | | 941 | | | | 192 | | |
Legal and audit fees | | | 11,541 | | | | 10,308 | | | | 5,058 | | |
State registration and filing fees | | | 21,689 | | | | 28,637 | | | | 32,647 | | |
Other expenses | | | 13,572 | | | | 12,404 | | | | 7,597 | | |
Recoupment of prior expenses waived/reimbursed
by Adviser | | | 290 | | | | 391 | | | | 227 | | |
Total Expenses | | | 1,633,197 | | | | 1,770,985 | | | | 349,457 | | |
Expenses waived/reimbursed by Adviser | | | (134,294 | ) | | | (30,405 | ) | | | (22,509 | ) | |
Net Expenses | | | 1,498,903 | | | | 1,740,580 | | | | 326,948 | | |
Net Investment Income (Loss) | | | (758,063 | ) | | | (1,419,455 | ) | | | (301,019 | ) | |
Realized/Unrealized Gains (Losses) from
Investments: | | | |
Net realized gains (losses) from investment
securities | | | (5,578,437 | ) | | | (23,989,002 | ) | | | (18,691,046 | ) | |
Net change in unrealized appreciation/depreciation
on investment securities | | | (93,846,979 | ) | | | (114,414,143 | ) | | | (6,713,477 | ) | |
Net realized/unrealized gains (losses) on
investments | | | (99,425,416 | ) | | | (138,403,145 | ) | | | (25,404,523 | ) | |
Change in net assets resulting from operations | | $ | (100,183,479 | ) | | $ | (139,822,600 | ) | | $ | (25,705,542 | ) | |
See notes to financial statements.
29
Victory Portfolios | | Statements of Changes in Net Assets | |
| | | Victory
RS Small Cap Growth Fund | | Victory
RS Select Growth Fund | | Victory
RS Mid Cap Growth Fund | |
| | | Six
Months
Ended
June 30,
2022
(Unaudited) | | Year
Ended
December 31,
2021 | | Six
Months
Ended
June 30,
2022
(Unaudited) | | Year
Ended
December 31,
2021 | | Six
Months
Ended
June 30,
2022
(Unaudited) | | Year
Ended
December 31,
2021 | |
From Investment
Activities: | |
Operations: | |
Net Investment
Income (Loss) | | $ | (6,431,975 | ) | | $ | (29,372,395 | ) | | $ | (751,792 | ) | | $ | (2,675,366 | ) | | $ | (847,871 | ) | | $ | (4,087,360 | ) | |
Net realized gains
(losses) from
investments | | | (244,848,803 | ) | | | 337,188,044 | | | | (7,417,928 | ) | | | 49,019,375 | | | | (10,515,439 | ) | | | 141,961,315 | | |
Net change in
unrealized
appreciation/
depreciation
on investments | | | (488,834,584 | ) | | | (616,704,361 | ) | | | (54,899,049 | ) | | | (30,101,172 | ) | | | (104,113,665 | ) | | | (112,254,382 | ) | |
Change in net assets
resulting from
operations | | | (740,115,362 | ) | | | (308,888,712 | ) | | | (63,068,769 | ) | | | 16,242,837 | | | | (115,476,975 | ) | | | 25,619,573 | | |
Distributions to Shareholders: | |
Class A | | | — | | | | (93,199,400 | ) | | | — | | | | (26,927,629 | ) | | | — | | | | (26,057,513 | ) | |
Class C | | | — | | | | (2,137,568 | ) | | | — | | | | (3,086,031 | ) | | | — | | | | (4,637,294 | ) | |
Class R | | | — | | | | (815,659 | ) | | | — | | | | (117,749 | ) | | | — | | | | (194,304 | ) | |
Class R6 | | | — | | | | (88,002,280 | ) | | | — | | | | (257,285 | ) | | | — | | | | (6,204,984 | ) | |
Class Y | | | — | | | | (137,845,800 | ) | | | — | | | | (15,262,714 | ) | | | — | | | | (88,979,683 | ) | |
Member Class | | | — | | | | — | | | | — | | | | — | | | | — | | | | (223,742 | ) | |
Change in net assets
resulting from
distributions to
shareholders | | | — | | | | (322,000,707 | ) | | | — | | | | (45,651,408 | ) | | | — | | | | (126,297,520 | ) | |
Change in net assets
resulting from
capital transactions | | | (438,582,718 | ) | | | (58,863,607 | ) | | | (17,647,133 | ) | | | (5,812,343 | ) | | | (65,222,252 | ) | | | (133,837,034 | ) | |
Change in net assets | | | (1,178,698,080 | ) | | | (689,753,026 | ) | | | (80,715,902 | ) | | | (35,220,914 | ) | | | (180,699,227 | ) | | | (234,514,981 | ) | |
Net Assets: | |
Beginning of period | | | 2,247,531,883 | | | | 2,937,284,909 | | | | 198,682,949 | | | | 233,903,863 | | | | 370,789,651 | | | | 605,304,632 | | |
End of period | | $ | 1,068,833,803 | | | $ | 2,247,531,883 | | | $ | 117,967,047 | | | $ | 198,682,949 | | | $ | 190,090,424 | | | $ | 370,789,651 | | |
(continues on next page)
See notes to financial statements.
30
Victory Portfolios | | Statements of Changes in Net Assets | |
(continued)
| | | Victory
RS Small Cap Growth Fund | | Victory
RS Select Growth Fund | | Victory
RS Mid Cap Growth Fund | |
| | | Six
Months
Ended
June 30,
2022
(Unaudited) | | Year
Ended
December 31,
2021 | | Six
Months
Ended
June 30,
2022
(Unaudited) | | Year
Ended
December 31,
2021 | | Six
Months
Ended
June 30,
2022
(Unaudited) | | Year
Ended
December 31,
2021 | |
Capital Transactions: | |
Class A | |
Proceeds from
shares issued | | $ | 23,241,312 | | | $ | 89,844,368 | | | $ | 4,260,033 | | | $ | 17,921,964 | | | $ | 2,362,709 | | | $ | 6,325,210 | | |
Distributions
reinvested | | | — | | | | 89,403,944 | | | | — | | | | 25,918,091 | | | | — | | | | 24,440,661 | | |
Cost of shares
redeemed | | | (84,184,140 | ) | | | (186,733,595 | ) | | | (7,630,547 | ) | | | (22,842,642 | ) | | | (9,097,134 | ) | | | (13,937,984 | ) | |
Total Class A | | $ | (60,942,828 | ) | | $ | (7,485,283 | ) | | $ | (3,370,514 | ) | | $ | 20,997,413 | | | $ | (6,734,425 | ) | | $ | 16,827,887 | | |
Class C | |
Proceeds from
shares issued | | $ | 464,373 | | | $ | 2,244,719 | | | $ | 80,717 | | | $ | 306,365 | | | $ | 25,181 | | | $ | 259,376 | | |
Distributions
reinvested | | | — | | | | 2,073,757 | | | | — | | | | 3,077,902 | | | | — | | | | 4,489,037 | | |
Cost of shares
redeemed | | | (1,900,739 | ) | | | (9,438,427 | ) | | | (3,188,289 | ) | | | (15,624,585 | ) | | | (2,581,354 | ) | | | (6,018,465 | ) | |
Total Class C | | $ | (1,436,366 | ) | | $ | (5,119,951 | ) | | $ | (3,107,572 | ) | | $ | (12,240,318 | ) | | $ | (2,556,173 | ) | | $ | (1,270,052 | ) | |
Class R | |
Proceeds from
shares issued | | $ | 448,155 | | | $ | 2,591,119 | | | $ | 183,599 | | | $ | 57,546 | | | $ | 17,619 | | | $ | 38,547 | | |
Distributions
reinvested | | | — | | | | 815,659 | | | | — | | | | 102,008 | | | | — | | | | 194,304 | | |
Cost of shares
redeemed | | | (836,182 | ) | | | (5,227,473 | ) | | | (44,858 | ) | | | (172,852 | ) | | | (39,351 | ) | | | (49,826 | ) | |
Total Class R | | $ | (388,027 | ) | | $ | (1,820,695 | ) | | $ | 138,741 | | | $ | (13,298 | ) | | $ | (21,732 | ) | | $ | 183,025 | | |
Class R6 | |
Proceeds from
shares issued | | $ | 74,931,308 | | | $ | 253,929,075 | | | $ | 28,938 | | | $ | 694,851 | | | $ | 563,827 | | | $ | 6,226,411 | | |
Distributions
reinvested | | | — | | | | 58,606,415 | | | | — | | | | 203,176 | | | | — | | | | 2,271,808 | | |
Cost of shares
redeemed | | | (233,063,899 | ) | | | (210,549,047 | ) | | | (225,628 | ) | | | (204,355 | ) | | | (11,033,168 | ) | | | (11,402,846 | ) | |
Total Class R6 | | $ | (158,132,591 | ) | | $ | 101,986,443 | | | $ | (196,690 | ) | | $ | 693,672 | | | $ | (10,469,341 | ) | | $ | (2,904,627 | ) | |
Class Y | |
Proceeds from
shares issued | | $ | 84,048,779 | | | $ | 289,808,108 | | | $ | 2,258,910 | | | $ | 8,159,436 | | | $ | 18,086,889 | | | $ | 46,902,971 | | |
Distributions
reinvested | | | — | | | | 125,873,133 | | | | — | | | | 14,112,648 | | | | — | | | | 86,573,237 | | |
Cost of shares
redeemed | | | (301,731,685 | ) | | | (562,105,362 | ) | | | (13,370,008 | ) | | | (37,521,896 | ) | | | (64,101,670 | ) | | | (281,200,740 | ) | |
Total Class Y | | $ | (217,682,906 | ) | | $ | (146,424,121 | ) | | $ | (11,111,098 | ) | | $ | (15,249,812 | ) | | $ | (46,014,781 | ) | | $ | (147,724,532 | ) | |
Member Class | |
Proceeds from
shares issued | | $ | — | | | $ | — | | | $ | — | | | $ | — | | | $ | 786,952 | | | $ | 1,578,737 | | |
Distributions
reinvested | | | — | | | | — | | | | — | | | | — | | | | — | | | | 223,742 | | |
Cost of shares
redeemed | | | — | | | | — | | | | — | | | | — | | | | (212,752 | ) | | | (751,214 | ) | |
Total Member
Class | | $ | — | | | $ | — | | | $ | — | | | $ | — | | | $ | 574,200 | | | $ | 1,051,265 | | |
Change in net assets
resulting from capital
transactions | | $ | (438,582,718 | ) | | $ | (58,863,607 | ) | | $ | (17,647,133 | ) | | $ | (5,812,343 | ) | | $ | (65,222,252 | ) | | $ | (133,837,034 | ) | |
(continues on next page)
See notes to financial statements.
31
Victory Portfolios | | Statements of Changes in Net Assets | |
(continued)
| | | Victory
RS Small Cap Growth Fund | | Victory
RS Select Growth Fund | | Victory
RS Mid Cap Growth Fund | |
| | | Six
Months
Ended
June 30,
2022
(Unaudited) | | Year
Ended
December 31,
2021 | | Six
Months
Ended
June 30,
2022
(Unaudited) | | Year
Ended
December 31,
2021 | | Six
Months
Ended
June 30,
2022
(Unaudited) | | Year
Ended
December 31,
2021 | |
Share Transactions: | |
Class A | |
Issued | | | 407,517 | | | | 936,234 | | | | 167,627 | | | | 466,310 | | | | 120,671 | | | | 197,364 | | |
Reinvested | | | — | | | | 1,268,501 | | | | — | | | | 872,076 | | | | — | | | | 980,063 | | |
Redeemed | | | (1,474,491 | ) | | | (2,017,589 | ) | | | (298,027 | ) | | | (610,699 | ) | | | (462,654 | ) | | | (442,275 | ) | |
Total Class A | | | (1,066,974 | ) | | | 187,146 | | | | (130,400 | ) | | | 727,687 | | | | (341,983 | ) | | | 735,152 | | |
Class C | |
Issued | | | 10,571 | | | | 29,248 | | | | 4,842 | | | | 10,395 | | | | 1,547 | | | | 11,496 | | |
Reinvested | | | — | | | | 38,142 | | | | — | | | | 156,239 | | | | — | | | | 226,635 | | |
Redeemed | | | (40,531 | ) | | | (124,132 | ) | | | (183,502 | ) | | | (527,470 | ) | | | (168,488 | ) | | | (232,518 | ) | |
Total Class C | | | (29,960 | ) | | | (56,742 | ) | | | (178,660 | ) | | | (360,836 | ) | | | (166,941 | ) | | | 5,613 | | |
Class R | |
Issued | | | 9,198 | | | | 30,001 | | | | 8,730 | | | | 2,155 | | | | 1,135 | | | | 1,297 | | |
Reinvested | | | — | | | | 13,371 | | | | — | | | | 4,957 | | | | — | | | | 9,044 | | |
Redeemed | | | (15,796 | ) | | | (62,252 | ) | | | (2,562 | ) | | | (5,456 | ) | | | (2,122 | ) | | | (1,602 | ) | |
Total Class R | | | (6,598 | ) | | | (18,880 | ) | | | 6,168 | | | | 1,656 | | | | (987 | ) | | | 8,739 | | |
Class R6 | |
Issued | | | 1,253,727 | | | | 2,569,766 | | | | 1,068 | | | | 16,988 | | | | 26,021 | | | | 187,579 | | |
Reinvested | | | — | | | | 772,458 | | | | — | | | | 6,164 | | | | — | | | | 85,017 | | |
Redeemed | | | (3,497,039 | ) | | | (2,189,573 | ) | | | (7,806 | ) | | | (4,924 | ) | | | (478,476 | ) | | | (333,844 | ) | |
Total Class R6 | | | (2,243,312 | ) | | | 1,152,651 | | | | (6,738 | ) | | | 18,228 | | | | (452,455 | ) | | | (61,248 | ) | |
Class Y | |
Issued | | | 1,342,369 | | | | 2,889,358 | | | | 79,911 | | | | 196,234 | | | | 839,160 | | | | 1,505,331 | | |
Reinvested | | | — | | | | 1,666,973 | | | | — | | | | 431,711 | | | | — | | | | 3,196,451 | | |
Redeemed | | | (5,035,409 | ) | | | (5,767,523 | ) | | | (482,054 | ) | | | (876,979 | ) | | | (3,083,211 | ) | | | (8,783,601 | ) | |
Total Class Y | | | (3,693,040 | ) | | | (1,211,192 | ) | | | (402,143 | ) | | | (249,034 | ) | | | (2,244,051 | ) | | | (4,081,819 | ) | |
Member Class | |
Issued | | | — | | | | — | | | | — | | | | — | | | | 39,375 | | | | 48,341 | | |
Reinvested | | | — | | | | — | | | | — | | | | — | | | | — | | | | 9,137 | | |
Redeemed | | | — | | | | — | | | | — | | | | — | | | | (11,142 | ) | | | (22,262 | ) | |
Total Member Class | | | — | | | | — | | | | — | | | | — | | | | 28,233 | | | | 35,216 | | |
Change in Shares | | | (7,039,884 | ) | | | 52,983 | | | | (711,773 | ) | | | 137,701 | | | | (3,178,184 | ) | | | (3,358,347 | ) | |
See notes to financial statements.
32
Victory Portfolios | | Statements of Changes in Net Assets | |
| | | Victory
RS Growth Fund | | Victory
RS Science and
Technology Fund | | Victory
RS Small Cap Equity Fund | |
| | | Six
Months
Ended
June 30,
2022
(Unaudited) | | Year
Ended
December 31,
2021 | | Six
Months
Ended
June 30,
2022
(Unaudited) | | Year
Ended
December 31,
2021 | | Six
Months
Ended
June 30,
2022
(Unaudited) | | Year
Ended
December 31,
2021 | |
From Investment Activities: | |
Operations: | |
Net Investment
Income (Loss) | | $ | (758,063 | ) | | $ | (2,257,413 | ) | | $ | (1,419,455 | ) | | $ | (5,282,484 | ) | | $ | (301,019 | ) | | $ | (949,053 | ) | |
Net realized gains
(losses) from
investments | | | (5,578,437 | ) | | | 34,175,683 | | | | (23,989,002 | ) | | | 62,995,967 | | | | (18,691,046 | ) | | | 12,976,234 | | |
Net change in
unrealized
appreciation/
depreciation on
investments | | | (93,846,979 | ) | | | 27,407,434 | | | | (114,414,143 | ) | | | (94,329,136 | ) | | | (6,713,477 | ) | | | (17,969,992 | ) | |
Change in net assets resulting
from operations | | | (100,183,479 | ) | | | 59,325,704 | | | | (139,822,600 | ) | | | (36,615,653 | ) | | | (25,705,542 | ) | | | (5,942,811 | ) | |
Distributions to Shareholders: | |
Class A | | | — | | | | (25,870,624 | ) | | | — | | | | (34,393,562 | ) | | | — | | | | (11,807,040 | ) | |
Class C | | | — | | | | (185,893 | ) | | | — | | | | (2,079,381 | ) | | | — | | | | (74,046 | ) | |
Class R | | | — | | | | (49,973 | ) | | | — | | | | (176,750 | ) | | | — | | | | (801,530 | ) | |
Class Y | | | — | | | | (2,769,379 | ) | | | — | | | | (10,284,801 | ) | | | — | | | | (754,635 | ) | |
Member Class | | | — | | | | — | | | | — | | | | — | | | | — | | | | (248,472 | ) | |
Change in net assets resulting
from distributions to
shareholders | | | — | | | | (28,875,869 | ) | | | — | | | | (46,934,494 | ) | | | — | | | | (13,685,723 | ) | |
Change in net assets resulting
from capital transactions | | | (12,163,681 | ) | | | 5,846,536 | | | | (19,362,150 | ) | | | (22,173,579 | ) | | | (3,091,147 | ) | | | 3,027,200 | | |
Change in net assets | | | (112,347,160 | ) | | | 36,296,371 | | | | (159,184,750 | ) | | | (105,723,726 | ) | | | (28,796,689 | ) | | | (16,601,334 | ) | |
Net Assets: | |
Beginning of period | | | 344,710,047 | | | | 308,413,676 | | | | 343,826,835 | | | | 449,550,561 | | | | 68,516,803 | | | | 85,118,137 | | |
End of period | | $ | 232,362,887 | | | $ | 344,710,047 | | | $ | 184,642,085 | | | $ | 343,826,835 | | | $ | 39,720,114 | | | $ | 68,516,803 | | |
(continues on next page)
See notes to financial statements.
33
Victory Portfolios | | Statements of Changes in Net Assets | |
(continued)
| | | Victory
RS Growth Fund | | Victory
RS Science and
Technology Fund | | Victory
RS Small Cap Equity Fund | |
| | | Six
Months
Ended
June 30,
2022
(Unaudited) | | Year
Ended
December 31,
2021 | | Six
Months
Ended
June 30,
2022
(Unaudited) | | Year
Ended
December 31,
2021 | | Six
Months
Ended
June 30,
2022
(Unaudited) | | Year
Ended
December 31,
2021 | |
Capital Transactions: | |
Class A | |
Proceeds from shares
issued | | $ | 3,211,991 | | | $ | 8,581,742 | | | $ | 9,636,564 | | | $ | 39,004,944 | | | $ | 901,110 | | | $ | 6,230,569 | | |
Distributions reinvested | | | — | | | | 25,028,143 | | | | — | | | | 32,658,932 | | | | — | | | | 11,648,399 | | |
Cost of shares redeemed | | | (12,033,703 | ) | | | (26,382,488 | ) | | | (14,658,082 | ) | | | (80,772,344 | ) | | | (3,934,895 | ) | | | (16,789,674 | ) | |
Total Class A | | $ | (8,821,712 | ) | | $ | 7,227,397 | | | $ | (5,021,518 | ) | | $ | (9,108,468 | ) | | $ | (3,033,785 | ) | | $ | 1,089,294 | | |
Class C | |
Proceeds from shares
issued | | $ | 34,620 | | | $ | 35,326 | | | $ | 311,954 | | | $ | 1,707,463 | | | $ | — | | | $ | 287,897 | | |
Distributions reinvested | | | — | | | | 185,474 | | | | — | | | | 2,077,315 | | | | — | | | | 74,046 | | |
Cost of shares redeemed | | | (397,009 | ) | | | (2,443,080 | ) | | | (1,717,330 | ) | | | (7,751,009 | ) | | | (74,403 | ) | | | (383,060 | ) | |
Total Class C | | $ | (362,389 | ) | | $ | (2,222,280 | ) | | $ | (1,405,376 | ) | | $ | (3,966,231 | ) | | $ | (74,403 | ) | | $ | (21,117 | ) | |
Class R | |
Proceeds from shares
issued | | $ | 53,376 | | | $ | 44,677 | | | $ | 92,886 | | | $ | 339,728 | | | $ | 52,812 | | | $ | 135,914 | | |
Distributions reinvested | | | — | | | | 49,973 | | | | — | | | | 176,750 | | | | — | | | | 801,530 | | |
Cost of shares redeemed | | | (46,237 | ) | | | (6,705 | ) | | | (156,908 | ) | | | (401,462 | ) | | | (467,893 | ) | | | (247,781 | ) | |
Total Class R | | $ | 7,139 | | | $ | 87,945 | | | $ | (64,022 | ) | | $ | 115,016 | | | $ | (415,081 | ) | | $ | 689,663 | | |
Class Y | |
Proceeds from shares
issued | | $ | 1,058,582 | | | $ | 4,167,842 | | | $ | 5,955,830 | | | $ | 23,988,683 | | | $ | 393,148 | | | $ | 1,018,845 | | |
Distributions reinvested | | | — | | | | 2,657,237 | | | | — | | | | 9,629,680 | | | | — | | | | 752,967 | | |
Cost of shares redeemed | | | (4,045,301 | ) | | | (6,071,605 | ) | | | (18,827,064 | ) | | | (42,832,259 | ) | | | (413,218 | ) | | | (2,043,606 | ) | |
Total Class Y | | $ | (2,986,719 | ) | | $ | 753,474 | | | $ | (12,871,234 | ) | | $ | (9,213,896 | ) | | $ | (20,070 | ) | | $ | (271,794 | ) | |
Member Class | |
Proceeds from shares
issued | | $ | — | | | $ | — | | | $ | — | | | $ | — | | | $ | 548,551 | | | $ | 3,375,015 | | |
Distributions reinvested | | | — | | | | — | | | | — | | | | — | | | | — | | | | 248,472 | | |
Cost of shares redeemed | | | — | | | | — | | | | — | | | | — | | | | (96,359 | ) | | | (2,082,333 | ) | |
Total Member Class | | $ | — | | | $ | — | | | $ | — | | | $ | — | | | $ | 452,192 | | | $ | 1,541,154 | | |
Change in net assets resulting
from capital transactions | | $ | (12,163,681 | ) | | $ | 5,846,536 | | | $ | (19,362,150 | ) | | $ | (22,173,579 | ) | | $ | (3,091,147 | ) | | $ | 3,027,200 | | |
(continues on next page)
See notes to financial statements.
34
Victory Portfolios | | Statements of Changes in Net Assets | |
(continued)
| | | Victory
RS Growth Fund | | Victory
RS Science and
Technology Fund | | Victory
RS Small Cap Equity Fund | |
| | | Six
Months
Ended
June 30,
2022
(Unaudited) | | Year
Ended
December 31,
2021 | | Six
Months
Ended
June 30,
2022
(Unaudited) | | Year
Ended
December 31,
2021 | | Six
Months
Ended
June 30,
2022
(Unaudited) | | Year
Ended
December 31,
2021 | |
Share Transactions: | |
Class A | |
Issued | | | 150,636 | | | | 331,479 | | | | 442,179 | | | | 1,081,400 | | | | 85,933 | | | | 357,336 | | |
Reinvested | | | — | | | | 986,288 | | | | — | | | | 1,203,351 | | | | — | | | | 919,369 | | |
Redeemed | | | (564,882 | ) | | | (1,018,990 | ) | | | (710,511 | ) | | | (2,265,845 | ) | | | (380,080 | ) | | | (971,778 | ) | |
Total Class A | | | (414,246 | ) | | | 298,777 | | | | (268,332 | ) | | | 18,906 | | | | (294,147 | ) | | | 304,927 | | |
Class C | |
Issued | | | 1,979 | | | | 1,742 | | | | 22,356 | | | | 63,027 | | | | — | | | | 14,861 | | |
Reinvested | | | — | | | | 9,590 | | | | — | | | | 111,205 | | | | — | | | | 5,771 | | |
Redeemed | | | (24,174 | ) | | | (122,847 | ) | | | (118,207 | ) | | | (287,361 | ) | | | (7,246 | ) | | | (20,482 | ) | |
Total Class C | | | (22,195 | ) | | | (111,515 | ) | | | (95,851 | ) | | | (113,129 | ) | | | (7,246 | ) | | | 150 | | |
Class R | |
Issued | | | 2,870 | | | | 1,987 | | | | 6,267 | | | | 11,369 | | | | 8,371 | | | | 11,074 | | |
Reinvested | | | — | | | | 2,268 | | | | — | | | | 8,213 | | | | — | | | | 100,191 | | |
Redeemed | | | (2,507 | ) | | | (287 | ) | | | (9,605 | ) | | | (13,534 | ) | | | (68,512 | ) | | | (20,803 | ) | |
Total Class R | | | 363 | | | | 3,968 | | | | (3,338 | ) | | | 6,048 | | | | (60,141 | ) | | | 90,462 | | |
Class Y | |
Issued | | | 45,146 | | | | 159,034 | | | | 266,635 | | | | 604,120 | | | | 40,808 | | | | 56,893 | | |
Reinvested | | | — | | | | 98,559 | | | | — | | | | 319,286 | | | | — | | | | 56,614 | | |
Redeemed | | | (180,377 | ) | | | (227,354 | ) | | | (805,417 | ) | | | (1,098,885 | ) | | | (37,902 | ) | | | (129,973 | ) | |
Total Class Y | | | (135,231 | ) | | | 30,239 | | | | (538,782 | ) | | | (175,479 | ) | | | 2,906 | | | | (16,466 | ) | |
Member Class | |
Issued | | | — | | | | — | | | | — | | | | — | | | | 53,121 | | | | 188,543 | | |
Reinvested | | | — | | | | — | | | | — | | | | — | | | | — | | | | 19,580 | | |
Redeemed | | | — | | | | — | | | | — | | | | — | | | | (11,037 | ) | | | (115,794 | ) | |
Total Member Class | | | — | | | | — | | | | — | | | | — | | | | 42,084 | | | | 92,329 | | |
Change in Shares | | | (571,309 | ) | | | 221,469 | | | | (906,303 | ) | | | (263,654 | ) | | | (316,544 | ) | | | 471,402 | | |
See notes to financial statements.
35
Victory Portfolios | | Financial Highlights | |
For a Share Outstanding Throughout Each Period
| | | | | Investment Activities | | Distributions
to
Shareholders
From | | | |
| | | Net Asset
Value,
Beginning of
Period | | Net
Investment
Income
(Loss)(a) | | Net
Realized and
Unrealized
Gains
(Losses) | | Total from
Investment
Activities | | Net Realized
Gains from
Investments | | Total
Distributions | | Net Asset
Value,
End of
Period | | Total
Return
(Excludes
Sales
Charge)(b)(c) | |
Victory RS Small Cap Growth Fund | | | |
Class A | | | |
Six Months Ended
June 30, 2022
(Unaudited) | | $ | 73.73 | | | | (0.30 | ) | | | (27.04 | ) | | | (27.34 | ) | | | — | | | | — | | | $ | 46.39 | | | | (37.08 | )% | |
Year Ended December 31:
2021 | | $ | 97.45 | | | | (1.20 | ) | | | (10.15 | ) | | | (11.35 | ) | | | (12.37 | ) | | | (12.37 | ) | | $ | 73.73 | | | | (11.06 | )% | |
2020 | | $ | 77.19 | | | | (0.97 | ) | | | 30.04 | | | | 29.07 | | | | (8.81 | ) | | | (8.81 | ) | | $ | 97.45 | | | | 37.84 | % | |
2019 | | $ | 61.11 | | | | (0.80 | ) | | | 23.84 | | | | 23.04 | | | | (6.96 | ) | | | (6.96 | ) | | $ | 77.19 | | | | 37.91 | % | |
2018 | | $ | 80.96 | | | | (0.83 | ) | | | (6.54 | ) | | | (7.37 | ) | | | (12.48 | ) | | | (12.48 | ) | | $ | 61.11 | | | | (8.97 | )% | |
2017 | | $ | 65.31 | | | | (0.75 | ) | | | 24.13 | | | | 23.38 | | | | (7.73 | ) | | | (7.73 | ) | | $ | 80.96 | | | | 36.86 | % | |
Class C | | | |
Six Months Ended
June 30, 2022
(Unaudited) | | $ | 56.86 | | | | (0.40 | ) | | | (20.81 | ) | | | (21.21 | ) | | | — | | | | — | | | $ | 35.65 | | | | (37.30 | )% | |
Year Ended December 31:
2021 | | $ | 79.07 | | | | (1.55 | ) | | | (8.29 | ) | | | (9.84 | ) | | | (12.37 | ) | | | (12.37 | ) | | $ | 56.86 | | | | (11.73 | )% | |
2020 | | $ | 64.34 | | | | (1.30 | ) | | | 24.84 | | | | 23.54 | | | | (8.81 | ) | | | (8.81 | ) | | $ | 79.07 | | | | 36.78 | % | |
2019 | | $ | 52.19 | | | | (1.17 | ) | | | 20.28 | | | | 19.11 | | | | (6.96 | ) | | | (6.96 | ) | | $ | 64.34 | | | | 36.88 | % | |
2018 | | $ | 71.70 | | | | (1.31 | ) | | | (5.72 | ) | | | (7.03 | ) | | | (12.48 | ) | | | (12.48 | ) | | $ | 52.19 | | | | (9.66 | )% | |
2017 | | $ | 58.97 | | | | (1.18 | ) | | | 21.64 | | | | 20.46 | | | | (7.73 | ) | | | (7.73 | ) | | $ | 71.70 | | | | 35.84 | % | |
Class R | | | |
Six Months Ended
June 30, 2022
(Unaudited) | | $ | 63.68 | | | | (0.37 | ) | | | (23.33 | ) | | | (23.70 | ) | | | — | | | | — | | | $ | 39.98 | | | | (37.22 | )% | |
Year Ended December 31:
2021 | | $ | 86.56 | | | | (1.45 | ) | | | (9.06 | ) | | | (10.51 | ) | | | (12.37 | ) | | | (12.37 | ) | | $ | 63.68 | | | | (11.53 | )% | |
2020 | | $ | 69.61 | | | | (1.20 | ) | | | 26.96 | | | | 25.76 | | | | (8.81 | ) | | | (8.81 | ) | | $ | 86.56 | | | | 37.20 | % | |
2019 | | $ | 55.87 | | | | (1.05 | ) | | | 21.75 | | | | 20.70 | | | | (6.96 | ) | | | (6.96 | ) | | $ | 69.61 | | | | 37.28 | % | |
2018 | | $ | 75.55 | | | | (1.15 | ) | | | (6.05 | ) | | | (7.20 | ) | | | (12.48 | ) | | | (12.48 | ) | | $ | 55.87 | | | | (9.39 | )% | |
2017 | | $ | 61.63 | | | | (1.04 | ) | | | 22.69 | | | | 21.65 | | | | (7.73 | ) | | | (7.73 | ) | | $ | 75.55 | | | | 36.24 | % | |
(a) Per share net investment income (loss) has been calculated using the average daily shares method.
(b) Not annualized for periods less than one year.
(c) Includes adjustments in accordance with U.S. Generally Accepted Accounting Principles.
(d) Annualized for periods less than one year.
(e) Does not include acquire fund fees and expenses, if any.
(f) Portfolio turnover is calculated on the basis of the Fund as a whole without distinguishing between the classes of shares issued.
See notes to financial statements.
36
Victory Portfolios | | Financial Highlights — continued | |
For a Share Outstanding Throughout Each Period
| | | Ratios to Average Net Assets | | Supplemental Data | |
| | | Net
Expenses(d)(e) | | Net
Investment
Income
(Loss)(d) | | Gross
Expenses(d)(e) | | Net Assets,
End of
Period
(000's) | | Portfolio
Turnover(b)(f) | |
Victory RS Small Cap Growth Fund | |
Class A | |
Six Months Ended
June 30, 2022
(Unaudited) | | | 1.40 | % | | | (1.05 | )% | | | 1.47 | % | | $ | 349,574 | | | | 53 | % | |
Year Ended December 31:
2021 | | | 1.40 | % | | | (1.27 | )% | | | 1.42 | % | | $ | 634,204 | | | | 92 | % | |
2020 | | | 1.40 | % | | | (1.20 | )% | | | 1.43 | % | | $ | 820,006 | | | | 72 | % | |
2019 | | | 1.40 | % | | | (1.06 | )% | | | 1.44 | % | | $ | 687,425 | | | | 100 | % | |
2018 | | | 1.40 | % | | | (0.94 | )% | | | 1.45 | % | | $ | 499,350 | | | | 86 | % | |
2017 | | | 1.40 | % | | | (1.00 | )% | | | 1.44 | % | | $ | 575,227 | | | | 107 | % | |
Class C | |
Six Months Ended
June 30, 2022
(Unaudited) | | | 2.16 | % | | | (1.82 | )% | | | 2.32 | % | | $ | 6,071 | | | | 53 | % | |
Year Ended December 31:
2021 | | | 2.16 | % | | | (2.03 | )% | | | 2.16 | % | | $ | 11,387 | | | | 92 | % | |
2020 | | | 2.16 | % | | | (1.96 | )% | | | 2.26 | % | | $ | 20,323 | | | | 72 | % | |
2019 | | | 2.16 | % | | | (1.82 | )% | | | 2.27 | % | | $ | 18,581 | | | | 100 | % | |
2018 | | | 2.16 | % | | | (1.71 | )% | | | 2.26 | % | | $ | 13,602 | | | | 86 | % | |
2017 | | | 2.16 | % | | | (1.75 | )% | | | 2.23 | % | | $ | 13,633 | | | | 107 | % | |
Class R | |
Six Months Ended
June 30, 2022
(Unaudited) | | | 1.86 | % | | | (1.51 | )% | | | 2.03 | % | | $ | 2,913 | | | | 53 | % | |
Year Ended December 31:
2021 | | | 1.86 | % | | | (1.73 | )% | | | 1.86 | % | | $ | 5,060 | | | | 92 | % | |
2020 | | | 1.86 | % | | | (1.66 | )% | | | 1.97 | % | | $ | 8,513 | | | | 72 | % | |
2019 | | | 1.86 | % | | | (1.52 | )% | | | 1.93 | % | | $ | 8,012 | | | | 100 | % | |
2018 | | | 1.86 | % | | | (1.40 | )% | | | 1.87 | % | | $ | 7,285 | | | | 86 | % | |
2017 | | | 1.86 | % | | | (1.46 | )% | | | 1.94 | % | | $ | 7,698 | | | | 107 | % | |
See notes to financial statements.
37
Victory Portfolios | | Financial Highlights | |
For a Share Outstanding Throughout Each Period
| | | | | Investment Activities | | Distributions
to
Shareholders
From | | | |
| | | Net Asset
Value,
Beginning of
Period | | Net
Investment
Income
(Loss)(a) | | Net
Realized and
Unrealized
Gains
(Losses) | | Total from
Investment
Activities | | Net Realized
Gains from
Investments | | Total
Distributions | | Net Asset
Value,
End of
Period | | Total
Return(b)(c) | |
Victory RS Small Cap Growth Fund | | | |
Class R6 | | | |
Six Months Ended
June 30, 2022
(Unaudited) | | $ | 79.37 | | | | (0.22 | ) | | | (29.12 | ) | | | (29.34 | ) | | | — | | | | — | | | $ | 50.03 | | | | (36.97 | )% | |
Year Ended December 31: | |
2021 | | $ | 103.42 | | | | (0.91 | ) | | | (10.77 | ) | | | (11.68 | ) | | | (12.37 | ) | | | (12.37 | ) | | $ | 79.37 | | | | (10.74 | )% | |
2020 | | $ | 81.24 | | | | (0.73 | ) | | | 31.72 | | | | 30.99 | | | | (8.81 | ) | | | (8.81 | ) | | $ | 103.42 | | | | 38.32 | % | |
2019 | | $ | 63.83 | | | | (0.58 | ) | | | 24.95 | | | | 24.37 | | | | (6.96 | ) | | | (6.96 | ) | | $ | 81.24 | | | | 38.38 | % | |
2018 | | $ | 83.67 | | | | (0.58 | ) | | | (6.78 | ) | | | (7.36 | ) | | | (12.48 | ) | | | (12.48 | ) | | $ | 63.83 | | | | (8.66 | )% | |
July 12, 2017 (g)
through
December 31, 2017 | | $ | 79.23 | | | | (0.41 | ) | | | 12.58 | | | | 12.17 | | | | (7.73 | ) | | | (7.73 | ) | | $ | 83.67 | | | | 16.23 | % | |
Class Y | | | |
Six Months Ended
June 30, 2022
(Unaudited) | | $ | 79.00 | | | | (0.24 | ) | | | (28.98 | ) | | | (29.22 | ) | | | — | | | | — | | | $ | 49.78 | | | | (36.99 | )% | |
Year Ended December 31:
2021 | | $ | 103.10 | | | | (1.00 | ) | | | (10.73 | ) | | | (11.73 | ) | | | (12.37 | ) | | | (12.37 | ) | | $ | 79.00 | | | | (10.82 | )% | |
2020 | | $ | 81.06 | | | | (0.79 | ) | | | 31.64 | | | | 30.85 | | | | (8.81 | ) | | | (8.81 | ) | | $ | 103.10 | | | | 38.21 | % | |
2019 | | $ | 63.75 | | | | (0.62 | ) | | | 24.89 | | | | 24.27 | | | | (6.96 | ) | | | (6.96 | ) | | $ | 81.06 | | | | 38.29 | % | |
2018 | | $ | 83.64 | | | | (0.61 | ) | | | (6.80 | ) | | | (7.41 | ) | | | (12.48 | ) | | | (12.48 | ) | | $ | 63.75 | | | | (8.72 | )% | |
2017 | | $ | 67.08 | | | | (0.53 | ) | | | 24.82 | | | | 24.29 | | | | (7.73 | ) | | | (7.73 | ) | | $ | 83.64 | | | | 37.23 | % | |
(a) Per share net investment income (loss) has been calculated using the average daily shares method.
(b) Not annualized for periods less than one year.
(c) Includes adjustments in accordance with U.S. Generally Accepted Accounting Principles.
(d) Annualized for periods less than one year.
(e) Does not include acquire fund fees and expenses, if any.
(f) Portfolio turnover is calculated on the basis of the Fund as a whole without distinguishing between the classes of shares issued.
(g) Commencement of operations.
See notes to financial statements.
38
Victory Portfolios | | Financial Highlights — continued | |
For a Share Outstanding Throughout Each Period (continued)
| | | Ratios to Average Net Assets | | Supplemental Data | |
| | | Net
Expenses(d)(e) | | Net
Investment
Income
(Loss)(d) | | Gross
Expenses(d)(e) | | Net Assets,
End of
Period
(000's) | | Portfolio
Turnover(b)(f) | |
Victory RS Small Cap Growth Fund | |
Class R6 | |
Six Months Ended
June 30, 2022
(Unaudited) | | | 1.06 | % | | | (0.72 | )% | | | 1.06 | % | | $ | 272,998 | | | | 53 | % | |
Year Ended December 31: | |
2021 | | | 1.04 | % | | | (0.91 | )% | | | 1.04 | % | | $ | 611,157 | | | | 92 | % | |
2020 | | | 1.06 | % | | | (0.86 | )% | | | 1.06 | % | | $ | 677,128 | | | | 72 | % | |
2019 | | | 1.06 | % | | | (0.72 | )% | | | 1.06 | % | | $ | 441,471 | | | | 100 | % | |
2018 | | | 1.06 | % | | | (0.64 | )% | | | 1.10 | % | | $ | 113,288 | | | | 86 | % | |
July 12, 2017 (g)
through
December 31, 2017 | | | 1.06 | % | | | (1.03 | )% | | | 1.41 | % | | $ | 25,551 | | | | 107 | % | |
Class Y | |
Six Months Ended
June 30, 2022
(Unaudited) | | | 1.13 | % | | | (0.79 | )% | | | 1.19 | % | | $ | 437,279 | | | | 53 | % | |
Year Ended December 31:
2021 | | | 1.13 | % | | | (1.00 | )% | | | 1.14 | % | | $ | 985,724 | | | | 92 | % | |
2020 | | | 1.13 | % | | | (0.93 | )% | | | 1.15 | % | | $ | 1,411,316 | | | | 72 | % | |
2019 | | | 1.13 | % | | | (0.79 | )% | | | 1.15 | % | | $ | 1,131,648 | | | | 100 | % | |
2018 | | | 1.13 | % | | | (0.67 | )% | | | 1.15 | % | | $ | 967,112 | | | | 86 | % | |
2017 | | | 1.13 | % | | | (0.68 | )% | | | 1.17 | % | | $ | 1,081,427 | | | | 107 | % | |
See notes to financial statements.
39
Victory Portfolios | | Financial Highlights | |
For a Share Outstanding Throughout Each Period
| | | | | Investment Activities | | Distributions
to
Shareholders
From | | | |
| | | Net Asset
Value,
Beginning of
Period | | Net
Investment
Income
(Loss)(a) | | Net
Realized and
Unrealized
Gains
(Losses) | | Total from
Investment
Activities | | Net Realized
Gains from
Investments | | Total
Distributions | | Net Asset
Value,
End of
Period | | Total
Return
(Excludes
Sales
Charge)(b) | |
Victory RS Select Growth Fund | | | |
Class A | | | |
Six Months Ended
June 30, 2022
(Unaudited) | | $ | 31.30 | | | | (0.13 | ) | | | (10.31 | ) | | | (10.44 | ) | | | — | | | | — | | | $ | 20.86 | | | | (33.35 | )% | |
Year Ended December 31:
2021 | | $ | 38.19 | | | | (0.49 | ) | | | 2.64 | | | | 2.15 | | | | (9.04 | ) | | | (9.04 | ) | | $ | 31.30 | | | | 6.89 | % | |
2020 | | $ | 33.81 | | | | (0.40 | ) | | | 11.43 | | | | 11.03 | | | | (6.65 | ) | | | (6.65 | ) | | $ | 38.19 | | | | 33.22 | % | |
2019 | | $ | 28.96 | | | | (0.37 | ) | | | 9.68 | | | | 9.31 | | | | (4.46 | ) | | | (4.46 | ) | | $ | 33.81 | | | | 32.29 | % | |
2018 | | $ | 46.03 | | | | (0.42 | ) | | | (3.12 | ) | | | (3.54 | ) | | | (13.53 | ) | | | (13.53 | ) | | $ | 28.96 | | | | (7.23 | )% | |
2017 | | $ | 45.04 | | | | (0.43 | ) | | | 8.16 | | | | 7.73 | | | | (6.74 | ) | | | (6.74 | ) | | $ | 46.03 | | | | 17.10 | % | |
Class C | | | |
Six Months Ended
June 30, 2022
(Unaudited) | | $ | 20.74 | | | | (0.16 | ) | | | (6.81 | ) | | | (6.97 | ) | | | — | | | | — | | | $ | 13.77 | | | | (33.61 | )% | |
Year Ended December 31:
2021 | | $ | 28.54 | | | | (0.59 | ) | | | 1.83 | | | | 1.24 | | | | (9.04 | ) | | | (9.04 | ) | | $ | 20.74 | | | | 6.02 | % | |
2020 | | $ | 26.77 | | | | (0.53 | ) | | | 8.95 | | | | 8.42 | | | | (6.65 | ) | | | (6.65 | ) | | $ | 28.54 | | | | 32.20 | % | |
2019 | | $ | 23.82 | | | | (0.53 | ) | | | 7.94 | | | | 7.41 | | | | (4.46 | ) | | | (4.46 | ) | | $ | 26.77 | | | | 31.28 | % | |
2018 | | $ | 40.80 | | | | (0.70 | ) | | | (2.75 | ) | | | (3.45 | ) | | | (13.53 | ) | | | (13.53 | ) | | $ | 23.82 | | | | (7.98 | )% | |
2017 | | $ | 40.89 | | | | (0.73 | ) | | | 7.38 | | | | 6.65 | | | | (6.74 | ) | | | (6.74 | ) | | $ | 40.80 | | | | 16.19 | % | |
Class R | | | |
Six Months Ended
June 30, 2022
(Unaudited) | | $ | 21.67 | | | | (0.14 | ) | | | (7.12 | ) | | | (7.26 | ) | | | — | | | | — | | | $ | 14.41 | | | | (33.50 | )% | |
Year Ended December 31:
2021 | | $ | 29.34 | | | | (0.53 | ) | | | 1.90 | | | | 1.37 | | | | (9.04 | ) | | | (9.04 | ) | | $ | 21.67 | | | | 6.31 | % | |
2020 | | $ | 27.30 | | | | (0.46 | ) | | | 9.15 | | | | 8.69 | | | | (6.65 | ) | | | (6.65 | ) | | $ | 29.34 | | | | 32.57 | % | |
2019 | | $ | 24.16 | | | | (0.45 | ) | | | 8.05 | | | | 7.60 | | | | (4.46 | ) | | | (4.46 | ) | | $ | 27.30 | | | | 31.63 | % | |
2018 | | $ | 41.06 | | | | (0.59 | ) | | | (2.78 | ) | | | (3.37 | ) | | | (13.53 | ) | | | (13.53 | ) | | $ | 24.16 | | | | (7.70 | )% | |
2017 | | $ | 41.00 | | | | (0.61 | ) | | | 7.41 | | | | 6.80 | | | | (6.74 | ) | | | (6.74 | ) | | $ | 41.06 | | | | 16.51 | % | |
(a) Per share net investment income (loss) has been calculated using the average daily shares method.
(b) Not annualized for periods less than one year.
(c) Annualized for periods less than one year.
(d) Does not include acquire fund fees and expenses, if any.
(e) Portfolio turnover is calculated on the basis of the Fund as a whole without distinguishing between the classes of shares issued.
See notes to financial statements.
40
Victory Portfolios | | Financial Highlights — continued | |
For a Share Outstanding Throughout Each Period
| | | Ratios to Average Net Assets | | Supplemental Data | |
| | | Net
Expenses(c)(d) | | Net
Investment
Income
(Loss)(c) | | Gross
Expenses(c)(d) | | Net Assets,
End of
Period
(000's) | | Portfolio
Turnover(b)(e) | |
Victory RS Select Growth Fund | |
Class A | |
Six Months Ended
June 30, 2022
(Unaudited) | | | 1.40 | % | | | (1.05 | )% | | | 1.52 | % | | $ | 75,270 | | | | 69 | % | |
Year Ended December 31:
2021 | | | 1.40 | % | | | (1.21 | )% | | | 1.48 | % | | $ | 117,017 | | | | 75 | % | |
2020 | | | 1.40 | % | | | (1.14 | )% | | | 1.49 | % | | $ | 115,014 | | | | 73 | % | |
2019 | | | 1.40 | % | | | (1.06 | )% | | | 1.52 | % | | $ | 97,337 | | | | 74 | % | |
2018 | | | 1.40 | % | | | (0.86 | )% | | | 1.50 | % | | $ | 94,393 | | | | 79 | % | |
2017 | | | 1.40 | % | | | (0.88 | )% | | | 1.49 | % | | $ | 147,531 | | | | 69 | % | |
Class C | |
Six Months Ended
June 30, 2022
(Unaudited) | | | 2.18 | % | | | (1.86 | )% | | | 2.44 | % | | $ | 4,069 | | | | 69 | % | |
Year Ended December 31:
2021 | | | 2.18 | % | | | (1.99 | )% | | | 2.24 | % | | $ | 9,835 | | | | 75 | % | |
2020 | | | 2.18 | % | | | (1.92 | )% | | | 2.29 | % | | $ | 23,831 | | | | 73 | % | |
2019 | | | 2.18 | % | | | (1.84 | )% | | | 2.30 | % | | $ | 26,988 | | | | 74 | % | |
2018 | | | 2.18 | % | | | (1.64 | )% | | | 2.25 | % | | $ | 31,754 | | | | 79 | % | |
2017 | | | 2.18 | % | | | (1.66 | )% | | | 2.24 | % | | $ | 51,208 | | | | 69 | % | |
Class R | |
Six Months Ended
June 30, 2022
(Unaudited) | | | 1.91 | % | | | (1.56 | )% | | | 3.70 | % | | $ | 360 | | | | 69 | % | |
Year Ended December 31:
2021 | | | 1.91 | % | | | (1.72 | )% | | | 2.18 | % | | $ | 408 | | | | 75 | % | |
2020 | | | 1.91 | % | | | (1.64 | )% | | | 5.35 | % | | $ | 504 | | | | 73 | % | |
2019 | | | 1.91 | % | | | (1.57 | )% | | | 4.35 | % | | $ | 604 | | | | 74 | % | |
2018 | | | 1.91 | % | | | (1.38 | )% | | | 3.60 | % | | $ | 701 | | | | 79 | % | |
2017 | | | 1.91 | % | | | (1.39 | )% | | | 2.90 | % | | $ | 1,014 | | | | 69 | % | |
See notes to financial statements.
41
Victory Portfolios | | Financial Highlights | |
For a Share Outstanding Throughout Each Period
| | | | | Investment Activities | | Distributions
to
Shareholders
From | | | |
| | | Net Asset
Value,
Beginning of
Period | | Net
Investment
Income
(Loss)(a) | | Net
Realized and
Unrealized
Gains
(Losses) | | Total from
Investment
Activities | | Net Realized
Gains from
Investments | | Total
Distributions | | Net Asset
Value,
End of
Period | | Total
Return(b) | |
Victory RS Select Growth Fund | | | |
Class R6 | | | |
Six Months Ended
June 30, 2022
(Unaudited) | | $ | 34.71 | | | | (0.10 | ) | | | (11.43 | ) | | | (11.53 | ) | | | — | | | | — | | | $ | 23.18 | | | | (33.22 | )% | |
Year December 31:
2021 | | $ | 41.25 | | | | (0.38 | ) | | | 2.88 | | | | 2.50 | | | | (9.04 | ) | | | (9.04 | ) | | $ | 34.71 | | | | 7.23 | % | |
2020 | | $ | 35.99 | | | | (0.31 | ) | | | 12.22 | | | | 11.91 | | | | (6.65 | ) | | | (6.65 | ) | | $ | 41.25 | | | | 33.65 | % | |
2019 | | $ | 30.50 | | | | (0.27 | ) | | | 10.22 | | | | 9.95 | | | | (4.46 | ) | | | (4.46 | ) | | $ | 35.99 | | | | 32.76 | % | |
2018 | | $ | 47.53 | | | | (0.29 | ) | | | (3.21 | ) | | | (3.50 | ) | | | (13.53 | ) | | | (13.53 | ) | | $ | 30.50 | | | | (6.92 | )% | |
2017 | | $ | 46.16 | | | | (0.28 | ) | | | 8.39 | | | | 8.11 | | | | (6.74 | ) | | | (6.74 | ) | | $ | 47.53 | | | | 17.48 | % | |
Class Y | | | |
Six Months Ended
June 30, 2022
(Unaudited) | | $ | 34.43 | | | | (0.11 | ) | | | (11.34 | ) | | | (11.45 | ) | | | — | | | | — | | | $ | 22.98 | | | | (33.26 | )% | |
Year Ended December 31:
2021 | | $ | 41.02 | | | | (0.41 | ) | | | 2.86 | | | | 2.45 | | | | (9.04 | ) | | | (9.04 | ) | | $ | 34.43 | | | | 7.15 | % | |
2020 | | $ | 35.84 | | | | (0.33 | ) | | | 12.16 | | | | 11.83 | | | | (6.65 | ) | | | (6.65 | ) | | $ | 41.02 | | | | 33.57 | % | |
2019 | | $ | 30.41 | | | | (0.29 | ) | | | 10.18 | | | | 9.89 | | | | (4.46 | ) | | | (4.46 | ) | | $ | 35.84 | | | | 32.66 | % | |
2018 | | $ | 47.47 | | | | (0.30 | ) | | | (3.23 | ) | | | (3.53 | ) | | | (13.53 | ) | | | (13.53 | ) | | $ | 30.41 | | | | (7.02 | )% | |
2017 | | $ | 46.15 | | | | (0.31 | ) | | | 8.37 | | | | 8.06 | | | | (6.74 | ) | | | (6.74 | ) | | $ | 47.47 | | | | 17.40 | % | |
(a) Per share net investment income (loss) has been calculated using the average daily shares method.
(b) Not annualized for periods less than one year.
(c) Annualized for periods less than one year.
(d) Does not include acquire fund fees and expenses, if any.
(e) Portfolio turnover is calculated on the basis of the Fund as a whole without distinguishing between the classes of shares issued.
See notes to financial statements.
42
Victory Portfolios | | Financial Highlights — continued | |
For a Share Outstanding Throughout Each Period (continued)
| | Ratios to Average Net Assets | | Supplemental Data | |
| | | Net
Expenses(c)(d) | | Net
Investment
Income
(Loss)(c) | | Gross
Expenses(c)(d) | | Net Assets,
End of
Period
(000's) | | Portfolio
Turnover(b)(e) | |
Victory RS Select Growth Fund | |
Class R6 | |
Six Months Ended
June 30, 2022
(Unaudited) | | | 1.06 | % | | | (0.73 | )% | | | 2.39 | % | | $ | 665 | | | | 69 | % | |
Year December 31:
2021 | | | 1.06 | % | | | (0.88 | )% | | | 1.83 | % | | $ | 1,231 | | | | 75 | % | |
2020 | | | 1.06 | % | | | (0.80 | )% | | | 4.52 | % | | $ | 710 | | | | 73 | % | |
2019 | | | 1.06 | % | | | (0.72 | )% | | | 5.46 | % | | $ | 302 | | | | 74 | % | |
2018 | | | 1.06 | % | | | (0.59 | )% | | | 6.33 | % | | $ | 239 | | | | 79 | % | |
2017 | | | 1.06 | % | | | (0.55 | )% | | | 27.47 | % | | $ | 151 | | | | 69 | % | |
Class Y | |
Six Months Ended
June 30, 2022
(Unaudited) | | | 1.14 | % | | | (0.80 | )% | | | 1.25 | % | | $ | 37,602 | | | | 69 | % | |
Year Ended December 31:
2021 | | | 1.14 | % | | | (0.95 | )% | | | 1.21 | % | | $ | 70,192 | | | | 75 | % | |
2020 | | | 1.14 | % | | | (0.88 | )% | | | 1.24 | % | | $ | 93,844 | | | | 73 | % | |
2019 | | | 1.14 | % | | | (0.80 | )% | | | 1.23 | % | | $ | 94,933 | | | | 74 | % | |
2018 | | | 1.14 | % | | | (0.59 | )% | | | 1.21 | % | | $ | 120,696 | | | | 79 | % | |
2017 | | | 1.14 | % | | | (0.62 | )% | | | 1.20 | % | | $ | 244,689 | | | | 69 | % | |
See notes to financial statements.
43
Victory Portfolios | | Financial Highlights | |
For a Share Outstanding Throughout Each Period
| | | | | Investment Activities | | Distributions to
Shareholders From | |
| | | Net Asset
Value,
Beginning of
Period | | Net
Investment
Income
(Loss)(a) | | Net Realized
and Unrealized
Gains (Losses) | | Total from
Investment
Activities | | Net Realized
Gains from
Investments | | Return of
Capital | |
Victory RS Mid Cap Growth Fund | | | |
Class A | | | |
Six Months Ended
June 30, 2022
(Unaudited) | | $ | 24.76 | | | | (0.08 | ) | | | (8.37 | ) | | | (8.45 | ) | | | — | | | | — | | |
Year Ended December 31: | |
2021 | | $ | 32.99 | | | | (0.33 | ) | | | 1.60 | | | | 1.27 | | | | (9.50 | ) | | | — | | |
2020 | | $ | 25.56 | | | | (0.20 | ) | | | 8.98 | | | | 8.78 | | | | (1.35 | ) | | | — | | |
2019 | | $ | 19.96 | | | | (0.17 | ) | | | 5.77 | | | | 5.60 | | | | — | | | | — | | |
2018 | | $ | 25.77 | | | | (0.14 | ) | | | (1.79 | ) | | | (1.93 | ) | | | (3.00 | ) | | | (0.88 | ) | |
2017 | | $ | 21.32 | | | | (0.10 | ) | | | 4.55 | | | | 4.45 | | | | — | | | | — | | |
Class C | | | |
Six Months Ended
June 30, 2022
(Unaudited) | | $ | 19.34 | | | | (0.13 | ) | | | (6.53 | ) | | | (6.66 | ) | | | — | | | | — | | |
Year Ended December 31: | |
2021 | | $ | 28.05 | | | | (0.52 | ) | | | 1.31 | | | | 0.79 | | | | (9.50 | ) | | | — | | |
2020 | | $ | 22.08 | | | | (0.38 | ) | | | 7.70 | | | | 7.32 | | | | (1.35 | ) | | | — | | |
2019 | | $ | 17.40 | | | | (0.34 | ) | | | 5.02 | | | | 4.68 | | | | — | | | | — | | |
2018 | | $ | 23.22 | | | | (0.35 | ) | | | (1.59 | ) | | | (1.94 | ) | | | (3.65 | ) | | | (0.23 | ) | |
2017 | | $ | 19.38 | | | | (0.28 | ) | | | 4.12 | | | | 3.84 | | | | — | | | | — | | |
Class R | | | |
Six Months Ended
June 30, 2022
(Unaudited) | | $ | 21.24 | | | | (0.12 | ) | | | (7.18 | ) | | | (7.30 | ) | | | — | | | | — | | |
Year Ended December 31: | |
2021 | | $ | 29.79 | | | | (0.47 | ) | | | 1.42 | | | | 0.95 | | | | (9.50 | ) | | | — | | |
2020 | | $ | 23.32 | | | | (0.33 | ) | | | 8.15 | | | | 7.82 | | | | (1.35 | ) | | | — | | |
2019 | | $ | 18.31 | | | | (0.28 | ) | | | 5.29 | | | | 5.01 | | | | — | | | | — | | |
2018 | | $ | 24.14 | | | | (0.29 | ) | | | (1.66 | ) | | | (1.95 | ) | | | (3.86 | ) | | | (0.02 | ) | |
2017 | | $ | 20.09 | | | | (0.23 | ) | | | 4.28 | | | | 4.05 | | | | — | | | | — | | |
(a) Per share net investment income (loss) has been calculated using the average daily shares method.
(b) Not annualized for periods less than one year.
(c) Annualized for periods less than one year.
(d) Does not include acquire fund fees and expenses, if any.
(e) Portfolio turnover is calculated on the basis of the Fund as a whole without distinguishing between the classes of shares issued.
(f) Includes impact of Line of credit fees. Without these Line of credit fees, the net expense ratio would have been at the contractual expense cap. (See Note 4 in the Notes to Financial Statements)
See notes to financial statements.
44
Victory Portfolios | | Financial Highlights — continued | |
For a Share Outstanding Throughout Each Period
| | | | | Ratios to Average Net Assets | | Supplemental Data | |
| | | Total
Distributions | | Net Asset
Value,
End of
Period | | Total
Return
(Excludes
Sales
Charge)(b) | | Net
Expenses(c)(d) | | Net
Investment
Income
(Loss)(c) | | Gross
Expenses(c)(d) | | Net Assets,
End of
Period
(000's) | | Portfolio
Turnover(b)(e) | |
Victory RS Mid Cap Growth Fund | |
Class A | |
Six Months Ended
June 30, 2022
(Unaudited) | | | — | | | $ | 16.31 | | | | (34.13 | )% | | | 1.21 | %(f) | | | (0.80 | )% | | | 1.39 | % | | $ | 52,411 | | | | 66 | % | |
Year Ended December 31: | |
2021 | | | (9.50 | ) | | $ | 24.76 | | | | 4.68 | % | | | 1.20 | % | | | (0.98 | )% | | | 1.33 | % | | $ | 88,064 | | | | 90 | % | |
2020 | | | (1.35 | ) | | $ | 32.99 | | | | 34.47 | % | | | 1.20 | % | | | (0.75 | )% | | | 1.35 | % | | $ | 93,072 | | | | 92 | % | |
2019 | | | — | | | $ | 25.56 | | | | 28.06 | % | | | 1.20 | % | | | (0.67 | )% | | | 1.35 | % | | $ | 82,888 | | | | 86 | % | |
2018 | | | (3.88 | ) | | $ | 19.96 | | | | (7.37 | )% | | | 1.20 | % | | | (0.53 | )% | | | 1.34 | % | | $ | 75,451 | | | | 126 | % | |
2017 | | | — | | | $ | 25.77 | | | | 20.87 | % | | | 1.20 | % | | | (0.44 | )% | | | 1.29 | % | | $ | 108,271 | | | | 86 | % | |
Class C | |
Six Months Ended
June 30, 2022
(Unaudited) | | | — | | | $ | 12.68 | | | | (34.44 | )% | | | 2.12 | %(f) | | | (1.72 | )% | | | 2.21 | % | | $ | 5,785 | | | | 66 | % | |
Year Ended December 31: | |
2021 | | | (9.50 | ) | | $ | 19.34 | | | | 3.75 | % | | | 2.09 | % | | | (1.87 | )% | | | 2.09 | % | | $ | 12,054 | | | | 90 | % | |
2020 | | | (1.35 | ) | | $ | 28.05 | | | | 33.30 | % | | | 2.11 | % | | | (1.65 | )% | | | 2.14 | % | | $ | 17,325 | | | | 92 | % | |
2019 | | | — | | | $ | 22.08 | | | | 26.90 | % | | | 2.11 | % | | | (1.58 | )% | | | 2.12 | % | | $ | 20,266 | | | | 86 | % | |
2018 | | | (3.88 | ) | | $ | 17.40 | | | | (8.23 | )% | | | 2.11 | % | | | (1.44 | )% | | | 2.12 | % | | $ | 18,072 | | | | 126 | % | |
2017 | | | — | | | $ | 23.22 | | | | 19.81 | % | | | 2.10 | % | | | (1.33 | )% | | | 2.10 | % | | $ | 23,264 | | | | 86 | % | |
Class R | |
Six Months Ended
June 30, 2022
(Unaudited) | | | — | | | $ | 13.94 | | | | (34.37 | )% | | | 1.81 | %(f) | | | (1.40 | )% | | | 3.42 | % | | $ | 387 | | | | 66 | % | |
Year Ended December 31: | |
2021 | | | (9.50 | ) | | $ | 21.24 | | | | 4.09 | % | | | 1.80 | % | | | (1.58 | )% | | | 1.93 | % | | $ | 610 | | | | 90 | % | |
2020 | | | (1.35 | ) | | $ | 29.79 | | | | 33.67 | % | | | 1.80 | % | | | (1.34 | )% | | | 4.13 | % | | $ | 596 | | | | 92 | % | |
2019 | | | — | | | $ | 23.32 | | | | 27.36 | % | | | 1.80 | % | | | (1.26 | )% | | | 3.41 | % | | $ | 927 | | | | 86 | % | |
2018 | | | (3.88 | ) | | $ | 18.31 | | | | (7.99 | )% | | | 1.80 | % | | | (1.13 | )% | | | 2.68 | % | | $ | 1,144 | | | | 126 | % | |
2017 | | | — | | | $ | 24.14 | | | | 20.21 | % | | | 1.80 | % | | | (1.03 | )% | | | 2.43 | % | | $ | 1,685 | | | | 86 | % | |
See notes to financial statements.
45
Victory Portfolios | | Financial Highlights | |
For a Share Outstanding Throughout Each Period
| | | | Investment Activities | | Distributions to
Shareholders From | |
| | | Net Asset
Value,
Beginning of
Period | | Net
Investment
Income
(Loss)(a) | | Net Realized
and Unrealized
Gains (Losses) | | Total from
Investment
Activities | | Net Realized
Gains from
Investments | | Return of
Capital | |
Victory RS Mid Cap Growth Fund | | | |
Class R6 | | | |
Six Months Ended
June 30, 2022
(Unaudited) | | $ | 26.46 | | | | (0.06 | ) | | | (8.95 | ) | | | (9.01 | ) | | | — | | | | — | | |
Year Ended December 31: | |
2021 | | $ | 34.53 | | | | (0.25 | ) | | | 1.68 | | | | 1.43 | | | | (9.50 | ) | | | — | | |
2020 | | $ | 26.63 | | | | (0.14 | ) | | | 9.39 | | | | 9.25 | | | | (1.35 | ) | | | — | | |
2019 | | $ | 20.74 | | | | (0.11 | ) | | | 6.00 | | | | 5.89 | | | | — | | | | — | | |
2018 | | $ | 26.55 | | | | (0.07 | ) | | | (1.86 | ) | | | (1.93 | ) | | | (3.84 | ) | | | (0.04 | ) | |
2017 | | $ | 21.90 | | | | (0.04 | ) | | | 4.69 | | | | 4.65 | | | | — | | | | — | | |
Class Y | | | |
Six Months Ended
June 30, 2022
(Unaudited) | | $ | 26.43 | | | | (0.06 | ) | | | (8.95 | ) | | | (9.01 | ) | | | — | | | | — | | |
Year Ended December 31: | |
2021 | | $ | 34.50 | | | | (0.26 | ) | | | 1.69 | | | | 1.43 | | | | (9.50 | ) | | | — | | |
2020 | | $ | 26.61 | | | | (0.14 | ) | | | 9.38 | | | | 9.24 | | | | (1.35 | ) | | | — | | |
2019 | | $ | 20.73 | | | | (0.11 | ) | | | 5.99 | | | | 5.88 | | | | — | | | | — | | |
2018 | | $ | 26.54 | | | | (0.08 | ) | | | (1.85 | ) | | | (1.93 | ) | | | (1.17 | ) | | | (2.71 | ) | |
2017 | | $ | 21.90 | | | | (0.04 | ) | | | 4.68 | | | | 4.64 | | | | — | | | | — | | |
Member Class | | | |
Six Months Ended
June 30, 2022
(Unaudited) | | $ | 24.84 | | | | (0.06 | ) | | | (8.41 | ) | | | (8.47 | ) | | | — | | | | — | | |
Year Ended December 31: | |
2021 | | $ | 33.00 | | | | (0.28 | ) | | | 1.62 | | | | 1.34 | | | | (9.50 | ) | | | — | | |
November 3, 2020 (g)
through
December 31, 2020 | | $ | 29.16 | | | | (0.04 | ) | | | 5.23 | | | | 5.19 | | | | (1.35 | ) | | | — | | |
(a) Per share net investment income (loss) has been calculated using the average daily shares method.
(b) Not annualized for periods less than one year.
(c) Annualized for periods less than one year.
(d) Does not include acquire fund fees and expenses, if any.
(e) Portfolio turnover is calculated on the basis of the Fund as a whole without distinguishing between the classes of shares issued.
(f) Includes impact of Line of credit fees. Without these Line of credit fees, the net expense ratio would have been at the contractual expense cap. (See Note 4 in the Notes to Financial Statements)
(g) Commencement of operations.
See notes to financial statements.
46
Victory Portfolios | | Financial Highlights — continued | |
For a Share Outstanding Throughout Each Period (continued)
| | | | | Ratios to Average Net Assets | | Supplemental Data | |
| | | Total
Distributions | | Net Asset
Value,
End of
Period | | Total
Return(b) | | Net
Expenses(c)(d) | | Net
Investment
Income
(Loss)(c) | | Gross
Expenses(c)(d) | | Net Assets,
End of
Period
(000's) | | Portfolio
Turnover(b)(e) | |
Victory RS Mid Cap Growth Fund | |
Class R6 | |
Six Months Ended
June 30, 2022
(Unaudited) | | | — | | | $ | 17.45 | | | | (34.05 | )% | | | 0.95 | %(f) | | | (0.58 | )% | | | 1.11 | % | | $ | 5,116 | | | | 66 | % | |
Year Ended December 31: | |
2021 | | | (9.50 | ) | | $ | 26.46 | | | | 4.95 | % | | | 0.94 | % | | | (0.73 | )% | | | 0.98 | % | | $ | 19,731 | | | | 90 | % | |
2020 | | | (1.35 | ) | | $ | 34.53 | | | | 34.86 | % | | | 0.94 | % | | | (0.49 | )% | | | 1.01 | % | | $ | 27,861 | | | | 92 | % | |
2019 | | | — | | | $ | 26.63 | | | | 28.40 | % | | | 0.94 | % | | | (0.44 | )% | | | 1.05 | % | | $ | 20,321 | | | | 86 | % | |
2018 | | | (3.88 | ) | | $ | 20.74 | | | | (7.15 | )% | | | 0.94 | % | | | (0.26 | )% | | | 1.32 | % | | $ | 3,793 | | | | 126 | % | |
2017 | | | — | | | $ | 26.55 | | | | 21.23 | % | | | 0.94 | % | | | (0.17 | )% | | | 2.26 | % | | $ | 2,132 | | | | 86 | % | |
Class Y | |
Six Months Ended
June 30, 2022
(Unaudited) | | | — | | | $ | 17.42 | | | | (34.09 | )% | | | 0.96 | %(f) | | | (0.55 | )% | | | 1.16 | % | | $ | 125,299 | | | | 66 | % | |
Year Ended December 31: | |
2021 | | | (9.50 | ) | | $ | 26.43 | | | | 4.96 | % | | | 0.95 | % | | | (0.73 | )% | | | 1.09 | % | | $ | 249,373 | | | | 90 | % | |
2020 | | | (1.35 | ) | | $ | 34.50 | | | | 34.84 | % | | | 0.95 | % | | | (0.50 | )% | | | 1.10 | % | | $ | 466,342 | | | | 92 | % | |
2019 | | | — | | | $ | 26.61 | | | | 28.36 | % | | | 0.95 | % | | | (0.43 | )% | | | 1.10 | % | | $ | 395,586 | | | | 86 | % | |
2018 | | | (3.88 | ) | | $ | 20.73 | | | | (7.15 | )% | | | 0.95 | % | | | (0.27 | )% | | | 1.05 | % | | $ | 243,009 | | | | 126 | % | |
2017 | | | — | | | $ | 26.54 | | | | 21.19 | % | | | 0.95 | % | | | (0.18 | )% | | | 1.06 | % | | $ | 310,050 | | | | 86 | % | |
Member Class | |
Six Months Ended
June 30, 2022
(Unaudited) | | | — | | | $ | 16.37 | | | | (34.10 | )% | | | 1.05 | % | | | (0.60 | )% | | | 2.49 | % | | $ | 1,092 | | | | 66 | % | |
Year Ended December 31: | |
2021 | | | (9.50 | ) | | $ | 24.84 | | | | 4.88 | % | | | 1.05 | % | | | (0.85 | )% | | | 5.66 | % | | $ | 957 | | | | 90 | % | |
November 3, 2020 (g)
through
December 31, 2020 | | | (1.35 | ) | | $ | 33.00 | | | | 17.94 | % | | | 1.05 | % | | | (0.71 | )% | | | 31.23 | % | | $ | 109 | | | | 92 | % | |
See notes to financial statements.
47
Victory Portfolios | | Financial Highlights | |
For a Share Outstanding Throughout Each Period
| | | | | Investment Activities | | Distributions to
Shareholders From | |
| | | Net Asset
Value,
Beginning of
Period | | Net
Investment
Income
(Loss)(a) | | Net Realized
and Unrealized
Gains (Losses) | | Total from
Investment
Activities | | Net
Investment
Income | | Net Realized
Gains from
Investments | |
Victory RS Growth Fund | | | |
Class A | | | |
Six Months Ended
June 30, 2022
(Unaudited) | | $ | 26.14 | | | | (0.06 | ) | | | (7.66 | ) | | | (7.72 | ) | | | — | | | | — | | |
Year Ended December 31: | |
2021 | | $ | 23.84 | | | | (0.18 | ) | | | 4.85 | | | | 4.67 | | | | (0.02 | ) | | | (2.35 | ) | |
2020 | | $ | 19.22 | | | | (0.08 | ) | | | 6.89 | | | | 6.81 | | | | — | | | | (2.19 | ) | |
2019 | | $ | 16.40 | | | | (0.03 | ) | | | 4.90 | | | | 4.87 | | | | — | | | | (2.05 | ) | |
2018 | | $ | 20.60 | | | | (0.06 | ) | | | (1.36 | ) | | | (1.42 | ) | | | — | | | | (2.78 | ) | |
2017 | | $ | 16.44 | | | | (0.02 | ) | | | 5.24 | | | | 5.22 | | | | — | | | | (1.06 | ) | |
Class C | | | |
Six Months Ended
June 30, 2022
(Unaudited) | | $ | 19.94 | | | | (0.12 | ) | | | (5.83 | ) | | | (5.95 | ) | | | — | | | | — | | |
Year Ended December 31: | |
2021 | | $ | 18.80 | | | | (0.31 | ) | | | 3.80 | | | | 3.49 | | | | — | | | | (2.35 | ) | |
2020 | | $ | 15.63 | | | | (0.20 | ) | | | 5.56 | | | | 5.36 | | | | — | | | | (2.19 | ) | |
2019 | | $ | 13.75 | | | | (0.16 | ) | | | 4.09 | | | | 3.93 | | | | — | | | | (2.05 | ) | |
2018 | | $ | 17.90 | | | | (0.21 | ) | | | (1.16 | ) | | | (1.37 | ) | | | — | | | | (2.78 | ) | |
2017 | | $ | 14.51 | | | | (0.15 | ) | | | 4.60 | | | | 4.45 | | | | — | | | | (1.06 | ) | |
Class R | | | |
Six Months Ended
June 30, 2022
(Unaudited) | | $ | 22.71 | | | | (0.11 | ) | | | (6.65 | ) | | | (6.76 | ) | | | — | | | | — | | |
Year Ended December 31: | |
2021 | | $ | 21.09 | | | | (0.30 | ) | | | 4.27 | | | | 3.97 | | | | — | | | | (2.35 | ) | |
2020 | | $ | 17.29 | | | | (0.19 | ) | | | 6.18 | | | | 5.99 | | | | — | | | | (2.19 | ) | |
2019 | | $ | 15.00 | | | | (0.14 | ) | | | 4.48 | | | | 4.34 | | | | — | | | | (2.05 | ) | |
2018 | | $ | 19.22 | | | | (0.18 | ) | | | (1.26 | ) | | | (1.44 | ) | | | — | | | | (2.78 | ) | |
2017 | | $ | 15.49 | | | | (0.13 | ) | | | 4.92 | | | | 4.79 | | | | — | | | | (1.06 | ) | |
Class Y | | | |
Six Months Ended
June 30, 2022
(Unaudited) | | $ | 27.70 | | | | (0.03 | ) | | | (8.12 | ) | | | (8.15 | ) | | | — | | | | — | | |
Year Ended December 31: | |
2021 | | $ | 25.13 | | | | (0.12 | ) | | | 5.13 | | | | 5.01 | | | | (0.09 | ) | | | (2.35 | ) | |
2020 | | $ | 20.11 | | | | (0.02 | ) | | | 7.23 | | | | 7.21 | | | | — | | | | (2.19 | ) | |
2019 | | $ | 17.04 | | | | 0.02 | | | | 5.10 | | | | 5.12 | | | | — | | | | (2.05 | ) | |
2018 | | $ | 21.23 | | | | — | (f) | | | (1.41 | ) | | | (1.41 | ) | | | — | | | | (2.78 | ) | |
2017 | | $ | 16.88 | | | | 0.03 | | | | 5.38 | | | | 5.41 | | | | — | | | | (1.06 | ) | |
(a) Per share net investment income (loss) has been calculated using the average daily shares method.
(b) Not annualized for periods less than one year.
(c) Annualized for periods less than one year.
See notes to financial statements.
48
Victory Portfolios | | Financial Highlights — continued | |
For a Share Outstanding Throughout Each Period
| | | | | Ratios to Average Net Assets | | Supplemental Data | |
| | | Total
Distributions | | Net Asset
Value,
End of
Period | | Total
Return
(Excludes
Sales
Charge)(b) | | Net
Expenses(c)(d) | | Net
Investment
Income
(Loss)(c) | | Gross
Expenses(c)(d) | | Net Assets,
End of
Period
(000's) | | Portfolio
Turnover(b)(e) | |
Victory RS Growth Fund | |
Class A | |
Six Months Ended
June 30, 2022
(Unaudited) | | | — | | | $ | 18.42 | | | | (29.53 | )% | | | 1.10 | % | | | (0.57 | )% | | | 1.19 | % | | $ | 209,883 | | | | 54 | % | |
Year Ended December 31: | |
2021 | | | (2.37 | ) | | $ | 26.14 | | | | 19.91 | % | | | 1.10 | % | | | (0.71 | )% | | | 1.17 | % | | $ | 308,663 | | | | 62 | % | |
2020 | | | (2.19 | ) | | $ | 23.84 | | | | 35.64 | % | | | 1.10 | % | | | (0.37 | )% | | | 1.19 | % | | $ | 274,388 | | | | 73 | % | |
2019 | | | (2.05 | ) | | $ | 19.22 | | | | 29.83 | % | | | 1.10 | % | | | (0.16 | )% | | | 1.19 | % | | $ | 223,503 | | | | 95 | % | |
2018 | | | (2.78 | ) | | $ | 16.40 | | | | (6.81 | )% | | | 1.10 | % | | | (0.28 | )% | | | 1.19 | % | | $ | 188,220 | | | | 87 | % | |
2017 | | | (1.06 | ) | | $ | 20.60 | | | | 31.75 | % | | | 1.10 | % | | | (0.09 | )% | | | 1.20 | % | | $ | 218,238 | | | | 74 | % | |
Class C | |
Six Months Ended
June 30, 2022
(Unaudited) | | | — | | | $ | 13.99 | | | | (29.84 | )% | | | 1.93 | % | | | (1.41 | )% | | | 2.58 | % | | $ | 906 | | | | 54 | % | |
Year Ended December 31: | |
2021 | | | (2.35 | ) | | $ | 19.94 | | | | 18.95 | % | | | 1.93 | % | | | (1.54 | )% | | | 1.99 | % | | $ | 1,733 | | | | 62 | % | |
2020 | | | (2.19 | ) | | $ | 18.80 | | | | 34.55 | % | | | 1.93 | % | | | (1.20 | )% | | | 2.43 | % | | $ | 3,731 | | | | 73 | % | |
2019 | | | (2.05 | ) | | $ | 15.63 | | | | 28.74 | % | | | 1.93 | % | | | (0.99 | )% | | | 2.33 | % | | $ | 4,240 | | | | 95 | % | |
2018 | | | (2.78 | ) | | $ | 13.75 | | | | (7.56 | )% | | | 1.93 | % | | | (1.10 | )% | | | 2.20 | % | | $ | 4,409 | | | | 87 | % | |
2017 | | | (1.06 | ) | | $ | 17.90 | | | | 30.57 | % | | | 1.93 | % | | | (0.92 | )% | | | 2.10 | % | | $ | 6,974 | | | | 74 | % | |
Class R | |
Six Months Ended
June 30, 2022
(Unaudited) | | | — | | | $ | 15.95 | | | | (29.77 | )% | | | 1.71 | % | | | (1.17 | )% | | | 3.44 | % | | $ | 387 | | | | 54 | % | |
Year Ended December 31: | |
2021 | | | (2.35 | ) | | $ | 22.71 | | | | 19.17 | % | | | 1.71 | % | | | (1.32 | )% | | | 1.71 | % | | $ | 542 | | | | 62 | % | |
2020 | | | (2.19 | ) | | $ | 21.09 | | | | 34.87 | % | | | 1.71 | % | | | (0.98 | )% | | | 6.08 | % | | $ | 420 | | | | 73 | % | |
2019 | | | (2.05 | ) | | $ | 17.29 | | | | 29.08 | % | | | 1.71 | % | | | (0.77 | )% | | | 5.41 | % | | $ | 438 | | | | 95 | % | |
2018 | | | (2.78 | ) | | $ | 15.00 | | | | (7.41 | )% | | | 1.71 | % | | | (0.88 | )% | | | 3.49 | % | | $ | 516 | | | | 87 | % | |
2017 | | | (1.06 | ) | | $ | 19.22 | | | | 30.92 | % | | | 1.71 | % | | | (0.70 | )% | | | 2.72 | % | | $ | 830 | | | | 74 | % | |
Class Y | |
Six Months Ended
June 30, 2022
(Unaudited) | | | — | | | $ | 19.55 | | | | (29.42 | )% | | | 0.83 | % | | | (0.30 | )% | | | 0.95 | % | | $ | 21,188 | | | | 54 | % | |
Year Ended December 31: | |
2021 | | | (2.44 | ) | | $ | 27.70 | | | | 20.22 | % | | | 0.83 | % | | | (0.44 | )% | | | 0.91 | % | | $ | 33,772 | | | | 62 | % | |
2020 | | | (2.19 | ) | | $ | 25.13 | | | | 36.06 | % | | | 0.83 | % | | | (0.09 | )% | | | 0.99 | % | | $ | 29,875 | | | | 73 | % | |
2019 | | | (2.05 | ) | | $ | 20.11 | | | | 30.18 | % | | | 0.83 | % | | | 0.11 | % | | | 0.98 | % | | $ | 31,473 | | | | 95 | % | |
2018 | | | (2.78 | ) | | $ | 17.04 | | | | (6.56 | )% | | | 0.83 | % | | | (0.01 | )% | | | 0.97 | % | | $ | 26,457 | | | | 87 | % | |
2017 | | | (1.06 | ) | | $ | 21.23 | | | | 32.05 | % | | | 0.83 | % | | | 0.17 | % | | | 0.97 | % | | $ | 30,309 | | | | 74 | % | |
(d) Does not include acquire fund fees and expenses, if any.
(e) Portfolio turnover is calculated on the basis of the Fund as a whole without distinguishing between the classes of shares issued.
(f) Amount is less than $0.005 per share.
See notes to financial statements.
49
Victory Portfolios | | Financial Highlights | |
For a Share Outstanding Throughout Each Period
| | | | | Investment Activities | | Distributions
to
Shareholders
From | | | |
| | | Net Asset
Value,
Beginning of
Period | | Net
Investment
Income
(Loss)(a) | | Net Realized
and Unrealized
Gains (Losses) | | Total from
Investment
Activities | | Net Realized
Gains from
Investments | |
Total
Distributions | | Net Asset
Value,
End of
Period | | Total
Return
(Excludes
Sales
Charge)(b) | |
Victory RS Science and Technology Fund | | | |
Class A | | | |
Six Months Ended
June 30, 2022
(Unaudited) | | $ | 28.34 | | | | (0.12 | ) | | | (11.73 | ) | | | (11.85 | ) | | | — | | | | — | | | $ | 16.49 | | | | (41.81 | )% | |
Year Ended December 31: | |
2021 | | $ | 36.35 | | | | (0.46 | ) | | | (3.10 | ) | | | (3.56 | ) | | | (4.45 | ) | | | (4.45 | ) | | $ | 28.34 | | | | (9.25 | )% | |
2020 | | $ | 23.37 | | | | (0.34 | ) | | | 15.48 | | | | 15.14 | | | | (2.16 | ) | | | (2.16 | ) | | $ | 36.35 | | | | 65.03 | % | |
2019 | | $ | 18.34 | | | | (0.26 | ) | | | 7.43 | | | | 7.17 | | | | (2.14 | ) | | | (2.14 | ) | | $ | 23.37 | | | | 39.32 | % | |
2018 | | $ | 21.56 | | | | (0.27 | ) | | | 0.06 | | | | (0.21 | ) | | | (3.01 | ) | | | (3.01 | ) | | $ | 18.34 | | | | (0.73 | )% | |
2017 | | $ | 17.49 | | | | (0.25 | ) | | | 8.04 | | | | 7.79 | | | | (3.72 | ) | | | (3.72 | ) | | $ | 21.56 | | | | 44.74 | % | |
Class C | | | |
Six Months Ended
June 30, 2022
(Unaudited) | | $ | 19.48 | | | | (0.14 | ) | | | (8.05 | ) | | | (8.19 | ) | | | — | | | | — | | | $ | 11.29 | | | | (42.04 | )% | |
Year Ended December 31: | |
2021 | | $ | 26.81 | | | | (0.55 | ) | | | (2.33 | ) | | | (2.88 | ) | | | (4.45 | ) | | | (4.45 | ) | | $ | 19.48 | | | | (10.03 | )% | |
2020 | | $ | 17.73 | | | | (0.41 | ) | | | 11.65 | | | | 11.24 | | | | (2.16 | ) | | | (2.16 | ) | | $ | 26.81 | | | | 63.71 | % | |
2019 | | $ | 14.40 | | | | (0.35 | ) | | | 5.82 | | | | 5.47 | | | | (2.14 | ) | | | (2.14 | ) | | $ | 17.73 | | | | 38.27 | % | |
2018 | | $ | 17.73 | | | | (0.38 | ) | | | 0.06 | | | | (0.32 | ) | | | (3.01 | ) | | | (3.01 | ) | | $ | 14.40 | | | | (1.58 | )% | |
2017 | | $ | 14.96 | | | | (0.36 | ) | | | 6.85 | | | | 6.49 | | | | (3.72 | ) | | | (3.72 | ) | | $ | 17.73 | | | | 43.70 | % | |
Class R | | | |
Six Months Ended
June 30, 2022
(Unaudited) | | $ | 22.45 | | | | (0.13 | ) | | | (9.29 | ) | | | (9.42 | ) | | | — | | | | — | | | $ | 13.03 | | | | (41.96 | )% | |
Year Ended December 31: | |
2021 | | $ | 29.99 | | | | (0.51 | ) | | | (2.58 | ) | | | (3.09 | ) | | | (4.45 | ) | | | (4.45 | ) | | $ | 22.45 | | | | (9.66 | )% | |
2020 | | $ | 19.60 | | | | (0.39 | ) | | | 12.94 | | | | 12.55 | | | | (2.16 | ) | | | (2.16 | ) | | $ | 29.99 | | | | 64.32 | % | |
2019 | | $ | 15.70 | | | | (0.31 | ) | | | 6.35 | | | | 6.04 | | | | (2.14 | ) | | | (2.14 | ) | | $ | 19.60 | | | | 38.73 | % | |
2018 | | $ | 18.99 | | | | (0.33 | ) | | | 0.05 | | | | (0.28 | ) | | | (3.01 | ) | | | (3.01 | ) | | $ | 15.70 | | | | (1.20 | )% | |
2017 | | $ | 15.78 | | | | (0.31 | ) | | | 7.24 | | | | 6.93 | | | | (3.72 | ) | | | (3.72 | ) | | $ | 18.99 | | | | 44.05 | % | |
(a) Per share net investment income (loss) has been calculated using the average daily shares method.
(b) Not annualized for periods less than one year.
(c) Annualized for periods less than one year.
(d) Does not include acquire fund fees and expenses, if any.
(e) Portfolio turnover is calculated on the basis of the Fund as a whole without distinguishing between the classes of shares issued.
See notes to financial statements.
50
Victory Portfolios | | Financial Highlights — continued | |
For a Share Outstanding Throughout Each Period
| | | Ratios to Average Net Assets | | Supplemental Data | |
| | | Net
Expenses(c)(d) | | Net
Investment
Income
(Loss)(c) | | Gross
Expenses(c)(d) | | Net Assets,
End of
Period
(000's) | | Portfolio
Turnover(b)(e) | |
Victory RS Science and Technology Fund | |
Class A | |
Six Months Ended
June 30, 2022
(Unaudited) | | | 1.49 | % | | | (1.22 | )% | | | 1.50 | % | | $ | 141,315 | | | | 31 | % | |
Year Ended December 31: | |
2021 | | | 1.47 | % | | | (1.28 | )% | | | 1.47 | % | | $ | 250,490 | | | | 46 | % | |
2020 | | | 1.48 | % | | | (1.22 | )% | | | 1.48 | % | | $ | 320,605 | | | | 30 | % | |
2019 | | | 1.48 | % | | | (1.14 | )% | | | 1.48 | % | | $ | 199,591 | | | | 88 | % | |
2018 | | | 1.47 | % | | | (1.10 | )% | | | 1.47 | % | | $ | 140,389 | | | | 83 | % | |
2017 | | | 1.49 | % | | | (1.18 | )% | | | 1.49 | % | | $ | 146,002 | | | | 89 | % | |
Class C | |
Six Months Ended
June 30, 2022
(Unaudited) | | | 2.28 | % | | | (2.01 | )% | | | 2.40 | % | | $ | 5,390 | | | | 31 | % | |
Year Ended December 31: | |
2021 | | | 2.28 | % | | | (2.09 | )% | | | 2.28 | % | | $ | 11,168 | | | | 46 | % | |
2020 | | | 2.28 | % | | | (2.03 | )% | | | 2.32 | % | | $ | 18,398 | | | | 30 | % | |
2019 | | | 2.28 | % | | | (1.94 | )% | | | 2.34 | % | | $ | 14,054 | | | | 88 | % | |
2018 | | | 2.28 | % | | | (1.91 | )% | | | 2.31 | % | | $ | 11,857 | | | | 83 | % | |
2017 | | | 2.28 | % | | | (1.97 | )% | | | 2.31 | % | | $ | 11,831 | | | | 89 | % | |
Class R | |
Six Months Ended
June 30, 2022
(Unaudited) | | | 1.93 | % | | | (1.66 | )% | | | 3.07 | % | | $ | 589 | | | | 31 | % | |
Year Ended December 31: | |
2021 | | | 1.93 | % | | | (1.74 | )% | | | 1.93 | % | | $ | 1,089 | | | | 46 | % | |
2020 | | | 1.93 | % | | | (1.68 | )% | | | 3.69 | % | | $ | 1,273 | | | | 30 | % | |
2019 | | | 1.93 | % | | | (1.59 | )% | | | 4.28 | % | | $ | 681 | | | | 88 | % | |
2018 | | | 1.93 | % | | | (1.56 | )% | | | 2.75 | % | | $ | 707 | | | | 83 | % | |
2017 | | | 1.93 | % | | | (1.62 | )% | | | 2.54 | % | | $ | 1,705 | | | | 89 | % | |
See notes to financial statements.
51
Victory Portfolios | | Financial Highlights | |
For a Share Outstanding Throughout Each Period
| | | | | Investment Activities | | Distributions
to
Shareholders
From | | | |
| | | Net Asset
Value,
Beginning of
Period | | Net
Investment
Income
(Loss)(a) | | Net Realized
and Unrealized
Gains (Losses) | | Total from
Investment
Activities | | Net Realized
Gains from
Investments | | Total
Distributions | | Net Asset
Value,
End of
Period | | Total
Return(b) | |
Victory RS Science and Technology Fund | | | |
Class Y | | | |
Six Months Ended
June 30, 2022
(Unaudited) | | $ | 31.49 | | | | (0.11 | ) | | | (13.04 | ) | | | (13.15 | ) | | | — | | | | — | | | $ | 18.34 | | | | (41.76 | )% | |
Year Ended December 31: | |
2021 | | $ | 39.73 | | | | (0.41 | ) | | | (3.38 | ) | | | (3.79 | ) | | | (4.45 | ) | | | (4.45 | ) | | $ | 31.49 | | | | (9.04 | )% | |
2020 | | $ | 25.36 | | | | (0.29 | ) | | | 16.82 | | | | 16.53 | | | | (2.16 | ) | | | (2.16 | ) | | $ | 39.73 | | | | 65.40 | % | |
2019 | | $ | 19.72 | | | | (0.22 | ) | | | 8.00 | | | | 7.78 | | | | (2.14 | ) | | | (2.14 | ) | | $ | 25.36 | | | | 39.66 | % | |
2018 | | $ | 22.90 | | | | (0.22 | ) | | | 0.05 | | | | (0.17 | ) | | | (3.01 | ) | | | (3.01 | ) | | $ | 19.72 | | | | (0.51 | )% | |
2017 | | $ | 18.37 | | | | (0.21 | ) | | | 8.46 | | | | 8.25 | | | | (3.72 | ) | | | (3.72 | ) | | $ | 22.90 | | | | 45.11 | % | |
(a) Per share net investment income (loss) has been calculated using the average daily shares method.
(b) Not annualized for periods less than one year.
(c) Annualized for periods less than one year.
(d) Does not include acquire fund fees and expenses, if any.
(e) Portfolio turnover is calculated on the basis of the Fund as a whole without distinguishing between the classes of shares issued.
See notes to financial statements.
52
Victory Portfolios | | Financial Highlights — continued | |
For a Share Outstanding Throughout Each Period (continued)
| | Ratios to Average Net Assets | | Supplemental Data | |
| | | Net
Expenses(c)(d) | | Net
Investment
Income
(Loss)(c) | | Gross
Expenses(c)(d) | | Net Assets,
End of
Period
(000's) | | Portfolio
Turnover(b)(e) | |
Victory RS Science and Technology Fund | |
Class Y | |
Six Months Ended
June 30, 2022
(Unaudited) | | | 1.24 | % | | | (0.97 | )% | | | 1.30 | % | | $ | 37,348 | | | | 31 | % | |
Year Ended December 31: | |
2021 | | | 1.23 | % | | | (1.05 | )% | | | 1.23 | % | | $ | 81,080 | | | | 46 | % | |
2020 | | | 1.24 | % | | | (0.99 | )% | | | 1.26 | % | | $ | 109,275 | | | | 30 | % | |
2019 | | | 1.24 | % | | | (0.89 | )% | | | 1.26 | % | | $ | 77,998 | | | | 88 | % | |
2018 | | | 1.24 | % | | | (0.85 | )% | | | 1.25 | % | | $ | 53,395 | | | | 83 | % | |
2017 | | | 1.24 | % | | | (0.92 | )% | | | 1.26 | % | | $ | 32,047 | | | | 89 | % | |
See notes to financial statements.
53
Victory Portfolios | | Financial Highlights | |
For a Share Outstanding Throughout Each Period
| | | | | Investment Activities | | Distributions
to
Shareholders
From | | | |
| | | Net Asset
Value,
Beginning of
Period | | Net
Investment
Income
(Loss)(a) | | Net Realized
and Unrealized
Gains (Losses) | | Total from
Investment
Activities | | Net Realized
Gains from
Investments | |
Total
Distributions | | Net Asset
Value,
End of
Period | | Total
Return
(Excludes
Sales
Charge)(b) | |
Victory RS Small Cap Equity Fund | | | |
Class A | | | |
Six Months Ended
June 30, 2022
(Unaudited) | | $ | 13.32 | | | | (0.06 | ) | | | (5.07 | ) | | | (5.13 | ) | | | — | | | | — | | | $ | 8.19 | | | | (38.51 | )% | |
Year Ended December 31: | |
2021 | | $ | 18.02 | | | | (0.21 | ) | | | (1.28 | ) | | | (1.49 | ) | | | (3.21 | ) | | | (3.21 | ) | | $ | 13.32 | | | | (7.36 | )% | |
2020 | | $ | 16.05 | | | | (0.19 | ) | | | 6.17 | | | | 5.98 | | | | (4.01 | ) | | | (4.01 | ) | | $ | 18.02 | | | | 37.99 | % | |
2019 | | $ | 12.97 | | | | (0.15 | ) | | | 5.11 | | | | 4.96 | | | | (1.88 | ) | | | (1.88 | ) | | $ | 16.05 | | | | 38.49 | % | |
2018 | | $ | 18.88 | | | | (0.16 | ) | | | (1.47 | ) | | | (1.63 | ) | | | (4.28 | ) | | | (4.28 | ) | | $ | 12.97 | | | | (8.39 | )% | |
2017 | | $ | 14.41 | | | | (0.14 | ) | | | 5.55 | | | | 5.41 | | | | (0.94 | ) | | | (0.94 | ) | | $ | 18.88 | | | | 37.57 | % | |
Class C | | | |
Six Months Ended
June 30, 2022
(Unaudited) | | $ | 13.49 | | | | (0.10 | ) | | | (5.12 | ) | | | (5.22 | ) | | | — | | | | — | | | $ | 8.27 | | | | (38.70 | )% | |
Year Ended December 31: | |
2021 | | $ | 18.39 | | | | (0.37 | ) | | | (1.32 | ) | | | (1.69 | ) | | | (3.21 | ) | | | (3.21 | ) | | $ | 13.49 | | | | (8.14 | )% | |
2020 | | $ | 49.61 | | | | (0.84 | ) | | | 17.74 | | | | 16.90 | | | | (48.12 | ) | | | (48.12 | ) | | $ | 18.39 | | | | 36.75 | % | |
2019 | | $ | 52.83 | | | | (1.08 | ) | | | 20.42 | | | | 19.34 | | | | (22.56 | ) | | | (22.56 | ) | | $ | 49.61 | | | | 37.26 | % | |
2018 | | $ | 115.36 | | | | (2.04 | ) | | | (9.13 | ) | | | (11.17 | ) | | | (51.36 | ) | | | (51.36 | ) | | $ | 52.83 | | | | (9.23 | )% | |
2017 | | $ | 92.89 | | | | (1.80 | ) | | | 35.55 | | | | 33.75 | | | | (11.28 | ) | | | (11.28 | ) | | $ | 115.36 | | | | 36.34 | % | |
Class R | | | |
Six Months Ended
June 30, 2022
(Unaudited) | | $ | 8.41 | | | | (0.05 | ) | | | (3.20 | ) | | | (3.25 | ) | | | — | | | | — | | | $ | 5.16 | | | | (38.64 | )% | |
Year Ended December 31: | |
2021 | | $ | 12.79 | | | | (0.21 | ) | | | (0.96 | ) | | | (1.17 | ) | | | (3.21 | ) | | | (3.21 | ) | | $ | 8.41 | | | | (7.87 | )% | |
2020 | | $ | 12.32 | | | | (0.20 | ) | | | 4.68 | | | | 4.48 | | | | (4.01 | ) | | | (4.01 | ) | | $ | 12.79 | | | | 37.31 | % | |
2019 | | $ | 10.32 | | | | (0.18 | ) | | | 4.06 | | | | 3.88 | | | | (1.88 | ) | | | (1.88 | ) | | $ | 12.32 | | | | 37.91 | % | |
2018 | | $ | 16.08 | | | | (0.23 | ) | | | (1.25 | ) | | | (1.48 | ) | | | (4.28 | ) | | | (4.28 | ) | | $ | 10.32 | | | | (8.92 | )% | |
2017 | | $ | 12.44 | | | | (0.20 | ) | | | 4.78 | | | | 4.58 | | | | (0.94 | ) | | | (0.94 | ) | | $ | 16.08 | | | | 36.84 | % | |
(a) Per share net investment income (loss) has been calculated using the average daily shares method.
(b) Not annualized for periods less than one year.
(c) Annualized for periods less than one year.
(d) Does not include acquire fund fees and expenses, if any.
(e) Portfolio turnover is calculated on the basis of the Fund as a whole without distinguishing between the classes of shares issued.
(f) Reflects increased trading activity due to changes in allocation strategies.
See notes to financial statements.
54
Victory Portfolios | | Financial Highlights — continued | |
For a Share Outstanding Throughout Each Period
| | | Ratios to Average Net Assets | | Supplemental Data | |
| | | Net
Expenses(c)(d) | | Net
Investment
Income
(Loss)(c) | | Gross
Expenses(c)(d) | | Net Assets,
End of
Period
(000's) | | Portfolio
Turnover(b)(e) | |
Victory RS Small Cap Equity Fund | |
Class A | |
Six Months Ended
June 30, 2022
(Unaudited) | | | 1.31 | % | | | (1.21 | )% | | | 1.31 | % | | $ | 34,914 | | | | 73 | % | |
Year Ended December 31: | |
2021 | | | 1.25 | % | | | (1.18 | )% | | | 1.25 | % | | $ | 60,699 | | | | 113 | % | |
2020 | | | 1.29 | % | | | (1.14 | )% | | | 1.29 | % | | $ | 76,611 | | | | 157 | %(f) | |
2019 | | | 1.26 | % | | | (0.93 | )% | | | 1.26 | % | | $ | 63,247 | | | | 89 | % | |
2018 | | | 1.22 | % | | | (0.78 | )% | | | 1.22 | % | | $ | 51,619 | | | | 77 | % | |
2017 | | | 1.25 | % | | | (0.84 | )% | | | 1.25 | % | | $ | 65,514 | | | | 79 | % | |
Class C | |
Six Months Ended
June 30, 2022
(Unaudited) | | | 2.10 | % | | | (2.00 | )% | | | 6.81 | % | | $ | 173 | | | | 73 | % | |
Year Ended December 31: | |
2021 | | | 2.10 | % | | | (2.04 | )% | | | 4.32 | % | | $ | 380 | | | | 113 | % | |
2020 | | | 2.10 | % | | | (1.94 | )% | | | 5.26 | % | | $ | 515 | | | | 157 | %(f) | |
2019 | | | 2.10 | % | | | (1.76 | )% | | | 3.86 | % | | $ | 478 | | | | 89 | % | |
2018 | | | 2.10 | % | | | (1.71 | )% | | | 4.24 | % | | $ | 616 | | | | 77 | % | |
2017 | | | 2.10 | % | | | (1.69 | )% | | | 3.87 | % | | $ | 533 | | | | 79 | % | |
Class R | |
Six Months Ended
June 30, 2022
(Unaudited) | | | 1.75 | % | | | (1.65 | )% | | | 2.25 | % | | $ | 1,499 | | | | 73 | % | |
Year Ended December 31: | |
2021 | | | 1.75 | % | | | (1.68 | )% | | | 1.89 | % | | $ | 2,949 | | | | 113 | % | |
2020 | | | 1.75 | % | | | (1.59 | )% | | | 2.05 | % | | $ | 3,325 | | | | 157 | %(f) | |
2019 | | | 1.75 | % | | | (1.42 | )% | | | 2.05 | % | | $ | 2,874 | | | | 89 | % | |
2018 | | | 1.75 | % | | | (1.30 | )% | | | 1.88 | % | | $ | 2,303 | | | | 77 | % | |
2017 | | | 1.75 | % | | | (1.34 | )% | | | 1.97 | % | | $ | 3,381 | | | | 79 | % | |
See notes to financial statements.
55
Victory Portfolios | | Financial Highlights | |
For a Share Outstanding Throughout Each Period
| | | | | Investment Activities | | Distributions
to
Shareholders
From | | | |
| | | Net Asset
Value,
Beginning of
Period | | Net
Investment
Income
(Loss)(a) | | Net Realized
and Unrealized
Gains (Losses) | | Total from
Investment
Activities | | Net Realized
Gains from
Investments | | Total
Distributions | | Net Asset
Value,
End of
Period | | Total
Return(b) | |
Victory RS Small Cap Equity Fund | | | |
Class Y | | | |
Six Months Ended
June 30, 2022
(Unaudited) | | $ | 13.98 | | | | (0.05 | ) | | | (5.32 | ) | | | (5.37 | ) | | | — | | | | — | | | $ | 8.61 | | | | (38.41 | )% | |
Year Ended December 31: | |
2021 | | $ | 18.71 | | | | (0.19 | ) | | | (1.33 | ) | | | (1.52 | ) | | | (3.21 | ) | | | (3.21 | ) | | $ | 13.98 | | | | (7.25 | )% | |
2020 | | $ | 16.52 | | | | (0.16 | ) | | | 6.36 | | | | 6.20 | | | | (4.01 | ) | | | (4.01 | ) | | $ | 18.71 | | | | 38.24 | % | |
2019 | | $ | 13.29 | | | | (0.13 | ) | | | 5.24 | | | | 5.11 | | | | (1.88 | ) | | | (1.88 | ) | | $ | 16.52 | | | | 38.69 | % | |
2018 | | $ | 19.20 | | | | (0.14 | ) | | | (1.49 | ) | | | (1.63 | ) | | | (4.28 | ) | | | (4.28 | ) | | $ | 13.29 | | | | (8.23 | )% | |
2017 | | $ | 14.62 | | | | (0.14 | ) | | | 5.66 | | | | 5.52 | | | | (0.94 | ) | | | (0.94 | ) | | $ | 19.20 | | | | 37.78 | % | |
Member Class | | | |
Six Months Ended
June 30, 2022
(Unaudited) | | $ | 13.34 | | | | (0.05 | ) | | | (5.08 | ) | | | (5.13 | ) | | | — | | | | — | | | $ | 8.21 | | | | (38.46 | )% | |
Year Ended December 31: | |
2021 | | $ | 18.04 | | | | (0.19 | ) | | | (1.30 | ) | | | (1.49 | ) | | | (3.21 | ) | | | (3.21 | ) | | $ | 13.34 | | | | (7.35 | )% | |
November 3, 2020 (g)
through
December 31, 2020 | | $ | 17.72 | | | | (0.04 | ) | | | 4.37 | | | | 4.33 | | | | (4.01 | ) | | | (4.01 | ) | | $ | 18.04 | | | | 25.09 | % | |
(a) Per share net investment income (loss) has been calculated using the average daily shares method.
(b) Not annualized for periods less than one year.
(c) Annualized for periods less than one year.
(d) Does not include acquire fund fees and expenses, if any.
(e) Portfolio turnover is calculated on the basis of the Fund as a whole without distinguishing between the classes of shares issued.
(f) Reflects increased trading activity due to changes in allocation strategies.
(g) Commencement of operations.
See notes to financial statements.
56
Victory Portfolios | | Financial Highlights — continued | |
For a Share Outstanding Throughout Each Period (continued)
| | Ratios to Average Net Assets | | Supplemental Data | |
| | | Net
Expenses(c)(d) | | Net
Investment
Income
(Loss)(c) | | Gross
Expenses(c)(d) | | Net Assets,
End of
Period
(000's) | | Portfolio
Turnover(b)(e) | |
Victory RS Small Cap Equity Fund | |
Class Y | |
Six Months Ended
June 30, 2022
(Unaudited) | | | 1.10 | % | | | (0.99 | )% | | | 1.34 | % | | $ | 1,930 | | | | 73 | % | |
Year Ended December 31: | |
2021 | | | 1.10 | % | | | (1.03 | )% | | | 1.10 | % | | $ | 3,095 | | | | 113 | % | |
2020 | | | 1.10 | % | | | (0.95 | )% | | | 1.58 | % | | $ | 4,449 | | | | 157 | %(f) | |
2019 | | | 1.10 | % | | | (0.77 | )% | | | 1.43 | % | | $ | 3,275 | | | | 89 | % | |
2018 | | | 1.10 | % | | | (0.69 | )% | | | 1.68 | % | | $ | 2,750 | | | | 77 | % | |
2017 | | | 1.10 | % | | | (0.78 | )% | | | 1.34 | % | | $ | 6,398 | | | | 79 | % | |
Member Class | |
Six Months Ended
June 30, 2022
(Unaudited) | | | 1.15 | % | | | (1.04 | )% | | | 2.57 | % | | $ | 1,203 | | | | 73 | % | |
Year Ended December 31: | |
2021 | | | 1.15 | % | | | (1.08 | )% | | | 3.55 | % | | $ | 1,394 | | | | 113 | % | |
November 3, 2020 (g)
through
December 31, 2020 | | | 1.15 | % | | | (1.14 | )% | | | 23.73 | % | | $ | 218 | | | | 157 | %(f) | |
See notes to financial statements.
57
Victory Portfolios | | Notes to Financial Statements
June 30, 2022 | |
(Unaudited)
1. Organization:
Victory Portfolios (the "Trust") is organized as a Delaware statutory trust and the Trust is registered under the Investment Company Act of 1940, as amended (the "1940 Act"), as an open-end investment company. The Trust is comprised of 40 funds and is authorized to issue an unlimited number of shares, which are units of beneficial interest with a par value of $0.001 per share.
The accompanying financial statements are those of the following six Funds (collectively, the "Funds" and individually, a "Fund"). Each Fund is classified as diversified under the 1940 Act.
Funds (Legal Name) | | Funds (Short Name) | | Investment Share
Classes Offered | |
Victory RS Small Cap Growth Fund | | RS Small Cap Growth Fund | | A, C, R, R6, and Y | |
Victory RS Select Growth Fund | | RS Select Growth Fund | | A, C, R, R6, and Y | |
Victory RS Mid Cap Growth Fund
| | RS Mid Cap Growth Fund
| | A, C, R, R6, Y, and
Member Class | |
Victory RS Growth Fund | | RS Growth Fund | | A, C, R, and Y | |
Victory RS Science and Technology Fund | | RS Science and Technology Fund | | A, C, R, and Y | |
Victory RS Small Cap Equity Fund
| | RS Small Cap Equity Fund
| | A, C, R, Y, and
Member Class | |
Each class of shares of a Fund has substantially identical rights and privileges except with respect to sales charges, fees paid under distribution plans, expenses allocable exclusively to each class of shares, voting rights on matters solely affecting a single class of shares, and the exchange privilege of each class of shares.
Under the Trust's organizational documents, its officers and trustees are indemnified against certain liabilities arising out of the performance of their duties to the Funds. In addition, in the normal course of business, the Funds enter into contracts with their vendors and others that provide for general indemnifications. The Funds' maximum exposure under these arrangements is unknown, as this would involve future claims that may be made against the Funds. However, based on experience, the Funds expect that risk of loss to be remote.
2. Significant Accounting Policies:
The following is a summary of significant accounting policies followed by the Trust in the preparation of its financial statements. The policies are in conformity with U.S. Generally Accepted Accounting Principles ("GAAP"). The preparation of financial statements in accordance with GAAP requires management to make estimates and assumptions that affect the reported amounts of assets and liabilities and disclosure of contingent assets and liabilities at the date of the financial statements and the reported amounts of income and expenses for the period. Actual results could differ from those estimates. The Funds follow the specialized accounting and reporting requirements under GAAP that are applicable to investment companies under Accounting Standards Codification Topic 946.
Investment Valuation:
The Funds record investments at fair value. Fair value is defined as the price that would be received to sell an asset or paid to transfer a liability in an orderly transaction between market participants at the measurement date.
The valuation techniques described below maximize the use of observable inputs and minimize the use of unobservable inputs in determining fair value. The inputs used for valuing the Funds' investments are summarized in the three broad levels listed below:
• Level 1 — quoted prices in active markets for identical securities
• Level 2 — other significant observable inputs (including quoted prices for similar securities or interest rates applicable to those securities, etc.)
• Level 3 — significant unobservable inputs (including the Funds' own assumptions in determining the fair value of investments)
58
Victory Portfolios | | Notes to Financial Statements — continued
June 30, 2022 | |
(Unaudited)
Changes in valuation techniques may result in transfers in or out of an assigned level within the disclosure hierarchy. The inputs or methodologies used for valuation techniques are not necessarily an indication of the risk associated with entering into those investments.
Victory Capital Management Inc. ("VCM" or the "Adviser") has established the Pricing and Liquidity Committee (the "Committee"), and subject to the Trust's Board of Trustees' (the "Board") oversight, the Committee administers and oversees the Funds' valuation policies and procedures, which are approved by the Board.
Portfolio securities listed or traded on securities exchanges, including Exchange-Traded Funds ("ETFs"), and American Depositary Receipts ("ADRs"), are valued at the closing price on the exchange or system where the security is principally traded, if available, or at the Nasdaq Official Closing Price. If there have been no sales for that day on the exchange or system, then a security is valued at the last available bid quotation on the exchange or system where the security is principally traded. In each of these situations, valuations are typically categorized as Level 1 in the fair value hierarchy.
Investments in open-end investment companies, other than ETFs, are valued at their net asset value ("NAV"). These valuations are typically categorized as Level 1 in the fair value hierarchy.
In the event that price quotations or valuations are not readily available, investments are valued at fair value in accordance with procedures established by and under the general supervision and responsibility of the Board. These valuations are typically categorized as Level 2 or Level 3 in the fair value hierarchy, based on the observability of inputs used to determine the fair value. The effect of fair value pricing is that securities may not be priced on the basis of quotations from the primary market in which they are traded and the actual price realized from the sale of a security may differ materially from the fair value price. Valuing these securities at fair value is intended to cause the Fund's NAV to be more reliable than it otherwise would be.
A summary of the valuations as of June 30, 2022, based upon the three levels defined above, is included in the table below while the breakdown, by category, of investments is disclosed on the Schedules of Portfolio Investments:
| | | Level 1 | | Level 2 | | Level 3 | | Total | |
RS Small Cap Growth Fund | |
Common Stocks | | $ | 1,044,630,414 | | | $ | — | | | $ | — | | | $ | 1,044,630,414 | | |
Collateral for Securities Loaned | | | 56,345,523 | | | | — | | | | — | | | | 56,345,523 | | |
Total | | $ | 1,100,975,937 | | | $ | — | | | $ | — | | | $ | 1,100,975,937 | | |
RS Select Growth Fund | |
Common Stocks | | $ | 113,328,653 | | | $ | — | | | $ | — | | | $ | 113,328,653 | | |
Total | | $ | 113,328,653 | | | $ | — | | | $ | — | | | $ | 113,328,653 | | |
RS Mid Cap Growth Fund | |
Common Stocks | | $ | 187,230,502 | | | $ | — | | | $ | — | | | $ | 187,230,502 | | |
Collateral for Securities Loaned | | | 1,727,171 | | | | — | | | | — | | | | 1,727,171 | | |
Total | | $ | 188,957,673 | | | $ | — | | | $ | — | | | $ | 188,957,673 | | |
RS Growth Fund | |
Common Stocks | | $ | 231,838,267 | | | $ | — | | | $ | — | | | $ | 231,838,267 | | |
Collateral for Securities Loaned | | | 1,285,351 | | | | — | | | | — | | | | 1,285,351 | | |
Total | | $ | 233,123,618 | | | $ | — | | | $ | — | | | $ | 233,123,618 | | |
RS Science and Technology Fund | |
Common Stocks | | $ | 183,322,626 | | | $ | — | | | $ | — | | | $ | 183,322,626 | | |
Warrants | | | 12,690 | | | | — | | | | — | | | | 12,690 | | |
Collateral for Securities Loaned | | | 16,031,838 | | | | — | | | | — | | | | 16,031,838 | | |
Total | | $ | 199,367,154 | | | $ | — | | | $ | — | | | $ | 199,367,154 | | |
59
Victory Portfolios | | Notes to Financial Statements — continued
June 30, 2022 | |
(Unaudited)
| | | Level 1 | | Level 2 | | Level 3 | | Total | |
RS Small Cap Equity Fund | |
Common Stocks | | $ | 38,646,317 | | | $ | — | | | $ | — | | | $ | 38,646,317 | | |
Collateral for Securities Loaned | | | 3,003,257 | | | | — | | | | — | | | | 3,003,257 | | |
Total | | $ | 41,649,574 | | | $ | — | | | $ | — | | | $ | 41,649,574 | | |
For the six months ended June 30, 2022, there were no transfers in or out of Level 3 in the fair value hierarchy.
Real Estate Investment Trusts ("REITs"):
The Funds may invest in REITs, which report information on the source of their distributions annually. REITs are pooled investment vehicles that invest primarily in income-producing real estate or real-estate related loans or interests (such as mortgages). Certain distributions received from REITs during the year are recorded as realized gains or return of capital as estimated by the Funds or when such information becomes known.
Investment Companies:
Open-End Funds:
The Funds may invest in portfolios of open-end investment companies. These investment companies value securities in their portfolios for which market quotations are readily available at their market values (generally the last reported sale price) and all other securities and assets at their fair value by the methods established by the board of directors of the underlying funds.
Investment Transactions and Related Income:
Changes in holdings of investments are accounted for no later than one business day following the trade date. For financial reporting purposes, however, investment transactions are accounted for on trade date or the last business day of the reporting period. Interest income is determined on the basis of coupon interest accrued using the effective interest method which adjusts, where applicable, the amortization of premiums or accretion of discounts. Dividend income is recorded on the ex-dividend date. Gains or losses realized on sales of securities are recorded on the identified cost basis.
Securities Lending:
The Funds, through a Securities Lending Agreement with Citibank, N.A. ("Citibank"), may lend their securities to qualified financial institutions, such as certain broker-dealers and banks, to earn additional income, net of income retained by Citibank. Borrowers are required to initially secure their loans for collateral in the amount of at least 102% of the value of U.S. securities loaned or at least 105% of the value of non-U.S. securities loaned, marked-to-market daily. Any collateral shortfalls associated with increases in the valuation of the securities loaned are generally cured the next business day. The collateral can be received in the form of cash collateral and/or non-cash collateral. Non-cash collateral can include U.S. Government Securities and other securities as permitted by Securities and Exchange Commission ("SEC") guidelines. The cash collateral is invested in short-term instruments or cash equivalents, primarily open-end investment companies, as noted on the Funds' Schedules of Portfolio Investments. The Funds effectively do not have control of the non-cash collateral and therefore it is not disclosed on the Funds' Schedules of Portfolio Investments. Collateral requirements are determined daily based on the value of the Funds' securities on loan as of the end of the prior business day. During the time portfolio securities are on loan, the borrower will pay the Funds any dividends or interest paid on such securities plus any fee negotiated between the parties to the lending agreement. The Funds also earn a return from the collateral. The Funds pay Citibank various fees in connection with the investment of cash collateral and fees based on the investment income received from securities lending activities. Securities lending income (net of these fees) is disclosed on the Statements of Operations. Loans are terminable upon demand and the borrower must return the loaned securities within the lesser of one standard settlement period or five business days. Although risk is mitigated by
60
Victory Portfolios | | Notes to Financial Statements — continued
June 30, 2022 | |
(Unaudited)
the collateral, a Fund could experience a delay in recovering its securities and possible loss of income or value if the borrower fails to return them. In addition, there is a risk that the value of the short-term investments will be less than the amount of cash collateral required to be returned to the borrower.
The Funds' agreement with Citibank does not include master netting provisions. Non-cash collateral received by the Funds may not be sold or repledged, except to satisfy borrower default.
The following table is a summary of the Funds' securities lending transactions as of June 30, 2022.
| | | Value of
Securities on Loan | | Non-Cash
Collateral | | Cash
Collateral | |
RS Small Cap Growth Fund | | $ | 53,491,274 | | | $ | — | | | $ | 56,345,523 | | |
RS Mid Cap Growth Fund | | | 1,632,835 | | | | — | | | | 1,727,171 | | |
RS Growth Fund | | | 1,215,147 | | | | — | | | | 1,285,351 | | |
RS Science and Technology Fund | | | 15,510,403 | | | | — | | | | 16,031,838 | | |
RS Small Cap Equity Fund | | | 2,916,343 | | | | — | | | | 3,003,257 | | |
Federal Income Taxes:
Each Fund intends to continue to qualify as a regulated investment company by complying with the provisions available to certain investment companies, as defined in applicable sections of the Internal Revenue Code, and to make distributions of net investment income and net realized gains sufficient to relieve it from all, or substantially all, federal income taxes. Accordingly, no provision for federal income taxes is required in the financial statements. The Funds have a tax year end of December 31.
For the six months ended June 30, 2022, the Funds did not incur any income tax, interest, or penalties, and have recorded no liability for net unrecognized tax benefits relating to uncertain tax positions.
Management of the Funds has reviewed tax positions taken in tax years that remain subject to examination by all major tax jurisdictions, including federal (i.e., the last four tax years, which includes the current fiscal tax year end). Management believes that there is no tax liability resulting from unrecognized tax benefits related to uncertain tax positions taken.
Allocations:
Expenses directly attributable to a Fund are charged to that Fund, while expenses that are attributable to more than one fund in the Trust, or jointly with an affiliated trust, are allocated among the respective funds in the Trust and/or an affiliated trust based upon net assets or another appropriate basis.
Income, expenses (other than class-specific expenses such as transfer agent fees, state registration fees, printing fees, and 12b-1 fees), and realized and unrealized gains or losses on investments are allocated to each class of shares based on its relative net assets on the date income is earned or expenses and realized and unrealized gains and losses are incurred.
3. Purchases and Sales:
Purchases and sales of securities (excluding securities maturing less than one year from acquisition) for the six months ended June 30, 2022, were as follows:
| | | Excluding
U.S. Government Securities | |
| | | Purchases | | Sales | |
RS Small Cap Growth Fund | | $ | 818,896,337 | | | $ | 1,288,520,944 | | |
RS Select Growth Fund | | | 102,815,616 | | | | 125,373,462 | | |
RS Mid Cap Growth Fund | | | 171,080,658 | | | | 235,284,706 | | |
RS Growth Fund | | | 150,715,258 | | | | 163,420,917 | | |
RS Science and Technology Fund | | | 75,482,143 | | | | 95,325,031 | | |
RS Small Cap Equity Fund | | | 36,794,768 | | | | 40,049,574 | | |
61
Victory Portfolios | | Notes to Financial Statements — continued
June 30, 2022 | |
(Unaudited)
4. Fees and Transactions with Affiliates and Related Parties:
Investment Advisory Fees:
Investment advisory services are provided to the Funds by the Adviser, which is a New York corporation registered as an investment adviser with the SEC. The Adviser is an indirect wholly owned subsidiary of Victory Capital Holdings, Inc., a publicly traded Delaware corporation, and a wholly owned direct subsidiary of Victory Capital Operating, LLC.
Under the terms of the Investment Advisory Agreement, the Adviser is entitled to receive fees based on a percentage of the average daily net assets of each Fund. The rates at which the Adviser is paid by each Fund are included in the table below.
| | | Flat Rate | |
RS Small Cap Growth Fund | | | 0.95 | % | |
RS Select Growth Fund | | | 1.00 | % | |
RS Mid Cap Growth Fund | | | 0.85 | % | |
RS Growth Fund | | | 0.75 | % | |
RS Science and Technology Fund | | | 1.00 | % | |
RS Small Cap Equity Fund | | | 0.75 | % | |
Amounts incurred and paid to VCM for the six months ended June 30, 2022, are reflected on the Statements of Operations as Investment advisory fees.
Administration and Servicing Fees:
VCM also serves as the Funds' administrator and fund accountant. Under the Administration and Fund Accounting Agreement, VCM is entitled to receive fees based on a percentage of the average daily net assets of the Trust, Victory Variable Insurance Funds and Victory Portfolios II. The tiered rates at which VCM is paid by the Funds are shown in the table below:
Net Assets | |
Up to $15 billion | | $15 billion – $30 billion | | Over $30 billion | |
| | 0.08 | %, plus | | | 0.05 | %, plus | | | 0.04 | % | |
Amounts incurred for the six months ended June 30, 2022, are reflected on the Statements of Operations as Administration fees.
Citi Fund Services Ohio, Inc. ("Citi"), an affiliate of Citibank, acts as sub-administrator and sub-fund accountant to the Funds pursuant to the Sub-Administration and Sub-Fund Accounting Services Agreement between VCM and Citi. VCM pays Citi a fee for providing these services. The Trust reimburses VCM and Citi for out-of-pocket expenses incurred in providing these services and certain other expenses specifically allocated to the Funds. Amounts incurred for the six months ended June 30, 2022, are reflected on the Statements of Operations as Sub-Administration fees.
The Funds (as part of the Trust) have entered into an agreement with the Adviser to provide compliance services, pursuant to which the Adviser furnishes its compliance personnel, including the services of the Chief Compliance Officer ("CCO"), and other resources reasonably necessary to provide the Trust with compliance oversight services related to the design, administration, and oversight of a compliance program for the Trust in accordance with Rule 38a-1 under the 1940 Act. The CCO is an employee of the Adviser, which pays the compensation of the CCO and support staff. The funds in the Trust, Victory Variable Insurance Funds, Victory Portfolios II and USAA Mutual Funds (collectively, the "Victory Funds Complex"), in aggregate, compensate the Adviser for these services. Amounts incurred for the six months ended June 30, 2022, are reflected on the Statements of Operations as Compliance fees.
Transfer Agency Fees:
FIS Investor Services, LLC ("FIS") serves as the Funds' transfer agent. Under the Transfer Agent Agreement, the Trust pays FIS a fee for its services and reimburses FIS for all of their reasonable out-of-pocket
62
Victory Portfolios | | Notes to Financial Statements — continued
June 30, 2022 | |
(Unaudited)
expenses incurred in providing these services. Amounts incurred for the period ended June 30, 2022, are reflected on the Statements of Operations as Transfer agent fees.
Victory Capital Transfer Agency, Inc., an affiliate of the Adviser, serves as sub-transfer agent for the Member Class. Victory Capital Transfer Agency, Inc. receives no fee or other compensation for these services.
Distributor/Underwriting Services:
Victory Capital Services, Inc. (the "Distributor"), an affiliate of the Adviser, serves as Distributor for the continuous offering of the shares of the Funds pursuant to a Distribution Agreement between the Distributor and the Trust.
Pursuant to the Distribution and Service Plans adopted in accordance with Rule 12b-1 under the 1940 Act, the Distributor may receive a monthly distribution and service fee up to the annual rate shown in the table below:
| | | Class A | | Class C | | Class R | |
RS Small Cap Growth Fund | | | 0.25 | % | | | 1.00 | % | | | 0.50 | % | |
RS Select Growth Fund | | | 0.25 | % | | | 1.00 | % | | | 0.50 | % | |
RS Mid Cap Growth Fund | | | 0.25 | % | | | 1.00 | % | | | 0.50 | % | |
RS Growth Fund | | | 0.25 | % | | | 1.00 | % | | | 0.50 | % | |
RS Science and Technology Fund | | | 0.25 | % | | | 1.00 | % | | | 0.50 | % | |
RS Small Cap Equity Fund | | | 0.25 | % | | | 1.00 | % | | | 0.50 | % | |
The distribution and service fees paid to the Distributor may be used by the Distributor to pay for activities primarily intended to result in the sale of Class A, Class C, and Class R. Amounts incurred for the six-months ended June 30, 2022, are reflected on the Statements of Operations as 12b-1 fees.
In addition, the Distributor is entitled to receive commissions in connection with sales of the Class A. For the six months ended June 30, 2022, the Distributor received approximately $12,697 from commissions earned in connection with sales of Class A.
Other Fees:
Citibank serves as the Funds' custodian. The Funds pay Citibank a fee for providing these services. Amounts incurred for the six months ended June 30, 2022, are reflected on the Statements of Operations as Custodian fees.
Sidley Austin LLP provides legal services to the Trust.
The Adviser has entered into expense limitation agreements with the Funds. Under the terms of the agreements, the Adviser has agreed to waive fees or reimburse certain expenses to the extent that ordinary operating expenses incurred by certain classes of a Fund in any fiscal year exceed the expense limit for such classes of the Fund. Such excess amounts will be the liability of the Adviser. Acquired fund fees and expenses, interest, taxes, brokerage commissions, other expenditures which are capitalized in accordance with GAAP, and other extraordinary expenses not incurred in the ordinary course of a Fund's business are excluded from the expense limits. As of June 30, 2022, the expense limits (excluding voluntary waivers) are as follows:
| | | In effect until April 30, 2023 | |
| | | Class A | | Class C | | Class R | | Class R6 | | Class Y | | Member Class | |
RS Small Cap Growth Fund | | | 1.40 | % | | | 2.16 | % | | | 1.86 | % | | | 1.06 | % | | | 1.13 | % | | | N/A | | |
RS Select Growth Fund | | | 1.40 | % | | | 2.18 | % | | | 1.91 | % | | | 1.06 | % | | | 1.14 | % | | | N/A | | |
RS Mid Cap Growth Fund | | | 1.20 | % | | | 2.11 | % | | | 1.80 | % | | | 0.94 | % | | | 0.95 | % | | | 1.05 | % | |
RS Growth Fund | | | 1.10 | % | | | 1.93 | % | | | 1.71 | % | | | N/A | | | | 0.83 | % | | | N/A | | |
RS Science and Technology Fund | | | 1.49 | % | | | 2.28 | % | | | 1.93 | % | | | N/A | | | | 1.24 | % | | | N/A | | |
RS Small Cap Equity Fund | | | 1.35 | % | | | 2.10 | % | | | 1.75 | % | | | N/A | | | | 1.10 | % | | | 1.15 | % | |
63
Victory Portfolios | | Notes to Financial Statements — continued
June 30, 2022 | |
(Unaudited)
Under the terms of the expense limitation agreements, as amended May 1, 2022, the Funds have agreed to repay fees and expenses that were waived or reimbursed by the Adviser for a period of up to three years (thirty-six (36) months) after the waiver or reimbursement took place, subject to the lesser of any operating expense limits in effect at the time of: (a) the original waiver or expense reimbursement; or (b) the recoupment, after giving effect to the recoupment amount.
As of June 30, 2022, the following amounts are available to be repaid to the Adviser. The Funds have not recorded any amounts available to be repaid as a liability due to an assessment that such repayments are not probable at June 30, 2022.
| | | Expires
2022 | | Expires
2023 | | Expires
2024 | | Expires
2025 | | Total | |
RS Small Cap Growth Fund | | $ | 278,134 | | | $ | 486,448 | | | $ | 315,198 | | | $ | 359,869 | | | $ | 1,439,649 | | |
RS Select Growth Fund | | | 117,764 | | | | 227,571 | | | | 180,839 | | | | 101,407 | | | | 627,581 | | |
RS Mid Cap Growth Fund | | | 415,451 | | | | 755,044 | | | | 678,326 | | | | 261,278 | | | | 2,110,099 | | |
RS Growth Fund | | | 147,092 | | | | 294,950 | | | | 240,370 | | | | 134,294 | | | | 816,706 | | |
RS Science and Technology Fund | | | 12,698 | | | | 37,306 | | | | — | | | | 30,405 | | | | 80,409 | | |
RS Small Cap Equity Fund | | | 15,215 | | | | 40,673 | | | | 42,087 | | | | 22,509 | | | | 120,484 | | |
The Adviser may voluntarily waive or reimburse additional fees to assist the Funds in maintaining competitive expense ratios. These waivers are not available for recoupment and are reflected on the Statements of Operations as Expenses waived/reimbursed by Adviser. There were no voluntary waivers or reimbursements for the year ended December 31, 2021.
Certain officers and/or interested trustees of the Funds are also officers and/or employees of the Adviser, administrator, fund accountant, sub-administrator, sub-fund accountant, custodian, legal counsel, and Distributor.
5. Risks:
The Funds may be subject to other risks in addition to these identified risks.
Equity Risk — The value of the equity securities in which the Funds invests may decline in response to developments affecting individual companies and/or general economic conditions in the United States or abroad. A company's earnings or dividends may not increase as expected (or may decline) because of poor management, competitive pressures, reliance on particular suppliers or geographical regions, labor problems or shortages, corporate restructurings, fraudulent disclosures, man-made or natural disasters, military confrontations or wars, terrorism, public health crises, or other events, conditions and factors. Price changes may be temporary or last for extended periods.
Market Risk — Overall market risks may affect the value of the Fund. Domestic and international factors such as political events, war, terrorism, trade disputes, inflation rates, interest rate levels and other fiscal and monetary policy changes, cybersecurity incidents, pandemics and other public health crises, sanctions against a particular foreign country, its nationals, businesses or industries and related geopolitical events, as well as environmental disasters such as earthquakes, fires, and floods or other catastrophes, may add to instability in global economies and markets generally, and may lead to increased market volatility. Global economies and financial markets are highly interconnected, which increases the possibility that conditions in one country or region might adversely affect issuers in another country or region. The impact of these and other factors may be short-term or may last for extended periods.
Sector Risk — To the extent the Funds focus in one or more sectors, market or economic factors impacting those sectors could have a significant effect on the value of the Funds' investments and could make the Funds' performance more volatile. For example, the values of companies in the Information Technology sector are particularly vulnerable to economic downturns, short product cycles and aggressive pricing, market competition and changes in government regulation.
64
Victory Portfolios | | Notes to Financial Statements — continued
June 30, 2022 | |
(Unaudited)
Concentration Risk — The RS Science and Technology Fund, RS Small Cap Growth Fund, RS Small Cap Equity Fund, RS Select Growth Fund, RS Mid Cap Growth Fund and RS Growth Fund may concentrate its investments in a particular industry, as the term "concentration" is used in the 1940 Act. Concentrating investments in the Natural Resources sector increases the risk of loss because the stocks of many or all of the companies in the sector may decline in value due to developments adversely affecting the sector. In addition, investors may buy or sell substantial amounts of the Fund's shares in response to factors affecting or expected to affect the natural resources sector, resulting in extreme inflows and outflows of cash into and out of the Fund. Such inflows or outflows might affect management of the Fund adversely to the extent they cause the Fund's cash position or cash requirements to exceed normal levels.
Smaller-Capitalization Stock Risk — Small- and mid-sized capitalization companies are subject to a number of risks not associated with larger, more established companies, potentially making their stock prices more volatile and increasing the risk of loss. Smaller companies may have limited markets, product lines, or financial resources and lack management experience and may experience higher failure rates than larger companies.
6. Borrowing and Interfund Lending:
Line of Credit:
The Victory Funds Complex participates in a short-term demand note "Line of Credit" agreement with Citibank. The Line of Credit agreement with Citibank was renewed on June 27, 2022, with a termination date of June 26, 2023. Under the agreement with Citibank, the Victory Funds Complex may borrow up to $600 million, of which $300 million is committed and $300 million is uncommitted. $40 million of the Line of Credit is reserved for use by the Victory Floating Rate Fund, another series of the Victory Funds Complex, with Victory Floating Rate Fund paying the related commitment fees for that amount. The purpose of the Line of Credit is to meet temporary or emergency cash needs. For the six months ended June 30, 2022, Citibank received an annual commitment fee of 0.15% on $300 million for providing the Line of Credit. Each fund in the Victory Funds Complex paid a pro-rata portion of the commitment fees plus any interest on amounts borrowed. For the period from January 1, 2022, through June 27, 2022, interest was based on the one-month London Interbank Offered Rate ("LIBOR") plus one percent. Effective with the renewal, for the period June 28, 2022, through June 30, 2022, interest was based on the one-month Secured Overnight Financing Rate (SOFR) plus 1.10 percent. Interest charged to each fund during the period, if applicable, is reflected on the Statements of Operations under Line of credit fees.
The Funds had no borrowings under the Line of Credit agreement during the six months ended June 30, 2022.
Interfund Lending:
The Trust and the Adviser rely on an exemptive order granted by the SEC in March 2017 (the "Order"), permitting the establishment and operation of an Interfund Lending Facility (the "Facility"). The Facility allows each Fund to directly lend and borrow money to or from any other fund in the Victory Funds Complex that is permitted to participate in the Facility, relying upon the Order at rates beneficial to both the borrowing and lending funds. Advances under the Facility are allowed for temporary or emergency purposes, including the meeting of redemption requests that otherwise might require the untimely disposition of securities, and are subject to each Fund's borrowing restrictions. The interfund loan rate is determined, as specified in the Order, by averaging the current repurchase agreement rate and the current bank loan rate. As a Borrower, interest charged to each Fund, if any, during the period, is reflected on the Statements of Operations under Interfund lending fees. As a Lender, interest earned by each Fund, if any, during the period, is reflected on the Statements of Operations under Interfund lending.
65
Victory Portfolios | | Notes to Financial Statements — continued
June 30, 2022 | |
(Unaudited)
The average borrowing or lending for the days outstanding and average interest rate for each Fund during the year ended June 30, 2022, were as follows (amounts in thousands):
| | | Borrower
or
Lender | | Amount
Outstanding
at
June 30,
2022 | | Average
Borrowing* | | Days
Borrowing
Outstanding | | Average
Interest
Rate* | | Maximum
Borrowing
During
the Period | |
RS Small Cap Growth
Fund | | Borrower | | $ | — | | | $ | 22,336,700 | | | | 10 | | | | 0.68 | % | | $ | 53,069,000 | | |
RS Mid Cap Growth
Fund | | Borrower | | | — | | | | 2,376,889 | | | | 9 | | | | 1.02 | % | | | 5,438,000 | | |
* Based on the number of days borrowings were outstanding for the six months ended June 30, 2022.
7. Federal Income Tax Information:
Dividends from net investment income, if any, are declared and paid as noted in the table below. Distributable net realized gains, if any, are declared and distributed at least annually from each Fund.
| | | Declared | | Paid | |
RS Small Cap Growth Fund | | Annually | | Annually | |
RS Select Growth Fund | | Annually | | Annually | |
RS Mid Cap Growth Fund | | Annually | | Annually | |
RS Growth Fund | | Annually | | Annually | |
RS Science and Technology Fund | | Annually | | Annually | |
RS Small Cap Equity Fund | | Annually | | Annually | |
The amounts of dividends from net investment income and distributions from net realized gains (collectively, distributions to shareholders) are determined in accordance with federal income tax regulations, which may differ from GAAP. To the extent these "book/tax" differences are permanent in nature (e.g., net operating loss and distribution reclassification), such amounts are reclassified within the components of net assets based on their federal tax-basis treatment; temporary differences (e.g., wash sales) do not require reclassification. To the extent dividends and distributions exceed net investment income and net realized gains for tax purposes, they are reported as distributions of capital. Net investment losses incurred by the Funds may be reclassified as an offset to capital on the accompanying Statements of Assets and Liabilities.
The tax character of current year distributions paid and the tax basis of the current components of accumulated earnings (loss) will be determined at the end of the current tax year ending December 31, 2022.
As of the tax year ended December 31, 2021, the Funds had no capital loss carryforwards for federal income tax purposes.
66
Victory Portfolios | | Supplemental Information
June 30, 2022 | |
(Unaudited)
Proxy Voting and Portfolio Holdings Information
Proxy Voting:
Information regarding the policies and procedures each Fund uses to determine how to vote proxies relating to portfolio securities is available without charge, upon request, by calling 800-539-3863. The information is also included in the Funds' Statement of Additional Information, which is available on the SEC's website at www.sec.gov.
Information relating to how the Funds voted proxies relating to portfolio securities held during the most recent 12 months ended June 30 is available on the SEC's website at www.sec.gov.
Availability of Schedules of Portfolio Investments:
The Trust files a complete list of Schedules of Portfolio Investments with the SEC for the first and third quarter of each fiscal year on Form N-PORT. Forms N-PORT are available on the SEC's website at www.sec.gov.
Expense Examples
As a shareholder of a Fund, you may incur two types of costs: (1) transaction costs, including sales charges (loads) on purchases; and (2) ongoing costs, including management fees and other Fund expenses. These examples are intended to help you understand your ongoing costs (in dollars) of investing in a Fund and to compare these costs with the ongoing costs of investing in other mutual funds.
These examples are based on an investment of $1,000 invested at the beginning of the period and held for the entire period from January 1, 2022, through June 30, 2022.
The Actual Expense figures in the table below provide information about actual account values and actual expenses. You may use the information below, together with the amount you invested, to estimate the expenses that you paid over the period. Simply divide your account value by $1,000 (for example, an $8,600 account value divided by $1,000 = 8.6), then multiply the result by the number in the table under the heading entitled "Actual Expenses Paid During Period" to estimate the expenses you paid on your account during this period.
The Hypothetical Expense figures in the table below provide information about hypothetical account values and hypothetical expenses based on the Fund's actual expense ratio and an assumed rate of return of 5% per year before expenses, which is not the Fund's actual return. The hypothetical account values and expenses may not be used to estimate the actual ending account balance or expenses you paid for the period. You may use this information to compare this 5% hypothetical example with the 5% hypothetical examples that appear in shareholder reports of other funds.
Please note the expenses shown in the table below are meant to highlight your ongoing costs only and do not reflect any transactional costs. Therefore, the hypothetical expenses in the table are useful in comparing ongoing costs only and will not help you determine the relative total costs of owning different funds. In addition, if these transactional costs were included, your costs would have been higher.
| | | Beginning
Account
Value
1/1/22 | | Actual
Ending
Account
Value
6/30/22 | | Hypothetical
Ending
Account
Value
6/30/22 | | Actual
Expenses
Paid
During
Period
1/1/22-
6/30/22* | | Hypothetical
Expenses
Paid
During
Period
1/1/22-
6/30/22* | | Annualized
Expense
Ratio
During
Period
1/1/22-
6/30/22 | |
RS Small Cap Growth Fund | |
Class A | | $ | 1,000.00 | | | $ | 629.20 | | | $ | 1,017.85 | | | $ | 5.66 | | | $ | 7.00 | | | | 1.40 | % | |
Class C | | | 1,000.00 | | | | 627.00 | | | | 1,014.08 | | | | 8.71 | | | | 10.79 | | | | 2.16 | % | |
Class R | | | 1,000.00 | | | | 627.80 | | | | 1,015.57 | | | | 7.51 | | | | 9.30 | | | | 1.86 | % | |
Class R6 | | | 1,000.00 | | | | 630.30 | | | | 1,019.54 | | | | 4.28 | | | | 5.31 | | | | 1.06 | % | |
Class Y | | | 1,000.00 | | | | 630.10 | | | | 1,019.19 | | | | 4.57 | | | | 5.66 | | | | 1.13 | % | |
67
Victory Portfolios | | Supplemental Information — continued
June 30, 2022 | |
(Unaudited)
| | | Beginning
Account
Value
1/1/22 | | Actual
Ending
Account
Value
6/30/22 | | Hypothetical
Ending
Account
Value
6/30/22 | | Actual
Expenses
Paid
During
Period
1/1/22-
6/30/22* | | Hypothetical
Expenses
Paid
During
Period
1/1/22-
6/30/22* | | Annualized
Expense
Ratio
During
Period
1/1/22-
6/30/22 | |
RS Select Growth Fund | |
Class A | | $ | 1,000.00 | | | $ | 666.50 | | | $ | 1,017.85 | | | $ | 5.78 | | | $ | 7.00 | | | | 1.40 | % | |
Class C | | | 1,000.00 | | | | 663.90 | | | | 1,013.98 | | | | 8.99 | | | | 10.89 | | | | 2.18 | % | |
Class R | | | 1,000.00 | | | | 665.00 | | | | 1,015.32 | | | | 7.89 | | | | 9.54 | | | | 1.91 | % | |
Class R6 | | | 1,000.00 | | | | 667.80 | | | | 1,019.54 | | | | 4.38 | | | | 5.31 | | | | 1.06 | % | |
Class Y | | | 1,000.00 | | | | 667.40 | | | | 1,019.14 | | | | 4.71 | | | | 5.71 | | | | 1.14 | % | |
RS Mid Cap Growth Fund | |
Class A | | | 1,000.00 | | | | 658.70 | | | | 1,018.79 | | | | 4.98 | | | | 6.06 | | | | 1.21 | % | |
Class C | | | 1,000.00 | | | | 655.60 | | | | 1,014.28 | | | | 8.70 | | | | 10.59 | | | | 2.12 | % | |
Class R | | | 1,000.00 | | | | 656.30 | | | | 1,015.82 | | | | 7.43 | | | | 9.05 | | | | 1.81 | % | |
Class R6 | | | 1,000.00 | | | | 659.50 | | | | 1,020.08 | | | | 3.91 | | | | 4.76 | | | | 0.95 | % | |
Class Y | | | 1,000.00 | | | | 659.10 | | | | 1,020.03 | | | | 3.95 | | | | 4.81 | | | | 0.96 | % | |
Member Class | | | 1,000.00 | | | | 659.00 | | | | 1,019.59 | | | | 4.32 | | | | 5.26 | | | | 1.05 | % | |
RS Growth Fund | |
Class A | | | 1,000.00 | | | | 704.70 | | | | 1,019.34 | | | | 4.65 | | | | 5.51 | | | | 1.10 | % | |
Class C | | | 1,000.00 | | | | 701.60 | | | | 1,015.22 | | | | 8.14 | | | | 9.64 | | | | 1.93 | % | |
Class R | | | 1,000.00 | | | | 702.30 | | | | 1,016.31 | | | | 7.22 | | | | 8.55 | | | | 1.71 | % | |
Class Y | | | 1,000.00 | | | | 705.80 | | | | 1,020.68 | | | | 3.51 | | | | 4.16 | | | | 0.83 | % | |
RS Science and Technology Fund | |
Class A | | | 1,000.00 | | | | 581.90 | | | | 1,017.41 | | | | 5.84 | | | | 7.45 | | | | 1.49 | % | |
Class C | | | 1,000.00 | | | | 579.60 | | | | 1,013.49 | | | | 8.93 | | | | 11.38 | | | | 2.28 | % | |
Class R | | | 1,000.00 | | | | 580.40 | | | | 1,015.22 | | | | 7.56 | | | | 9.64 | | | | 1.93 | % | |
Class Y | | | 1,000.00 | | | | 582.40 | | | | 1,018.65 | | | | 4.87 | | | | 6.21 | | | | 1.24 | % | |
RS Small Cap Equity Fund | |
Class A | | | 1,000.00 | | | | 614.90 | | | | 1,018.30 | | | | 5.25 | | | | 6.56 | | | | 1.31 | % | |
Class C | | | 1,000.00 | | | | 613.00 | | | | 1,014.38 | | | | 8.40 | | | | 10.49 | | | | 2.10 | % | |
Class R | | | 1,000.00 | | | | 613.60 | | | | 1,016.12 | | | | 7.00 | | | | 8.75 | | | | 1.75 | % | |
Class Y | | | 1,000.00 | | | | 615.90 | | | | 1,019.34 | | | | 4.41 | | | | 5.51 | | | | 1.10 | % | |
Member Class | | | 1,000.00 | | | | 615.40 | | | | 1,019.09 | | | | 4.61 | | | | 5.76 | | | | 1.15 | % | |
* Expenses are equal to the average account value multiplied by the Fund's annualized expense ratio multiplied by 181/365 (the number of days in the most recent fiscal half-year divided by the number of days in the fiscal year).
68
Victory Portfolios | | Supplemental Information — continued
June 30, 2022 | |
(Unaudited)
Liquidity Risk Management Program:
The Victory Funds have adopted and implemented a written liquidity risk management program (the "LRMP") as required by Rule 22e-4 under the Investment Company Act of 1940, as amended. The LRMP is reasonably designed to assess and manage each Fund's liquidity risk, taking into consideration each Fund's investment strategy and the liquidity of its portfolio investments during normal and reasonably foreseeable stressed market conditions; its short- and long-term cash flow projections; and its cash holdings and access to other liquidity management tools such as available funding sources including the Victory Funds Complex Interfund Lending Facility and Line of Credit (discussed in the Notes to Financial Statements). The Victory Funds' Board of Trustees approved the appointment of the Funds' investment adviser, Victory Capital Management Inc. ("Victory Capital"), as the administrator of the LRMP.
Victory Capital manages liquidity risks associated with the Funds' investments by monitoring, among other things, cash and cash equivalents, any use of derivatives, the concentration of investments, the appropriateness of each Fund's investment strategy, and by classifying every Fund investment as either highly liquid, moderately liquid, less liquid, or illiquid on at least a monthly basis. To assist with the classification of Fund investments, Victory Capital has retained a third-party provider of liquidity evaluation services. This provider determines preliminary liquidity classifications for all portfolio holdings based upon portfolio-level data and certain assumptions provided by Victory Capital. Victory Capital reviews the preliminary liquidity classifications and, when appropriate, considers other information including input from the Funds' portfolio managers (including the portfolio managers employed by any investment sub-advisers) in determining final liquidity classifications.
At a meeting held on February 24, 2022, Victory Capital provided an oral and written report to the Trustees on the operation and effectiveness of the LRMP during the previous year. The report from Victory Capital concluded that the Funds did not experience any significant liquidity challenges during the covered period, and the Funds' LRMP is reasonably designed to assess and manage its liquidity risk. The report also concluded that the LRMP continues to operate adequately and effectively to enable Victory Capital to oversee and manage liquidity risk and ensure each Fund is able to meet redemption requests without significant dilution to the remaining investors' interest in each Fund. During the review period, each Fund's portfolio consisted primarily of highly liquid investments, which are defined as cash and any investments that each Fund reasonably expects to be converted to cash in current market conditions in three business days or less without significantly changing the market value of the investment. Therefore, the Funds have not adopted a highly liquid investment minimum. The Funds' investments were below the limitation on illiquid investments during the review period. Additionally, Victory Capital indicated that no events occurred that would require the filing of Form N-LIQUID and recommended no material changes to the LRMP.
69
Privacy Policy
Protecting the Privacy of Information
The Trust respects your right to privacy. We also know that you expect us to conduct and process your business in an accurate and efficient manner. To do so, we must collect and maintain certain personal information about you. This is the information we collect from you on applications or other forms, and from the transactions you make with us or third parties. It may include your name, address, social security number, account transactions and balances, and information about investment goals and risk tolerance.
We do not disclose any information about you or about former customers to anyone except as permitted or required by law. Specifically, we may disclose the information we collect to companies that perform services on our behalf, such as the transfer agent that processes shareholder accounts and printers and mailers that assist us in the distribution of investor materials. We may also disclose this information to companies that perform marketing services on our behalf. This allows us to continue to offer you Victory investment products and services that meet your investing needs, and to effect transactions that you request or authorize. These companies will use this information only in connection with the services for which we hired them. They are not permitted to use or share this information for any other purpose.
To protect your personal information internally, we permit access only by authorized employees and maintain physical, electronic, and procedural safeguards to guard your personal information.*
* You may have received communications regarding information about privacy policies from other financial institutions which gave you the opportunity to "opt-out" of certain information sharing with companies which are not affiliated with that financial institution. The Trust does not share information with other companies for purposes of marketing solicitations for products other than the Trust. Therefore, the Trust does not provide opt-out options to their shareholders.
Victory Funds
P.O. Box 182593
Columbus, Ohio 43218-2593

Visit our website at: | | Call Victory at: | |
www.vcm.com | | 800-539-FUND (800-539-3863) | |
| | | 800-235-8396 for Member Class | |

June 30, 2022
Semi Annual Report
Victory RS International Fund
Victory RS Global Fund
Victory Sophus Emerging Markets Fund
www.vcm.com
News, Information And Education 24 Hours A Day, 7 Days A Week
The Victory Capital website gives fund shareholders, prospective shareholders, and investment professionals a convenient way to access fund information, get guidance, and track fund performance anywhere they can access the Internet. The site includes:
• Detailed performance records
• Daily share prices
• The latest fund news
• Investment resources to help you become a better investor
• A section dedicated to investment professionals
Whether you're a potential investor searching for the fund that matches your investment philosophy, a seasoned investor interested in planning tools, or an investment professional, www.vcm.com has what you seek. Visit us anytime. We're always open.
TABLE OF CONTENTS
Investment Objective and Portfolio
Holdings | | | 3 | | |
Schedules of Portfolio Investments | |
Victory RS International Fund | | | 6 | | |
Victory RS Global Fund | | | 11 | | |
Victory Sophus Emerging Markets Fund | | | 17 | | |
Financial Statements | |
Statements of Assets and Liabilities | | | 24 | | |
Statements of Operations | | | 26 | | |
Statements of Changes in Net Assets | | | 27 | | |
Financial Highlights | | | 30 | | |
Notes to Financial Statements | | | 42 | | |
Supplemental Information | | | 52 | | |
Proxy Voting and Portfolio Holdings Information | | | 52 | | |
Expense Examples | | | 52 | | |
Liquidity Risk Management Program | | | 54 | | |
Privacy Policy (inside back cover) | | | |
1
IRA DISTRIBUTION WITHHOLDING DISCLOSURE
We generally must withhold federal income tax at a rate of 10% of the taxable portion of your distribution and, if you live in a state that requires state income tax withholding, at your state's tax rate. However, you may elect not to have withholding apply or to have income tax withheld at a higher rate. Any withholding election that you make will apply to any subsequent distribution unless and until you change or revoke the election. If you wish to make a withholding election, or change or revoke a prior withholding election, call 800-539-3863 and form W-4P (OMB No. 1545-0074 withholding certificate for pension or annuity payments) will be electronically sent.
If you do not have a withholding election in place by the date of a distribution, federal income tax will be withheld from the taxable portion of your distribution at a rate of 10%. If you must pay estimated taxes, you may be subject to estimated tax penalties if your estimated tax payments are not sufficient and sufficient tax is not withheld from your distribution.
For more specific information, please consult your tax adviser.
The Funds are distributed by Victory Capital Services, Inc. Victory Capital Management Inc. is the investment adviser to the Funds and receives fees from the Funds for performing services for the Funds.
This report is not authorized for distribution to prospective investors unless preceded or accompanied by a current prospectus of the Victory Funds.
For additional information about any Victory Fund, including fees, expenses, and risks, view our prospectus online at vcm.com or call 800-539-3863. Read it carefully before you invest or send money.
The information in this report is based on data obtained from recognized services and sources and is believed to be reliable. Any opinions, projections, or recommendations in this report are subject to change without notice and are not intended as individual investment advice. Past investment performance of the Funds, markets or securities mentioned herein should not be considered to be indicative of future results.
• NOT FDIC INSURED • NO BANK GUARANTEE • MAY LOSE VALUE

Call Victory at:
800-539-FUND (800-539-3863)
Visit our website at:
www.vcm.com
2
Victory Portfolios
Victory RS International Fund | | June 30, 2022 | |
(Unaudited)
Investment Objective and Portfolio Holdings:
The Fund seeks to provide long-term capital appreciation.
Top 10 Holdings*:
June 30, 2022
(% of Net Assets)
Nestle SA, Registered Shares | | | 4.5 | % | |
Roche Holding AG | | | 3.8 | % | |
Toyota Motor Corp. | | | 3.2 | % | |
LVMH Moet Hennessy Louis Vuitton SE | | | 2.8 | % | |
Novartis AG, Registered Shares | | | 2.5 | % | |
Novo Nordisk A/S, Class B | | | 2.4 | % | |
Shell PLC | | | 2.4 | % | |
BHP Group Ltd. | | | 2.1 | % | |
HSBC Holdings PLC | | | 2.1 | % | |
Diageo PLC | | | 2.0 | % | |
Sector Allocation*:
June 30, 2022
(% of Net Assets)
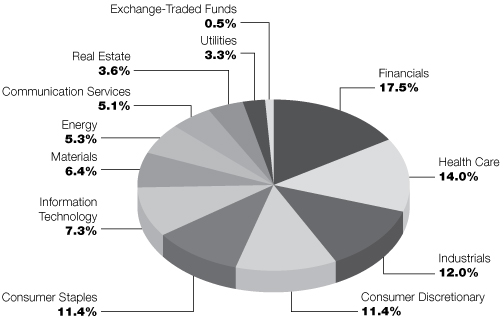
* Does not include futures contracts, money market instruments, and short-term investments purchased with cash collateral from securities loaned.
Percentages are of the net assets of the Fund and may not equal 100%.
Refer to the Schedule of Portfolio Investments for a complete list of securities.
3
Victory Portfolios
Victory RS Global Fund | | June 30, 2022 | |
(Unaudited)
Investment Objective and Portfolio Holdings:
The Fund seeks to provide long-term capital appreciation.
Top 10 Holdings*:
June 30, 2022
(% of Net Assets)
Apple, Inc. | | | 4.9 | % | |
Microsoft Corp. | | | 4.7 | % | |
Johnson & Johnson | | | 2.4 | % | |
Alphabet, Inc., Class C | | | 2.4 | % | |
McDonald's Corp. | | | 2.3 | % | |
PepsiCo, Inc. | | | 2.1 | % | |
Colgate-Palmolive Co. | | | 1.8 | % | |
Eli Lilly & Co. | | | 1.8 | % | |
Tencent Holdings Ltd. | | | 1.6 | % | |
Amazon.com, Inc. | | | 1.6 | % | |
Sector Allocation*:
June 30, 2022
(% of Net Assets)
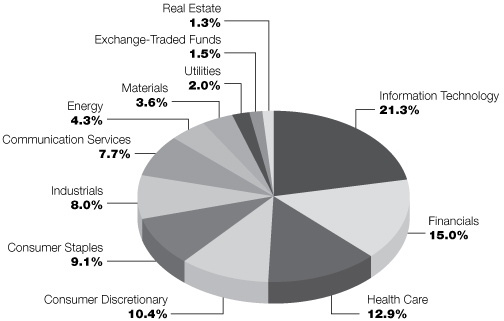
* Does not include futures contracts, money market instruments, and short-term investments purchased with cash collateral from securities loaned.
Percentages are of the net assets of the Fund and may not equal 100%.
Refer to the Schedule of Portfolio Investments for a complete list of securities.
4
Victory Portfolios
Victory Sophus Emerging Markets Fund | | June 30, 2022 | |
(Unaudited)
Investment Objective and Portfolio Holdings:
The Fund seeks to provide long-term capital appreciation.
Top 10 Holdings*:
June 30, 2022
(% of Net Assets)
Taiwan Semiconductor Manufacturing Co. Ltd. | | | 7.0 | % | |
Samsung Electronics Co. Ltd. | | | 3.7 | % | |
Alibaba Group Holding Ltd. | | | 3.5 | % | |
Tencent Holdings Ltd. | | | 3.5 | % | |
JD.com, Inc., Class A | | | 2.1 | % | |
Postal Savings Bank of China Co. Ltd., Class H | | | 1.9 | % | |
ICICI Bank Ltd. | | | 1.9 | % | |
Meituan, Class B | | | 1.6 | % | |
Infosys Ltd. | | | 1.5 | % | |
Mahindra & Mahindra Ltd. | | | 1.5 | % | |
Sector Allocation*:
June 30, 2022
(% of Net Assets)
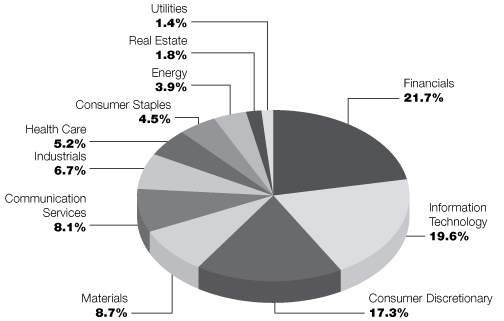
* Does not include futures contracts, money market instruments, and short-term investments purchased with cash collateral from securities loaned.
Percentages are of the net assets of the Fund and may not equal 100%.
Refer to the Schedule of Portfolio Investments for a complete list of securities.
5
Victory Portfolios
Victory RS International Fund | | Schedule of Portfolio Investments
June 30, 2022 | |
(Unaudited)
Security Description | | Shares | | Value | |
Common Stocks (97.3%) | |
Australia (7.3%): | |
Consumer Discretionary (1.1%): | |
Aristocrat Leisure Ltd. | | | 149,803 | | | $ | 3,562,433 | | |
Financials (1.1%): | |
Macquarie Group Ltd. | | | 32,077 | | | | 3,651,352 | | |
Health Care (1.9%): | |
CSL Ltd. | | | 33,552 | | | | 6,228,388 | | |
Materials (2.1%): | |
BHP Group Ltd. | | | 241,826 | | | | 6,922,826 | | |
Real Estate (1.1%): | |
Scentre Group | | | 1,906,272 | | | | 3,422,050 | | |
| | | | 23,787,049 | | |
Belgium (0.7%): | |
Information Technology (0.7%): | |
Melexis NV | | | 30,969 | | | | 2,226,981 | | |
China (1.0%): | |
Communication Services (1.0%): | |
Tencent Holdings Ltd. | | | 67,700 | | | | 3,064,528 | | |
Denmark (4.1%): | |
Consumer Discretionary (0.6%): | |
Pandora A/S (a) | | | 27,653 | | | | 1,757,148 | | |
Consumer Staples (1.1%): | |
Royal Unibrew A/S | | | 39,674 | | | | 3,531,473 | | |
Health Care (2.4%): | |
Novo Nordisk A/S, Class B | | | 71,406 | | | | 7,920,380 | | |
| | | | 13,209,001 | | |
France (8.4%): | |
Consumer Discretionary (4.0%): | |
La Francaise des Jeux SAEM (b) | | | 108,624 | | | | 3,771,352 | | |
LVMH Moet Hennessy Louis Vuitton SE | | | 14,961 | | | | 9,167,962 | | |
| | | | 12,939,314 | | |
Energy (0.9%): | |
Gaztransport Et Technigaz SA | | | 24,019 | | | | 3,016,466 | | |
Industrials (1.1%): | |
Safran SA | | | 36,850 | | | | 3,668,466 | | |
Information Technology (1.0%): | |
Capgemini SE | | | 19,828 | | | | 3,419,052 | | |
Materials (1.4%): | |
Arkema SA | | | 49,814 | | | | 4,455,352 | | |
| | | | 27,498,650 | | |
See notes to financial statements.
6
Victory Portfolios
Victory RS International Fund | | Schedule of Portfolio Investments — continued
June 30, 2022 | |
(Unaudited)
Security Description | | Shares | | Value | |
Germany (6.2%): | |
Consumer Discretionary (0.9%): | |
Volkswagen AG, Preference Shares | | | 22,854 | | | $ | 3,076,618 | | |
Financials (1.7%): | |
Allianz SE, Registered Shares | | | 29,132 | | | | 5,584,109 | | |
Industrials (1.9%): | |
Siemens AG, Registered Shares | | | 58,610 | | | | 6,024,044 | | |
Information Technology (1.7%): | |
SAP SE | | | 61,071 | | | | 5,565,857 | | |
| | | | 20,250,628 | | |
Hong Kong (3.6%): | |
Financials (1.7%): | |
AIA Group Ltd. | | | 502,600 | | | | 5,491,834 | | |
Real Estate (1.9%): | |
CK Asset Holdings Ltd. | | | 890,500 | | | | 6,327,446 | | |
| | | | 11,819,280 | | |
Italy (2.6%): | |
Utilities (2.6%): | |
Enel SpA | | | 726,620 | | | | 3,984,378 | | |
Snam SpA | | | 851,261 | | | | 4,465,393 | | |
| | | | 8,449,771 | | |
Japan (21.2%): | |
Communication Services (2.0%): | |
Capcom Co. Ltd. | | | 154,100 | | | | 3,749,182 | | |
Kakaku.com, Inc. | | | 163,900 | | | | 2,722,628 | | |
| | | | 6,471,810 | | |
Consumer Discretionary (4.0%): | |
Toyota Motor Corp. | | | 665,400 | | | | 10,268,174 | | |
ZOZO, Inc. | | | 151,600 | | | | 2,743,259 | | |
| | | | 13,011,433 | | |
Consumer Staples (1.3%): | |
Toyo Suisan Kaisha Ltd. | | | 108,300 | | | | 4,229,005 | | |
Financials (3.1%): | |
Mitsubishi UFJ Financial Group, Inc. | | | 977,600 | | | | 5,230,982 | | |
Tokio Marine Holdings, Inc. | | | 85,400 | | | | 4,980,575 | | |
| | | | 10,211,557 | | |
Health Care (2.5%): | |
Hoya Corp. | | | 53,000 | | | | 4,536,565 | | |
Shionogi & Co. Ltd. | | | 70,100 | | | | 3,578,322 | | |
| | | | 8,114,887 | | |
Industrials (3.9%): | |
Fuji Electric Co. Ltd. | | | 124,200 | | | | 5,135,660 | | |
Nippon Yusen KK | | | 35,200 | | | | 2,413,842 | | |
See notes to financial statements.
7
Victory Portfolios
Victory RS International Fund | | Schedule of Portfolio Investments — continued
June 30, 2022 | |
(Unaudited)
Security Description | | Shares | | Value | |
OKUMA Corp. | | | 38,900 | | | $ | 1,461,181 | | |
Sanwa Holdings Corp. | | | 389,000 | | | | 3,725,715 | | |
| | | | 12,736,398 | | |
Information Technology (3.1%): | |
Fujitsu Ltd. | | | 38,700 | | | | 4,843,167 | | |
Oracle Corp. | | | 49,200 | | | | 2,865,592 | | |
Ulvac, Inc. | | | 73,000 | | | | 2,486,789 | | |
| | | | 10,195,548 | | |
Real Estate (0.6%): | |
Sumitomo Realty & Development Co. Ltd. | | | 78,000 | | | | 2,059,402 | | |
Utilities (0.7%): | |
Chubu Electric Power Co., Inc. | | | 213,200 | | | | 2,147,116 | | |
| | | | 69,177,156 | | |
Netherlands (5.3%): | |
Communication Services (1.9%): | |
Koninklijke KPN NV | | | 1,736,136 | | | | 6,176,518 | | |
Financials (1.2%): | |
ING Groep NV | | | 392,676 | | | | 3,867,938 | | |
Industrials (1.4%): | |
Wolters Kluwer NV | | | 46,723 | | | | 4,527,654 | | |
Information Technology (0.8%): | |
ASM International NV | | | 11,240 | | | | 2,796,195 | | |
| | | | 17,368,305 | | |
New Zealand (0.5%): | |
Health Care (0.5%): | |
Fisher & Paykel Healthcare Corp. Ltd. | | | 130,979 | | | | 1,631,048 | | |
Norway (1.6%): | |
Energy (0.6%): | |
Aker BP ASA (a) | | | 57,151 | | | | 1,980,188 | | |
Financials (1.0%): | |
SpareBank 1 SMN | | | 275,729 | | | | 3,257,452 | | |
| | | | 5,237,640 | | |
Spain (1.4%): | |
Financials (1.4%): | |
Banco Bilbao Vizcaya Argentaria SA | | | 1,001,268 | | | | 4,547,693 | | |
Sweden (2.2%): | |
Industrials (2.2%): | |
Atlas Copco AB, Class B (c) | | | 586,648 | | | | 4,918,149 | | |
Nibe Industrier AB, Class B | | | 284,724 | | | | 2,147,484 | | |
| | | | 7,065,633 | | |
See notes to financial statements.
8
Victory Portfolios
Victory RS International Fund | | Schedule of Portfolio Investments — continued
June 30, 2022 | |
(Unaudited)
Security Description | | Shares | | Value | |
Switzerland (14.2%): | |
Consumer Staples (5.4%): | |
Coca-Cola HBC AG | | | 131,375 | | | $ | 2,926,759 | | |
Nestle SA, Registered Shares | | | 124,639 | | | | 14,569,193 | | |
| | | | 17,495,952 | | |
Financials (2.0%): | |
Partners Group Holding AG | | | 1,905 | | | | 1,720,670 | | |
UBS Group AG | | | 306,733 | | | | 4,959,649 | | |
| | | | 6,680,319 | | |
Health Care (6.3%): | |
Novartis AG, Registered Shares | | | 94,902 | | | | 8,047,116 | | |
Roche Holding AG | | | 37,354 | | | | 12,489,399 | | |
| | | | 20,536,515 | | |
Industrials (0.5%): | |
Adecco Group AG | | | 48,611 | | | | 1,657,158 | | |
| | | | 46,369,944 | | |
United Kingdom (17.0%): | |
Communication Services (0.2%): | |
ITV PLC | | | 714,992 | | | | 570,869 | | |
Consumer Discretionary (0.8%): | |
Next PLC | | | 38,403 | | | | 2,743,056 | | |
Consumer Staples (3.6%): | |
Diageo PLC | | | 149,290 | | | | 6,447,143 | | |
Imperial Brands PLC | | | 235,852 | | | | 5,279,293 | | |
| | | | 11,726,436 | | |
Energy (3.8%): | |
| BP PLC | | | 965,405 | | | | 4,532,283 | | |
Shell PLC | | | 303,857 | | | | 7,911,935 | | |
| | | | 12,444,218 | | |
Financials (4.3%): | |
Barclays PLC | | | 2,034,663 | | | | 3,804,087 | | |
HSBC Holdings PLC | | | 1,051,296 | | | | 6,866,446 | | |
Intermediate Capital Group PLC | | | 78,880 | | | | 1,260,884 | | |
Legal & General Group PLC | | | 702,567 | | | | 2,053,657 | | |
| | | | 13,985,074 | | |
Health Care (0.4%): | |
CVS Group PLC | | | 60,862 | | | | 1,230,081 | | |
Industrials (1.0%): | |
Ashtead Group PLC | | | 81,117 | | | | 3,411,894 | | |
Materials (2.9%): | |
Croda International PLC | | | 45,449 | | | | 3,591,769 | | |
Rio Tinto PLC | | | 97,768 | | | | 5,844,226 | | |
| | | | 9,435,995 | | |
| | | | 55,547,623 | | |
Total Common Stocks (Cost $333,694,898) | | | 317,250,930 | | |
See notes to financial statements.
9
Victory Portfolios
Victory RS International Fund | | Schedule of Portfolio Investments — continued
June 30, 2022 | |
(Unaudited)
Security Description | | Shares | | Value | |
Exchange-Traded Funds (0.5%) | |
United States (0.5%): | |
iShares MSCI EAFE ETF (a) | | | 25,767 | | | $ | 1,610,180 | | |
Total Exchange-Traded Funds (Cost $1,756,944) | | | 1,610,180 | | |
Collateral for Securities Loaned (1.0%)^ | |
United States (1.0%): | |
BlackRock Liquidity Funds TempFund, Institutional Shares, 1.47% (d) | | | 100,741 | | | | 100,741 | | |
Goldman Sachs Financial Square Prime Obligations Fund, Institutional
Shares, 1.42% (d) | | | 50,275 | | | | 50,275 | | |
HSBC U.S. Government Money Market Fund I Shares, 1.46% (d) | | | 627,027 | | | | 627,027 | | |
JPMorgan Prime Money Market Fund, Capital Shares, 1.50% (d) | | | 400,875 | | | | 400,875 | | |
Morgan Stanley Institutional Liquidity Government Portfolio, Institutional
Shares, 1.39% (d) | | | 267,338 | | | | 267,338 | | |
Morgan Stanley Institutional Liquidity Prime Portfolio, Institutional
Shares, 1.53% (d) | | | 1,802,412 | | | | 1,802,412 | | |
Total Collateral for Securities Loaned (Cost $3,248,668) | | | 3,248,668 | | |
Total Investments (Cost $338,700,510) — 98.8% | | | 322,109,778 | | |
Other assets in excess of liabilities — 1.2% | | | 3,986,447 | | |
NET ASSETS — 100.00% | | $ | 326,096,225 | | |
^ Purchased with cash collateral from securities on loan.
(a) All or a portion of this security is on loan.
(b) Rule 144A security or other security that is restricted as to resale to institutional investors. The Fund's Adviser has deemed this security to be liquid (unless otherwise noted as illiquid) based upon procedures approved by the Board of Trustees. As of June 30, 2022, the fair value of these securities was $3,771,352 and amounted to 1.2% of net assets.
(c) Non-income producing security.
(d) Rate disclosed is the daily yield on June 30, 2022.
ETF — Exchange-Traded Fund
PLC — Public Limited Company
See notes to financial statements.
10
Victory Portfolios
Victory RS Global Fund | | Schedule of Portfolio Investments
June 30, 2022 | |
(Unaudited)
Security Description | | Shares | | Value | |
Common Stocks (95.6%) | |
Australia (2.2%): | |
Consumer Discretionary (0.6%): | |
Aristocrat Leisure Ltd. | | | 84,098 | | | $ | 1,999,917 | | |
Financials (0.7%): | |
Macquarie Group Ltd. | | | 21,825 | | | | 2,484,358 | | |
Health Care (0.9%): | |
CSL Ltd. | | | 17,939 | | | | 3,330,086 | | |
| | | | 7,814,361 | | |
Belgium (0.4%): | |
Information Technology (0.4%): | |
Melexis NV | | | 17,285 | | | | 1,242,965 | | |
Bermuda (0.6%): | |
Industrials (0.6%): | |
Triton International Ltd. | | | 38,979 | | | | 2,052,244 | | |
Canada (5.1%): | |
Consumer Staples (1.0%): | |
Alimentation Couche-Tard, Inc. | | | 90,047 | | | | 3,513,023 | | |
Energy (0.6%): | |
Parex Resources, Inc. | | | 121,903 | | | | 2,064,868 | | |
Industrials (1.1%): | |
Canadian Pacific Railway Ltd. | | | 53,444 | | | | 3,733,605 | | |
Information Technology (1.4%): | |
Constellation Software, Inc. | | | 3,358 | | | | 4,985,782 | | |
Materials (1.0%): | |
Aginco Eagle Mines Ltd. | | | 73,609 | | | | 3,369,885 | | |
| | | | 17,667,163 | | |
China (3.1%): | |
Communication Services (1.6%): | |
Tencent Holdings Ltd. | | | 123,400 | | | | 5,585,861 | | |
Consumer Staples (0.7%): | |
Foshan Haitian Flavouring & Food Co. Ltd., Class A | | | 164,779 | | | | 2,230,515 | | |
Financials (0.8%): | |
Industrial & Commercial Bank of China Ltd., Class H | | | 4,831,000 | | | | 2,882,485 | | |
| | | | 10,698,861 | | |
Denmark (2.3%): | |
Consumer Discretionary (0.3%): | |
Pandora A/S (a) | | | 16,458 | | | | 1,045,787 | | |
Consumer Staples (0.7%): | |
Royal Unibrew A/S | | | 25,340 | | | | 2,255,571 | | |
See notes to financial statements.
11
Victory Portfolios
Victory RS Global Fund | | Schedule of Portfolio Investments — continued
June 30, 2022 | |
(Unaudited)
Security Description | | Shares | | Value | |
Health Care (1.3%): | |
Novo Nordisk A/S, Class B | | | 41,540 | | | $ | 4,607,632 | | |
| | | | 7,908,990 | | |
France (2.6%): | |
Consumer Discretionary (0.5%): | |
La Francaise des Jeux SAEM (b) | | | 55,802 | | | | 1,937,408 | | |
Energy (0.8%): | |
Gaztransport Et Technigaz SA | | | 23,371 | | | | 2,935,086 | | |
Industrials (0.6%): | |
Safran SA | | | 20,036 | | | | 1,994,610 | | |
Materials (0.7%): | |
Arkema SA | | | 26,387 | | | | 2,360,047 | | |
| | | | 9,227,151 | | |
Germany (0.5%): | |
Consumer Discretionary (0.5%): | |
Volkswagen AG, Preference Shares | | | 12,563 | | | | 1,691,238 | | |
Indonesia (1.1%): | |
Communication Services (1.1%): | |
PT Telkom Indonesia Persero Tbk | | | 14,458,900 | | | | 3,890,313 | | |
Ireland (1.1%): | |
Industrials (1.1%): | |
Eaton Corp. PLC | | | 30,121 | | | | 3,794,945 | | |
Italy (0.9%): | |
Utilities (0.9%): | |
Enel SpA | | | 283,286 | | | | 1,553,382 | | |
Snam SpA | | | 322,064 | | | | 1,689,426 | | |
| | | | 3,242,808 | | |
Japan (5.3%): | |
Communication Services (1.3%): | |
Capcom Co. Ltd. | | | 122,200 | | | | 2,973,069 | | |
Kakaku.com, Inc. | | | 94,600 | | | | 1,571,450 | | |
| | | | 4,544,519 | | |
Consumer Discretionary (0.6%): | |
ZOZO, Inc. | | | 115,900 | | | | 2,097,254 | | |
Consumer Staples (0.8%): | |
Toyo Suisan Kaisha Ltd. | | | 67,200 | | | | 2,624,092 | | |
Financials (0.9%): | |
Mitsubishi UFJ Financial Group, Inc. | | | 577,300 | | | | 3,089,041 | | |
Health Care (0.4%): | |
Hoya Corp. | | | 18,000 | | | | 1,540,720 | | |
See notes to financial statements.
12
Victory Portfolios
Victory RS Global Fund | | Schedule of Portfolio Investments — continued
June 30, 2022 | |
(Unaudited)
Security Description | | Shares | | Value | |
Industrials (0.9%): | |
Fuji Electric Co. Ltd. | | | 27,500 | | | $ | 1,137,123 | | |
Nippon Yusen KK | | | 27,600 | | | | 1,892,671 | | |
| | | | 3,029,794 | | |
Information Technology (0.4%): | |
Ulvac, Inc. | | | 44,600 | | | | 1,519,326 | | |
| | | | 18,444,746 | | |
Korea, Republic Of (1.4%): | |
Information Technology (1.4%): | |
Samsung Electronics Co. Ltd. | | | 110,107 | | | | 4,857,651 | | |
Netherlands (0.5%): | |
Information Technology (0.5%): | |
ASM International NV | | | 7,057 | | | | 1,755,582 | | |
New Zealand (0.5%): | |
Health Care (0.5%): | |
Fisher & Paykel Healthcare Corp. Ltd. | | | 141,217 | | | | 1,758,539 | | |
Norway (1.2%): | |
Energy (0.8%): | |
Aker BP ASA (a) | | | 76,464 | | | | 2,649,351 | | |
Financials (0.4%): | |
SpareBank 1 SMN | | | 124,050 | | | | 1,465,522 | | |
| | | | 4,114,873 | | |
Singapore (0.7%): | |
Financials (0.7%): | |
Singapore Exchange Ltd. | | | 352,000 | | | | 2,398,669 | | |
South Africa (0.3%): | |
Consumer Discretionary (0.3%): | |
Mr Price Group Ltd. | | | 105,269 | | | | 1,154,875 | | |
Spain (0.7%): | |
Financials (0.7%): | |
Banco Bilbao Vizcaya Argentaria SA | | | 550,302 | | | | 2,499,435 | | |
Sweden (1.1%): | |
Industrials (1.1%): | |
Atlas Copco AB, Class B (c) | | | 243,976 | | | | 2,045,367 | | |
Nibe Industrier AB, Class B | | | 231,027 | | | | 1,742,483 | | |
| | | | 3,787,850 | | |
Switzerland (2.3%): | |
Financials (0.4%): | |
Partners Group Holding AG | | | 1,414 | | | | 1,277,180 | | |
Health Care (1.5%): | |
Roche Holding AG | | | 15,766 | | | | 5,271,399 | | |
See notes to financial statements.
13
Victory Portfolios
Victory RS Global Fund | | Schedule of Portfolio Investments — continued
June 30, 2022 | |
(Unaudited)
Security Description | | Shares | | Value | |
Industrials (0.4%): | |
Adecco Group AG | | | 45,613 | | | $ | 1,554,956 | | |
| | | | 8,103,535 | | |
Taiwan (2.3%): | |
Financials (1.3%): | |
Cathay Financial Holding Co. Ltd. | | | 2,707,000 | | | | 4,635,624 | | |
Information Technology (1.0%): | |
Lite-On Technology Corp. | | | 1,729,000 | | | | 3,364,990 | | |
| | | | 8,000,614 | | |
United Kingdom (4.5%): | |
Consumer Discretionary (0.4%): | |
Next PLC | | | 21,771 | | | | 1,555,063 | | |
Consumer Staples (0.7%): | |
Imperial Brands PLC | | | 107,853 | | | | 2,414,173 | | |
Financials (1.5%): | |
Barclays PLC | | | 950,993 | | | | 1,778,014 | | |
HSBC Holdings PLC | | | 397,264 | | | | 2,594,694 | | |
Intermediate Capital Group PLC | | | 53,729 | | | | 858,850 | | |
| | | | 5,231,558 | | |
Industrials (0.4%): | |
Ashtead Group PLC | | | 32,681 | | | | 1,374,608 | | |
Materials (1.5%): | |
Croda International PLC | | | 23,605 | | | | 1,865,469 | | |
Rio Tinto PLC | | | 54,877 | | | | 3,280,354 | | |
| | | | 5,145,823 | | |
| | | | 15,721,225 | | |
United States (54.9%): | |
Communication Services (3.7%): | |
Alphabet, Inc., Class C (c) | | | 3,788 | | | | 8,286,061 | | |
Meta Platforms, Inc., Class A (c) | | | 29,213 | | | | 4,710,596 | | |
| | | | 12,996,657 | | |
Consumer Discretionary (7.2%): | |
Amazon.com, Inc. (c) | | | 51,120 | | | | 5,429,455 | | |
McDonald's Corp. | | | 32,340 | | | | 7,984,099 | | |
PulteGroup, Inc. | | | 84,105 | | | | 3,333,081 | | |
Ross Stores, Inc. | | | 41,017 | | | | 2,880,624 | | |
Target Corp. | | | 15,437 | | | | 2,180,168 | | |
Tesla, Inc. (c) | | | 5,125 | | | | 3,451,277 | | |
| | | | 25,258,704 | | |
Consumer Staples (5.2%): | |
Colgate-Palmolive Co. | | | 80,311 | | | | 6,436,124 | | |
PepsiCo, Inc. | | | 43,331 | | | | 7,221,544 | | |
The Estee Lauder Cos., Inc. | | | 17,173 | | | | 4,373,448 | | |
| | | | 18,031,116 | | |
See notes to financial statements.
14
Victory Portfolios
Victory RS Global Fund | | Schedule of Portfolio Investments — continued
June 30, 2022 | |
(Unaudited)
Security Description | | Shares | | Value | |
Energy (2.1%): | |
APA Corp. | | | 47,717 | | | $ | 1,665,323 | | |
Cactus, Inc., Class A | | | 26,385 | | | | 1,062,524 | | |
ConocoPhillips | | | 50,216 | | | | 4,509,899 | | |
| | | | 7,237,746 | | |
Financials (7.6%): | |
Bank of America Corp. | | | 150,552 | | | | 4,686,684 | | |
JPMorgan Chase & Co. | | | 39,685 | | | | 4,468,928 | | |
LPL Financial Holdings, Inc. | | | 20,427 | | | | 3,768,373 | | |
S&P Global, Inc. | | | 13,505 | | | | 4,551,995 | | |
Synchrony Financial | | | 79,268 | | | | 2,189,382 | | |
The PNC Financial Services Group, Inc. | | | 14,253 | | | | 2,248,696 | | |
Unum Group | | | 133,185 | | | | 4,530,954 | | |
| | | | 26,445,012 | | |
Health Care (8.3%): | |
Amedisys, Inc. (c) | | | 11,910 | | | | 1,251,979 | | |
Amgen, Inc. | | | 21,074 | | | | 5,127,304 | | |
CVS Health Corp. | | | 52,580 | | | | 4,872,063 | | |
Eli Lilly & Co. | | | 19,189 | | | | 6,221,650 | | |
IDEXX Laboratories, Inc. (c) | | | 8,403 | | | | 2,947,184 | | |
Johnson & Johnson | | | 48,070 | | | | 8,532,906 | | |
| | | | 28,953,086 | | |
Industrials (1.8%): | |
Delta Air Lines, Inc. (c) | | | 72,701 | | | | 2,106,148 | | |
Honeywell International, Inc. | | | 24,865 | | | | 4,321,786 | | |
| | | | 6,427,934 | | |
Information Technology (16.2%): | |
Apple, Inc. | | | 125,554 | | | | 17,165,743 | | |
Cisco Systems, Inc. | | | 98,913 | | | | 4,217,650 | | |
Fortinet, Inc. (c) | | �� | 74,445 | | | | 4,212,098 | | |
Mastercard, Inc., Class A | | | 16,965 | | | | 5,352,118 | | |
Microsoft Corp. | | | 63,924 | | | | 16,417,601 | | |
NVIDIA Corp. | | | 32,168 | | | | 4,876,347 | | |
Texas Instruments, Inc. | | | 27,918 | | | | 4,289,601 | | |
| | | | 56,531,158 | | |
Materials (0.4%): | |
Alcoa Corp. | | | 34,884 | | | | 1,590,013 | | |
Real Estate (1.3%): | |
Prologis, Inc. | | | 39,765 | | | | 4,678,352 | | |
Utilities (1.1%): | |
MGE Energy, Inc. | | | 48,980 | | | | 3,812,113 | | |
| | | | 191,961,891 | | |
Total Common Stocks (Cost $329,147,261) | | | 333,790,524 | | |
See notes to financial statements.
15
Victory Portfolios
Victory RS Global Fund | | Schedule of Portfolio Investments — continued
June 30, 2022 | |
(Unaudited)
Security Description | | Shares | | Value | |
Exchange-Traded Funds (1.5%) | |
United States (1.5%): | |
iShares MSCI ACWI ETF | | | 61,117 | | | $ | 5,127,105 | | |
Total Exchange-Traded Funds (Cost $5,632,430) | | | 5,127,105 | | |
Collateral for Securities Loaned (0.9%)^ | |
United States (0.9%): | |
BlackRock Liquidity Funds TempFund, Institutional Shares, 1.47% (d) | | | 101,572 | | | | 101,572 | | |
Goldman Sachs Financial Square Prime Obligations Fund, Institutional
Shares, 1.42% (d) | | | 50,690 | | | | 50,690 | | |
HSBC U.S. Government Money Market Fund I Shares, 1.46% (d) | | | 632,202 | | | | 632,202 | | |
JPMorgan Prime Money Market Fund, Capital Shares, 1.50% (d) | | | 404,183 | | | | 404,183 | | |
Morgan Stanley Institutional Liquidity Government Portfolio, Institutional
Shares, 1.39% (d) | | | 269,545 | | | | 269,545 | | |
Morgan Stanley Institutional Liquidity Prime Portfolio, Institutional
Shares, 1.53% (d) | | | 1,817,288 | | | | 1,817,288 | | |
Total Collateral for Securities Loaned (Cost $3,275,480) | | | 3,275,480 | | |
Total Investments (Cost $338,055,171) — 98.0% | | | 342,193,109 | | |
Other assets in excess of liabilities — 2.0% | | | 7,152,962 | | |
NET ASSETS — 100.00% | | $ | 349,346,071 | | |
^ Purchased with cash collateral from securities on loan.
(a) All or a portion of this security is on loan.
(b) Rule 144A security or other security that is restricted as to resale to institutional investors. The Fund's Adviser has deemed this security to be liquid (unless otherwise noted as illiquid) based upon procedures approved by the Board of Trustees. As of June 30, 2022, the fair value of these securities was $1,937,408 and amounted to 0.6% of net assets.
(c) Non-income producing security.
(d) Rate disclosed is the daily yield on June 30, 2022.
ETF — Exchange-Traded Fund
PLC — Public Limited Company
See notes to financial statements.
16
Victory Portfolios
Victory Sophus Emerging Markets Fund | | Schedule of Portfolio Investments
June 30, 2022 | |
(Unaudited)
Security Description | | Shares | | Value | |
Common Stocks (98.9%) | |
Brazil (6.5%): | |
Consumer Discretionary (0.5%): | |
Vibra Energia SA | | | 633,285 | | | $ | 2,022,242 | | |
Consumer Staples (1.4%): | |
Sao Martinho SA | | | 262,500 | | | | 1,822,436 | | |
Sendas Distribuidora SA | | | 922,101 | | | | 2,514,549 | | |
SLC Agricola SA | | | 211,960 | | | | 1,787,497 | | |
| | | | 6,124,482 | | |
Energy (1.2%): | |
Petroleo Brasileiro SA, ADR | | | 449,679 | | | | 5,252,251 | | |
Financials (1.0%): | |
Itau Unibanco Holding SA, ADR | | | 989,405 | | | | 4,234,653 | | |
Health Care (0.7%): | |
Hypera SA | | | 402,400 | | | | 2,925,203 | | |
Industrials (0.9%): | |
Randon SA Implementos e Participacoes, Preference Shares | | | 1,099,400 | | | | 1,970,680 | | |
SIMPAR SA | | | 1,034,564 | | | | 1,834,691 | | |
| | | | 3,805,371 | | |
Materials (0.8%): | |
Dexco SA | | | 771,017 | | | | 1,454,249 | | |
Gerdau SA, Preference Shares | | | 484,800 | | | | 2,070,607 | | |
| | | | 3,524,856 | | |
| | | | 27,889,058 | | |
Canada (0.5%): | |
Energy (0.5%): | |
Parex Resources, Inc. | | | 120,413 | | | | 2,039,630 | | |
Chile (0.0%): (a) | |
Financials (0.0%): | |
Banco de Credito e Inversiones SA | | | 1 | | | | 29 | | |
China (32.9%): | |
Communication Services (5.6%): | |
37 Interactive Entertainment Network Technology Group Co. Ltd., Class A | | | 529,700 | | | | 1,686,664 | | |
Baidu, Inc., Class A (b) | | | 228,846 | | | | 4,335,185 | | |
NetEase, Inc. | | | 169,955 | | | | 3,201,950 | | |
Tencent Holdings Ltd. | | | 334,815 | | | | 15,155,836 | | |
| | | | 24,379,635 | | |
Consumer Discretionary (10.8%): | |
Alibaba Group Holding Ltd. (b) | | | 1,077,572 | | | | 15,372,380 | | |
BYD Co. Ltd., Class H | | | 124,500 | | | | 5,018,661 | | |
China Meidong Auto Holdings Ltd. | | | 618,000 | | | | 1,963,865 | | |
Fuyao Glass Industry Group Co. Ltd., Class H (c) | | | 667,600 | | | | 3,377,428 | | |
JD.com, Inc., Class A | | | 277,476 | | | | 8,941,348 | | |
See notes to financial statements.
17
Victory Portfolios
Victory Sophus Emerging Markets Fund | | Schedule of Portfolio Investments — continued
June 30, 2022 | |
(Unaudited)
Security Description | | Shares | | Value | |
Jiumaojiu International Holdings Ltd. (c) | | | 1,136,000 | | | $ | 3,025,902 | | |
Meituan, Class B (b) (c) | | | 270,500 | | | | 6,750,307 | | |
Yadea Group Holdings Ltd. (c) | | | 1,092,000 | | | | 2,141,700 | | |
| | | | 46,591,591 | | |
Consumer Staples (2.3%): | |
Chacha Food Co. Ltd., Class A | | | 385,878 | | | | 3,285,966 | | |
Chenguang Biotech Group Co. Ltd., Class A | | | 1,170,500 | | | | 2,728,407 | | |
Inner Mongolia Yili Industrial Group Co. Ltd., Class A | | | 656,200 | | | | 3,823,109 | | |
| | | | 9,837,482 | | |
Energy (1.4%): | |
PetroChina Co. Ltd., Class H | | | 12,880,000 | | | | 6,040,954 | | |
Financials (4.2%): | |
Industrial & Commercial Bank of China Ltd., Class H | | | 7,174,000 | | | | 4,280,469 | | |
PICC Property & Casualty Co. Ltd., Class H | | | 5,444,000 | | | | 5,677,178 | | |
Postal Savings Bank of China Co. Ltd., Class H (c) (d) | | | 10,070,000 | | | | 8,025,180 | | |
| | | | 17,982,827 | | |
Health Care (1.7%): | |
Hygeia Healthcare Holdings Co. Ltd. (b) (c) | | | 374,400 | | | | 2,496,734 | | |
Pharmaron Beijing Co. Ltd., Class H (c) | | | 211,150 | | | | 2,120,932 | | |
Shenzhen Mindray Bio-Medical Electronics Co. Ltd., Class A | | | 55,900 | | | | 2,621,445 | | |
| | | | 7,239,111 | | |
Industrials (2.0%): | |
China Railway Group Ltd., Class H | | | 8,525,000 | | | | 5,277,439 | | |
Xinte Energy Co. Ltd., Class H | | | 1,140,400 | | | | 3,421,762 | | |
| | | | 8,699,201 | | |
Information Technology (1.8%): | |
Glodon Co. Ltd., Class A | | | 323,000 | | | | 2,630,154 | | |
Luxshare Precision Industry Co. Ltd., Class A | | | 590,000 | | | | 2,984,139 | | |
WUS Printed Circuit Kunshan Co. Ltd., Class A | | | 1,025,050 | | | | 2,266,407 | | |
| | | | 7,880,700 | | |
Materials (2.2%): | |
China Hongqiao Group Ltd. | | | 3,118,500 | | | | 3,513,218 | | |
Shandong Nanshan Aluminum Co. Ltd., Class A | | | 3,734,700 | | | | 2,061,976 | | |
Wanhua Chemical Group Co. Ltd., Class A | | | 287,000 | | | | 4,167,790 | | |
| | | | 9,742,984 | | |
Utilities (0.9%): | |
China Longyuan Power Group Corp. Ltd., Class H | | | 1,972,000 | | | | 3,821,769 | | |
| | | | 142,216,254 | | |
Greece (1.2%): | |
Financials (0.5%): | |
National Bank of Greece SA (b) | | | 746,353 | | | | 2,232,453 | | |
Industrials (0.7%): | |
Mytilineos SA | | | 188,852 | | | | 2,795,004 | | |
| | | | 5,027,457 | | |
See notes to financial statements.
18
Victory Portfolios
Victory Sophus Emerging Markets Fund | | Schedule of Portfolio Investments — continued
June 30, 2022 | |
(Unaudited)
Security Description | | Shares | | Value | |
Hong Kong (2.9%): | |
Consumer Discretionary (0.8%): | |
Bosideng International Holdings Ltd. | | | 5,542,000 | | | $ | 3,443,161 | | |
Financials (0.5%): | |
BOC Hong Kong Holdings Ltd. | | | 547,500 | | | | 2,174,166 | | |
Industrials (0.5%): | |
Pacific Basin Shipping Ltd. | | | 6,091,000 | | | | 2,341,780 | | |
Real Estate (1.1%): | |
China Resources Land Ltd. | | | 960,000 | | | | 4,501,832 | | |
| | | | 12,460,939 | | |
India (11.8%): | |
Communication Services (0.3%): | |
Sun TV Network Ltd. | | | 233,029 | | | | 1,220,877 | | |
Consumer Discretionary (2.8%): | |
Balkrishna Industries Ltd. | | | 145,343 | | | | 3,974,266 | | |
Mahindra & Mahindra Ltd. | | | 460,589 | | | | 6,406,260 | | |
Raymond Ltd. | | | 165,862 | | | | 1,848,364 | | |
| | | | 12,228,890 | | |
Consumer Staples (0.4%): | |
Dabur India Ltd. | | | 285,525 | | | | 1,796,339 | | |
Financials (2.9%): | |
Cholamandalam Investment & Finance Co. Ltd. | | | 491,534 | | | | 3,872,224 | | |
ICICI Bank Ltd., ADR | | | 450,772 | | | | 7,996,695 | | |
UTI Asset Management Co. Ltd. | | | 69,834 | | | | 573,541 | | |
| | | | 12,442,460 | | |
Health Care (0.8%): | |
Apollo Hospitals Enterprise Ltd. | | | 71,977 | | | | 3,367,796 | | |
Industrials (1.0%): | |
Larsen & Toubro Ltd. | | | 227,000 | | | | 4,500,311 | | |
Information Technology (2.4%): | |
Infosys Ltd., ADR | | | 361,460 | | | | 6,690,625 | | |
WNS Holdings Ltd., ADR (b) | | | 49,268 | | | | 3,677,363 | | |
| | | | 10,367,988 | | |
Materials (0.7%): | |
Tata Steel Ltd. | | | 263,091 | | | | 2,901,006 | | |
Utilities (0.5%): | |
GAIL India Ltd. | | | 1,116,044 | | | | 1,915,622 | | |
| | | | 50,741,289 | | |
Indonesia (0.7%): | |
Financials (0.7%): | |
PT Bank Mandiri Persero Tbk | | | 5,388,600 | | | | 2,878,081 | | |
See notes to financial statements.
19
Victory Portfolios
Victory Sophus Emerging Markets Fund | | Schedule of Portfolio Investments — continued
June 30, 2022 | |
(Unaudited)
Security Description | | Shares | | Value | |
Korea, Republic Of (12.3%): | |
Communication Services (1.5%): | |
JYP Entertainment Corp. | | | 80,472 | | | $ | 2,995,365 | | |
LG Uplus Corp. | | | 365,314 | | | | 3,595,929 | | |
| | | | 6,591,294 | | |
Consumer Discretionary (0.7%): | |
Shinsegae, Inc. | | | 16,838 | | | | 2,835,191 | | |
Financials (2.4%): | |
Hana Financial Group, Inc. | | | 135,143 | | | | 4,108,450 | | |
Samsung Securities Co. Ltd. | | | 90,080 | | | | 2,329,079 | | |
Woori Financial Group, Inc. | | | 416,800 | | | | 3,902,459 | | |
| | | | 10,339,988 | | |
Health Care (1.0%): | |
InBody Co. Ltd. | | | 65,841 | | | | 1,213,614 | | |
Samsung Biologics Co. Ltd. (b) (c) | | | 4,701 | | | | 2,874,701 | | |
| | | | 4,088,315 | | |
Industrials (0.4%): | |
CJ Corp. | | | 30,101 | | | | 1,807,815 | | |
Information Technology (6.2%): | |
Innox Advanced Materials Co. Ltd. | | | 79,449 | | | | 2,039,230 | | |
Samsung Electro-Mechanics Co. Ltd. | | | 22,450 | | | | 2,271,874 | | |
Samsung Electronics Co. Ltd. | | | 399,638 | | | | 17,479,834 | | |
SK Hynix, Inc. | | | 70,271 | | | | 4,963,271 | | |
| | | | 26,754,209 | | |
Materials (0.1%): | |
PI Advanced Materials Co. Ltd. | | | 23,780 | | | | 585,505 | | |
| | | | 53,002,317 | | |
Malaysia (2.2%): | |
Consumer Discretionary (0.4%): | |
MR DIY Group M Bhd (c) | | | 3,576,600 | | | | 1,681,017 | | |
Consumer Staples (0.4%): | |
Kuala Lumpur Kepong Bhd | | | 394,700 | | | | 1,964,570 | | |
Financials (0.9%): | |
Public Bank Bhd | | | 4,023,400 | | | | 3,992,432 | | |
Materials (0.5%): | |
Petronas Chemicals Group Bhd | | | 1,013,700 | | | | 2,070,682 | | |
| | | | 9,708,701 | | |
Mexico (1.6%): | |
Consumer Discretionary (0.4%): | |
Alsea SAB de CV (b) | | | 996,448 | | | | 1,887,385 | | |
Financials (1.0%): | |
Grupo Financiero Banorte SAB de CV, Class O | | | 804,428 | | | | 4,488,206 | | |
See notes to financial statements.
20
Victory Portfolios
Victory Sophus Emerging Markets Fund | | Schedule of Portfolio Investments — continued
June 30, 2022 | |
(Unaudited)
Security Description | | Shares | | Value | |
Real Estate (0.2%): | |
Corp Inmobiliaria Vesta SAB de CV | | | 362,535 | | | $ | 674,420 | | |
| | | | 7,050,011 | | |
Peru (0.9%): | |
Financials (0.9%): | |
Credicorp Ltd. | | | 31,679 | | | | 3,798,629 | | |
Philippines (0.6%): | |
Financials (0.6%): | |
BDO Unibank, Inc. | | | 1,259,690 | | | | 2,535,035 | | |
Qatar (0.7%): | |
Industrials (0.7%): | |
Industries Qatar QSC | | | 670,668 | | | | 2,942,722 | | |
Russian Federation (0.0%): (a) | |
Consumer Staples (0.0%): | |
Magnit PJSC (e) (f) | | | 41,301 | | | | 683 | | |
Energy (0.0%): | |
Gazprom PJSC (e) (f) (g) (h) | | | 1,511,910 | | | | 66,636 | | |
Rosneft Oil Co. PJSC, GDR (e) (f) (g) (h) | | | 677,591 | | | | 31,752 | | |
| | | | 98,388 | | |
Financials (0.0%): | |
Sberbank of Russia PJSC, ADR (b) (e) (f) (g) (h) | | | 446,943 | | | | 2,990 | | |
| | | | 102,061 | | |
Saudi Arabia (4.0%): | |
Consumer Discretionary (0.4%): | |
Leejam Sports Co. JSC | | | 76,166 | | | | 1,821,477 | | |
Financials (2.4%): | |
Alinma Bank | | | 476,825 | | | | 4,261,406 | | |
The Saudi National Bank | | | 352,259 | | | | 6,200,945 | | |
| | | | 10,462,351 | | |
Health Care (0.5%): | |
Mouwasat Medical Services Co. | | | 38,542 | | | | 2,189,017 | | |
Materials (0.7%): | |
Saudi Arabian Mining Co. (b) | | | 213,768 | | | | 2,853,228 | | |
| | | | 17,326,073 | | |
South Africa (4.2%): | |
Communication Services (0.7%): | |
MTN Group Ltd. | | | 383,497 | | | | 3,122,197 | | |
Consumer Discretionary (0.5%): | |
Woolworths Holdings Ltd. | | | 724,653 | | | | 2,423,243 | | |
Financials (1.7%): | |
Absa Group Ltd. | | | 372,878 | | | | 3,562,010 | | |
Capitec Bank Holdings Ltd. | | | 30,572 | | | | 3,748,653 | | |
| | | | 7,310,663 | | |
See notes to financial statements.
21
Victory Portfolios
Victory Sophus Emerging Markets Fund | | Schedule of Portfolio Investments — continued
June 30, 2022 | |
(Unaudited)
Security Description | | Shares | | Value | |
Industrials (0.5%): | |
The Bidvest Group Ltd | | | 161,826 | | | $ | 2,091,064 | | |
Materials (0.8%): | |
Impala Platinum Holdings Ltd. | | | 303,836 | | | | 3,372,456 | | |
| | | | 18,319,623 | | |
Taiwan (11.1%): | |
Financials (1.1%): | |
CTBC Financial Holding Co. Ltd. | | | 5,654,000 | | | | 4,782,684 | | |
Information Technology (9.2%): | |
Gold Circuit Electronics Ltd. | | | 1,269,000 | | | | 3,258,042 | | |
Hon Hai Precision Industry Co. Ltd. | | | 1,279,000 | | | | 4,695,629 | | |
Taiwan Semiconductor Manufacturing Co. Ltd. | | | 1,884,998 | | | | 30,211,167 | | |
Unimicron Technology Corp. | | | 340,000 | | | | 1,819,723 | | |
| | | | 39,984,561 | | |
Materials (0.8%): | |
Formosa Plastics Corp. | | | 910,000 | | | | 3,322,978 | | |
| | | | 48,090,223 | | |
Thailand (3.5%): | |
Energy (0.8%): | |
PTT PCL | | | 3,596,500 | | | | 3,463,240 | | |
Financials (0.9%): | |
SCB X PCL (b) | | | 1,338,100 | | | | 3,936,802 | | |
Health Care (0.5%): | |
Mega Lifesciences PCL | | | 1,594,900 | | | | 2,281,390 | | |
Materials (0.8%): | |
Indorama Ventures PCL | | | 2,535,800 | | | | 3,379,818 | | |
Real Estate (0.5%): | |
AP Thailand PCL | | | 7,070,700 | | | | 2,002,842 | | |
| | | | 15,064,092 | | |
United Kingdom (1.3%): | |
Materials (1.3%): | |
Anglo American PLC | | | 100,003 | | | | 3,574,356 | | |
Mondi PLC | | | 125,776 | | | | 2,232,163 | | |
| | | | 5,806,519 | | |
Total Common Stocks (Cost $461,569,038) | | | 426,998,743 | | |
Collateral for Securities Loaned (1.2%)^ | |
United States (1.2%): | |
BlackRock Liquidity Funds TempFund, Institutional Shares, 1.47% (i) | | | 162,832 | | | | 162,832 | | |
Goldman Sachs Financial Square Prime Obligations Fund, Institutional
Shares, 1.42% (i) | | | 81,261 | | | | 81,261 | | |
HSBC U.S. Government Money Market Fund I Shares, 1.46% (i) | | | 1,013,490 | | | | 1,013,490 | | |
JPMorgan Prime Money Market Fund, Capital Shares, 1.50% (i) | | | 647,951 | | | | 647,951 | | |
See notes to financial statements.
22
Victory Portfolios
Victory Sophus Emerging Markets Fund | | Schedule of Portfolio Investments — continued
June 30, 2022 | |
(Unaudited)
Security Description | | Shares | | Value | |
Morgan Stanley Institutional Liquidity Government Portfolio, Institutional
Shares, 1.39% (i) | | | 432,110 | | | $ | 432,110 | | |
Morgan Stanley Institutional Liquidity Prime Portfolio, Institutional
Shares, 1.53% (i) | | | 2,913,314 | | | | 2,913,314 | | |
Total Collateral for Securities Loaned (Cost $5,250,958) | | | 5,250,958 | | |
Total Investments (Cost $466,819,996) — 100.1% | | | 432,249,701 | | |
Liabilities in excess of other assets — (0.1)% | | | (518,403 | ) | |
NET ASSETS — 100.00% | | $ | 431,731,298 | | |
^ Purchased with cash collateral from securities on loan.
(a) Amount represents less than 0.05% of net assets.
(b) Non-income producing security.
(c) Rule 144A security or other security that is restricted as to resale to institutional investors. The Fund's Adviser has deemed this security to be liquid (unless otherwise noted as illiquid) based upon procedures approved by the Board of Trustees. As of June 30, 2022, the fair value of these securities was $32,493,901 and amounted to 7.5% of net assets.
(d) All or a portion of this security is on loan.
(e) The Fund's Adviser has deemed this security to be illiquid based upon procedures approved by the Board of Trustees. As of June 30, 2022, illiquid securities were less than 0.05% of net assets.
(f) Security was fair valued based upon procedures approved by the Board of Trustees and represents less than 0.05% of net assets as of June 30, 2022. This security is classified as Level 3 within the fair value hierarchy. (See Note 2 in the Notes to Financial Statements)
(g) Restricted security that is not registered under the Securities Act of 1933.
(h) The following table details the acquisition date and cost of the Fund's restricted securities at June 30, 2022:
Security Name | | Acquisition Date | | Cost | |
Gazprom PJSC | | 7/28/2021 | | $ | 5,922,464 | | |
Rosneft Oil Co. PJSC, GDR | | 3/6/2020 | | | 4,383,338 | | |
Sberbank of Russia PJSC, ADR | | 11/11/2020 | | | 6,053,328 | | |
(i) Rate disclosed is the daily yield on June 30, 2022.
ADR — American Depositary Receipt
GDR — Global Depositary Receipt
PCL — Public Company Limited
PLC — Public Limited Company
See notes to financial statements.
23
Victory Portfolios | | Statements of Assets and Liabilities
June 30, 2022 | |
(Unaudited)
| | | Victory
RS International
Fund | | Victory
RS Global
Fund | | Victory Sophus
Emerging
Markets Fund | |
Assets: | |
Investments, at value (Cost $338,700,510,
$338,055,171 and $466,819,996) | | $ | 322,109,778 | (a) | | $ | 342,193,109 | (b) | | $ | 432,249,701 | (c) | |
Foreign currency, at value (Cost $388,013,
$625,646 and $4,722,662) | | | 392,169 | | | | 627,032 | | | | 4,724,091 | | |
Cash | | | 5,854,363 | | | | 9,884,180 | | | | — | | |
Receivables: | |
Interest and dividends | | | 295,748 | | | | 272,971 | | | | 2,003,774 | | |
Capital shares issued | | | 29,318 | | | | 839,205 | | | | 243,725 | | |
Investments sold | | | 1,195,661 | | | | — | | | | 6,827,624 | | |
Reclaims | | | 1,191,866 | | | | 185,735 | | | | 4,212 | | |
From Adviser | | | 80,144 | | | | 145,390 | | | | 243,605 | | |
Prepaid expenses | | | 39,855 | | | | 57,717 | | | | 40,898 | | |
Total Assets | | | 331,188,902 | | | | 354,205,339 | | | | 446,337,630 | | |
Liabilities: | |
Payables: | |
Collateral received on loaned securities | | | 3,248,668 | | | | 3,275,480 | | | | 5,250,958 | | |
Payable to custodian | | | — | | | | — | | | | 2,786,043 | | |
Investments purchased | | | 1,436,670 | | | | 1,235,018 | | | | 5,587,622 | | |
Capital shares redeemed | | | 92,297 | | | | 54,013 | | | | 188,834 | | |
Accrued foreign capital gains taxes | | | — | | | | — | | | | 202,676 | | |
Accrued expenses and other payables: | |
Investment advisory fees | | | 221,056 | | | | 177,525 | | | | 366,175 | | |
Administration fees | | | 14,909 | | | | 15,979 | | | | 19,767 | | |
Custodian fees | | | 9,305 | | | | 7,336 | | | | 45,572 | | |
Transfer agent fees | | | 36,857 | | | | 58,636 | | | | 85,400 | | |
Compliance fees | | | 192 | | | | 208 | | | | 244 | | |
| 12b-1 fees | | | 2,700 | | | | 9,027 | | | | 6,665 | | |
Other accrued expenses | | | 30,023 | | | | 26,046 | | | | 66,376 | | |
Total Liabilities | | | 5,092,677 | | | | 4,859,268 | | | | 14,606,332 | | |
Net Assets: | |
Capital | | | 342,329,967 | | | | 350,918,053 | | | | 476,222,130 | | |
Total accumulated earnings/(loss) | | | (16,233,742 | ) | | | (1,571,982 | ) | | | (44,490,832 | ) | |
Net Assets | | $ | 326,096,225 | | | $ | 349,346,071 | | | $ | 431,731,298 | | |
Net Assets | |
Class A | | $ | 19,497,070 | | | $ | 60,227,598 | | | $ | 40,797,290 | | |
Class C | | | 967,240 | | | | 4,437,243 | | | | 971,438 | | |
Class R | | | 1,527,659 | | | | 4,852,314 | | | | 9,469,026 | | |
Class R6 | | | 235,553,795 | | | | 107,273,125 | | | | 161,875,743 | | |
Class Y | | | 68,550,461 | | | | 172,555,791 | | | | 218,617,801 | | |
Total | | $ | 326,096,225 | | | $ | 349,346,071 | | | $ | 431,731,298 | | |
(continues on next page)
See notes to financial statements.
24
Victory Portfolios | | Statements of Assets and Liabilities
June 30, 2022 | |
(Unaudited) (continued)
| | | Victory
RS International
Fund | | Victory
RS Global
Fund | | Victory Sophus
Emerging
Markets Fund | |
Shares (unlimited number of shares authorized
with a par value of $0.001 per share): | |
Class A | | | 1,672,484 | | | | 3,773,288 | | | | 2,216,972 | | |
Class C | | | 117,635 | | | | 289,528 | | | | 72,039 | | |
Class R | | | 141,076 | | | | 242,171 | | | | 551,804 | | |
Class R6 | | | 24,662,780 | | | | 9,095,161 | | | | 8,630,445 | | |
Class Y | | | 5,962,634 | | | | 10,886,846 | | | | 11,787,814 | | |
Total | | | 32,556,609 | | | | 24,286,994 | | | | 23,259,074 | | |
Net asset value, offering (except Class A)
and redemption price per share: | |
Class A | | $ | 11.66 | | | $ | 15.96 | | | $ | 18.40 | | |
Class C (d) | | | 8.22 | | | | 15.33 | | | | 13.48 | | |
Class R | | | 10.83 | | | | 20.04 | | | | 17.16 | | |
Class R6 | | | 9.55 | | | | 11.79 | | | | 18.76 | | |
Class Y | | | 11.50 | | | | 15.85 | | | | 18.55 | | |
Maximum Sales Charge — Class A | | | 5.75 | % | | | 5.75 | % | | | 5.75 | % | |
Maximum offering price (100%/(100%-maximum
sales charge) of net asset value adjusted to the
nearest cent) per share — Class A | | $ | 12.37 | | | $ | 16.93 | | | $ | 19.52 | | |
(a) Includes $1,063,478 of securities on loan.
(b) Includes $2,085,475 of securities on loan.
(c) Includes $4,990,435 of securities on loan.
(d) Redemption price per share varies by the length of time shares are held.
See notes to financial statements.
25
Victory Portfolios | | Statements of Operations
For the Six Months Ended June 30, 2022 | |
(Unaudited)
| | | Victory
RS International
Fund | | Victory
RS Global
Fund | | Victory Sophus
Emerging
Markets Fund | |
Investment Income: | | | |
Dividends | | $ | 9,116,423 | | | $ | 4,686,381 | | | $ | 7,550,782 | | |
Interest | | | 1,929 | | | | 4,040 | | | | 2,723 | | |
Non-cash dividends | | | 979,866 | | | | — | | | | 658,377 | | |
Securities lending (net of fees) | | | 65,305 | | | | 13,387 | | | | 3,593 | | |
Foreign tax withholding | | | (1,142,679 | ) | | | (397,701 | ) | | | (866,157 | ) | |
Total Income | | | 9,020,844 | | | | 4,306,107 | | | | 7,349,318 | | |
Expenses: | | | |
Investment advisory fees | | | 1,521,293 | | | | 1,082,574 | | | | 2,363,874 | | |
Administration fees | | | 102,740 | | | | 97,497 | | | | 127,727 | | |
Sub-Administration fees | | | 8,428 | | | | 8,428 | | | | 8,428 | | |
| 12b-1 fees — Class A | | | 27,813 | | | | 81,094 | | | | 59,492 | | |
| 12b-1 fees — Class C | | | 5,357 | | | | 24,296 | | | | 6,789 | | |
| 12b-1 fees — Class R | | | 4,281 | | | | 13,185 | | | | 27,088 | | |
Custodian fees | | | 28,381 | | | | 23,066 | | | | 163,825 | | |
Transfer agent fees — Class A | | | 23,472 | | | | 52,164 | | | | 43,861 | | |
Transfer agent fees — Class C | | | 508 | | | | 2,970 | | | | 1,322 | | |
Transfer agent fees — Class R | | | 1,768 | | | | 3,242 | | | | 9,052 | | |
Transfer agent fees — Class R6 | | | 461 | | | | 922 | | | | 3,650 | | |
Transfer agent fees — Class Y | | | 62,517 | | | | 100,423 | | | | 145,373 | | |
Trustees' fees | | | 11,906 | | | | 10,543 | | | | 14,393 | | |
Compliance fees | | | 1,381 | | | | 1,250 | | | | 1,688 | | |
Legal and audit fees | | | 14,961 | | | | 17,108 | | | | 29,303 | | |
State registration and filing fees | | | 36,417 | | | | 48,237 | | | | 38,614 | | |
Interfund lending fees | | | 392 | | | | — | | | | 713 | | |
Other expenses | | | 30,893 | | | | 25,603 | | | | 56,908 | | |
Total Expenses | | | 1,882,969 | | | | 1,592,602 | | | | 3,102,100 | | |
Expenses waived/reimbursed by Adviser | | | (239,905 | ) | | | (417,089 | ) | | | (728,153 | ) | |
Net Expenses | | | 1,643,064 | | | | 1,175,513 | | | | 2,373,947 | | |
Net Investment Income (Loss) | | | 7,377,780 | | | | 3,130,594 | | | | 4,975,371 | | |
Realized/Unrealized Gains (Losses) from
Investments: | | | |
Net realized gains (losses) from investment
securities and foreign currency transactions | | | (3,983,734 | ) | | | (5,043,608 | ) | | | (12,847,721 | ) | |
Foreign tax (paid) refunds on realized gains | | | — | | | | 156 | | | | (82,972 | ) | |
Net change in unrealized appreciation/
depreciation on investment securities
and foreign currency translations | | | (92,632,424 | ) | | | (87,618,444 | ) | | | (90,680,480 | ) | |
Net change in accrued foreign taxes on
unrealized gains | | | — | | | | — | | | | 431,289 | | |
Net realized/unrealized gains (losses) on
investments | | | (96,616,158 | ) | | | (92,661,896 | ) | | | (103,179,884 | ) | |
Change in net assets resulting from operations | | $ | (89,238,378 | ) | | $ | (89,531,302 | ) | | $ | (98,204,513 | ) | |
See notes to financial statements.
26
Victory Portfolios | | Statements of Changes in Net Assets | |
| | | Victory
RS International Fund | | Victory RS Global Fund | | Victory Sophus
Emerging Markets Fund | |
| | | Six
Months
Ended
June 30,
2022
(Unaudited) | | Year
Ended
December 31,
2021 | | Six
Months
Ended
June 30,
2022
(Unaudited) | | Year
Ended
December 31,
2021 | | Six
Months
Ended
June 30,
2022
(Unaudited) | | Year
Ended
December 31,
2021 | |
From Investment
Activities: | |
Operations: | |
Net Investment
Income (Loss) | | $ | 7,377,780 | | | $ | 8,400,111 | | | $ | 3,130,594 | | | $ | 3,496,440 | | | $ | 4,975,371 | | | $ | 5,449,839 | | |
Net realized gains
(losses) from
investments | | | (3,983,734 | ) | | | 18,558,540 | | | | (5,043,452 | ) | | | 8,197,474 | | | | (12,930,693 | ) | | | 41,475,953 | | |
Net change in
unrealized
appreciation/
depreciation
on investments | | | (92,632,424 | ) | | | 27,076,805 | | | | (87,618,444 | ) | | | 43,710,135 | | | | (90,249,191 | ) | | | (72,829,809 | ) | |
Change in net assets
resulting from
operations | | | (89,238,378 | ) | | | 54,035,456 | | | | (89,531,302 | ) | | | 55,404,049 | | | | (98,204,513 | ) | | | (25,904,017 | ) | |
Distributions to
Shareholders: | |
Class A | | | — | | | | (1,039,350 | ) | | | — | | | | (2,189,789 | ) | | | — | | | | (2,138,975 | ) | |
Class C | | | — | | | | (57,816 | ) | | | — | | | | (108,980 | ) | | | — | | | | (71,226 | ) | |
Class R | | | — | | | | (80,118 | ) | | | — | | | | (124,953 | ) | | | — | | | | (470,900 | ) | |
Class R6 | | | — | | | | (15,469,430 | ) | | | — | | | | (4,331,090 | ) | | | — | | | | (7,458,475 | ) | |
Class Y | | | — | | | | (4,887,821 | ) | | | — | | | | (5,612,312 | ) | | | — | | | | (11,195,767 | ) | |
From return of
capital: | |
Class A | | | — | | | | — | | | | — | | | | — | | | | — | | | | (26,869 | ) | |
Class C | | | — | | | | — | | | | — | | | | — | | | | — | | | | (311 | ) | |
Class R | | | — | | | | — | | | | — | | | | — | | | | — | | | | (5,030 | ) | |
Class R6 | | | — | | | | — | | | | — | | | | — | | | | — | | | | (115,990 | ) | |
Class Y | | | — | | | | — | | | | — | | | | — | | | | — | | | | (170,813 | ) | |
Change in net assets
resulting from
distributions to
shareholders | | | — | | | | (21,534,535 | ) | | | — | | | | (12,367,124 | ) | | | — | | | | (21,654,356 | ) | |
Change in net assets
resulting from
capital transactions | | | (22,048,025 | ) | | | 23,244,315 | | | | 87,981,779 | | | | 87,147,589 | | | | 29,817,220 | | | | 74,677,705 | | |
Change in net assets | | | (111,286,403 | ) | | | 55,745,236 | | | | (1,549,523 | ) | | | 130,184,514 | | | | (68,387,293 | ) | | | 27,119,332 | | |
Net Assets: | |
Beginning of period | | | 437,382,628 | | | | 381,637,392 | | | | 350,895,594 | | | | 220,711,080 | | | | 500,118,591 | | | | 472,999,259 | | |
End of period | | $ | 326,096,225 | | | $ | 437,382,628 | | | $ | 349,346,071 | | | $ | 350,895,594 | | | $ | 431,731,298 | | | $ | 500,118,591 | | |
(continues on next page)
See notes to financial statements.
27
Victory Portfolios | | Statements of Changes in Net Assets | |
(continued)
| | | Victory
RS International Fund | | Victory RS Global Fund | | Victory Sophus
Emerging Markets Fund | |
| | | Six
Months
Ended
June 30,
2022
(Unaudited) | | Year
Ended
December 31,
2021 | | Six
Months
Ended
June 30,
2022
(Unaudited) | | Year
Ended
December 31,
2021 | | Six
Months
Ended
June 30,
2022
(Unaudited) | | Year
Ended
December 31,
2021 | |
Capital Transactions: | |
Class A | |
Proceeds from
shares issued | | $ | 982,432 | | | $ | 3,782,204 | | | $ | 13,824,772 | | | $ | 30,273,412 | | | $ | 3,306,343 | | | $ | 12,169,687 | | |
Distributions
reinvested | | | — | | | | 1,026,274 | | | | — | | | | 2,189,490 | | | | — | | | | 2,131,142 | | |
Cost of shares
redeemed | | | (1,781,435 | ) | | | (5,581,683 | ) | | | (8,929,958 | ) | | | (19,928,713 | ) | | | (7,022,675 | ) | | | (15,751,498 | ) | |
Total Class A | | $ | (799,003 | ) | | $ | (773,205 | ) | | $ | 4,894,814 | | | $ | 12,534,189 | | | $ | (3,716,332 | ) | | $ | (1,450,669 | ) | |
Class C | |
Proceeds from
shares issued | | $ | 114,650 | | | $ | — | | | $ | 1,771,418 | | | $ | 681,553 | | | $ | 900 | | | $ | 72,763 | | |
Distributions
reinvested | | | — | | | | 57,816 | | | | — | | | | 108,980 | | | | — | | | | 71,469 | | |
Cost of shares
redeemed | | | (35,158 | ) | | | (237,775 | ) | | | (350,055 | ) | | | (669,835 | ) | | | (442,589 | ) | | | (1,633,676 | ) | |
Total Class C | | $ | 79,492 | | | $ | (179,959 | ) | | $ | 1,421,363 | | | $ | 120,698 | | | $ | (441,689 | ) | | $ | (1,489,444 | ) | |
Class R | |
Proceeds from
shares issued | | $ | 82,588 | | | $ | 209,980 | | | $ | 814,428 | | | $ | 420,305 | | | $ | 598,560 | | | $ | 1,691,004 | | |
Distributions
reinvested | | | — | | | | 80,117 | | | | — | | | | 124,953 | | | | — | | | | 475,168 | | |
Cost of shares
redeemed | | | (104,782 | ) | | | (518,332 | ) | | | (121,198 | ) | | | (385,111 | ) | | | (734,854 | ) | | | (2,910,119 | ) | |
Total Class R | | $ | (22,194 | ) | | $ | (228,235 | ) | | $ | 693,230 | | | $ | 160,147 | | | $ | (136,294 | ) | | $ | (743,947 | ) | |
Class R6 | |
Proceeds from
shares issued | | $ | 11,632,156 | | | $ | 22,800,521 | | | $ | 34,650,763 | | | $ | 43,038,792 | | | $ | 39,342,196 | | | $ | 94,833,979 | | |
Distributions
reinvested | | | — | | | | 15,408,131 | | | | — | | | | 4,327,185 | | | | — | | | | 7,283,778 | | |
Cost of shares
redeemed | | | (10,923,972 | ) | | | (13,779,137 | ) | | | (1,436,038 | ) | | | (4,663,447 | ) | | | (14,795,977 | ) | | | (24,889,733 | ) | |
Total Class R6 | | $ | 708,184 | | | $ | 24,429,515 | | | $ | 33,214,725 | | | $ | 42,702,530 | | | $ | 24,546,219 | | | $ | 77,228,024 | | |
Class Y | |
Proceeds from
shares issued | | $ | 10,830,195 | | | $ | 32,525,272 | | | $ | 80,445,948 | | | $ | 53,808,588 | | | $ | 53,772,049 | | | $ | 83,395,279 | | |
Distributions
reinvested | | | — | | | | 4,884,864 | | | | — | | | | 5,608,671 | | | | — | | | | 11,334,737 | | |
Cost of shares
redeemed | | | (32,844,699 | ) | | | (37,413,937 | ) | | | (32,688,301 | ) | | | (27,787,234 | ) | | | (44,206,733 | ) | | | (93,596,275 | ) | |
Total Class Y | | $ | (22,014,504 | ) | | $ | (3,801 | ) | | $ | 47,757,647 | | | $ | 31,630,025 | | | $ | 9,565,316 | | | $ | 1,133,741 | | |
Change in net assets
resulting from capital
transactions | | $ | (22,048,025 | ) | | $ | 23,244,315 | | | $ | 87,981,779 | | | $ | 87,147,589 | | | $ | 29,817,220 | | | $ | 74,677,705 | | |
(continues on next page)
See notes to financial statements.
28
Victory Portfolios | | Statements of Changes in Net Assets | |
(continued)
| | | Victory
RS International Fund | | Victory RS Global Fund | | Victory Sophus
Emerging Markets Fund | |
| | | Six
Months
Ended
June 30,
2022
(Unaudited) | | Year
Ended
December 31,
2021 | | Six
Months
Ended
June 30,
2022
(Unaudited) | | Year
Ended
December 31,
2021 | | Six
Months
Ended
June 30,
2022
(Unaudited) | | Year
Ended
December 31,
2021 | |
Share Transactions: | |
Class A | |
Issued | | | 77,865 | | | | 260,078 | | | | 753,661 | | | | 1,528,049 | | | | 154,702 | | | | 476,833 | | |
Reinvested | | | — | | | | 69,890 | | | | — | | | | 108,460 | | | | — | | | | 94,077 | | |
Redeemed | | | (136,759 | ) | | | (378,820 | ) | | | (486,737 | ) | | | (1,087,051 | ) | | | (326,000 | ) | | | (619,797 | ) | |
Total Class A | | | (58,894 | ) | | | (48,852 | ) | | | 266,924 | | | | 549,458 | | | | (171,298 | ) | | | (48,887 | ) | |
Class C | |
Issued | | | 11,701 | | | | — | | | | 96,609 | | | | 36,053 | | | | 58 | | | | 3,730 | | |
Reinvested | | | — | | | | 5,554 | | | | — | | | | 5,629 | | | | — | | | | 4,307 | | |
Redeemed | | | (3,854 | ) | | | (23,450 | ) | | | (20,979 | ) | | | (36,997 | ) | | | (28,912 | ) | | | (84,587 | ) | |
Total Class C | | | 7,847 | | | | (17,896 | ) | | | 75,630 | | | | 4,685 | | | | (28,854 | ) | | | (76,550 | ) | |
Class R | |
Issued | | | 6,683 | | | | 15,426 | | | | 34,105 | | | | 17,638 | | | | 30,590 | | | | 72,211 | | |
Reinvested | | | — | | | | 5,866 | | | | — | | | | 4,939 | | | | — | | | | 22,482 | | |
Redeemed | | | (8,329 | ) | | | (37,328 | ) | | | (5,186 | ) | | | (15,790 | ) | | | (37,666 | ) | | | (120,823 | ) | |
Total Class R | | | (1,646 | ) | | | (16,036 | ) | | | 28,919 | | | | 6,787 | | | | (7,076 | ) | | | (26,130 | ) | |
Class R6 | |
Issued | | | 1,109,823 | | | | 1,830,467 | | | | 2,601,629 | | | | 3,002,088 | | | | 1,776,313 | | | | 3,586,805 | | |
Reinvested | | | — | | | | 1,278,135 | | | | — | | | | 289,548 | | | | — | | | | 315,585 | | |
Redeemed | | | (978,660 | ) | | | (1,169,870 | ) | | | (106,645 | ) | | | (325,083 | ) | | | (694,389 | ) | | | (961,564 | ) | |
Total Class R6 | | | 131,163 | | | | 1,938,732 | | | | 2,494,984 | | | | 2,966,553 | | | | 1,081,924 | | | | 2,940,826 | | |
Class Y | |
Issued | | | 803,167 | | | | 2,230,794 | | | | 4,330,642 | | | | 2,820,014 | | | | 2,617,614 | | | | 3,187,741 | | |
Reinvested | | | — | | | | 337,332 | | | | — | | | | 279,776 | | | | — | | | | 496,566 | | |
Redeemed | | | (2,579,692 | ) | | | (2,563,951 | ) | | | (1,800,468 | ) | | | (1,454,945 | ) | | | (2,139,461 | ) | | | (3,656,296 | ) | |
Total Class Y | | | (1,776,525 | ) | | | 4,175 | | | | 2,530,174 | | | | 1,644,845 | | | | 478,153 | | | | 28,011 | | |
Change in Shares | | | (1,698,055 | ) | | | 1,860,123 | | | | 5,396,631 | | | | 5,172,328 | | | | 1,352,849 | | | | 2,817,270 | | |
See notes to financial statements.
29
Victory Portfolios | | Financial Highlights | |
For a Share Outstanding Throughout Each Period
| | | | | Investment Activities | | Distributions to
Shareholders From | |
| | | Net Asset
Value,
Beginning of
Period | | Net
Investment
Income
(Loss)(a) | | Net Realized
and Unrealized
Gains (Losses) | | Total from
Investment
Activities | | Net
Investment
Income | | Net Realized
Gains From
Investments | |
Victory RS International Fund | | | |
Class A | | | |
Six Months
Ended
June 30, 2022
(Unaudited) | | $ | 14.76 | | | | 0.24 | | | | (3.34 | ) | | | (3.10 | ) | | | — | | | | — | | |
Year Ended December 31: | |
2021 | | $ | 13.49 | | | | 0.27 | | | | 1.62 | | | | 1.89 | | | | (0.25 | ) | | | (0.37 | ) | |
2020 | | $ | 12.93 | | | | 0.21 | | | | 0.51 | | | | 0.72 | | | | (0.13 | ) | | | (0.03 | ) | |
2019 | | $ | 10.63 | | | | 0.26 | | | | 2.05 | | | | 2.31 | | | | — | (f) | | | (0.01 | ) | |
2018 | | $ | 12.12 | | | | 0.23 | | | | (1.52 | ) | | | (1.29 | ) | | | (0.20 | ) | | | — | | |
2017 | | $ | 9.84 | | | | 0.19 | | | | 2.29 | | | | 2.48 | | | | (0.20 | ) | | | — | | |
Class C | | | |
Six Months
Ended
June 30, 2022
(Unaudited) | | $ | 10.45 | | | | 0.14 | | | | (2.37 | ) | | | (2.23 | ) | | | — | | | | — | | |
Year Ended December 31: | |
2021 | | $ | 9.72 | | | | 0.11 | | | | 1.17 | | | | 1.28 | | | | (0.18 | ) | | | (0.37 | ) | |
2020 | | $ | 9.36 | | | | 0.10 | | | | 0.34 | | | | 0.44 | | | | (0.05 | ) | | | (0.03 | ) | |
2019 | | $ | 7.76 | | | | 0.12 | | | | 1.49 | | | | 1.61 | | | | — | | | | (0.01 | ) | |
2018 | | $ | 8.89 | | | | 0.11 | | | | (1.11 | ) | | | (1.00 | ) | | | (0.13 | ) | | | — | | |
2017 | | $ | 7.26 | | | | 0.08 | | | | 1.68 | | | | 1.76 | | | | (0.13 | ) | | | — | | |
Class R | | | |
Six Months
Ended
June 30, 2022
(Unaudited) | | $ | 13.73 | | | | 0.20 | | | | (3.10 | ) | | | (2.90 | ) | | | — | | | | — | | |
Year Ended December 31: | |
2021 | | $ | 12.58 | | | | 0.22 | | | | 1.51 | | | | 1.73 | | | | (0.21 | ) | | | (0.37 | ) | |
2020 | | $ | 12.07 | | | | 0.18 | | | | 0.45 | | | | 0.63 | | | | (0.09 | ) | | | (0.03 | ) | |
2019 | | $ | 9.95 | | | | 0.21 | | | | 1.92 | | | | 2.13 | | | | — | | | | (0.01 | ) | |
2018 | | $ | 11.35 | | | | 0.19 | | | | (1.42 | ) | | | (1.23 | ) | | | (0.17 | ) | | | — | | |
2017 | | $ | 9.23 | | | | 0.15 | | | | 2.14 | | | | 2.29 | | | | (0.17 | ) | | | — | | |
(a) Per share net investment income (loss) has been calculated using the average daily shares method.
(b) Not annualized for periods less than one year.
(c) Annualized for periods less than one year.
(d) Does not include acquired fund fees and expenses, if any.
(e) Portfolio turnover is calculated on the basis of the Fund as a whole without distinguishing between the classes of shares issued.
(f) Amount is less than $0.005 per share.
See notes to financial statements.
30
Victory Portfolios | | Financial Highlights — continued | |
For a Share Outstanding Throughout Each Period
| | | | | Ratios to Average Net Assets | | Supplemental Data | |
| | | Total
Distributions | | Net Asset
Value,
End of
Period | | Total
Return
(Excludes
Sales
Charge)(b) | | Net
Expenses(c)(d) | | Net
Investment
Income
(Loss)(c) | | Gross
Expenses(c)(d) | | Net Assets,
End of
Period
(000's) | | Portfolio
Turnover(b)(e) | |
Victory RS International Fund | |
Class A | |
Six Months
Ended
June 30, 2022
(Unaudited) | | | — | | | $ | 11.66 | | | | (21.00 | )% | | | 1.13 | % | | | 3.63 | % | | | 1.42 | % | | $ | 19,497 | | | | 18 | % | |
Year Ended December 31: | |
2021 | | | (0.62 | ) | | $ | 14.76 | | | | 14.05 | % | | | 1.13 | % | | | 1.80 | % | | | 1.40 | % | | $ | 25,555 | | | | 43 | % | |
2020 | | | (0.16 | ) | | $ | 13.49 | | | | 5.55 | % | | | 1.13 | % | | | 1.79 | % | | | 1.47 | % | | $ | 24,010 | | | | 52 | % | |
2019 | | | (0.01 | ) | | $ | 12.93 | | | | 21.72 | % | | | 1.13 | % | | | 2.18 | % | | | 1.55 | % | | $ | 22,620 | | | | 20 | % | |
2018 | | | (0.20 | ) | | $ | 10.63 | | | | (10.65 | )% | | | 1.13 | % | | | 1.97 | % | | | 1.61 | % | | $ | 15,716 | | | | 52 | % | |
2017 | | | (0.20 | ) | | $ | 12.12 | | | | 25.26 | % | | | 1.20 | % | | | 1.66 | % | | | 1.81 | % | | $ | 18,512 | | | | 60 | % | |
Class C | |
Six Months
Ended
June 30, 2022
(Unaudited) | | | — | | | $ | 8.22 | | | | (21.34 | )% | | | 1.88 | % | | | 2.97 | % | | | 3.07 | % | | $ | 967 | | | | 18 | % | |
Year Ended December 31: | |
2021 | | | (0.55 | ) | | $ | 10.45 | | | | 13.24 | % | | | 1.88 | % | | | 1.03 | % | | | 3.07 | % | | $ | 1,147 | | | | 43 | % | |
2020 | | | (0.08 | ) | | $ | 9.72 | | | | 4.76 | % | | | 1.88 | % | | | 1.14 | % | | | 3.07 | % | | $ | 1,241 | | | | 52 | % | |
2019 | | | (0.01 | ) | | $ | 9.36 | | | | 20.70 | % | | | 1.88 | % | | | 1.39 | % | | | 3.14 | % | | $ | 1,480 | | | | 20 | % | |
2018 | | | (0.13 | ) | | $ | 7.76 | | | | (11.24 | )% | | | 1.88 | % | | | 1.23 | % | | | 3.52 | % | | $ | 702 | | | | 52 | % | |
2017 | | | (0.13 | ) | | $ | 8.89 | | | | 24.25 | % | | | 1.95 | % | | | 0.92 | % | | | 3.26 | % | | $ | 1,066 | | | | 60 | % | |
Class R | |
Six Months
Ended
June 30, 2022
(Unaudited) | | | — | | | $ | 10.83 | | | | (21.12 | )% | | | 1.38 | % | | | 3.36 | % | | | 2.29 | % | | $ | 1,528 | | | | 18 | % | |
Year Ended December 31: | |
2021 | | | (0.58 | ) | | $ | 13.73 | | | | 13.85 | % | | | 1.38 | % | | | 1.58 | % | | | 2.16 | % | | $ | 1,959 | | | | 43 | % | |
2020 | | | (0.12 | ) | | $ | 12.58 | | | | 5.21 | % | | | 1.38 | % | | | 1.60 | % | | | 2.24 | % | | $ | 1,998 | | | | 52 | % | |
2019 | | | (0.01 | ) | | $ | 12.07 | | | | 21.37 | % | | | 1.38 | % | | | 1.87 | % | | | 2.32 | % | | $ | 2,652 | | | | 20 | % | |
2018 | | | (0.17 | ) | | $ | 9.95 | | | | (10.85 | )% | | | 1.38 | % | | | 1.73 | % | | | 2.31 | % | | $ | 1,786 | | | | 52 | % | |
2017 | | | (0.17 | ) | | $ | 11.35 | | | | 24.85 | % | | | 1.48 | % | | | 1.39 | % | | | 2.48 | % | | $ | 2,522 | | | | 60 | % | |
(continues on next page)
See notes to financial statements.
31
Victory Portfolios | | Financial Highlights | |
For a Share Outstanding Throughout Each Period
| | | | | Investment Activities | | Distributions to
Shareholders From | |
| | | Net Asset
Value,
Beginning of
Period | | Net
Investment
Income
(Loss)(a) | | Net Realized
and Unrealized
Gains (Losses) | | Total from
Investment
Activities | | Net
Investment
Income | | Net Realized
Gains From
Investments | |
Victory RS International Fund | | | |
Class R6 | | | |
Six Months
Ended
June 30, 2022
(Unaudited) | | $ | 12.07 | | | | 0.21 | | | | (2.73 | ) | | | (2.52 | ) | | | — | | | | — | | |
Year Ended December 31: | |
2021 | | $ | 11.14 | | | | 0.25 | | | | 1.34 | | | | 1.59 | | | | (0.29 | ) | | | (0.37 | ) | |
2020 | | $ | 10.70 | | | | 0.20 | | | | 0.43 | | | | 0.63 | | | | (0.16 | ) | | | (0.03 | ) | |
May 2, 2019 (f)
through
December 31, 2019 | | $ | 10.00 | | | | 0.06 | | | | 0.67 | | | | 0.73 | | | | (0.02 | ) | | | (0.01 | ) | |
Class Y | | | |
Six Months
Ended
June 30, 2022
(Unaudited) | | $ | 14.54 | | | | 0.25 | | | | (3.29 | ) | | | (3.04 | ) | | | — | | | | — | | |
Year Ended December 31: | |
2021 | | $ | 13.29 | | | | 0.30 | | | | 1.60 | | | | 1.90 | | | | (0.28 | ) | | | (0.37 | ) | |
2020 | | $ | 12.74 | | | | 0.25 | | | | 0.49 | | | | 0.74 | | | | (0.16 | ) | | | (0.03 | ) | |
2019 | | $ | 10.47 | | | | 0.22 | | | | 2.08 | | | | 2.30 | | | | (0.02 | ) | | | (0.01 | ) | |
2018 | | $ | 11.93 | | | | 0.23 | | | | (1.47 | ) | | | (1.24 | ) | | | (0.22 | ) | | | — | | |
2017 | | $ | 9.69 | | | | 0.22 | | | | 2.26 | | | | 2.48 | | | | (0.24 | ) | | | — | | |
(a) Per share net investment income (loss) has been calculated using the average daily shares method.
(b) Not annualized for periods less than one year.
(c) Annualized for periods less than one year.
(d) Does not include acquired fund fees and expenses, if any.
(e) Portfolio turnover is calculated on the basis of the Fund as a whole without distinguishing between the classes of shares issued.
(f) Commencement of operations.
See notes to financial statements.
32
Victory Portfolios | | Financial Highlights — continued | |
For a Share Outstanding Throughout Each Period (continued)
| | | | | Ratios to Average Net Assets | | Supplemental Data | |
| | | Total
Distributions | | Net Asset
Value,
End of
Period | |
Total
Return(b) | | Net
Expenses(c)(d) | | Net
Investment
Income
(Loss)(c) | | Gross
Expenses(c)(d) | | Net Assets,
End of
Period
(000's) | | Portfolio
Turnover(b)(e) | |
Victory RS International Fund | |
Class R6 | |
Six Months
Ended
June 30, 2022
(Unaudited) | | | — | | | $ | 9.55 | | | | (20.88 | )% | | | 0.83 | % | | | 3.94 | % | | | 0.91 | % | | $ | 235,554 | | | | 18 | % | |
Year Ended December 31: | |
2021 | | | (0.66 | ) | | $ | 12.07 | | | | 14.32 | % | | | 0.83 | % | | | 2.06 | % | | | 0.91 | % | | $ | 296,211 | | | | 43 | % | |
2020 | | | (0.19 | ) | | $ | 11.14 | | | | 5.90 | % | | | 0.83 | % | | | 2.03 | % | | | 0.93 | % | | $ | 251,586 | | | | 52 | % | |
May 2, 2019 (f)
through
December 31, 2019 | | | (0.03 | ) | | $ | 10.70 | | | | 7.24 | % | | | 0.83 | % | | | 0.92 | % | | | 0.97 | % | | $ | 178,695 | | | | 20 | % | |
Class Y | |
Six Months
Ended
June 30, 2022
(Unaudited) | | | — | | | $ | 11.50 | | | | (20.91 | )% | | | 0.88 | % | | | 3.82 | % | | | 1.07 | % | | $ | 68,550 | | | | 18 | % | |
Year Ended December 31: | |
2021 | | | (0.65 | ) | | $ | 14.54 | | | | 14.38 | % | | | 0.88 | % | | | 2.02 | % | | | 1.02 | % | | $ | 112,511 | | | | 43 | % | |
2020 | | | (0.19 | ) | | $ | 13.29 | | | | 5.80 | % | | | 0.88 | % | | | 2.11 | % | | | 1.09 | % | | $ | 102,803 | | | | 52 | % | |
2019 | | | (0.03 | ) | | $ | 12.74 | | | | 21.94 | % | | | 0.88 | % | | | 1.80 | % | | | 1.16 | % | | $ | 75,366 | | | | 20 | % | |
2018 | | | (0.22 | ) | | $ | 10.47 | | | | (10.38 | )% | | | 0.88 | % | | | 1.97 | % | | | 1.62 | % | | $ | 5,979 | | | | 52 | % | |
2017 | | | (0.24 | ) | | $ | 11.93 | | | | 25.56 | % | | | 0.94 | % | | | 1.98 | % | | | 1.85 | % | | $ | 3,122 | | | | 60 | % | |
See notes to financial statements.
33
Victory Portfolios | | Financial Highlights | |
For a Share Outstanding Throughout Each Period
| | | | | Investment Activities | | Distributions to
Shareholders From | |
| | | Net Asset
Value,
Beginning of
Period | | Net
Investment
Income
(Loss)(a) | | Net
Realized and
Unrealized
Gains
(Losses) | | Total from
Investment
Activities | | Net
Investment
Income | | Net Realized
Gains From
Investments | | Return of
Capital | |
Victory RS Global Fund | | | |
Class A | | | |
Six Months
Ended
June 30, 2022
(Unaudited) | | $ | 20.47 | | | | 0.14 | | | | (4.65 | ) | | | (4.51 | ) | | | — | | | | — | | | | — | | |
Year Ended
December 31: | |
2021 | | $ | 17.27 | | | | 0.20 | | | | 3.65 | | | | 3.85 | | | | (0.18 | ) | | | (0.47 | ) | | | — | | |
2020 | | $ | 14.86 | | | | 0.18 | | | | 2.35 | | | | 2.53 | | | | (0.11 | ) | | | (0.01 | ) | | | — | | |
2019 | | $ | 11.53 | | | | 0.21 | | | | 3.29 | | | | 3.50 | | | | (0.16 | ) | | | (0.01 | ) | | | — | | |
2018 | | $ | 12.75 | | | | 0.20 | | | | (0.90 | ) | | | (0.70 | ) | | | (0.16 | ) | | | (0.36 | ) | | | — | | |
2017 | | $ | 11.16 | | | | 0.15 | | | | 2.53 | | | | 2.68 | | | | — | | | | (1.00 | ) | | | (0.09 | ) | |
Class C | | | |
Six Months
Ended
June 30, 2022
(Unaudited) | | $ | 19.73 | | | | 0.07 | | | | (4.47 | ) | | | (4.40 | ) | | | — | | | | — | | | | — | | |
Year Ended
December 31: | |
2021 | | $ | 16.68 | | | | 0.06 | | | | 3.52 | | | | 3.58 | | | | (0.06 | ) | | | (0.47 | ) | | | — | | |
2020 | | $ | 14.38 | | | | 0.07 | | | | 2.24 | | | | 2.31 | | | | — | (f) | | | (0.01 | ) | | | — | | |
2019 | | $ | 11.17 | | | | 0.14 | | | | 3.16 | | | | 3.30 | | | | (0.08 | ) | | | (0.01 | ) | | | — | | |
2018 | | $ | 12.38 | | | | 0.10 | | | | (0.87 | ) | | | (0.77 | ) | | | (0.08 | ) | | | (0.36 | ) | | | — | | |
2017 | | $ | 10.95 | | | | 0.05 | | | | 2.47 | | | | 2.52 | | | | — | | | | (1.00 | ) | | | (0.09 | ) | |
Class R | | | |
Six Months
Ended
June 30, 2022
(Unaudited) | | $ | 25.73 | | | | 0.14 | | | | (5.83 | ) | | | (5.69 | ) | | | — | | | | — | | | | — | | |
Year Ended
December 31: | |
2021 | | $ | 21.57 | | | | 0.21 | | | | 4.55 | | | | 4.76 | | | | (0.13 | ) | | | (0.47 | ) | | | — | | |
2020 | | $ | 18.55 | | | | 0.18 | | | | 2.92 | | | | 3.10 | | | | (0.07 | ) | | | (0.01 | ) | | | — | | |
2019 | | $ | 14.37 | | | | 0.25 | | | | 4.07 | | | | 4.32 | | | | (0.13 | ) | | | (0.01 | ) | | | — | | |
2018 | | $ | 15.76 | | | | 0.20 | | | | (1.10 | ) | | | (0.90 | ) | | | (0.13 | ) | | | (0.36 | ) | | | — | | |
2017 | | $ | 13.62 | | | | 0.05 | | | | 3.18 | | | | 3.23 | | | | — | | | | (1.00 | ) | | | (0.09 | ) | |
(a) Per share net investment income (loss) has been calculated using the average daily shares method.
(b) Not annualized for periods less than one year.
(c) Annualized for periods less than one year.
(d) Does not include acquired fund fees and expenses, if any.
(e) Portfolio turnover is calculated on the basis of the Fund as a whole without distinguishing between the classes of shares issued.
(f) Amount is less than $0.005 per share.
See notes to financial statements.
34
Victory Portfolios | | Financial Highlights — continued | |
For a Share Outstanding Throughout Each Period
| | | | | Ratios to Average Net Assets | | Supplemental Data | |
| | | Total
Distributions | | Net Asset
Value,
End of
Period | | Total
Return
(Excludes
Sales
Charge)(b) | | Net
Expenses(c)(d) | | Net
Investment
Income
(Loss)(c) | | Gross
Expenses(c)(d) | | Net Assets,
End of
Period
(000's) | | Portfolio
Turnover(b)(e) | |
Victory RS Global Fund | |
Class A | |
Six Months
Ended
June 30, 2022
(Unaudited) | | | — | | | $ | 15.96 | | | | (22.03 | )% | | | 0.85 | % | | | 1.51 | % | | | 1.16 | % | | $ | 60,228 | | | | 14 | % | |
Year Ended
December 31: | |
2021 | | | (0.65 | ) | | $ | 20.47 | | | | 22.39 | % | | | 0.85 | % | | | 1.05 | % | | | 1.34 | % | | $ | 71,792 | | | | 38 | % | |
2020 | | | (0.12 | ) | | $ | 17.27 | | | | 17.00 | % | | | 0.85 | % | | | 1.22 | % | | | 1.40 | % | | $ | 51,066 | | | | 71 | % | |
2019 | | | (0.17 | ) | | $ | 14.86 | | | | 30.36 | % | | | 0.85 | % | | | 1.51 | % | | | 1.53 | % | | $ | 26,471 | | | | 46 | % | |
2018 | | | (0.52 | ) | | $ | 11.53 | | | | (5.45 | )% | | | 0.94 | % | | | 1.51 | % | | | 1.75 | % | | $ | 5,695 | | | | 58 | % | |
2017 | | | (1.09 | ) | | $ | 12.75 | | | | 24.48 | % | | | 1.17 | % | | | 1.24 | % | | | 1.90 | % | | $ | 3,456 | | | | 187 | % | |
Class C | |
Six Months
Ended
June 30, 2022
(Unaudited) | | | — | | | $ | 15.33 | | | | (22.30 | )% | | | 1.60 | % | | | 0.80 | % | | | 2.05 | % | | $ | 4,437 | | | | 14 | % | |
Year Ended
December 31: | |
2021 | | | (0.53 | ) | | $ | 19.73 | | | | 21.52 | % | | | 1.60 | % | | | 0.35 | % | | | 2.33 | % | | $ | 4,221 | | | | 38 | % | |
2020 | | | (0.01 | ) | | $ | 16.68 | | | | 16.06 | % | | | 1.60 | % | | | 0.48 | % | | | 2.53 | % | | $ | 3,491 | | | | 71 | % | |
2019 | | | (0.09 | ) | | $ | 14.38 | | | | 29.52 | % | | | 1.60 | % | | | 1.07 | % | | | 2.59 | % | | $ | 3,101 | | | | 46 | % | |
2018 | | | (0.44 | ) | | $ | 11.17 | | | | (6.20 | )% | | | 1.70 | % | | | 0.79 | % | | | 2.59 | % | | $ | 2,358 | | | | 58 | % | |
2017 | | | (1.09 | ) | | $ | 12.38 | | | | 23.47 | % | | | 1.91 | % | | | 0.41 | % | | | 3.00 | % | | $ | 2,167 | | | | 187 | % | |
Class R | |
Six Months
Ended
June 30, 2022
(Unaudited) | | | — | | | $ | 20.04 | | | | (22.11 | )% | | | 1.10 | % | | | 1.26 | % | | | 1.55 | % | | $ | 4,852 | | | | 14 | % | |
Year Ended
December 31: | |
2021 | | | (0.60 | ) | | $ | 25.73 | | | | 22.12 | % | | | 1.10 | % | | | 0.85 | % | | | 1.70 | % | | $ | 5,488 | | | | 38 | % | |
2020 | | | (0.08 | ) | | $ | 21.57 | | | | 16.70 | % | | | 1.10 | % | | | 0.98 | % | | | 1.93 | % | | $ | 4,454 | | | | 71 | % | |
2019 | | | (0.14 | ) | | $ | 18.55 | | | | 30.10 | % | | | 1.10 | % | | | 1.53 | % | | | 2.34 | % | | $ | 2,365 | | | | 46 | % | |
2018 | | | (0.49 | ) | | $ | 14.37 | | | | (5.68 | )% | | | 1.20 | % | | | 1.25 | % | | | 2.34 | % | | $ | 1,920 | | | | 58 | % | |
2017 | | | (1.09 | ) | | $ | 15.76 | | | | 24.09 | % | | | 1.61 | % | | | 0.38 | % | | | 2.76 | % | | $ | 2,281 | | | | 187 | % | |
(continues on next page)
See notes to financial statements.
35
Victory Portfolios | | Financial Highlights | |
For a Share Outstanding Throughout Each Period
| | | | | Investment Activities | | Distributions to
Shareholders From | |
| | | Net Asset
Value,
Beginning of
Period | | Net
Investment
Income
(Loss)(a) | | Net
Realized and
Unrealized
Gains
(Losses) | | Total from
Investment
Activities | | Net
Investment
Income | | Net Realized
Gains From
Investments | | Return of
Capital | |
Victory RS Global Fund | | | |
Class R6 | | | |
Six Months
Ended
June 30, 2022
(Unaudited) | | $ | 15.11 | | | | 0.12 | | | | (3.44 | ) | | | (3.32 | ) | | | — | | | | — | | | | — | | |
Year Ended
December 31: | |
2021 | | $ | 12.87 | | | | 0.20 | | | | 2.73 | | | | 2.93 | | | | (0.22 | ) | | | (0.47 | ) | | | — | | |
2020 | | $ | 11.07 | | | | 0.08 | | | | 1.83 | | | | 1.91 | | | | (0.10 | ) | | | (0.01 | ) | | | — | | |
May 2, 2019 (f)
through
December 31,
2019 | | $ | 10.00 | | | | 0.13 | | | | 1.12 | | | | 1.25 | | | | (0.17 | ) | | | (0.01 | ) | | | — | | |
Class Y | | | |
Six Months
Ended
June 30, 2022
(Unaudited) | | $ | 20.31 | | | | 0.16 | | | | (4.62 | ) | | | (4.46 | ) | | | — | | | | — | | | | — | | |
Year Ended
December 31: | |
2021 | | $ | 17.12 | | | | 0.26 | | | | 3.62 | | | | 3.88 | | | | (0.22 | ) | | | (0.47 | ) | | | — | | |
2020 | | $ | 14.72 | | | | 0.20 | | | | 2.34 | | | | 2.54 | | | | (0.13 | ) | | | (0.01 | ) | | | — | | |
2019 | | $ | 11.42 | | | | 0.26 | | | | 3.24 | | | | 3.50 | | | | (0.19 | ) | | | (0.01 | ) | | | — | | |
2018 | | $ | 12.63 | | | | 0.23 | | | | (0.89 | ) | | | (0.66 | ) | | | (0.19 | ) | | | (0.36 | ) | | | — | | |
2017 | | $ | 11.04 | | | | 0.18 | | | | 2.50 | | | | 2.68 | | | | — | | | | (1.00 | ) | | | (0.09 | ) | |
(a) Per share net investment income (loss) has been calculated using the average daily shares method.
(b) Not annualized for periods less than one year.
(c) Annualized for periods less than one year.
(d) Does not include acquired fund fees and expenses, if any.
(e) Portfolio turnover is calculated on the basis of the Fund as a whole without distinguishing between the classes of shares issued.
(f) Commencement of operations.
See notes to financial statements.
36
Victory Portfolios | | Financial Highlights — continued | |
For a Share Outstanding Throughout Each Period (continued)
| | | | | Ratios to Average Net Assets | | Supplemental Data | |
| | | Total
Distributions | | Net Asset
Value,
End of
Period | |
Total
Return(b) | | Net
Expenses(c)(d) | | Net
Investment
Income
(Loss)(c) | | Gross
Expenses(c)(d) | | Net Assets,
End of
Period
(000's) | | Portfolio
Turnover(b)(e) | |
Victory RS Global Fund | |
Class R6 | |
Six Months
Ended
June 30, 2022
(Unaudited) | | | — | | | $ | 11.79 | | | | (21.97 | )% | | | 0.55 | % | | | 1.84 | % | | | 0.72 | % | | $ | 107,273 | | | | 14 | % | |
Year Ended
December 31: | |
2021 | | | (0.69 | ) | | $ | 15.11 | | | | 22.84 | % | | | 0.55 | % | | | 1.35 | % | | | 0.85 | % | | $ | 99,708 | | | | 38 | % | |
2020 | | | (0.11 | ) | | $ | 12.87 | | | | 17.27 | % | | | 0.55 | % | | | 0.64 | % | | | 1.16 | % | | $ | 46,776 | | | | 71 | % | |
May 2, 2019 (f)
through
December 31,
2019 | | | (0.18 | ) | | $ | 11.07 | | | | 12.47 | % | | | 0.55 | % | | | 1.85 | % | | | 28.85 | % | | $ | 124 | | | | 46 | % | |
Class Y | |
Six Months
Ended
June 30, 2022
(Unaudited) | | | — | | | $ | 15.85 | | | | (21.96 | )% | | | 0.60 | % | | | 1.80 | % | | | 0.83 | % | | $ | 172,556 | | | | 14 | % | |
Year Ended
December 31: | |
2021 | | | (0.69 | ) | | $ | 20.31 | | | | 22.78 | % | | | 0.60 | % | | | 1.34 | % | | | 0.96 | % | | $ | 169,687 | | | | 38 | % | |
2020 | | | (0.14 | ) | | $ | 17.12 | | | | 17.27 | % | | | 0.60 | % | | | 1.38 | % | | | 1.10 | % | | $ | 114,925 | | | | 71 | % | |
2019 | | | (0.20 | ) | | $ | 14.72 | | | | 30.69 | % | | | 0.60 | % | | | 1.95 | % | | | 1.17 | % | | $ | 52,541 | | | | 46 | % | |
2018 | | | (0.55 | ) | | $ | 11.42 | | | | (5.17 | )% | | | 0.70 | % | | | 1.80 | % | | | 1.20 | % | | $ | 25,544 | | | | 58 | % | |
2017 | | | (1.09 | ) | | $ | 12.63 | | | | 24.75 | % | | | 0.88 | % | | | 1.44 | % | | | 1.32 | % | | $ | 24,657 | | | | 187 | % | |
See notes to financial statements.
37
Victory Portfolios | | Financial Highlights | |
For a Share Outstanding Throughout Each Period
| | | | | Investment Activities | | Distributions to
Shareholders From | |
| | | Net Asset
Value,
Beginning of
Period | | Net
Investment
Income
(Loss)(a) | | Net
Realized and
Unrealized
Gains
(Losses) | | Total from
Investment
Activities | | Net
Investment
Income | | Net Realized
Gains From
Investments | | Return of
Capital | |
Victory Sophus Emerging Markets Fund | | | |
Class A | | | |
Six Months
Ended
June 30, 2022
(Unaudited) | | $ | 22.69 | | | | 0.18 | | | | (4.47 | ) | | | (4.29 | ) | | | — | | | | — | | | | — | | |
Year Ended
December 31: | |
2021 | | $ | 24.70 | | | | 0.18 | | | | (1.26 | ) | | | (1.08 | ) | | | (0.26 | ) | | | (0.66 | ) | | | (0.01 | ) | |
2020 | | $ | 21.37 | | | | 0.10 | | | | 3.45 | | | | 3.55 | | | | (0.22 | ) | | | — | | | | — | | |
2019 | | $ | 17.45 | | | | 0.37 | | | | 3.65 | | | | 4.02 | | | | (0.10 | ) | | | — | | | | — | | |
2018 | | $ | 22.52 | | | | 0.24 | | | | (4.54 | ) | | | (4.30 | ) | | | (0.13 | ) | | | (0.64 | ) | | | — | | |
2017 | | $ | 15.98 | | | | 0.16 | | | | 6.55 | | | | 6.71 | | | | (0.17 | ) | | | — | | | | — | | |
Class C | | | |
Six Months
Ended
June 30, 2022
(Unaudited) | | $ | 16.69 | | | | 0.06 | | | | (3.27 | ) | | | (3.21 | ) | | | — | | | | — | | | | — | | |
Year Ended
December 31: | |
2021 | | $ | 18.38 | | | | (0.03 | ) | | | (0.92 | ) | | | (0.95 | ) | | | (0.08 | ) | | | (0.66 | ) | | | — | (f) | |
2020 | | $ | 15.94 | | | | (0.07 | ) | | | 2.58 | | | | 2.51 | | | | (0.07 | ) | | | — | | | | — | | |
2019 | | $ | 13.06 | | | | 0.14 | | | | 2.74 | | | | 2.88 | | | | — | | | | — | | | | — | | |
2018 | | $ | 17.07 | | | | 0.05 | | | | (3.42 | ) | | | (3.37 | ) | | | — | (f) | | | (0.64 | ) | | | — | | |
2017 | | $ | 12.17 | | | | — | (f) | | | 4.97 | | | | 4.97 | | | | (0.07 | ) | | | — | | | | — | | |
Class R | | | |
Six Months
Ended
June 30, 2022
(Unaudited) | | $ | 21.19 | | | | 0.15 | | | | (4.18 | ) | | | (4.03 | ) | | | — | | | | — | | | | — | | |
Year Ended
December 31: | |
2021 | | $ | 23.13 | | | | 0.11 | | | | (1.18 | ) | | | (1.07 | ) | | | (0.20 | ) | | | (0.66 | ) | | | (0.01 | ) | |
2020 | | $ | 20.03 | | | | 0.05 | | | | 3.23 | | | | 3.28 | | | | (0.18 | ) | | | — | | | | — | | |
2019 | | $ | 16.37 | | | | 0.31 | | | | 3.41 | | | | 3.72 | | | | (0.06 | ) | | | — | | | | — | | |
2018 | | $ | 21.18 | | | | 0.18 | | | | (4.26 | ) | | | (4.08 | ) | | | (0.09 | ) | | | (0.64 | ) | | | — | | |
2017 | | $ | 15.03 | | | | 0.09 | | | | 6.17 | | | | 6.26 | | | | (0.11 | ) | | | — | | | | — | | |
(a) Per share net investment income (loss) has been calculated using the average daily shares method.
(b) Not annualized for periods less than one year.
(c) Annualized for periods less than one year.
(d) Does not include acquired fund fees and expenses, if any.
(e) Portfolio turnover is calculated on the basis of the Fund as a whole without distinguishing between the classes of shares issued.
(f) Amount is less than $0.005 per share.
(g) Amount is less than 0.005%.
See notes to financial statements.
38
Victory Portfolios | | Financial Highlights — continued | |
For a Share Outstanding Throughout Each Period
| | | | | Ratios to Average Net Assets | | Supplemental Data | |
| | | Total
Distributions | | Net Asset
Value,
End of
Period | | Total
Return
(Excludes
Sales
Charge)(b) | | Net
Expenses(c)(d) | | Net
Investment
Income
(Loss)(c) | | Gross
Expenses(c)(d) | | Net Assets,
End of
Period
(000's) | | Portfolio
Turnover(b)(e) | |
Victory Sophus Emerging Markets Fund | |
Class A | |
Six Months
Ended
June 30, 2022
(Unaudited) | | | — | | | $ | 18.40 | | | | (18.91 | )% | | | 1.34 | % | | | 1.72 | % | | | 1.63 | % | | $ | 40,797 | | | | 27 | % | |
Year Ended
December 31: | |
2021 | | | (0.93 | ) | | $ | 22.69 | | | | (4.35 | )% | | | 1.34 | % | | | 0.69 | % | | | 1.60 | % | | $ | 54,194 | | | | 85 | % | |
2020 | | | (0.22 | ) | | $ | 24.70 | | | | 16.73 | % | | | 1.34 | % | | | 0.47 | % | | | 1.64 | % | | $ | 60,206 | | | | 109 | % | |
2019 | | | (0.10 | ) | | $ | 21.37 | | | | 22.96 | % | | | 1.34 | % | | | 1.95 | % | | | 1.62 | % | | $ | 62,346 | | | | 96 | % | |
2018 | | | (0.77 | ) | | $ | 17.45 | | | | (19.08 | )% | | | 1.34 | % | | | 1.11 | % | | | 1.61 | % | | $ | 56,823 | | | | 118 | % | |
2017 | | | (0.17 | ) | | $ | 22.52 | | | | 42.08 | % | | | 1.54 | % | | | 0.80 | % | | | 1.66 | % | | $ | 76,485 | | | | 113 | % | |
Class C | |
Six Months
Ended
June 30, 2022
(Unaudited) | | | — | | | $ | 13.48 | | | | (19.17 | )% | | | 2.14 | % | | | 0.80 | % | | | 3.19 | % | | $ | 971 | | | | 27 | % | |
Year Ended
December 31: | |
2021 | | | (0.74 | ) | | $ | 16.69 | | | | (5.16 | )% | | | 2.14 | % | | | (0.17 | )% | | | 2.77 | % | | $ | 1,684 | | | | 85 | % | |
2020 | | | (0.07 | ) | | $ | 18.38 | | | | 15.79 | % | | | 2.14 | % | | | (0.45 | )% | | | 2.69 | % | | $ | 3,261 | | | | 109 | % | |
2019 | | | — | | | $ | 15.94 | | | | 22.05 | % | | | 2.14 | % | | | 0.99 | % | | | 2.48 | % | | $ | 5,787 | | | | 96 | % | |
2018 | | | (0.64 | ) | | $ | 13.06 | | | | (19.75 | )% | | | 2.14 | % | | | 0.31 | % | | | 2.40 | % | | $ | 10,141 | | | | 118 | % | |
2017 | | | (0.07 | ) | | $ | 17.07 | | | | 40.96 | % | | | 2.34 | % | | | — | %(g) | | | 2.46 | % | | $ | 15,854 | | | | 113 | % | |
Class R | |
Six Months
Ended
June 30, 2022
(Unaudited) | | | — | | | $ | 17.16 | | | | (19.02 | )% | | | 1.58 | % | | | 1.50 | % | | | 1.93 | % | | $ | 9,469 | | | | 27 | % | |
Year Ended
December 31: | |
2021 | | | (0.87 | ) | | $ | 21.19 | | | | (4.57 | )% | | | 1.58 | % | | | 0.44 | % | | | 1.91 | % | | $ | 11,840 | | | | 85 | % | |
2020 | | | (0.18 | ) | | $ | 23.13 | | | | 16.46 | % | | | 1.58 | % | | | 0.25 | % | | | 1.95 | % | | $ | 13,531 | | | | 109 | % | |
2019 | | | (0.06 | ) | | $ | 20.03 | | | | 22.64 | % | | | 1.58 | % | | | 1.71 | % | | | 1.94 | % | | $ | 13,817 | | | | 96 | % | |
2018 | | | (0.73 | ) | | $ | 16.37 | | | | (19.24 | )% | | | 1.58 | % | | | 0.89 | % | | | 1.91 | % | | $ | 12,505 | | | | 118 | % | |
2017 | | | (0.11 | ) | | $ | 21.18 | | | | 41.69 | % | | | 1.83 | % | | | 0.50 | % | | | 2.00 | % | | $ | 17,875 | | | | 113 | % | |
(continues on next page)
See notes to financial statements.
39
Victory Portfolios | | Financial Highlights | |
For a Share Outstanding Throughout Each Period
| | | | Investment Activities | | Distributions to
Shareholders From | |
| | | Net Asset
Value,
Beginning of
Period | | Net
Investment
Income
(Loss)(a) | | Net
Realized and
Unrealized
Gains
(Losses) | | Total from
Investment
Activities | | Net
Investment
Income | | Net Realized
Gains From
Investments | | Return of
Capital | |
Victory Sophus Emerging Markets Fund | | | |
Class R6 | | | |
Six Months
Ended
June 30, 2022
(Unaudited) | | $ | 23.08 | | | | 0.24 | | | | (4.56 | ) | | | (4.32 | ) | | | — | | | | — | | | | — | | |
Year Ended
December 31: | |
2021 | | $ | 25.10 | | | | 0.31 | | | | (1.30 | ) | | | (0.99 | ) | | | (0.35 | ) | | | (0.66 | ) | | | (0.02 | ) | |
2020 | | $ | 21.68 | | | | 0.20 | | | | 3.52 | | | | 3.72 | | | | (0.30 | ) | | | — | | | | — | | |
2019 | | $ | 17.68 | | | | 0.52 | | | | 3.65 | | | | 4.17 | | | | (0.17 | ) | | | — | | | | — | | |
2018 | | $ | 22.81 | | | | 0.34 | | | | (4.62 | ) | | | (4.28 | ) | | | (0.21 | ) | | | (0.64 | ) | | | — | | |
2017 | | $ | 16.16 | | | | 0.34 | | | | 6.57 | | | | 6.91 | | | | (0.26 | ) | | | — | | | | — | | |
Class Y | | | |
Six Months
Ended
June 30, 2022
(Unaudited) | | $ | 22.83 | | | | 0.22 | | | | (4.50 | ) | | | (4.28 | ) | | | — | | | | — | | | | — | | |
Year Ended
December 31: | |
2021 | | $ | 24.85 | | | | 0.27 | | | | (1.27 | ) | | | (1.00 | ) | | | (0.34 | ) | | | (0.66 | ) | | | (0.02 | ) | |
2020 | | $ | 21.48 | | | | 0.16 | | | | 3.50 | | | | 3.66 | | | | (0.29 | ) | | | — | | | | — | | |
2019 | | $ | 17.54 | | | | 0.45 | | | | 3.65 | | | | 4.10 | | | | (0.16 | ) | | | — | | | | — | | |
2018 | | $ | 22.64 | | | | 0.35 | | | | (4.61 | ) | | | (4.26 | ) | | | (0.20 | ) | | | (0.64 | ) | | | — | | |
2017 | | $ | 16.05 | | | | 0.21 | | | | 6.62 | | | | 6.83 | | | | (0.24 | ) | | | — | | | | — | | |
(a) Per share net investment income (loss) has been calculated using the average daily shares method.
(b) Not annualized for periods less than one year.
(c) Annualized for periods less than one year.
(d) Does not include acquired fund fees and expenses, if any.
(e) Portfolio turnover is calculated on the basis of the Fund as a whole without distinguishing between the classes of shares issued.
See notes to financial statements.
40
Victory Portfolios | | Financial Highlights — continued | |
For a Share Outstanding Throughout Each Period (continued)
| | | | | Ratios to Average Net Assets | | Supplemental Data | |
| | | Total
Distributions | | Net Asset
Value,
End of
Period | |
Total
Return(b) | | Net
Expenses(c)(d) | | Net
Investment
Income
(Loss)(c) | | Gross
Expenses(c)(d) | | Net Assets,
End of
Period
(000's) | | Portfolio
Turnover(b)(e) | |
Victory Sophus Emerging Markets Fund | |
Class R6 | |
Six Months
Ended
June 30, 2022
(Unaudited) | | | — | | | $ | 18.76 | | | | (18.72 | )% | | | 0.89 | % | | | 2.24 | % | | | 1.18 | % | | $ | 161,876 | | | | 27 | % | |
Year Ended
December 31: | |
2021 | | | (1.03 | ) | | $ | 23.08 | | | | (3.93 | )% | | | 0.89 | % | | | 1.17 | % | | | 1.17 | % | | $ | 174,198 | | | | 85 | % | |
2020 | | | (0.30 | ) | | $ | 25.10 | | | | 17.28 | % | | | 0.89 | % | | | 0.95 | % | | | 1.21 | % | | $ | 115,637 | | | | 109 | % | |
2019 | | | (0.17 | ) | | $ | 21.68 | | | | 23.55 | % | | | 0.89 | % | | | 2.69 | % | | | 1.22 | % | | $ | 72,196 | | | | 96 | % | |
2018 | | | (0.85 | ) | | $ | 17.68 | | | | (18.73 | )% | | | 0.89 | % | | | 1.59 | % | | | 1.24 | % | | $ | 29,228 | | | | 118 | % | |
2017 | | | (0.26 | ) | | $ | 22.81 | | | | 42.77 | % | | | 1.03 | % | | | 1.66 | % | | | 1.39 | % | | $ | 18,762 | | | | 113 | % | |
Class Y | |
Six Months
Ended
June 30, 2022
(Unaudited) | | | — | | | $ | 18.55 | | | | (18.75 | )% | | | 0.99 | % | | | 2.12 | % | | | 1.31 | % | | $ | 218,618 | | | | 27 | % | |
Year Ended
December 31: | |
2021 | | | (1.02 | ) | | $ | 22.83 | | | | (4.01 | )% | | | 0.99 | % | | | 1.05 | % | | | 1.29 | % | | $ | 258,201 | | | | 85 | % | |
2020 | | | (0.29 | ) | | $ | 24.85 | | | | 17.10 | % | | | 0.99 | % | | | 0.79 | % | | | 1.31 | % | | $ | 280,364 | | | | 109 | % | |
2019 | | | (0.16 | ) | | $ | 21.48 | | | | 23.40 | % | | | 0.99 | % | | | 2.32 | % | | | 1.30 | % | | $ | 255,423 | | | | 96 | % | |
2018 | | | (0.84 | ) | | $ | 17.54 | | | | (18.77 | )% | | | 0.99 | % | | | 1.64 | % | | | 1.30 | % | | $ | 178,132 | | | | 118 | % | |
2017 | | | (0.24 | ) | | $ | 22.64 | | | | 42.59 | % | | | 1.18 | % | | | 1.07 | % | | | 1.33 | % | | $ | 100,902 | | | | 113 | % | |
See notes to financial statements.
41
Victory Portfolios | | Notes to Financial Statements
June 30, 2022 | |
(Unaudited)
1. Organization:
Victory Portfolios (the "Trust") is organized as a Delaware statutory trust and the Trust is registered under the Investment Company Act of 1940, as amended (the "1940 Act"), as an open-end investment company. The Trust is comprised of 40 funds and is authorized to issue an unlimited number of shares, which are units of beneficial interest with a par value of $0.001 per share.
The accompanying financial statements are those of the following three Funds (collectively, the "Funds" and individually, a "Fund"). Each Fund is classified as diversified under the 1940 Act.
Funds (Legal Name) | | Funds (Short Name) | | Investment Share
Classes Offered | |
Victory RS International Fund | | RS International Fund | | A, C, R, R6, and Y | |
Victory RS Global Fund | | RS Global Fund | | A, C, R, R6, and Y | |
Victory Sophus Emerging
Markets Fund | | Sophus Emerging Markets Fund | | A, C, R, R6, and Y | |
Each class of shares of a Fund has substantially identical rights and privileges except with respect to sales charges, fees paid under distribution plans, expenses allocable exclusively to each class of shares, voting rights on matters solely affecting a single class of shares, and the exchange privilege of each class of shares.
Under the Trust's organizational documents, its officers and trustees are indemnified against certain liabilities arising out of the performance of their duties to the Funds. In addition, in the normal course of business, the Funds enter into contracts with their vendors and others that provide for general indemnifications. The Funds' maximum exposure under these arrangements is unknown, as this would involve future claims that may be made against the Funds. However, based on experience, the Funds expect that risk of loss to be remote.
2. Significant Accounting Policies:
The following is a summary of significant accounting policies followed by the Trust in the preparation of its financial statements. The policies are in conformity with U.S. Generally Accepted Accounting Principles ("GAAP"). The preparation of financial statements in accordance with GAAP requires management to make estimates and assumptions that affect the reported amounts of assets and liabilities and disclosure of contingent assets and liabilities at the date of the financial statements and the reported amounts of income and expenses for the period. Actual results could differ from those estimates. The Funds follow the specialized accounting and reporting requirements under GAAP that are applicable to investment companies under Accounting Standards Codification Topic 946.
Investment Valuation:
The Funds record investments at fair value. Fair value is defined as the price that would be received to sell an asset or paid to transfer a liability in an orderly transaction between market participants at the measurement date.
The valuation techniques described below maximize the use of observable inputs and minimize the use of unobservable inputs in determining fair value. The inputs used for valuing the Funds' investments are summarized in the three broad levels listed below:
• Level 1 — quoted prices in active markets for identical securities
• Level 2 — other significant observable inputs (including quoted prices for similar securities or interest rates applicable to those securities, etc.)
• Level 3 — significant unobservable inputs (including the Funds' own assumptions in determining the fair value of investments)
42
Victory Portfolios | | Notes to Financial Statements — continued
June 30, 2022 | |
(Unaudited)
Changes in valuation techniques may result in transfers in or out of an assigned level within the disclosure hierarchy. The inputs or methodologies used for valuation techniques are not necessarily an indication of the risk associated with entering into those investments.
Victory Capital Management Inc. ("VCM" or the "Adviser") has established the Pricing and Liquidity Committee (the "Committee"), and subject to the Trust's Board of Trustees' (the "Board") oversight, the Committee administers and oversees the Funds' valuation policies and procedures, which are approved by the Board.
Portfolio securities listed or traded on securities exchanges, including Exchange-Traded Funds ("ETFs"), and American Depositary Receipts ("ADRs"), are valued at the closing price on the exchange or system where the security is principally traded, if available, or at the Nasdaq Official Closing Price. If there have been no sales for that day on the exchange or system, then a security is valued at the last available bid quotation on the exchange or system where the security is principally traded. In each of these situations, valuations are typically categorized as Level 1 in the fair value hierarchy.
Investments in open-end investment companies, other than ETFs, are valued at their net asset value ("NAV"). These valuations are typically categorized as Level 1 in the fair value hierarchy.
In the event that price quotations or valuations are not readily available, investments are valued at fair value in accordance with procedures established by and under the general supervision and responsibility of the Board. These valuations are typically categorized as Level 2 or Level 3 in the fair value hierarchy, based on the observability of inputs used to determine the fair value. The effect of fair value pricing is that securities may not be priced on the basis of quotations from the primary market in which they are traded and the actual price realized from the sale of a security may differ materially from the fair value price. Valuing these securities at fair value is intended to cause the Fund's NAV to be more reliable than it otherwise would be.
In accordance with procedures adopted by the Board, fair value pricing may be used if events materially affecting the value of foreign securities occur between the time the exchange on which they are traded closes and the time a Fund's NAV is calculated. The Funds use a systematic valuation model, provided daily by an independent third party to fair value its international equity securities. The valuations are categorized as Level 2 in the fair value hierarchy.
A summary of the valuations as of June 30, 2022, based upon the three levels defined above, is included in the table below while the breakdown, by category, of investments is disclosed on the Schedules of Portfolio Investments:
| | | Level 1 | | Level 2 | | Level 3 | | Total | |
RS International Fund | |
Common Stocks | | $ | — | | | $ | 317,250,930 | | | $ | — | | | $ | 317,250,930 | | |
Exchange-Traded Funds | | | 1,610,180 | | | | — | | | | — | | | | 1,610,180 | | |
Collateral for Securities Loaned | | | 3,248,668 | | | | — | | | | — | | | | 3,248,668 | | |
Total | | $ | 4,858,848 | | | $ | 317,250,930 | | | $ | — | | | $ | 322,109,778 | | |
RS Global Fund | |
Common Stocks | | $ | 215,476,243 | | | $ | 118,314,281 | | | $ | — | | | $ | 333,790,524 | | |
Exchange-Traded Funds | | | 5,127,105 | | | | — | | | | — | | | | 5,127,105 | | |
Collateral for Securities Loaned | | | 3,275,480 | | | | — | | | | — | | | | 3,275,480 | | |
Total | | $ | 223,878,828 | | | $ | 118,314,281 | | | $ | — | | | $ | 342,193,109 | | |
Sophus Emerging Markets Fund | |
Common Stocks | | $ | 63,078,842 | | | $ | 363,817,840 | | | $ | 102,061 | | | $ | 426,998,743 | | |
Collateral for Securities Loaned | | | 5,250,958 | | | | — | | | | — | | | | 5,250,958 | | |
Total | | $ | 68,329,800 | | | $ | 363,817,840 | | | $ | 102,061 | | | $ | 432,249,701 | | |
For the six months ended June 30, 2022, there were no significant changes into/out of Level 3. The transfers into Level 3 investments for the Sophus Emerging Markets Fund were immaterial, although
43
Victory Portfolios | | Notes to Financial Statements — continued
June 30, 2022 | |
(Unaudited)
the change in unrealized appreciation/(depreciation) on these investments was $(22,331,209). These securities were impacted by the invasion of Ukraine and sanctions on market conditions in Russia. From the start of the conflict in Ukraine until June 30, 2022, Russian-held investments were valued at an approximately 99 percent discount from their last traded prices.
Real Estate Investment Trusts ("REITs"):
The Funds may invest in REITs, which report information on the source of their distributions annually. REITs are pooled investment vehicles that invest primarily in income-producing real estate or real-estate related loans or interests (such as mortgages). Certain distributions received from REITs during the year are recorded as realized gains or return of capital as estimated by the Funds or when such information becomes known.
Investment Companies:
Exchange-Traded Funds:
The Funds may invest in ETFs, the shares of which are bought and sold on a securities exchange. An ETF trades like common stock and represents a fixed portfolio of securities often designed to track the performance and dividend yield of a particular domestic or foreign market index. The Funds may purchase shares of an ETF to temporarily gain exposure to a portion of the U.S. or a foreign market while awaiting purchase of underlying securities. The risks of owning an ETF generally reflect the risks of owning the underlying securities they are designed to track, although the lack of liquidity of an ETF could result in it being more volatile. Additionally, ETFs have fees and expenses that reduce their value.
Open-End Funds:
The Funds may invest in portfolios of open-end investment companies. These investment companies value securities in their portfolios for which market quotations are readily available at their market values (generally the last reported sale price) and all other securities and assets at their fair value by the methods established by the board of directors of the underlying funds.
Foreign Exchange Currency Contracts:
Certain Funds may enter into foreign exchange currency contracts to convert U.S. dollars to and from various foreign currencies. A foreign exchange currency contract is an obligation by a Fund to purchase or sell a specific currency at a future date at a price (in U.S. dollars) set at the time of the contract. The Funds do not engage in "cross-currency" foreign exchange contracts (i.e., contracts to purchase or sell one foreign currency in exchange for another foreign currency). The Funds' foreign exchange currency contracts might be considered spot contracts (typically a contract of one week or less) or forward contracts (typically a contract term over one week). A spot contract is entered into for purposes of hedging against foreign currency fluctuations relating to a specific portfolio transaction, such as the delay between a security transaction trade date and settlement date. Forward contracts are entered into for purposes of hedging portfolio holdings or concentrations of such holdings. The Funds enter into foreign exchange currency contracts solely for spot or forward hedging purposes, and not for speculative purposes (i.e., the Funds do not enter into such contracts solely for the purpose of earning foreign currency gains). Each foreign exchange currency contract is adjusted daily by the prevailing spot or forward rate of the underlying currency, and any appreciation or depreciation is recorded for financial statement purposes as unrealized until the contract settlement date, at which time the Funds record realized gains or losses equal to the difference between the value of a contract at the time it was opened and the value at the time it was closed. The Funds could be exposed to risk if a counterparty is unable to meet the terms of a foreign exchange currency contract or if the value of the foreign currency changes unfavorably. In addition, the use of foreign exchange currency contracts does not eliminate fluctuations in the underlying prices of the securities. For the six months ended June 30, 2022, the Funds had no open forward foreign exchange currency contracts.
44
Victory Portfolios | | Notes to Financial Statements — continued
June 30, 2022 | |
(Unaudited)
Investment Transactions and Related Income:
Changes in holdings of investments are accounted for no later than one business day following the trade date. For financial reporting purposes, however, investment transactions are accounted for on trade date or the last business day of the reporting period. Interest income is determined on the basis of coupon interest accrued using the effective interest method which adjusts, where applicable, the amortization of premiums or accretion of discounts. Dividend income is recorded on the ex-dividend date. Gains or losses realized on sales of securities are recorded on the identified cost basis.
Withholding taxes on interest, dividends, and gains as a result of certain investments by the Funds have been provided for in accordance with each investment's applicable country's tax rules and rates.
Securities Lending:
The Funds, through a Securities Lending Agreement with Citibank, N.A. ("Citibank"), may lend their securities to qualified financial institutions, such as certain broker-dealers and banks, to earn additional income, net of income retained by Citibank. Borrowers are required to initially secure their loans for collateral in the amount of at least 102% of the value of U.S. securities loaned or at least 105% of the value of non-U.S. securities loaned, marked-to-market daily. Any collateral shortfalls associated with increases in the valuation of the securities loaned are generally cured the next business day. The collateral can be received in the form of cash collateral and/or non-cash collateral. Non-cash collateral can include U.S. Government Securities and other securities as permitted by Securities and Exchange Commission ("SEC") guidelines. The cash collateral is invested in short-term instruments or cash equivalents, primarily open-end investment companies, as noted on the Funds' Schedules of Portfolio Investments. The Funds effectively do not have control of the non-cash collateral and therefore it is not disclosed on the Funds' Schedules of Portfolio Investments. Collateral requirements are determined daily based on the value of the Funds' securities on loan as of the end of the prior business day. During the time portfolio securities are on loan, the borrower will pay the Funds any dividends or interest paid on such securities plus any fee negotiated between the parties to the lending agreement. The Funds also earn a return from the collateral. The Funds pay Citibank various fees in connection with the investment of cash collateral and fees based on the investment income received from securities lending activities. Securities lending income (net of these fees) is disclosed on the Statements of Operations. Loans are terminable upon demand and the borrower must return the loaned securities within the lesser of one standard settlement period or five business days. Although risk is mitigated by the collateral, a Fund could experience a delay in recovering its securities and possible loss of income or value if the borrower fails to return them. In addition, there is a risk that the value of the short-term investments will be less than the amount of cash collateral required to be returned to the borrower.
The Funds' agreement with Citibank does not include master netting provisions. Non-cash collateral received by the Funds may not be sold or repledged, except to satisfy borrower default.
The following table is a summary of the Funds' securities lending transactions as of June 30, 2022.
| | | Value of
Securities on Loan | | Non-Cash
Collateral | | Cash
Collateral | |
RS International Fund | | $ | 1,063,478 | | | $ | — | | | $ | 3,248,668 | | |
RS Global Fund | | | 2,085,475 | | | | — | | | | 3,275,480 | | |
RS Sophus Emerging Markets Fund | | | 4,990,435 | | | | — | | | | 5,250,958 | | |
Foreign Currency Translations:
The accounting records of the Funds are maintained in U.S. dollars. Investment securities and other assets and liabilities of a Fund denominated in a foreign currency are translated into U.S. dollars at current exchange rates. Purchases and sales of securities, income receipts and expense payments are translated into U.S. dollars at the exchange rates on the date of the transactions. The Funds do not isolate the portion of the results of operations resulting from changes in foreign exchange rates on
45
Victory Portfolios | | Notes to Financial Statements — continued
June 30, 2022 | |
(Unaudited)
investments from fluctuations arising from changes in market prices of securities held. Such fluctuations are disclosed as Net change in unrealized appreciation/depreciation on investment securities and foreign currency translations on the Statements of Operations. Any realized gains or losses from these fluctuations are disclosed as Net realized gains (losses) from investment securities and foreign currency transactions on the Statements of Operations.
Foreign Taxes:
The Funds may be subject to foreign taxes related to foreign income received (a portion of which may be reclaimable), capital gains on the sale of securities, and certain foreign currency transactions. All foreign taxes are recorded in accordance with the applicable regulations and rates that exist in the foreign jurisdictions in which the Funds invest.
Federal Income Taxes:
Each Fund intends to continue to qualify as a regulated investment company by complying with the provisions available to certain investment companies, as defined in applicable sections of the Internal Revenue Code, and to make distributions of net investment income and net realized gains sufficient to relieve it from all, or substantially all, federal income taxes. Accordingly, no provision for federal income taxes is required in the financial statements. The Funds have a tax year end of December 31.
For the six months ended June 30, 2022, the Funds did not incur any income tax, interest, or penalties, and have recorded no liability for net unrecognized tax benefits relating to uncertain tax positions.
Management of the Funds has reviewed tax positions taken in tax years that remain subject to examination by all major tax jurisdictions, including federal (i.e., the last four tax years, which includes the current fiscal tax year end). Management believes that there is no tax liability resulting from unrecognized tax benefits related to uncertain tax positions taken.
Allocations:
Expenses directly attributable to a Fund are charged to that Fund, while expenses that are attributable to more than one fund in the Trust, or jointly with an affiliated trust, are allocated among the respective funds in the Trust and/or an affiliated trust based upon net assets or another appropriate basis.
Income, expenses (other than class-specific expenses such as transfer agent fees, state registration fees, printing fees, and 12b-1 fees), and realized and unrealized gains or losses on investments are allocated to each class of shares based on its relative net assets on the date income is earned or expenses and realized and unrealized gains and losses are incurred.
3. Purchases and Sales:
Purchases and sales of securities (excluding securities maturing less than one year from acquisition) for the six months ended June 30, 2022, were as follows:
| | | Excluding
U.S. Government Securities | |
| | | Purchases | | Sales | |
RS International Fund | | $ | 69,262,509 | | | $ | 79,850,835 | | |
RS Global Fund | | | 140,890,098 | | | | 50,212,046 | | |
Sophus Emerging Markets Fund | | | 160,129,648 | | | | 125,642,733 | | |
46
Victory Portfolios | | Notes to Financial Statements — continued
June 30, 2022 | |
(Unaudited)
4. Affiliated Fund Ownership:
The Funds offer shares for investment by other funds. The fund-of-funds do not invest in the underlying funds for the purpose of exercising management or control, and the affiliated fund-of-funds annual and semi-annual reports may be viewed at vcm.com. As of June 30, 2022, certain fund-of-funds owned total outstanding shares of the Funds as follows:
RS International Fund | | Ownership % | |
USAA Target Retirement Income Fund | | | 7.5 | | |
USAA Target Retirement 2030 Fund | | | 16.9 | | |
USAA Target Retirement 2040 Fund | | | 25.0 | | |
USAA Target Retirement 2050 Fund | | | 18.2 | | |
USAA Target Retirement 2060 Fund | | | 2.7 | | |
RS Global Fund | | Ownership % | |
Victory Strategic Allocation Fund | | | 1.7 | | |
Sophus Emerging Markets Fund | | Ownership % | |
USAA Target Retirement Income Fund | | | 7.5 | | |
USAA Target Retirement 2030 Fund | | | 16.9 | | |
USAA Target Retirement 2040 Fund | | | 25.0 | | |
USAA Target Retirement 2050 Fund | | | 18.2 | | |
USAA Target Retirement 2060 Fund | | | 2.7 | | |
Victory Strategic Allocation Fund | | | 0.5 | | |
5. Fees and Transactions with Affiliates and Related Parties:
Investment Advisory Fees:
Investment advisory services are provided to the Funds by the Adviser, which is a New York corporation registered as an investment adviser with the SEC. The Adviser is an indirect wholly owned subsidiary of Victory Capital Holdings, Inc., a publicly traded Delaware corporation, and a wholly owned direct subsidiary of Victory Capital Operating, LLC.
Under the terms of the Investment Advisory Agreement, the Adviser is entitled to receive fees based on a percentage of the average daily net assets of each Fund. The rates at which the Adviser is paid by each Fund are included in the table below.
RS International Fund | | | 0.80 | % | |
RS Global Fund | | | 0.60 | % | |
Sophus Emerging Markets Fund | | | 1.00 | % | |
Amounts incurred and paid to VCM for the six months ended June 30, 2022, are reflected on the Statements of Operations as Investment advisory fees.
Administration and Servicing Fees:
VCM also serves as the Funds' administrator and fund accountant. Under the Administration and Fund Accounting Agreement, VCM is entitled to receive fees based on a percentage of the average daily net assets of the Trust, Victory Variable Insurance Funds and Victory Portfolios II. The tiered rates at which VCM is paid by the Funds are shown in the table below:
Net Assets | |
Up to $15 billion | | $15 billion – $30 billion | | Over $30 billion | |
| | 0.08 | %, plus | | | 0.05 | %, plus | | | 0.04 | % | |
Amounts incurred for the six months ended June 30, 2022, are reflected on the Statements of Operations as Administration fees.
47
Victory Portfolios | | Notes to Financial Statements — continued
June 30, 2022 | |
(Unaudited)
Citi Fund Services Ohio, Inc. ("Citi"), an affiliate of Citibank, acts as sub-administrator and sub-fund accountant to the Funds pursuant to the Sub-Administration and Sub-Fund Accounting Services Agreement between VCM and Citi. VCM pays Citi a fee for providing these services. The Trust reimburses VCM and Citi for out-of-pocket expenses incurred in providing these services and certain other expenses specifically allocated to the Funds. Amounts incurred for the six months ended June 30, 2022, are reflected on the Statements of Operations as Sub-Administration fees.
The Funds (as part of the Trust) have entered into an agreement with the Adviser to provide compliance services, pursuant to which the Adviser furnishes its compliance personnel, including the services of the Chief Compliance Officer ("CCO"), and other resources reasonably necessary to provide the Trust with compliance oversight services related to the design, administration, and oversight of a compliance program for the Trust in accordance with Rule 38a-1 under the 1940 Act. The CCO is an employee of the Adviser, which pays the compensation of the CCO and support staff. The funds in the Trust, Victory Variable Insurance Funds, Victory Portfolios II and USAA Mutual Funds (collectively, the "Victory Funds Complex"), in aggregate, compensate the Adviser for these services. Amounts incurred for the six months ended June 30, 2022, are reflected on the Statements of Operations as Compliance fees.
Transfer Agency Fees:
FIS Investor Services, LLC ("FIS") serves as the Funds' transfer agent. Under the Transfer Agent Agreement, the Trust pays FIS a fee for its services and reimburses FIS for all of their reasonable out-of-pocket expenses incurred in providing these services. Amounts incurred for the six months ended June 30, 2022, are reflected on the Statements of Operations as Transfer agent fees.
Distributor/Underwriting Services:
Victory Capital Services, Inc. (the "Distributor"), an affiliate of the Adviser, serves as Distributor for the continuous offering of the shares of the Funds pursuant to a Distribution Agreement between the Distributor and the Trust.
Pursuant to the Distribution and Service Plans adopted in accordance with Rule 12b-1 under the 1940 Act, the Distributor may receive a monthly distribution and service fee up to the annual rate shown in the table below:
| | | Class A | | Class C | | Class R | |
RS International Fund | | | 0.25 | % | | | 1.00 | % | | | 0.50 | % | |
RS Global Fund | | | 0.25 | % | | | 1.00 | % | | | 0.50 | % | |
Sophus Emerging Markets Fund | | | 0.25 | % | | | 1.00 | % | | | 0.50 | % | |
The distribution and service fees paid to the Distributor may be used by the Distributor to pay for activities primarily intended to result in the sale of Class A, Class C, and Class R. Amounts incurred for the six-months ended June 30, 2022, are reflected on the Statements of Operations as 12b-1 fees.
In addition, the Distributor is entitled to receive commissions in connection with sales of the Class A. For the six months ended June 30, 2022, the Distributor received approximately $1,883 from commissions earned in connection with sales of Class A.
Other Fees:
Citibank serves as the Funds' custodian. The Funds pay Citibank a fee for providing these services. Amounts incurred for the six months ended June 30, 2022, are reflected on the Statements of Operations as Custodian fees.
Sidley Austin LLP provides legal services to the Trust.
The Adviser has entered into expense limitation agreements with the Funds. Under the terms of the agreements, the Adviser has agreed to waive fees or reimburse certain expenses to the extent that ordinary operating expenses incurred by certain classes of a Fund in any fiscal year exceed the expense limit for such classes of the Fund. Such excess amounts will be the liability of the Adviser. Acquired
48
Victory Portfolios | | Notes to Financial Statements — continued
June 30, 2022 | |
(Unaudited)
fund fees and expenses, interest, taxes, brokerage commissions, other expenditures which are capitalized in accordance with GAAP, and other extraordinary expenses not incurred in the ordinary course of a Fund's business are excluded from the expense limits. As of June 30, 2022, the expense limits (excluding voluntary waivers) are as follows:
| | | In effect until April 30, 2023 | |
| | | Class A | | Class C | | Class R | | Class R6 | | Class Y | |
RS International Fund | | | 1.13 | % | | | 1.88 | % | | | 1.38 | % | | | 0.83 | % | | | 0.88 | % | |
RS Global Fund | | | 0.85 | % | | | 1.60 | % | | | 1.10 | % | | | 0.55 | % | | | 0.60 | % | |
Sophus Emerging Markets Fund | | | 1.34 | % | | | 2.14 | % | | | 1.58 | % | | | 0.89 | % | | | 0.99 | % | |
Under the terms of the expense limitation agreements, as amended May 1, 2022, the Funds have agreed to repay fees and expenses that were waived or reimbursed by the Adviser for a period of up to three years (thirty-six (36) months) after the waiver or reimbursement took place, subject to the lesser of any operating expense limits in effect at the time of: (a) the original waiver or expense reimbursement; or (b) the recoupment, after giving effect to the recoupment amount.
As of June 30, 2022, the following amounts are available to be repaid to the Adviser. The Funds have not recorded any amounts available to be repaid as a liability due to an assessment that such repayments are not probable at June 30, 2022.
| | | Expires
2022 | | Expires
2023 | | Expires
2024 | | Expires
2025 | | Total | |
RS International Fund | | $ | 180,079 | | | $ | 491,864 | | | $ | 478,133 | | | $ | 239,905 | | | $ | 1,389,981 | | |
RS Global Fund | | | 221,163 | | | | 690,062 | | | | 1,055,677 | | | | 417,089 | | | | 2,383,991 | | |
Sophus Emerging Markets Fund | | | 620,198 | | | | 1,137,721 | | | | 1,536,446 | | | | 728,153 | | | | 4,022,518 | | |
The Adviser may voluntarily waive or reimburse additional fees to assist the Fund in maintaining competitive expense ratios. Voluntary waivers and reimbursements applicable to the Fund is not available to be recouped at a future time. There were no voluntary waivers or reimbursements for the six months ended June 30, 2022.
Certain officers and/or interested trustees of the Funds are also officers and/or employees of the Adviser, administrator, fund accountant, sub-administrator, sub-fund accountant, custodian, legal counsel, and Distributor.
6. Risks:
The Funds may be subject to other risks in addition to these identified risks.
Equity Risk — The value of the equity securities in which the Funds invests may decline in response to developments affecting individual companies and/or general economic conditions in the United States or abroad. A company's earnings or dividends may not increase as expected (or may decline) because of poor management, competitive pressures, reliance on particular suppliers or geographical regions, labor problems or shortages, corporate restructurings, fraudulent disclosures, man-made or natural disasters, military confrontations or wars, terrorism, public health crises, or other events, conditions and factors. Price changes may be temporary or last for extended periods.
Foreign Securities Risk — Foreign securities (including depositary receipts) are subject to political, regulatory, and economic risks not present in domestic investments. Foreign securities could be affected by factors not present in the U.S., including expropriation, confiscation of property, and difficulties in enforcing contracts. Compared to U.S. companies, there generally is less publicly available information about foreign companies and there may be less governmental regulation and supervision of foreign companies. Foreign securities generally experience more volatility than their domestic counterparts. In addition, to the extent investments are made in a limited number of countries, events in those countries will have a more significant impact on the Fund. Fluctuations in the exchange rates between the U.S. dollar and foreign currencies, currency exchange control regulations, and restrictions or prohibitions on the repatriation of foreign currencies may negatively affect an investment.
49
Victory Portfolios | | Notes to Financial Statements — continued
June 30, 2022 | |
(Unaudited)
Emerging Markets Risk — The risks related to investing in foreign securities are generally greater with respect to securities of companies that conduct their business activities in emerging markets or whose securities are traded principally in emerging markets. The risks of investing in emerging markets include the risks of illiquidity, increased price volatility, smaller market capitalizations, less government regulation, less extensive and less frequent accounting, financial and other reporting requirements, risk of loss resulting from problems in share registration and custody, substantial economic and political disruptions and the nationalization of foreign deposits or assets.
Market Risk — Overall market risks may affect the value of the Fund. Domestic and international factors such as political events, war, terrorism, trade disputes, inflation rates, interest rate levels and other fiscal and monetary policy changes, cybersecurity incidents, pandemics and other public health crises, sanctions against a particular foreign country, its nationals, businesses or industries and related geopolitical events, as well as environmental disasters such as earthquakes, fires, and floods or other catastrophes, may add to instability in global economies and markets generally, and may lead to increased market volatility. Global economies and financial markets are highly interconnected, which increases the possibility that conditions in one country or region might adversely affect issuers in another country or region. The impact of these and other factors may be short-term or may last for extended periods.
7. Borrowing and Interfund Lending:
Line of Credit:
The Victory Funds Complex participates in a short-term demand note "Line of Credit" agreement with Citibank. The Line of Credit agreement with Citibank was renewed on June 27, 2022, with a termination date of June 26, 2023. Under the agreement with Citibank, the Victory Funds Complex may borrow up to $600 million, of which $300 million is committed and $300 million is uncommitted. $40 million of the Line of Credit is reserved for use by the Victory Floating Rate Fund, another series of the Victory Funds Complex, with Victory Floating Rate Fund paying the related commitment fees for that amount. The purpose of the Line of Credit is to meet temporary or emergency cash needs. For the six months ended June 30, 2022, Citibank received an annual commitment fee of 0.15% on $300 million for providing the Line of Credit. Each fund in the Victory Funds Complex paid a pro-rata portion of the commitment fees plus any interest on amounts borrowed. For the period from January 1, 2022, through June 27, 2022, interest was based on the one-month London Interbank Offered Rate ("LIBOR") plus one percent. Effective with the renewal, for the period June 28, 2022, through June 30, 2022, interest was based on the one-month Secured Overnight Financing Rate (SOFR) plus 1.10 percent. Interest charged to each fund during the period, if applicable, is reflected on the Statements of Operations under Line of credit fees.
The Funds had no borrowings under the Line of Credit agreement during the six months ended June 30, 2022.
Interfund Lending:
The Trust and the Adviser rely on an exemptive order granted by the SEC in March 2017 (the "Order"), permitting the establishment and operation of an Interfund Lending Facility (the "Facility"). The Facility allows each Fund to directly lend and borrow money to or from any other fund in the Victory Funds Complex that is permitted to participate in the Facility, relying upon the Order at rates beneficial to both the borrowing and lending funds. Advances under the Facility are allowed for temporary or emergency purposes, including the meeting of redemption requests that otherwise might require the untimely disposition of securities, and are subject to each Fund's borrowing restrictions. The interfund loan rate is determined, as specified in the Order, by averaging the current repurchase agreement rate and the current bank loan rate. As a Borrower, interest charged to each Fund, if any, during the period, is reflected on the Statements of Operations under Interfund lending fees. As a Lender, interest earned by each Fund, if any, during the period, is reflected on the Statements of Operations under Interfund lending.
50
Victory Portfolios | | Notes to Financial Statements — continued
June 30, 2022 | |
(Unaudited)
| | | Borrower or
Lender | | Amount
Outstanding at
June 30,
2022 | | Average
Borrowing* | | Days
Borrowing
Outstanding | | Average
Interest
Rate* | | Maximum
Borrowing
During the
Period | |
RS International
Fund | | Borrower | | $ | — | | | $ | 7,352,500 | | | | 2 | | | | 0.98 | % | | $ | 7,521,000 | | |
Sophus Emerging
Markets Fund | | Borrower | | | — | | | | 2,855,429 | | | | 7 | | | | 1.31 | % | | | 3,347,000 | | |
* Based on the number of days borrowings were outstanding for the six months ended June 30, 2022.
8. Federal Income Tax Information:
Dividends from net investment income, if any, are declared and paid as noted in the table below. Distributable net realized gains, if any, are declared and distributed at least annually from each Fund.
| | | Declared | | Paid | |
RS International Fund | | Annually | | Annually | |
RS Global Fund | | Annually | | Annually | |
Sophus Emerging Markets Fund | | Annually | | Annually | |
The amounts of dividends from net investment income and distributions from net realized gains (collectively, distributions to shareholders) are determined in accordance with federal income tax regulations, which may differ from GAAP. To the extent these "book/tax" differences are permanent in nature (e.g., net operating loss and distribution reclassification), such amounts are reclassified within the components of net assets based on their federal tax-basis treatment; temporary differences (e.g., wash sales) do not require reclassification. To the extent dividends and distributions exceed net investment income and net realized gains for tax purposes, they are reported as distributions of capital. Net investment losses incurred by the Funds may be reclassified as an offset to capital on the accompanying Statements of Assets and Liabilities.
The tax character of current year distributions paid and the tax basis of the current components of accumulated earnings (loss) will be determined at the end of the current tax year ending December 31, 2022.
At the tax year ended December 31, 2021, the Funds had no capital loss carryforward for federal income tax purposes.
51
Victory Portfolios | | Supplemental Information
June 30, 2022 | |
(Unaudited)
Proxy Voting and Portfolio Holdings Information
Proxy Voting:
Information regarding the policies and procedures each Fund uses to determine how to vote proxies relating to portfolio securities is available without charge, upon request, by calling 800-539-3863. The information is also included in the Funds' Statement of Additional Information, which is available on the SEC's website at www.sec.gov.
Information relating to how the Funds voted proxies relating to portfolio securities held during the most recent 12 months ended June 30 is available on the SEC's website at www.sec.gov.
Availability of Schedules of Portfolio Investments:
The Trust files a complete list of Schedules of Portfolio Investments with the SEC for the first and third quarter of each fiscal year on Form N-PORT. Forms N-PORT are available on the SEC's website at www.sec.gov.
Expense Examples
As a shareholder of a Fund, you may incur two types of costs: (1) transaction costs, including sales charges (loads) on purchases; and (2) ongoing costs, including management fees and other Fund expenses. These examples are intended to help you understand your ongoing costs (in dollars) of investing in a Fund and to compare these costs with the ongoing costs of investing in other mutual funds.
These examples are based on an investment of $1,000 invested at the beginning of the period and held for the entire period from January 1, 2022, through June 30, 2022.
The Actual Expense figures in the table below provide information about actual account values and actual expenses. You may use the information below, together with the amount you invested, to estimate the expenses that you paid over the period. Simply divide your account value by $1,000 (for example, an $8,600 account value divided by $1,000 = 8.6), then multiply the result by the number in the table under the heading entitled "Actual Expenses Paid During Period" to estimate the expenses you paid on your account during this period.
The Hypothetical Expense figures in the table below provide information about hypothetical account values and hypothetical expenses based on the Fund's actual expense ratio and an assumed rate of return of 5% per year before expenses, which is not the Fund's actual return. The hypothetical account values and expenses may not be used to estimate the actual ending account balance or expenses you paid for the period. You may use this information to compare this 5% hypothetical example with the 5% hypothetical examples that appear in shareholder reports of other funds.
Please note the expenses shown in the table below are meant to highlight your ongoing costs only and do not reflect any transactional costs. Therefore, the hypothetical expenses in the table are useful in comparing ongoing costs only and will not help you determine the relative total costs of owning different funds. In addition, if these transactional costs were included, your costs would have been higher.
| | | Beginning
Account
Value
1/1/22 | | Actual
Ending
Account
Value
6/30/22 | | Hypothetical
Ending
Account
Value
6/30/22 | | Actual
Expenses Paid
During Period
1/1/22-6/30/22* | | Hypothetical
Expenses Paid
During Period
1/1/22-6/30/22* | | Annualized
Expense Ratio
During Period
1/1/22-6/30/22 | |
RS International Fund | |
Class A | | $ | 1,000.00 | | | $ | 790.00 | | | $ | 1,019.19 | | | $ | 5.02 | | | $ | 5.66 | | | | 1.13 | % | |
Class C | | | 1,000.00 | | | | 786.60 | | | | 1,015.47 | | | | 8.33 | | | | 9.39 | | | | 1.88 | % | |
Class R | | | 1,000.00 | | | | 788.80 | | | | 1,017.95 | | | | 6.12 | | | | 6.90 | | | | 1.38 | % | |
Class R6 | | | 1,000.00 | | | | 791.20 | | | | 1,020.68 | | | | 3.69 | | | | 4.16 | | | | 0.83 | % | |
Class Y | | | 1,000.00 | | | | 790.90 | | | | 1,020.43 | | | | 3.91 | | | | 4.41 | | | | 0.88 | % | |
52
Victory Portfolios | | Supplemental Information — continued
June 30, 2022 | |
(Unaudited)
| | | Beginning
Account
Value
1/1/22 | | Actual
Ending
Account
Value
6/30/22 | | Hypothetical
Ending
Account
Value
6/30/22 | | Actual
Expenses Paid
During Period
1/1/22-6/30/22* | | Hypothetical
Expenses Paid
During Period
1/1/22-6/30/22* | | Annualized
Expense Ratio
During Period
1/1/22-6/30/22 | |
RS Global Fund | |
Class A | | $ | 1,000.00 | | | $ | 779.70 | | | $ | 1,020.58 | | | $ | 3.75 | | | $ | 4.26 | | | | 0.85 | % | |
Class C | | | 1,000.00 | | | | 777.00 | | | | 1,016.86 | | | | 7.05 | | | | 8.00 | | | | 1.60 | % | |
Class R | | | 1,000.00 | | | | 778.90 | | | | 1,019.34 | | | | 4.85 | | | | 5.51 | | | | 1.10 | % | |
Class R6 | | | 1,000.00 | | | | 780.30 | | | | 1,022.07 | | | | 2.43 | | | | 2.76 | | | | 0.55 | % | |
Class Y | | | 1,000.00 | | | | 780.40 | | | | 1,021.82 | | | | 2.65 | | | | 3.01 | | | | 0.60 | % | |
Sophus Emerging Markets Fund | |
Class A | | | 1,000.00 | | | | 810.90 | | | | 1,018.15 | | | | 6.02 | | | | 6.71 | | | | 1.34 | % | |
Class C | | | 1,000.00 | | | | 808.30 | | | | 1,014.18 | | | | 9.59 | | | | 10.69 | | | | 2.14 | % | |
Class R | | | 1,000.00 | | | | 809.80 | | | | 1,016.96 | | | | 7.09 | | | | 7.90 | | | | 1.58 | % | |
Class R6 | | | 1,000.00 | | | | 812.80 | | | | 1,020.38 | | | | 4.00 | | | | 4.46 | | | | 0.89 | % | |
Class Y | | | 1,000.00 | | | | 812.50 | | | | 1,019.89 | | | | 4.45 | | | | 4.96 | | | | 0.99 | % | |
* Expenses are equal to the average account value multiplied by the Fund's annualized expense ratio multiplied by 181/365 (the number of days in the most recent fiscal half-year divided by the number of days in the fiscal year).
53
Victory Portfolios | | Supplemental Information — continued
June 30, 2022 | |
(Unaudited)
Liquidity Risk Management Program:
The Victory Funds have adopted and implemented a written liquidity risk management program (the "LRMP") as required by Rule 22e-4 under the Investment Company Act of 1940, as amended. The LRMP is reasonably designed to assess and manage each Fund's liquidity risk, taking into consideration each Fund's investment strategy and the liquidity of its portfolio investments during normal and reasonably foreseeable stressed market conditions; its short- and long-term cash flow projections; and its cash holdings and access to other liquidity management tools such as available funding sources including the Victory Funds Complex Interfund Lending Facility and Line of Credit (discussed in the Notes to Financial Statements). The Victory Funds' Board of Trustees approved the appointment of the Funds' investment adviser, Victory Capital Management Inc. ("Victory Capital"), as the administrator of the LRMP.
Victory Capital manages liquidity risks associated with the Funds' investments by monitoring, among other things, cash and cash equivalents, any use of derivatives, the concentration of investments, the appropriateness of each Fund's investment strategy, and by classifying every Fund investment as either highly liquid, moderately liquid, less liquid, or illiquid on at least a monthly basis. To assist with the classification of Fund investments, Victory Capital has retained a third-party provider of liquidity evaluation services. This provider determines preliminary liquidity classifications for all portfolio holdings based upon portfolio-level data and certain assumptions provided by Victory Capital. Victory Capital reviews the preliminary liquidity classifications and, when appropriate, considers other information including input from the Funds' portfolio managers (including the portfolio managers employed by any investment sub-advisers) in determining final liquidity classifications.
At a meeting held on February 24, 2022, Victory Capital provided an oral and written report to the Trustees on the operation and effectiveness of the LRMP during the previous year. The report from Victory Capital concluded that the Funds did not experience any significant liquidity challenges during the covered period, and the Funds' LRMP is reasonably designed to assess and manage its liquidity risk. The report also concluded that the LRMP continues to operate adequately and effectively to enable Victory Capital to oversee and manage liquidity risk and ensure each Fund is able to meet redemption requests without significant dilution to the remaining investors' interest in each Fund. During the review period, each Fund's portfolio consisted primarily of highly liquid investments, which are defined as cash and any investments that each Fund reasonably expects to be converted to cash in current market conditions in three business days or less without significantly changing the market value of the investment. Therefore, the Funds have not adopted a highly liquid investment minimum. The Funds' investments were below the limitation on illiquid investments during the review period. Additionally, Victory Capital indicated that no events occurred that would require the filing of Form N-LIQUID and recommended no material changes to the LRMP.
54
Privacy Policy
Protecting the Privacy of Information
The Trust respects your right to privacy. We also know that you expect us to conduct and process your business in an accurate and efficient manner. To do so, we must collect and maintain certain personal information about you. This is the information we collect from you on applications or other forms, and from the transactions you make with us or third parties. It may include your name, address, social security number, account transactions and balances, and information about investment goals and risk tolerance.
We do not disclose any information about you or about former customers to anyone except as permitted or required by law. Specifically, we may disclose the information we collect to companies that perform services on our behalf, such as the transfer agent that processes shareholder accounts and printers and mailers that assist us in the distribution of investor materials. We may also disclose this information to companies that perform marketing services on our behalf. This allows us to continue to offer you Victory investment products and services that meet your investing needs, and to effect transactions that you request or authorize. These companies will use this information only in connection with the services for which we hired them. They are not permitted to use or share this information for any other purpose.
To protect your personal information internally, we permit access only by authorized employees and maintain physical, electronic, and procedural safeguards to guard your personal information.*
* You may have received communications regarding information about privacy policies from other financial institutions which gave you the opportunity to "opt-out" of certain information sharing with companies which are not affiliated with that financial institution. The Trust does not share information with other companies for purposes of marketing solicitations for products other than the Trust. Therefore, the Trust does not provide opt-out options to their shareholders.
Victory Funds
P.O. Box 182593
Columbus, Ohio 43218-2593

Visit our website at: | | Call Victory at: | |
www.vcm.com | | 800-539-FUND (800-539-3863) | |

June 30, 2022
Semi Annual Report
Victory INCORE Investment Quality Bond Fund
Victory INCORE Low Duration Bond Fund
Victory High Yield Fund
Victory Tax-Exempt Fund
Victory High Income Municipal Bond Fund
Victory Floating Rate Fund
www.vcm.com
News, Information And Education 24 Hours A Day, 7 Days A Week
The Victory Capital website gives fund shareholders, prospective shareholders, and investment professionals a convenient way to access fund information, get guidance, and track fund performance anywhere they can access the Internet. The site includes:
• Detailed performance records
• Daily share prices
• The latest fund news
• Investment resources to help you become a better investor
• A section dedicated to investment professionals
Whether you're a potential investor searching for the fund that matches your investment philosophy, a seasoned investor interested in planning tools, or an investment professional, www.vcm.com has what you seek. Visit us anytime. We're always open.
TABLE OF CONTENTS
Investment Objective and Portfolio
Holdings | | | 3 | | |
Schedules of Portfolio Investments | |
Victory INCORE Investment Quality Bond Fund | | | 9 | | |
Victory INCORE Low Duration Bond Fund | | | 18 | | |
Victory High Yield Fund | | | 27 | | |
Victory Tax-Exempt Fund | | | 33 | | |
Victory High Income Municipal Bond Fund | | | 37 | | |
Victory Floating Rate Fund | | | 42 | | |
Financial Statements | |
Statements of Assets and Liabilities | | | 52 | | |
Statements of Operations | | | 54 | | |
Statements of Changes in Net Assets | | | 56 | | |
Financial Highlights | | | 62 | | |
Notes to Financial Statements | | | 76 | | |
Supplemental Information | | | 92 | | |
Proxy Voting and Portfolio Holdings Information | | | 92 | | |
Expense Examples | | | 92 | | |
Liquidity Risk Management Program | | | 94 | | |
Privacy Policy (inside back cover) | | | |
1
IRA DISTRIBUTION WITHHOLDING DISCLOSURE
We generally must withhold federal income tax at a rate of 10% of the taxable portion of your distribution and, if you live in a state that requires state income tax withholding, at your state's tax rate. However, you may elect not to have withholding apply or to have income tax withheld at a higher rate. Any withholding election that you make will apply to any subsequent distribution unless and until you change or revoke the election. If you wish to make a withholding election, or change or revoke a prior withholding election, call 800-539-3863 (800-235-8396 for Member Class) and form W-4P (OMB No. 1545-0074 withholding certificate for pension or annuity payments) will be electronically sent.
If you do not have a withholding election in place by the date of a distribution, federal income tax will be withheld from the taxable portion of your distribution at a rate of 10%. If you must pay estimated taxes, you may be subject to estimated tax penalties if your estimated tax payments are not sufficient and sufficient tax is not withheld from your distribution.
For more specific information, please consult your tax adviser.
The Funds are distributed by Victory Capital Services, Inc. Victory Capital Management Inc. is the investment adviser to the Funds and receives fees from the Funds for performing services for the Funds.
This report is not authorized for distribution to prospective investors unless preceded or accompanied by a current prospectus of the Victory Funds.
For additional information about any Victory Fund, including fees, expenses, and risks, view our prospectus online at vcm.com or call 800-539-3863 (800-235-8396 for Member Class). Read it carefully before you invest or send money.
The information in this report is based on data obtained from recognized services and sources and is believed to be reliable. Any opinions, projections, or recommendations in this report are subject to change without notice and are not intended as individual investment advice. Past investment performance of the Funds, markets or securities mentioned herein should not be considered to be indicative of future results.
• NOT FDIC INSURED • NO BANK GUARANTEE • MAY LOSE VALUE

Call Victory at:
800-539-FUND (800-539-3863)
800-235-8396 for Member Class
Visit our website at:
www.vcm.com
2
Victory Portfolios
Victory INCORE Investment Quality Bond Fund | | June 30, 2022 | |
(Unaudited)
Investment Objective and Portfolio Holdings:
The Fund seeks to provide a high level of current income and capital appreciation without undue risk to principal.
Asset Allocation*:
June 30, 2022
(% of Net Assets)
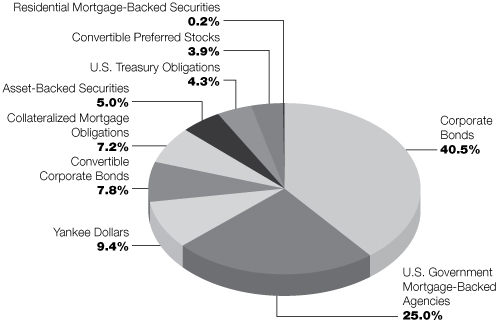
* Does not include futures contracts, money market instruments, and short-term investments purchased with cash collateral from securities loaned.
Percentages are of the net assets of the Fund and may not equal 100%.
Refer to the Schedule of Portfolio Investments for a complete list of securities.
3
Victory Portfolios
Victory INCORE Low Duration Bond Fund | | June 30, 2022 | |
(Unaudited)
Investment Objective and Portfolio Holdings:
The Fund seeks to provide a high level of current income consistent with preservation of capital.
Asset Allocation*:
June 30, 2022
(% of Net Assets)
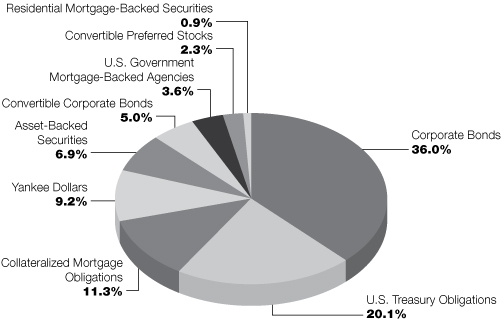
* Does not include futures contracts, money market instruments, and short-term investments purchased with cash collateral from securities loaned.
Percentages are of the net assets of the Fund and may not equal 100%.
Refer to the Schedule of Portfolio Investments for a complete list of securities.
4
Victory Portfolios
Victory High Yield Fund | | June 30, 2022 | |
(Unaudited)
Investment Objective and Portfolio Holdings:
The Fund seeks to provide current income. Capital appreciation is a secondary objective.
Asset Allocation*:
June 30, 2022
(% of Net Assets)
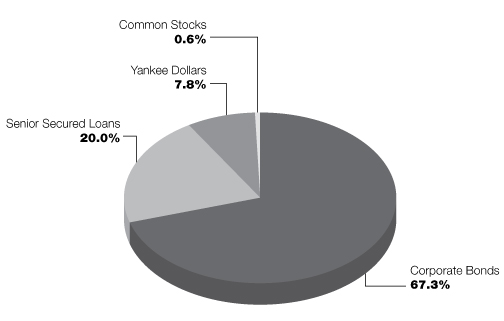
* Does not include futures contracts, money market instruments, and short-term investments purchased with cash collateral from securities loaned.
Percentages are of the net assets of the Fund and may not equal 100%.
Refer to the Schedule of Portfolio Investments for a complete list of securities.
5
Victory Portfolios
Victory Tax-Exempt Fund | | June 30, 2022 | |
(Unaudited)
Investment Objective and Portfolio Holdings:
The Fund seeks to maximize current income exempt from federal income taxes, consistent with the preservation of capital.
Asset Allocation*:
June 30, 2022
(% of Net Assets)
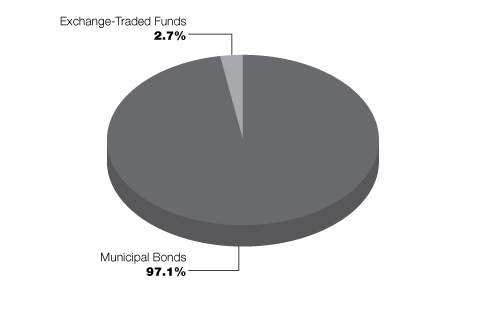
* Does not include futures contracts, money market instruments, and short-term investments purchased with cash collateral from securities loaned.
Percentages are of the net assets of the Fund and may not equal 100%.
Refer to the Schedule of Portfolio Investments for a complete list of securities.
6
Victory Portfolios
Victory High Income Municipal Bond Fund | | June 30, 2022 | |
(Unaudited)
Investment Objective and Portfolio Holdings:
The Fund seeks to provide a high current income exempt from federal income tax with a secondary objective of capital appreciation.
Asset Allocation*:
June 30, 2022
(% of Net Assets)
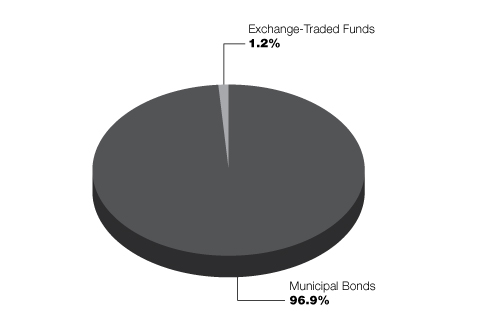
* Does not include futures contracts, money market instruments, and short-term investments purchased with cash collateral from securities loaned.
Percentages are of the net assets of the Fund and may not equal 100%.
Refer to the Schedule of Portfolio Investments for a complete list of securities.
7
Victory Portfolios
Victory Floating Rate Fund | | June 30, 2022 | |
(Unaudited)
Investment Objective and Portfolio Holdings:
The Fund seeks to provide a high level of current income.
Top 10 Holdings*:
June 30, 2022
(% of Net Assets)
Petco Health and Wellness Co., Inc., Initial Term Loans, First Lien | | | 1.7 | % | |
AAdvantage Loyalty IP Ltd., Initial Term Loan, First Lien | | | 1.7 | % | |
iHeartCommunications, Inc., Term Loans, First Lien | | | 1.6 | % | |
Air Canada, Term Loan, First Lien | | | 1.5 | % | |
Lucid Energy Group II Borrower LLC, Term Loan, First Lien | | | 1.4 | % | |
Delta Air Lines, Inc. and Skymiles IP Ltd., Initial Term Loan, First Lien | | | 1.4 | % | |
Intelsat Jackson Holdings SA, Term B loan, First Lien | | | 1.4 | % | |
Hertz Corp., Initial Term B Loans, First Lien | | | 1.4 | % | |
SWF Holdings Corp. I, Initial Term Loans, First Lien | | | 1.4 | % | |
PetSmart, Inc., Initial Term Loans, First Lien | | | 1.4 | % | |
Sector Allocation*:
June 30, 2022
(% of Net Assets)
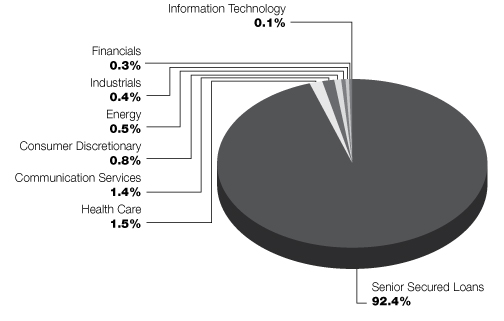
* Does not include futures contracts, money market instruments, and short-term investments purchased with cash collateral from securities loaned.
Percentages are of the net assets of the Fund and may not equal 100%.
Refer to the Schedule of Portfolio Investments for a complete list of securities.
8
Victory Portfolios
Victory INCORE Investment Quality Bond Fund | | Schedule of Portfolio Investments
June 30, 2022 | |
(Unaudited)
Security Description | | Principal
Amount | | Value | |
Asset-Backed Securities (5.0%) | |
Drive Auto Receivables Trust, Series 2021-1, Class C, 1.02%, 6/15/27,
Callable 12/15/23 @ 100 (a) | | $ | 125,000 | | | $ | 122,076 | | |
GM Financial Consumer Automobile Receivables Trust, Series 2021-2,
Class C, 1.28%, 1/19/27, Callable 12/16/24 @ 100 (a) | | | 105,000 | | | | 97,758 | | |
Santander Drive Auto Receivables Trust, Series 2021-4, Class C, 1.26%, 2/16/27,
Callable 6/15/24 @ 100 (a) | | | 100,000 | | | | 95,693 | | |
Santander Retail Auto Lease Trust, Series 2021-A, Class C, 1.14%, 3/20/26,
Callable 4/20/24 @ 100 (a) (b) | | | 287,000 | | | | 272,115 | | |
United Auto Credit Securitization Trust, Series 2022-1, Class C, 2.61%, 6/10/27,
Callable 6/10/25 @ 100 (a) (b) | | | 81,000 | | | | 78,244 | | |
Westlake Automobile Receivables Trust, Series 2021-1A, Class C, 0.95%, 3/16/26,
Callable 6/15/24 @ 100 (a) (b) | | | 142,000 | | | | 136,622 | | |
Westlake Automobile Receivables Trust, Series 2021-2A, Class C, 0.89%, 7/15/26,
Callable 9/15/24 @ 100 (a) (b) | | | 136,000 | | | | 128,743 | | |
Westlake Automobile Receivables Trust, Series 2022-1A, Class C, 3.11%, 3/15/27,
Callable 8/15/25 @ 100 (a) (b) | | | 106,000 | | | | 103,520 | | |
Total Asset-Backed Securities (Cost $1,081,897) | | | 1,034,771 | | |
Collateralized Mortgage Obligations (7.2%) | |
BANK, Series 2020-BN26, Class AS, 2.69%, 3/15/63, Callable 3/15/30 @ 100 (a) | | | 130,000 | | | | 112,554 | | |
CFCRE Commercial Mortgage Trust, Series 2016-C3, Class A2, 3.60%, 1/10/48,
Callable 11/10/25 @ 100 | | | 54,525 | | | | 53,067 | | |
CFCRE Commercial Mortgage Trust, Series 2016-C4, Class A2, 3.28%, 5/10/58 | | | 44,000 | | | | 42,470 | | |
Citigroup Commercial Mortgage Trust, Series 2020-GC46, Class AS, 2.92%,
2/15/53, Callable 2/15/30 @ 100 (a) | | | 117,000 | | | | 102,336 | | |
Citigroup Commercial Mortgage Trust, Series 2016-P4, Class A4, 2.90%,
7/10/49, Callable 7/10/26 @ 100 (a) | | | 85,000 | | | | 80,717 | | |
Citigroup Commercial Mortgage Trust, Series 2015-GC33, Class A4, 3.78%,
9/10/58, Callable 9/10/25 @ 100 | | | 50,000 | | | | 49,548 | | |
Citigroup Commercial Mortgage Trust, Series 2015-P1, Class A5, 3.72%,
9/15/48, Callable 7/15/25 @ 100 (a) | | | 56,000 | | | | 55,211 | | |
COMM Mortgage Trust, Series 2015-CR25, Class A4, 3.76%, 8/10/48,
Callable 8/10/25 @ 100 (a) | | | 65,000 | | | | 63,988 | | |
CSAIL Commercial Mortgage Trust, Series 2015-C2, Class A4, 3.50%, 6/15/57,
Callable 4/15/25 @ 100 (a) | | | 73,000 | | | | 71,496 | | |
CSAIL Commercial Mortgage Trust, Series 2015-C3, Class A4, 3.72%, 8/15/48,
Callable 7/15/25 @ 100 (a) | | | 120,000 | | | | 118,013 | | |
CSAIL Commercial Mortgage Trust, Series 2015-C4, Class A4, 3.81%, 11/15/48 (a) | | | 54,000 | | | | 53,166 | | |
CSAIL Commercial Mortgage Trust, Series 2016-C7, Class A5, 3.50%, 11/15/49,
Callable 10/15/26 @ 100 | | | 48,000 | | | | 46,589 | | |
GS Mortgage Securities Trust, Series 2016-GS2, Class A4, 3.05%, 5/10/49,
Callable 2/10/26 @ 100 (a) | | | 57,000 | | | | 54,621 | | |
GS Mortgage Securities Trust, Series 2015-GC30, Class A4, 3.38%, 5/10/50,
Callable 5/10/25 @ 100 (a) | | | 57,000 | | | | 55,961 | | |
JP Morgan Chase Commercial Mortgage Securities Trust, Series 2016-JP2,
Class A4, 2.82%, 8/15/49, Callable 7/15/26 @ 100 (a) | | | 131,000 | | | | 123,920 | | |
See notes to financial statements.
9
Victory Portfolios
Victory INCORE Investment Quality Bond Fund | | Schedule of Portfolio Investments — continued
June 30, 2022 | |
(Unaudited)
Security Description | | Principal
Amount | | Value | |
JPMBB Commercial Mortgage Securities Trust, Series 2015-C28, Class A4, 3.23%,
10/15/48, Callable 3/15/25 @ 100 (a) | | $ | 68,000 | | | $ | 66,378 | | |
JPMBB Commercial Mortgage Securities Trust, Series 2015-C31, Class A3, 3.80%,
8/15/48, Callable 8/15/25 @ 100 (a) | | | 52,461 | | | | 51,768 | | |
Morgan Stanley Bank of America Merrill Lynch Trust, Series 2016-C32, Class A4,
3.72%, 12/15/49, Callable 12/15/26 @ 100 (a) | | | 55,000 | | | | 53,669 | | |
Wells Fargo Commercial Mortgage Trust, Series 2016-NXS6, Class A4,
2.92%, 11/15/49, Callable 9/15/26 @ 100 | | | 51,000 | | | | 48,513 | | |
Wells Fargo Commercial Mortgage Trust, Series 2015-C28, Class A4,
3.54%, 5/15/48, Callable 4/15/25 @ 100 (a) | | | 67,000 | | | | 65,654 | | |
Wells Fargo Commercial Mortgage Trust, Series 2015-P2, Class A4,
3.81%, 12/15/48, Callable 11/15/25 @ 100 (a) | | | 57,000 | | | | 56,279 | | |
Wells Fargo Commercial Mortgage Trust, Series 2015-C30, Class A4,
3.66%, 9/15/58, Callable 7/15/25 @ 100 (a) | | | 62,000 | | | | 61,017 | | |
Total Collateralized Mortgage Obligations (Cost $1,592,093) | | | 1,486,935 | | |
Convertible Corporate Bonds (7.8%) | |
Consumer Discretionary (1.4%): | |
Booking Holdings, Inc., 0.75%, 5/1/25 (a) (c) | | | 120,000 | | | | 142,480 | | |
Expedia Group, Inc., 2/15/26 (a) (c) (d) | | | 120,000 | | | | 108,384 | | |
Ford Motor Co., 3/15/26 (d) | | | 40,000 | | | | 36,628 | | |
| | | | 287,492 | | |
Energy (0.6%): | |
Pioneer Natural Resources Co., 0.25%, 5/15/25 (a) | | | 60,000 | | | | 129,802 | | |
Financials (1.8%): | |
Ares Capital Corp., 4.63%, 3/1/24 (a) | | | 135,000 | | | | 140,894 | | |
Barclays Bank PLC
2/4/25 (a) (d) | | | 45,000 | | | | 61,194 | | |
2/18/25 (d) | | | 30,000 | | | | 31,404 | | |
JPMorgan Chase Financial Co. LLC, 0.25%, 5/1/23 (a) (b) | | | 100,000 | | | | 104,073 | | |
Sixth Street Specialty Lending, Inc., 4.50%, 8/1/22 | | | 40,000 | | | | 41,650 | | |
| | | | 379,215 | | |
Health Care (1.1%): | |
Anthem, Inc., 2.75%, 10/15/42 (a) | | | 17,000 | | | | 116,596 | | |
Illumina, Inc., 8/15/23 (a) (d) | | | 110,000 | | | | 105,137 | | |
| | | | 221,733 | | |
Industrials (0.7%): | |
Southwest Airlines Co., 1.25%, 5/1/25 (a) | | | 115,000 | | | | 135,972 | | |
Information Technology (1.9%): | |
Akamai Technologies, Inc., 0.13%, 5/1/25 (a) | | | 50,000 | | | | 54,829 | | |
Block, Inc., 0.25%, 11/1/27 | | | 20,000 | | | | 14,727 | | |
Euronet Worldwide, Inc., 0.75%, 3/15/49, Callable 3/20/25 @ 100 (a) (c) | | | 125,000 | | | | 128,250 | | |
Vishay Intertechnology, Inc., 2.25%, 6/15/25 | | | 40,000 | | | | 37,899 | | |
Western Digital Corp., 1.50%, 2/1/24 (a) | | | 170,000 | | | | 161,666 | | |
| | | | 397,371 | | |
See notes to financial statements.
10
Victory Portfolios
Victory INCORE Investment Quality Bond Fund | | Schedule of Portfolio Investments — continued
June 30, 2022 | |
(Unaudited)
Security Description | | Shares or
Principal
Amount | | Value | |
Real Estate (0.3%): | |
Kite Realty Group LP, 0.75%, 4/1/27 (a) (b) | | $ | 70,000 | | | $ | 63,122 | | |
Total Convertible Corporate Bonds (Cost $1,624,231) | | | 1,614,707 | | |
Convertible Preferred Stocks (3.9%) | |
Financials (1.5%): | |
Bank of America Corp., Series L, 7.25% (a) (e) | | | 112 | | | | 134,904 | | |
KKR & Co., Inc., Series C, 9/15/23, 6.00% (a) | | | 990 | | | | 57,885 | | |
Wells Fargo & Co., Series L, 7.50% (a) (e) | | | 95 | | | | 115,474 | | |
| | | | 308,263 | | |
Health Care (0.1%): | |
Danaher Corp., Series B, 4/15/23, 5.00% (c) | | | 17 | | | | 22,495 | | |
Industrials (0.4%): | |
Stanley Black & Decker, Inc., 11/15/22, 5.25% (a) | | | 1,201 | | | | 80,935 | | |
Utilities (1.9%): | |
American Electric Power Co., Inc., 8/15/23, 6.13% | | | 655 | | | | 35,553 | | |
CenterPoint Energy, Inc., 9/15/29, 4.57% | | | 455 | | | | 21,053 | | |
DTE Energy Co., 11/1/22, 6.25% (a) | | | 1,765 | | | | 90,756 | | |
NextEra Energy, Inc., 3/1/23, 5.28% (a) | | | 2,875 | | | | 142,744 | | |
NiSource, Inc., 3/1/24, 7.75% | | | 85 | | | | 9,666 | | |
The Southern Co., Series 2019, 8/1/22, 6.75% (a) | | | 1,962 | | | | 103,947 | | |
| | | | 403,719 | | |
Total Convertible Preferred Stocks (Cost $917,012) | | | 815,412 | | |
Corporate Bonds (40.5%) | |
Communication Services (1.8%): | |
AT&T, Inc.
4.25%, 3/1/27, Callable 12/1/26 @ 100 (a) | | $ | 46,000 | | | | 45,917 | | |
5.15%, 11/15/46, Callable 5/15/46 @ 100 (a) | | | 126,000 | | | | 124,390 | | |
CenturyLink, Inc., 6.75%, 12/1/23 | | | 50,000 | | | | 49,635 | | |
Comcast Corp., 3.45%, 2/1/50, Callable 8/1/49 @ 100 (a) | | | 70,000 | | | | 55,747 | | |
Sirius XM Radio, Inc., 4.13%, 7/1/30, Callable 7/1/25 @ 102.06 (a) (b) | | | 62,000 | | | | 51,776 | | |
Verizon Communications, Inc., 3.38%, 2/15/25 (a) | | | 38,000 | | | | 37,759 | | |
| | | | 365,224 | | |
Consumer Discretionary (5.2%): | |
Aptiv PLC, 5.40%, 3/15/49, Callable 9/15/48 @ 100 | | | 34,000 | | | | 31,137 | | |
Dana, Inc., 5.63%, 6/15/28, Callable 6/15/23 @ 102.81 | | | 48,000 | | | | 41,517 | | |
General Motors Co., 4.88%, 10/2/23 (a) | | | 96,000 | | | | 96,910 | | |
Lennar Corp., 5.00%, 6/15/27, Callable 12/15/26 @ 100 (a) | | | 93,000 | | | | 92,022 | | |
Marriott International, Inc., 3.60%, 4/15/24, Callable 3/15/24 @ 100 (a) | | | 142,000 | | | | 140,654 | | |
Meritage Homes Corp., 6.00%, 6/1/25, Callable 3/1/25 @ 100 | | | 27,000 | | | | 26,332 | | |
Murphy Oil USA, Inc., 3.75%, 2/15/31, Callable 2/15/26 @ 101.88 (a) (b) | | | 78,000 | | | | 66,513 | | |
NIKE, Inc., 3.88%, 11/1/45, Callable 5/1/45 @ 100 (a) | | | 73,000 | | | | 67,045 | | |
NVR, Inc., 3.00%, 5/15/30, Callable 11/15/29 @ 100 (a) | | | 118,000 | | | | 101,284 | | |
O'Reilly Automotive, Inc., 4.70%, 6/15/32, Callable 3/15/32 @ 100 | | | 69,000 | | | | 68,787 | | |
PulteGroup, Inc., 5.00%, 1/15/27, Callable 10/15/26 @ 100 (a) (c) | | | 100,000 | | | | 99,972 | | |
See notes to financial statements.
11
Victory Portfolios
Victory INCORE Investment Quality Bond Fund | | Schedule of Portfolio Investments — continued
June 30, 2022 | |
(Unaudited)
Security Description | | Principal
Amount | | Value | |
Ross Stores, Inc., 3.38%, 9/15/24, Callable 6/15/24 @ 100 (a) | | $ | 70,000 | | | $ | 68,886 | | |
The Goodyear Tire Rubber Co., 5.25%, 4/30/31, Callable 1/30/31 @ 100 (a) (c) | | | 66,000 | | | | 53,666 | | |
Whirlpool Corp., 2.40%, 5/15/31, Callable 2/15/31 @ 100 (a) | | | 80,000 | | | | 66,609 | | |
Yum! Brands, Inc., 3.63%, 3/15/31, Callable 12/15/30 @ 100 (a) | | | 73,000 | | | | 61,786 | | |
| | | | 1,083,120 | | |
Consumer Staples (2.1%): | |
7-Eleven, Inc., 0.80%, 2/10/24, Callable 8/8/22 @ 100 (a) (b) | | | 156,000 | | | | 148,149 | | |
BAT Capital Corp., 5.28%, 4/2/50, Callable 10/2/49 @ 100 (a) | | | 75,000 | | | | 61,761 | | |
Church & Dwight Co., Inc., 2.30%, 12/15/31, Callable 9/15/31 @ 100 | | | 50,000 | | | | 42,185 | | |
Estee Lauder Cos., Inc., 4.15%, 3/15/47, Callable 9/15/46 @ 100 (a) | | | 52,000 | | | | 48,380 | | |
Reynolds American, Inc., 5.70%, 8/15/35, Callable 2/15/35 @ 100 (a) | | | 92,000 | | | | 85,749 | | |
Tyson Foods, Inc., 5.10%, 9/28/48, Callable 3/28/48 @ 100 | | | 39,000 | | | | 39,288 | | |
| | | | 425,512 | | |
Energy (3.6%): | |
Continental Resources, Inc.
4.50%, 4/15/23, Callable 1/15/23 @ 100 (a) | | | 113,000 | | | | 113,404 | | |
2.27%, 11/15/26, Callable 11/15/23 @ 100 (a) (b) | | | 93,000 | | | | 82,505 | | |
EOG Resources, Inc., 4.95%, 4/15/50, Callable 10/15/49 @ 100 (a) | | | 65,000 | | | | 67,206 | | |
HollyFrontier Corp., 2.63%, 10/1/23 (a) | | | 116,000 | | | | 112,738 | | |
Marathon Oil Corp., 6.60%, 10/1/37 (a) | | | 105,000 | | | | 111,241 | | |
Pioneer Natural Resources Co., 1.90%, 8/15/30, Callable 5/15/30 @ 100 (a) | | | 109,000 | | | | 89,004 | | |
Plains All American Pipeline LP/PAA Finance Corp., 2.85%, 1/31/23,
Callable 10/31/22 @ 100 (a) | | | 120,000 | | | | 119,293 | | |
Western Midstream Operating LP, 4.55%, 2/1/30, Callable 11/1/29 @ 100 (a) | | | 66,000 | | | | 57,132 | | |
| | | | 752,523 | | |
Financials (10.1%): | |
Aflac, Inc., 4.75%, 1/15/49, Callable 7/15/48 @ 100 | | | 10,000 | | | | 9,629 | | |
Alleghany Corp., 3.63%, 5/15/30, Callable 2/15/30 @ 100 (a) | | | 55,000 | | | | 51,468 | | |
American Express Co., 4.99% (SOFR+226bps), 5/26/33, Callable 2/26/32 @ 100 (f) | | | 103,000 | | | | 102,956 | | |
Bank of America Corp.
4.20%, 8/26/24 (a) | | | 51,000 | | | | 51,113 | | |
3.25%, 10/21/27, Callable 10/21/26 @ 100 (a) | | | 100,000 | | | | 94,331 | | |
2.57% (SOFR+121bps), 10/20/32, Callable 10/20/31 @ 100 (a) (f) | | | 120,000 | | | | 99,017 | | |
Capital One Financial Corp.
4.93% (SOFR+206bps), 5/10/28, Callable 5/10/27 @ 100 (f) | | | 60,000 | | | | 59,471 | | |
2.36% (SOFR+134bps), 7/29/32, Callable 7/29/31 @ 100 (a) (f) | | | 146,000 | | | | 111,159 | | |
Cincinnati Financial Corp., 6.13%, 11/1/34 (a) | | | 75,000 | | | | 85,253 | | |
Citigroup, Inc.
3.88%, 3/26/25 | | | 35,000 | | | | 34,575 | | |
4.60%, 3/9/26 (a) | | | 36,000 | | | | 36,076 | | |
4.45%, 9/29/27 (a) | | | 63,000 | | | | 61,939 | | |
Ford Motor Credit Co. LLC, 4.06%, 11/1/24, Callable 10/1/24 @ 100 (a) | | | 200,000 | | | | 190,066 | | |
General Motors Financial Co., Inc., 4.15%, 6/19/23, Callable 5/19/23 @ 100 | | | 49,000 | | | | 48,930 | | |
Globe Life, Inc., 2.15%, 8/15/30, Callable 5/15/30 @ 100 (a) | | | 110,000 | | | | 90,060 | | |
JPMorgan Chase & Co.
2.95%, 10/1/26, Callable 7/1/26 @ 100 (a) | | | 170,000 | | | | 162,301 | | |
2.55% (SOFR+118bps), 11/8/32, Callable 11/8/31 @ 100 (a) (f) | | | 135,000 | | | | 112,169 | | |
5.60%, 7/15/41 | | | 27,000 | | | | 28,337 | | |
See notes to financial statements.
12
Victory Portfolios
Victory INCORE Investment Quality Bond Fund | | Schedule of Portfolio Investments — continued
June 30, 2022 | |
(Unaudited)
Security Description | | Principal
Amount | | Value | |
Morgan Stanley, 3.13%, 7/27/26, MTN (a) | | $ | 205,000 | | | $ | 195,642 | | |
Old Republic International Corp., 3.85%, 6/11/51, Callable 12/11/50 @ 100 | | | 42,000 | | | | 31,697 | | |
Regions Financial Corp., 1.80%, 8/12/28, Callable 6/12/28 @ 100 (a) | | | 89,000 | | | | 75,687 | | |
SVB Financial Group, 3.13%, 6/5/30, Callable 3/5/30 @ 100 (a) | | | 164,000 | | | | 141,132 | | |
Wells Fargo & Co.
4.30%, 7/22/27, MTN (a) | | | 180,000 | | | | 177,856 | | |
4.90%, 11/17/45 (a) | | | 55,000 | | | | 50,894 | | |
| | | | 2,101,758 | | |
Health Care (4.4%): | |
AbbVie, Inc.
3.20%, 11/21/29, Callable 8/21/29 @ 100 (a) | | | 66,000 | | | | 60,682 | | |
4.45%, 5/14/46, Callable 11/14/45 @ 100 (a) | | | 62,000 | | | | 56,240 | | |
Anthem, Inc., 2.38%, 1/15/25, Callable 12/15/24 @ 100 (a) | | | 65,000 | | | | 62,662 | | |
Baxter International, Inc., 2.54%, 2/1/32, Callable 11/1/31 @ 100 (a) (b) | | | 141,000 | | | | 118,929 | | |
Centene Corp., 4.25%, 12/15/27, Callable 12/15/22 @ 102.13 (a) | | | 73,000 | | | | 68,165 | | |
HCA, Inc., 4.13%, 6/15/29, Callable 3/15/29 @ 100 (a) | | | 73,000 | | | | 66,659 | | |
Hologic, Inc., 3.25%, 2/15/29, Callable 9/28/23 @ 101.63 (a) (b) | | | 114,000 | | | | 97,401 | | |
Mylan, Inc., 4.55%, 4/15/28, Callable 1/15/28 @ 100 (a) | | | 91,000 | | | | 86,690 | | |
Regeneron Pharmaceuticals, Inc., 2.80%, 9/15/50, Callable 3/15/50 @ 100 | | | 63,000 | | | | 42,684 | | |
Universal Health Services, Inc.
1.65%, 9/1/26, Callable 8/1/26 @ 100 (a) (b) | | | 154,000 | | | | 133,420 | | |
2.65%, 10/15/30, Callable 7/15/30 @ 100 (b) | | | 44,000 | | | | 35,065 | | |
Viatris, Inc.
2.30%, 6/22/27, Callable 4/22/27 @ 100 | | | 40,000 | | | | 34,218 | | |
4.00%, 6/22/50, Callable 12/22/49 @ 100 (a) | | | 75,000 | | | | 49,973 | | |
| | | | 912,788 | | |
Industrials (3.9%): | |
Acuity Brands Lighting, Inc., 2.15%, 12/15/30, Callable 9/15/30 @ 100 | | | 37,000 | | | | 29,320 | | |
Air Lease Corp.
0.70%, 2/15/24, Callable 1/15/24 @ 100, MTN (a) | | | 120,000 | | | | 113,342 | | |
0.80%, 8/18/24, Callable 7/18/24 @ 100 (a) | | | 58,000 | | | | 53,128 | | |
CSX Corp., 3.35%, 9/15/49, Callable 3/15/49 @ 100 (a) | | | 49,000 | | | | 38,264 | | |
Delta Air Lines, Inc., 3.80%, 4/19/23, Callable 3/19/23 @ 100 (a) | | | 130,000 | | | | 129,372 | | |
Hillenbrand, Inc., 5.00%, 9/15/26, Callable 7/15/26 @ 100 (a) | | | 195,000 | | | | 184,421 | | |
Norfolk Southern Corp.
2.30%, 5/15/31, Callable 2/15/31 @ 100 | | | 40,000 | | | | 34,140 | | |
2.90%, 8/25/51, Callable 2/25/51 @ 100 | | | 50,000 | | | | 35,856 | | |
Northrop Grumman Corp., 5.25%, 5/1/50, Callable 11/1/49 @ 100 (a) | | | 45,000 | | | | 47,526 | | |
Oshkosh Corp., 3.10%, 3/1/30, Callable 12/1/29 @ 100 (a) | | | 60,000 | | | | 51,334 | | |
Sensata Technologies, Inc., 3.75%, 2/15/31, Callable 2/15/26 @ 101.88 (b) | | | 57,000 | | | | 45,749 | | |
Snap-on, Inc., 4.10%, 3/1/48, Callable 9/1/47 @ 100 (a) | | | 56,000 | | | | 51,011 | | |
| | | | 813,463 | | |
Information Technology (3.3%): | |
Apple, Inc., 4.65%, 2/23/46, Callable 8/23/45 @ 100 (a) | | | 53,000 | | | | 54,778 | | |
Broadcom, Inc., 5.00%, 4/15/30, Callable 1/15/30 @ 100 (a) | | | 123,000 | | | | 120,921 | | |
Cadence Design Systems, Inc., 4.38%, 10/15/24, Callable 7/15/24 @ 100 (a) | | | 153,000 | | | | 154,576 | | |
Micron Technology, Inc., 5.33%, 2/6/29, Callable 11/6/28 @ 100 (a) | | | 167,000 | | | | 166,427 | | |
NCR Corp., 5.25%, 10/1/30, Callable 10/1/25 @ 102.63 (b) | | | 38,000 | | | | 32,754 | | |
See notes to financial statements.
13
Victory Portfolios
Victory INCORE Investment Quality Bond Fund | | Schedule of Portfolio Investments — continued
June 30, 2022 | |
(Unaudited)
Security Description | | Principal
Amount | | Value | |
NetApp, Inc., 3.25%, 12/15/22, Callable 9/15/22 @ 100 (a) | | $ | 70,000 | | | $ | 69,935 | | |
Texas Instruments, Inc., 4.15%, 5/15/48, Callable 11/15/47 @ 100 (a) | | | 51,000 | | | | 49,198 | | |
Western Digital Corp., 2.85%, 2/1/29, Callable 12/1/28 @ 100 | | | 53,000 | | | | 43,196 | | |
| | | | 691,785 | | |
Materials (0.4%): | |
Newmont Corp., 2.60%, 7/15/32, Callable 4/15/32 @ 100 | | | 36,000 | | | | 29,702 | | |
The Scotts Miracle-Gro Co., 4.50%, 10/15/29, Callable 10/15/24 @ 102.25 (a) | | | 66,000 | | | | 54,135 | | |
| | | | 83,837 | | |
Real Estate (4.2%): | |
Essential Properties LP, 2.95%, 7/15/31, Callable 4/15/31 @ 100 | | | 56,000 | | | | 43,928 | | |
Highwoods Realty LP, 3.63%, 1/15/23, Callable 10/15/22 @ 100 (a) | | | 285,000 | | | | 285,077 | | |
Iron Mountain, Inc., 5.25%, 7/15/30, Callable 7/15/25 @ 102.63 (b) | | | 48,000 | | | | 41,782 | | |
Kite Realty Group Trust, 4.00%, 3/15/25, Callable 12/15/24 @ 100 (a) (c) | | | 155,000 | | | | 151,545 | | |
Physicians Realty LP
3.95%, 1/15/28, Callable 10/15/27 @ 100 (a) | | | 60,000 | | | | 57,149 | | |
2.63%, 11/1/31, Callable 8/1/31 @ 100 | | | 48,000 | | | | 38,719 | | |
Regency Centers LP, 4.65%, 3/15/49, Callable 9/15/48 @ 100 | | | 49,000 | | | | 43,783 | | |
Sabra Health Care LP, 5.13%, 8/15/26, Callable 5/15/26 @ 100 (a) | | | 65,000 | | | | 63,186 | | |
Spirit Realty LP, 3.20%, 1/15/27, Callable 11/15/26 @ 100 | | | 92,000 | | | | 84,560 | | |
STORE Capital Corp., 2.75%, 11/18/30, Callable 8/18/30 @ 100 (a) | | | 80,000 | | | | 65,653 | | |
| | | | 875,382 | | |
Utilities (1.5%): | |
Ameren Illinois Co., 1.55%, 11/15/30, Callable 8/15/30 @ 100 (a) | | | 100,000 | | | | 81,451 | | |
Consolidated Edison Co. of New York, Inc., 6.30%, 8/15/37 | | | 40,000 | | | | 45,094 | | |
Oklahoma Gas and Electric Co., 5.25%, 5/15/41, Callable 11/15/40 @ 100 (a) | | | 105,000 | | | | 104,632 | | |
Public Service Electric & Gas Co., 4.00%, 6/1/44, Callable 12/1/43 @ 100 (a) | | | 65,000 | | | | 55,886 | | |
Wisconsin Public Service Corp., 2.85%, 12/1/51, Callable 6/1/51 @ 100 | | | 47,000 | | | | 34,124 | | |
| | | | 321,187 | | |
Total Corporate Bonds (Cost $9,465,124) | | | 8,426,579 | | |
Residential Mortgage-Backed Securities (0.2%) | |
Credit Suisse First Boston Mortgage Securities Corp., Series 2002-HE16,
Class M1, 2.94% (LIBOR01M+132bps), 10/25/32, Callable 7/25/22 @ 100 (f) | | | 50,787 | | | | 50,932 | | |
Total Residential Mortgage-Backed Securities (Cost $49,868) | | | 50,932 | | |
Yankee Dollars (9.4%) | |
Communication Services (0.4%): | |
Vodafone Group PLC, 5.25%, 5/30/48 (a) | | | 89,000 | | | | 84,626 | | |
Consumer Staples (4.2%): | |
Barry Callebaut Services NV, 5.50%, 6/15/23 (b) | | | 275,000 | | | | 276,334 | | |
Kerry Group Financial Services Unlimited Co., 3.20%, 4/9/23, Callable
1/9/23 @ 100 (a) (b) | | | 400,000 | | | | 398,840 | | |
Suntory Holdings Ltd., 2.25%, 10/16/24, Callable 9/16/24 @ 100 (a) (b) | | | 200,000 | | | | 190,154 | | |
| | | | 865,328 | | |
See notes to financial statements.
14
Victory Portfolios
Victory INCORE Investment Quality Bond Fund | | Schedule of Portfolio Investments — continued
June 30, 2022 | |
(Unaudited)
Security Description | | Principal
Amount | | Value | |
Energy (0.7%): | |
Ecopetrol SA, 5.88%, 9/18/23 (a) | | $ | 133,000 | | | $ | 132,947 | | |
Statoil ASA, 3.95%, 5/15/43 | | | 20,000 | | | | 17,869 | | |
| | | | 150,816 | | |
Financials (1.4%): | |
HSBC Holdings PLC, 2.87% (SOFR+141bps), 11/22/32, Callable
11/22/31 @ 100 (a) (f) | | | 200,000 | | | | 163,824 | | |
Newcrest Finance Pty Ltd.
5.75%, 11/15/41 (b) | | | 45,000 | | | | 44,459 | | |
4.20%, 5/13/50, Callable 11/13/49 @ 100 (b) | | | 25,000 | | | | 20,436 | | |
Total Capital International SA, 2.99%, 6/29/41, Callable 12/29/40 @ 100 (a) | | | 85,000 | | | | 67,173 | | |
| | | | 295,892 | | |
Industrials (1.1%): | |
AerCap Ireland Capital DAC/AerCap Global Aviation Trust, 6.50%, 7/15/25,
Callable 6/15/25 @ 100 (a) | | | 150,000 | | | | 153,328 | | |
Canadian National Railway Co., 3.20%, 8/2/46, Callable 2/2/46 @ 100 (a) | | | 60,000 | | | | 46,892 | | |
Canadian Pacific Railway Co., 3.10%, 12/2/51, Callable 6/2/51 @ 100 | | | 33,000 | | | | 24,313 | | |
| | | | 224,533 | | |
Materials (1.4%): | |
Anglo American Capital PLC, 2.88%, 3/17/31, Callable 12/17/30 @ 100 (a) (b) | | | 200,000 | | | | 166,426 | | |
Rio Tinto Finance USA Ltd., 5.20%, 11/2/40 (a) | | | 50,000 | | | | 52,080 | | |
Vale Overseas Ltd., 6.25%, 8/10/26 (a) (c) | | | 63,000 | | | | 65,822 | | |
| | | | 284,328 | | |
Utilities (0.2%): | |
Iberdrola International BV, 6.75%, 9/15/33 | | | 35,000 | | | | 39,613 | | |
Total Yankee Dollars (Cost $2,133,612) | | | 1,945,136 | | |
U.S. Government Mortgage-Backed Agencies (25.0%) | |
Federal Home Loan Bank
1.10%, 4/29/26 (a) | | | 255,000 | | | | 234,789 | | |
Federal Home Loan Mortgage Corp.
5.00%, 6/15/23 (a) | | | 3,056 | | | | 3,062 | | |
Series 4395, Class PA, 2.50%, 4/15/37 – 7/1/50 (a) | | | 160,540 | | | | 149,642 | | |
5.50%, 6/1/38 | | | 18,848 | | | | 20,143 | | |
7.00%, 9/1/38 (a) | | | 4,726 | | | | 5,235 | | |
Series 4320, Class AP, 3.50%, 7/15/39 – 10/15/40 (a) | | | 63,486 | | | | 63,794 | | |
4.50%, 1/1/41 – 7/1/44 (a) | | | 250,512 | | | | 258,194 | | |
Series 4444, Class CH, 3.00%, 1/15/41 (a) | | | 10,667 | | | | 10,650 | | |
2.00%, 3/1/51 (a) | | | 244,944 | | | | 213,139 | | |
| | | | 723,859 | | |
Federal National Mortgage Association
7.00%, 8/1/23 – 12/1/27 | | | 35 | | | | 35 | | |
7.50%, 12/1/29 (a) | | | 2,744 | | | | 2,988 | | |
8.00%, 6/1/30 | | | 1,571 | | | | 1,742 | | |
8.00%, 9/1/30 (a) | | | 6,128 | | | | 6,717 | | |
7.50%, 2/1/31 | | | 7,760 | | | | 8,304 | | |
See notes to financial statements.
15
Victory Portfolios
Victory INCORE Investment Quality Bond Fund | | Schedule of Portfolio Investments — continued
June 30, 2022 | |
(Unaudited)
Security Description | | Shares or
Principal
Amount | | Value | |
7.00%, 2/1/32 – 6/1/32 (a) | | $ | 12,650 | | | $ | 13,975 | | |
5.00%, 12/1/34 – 3/1/40 | | | 46,479 | | | | 48,939 | | |
Series 2005-19, Class PB, 5.50%, 3/25/35 – 1/1/38 (a) | | | 179,606 | | | | 190,685 | | |
1.91% (LIBOR12M+166bps), 12/1/36 (a) (f) | | | 24,335 | | | | 24,491 | | |
6.00%, 2/1/37 (a) | | | 41,765 | | | | 45,593 | | |
4.50%, 12/1/38 – 5/25/40 (a) | | | 172,099 | | | | 175,094 | | |
Series 2013-33, Class UD, 2.50%, 4/25/39 – 7/1/51 (a) | | | 736,335 | | | | 669,404 | | |
3.50%, 8/1/39 – 12/25/50 (a) | | | 289,388 | | | | 285,711 | | |
3.00%, 6/1/40 – 5/1/48 (a) | | | 444,007 | | | | 421,637 | | |
4.00%, 11/1/43 – 10/1/48 (a) | | | 329,412 | | | | 331,987 | | |
3.50%, 7/1/46 | | | 26,975 | | | | 26,320 | | |
4.00%, 6/1/49 | | | 8,486 | | | | 8,458 | | |
2.00%, 3/1/51 (a) | | | 273,843 | | | | 238,285 | | |
2.00%, 7/25/52 (g) | | | 500,000 | | | | 433,728 | | |
2.50%, 7/25/52 (g) | | | 700,000 | | | | 629,176 | | |
3.00%, 7/25/52 (g) | | | 400,000 | | | | 372,360 | | |
3.50%, 7/25/52 (g) | | | 300,000 | | | | 288,472 | | |
| | | | 4,224,101 | | |
Government National Mortgage Association
6.00%, 12/15/33 (a) | | | 7,619 | | | | 8,289 | | |
Total U.S. Government Mortgage-Backed Agencies (Cost $5,457,184) | | | 5,191,038 | | |
U.S. Treasury Obligations (4.3%) | |
U.S. Treasury Bonds, 1.25%, 5/15/50 (a) | | | 665,000 | | | | 423,003 | | |
U.S. Treasury Notes
0.75%, 4/30/26 (a) | | | 230,000 | | | | 210,827 | | |
1.63%, 5/15/31 (a) | | | 288,000 | | | | 257,310 | | |
Total U.S. Treasury Obligations (Cost $929,198) | | | 891,140 | | |
Collateral for Securities Loaned (2.7%)^ | |
BlackRock Liquidity Funds TempFund, Institutional Shares, 1.47% (h) | | | 17,696 | | | | 17,696 | | |
Goldman Sachs Financial Square Prime Obligations Fund, Institutional
Shares, 1.42% (h) | | | 8,831 | | | | 8,831 | | |
HSBC U.S. Government Money Market Fund, I Shares, 1.46% (h) | | | 110,143 | | | | 110,143 | | |
JPMorgan Prime Money Market Fund, Capital Shares, 1.50% (h) | | | 70,417 | | | | 70,417 | | |
Morgan Stanley Institutional Liquidity Government Portfolio, Institutional Shares,
1.39% (h) | | | 46,960 | | | | 46,960 | | |
Morgan Stanley Institutional Liquidity Prime Portfolio, Institutional Shares,
1.53% (h) | | | 316,610 | | | | 316,610 | | |
Total Collateral for Securities Loaned (Cost $570,657) | | | 570,657 | | |
Total Investments (Cost $23,820,876) — 106.0% | | | 22,027,307 | | |
Liabilities in excess of other assets — (6.0)% | | | (1,247,444 | ) | |
NET ASSETS — 100.00% | | $ | 20,779,863 | | |
^ Purchased with cash collateral from securities on loan.
(a) All or a portion of this security has been segregated as collateral for derivative instruments, delayed delivered and/or when-issued securities.
See notes to financial statements.
16
Victory Portfolios
Victory INCORE Investment Quality Bond Fund | | Schedule of Portfolio Investments — continued
June 30, 2022 | |
(Unaudited)
(b) Rule 144A security or other security that is restricted as to resale to institutional investors. The Fund's Adviser has deemed this security to be liquid (unless otherwise noted as illiquid) based upon procedures approved by the Board of Trustees. As of June 30, 2022, the fair value of these securities was $2,837,131 and amounted to 13.7% of net assets.
(c) All or a portion of this security is on loan.
(d) Zero-coupon bond.
(e) Security is perpetual and has no final maturity date but may be subject to calls at various dates in the future.
(f) Variable or Floating-Rate Security. Rate disclosed is as of June 30, 2022.
(g) Security or a portion of the security purchased on a delayed-delivery and/or when-issued basis.
(h) Rate disclosed is the daily yield on June 30, 2022.
bps — Basis points
LIBOR — London Interbank Offered Rate
LIBOR01M — 1 Month US Dollar LIBOR, rate disclosed as of June 30, 2022, based on the last reset date of the security
LIBOR12M — 12 Month US Dollar LIBOR, rate disclosed as of June 30, 2022, based on the last reset date of the security
LLC — Limited Liability Company
LP — Limited Partnership
MTN — Medium Term Note
PLC — Public Limited Company
SOFR — Secured Overnight Financing Rate
Futures Contracts Purchased
| | | Number of
Contracts | | Expiration
Date | | Notional
Amount | | Value | | Unrealized
Appreciation
(Depreciation) | |
2-Year U.S. Treasury Note Futures | | | 2 | | | 9/30/22 | | $ | 421,585 | | | $ | 420,031 | | | $ | (1,554 | ) | |
5-Year U.S. Treasury Note Futures | | | 14 | | | 9/30/22 | | | 1,556,040 | | | | 1,571,500 | | | | 15,460 | | |
Euro FX Futures | | | 2 | | | 9/19/22 | | | 269,025 | | | | 263,450 | | | | (5,575 | ) | |
Mexican Peso Futures | | | 10 | | | 9/19/22 | | | 249,050 | | | | 244,800 | | | | (4,250 | ) | |
Ultra Long Term U.S. Treasury
Bond Futures | | | 6 | | | 9/21/22 | | | 950,459 | | | | 926,063 | | | | (24,396 | ) | |
| | | $ | (20,315 | ) | |
Futures Contracts Sold
| | | Number of
Contracts | | Expiration
Date | | Notional
Amount | | Value | | Unrealized
Appreciation
(Depreciation) | |
10-Year U.S. Treasury Note Futures | | | 11 | | | 9/21/22 | | $ | 1,317,126 | | | $ | 1,303,844 | | | $ | 13,282 | | |
Japanese Yen Futures | | | 5 | | | 9/19/22 | | | 475,000 | | | | 463,469 | | | | 11,531 | | |
Micro E-Mini S&P 500 Index Futures | | | 29 | | | 9/16/22 | | | 576,243 | | | | 549,478 | | | | 26,765 | | |
| | | $ | 51,578 | | |
Total unrealized appreciation | | $ | 67,038 | | |
Total unrealized depreciation | | | (35,775 | ) | |
Total net unrealized appreciation (depreciation) | | $ | 31,263 | | |
See notes to financial statements.
17
Victory Portfolios
Victory INCORE Low Duration Bond Fund | | Schedule of Portfolio Investments
June 30, 2022 | |
(Unaudited)
Security Description | | Principal
Amount | | Value | |
Asset-Backed Securities (6.9%) | |
AmeriCredit Automobile Receivables Trust, Series 2021-1, Class C, 0.89%,
10/19/26, Callable 6/18/24 @ 100 | | $ | 1,815,000 | | | $ | 1,699,611 | | |
CarMax Auto Owner Trust, Series 2020-4, Class B, 0.85%, 6/15/26,
Callable 8/15/24 @ 100 | | | 434,000 | | | | 405,548 | | |
GM Financial Automobile Leasing Trust, Series 2021-1, Class C, 0.70%, 2/20/25,
Callable 7/20/23 @ 100 | | | 1,168,000 | | | | 1,122,664 | | |
GM Financial Consumer Automobile Receivables Trust, Series 2021-2,
Class C, 1.28%, 1/19/27, Callable 12/16/24 @ 100 (a) | | | 886,000 | | | | 824,888 | | |
JPMorgan Chase Bank NA, Series 2021-2, Class B, 0.89%, 12/26/28,
Callable 3/25/25 @ 100 (b) | | | 681,441 | | | | 662,665 | | |
Santander Drive Auto Receivables Trust, Series 2021-1, Class C, 0.75%,
2/17/26, Callable 2/15/24 @ 100 | | | 1,144,000 | | | | 1,116,291 | | |
Santander Drive Auto Receivables Trust, Series 2021-2, Class C, 0.90%,
6/15/26, Callable 3/15/24 @ 100 | | | 1,125,000 | | | | 1,090,159 | | |
Santander Drive Auto Receivables Trust, Series 2021-3, Class C, 0.95%,
9/15/27, Callable 2/15/24 @ 100 | | | 915,000 | | | | 879,765 | | |
Santander Retail Auto Lease Trust, Series 2021-A, Class C, 1.14%,
3/20/26, Callable 4/20/24 @ 100 (a) (b) | | | 2,200,000 | | | | 2,085,899 | | |
United Auto Credit Securitization Trust, Series 2022-1, Class C, 2.61%,
6/10/27, Callable 6/10/25 @ 100 (a) (b) | | | 731,000 | | | | 706,131 | | |
Westlake Automobile Receivables Trust, Series 2021-1A, Class C, 0.95%,
3/16/26, Callable 6/15/24 @ 100 (a) (b) | | | 1,230,000 | | | | 1,183,416 | | |
Westlake Automobile Receivables Trust, Series 2021-2A, Class C, 0.89%,
7/15/26, Callable 9/15/24 @ 100 (a) (b) | | | 1,223,000 | | | | 1,157,743 | | |
Westlake Automobile Receivables Trust, Series 2022-1A, Class C, 3.11%,
3/15/27, Callable 8/15/25 @ 100 (a) (b) | | | 1,000,000 | | | | 976,606 | | |
Total Asset-Backed Securities (Cost $14,538,914) | | | 13,911,386 | | |
Collateralized Mortgage Obligations (11.3%) | |
Banc of America Commercial Mortgage Trust, Series 2015-UBS7,
Class A4, 3.71%, 9/15/48, Callable 9/15/25 @ 100 | | | 1,000,000 | | | | 981,627 | | |
CFCRE Commercial Mortgage Trust, Series 2016-C3, Class A3, 3.87%, 1/10/48,
Callable 12/10/25 @ 100 | | | 925,000 | | | | 911,952 | | |
CFCRE Commercial Mortgage Trust, Series 2016-C4, Class A2, 3.28%, 5/10/58 | | | 489,000 | | | | 471,992 | | |
CFCRE Commercial Mortgage Trust, Series 2016-C3, Class A2, 3.60%, 1/10/48,
Callable 11/10/25 @ 100 | | | 509,227 | | | | 495,610 | | |
Citigroup Commercial Mortgage Trust, Series 2015-GC33, Class A4, 3.78%,
9/10/58, Callable 9/10/25 @ 100 | | | 392,000 | | | | 388,460 | | |
Citigroup Commercial Mortgage Trust, Series 2015-P1, Class A5, 3.72%,
9/15/48, Callable 7/15/25 @ 100 (a) | | | 1,662,000 | | | | 1,638,570 | | |
Citigroup Commercial Mortgage Trust, Series 2015-GC29, Class A4, 3.19%,
4/10/48, Callable 4/10/25 @ 100 | | | 465,000 | | | | 452,127 | | |
COMM Mortgage Trust, Series 2015-CR25, Class A4, 3.76%, 8/10/48,
Callable 8/10/25 @ 100 (a) | | | 1,219,000 | | | | 1,200,027 | | |
CSAIL Commercial Mortgage Trust, Series 2015-C2, Class A4, 3.50%, 6/15/57,
Callable 4/15/25 @ 100 (a) | | | 667,000 | | | | 653,262 | | |
CSAIL Commercial Mortgage Trust, Series 2016-C6, Class A5, 3.09%, 1/15/49,
Callable 3/15/26 @ 100 | | | 696,000 | | | | 667,678 | | |
See notes to financial statements.
18
Victory Portfolios
Victory INCORE Low Duration Bond Fund | | Schedule of Portfolio Investments — continued
June 30, 2022 | |
(Unaudited)
Security Description | | Principal
Amount | | Value | |
CSAIL Commercial Mortgage Trust, Series 2015-C4, Class A4, 3.81%,
11/15/48 (a) | | $ | 539,000 | | | $ | 530,680 | | |
CSAIL Commercial Mortgage Trust, Series 2015-C3, Class A4, 3.72%,
8/15/48, Callable 7/15/25 @ 100 (a) | | | 1,280,899 | | | | 1,259,684 | | |
GS Mortgage Securities Trust, Series 2015-GC32, Class A4, 3.76%,
7/10/48, Callable 7/10/25 @ 100 | | | 848,000 | | | | 834,826 | | |
GS Mortgage Securities Trust, Series 2016-GS2, Class A4, 3.05%, 5/10/49,
Callable 2/10/26 @ 100 (a) | | | 778,000 | | | | 745,528 | | |
GS Mortgage Securities Trust, Series 2015-GC30, Class A4, 3.38%, 5/10/50,
Callable 5/10/25 @ 100 (a) | | | 504,000 | | | | 494,815 | | |
JPMBB Commercial Mortgage Securities Trust, Series 2016-C1, Class A5, 3.58%,
3/15/49, Callable 1/15/26 @ 100 | | | 1,321,000 | | | | 1,288,953 | | |
JPMBB Commercial Mortgage Securities Trust, Series 2015-C33,
Class A4, 3.77%, 12/15/48, Callable 11/15/25 @ 100 | | | 1,938,000 | | | | 1,907,082 | | |
JPMBB Commercial Mortgage Securities Trust, Series 2015-C31,
Class A3, 3.80%, 8/15/48, Callable 8/15/25 @ 100 (a) | | | 480,433 | | | | 474,085 | | |
JPMBB Commercial Mortgage Securities Trust, Series 2015-C28,
Class A4, 3.23%, 10/15/48, Callable 3/15/25 @ 100 (a) | | | 1,191,000 | | | | 1,162,600 | | |
Morgan Stanley Bank of America Merrill Lynch Trust, Series 2016-C29,
Class A4, 3.33%, 5/15/49, Callable 3/15/26 @ 100 | | | 2,018,000 | | | | 1,951,555 | | |
Wells Fargo Commercial Mortgage Trust, Series 2015-C29, Class A4, 3.64%,
6/15/48, Callable 6/15/25 @ 100 | | | 1,092,000 | | | | 1,074,809 | | |
Wells Fargo Commercial Mortgage Trust, Series 2015-C31, Class A4, 3.70%,
11/15/48, Callable 10/15/25 @ 100 | | | 1,593,000 | | | | 1,565,274 | | |
Wells Fargo Commercial Mortgage Trust, Series 2015-C28, Class A4, 3.54%,
5/15/48, Callable 4/15/25 @ 100 (a) | | | 732,000 | | | | 717,291 | | |
Wells Fargo Commercial Mortgage Trust, Series 2015-P2, Class A4, 3.81%,
12/15/48, Callable 11/15/25 @ 100 (a) | | | 532,000 | | | | 525,272 | | |
Wells Fargo Commercial Mortgage Trust, Series 2015-C30, Class A4, 3.66%,
9/15/58, Callable 7/15/25 @ 100 (a) | | | 573,000 | | | | 563,914 | | |
Total Collateralized Mortgage Obligations (Cost $23,719,525) | | | 22,957,673 | | |
Convertible Corporate Bonds (5.0%) | |
Consumer Discretionary (0.7%): | |
Booking Holdings, Inc., 0.75%, 5/1/25 (a) (c) | | | 525,000 | | | | 623,348 | | |
Expedia Group, Inc., 2/15/26 (a) (c) (d) | | | 590,000 | | | | 532,888 | | |
Ford Motor Co., 3/15/26 (d) | | | 290,000 | | | | 265,556 | | |
| | | | 1,421,792 | | |
Energy (0.6%): | |
Pioneer Natural Resources Co., 0.25%, 5/15/25 (a) | | | 565,000 | | | | 1,222,298 | | |
Financials (1.3%): | |
Ares Capital Corp., 4.63%, 3/1/24 (a) | | | 730,000 | | | | 761,872 | | |
Barclays Bank PLC
2/4/25 (a) (d) | | | 270,000 | | | | 367,165 | | |
2/18/25 (d) | | | 230,000 | | | | 240,764 | | |
JPMorgan Chase Financial Co. LLC, 0.25%, 5/1/23 (a) (b) | | | 800,000 | | | | 832,584 | | |
Sixth Street Specialty Lending, Inc., 4.50%, 8/1/22 | | | 300,000 | | | | 312,375 | | |
| | | | 2,514,760 | | |
See notes to financial statements.
19
Victory Portfolios
Victory INCORE Low Duration Bond Fund | | Schedule of Portfolio Investments — continued
June 30, 2022 | |
(Unaudited)
Security Description | | Shares or
Principal
Amount | | Value | |
Health Care (0.6%): | |
Anthem, Inc., 2.75%, 10/15/42 (a) | | $ | 110,000 | | | $ | 754,444 | | |
Illumina, Inc., 8/15/23 (a) (c) (d) | | | 530,000 | | | | 506,568 | | |
| | | | 1,261,012 | | |
Industrials (0.4%): | |
Southwest Airlines Co., 1.25%, 5/1/25 (a) | | | 710,000 | | | | 839,483 | | |
Information Technology (1.2%): | |
Akamai Technologies, Inc., 0.13%, 5/1/25 (a) (c) | | | 375,000 | | | | 411,218 | | |
Block, Inc., 0.25%, 11/1/27 | | | 195,000 | | | | 143,584 | | |
Euronet Worldwide, Inc., 0.75%, 3/15/49, Callable 3/20/25 @ 100 (a) (c) | | | 730,000 | | | | 748,980 | | |
Vishay Intertechnology, Inc., 2.25%, 6/15/25 | | | 225,000 | | | | 213,181 | | |
Western Digital Corp., 1.50%, 2/1/24 (a) | | | 995,000 | | | | 946,225 | | |
| | | | 2,463,188 | | |
Real Estate (0.2%): | |
Kite Realty Group LP, 0.75%, 4/1/27 (a) (b) | | | 435,000 | | | | 392,257 | | |
Total Convertible Corporate Bonds (Cost $9,772,984) | | | 10,114,790 | | |
Convertible Preferred Stocks (2.3%) | |
Financials (0.9%): | |
Bank of America Corp., Series L, 7.25% (a) (e) | | | 655 | | | | 788,947 | | |
KKR & Co., Inc., Series C, 9/15/23, 6.00% (a) | | | 6,495 | | | | 379,763 | | |
Wells Fargo & Co., Series L, 7.50% (a) (e) | | | 550 | | | | 668,530 | | |
| | | | 1,837,240 | | |
Health Care (0.1%): | |
Danaher Corp., Series B, 4/15/23, 5.00% | | | 146 | | | | 193,189 | | |
Industrials (0.2%): | |
Stanley Black & Decker, Inc., 11/15/22, 5.25% (a) | | | 6,815 | | | | 459,263 | | |
Utilities (1.1%): | |
American Electric Power Co., Inc., 8/15/23, 6.13% | | | 3,530 | | | | 191,608 | | |
CenterPoint Energy, Inc., 9/15/29, 4.57% | | | 3,880 | | | | 179,528 | | |
DTE Energy Co., 11/1/22, 6.25% (a) | | | 10,175 | | | | 523,198 | | |
NextEra Energy, Inc., 3/1/23, 5.28% (a) | | | 14,070 | | | | 698,576 | | |
NiSource, Inc., 3/1/24, 7.75% | | | 1,710 | | | | 194,461 | | |
The Southern Co., Series 2019, 8/1/22, 6.75% (a) | | | 8,901 | | | | 471,575 | | |
| | | | 2,258,946 | | |
Total Convertible Preferred Stocks (Cost $5,298,410) | | | 4,748,638 | | |
Corporate Bonds (36.0%) | |
Communication Services (1.3%): | |
CenturyLink, Inc., 6.75%, 12/1/23 | | $ | 424,000 | | | | 420,909 | | |
Charter Communications Operating LLC/Charter Communications Operating
Capital, 4.50%, 2/1/24, Callable 1/1/24 @ 100 | | | 496,000 | | | | 499,066 | | |
Fox Corp., 4.03%, 1/25/24, Callable 12/25/23 @ 100 | | | 1,388,000 | | | | 1,387,972 | | |
Verizon Communications, Inc., 3.38%, 2/15/25 (a) | | | 354,000 | | | | 351,759 | | |
| | | | 2,659,706 | | |
See notes to financial statements.
20
Victory Portfolios
Victory INCORE Low Duration Bond Fund | | Schedule of Portfolio Investments — continued
June 30, 2022 | |
(Unaudited)
Security Description | | Principal
Amount | | Value | |
Consumer Discretionary (2.7%): | |
D.R. Horton, Inc., 4.75%, 2/15/23, Callable 11/15/22 @ 100 (a) | | $ | 3,027,000 | | | $ | 3,051,821 | | |
General Motors Co., 4.88%, 10/2/23 (a) | | | 1,297,000 | | | | 1,309,296 | | |
Kohl's Corp., 4.25%, 7/17/25, Callable 4/17/25 @ 100 | | | 1,194,000 | | | | 1,176,162 | | |
| | | | 5,537,279 | | |
Consumer Staples (1.4%): | |
7-Eleven, Inc., 0.80%, 2/10/24, Callable 8/8/22 @ 100 (a) (b) | | | 1,372,000 | | | | 1,302,947 | | |
Altria Group, Inc., 4.40%, 2/14/26, Callable 12/14/25 @ 100 (a) | | | 322,000 | | | | 315,225 | | |
Tyson Foods, Inc., 3.95%, 8/15/24, Callable 5/15/24 @ 100 | | | 1,170,000 | | | | 1,166,853 | | |
| | | | 2,785,025 | | |
Energy (2.5%): | |
Boardwalk Pipelines LP, 3.38%, 2/1/23, Callable 11/1/22 @ 100 | | | 400,000 | | | | 398,868 | | |
Continental Resources, Inc.
4.50%, 4/15/23, Callable 1/15/23 @ 100 (a) | | | 801,000 | | | | 803,860 | | |
2.27%, 11/15/26, Callable 11/15/23 @ 100 (a) (b) | | | 797,000 | | | | 707,058 | | |
HollyFrontier Corp., 2.63%, 10/1/23 (a) | | | 971,000 | | | | 943,695 | | |
Pioneer Natural Resources Co., 0.55%, 5/15/23 | | | 1,130,000 | | | | 1,100,982 | | |
Plains All American Pipeline LP/PAA Finance Corp., 2.85%, 1/31/23,
Callable 10/31/22 @ 100 (a) | | | 1,010,000 | | | | 1,004,051 | | |
| | | | 4,958,514 | | |
Financials (12.3%): | |
Bank of America Corp.
4.20%, 8/26/24 (a) | | | 1,660,000 | | | | 1,663,685 | | |
1.53% (SOFR+65bps), 12/6/25, Callable 12/6/24 @ 100, MTN (f) | | | 1,350,000 | | | | 1,256,269 | | |
Capital One Financial Corp.
3.30%, 10/30/24, Callable 9/30/24 @ 100 (a) | | | 684,000 | | | | 668,234 | | |
1.34% (SOFR+69bps), 12/6/24, Callable 12/6/23 @ 100 (f) | | | 1,695,000 | | | | 1,623,708 | | |
2.64% (SOFR+129bps), 3/3/26, Callable 3/3/25 @ 100 (f) | | | 2,052,000 | | | | 1,937,704 | | |
Citigroup, Inc., 3.11% (SOFR+284bps), 4/8/26, Callable 4/8/25 @ 100 (f) | | | 2,772,000 | | | | 2,665,444 | | |
Dana Financing Luxembourg Sarl, 5.75%, 4/15/25,
Callable 8/8/22 @ 101.44 (a) (b) | | | 772,000 | | | | 742,208 | | |
Fifth Third Bancorp
1.63%, 5/5/23, Callable 4/5/23 @ 100 | | | 1,660,000 | | | | 1,635,847 | | |
3.65%, 1/25/24, Callable 12/25/23 @ 100 (a) | | | 799,000 | | | | 795,788 | | |
General Motors Financial Co., Inc., 5.10%, 1/17/24, Callable 12/17/23 @ 100 | | | 1,549,000 | | | | 1,564,444 | | |
Harley-Davidson Financial Services, Inc., 3.35%, 2/15/23, Callable
1/15/23 @ 100 (b) | | | 1,488,000 | | | | 1,484,756 | | |
JPMorgan Chase & Co.
2.30% (SOFR+116bps), 10/15/25, Callable 10/15/24 @ 100 (f) | | | 3,000,000 | | | | 2,859,390 | | |
2.60% (SOFR+92bps), 2/24/26, Callable 2/24/25 @ 100 (f) | | | 933,000 | | | | 888,253 | | |
Morgan Stanley, 0.53% (SOFR+46bps), 1/25/24, Callable 1/25/23 @ 100 (f) | | | 2,575,000 | | | | 2,526,204 | | |
Wells Fargo & Co.
0.81% (SOFR+51bps), 5/19/25, Callable 5/19/24 @ 100, MTN (f) | | | 585,000 | | | | 547,730 | | |
2.41% (SOFR+109bps), 10/30/25, Callable 10/30/24 @ 100, MTN (c) (f) | | | 2,077,000 | | | | 1,980,586 | | |
| | | | 24,840,250 | | |
See notes to financial statements.
21
Victory Portfolios
Victory INCORE Low Duration Bond Fund | | Schedule of Portfolio Investments — continued
June 30, 2022 | |
(Unaudited)
Security Description | | Principal
Amount | | Value | |
Health Care (4.1%): | |
Biogen, Inc., 3.63%, 9/15/22 | | $ | 1,025,000 | | | $ | 1,028,106 | | |
Centene Corp., 4.25%, 12/15/27, Callable 12/15/22 @ 102.13 (a) | | | 621,000 | | | | 579,865 | | |
HCA, Inc., 5.00%, 3/15/24 | | | 2,479,000 | | | | 2,487,552 | | |
Humana, Inc., 2.90%, 12/15/22, Callable 11/15/22 @ 100 (a) | | | 560,000 | | | | 559,306 | | |
Mylan, Inc., 3.13%, 1/15/23 (b) | | | 2,479,000 | | | | 2,464,498 | | |
Universal Health Services, Inc., 1.65%, 9/1/26, Callable 8/1/26 @ 100 (a) (b) | | | 1,387,000 | | | | 1,201,641 | | |
| | | | 8,320,968 | | |
Industrials (3.0%): | |
Air Lease Corp., 0.70%, 2/15/24, Callable 1/15/24 @ 100, MTN (a) | | | 2,480,000 | | | | 2,342,410 | | |
Delta Air Lines, Inc., 3.80%, 4/19/23, Callable 3/19/23 @ 100 (a) | | | 1,115,000 | | | | 1,109,615 | | |
EnPro Industries, Inc., 5.75%, 10/15/26, Callable 8/8/22 @ 104.31 (a) | | | 725,000 | | | | 706,389 | | |
Southwest Airlines Co., 4.75%, 5/4/23 | | | 1,937,000 | | | | 1,950,152 | | |
| | | | 6,108,566 | | |
Information Technology (3.1%): | |
Broadcom Corp./Broadcom Cayman Finance Ltd., 3.63%, 1/15/24,
Callable 11/15/23 @ 100 (a) | | | 2,175,000 | | | | 2,172,803 | | |
Cadence Design Systems, Inc., 4.38%, 10/15/24, Callable 7/15/24 @ 100 (a) | | | 1,173,000 | | | | 1,185,082 | | |
KLA Corp., 4.65%, 11/1/24, Callable 8/1/24 @ 100 | | | 496,000 | | | | 502,155 | | |
Marvell Technology Group Ltd., 4.20%, 6/22/23, Callable 5/22/23 @ 100 | | | 941,000 | | | | 941,640 | | |
NCR Corp., 5.00%, 10/1/28, Callable 10/1/23 @ 102.5 (b) | | | 642,000 | | | | 546,862 | | |
Seagate HDD Cayman, 4.88%, 3/1/24, Callable 1/1/24 @ 100 | | | 1,000,000 | | | | 990,360 | | |
| | | | 6,338,902 | | |
Materials (1.4%): | |
Celanese US Holdings LLC, 4.63%, 11/15/22 (a) | | | 855,000 | | | | 858,300 | | |
Southern Copper Corp., 3.88%, 4/23/25 | | | 2,050,000 | | | | 2,027,491 | | |
| | | | 2,885,791 | | |
Real Estate (3.1%): | |
American Tower Corp., 3.00%, 6/15/23 (a) | | | 1,000,000 | | | | 989,550 | | |
Brandywine Operating Partnership LP, 3.95%, 2/15/23, Callable 11/15/22 @ 100 | | | 750,000 | | | | 747,600 | | |
Iron Mountain, Inc., 5.25%, 7/15/30, Callable 7/15/25 @ 102.63 (b) | | | 638,000 | | | | 555,353 | | |
Piedmont Operating Partnership LP, 3.40%, 6/1/23, Callable 3/1/23 @ 100 (a) | | | 1,629,000 | | | | 1,619,959 | | |
Post Apartment Homes LP, 3.38%, 12/1/22, Callable 9/1/22 @ 100 | | | 250,000 | | | | 249,848 | | |
Regency Centers, LP, 3.90%, 11/1/25, Callable 8/1/25 @ 100 | | | 1,194,000 | | | | 1,176,460 | | |
Weingarten Realty Investors
3.38%, 10/15/22, Callable 8/8/22 @ 100 (a) | | | 365,000 | | | | 365,117 | | |
3.50%, 4/15/23, Callable 1/15/23 @ 100 | | | 497,000 | | | | 495,703 | | |
| | | | 6,199,590 | | |
Utilities (1.1%): | |
Ameren Corp., 2.50%, 9/15/24, Callable 8/15/24 @ 100 | | | 588,000 | | | | 570,342 | | |
Exelon Corp., 3.95%, 6/15/25, Callable 3/15/25 @ 100 (a) | | | 591,000 | | | | 589,381 | | |
NextEra Energy Capital Holdings, Inc., 0.65%, 3/1/23 | | | 1,129,000 | | | | 1,109,604 | | |
| | | | 2,269,327 | | |
Total Corporate Bonds (Cost $76,103,018) | | | 72,903,918 | | |
See notes to financial statements.
22
Victory Portfolios
Victory INCORE Low Duration Bond Fund | | Schedule of Portfolio Investments — continued
June 30, 2022 | |
(Unaudited)
Security Description | | Principal
Amount | | Value | |
Residential Mortgage-Backed Securities (0.9%) | |
GSR Mortgage Loan Trust, Series 2004-15F, Class 5A1, 5.50%, 10/25/20,
Callable 9/25/28 @ 100 (a) | | $ | 15,386 | | | $ | 14,558 | | |
JPMorgan Mortgage Trust, Series 2014-5, Class A11, 2.84%, 10/25/29,
Callable 8/25/23 @ 100 (a) (b) (g) | | | 1,342,035 | | | | 1,334,101 | | |
JPMorgan Mortgage Trust, Series 2017-3, Class 2A2, 2.50%, 8/25/47,
Callable 7/25/24 @ 100 (a) (b) (g) | | | 645,477 | | | | 573,625 | | |
Total Residential Mortgage-Backed Securities (Cost $2,008,032) | | | 1,922,284 | | |
Yankee Dollars (9.2%) | |
Communication Services (0.3%): | |
SES SA, 3.60%, 4/4/23 (b) | | | 503,000 | | | | 500,374 | | |
Consumer Discretionary (1.0%): | |
Stellantis NV, 5.25%, 4/15/23 (c) | | | 2,048,000 | | | | 2,060,902 | | |
Consumer Staples (2.8%): | |
Barry Callebaut Services NV, 5.50%, 6/15/23 (b) | | | 2,346,000 | | | | 2,357,378 | | |
Kerry Group Financial Services Unlimited Co., 3.20%, 4/9/23,
Callable 1/9/23 @ 100 (a) (b) | | | 2,391,000 | | | | 2,384,066 | | |
Pernod Ricard SA, 4.25%, 7/15/22 (a) (b) | | | 833,000 | | | | 833,383 | | |
| | | | 5,574,827 | | |
Energy (1.6%): | |
Canadian Natural Resources Ltd.
2.95%, 1/15/23, Callable 12/15/22 @ 100 | | | 1,305,000 | | | | 1,300,850 | | |
3.80%, 4/15/24, Callable 1/15/24 @ 100 | | | 1,180,000 | | | | 1,172,094 | | |
Ecopetrol SA, 5.88%, 9/18/23 (a) | | | 846,000 | | | | 845,662 | | |
| | | | 3,318,606 | | |
Financials (1.1%): | |
HSBC Holdings PLC, 1.16% (SOFR+58bps), 11/22/24, Callable 11/22/23 @ 100 (f) | | | 1,000,000 | | | | 955,650 | | |
The Toronto-Dominion Bank, 2.35%, 3/8/24 | | | 1,359,000 | | | | 1,331,100 | | |
| | | | 2,286,750 | | |
Industrials (0.7%): | |
AerCap Ireland Capital DAC/AerCap Global Aviation Trust, 1.75%, 1/30/26,
Callable 12/30/25 @ 100 | | | 1,100,000 | | | | 959,112 | | |
Sensata Technologies BV, 4.00%, 4/15/29, Callable 4/15/24 @ 102 (b) | | | 606,000 | | | | 515,379 | | |
| | | | 1,474,491 | | |
Materials (1.4%): | |
Anglo American Capital PLC, 3.63%, 9/11/24 (b) | | | 2,880,000 | | | | 2,826,979 | | |
Utilities (0.3%): | |
Enel Generacion Chile SA, 4.25%, 4/15/24, Callable 1/15/24 @ 100 (c) | | | 655,000 | | | | 642,752 | | |
Total Yankee Dollars (Cost $19,528,086) | | | 18,685,681 | | |
See notes to financial statements.
23
Victory Portfolios
Victory INCORE Low Duration Bond Fund | | Schedule of Portfolio Investments — continued
June 30, 2022 | |
(Unaudited)
Security Description | | Shares or
Principal
Amount | | Value | |
U.S. Government Mortgage-Backed Agencies (3.6%) | |
Federal Home Loan Mortgage Corp.
5.00%, 6/15/23 – 8/1/40 (a) | | $ | 416,814 | | | $ | 439,536 | | |
5.50%, 10/25/23 (a) | | | 982 | | | | 986 | | |
7.00%, 9/1/38 (a) | | | 2,268 | | | | 2,513 | | |
Series 4320, Class AP, 3.50%, 7/15/39 (a) | | | 667,579 | | | | 670,889 | | |
Series 3713, Class PA, 2.00%, 2/15/40 – 3/15/40 (a) | | | 1,738,297 | | | | 1,709,319 | | |
Series 4444, Class CH, 3.00%, 1/15/41 (a) | | | 195,565 | | | | 195,247 | | |
Series 4049, Class AB, 2.75%, 12/15/41 (a) | | | 15,509 | | | | 15,500 | | |
| | | | 3,033,990 | | |
Federal National Mortgage Association
6.00%, 2/1/37 (a) | | | 723,978 | | | | 790,338 | | |
Series 2013-33, Class UD, 2.50%, 4/25/39 (a) | | | 210,368 | | | | 208,947 | | |
Series 2011-21, Class PA, 4.50%, 5/25/40 (a) | | | 1,450,807 | | | | 1,471,315 | | |
5.00%, 2/1/41 – 10/1/41 (a) | | | 1,616,284 | | | | 1,703,369 | | |
| | | | 4,173,969 | | |
Total U.S. Government Mortgage-Backed Agencies (Cost $7,420,031) | | | 7,207,959 | | |
U.S. Treasury Obligations (20.1%) | |
U.S. Treasury Notes
2.25%, 3/31/24 | | | 23,000,000 | | | | 22,710,703 | | |
0.75%, 11/15/24 (a) | | | 11,579,000 | | | | 10,976,530 | | |
2.75%, 5/15/25 | | | 7,000,000 | | | | 6,946,407 | | |
Total U.S. Treasury Obligations (Cost $41,232,522) | | | 40,633,640 | | |
Collateral for Securities Loaned (1.5%)^ | |
BlackRock Liquidity Funds TempFund, Institutional Shares, 1.47% (h) | | | 94,068 | | | | 94,068 | | |
Goldman Sachs Financial Square Prime Obligations Fund, Institutional Shares,
1.42% (h) | | | 46,945 | | | | 46,945 | | |
HSBC U.S. Government Money Market Fund, I Shares, 1.46% (h) | | | 585,495 | | | | 585,495 | | |
JPMorgan Prime Money Market Fund, Capital Shares, 1.50% (h) | | | 374,322 | | | | 374,322 | | |
Morgan Stanley Institutional Liquidity Government Portfolio, Institutional
Shares, 1.39% (h) | | | 249,631 | | | | 249,631 | | |
Morgan Stanley Institutional Liquidity Prime Portfolio, Institutional Shares,
1.53% (h) | | | 1,683,026 | | | | 1,683,026 | | |
Total Collateral for Securities Loaned (Cost $3,033,487) | | | 3,033,487 | | |
Total Investments (Cost $202,655,009) — 96.8% | | | 196,119,456 | | |
Other assets in excess of liabilities — 3.2% | | | 6,552,107 | | |
NET ASSETS — 100.00% | | $ | 202,671,563 | | |
^ Purchased with cash collateral from securities on loan.
(a) All or a portion of this security has been segregated as collateral for derivative instruments.
See notes to financial statements.
24
Victory Portfolios
Victory INCORE Low Duration Bond Fund | | Schedule of Portfolio Investments — continued
June 30, 2022 | |
(Unaudited)
(b) Rule 144A security or other security that is restricted as to resale to institutional investors. The Fund's Adviser has deemed this security to be liquid (unless otherwise noted as illiquid) based upon procedures approved by the Board of Trustees. As of June 30, 2022, the fair value of these securities was $28,327,909 and amounted to 14.0% of net assets.
(c) All or a portion of this security is on loan.
(d) Zero-coupon bond.
(e) Security is perpetual and has no final maturity date but may be subject to calls at various dates in the future.
(f) Variable or Floating-Rate Security. Rate disclosed is as of June 30, 2022.
(g) The rate for certain asset-backed and mortgage-backed securities may vary based on factors relating to the pool of assets underlying the security. The rate disclosed is the rate in effect at June 30, 2022.
(h) Rate disclosed is the daily yield on June 30, 2022.
bps — Basis points
LLC — Limited Liability Company
LP — Limited Partnership
MTN — Medium Term Note
PLC — Public Limited Company
SOFR — Secured Overnight Financing Rate
Futures Contracts Purchased
| | | Number of
Contracts | | Expiration
Date | | Notional
Amount | | Value | | Unrealized
Appreciation
(Depreciation) | |
2-Year U.S. Treasury Note Futures | | | 116 | | | 9/30/22 | | $ | 24,451,928 | | | $ | 24,361,812 | | | $ | (90,116 | ) | |
Euro FX Futures | | | 21 | | | 9/19/22 | | | 2,827,300 | | | | 2,766,225 | | | | (61,075 | ) | |
Mexican Peso Futures | | | 98 | | | 9/19/22 | | | 2,440,302 | | | | 2,399,040 | | | | (41,262 | ) | |
| | | $ | (192,453 | ) | |
Futures Contracts Sold
| | | Number of
Contracts | | Expiration
Date | | Notional
Amount | | Value | | Unrealized
Appreciation
(Depreciation) | |
10-Year U.S. Treasury Note Futures | | | 22 | | | 9/21/22 | | $ | 2,634,252 | | | $ | 2,607,688 | | | $ | 26,564 | | |
5-Year U.S. Treasury Note Futures | | | 78 | | | 9/30/22 | | | 8,810,073 | | | | 8,755,500 | | | | 54,573 | | |
Japanese Yen Futures | | | 48 | | | 9/19/22 | | | 4,559,999 | | | | 4,449,300 | | | | 110,699 | | |
Micro E-Mini S&P 500 Index Futures | | | 130 | | | 9/16/22 | | | 2,549,057 | | | | 2,463,175 | | | | 85,882 | | |
Ultra Long Term U.S. Treasury
Bond Futures | | | 4 | | | 9/21/22 | | | 633,611 | | | | 617,375 | | | | 16,236 | | |
| | | $ | 293,954 | | |
Total unrealized appreciation | | $ | 293,954 | | |
Total unrealized depreciation | | | (192,453 | ) | |
Total net unrealized appreciation (depreciation) | | $ | 101,501 | | |
See notes to financial statements.
25
Victory Portfolios
Victory INCORE Low Duration Bond Fund | | Schedule of Portfolio Investments — continued
June 30, 2022 | |
(Unaudited)
Credit Default Swap Agreements — Sell Protection (a)
Underlying
Instruments | | Fixed
Deal
Receive
Rate | | Maturity
Date | | Payment
Frequency | | Implied
Credit
Spread at
June 30,
2022 (b) | | Notional
Amount (c) | | Value | | Premiums
Paid
(Received) | | Unrealized
Appreciation
(Depreciation) | |
CDX North
America High
Yield Index;
Series 38 | | | 5.00 | % | | 6/20/27 | | Quarterly | | | 5.76 | % | | $ | 7,920,000 | | | $ | (235,751 | ) | | $ | 306,813 | | | $ | (542,564 | ) | |
| | | $ | (235,751 | ) | | $ | 306,813 | | | $ | (542,564 | ) | |
(a) When a credit event occurs as defined under the terms of the swap agreement, the Fund as a seller of credit protection will either (i) pay to the buyer of protection an amount equal to the par value of the defaulted reference entity or (ii) pay a net amount equal to the par value of the defaulted reference entity less its recovery value.
(b) Implied credit spread, represented in absolute terms, utilized in determining the value of the credit default swap agreements as of period end will serve as an indicator of the current status of the payment/performance risk and represent the likelihood or risk of default for the credit derivative. The implied credit spread of a referenced entity reflects the cost of buying/selling protection and may include payments required to be made to enter into the agreement. Generally, wider credit spreads represent a perceived deterioration of the referenced entity's credit soundness and a greater likelihood or risk of default or other credit event occurring as defined under the terms of the swap agreement.
(c) The notional amount represents the maximum potential amount the Fund could be required to pay as a seller of credit protection if a credit event occurs, as defined under the terms of the swap agreement, for each security included in the CDX North America High Yield Index.
See notes to financial statements.
26
Victory Portfolios
Victory High Yield Fund | | Schedule of Portfolio Investments
June 30, 2022 | |
(Unaudited)
Security Description | | Shares or
Principal
Amount | | Value | |
Common Stocks (0.6%) | |
Communication Services (0.5%): | |
Altice USA, Inc., Class A (a) | | | 38,825 | | | $ | 359,131 | | |
iHeartMedia, Inc., Class A (a) | | | 30,500 | | | | 240,645 | | |
Nexstar Media Group, Inc., Class A | | | 1,481 | | | | 241,225 | | |
Sinclair Broadcast Group, Inc., Class A | | | 17,500 | | | | 357,000 | | |
| | | | 1,198,001 | | |
Consumer Discretionary (0.0%): (b) | |
Men's Wearhouse, Inc. | | | 31,563 | | | | 59,591 | | |
Health Care (0.1%): | |
Surgery Partners, Inc. (a) | | | 9,390 | | | | 271,559 | | |
Total Common Stocks (Cost $2,143,123) | | | 1,529,151 | | |
Senior Secured Loans (20.0%) | |
19th Holdings Golf LLC, Initial Term Loans, First Lien, 4.49%
(SOFR01M+325bps), 1/27/29 (c) | | $ | 2,250,000 | | | | 2,126,250 | | |
Air Canada, Term Loan, First Lien, 4.25%
(LIBOR06M+350bps), 7/27/28 (c) | | | 2,200,000 | | | | 2,018,500 | | |
Air Methods Corp., Initial Term Loans, First Lien, 4.51%
(LIBOR03M+350bps), 4/21/24 (c) | | | 1,948,718 | | | | 1,722,783 | | |
Bausch Health Cos., Inc., Second Amendment Term Loan, First Lien, 6.45%
(SOFR01M+525bps), 1/27/27 (c) | | | 3,000,000 | | | | 2,564,670 | | |
Covis Pharma Holdings S.a.r.l., Dollar Term B Loans, First Lien, 7.30%
(SOFR03M+650bps), 2/14/27 (c) | | | 2,715,625 | | | | 2,253,969 | | |
CP Altas Buyer, Inc., Term B Loans, First Lien, 4.81%
(LIBOR01M+375bps), 11/23/27 (c) | | | 1,985,319 | | | | 1,737,988 | | |
Dayco Products LLC, Term Loans, First Lien, 5.82%
(LIBOR03M+425bps), 5/19/24 (c) | | | 950,000 | | | | 859,408 | | |
Diamond Sports Group LLC, Term Loan, First Lien, 9.18%
(SOFR01M+800bps), 5/25/26 (c) | | | 522,314 | | | | 518,830 | | |
Diamond Sports Group LLC, Term Loan, Second Lien, 4.43%
(SOFR01M+325bps), 8/24/26 (c) | | | 7,039,625 | | | | 1,642,556 | | |
Envision Healthcare Corp., Initial Term Loans, First Lien, 4.81%
(LIBOR01M+375bps), 10/10/25 (c) | | | 3,105,538 | | | | 1,021,722 | | |
Great Outdoors Group LLC, Term B1, First Lien, 4.81%
(LIBOR01M+375bps), 3/5/28 (c) | | | 3,600,294 | | | | 3,272,667 | | |
Intelsat Jackson Holdings SA, Term B loan, First Lien, 4.67%
(SOFR06M+425bps), 2/1/29 (c) | | | 3,088,484 | | | | 2,825,407 | | |
Jo-Ann Stores LLC, Term B-1 Loan, First Lien, 5.96%
(LIBOR03M+475bps), 6/30/28 (c) | | | 1,574,568 | | | | 1,094,324 | | |
Knight Health Holdings LLC, Term B Loans, First Lien, 6.31%
(LIBOR01M+525bps), 12/17/28 (c) | | | 3,980,000 | | | | 3,263,600 | | |
Life Time, Inc., 2021 Refinancing Term Loan, First Lien, 6.32%
(LIBOR03M+475bps), 12/15/24 (c) | | | 805,183 | | | | 793,105 | | |
LifeScan Global Corp., Initial Term Loan, First Lien, 6.96%
(LIBOR03M+600bps), 10/1/24 (c) | | | 3,815,758 | | | | 3,313,337 | | |
Lucid Energy Group II Borrower LLC, Term Loan, First Lien, 5.87%
(LIBOR01M+425bps), 11/24/28 (c) | | | 4,477,500 | | | | 4,411,949 | | |
See notes to financial statements.
27
Victory Portfolios
Victory High Yield Fund | | Schedule of Portfolio Investments — continued
June 30, 2022 | |
(Unaudited)
Security Description | | Principal
Amount | | Value | |
Petco Health and Wellness Co., Inc., Initial Term Loans, First Lien, 4.26%
(LIBOR03M+325bps), 2/25/28 (c) | | $ | 4,446,231 | | | $ | 4,181,547 | | |
PetSmart, Inc., Initial Term Loans, First Lien, 4.50%
(LIBOR06M+375bps), 2/12/28 (c) | | | 1,662,438 | | | | 1,560,197 | | |
Radiology Partners, Inc., Term Loan New, First Lien, 5.89%
(LIBOR01M+425bps), 7/9/25 (c) | | | 2,000,000 | | | | 1,787,000 | | |
SWF Holdings Corp. I, Initial Term Loans, First Lien, 5.60%
(LIBOR01M+400bps), 10/6/28 (c) | | | 2,339,125 | | | | 1,915,159 | | |
Team Health Holdings, Inc., Facility Extending TLB, First Lien, 6.28%
(SOFR01M+525bps), 2/17/27 (c) | | | 2,296,540 | | | | 1,920,482 | | |
The Men's Wearhouse LLC, Term Loan, First Lien, 9.29%
(LIBOR03M+800bps), 12/1/25 (c) | | | 1,697,574 | | | | 1,614,817 | | |
The Michaels Cos., Inc., Term B Loans, First Lien, 5.26%
(LIBOR03M+425bps), 4/15/28 (c) | | | 3,963,722 | | | | 3,254,652 | | |
Traverse Midstream Partners LLC, Advance, First Lien, 5.38%
(SOFR03M+425bps), 9/27/24 (c) | | | 43,514 | | | | 41,411 | | |
Traverse Midstream Partners LLC, Advance, First Lien, 5.95%
(SOFR06M+425bps) (c) | | | 1,853,117 | | | | 1,763,556 | | |
United Airlines, Inc., Class B Term Loans, First Lien, 5.39%
(LIBOR01M+375bps), 4/21/28 (c) | | | 1,481,250 | | | | 1,372,941 | | |
Total Senior Secured Loans (Cost $62,461,566) | | | 54,852,827 | | |
Corporate Bonds (67.3%) | |
Communication Services (13.0%): | |
Audacy Capital Corp., 6.50%, 5/1/27, Callable 7/22/22 @ 104.88 (d) (e) | | | 3,500,000 | | | | 2,126,705 | | |
Cinemark USA, Inc., 5.25%, 7/15/28, Callable 7/15/24 @ 102.63 (e) | | | 2,000,000 | | | | 1,605,540 | | |
CSC Holdings LLC, 5.75%, 1/15/30, Callable 1/15/25 @ 102.88 (e) | | | 5,500,000 | | | | 4,001,360 | | |
Cumulus Media New Holdings, Inc., 6.75%, 7/1/26,
Callable 8/8/22 @ 103.38 (d) (e) | | | 4,960,000 | | | | 4,571,235 | | |
Entercom Media Corp., 6.75%, 3/31/29, Callable 3/31/24 @ 103.38 (e) | | | 4,200,000 | | | | 2,245,404 | | |
Frontier Communications Holdings LLC, 5.00%, 5/1/28,
Callable 5/1/24 @ 102.5 (e) | | | 3,250,000 | | | | 2,777,288 | | |
Gray Television, Inc., 4.75%, 10/15/30, Callable 10/15/25 @ 102.38 (e) | | | 2,750,000 | | | | 2,152,672 | | |
iHeartCommunications, Inc., 8.38%, 5/1/27, Callable 7/22/22 @ 104.19 (d) | | | 4,510,000 | | | | 3,603,941 | | |
Nexstar Broadcasting, Inc., 5.63%, 7/15/27, Callable 7/18/22 @ 104.22 (e) | | | 4,000,000 | | | | 3,693,000 | | |
Scripps Escrow II, Inc., 5.38%, 1/15/31, Callable 1/15/26 @ 102.69 (d) (e) | | | 1,600,000 | | | | 1,277,376 | | |
Sinclair Television Group, Inc., 5.50%, 3/1/30, Callable 12/1/24 @ 102.75 (e) | | | 3,500,000 | | | | 2,590,245 | | |
TEGNA, Inc., 5.00%, 9/15/29, Callable 9/15/24 @ 102.5 | | | 3,000,000 | | | | 2,837,130 | | |
Univision Communications, Inc., 5.13%, 2/15/25, Callable 7/18/22 @ 100.85 (e) | | | 2,500,000 | | | | 2,358,100 | | |
| | | | 35,839,996 | | |
Consumer Discretionary (12.8%): | |
Academy Ltd., 6.00%, 11/15/27, Callable 11/15/23 @ 103 (e) | | | 1,800,000 | | | | 1,643,994 | | |
Affinity Gaming, 6.88%, 12/15/27, Callable 12/1/23 @ 103.44 (e) | | | 4,750,000 | | | | 3,993,848 | | |
American Axle & Manufacturing, Inc., 5.00%, 10/1/29,
Callable 10/1/24 @ 102.5 (d) | | | 4,100,000 | | | | 3,283,690 | | |
Beazer Homes USA, Inc., 5.88%, 10/15/27, Callable 10/15/22 @ 102.94 | | | 2,000,000 | | | | 1,580,200 | | |
Clarios Global LP/Clarios US Finance Co., 8.50%, 5/15/27,
Callable 8/8/22 @ 104.25 (e) | | | 4,000,000 | | | | 3,869,240 | | |
LBM Acquisition LLC, 6.25%, 1/15/29, Callable 1/15/24 @ 103.13 (e) | | | 2,050,000 | | | | 1,310,770 | | |
See notes to financial statements.
28
Victory Portfolios
Victory High Yield Fund | | Schedule of Portfolio Investments — continued
June 30, 2022 | |
(Unaudited)
Security Description | | Principal
Amount | | Value | |
Life Time, Inc., 5.75%, 1/15/26, Callable 1/15/23 @ 102.88 (e) | | $ | 4,000,000 | | | $ | 3,594,680 | | |
Magic Mergeco, Inc., 7.88%, 5/1/29, Callable 5/1/24 @ 103.94 (e) | | | 550,000 | | | | 364,188 | | |
MGM Resorts International, 5.50%, 4/15/27, Callable 1/15/27 @ 100 | | | 2,475,000 | | | | 2,233,687 | | |
MIWD Holdco II LLC/MIWD Finance Corp., 5.50%, 2/1/30,
Callable 2/1/25 @ 102.75 (e) | | | 900,000 | | | | 745,182 | | |
PetSmart, Inc./PetSmart Finance Corp., 7.75%, 2/15/29,
Callable 2/15/24 @ 103.88 (e) | | | 3,600,000 | | | | 3,247,884 | | |
Premier Entertainment Sub LLC/Premier Entertainment Finance Corp.
5.63%, 9/1/29, Callable 9/1/24 @ 102.81 (e) | | | 2,000,000 | | | | 1,427,240 | | |
5.88%, 9/1/31, Callable 9/1/26 @ 102.98 (e) | | | 3,800,000 | | | | 2,635,946 | | |
Scientific Games Holdings LP/Scientific Games US FinCo., Inc., 6.63%, 3/1/30,
Callable 3/1/25 @ 103.31 (e) | | | 3,000,000 | | | | 2,551,410 | | |
Viking Cruises Ltd., 13.00%, 5/15/25, Callable 7/22/22 @ 109.75 (e) | | | 2,700,000 | | | | 2,770,038 | | |
| | | | 35,251,997 | | |
Consumer Staples (1.4%): | |
Post Holdings, Inc., 4.50%, 9/15/31, Callable 9/15/26 @ 102.25 (e) | | | 1,000,000 | | | | 821,020 | | |
Simmons Foods, Inc./Simmons prepared Foods, Inc./Simmons Pet Food, Inc./
Simmons Feed, 4.63%, 3/1/29, Callable 3/1/24 @ 102.31 (e) | | | 1,370,000 | | | | 1,157,910 | | |
Triton Water Holdings, Inc., 6.25%, 4/1/29, Callable 4/1/24 @ 103.13 (e) | | | 2,800,000 | | | | 1,990,016 | | |
| | | | 3,968,946 | | |
Energy (6.7%): | |
Antero Midstream Partners LP/Antero Midstream Finance Corp.,
5.38%, 6/15/29, Callable 6/15/24 @ 102.69 (e) | | | 3,450,000 | | | | 3,093,960 | | |
Antero Resources Corp., 7.63%, 2/1/29, Callable 2/1/24 @ 103.81 (e) | | | 750,000 | | | | 765,615 | | |
CITGO Holding, Inc., 9.25%, 8/1/24, Callable 8/8/22 @ 102.31 (d) (e) | | | 3,500,000 | | | | 3,406,165 | | |
CITGO Petroleum Corp., 7.00%, 6/15/25, Callable 8/8/22 @ 103.5 (e) | | | 2,500,000 | | | | 2,418,875 | | |
Comstock Resources, Inc., 6.75%, 3/1/29, Callable 3/1/24 @ 103.38 (e) | | | 4,776,000 | | | | 4,288,609 | | |
PBF Holding Co. LLC/PBF Finance Corp., 6.00%, 2/15/28,
Callable 2/15/23 @ 103 | | | 3,750,000 | | | | 3,178,163 | | |
Range Resources Corp., 5.00%, 3/15/23, Callable 12/15/22 @ 100 | | | 1,350,000 | | | | 1,339,942 | | |
| | | | 18,491,329 | | |
Financials (6.5%): | |
AmWINS Group, Inc., 4.88%, 6/30/29, Callable 6/30/24 @ 102.44 (e) | | | 1,500,000 | | | | 1,238,655 | | |
BCPE Ulysses Intermediate, Inc., 7.75%, 4/1/27, Callable 4/1/23 @ 102 (e) | | | 1,450,000 | | | | 891,909 | | |
Compass Group Diversified Holdings LLC, 5.25%, 4/15/29,
Callable 4/15/24 @ 102.63 (e) | | | 2,200,000 | | | | 1,822,436 | | |
Gray Escrow II, Inc., 5.38%, 11/15/31, Callable 11/15/26 @ 102.69 (e) | | | 1,950,000 | | | | 1,562,048 | | |
Gray Television, Inc., 7.00%, 5/15/27, Callable 7/18/22 @ 105.25 (e) | | | 3,000,000 | | | | 2,890,980 | | |
SWF Escrow Issuer Corp., 6.50%, 10/1/29, Callable 10/1/24 @ 103.25 (d) (e) | | | 4,100,000 | | | | 2,863,686 | | |
U.S. Renal Care, Inc., 10.63%, 7/15/27, Callable 8/8/22 @ 105.31 (e) | | | 4,390,000 | | | | 1,701,125 | | |
Victors Merger Corp., 6.38%, 5/15/29, Callable 5/15/24 @ 103.19 (d) (e) | | | 4,800,000 | | | | 3,019,440 | | |
White Capital Parent LLC, 8.25%, 3/15/26, Callable 8/8/22 @ 102 (e) | | | 2,100,000 | | | | 1,766,898 | | |
| | | | 17,757,177 | | |
Health Care (6.4%): | |
Air Methods Corp., 8.00%, 5/15/25, Callable 8/8/22 @ 100 (d) (e) | | | 3,125,000 | | | | 2,045,094 | | |
Bausch Health Cos., Inc., 5.25%, 1/30/30, Callable 1/30/25 @ 102.63 (e) | | | 2,250,000 | | | | 1,171,440 | | |
CHS/Community Health Systems, Inc., 6.13%, 4/1/30,
Callable 4/1/25 @ 103.06 (d) (e) | | | 5,450,000 | | | | 3,328,806 | | |
See notes to financial statements.
29
Victory Portfolios
Victory High Yield Fund | | Schedule of Portfolio Investments — continued
June 30, 2022 | |
(Unaudited)
Security Description | | Principal
Amount | | Value | |
LifePoint Health, Inc., 5.38%, 1/15/29, Callable 1/15/24 @ 102.69 (e) | | $ | 3,500,000 | | | $ | 2,570,260 | | |
Radiology Partners, Inc., 9.25%, 2/1/28, Callable 2/1/23 @ 104.63 (e) | | | 3,685,000 | | | | 2,769,351 | | |
Team Health Holdings, Inc., 6.38%, 2/1/25, Callable 7/22/22 @ 100 (d) (e) | | | 3,250,000 | | | | 2,289,885 | | |
Tenet Healthcare Corp., 6.13%, 10/1/28, Callable 10/1/23 @ 103.06 (e) | | | 4,000,000 | | | | 3,441,960 | | |
| | | | 17,616,796 | | |
Industrials (13.5%): | |
Ahern Rentals, Inc., 7.38%, 5/15/23, Callable 8/8/22 @ 100 (e) | | | 1,450,000 | | | | 1,119,603 | | |
American Airlines, Inc., 11.75%, 7/15/25 (e) | | | 3,500,000 | | | | 3,622,465 | | |
American Airlines, Inc./AAdvantage Loyalty IP Ltd., 5.75%, 4/20/29 (e) | | | 1,850,000 | | | | 1,579,530 | | |
Aramark Services, Inc., 6.38%, 5/1/25, Callable 8/8/22 @ 103.19 (e) | | | 3,000,000 | | | | 2,938,200 | | |
Cornerstone Building Brands, Inc., 6.13%, 1/15/29,
Callable 9/15/23 @ 103.06 (e) | | | 3,000,000 | | | | 1,932,240 | | |
Madison IAQ LLC, 5.88%, 6/30/29, Callable 6/30/24 @ 102.94 (e) | | | 2,800,000 | | | | 2,135,644 | | |
Mileage Plus Holdings LLC/Mileage Plus Intellectual Property Assets Ltd.,
6.50%, 6/20/27, Callable 6/30/23 @ 103.25 (e) | | | 3,000,000 | | | | 2,946,330 | | |
NESCO Holdings II, Inc., 5.50%, 4/15/29, Callable 4/15/24 @ 102.75 (e) | | | 2,050,000 | | | | 1,723,722 | | |
Pike Corp., 5.50%, 9/1/28, Callable 9/1/23 @ 102.75 (e) | | | 2,000,000 | | | | 1,600,320 | | |
SRS Distribution, Inc.
6.13%, 7/1/29, Callable 7/1/24 @ 103.06 (e) | | | 1,125,000 | | | | 886,568 | | |
6.00%, 12/1/29, Callable 12/1/24 @ 103 (e) | | | 3,000,000 | | | | 2,353,320 | | |
The Hertz Corp., 5.00%, 12/1/29, Callable 12/1/24 @ 102.5 (e) | | | 5,000,000 | | | | 3,851,200 | | |
TransDigm, Inc., 4.63%, 1/15/29, Callable 1/15/24 @ 102.31 | | | 3,325,000 | | | | 2,676,858 | | |
Triumph Group, Inc., 6.25%, 9/15/24, Callable 8/8/22 @ 101.56 (e) | | | 3,525,000 | | | | 3,149,552 | | |
Wabash National Corp., 4.50%, 10/15/28, Callable 10/15/24 @ 102.25 (e) | | | 3,000,000 | | | | 2,338,320 | | |
WESCO Distribution, Inc., 7.25%, 6/15/28, Callable 6/15/23 @ 103.63 (e) | | | 2,250,000 | | | | 2,224,642 | | |
| | | | 37,078,514 | | |
Information Technology (1.7%): | |
Black Knight InfoServ LLC, 3.63%, 9/1/28, Callable 9/1/23 @ 101.81 (e) | | | 1,250,000 | | | | 1,085,575 | | |
Caesars Entertainment, Inc., 8.13%, 7/1/27, Callable 7/1/23 @ 104.06 (d) (e) | | | 3,750,000 | | | | 3,615,975 | | |
| | | | 4,701,550 | | |
Materials (3.1%): | |
Allegheny Technologies, Inc., 5.13%, 10/1/31, Callable 10/1/26 @ 102.56 | | | 3,000,000 | | | | 2,352,420 | | |
CVR Partners LP/CVR Nitrogen Finance Corp., 6.13%, 6/15/28,
Callable 6/15/24 @ 103.06 (e) | | | 1,800,000 | | | | 1,648,566 | | |
Mauser Packaging Solutions Holding Co., 5.50%, 4/15/24,
Callable 8/8/22 @ 100 (e) | | | 2,700,000 | | | | 2,578,986 | | |
Midas OpCo Holdings LLC, 5.63%, 8/15/29, Callable 8/15/24 @ 102.81 (e) | | | 2,250,000 | | | | 1,804,770 | | |
| | | | 8,384,742 | | |
Real Estate (1.2%): | |
Adams Homes, Inc., 7.50%, 2/15/25, Callable 7/22/22 @ 103.75 (e) | | | 3,371,000 | | | | 3,185,359 | | |
Utilities (1.0%): | |
Calpine Corp., 5.13%, 3/15/28, Callable 3/15/23 @ 102.56 (e) | | | 3,000,000 | | | | 2,660,460 | | |
Total Corporate Bonds (Cost $226,116,182) | | | 184,936,866 | | |
See notes to financial statements.
30
Victory Portfolios
Victory High Yield Fund | | Schedule of Portfolio Investments — continued
June 30, 2022 | |
(Unaudited)
Security Description | | Shares or
Principal
Amount | | Value | |
Yankee Dollars (7.8%) | |
Communication Services (1.4%): | |
Telesat Canada/Telesat LLC, 5.63%, 12/6/26, Callable 12/6/23 @ 102.81 (e) | | $ | 6,050,000 | | | $ | 3,767,093 | | |
Consumer Discretionary (0.7%): | |
International Game Technology PLC, 5.25%, 1/15/29,
Callable 1/15/24 @ 102.63 (e) | | | 2,000,000 | | | | 1,811,280 | | |
Energy (0.6%): | |
TechnipFMC PLC, 6.50%, 2/1/26, Callable 2/1/23 @ 103.25 (d) (e) | | | 1,800,000 | | | | 1,791,018 | | |
Industrials (2.7%): | |
Bombardier, Inc., 7.88%, 4/15/27, Callable 8/8/22 @ 103.94 (d) (e) | | | 4,500,000 | | | | 3,745,440 | | |
VistaJet Malta Finance PLC/XO Management Holding, Inc., 6.38%, 2/1/30,
Callable 2/1/25 @ 103.19 (e) | | | 4,750,000 | | | | 3,802,043 | | |
| | | | 7,547,483 | | |
Information Technology (0.7%): | |
ION Trading Technologies Sarl, 5.75%, 5/15/28, Callable 5/15/24 @ 102.88 (e) | | | 2,500,000 | | | | 1,988,850 | | |
Materials (1.7%): | |
Titan Acquisition Ltd./Titan Co-Borrower LLC, 7.75%, 4/15/26,
Callable 8/8/22 @ 101.94 (e) | | | 2,000,000 | | | | 1,846,740 | | |
Trinseo Materials Operating SCA/Trinseo Materials Finance, Inc.,
5.13%, 4/1/29, Callable 4/1/24 @ 102.56 (e) | | | 3,900,000 | | | | 2,814,942 | | |
| | | | 4,661,682 | | |
Total Yankee Dollars (Cost $26,324,984) | | | 21,567,406 | | |
Collateral for Securities Loaned (11.0%)^ | |
BlackRock Liquidity Funds TempFund, Institutional Shares, 1.47% (f) | | | 939,874 | | | | 939,874 | | |
Goldman Sachs Financial Square Prime Obligations Fund, Institutional
Shares, 1.42% (f) | | | 469,044 | | | | 469,044 | | |
HSBC U.S. Government Money Market Fund, I Shares, 1.46% (f) | | | 5,849,917 | | | | 5,849,917 | | |
JPMorgan Prime Money Market Fund, Capital Shares, 1.50% (f) | | | 3,740,007 | | | | 3,740,007 | | |
Morgan Stanley Institutional Liquidity Government Portfolio, Institutional
Shares, 1.39% (f) | | | 2,494,163 | | | | 2,494,163 | | |
Morgan Stanley Institutional Liquidity Prime Portfolio, Institutional
Shares, 1.53% (f) | | | 16,815,802 | | | | 16,815,802 | | |
Total Collateral for Securities Loaned (Cost $30,308,807) | | | 30,308,807 | | |
Total Investments (Cost $347,354,662) — 106.7% | | | 293,195,057 | | |
Liabilities in excess of other assets — (6.7)% | | | (18,530,387 | ) | |
NET ASSETS — 100.00% | | $ | 274,664,670 | | |
^ Purchased with cash collateral from securities on loan.
(a) Non-income producing security.
(b) Amount represents less than 0.05% of net assets.
(c) Variable or Floating-Rate Security. Rate disclosed is as of June 30, 2022.
(d) All or a portion of this security is on loan.
See notes to financial statements.
31
Victory Portfolios
Victory High Yield Fund | | Schedule of Portfolio Investments — continued
June 30, 2022 | |
(Unaudited)
(e) Rule 144A security or other security that is restricted as to resale to institutional investors. The Fund's Adviser has deemed this security to be liquid (unless otherwise noted as illiquid) based upon procedures approved by the Board of Trustees. As of June 30, 2022, the fair value of these securities was $183,418,241 and amounted to 66.8% of net assets.
(f) Rate disclosed is the daily yield on June 30, 2022.
bps — Basis points
LIBOR — London Interbank Offered Rate
LIBOR01M — 1 Month US Dollar LIBOR, rate disclosed as of June 30, 2022, based on the last reset date of the security
LIBOR03M — 3 Month US Dollar LIBOR, rate disclosed as of June 30, 2022, based on the last reset date of the security
LIBOR06M — 6 Month US Dollar LIBOR, rate disclosed as of June 30, 2022, based on the last reset date of the security
LLC — Limited Liability Company
LP — Limited Partnership
PLC — Public Limited Company
SOFR — Secured Overnight Financing Rate
SOFR01M — 1 Month SOFR, rate disclosed as of June 30, 2022
SOFR03M — 3 Month SOFR, rate disclosed as of June 30, 2022
SOFR06M — 6 Month SOFR, rate disclosed as of June 30, 2022
See notes to financial statements.
32
Victory Portfolios
Victory Tax-Exempt Fund | | Schedule of Portfolio Investments
June 30, 2022 | |
(Unaudited)
Security Description | | Principal
Amount | | Value | |
Municipal Bonds (97.1%) | |
Arkansas (1.6%): | |
Arkansas Development Finance Authority Revenue, 3.20%, 12/1/49,
Continuously Callable @100 | | $ | 750,000 | | | $ | 580,600 | | |
University of Central Arkansas Revenue, Series A, 3.00%, 11/1/49,
Continuously Callable @100 | | | 265,000 | | | | 198,179 | | |
| | | | 778,779 | | |
California (1.0%): | |
San Francisco City & County Airport Comm-San Francisco International
Airport Revenue, Series A, 4.00%, 5/1/52, Continuously Callable @100 | | | 500,000 | | | | 478,542 | | |
Colorado (2.6%): | |
Colorado Health Facilities Authority Revenue, Series A, 4.00%, 12/1/50,
Continuously Callable @103 | | | 750,000 | | | | 639,377 | | |
Gold Hill Mesa Metropolitan, GO, 5.50%, 12/1/47, Continuously Callable @100 | | | 585,000 | | | | 641,863 | | |
| | | | 1,281,240 | | |
Connecticut (4.2%): | |
Connecticut Health and Educational Facilities Authority Revenue,
Series 2016 CT, 5.00%, 12/1/41, Continuously Callable @100 | | | 2,000,000 | | | | 2,091,642 | | |
Florida (9.7%): | |
Capital Trust Agency, Inc. Revenue, 5.00%, 8/1/55, Continuously
Callable @100 | | | 400,000 | | | | 401,440 | | |
City of Pompano Beach Revenue, 4.00%, 9/1/50, Continuously Callable @103 | | | 500,000 | | | | 404,655 | | |
County of Miami-Dade Seaport Department Revenue, 4.00%, 10/1/50,
Continuously Callable @100 | | | 500,000 | | | | 457,228 | | |
Florida Development Finance Corp. Revenue, Series A, 5.00%, 6/15/55,
Continuously Callable @100 | | | 500,000 | | | | 509,104 | | |
Hillsborough County IDA Revenue, 4.00%, 8/1/50, Continuously
Callable @100 | | | 500,000 | | | | 445,613 | | |
Miami-Dade County Public Facilities Revenue, Series A, 5.00%, 6/1/33,
Continuously Callable @100 | | | 2,000,000 | | | | 2,118,098 | | |
St. Johns County IDA Revenue, 4.00%, 8/1/55, Continuously Callable @103 | | | 500,000 | | | | 438,481 | | |
| | | | 4,774,619 | | |
Georgia (2.0%): | |
Appling County Development Authority Revenue, 0.74%, 9/1/41, Continuously
Callable @100 (a) | | | 450,000 | | | | 450,000 | | |
Private Colleges & Universities Authority Revenue, 5.25%, 10/1/51,
Continuously Callable @100 (b) | | | 500,000 | | | | 542,075 | | |
| | | | 992,075 | | |
Guam (2.1%): | |
Port Authority of Guam Revenue, Series A, 5.00%, 7/1/48, Continuously
Callable @100 | | | 1,000,000 | | | | 1,029,069 | | |
Illinois (21.6%): | |
Chicago Board of Education Revenue, 6.00%, 4/1/46, Continuously
Callable @100 (c) | | | 2,275,000 | | | | 2,411,343 | | |
Chicago Transit Authority Sales Tax Receipts Revenue, Series 2014, 5.00%,
12/1/44, Continuously Callable @100 | | | 1,450,000 | | | | 1,503,315 | | |
See notes to financial statements.
33
Victory Portfolios
Victory Tax-Exempt Fund | | Schedule of Portfolio Investments — continued
June 30, 2022 | |
(Unaudited)
Security Description | | Principal
Amount | | Value | |
City of Chicago Wastewater Transmission Revenue
Series A, 5.00%, 1/1/47, Continuously Callable @100 | | $ | 1,000,000 | | | $ | 1,035,740 | | |
Series C, 5.00%, 1/1/34, Continuously Callable @100 | | | 1,000,000 | | | | 1,038,007 | | |
City of Chicago, GO, Series A, 5.50%, 1/1/49, Continuously Callable @100 | | | 1,000,000 | | | | 1,038,337 | | |
Illinois, GO, Series 2013, 5.50%, 7/1/27, Continuously Callable @100 | | | 2,000,000 | | | | 2,052,054 | | |
Sales Tax Securitization Corp. Revenue, Series 2018 C, 5.00%, 1/1/43,
Continuously Callable @100 | | | 1,500,000 | | | | 1,602,111 | | |
| | | | 10,680,907 | | |
Indiana (1.1%): | |
Indiana Finance Authority Revenue, Series A, 5.50%, 7/1/52, Continuously
Callable @100 | | | 500,000 | | | | 524,169 | | |
Iowa (0.7%): | |
Iowa Finance Authority Revenue, Series A-1, 4.00%, 5/15/55, Continuously
Callable @103 | | | 500,000 | | | | 362,577 | | |
Kansas (0.4%): | |
Wyandotte County-Kansas City Unified Government Tax Allocation, 5.75%,
3/1/41, Continuously Callable @103 (d) | | | 200,000 | | | | 193,626 | | |
Maryland (0.5%): | |
City of Gaithersburg Maryland Revenue, 5.13%, 1/1/42, Continuously
Callable @103 | | | 250,000 | | | | 251,936 | | |
Massachusetts (1.8%): | |
University of Massachusetts Building Authority Revenue 5.00%, 11/1/39,
Pre-refunded 11/1/24 @ 100 | | | 220,000 | | | | 234,802 | | |
Series 1-2021, 5.00%, 11/1/39, Continuously Callable @100 | | | 410,000 | | | | 428,483 | | |
Series 1-2021, 5.00%, 11/1/39, Pre-refunded 11/1/24 @ 100 | | | 190,000 | | | | 202,783 | | |
| | | | 866,068 | | |
Michigan (0.9%): | |
Michigan Finance Authority Revenue, 4.00%, 12/1/51, Continuously
Callable @100 | | | 500,000 | | | | 433,299 | | |
Missouri (2.2%): | |
Health & Educational Facilities Authority of the State of Missouri Revenue,
4.25%, 12/1/42, Continuously Callable @100 (d) | | | 1,150,000 | | | | 1,076,463 | | |
New Jersey (7.5%): | |
New Jersey Economic Development Authority Biomedical Research Facilities
Revenue, Series 2016 A, 5.00%, 7/15/29, Continuously Callable @100 (c) | | | 885,000 | | | | 936,393 | | |
New Jersey Transportation Trust Fund Authority Revenue 5.00%, 6/15/28,
Continuously Callable @100 | | | 1,000,000 | | | | 1,077,079 | | |
Series BB, 3.50%, 6/15/46, Continuously Callable @100 | | | 200,000 | | | | 167,011 | | |
Tobacco Settlement Financing Corp. Revenue, Series 2018 A, 5.00%, 6/1/46,
Continuously Callable @100 | | | 1,500,000 | | | | 1,535,645 | | |
| | | | 3,716,128 | | |
New York (13.2%): | |
City of New York, GO, Series 2, 1.25%, 4/1/42, Continuously Callable @100 (a) | | | 700,000 | | | | 700,000 | | |
Metropolitan Transportation Authority Dedicated Tax Green Fund Revenue,
Series 2016 B1, 5.00%, 11/15/56, Continuously Callable @100 | | | 1,545,000 | | | | 1,607,061 | | |
See notes to financial statements.
34
Victory Portfolios
Victory Tax-Exempt Fund | | Schedule of Portfolio Investments — continued
June 30, 2022 | |
(Unaudited)
Security Description | | Principal
Amount | | Value | |
Metropolitan Transportation Authority Revenue, Series D-3, 4.00%, 11/15/49,
Continuously Callable @100 | | $ | 500,000 | | | $ | 440,018 | | |
New York Counties Tobacco Trust II Revenue, 5.75%, 6/1/43, Continuously
Callable @100 | | | 200,000 | | | | 200,339 | | |
New York State Dormitory Authority Revenue, 6.00%, 7/1/40, Continuously
Callable @100 (d) (e) | | | 330,000 | | | | 285,699 | | |
Port Authority of New York & New Jersey Revenue, 5.00%, 12/1/32,
Continuously Callable @100 | | | 1,000,000 | | | | 1,021,160 | | |
Schenectady County Capital Resource Corp. Revenue, 5.25%, 7/1/52,
Continuously Callable @100 | | | 200,000 | | | | 217,814 | | |
TSASC, Inc. Revenue, Series A, 5.00%, 6/1/41, Continuously Callable @100 | | | 2,000,000 | | | | 2,079,858 | | |
| | | | 6,551,949 | | |
North Carolina (4.7%): | |
City of Charlotte Certificate of Participation, 4.00%, 6/1/49, Continuously
Callable @100 | | | 1,670,000 | | | | 1,640,187 | | |
North Carolina Medical Care Commission Revenue
Series A, 4.00%, 9/1/50, Continuously Callable @100 | | | 500,000 | | | | 413,547 | | |
Series A, 4.00%, 10/1/50, Continuously Callable @103 | | | 350,000 | | | | 292,593 | | |
| | | | 2,346,327 | | |
Ohio (6.3%): | |
Buckeye Tobacco Settlement Financing Authority Revenue,
Series B-2, 5.00%, 6/1/55, Continuously Callable @100 | | | 900,000 | | | | 847,539 | | |
County of Franklin Revenue, Series B, 5.00%, 7/1/45, Continuously
Callable @103 | | | 500,000 | | | | 507,409 | | |
County of Hardin Economic Development Facilities Revenue, 5.00%,
5/1/30, Continuously Callable @103 | | | 350,000 | | | | 346,123 | | |
Logan Elm Local School District, GO, 4.00%, 11/1/55, Continuously
Callable @100 | | | 1,500,000 | | | | 1,420,767 | | |
| | | | 3,121,838 | | |
Pennsylvania (4.7%): | |
Philadelphia School District, GO, Series A, 5.00%, 9/1/44, Continuously
Callable @100 | | | 1,000,000 | | | | 1,060,315 | | |
The Philadelphia School District, GO, Series A, 5.00%, 9/1/38, Continuously
Callable @100 | | | 1,200,000 | | | | 1,274,045 | | |
| | | | 2,334,360 | | |
Texas (3.9%): | |
City of Arlington Tax Allocation, 4.00%, 8/15/50, Continuously Callable @100 | | | 500,000 | | | | 416,787 | | |
Port of Port Arthur Navigation District Revenue
Series A, 0.80%, 4/1/40, Continuously Callable @100 (a) | | | 800,000 | | | | 800,000 | | |
Series B, 0.80%, 4/1/40, Continuously Callable @100 (a) | | | 200,000 | | | | 200,000 | | |
Series C, 0.82%, 4/1/40, Continuously Callable @100 (a) | | | 500,000 | | | | 500,000 | | |
| | | | 1,916,787 | | |
Utah (3.6%): | |
Jordanelle Special Service District Special Assessment, Series C, 12.00%,
8/1/30, Continuously Callable @100 (d) | | | 368,503 | | | | 369,322 | | |
Military Installation Development Authority Revenue, Series A-1, 4.00%,
6/1/41, Continuously Callable @103 | | | 250,000 | | | | 198,493 | | |
See notes to financial statements.
35
Victory Portfolios
Victory Tax-Exempt Fund | | Schedule of Portfolio Investments — continued
June 30, 2022 | |
(Unaudited)
Security Description | | Shares or
Principal
Amount | | Value | |
Utah Charter School Finance Authority Revenue, Series A, 5.63%, 6/15/42,
Continuously Callable @100 (d) | | $ | 250,000 | | | $ | 252,378 | | |
Utah Infrastructure Agency Revenue, Series A, 5.00%, 10/15/40,
Continuously Callable @100 | | | 1,000,000 | | | | 977,350 | | |
| | | | 1,797,543 | | |
Wisconsin (0.8%): | |
Wisconsin Health & Educational Facilities Authority Revenue, 4.00%, 1/1/47,
Continuously Callable @103 | | | 500,000 | | | | 420,016 | | |
Total Municipal Bonds (Cost $50,220,482) | | | 48,019,959 | | |
Exchange-Traded Funds (2.7%) | |
VanEck Vectors High-Yield Municipal Index ETF | | | 25,000 | | | | 1,346,250 | | |
Total Exchange-Traded Funds (Cost $1,383,097) | | | 1,346,250 | | |
Total Investments (Cost $51,603,579) — 99.8% | | | 49,366,209 | | |
Other assets in excess of liabilities — 0.2% | | | 81,414 | | |
NET ASSETS — 100.00% | | $ | 49,447,623 | | |
(a) Variable Rate Demand Notes that provide the rights to sell the security at face value on either that day or within the rate-reset period. The interest rate is reset on the put date at a stipulated daily, weekly, monthly, quarterly, or other specified time interval to reflect current market conditions. These securities do not indicate a reference rate and spread in their description.
(b) Security or a portion of the security purchased on a delayed-delivery and/or when-issued basis.
(c) All or a portion of this security has been segregated as collateral for delayed delivered and/or when-issued securities.
(d) Rule 144A security or other security that is restricted as to resale to institutional investors. The Fund's Adviser has deemed this security to be liquid (unless otherwise noted as illiquid) based upon procedures approved by the Board of Trustees. As of June 30, 2022, the fair value of these securities was $2,177,488 and amounted to 4.4% of net assets.
(e) The Fund's Adviser has deemed this security to be illiquid based upon procedures approved by the Board of Trustees. As of June 30, 2022, illiquid securities were 0.6% of net assets.
ETF — Exchange-Traded Fund
GO — General Obligation
IDA — Industrial Development Authority
See notes to financial statements.
36
Victory Portfolios
Victory High Income Municipal Bond Fund | | Schedule of Portfolio Investments
June 30, 2022 | |
(Unaudited)
Security Description | | Principal
Amount | | Value | |
Municipal Bonds (96.9%) | |
Arizona (6.5%): | |
Arizona IDA Revenue | |
4.00%, 7/15/51, Continuously Callable @100 (a) | | $ | 500,000 | | | $ | 397,182 | | |
4.00%, 12/15/51, Continuously Callable @100 (a) | | | 700,000 | | | | 572,027 | | |
La Paz County IDA Revenue, 4.00%, 2/15/51, Continuously Callable @100 | | | 280,000 | | | | 233,059 | | |
Maricopa County IDA Revenue, 4.00%, 10/15/47, Continuously
Callable @104 (a) | | | 500,000 | | | | 430,041 | | |
The IDA of the City of Phoenix Revenue, 4.00%, 12/1/51, Continuously
Callable @100 (a) | | | 1,000,000 | | | | 755,723 | | |
The IDA of the County of Pima Revenue, 4.00%, 6/15/51, Continuously
Callable @100 (a) | | | 500,000 | | | | 404,990 | | |
| | | | 2,793,022 | | |
California (0.5%): | |
California County Tobacco Securitization Agency Revenue, Series B-1,
5.00%, 6/1/49, Continuously Callable @100 | | | 195,000 | | | | 214,554 | | |
Delaware (1.0%): | |
Delaware State Economic Development Authority Revenue, 4.00%, 6/1/52,
Continuously Callable @100 | | | 500,000 | | | | 415,461 | | |
District of Columbia (0.5%): | |
District of Columbia Tobacco Settlement Financing Corp. Revenue,
6.50%, 5/15/33 | | | 195,000 | | | | 202,122 | | |
Florida (7.6%): | |
Escambia County Health Facilities Authority Revenue, 3.00%, 8/15/50,
Continuously Callable @100 | | | 1,000,000 | | | | 745,956 | | |
Florida Development Finance Corp. Revenue, 4.00%, 7/1/55, Continuously
Callable @100 | | | 500,000 | | | | 394,677 | | |
Pinellas County Educational Facilities Authority Revenue, Series A, 4.00%,
6/1/46, Continuously Callable @100 (a) | | | 500,000 | | | | 407,263 | | |
Seminole County IDA Revenue, 4.00%, 6/15/56, Continuously
Callable @100 (a) | | | 705,000 | | | | 564,519 | | |
Sumter County Village Community Development District No. 10 Special
Assessment Revenue, Series 2014, 5.75%, 5/1/31, Continuously
Callable @100 | | | 1,145,000 | | | | 1,163,289 | | |
| | | | 3,275,704 | | |
Georgia (3.5%): | |
Development Authority of Heard County Revenue, 0.93%, 9/1/26,
Continuously Callable @100 (b) | | | 1,500,000 | | | | 1,500,000 | | |
Illinois (11.5%): | |
Chicago Board of Education Revenue, 6.00%, 4/1/46, Continuously
Callable @100 | | | 1,500,000 | | | | 1,589,896 | | |
City of Chicago, GO, Series A, 5.50%, 1/1/49, Continuously Callable @100 | | | 1,000,000 | | | | 1,038,337 | | |
Illinois, GO
5.50%, 7/1/33, Continuously Callable @100 | | | 1,000,000 | | | | 1,023,986 | | |
5.50%, 7/1/38, Continuously Callable @100 | | | 1,250,000 | | | | 1,276,770 | | |
| | | | 4,928,989 | | |
See notes to financial statements.
37
Victory Portfolios
Victory High Income Municipal Bond Fund | | Schedule of Portfolio Investments — continued
June 30, 2022 | |
(Unaudited)
Security Description | | Principal
Amount | | Value | |
Indiana (3.4%): | |
Indiana Finance Authority Revenue
4.13%, 12/1/26 | | $ | 1,000,000 | | | $ | 982,453 | | |
Series A, 5.00%, 7/1/55, Continuously Callable @100 | | | 500,000 | | | | 466,662 | | |
| | | | 1,449,115 | | |
Iowa (1.9%): | |
Iowa Finance Authority Revenue
Series A, 5.00%, 5/15/48, Continuously Callable @100 | | | 500,000 | | | | 468,253 | | |
Series A-1, 4.00%, 5/15/55, Continuously Callable @103 | | | 500,000 | | | | 362,578 | | |
| | | | 830,831 | | |
Kansas (0.5%): | |
Wyandotte County-Kansas City Unified Government Tax Allocation, 5.75%,
3/1/41, Continuously Callable @103 (a) | | | 200,000 | | | | 193,626 | | |
Maryland (0.4%): | |
Maryland Economic Development Corp. Revenue, 4.25%, 7/1/50,
Continuously Callable @100 | | | 200,000 | | | | 167,099 | | |
Massachusetts (0.7%): | |
Massachusetts Development Finance Agency Revenue, 4.00%, 10/1/32,
Continuously Callable @105 (a) | | | 300,000 | | | | 309,427 | | |
Minnesota (0.7%): | |
City of Woodbury Revenue, 4.00%, 7/1/51, Continuously Callable @103 | | | 400,000 | | | | 316,484 | | |
Missouri (1.1%): | |
Health & Educational Facilities Authority of the State of Missouri Revenue,
4.25%, 12/1/42, Continuously Callable @100 (a) | | | 500,000 | | | | 468,027 | | |
New Hampshire (2.4%): | |
New Hampshire Business Finance Authority Revenue
4.00%, 1/1/51, Continuously Callable @103 | | | 500,000 | | | | 408,336 | | |
Series B, 3.75%, 7/1/45, (Put Date 7/2/40) (a) (c) | | | 750,000 | | | | 632,357 | | |
| | | | 1,040,693 | | |
New Jersey (3.2%): | |
New Jersey Economic Development Authority Revenue, Series S, 4.00%,
6/15/50, Continuously Callable @100 | | | 450,000 | | | | 409,947 | | |
New Jersey Economic Development Motor Vehicle Surcharges Subordinate
Revenue, Series A, 5.00%, 7/1/33, Continuously Callable @100 | | | 500,000 | | | | 525,130 | | |
New Jersey Transportation Trust Fund Authority Revenue, Series BB, 3.50%,
6/15/46, Continuously Callable @100 | | | 500,000 | | | | 417,529 | | |
| | | | 1,352,606 | | |
New Mexico (2.1%): | |
New Mexico Hospital Equipment Loan Council Revenue, Series LA, 5.00%,
7/1/49, Continuously Callable @102 | | | 500,000 | | | | 450,536 | | |
Winrock Town Center Tax Increment Development District Tax Allocation,
4.25%, 5/1/40, Continuously Callable @103 (a) | | | 500,000 | | | | 431,874 | | |
| | | | 882,410 | | |
See notes to financial statements.
38
Victory Portfolios
Victory High Income Municipal Bond Fund | | Schedule of Portfolio Investments — continued
June 30, 2022 | |
(Unaudited)
Security Description | | Principal
Amount | | Value | |
New York (10.0%): | |
Build NYC Resource Corp. Revenue
4.00%, 6/15/51, Continuously Callable @100 | | $ | 500,000 | | | $ | 398,772 | | |
Series A, 5.00%, 6/15/51, Continuously Callable @100 (a) | | | 100,000 | | | | 99,231 | | |
Huntington Local Development Corp. Revenue, Series S, 3.00%, 7/1/25 | | | 500,000 | | | | 488,419 | | |
Metropolitan Transportation Authority Revenue
Series A-2, 5.00%, 11/15/45, (Put Date 5/15/30) (c) | | | 365,000 | | | | 395,292 | | |
Series D-3, 4.00%, 11/15/49, Continuously Callable @100 | | | 500,000 | | | | 440,018 | | |
New York State Dormitory Authority Revenue
6.00%, 7/1/40, Continuously Callable @100 (a) (d) | | | 1,000,000 | | | | 865,753 | | |
4.00%, 7/1/40, Continuously Callable @100 | | | 200,000 | | | | 189,654 | | |
New York Transportation Development Corp. Revenue, 5.00%, 10/1/40,
Continuously Callable @100 | | | 750,000 | | | | 753,043 | | |
Onondaga Civic Development Corp. Revenue, 5.00%, 10/1/40, Continuously
Callable @100 | | | 250,000 | | | | 235,790 | | |
Western Regional Off-Track Betting Corp. Revenue, 4.13%, 12/1/41,
Continuously Callable @100 (a) | | | 500,000 | | | | 402,533 | | |
| | | | 4,268,505 | | |
North Carolina (0.5%): | |
North Carolina Medical Care Commission Revenue, 5.00%, 10/1/50,
Continuously Callable @103 | | | 250,000 | | | | 227,821 | | |
North Dakota (2.1%): | |
Grand Forks, North Dakota Senior Housing and Nursing Facility Revenue,
5.00%, 12/1/36, Continuously Callable @100 | | | 1,000,000 | | | | 911,297 | | |
Ohio (3.7%): | |
Buckeye Tobacco Settlement Financing Authority Revenue,
Series B-2, 5.00%, 6/1/55, Continuously Callable @100 | | | 1,000,000 | | | | 941,710 | | |
County of Hardin Revenue, 5.50%, 5/1/50, Continuously Callable @103 | | | 500,000 | | | | 451,800 | | |
Northeast Ohio Medical University Revenue, Series A, 4.00%, 12/1/45,
Continuously Callable @100 | | | 225,000 | | | | 210,262 | | |
| | | | 1,603,772 | | |
Oregon (1.8%): | |
Clackamas County Hospital Facility Authority Revenue
Series A, 5.00%, 11/15/52, Continuously Callable @102 | | | 500,000 | | | | 469,586 | | |
Series A, 5.38%, 11/15/55, Continuously Callable @102 | | | 100,000 | | | | 94,143 | | |
Yamhill County Hospital Authority Revenue, Series A, 5.00%, 11/15/51,
Continuously Callable @103 | | | 250,000 | | | | 209,367 | | |
| | | | 773,096 | | |
Pennsylvania (2.4%): | |
Bucks County IDA Revenue, 5.00%, 7/1/54, Continuously Callable @100 | | | 500,000 | | | | 440,585 | | |
Pennsylvania Economic Development Financing Authority Revenue,
9.00%, 4/1/51, (Put Date 4/13/28) (a) (c) | | | 500,000 | | | | 568,952 | | |
| | | | 1,009,537 | | |
See notes to financial statements.
39
Victory Portfolios
Victory High Income Municipal Bond Fund | | Schedule of Portfolio Investments — continued
June 30, 2022 | |
(Unaudited)
Security Description | | Principal
Amount | | Value | |
South Carolina (4.5%): | |
County of Richland SC Special Assessment, 3.63%, 11/1/31, Continuously
Callable @103 (a) | | $ | 290,000 | | | $ | 244,011 | | |
Lancaster County Walnut Creek Improvement District Assessment Refunding
Revenue, Series 2016 A-1, 5.00%, 12/1/37, Continuously Callable @100 | | | 1,675,000 | | | | 1,688,505 | | |
| | | | 1,932,516 | | |
South Dakota (0.8%): | |
Oglala Sioux Tribe, Series 2012, 5.00%, 10/1/22, Callable 8/8/22 @ 100 (a) | | | 335,000 | | | | 335,033 | | |
Texas (4.6%): | |
City of Houston Texas Airport System Revenue, Series C, 4.00%, 7/15/41,
Continuously Callable @100 | | | 750,000 | | | | 630,748 | | |
Port of Port Arthur Navigation District Revenue, Series A, 0.80%, 4/1/40,
Continuously Callable @100 (b) | | | 300,000 | | | | 300,000 | | |
Texas Private Activity Bond Surface Transportation Corp. Revenue,
NTE Mobility Partners Segments 3 LLC — Segments 3A & 3B Facility,
Series 2013, 7.00%, 12/31/38, Continuously Callable @100 | | | 1,000,000 | | | | 1,042,526 | | |
| | | | 1,973,274 | | |
Utah (8.0%): | |
Jordanelle Special Service District Special Assessment, Series C, 12.00%,
8/1/30, Continuously Callable @100 (a) | | | 1,299,653 | | | | 1,302,542 | | |
Military Installation Development Authority Revenue
Series A-1, 4.00%, 6/1/41, Continuously Callable @103 | | | 250,000 | | | | 198,493 | | |
Series A-1, 4.00%, 6/1/52, Continuously Callable @103 | | | 250,000 | | | | 178,686 | | |
Utah Charter School Finance Authority Revenue
2.75%, 4/15/50, Continuously Callable @100 | | | 525,000 | | | | 349,918 | | |
Series A, 5.63%, 6/15/42, Continuously Callable @100 (a) | | | 250,000 | | | | 252,378 | | |
Utah Infrastructure Agency Revenue, Series A, 5.38%, 10/15/40,
Continuously Callable @100 | | | 1,150,000 | | | | 1,160,236 | | |
| | | | 3,442,253 | | |
Vermont (1.5%): | |
Vermont Economic Development Authority Revenue, 4.00%, 5/1/45,
Continuously Callable @103 | | | 500,000 | | | | 400,865 | | |
Vermont Educational & Health Buildings Financing Agency Revenue,
5.00%, 10/15/46, Continuously Callable @100 | | | 250,000 | | | | 257,362 | | |
| | | | 658,227 | | |
West Virginia (2.4%): | |
The County Commission of Monongalia County, WV Special District Excise
Tax Revenue, Series 2017 A, 5.75%, 6/1/43, Continuously
Callable @100 (a) | | | 1,000,000 | | | | 1,049,165 | | |
Wisconsin (7.1%): | |
Public Finance Authority Revenue
4.00%, 4/1/52, Continuously Callable @100 (a) | | | 500,000 | | | | 408,628 | | |
Series A, 4.25%, 12/1/51, Continuously Callable @100 (a) | | | 500,000 | | | | 429,639 | | |
Series A, 5.25%, 3/1/55, Continuously Callable @100 (a) | | | 500,000 | | | | 458,007 | | |
Series A, 5.00%, 7/1/55, Continuously Callable @100 (a) | | | 500,000 | | | | 466,805 | | |
Series A-1, 4.00%, 7/1/51, Continuously Callable @100 (a) | | | 500,000 | | | | 421,962 | | |
See notes to financial statements.
40
Victory Portfolios
Victory High Income Municipal Bond Fund | | Schedule of Portfolio Investments — continued
June 30, 2022 | |
(Unaudited)
Security Description | | Shares or
Principal
Amount | | Value | |
Wisconsin Health & Educational Facilities Authority Revenue
4.00%, 1/1/47, Continuously Callable @103 | | $ | 500,000 | | | $ | 420,016 | | |
4.00%, 12/1/51, Continuously Callable @100 | | | 500,000 | | | | 422,059 | | |
| | | | 3,027,116 | | |
Total Municipal Bonds (Cost $46,252,276) | | | 41,551,782 | | |
Exchange-Traded Funds (1.2%) | |
VanEck Vectors High-Yield Municipal Index ETF | | | 10,000 | | | | 538,500 | | |
Total Exchange-Traded Funds (Cost $550,297) | | | 538,500 | | |
Total Investments (Cost $46,802,573) — 98.1% | | | 42,090,282 | | |
Other assets in excess of liabilities — 1.9% | | | 808,512 | | |
NET ASSETS — 100.00% | | $ | 42,898,794 | | |
(a) Rule 144A security or other security that is restricted as to resale to institutional investors. The Fund's Adviser has deemed this security to be liquid (unless otherwise noted as illiquid) based upon procedures approved by the Board of Trustees. As of June 30, 2022, the fair value of these securities was $12,871,695 and amounted to 30.0% of net assets.
(b) Variable Rate Demand Notes that provide the rights to sell the security at face value on either that day or within the rate-reset period. The interest rate is reset on the put date at a stipulated daily, weekly, monthly, quarterly, or other specified time interval to reflect current market conditions. These securities do not indicate a reference rate and spread in their description.
(c) Put Bond.
(d) The Fund's Adviser has deemed this security to be illiquid based upon procedures approved by the Board of Trustees. As of June 30, 2022, illiquid securities were 2.0% of net assets.
ETF — Exchange-Traded Fund
GO — General Obligation
IDA — Industrial Development Authority
LLC — Limited Liability Company
See notes to financial statements.
41
Victory Portfolios
Victory Floating Rate Fund | | Schedule of Portfolio Investments
June 30, 2022 | |
(Unaudited)
Security Description | | Shares or
Principal
Amount | | Value | |
Common Stocks (0.0%) (a) | |
Consumer Discretionary (0.0%): | |
Men's Wearhouse, Inc. | | | 51,299 | | | $ | 96,853 | | |
Total Common Stocks (Cost $192,371) | | | 96,853 | | |
Warrants (0.0%) (a) | |
Communication Services (0.0%): | |
Cineworld | | | 377,856 | | | | 39,090 | | |
Total Warrants (Cost $—) | | | 39,090 | | |
Senior Secured Loans (92.4%) | |
19th Holdings Golf LLC, Initial Term Loans, First Lien, 4.49%
(SOFR01M+325bps), 1/27/29 (b) | | $ | 27,500,000 | | | | 25,987,500 | | |
84 Lumber Co., Term B-1 Loans, First Lien, 4.06% (LIBOR01M+300bps),
11/13/26 (b) | | | 8,789,940 | | | | 8,380,680 | | |
AAdvantage Loyalty IP Ltd., Initial Term Loan, First Lien, 5.81%
(LIBOR03M+475bps), 4/20/28 (b) | | | 34,334,127 | | | | 32,690,895 | | |
Academy Ltd., Refinancing Term Loans, First Lien, 4.81%
(LIBOR01M+375bps), 11/6/27 (b) | | | 8,133,882 | | | | 7,717,020 | | |
Accelerated Health Systems LLC, Initial Term B Loans, First Lien, 4.91%
(SOFR06M+425bps), 2/2/29 (b) | | | 15,000,000 | | | | 14,203,200 | | |
ACProducts, Inc., Initial Term Loans, First Lien, 4.75%
(LIBOR06M+425bps), 5/17/28 (b) | | | 33,692,318 | | | | 25,943,085 | | |
Acrisure LLC, 2021-1 Additional Term Loans, First Lien, 4.81%
(LIBOR01M+375bps), 2/15/27 (b) | | | 1,488,750 | | | | 1,390,120 | | |
Acrisure LLC, 2021-2 Additional Term Loan, First Lien, 5.31%
(LIBOR01M+425bps), 2/15/27 (b) | | | 3,980,000 | | | | 3,747,847 | | |
Acrisure LLC, Term Loan B 2020, First Lien, 4.56% (LIBOR01M+350bps),
2/15/27 (b) | | | 15,180,269 | | | | 13,889,947 | | |
Adient US LLC, Term B-1 Loans, First Lien, 4.31% (LIBOR01M+325bps),
4/8/28 (b) | | | 4,987,406 | | | | 4,629,958 | | |
Air Canada, Term Loan, First Lien, 4.25% (LIBOR06M+350bps),
7/27/28 (b) | | | 33,000,000 | | | | 30,277,500 | | |
Air Medical Group Holdings, Inc., Incremental Term Loan B, First Lien,
5.31% (LIBOR01M+425bps), 3/14/25 (b) | | | 7,812,654 | | | | 7,251,158 | | |
Air Methods Corp., Initial Term Loans, First Lien, 4.51%
(LIBOR03M+350bps), 4/21/24 (b) | | | 19,545,464 | | | | 17,279,363 | | |
Albaugh LLC, Term Loan B, First Lien, 4.75% (SOFR03M+375bps),
12/21/24 (b) | | | 16,000,000 | | | | 15,240,000 | | |
Alliance Laundry Systems LLC, Initial Term B Loans, First Lien, 4.52%
(LIBOR03M+350bps), 10/8/27 (b) | | | 11,616,646 | | | | 11,014,091 | | |
Alliance Laundry Systems LLC, Initial Term B Loans, First Lien, 4.75%
(LIBOR01M+350bps) (b) | | | 145,849 | | | | 138,283 | | |
Alterra Mountain Co., Facility 2028 Term Loan B, First Lien, 4.56%
(LIBOR01M+350bps), 8/17/28 (b) | | | 10,939,925 | | | | 10,379,254 | | |
American Axle & Manufacturing, Inc., Term Loan B, First Lien, 3.88%
(LIBOR01M+225bps), 4/6/24 (b) | | | 4,457,887 | | | | 4,313,005 | | |
See notes to financial statements.
42
Victory Portfolios
Victory Floating Rate Fund | | Schedule of Portfolio Investments — continued
June 30, 2022 | |
(Unaudited)
Security Description | | Principal
Amount | | Value | |
Amneal Pharmaceuticals LLC, Initial Term Loans, First Lien, 4.56%
(LIBOR01M+350bps), 3/23/25 (b) | | $ | 21,587,108 | | | $ | 19,482,365 | | |
Anchor Packaging LLC, Initial Term Loans, First Lien, 5.06%
(LIBOR01M+400bps), 7/18/26 (b) | | | 6,887,101 | | | | 6,525,529 | | |
Apex Tool Group LLC, Initial Term Loan, First Lien, 6.43%
(SOFR01M+525bps), 2/8/29 (b) | | | 11,491,862 | | | | 10,080,546 | | |
AT home Group, Inc., Initial Term Loan, First Lien, 4.97%
(LIBOR03M+400bps), 7/23/28 (b) | | | 27,667,322 | | | | 21,317,672 | | |
Avis Budget Car Rental LLC, Tranche C Term Loan, First Lien, 4.63%
(SOFR01M+350bps), 3/16/29 (b) | | | 2,992,500 | | | | 2,857,837 | | |
AZZ, Inc., Initial Term Loan, First Lien, 5.28% (SOFR01M+425bps),
5/6/29 (b) | | | 13,000,000 | | | | 12,382,500 | | |
Bally's Corp., Term B Facility Loans, First Lien, 4.37%
(LIBOR01M+325bps), 10/1/28 (b) | | | 14,925,000 | | | | 13,817,267 | | |
Bausch Health Cos., Inc., Second Amendment Term Loan, First Lien,
6.45% (SOFR01M+525bps), 1/27/27 (b) | | | 28,000,000 | | | | 23,936,920 | | |
Brand Energy and Infrastructure Services, Inc., Initial Term Loan,
First Lien, 5.26% (LIBOR01M+425bps), 6/21/24 (b) | | | 60,026 | | | | 51,723 | | |
Brand Energy and Infrastructure Services, Inc., Initial Term Loan,
First Lien, 5.43% (LIBOR03M+425bps), 6/21/24 (b) | | | 7,543,285 | | | | 6,499,822 | | |
Brookfield Property REIT, Inc., Initial Term B Loans, First Lien, 3.63%
(SOFR01M+250bps), 8/24/25 (b) | | | 7,824,700 | | | | 7,483,778 | | |
BW NHHC Holdco, Inc., Term Loan Lien 2, Second Lien, 10.46%
(LIBOR03M+900bps), 5/15/26 (b) | | | 3,000,000 | | | | 1,642,500 | | |
Caesars Resort Collection LLC, 1st Lien Term Loan B, 3.81%
(LIBOR01M+275bps), 12/22/24 (b) | | | 2,992,167 | | | | 2,875,592 | | |
Caesars Resort Collection LLC, Term B-1 Loans, First Lien, 4.56%
(LIBOR01M+350bps), 6/19/25 (b) | | | 7,867,387 | | | | 7,566,460 | | |
Calpine Corp., 2020 Term Loans, First Lien, 3.56% (LIBOR01M+250bps),
12/16/27 (b) | | | 1,450,192 | | | | 1,375,376 | | |
Chariot Buyer LLC, Initial Term Loans, First Lien, 4.51%
(LIBOR03M+350bps), 11/3/28 (b) | | | 12,935,000 | | | | 11,652,236 | | |
Chassix, Inc., Term Loan B, First Lien, 7.56% (LIBOR06M+550bps),
11/10/23 (b) | | | 2,001,299 | | | | 1,691,097 | | |
Chassix, Inc., Term Loan B, First Lien, 7.06% (LIBOR03M+550bps),
11/10/23 (b) | | | 1,804,268 | | | | 1,524,607 | | |
Cinemark USA, Inc., Term Loan B, First Lien, 3/29/25 (c) (d) | | | 3,989,349 | | | | 3,747,754 | | |
Clarios Global LP, Term B-1, First Lien, 4.31% (LIBOR01M+325bps),
4/30/26 (b) | | | 7,659,794 | | | | 7,133,183 | | |
Clear Channel Outdoor Holdings, Inc., Term B Loan, First Lien,
8/21/26 (c) (d) | | | 5,000,000 | | | | 4,281,250 | | |
Clydesdale Acquisition Holdings LLC, Term B Loans, First Lien, 5.38%
(SOFR01M+425bps), 4/13/29 (b) | | | 18,000,000 | | | | 16,793,460 | | |
Consolidated Communications, Inc., 2020 Term B-1, First Lien, 4.56%
(LIBOR01M+350bps), 10/2/27 (b) | | | 13,644,610 | | | | 12,030,043 | | |
Cornerstone Building Brands, Inc., New Term Loan B, First Lien, 4.57%
(LIBOR01M+325bps), 4/12/28 (b) | | | 16,602,281 | | | | 13,696,882 | | |
Covis Pharma Holdings S.a.r.l., Dollar Term B Loans, First Lien, 7.30%
(SOFR03M+650bps), 2/14/27 (b) | | | 16,787,500 | | | | 13,933,625 | | |
See notes to financial statements.
43
Victory Portfolios
Victory Floating Rate Fund | | Schedule of Portfolio Investments — continued
June 30, 2022 | |
(Unaudited)
Security Description | | Principal
Amount | | Value | |
CP Altas Buyer, Inc., Term B Loans, First Lien, 4.81%
(LIBOR01M+375bps), 11/23/27 (b) | | $ | 28,847,013 | | | $ | 25,253,252 | | |
CPM Holdings, Inc., 2nd Lien Initial Term Loans, Second Lien, 9.31%
(LIBOR01M+825bps), 11/16/26 (b) | | | 1,595,960 | | | | 1,524,141 | | |
CPM Holdings, Inc., Initial Term Loans, First Lien, 4.56%
(LIBOR01M+350bps), 11/17/25 (b) | | | 2,894,987 | | | | 2,752,409 | | |
CSC Holdings LLC, October 2018 Incremental Term Loans, First Lien,
3.57% (LIBOR01M+225bps), 1/15/26 (b) | | | 3,000,000 | | | | 2,784,390 | | |
Cumulus Media New Holdings, Inc., Initial Term Loan, First Lien, 4.75%
(LIBOR06M+375bps), 3/31/26 (b) | | | 19,164,544 | | | | 18,234,297 | | |
Dayco Products LLC, Term Loans, First Lien, 5.82% (LIBOR03M+425bps),
5/19/24 (b) | | | 11,049,141 | | | | 9,995,495 | | |
Delta 2 (Lux) S.a.r.l., New Term Loan B, First Lien, 3.56%
(LIBOR01M+250bps), 2/1/24 (b) | | | 24,000,000 | | | | 23,352,000 | | |
Delta Air Lines, Inc. and Skymiles IP Ltd., Initial Term Loan, First Lien,
4.75% (LIBOR03M+375bps), 10/20/27 (b) | | | 27,911,595 | | | | 27,710,910 | | |
Diamond Sports Group LLC, Term Loan, First Lien, 9.18%
(SOFR01M+800bps), 5/25/26 (b) | | | 1,456,035 | | | | 1,446,323 | | |
Diamond Sports Group LLC, Term Loan, Second Lien, 4.43%
(SOFR01M+325bps), 8/24/26 (b) | | | 19,901,156 | | | | 4,643,537 | | |
Dynasty Acquisition Co., Inc., 2020 Specified Refi Term B-1 Loans,
First Lien, 4.51% (LIBOR03M+350bps), 4/8/26 (b) | | | 2,771,311 | | | | 2,548,220 | | |
Entercom Media Corp., New Term Loan, First Lien, 4.13%
(LIBOR01M+250bps), 11/17/24 (b) | | | 19,706,476 | | | | 17,415,599 | | |
Envision Healthcare Corp., Initial Term Loans, First Lien, 4.81%
(LIBOR01M+375bps), 10/10/25 (b) | | | 14,161,251 | | | | 4,659,052 | | |
Eyemart Express LLC, Term B-1 Loan, First Lien, 5.13%
(LIBOR03M+300bps), 8/5/27 (b) | | | 27,016,859 | | | | 25,328,305 | | |
Fertitta Entertainment LLC, Initial B Term Loan, First Lien, 5.53%
(SOFR01M+400bps), 1/27/29 (b) | | | 22,443,750 | | | | 20,639,946 | | |
First Brands Group LLC, 2021 Term Loans, First Lien, 6.03%
(SOFR03M+500bps), 3/24/27 (b) | | | 6,426,193 | | | | 6,079,179 | | |
Froneri International Ltd., Facility B2 Loan, First Lien, 3.31%
(LIBOR01M+225bps), 1/31/27 (b) | | | 2,870,001 | | | | 2,634,432 | | |
Frontier Communications Corp., Refinancing Term Loans, First Lien,
4.81% (LIBOR03M+375bps), 10/8/27 (b) | | | 15,844,773 | | | | 14,791,096 | | |
Gates Global LLC, Initial B-3 Dollar Term Loan, First Lien, 3.56%
(LIBOR01M+250bps), 3/31/27 (b) | | | 10,873,722 | | | | 10,237,610 | | |
Global Medical Response, Inc., 2020 Term Loan, First Lien, 5.25%
(LIBOR03M+425bps), 10/2/25 (b) | | | 10,854,774 | | | | 10,074,642 | | |
Graham Packaging Co., Inc., New Term Loans, First Lien, 4.06%
(LIBOR01M+300bps), 8/4/27 (b) | | | 15,659,407 | | | | 14,654,543 | | |
Great Outdoors Group LLC, Term B1, First Lien, 4.81%
(LIBOR01M+375bps), 3/5/28 (b) | | | 23,050,825 | | | | 20,953,200 | | |
Harbor Purchaser, Inc., 6.28% (SOFR01M+525bps), 4/4/29 (b) | | | 22,000,000 | | | | 19,841,360 | | |
Hertz Corp., Initial Term B Loans, First Lien, 4.31% (LIBOR01M+325bps),
6/30/28 (b) | | | 29,374,150 | | | | 27,601,127 | | |
Hertz Corp., Initial Term C Loan, First Lien, 4.31% (LIBOR01M+325bps),
6/30/28 (b) | | | 5,591,816 | | | | 5,254,294 | | |
See notes to financial statements.
44
Victory Portfolios
Victory Floating Rate Fund | | Schedule of Portfolio Investments — continued
June 30, 2022 | |
(Unaudited)
Security Description | | Principal
Amount | | Value | |
Hillman Group, Inc., Initial Delayed Draw Term Loan, First Lien,
4.39% (LIBOR01M+275bps), 2/24/28 (b) (d) (e) | | $ | 1,020,660 | | | $ | 953,041 | | |
Hillman Group, Inc., Initial Term Loans, First Lien, 4.39%
(LIBOR01M+275bps), 7/14/28 (b) | | | 4,231,833 | | | | 3,951,474 | | |
Holley Purchaser, Inc., Initial Term Loan, First Lien, 5.58%
(LIBOR03M+375bps), 11/10/28 (b) | | | 13,512,964 | | | | 12,724,753 | | |
Hub International Ltd., Term Loan B, First Lien, 4.21%
(LIBOR03M+300bps), 4/25/25 (b) | | | 10,153,846 | | | | 9,594,369 | | |
Hunter Douglas, Inc., Tranche B-1 Term Loans, First Lien, 4.84%
(SOFR03M+350bps), 2/9/29 (b) | | | 20,000,000 | | | | 17,162,600 | | |
iHeartCommunications, Inc., Second Amendment Incremental
Term Loan, First Lien, 4.31% (LIBOR01M+325bps), 5/1/26 (b) | | | 6,975,912 | | | | 6,478,878 | | |
iHeartCommunications, Inc., Term Loans, First Lien, 4.06%
(LIBOR01M+300bps), 5/1/26 (b) | | | 33,258,671 | | | | 30,819,813 | | |
Innio North America Holding, Inc., Facility B USD, First Lien, 4.22%
(LIBOR03M+325bps), 11/6/25 (b) | | | 8,802,566 | | | | 8,487,171 | | |
Intelsat Jackson Holdings SA, Term B loan, First Lien, 4.67%
(SOFR06M+425bps), 2/1/29 (b) | | | 30,250,905 | | | | 27,674,133 | | |
Janus International Group LLC, Amendment No 3 Refinancing
Term Loans, First Lien, 4.31% (LIBOR01M+325bps), 2/15/25 (b) | | | 19,464,477 | | | | 18,326,973 | | |
Jo-Ann Stores LLC, Term B-1 Loan, First Lien, 5.96%
(LIBOR03M+475bps), 6/30/28 (b) | | | 18,351,300 | | | | 12,754,154 | | |
Knight Health Holdings LLC, Term B Loans, First Lien, 6.31%
(LIBOR01M+525bps), 12/17/28 (b) | | | 23,382,500 | | | | 19,173,650 | | |
LBM Acquisition LLC, Initial Term Loan, First Lien, 4.81%
(LIBOR01M+375bps), 12/17/27 (b) (d) | | | 24,465,342 | | | | 19,992,833 | | |
Leslie's Poolmart, Inc., Term Loan B, First Lien, 3.02%
(LIBOR06M+250bps), 3/9/28 (b) | | | 17,335,694 | | | | 16,443,600 | | |
Life Time, Inc., 2021 Refinancing Term Loan, First Lien, 6.32%
(LIBOR03M+475bps), 12/15/24 (b) | | | 12,796,530 | | | | 12,604,582 | | |
Lifepoint Health, Inc., Term B Loans, First Lien, 4.81%
(LIBOR01M+375bps), 11/16/25 (b) | | | 13,231,875 | | | | 12,320,067 | | |
LifeScan Global Corp., Initial Term Loan, First Lien, 6.96%
(LIBOR03M+600bps), 10/1/24 (b) | | | 21,698,568 | | | | 18,841,518 | | |
LifeScan Global Corp., Initial Term Loan, Second Lien, 10.46%
(LIBOR03M+950bps), 6/19/25 (b) | | | 3,750,000 | | | | 3,300,000 | | |
LSF11 A5 Holdco LLC, Term Loans, First Lien, 4.55%
(SOFR01M+350bps), 10/15/28 (b) | | | 13,965,000 | | | | 13,031,160 | | |
Lucid Energy Group II Borrower LLC, Term Loan, First Lien, 5.87%
(LIBOR01M+425bps), 11/24/28 (b) | | | 28,795,998 | | | | 28,374,425 | | |
Madison IAQ LLC, Initial Term Loans, First Lien, 4.89%
(LIBOR06M+325bps), 6/16/28 (b) | | | 20,295,000 | | | | 18,434,557 | | |
McGraw Hill Education, Inc., Initial Term Loan, First Lien, 5.55%
(LIBOR06M+475bps), 7/30/28 (b) | | | 21,614,287 | | | | 19,524,834 | | |
MHI Holdings LLC, Initial Term Loans, First Lien, 6.06%
(LIBOR01M+500bps), 9/20/26 (b) | | | 7,531,670 | | | | 7,173,915 | | |
Mileage Plus Holdings LLC, Initial Term Loan, First Lien, 7.31%
(LIBOR03M+525bps), 6/20/27 (b) | | | 25,000,000 | | | | 24,650,000 | | |
See notes to financial statements.
45
Victory Portfolios
Victory Floating Rate Fund | | Schedule of Portfolio Investments — continued
June 30, 2022 | |
(Unaudited)
Security Description | | Principal
Amount | | Value | |
Momentive Performance Materials, Inc., Initial Dollar Term Loan,
First Lien, 4.31% (LIBOR01M+325bps), 5/15/24 (b) | | $ | 8,622,688 | | | $ | 8,313,738 | | |
Navicure, Inc., Initial Term Loans, First Lien, 5.06% (LIBOR01M+400bps),
10/23/26 (b) | | | 10,832,690 | | | | 10,250,433 | | |
NorthRiver Midstream Finance LP, Initial Term Loan B, First Lien, 4.22%
(LIBOR03M+325bps), 10/1/25 (b) | | | 11,717,136 | | | | 11,405,343 | | |
Packaging Coordinators Midco, Inc., Term B Loans, First Lien, 4.76%
(LIBOR03M+375bps), 12/1/27 (b) | | | 13,053,361 | | | | 12,308,275 | | |
Padagis LLC, Term B Loans, First Lien, 5.72% (LIBOR03M+475bps),
7/6/28 (b) | | | 3,000,000 | | | | 2,752,500 | | |
Park River Holdings, Inc., Initial Term Loans, First Lien, 4.22%
(LIBOR03M+325bps), 1/20/28 (b) | | | 9,899,952 | | | | 8,056,086 | | |
Peraton Corp., Term B Loans, First Lien, 4.81% (LIBOR01M+375bps),
2/1/28 (b) | | | 11,150,543 | | | | 10,447,613 | | |
Petco Health and Wellness Co., Inc., Initial Term Loans, First Lien, 4.26%
(LIBOR03M+325bps), 2/25/28 (b) | | | 35,515,318 | | | | 33,401,091 | | |
PetSmart, Inc., Initial Term Loans, First Lien, 4.50% (LIBOR06M+375bps),
2/12/28 (b) | | | 28,561,737 | | | | 26,805,190 | | |
PG&E Corp., Term Loans, First Lien, 4.06% (LIBOR01M+300bps),
6/23/25 (b) | | | 10,794,774 | | | | 10,152,485 | | |
Phoenix Newco, Inc., Initial Term Loans, First Lien, 4.31%
(LIBOR01M+325bps), 11/15/28 (b) | | | 4,950,000 | | | | 4,638,150 | | |
Presidio Holdings, Inc., Term Loan B, First Lien, 4.74%
(LIBOR03M+350bps), 12/19/26 (b) | | | 6,620,829 | | | | 6,251,188 | | |
Presidio Holdings, Inc., Term Loan B, First Lien, 4.56%
(LIBOR01M+350bps), 12/19/26 (b) | | | 311,236 | | | | 293,859 | | |
Radiology Partners, Inc., Term Loan New, First Lien, 5.89%
(LIBOR01M+425bps), 7/9/25 (b) | | | 26,451,802 | | | | 23,634,685 | | |
Renaissance Holding Corp., Second Incremental Term Loans, First Lien,
5.58% (SOFR01M+450bps), 3/16/27 (b) | | | 2,500,000 | | | | 2,381,250 | | |
Rent-A-Center, Facility Term Loan B2, First Lien, 4.31%
(LIBOR01M+325bps), 2/17/28 (b) | | | 4,112,626 | | | | 3,688,532 | | |
Reynolds Group Holdings, Inc., Tranche B-2 U.S. Term Loans, First Lien,
4.31% (LIBOR01M+325bps), 2/16/26 (b) | | | 6,895,000 | | | | 6,416,694 | | |
Ring Container Technologies Group LLC, Initial Term Loans, First Lien,
4.27% (LIBOR06M+375bps), 8/5/28 (b) | | | 5,462,500 | | | | 5,175,719 | | |
Rising Tide Holdings, Inc., Initial Term Loan, First Lien, 5.81%
(LIBOR01M+475bps), 6/1/28 (b) | | | 10,907,393 | | | | 9,462,164 | | |
Robertshaw US Holding Corp., 2nd Lien Initial Term Loans, Second Lien,
9.06% (LIBOR01M+800bps), 2/15/26 (b) | | | 4,000,000 | | | | 2,600,000 | | |
Robertshaw US Holding Corp., Term Loan B, First Lien, 4.56%
(LIBOR01M+350bps), 2/28/25 (b) | | | 6,337,933 | | | | 5,146,908 | | |
Ryan Specialty Group LLC, TL, First Lien, 4.13% (SOFR01M+300bps),
9/1/27 (b) | | | 7,867,387 | | | | 7,552,692 | | |
Scientific Games International, Inc., Initial Term B Loans, First Lien,
4.36% (SOFR01M+300bps), 4/16/29 (b) | | | 11,000,000 | | | | 10,422,500 | | |
Sedgwick Claims Management Services, Inc., Initial Term Loans,
First Lien, 4.31% (LIBOR01M+325bps), 12/31/25 (b) | | | 6,925,752 | | | | 6,489,430 | | |
Sinclair Television Group, Inc., Term Loan B-3, First Lien, 4.06%
(LIBOR01M+300bps), 3/25/28 (b) | | | 15,894,761 | | | | 14,695,978 | | |
See notes to financial statements.
46
Victory Portfolios
Victory Floating Rate Fund | | Schedule of Portfolio Investments — continued
June 30, 2022 | |
(Unaudited)
Security Description | | Principal
Amount | | Value | |
Sparta US Holdco LLC, Initial Term Loan, First Lien, 4.62%
(LIBOR01M+350bps), 4/30/28 (b) | | $ | 3,980,000 | | | $ | 3,790,950 | | |
SRS Distribution, Inc., 2022 Refinancing Term Loans, First Lien, 4.00%
(SOFR06M+350bps), 6/4/28 (b) | | | 4,987,500 | | | | 4,582,266 | | |
SRS Distribution, Inc., 2021 Refinancing Term Loans, First Lien, 4.02%
(LIBOR06M+350bps), 6/4/28 (b) | | | 25,336,112 | | | | 23,321,891 | | |
Standard Aero Ltd., 2020 SPCFD Refi Term B-2 Loans, First Lien, 4.51%
(LIBOR03M+350bps), 4/8/26 (b) | | | 1,489,952 | | | | 1,370,011 | | |
Station Casinos LLC, Term B-1 Facility Loans, First Lien, 3.31%
(LIBOR01M+225bps), 2/8/27 (b) | | | 14,280,912 | | | | 13,404,207 | | |
Surgery Center Holdings, Inc., 2021 New Term Loans, First Lien, 4.95%
(LIBOR01M+375bps), 8/31/26 (b) | | | 22,304,934 | | | | 20,736,674 | | |
SWF Holdings Corp. I, Initial Term Loans, First Lien, 5.60%
(LIBOR01M+400bps), 10/6/28 (b) | | | 33,166,875 | | | | 27,155,379 | | |
Tailwind Smith Cooper Intermediate Corp., 2nd Lien Initial Term Loans,
Second Lien, 10.24% (LIBOR03M+900bps), 5/28/27 (b) | | | 3,000,000 | | | | 2,703,750 | | |
Team Health Holdings, Inc., Facility Extending TLB, First Lien, 6.28%
(SOFR01M+525bps), 2/17/27 (b) | | | 24,433,097 | | | | 20,432,177 | | |
Tenneco, Inc., Tranche B Term Loan, First Lien, 4.06%
(LIBOR01M+300bps), 10/1/25 (b) | | | 18,470,757 | | | | 17,731,927 | | |
The Men's Wearhouse LLC, Term Loan, First Lien, 9.29%
(LIBOR03M+800bps), 12/1/25 (b) | | | 2,759,111 | | | | 2,624,605 | | |
The Michaels Cos., Inc., Term B Loans, First Lien, 5.26%
(LIBOR03M+425bps), 4/15/28 (b) | | | 24,286,002 | | | | 19,941,479 | | |
Thor Industries, Inc., Term B-1, First Lien, 4.06% (LIBOR01M+300bps),
2/1/26 (b) | | | 6,476,602 | | | | 6,303,871 | | |
Titan Acquisition Ltd., Initial Term Loan, First Lien, 3.35%
(LIBOR06M+300bps), 3/28/25 (b) | | | 13,652,165 | | | | 12,488,864 | | |
Transdigm, Inc., Tranche F Refinancing Term Loan, First Lien, 3.31%
(LIBOR01M+225bps), 12/9/25 (b) | | | 14,780,207 | | | | 13,983,702 | | |
Traverse Midstream Partners LLC, Advance, First Lien, 5.95%
(SOFR06M+425bps) (b) | | | 320,824 | | | | 305,319 | | |
Traverse Midstream Partners LLC, Advance, First Lien, 5.38%
(SOFR03M+425bps), 9/27/24 (b) | | | 13,662,951 | | | | 13,002,620 | | |
TricorBraun Holdings, Inc., Closing Date Initial Term Loans, First Lien,
4.31% (LIBOR01M+325bps), 3/3/28 (b) | | | 12,636,843 | | | | 11,722,946 | | |
Trident TPI Holdings, Inc., Tranche B-3 DDTL Commitments, First Lien,
5.06% (LIBOR01M+400bps), 9/17/28 (d) | | | 372,574 | | | | 348,729 | | |
Trident TPI Holdings, Inc., Tranche B-3 DDTL Commitments, First Lien,
5.06% (LIBOR01M+400bps), 9/17/28 (b) (d) (e) | | | 556,109 | | | | 520,518 | | |
Trident TPI Holdings, Inc., Tranche B-3 Initial Term Loans, First Lien,
5.06% (LIBOR01M+400bps), 9/17/28 (b) | | | 6,525,110 | | | | 6,107,503 | | |
Triton Water Holdings, Inc., Initial Term Loan, First Lien, 4.51%
(LIBOR03M+350bps), 3/31/28 (b) | | | 15,753,275 | | | | 13,891,080 | | |
Truck Hero, Inc., Initial Term Loans, First Lien, 4.56%
(LIBOR01M+325bps), 2/24/28 (b) | | | 18,064,636 | | | | 16,113,656 | | |
U.S. Renal Care, Inc., Initial Term Loan, First Lien, 6.06%
(LIBOR01M+500bps), 7/26/26 (b) | | | 22,656,763 | | | | 15,430,841 | | |
See notes to financial statements.
47
Victory Portfolios
Victory Floating Rate Fund | | Schedule of Portfolio Investments — continued
June 30, 2022 | |
(Unaudited)
Security Description | | Principal
Amount | | Value | |
United Airlines, Inc., Class B Term Loans, First Lien, 5.39%
(LIBOR01M+375bps), 4/21/28 (b) | | $ | 20,779,649 | | | $ | 19,260,241 | | |
Univision Communications, Inc., 2021 Replacement New First-Lien Term,
First Lien, 4.31% (LIBOR01M+325bps), 3/24/26 (b) | | | 14,701,823 | | | | 13,862,643 | | |
Univision Communications, Inc., Initial First-Lien Term Loans, First Lien,
4.31% (LIBOR01M+325bps), 5/7/28 (b) | | | 8,478,750 | | | | 7,906,434 | | |
Upstream Rehabilitation, August 2021 Incremental TL, First Lien, 5.40%
(SOFR01M+425bps), 11/20/26 (b) | | | 6,944,962 | | | | 6,324,291 | | |
USI, Inc., 2017 New Term Loans, First Lien, 4.01% (LIBOR03M+300bps),
5/16/24 (b) | | | 17,529,466 | | | | 16,773,596 | | |
UTZ Quality Foods LLC, 2021 New Term Loans, First Lien, 4.06%
(LIBOR01M+300bps), 1/20/28 (b) | | | 3,900,011 | | | | 3,709,885 | | |
Verscend Holding Corp., New Term Loan B-1 Facility, First Lien, 5.06%
(LIBOR01M+400bps), 8/27/25 (b) | | | 9,788,064 | | | | 9,347,602 | | |
Weber-Stephen Products LLC, Initial Term B Loans, First Lien, 4.31%
(LIBOR01M+325bps), 10/30/27 (b) | | | 17,298,100 | | | | 15,654,780 | | |
Welbilt, Inc., Facility TL, First Lien, 3.56% (LIBOR01M+250bps),
10/23/25 (b) | | | 15,000,000 | | | | 14,743,800 | | |
WestJet Airlines Ltd., Initial Term Loan, First Lien, 4.74%
(LIBOR06M+300bps), 12/11/26 (b) | | | 23,754,272 | | | | 21,212,565 | | |
White Cap Buyer LLC, Initial Closing Date Term Loan, First Lien, 4.78%
(SOFR01M+375bps), 10/19/27 (b) | | | 11,337,734 | | | | 10,416,543 | | |
WireCo WorldGroup, Inc., Initial Term Loan, First Lien, 5.69%
(LIBOR03M+425bps), 11/13/28 (b) | | | 15,811,852 | | | | 14,823,611 | | |
WP CPP Holdings LLC, Term Loan Second Lien, Second Lien, 8.99%
(LIBOR03M+775bps), 4/30/26 (b) | | | 2,000,000 | | | | 1,620,000 | | |
WP CPP Holdings LLC, Term Loans, First Lien, 4.99%
(LIBOR03M+375bps), 4/30/25 (b) | | | 9,766,799 | | | | 8,050,674 | | |
WP CPP Holdings LLC, Term Loans, First Lien, 4.81%
(LIBOR01M+375bps), 4/30/25 (b) | | | 24,231 | | | | 19,973 | | |
Total Senior Secured Loans (Cost $1,997,542,041) | | | 1,816,538,895 | | |
Corporate Bonds (4.7%) | |
Communication Services (1.3%): | |
Audacy Capital Corp., 6.50%, 5/1/27, Callable 7/22/22 @ 104.88 (f) | | | 2,000,000 | | | | 1,215,260 | | |
CSC Holdings LLC
5.75%, 1/15/30, Callable 1/15/25 @ 102.88 (f) | | | 1,250,000 | | | | 909,400 | | |
Cumulus Media New Holdings, Inc., 6.75%, 7/1/26, Callable
8/8/22 @ 103.38 (f) (g) | | | 8,247,000 | | | | 7,600,600 | | |
Frontier Communications Holdings LLC, 5.00%, 5/1/28, Callable
5/1/24 @ 102.5 (f) (g) | | | 1,460,000 | | | | 1,247,643 | | |
iHeartCommunications, Inc., 8.38%, 5/1/27, Callable
7/22/22 @ 104.19 (g) | | | 4,500,000 | | | | 3,595,950 | | |
Sinclair Television Group, Inc., 5.50%, 3/1/30, Callable
12/1/24 @ 102.75 (f) (g) | | | 15,350,000 | | | | 11,360,075 | | |
| | | | 25,928,928 | | |
See notes to financial statements.
48
Victory Portfolios
Victory Floating Rate Fund | | Schedule of Portfolio Investments — continued
June 30, 2022 | |
(Unaudited)
Security Description | | Principal
Amount | | Value | |
Consumer Discretionary (0.8%): | |
Affinity Gaming, 6.88%, 12/15/27, Callable 12/1/23 @ 103.44 (f) (g) | | $ | 6,000,000 | | | $ | 5,044,860 | | |
Magic Mergeco, Inc., 7.88%, 5/1/29, Callable 5/1/24 @ 103.94 (f) (g) | | | 1,070,000 | | | | 708,511 | | |
Premier Entertainment Sub LLC/Premier Entertainment Finance Corp.,
5.88%, 9/1/31, Callable 9/1/26 @ 102.98 (f) (g) | | | 4,000,000 | | | | 2,774,680 | | |
Scientific Games Holdings LP/Scientific Games US FinCo., Inc., 6.63%,
3/1/30, Callable 3/1/25 @ 103.31 (f) (g) | | | 2,750,000 | | | | 2,338,793 | | |
Viking Cruises Ltd., 13.00%, 5/15/25, Callable 7/22/22 @ 109.75 (f) (g) | | | 6,000,000 | | | | 6,155,640 | | |
| | | | 17,022,484 | | |
Energy (0.5%): | |
Antero Midstream Partners LP/Antero Midstream Finance Corp.,
5.38%, 6/15/29, Callable 6/15/24 @ 102.69 (f) | | | 2,334,000 | | | | 2,093,131 | | |
CITGO Holding, Inc., 9.25%, 8/1/24, Callable 8/8/22 @ 102.31 (f) | | | 2,750,000 | | | | 2,676,273 | | |
PBF Holding Co. LLC/PBF Finance Corp., 6.00%, 2/15/28,
Callable 2/15/23 @ 103 | | | 5,534,000 | | | | 4,690,120 | | |
| | | | 9,459,524 | | |
Financials (0.3%): | |
Compass Group Diversified Holdings LLC, 5.25%, 4/15/29, Callable
4/15/24 @ 102.63 (f) (g) | | | 4,000,000 | | | | 3,313,520 | | |
SWF Escrow Issuer Corp., 6.50%, 10/1/29, Callable
10/1/24 @ 103.25 (f) (g) | | | 2,899,000 | | | | 2,024,835 | | |
U.S. Renal Care, Inc., 10.63%, 7/15/27, Callable 8/8/22 @ 105.31 (f) | | | 1,120,000 | | | | 434,000 | | |
| | | | 5,772,355 | | |
Health Care (1.5%): | |
Air Methods Corp., 8.00%, 5/15/25, Callable 8/8/22 @ 100 (f) (g) | | | 14,250,000 | | | | 9,325,628 | | |
Bausch Health Cos., Inc., 5.25%, 1/30/30, Callable
1/30/25 @ 102.63 (f) (g) | | | 10,466,000 | | | | 5,449,018 | | |
CHS/Community Health Systems, Inc., 6.13%, 4/1/30, Callable
4/1/25 @ 103.06 (f) | | | 6,500,000 | | | | 3,970,135 | | |
LifePoint Health, Inc., 5.38%, 1/15/29, Callable 1/15/24 @ 102.69 (f) | | | 2,650,000 | | | | 1,946,054 | | |
Radiology Partners, Inc., 9.25%, 2/1/28, Callable 2/1/23 @ 104.63 (f) (g) | | | 3,200,000 | | | | 2,404,864 | | |
Team Health Holdings, Inc., 6.38%, 2/1/25, Callable 7/22/22 @ 100 (f) (g) | | | 8,383,000 | | | | 5,906,494 | | |
| | | | 29,002,193 | | |
Industrials (0.2%): | |
American Airlines, Inc., 11.75%, 7/15/25 (f) (g) | | | 820,000 | | | | 848,692 | | |
Wabash National Corp., 4.50%, 10/15/28, Callable
10/15/24 @ 102.25 (f) (g) | | | 3,950,000 | | | | 3,078,788 | | |
| | | | 3,927,480 | | |
Information Technology (0.1%): | |
Caesars Entertainment, Inc., 8.13%, 7/1/27, Callable
7/1/23 @ 104.06 (f) (g) | | | 1,800,000 | | | | 1,735,668 | | |
Total Corporate Bonds (Cost $121,249,797) | | | 92,848,632 | | |
See notes to financial statements.
49
Victory Portfolios
Victory Floating Rate Fund | | Schedule of Portfolio Investments — continued
June 30, 2022 | |
(Unaudited)
Security Description | | Principal
Amount | | Value | |
Yankee Dollars (0.3%) | |
Communication Services (0.1%): | |
Telesat Canada/Telesat LLC, 5.63%, 12/6/26, Callable
12/6/23 @ 102.81 (f) (g) | | $ | 4,350,000 | | | $ | 2,708,571 | | |
Industrials (0.2%): | |
Bombardier, Inc., 7.88%, 4/15/27, Callable 8/8/22 @ 103.94 (f) (g) | | | 1,000,000 | | | | 832,320 | | |
VistaJet Malta Finance PLC/XO Management Holding, Inc., 6.38%,
2/1/30, Callable 2/1/25 @ 103.19 (f) (g) | | | 3,650,000 | | | | 2,921,569 | | |
| | | | 3,753,889 | | |
Total Yankee Dollars (Cost $8,231,809) | | | 6,462,460 | | |
Total Investments (Cost $2,127,216,018) — 97.4% | | | 1,915,985,930 | | |
Other assets in excess of liabilities — 2.6% | | | 50,444,902 | | |
NET ASSETS — 100.00% | | $ | 1,966,430,832 | | |
(a) Amount represents less than 0.05% of net assets.
(b) Variable or Floating-Rate Security. Rate disclosed is as of June 30, 2022.
(c) The rates for this senior secured loan will be known on settlement date of the loan, subsequent to this report date. Senior secured loans have rates that will fluctuate over time in line with prevailing interest rates.
(d) Security or a portion of the security purchased on a delayed-delivery and/or when-issued basis.
(e) The Fund may enter into certain credit agreements all or a portion of which may be unfunded. The Fund is obligated to fund these commitments at the borrower's discretion. At June 30, 2022, the Fund held unfunded or partially unfunded loan commitments of $1,202,027, which included a $84,449 unrealized loss.
(f) Rule 144A security or other security that is restricted as to resale to institutional investors. The Fund's Adviser has deemed this security to be liquid (unless otherwise noted as illiquid) based upon procedures approved by the Board of Trustees. As of June 30, 2022, the fair value of these securities was $91,025,022 and amounted to 4.6% of net assets.
(g) All or a portion of the security has been segregated as collateral for securities purchased on a delayed-delivery and/or when-issued basis.
bps — Basis points
LIBOR — London Interbank Offered Rate
LIBOR01M — 1 Month US Dollar LIBOR, rate disclosed as of June 30, 2022, based on the last reset date of the security
LIBOR03M — 3 Month US Dollar LIBOR, rate disclosed as of June 30, 2022, based on the last reset date of the security
LIBOR06M — 6 Month US Dollar LIBOR, rate disclosed as of June 30, 2022, based on the last reset date of the security
LLC — Limited Liability Company
LP — Limited Partnership
PLC — Public Limited Company
See notes to financial statements.
50
Victory Portfolios
Victory Floating Rate Fund | | Schedule of Portfolio Investments — continued
June 30, 2022 | |
(Unaudited)
REIT — Real Estate Investment Trust
SOFR — Secured Overnight Financing Rate
SOFR01M — 1 Month SOFR, rate disclosed as of June 30, 2022
SOFR03M — 3 Month SOFR, rate disclosed as of June 30, 2022
SOFR06M — 6 Month SOFR, rate disclosed as of June 30, 2022
See notes to financial statements.
51
Victory Portfolios | | Statements of Assets and Liabilities
June 30, 2022 | |
(Unaudited)
| | | Victory INCORE
Investment Quality
Bond Fund | | Victory INCORE
Low Duration
Bond Fund | | Victory High
Yield Fund | |
Assets: | |
Investments, at value (Cost $23,820,876,
$202,655,009 and $347,354,662) | | $ | 22,027,307 | (a) | | $ | 196,119,456 | (b) | | $ | 293,195,057 | (c) | |
Cash | | | 537,465 | | | | 5,885,886 | | | | 452,258 | | |
Deposit with broker for futures contracts | | | 254,791 | | | | 1,742,581 | | | | — | | |
Deposit with broker for swap contracts | | | 111,306 | | | | 1,051,703 | | | | — | | |
Receivables: | |
Interest and dividends | | | 129,828 | | | | 1,156,978 | | | | 5,167,848 | | |
Capital shares issued | | | 970 | | | | 105,727 | | | | 539,664 | | |
Investments sold | | | 6,424 | | | | — | | | | 6,941,067 | | |
Variation margin on open futures contracts | | | 30,560 | | | | 95,600 | | | | — | | |
Variation margin on open swap contracts | | | — | | | | 1,100 | | | | — | | |
From Adviser | | | 21,553 | | | | 22,453 | | | | 48,187 | | |
Prepaid expenses | | | 24,558 | | | | 36,681 | | | | 46,267 | | |
Total Assets | | | 23,144,762 | | | | 206,218,165 | | | | 306,390,348 | | |
Liabilities: | |
Payables: | |
Collateral received on loaned securities | | | 570,657 | | | | 3,033,487 | | | | 30,308,807 | | |
Distributions | | | 605 | | | | 37,896 | | | | 213,620 | | |
Investments purchased | | | 1,743,333 | | | | — | | | | 275,000 | | |
Capital shares redeemed | | | 5,465 | | | | 177,943 | | | | 660,347 | | |
Variation margin on open futures contracts | | | 14,378 | | | | 117,353 | | | | — | | |
Variation margin on open swap agreements | | | — | | | | 17,000 | | | | — | | |
Accrued expenses and other payables: | |
Investment advisory fees | | | 8,582 | | | | 75,064 | | | | 145,753 | | |
Administration fees | | | 928 | | | | 9,036 | | | | 13,110 | | |
Custodian fees | | | 1,463 | | | | 2,725 | | | | 4,416 | | |
Transfer agent fees | | | 8,971 | | | | 45,843 | | | | 60,640 | | |
Compliance fees | | | 12 | | | | 123 | | | | 191 | | |
| 12b-1 fees | | | 2,368 | | | | 10,702 | | | | 18,673 | | |
Other accrued expenses | | | 8,137 | | | | 19,430 | | | | 25,121 | | |
Total Liabilities | | | 2,364,899 | | | | 3,546,602 | | | | 31,725,678 | | |
Net Assets: | |
Capital | | | 22,442,083 | | | | 238,264,157 | | | | 338,262,881 | | |
Total accumulated earnings/(loss) | | | (1,662,220 | ) | | | (35,592,594 | ) | | | (63,598,211 | ) | |
Net Assets | | $ | 20,779,863 | | | $ | 202,671,563 | | | $ | 274,664,670 | | |
Net Assets | |
Class A | | $ | 16,369,256 | | | $ | 84,648,097 | | | $ | 34,439,186 | | |
Class C | | | 331,811 | | | | 4,748,110 | | | | 27,872,135 | | |
Class R | | | 2,751,982 | | | | 1,178,516 | | | | 15,904,789 | | |
Class Y | | | 1,326,814 | | | | 112,096,840 | | | | 196,448,560 | | |
Total | | $ | 20,779,863 | | | $ | 202,671,563 | | | $ | 274,664,670 | | |
Shares (unlimited number of shares authorized
with a par value of $0.001 per share): | |
Class A | | | 1,845,011 | | | | 8,714,296 | | | | 6,213,565 | | |
Class C | | | 37,418 | | | | 488,703 | | | | 5,016,852 | | |
Class R | | | 309,395 | | | | 121,338 | | | | 2,861,713 | | |
Class Y | | | 149,740 | | | | 11,536,419 | | | | 35,613,244 | | |
Total | | | 2,341,564 | | | | 20,860,756 | | | | 49,705,374 | | |
Net asset value, offering (except Class A)
and redemption price per share: | |
Class A | | $ | 8.87 | | | $ | 9.71 | | | $ | 5.54 | | |
Class C (d) | | | 8.87 | | | | 9.72 | | | | 5.56 | | |
Class R | | | 8.89 | | | | 9.71 | | | | 5.56 | | |
Class Y | | | 8.86 | | | | 9.72 | | | | 5.52 | | |
Maximum Sales Charge — Class A | | | 2.25 | % | | | 2.25 | % | | | 2.25 | % | |
Maximum offering price
(100%/(100%-maximum sales charge) of
net asset value adjusted to the nearest cent)
per share — Class A | | $ | 9.07 | | | $ | 9.93 | | | $ | 5.67 | | |
(a) Includes $552,020 of securities on loan.
(b) Includes $2,955,531 of securities on loan.
(c) Includes $28,669,708 of securities on loan.
(d) Redemption price per share varies by the length of time shares are held.
See notes to financial statements.
52
Victory Portfolios | | Statements of Assets and Liabilities
June 30, 2022 | |
(Unaudited)
| | | Victory
Tax-Exempt
Fund | | Victory
High Income
Municipal Bond
Fund | | Victory
Floating
Rate Fund | |
Assets: | |
Investments, at value (Cost $51,603,579,
$46,802,573 and $2,127,216,018) | | $ | 49,366,209 | | | $ | 42,090,282 | | | $ | 1,915,985,930 | | |
Cash | | | 158,002 | | | | 343,676 | | | | 2,614,289 | | |
Receivables: | |
Interest and dividends | | | 517,374 | | | | 560,607 | | | | 14,852,153 | | |
Capital shares issued | | | 3,407 | | | | 3,569 | | | | 2,760,260 | | |
Investments sold | | | — | | | | — | | | | 80,142,670 | | |
From Adviser | | | 19,690 | | | | 23,999 | | | | 286,380 | | |
Prepaid expenses | | | 28,835 | | | | 19,090 | | | | 43,138 | | |
Total Assets | | | 50,093,517 | | | | 43,041,223 | | | | 2,016,684,820 | | |
Liabilities: | |
Payables: | |
Distributions | | | 7,752 | | | | 7,932 | | | | 1,547,691 | | |
To affiliate on interfund lending | | | — | | | | — | | | | 18,261,000 | | |
Investments purchased | | | 552,040 | | | | — | | | | 14,349,010 | | |
Capital shares redeemed | | | 39,271 | | | | 93,851 | | | | 14,329,908 | | |
Accrued expenses and other payables: | |
Investment advisory fees | | | 20,498 | | | | 17,761 | | | | 1,125,533 | | |
Administration fees | | | 2,215 | | | | 1,916 | | | | 94,514 | | |
Custodian fees | | | 1,741 | | | | 1,788 | | | | 42,804 | | |
Transfer agent fees | | | 9,687 | | | | 8,243 | | | | 312,632 | | |
Compliance fees | | | 30 | | | | 26 | | | | 1,393 | | |
Trustees' fees | | | — | | | | — | | | | 1,775 | | |
| 12b-1 fees | | | 4,123 | | | | 3,475 | | | | 62,438 | | |
Other accrued expenses | | | 8,537 | | | | 7,437 | | | | 125,290 | | |
Total Liabilities | | | 645,894 | | | | 142,429 | | | | 50,253,988 | | |
Net Assets: | |
Capital | | | 51,982,115 | | | | 47,698,740 | | | | 2,404,014,212 | | |
Total accumulated earnings/(loss) | | | (2,534,492 | ) | | | (4,799,946 | ) | | | (437,583,380 | ) | |
Net Assets | | $ | 49,447,623 | | | $ | 42,898,794 | | | $ | 1,966,430,832 | | |
Net Assets | |
Class A | | $ | 33,721,809 | | | $ | 27,776,708 | | | $ | 303,348,746 | | |
Class C | | | 1,687,767 | | | | 1,587,845 | | | | 72,649,797 | | |
Class R | | | — | | | | — | | | | 569,248 | | |
Class Y | | | 14,038,047 | | | | 10,218,562 | | | | 1,585,656,398 | | |
Member Class | | | — | | | | 3,315,679 | | | | 4,206,643 | | |
Total | | $ | 49,447,623 | | | $ | 42,898,794 | | | $ | 1,966,430,832 | | |
Shares (unlimited number of shares authorized
with a par value of $0.001 per share): | |
Class A | | | 3,943,947 | | | | 2,949,825 | | | | 36,155,571 | | |
Class C | | | 197,488 | | | | 168,643 | | | | 8,655,108 | | |
Class R | | | — | | | | — | | | | 67,862 | | |
Class Y | | | 1,642,524 | | | | 1,085,045 | | | | 188,903,976 | | |
Member Class | | | — | | | | 352,094 | | | | 501,530 | | |
Total | | | 5,783,959 | | | | 4,555,607 | | | | 234,284,047 | | |
Net asset value, offering (except Class A)
and redemption price per share: | |
Class A | | $ | 8.55 | | | $ | 9.42 | | | $ | 8.39 | | |
Class C (a) | | | 8.55 | | | | 9.42 | | | | 8.39 | | |
Class R | | | — | | | | — | | | | 8.39 | | |
Class Y | | | 8.55 | | | | 9.42 | | | | 8.39 | | |
Member Class | | | — | | | | 9.42 | | | | 8.39 | | |
Maximum Sales Charge — Class A | | | 2.25 | % | | | 2.25 | % | | | 2.25 | % | |
Maximum offering price
(100%/(100%-maximum sales charge) of
net asset value adjusted to the nearest cent)
per share — Class A | | $ | 8.75 | | | $ | 9.64 | | | $ | 8.58 | | |
(a) Redemption price per share varies by the length of time shares are held.
See notes to financial statements.
53
Victory Portfolios | | Statements of Operations
For the Six Months Ended June 30, 2022 | |
(Unaudited)
| | | Victory INCORE
Investment Quality
Bond Fund | | Victory
INCORE
Low Duration
Bond Fund | | Victory
High
Yield Fund | |
Investment Income: | | | |
Dividends | | $ | 27,866 | | | $ | 159,436 | | | $ | 80,538 | | |
Interest | | | 221,866 | | | | 1,630,247 | | | | 11,009,965 | | |
Securities lending (net of fees) | | | 2,938 | | | | 17,713 | | | | 162,296 | | |
Total Income | | | 252,670 | | | | 1,807,396 | | | | 11,252,799 | | |
Expenses: | | | |
Investment advisory fees | | | 55,261 | | | | 463,192 | | | | 969,805 | | |
Administration fees | | | 5,972 | | | | 55,620 | | | | 87,329 | | |
Sub-Administration fees | | | 8,428 | | | | 8,428 | | | | 8,428 | | |
| 12b-1 fees — Class A | | | 21,706 | | | | 97,044 | | | | 53,601 | | |
| 12b-1 fees — Class C | | | 2,061 | | | | 26,099 | | | | 155,560 | | |
| 12b-1 fees — Class R | | | 7,217 | | | | 2,962 | | | | 44,710 | | |
Custodian fees | | | 4,357 | | | | 8,269 | | | | 13,520 | | |
Transfer agent fees — Class A | | | 15,742 | | | | 51,909 | | | | 22,236 | | |
Transfer agent fees — Class C | | | 280 | | | | 1,812 | | | | 8,023 | | |
Transfer agent fees — Class R | | | 3,025 | | | | 858 | | | | 2,348 | | |
Transfer agent fees — Class Y | | | 939 | | | | 47,261 | | | | 136,751 | | |
Trustees' fees | | | 1,360 | | | | 6,498 | | | | 10,044 | | |
Compliance fees | | | 80 | | | | 729 | | | | 1,168 | | |
Legal and audit fees | | | 5,840 | | | | 10,932 | | | | 14,755 | | |
State registration and filing fees | | | 25,600 | | | | 31,190 | | | | 40,555 | | |
Other expenses | | | 10,830 | | | | 17,725 | | | | 26,255 | | |
Total Expenses | | | 168,698 | | | | 830,528 | | | | 1,595,088 | | |
Expenses waived/reimbursed by Adviser | | | (63,495 | ) | | | (73,336 | ) | | | (123,693 | ) | |
Net Expenses | | | 105,203 | | | | 757,192 | | | | 1,471,395 | | |
Net Investment Income (Loss) | | | 147,467 | | | | 1,050,204 | | | | 9,781,404 | | |
Realized/Unrealized Gains (Losses) from
Investments: | | | |
Net realized gains (losses) from investment
securities | | | (251,181 | ) | | | (1,280,621 | ) | | | (7,191,413 | ) | |
Net realized gains (losses) from futures
contracts | | | (119,963 | ) | | | 1,638,273 | | | | — | | |
Net realized gains (losses) from swap
agreements | | | 6,365 | | | | (108,260 | ) | | | — | | |
Net change in unrealized appreciation/
depreciation on investment securities | | | (2,517,629 | ) | | | (8,945,611 | ) | | | (57,516,476 | ) | |
Net change in unrealized appreciation/
depreciation on futures contracts | | | 34,508 | | | | 105,804 | | | | — | | |
Net change in unrealized appreciation/
depreciation on swap agreements | | | (258 | ) | | | (584,075 | ) | | | — | | |
Net realized/unrealized gains (losses)
on investments | | | (2,848,158 | ) | | | (9,174,490 | ) | | | (64,707,889 | ) | |
Change in net assets resulting from operations | | $ | (2,700,691 | ) | | $ | (8,124,286 | ) | | $ | (54,926,485 | ) | |
See notes to financial statements.
54
Victory Portfolios | | Statements of Operations
For the Six Months Ended June 30, 2022 | |
(Unaudited)
| | | Victory
Tax-Exempt
Fund | | Victory
High Income
Municipal Bond
Fund | | Victory
Floating
Rate Fund | |
Investment Income: | | | |
Dividends | | $ | 3,847 | | | $ | 8,273 | | | $ | 555,552 | | |
Interest | | | 1,013,330 | | | | 1,108,135 | | | | 57,475,806 | | |
Total Income | | | 1,017,177 | | | | 1,116,408 | | | | 58,031,358 | | |
Expenses: | | | |
Investment advisory fees | | | 122,928 | | | | 119,689 | | | | 7,412,664 | | |
Administration fees | | | 13,286 | | | | 12,934 | | | | 616,152 | | |
Sub-Administration fees | | | 8,428 | | | | 8,428 | | | | 8,429 | | |
| 12b-1 fees — Class A | | | 41,228 | | | | 38,391 | | | | 432,784 | | |
| 12b-1 fees — Class C | | | 9,276 | | | | 9,277 | | | | 399,515 | | |
| 12b-1 fees — Class R | | | — | | | | — | | | | 1,519 | | |
Custodian fees | | | 3,643 | | | | 3,869 | | | | 128,797 | | |
Transfer agent fees — Class A | | | 13,002 | | | | 9,246 | | | | 158,811 | | |
Transfer agent fees — Class C | | | 1,015 | | | | 870 | | | | 35,011 | | |
Transfer agent fees — Class R | | | — | | | | — | | | | 513 | | |
Transfer agent fees — Class Y | | | 6,182 | | | | 4,340 | | | | 709,301 | | |
Transfer agent fees — Member Class | | | — | | | | 958 | | | | 1,792 | | |
Trustees' fees | | | 2,124 | | | | 2,113 | | | | 64,438 | | |
Compliance fees | | | 175 | | | | 174 | | | | 8,104 | | |
Legal and audit fees | | | 5,830 | | | | 5,806 | | | | 121,781 | | |
State registration and filing fees | | | 20,426 | | | | 29,643 | | | | 124,863 | | |
Interfund lending fees | | | — | | | | — | | | | 7,783 | | |
Other expenses | | | 7,204 | | | | 8,505 | | | | 131,941 | | |
Total Expenses | | | 254,747 | | | | 254,243 | | | | 10,364,198 | | |
Expenses waived/reimbursed by Adviser | | | (58,582 | ) | | | (72,209 | ) | | | (674,173 | ) | |
Net Expenses | | | 196,165 | | | | 182,034 | | | | 9,690,025 | | |
Net Investment Income (Loss) | | | 821,012 | | | | 934,374 | | | | 48,341,333 | | |
Realized/Unrealized Gains (Losses) from
Investments: | | | |
Net realized gains (losses) from investment
securities | | | 14,763 | | | | (69,810 | ) | | | (41,840,643 | ) | |
Net change in unrealized appreciation/
depreciation on investment securities | | | (6,642,643 | ) | | | (7,898,424 | ) | | | (199,567,574 | ) | |
Net realized/unrealized gains (losses) on
investments | | | (6,627,880 | ) | | | (7,968,234 | ) | | | (241,408,217 | ) | |
Change in net assets resulting from operations | | $ | (5,806,868 | ) | | $ | (7,033,860 | ) | | $ | (193,066,884 | ) | |
See notes to financial statements.
55
Victory Portfolios | | Statements of Changes in Net Assets | |
| | | Victory
INCORE Investment
Quality Bond Fund | | Victory
INCORE Low Duration
Bond Fund | | Victory
High Yield Fund | |
| | | Six
Months
Ended
June 30,
2022
(Unaudited) | | Year
Ended
December 31,
2021 | | Six
Months
Ended
June 30,
2022
(Unaudited) | | Year
Ended
December 31,
2021 | | Six
Months
Ended
June 30,
2022
(Unaudited) | | Year
Ended
December 31,
2021 | |
From Investment
Activities: | |
Operations: | |
Net Investment
Income (Loss) | | $ | 147,467 | | | $ | 302,821 | | | $ | 1,050,204 | | | $ | 2,291,642 | | | $ | 9,781,404 | | | $ | 15,725,344 | | |
Net realized gains
(losses) from
investments | | | (364,779 | ) | | | 414,092 | | | | 249,392 | | | | 2,765,191 | | | | (7,191,413 | ) | | | 5,672,619 | | |
Net change in
unrealized
appreciation/
depreciation
on investments | | | (2,483,379 | ) | | | (892,085 | ) | | | (9,423,882 | ) | | | (3,020,467 | ) | | | (57,516,476 | ) | | | (7,935,627 | ) | |
Change in net assets
resulting from
operations | | | (2,700,691 | ) | | | (175,172 | ) | | | (8,124,286 | ) | | | 2,036,366 | | | | (54,926,485 | ) | | | 13,462,336 | | |
Distributions to Shareholders: | |
Class A | | | (136,029 | ) | | | (336,494 | ) | | | (442,323 | ) | | | (879,844 | ) | | | (1,273,385 | ) | | | (2,461,269 | ) | |
Class C | | | (1,409 | ) | | | (5,625 | ) | | | (9,372 | ) | | | (21,804 | ) | | | (814,806 | ) | | | (1,335,016 | ) | |
Class R | | | (16,725 | ) | | | (40,583 | ) | | | (4,230 | ) | | | (7,637 | ) | | | (505,744 | ) | | | (979,672 | ) | |
Class Y | | | (13,013 | ) | | | (38,987 | ) | | | (825,378 | ) | | | (1,922,795 | ) | | | (7,217,382 | ) | | | (11,295,501 | ) | |
Change in net assets
resulting from
distributions to
shareholders | | | (167,176 | ) | | | (421,689 | ) | | | (1,281,303 | ) | | | (2,832,080 | ) | | | (9,811,317 | ) | | | (16,071,458 | ) | |
Change in net assets
resulting from
capital transactions | | | (972,839 | ) | | | (5,104,106 | ) | | | (5,209,767 | ) | | | (42,237,361 | ) | | | 615,134 | | | | 88,777,937 | | |
Change in net assets | | | (3,840,706 | ) | | | (5,700,967 | ) | | | (14,615,356 | ) | | | (43,033,075 | ) | | | (64,122,668 | ) | | | 86,168,815 | | |
Net Assets: | |
Beginning of period | | | 24,620,569 | | | | 30,321,536 | | | | 217,286,919 | | | | 260,319,994 | | | | 338,787,338 | | | | 252,618,523 | | |
End of period | | $ | 20,779,863 | | | $ | 24,620,569 | | | $ | 202,671,563 | | | $ | 217,286,919 | | | $ | 274,664,670 | | | $ | 338,787,338 | | |
(continues on next page)
See notes to financial statements.
56
Victory Portfolios | | Statements of Changes in Net Assets | |
(continued)
| | | Victory
INCORE Investment
Quality Bond Fund | | Victory
INCORE Low Duration
Bond Fund | | Victory
High Yield Fund | |
| | | Six
Months
Ended
June 30,
2022
(Unaudited) | | Year
Ended
December 31,
2021 | | Six
Months
Ended
June 30,
2022
(Unaudited) | | Year
Ended
December 31,
2021 | | Six
Months
Ended
June 30,
2022
(Unaudited) | | Year
Ended
December 31,
2021 | |
Capital Transactions: | |
Class A | |
Proceeds from
shares issued | | $ | 674,579 | | | $ | 3,219,691 | | | $ | 23,637,951 | | | $ | 27,443,659 | | | $ | 2,555,513 | | | $ | 18,887,212 | | |
Distributions
reinvested | | | 132,413 | | | | 327,179 | | | | 401,474 | | | | 797,627 | | | | 875,733 | | | | 1,668,744 | | |
Cost of shares
redeemed | | | (1,476,847 | ) | | | (5,233,205 | ) | | | (12,758,167 | ) | | | (21,402,058 | ) | | | (9,821,871 | ) | | | (9,668,773 | ) | |
Total Class A | | $ | (669,855 | ) | | $ | (1,686,335 | ) | | $ | 11,281,258 | | | $ | 6,839,228 | | | $ | (6,390,625 | ) | | $ | 10,887,183 | | |
Class C | |
Proceeds from
shares issued | | $ | 830 | | | $ | 1,689 | | | $ | 1,109,704 | | | $ | 1,947,527 | | | $ | 2,666,605 | | | $ | 10,304,554 | | |
Distributions
reinvested | | | 1,409 | | | | 5,578 | | | | 8,934 | | | | 20,254 | | | | 472,626 | | | | 672,575 | | |
Cost of shares
redeemed | | | (100,496 | ) | | | (2,020,890 | ) | | | (1,665,272 | ) | | | (19,935,340 | ) | | | (1,937,916 | ) | | | (3,823,976 | ) | |
Total Class C | | $ | (98,257 | ) | | $ | (2,013,623 | ) | | $ | (546,634 | ) | | $ | (17,967,559 | ) | | $ | 1,201,315 | | | $ | 7,153,153 | | |
Class R | |
Proceeds from
shares issued | | $ | 68,919 | | | $ | 265,416 | | | $ | 161,059 | | | $ | 250,815 | | | $ | 275,157 | | | $ | 979,946 | | |
Distributions
reinvested | | | 16,714 | | | | 40,505 | | | | 4,230 | | | | 7,615 | | | | 59,523 | | | | 107,948 | | |
Cost of shares
redeemed | | | (170,725 | ) | | | (626,813 | ) | | | (146,188 | ) | | | (169,252 | ) | | | (93,240 | ) | | | (984,832 | ) | |
Total Class R | | $ | (85,092 | ) | | $ | (320,892 | ) | | $ | 19,101 | | | $ | 89,178 | | | $ | 241,440 | | | $ | 103,062 | | |
Class Y | |
Proceeds from
shares issued | | $ | 45,972 | | | $ | 432,578 | | | $ | 28,884,297 | | | $ | 70,433,564 | | | $ | 92,123,798 | | | $ | 189,927,452 | | |
Distributions
reinvested | | | 12,882 | | | | 38,854 | | | | 667,781 | | | | 1,562,121 | | | | 7,208,339 | | | | 11,280,860 | | |
Cost of shares
redeemed | | | (178,489 | ) | | | (1,554,688 | ) | | | (45,515,570 | ) | | | (103,193,893 | ) | | | (93,769,133 | ) | | | (130,573,773 | ) | |
Total Class Y | | $ | (119,635 | ) | | $ | (1,083,256 | ) | | $ | (15,963,492 | ) | | $ | (31,198,208 | ) | | $ | 5,563,004 | | | $ | 70,634,539 | | |
Change in net assets
resulting from capital
transactions | | $ | (972,839 | ) | | $ | (5,104,106 | ) | | $ | (5,209,767 | ) | | $ | (42,237,361 | ) | | $ | 615,134 | | | $ | 88,777,937 | | |
(continues on next page)
See notes to financial statements.
57
Victory Portfolios | | Statements of Changes in Net Assets | |
(continued)
| | | Victory
INCORE Investment
Quality Bond Fund | | Victory
INCORE Low Duration
Bond Fund | | Victory
High Yield Fund | |
| | | Six
Months
Ended
June 30,
2022
(Unaudited) | | Year
Ended
December 31,
2021 | | Six
Months
Ended
June 30,
2022
(Unaudited) | | Year
Ended
December 31,
2021 | | Six
Months
Ended
June 30,
2022
(Unaudited) | | Year
Ended
December 31,
2021 | |
Share Transactions: | |
Class A | |
Issued | | | 71,332 | | | | 317,256 | | | | 2,396,053 | | | | 2,689,921 | | | | 406,399 | | | | 2,747,182 | | |
Reinvested | | | 14,218 | | | | 32,480 | | | | 40,636 | | | | 78,254 | | | | 141,007 | | | | 243,419 | | |
Redeemed | | | (155,212 | ) | | | (519,236 | ) | | | (1,290,046 | ) | | | (2,097,475 | ) | | | (1,584,935 | ) | | | (1,409,340 | ) | |
Total Class A | | | (69,662 | ) | | | (169,500 | ) | | | 1,146,643 | | | | 670,700 | | | | (1,037,529 | ) | | | 1,581,261 | | |
Class C | |
Issued | | | 89 | | | | 167 | | | | 111,789 | | | | 191,248 | | | | 421,830 | | | | 1,495,332 | | |
Reinvested | | | 151 | | | | 554 | | | | 906 | | | | 1,986 | | | | 76,171 | | | | 97,913 | | |
Redeemed | | | (10,851 | ) | | | (198,568 | ) | | | (167,924 | ) | | | (1,954,241 | ) | | | (310,567 | ) | | | (555,259 | ) | |
Total Class C | | | (10,611 | ) | | | (197,847 | ) | | | (55,229 | ) | | | (1,761,007 | ) | | | 187,434 | | | | 1,037,986 | | |
Class R | |
Issued | | | 7,376 | | | | 26,305 | | | | 16,141 | | | | 24,662 | | | | 42,767 | | | | 141,863 | | |
Reinvested | | | 1,792 | | | | 4,012 | | | | 428 | | | | 747 | | | | 9,599 | | | | 15,703 | | |
Redeemed | | | (17,592 | ) | | | (62,127 | ) | | | (14,695 | ) | | | (16,595 | ) | | | (15,076 | ) | | | (143,250 | ) | |
Total Class R | | | (8,424 | ) | | | (31,810 | ) | | | 1,874 | | | | 8,814 | | | | 37,290 | | | | 14,316 | | |
Class Y | |
Issued | | | 4,938 | | | | 42,628 | | | | 2,905,887 | | | | 6,908,185 | | | | 14,406,017 | | | | 27,774,023 | | |
Reinvested | | | 1,384 | | | | 3,862 | | | | 67,489 | | | | 153,191 | | | | 1,169,035 | | | | 1,654,148 | | |
Redeemed | | | (18,970 | ) | | | (153,909 | ) | | | (4,584,840 | ) | | | (10,114,574 | ) | | | (15,066,232 | ) | | | (19,136,526 | ) | |
Total Class Y | | | (12,648 | ) | | | (107,419 | ) | | | (1,611,464 | ) | | | (3,053,198 | ) | | | 508,820 | | | | 10,291,645 | | |
Change in Shares | | | (101,345 | ) | | | (506,576 | ) | | | (518,176 | ) | | | (4,134,691 | ) | | | (303,985 | ) | | | 12,925,208 | | |
See notes to financial statements.
58
Victory Portfolios | | Statements of Changes in Net Assets | |
| | | Victory
Tax-Exempt Fund | | Victory
High Income
Municipal Bond Fund | | Victory
Floating Rate Fund | |
| | | Six
Months
Ended
June 30,
2022
(Unaudited) | | Year
Ended
December 31,
2021 | | Six
Months
Ended
June 30,
2022
(Unaudited) | | Year
Ended
December 31,
2021 | | Six
Months
Ended
June 30,
2022
(Unaudited) | | Year
Ended
December 31,
2021 | |
From Investment Activities: | |
Operations: | |
Net investment
income (loss) | | $ | 821,012 | | | $ | 1,441,183 | | | $ | 934,374 | | | $ | 1,590,070 | | | $ | 48,341,333 | | | $ | 65,098,792 | | |
Net realized gains
(losses) from
investments | | | 14,763 | | | | 1,382,468 | | | | (69,810 | ) | | | 209,201 | | | | (41,840,643 | ) | | | 408,615 | | |
Net change in
unrealized
appreciation/
depreciation on
investments | | | (6,642,643 | ) | | | (770,070 | ) | | | (7,898,424 | ) | | | 1,002,109 | | | | (199,567,574 | ) | | | (12,438,598 | ) | |
Change in net assets
resulting from
operations | | | (5,806,868 | ) | | | 2,053,581 | | | | (7,033,860 | ) | | | 2,801,380 | | | | (193,066,884 | ) | | | 53,068,809 | | |
Distributions to Shareholders: | |
Class A | | | (550,202 | ) | | | (1,954,076 | ) | | | (594,184 | ) | | | (1,162,366 | ) | | | (7,163,198 | ) | | | (11,345,229 | ) | |
Class C | | | (23,491 | ) | | | (103,696 | ) | | | (28,585 | ) | | | (78,359 | ) | | | (1,327,377 | ) | | | (2,286,259 | ) | |
Class R | | | — | | | | — | | | | — | | | | — | | | | (10,878 | ) | | | (16,736 | ) | |
Class Y | | | (247,319 | ) | | | (814,249 | ) | | | (250,606 | ) | | | (435,742 | ) | | | (40,365,698 | ) | | | (51,994,941 | ) | |
Member Class | | | — | | | | — | | | | (60,999 | ) | | | (45,997 | ) | | | (88,591 | ) | | | (35,024 | ) | |
Change in net assets
resulting from
distributions to
shareholders | | | (821,012 | ) | | | (2,872,021 | ) | | | (934,374 | ) | | | (1,722,464 | ) | | | (48,955,742 | ) | | | (65,678,189 | ) | |
Change in net assets
resulting from
capital transactions | | | 4,756,285 | | | | (9,358,432 | ) | | | (2,617,707 | ) | | | 6,876,625 | | | | 6,014,083 | | | | 1,551,086,684 | | |
Change in net assets | | | (1,871,595 | ) | | | (10,176,872 | ) | | | (10,585,941 | ) | | | 7,955,541 | | | | (236,008,543 | ) | | | 1,538,477,304 | | |
Net Assets: | |
Beginning of period | | | 51,319,218 | | | | 61,496,090 | | | | 53,484,735 | | | | 45,529,194 | | | | 2,202,439,375 | | | | 663,962,071 | | |
End of period | | $ | 49,447,623 | | | $ | 51,319,218 | | | $ | 42,898,794 | | | $ | 53,484,735 | | | $ | 1,966,430,832 | | | $ | 2,202,439,375 | | |
(continues on next page)
See notes to financial statements.
59
Victory Portfolios | | Statements of Changes in Net Assets | |
(continued)
| | | Victory
Tax-Exempt Fund | | Victory
High Income
Municipal Bond Fund | | Victory
Floating Rate Fund | |
| | | Six
Months
Ended
June 30,
2022
(Unaudited) | | Year
Ended
December 31,
2021 | | Six
Months
Ended
June 30,
2022
(Unaudited) | | Year
Ended
December 31,
2021 | | Six
Months
Ended
June 30,
2022
(Unaudited) | | Year
Ended
December 31,
2021 | |
Capital Transactions: | |
Class A | |
Proceeds from shares
issued | | $ | 8,698,504 | | | $ | 7,231,915 | | | $ | 336,020 | | | $ | 9,753,917 | | | $ | 75,487,539 | | | $ | 266,345,825 | | |
Distributions
reinvested | | | 511,085 | | | | 1,806,265 | | | | 552,147 | | | | 1,080,764 | | | | 6,274,877 | | | | 10,126,690 | | |
Cost of shares
redeemed | | | (6,384,063 | ) | | | (5,160,768 | ) | | | (2,377,450 | ) | | | (3,548,527 | ) | | | (91,865,509 | ) | | | (90,141,473 | ) | |
Total Class A | | $ | 2,825,526 | | | $ | 3,877,412 | | | $ | (1,489,283 | ) | | $ | 7,286,154 | | | $ | (10,103,093 | ) | | $ | 186,331,042 | | |
Class C | |
Proceeds from shares
issued | | $ | 268,511 | | | $ | 212,297 | | | $ | 19,878 | | | $ | 234,228 | | | $ | 12,437,949 | | | $ | 48,665,824 | | |
Distributions
reinvested | | | 22,294 | | | | 99,658 | | | | 28,445 | | | | 74,083 | | | | 1,185,416 | | | | 2,087,262 | | |
Cost of shares
redeemed | | | (385,258 | ) | | | (4,766,843 | ) | | | (347,200 | ) | | | (7,590,095 | ) | | | (13,723,713 | ) | | | (64,541,146 | ) | |
Total Class C | | $ | (94,453 | ) | | $ | (4,454,888 | ) | | $ | (298,877 | ) | | $ | (7,281,784 | ) | | $ | (100,348 | ) | | $ | (13,788,060 | ) | |
Class R | |
Proceeds from shares
issued | | $ | — | | | $ | — | | | $ | — | | | $ | — | | | $ | 153,717 | | | $ | 370,964 | | |
Distributions
reinvested | | | — | | | | — | | | | — | | | | — | | | | 10,778 | | | | 16,539 | | |
Cost of shares
redeemed | | | — | | | | — | | | | — | | | | — | | | | (132,931 | ) | | | (82,647 | ) | |
Total Class R | | $ | — | | | $ | — | | | $ | — | | | $ | — | | | $ | 31,564 | | | $ | 304,856 | | |
Class Y | |
Proceeds from shares
issued | | $ | 6,481,699 | | | $ | 7,289,073 | | | $ | 1,911,300 | | | $ | 5,118,372 | | | $ | 793,701,476 | | | $ | 1,691,635,496 | | |
Distributions
reinvested | | | 240,337 | | | | 789,622 | | | | 244,721 | | | | 423,799 | | | | 34,145,638 | | | | 45,070,085 | | |
Cost of shares
redeemed | | | (4,696,824 | ) | | | (16,859,651 | ) | | | (3,943,276 | ) | | | (1,382,882 | ) | | | (814,213,526 | ) | | | (360,535,842 | ) | |
Total Class Y | | $ | 2,025,212 | | | $ | (8,780,956 | ) | | $ | (1,787,255 | ) | | $ | 4,159,289 | | | $ | 13,633,588 | | | $ | 1,376,169,739 | | |
Member Class | |
Proceeds from shares
issued | | $ | — | | | $ | — | | | $ | 1,816,602 | | | $ | 2,791,673 | | | $ | 3,210,456 | | | $ | 2,614,800 | | |
Distributions
reinvested | | | — | | | | — | | | | 60,999 | | | | 45,997 | | | | 88,591 | | | | 35,024 | | |
Cost of shares
redeemed | | | — | | | | — | | | | (919,893 | ) | | | (124,704 | ) | | | (746,675 | ) | | | (580,717 | ) | |
Total
Member Class | | $ | — | | | $ | — | | | $ | 957,708 | | | $ | 2,712,966 | | | $ | 2,552,372 | | | $ | 2,069,107 | | |
Change in net assets
resulting from capital
transactions | | $ | 4,756,285 | | | $ | (9,358,432 | ) | | $ | (2,617,707 | ) | | $ | 6,876,625 | | | $ | 6,014,083 | | | $ | 1,551,086,684 | | |
(continues on next page)
See notes to financial statements.
60
Victory Portfolios | | Statements of Changes in Net Assets | |
(continued)
| | | Victory
Tax-Exempt Fund | | Victory
High Income
Municipal Bond Fund | | Victory
Floating Rate Fund | |
| | | Six
Months
Ended
June 30,
2022
(Unaudited) | | Year
Ended
December 31,
2021 | | Six
Months
Ended
June 30,
2022
(Unaudited) | | Year
Ended
December 31,
2021 | | Six
Months
Ended
June 30,
2022
(Unaudited) | | Year
Ended
December 31,
2021 | |
Share Transactions: | |
Class A | |
Issued | | | 996,879 | | | | 722,275 | | | | 33,424 | | | | 892,208 | | | | 8,257,660 | | | | 28,352,164 | | |
Reinvested | | | 56,732 | | | | 182,127 | | | | 54,872 | | | | 97,863 | | | | 703,369 | | | | 1,079,897 | | |
Redeemed | | | (719,474 | ) | | | (514,040 | ) | | | (236,931 | ) | | | (321,447 | ) | | | (10,289,489 | ) | | | (9,602,493 | ) | |
Total Class A | | | 334,137 | | | | 390,362 | | | | (148,635 | ) | | | 668,624 | | | | (1,328,460 | ) | | | 19,829,568 | | |
Class C | |
Issued | | | 28,033 | | | | 21,295 | | | | 2,072 | | | | 21,158 | | | | 1,360,846 | | | | 5,176,179 | | |
Reinvested | | | 2,471 | | | | 10,059 | | | | 2,827 | | | | 6,716 | | | | 133,039 | | | | 222,482 | | |
Redeemed | | | (41,385 | ) | | | (476,876 | ) | | | (33,994 | ) | | | (695,638 | ) | | | (1,529,456 | ) | | | (6,865,599 | ) | |
Total Class C | | | (10,881 | ) | | | (445,522 | ) | | | (29,095 | ) | | | (667,764 | ) | | | (35,571 | ) | | | (1,466,938 | ) | |
Class R | |
Issued | | | — | | | | — | | | | — | | | | — | | | | 16,755 | | | | 39,473 | | |
Reinvested | | | — | | | | — | | | | — | | | | — | | | | 1,211 | | | | 1,764 | | |
Redeemed | | | — | | | | — | | | | — | | | | — | | | | (14,658 | ) | | | (8,787 | ) | |
Total Class R | | | — | | | | — | | | | — | | | | — | | | | 3,308 | | | | 32,450 | | |
Class Y | |
Issued | | | 701,221 | | | | 723,170 | | | | 185,172 | | | | 464,246 | | | | 87,121,619 | | | | 179,923,304 | | |
Reinvested | | | 26,685 | | | | 79,624 | | | | 24,266 | | | | 38,361 | | | | 3,824,897 | | | | 4,805,331 | | |
Redeemed | | | (514,013 | ) | | | (1,688,841 | ) | | | (394,938 | ) | | | (125,470 | ) | | | (91,552,742 | ) | | | (38,433,801 | ) | |
Total Class Y | | | 213,893 | | | | (886,047 | ) | | | (185,500 | ) | | | 377,137 | | | | (606,226 | ) | | | 146,294,834 | | |
Member Class | |
Issued | | | — | | | | — | | | | 181,816 | | | | 251,536 | | | | 349,206 | | | | 278,912 | | |
Reinvested | | | — | | | | — | | | | 6,076 | | | | 4,154 | | | | 9,979 | | | | 3,741 | | |
Redeemed | | | — | | | | — | | | | (93,088 | ) | | | (11,298 | ) | | | (85,169 | ) | | | (61,820 | ) | |
Total Member
Class | | | — | | | | — | | | | 94,804 | | | | 244,392 | | | | 274,016 | | | | 220,833 | | |
Change in Shares | | | 537,149 | | | | (941,207 | ) | | | (268,426 | ) | | | 622,389 | | | | (1,692,933 | ) | | | 164,910,747 | | |
See notes to financial statements.
61
Victory Portfolios | | Financial Highlights | |
For a Share Outstanding Throughout Each Period
| | | | | Investment Activities | | Distributions to
Shareholders From | |
| | | Net Asset
Value,
Beginning of
Period | | Net
Investment
Income
(Loss)(a) | | Net Realized
and Unrealized
Gains (Losses) | | Total from
Investment
Activities | | Net
Investment
Income | | Total
Distributions | |
Victory INCORE Investment Quality Bond Fund | | | |
Class A | | | |
Six Months Ended
June 30, 2022
(Unaudited) | | $ | 10.08 | | | | 0.06 | | | | (1.20 | ) | | | (1.14 | ) | | | (0.07 | ) | | | (0.07 | ) | |
Year Ended December 31: | |
2021 | | $ | 10.28 | | | | 0.12 | | | | (0.16 | ) | | | (0.04 | ) | | | (0.16 | ) | | | (0.16 | ) | |
2020 | | $ | 9.72 | | | | 0.16 | | | | 0.61 | | | | 0.77 | | | | (0.21 | ) | | | (0.21 | ) | |
2019 | | $ | 9.26 | | | | 0.20 | | | | 0.49 | | | | 0.69 | | | | (0.23 | ) | | | (0.23 | ) | |
2018 | | $ | 9.59 | | | | 0.21 | | | | (0.29 | ) | | | (0.08 | ) | | | (0.25 | ) | | | (0.25 | ) | |
2017 | | $ | 9.48 | | | | 0.18 | | | | 0.16 | | | | 0.34 | | | | (0.23 | ) | | | (0.23 | ) | |
Class C | | | |
Six Months Ended
June 30, 2022
(Unaudited) | | $ | 10.07 | | | | 0.02 | | | | (1.19 | ) | | | (1.17 | ) | | | (0.03 | ) | | | (0.03 | ) | |
Year Ended December 31: | |
2021 | | $ | 10.27 | | | | 0.03 | | | | (0.16 | ) | | | (0.13 | ) | | | (0.07 | ) | | | (0.07 | ) | |
2020 | | $ | 9.72 | | | | 0.08 | | | | 0.59 | | | | 0.67 | | | | (0.12 | ) | | | (0.12 | ) | |
2019 | | $ | 9.25 | | | | 0.12 | | | | 0.49 | | | | 0.61 | | | | (0.14 | ) | | | (0.14 | ) | |
2018 | | $ | 9.58 | | | | 0.13 | | | | (0.29 | ) | | | (0.16 | ) | | | (0.17 | ) | | | (0.17 | ) | |
2017 | | $ | 9.47 | | | | 0.10 | | | | 0.16 | | | | 0.26 | | | | (0.15 | ) | | | (0.15 | ) | |
Class R | | | |
Six Months Ended
June 30, 2022
(Unaudited) | | $ | 10.10 | | | | 0.05 | | | | (1.21 | ) | | | (1.16 | ) | | | (0.05 | ) | | | (0.05 | ) | |
Year Ended December 31: | |
2021 | | $ | 10.30 | | | | 0.08 | | | | (0.16 | ) | | | (0.08 | ) | | | (0.12 | ) | | | (0.12 | ) | |
2020 | | $ | 9.75 | | | | 0.12 | | | | 0.59 | | | | 0.71 | | | | (0.16 | ) | | | (0.16 | ) | |
2019 | | $ | 9.28 | | | | 0.16 | | | | 0.50 | | | | 0.66 | | | | (0.19 | ) | | | (0.19 | ) | |
2018 | | $ | 9.61 | | | | 0.18 | | | | (0.30 | ) | | | (0.12 | ) | | | (0.21 | ) | | | (0.21 | ) | |
2017 | | $ | 9.50 | | | | 0.14 | | | | 0.16 | | | | 0.30 | | | | (0.19 | ) | | | (0.19 | ) | |
Class Y | | | |
Six Months Ended
June 30, 2022
(Unaudited) | | $ | 10.06 | | | | 0.08 | | | | (1.20 | ) | | | (1.12 | ) | | | (0.08 | ) | | | (0.08 | ) | |
Year Ended December 31: | |
2021 | | $ | 10.27 | | | | 0.14 | | | | (0.16 | ) | | | (0.02 | ) | | | (0.19 | ) | | | (0.19 | ) | |
2020 | | $ | 9.71 | | | | 0.19 | | | | 0.60 | | | | 0.79 | | | | (0.23 | ) | | | (0.23 | ) | |
2019 | | $ | 9.25 | | | | 0.22 | | | | 0.49 | | | | 0.71 | | | | (0.25 | ) | | | (0.25 | ) | |
2018 | | $ | 9.58 | | | | 0.23 | | | | (0.29 | ) | | | (0.06 | ) | | | (0.27 | ) | | | (0.27 | ) | |
2017 | | $ | 9.47 | | | | 0.20 | | | | 0.16 | | | | 0.36 | | | | (0.25 | ) | | | (0.25 | ) | |
(a) Per share net investment income (loss) has been calculated using the average daily shares method.
(b) Not annualized for periods less than one year.
(c) Annualized for periods less than one year.
See notes to financial statements.
62
Victory Portfolios | | Financial Highlights — continued | |
For a Share Outstanding Throughout Each Period
| | | | | Ratios to Average Net Assets | | Supplemental Data | |
| | | Net Asset
Value,
End of
Period | | Total
Return
(Excludes
Sales
Charge)(b) | | Net
Expenses(c)(d) | | Net
Investment
Income
(Loss)(c) | | Gross
Expenses(c)(d) | | Net Assets,
End of
Period
(000's) | | Portfolio
Turnover(b)(e) | |
Victory INCORE Investment Quality Bond Fund | |
Class A | |
Six Months Ended
June 30, 2022
(Unaudited) | | $ | 8.87 | | | | (11.31 | )% | | | 0.90 | % | | | 1.39 | % | | | 1.36 | % | | $ | 16,369 | | | | 23 | % | |
Year Ended December 31: | |
2021 | | $ | 10.08 | | | | (0.37 | )% | | | 0.90 | % | | | 1.17 | % | | | 1.29 | % | | $ | 19,292 | | | | 67 | % | |
2020 | | $ | 10.28 | | | | 7.94 | % | | | 0.90 | % | | | 1.60 | % | | | 1.27 | % | | $ | 21,423 | | | | 80 | % | |
2019 | | $ | 9.72 | | | | 7.49 | % | | | 0.90 | % | | | 2.13 | % | | | 1.23 | % | | $ | 22,004 | | | | 92 | % | |
2018 | | $ | 9.26 | | | | (0.80 | )% | | | 0.90 | % | | | 2.27 | % | | | 1.13 | % | | $ | 24,049 | | | | 115 | % | |
2017 | | $ | 9.59 | | | | 3.62 | % | | | 0.90 | % | | | 1.86 | % | | | 1.07 | % | | $ | 31,306 | | | | 70 | % | |
Class C | |
Six Months Ended
June 30, 2022
(Unaudited) | | $ | 8.87 | | | | (11.61 | )% | | | 1.77 | % | | | 0.51 | % | | | 4.71 | % | | $ | 332 | | | | 23 | % | |
Year Ended December 31: | |
2021 | | $ | 10.07 | | | | (1.23 | )% | | | 1.77 | % | | | 0.33 | % | | | 3.67 | % | | $ | 484 | | | | 67 | % | |
2020 | | $ | 10.27 | | | | 6.89 | % | | | 1.77 | % | | | 0.76 | % | | | 2.39 | % | | $ | 2,526 | | | | 80 | % | |
2019 | | $ | 9.72 | | | | 6.65 | % | | | 1.77 | % | | | 1.28 | % | | | 2.23 | % | | $ | 2,824 | | | | 92 | % | |
2018 | | $ | 9.25 | | | | (1.66 | )% | | | 1.77 | % | | | 1.42 | % | | | 2.10 | % | | $ | 3,634 | | | | 115 | % | |
2017 | | $ | 9.58 | | | | 2.74 | % | | | 1.77 | % | | | 0.99 | % | | | 1.91 | % | | $ | 6,127 | | | | 70 | % | |
Class R | |
Six Months Ended
June 30, 2022
(Unaudited) | | $ | 8.89 | | | | (11.47 | )% | | | 1.30 | % | | | 0.98 | % | | | 1.95 | % | | $ | 2,752 | | | | 23 | % | |
Year Ended December 31: | |
2021 | | $ | 10.10 | | | | (0.77 | )% | | | 1.30 | % | | | 0.76 | % | | | 1.81 | % | | $ | 3,210 | | | | 67 | % | |
2020 | | $ | 10.30 | | | | 7.37 | % | | | 1.30 | % | | | 1.16 | % | | | 1.84 | % | | $ | 3,603 | | | | 80 | % | |
2019 | | $ | 9.75 | | | | 7.14 | % | | | 1.30 | % | | | 1.71 | % | | | 1.83 | % | | $ | 3,362 | | | | 92 | % | |
2018 | | $ | 9.28 | | | | (1.20 | )% | | | 1.30 | % | | | 1.88 | % | | | 1.69 | % | | $ | 3,192 | | | | 115 | % | |
2017 | | $ | 9.61 | | | | 3.16 | % | | | 1.30 | % | | | 1.44 | % | | | 1.65 | % | | $ | 3,940 | | | | 70 | % | |
Class Y | |
Six Months Ended
June 30, 2022
(Unaudited) | | $ | 8.86 | | | | (11.13 | )% | | | 0.66 | % | | | 1.63 | % | | | 1.78 | % | | $ | 1,327 | | | | 23 | % | |
Year Ended December 31: | |
2021 | | $ | 10.06 | | | | (0.22 | )% | | | 0.66 | % | | | 1.42 | % | | | 1.53 | % | | $ | 1,634 | | | | 67 | % | |
2020 | | $ | 10.27 | | | | 8.21 | % | | | 0.66 | % | | | 1.91 | % | | | 1.31 | % | | $ | 2,770 | | | | 80 | % | |
2019 | | $ | 9.71 | | | | 7.76 | % | | | 0.66 | % | | | 2.35 | % | | | 1.24 | % | | $ | 3,412 | | | | 92 | % | |
2018 | | $ | 9.25 | | | | (0.56 | )% | | | 0.66 | % | | | 2.51 | % | | | 1.12 | % | | $ | 3,265 | | | | 115 | % | |
2017 | | $ | 9.58 | | | | 3.87 | % | | | 0.66 | % | | | 2.09 | % | | | 0.98 | % | | $ | 4,421 | | | | 70 | % | |
(d) Does not include acquired fund fees and expenses, if any.
(e) Portfolio turnover is calculated on the basis of the Fund as a whole without distinguishing between the classes of shares issued.
See notes to financial statements.
63
Victory Portfolios | | Financial Highlights | |
For a Share Outstanding Throughout Each Period
| | | | | Investment Activities | | Distributions to
Shareholders From | |
| | | Net Asset
Value,
Beginning of
Period | | Net
Investment
Income
(Loss)(a) | | Net Realized
and Unrealized
Gains (Losses) | | Total from
Investment
Activities | | Net
Investment
Income | | Return of
Capital | |
Victory INCORE Low Duration Bond Fund | | | |
Class A | | | |
Six Months Ended
June 30, 2022
(Unaudited) | | $ | 10.16 | | | | 0.04 | | | | (0.43 | ) | | | (0.39 | ) | | | (0.06 | ) | | | — | | |
Year Ended December 31: | |
2021 | | $ | 10.20 | | | | 0.09 | | | | (0.02 | ) | | | 0.07 | | | | (0.11 | ) | | | — | | |
2020 | | $ | 9.99 | | | | 0.14 | | | | 0.24 | | | | 0.38 | | | | (0.14 | ) | | | (0.03 | ) | |
2019 | | $ | 9.86 | | | | 0.19 | | | | 0.15 | | | | 0.34 | | | | (0.20 | ) | | | (0.01 | ) | |
2018 | | $ | 9.99 | | | | 0.16 | | | | (0.08 | ) | | | 0.08 | | | | (0.21 | ) | | | — | | |
2017 | | $ | 10.03 | | | | 0.12 | | | | 0.02 | | | | 0.14 | | | | (0.18 | ) | | | — | | |
Class C | | | |
Six Months Ended
June 30, 2022
(Unaudited) | | $ | 10.16 | | | | 0.01 | | | | (0.43 | ) | | | (0.42 | ) | | | (0.02 | ) | | | — | | |
Year Ended December 31: | |
2021 | | $ | 10.20 | | | | 0.01 | | | | (0.02 | ) | | | (0.01 | ) | | | (0.03 | ) | | | — | | |
2020 | | $ | 9.99 | | | | 0.08 | | | | 0.22 | | | | 0.30 | | | | (0.07 | ) | | | (0.02 | ) | |
2019 | | $ | 9.85 | | | | 0.12 | | | | 0.16 | | | | 0.28 | | | | (0.14 | ) | | | — | (f) | |
2018 | | $ | 9.99 | | | | 0.09 | | | | (0.09 | ) | | | — | (f) | | | (0.14 | ) | | | — | | |
2017 | | $ | 10.02 | | | | 0.04 | | | | 0.03 | | | | 0.07 | | | | (0.10 | ) | | | — | | |
Class R | | | |
Six Months Ended
June 30, 2022
(Unaudited) | | $ | 10.16 | | | | 0.02 | | | | (0.43 | ) | | | (0.41 | ) | | | (0.04 | ) | | | — | | |
Year Ended December 31: | |
2021 | | $ | 10.20 | | | | 0.05 | | | | (0.02 | ) | | | 0.03 | | | | (0.07 | ) | | | — | | |
2020 | | $ | 9.99 | | | | 0.10 | | | | 0.24 | | | | 0.34 | | | | (0.10 | ) | | | (0.03 | ) | |
2019 | | $ | 9.86 | | | | 0.15 | | | | 0.15 | | | | 0.30 | | | | (0.16 | ) | | | (0.01 | ) | |
2018 | | $ | 9.99 | | | | 0.12 | | | | (0.08 | ) | | | 0.04 | | | | (0.17 | ) | | | — | | |
2017 | | $ | 10.02 | | | | 0.08 | | | | 0.03 | | | | 0.11 | | | | (0.14 | ) | | | — | | |
Class Y | | | |
Six Months Ended
June 30, 2022
(Unaudited) | | $ | 10.16 | | | | 0.06 | | | | (0.43 | ) | | | (0.37 | ) | | | (0.07 | ) | | | — | | |
Year Ended December 31: | |
2021 | | $ | 10.20 | | | | 0.11 | | | | (0.01 | ) | | | 0.10 | | | | (0.14 | ) | | | — | | |
2020 | | $ | 9.99 | | | | 0.17 | | | | 0.23 | | | | 0.40 | | | | (0.15 | ) | | | (0.04 | ) | |
2019 | | $ | 9.86 | | | | 0.21 | | | | 0.16 | | | | 0.37 | | | | (0.23 | ) | | | (0.01 | ) | |
2018 | | $ | 10.00 | | | | 0.19 | | | | (0.10 | ) | | | 0.09 | | | | (0.23 | ) | | | — | | |
2017 | | $ | 10.03 | | | | 0.15 | | | | 0.02 | | | | 0.17 | | | | (0.20 | ) | | | — | | |
(a) Per share net investment income (loss) has been calculated using the average daily shares method.
(b) Not annualized for periods less than one year.
(c) Annualized for periods less than one year.
See notes to financial statements.
64
Victory Portfolios | | Financial Highlights — continued | |
For a Share Outstanding Throughout Each Period
| | | | | Ratios to Average Net Assets | | Supplemental Data | |
| | | Total
Distributions | | Net Asset
Value,
End of
Period | | Total
Return
(Excludes
Sales
Charge)(b) | | Net
Expenses(c)(d) | | Net
Investment
Income
(Loss)(c) | | Gross
Expenses(c)(d) | | Net Assets,
End of
Period
(000's) | | Portfolio
Turnover(b)(e) | |
Victory INCORE Low Duration Bond Fund | |
Class A | |
Six Months Ended
June 30, 2022
(Unaudited) | | | (0.06 | ) | | $ | 9.71 | | | | (3.89 | )% | | | 0.85 | % | | | 0.91 | % | | | 0.96 | % | | $ | 84,648 | | | | 43 | % | |
Year Ended December 31: | |
2021 | | | (0.11 | ) | | $ | 10.16 | | | | 0.71 | % | | | 0.85 | % | | | 0.87 | % | | | 0.95 | % | | $ | 76,901 | | | | 58 | % | |
2020 | | | (0.17 | ) | | $ | 10.20 | | | | 3.85 | % | | | 0.85 | % | | | 1.39 | % | | | 0.95 | % | | $ | 70,357 | | | | 85 | % | |
2019 | | | (0.21 | ) | | $ | 9.99 | | | | 3.51 | % | | | 0.85 | % | | | 1.93 | % | | | 0.95 | % | | $ | 61,972 | | | | 50 | % | |
2018 | | | (0.21 | ) | | $ | 9.86 | | | | 0.73 | % | | | 0.85 | % | | | 1.66 | % | | | 0.90 | % | | $ | 96,210 | | | | 45 | % | |
2017 | | | (0.18 | ) | | $ | 9.99 | | | | 1.47 | % | | | 0.85 | % | | | 1.21 | % | | | 0.90 | % | | $ | 149,287 | | | | 62 | % | |
Class C | |
Six Months Ended
June 30, 2022
(Unaudited) | | | (0.02 | ) | | $ | 9.72 | | | | (4.16 | )% | | | 1.62 | % | | | 0.14 | % | | | 1.86 | % | | $ | 4,748 | | | | 43 | % | |
Year Ended December 31: | |
2021 | | | (0.03 | ) | | $ | 10.16 | | | | (0.07 | )% | | | 1.62 | % | | | 0.10 | % | | | 1.91 | % | | $ | 5,528 | | | | 58 | % | |
2020 | | | (0.09 | ) | | $ | 10.20 | | | | 3.05 | % | | | 1.62 | % | | | 0.76 | % | | | 1.72 | % | | $ | 23,504 | | | | 85 | % | |
2019 | | | (0.14 | ) | | $ | 9.99 | | | | 2.81 | % | | | 1.62 | % | | | 1.17 | % | | | 1.70 | % | | $ | 38,969 | | | | 50 | % | |
2018 | | | (0.14 | ) | | $ | 9.85 | | | | (0.04 | )% | | | 1.62 | % | | | 0.88 | % | | | 1.68 | % | | $ | 62,103 | | | | 45 | % | |
2017 | | | (0.10 | ) | | $ | 9.99 | | | | 0.70 | % | | | 1.62 | % | | | 0.44 | % | | | 1.65 | % | | $ | 82,847 | | | | 62 | % | |
Class R | |
Six Months Ended
June 30, 2022
(Unaudited) | | | (0.04 | ) | | $ | 9.71 | | | | (4.09 | )% | | | 1.27 | % | | | 0.49 | % | | | 2.16 | % | | $ | 1,179 | | | | 43 | % | |
Year Ended December 31: | |
2021 | | | (0.07 | ) | | $ | 10.16 | | | | 0.29 | % | | | 1.27 | % | | | 0.45 | % | | | 2.30 | % | | $ | 1,214 | | | | 58 | % | |
2020 | | | (0.13 | ) | | $ | 10.20 | | | | 3.41 | % | | | 1.27 | % | | | 0.99 | % | | | 2.38 | % | | $ | 1,129 | | | | 85 | % | |
2019 | | | (0.17 | ) | | $ | 9.99 | | | | 3.17 | % | | | 1.27 | % | | | 1.50 | % | | | 2.13 | % | | $ | 1,147 | | | | 50 | % | |
2018 | | | (0.17 | ) | | $ | 9.86 | | | | 0.31 | % | | | 1.27 | % | | | 1.20 | % | | | 1.87 | % | | $ | 1,554 | | | | 45 | % | |
2017 | | | (0.14 | ) | | $ | 9.99 | | | | 1.05 | % | | | 1.27 | % | | | 0.79 | % | | | 1.68 | % | | $ | 2,078 | | | | 62 | % | |
Class Y | |
Six Months Ended
June 30, 2022
(Unaudited) | | | (0.07 | ) | | $ | 9.72 | | | | (3.68 | )% | | | 0.62 | % | | | 1.13 | % | | | 0.65 | % | | $ | 112,097 | | | | 43 | % | |
Year Ended December 31: | |
2021 | | | (0.14 | ) | | $ | 10.16 | | | | 0.94 | % | | | 0.62 | % | | | 1.10 | % | | | 0.67 | % | | $ | 133,644 | | | | 58 | % | |
2020 | | | (0.19 | ) | | $ | 10.20 | | | | 4.08 | % | | | 0.62 | % | | | 1.64 | % | | | 0.68 | % | | $ | 165,330 | | | | 85 | % | |
2019 | | | (0.24 | ) | | $ | 9.99 | | | | 3.76 | % | | | 0.62 | % | | | 2.12 | % | | | 0.69 | % | | $ | 164,509 | | | | 50 | % | |
2018 | | | (0.23 | ) | | $ | 9.86 | | | | 0.96 | % | | | 0.62 | % | | | 1.87 | % | | | 0.68 | % | | $ | 180,034 | | | | 45 | % | |
2017 | | | (0.20 | ) | | $ | 10.00 | | | | 1.71 | % | | | 0.62 | % | | | 1.44 | % | | | 0.65 | % | | $ | 271,294 | | | | 62 | % | |
(d) Does not include acquired fund fees and expenses, if any.
(e) Portfolio turnover is calculated on the basis of the Fund as a whole without distinguishing between the classes of shares issued.
(f) Amount is less than $0.005 per share.
See notes to financial statements.
65
Victory Portfolios | | Financial Highlights | |
For a Share Outstanding Throughout Each Period
| | | | | Investment Activities | | Distributions to
Shareholders From | |
| | | Net Asset
Value,
Beginning of
Period | | Net
Investment
Income
(Loss)(a) | | Net Realized
and Unrealized
Gains (Losses) | | Total from
Investment
Activities | | Net
Investment
Income | | Total
Distributions | |
Victory High Yield Fund | | | |
Class A | | | |
Six Months Ended
June 30, 2022
(Unaudited) | | $ | 6.79 | | | | 0.19 | | | | (1.25 | ) | | | (1.06 | ) | | | (0.19 | ) | | | (0.19 | ) | |
Year Ended December 31: | |
2021 | | $ | 6.83 | | | | 0.36 | | | | (0.03 | ) | | | 0.33 | | | | (0.37 | ) | | | (0.37 | ) | |
2020 | | $ | 6.73 | | | | 0.37 | | | | 0.10 | | | | 0.47 | | | | (0.37 | ) | | | (0.37 | ) | |
2019 | | $ | 6.20 | | | | 0.37 | | | | 0.54 | | | | 0.91 | | | | (0.38 | ) | | | (0.38 | ) | |
2018 | | $ | 6.57 | | | | 0.39 | | | | (0.37 | ) | | | 0.02 | | | | (0.39 | ) | | | (0.39 | ) | |
2017 | | $ | 6.34 | | | | 0.39 | | | | 0.22 | | | | 0.61 | | | | (0.38 | ) | | | (0.38 | ) | |
Class C | | | |
Six Months Ended
June 30, 2022
(Unaudited) | | $ | 6.81 | | | | 0.16 | | | | (1.25 | ) | | | (1.09 | ) | | | (0.16 | ) | | | (0.16 | ) | |
Year Ended December 31: | |
2021 | | $ | 6.85 | | | | 0.31 | | | | (0.03 | ) | | | 0.28 | | | | (0.32 | ) | | | (0.32 | ) | |
2020 | | $ | 6.75 | | | | 0.33 | | | | 0.10 | | | | 0.43 | | | | (0.33 | ) | | | (0.33 | ) | |
2019 | | $ | 6.21 | | | | 0.33 | | | | 0.54 | | | | 0.87 | | | | (0.33 | ) | | | (0.33 | ) | |
2018 | | $ | 6.58 | | | | 0.34 | | | | (0.36 | ) | | | (0.02 | ) | | | (0.35 | ) | | | (0.35 | ) | |
2017 | | $ | 6.35 | | | | 0.34 | | | | 0.23 | | | | 0.57 | | | | (0.34 | ) | | | (0.34 | ) | |
Class R | | | |
Six Months Ended
June 30, 2022
(Unaudited) | | $ | 6.81 | | | | 0.18 | | | | (1.25 | ) | | | (1.07 | ) | | | (0.18 | ) | | | (0.18 | ) | |
Year Ended December 31: | |
2021 | | $ | 6.85 | | | | 0.34 | | | | (0.03 | ) | | | 0.31 | | | | (0.35 | ) | | | (0.35 | ) | |
2020 | | $ | 6.75 | | | | 0.35 | | | | 0.10 | | | | 0.45 | | | | (0.35 | ) | | | (0.35 | ) | |
2019 | | $ | 6.22 | | | | 0.35 | | | | 0.53 | | | | 0.88 | | | | (0.35 | ) | | | (0.35 | ) | |
2018 | | $ | 6.59 | | | | 0.37 | | | | (0.37 | ) | | | — | (g) | | | (0.37 | ) | | | (0.37 | ) | |
2017 | | $ | 6.35 | | | | 0.37 | | | | 0.23 | | | | 0.60 | | | | (0.36 | ) | | | (0.36 | ) | |
Class Y | | | |
Six Months Ended
June 30, 2022
(Unaudited) | | $ | 6.76 | | | | 0.19 | | | | (1.24 | ) | | | (1.05 | ) | | | (0.19 | ) | | | (0.19 | ) | |
Year Ended December 31: | |
2021 | | $ | 6.80 | | | | 0.38 | | | | (0.04 | ) | | | 0.34 | | | | (0.38 | ) | | | (0.38 | ) | |
2020 | | $ | 6.70 | | | | 0.39 | | | | 0.10 | | | | 0.49 | | | | (0.39 | ) | | | (0.39 | ) | |
2019 | | $ | 6.17 | | | | 0.39 | | | | 0.53 | | | | 0.92 | | | | (0.39 | ) | | | (0.39 | ) | |
2018 | | $ | 6.54 | | | | 0.41 | | | | (0.37 | ) | | | 0.04 | | | | (0.41 | ) | | | (0.41 | ) | |
2017 | | $ | 6.31 | | | | 0.40 | | | | 0.23 | | | | 0.63 | | | | (0.40 | ) | | | (0.40 | ) | |
(a) Per share net investment income (loss) has been calculated using the average daily shares method.
(b) Includes adjustments in accordance with U.S. Generally Accepted Accounting Principles.
(c) Not annualized for periods less than one year.
(d) Annualized for periods less than one year.
See notes to financial statements.
66
Victory Portfolios | | Financial Highlights — continued | |
For a Share Outstanding Throughout Each Period
| | | | | Ratios to Average Net Assets | | Supplemental Data | |
| | | Net Asset
Value,
End of
Period | | Total
Return
(Excludes
Sales
Charge)(b)(c) | | Net
Expenses(d)(e) | | Net
Investment
Income
(Loss)(d) | | Gross
Expenses(d)(e) | | Net Assets,
End of
Period
(000's) | | Portfolio
Turnover(c)(f) | |
Victory High Yield Fund | |
Class A | |
Six Months Ended
June 30, 2022
(Unaudited) | | $ | 5.54 | | | | (15.92 | )% | | | 1.00 | % | | | 5.93 | % | | | 1.08 | % | | $ | 34,439 | | | | 29 | % | |
Year Ended December 31: | |
2021 | | $ | 6.79 | | | | 4.86 | % | | | 1.00 | % | | | 5.22 | % | | | 1.08 | % | | $ | 49,271 | | | | 67 | % | |
2020 | | $ | 6.83 | | | | 7.61 | % | | | 1.00 | % | | | 5.85 | % | | | 1.12 | % | | $ | 38,735 | | | | 124 | % | |
2019 | | $ | 6.73 | | | | 14.90 | % | | | 1.00 | % | | | 5.70 | % | | | 1.12 | % | | $ | 31,602 | | | | 87 | % | |
2018 | | $ | 6.20 | | | | 0.28 | % | | | 1.00 | % | | | 6.01 | % | | | 1.12 | % | | $ | 23,797 | | | | 87 | % | |
2017 | | $ | 6.57 | | | | 9.93 | % | | | 1.00 | % | | | 5.99 | % | | | 1.13 | % | | $ | 21,882 | | | | 174 | % | |
Class C | |
Six Months Ended
June 30, 2022
(Unaudited) | | $ | 5.56 | | | | (16.17 | )% | | | 1.70 | % | | | 5.23 | % | | | 1.79 | % | | $ | 27,872 | | | | 29 | % | |
Year Ended December 31: | |
2021 | | $ | 6.81 | | | | 4.11 | % | | | 1.70 | % | | | 4.51 | % | | | 1.78 | % | | $ | 32,889 | | | | 67 | % | |
2020 | | $ | 6.85 | | | | 6.84 | % | | | 1.70 | % | | | 5.14 | % | | | 1.81 | % | | $ | 25,957 | | | | 124 | % | |
2019 | | $ | 6.75 | | | | 14.24 | % | | | 1.70 | % | | | 5.00 | % | | | 1.82 | % | | $ | 21,163 | | | | 87 | % | |
2018 | | $ | 6.21 | | | | (0.43 | )% | | | 1.70 | % | | | 5.29 | % | | | 1.84 | % | | $ | 19,432 | | | | 87 | % | |
2017 | | $ | 6.58 | | | | 9.19 | % | | | 1.70 | % | | | 5.27 | % | | | 1.84 | % | | $ | 22,283 | | | | 174 | % | |
Class R | |
Six Months Ended
June 30, 2022
(Unaudited) | | $ | 5.56 | | | | (15.99 | )% | | | 1.28 | % | | | 5.65 | % | | | 1.28 | % | | $ | 15,905 | | | | 29 | % | |
Year Ended December 31: | |
2021 | | $ | 6.81 | | | | 4.55 | % | | | 1.28 | % | | | 4.93 | % | | | 1.28 | % | | $ | 19,243 | | | | 67 | % | |
2020 | | $ | 6.85 | | | | 7.24 | % | | | 1.33 | % | | | 5.51 | % | | | 1.33 | % | | $ | 19,248 | | | | 124 | % | |
2019 | | $ | 6.75 | | | | 14.48 | % | | | 1.33 | % | | | 5.37 | % | | | 1.33 | % | | $ | 18,818 | | | | 87 | % | |
2018 | | $ | 6.22 | | | | (0.07 | )% | | | 1.35 | % | | | 5.64 | % | | | 1.35 | % | | $ | 17,595 | | | | 87 | % | |
2017 | | $ | 6.59 | | | | 9.64 | % | | | 1.35 | % | | | 5.61 | % | | | 1.36 | % | | $ | 19,217 | | | | 174 | % | |
Class Y | |
Six Months Ended
June 30, 2022
(Unaudited) | | $ | 5.52 | | | | (15.73 | )% | | | 0.76 | % | | | 6.22 | % | | | 0.84 | % | | $ | 196,449 | | | | 29 | % | |
Year Ended December 31: | |
2021 | | $ | 6.76 | | | | 5.15 | % | | | 0.76 | % | | | 5.49 | % | | | 0.84 | % | | $ | 237,385 | | | | 67 | % | |
2020 | | $ | 6.80 | | | | 7.88 | % | | | 0.76 | % | | | 6.11 | % | | | 0.90 | % | | $ | 168,677 | | | | 124 | % | |
2019 | | $ | 6.70 | | | | 15.25 | % | | | 0.76 | % | | | 5.96 | % | | | 0.92 | % | | $ | 108,171 | | | | 87 | % | |
2018 | | $ | 6.17 | | | | 0.52 | % | | | 0.76 | % | | | 6.32 | % | | | 0.97 | % | | $ | 21,060 | | | | 87 | % | |
2017 | | $ | 6.54 | | | | 10.24 | % | | | 0.76 | % | | | 6.27 | % | | | 1.04 | % | | $ | 5,213 | | | | 174 | % | |
(e) Does not include acquired fund fees and expenses, if any.
(f) Portfolio turnover is calculated on the basis of the Fund as a whole without distinguishing between the classes of shares issued.
(g) Amount is less than $0.005 per share.
See notes to financial statements.
67
Victory Portfolios | | Financial Highlights | |
For a Share Outstanding Throughout Each Period
| | | | | Investment Activities | | Distributions to
Shareholders From | |
| | | Net Asset
Value,
Beginning of
Period | | Net
Investment
Income
(Loss)(a) | | Net Realized
and Unrealized
Gains (Losses) | | Total from
Investment
Activities | | Net
Investment
Income | | Net Realized
Gains from
Investments | |
Victory Tax-Exempt Fund | | | |
Class A | | | |
Six Months Ended
June 30, 2022
(Unaudited) | | $ | 9.78 | | | | 0.15 | | | | (1.23 | ) | | | (1.08 | ) | | | (0.15 | ) | | | — | | |
Year Ended December 31: | |
2021 | | $ | 9.94 | | | | 0.27 | | | | 0.12 | | | | 0.39 | | | | (0.32 | ) | | | (0.23 | ) | |
2020 | | $ | 9.84 | | | | 0.29 | | | | 0.23 | | | | 0.52 | | | | (0.32 | ) | | | (0.10 | ) | |
2019 | | $ | 9.47 | | | | 0.30 | | | | 0.53 | | | | 0.83 | | | | (0.34 | ) | | | (0.12 | ) | |
2018 | | $ | 9.91 | | | | 0.36 | | | | (0.30 | ) | | | 0.06 | | | | (0.36 | ) | | | (0.14 | ) | |
2017 | | $ | 9.65 | | | | 0.36 | | | | 0.39 | | | | 0.75 | | | | (0.37 | ) | | | (0.12 | ) | |
Class C | | | |
Six Months Ended
June 30, 2022
(Unaudited) | | $ | 9.78 | | | | 0.11 | | | | (1.23 | ) | | | (1.12 | ) | | | (0.11 | ) | | | — | | |
Year Ended December 31: | |
2021 | | $ | 9.94 | | | | 0.20 | | | | 0.11 | | | | 0.31 | | | | (0.24 | ) | | | (0.23 | ) | |
2020 | | $ | 9.84 | | | | 0.22 | | | | 0.22 | | | | 0.44 | | | | (0.24 | ) | | | (0.10 | ) | |
2019 | | $ | 9.47 | | | | 0.23 | | | | 0.52 | | | | 0.75 | | | | (0.26 | ) | | | (0.12 | ) | |
2018 | | $ | 9.90 | | | | 0.28 | | | | (0.29 | ) | | | (0.01 | ) | | | (0.28 | ) | | | (0.14 | ) | |
2017 | | $ | 9.65 | | | | 0.29 | | | | 0.37 | | | | 0.66 | | | | (0.29 | ) | | | (0.12 | ) | |
Class Y | | | |
Six Months Ended
June 30, 2022
(Unaudited) | | $ | 9.78 | | | | 0.16 | | | | (1.23 | ) | | | (1.07 | ) | | | (0.16 | ) | | | — | | |
Year Ended December 31: | |
2021 | | $ | 9.94 | | | | 0.29 | | | | 0.11 | | | | 0.40 | | | | (0.33 | ) | | | (0.23 | ) | |
2020 | | $ | 9.84 | | | | 0.30 | | | | 0.23 | | | | 0.53 | | | | (0.33 | ) | | | (0.10 | ) | |
2019 | | $ | 9.46 | | | | 0.30 | | | | 0.55 | | | | 0.85 | | | | (0.35 | ) | | | (0.12 | ) | |
2018 | | $ | 9.90 | | | | 0.37 | | | | (0.30 | ) | | | 0.07 | | | | (0.37 | ) | | | (0.14 | ) | |
2017 | | $ | 9.65 | | | | 0.37 | | | | 0.38 | | | | 0.75 | | | | (0.38 | ) | | | (0.12 | ) | |
(a) Per share net investment income (loss) has been calculated using the average daily shares method.
(b) Not annualized for periods less than one year.
(c) Annualized for periods less than one year.
(d) Does not include acquired fund fees and expenses, if any.
(e) Portfolio turnover is calculated on the basis of the Fund as a whole without distinguishing between the classes of shares issued.
See notes to financial statements.
68
Victory Portfolios | | Financial Highlights — continued | |
For a Share Outstanding Throughout Each Period
| | | | | Ratios to Average Net Assets | | Supplemental Data | |
| | | Total
Distributions | | Net Asset
Value,
End of
Period | | Total
Return
(Excludes
Sales
Charge)(b) | | Net
Expenses(c)(d) | | Net
Investment
Income
(Loss)(c) | | Gross
Expenses(c)(d) | | Net Assets,
End of
Period
(000's) | | Portfolio
Turnover(b)(e) | |
Victory Tax-Exempt Fund | |
Class A | |
Six Months Ended
June 30, 2022
(Unaudited) | | | (0.15 | ) | | $ | 8.55 | | | | (11.11 | )% | | | 0.80 | % | | | 3.34 | % | | | 1.04 | % | | $ | 33,722 | | | | 1 | % | |
Year Ended December 31: | |
2021 | | | (0.55 | ) | | $ | 9.78 | | | | 3.94 | % | | | 0.80 | % | | | 2.74 | % | | | 1.03 | % | | $ | 35,312 | | | | 6 | % | |
2020 | | | (0.42 | ) | | $ | 9.94 | | | | 5.39 | % | | | 0.80 | % | | | 3.00 | % | | | 1.04 | % | | $ | 32,001 | | | | 44 | % | |
2019 | | | (0.46 | ) | | $ | 9.84 | | | | 8.82 | % | | | 0.80 | % | | | 3.04 | % | | | 1.02 | % | | $ | 30,251 | | | | 64 | % | |
2018 | | | (0.50 | ) | | $ | 9.47 | | | | 0.69 | % | | | 0.80 | % | | | 3.68 | % | | | 0.97 | % | | $ | 29,993 | | | | 42 | % | |
2017 | | | (0.49 | ) | | $ | 9.91 | | | | 7.89 | % | | | 0.80 | % | | | 3.70 | % | | | 0.96 | % | | $ | 37,570 | | | | 84 | % | |
Class C | |
Six Months Ended
June 30, 2022
(Unaudited) | | | (0.11 | ) | | $ | 8.55 | | | | (11.46 | )% | | | 1.60 | % | | | 2.54 | % | | | 2.41 | % | | $ | 1,688 | | | | 1 | % | |
Year Ended December 31: | |
2021 | | | (0.47 | ) | | $ | 9.78 | | | | 3.13 | % | | | 1.60 | % | | | 2.01 | % | | | 2.38 | % | | $ | 2,037 | | | | 6 | % | |
2020 | | | (0.34 | ) | | $ | 9.94 | | | | 4.56 | % | | | 1.60 | % | | | 2.28 | % | | | 1.91 | % | | $ | 6,497 | | | | 44 | % | |
2019 | | | (0.38 | ) | | $ | 9.84 | | | | 7.97 | % | | | 1.60 | % | | | 2.34 | % | | | 1.82 | % | | $ | 11,259 | | | | 64 | % | |
2018 | | | (0.42 | ) | | $ | 9.47 | | | | (0.01 | )% | | | 1.60 | % | | | 2.88 | % | | | 1.78 | % | | $ | 17,986 | | | | 42 | % | |
2017 | | | (0.41 | ) | | $ | 9.90 | | | | 6.92 | % | | | 1.60 | % | | | 2.89 | % | | | 1.74 | % | | $ | 26,520 | | | | 84 | % | |
Class Y | |
Six Months Ended
June 30, 2022
(Unaudited) | | | (0.16 | ) | | $ | 8.55 | | | | (11.06 | )% | | | 0.69 | % | | | 3.45 | % | | | 0.84 | % | | $ | 14,038 | | | | 1 | % | |
Year Ended December 31: | |
2021 | | | (0.56 | ) | | $ | 9.78 | | | | 4.06 | % | | | 0.69 | % | | | 2.85 | % | | | 0.89 | % | | $ | 13,969 | | | | 6 | % | |
2020 | | | (0.43 | ) | | $ | 9.94 | | | | 5.51 | % | | | 0.69 | % | | | 3.12 | % | | | 0.85 | % | | $ | 22,998 | | | | 44 | % | |
2019 | | | (0.47 | ) | | $ | 9.84 | | | | 9.06 | % | | | 0.69 | % | | | 3.07 | % | | | 0.83 | % | | $ | 24,459 | | | | 64 | % | |
2018 | | | (0.51 | ) | | $ | 9.46 | | | | 0.80 | % | | | 0.69 | % | | | 3.79 | % | | | 0.77 | % | | $ | 20,260 | | | | 42 | % | |
2017 | | | (0.50 | ) | | $ | 9.90 | | | | 7.90 | % | | | 0.69 | % | | | 3.80 | % | | | 0.73 | % | | $ | 27,420 | | | | 84 | % | |
See notes to financial statements.
69
Victory Portfolios | | Financial Highlights | |
For a Share Outstanding Throughout Each Period
| | | | | Investment Activities | | Distributions to
Shareholders From | |
| | | Net Asset
Value,
Beginning of
Period | | Net
Investment
Income
(Loss)(a) | | Net Realized
and Unrealized
Gains (Losses) | | Total from
Investment
Activities | | Net
Investment
Income | | Net Realized
Gains from
Investments | |
Victory High Income Municipal Bond Fund | | | |
Class A | | | |
Six Months Ended
June 30, 2022
(Unaudited) | | $ | 11.09 | | | | 0.20 | | | | (1.67 | ) | | | (1.47 | ) | | | (0.20 | ) | | | — | | |
Year Ended December 31: | |
2021 | | $ | 10.84 | | | | 0.36 | | | | 0.27 | | | | 0.63 | | | | (0.38 | ) | | | — | | |
2020 | | $ | 10.75 | | | | 0.42 | | | | 0.15 | | | | 0.57 | | | | (0.39 | ) | | | (0.09 | ) | |
2019 | | $ | 10.39 | | | | 0.35 | | | | 0.47 | | | | 0.82 | | | | (0.40 | ) | | | (0.06 | ) | |
2018 | | $ | 10.79 | | | | 0.43 | | | | (0.40 | ) | | | 0.03 | | | | (0.43 | ) | | | — | | |
2017 | | $ | 10.35 | | | | 0.46 | | | | 0.44 | | | | 0.90 | | | | (0.46 | ) | | | — | | |
Class C | | | |
Six Months Ended
June 30, 2022
(Unaudited) | | $ | 11.09 | | | | 0.16 | | | | (1.67 | ) | | | (1.51 | ) | | | (0.16 | ) | | | — | | |
Year Ended December 31: | |
2021 | | $ | 10.84 | | | | 0.28 | | | | 0.27 | | | | 0.55 | | | | (0.30 | ) | | | — | | |
2020 | | $ | 10.75 | | | | 0.33 | | | | 0.16 | | | | 0.49 | | | | (0.31 | ) | | | (0.09 | ) | |
2019 | | $ | 10.39 | | | | 0.28 | | | | 0.46 | | | | 0.74 | | | | (0.32 | ) | | | (0.06 | ) | |
2018 | | $ | 10.79 | | | | 0.35 | | | | (0.40 | ) | | | (0.05 | ) | | | (0.35 | ) | | | — | | |
2017 | | $ | 10.35 | | | | 0.38 | | | | 0.44 | | | | 0.82 | | | | (0.38 | ) | | | — | | |
Class Y | | | |
Six Months Ended
June 30, 2022
(Unaudited) | | $ | 11.09 | | | | 0.21 | | | | (1.67 | ) | | | (1.46 | ) | | | (0.21 | ) | | | — | | |
Year Ended December 31: | |
2021 | | $ | 10.84 | | | | 0.38 | | | | 0.28 | | | | 0.66 | | | | (0.41 | ) | | | — | | |
2020 | | $ | 10.75 | | | | 0.44 | | | | 0.16 | | | | 0.60 | | | | (0.42 | ) | | | (0.09 | ) | |
2019 | | $ | 10.39 | | | | 0.38 | | | | 0.47 | | | | 0.85 | | | | (0.43 | ) | | | (0.06 | ) | |
2018 | | $ | 10.79 | | | | 0.46 | | | | (0.40 | ) | | | 0.06 | | | | (0.46 | ) | | | — | | |
2017 | | $ | 10.35 | | | | 0.48 | | | | 0.44 | | | | 0.92 | | | | (0.48 | ) | | | — | | |
Member Class | | | |
Six Months Ended
June 30, 2022
(Unaudited) | | $ | 11.09 | | | | 0.20 | | | | (1.67 | ) | | | (1.47 | ) | | | (0.20 | ) | | | — | | |
Year Ended December 31: | |
2021 | | $ | 10.84 | | | | 0.34 | | | | 0.31 | | | | 0.65 | | | | (0.40 | ) | | | — | | |
November 3, 2020 (f)
through
December 31, 2020 | | $ | 10.56 | | | | 0.12 | | | | 0.31 | | | | 0.43 | | | | (0.06 | ) | | | (0.09 | ) | |
(a) Per share net investment income (loss) has been calculated using the average daily shares method.
(b) Not annualized for periods less than one year.
(c) Annualized for periods less than one year.
(d) Does not include acquired fund fees and expenses, if any.
See notes to financial statements.
70
Victory Portfolios | | Financial Highlights — continued | |
For a Share Outstanding Throughout Each Period
| | | | | Ratios to Average Net Assets | | Supplemental Data | |
| | | Total
Distributions | | Net Asset
Value,
End of
Period | | Total
Return
(Excludes
Sales
Charge)(b) | | Net
Expenses(c)(d) | | Net
Investment
Income
(Loss)(c) | | Gross
Expenses(c)(d) | | Net Assets,
End of
Period
(000's) | | Portfolio
Turnover(b)(e) | |
Victory High Income Municipal Bond Fund | |
Class A | |
Six Months Ended
June 30, 2022
(Unaudited) | | | (0.20 | ) | | $ | 9.42 | | | | (13.39 | )% | | | 0.80 | % | | | 3.87 | % | | | 1.04 | % | | $ | 27,777 | | | | 12 | % | |
Year Ended December 31: | |
2021 | | | (0.38 | ) | | $ | 11.09 | | | | 5.91 | % | | | 0.80 | % | | | 3.22 | % | | | 1.04 | % | | $ | 34,352 | | | | 19 | % | |
2020 | | | (0.48 | ) | | $ | 10.84 | | | | 5.52 | % | | | 0.80 | % | | | 3.95 | % | | | 1.10 | % | | $ | 26,330 | | | | 74 | % | |
2019 | | | (0.46 | ) | | $ | 10.75 | | | | 8.04 | % | | | 0.80 | % | | | 3.27 | % | | | 1.09 | % | | $ | 19,153 | | | | 49 | % | |
2018 | | | (0.43 | ) | | $ | 10.39 | | | | 0.34 | % | | | 0.80 | % | | | 4.13 | % | | | 1.02 | % | | $ | 16,483 | | | | 48 | % | |
2017 | | | (0.46 | ) | | $ | 10.79 | | | | 8.85 | % | | | 0.80 | % | | | 4.31 | % | | | 0.96 | % | | $ | 25,831 | | | | 66 | % | |
Class C | |
Six Months Ended
June 30, 2022
(Unaudited) | | | (0.16 | ) | | $ | 9.42 | | | | (13.72 | )% | | | 1.57 | % | | | 3.09 | % | | | 2.36 | % | | $ | 1,588 | | | | 12 | % | |
Year Ended December 31: | |
2021 | | | (0.30 | ) | | $ | 11.09 | | | | 5.12 | % | | | 1.57 | % | | | 2.50 | % | | | 2.20 | % | | $ | 2,192 | | | | 19 | % | |
2020 | | | (0.40 | ) | | $ | 10.84 | | | | 4.72 | % | | | 1.57 | % | | | 3.11 | % | | | 1.90 | % | | $ | 9,378 | | | | 74 | % | |
2019 | | | (0.38 | ) | | $ | 10.75 | | | | 7.22 | % | | | 1.57 | % | | | 2.61 | % | | | 1.85 | % | | $ | 13,995 | | | | 49 | % | |
2018 | | | (0.35 | ) | | $ | 10.39 | | | | (0.43 | )% | | | 1.57 | % | | | 3.35 | % | | | 1.78 | % | | $ | 19,282 | | | | 48 | % | |
2017 | | | (0.38 | ) | | $ | 10.79 | | | | 8.01 | % | | | 1.57 | % | | | 3.54 | % | | | 1.73 | % | | $ | 25,175 | | | | 66 | % | |
Class Y | |
Six Months Ended
June 30, 2022
(Unaudited) | | | (0.21 | ) | | $ | 9.42 | | | | (13.29 | )% | | | 0.57 | % | | | 4.08 | % | | | 0.86 | % | | $ | 10,219 | | | | 12 | % | |
Year Ended December 31: | |
2021 | | | (0.41 | ) | | $ | 11.09 | | | | 6.16 | % | | | 0.57 | % | | | 3.40 | % | | | 0.85 | % | | $ | 14,087 | | | | 19 | % | |
2020 | | | (0.51 | ) | | $ | 10.84 | | | | 5.76 | % | | | 0.57 | % | | | 4.14 | % | | | 0.93 | % | | $ | 9,682 | | | | 74 | % | |
2019 | | | (0.49 | ) | | $ | 10.75 | | | | 8.29 | % | | | 0.57 | % | | | 3.56 | % | | | 0.88 | % | | $ | 10,620 | | | | 49 | % | |
2018 | | | (0.46 | ) | | $ | 10.39 | | | | 0.57 | % | | | 0.57 | % | | | 4.36 | % | | | 0.78 | % | | $ | 11,683 | | | | 48 | % | |
2017 | | | (0.48 | ) | | $ | 10.79 | | | | 9.10 | % | | | 0.57 | % | | | 4.55 | % | | | 0.73 | % | | $ | 26,864 | | | | 66 | % | |
Member Class | |
Six Months Ended
June 30, 2022
(Unaudited) | | | (0.20 | ) | | $ | 9.42 | | | | (13.32 | )% | | | 0.65 | % | | | 4.05 | % | | | 1.34 | % | | $ | 3,316 | | | | 12 | % | |
Year Ended December 31: | |
2021 | | | (0.40 | ) | | $ | 11.09 | | | | 6.07 | % | | | 0.65 | % | | | 3.04 | % | | | 2.61 | % | | $ | 2,853 | | | | 19 | % | |
November 3, 2020 (f)
through
December 31, 2020 | | | (0.15 | ) | | $ | 10.84 | | | | 4.12 | % | | | 0.65 | % | | | 6.78 | % | | | 42.32 | % | | $ | 140 | | | | 74 | % | |
(d) Does not include acquired fund fees and expenses, if any.
(e) Portfolio turnover is calculated on the basis of the Fund as a whole without distinguishing between the classes of shares issued.
(f) Commencement of operations.
See notes to financial statements.
71
Victory Portfolios | | Financial Highlights | |
For a Share Outstanding Throughout Each Period
| | | | | Investment Activities | | Distributions to
Shareholders From | |
| | | Net Asset
Value,
Beginning of
Period | | Net
Investment
Income
(Loss)(a) | | Net Realized
and Unrealized
Gains (Losses) | | Total from
Investment
Activities | | Net
Investment
Income | | Total
Distributions | |
Victory Floating Rate Fund | | | |
Class A | | | |
Six Months Ended
June 30, 2022
(Unaudited) | | $ | 9.33 | | | | 0.18 | | | | (0.93 | ) | | | (0.75 | ) | | | (0.19 | ) | | | (0.19 | ) | |
Year Ended December 31: | |
2021 | | $ | 9.34 | | | | 0.36 | | | | — | (g) | | | 0.36 | | | | (0.37 | ) | | | (0.37 | ) | |
2020 | | $ | 9.42 | | | | 0.49 | | | | (0.08 | ) | | | 0.41 | | | | (0.49 | ) | | | (0.49 | ) | |
2019 | | $ | 9.13 | | | | 0.55 | | | | 0.29 | | | | 0.84 | | | | (0.55 | ) | | | (0.55 | ) | |
2018 | | $ | 9.60 | | | | 0.52 | | | | (0.47 | ) | | | 0.05 | | | | (0.52 | ) | | | (0.52 | ) | |
2017 | | $ | 9.71 | | | | 0.46 | | | | (0.10 | ) | | | 0.36 | | | | (0.47 | ) | | | (0.47 | ) | |
Class C | | | |
Six Months Ended
June 30, 2022
(Unaudited) | | $ | 9.33 | | | | 0.15 | | | | (0.94 | ) | | | (0.79 | ) | | | (0.15 | ) | | | (0.15 | ) | |
Year Ended December 31: | |
2021 | | $ | 9.34 | | | | 0.29 | | | | (0.01 | ) | | | 0.28 | | | | (0.29 | ) | | | (0.29 | ) | |
2020 | | $ | 9.42 | | | | 0.43 | | | | (0.09 | ) | | | 0.34 | | | | (0.42 | ) | | | (0.42 | ) | |
2019 | | $ | 9.14 | | | | 0.48 | | | | 0.28 | | | | 0.76 | | | | (0.48 | ) | | | (0.48 | ) | |
2018 | | $ | 9.61 | | | | 0.44 | | | | (0.47 | ) | | | (0.03 | ) | | | (0.44 | ) | | | (0.44 | ) | |
2017 | | $ | 9.72 | | | | 0.38 | | | | (0.10 | ) | | | 0.28 | | | | (0.39 | ) | | | (0.39 | ) | |
Class R | | | |
Six Months Ended
June 30, 2022
(Unaudited) | | $ | 9.33 | | | | 0.16 | | | | (0.94 | ) | | | (0.78 | ) | | | (0.16 | ) | | | (0.16 | ) | |
Year Ended December 31: | |
2021 | | $ | 9.33 | | | | 0.31 | | | | — | (g) | | | 0.31 | | | | (0.31 | ) | | | (0.31 | ) | |
2020 | | $ | 9.41 | | | | 0.45 | | | | (0.09 | ) | | | 0.36 | | | | (0.44 | ) | | | (0.44 | ) | |
2019 | | $ | 9.13 | | | | 0.50 | | | | 0.28 | | | | 0.78 | | | | (0.50 | ) | | | (0.50 | ) | |
2018 | | $ | 9.60 | | | | 0.46 | | | | (0.46 | ) | | | — | (g) | | | (0.47 | ) | | | (0.47 | ) | |
2017 | | $ | 9.72 | | | | 0.41 | | | | (0.12 | ) | | | 0.29 | | | | (0.41 | ) | | | (0.41 | ) | |
(a) Per share net investment income (loss) has been calculated using the average daily shares method.
(b) Includes adjustments in accordance with U.S. Generally Accepted Accounting Principles.
(c) Not annualized for periods less than one year.
(d) Annualized for periods less than one year.
(e) Does not include acquired fund fees and expenses, if any.
(f) Portfolio turnover is calculated on the basis of the Fund as a whole without distinguishing between the classes of shares issued.
(g) Amount is less than $0.005 per share.
See notes to financial statements.
72
Victory Portfolios | | Financial Highlights — continued | |
For a Share Outstanding Throughout Each Period
| | | | | Ratios to Average Net Assets | | Supplemental Data | |
| | | Net Asset
Value,
End of
Period | | Total
Return
(Excludes
Sales
Charge)(b)(c) | | Net
Expenses(d)(e) | | Net
Investment
Income
(Loss)(d) | | Gross
Expenses(d)(e) | | Net Assets,
End of
Period
(000's) | | Portfolio
Turnover(c)(f) | |
Victory Floating Rate Fund | |
Class A | |
Six Months Ended
June 30, 2022
(Unaudited) | | $ | 8.39 | | | | (8.19 | )% | | | 1.00 | % | | | 4.09 | % | | | 1.10 | % | | $ | 303,349 | | | | 25 | % | |
Year Ended December 31: | |
2021 | | $ | 9.33 | | | | 3.89 | % | | | 1.00 | % | | | 3.88 | % | | | 1.12 | % | | $ | 349,706 | | | | 35 | % | |
2020 | | $ | 9.34 | | | | 4.81 | % | | | 1.00 | % | | | 5.54 | % | | | 1.17 | % | | $ | 164,864 | | | | 54 | % | |
2019 | | $ | 9.42 | | | | 9.43 | % | | | 1.00 | % | | | 5.89 | % | | | 1.17 | % | | $ | 146,584 | | | | 35 | % | |
2018 | | $ | 9.13 | | | | 0.43 | % | | | 1.00 | % | | | 5.41 | % | | | 1.14 | % | | $ | 118,672 | | | | 48 | % | |
2017 | | $ | 9.60 | | | | 3.76 | % | | | 1.00 | % | | | 4.76 | % | | | 1.10 | % | | $ | 148,060 | | | | 57 | % | |
Class C | |
Six Months Ended
June 30, 2022
(Unaudited) | | $ | 8.39 | | | | (8.56 | )% | | | 1.80 | % | | | 3.29 | % | | | 1.86 | % | | $ | 72,650 | | | | 25 | % | |
Year Ended December 31: | |
2021 | | $ | 9.33 | | | | 3.05 | % | | | 1.80 | % | | | 3.09 | % | | | 1.89 | % | | $ | 81,109 | | | | 35 | % | |
2020 | | $ | 9.34 | | | | 3.96 | % | | | 1.80 | % | | | 4.81 | % | | | 1.94 | % | | $ | 94,885 | | | | 54 | % | |
2019 | | $ | 9.42 | | | | 8.49 | % | | | 1.80 | % | | | 5.08 | % | | | 1.92 | % | | $ | 149,054 | | | | 35 | % | |
2018 | | $ | 9.14 | | | | (0.38 | )% | | | 1.80 | % | | | 4.60 | % | | | 1.90 | % | | $ | 211,462 | | | | 48 | % | |
2017 | | $ | 9.61 | | | | 2.93 | % | | | 1.80 | % | | | 3.97 | % | | | 1.87 | % | | $ | 265,486 | | | | 57 | % | |
Class R | |
Six Months Ended
June 30, 2022
(Unaudited) | | $ | 8.39 | | | | (8.45 | )% | | | 1.56 | % | | | 3.54 | % | | | 3.16 | % | | $ | 569 | | | | 25 | % | |
Year Ended December 31: | |
2021 | | $ | 9.33 | | | | 3.40 | % | | | 1.56 | % | | | 3.31 | % | | | 3.45 | % | | $ | 602 | | | | 35 | % | |
2020 | | $ | 9.33 | | | | 4.23 | % | | | 1.56 | % | | | 5.01 | % | | | 6.20 | % | | $ | 300 | | | | 54 | % | |
2019 | | $ | 9.41 | | | | 8.75 | % | | | 1.56 | % | | | 5.34 | % | | | 3.73 | % | | $ | 455 | | | | 35 | % | |
2018 | | $ | 9.13 | | | | (0.13 | )% | | | 1.56 | % | | | 4.84 | % | | | 2.99 | % | | $ | 716 | | | | 48 | % | |
2017 | | $ | 9.60 | | | | 3.07 | % | | | 1.56 | % | | | 4.20 | % | | | 2.26 | % | | $ | 916 | | | | 57 | % | |
(continues on next page)
See notes to financial statements.
73
Victory Portfolios | | Financial Highlights | |
For a Share Outstanding Throughout Each Period
| | | | | Investment Activities | | Distributions to
Shareholders From | |
| | | Net Asset
Value,
Beginning of
Period | | Net
Investment
Income
(Loss)(a) | | Net Realized
and Unrealized
Gains (Losses) | | Total from
Investment
Activities | | Net
Investment
Income | | Total
Distributions | |
Victory Floating Rate Fund | | | |
Class Y | | | |
Six Months Ended
June 30, 2022
(Unaudited) | | $ | 9.33 | | | | 0.19 | | | | (0.93 | ) | | | (0.74 | ) | | | (0.20 | ) | | | (0.20 | ) | |
Year Ended December 31: | |
2021 | | $ | 9.35 | | | | 0.38 | | | | (0.01 | ) | | | 0.37 | | | | (0.39 | ) | | | (0.39 | ) | |
2020 | | $ | 9.43 | | | | 0.51 | | | | (0.08 | ) | | | 0.43 | | | | (0.51 | ) | | | (0.51 | ) | |
2019 | | $ | 9.14 | | | | 0.57 | | | | 0.29 | | | | 0.86 | | | | (0.57 | ) | | | (0.57 | ) | |
2018 | | $ | 9.61 | | | | 0.54 | | | | (0.47 | ) | | | 0.07 | | | | (0.54 | ) | | | (0.54 | ) | |
2017 | | $ | 9.72 | | | | 0.48 | | | | (0.10 | ) | | | 0.38 | | | | (0.49 | ) | | | (0.49 | ) | |
Member Class | | | |
Six Months Ended
June 30, 2022
(Unaudited) | | $ | 9.33 | | | | 0.19 | | | | (0.94 | ) | | �� | (0.75 | ) | | | (0.19 | ) | | | (0.19 | ) | |
Year Ended December 31: | |
2021 | | $ | 9.34 | | | | 0.38 | | | | (0.01 | ) | | | 0.37 | | | | (0.38 | ) | | | (0.38 | ) | |
November 3, 2020 (g)
through
December 31, 2020 | | $ | 9.02 | | | | 0.08 | | | | 0.32 | | | | 0.40 | | | | (0.08 | ) | | | (0.08 | ) | |
(a) Per share net investment income (loss) has been calculated using the average daily shares method.
(b) Includes adjustments in accordance with U.S. Generally Accepted Accounting Principles.
(c) Not annualized for periods less than one year.
(d) Annualized for periods less than one year.
(e) Does not include acquired fund fees and expenses, if any.
(f) Portfolio turnover is calculated on the basis of the Fund as a whole without distinguishing between the classes of shares issued.
(g) Commencement of operations.
See notes to financial statements.
74
Victory Portfolios | | Financial Highlights — continued | |
For a Share Outstanding Throughout Each Period (continued)
| | | | | Ratios to Average Net Assets | | Supplemental Data | |
| | | Net Asset
Value,
End of
Period | | Total
Return(b)(c) | | Net
Expenses(d)(e) | | Net
Investment
Income
(Loss)(d) | | Gross
Expenses(d)(e) | | Net Assets,
End of
Period
(000's) | | Portfolio
Turnover(c)(f) | |
Victory Floating Rate Fund | |
Class Y | |
Six Months Ended
June 30, 2022
(Unaudited) | | $ | 8.39 | | | | (8.08 | )% | | | 0.78 | % | | | 4.31 | % | | | 0.83 | % | | $ | 1,585,656 | | | | 25 | % | |
Year Ended December 31: | |
2021 | | $ | 9.33 | | | | 4.01 | % | | | 0.78 | % | | | 4.08 | % | | | 0.86 | % | | $ | 1,768,900 | | | | 35 | % | |
2020 | | $ | 9.35 | | | | 5.03 | % | | | 0.78 | % | | | 5.73 | % | | | 0.93 | % | | $ | 403,852 | | | | 54 | % | |
2019 | | $ | 9.43 | | | | 9.65 | % | | | 0.78 | % | | | 6.10 | % | | | 0.92 | % | | $ | 289,796 | | | | 35 | % | |
2018 | | $ | 9.14 | | | | 0.64 | % | | | 0.78 | % | | | 5.64 | % | | | 0.89 | % | | $ | 281,545 | | | | 48 | % | |
2017 | | $ | 9.61 | | | | 3.98 | % | | | 0.78 | % | | | 4.99 | % | | | 0.88 | % | | $ | 276,195 | | | | 57 | % | |
Member Class | |
Six Months Ended
June 30, 2022
(Unaudited) | | $ | 8.39 | | | | (8.12 | )% | | | 0.85 | % | | | 4.30 | % | | | 1.33 | % | | $ | 4,207 | | | | 25 | % | |
Year Ended December 31: | |
2021 | | $ | 9.33 | | | | 4.04 | % | | | 0.85 | % | | | 4.02 | % | | | 3.64 | % | | $ | 2,122 | | | | 35 | % | |
November 3, 2020 (g)
through
December 31, 2020 | | $ | 9.34 | | | | 4.41 | % | | | 0.85 | % | | | 5.46 | % | | | 56.41 | % | | $ | 62 | | | | 54 | % | |
See notes to financial statements.
75
Victory Portfolios | | Notes to Financial Statements
June 30, 2022 | |
(Unaudited)
1. Organization:
Victory Portfolios (the "Trust") is organized as a Delaware statutory trust and the Trust is registered under the Investment Company Act of 1940, as amended (the "1940 Act"), as an open-end investment company. The Trust is comprised of 40 funds and is authorized to issue an unlimited number of shares, which are units of beneficial interest with a par value of $0.001 per share.
The accompanying financial statements are those of the following seven Funds (collectively, the "Funds" and individually, a "Fund"). Each Fund is classified as diversified under the 1940 Act.
Funds (Legal Name) | | Funds (Short Name) | | Investment Share
Classes Offered | |
Victory INCORE Investment Quality
Bond Fund | | INCORE Investment Quality
Bond Fund | | A, C, R, and Y
| |
Victory INCORE Low Duration
Bond Fund | | INCORE Low Duration
Bond Fund | | A, C, R, and Y
| |
Victory High Yield Fund | | High Yield Fund | | A, C, R, and Y | |
Victory Tax-Exempt Fund | | Tax-Exempt Fund | | A, C, and Y | |
Victory High Income Municipal
Bond Fund | | High Income Municipal
Bond Fund | | A, C, Y, and
Member Class | |
Victory Floating Rate Fund | | Floating Rate Fund | | A, C, R, Y, and
Member Class | |
Each class of shares of a Fund has substantially identical rights and privileges except with respect to sales charges, fees paid under distribution plans, expenses allocable exclusively to each class of shares, voting rights on matters solely affecting a single class of shares, and the exchange privilege of each class of shares.
Under the Trust's organizational documents, its officers and trustees are indemnified against certain liabilities arising out of the performance of their duties to the Funds. In addition, in the normal course of business, the Funds enter into contracts with their vendors and others that provide for general indemnifications. The Funds' maximum exposure under these arrangements is unknown, as this would involve future claims that may be made against the Funds. However, based on experience, the Funds expect that risk of loss to be remote.
2. Significant Accounting Policies:
The following is a summary of significant accounting policies followed by the Trust in the preparation of its financial statements. The policies are in conformity with U.S. Generally Accepted Accounting Principles ("GAAP"). The preparation of financial statements in accordance with GAAP requires management to make estimates and assumptions that affect the reported amounts of assets and liabilities and disclosure of contingent assets and liabilities at the date of the financial statements and the reported amounts of income and expenses for the period. Actual results could differ from those estimates. The Funds follow the specialized accounting and reporting requirements under GAAP that are applicable to investment companies under Accounting Standards Codification Topic 946.
Investment Valuation:
The Funds record investments at fair value. Fair value is defined as the price that would be received to sell an asset or paid to transfer a liability in an orderly transaction between market participants at the measurement date.
76
Victory Portfolios | | Notes to Financial Statements — continued
June 30, 2022 | |
(Unaudited)
The valuation techniques described below maximize the use of observable inputs and minimize the use of unobservable inputs in determining fair value. The inputs used for valuing the Funds' investments are summarized in the three broad levels listed below:
• Level 1 — quoted prices in active markets for identical securities
• Level 2 — other significant observable inputs (including quoted prices for similar securities or interest rates applicable to those securities, etc.)
• Level 3 — significant unobservable inputs (including the Funds' own assumptions in determining the fair value of investments)
Changes in valuation techniques may result in transfers in or out of an assigned level within the disclosure hierarchy. The inputs or methodologies used for valuation techniques are not necessarily an indication of the risk associated with entering into those investments.
Victory Capital Management Inc. ("VCM" or the "Adviser") has established the Pricing and Liquidity Committee (the "Committee"), and subject to the Trust's Board of Trustees' (the "Board") oversight, the Committee administers and oversees the Funds' valuation policies and procedures, which are approved by the Board.
Portfolio securities listed or traded on securities exchanges, including Exchange-Traded Funds ("ETFs"), are valued at the closing price on the exchange or system where the security is principally traded, if available, or at the Nasdaq Official Closing Price. If there have been no sales for that day on the exchange or system, then a security is valued at the last available bid quotation on the exchange or system where the security is principally traded. In each of these situations, valuations are typically categorized as Level 1 in the fair value hierarchy.
Investments in open-end investment companies, other than ETFs, are valued at their net asset value ("NAV"). These valuations are typically categorized as Level 1 in the fair value hierarchy.
Debt securities are valued each business day by a pricing service approved by the Board. The approved pricing service uses the evaluated bid or the last sale price to value securities. Debt obligations maturing within 60 days may be valued at amortized cost, provided that the amortized cost represents the fair value of such securities. These valuations are typically categorized as Level 2 in the fair value hierarchy.
Futures contracts are valued at the settlement price established each day by the board of trade or an exchange on which they are traded. These valuations are typically categorized as Level 1 in the fair value hierarchy.
Swap agreements are valued at the mean between the current bid and ask prices. To the extent this model is utilized, these valuations are considered as Level 2 in the fair value hierarchy.
In the event that price quotations or valuations are not readily available, investments are valued at fair value in accordance with procedures established by and under the general supervision and responsibility of the Board. These valuations are typically categorized as Level 2 or Level 3 in the fair value hierarchy, based on the observability of inputs used to determine the fair value. The effect of fair value pricing is that securities may not be priced on the basis of quotations from the primary market in which they are traded and the actual price realized from the sale of a security may differ materially from the fair value price. Valuing these securities at fair value is intended to cause the Fund's NAV to be more reliable than it otherwise would be.
77
Victory Portfolios | | Notes to Financial Statements — continued
June 30, 2022 | |
(Unaudited)
A summary of the valuations as of June 30, 2022, based upon the three levels defined above, is included in the table below while the breakdown, by category, of investments is disclosed on the Schedules of Portfolio Investments:
| | | Level 1 | | Level 2 | | Level 3 | | Total | |
INCORE Investment Quality Bond Fund | |
Asset-Backed Securities | | $ | — | | | $ | 1,034,771 | | | $ | — | | | $ | 1,034,771 | | |
Collateralized Mortgage Obligations | | | — | | | | 1,486,935 | | | | — | | | | 1,486,935 | | |
Convertible Corporate Bonds | | | — | | | | 1,614,707 | | | | — | | | | 1,614,707 | | |
Convertible Preferred Stocks | | | 794,359 | | | | 21,053 | | | | — | | | | 815,412 | | |
Corporate Bonds | | | — | | | | 8,426,579 | | | | — | | | | 8,426,579 | | |
Residential Mortgage-Backed
Securities | | | — | | | | 50,932 | | | | — | | | | 50,932 | | |
Yankee Dollars | | | — | | | | 1,945,136 | | | | — | | | | 1,945,136 | | |
U.S. Government Mortgage-Backed
Agencies | | | — | | | | 5,191,038 | | | | — | | | | 5,191,038 | | |
U.S. Treasury Obligations | | | — | | | | 891,140 | | | | — | | | | 891,140 | | |
Collateral for Securities Loaned | | | 570,657 | | | | — | | | | — | | | | 570,657 | | |
Total | | $ | 1,365,016 | | | $ | 20,662,291 | | | $ | — | | | $ | 22,027,307 | | |
Other Financial Investments*: | |
Assets: | |
Futures Contracts | | $ | 67,038 | | | $ | — | | | $ | — | | | $ | 67,038 | | |
Liabilities: | |
Futures Contracts | | | (35,775 | ) | | | — | | | | — | | | | (35,775 | ) | |
Total | | $ | 31,263 | | | $ | — | | | $ | — | | | $ | 31,263 | | |
INCORE Low Duration Bond Fund | |
Asset-Backed Securities | | $ | — | | | $ | 13,911,386 | | | $ | — | | | $ | 13,911,386 | | |
Collateralized Mortgage Obligations | | | — | | | | 22,957,673 | | | | — | | | | 22,957,673 | | |
Convertible Corporate Bonds | | | — | | | | 10,114,790 | | | | — | | | | 10,114,790 | | |
Convertible Preferred Stocks | | | 4,569,110 | | | | 179,528 | | | | — | | | | 4,748,638 | | |
Corporate Bonds | | | — | | | | 72,903,918 | | | | — | | | | 72,903,918 | | |
Residential Mortgage-Backed
Securities | | | — | | | | 1,922,284 | | | | — | | | | 1,922,284 | | |
Yankee Dollars | | | — | | | | 18,685,681 | | | | — | | | | 18,685,681 | | |
U.S. Government Mortgage-Backed
Agencies | | | — | | | | 7,207,959 | | | | — | | | | 7,207,959 | | |
U.S. Treasury Obligations | | | — | | | | 40,633,640 | | | | — | | | | 40,633,640 | | |
Collateral for Securities Loaned | | | 3,033,487 | | | | — | | | | — | | | | 3,033,487 | | |
Total | | $ | 7,602,597 | | | $ | 188,516,859 | | | $ | — | | | $ | 196,119,456 | | |
Other Financial Investments*: | |
Assets: | |
Futures Contracts | | $ | 293,954 | | | $ | — | | | $ | — | | | $ | 293,954 | | |
Liabilities: | |
Credit Default Swap | | | — | | | | (542,564 | ) | | | — | | | | (542,564 | ) | |
Futures Contracts | | | (192,453 | ) | | | — | | | | — | | | | (192,453 | ) | |
Total | | $ | 101,501 | | | $ | (542,564 | ) | | $ | — | | | $ | (441,063 | ) | |
High Yield Fund | |
Common Stocks | | $ | 1,469,560 | | | $ | — | | | $ | 59,591 | | | $ | 1,529,151 | | |
Senior Secured Loans | | | — | | | | 54,852,827 | | | | — | | | | 54,852,827 | | |
Corporate Bonds | | | — | | | | 184,936,866 | | | | — | | | | 184,936,866 | | |
Yankee Dollars | | | — | | | | 21,567,406 | | | | — | | | | 21,567,406 | | |
Collateral for Securities Loaned | | | 30,308,807 | | | | — | | | | — | | | | 30,308,807 | | |
Total | | $ | 31,778,367 | | | $ | 261,357,099 | | | $ | 59,591 | | | $ | 293,195,057 | | |
78
Victory Portfolios | | Notes to Financial Statements — continued
June 30, 2022 | |
(Unaudited)
| | | Level 1 | | Level 2 | | Level 3 | | Total | |
Tax-Exempt Fund | |
Municipal Bonds | | $ | — | | | $ | 48,019,959 | | | $ | — | | | $ | 48,019,959 | | |
Exchange-Traded Funds | | | 1,346,250 | | | | — | | | | — | | | | 1,346,250 | | |
Total | | $ | 1,346,250 | | | $ | 48,019,959 | | | $ | — | | | $ | 49,366,209 | | |
High Income Municipal Bond Fund | |
Municipal Bonds | | $ | — | | | $ | 41,551,782 | | | $ | — | | | $ | 41,551,782 | | |
Exchange-Traded Funds | | | 538,500 | | | | — | | | | — | | | | 538,500 | | |
Total | | $ | 538,500 | | | $ | 41,551,782 | | | $ | — | | | $ | 42,090,282 | | |
Floating Rate Fund | |
Common Stocks | | $ | — | | | $ | — | | | $ | 96,853 | | | $ | 96,853 | | |
Warrants | | | — | | | | 39,090 | | | | — | | | | 39,090 | | |
Senior Secured Loans | | | — | | | | 1,816,538,895 | | | | — | | | | 1,816,538,895 | | |
Corporate Bonds | | | — | | | | 92,848,632 | | | | — | | | | 92,848,632 | | |
Yankee Dollars | | | — | | | | 6,462,460 | | | | — | | | | 6,462,460 | | |
Total | | $ | — | | | $ | 1,915,889,077 | | | $ | 96,853 | | | $ | 1,915,985,930 | | |
* Futures contracts and credit default swaps are valued at the unrealized appreciation (depreciation) on the investment.
For the six months ended June 30, 2022, there were no transfers in or out of Level 3 in the fair value hierarchy.
Real Estate Investment Trusts ("REITs"):
The Funds may invest in REITs, which report information on the source of their distributions annually. REITs are pooled investment vehicles that invest primarily in income-producing real estate or real-estate related loans or interests (such as mortgages). Certain distributions received from REITs during the year are recorded as realized gains or return of capital as estimated by the Funds or when such information becomes known.
Investment Companies:
Exchange-Traded Funds:
The Funds may invest in ETFs, the shares of which are bought and sold on a securities exchange. An ETF trades like common stock and represents a fixed portfolio of securities often designed to track the performance and dividend yield of a particular domestic or foreign market index. The Funds may purchase shares of an ETF to temporarily gain exposure to a portion of the U.S. or a foreign market while awaiting purchase of underlying securities. The risks of owning an ETF generally reflect the risks of owning the underlying securities they are designed to track, although the lack of liquidity of an ETF could result in it being more volatile. Additionally, ETFs have fees and expenses that reduce their value.
Open-End Funds:
The Funds may invest in portfolios of open-end investment companies. These investment companies value securities in their portfolios for which market quotations are readily available at their market values (generally the last reported sale price) and all other securities and assets at their fair value by the methods established by the board of directors of the underlying funds.
Securities Purchased on a Delayed-Delivery or When-Issued Basis:
The Funds may purchase securities on a when-issued basis. When-issued securities are securities purchased for delivery beyond normal settlement periods at a stated price and/or yield, thereby involving the risk that the price and/or yield obtained may be more or less than those available in the market when delivery takes place. At the time a Fund makes the commitment to purchase a security on a
79
Victory Portfolios | | Notes to Financial Statements — continued
June 30, 2022 | |
(Unaudited)
when-issued basis, the Fund records the transaction and reflects the value of the security in determining net asset value. No interest accrues to the Fund until the transaction settles and payment takes place. Normally, the settlement date occurs within one month of the purchase. A segregated account is established and the Fund maintains cash and/or marketable securities at least equal in value to commitments for when-issued securities. If a Fund owns when-issued securities, these values are included in Payable for investments purchased on the accompanying Statements of Assets and Liabilities and the segregated assets are identified on the Schedules of Portfolio Investments.
Municipal Obligations:
The values of municipal obligations can fluctuate and may be affected by adverse tax, legislative, or political changes, and by financial developments affecting municipal issuers. Payment of municipal obligations may depend on a relatively limited source of revenue, resulting in greater credit risk. Future changes in federal tax laws or the activity of an issuer may adversely affect the tax-exempt status of municipal obligations.
Mortgage- and Asset-Backed Securities:
The values of some mortgage-related or asset-backed securities may be particularly sensitive to changes in prevailing interest rates. Early repayment of principal on some mortgage-related securities may expose the Fund to a lower rate of return upon reinvestment of principal. The values of mortgage- and asset-backed securities depend in part on the credit quality and adequacy of the underlying assets or collateral and may fluctuate in response to the market's perception of these factors as well as current and future repayment rates. Some mortgage-backed securities are backed by the full faith and credit of the U.S. government (e.g., mortgage-backed securities issued by the Government National Mortgage Association, commonly known as "Ginnie Mae"), while other mortgage-backed securities (e.g., mortgage-backed securities issued by the Federal National Mortgage Association and the Federal Home Loan Mortgage Corporation, commonly known as "Fannie Mae" and "Freddie Mac," respectively), are backed only by the credit of the government entity issuing them. In addition, some mortgage-backed securities are issued by private entities and, as such, are not guaranteed by the U.S. government or any agency or instrumentality of the U.S. government.
Loans:
Floating rate loans in which certain Funds invest are primarily "senior" loans. Senior floating rate loans typically hold a senior position in the capital structures of the borrower, are typically secured by specific collateral, and have a claim on the assets and/or stock of the borrower that is senior to that held by subordinated debtholders and stockholders of the borrower. While these protections may reduce risk, these investments still present significant credit risk. A significant portion of a Fund's floating rate investments may be issued in connection with highly leveraged transactions such as leveraged buyouts, leveraged recapitalization loans, and other types of acquisition financing. Obligations in these types of transactions are subject to greater credit risk (including default and bankruptcy) than many other investments and may be, or become, illiquid. See the note below regarding below-investment-grade securities.
The Funds may purchase second-lien loans (secured loans with a claim on collateral subordinate to a senior lender's claim on such collateral), fixed rate loans, unsecured loans, and other debt obligations.
Transactions in loans often settle on a delayed basis, and a Fund may not receive the proceeds from the sale of a loan or pay for a loan purchase for a substantial period of time after entering into the transactions.
Below-Investment-Grade Securities:
Certain Funds may invest in below-investment-grade securities (i.e., lower-quality, "junk" debt), which are subject to various risks. Lower-quality debt is considered to be speculative because it is less certain that the issuer will be able to pay interest or repay the principal than in the case of investment-grade debt. These securities can involve a substantially greater risk of default than higher-rated securities, and their values can decline significantly over short periods of time. Lower-quality debt securities tend
80
Victory Portfolios | | Notes to Financial Statements — continued
June 30, 2022 | |
(Unaudited)
to be more sensitive to adverse news about their issuers, the market and the economy in general, than higher-quality debt securities. The market for these securities can be less liquid, especially during periods of recession or general market decline.
Derivative Instruments:
Futures Contracts:
The Funds may enter into contracts for the future delivery of securities or foreign currencies and futures contracts based on a specific security, class of securities, foreign currency or an index, and purchase or sell options on any such futures contracts. A futures contract on a securities index is an agreement obligating either party to pay, and entitling the other party to receive, while the contract is outstanding, cash payments based on the level of a specified securities index. No physical delivery of the underlying asset is made. The Funds may enter into futures contracts in an effort to hedge against market risks. The acquisition of put and call options on futures contracts will give the Funds the right (but not the obligation), for a specified price, to sell or to purchase the underlying futures contract, upon exercise of the option, at any time during the option period. Futures transactions involve brokerage costs and require the Funds to segregate assets to cover contracts that would require it to purchase securities or currencies. A good faith margin deposit, known as initial margin, of cash or government securities with a broker or custodian is required to initiate and maintain open positions in futures contracts. Subsequent payments, known as variation margin, are made or received by the Funds based on the change in the market value of the position and are recorded as unrealized appreciation or depreciation until the contract is closed out, at which time the gain or loss is realized. The Funds may lose the expected benefit of futures transactions if interest rates, exchange rates or securities prices change in an unanticipated manner. Such unanticipated changes may also result in lower overall performance than if the Funds had not entered into any futures transactions. In addition, the value of the Funds' futures positions may not prove to be perfectly or even highly correlated with the value of its portfolio securities or foreign currencies, limiting the Funds' ability to hedge effectively against interest rate, exchange rate and/or market risk and giving rise to additional risks. There is no assurance of liquidity in the secondary market for purposes of closing out futures positions. The collateral held by the Funds is reflected on the Statements of Assets and Liabilities under Deposit with broker for futures contracts.
Management has determined that no offsetting requirements exist as a result of their conclusion that the Funds are not subject to master netting agreements for futures contracts.
During the six months ended June 30, 2022, the Funds entered into futures contracts primarily for the strategy of hedging or other purposes, including but not limited to, providing liquidity and equitizing cash.
Credit Derivatives:
The Funds may enter into credit derivatives, including centrally cleared credit default swaps on individual obligations or credit indices. The Funds may use these investments (i) as alternatives to direct long or short investment in a particular security or securities, (ii) to adjust the Funds' asset allocations or risk exposures, or (iii) for hedging purposes. The use by the Funds of centrally cleared credit default swaps may have the effect of creating a short position in a security. Credit derivatives can create investment leverage and may create additional investment risks that may subject the Funds to greater volatility than investments in more traditional securities, as described in the Funds' Statements of Additional Information.
Centrally cleared credit default swap ("CDS") agreements on credit indices involve one party making a stream of payments (referred to as the buyer of protection) to another party (the seller of protection) in exchange for the right to receive a specified return in the event of a write-down, principal shortfall, interest shortfall or default of all or part of the referenced entities comprising the credit index. A credit index is a basket of credit instruments or exposures designed to be representative of a specific sector of the credit market as a whole. These indices are made up of reference credits that are judged by a poll of dealers to be the most liquid entities in the CDS.
81
Victory Portfolios | | Notes to Financial Statements — continued
June 30, 2022 | |
(Unaudited)
The counterparty risk for cleared swap agreements is generally lower than uncleared over-the-counter swap agreements because generally a clearing organization becomes substituted for each counterparty to a centrally cleared swap agreement and, in effect, guarantees each party's performance under the contract as each party to a trade looks only to the clearing organization for performance of financial obligations. However, there can be no assurance that the clearing organization, or its members, will satisfy its obligations to the Fund.
The Funds may enter into CDS agreements either as a buyer or seller. The Funds may buy protection under a CDS to attempt to mitigate the risk of default or credit quality deterioration in one or more individual holdings or in a segment of the fixed income securities market. The Funds may sell protection under a CDS in an attempt to gain exposure to an underlying issuer's credit quality characteristics without investing directly in that issuer.
For swaps entered with an individual counterparty, the Funds bear the risk of loss of the uncollateralized amount expected to be received under a CDS agreement in the event of the default or bankruptcy of the counterparty. CDS agreements are generally valued at a price at which the counterparty to such agreement would terminate the agreement. The Funds may also enter into centrally cleared swaps.
Upon entering into a cleared CDS, the Funds may be required to deposit with the broker an amount of cash or cash equivalents in the range of approximately 3% to 6% of the notional amount for CDS on high yield debt issuers (this amount is subject to change by the clearing organization that clears the trade). This amount, known as "initial margin," is in the nature of a performance bond or good faith deposit on the CDS and is returned to a Fund upon termination of the CDS, assuming all contractual obligations have been satisfied. Subsequent payments, known as "variation margin," to and from the broker will be made daily as the price of the CDS fluctuates, making the long and short positions in the CDS contract more or less valuable, a process known as "marking-to-market". The premium (discount) payments are built into the daily price of the CDS and thus are amortized through the variation margin. The variation margin payment also includes the daily portion of the periodic payment stream.
The maximum potential amount of future payments (undiscounted) that the Funds as a seller of protection could be required to make under a CDS agreement equals the notional amount of the agreement. Notional amounts of each individual CDS agreement outstanding as of year end for which the Funds are the sellers of protection are disclosed on the Schedules of Portfolio Investments. These potential amounts would be partially offset by any recovery values of the respective referenced obligations, upfront payments received upon entering into the agreement, periodic interest payments, or net amounts received from the settlement of buy protection CDS agreements entered into by the Funds for the same referenced entity or entities. The collateral held by the Funds is reflected on the Statements of Assets and Liabilities under Deposit with broker for swap agreements.
Management has determined that no offsetting requirements exist as a result of their conclusion that the Funds are not subject to master netting agreements for swap agreements.
As of June 30, 2022, INCORE Low Duration Bond Fund entered into centrally cleared CDS agreements primarily for the strategy of asset allocation and risk exposure, and the INCORE Total Return Bond Fund had no open swap agreements.
Summary of Derivative Instruments:
The following table summarizes the fair values of derivative instruments on the Statements of Assets and Liabilities, categorized by risk exposure, as of June 30, 2022:
| | | Assets | | Liabilities | |
| | | Variation Margin
Receivable on Open
Futures Contracts* | | Variation Margin
Payable on Open
Futures Contracts* | | Variation Margin
Payable on Open
Swap Contracts* | |
Credit Risk Exposure: | |
INCORE Low Duration Bond Fund | | $ | — | | | $ | — | | | $ | 542,564 | | |
Currency Risk Exposure: | |
INCORE Investment Quality Bond Fund | | | 11,531 | | | | 9,825 | | | | — | | |
INCORE Low Duration Bond Fund | | | 110,699 | | | | 102,337 | | | | — | | |
82
Victory Portfolios | | Notes to Financial Statements — continued
June 30, 2022 | |
(Unaudited)
| | | Assets | | Liabilities | |
| | | Variation Margin
Receivable on Open
Futures Contracts* | | Variation Margin
Payable on Open
Futures Contracts* | | Variation Margin
Payable on Open
Swap Contracts* | |
Equity Risk Exposure: | |
INCORE Investment Quality Bond Fund | | $ | 26,765 | | | $ | — | | | $ | — | | |
INCORE Low Duration Bond Fund | | | 85,882 | | | | — | | | | — | | |
Interest Rate Risk Exposure: | |
INCORE Investment Quality Bond Fund | | | 28,742 | | | | 25,950 | | | | — | | |
INCORE Low Duration Bond Fund | | | 97,373 | | | | 90,116 | | | | — | | |
* Includes cumulative appreciation/depreciation of futures contracts and swap agreements as reported on the Schedules of Portfolio Investments. Only current day's variation margin for both futures contracts and swap agreements is reported within the Statements of Assets and Liabilities.
The following table presents the effect of derivative instruments on the Statements of Operations, categorized by risk exposure, for the six months ended June 30, 2022:
| | | Net Realized Gains (Losses)
on Derivatives
Recognized as a
Result from Operations | | Net Change in Unrealized
Appreciation/Depreciation
on Derivatives Recognized
as a Result of Operations | |
| | | Net Realized
Gains (Losses)
from Futures
Contracts | | Net Realized
Gains (Losses)
from Swap
Agreements | | Net Change in
Unrealized
Appreciation/
Depreciation
on Futures
Contracts | | Net Change in
Unrealized
Appreciation/
Depreciation
on Swap
Agreements | |
Credit Risk Exposure: | |
INCORE Investment Quality Bond Fund | | $ | — | | | $ | 6,365 | | | $ | — | | | $ | (258 | ) | |
INCORE Low Duration Bond Fund | | | — | | | | (108,260 | ) | | | — | | | | (584,075 | ) | |
Currency Risk Exposure: | |
INCORE Investment Quality Bond Fund | | | 77,471 | | | | — | | | | (894 | ) | | | — | | |
INCORE Low Duration Bond Fund | | | 746,525 | | | | — | | | | (11,918 | ) | | | — | | |
Equity Risk Exposure: | |
INCORE Investment Quality Bond Fund | | | 43,223 | | | | — | | | | 28,165 | | | | — | | |
INCORE Low Duration Bond Fund | | | 196,926 | | | | — | | | | 85,882 | | | | — | | |
Interest Rate Risk Exposure: | |
INCORE Investment Quality Bond Fund | | | (240,657 | ) | | | — | | | | 7,237 | | | | — | | |
INCORE Low Duration Bond Fund | | | 694,822 | | | | — | | | | 31,840 | | | | — | | |
All open derivative positions at period end are reflected on each respective Fund's Schedule of Portfolio Investments. The underlying face value of open derivative positions relative to each Fund's net assets at period end is generally representative of the notional amount of open positions to net assets throughout the period.
Investment Transactions and Related Income:
Changes in holdings of investments are accounted for no later than one business day following the trade date. For financial reporting purposes, however, investment transactions are accounted for on trade date or the last business day of the reporting period. Interest income is determined on the basis of coupon interest accrued using the effective interest method which adjusts, where applicable, the amortization of premiums or accretion of discounts. Dividend income is recorded on the ex-dividend date. Gains or losses realized on sales of securities are recorded on the identified cost basis. Paydown gains or losses on applicable securities, if any, are recorded as components of Interest Income on the Statements of Operations.
83
Victory Portfolios | | Notes to Financial Statements — continued
June 30, 2022 | |
(Unaudited)
The Funds may receive other income from investments in loan assignments and/or unfunded commitments, including amendment fees, consent fees, and commitment fees. These fees are recorded as income when received. These amounts, if received, are included in Interest income on the Statements of Operations.
Securities Lending:
The Funds, through a Securities Lending Agreement with Citibank, N.A. ("Citibank"), may lend their securities to qualified financial institutions, such as certain broker-dealers and banks, to earn additional income, net of income retained by Citibank. Borrowers are required to initially secure their loans for collateral in the amount of at least 102% of the value of U.S. securities loaned or at least 105% of the value of non-U.S. securities loaned, marked-to-market daily. Any collateral shortfalls associated with increases in the valuation of the securities loaned are generally cured the next business day. The collateral can be received in the form of cash collateral and/or non-cash collateral. Non-cash collateral can include U.S. Government Securities and other securities as permitted by Securities and Exchange Commission ("SEC") guidelines. The cash collateral is invested in short-term instruments or cash equivalents, primarily open-end investment companies, as noted on the Funds' Schedules of Portfolio Investments. The Funds effectively do not have control of the non-cash collateral and therefore it is not disclosed on the Funds' Schedules of Portfolio Investments. Collateral requirements are determined daily based on the value of the Funds' securities on loan as of the end of the prior business day. During the time portfolio securities are on loan, the borrower will pay the Funds any dividends or interest paid on such securities plus any fee negotiated between the parties to the lending agreement. The Funds also earn a return from the collateral. The Funds pay Citibank various fees in connection with the investment of cash collateral and fees based on the investment income received from securities lending activities. Securities lending income (net of these fees) is disclosed on the Statements of Operations. Loans are terminable upon demand and the borrower must return the loaned securities within the lesser of one standard settlement period or five business days. Although risk is mitigated by the collateral, a Fund could experience a delay in recovering its securities and possible loss of income or value if the borrower fails to return them. In addition, there is a risk that the value of the short-term investments will be less than the amount of cash collateral required to be returned to the borrower.
The Funds' agreement with Citibank does not include master netting provisions. Non-cash collateral received by the Funds may not be sold or repledged, except to satisfy borrower default.
The following table is a summary of the Funds' securities lending transactions as of June 30, 2022.
| | | Value of
Securities on Loan | | Non-Cash
Collateral | | Cash
Collateral | |
INCORE Investment Quality Bond Fund | | $ | 552,020 | | | $ | — | | | $ | 570,657 | | |
INCORE Low Duration Bond Fund | | | 2,955,531 | | | | — | | | | 3,033,487 | | |
High Yield Fund | | | 28,669,708 | | | | — | | | | 30,308,807 | | |
Federal Income Taxes:
Each Fund intends to continue to qualify as a regulated investment company by complying with the provisions available to certain investment companies, as defined in applicable sections of the Internal Revenue Code, and to make distributions of net investment income and net realized gains sufficient to relieve it from all, or substantially all, federal income taxes. Accordingly, no provision for federal income taxes is required in the financial statements. The Funds have a tax year end of December 31.
For the six months ended June 30, 2022, the Funds did not incur any income tax, interest, or penalties, and have recorded no liability for net unrecognized tax benefits relating to uncertain tax positions.
Management of the Funds has reviewed tax positions taken in tax years that remain subject to examination by all major tax jurisdictions, including federal (i.e., the last four tax years, which includes the current fiscal tax year end). Management believes that there is no tax liability resulting from unrecognized tax benefits related to uncertain tax positions taken.
84
Victory Portfolios | | Notes to Financial Statements — continued
June 30, 2022 | |
(Unaudited)
Allocations:
Expenses directly attributable to a Fund are charged to that Fund, while expenses that are attributable to more than one fund in the Trust, or jointly with an affiliated trust, are allocated among the respective funds in the Trust and/or an affiliated trust based upon net assets or another appropriate basis.
Income, expenses (other than class-specific expenses such as transfer agent fees, state registration fees, printing fees, and 12b-1 fees), and realized and unrealized gains or losses on investments are allocated to each class of shares based on its relative net assets on the date income is earned or expenses and realized and unrealized gains and losses are incurred.
Cross-Trade Transactions:
Pursuant to Rule 17a-7 under the 1940 Act, the Funds may engage in securities transactions with affiliated investment companies and advisory accounts managed by the Adviser and any applicable sub-adviser. Any such purchase or sale transaction must be effected without brokerage commission or other remuneration, except for customary transfer fees. The transaction must be effected at the current market price, which is either the security's last sale price on an exchange or, if there are no transactions in the security that day, at the average of the highest bid and lowest asked price. For the six months ended June 30, 2022, the Fund engaged in the following securities transactions with affiliated funds, which resulted in the following net realized gains (losses):
| | | Purchases | | Sales | | Net Realized
Gains (Losses) | |
Tax-Exempt Fund | | $ | 2,400,000 | | | $ | 3,800,000 | | | $ | — | | |
High Income Municipal Bond | | | 2,900,000 | | | | 2,200,000 | | | | — | | |
3. Purchases and Sales:
Purchases and sales of securities (excluding securities maturing less than one year from acquisition) for the six months ended June 30, 2022, were as follows:
| | | Excluding
U.S. Government Securities | | U.S. Government Securities | |
| | | Purchases | | Sales | | Purchases | | Sales | |
INCORE Investment Quality
Bond Fund | | $ | 2,190,779 | | | $ | 2,168,063 | | | $ | 2,704,664 | | | $ | 3,631,731 | | |
INCORE Low Duration
Bond Fund | | | 33,649,111 | | | | 53,921,057 | | | | 64,199,057 | | | | 31,290,579 | | |
High Yield Fund | | | 91,847,673 | | | | 91,914,808 | | | | — | | | | — | | |
Tax-Exempt Fund | | | 4,585,054 | | | | 545,155 | | | | — | | | | — | | |
High Income Municipal
Bond Fund | | | 5,309,419 | | | | 5,318,152 | | | | — | | | | — | | |
Floating Rate Fund | | | 568,420,457 | | | | 563,162,415 | | | | — | | | | — | | |
4. Fees and Transactions with Affiliates and Related Parties:
Investment Advisory Fees:
Investment advisory services are provided to the Funds by the Adviser, which is a New York corporation registered as an investment adviser with the SEC. The Adviser is an indirect wholly owned subsidiary of Victory Capital Holdings, Inc., a publicly traded Delaware corporation, and a wholly owned direct subsidiary of Victory Capital Operating, LLC.
VCM has entered into a Sub-Advisory Agreement with Park Avenue Institutional Advisers LLC ("Park Avenue"). Park Avenue is responsible for providing day-to-day investment advisory services to the High Yield Fund and the Floating Rate Fund, subject to the oversight of the Board.
85
Victory Portfolios | | Notes to Financial Statements — continued
June 30, 2022 | |
(Unaudited)
Under the terms of the Investment Advisory Agreement, the Adviser is entitled to receive fees based on a percentage of the average daily net assets of each Fund. The rates at which the Adviser is paid by each Fund are included in the table below.
| | | Flat Rate | |
INCORE Investment Quality Bond Fund | | | 0.50 | % | |
INCORE Low Duration Bond Fund | | | 0.45 | % | |
High Yield Fund | | | 0.60 | % | |
Tax-Exempt Fund | | | 0.50 | % | |
High Income Municipal Bond Fund | | | 0.50 | % | |
Floating Rate Fund | | | 0.65 | % | |
Amounts incurred and paid to VCM for the six months ended June 30, 2022, are reflected on the Statements of Operations as Investment advisory fees.
Administration and Servicing Fees:
VCM also serves as the Funds' administrator and fund accountant. Under the Administration and Fund Accounting Agreement, VCM is entitled to receive fees based on a percentage of the average daily net assets of the Trust, Victory Variable Insurance Funds and Victory Portfolios II. The tiered rates at which VCM is paid by the Funds are shown in the table below:
Net Assets | |
Up to $15 billion | | $15 billion – $30 billion | | Over $30 billion | |
| | 0.08 | %, plus | | | 0.05 | %, plus | | | 0.04 | % | |
Amounts incurred for the six months ended June 30, 2022, are reflected on the Statements of Operations as Administration fees.
Citi Fund Services Ohio, Inc. ("Citi"), an affiliate of Citibank, acts as sub-administrator and sub-fund accountant to the Funds pursuant to the Sub-Administration and Sub-Fund Accounting Services Agreement between VCM and Citi. VCM pays Citi a fee for providing these services. The Trust reimburses VCM and Citi for out-of-pocket expenses incurred in providing these services and certain other expenses specifically allocated to the Funds. Amounts incurred for the six months ended June 30, 2022, are reflected on the Statements of Operations as Sub-Administration fees.
The Funds (as part of the Trust) have entered into an agreement with the Adviser to provide compliance services, pursuant to which the Adviser furnishes its compliance personnel, including the services of the Chief Compliance Officer ("CCO"), and other resources reasonably necessary to provide the Trust with compliance oversight services related to the design, administration, and oversight of a compliance program for the Trust in accordance with Rule 38a-1 under the 1940 Act. The CCO is an employee of the Adviser, which pays the compensation of the CCO and support staff. The funds in the Trust, Victory Variable Insurance Funds, Victory Portfolios II and USAA Mutual Funds (collectively, the "Victory Funds Complex"), in aggregate, compensate the Adviser for these services. Amounts incurred for the six months ended June 30, 2022, are reflected on the Statements of Operations as Compliance fees.
Transfer Agency Fees:
FIS Investor Services, LLC ("FIS") serves as the Funds' transfer agent. Under the Transfer Agent Agreement, the Trust pays FIS a fee for its services and reimburses FIS for all of their reasonable out-of-pocket expenses incurred in providing these services. Amounts incurred for the six months ended June 30, 2022, are reflected on the Statements of Operations as Transfer agent fees.
Victory Capital Transfer Agency, Inc., an affiliate of the Adviser, serves as sub-transfer agent for the Member Class. Victory Capital Transfer Agency, Inc. receives no fee or other compensation for these services.
Distributor/Underwriting Services:
Victory Capital Services, Inc. (the "Distributor"), an affiliate of the Adviser, serves as Distributor for the continuous offering of the shares of the Funds pursuant to a Distribution Agreement between the Distributor and the Trust.
86
Victory Portfolios | | Notes to Financial Statements — continued
June 30, 2022 | |
(Unaudited)
Pursuant to the Distribution and Service Plans adopted in accordance with Rule 12b-1 under the 1940 Act, the Distributor may receive a monthly distribution and service fee up to the annual rate shown in the table below:
| | | Class A | | Class C | | Class R | |
INCORE Investment Quality Bond Fund | | | 0.25 | % | | | 1.00 | % | | | 0.50 | % | |
INCORE Low Duration Bond Fund | | | 0.25 | % | | | 1.00 | % | | | 0.50 | % | |
High Yield Fund | | | 0.25 | % | | | 1.00 | % | | | 0.50 | % | |
Tax-Exempt Fund | | | 0.25 | % | | | 1.00 | % | | | N/A | | |
High Income Municipal Bond Fund | | | 0.25 | % | | | 1.00 | % | | | N/A | | |
Floating Rate Fund | | | 0.25 | % | | | 1.00 | % | | | 0.50 | % | |
The distribution and service fees paid to the Distributor may be used by the Distributor to pay for activities primarily intended to result in the sale of Class A, Class C, and Class R. Amounts incurred for the six-months ended June 30, 2022, are reflected on the Statements of Operations as 12b-1 fees.
In addition, the Distributor is entitled to receive commissions in connection with sales of the Class A. For the six months ended June 30, 2022, the Distributor received $9,733 from commissions earned in connection with sales of Class A.
Other Fees:
Citibank serves as the Funds' custodian. The Funds pay Citibank a fee for providing these services. Amounts incurred for the six months ended June 30, 2022, are reflected on the Statements of Operations as Custodian fees.
Sidley Austin LLP provides legal services to the Trust.
The Adviser has entered into expense limitation agreements with the Funds. Under the terms of the agreements, the Adviser has agreed to waive fees or reimburse certain expenses to the extent that ordinary operating expenses incurred by certain classes of a Fund in any fiscal year exceed the expense limit for such classes of the Fund. Such excess amounts will be the liability of the Adviser. Acquired fund fees and expenses, interest, taxes, brokerage commissions, other expenditures which are capitalized in accordance with GAAP, and other extraordinary expenses not incurred in the ordinary course of a Fund's business are excluded from the expense limits. As of June 30, 2022, the expense limits (excluding voluntary waivers) are as follows:
| | | In effect until April 30, 2023 | |
| | | Class A | | Class C | | Class R | | Class Y | | Member
Class | |
INCORE Investment Quality Bond Fund | | | 0.90 | % | | | 1.77 | % | | | 1.30 | % | | | 0.66 | % | | | N/A | | |
INCORE Low Duration Bond Fund | | | 0.85 | % | | | 1.62 | % | | | 1.27 | % | | | 0.62 | % | | | N/A | | |
High Yield Fund | | | 1.00 | % | | | 1.70 | % | | | 1.35 | % | | | 0.76 | % | | | N/A | | |
Tax-Exempt Fund | | | 0.80 | % | | | 1.60 | % | | | N/A | | | | 0.69 | % | | | N/A | | |
High Income Municipal Bond Fund | | | 0.80 | % | | | 1.57 | % | | | N/A | | | | 0.57 | % | | | 0.65 | % | |
Floating Rate Fund | | | 1.00 | % | | | 1.80 | % | | | 1.56 | % | | | 0.78 | % | | | 0.85 | % | |
Under the terms of the expense limitation agreements, as amended May 1, 2022, the Funds have agreed to repay fees and expenses that were waived or reimbursed by the Adviser for a period of up to three years (thirty-six (36) months) after the waiver or reimbursement took place, subject to the lesser of any operating expense limits in effect at the time of: (a) the original waiver or expense reimbursement; or (b) the recoupment, after giving effect to the recoupment amount.
As of June 30, 2022, the following amounts are available to be repaid to the Adviser. The Funds have not recorded any amounts available to be repaid as a liability due to an assessment that repayments are not probable at June 30, 2022.
87
Victory Portfolios | | Notes to Financial Statements — continued
June 30, 2022 | |
(Unaudited)
| | | Expires
2022 | | Expires
2023 | | Expires
2024 | | Expires
2025 | | Total | |
INCORE Investment Quality Bond Fund | | $ | 68,119 | | | $ | 136,293 | | | $ | 132,566 | | | $ | 63,495 | | | $ | 400,473 | | |
INCORE Low Duration Bond Fund | | | 62,032 | | | | 131,941 | | | | 97,075 | | | | 42,457 | | | | 333,505 | | |
High Yield Fund | | | 137,730 | | | | 253,784 | | | | 221,331 | | | | 123,693 | | | | 736,538 | | |
Tax-Exempt Fund | | | 69,949 | | | | 135,204 | | | | 131,110 | | | | 58,582 | | | | 394,845 | | |
High Income Municipal Bond Fund | | | 74,413 | | | | 131,713 | | | | 156,099 | | | | 72,209 | | | | 434,434 | | |
Floating Rate Fund | | | 421,954 | | | | 827,922 | | | | 1,454,748 | | | | 674,173 | | | | 3,378,797 | | |
The Adviser may voluntarily waive or reimburse additional fees to assist the Funds in maintaining competitive expense ratios. These waivers are not available for recoupment and are reflected on the Statements of Operations as Expenses waived/reimbursed by Adviser. For the year ended June 30, 2022, the Adviser voluntarily waived the following amounts:
INCORE Low Duration Bond Fund | | $ | 30,879 | | |
Certain officers and/or interested trustees of the Funds are also officers and/or employees of the Adviser, administrator, fund accountant, sub-administrator, sub-fund accountant, custodian, legal counsel, and Distributor.
5. Risks:
The Funds may be subject to other risks in addition to these identified risks.
Debt Securities Risk — The value of a debt security or other income-producing security changes in response to various factors, including, for example, market-related factors (such as changes in interest rates or changes in the risk appetite of investors generally) and changes in the actual or perceived ability of the issuer (or of issuers generally) to meet its (or their) obligations. Other factors that may affect the value of debt securities, include, among others, public health crises and responses by governments and companies to such crises. These and other events may affect the creditworthiness of the issuer of a debt security and may impair an issuer's ability to timely meet its debt obligations as they come due.
Credit Risk — The Funds will be subject to credit risk with respect to the amount each expects to receive from counterparties for financial instruments entered into by the Funds. The Funds may be negatively impacted if a counterparty becomes bankrupt or otherwise fails to perform its obligations due to financial difficulties. The Funds may experience significant delays in obtaining any recovery in bankruptcy or other reorganization proceeding and the Funds may obtain only limited recovery or may obtain no recovery in such circumstances. The Funds typically enter into transactions with counterparties whose credit ratings are investment grade, as determined by a nationally recognized statistical rating organization or, if unrated, judged by the Adviser to be of comparable quality.
Derivatives Risk — The use of derivative instruments, such as futures contracts and credit default swaps, exposes the Funds to additional risks and transaction costs. Risks of derivative instruments include: (1) the risk that interest rates, securities prices, asset values, and currency markets will not move in the direction that a portfolio manager anticipates; (2) imperfect correlation between the price of derivative instruments and movements in the prices of the securities, assets, interest rates or currencies being hedged; (3) the fact that skills needed to use these strategies are different than those needed to select portfolio securities; (4) the possible absence of a liquid secondary market for any particular instrument and possible exchange imposed price fluctuation limits, either of which may make it difficult or impossible to close out a position when desired; (5) the risk that adverse price movements in an instrument can result in a loss substantially greater than the Funds' initial investment in that instrument (in some cases, the potential loss is unlimited); (6) particularly in the case of privately-negotiated instruments, the risk that the counterparty will not perform its obligations, which could leave the Funds worse off than if it had not entered into the position; and (7) the inability to close out certain hedged positions to avoid adverse tax consequences.
LIBOR Discontinuation Risk — The London Interbank Offered Rate ("LIBOR") discontinuation may adversely affect the financial markets generally and the Funds' operations, finances and investments specifically. LIBOR has been the principal floating-rate benchmark in the financial markets. However,
88
Victory Portfolios | | Notes to Financial Statements — continued
June 30, 2022 | |
(Unaudited)
LIBOR has been or will be discontinued as a floating rate benchmark. The date of discontinuation depends on the LIBOR currency and tenor. With limited exceptions, no new LIBOR obligations will be entered into after December 31, 2021. Existing LIBOR obligations have transitioned or will transition to another benchmark, depending on the LIBOR currency and tenor. For some existing LIBOR-based obligations, the contractual consequences of the discontinuation of LIBOR may not be clear.
Non-LIBOR floating-rate obligations, including Secured Overnight Financing Rate ("SOFR")-based obligations, may have returns and values that fluctuate more than those of floating-rate debt obligations that are based on LIBOR or other rates. Also, because SOFR and some alternative floating rates are relatively new market indexes, markets for certain non-LIBOR obligations may never develop or may not be liquid. Market terms for non-LIBOR floating rate obligations, such as the spread over the index reflected in interest-rate provisions, may evolve over time, and prices of non-LIBOR floating rate obligations may be different depending on when they are issued and changing views about correct spread levels.
Various SOFR-based rates, including SOFR-based term rates, and various non-SOFR-based rates are expected to develop in response to the discontinuation of U.S. dollar LIBOR, which may create various risks for the Funds and the financial markets more generally. There are non-LIBOR forward-looking floating rates that are not based on SOFR and that may be considered by participants in the financial markets as LIBOR alternatives. Such rates include AMERIBOR (American Interbank Offered Rate), BSBY (Bloomberg Short-Term Bank Yield Index) and BYI (Bank Yield Index). Unlike forward-looking SOFR-based term rates, such rates are intended to reflect a bank credit spread component.
It is not clear how replacement rates for LIBOR — including SOFR-based rates and non-SOFR-based rates — will develop and to what extent they will be used. There is no assurance that these replacement rates will be suitable substitutes for LIBOR, and thus the substitution of such rates for LIBOR could have an adverse effect on the Funds and the financial markets more generally. Concerns about market depth and stability could affect the development of non-SOFR-based term rates, and such rates may create various risks, which may or may not be similar to the risks relating to SOFR.
Market Risk — Overall market risks may affect the value of the Fund. Domestic and international factors such as political events, war, terrorism, trade disputes, inflation rates, interest rate levels and other fiscal and monetary policy changes, cybersecurity incidents, pandemics and other public health crises, sanctions against a particular foreign country, its nationals, businesses or industries and related geopolitical events, as well as environmental disasters such as earthquakes, fires, and floods or other catastrophes, may add to instability in global economies and markets generally, and may lead to increased market volatility. Global economies and financial markets are highly interconnected, which increases the possibility that conditions in one country or region might adversely affect issuers in another country or region. The impact of these and other factors may be short-term or may last for extended periods.
6. Borrowing and Interfund Lending:
Line of Credit:
The Victory Funds Complex participates in a short-term demand note "Line of Credit" agreement with Citibank. The Line of Credit agreement with Citibank was renewed on June 27, 2022, with a termination date of June 26, 2023. Under the agreement with Citibank, the Victory Funds Complex may borrow up to $600 million, of which $300 million is committed and $300 million is uncommitted. $40 million of the Line of Credit is reserved for use by the Floating Rate Fund, another series of the Victory Funds Complex, with Floating Rate Fund paying the related commitment fees for that amount. The purpose of the Line of Credit is to meet temporary or emergency cash needs. For the six months ended June 30, 2022, Citibank received an annual commitment fee of 0.15% on $300 million for providing the Line of Credit. Each fund in the Victory Funds Complex paid a pro-rata portion of the commitment fees plus any interest on amounts borrowed. For the period from January 1, 2022, through June 27, 2022, interest was based on the one-month LIBOR plus one percent. Effective with the renewal, for the period June 28, 2022, through June 30, 2022, interest was based on the one-month SOFR plus 1.10 percent.
89
Victory Portfolios | | Notes to Financial Statements — continued
June 30, 2022 | |
(Unaudited)
Interest charged to each fund during the period, if applicable, is reflected on the Statements of Operations under Line of credit fees.
The Funds had no borrowings under the Line of Credit agreement during the six months ended June 30, 2022.
Interfund Lending:
The Trust and the Adviser rely on an exemptive order granted by the SEC in March 2017 (the "Order"), permitting the establishment and operation of an Interfund Lending Facility (the "Facility"). The Facility allows each Fund to directly lend and borrow money to or from any other fund in the Victory Funds Complex that is permitted to participate in the Facility, relying upon the Order at rates beneficial to both the borrowing and lending funds. Advances under the Facility are allowed for temporary or emergency purposes, including the meeting of redemption requests that otherwise might require the untimely disposition of securities, and are subject to each Fund's borrowing restrictions. The interfund loan rate is determined, as specified in the Order, by averaging the current repurchase agreement rate and the current bank loan rate. As a Borrower, interest charged to each Fund, if any, during the period, is reflected on the Statements of Operations under Interfund lending fees. As a Lender, interest earned by each Fund, if any, during the period, is reflected on the Statements of Operations under Interfund lending.
| | | Borrower or
Lender | | Amount
Outstanding at
June 30,
2022 | | Average
Borrowing* | | Days
Borrowing
Outstanding | | Average
Interest
Rate | | Maximum
Borrowing
During
the Period | |
Floating Rate Fund | | Borrower | | $ | 18,261,000 | | | $ | 18,417,556 | | | | 9 | | | | 1.67 | % | | $ | 23,968,000 | | |
* For the six months ended June 30, 2022, based on the number of days borrowings were outstanding
7. Federal Income Tax Information:
Distributable net realized gains, if any, are declared and distributed at least annually from each Fund. Dividends from net investment income, if any, are declared and paid as noted in the table below.
| | | Declared | | Paid | |
INCORE Investment Quality Bond Fund | | Monthly | | Monthly | |
INCORE Low Duration Bond Fund | | Monthly | | Monthly | |
High Yield Fund | | Monthly | | Monthly | |
Tax-Exempt Fund | | Monthly | | Monthly | |
High Income Municipal Bond Fund | | Monthly | | Monthly | |
Floating Rate Fund | | Monthly | | Monthly | |
The amounts of dividends from net investment income and distributions from net realized gains (collectively, distributions to shareholders) are determined in accordance with federal income tax regulations, which may differ from GAAP. To the extent these "book/tax" differences are permanent in nature (e.g., net operating loss and distribution reclassification), such amounts are reclassified within the components of net assets based on their federal tax-basis treatment; temporary differences (e.g., wash sales) do not require reclassification. To the extent dividends and distributions exceed net investment income and net realized gains for tax purposes, they are reported as distributions of capital. Net investment losses incurred by the Funds may be reclassified as an offset to capital on the accompanying Statements of Assets and Liabilities.
The tax character of current year distributions paid and the tax basis of the current components of accumulated earnings (loss) will be determined at the end of the current tax year ending December 31, 2022.
90
Victory Portfolios | | Notes to Financial Statements — continued
June 30, 2022 | |
(Unaudited)
As of the tax year ended December 31, 2021, the Funds had net capital loss carryforwards as shown in the table below. It is unlikely that the Board will authorize a distribution of capital gains realized in the future until the capital loss carryforwards have been used.
| | | Short Term
Amount | | Long Term
Amount | | Total | |
INCORE Low Duration Bond Fund | | $ | 10,648,311 | | | $ | 17,719,671 | | | $ | 28,367,982 | | |
High Yield Fund | | | — | | | | 1,672,868 | | | | 1,672,868 | | |
Floating Rate Fund | | | 28,463,563 | | | | 155,046,358 | | | | 183,509,921 | | |
91
Victory Portfolios | | Supplemental Information
June 30, 2022 | |
(Unaudited)
Proxy Voting and Portfolio Holdings Information
Proxy Voting:
Information regarding the policies and procedures each Fund uses to determine how to vote proxies relating to portfolio securities is available without charge, upon request, by calling 800-539-3863. The information is also included in the Funds' Statement of Additional Information, which is available on the SEC's website at www.sec.gov.
Information relating to how the Funds voted proxies relating to portfolio securities held during the most recent 12 months ended June 30 is available on the SEC's website at www.sec.gov.
Availability of Schedules of Portfolio Investments:
The Trust files a complete list of Schedules of Portfolio Investments with the SEC for the first and third quarter of each fiscal year on Form N-PORT. Forms N-PORT are available on the SEC's website at www.sec.gov.
Expense Examples
As a shareholder of a Fund, you may incur two types of costs: (1) transaction costs, including sales charges (loads) on purchases; and (2) ongoing costs, including management fees and other Fund expenses. These examples are intended to help you understand your ongoing costs (in dollars) of investing in a Fund and to compare these costs with the ongoing costs of investing in other mutual funds.
These examples are based on an investment of $1,000 invested at the beginning of the period and held for the entire period from January 1, 2022, through June 30, 2022.
The Actual Expense figures in the table below provide information about actual account values and actual expenses. You may use the information below, together with the amount you invested, to estimate the expenses that you paid over the period. Simply divide your account value by $1,000 (for example, an $8,600 account value divided by $1,000 = 8.6), then multiply the result by the number in the table under the heading entitled "Actual Expenses Paid During Period" to estimate the expenses you paid on your account during this period.
The Hypothetical Expense figures in the table below provide information about hypothetical account values and hypothetical expenses based on the Fund's actual expense ratio and an assumed rate of return of 5% per year before expenses, which is not the Fund's actual return. The hypothetical account values and expenses may not be used to estimate the actual ending account balance or expenses you paid for the period. You may use this information to compare this 5% hypothetical example with the 5% hypothetical examples that appear in shareholder reports of other funds.
Please note the expenses shown in the table below are meant to highlight your ongoing costs only and do not reflect any transactional costs. Therefore, the hypothetical expenses in the table are useful in comparing ongoing costs only and will not help you determine the relative total costs of owning different funds. In addition, if these transactional costs were included, your costs would have been higher.
| | | Beginning
Account
Value
1/1/22 | | Actual
Ending
Account
Value
6/30/22 | | Hypothetical
Ending
Account
Value
6/30/22 | | Actual
Expenses
Paid
During
Period
1/1/22-
6/30/22* | | Hypothetical
Expenses
Paid
During
Period
1/1/22-
6/30/22* | | Annualized
Expense
Ratio
During
Period
1/1/22-
6/30/22 | |
INCORE Investment Quality Bond Fund | |
Class A | | $ | 1,000.00 | | | $ | 886.90 | | | $ | 1,020.33 | | | $ | 4.21 | | | $ | 4.51 | | | | 0.90 | % | |
Class C | | | 1,000.00 | | | | 883.90 | | | | 1,016.02 | | | | 8.27 | | | | 8.85 | | | | 1.77 | % | |
Class R | | | 1,000.00 | | | | 885.30 | | | | 1,018.35 | | | | 6.08 | | | | 6.51 | | | | 1.30 | % | |
Class Y | | | 1,000.00 | | | | 888.70 | | | | 1,021.52 | | | | 3.09 | | | | 3.31 | | | | 0.66 | % | |
92
Victory Portfolios | | Supplemental Information — continued
June 30, 2022 | |
(Unaudited)
| | | Beginning
Account
Value
1/1/22 | | Actual
Ending
Account
Value
6/30/22 | | Hypothetical
Ending
Account
Value
6/30/22 | | Actual
Expenses
Paid
During
Period
1/1/22-
6/30/22* | | Hypothetical
Expenses
Paid
During
Period
1/1/22-
6/30/22* | | Annualized
Expense
Ratio
During
Period
1/1/22-
6/30/22 | |
INCORE Low Duration Bond Fund | |
Class A | | $ | 1,000.00 | | | $ | 961.10 | | | $ | 1,020.58 | | | $ | 4.13 | | | $ | 4.26 | | | | 0.85 | % | |
Class C | | | 1,000.00 | | | | 958.40 | | | | 1,016.76 | | | | 7.87 | | | | 8.10 | | | | 1.62 | % | |
Class R | | | 1,000.00 | | | | 959.10 | | | | 1,018.50 | | | | 6.17 | | | | 6.36 | | | | 1.27 | % | |
Class Y | | | 1,000.00 | | | | 963.20 | | | | 1,021.72 | | | | 3.02 | | | | 3.11 | | | | 0.62 | % | |
High Yield Fund | |
Class A | | | 1,000.00 | | | | 840.80 | | | | 1,019.84 | | | | 4.56 | | | | 5.01 | | | | 1.00 | % | |
Class C | | | 1,000.00 | | | | 838.30 | | | | 1,016.36 | | | | 7.75 | | | | 8.50 | | | | 1.70 | % | |
Class R | | | 1,000.00 | | | | 840.10 | | | | 1,018.45 | | | | 5.84 | | | | 6.41 | | | | 1.28 | % | |
Class Y | | | 1,000.00 | | | | 842.70 | | | | 1,021.03 | | | | 3.47 | | | | 3.81 | | | | 0.76 | % | |
Tax-Exempt Fund | |
Class A | | | 1,000.00 | | | | 888.90 | | | | 1,020.83 | | | | 3.75 | | | | 4.01 | | | | 0.80 | % | |
Class C | | | 1,000.00 | | | | 885.40 | | | | 1,016.86 | | | | 7.48 | | | | 8.00 | | | | 1.60 | % | |
Class Y | | | 1,000.00 | | | | 889.40 | | | | 1,021.37 | | | | 3.23 | | | | 3.46 | | | | 0.69 | % | |
High Income Municipal Bond Fund | |
Class A | | | 1,000.00 | | | | 866.10 | | | | 1,020.83 | | | | 3.70 | | | | 4.01 | | | | 0.80 | % | |
Class C | | | 1,000.00 | | | | 862.80 | | | | 1,017.01 | | | | 7.25 | | | | 7.85 | | | | 1.57 | % | |
Class Y | | | 1,000.00 | | | | 867.10 | | | | 1,021.97 | | | | 2.64 | | | | 2.86 | | | | 0.57 | % | |
Member Class | | | 1,000.00 | | | | 866.80 | | | | 1,021.57 | | | | 3.01 | | | | 3.26 | | | | 0.65 | % | |
Floating Rate Fund | |
Class A | | | 1,000.00 | | | | 918.10 | | | | 1,019.84 | | | | 4.76 | | | | 5.01 | | | | 1.00 | % | |
Class C | | | 1,000.00 | | | | 914.40 | | | | 1,015.87 | | | | 8.54 | | | | 9.00 | | | | 1.80 | % | |
Class R | | | 1,000.00 | | | | 915.50 | | | | 1,017.06 | | | | 7.41 | | | | 7.80 | | | | 1.56 | % | |
Class Y | | | 1,000.00 | | | | 919.20 | | | | 1,020.93 | | | | 3.71 | | | | 3.91 | | | | 0.78 | % | |
Member Class | | | 1,000.00 | | | | 918.80 | | | | 1,020.58 | | | | 4.04 | | | | 4.26 | | | | 0.85 | % | |
* Expenses are equal to the average account value multiplied by the Fund's annualized expense ratio multiplied by 181/365 (the number of days in the most recent fiscal half-year divided by the number of days in the fiscal year).
93
Victory Portfolios | | Supplemental Information — continued
June 30, 2022 | |
(Unaudited)
Liquidity Risk Management Program:
The Victory Funds have adopted and implemented a written liquidity risk management program (the "LRMP") as required by Rule 22e-4 under the Investment Company Act of 1940, as amended. The LRMP is reasonably designed to assess and manage each Fund's liquidity risk, taking into consideration each Fund's investment strategy and the liquidity of its portfolio investments during normal and reasonably foreseeable stressed market conditions; its short- and long-term cash flow projections; and its cash holdings and access to other liquidity management tools such as available funding sources including the Victory Funds Complex Interfund Lending Facility and Line of Credit (discussed in the Notes to Financial Statements). The Victory Funds' Board of Trustees approved the appointment of the Funds' investment adviser, Victory Capital Management Inc. ("Victory Capital"), as the administrator of the LRMP.
Victory Capital manages liquidity risks associated with the Funds' investments by monitoring, among other things, cash and cash equivalents, any use of derivatives, the concentration of investments, the appropriateness of each Fund's investment strategy, and by classifying every Fund investment as either highly liquid, moderately liquid, less liquid, or illiquid on at least a monthly basis. To assist with the classification of Fund investments, Victory Capital has retained a third-party provider of liquidity evaluation services. This provider determines preliminary liquidity classifications for all portfolio holdings based upon portfolio-level data and certain assumptions provided by Victory Capital. Victory Capital reviews the preliminary liquidity classifications and, when appropriate, considers other information including input from the Funds' portfolio managers (including the portfolio managers employed by any investment sub-advisers) in determining final liquidity classifications.
At a meeting held on February 24, 2022, Victory Capital provided an oral and written report to the Trustees on the operation and effectiveness of the LRMP during the previous year. The report from Victory Capital concluded that the Funds did not experience any significant liquidity challenges during the covered period, and the Funds' LRMP is reasonably designed to assess and manage its liquidity risk. The report also concluded that the LRMP continues to operate adequately and effectively to enable Victory Capital to oversee and manage liquidity risk and ensure each Fund is able to meet redemption requests without significant dilution to the remaining investors' interest in each Fund. During the review period, except for Victory Floating Rate Fund, each Fund's portfolio consisted primarily of highly liquid investments, which are defined as cash and any investments that each Fund reasonably expected to be converted to cash in current market conditions in three business days or less without significantly changing the market value of the investment. Therefore, the Funds have not adopted a Highly Liquid Investment Minimum. The Victory Floating Rate Fund set a Highly Liquid Investment Minimum of 5% upon implementation of the LMRP. The Victory Floating Rate Fund invests primarily in floating rate bank loans, which typically are characterized as Less Liquid because transactions on these securities often occur on a delayed basis. The Fund typically maintains 12-15% of its net assets in Highly Liquid Investments. This Fund also reserves a set portion of the Line of Credit agreement with Citibank to mitigate the liquidity risk from holding Less Liquid securities. Victory Floating Rate Fund has maintained highly liquid investments satisfying this minimum requirement. The Funds' investments were below the limitation on illiquid investments during the review period. Additionally, Victory Capital indicated that no events occurred that would require the filing of Form N-LIQUID and recommended no material changes to the LRMP.
94
Privacy Policy
Protecting the Privacy of Information
The Trust respects your right to privacy. We also know that you expect us to conduct and process your business in an accurate and efficient manner. To do so, we must collect and maintain certain personal information about you. This is the information we collect from you on applications or other forms, and from the transactions you make with us or third parties. It may include your name, address, social security number, account transactions and balances, and information about investment goals and risk tolerance.
We do not disclose any information about you or about former customers to anyone except as permitted or required by law. Specifically, we may disclose the information we collect to companies that perform services on our behalf, such as the transfer agent that processes shareholder accounts and printers and mailers that assist us in the distribution of investor materials. We may also disclose this information to companies that perform marketing services on our behalf. This allows us to continue to offer you Victory investment products and services that meet your investing needs, and to effect transactions that you request or authorize. These companies will use this information only in connection with the services for which we hired them. They are not permitted to use or share this information for any other purpose.
To protect your personal information internally, we permit access only by authorized employees and maintain physical, electronic, and procedural safeguards to guard your personal information.*
* You may have received communications regarding information about privacy policies from other financial institutions which gave you the opportunity to "opt-out" of certain information sharing with companies which are not affiliated with that financial institution. The Trust does not share information with other companies for purposes of marketing solicitations for products other than the Trust. Therefore, the Trust does not provide opt-out options to their shareholders.
Victory Funds
P.O. Box 182593
Columbus, Ohio 43218-2593

Visit our website at: | | Call Victory at: | |
www.vcm.com | | 800-539-FUND (800-539-3863) | |
| | | 800-235-8396 for Member Class | |
Item 2. Code of Ethics.
Not applicable — only for annual reports.
Item 3. Audit Committee Financial Expert.
Not applicable — only for annual reports.
Item 4. Principal Accountant Fees and Services.
Not applicable — only for annual reports.
Item 5. Audit Committee of Listed Registrants.
Not applicable.
Item 6. Investments.
(a) Not applicable.
(b) Not applicable.
Item 7. Disclosure of Proxy Voting Policies and Procedures for Closed-End Management Investment Companies.
Not applicable.
Item 8. Portfolio Managers of Closed-End Management Investment Companies.
Not applicable.
Item 9. Purchases of Equity Securities by Closed-End Management Investment Company and Affiliated Purchasers.
Not applicable.
Item 10. Submission of Matters to a Vote of Security Holders.
Not applicable.
Item 11. Controls and Procedures.
| (a) | The registrant’s principal executive officer and principal financial officer have concluded, based on their evaluation of the registrant's disclosure controls and procedures as conducted within 90 days of the filing date of this report, that these disclosure controls and procedures are adequately designed and are operating effectively to ensure that information required to be disclosed by the registrant on Form N-CSR is recorded, processed, summarized and reported within the time periods specified in the Securities and Exchange Commission's rules and forms. |
| (b) | There were no changes in the registrant’s internal control over financial reporting (as defined in Rule 30a-3(d) under the Investment Company Act of 1940 (17 CFR 270.30a-3(d)) that occurred during the period covered by this report that have materially affected or are reasonably likely to materially affect, the registrant’s internal control over financial reporting. |
Item 12. Disclosure of Securities Lending Activities for Closed-End Management Investment Companies.
(a)(1) Not applicable.
(a)(2) Not applicable.
(a)(3) Not applicable.
(a)(4) Not applicable.
(b) Not applicable.
Item 13. Exhibits.
(a)(1) Not applicable.
(a)(2) Certifications pursuant to Rule 30a-2(a) are attached hereto.
(a)(3) Not applicable.
(b) Certifications pursuant to Rule 30a-2(b) are furnished herewith.
SIGNATURES
Pursuant to the requirements of the Securities Exchange Act of 1934 and the Investment Company Act of 1940, the registrant has duly caused this report to be signed on its behalf by the undersigned, thereunto duly authorized.
| (Registrant) | Victory Portfolios | |
| By (Signature and Title)* | /s/ Allan Shaer | |
| | Allan Shaer, Principal Financial Officer | |
Pursuant to the requirements of the Securities Exchange Act of 1934 and the Investment Company Act of 1940, this report has been signed below by the following persons on behalf of the registrant and in the capacities and on the dates indicated.
| By (Signature and Title)* | /s/ Christopher K. Dyer | |
| | Christopher K. Dyer, Principal Executive Officer | |
| By (Signature and Title)* | /s/ Allan Shaer | |
| | Allan Shaer, Principal Financial Officer | |