UNITED STATES
SECURITIES AND EXCHANGE COMMISSION
Washington, D.C. 20549
FORM N-CSR
CERTIFIED SHAREHOLDER REPORT OF REGISTERED
MANAGEMENT INVESTMENT COMPANIES
Investment Company Act file number: 811-04852
Victory Portfolios
(Exact name of registrant as specified in charter)
| | 4900 Tiedeman Road, 4th Floor, Brooklyn, Ohio | 44144 | |
| | (Address of principal executive offices) | (Zip code) | |
Citi Fund Services Ohio, Inc., 4400 Easton Commons, Suite 200, Columbus, OH 43219
(Name and address of agent for service)
Registrant’s telephone number, including area code: 800-539-3863
Date of fiscal year end: June 30
Date of reporting period: December 31, 2020
Item 1. Reports to Stockholders.

December 31, 2020
Semi Annual Report
Victory Integrity Discovery Fund
Victory Integrity Mid-Cap Value Fund
Victory Integrity Small-Cap Value Fund
Victory Integrity Small/Mid-Cap Value Fund
Victory Munder Multi-Cap Fund
Victory S&P 500 Index Fund
Victory Munder Mid-Cap Core Growth Fund
Victory Munder Small Cap Growth Fund
Victory Trivalent Emerging Markets Small-Cap Fund
Victory Trivalent International Fund-Core Equity
Victory Trivalent International Small-Cap Fund
Victory INCORE Total Return Bond Fund
As permitted by regulations adopted by the Securities and Exchange Commission, paper copies of the Victory Funds' shareholder reports may no longer be sent by mail, unless you specifically request paper copies of the reports from the Victory Funds or from your financial intermediary, such as a broker-dealer or bank. Instead, the reports will be made available on www.VictoryFunds.com, and you will be notified by mail each time a report is posted and provided with a website link to access the report. If you already elected to receive shareholder reports electronically, you will not be affected by this change, and you need not take any action.
You may elect to receive all future reports in paper free of charge. If you invest through a financial intermediary, you can contact your financial intermediary to request that you continue to receive paper copies of your reports. If you invest directly with the Victory Funds, you can call 800-539-3863 (800-235-8396 for Member Class) or send an e-mail request to TA.Processing@FISGlobal.com. Your election to receive reports in paper will apply to all Victory Funds you hold directly or through your financial intermediary.
www.vcm.com
News, Information And Education 24 Hours A Day, 7 Days A Week
The Victory Funds site gives fund shareholders, prospective shareholders, and investment professionals a convenient way to access fund information, get guidance, and track fund performance anywhere they can access the Internet. The site includes:
• Detailed performance records
• Daily share prices
• The latest fund news
• Investment resources to help you become a better investor
• A section dedicated to investment professionals
Whether you're a potential investor searching for the fund that matches your investment philosophy, a seasoned investor interested in planning tools, or an investment professional, www.vcm.com has what you seek. Visit us anytime. We're always open.
Table of Contents
Financial Statements | |
Victory Integrity Discovery Fund | |
Investment Objectives & Portfolio Holdings | | | 5 | | |
Schedule of Portfolio Investments | | | 8 | | |
Statement of Assets and Liabilities | | | 90-91 | | |
Statement of Operations | | | 98 | | |
Statements of Changes in Net Assets | | | 102-104 | | |
Financial Highlights | | | 114-117 | | |
Victory Integrity Mid-Cap Value Fund | |
Investment Objectives & Portfolio Holdings | | | 5 | | |
Schedule of Portfolio Investments | | | 13 | | |
Statement of Assets and Liabilities | | | 90-91 | | |
Statement of Operations | | | 98 | | |
Statements of Changes in Net Assets | | | 102-104 | | |
Financial Highlights | | | 118-119 | | |
Victory Integrity Small-Cap Value Fund | |
Investment Objectives & Portfolio Holdings | | | 5 | | |
Schedule of Portfolio Investments | | | 17 | | |
Statement of Assets and Liabilities | | | 90-91 | | |
Statement of Operations | | | 98 | | |
Statements of Changes in Net Assets | | | 102-104 | | |
Financial Highlights | | | 120-125 | | |
Victory Integrity Small/Mid-Cap Value Fund | |
Investment Objectives & Portfolio Holdings | | | 5 | | |
Schedule of Portfolio Investments | | | 22 | | |
Statement of Assets and Liabilities | | | 92-93 | | |
Statement of Operations | | | 99 | | |
Statements of Changes in Net Assets | | | 105-107 | | |
Financial Highlights | | | 126-127 | | |
Victory Munder Multi-Cap Fund | |
Investment Objectives & Portfolio Holdings | | | 6 | | |
Schedule of Portfolio Investments | | | 27 | | |
Statement of Assets and Liabilities | | | 92-93 | | |
Statement of Operations | | | 99 | | |
Statements of Changes in Net Assets | | | 105-107 | | |
Financial Highlights | | | 128-131 | | |
Victory S&P 500 Index Fund | |
Investment Objectives & Portfolio Holdings | | | 6 | | |
Schedule of Portfolio Investments | | | 30 | | |
Statement of Assets and Liabilities | | | 92-93 | | |
Statement of Operations | | | 99 | | |
Statements of Changes in Net Assets | | | 105-107 | | |
Financial Highlights | | | 132-135 | | |
Victory Munder Mid-Cap Core Growth Fund | |
Investment Objectives & Portfolio Holdings | | | 6 | | |
Schedule of Portfolio Investments | | | 42 | | |
Statement of Assets and Liabilities | | | 94-95 | | |
Statement of Operations | | | 100 | | |
Statements of Changes in Net Assets | | | 108-110 | | |
Financial Highlights | | | 136-139 | | |
1
Table of Contents (continued)
Victory Munder Small Cap Growth Fund | |
Investment Objectives & Portfolio Holdings | | | 6 | | |
Schedule of Portfolio Investments | | | 45 | | |
Statement of Assets and Liabilities | | | 94-95 | | |
Statement of Operations | | | 100 | | |
Statements of Changes in Net Assets | | | 108-110 | | |
Financial Highlights | | | 140-141 | | |
Victory Trivalent Emerging Markets Small-Cap Fund | |
Investment Objectives & Portfolio Holdings | | | 7 | | |
Schedule of Portfolio Investments | | | 50 | | |
Statement of Assets and Liabilities | | | 94-95 | | |
Statement of Operations | | | 100 | | |
Statements of Changes in Net Assets | | | 108-110 | | |
Financial Highlights | | | 142-143 | | |
Victory Trivalent International Fund-Core Equity | |
Investment Objectives & Portfolio Holdings | | | 7 | | |
Schedule of Portfolio Investments | | | 58 | | |
Statement of Assets and Liabilities | | | 96-97 | | |
Statement of Operations | | | 101 | | |
Statements of Changes in Net Assets | | | 111-113 | | |
Financial Highlights | | | 144-147 | | |
Victory Trivalent International Small-Cap Fund | |
Investment Objectives & Portfolio Holdings | | | 7 | | |
Schedule of Portfolio Investments | | | 70 | | |
Statement of Assets and Liabilities | | | 96-97 | | |
Statement of Operations | | | 101 | | |
Statements of Changes in Net Assets | | | 111-113 | | |
Financial Highlights | | | 148-151 | | |
Victory INCORE Total Return Bond Fund | |
Investment Objectives & Portfolio Holdings | | | 7 | | |
Schedule of Portfolio Investments | | | 81 | | |
Statement of Assets and Liabilities | | | 96-97 | | |
Statement of Operations | | | 101 | | |
Statements of Changes in Net Assets | | | 111-113 | | |
Financial Highlights | | | 152-153 | | |
Notes to Financial Statements | | | 154 | | |
Supplemental Information | |
Proxy Voting and Portfolio Holdings Information | | | 173 | | |
Expense Examples | | | 173 | | |
Advisory Contract Approval | | | 176 | | |
Privacy Policy (inside back cover) | | | |
2
IRA DISTRIBUTION WITHHOLDING DISCLOSURE
We generally must withhold federal income tax at a rate of 10% of the taxable portion of your distribution and, if you live in a state that requires state income tax withholding, at your state's tax rate. However, you may elect not to have withholding apply or to have income tax withheld at a higher rate. Any withholding election that you make will apply to any subsequent distribution unless and until you change or revoke the election. If you wish to make a withholding election, or change or revoke a prior withholding election, call 800-539-3863 (800-235-8396 for Member Class) and form W-4P (OMB No. 1545-0074 withholding certificate for pension or annuity payments) will be electronically sent.
If you do not have a withholding election in place by the date of a distribution, federal income tax will be withheld from the taxable portion of your distribution at a rate of 10%. If you must pay estimated taxes, you may be subject to estimated tax penalties if your estimated tax payments are not sufficient and sufficient tax is not withheld from your distribution.
For more specific information, please consult your tax adviser.
The Funds are distributed by Victory Capital Services, Inc. Victory Capital Management Inc. is the investment adviser to the Funds and receives fees from the Funds for performing services for the Funds.
This report is not authorized for distribution to prospective investors unless preceded or accompanied by a current prospectus of the Victory Funds.
For additional information about any Victory Fund, including fees, expenses, and risks, view our prospectus online at www.vcm.com or call 800-539-3863 (800-235-8396 for Member Class). Read it carefully before you invest or send money.
The information in this semi annual report is based on data obtained from recognized services and sources and is believed to be reliable. Any opinions, projections, or recommendations in this report are subject to change without notice and are not intended as individual investment advice. Past investment performance of the Funds, markets or securities mentioned herein should not be considered to be indicative of future results.
• NOT FDIC INSURED • NO BANK GUARANTEE • MAY LOSE VALUE

Call Victory at:
800-539-FUND (800-539-3863)
800-235-8396 for Member Class
Visit our website at:
www.vcm.com
3
This page is intentionally left blank.
4
Victory Portfolios | | December 31, 2020 | |
(Unaudited)
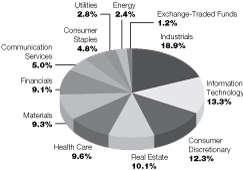
Investment Objectives & Portfolio Holdings:
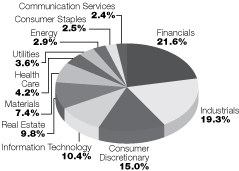
Integrity Discovery Fund
Seeks to provide capital appreciation.
Sector Allocation*:
December 31, 2020
(% of Net Assets)

* Does not include futures, money market instruments, and short-term investments purchased with cash collateral from securities loaned.
Percentages are of the net assets of the Fund and may not equal 100%.
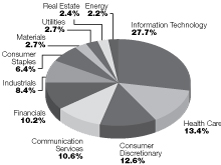
Integrity Mid-Cap Value Fund
Seeks to provide capital appreciation.
Sector Allocation*:
December 31, 2020
(% of Net Assets)

* Does not include futures, money market instruments, and short-term investments purchased with cash collateral from securities loaned.
Percentages are of the net assets of the Fund and may not equal 100%.
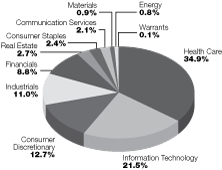
Integrity Small-Cap Value Fund
Seeks to provide long-term capital growth.
Sector Allocation*:
December 31, 2020
(% of Net Assets)

* Does not include futures, money market instruments, and short-term investments purchased with cash collateral from securities loaned.
Percentages are of the net assets of the Fund and may not equal 100%.
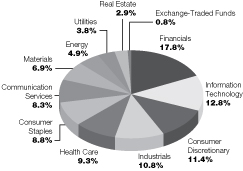
Integrity Small/Mid-Cap Value Fund
Seeks to provide capital appreciation
Sector Allocation*:
December 31, 2020
(% of Net Assets)
* Does not include futures, money market instruments, and short-term investments purchased with cash collateral from securities loaned.
Percentages are of the net assets of the Fund and may not equal 100%.
Refer to the Schedule of Portfolio Investments for a complete list of securities.
5
Victory Portfolios | | December 31, 2020 | |
(Unaudited)
Investment Objectives & Portfolio Holdings: (continued)
Munder Multi-Cap Fund
Seeks to provide long-term capital appreciation.
Sector Allocation*:
December 31, 2020
(% of Net Assets)

* Does not include futures, money market instruments, and short-term investments purchased with cash collateral from securities loaned.
Percentages are of the net assets of the Fund and may not equal 100%.
S&P 500 Index Fund
Seeks to provide performance and income that is
comparable to the S&P 500® Index.
Sector Allocation*:
December 31, 2020
(% of Net Assets)
* Does not include futures, money market instruments, and short-term investments purchased with cash collateral from securities loaned.
Percentages are of the net assets of the Fund and may not equal 100%.
Munder Mid-Cap Core Growth Fund
Seeks to provide long-term capital appreciation.
Sector Allocation*:
December 31, 2020
(% of Net Assets)

* Does not include futures, money market instruments, and short-term investments purchased with cash collateral from securities loaned.
Percentages are of the net assets of the Fund and may not equal 100%.
Munder Small Cap Growth Fund
Seeks to provide long-term capital appreciation.
Sector Allocation*:
December 31, 2020
(% of Net Assets)
* Does not include futures, money market instruments, and short-term investments purchased with cash collateral from securities loaned.
Percentages are of the net assets of the Fund and may not equal 100%.
Refer to the Schedule of Portfolio Investments for a complete list of securities.
6
Victory Portfolios | | December 31, 2020 | |
(Unaudited)
Investment Objectives & Portfolio Holdings: (continued)
Trivalent Emerging Markets Small-Cap Fund
Seeks to provide long-term growth of capital.
Sector Allocation*:
December 31, 2020
(% of Net Assets)

* Does not include futures, money market instruments, and short-term investments purchased with cash collateral from securities loaned.
Percentages are of the net assets of the Fund and may not equal 100%.
Trivalent International Fund-Core Equity
Seeks to provide long-term growth of capital.
Sector Allocation*:
December 31, 2020
(% of Net Assets)
* Does not include futures, money market instruments, and short-term investments purchased with cash collateral from securities loaned.
Percentages are of the net assets of the Fund and may not equal 100%.
Trivalent International Small-Cap Fund
Seeks to provide long-term growth of capital.
Sector Allocation*:
December 31, 2020
(% of Net Assets)
* Does not include futures, money market instruments, and short-term investments purchased with cash collateral from securities loaned.
Percentages are of the net assets of the Fund and may not equal 100%.
INCORE Total Return Bond Fund
Seeks to provide a high level of current income.
Its secondary objective is capital appreciation.
Sector Allocation*:
December 31, 2020
(% of Net Assets)
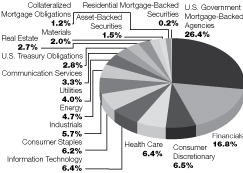
* Does not include futures, money market instruments, and short-term investments purchased with cash collateral from securities loaned.
Percentages are of the net assets of the Fund and may not equal 100%.
Refer to the Schedule of Portfolio Investments for a complete list of securities.
7
Victory Portfolios
Victory Integrity Discovery Fund | | Schedule of Portfolio Investments
December 31, 2020 | |
(Amounts in Thousands, Except for Shares) (Unaudited)
Security Description | | Shares | | Value | |
Common Stocks (99.0%) | |
Banks (21.4%): | |
Altabancorp | | | 19,200 | | | $ | 536 | | |
Atlantic Capital Bancshares, Inc. (a) | | | 42,600 | | | | 678 | | |
Bridge Bancorp, Inc. | | | 18,450 | | | | 446 | | |
Central Pacific Financial Corp. | | | 19,500 | | | | 371 | | |
Civista Bancshares, Inc. | | | 33,400 | | | | 586 | | |
ConnectOne Bancorp, Inc. | | | 26,800 | | | | 530 | | |
Equity Bancshares, Inc., Class A (a) | | | 26,900 | | | | 581 | | |
Financial Institutions, Inc. | | | 27,700 | | | | 623 | | |
First Bank/Hamilton NJ | | | 25,400 | | | | 238 | | |
First Foundation, Inc. | | | 28,600 | | | | 572 | | |
First Internet Bancorp | | | 16,600 | | | | 477 | | |
First Mid Bancshares, Inc. | | | 18,200 | | | | 613 | | |
FVCBankcorp, Inc. (a) (b) | | | 20,286 | | | | 298 | | |
German American Bancorp, Inc. | | | 16,650 | | | | 551 | | |
HarborOne Bancorp, Inc. | | | 54,500 | | | | 592 | | |
Heritage Commerce Corp. | | | 74,500 | | | | 661 | | |
Heritage Financial Corp. | | | 8,500 | | | | 199 | | |
Hometrust Bancshares, Inc. | | | 30,500 | | | | 589 | | |
Howard Bancorp, Inc. (a) | | | 22,525 | | | | 266 | | |
Independent Bank Corp. | | | 34,100 | | | | 630 | | |
Mercantile Bank Corp. | | | 24,750 | | | | 672 | | |
Origin Bancorp, Inc. | | | 25,400 | | | | 705 | | |
Peoples Bancorp, Inc. | | | 25,800 | | | | 699 | | |
QCR Holdings, Inc. | | | 18,100 | | | | 717 | | |
SmartFinancial, Inc. | | | 32,100 | | | | 582 | | |
Southern National Bancorp of Virginia, Inc. | | | 49,000 | | | | 593 | | |
The First Bancshares, Inc. | | | 21,700 | | | | 670 | | |
Univest Financial Corp. | | | 35,500 | | | | 731 | | |
Washington Trust Bancorp, Inc. | | | 16,700 | | | | 749 | | |
| | | | 16,155 | | |
Capital Markets (1.7%): | |
Cowen, Inc., Class A (b) | | | 27,900 | | | | 725 | | |
Diamond Hill Investment Group, Inc. | | | 3,798 | | | | 567 | | |
| | | | 1,292 | | |
Communication Services (2.6%): | |
Emerald Holding, Inc. (b) | | | 50,800 | | | | 275 | | |
Entravision Communications Corp., Class A | | | 107,070 | | | | 294 | | |
The E.W. Scripps Co., Class A | | | 54,300 | | | | 831 | | |
The Marcus Corp. | | | 38,098 | | | | 514 | | |
| | | | 1,914 | | |
Consumer Discretionary (16.1%): | |
BJ's Restaurants, Inc. | | | 12,350 | | | | 475 | | |
Caleres, Inc. | | | 45,500 | | | | 712 | | |
Century Communities, Inc. (a) | | | 10,000 | | | | 438 | | |
Chuy's Holdings, Inc. (a) | | | 16,000 | | | | 424 | | |
Dave & Buster's Entertainment, Inc. (b) | | | 26,200 | | | | 786 | | |
See notes to financial statements.
8
Victory Portfolios
Victory Integrity Discovery Fund | | Schedule of Portfolio Investments — continued
December 31, 2020 | |
(Amounts in Thousands, Except for Shares) (Unaudited)
Security Description | | Shares | | Value | |
Funko, Inc., Class A (a) | | | 38,100 | | | $ | 395 | | |
Genesco, Inc. (a) | | | 18,850 | | | | 567 | | |
G-III Apparel Group Ltd. (a) | | | 11,600 | | | | 275 | | |
Guess?, Inc. (b) | | | 22,150 | | | | 501 | | |
Hibbett Sports, Inc. (a) (b) | | | 15,450 | | | | 714 | | |
Lindblad Expeditions Holdings, Inc. (a) (b) | | | 30,450 | | | | 521 | | |
M/I Homes, Inc. (a) | | | 11,200 | | | | 496 | | |
Malibu Boats, Inc., Class A (a) | | | 8,300 | | | | 518 | | |
MarineMax, Inc. (a) | | | 10,500 | | | | 368 | | |
Modine Manufacturing Co. (a) | | | 63,000 | | | | 791 | | |
Motorcar Parts of America, Inc. (a) (b) | | | 27,075 | | | | 531 | | |
OneWater Marine, Inc. (a) | | | 10,618 | | | | 309 | | |
Potbelly Corp. (a) | | | 121,500 | | | | 535 | | |
Ruth's Hospitality Group, Inc. | | | 15,600 | | | | 277 | | |
Shoe Carnival, Inc. (b) | | | 14,100 | | | | 552 | | |
The Aaron's Co., Inc. (a) | | | 16,800 | | | | 319 | | |
Universal Electronics, Inc. (a) | | | 9,250 | | | | 485 | | |
Universal Technical Institute, Inc. (a) | | | 55,500 | | | | 359 | | |
Zumiez, Inc. (a) | | | 20,400 | | | | 751 | | |
| | | | 12,099 | | |
Consumer Finance (0.6%): | |
EZCORP, Inc., Class A (a) | | | 94,000 | | | | 450 | | |
Consumer Staples (0.2%): | |
Rite Aid Corp. (a) (b) | | | 8,100 | | | | 128 | | |
Energy (3.8%): | |
DHT Holdings, Inc. | | | 48,640 | | | | 254 | | |
Earthstone Energy, Inc., Class A (a) | | | 80,000 | | | | 426 | | |
International Seaways, Inc. | | | 15,750 | | | | 257 | | |
Matrix Service Co. (a) | | | 39,850 | | | | 438 | | |
Natural Gas Services Group, Inc. (a) | | | 31,700 | | | | 301 | | |
Newpark Resources, Inc. (a) | | | 109,845 | | | | 211 | | |
ProPetro Holding Corp. (a) | | | 45,500 | | | | 336 | | |
Solaris Oilfield Infrastructure, Inc., Class A | | | 52,174 | | | | 425 | | |
Tidewater, Inc. (a) | | | 32,400 | | | | 280 | | |
| | | | 2,928 | | |
Health Care (5.5%): | |
Community Health Systems, Inc. (a) | | | 121,200 | | | | 902 | | |
Hanger, Inc. (a) | | | 27,700 | | | | 609 | | |
Invacare Corp. | | | 74,500 | | | | 667 | | |
Owens & Minor, Inc. | | | 21,200 | | | | 573 | | |
RadNet, Inc. (a) | | | 37,300 | | | | 730 | | |
Surgery Partners, Inc. (a) (b) | | | 23,250 | | | | 674 | | |
| | | | 4,155 | | |
Industrials (16.7%): | |
CIRCOR International, Inc. (a) | | | 18,700 | | | | 718 | | |
Columbus McKinnon Corp. | | | 13,400 | | | | 515 | | |
Covenant Logistics Group, Inc., Class A (a) | | | 32,000 | | | | 474 | | |
CRA International, Inc. | | | 10,520 | | | | 536 | | |
See notes to financial statements.
9
Victory Portfolios
Victory Integrity Discovery Fund | | Schedule of Portfolio Investments — continued
December 31, 2020 | |
(Amounts in Thousands, Except for Shares) (Unaudited)
Security Description | | Shares | | Value | |
Ducommun, Inc. (a) | | | 10,300 | | | $ | 553 | | |
DXP Enterprise, Inc. (a) | | | 24,100 | | | | 535 | | |
Eagle Bulk Shipping, Inc. (a) (b) | | | 27,300 | | | | 519 | | |
Echo Global Logistics, Inc. (a) | | | 27,300 | | | | 732 | | |
Great Lakes Dredge & Dock Corp. (a) | | | 48,300 | | | | 636 | | |
Hawaiian Holdings, Inc. | | | 24,300 | | | | 430 | | |
Heidrick & Struggles International, Inc. | | | 14,500 | | | | 426 | | |
Heritage-Crystal Clean, Inc. (a) | | | 26,900 | | | | 567 | | |
Kelly Services, Inc., Class A | | | 28,300 | | | | 582 | | |
Knoll, Inc. | | | 21,919 | | | | 322 | | |
Maxar Technologies, Inc. | | | 26,100 | | | | 1,007 | | |
NN, Inc. (a) (b) | | | 87,000 | | | | 572 | | |
Park-Ohio Holdings Corp. (b) | | | 12,500 | | | | 386 | | |
SP Plus Corp. (a) | | | 23,800 | | | | 686 | | |
Team, Inc. (a) | | | 57,900 | | | | 631 | | |
The Shyft Group, Inc. | | | 18,100 | | | | 514 | | |
Titan Machinery, Inc. (a) | | | 25,000 | | | | 489 | | |
TrueBlue, Inc. (a) | | | 15,900 | | | | 297 | | |
VSE Corp. | | | 11,000 | | | | 423 | | |
| | | | 12,550 | | |
Information Technology (12.4%): | |
ADTRAN, Inc. | | | 29,300 | | | | 433 | | |
American Software, Inc., Class A | | | 25,400 | | | | 436 | | |
Axcelis Technologies, Inc. (a) | | | 13,700 | | | | 399 | | |
Benchmark Electronics, Inc. | | | 17,700 | | | | 478 | | |
Cohu, Inc. | | | 22,800 | | | | 870 | | |
Comtech Telecommunications Corp. | | | 19,400 | | | | 401 | | |
Conduent, Inc. (a) | | | 78,000 | | | | 375 | | |
CTS Corp. | | | 21,550 | | | | 740 | | |
Diebold Nixdorf, Inc. (a) | | | 49,000 | | | | 522 | | |
Digi International, Inc. (a) | | | 34,400 | | | | 650 | | |
Extreme Networks, Inc. (a) | | | 57,000 | | | | 393 | | |
Harmonic, Inc. (a) | | | 107,700 | | | | 796 | | |
I3 Verticals, Inc., Class A (a) | | | 10,555 | | | | 350 | | |
Ichor Holdings Ltd. (a) | | | 12,211 | | | | 368 | | |
Impinj, Inc. (a) (b) | | | 13,750 | | | | 576 | | |
NeoPhotonics Corp. (a) | | | 51,200 | | | | 465 | | |
Veeco Instruments, Inc. (a) | | | 23,369 | | | | 406 | | |
Vishay Precision Group, Inc. (a) | | | 18,300 | | | | 576 | | |
| | | | 9,234 | | |
Insurance (1.1%): | |
HCI Group, Inc. (b) | | | 6,550 | | | | 343 | | |
Heritage Insurance Holdings, Inc. (b) | | | 47,700 | | | | 483 | | |
| | | | 826 | | |
Materials (4.3%): | |
Haynes International, Inc. | | | 23,100 | | | | 551 | | |
Koppers Holdings, Inc. (a) | | | 18,550 | | | | 578 | | |
Kraton Corp. (a) | | | 13,800 | | | | 384 | | |
See notes to financial statements.
10
Victory Portfolios
Victory Integrity Discovery Fund | | Schedule of Portfolio Investments — continued
December 31, 2020 | |
(Amounts in Thousands, Except for Shares) (Unaudited)
Security Description | | Shares | | Value | |
Schnitzer Steel Industries, Inc. | | | 16,500 | | | $ | 527 | | |
SunCoke Energy, Inc. | | | 131,500 | | | | 571 | | |
Verso Corp., Class A | | | 52,550 | | | | 632 | | |
| | | | 3,243 | | |
Mortgage Real Estate Investment Trusts (0.9%): | |
Dynex Capital, Inc. (b) | | | 25,200 | | | | 449 | | |
Western Asset Mortgage Capital Corp. (b) | | | 64,725 | | | | 211 | | |
| | | | 660 | | |
Real Estate (6.6%): | |
Bluerock Residential Growth REIT, Inc. | | | 34,500 | | | | 437 | | |
CatchMark Timber Trust, Inc., Class A | | | 51,000 | | | | 477 | | |
Cedar Realty Trust, Inc. | | | 20,976 | | | | 212 | | |
City Office REIT, Inc. | | | 60,400 | | | | 590 | | |
Global Medical REIT, Inc. | | | 41,700 | | | | 546 | | |
NETSTREIT Corp. | | | 23,900 | | | | 466 | | |
New Senior Investment Group, Inc. | | | 68,600 | | | | 355 | | |
NexPoint Residential Trust, Inc. | | | 11,150 | | | | 472 | | |
Plymouth Industrial REIT, Inc. | | | 34,600 | | | | 519 | | |
UMH Properties, Inc. | | | 23,700 | | | | 351 | | |
Urstadt Biddle Properties, Inc., Class A (b) | | | 38,500 | | | | 544 | | |
| | | | 4,969 | | |
Thrifts & Mortgage Finance (5.1%): | |
Bridgewater Bancshares, Inc. (a) | | | 43,500 | | | | 543 | | |
Home Bancorp, Inc. | | | 8,800 | | | | 246 | | |
HomeStreet, Inc. | | | 16,400 | | | | 554 | | |
Meridian Bancorp, Inc. | | | 46,000 | | | | 686 | | |
PCSB Financial Corp. | | | 38,500 | | | | 614 | | |
Premier Financial Corp. | | | 39,400 | | | | 907 | | |
Provident Financial Services, Inc. | | | 17,500 | | | | 313 | | |
| | | | 3,863 | | |
Total Common Stocks (Cost $65,163) | | | 74,466 | | |
Collateral for Securities Loaned^ (8.7%) | |
BlackRock Liquidity Funds TempFund Portfolio, Institutional Class, 0.08% (c) | | | 113,942 | | | | 114 | | |
Fidelity Investments Money Market Government Portfolio I Shares, 0.01% (c) | | | 3,914,563 | | | | 3,915 | | |
Goldman Sachs Financial Square Prime Obligations Fund, Institutional
Class, 0.04% (c) | | | 56,863 | | | | 57 | | |
JPMorgan Prime Money Market Fund, Capital Class, 0.12% (c) | | | 453,404 | | | | 453 | | |
Morgan Stanley Institutional Liquidity Prime Portfolio, Institutional
Class, 0.09% (c) | | | 2,038,593 | | | | 2,039 | | |
Total Collateral for Securities Loaned (Cost $6,578) | | | 6,578 | | |
Total Investments (Cost $71,741) — 107.7% | | | 81,044 | | |
Liabilities in excess of other assets — (7.7)% | | | (5,795 | ) | |
NET ASSETS — 100.00% | | $ | 75,249 | | |
^ Purchased with cash collateral from securities on loan.
See notes to financial statements.
11
Victory Portfolios
Victory Integrity Discovery Fund | | Schedule of Portfolio Investments — continued
December 31, 2020 | |
(Unaudited)
(a) Non-income producing security.
(b) All or a portion of this security is on loan.
(c) Rate disclosed is the daily yield on December 31, 2020.
REIT — Real Estate Investment Trust
See notes to financial statements.
12
Victory Portfolios
Victory Integrity Mid-Cap Value Fund | | Schedule of Portfolio Investments
December 31, 2020 | |
(Amounts in Thousands, Except for Shares) (Unaudited)
Security Description | | Shares | | Value | |
Common Stocks (99.1%) | |
Communication Services (1.3%): | |
Cinemark Holdings, Inc. (a) | | | 53,133 | | | $ | 925 | | |
Nexstar Media Group, Inc., Class A | | | 14,977 | | | | 1,635 | | |
| | | | 2,560 | | |
Consumer Discretionary (14.6%): | |
Aptiv PLC | | | 9,526 | | | | 1,241 | | |
Aramark | | | 36,117 | | | | 1,390 | | |
AutoZone, Inc. (b) | | | 772 | | | | 915 | | |
Best Buy Co., Inc. | | | 5,992 | | | | 598 | | |
Brunswick Corp. | | | 20,325 | | | | 1,550 | | |
Caesars Entertainment, Inc. (b) | | | 18,438 | | | | 1,369 | | |
D.R. Horton, Inc. | | | 16,365 | | | | 1,128 | | |
Darden Restaurants, Inc. | | | 16,500 | | | | 1,966 | | |
Ford Motor Co. | | | 130,466 | | | | 1,147 | | |
Hilton Worldwide Holdings, Inc. | | | 10,520 | | | | 1,170 | | |
Kohl's Corp. | | | 23,702 | | | | 964 | | |
Mohawk Industries, Inc. (a) (b) | | | 10,445 | | | | 1,473 | | |
Newell Brands, Inc. | | | 57,718 | | | | 1,225 | | |
Norwegian Cruise Line Holdings Ltd. (a) (b) | | | 50,961 | | | | 1,296 | | |
Penske Automotive Group, Inc. | | | 22,305 | | | | 1,325 | | |
PulteGroup, Inc. | | | 23,200 | | | | 1,000 | | |
Ralph Lauren Corp. | | | 18,683 | | | | 1,937 | | |
Tapestry, Inc. | | | 41,427 | | | | 1,288 | | |
The Gap, Inc. | | | 42,467 | | | | 857 | | |
VF Corp. | | | 16,575 | | | | 1,416 | | |
Visteon Corp. (b) | | | 12,350 | | | | 1,550 | | |
W.W. International, Inc. (b) | | | 36,914 | | | | 901 | | |
Wyndham Destinations, Inc. | | | 37,037 | | | | 1,662 | | |
| | | | 29,368 | | |
Consumer Staples (3.3%): | |
Darling Ingredients, Inc. (b) | | | 19,349 | | | | 1,116 | | |
Lamb Weston Holdings, Inc. | | | 16,055 | | | | 1,264 | | |
Performance Food Group Co. (b) | | | 31,250 | | | | 1,488 | | |
The Kroger Co. | | | 44,537 | | | | 1,414 | | |
Tyson Foods, Inc., Class A | | | 21,816 | | | | 1,406 | | |
| | | | 6,688 | | |
Energy (3.7%): | |
Cabot Oil & Gas Corp. | | | 45,131 | | | | 735 | | |
Devon Energy Corp. | | | 76,430 | | | | 1,208 | | |
Diamondback Energy, Inc. | | | 26,254 | | | | 1,271 | | |
EOG Resources, Inc. | | | 18,278 | | | | 912 | | |
Hess Corp. | | | 21,495 | | | | 1,135 | | |
Pioneer Natural Resources Co. | | | 12,253 | | | | 1,395 | | |
Schlumberger Ltd. | | | 37,300 | | | | 814 | | |
| | | | 7,470 | | |
See notes to financial statements.
13
Victory Portfolios
Victory Integrity Mid-Cap Value Fund | | Schedule of Portfolio Investments — continued
December 31, 2020 | |
(Amounts in Thousands, Except for Shares) (Unaudited)
Security Description | | Shares | | Value | |
Financials (16.6%): | |
Ally Financial, Inc. | | | 53,780 | | | $ | 1,918 | | |
Arch Capital Group Ltd. (b) | | | 35,635 | | | | 1,285 | | |
Arthur J. Gallagher & Co. | | | 20,000 | | | | 2,475 | | |
Assurant, Inc. | | | 12,019 | | | | 1,637 | | |
Capital One Financial Corp. | | | 18,525 | | | | 1,831 | | |
Cincinnati Financial Corp. | | | 12,651 | | | | 1,105 | | |
CIT Group, Inc. | | | 30,466 | | | | 1,094 | | |
Fidelity National Financial, Inc. | | | 36,665 | | | | 1,433 | | |
Invesco Ltd. | | | 74,250 | | | | 1,294 | | |
Lincoln National Corp. | | | 25,993 | | | | 1,308 | | |
LPL Financial Holdings, Inc. | | | 16,765 | | | | 1,747 | | |
M&T Bank Corp. | | | 14,050 | | | | 1,789 | | |
Northern Trust Corp. | | | 21,720 | | | | 2,024 | | |
Regions Financial Corp. | | | 166,800 | | | | 2,688 | | |
Reinsurance Group of America, Inc. | | | 13,541 | | | | 1,569 | | |
State Street Corp. | | | 22,400 | | | | 1,630 | | |
Sterling Bancorp | | | 66,569 | | | | 1,197 | | |
Voya Financial, Inc. | | | 33,446 | | | | 1,967 | | |
W.R. Berkley Corp. | | | 27,855 | | | | 1,851 | | |
Western Alliance Bancorp | | | 24,405 | | | | 1,463 | | |
| | | | 33,305 | | |
Health Care (6.8%): | |
Alexion Pharmaceuticals, Inc. (b) | | | 9,391 | | | | 1,467 | | |
Encompass Health Corp. | | | 24,561 | | | | 2,031 | | |
Hill-Rom Holdings, Inc. | | | 11,177 | | | | 1,095 | | |
Jazz Pharmaceuticals PLC (b) | | | 6,898 | | | | 1,139 | | |
Laboratory Corp. of America Holdings (b) | | | 12,733 | | | | 2,592 | | |
McKesson Corp. | | | 9,182 | | | | 1,597 | | |
Perrigo Co. PLC | | | 32,758 | | | | 1,464 | | |
Zimmer Biomet Holdings, Inc. | | | 15,141 | | | | 2,333 | | |
| | | | 13,718 | | |
Industrials (18.0%): | |
Allison Transmission Holdings, Inc. | | | 22,601 | | | | 975 | | |
Barnes Group, Inc. | | | 31,390 | | | | 1,591 | | |
Beacon Roofing Supply, Inc. (b) | | | 29,145 | | | | 1,171 | | |
Carlisle Cos., Inc. | | | 9,715 | | | | 1,517 | | |
Clean Harbors, Inc. (b) | | | 14,000 | | | | 1,065 | | |
Colfax Corp. (b) | | | 45,436 | | | | 1,737 | | |
Cummins, Inc. | | | 8,077 | | | | 1,834 | | |
Delta Air Lines, Inc. | | | 30,095 | | | | 1,210 | | |
Fortune Brands Home & Security, Inc. | | | 13,207 | | | | 1,132 | | |
Howmet Aerospace, Inc. (b) | | | 48,450 | | | | 1,383 | | |
ITT, Inc. | | | 25,054 | | | | 1,930 | | |
Kansas City Southern | | | 6,460 | | | | 1,319 | | |
Knight-Swift Transportation Holdings, Inc. | | | 29,770 | | | | 1,245 | | |
ManpowerGroup, Inc. | | | 18,554 | | | | 1,673 | | |
nVent Electric PLC | | | 52,286 | | | | 1,218 | | |
Old Dominion Freight Line, Inc. | | | 4,880 | | | | 952 | | |
See notes to financial statements.
14
Victory Portfolios
Victory Integrity Mid-Cap Value Fund | | Schedule of Portfolio Investments — continued
December 31, 2020 | |
(Amounts in Thousands, Except for Shares) (Unaudited)
Security Description | | Shares | | Value | |
Oshkosh Corp. | | | 19,146 | | | $ | 1,648 | | |
Parker-Hannifin Corp. | | | 7,489 | | | | 2,040 | | |
Quanta Services, Inc. | | | 21,957 | | | | 1,581 | | |
Republic Services, Inc. | | | 12,673 | | | | 1,221 | | |
Sensata Technologies Holding PLC (b) | | | 27,650 | | | | 1,458 | | |
Southwest Airlines Co. | | | 36,310 | | | | 1,693 | | |
Stanley Black & Decker, Inc. | | | 8,538 | | | | 1,525 | | |
Trane Technologies PLC | | | 12,631 | | | | 1,834 | | |
Westinghouse Air Brake Technologies Corp. | | | 21,648 | | | | 1,585 | | |
| | | | 36,537 | | |
Information Technology (10.7%): | |
Arrow Electronics, Inc. (b) | | | 16,237 | | | | 1,580 | | |
Corning, Inc. | | | 43,160 | | | | 1,554 | | |
DXC Technology Co. | | | 49,725 | | | | 1,281 | | |
Flex Ltd. (b) | | | 93,553 | | | | 1,682 | | |
Jabil, Inc. | | | 43,983 | | | | 1,870 | | |
Juniper Networks, Inc. | | | 62,000 | | | | 1,396 | | |
Microchip Technology, Inc. | | | 14,508 | | | | 2,004 | | |
MKS Instruments, Inc. | | | 11,764 | | | | 1,770 | | |
NCR Corp. (b) | | | 46,075 | | | | 1,731 | | |
ON Semiconductor Corp. (b) | | | 77,968 | | | | 2,552 | | |
Science Applications International Corp. | | | 13,210 | | | | 1,250 | | |
Skyworks Solutions, Inc. | | | 7,741 | | | | 1,183 | | |
Western Digital Corp. | | | 32,221 | | | | 1,785 | | |
| | | | 21,638 | | |
Materials (7.2%): | |
Arconic Corp. (b) | | | 43,500 | | | | 1,296 | | |
FMC Corp. | | | 11,194 | | | | 1,287 | | |
Freeport-McMoRan, Inc. | | | 94,450 | | | | 2,458 | | |
Huntsman Corp. | | | 68,581 | | | | 1,724 | | |
PPG Industries, Inc. | | | 15,389 | | | | 2,219 | | |
Reliance Steel & Aluminum Co. | | | 11,971 | | | | 1,434 | | |
Steel Dynamics, Inc. | | | 31,770 | | | | 1,171 | | |
The Mosaic Co. | | | 58,840 | | | | 1,354 | | |
Westlake Chemical Corp. | | | 20,881 | | | | 1,704 | | |
| | | | 14,647 | | |
Real Estate (9.5%): | |
Americold Realty Trust (a) | | | 33,396 | | | | 1,247 | | |
Apartment Income REIT Corp. (b) | | | 45,252 | | | | 1,738 | | |
Camden Property Trust | | | 13,679 | | | | 1,367 | | |
Duke Realty Corp. | | | 48,062 | | | | 1,921 | | |
Essex Property Trust, Inc. | | | 6,982 | | | | 1,658 | | |
Healthpeak Properties, Inc. | | | 63,468 | | | | 1,919 | | |
Host Hotels & Resorts, Inc. | | | 116,348 | | | | 1,702 | | |
Medical Properties Trust, Inc. | | | 88,604 | | | | 1,930 | | |
Realty Income Corp. | | | 25,452 | | | | 1,582 | | |
STORE Capital Corp. | | | 48,266 | | | | 1,640 | | |
See notes to financial statements.
15
Victory Portfolios
Victory Integrity Mid-Cap Value Fund | | Schedule of Portfolio Investments — continued
December 31, 2020 | |
(Amounts in Thousands, Except for Shares) (Unaudited)
Security Description | | Shares | | Value | |
Welltower, Inc. | | | 20,727 | | | $ | 1,339 | | |
Weyerhaeuser Co. | | | 44,388 | | | | 1,488 | | |
| | | | 19,531 | | |
Utilities (7.4%): | |
CenterPoint Energy, Inc. | | | 73,390 | | | | 1,588 | | |
DTE Energy Co. | | | 17,200 | | | | 2,088 | | |
Edison International | | | 22,211 | | | | 1,395 | | |
Evergy, Inc. | | | 31,042 | | | | 1,724 | | |
PG&E Corp. (b) | | | 81,876 | | | | 1,020 | | |
Pinnacle West Capital Corp. | | | 14,463 | | | | 1,156 | | |
PPL Corp. | | | 48,162 | | | | 1,358 | | |
Spire, Inc. | | | 20,908 | | | | 1,339 | | |
UGI Corp. | | | 34,443 | | | | 1,204 | | |
Vistra Corp. | | | 61,005 | | | | 1,199 | | |
Xcel Energy, Inc. | | | 13,755 | | | | 917 | | |
| | | | 14,988 | | |
Total Common Stocks (Cost $160,300) | | | 200,450 | | |
Collateral for Securities Loaned^ (1.8%) | |
BlackRock Liquidity Funds TempFund Portfolio, Institutional Class, 0.08% (c) | | | 61,631 | | | | 62 | | |
Fidelity Investments Money Market Government Portfolio, Class I, 0.01% (c) | | | 2,117,397 | | | | 2,117 | | |
Goldman Sachs Financial Square Prime Obligations Fund, Institutional
Class, 0.04% (c) | | | 30,757 | | | | 31 | | |
JPMorgan Prime Money Market Fund, Capital Class, 0.12% (c) | | | 245,247 | | | | 245 | | |
Morgan Stanley Institutional Liquidity Prime Portfolio, Institutional
Class, 0.09% (c) | | | 1,102,680 | | | | 1,103 | | |
Total Collateral for Securities Loaned (Cost $3,558) | | | 3,558 | | |
Total Investments (Cost $163,858) — 100.9% | | | 204,008 | | |
Liabilities in excess of other assets — (0.9)% | | | (1,811 | ) | |
NET ASSETS — 100.00% | | $ | 202,197 | | |
^ Purchased with cash collateral from securities on loan.
(a) All or a portion of this security is on loan.
(b) Non-income producing security.
(c) Rate disclosed is the daily yield on December 31, 2020.
PLC — Public Limited Company
REIT — Real Estate Investment Trust
See notes to financial statements.
16
Victory Portfolios
Victory Integrity Small-Cap Value Fund | | Schedule of Portfolio Investments
December 31, 2020 | |
(Amounts in Thousands, Except for Shares) (Unaudited)
Security Description | | Shares | | Value | |
Common Stocks (99.4%) | |
Communication Services (2.3%): | |
Cinemark Holdings, Inc. (a) | | | 550,000 | | | $ | 9,576 | | |
Gray Television, Inc. (b) | | | 643,000 | | | | 11,503 | | |
Lions Gate Entertainment Corp., Class B (b) | | | 955,600 | | | | 9,919 | | |
TEGNA, Inc. | | | 532,700 | | | | 7,431 | | |
The Marcus Corp. (a) | | | 342,086 | | | | 4,611 | | |
| | | | 43,040 | | |
Consumer Discretionary (15.2%): | |
American Eagle Outfitters, Inc. (a) | | | 634,900 | | | | 12,743 | | |
Asbury Automotive Group, Inc. (b) | | | 92,300 | | | | 13,453 | | |
Bed Bath & Beyond, Inc. (a) | | | 294,000 | | | | 5,221 | | |
Bloomin' Brands, Inc. (a) | | | 682,000 | | | | 13,244 | | |
Brinker International, Inc. (a) | | | 158,000 | | | | 8,938 | | |
Brunswick Corp. | | | 157,200 | | | | 11,985 | | |
Caesars Entertainment, Inc. (b) | | | 190,800 | | | | 14,171 | | |
Century Communities, Inc. (b) | | | 220,900 | | | | 9,671 | | |
Cooper Tire & Rubber Co. | | | 197,200 | | | | 7,987 | | |
Dana, Inc. | | | 489,000 | | | | 9,545 | | |
G-III Apparel Group Ltd. (b) | | | 331,827 | | | | 7,878 | | |
Guess?, Inc. (a) | | | 427,600 | | | | 9,672 | | |
Jack in the Box, Inc. | | | 166,500 | | | | 15,452 | | |
Kohl's Corp. | | | 292,200 | | | | 11,890 | | |
Kontoor Brands, Inc. | | | 244,800 | | | | 9,929 | | |
Marriott Vacations Worldwide Corp. | | | 102,000 | | | | 13,996 | | |
Norwegian Cruise Line Holdings Ltd. (a) (b) | | | 226,200 | | | | 5,752 | | |
Sally Beauty Holdings, Inc. (a) (b) | | | 362,000 | | | | 4,720 | | |
Shoe Carnival, Inc. (a) | | | 160,500 | | | | 6,288 | | |
Steven Madden Ltd. | | | 385,200 | | | | 13,605 | | |
Tapestry, Inc. | | | 354,300 | | | | 11,012 | | |
The Cheesecake Factory, Inc. (a) | | | 247,000 | | | | 9,154 | | |
The ODP Corp. (b) | | | 240,000 | | | | 7,032 | | |
TRI Pointe Group, Inc. (b) | | | 620,300 | | | | 10,700 | | |
Visteon Corp. (b) | | | 93,000 | | | | 11,673 | | |
W.W. International, Inc. (b) | | | 346,000 | | | | 8,442 | | |
Wolverine World Wide, Inc. | | | 455,000 | | | | 14,218 | | |
| | | | 278,371 | | |
Consumer Staples (2.0%): | |
Edgewell Personal Care Co. | | | 226,600 | | | | 7,836 | | |
Performance Food Group Co. (b) | | | 343,400 | | | | 16,349 | | |
The Simply Good Foods Co. (b) | | | 408,700 | | | | 12,817 | | |
| | | | 37,002 | | |
Energy (3.8%): | |
Cimarex Energy Co. | | | 274,900 | | | | 10,311 | | |
Comstock Resources, Inc. (a) (b) | | | 1,279,500 | | | | 5,591 | | |
Devon Energy Corp. | | | 725,000 | | | | 11,463 | | |
EQT Corp. (b) | | | 545,000 | | | | 6,927 | | |
Ovintiv, Inc. | | | 752,800 | | | | 10,810 | | |
See notes to financial statements.
17
Victory Portfolios
Victory Integrity Small-Cap Value Fund | | Schedule of Portfolio Investments — continued
December 31, 2020 | |
(Amounts in Thousands, Except for Shares) (Unaudited)
Security Description | | Shares | | Value | |
PDC Energy, Inc. (b) | | | 757,500 | | | $ | 15,552 | | |
ProPetro Holding Corp. (b) | | | 1,180,000 | | | | 8,720 | | |
| | | | 69,374 | | |
Financials (24.3%): | |
Ameris Bancorp | | | 422,000 | | | | 16,066 | | |
Banc of California, Inc. | | | 549,000 | | | | 8,076 | | |
BancorpSouth Bank | | | 526,000 | | | | 14,433 | | |
Banner Corp. | | | 289,500 | | | | 13,488 | | |
Blackstone Mortgage Trust, Inc., Class A (a) | | | 453,000 | | | | 12,470 | | |
Cathay General Bancorp | | | 424,500 | | | | 13,665 | | |
CIT Group, Inc. | | | 363,000 | | | | 13,032 | | |
CNO Financial Group, Inc. | | | 410,000 | | | | 9,114 | | |
Essent Group Ltd. | | | 119,400 | | | | 5,158 | | |
First Bancorp, Inc., Class A (a) | | | 193,000 | | | | 6,529 | | |
First Merchants Corp. | | | 398,200 | | | | 14,897 | | |
Hancock Whitney Corp. | | | 566,000 | | | | 19,254 | | |
Heritage Financial Corp. | | | 296,000 | | | | 6,923 | | |
Invesco Ltd. | | | 626,000 | | | | 10,912 | | |
Investors Bancorp, Inc. | | | 1,177,000 | | | | 12,429 | | |
James River Group Holdings Ltd. | | | 182,000 | | | | 8,945 | | |
Kemper Corp. | | | 122,000 | | | | 9,373 | | |
Kinsale Capital Group, Inc. | | | 53,850 | | | | 10,777 | | |
Ladder Capital Corp. | | | 1,084,000 | | | | 10,602 | | |
MGIC Investment Corp. | | | 1,207,000 | | | | 15,148 | | |
PacWest Bancorp | | | 585,200 | | | | 14,864 | | |
People's United Financial, Inc. | | | 793,000 | | | | 10,253 | | |
Piper Sandler Cos. | | | 115,400 | | | | 11,644 | | |
Primerica, Inc. | | | 69,600 | | | | 9,322 | | |
Renasant Corp. (a) | | | 379,700 | | | | 12,788 | | |
RLI Corp. | | | 112,000 | | | | 11,665 | | |
Starwood Property Trust, Inc. (a) | | | 374,600 | | | | 7,230 | | |
Sterling Bancorp | | | 763,000 | | | | 13,719 | | |
Stewart Information Services Corp. | | | 228,000 | | | | 11,026 | | |
Stifel Financial Corp. | | | 368,500 | | | | 18,594 | | |
Synovus Financial Corp. | | | 275,000 | | | | 8,902 | | |
The Hanover Insurance Group, Inc. | | | 98,500 | | | | 11,517 | | |
United Community Banks, Inc. | | | 604,000 | | | | 17,178 | | |
Veritex Holdings, Inc. | | | 619,000 | | | | 15,884 | | |
Washington Federal, Inc. | | | 371,200 | | | | 9,555 | | |
WesBanco, Inc. | | | 434,000 | | | | 13,003 | | |
Western Alliance Bancorp | | | 312,400 | | | | 18,727 | | |
| | | | 447,162 | | |
Health Care (3.2%): | |
CONMED Corp. (a) | | | 88,500 | | | | 9,912 | | |
Magellan Health, Inc. (b) | | | 189,000 | | | | 15,656 | | |
Patterson Cos., Inc. (a) | | | 258,000 | | | | 7,645 | | |
Select Medical Holdings Corp. (b) | | | 491,000 | | | | 13,581 | | |
Supernus Pharmaceuticals, Inc. (b) | | | 248,200 | | | | 6,245 | | |
Tenet Healthcare Corp. (b) | | | 183,800 | | | | 7,339 | | |
| | | | 60,378 | | |
See notes to financial statements.
18
Victory Portfolios
Victory Integrity Small-Cap Value Fund | | Schedule of Portfolio Investments — continued
December 31, 2020 | |
(Amounts in Thousands, Except for Shares) (Unaudited)
Security Description | | Shares | | Value | |
Industrials (20.2%): | |
AAR Corp. | | | 438,100 | | | $ | 15,869 | | |
Aerojet Rocketdyne Holdings, Inc. (a) (b) | | | 199,800 | | | | 10,559 | | |
Allison Transmission Holdings, Inc. | | | 159,600 | | | | 6,884 | | |
Atkore International Group, Inc. (b) | | | 275,300 | | | | 11,318 | | |
AZZ, Inc. | | | 253,000 | | | | 12,002 | | |
Barnes Group, Inc. | | | 332,000 | | | | 16,829 | | |
Beacon Roofing Supply, Inc. (b) | | | 345,000 | | | | 13,865 | | |
Builders FirstSource, Inc. (b) | | | 237,000 | | | | 9,672 | | |
Clean Harbors, Inc. (b) | | | 161,400 | | | | 12,283 | | |
Crane Co. | | | 153,600 | | | | 11,929 | | |
Ducommun, Inc. (b) | | | 132,000 | | | | 7,088 | | |
EMCOR Group, Inc. | | | 189,500 | | | | 17,331 | | |
EnPro Industries, Inc. | | | 136,015 | | | | 10,272 | | |
Fluor Corp. | | | 480,000 | | | | 7,666 | | |
HNI Corp. | | | 163,000 | | | | 5,617 | | |
Hub Group, Inc., Class A (b) | | | 162,397 | | | | 9,257 | | |
Kennametal, Inc. | | | 364,000 | | | | 13,191 | | |
Kirby Corp. (b) | | | 118,500 | | | | 6,142 | | |
Korn Ferry | | | 338,500 | | | | 14,725 | | |
ManpowerGroup, Inc. | | | 65,600 | | | | 5,916 | | |
Meritor, Inc. (b) | | | 484,000 | | | | 13,508 | | |
MRC Global, Inc. (b) | | | 1,360,000 | | | | 9,017 | | |
NOW, Inc. (b) | | | 1,189,600 | | | | 8,541 | | |
nVent Electric PLC | | | 278,000 | | | | 6,475 | | |
Ryder System, Inc. | | | 179,000 | | | | 11,055 | | |
Saia, Inc. (b) | | | 72,800 | | | | 13,162 | | |
SkyWest, Inc. | | | 223,585 | | | | 9,013 | | |
Spirit Airlines, Inc. (b) | | | 345,600 | | | | 8,450 | | |
Steelcase, Inc., Class A | | | 456,400 | | | | 6,184 | | |
Terex Corp. | | | 474,000 | | | | 16,538 | | |
Trinity Industries, Inc. (a) | | | 327,475 | | | | 8,642 | | |
TrueBlue, Inc. (b) | | | 280,000 | | | | 5,233 | | |
Tutor Perini Corp. (b) | | | 480,300 | | | | 6,220 | | |
Wabash National Corp. | | | 569,000 | | | | 9,804 | | |
Werner Enterprises, Inc. | | | 239,500 | | | | 9,393 | | |
WESCO International, Inc. (b) | | | 157,000 | | | | 12,325 | | |
| | | | 371,975 | | |
Information Technology (8.7%): | |
ADTRAN, Inc. | | | 410,000 | | | | 6,056 | | |
Avnet, Inc. | | | 262,000 | | | | 9,199 | | |
Belden, Inc. | | | 231,500 | | | | 9,700 | | |
Cohu, Inc. | | | 402,200 | | | | 15,356 | | |
Conduent, Inc. (b) | | | 2,055,800 | | | | 9,868 | | |
CTS Corp. | | | 340,000 | | | | 11,672 | | |
Diebold Nixdorf, Inc. (b) | | | 1,040,000 | | | | 11,086 | | |
Diodes, Inc. (b) | | | 152,100 | | | | 10,723 | | |
Infinera Corp. (a) (b) | | | 1,308,000 | | | | 13,708 | | |
KBR, Inc. | | | 248,300 | | | | 7,680 | | |
Perspecta, Inc. | | | 290,300 | | | | 6,990 | | |
See notes to financial statements.
19
Victory Portfolios
Victory Integrity Small-Cap Value Fund | | Schedule of Portfolio Investments — continued
December 31, 2020 | |
(Amounts in Thousands, Except for Shares) (Unaudited)
Security Description | | Shares | | Value | |
Plexus Corp. (b) | | | 105,000 | | | $ | 8,212 | | |
TTM Technologies, Inc. (b) | | | 765,000 | | | | 10,553 | | |
Verint Systems, Inc. (b) | | | 177,700 | | | | 11,938 | | |
Viavi Solutions, Inc. (b) | | | 520,900 | | | | 7,800 | | |
Vishay Intertechnology, Inc. | | | 506,500 | | | | 10,490 | | |
| | | | 161,031 | | |
Materials (7.3%): | |
Alcoa Corp. (b) | | | 678,000 | | | | 15,628 | | |
Allegheny Technologies, Inc. (b) | | | 668,800 | | | | 11,216 | | |
Arconic Corp. (b) | | | 354,400 | | | | 10,561 | | |
Avient Corp. | | | 392,000 | | | | 15,789 | | |
Boise Cascade Co. | | | 171,000 | | | | 8,174 | | |
Carpenter Technology Corp. | | | 300,000 | | | | 8,736 | | |
Cleveland-Cliffs, Inc. (a) | | | 1,065,000 | | | | 15,506 | | |
Kraton Corp. (b) | | | 388,000 | | | | 10,783 | | |
O-I Glass, Inc. | | | 855,000 | | | | 10,175 | | |
Olin Corp. | | | 450,000 | | | | 11,052 | | |
Orion Engineered Carbons SA | | | 485,000 | | | | 8,313 | | |
Tronox Holdings PLC, Class A | | | 670,000 | | | | 9,795 | | |
| | | | 135,728 | | |
Real Estate (8.3%): | |
Alexander & Baldwin, Inc. | | | 730,000 | | | | 12,541 | | |
CareTrust REIT, Inc. | | | 471,700 | | | | 10,462 | | |
City Office REIT, Inc. | | | 680,000 | | | | 6,644 | | |
DiamondRock Hospitality Co. (b) | | | 1,614,078 | | | | 13,316 | | |
Essential Properties Realty Trust, Inc. (a) | | | 691,000 | | | | 14,649 | | |
Kite Realty Group Trust | | | 360,200 | | | | 5,389 | | |
Lexington Realty Trust | | | 1,437,300 | | | | 15,264 | | |
Mack Cali Realty Corp. | | | 791,100 | | | | 9,857 | | |
Physicians Realty Trust | | | 699,500 | | | | 12,451 | | |
SITE Centers Corp. | | | 1,410,000 | | | | 14,269 | | |
STAG Industrial, Inc. | | | 531,600 | | | | 16,651 | | |
Summit Hotel Properties, Inc. | | | 1,078,000 | | | | 9,713 | | |
Sunstone Hotel Investors, Inc. | | | 858,200 | | | | 9,723 | | |
| | | | 150,929 | | |
Utilities (4.1%): | |
ALLETE, Inc. (a) | | | 185,900 | | | | 11,514 | | |
Black Hills Corp. | | | 230,900 | | | | 14,188 | | |
New Jersey Resources Corp. (a) | | | 227,000 | | | | 8,070 | | |
NorthWestern Corp. | | | 160,000 | | | | 9,330 | | |
ONE Gas, Inc. | | | 103,300 | | | | 7,930 | | |
PNM Resources, Inc. | | | 164,000 | | | | 7,959 | | |
Portland General Electric Co. | | | 175,300 | | | | 7,498 | | |
Spire, Inc. | | | 113,500 | | | | 7,269 | | |
| | | | 73,758 | | |
Total Common Stocks (Cost $1,380,878) | | | 1,828,748 | | |
See notes to financial statements.
20
Victory Portfolios
Victory Integrity Small-Cap Value Fund | | Schedule of Portfolio Investments — continued
December 31, 2020 | |
(Amounts in Thousands, Except for Shares) (Unaudited)
Security Description | | Shares | | Value | |
Collateral for Securities Loaned^ (5.4%) | |
BlackRock Liquidity Funds TempFund Portfolio, Institutional Class, 0.08% (c) | | | 1,720,377 | | | $ | 1,720 | | |
Fidelity Investments Money Market Government Portfolio, Class I, 0.01% (c) | | | 59,105,027 | | | | 59,105 | | |
Goldman Sachs Financial Square Prime Obligations Fund, Institutional
Class, 0.04% (c) | | | 858,553 | | | | 859 | | |
JPMorgan Prime Money Market Fund, Capital Class, 0.12% (c) | | | 6,845,837 | | | | 6,846 | | |
Morgan Stanley Institutional Liquidity Prime Portfolio, Institutional
Class, 0.09% (c) | | | 30,780,218 | | | | 30,780 | | |
Total Collateral for Securities Loaned (Cost $99,310) | | | 99,310 | | |
Total Investments (Cost $1,480,188) — 104.8% | | | 1,928,058 | | |
Liabilities in excess of other assets — (4.8)% | | | (87,553 | ) | |
NET ASSETS — 100.00% | | $ | 1,840,505 | | |
^ Purchased with cash collateral from securities on loan.
(a) All or a portion of this security is on loan.
(b) Non-income producing security.
(c) Rate disclosed is the daily yield on December 31, 2020.
PLC — Public Limited Company
REIT — Real Estate Investment Trust
See notes to financial statements.
21
Victory Portfolios
Victory Integrity Small/Mid-Cap Value Fund | | Schedule of Portfolio Investments
December 31, 2020 | |
(Amounts in Thousands, Except for Shares) (Unaudited)
Security Description | | Shares | | Value | |
Common Stocks (99.1%) | |
Communication Services (2.4%): | |
Cinemark Holdings, Inc. (a) | | | 44,301 | | | $ | 771 | | |
Lions Gate Entertainment Corp., Class B (b) | | | 81,634 | | | | 848 | | |
Nexstar Media Group, Inc., Class A | | | 10,903 | | | | 1,191 | | |
TEGNA, Inc. | | | 51,050 | | | | 712 | | |
| | | | 3,522 | | |
Consumer Discretionary (15.0%): | |
American Eagle Outfitters, Inc. (a) | | | 49,949 | | | | 1,003 | | |
Aramark | | | 25,920 | | | | 997 | | |
Asbury Automotive Group, Inc. (b) | | | 5,958 | | | | 868 | | |
Bed Bath & Beyond, Inc. (a) | | | 23,441 | | | | 416 | | |
Brunswick Corp. | | | 17,171 | | | | 1,309 | | |
Caesars Entertainment, Inc. (b) | | | 13,128 | | | | 975 | | |
Darden Restaurants, Inc. | | | 8,450 | | | | 1,007 | | |
Jack in the Box, Inc. | | | 11,176 | | | | 1,037 | | |
Kohl's Corp. | | | 30,689 | | | | 1,249 | | |
Kontoor Brands, Inc. | | | 15,325 | | | | 622 | | |
Lear Corp. | | | 6,233 | | | | 991 | | |
Mohawk Industries, Inc. (b) | | | 7,106 | | | | 1,002 | | |
Newell Brands, Inc. | | | 53,500 | | | | 1,136 | | |
Norwegian Cruise Line Holdings Ltd. (a) (b) | | | 35,400 | | | | 900 | | |
PulteGroup, Inc. | | | 22,425 | | | | 967 | | |
Ralph Lauren Corp. | | | 13,901 | | | | 1,442 | | |
Steven Madden Ltd. | | | 27,332 | | | | 965 | | |
Tapestry, Inc. | | | 28,639 | | | | 890 | | |
TRI Pointe Group, Inc. (b) | | | 28,600 | | | | 493 | | |
Visteon Corp. (b) | | | 9,691 | | | | 1,217 | | |
W.W. International, Inc. (b) | | | 27,132 | | | | 662 | | |
Wolverine World Wide, Inc. | | | 36,865 | | | | 1,152 | | |
Wyndham Destinations, Inc. | | | 27,575 | | | | 1,237 | | |
| | | | 22,537 | | |
Consumer Staples (2.5%): | |
Edgewell Personal Care Co. (a) | | | 18,272 | | | | 632 | | |
Grocery Outlet Holding Corp. (b) | | | 20,170 | | | | 792 | | |
Lamb Weston Holdings, Inc. | | | 15,764 | | | | 1,241 | | |
Performance Food Group Co. (b) | | | 25,667 | | | | 1,222 | | |
| | | | 3,887 | | |
Energy (2.9%): | |
Devon Energy Corp. | | | 59,331 | | | | 938 | | |
Diamondback Energy, Inc. | | | 19,470 | | | | 942 | | |
EQT Corp. (b) | | | 53,876 | | | | 685 | | |
Parsley Energy, Inc., Class A | | | 70,822 | | | | 1,006 | | |
PDC Energy, Inc. (b) | | | 40,539 | | | | 832 | | |
| | | | 4,403 | | |
See notes to financial statements.
22
Victory Portfolios
Victory Integrity Small/Mid-Cap Value Fund | | Schedule of Portfolio Investments — continued
December 31, 2020 | |
(Amounts in Thousands, Except for Shares) (Unaudited)
Security Description | | Shares | | Value | |
Financials (21.6%): | |
AGNC Investment Corp. | | | 83,541 | | | $ | 1,303 | | |
Ally Financial, Inc. | | | 48,950 | | | | 1,746 | | |
Arch Capital Group Ltd. (b) | | | 17,144 | | | | 618 | | |
Assurant, Inc. | | | 9,994 | | | | 1,362 | | |
Blackstone Mortgage Trust, Inc., Class A (a) | | | 25,893 | | | | 713 | | |
Brown & Brown, Inc. | | | 13,809 | | | | 655 | | |
CIT Group, Inc. | | | 24,904 | | | | 894 | | |
Discover Financial Services | | | 16,030 | | | | 1,451 | | |
East West Bancorp, Inc. | | | 28,700 | | | | 1,455 | | |
Everest Re Group Ltd. | | | 3,407 | | | | 798 | | |
Hancock Whitney Corp. | | | 46,650 | | | | 1,587 | | |
Invesco Ltd. | | | 52,610 | | | | 917 | | |
Investors Bancorp, Inc. | | | 80,400 | | | | 849 | | |
Kinsale Capital Group, Inc. | | | 4,407 | | | | 882 | | |
Lincoln National Corp. | | | 11,974 | | | | 602 | | |
LPL Financial Holdings, Inc. | | | 12,023 | | | | 1,253 | | |
MGIC Investment Corp. | | | 88,050 | | | | 1,105 | | |
PacWest Bancorp | | | 49,677 | | | | 1,262 | | |
People's United Financial, Inc. | | | 78,820 | | | | 1,019 | | |
Primerica, Inc. | | | 8,177 | | | | 1,095 | | |
Reinsurance Group of America, Inc. | | | 8,359 | | | | 969 | | |
Sterling Bancorp | | | 70,164 | | | | 1,262 | | |
Stifel Financial Corp. | | | 23,007 | | | | 1,161 | | |
Synovus Financial Corp. | | | 28,200 | | | | 913 | | |
The Hanover Insurance Group, Inc. | | | 8,785 | | | | 1,027 | | |
Umpqua Holdings Corp. | | | 88,000 | | | | 1,332 | | |
Voya Financial, Inc. | | | 23,100 | | | | 1,359 | | |
WesBanco, Inc. | | | 32,400 | | | | 971 | | |
Western Alliance Bancorp | | | 30,254 | | | | 1,813 | | |
| | | | 32,373 | | |
Health Care (4.2%): | |
Encompass Health Corp. | | | 15,808 | | | | 1,308 | | |
Hill-Rom Holdings, Inc. | | | 8,495 | | | | 832 | | |
Jazz Pharmaceuticals PLC (b) | | | 6,420 | | | | 1,060 | | |
Magellan Health, Inc. (b) | | | 13,356 | | | | 1,106 | | |
Perrigo Co. PLC | | | 19,218 | | | | 859 | | |
Select Medical Holdings Corp. (b) | | | 39,482 | | | | 1,092 | | |
| | | | 6,257 | | |
Industrials (19.3%): | |
Aerojet Rocketdyne Holdings, Inc. (b) | | | 16,132 | | | | 853 | | |
Alaska Air Group, Inc. | | | 12,292 | | | | 639 | | |
Allison Transmission Holdings, Inc. | | | 12,738 | | | | 549 | | |
Atkore International Group, Inc. (b) | | | 22,450 | | | | 923 | | |
Barnes Group, Inc. | | | 24,725 | | | | 1,253 | | |
Beacon Roofing Supply, Inc. (b) | | | 26,661 | | | | 1,071 | | |
Carlisle Cos., Inc. | | | 8,049 | | | | 1,257 | | |
Clean Harbors, Inc. (b) | | | 13,450 | | | | 1,024 | | |
Crane Co. | | | 12,125 | | | | 942 | | |
See notes to financial statements.
23
Victory Portfolios
Victory Integrity Small/Mid-Cap Value Fund | | Schedule of Portfolio Investments — continued
December 31, 2020 | |
(Amounts in Thousands, Except for Shares) (Unaudited)
Security Description | | Shares | | Value | |
EMCOR Group, Inc. | | | 15,672 | | | $ | 1,433 | | |
EnPro Industries, Inc. | | | 11,697 | | | | 883 | | |
Flowserve Corp. | | | 17,360 | | | | 640 | | |
Fluor Corp. | | | 40,859 | | | | 653 | | |
Fortune Brands Home & Security, Inc. | | | 9,630 | | | | 825 | | |
ITT, Inc. | | | 16,718 | | | | 1,289 | | |
Kirby Corp. (b) | | | 12,130 | | | | 629 | | |
Knight-Swift Transportation Holdings, Inc. | | | 21,800 | | | | 912 | | |
Korn Ferry | | | 22,720 | | | | 988 | | |
ManpowerGroup, Inc. | | | 11,250 | | | | 1,015 | | |
Meritor, Inc. (b) | | | 38,127 | | | | 1,064 | | |
MRC Global, Inc. (b) | | | 92,142 | | | | 611 | | |
nVent Electric PLC | | | 38,708 | | | | 902 | | |
Oshkosh Corp. | | | 11,841 | | | | 1,019 | | |
Quanta Services, Inc. | | | 11,650 | | | | 839 | | |
Ryder System, Inc. | | | 16,140 | | | | 997 | | |
Saia, Inc. (b) | | | 5,730 | | | | 1,035 | | |
Sensata Technologies Holding PLC (b) | | | 22,287 | | | | 1,175 | | |
SkyWest, Inc. | | | 22,956 | | | | 926 | | |
Steelcase, Inc., Class A | | | 36,916 | | | | 500 | | |
Trinity Industries, Inc. | | | 26,900 | | | | 710 | | |
Tutor Perini Corp. (b) | | | 31,065 | | | | 402 | | |
Westinghouse Air Brake Technologies Corp. | | | 13,830 | | | | 1,012 | | |
| | | | 28,970 | | |
Information Technology (10.4%): | |
Arrow Electronics, Inc. (b) | | | 12,406 | | | | 1,207 | | |
Belden, Inc. | | | 19,760 | | | | 828 | | |
Conduent, Inc. (b) | | | 154,396 | | | | 741 | | |
Diodes, Inc. (b) | | | 9,327 | | | | 658 | | |
Euronet Worldwide, Inc. (b) | | | 7,495 | | | | 1,087 | | |
Flex Ltd. (b) | | | 78,225 | | | | 1,406 | | |
Infinera Corp. (a) (b) | | | 91,000 | | | | 953 | | |
Jabil, Inc. | | | 23,942 | | | | 1,018 | | |
MKS Instruments, Inc. | | | 8,650 | | | | 1,301 | | |
NCR Corp. (b) | | | 32,481 | | | | 1,220 | | |
ON Semiconductor Corp. (b) | | | 69,613 | | | | 2,278 | | |
Perspecta, Inc. | | | 18,663 | | | | 449 | | |
Verint Systems, Inc. (b) | | | 17,086 | | | | 1,148 | | |
Viavi Solutions, Inc. (b) | | | 42,251 | | | | 633 | | |
Vishay Intertechnology, Inc. | | | 37,135 | | | | 769 | | |
| | | | 15,696 | | |
Materials (7.4%): | |
Alcoa Corp. (b) | | | 50,651 | | | | 1,168 | | |
Allegheny Technologies, Inc. (b) | | | 53,864 | | | | 903 | | |
Arconic Corp. (b) | | | 31,100 | | | | 927 | | |
Boise Cascade Co. | | | 13,183 | | | | 630 | | |
Carpenter Technology Corp. | | | 24,680 | | | | 719 | | |
Huntsman Corp. | | | 43,500 | | | | 1,094 | | |
Kraton Corp. (b) | | | 23,351 | | | | 649 | | |
See notes to financial statements.
24
Victory Portfolios
Victory Integrity Small/Mid-Cap Value Fund | | Schedule of Portfolio Investments — continued
December 31, 2020 | |
(Amounts in Thousands, Except for Shares) (Unaudited)
Security Description | | Shares | | Value | |
O-I Glass, Inc. | | | 64,614 | | | $ | 769 | | |
Olin Corp. | | | 39,025 | | | | 958 | | |
Orion Engineered Carbons SA | | | 21,314 | | | | 365 | | |
Steel Dynamics, Inc. | | | 20,594 | | | | 759 | | |
The Mosaic Co. | | | 42,000 | | | | 966 | | |
Westlake Chemical Corp. | | | 15,620 | | | | 1,275 | | |
| | | | 11,182 | | |
Real Estate (9.8%): | |
Americold Realty Trust (a) | | | 30,420 | | | | 1,136 | | |
Apartment Income REIT Corp. (b) | | | 34,335 | | | | 1,319 | | |
Camden Property Trust | | | 11,674 | | | | 1,166 | | |
DiamondRock Hospitality Co. (b) | | | 129,600 | | | | 1,069 | | |
EPR Properties | | | 13,219 | | | | 430 | | |
First Industrial Realty Trust, Inc. | | | 22,800 | | | | 961 | | |
Gaming and Leisure Properties, Inc. | | | 20,677 | | | | 877 | | |
Highwoods Properties, Inc. | | | 38,000 | | | | 1,505 | | |
Mack Cali Realty Corp. | | | 47,245 | | | | 589 | | |
Medical Properties Trust, Inc. | | | 76,546 | | | | 1,667 | | |
SITE Centers Corp. | | | 115,880 | | | | 1,173 | | |
STORE Capital Corp. | | | 39,200 | | | | 1,331 | | |
VICI Properties, Inc. | | | 49,421 | | | | 1,260 | | |
| | | | 14,483 | | |
Utilities (3.6%): | |
ALLETE, Inc. | | | 11,038 | | | | 684 | | |
Black Hills Corp. | | | 13,962 | | | | 858 | | |
PG&E Corp. (b) | | | 60,688 | | | | 756 | | |
Pinnacle West Capital Corp. | | | 11,221 | | | | 897 | | |
Spire, Inc. | | | 8,764 | | | | 561 | | |
UGI Corp. | | | 26,784 | | | | 937 | | |
Vistra Corp. | | | 31,104 | | | | 612 | | |
| | | | 5,305 | | |
Total Common Stocks (Cost $118,345) | | | 148,615 | | |
Collateral for Securities Loaned^ (3.5%) | |
BlackRock Liquidity Funds TempFund Portfolio, Institutional Class, 0.08% (c) | | | 91,764 | | | | 92 | | |
Fidelity Investments Money Market Government Portfolio I Shares, 0.01% (c) | | | 3,152,647 | | | | 3,152 | | |
Goldman Sachs Financial Square Prime Obligations Fund, Institutional
Class, 0.04% (c) | | | 45,795 | | | | 46 | | |
JPMorgan Prime Money Market Fund, Capital Class, 0.12% (c) | | | 365,155 | | | | 365 | | |
Morgan Stanley Institutional Liquidity Prime Portfolio, Institutional
Class, 0.09% (c) | | | 1,641,809 | | | | 1,642 | | |
Total Collateral for Securities Loaned (Cost $5,297) | | | 5,297 | | |
Total Investments (Cost $123,642) — 102.6% | | | 153,912 | | |
Liabilities in excess of other assets — (2.6)% | | | (3,923 | ) | |
NET ASSETS — 100.00% | | $ | 149,989 | | |
^ Purchased with cash collateral from securities on loan.
See notes to financial statements.
25
Victory Portfolios
Victory Integrity Small/Mid-Cap Value Fund | | Schedule of Portfolio Investments — continued
December 31, 2020 | |
(Unaudited)
(a) All or a portion of this security is on loan.
(b) Non-income producing security.
(c) Rate disclosed is the daily yield on December 31, 2020.
PLC — Public Limited Company
REIT — Real Estate Investment Trust
See notes to financial statements.
26
Victory Portfolios
Victory Munder Multi-Cap Fund | | Schedule of Portfolio Investments
December 31, 2020 | |
(Amounts in Thousands, Except for Shares) (Unaudited)
Security Description | | Shares | | Value | |
Common Stocks (98.8%) | |
Communication Services (10.6%): | |
Alphabet, Inc., Class A (a) | | | 8,693 | | | $ | 15,236 | | |
Charter Communications, Inc., Class A (a) | | | 8,500 | | | | 5,623 | | |
Facebook, Inc., Class A (a) | | | 24,400 | | | | 6,665 | | |
Nexstar Media Group, Inc., Class A | | | 55,500 | | | | 6,060 | | |
T-Mobile U.S., Inc. (a) | | | 32,100 | | | | 4,329 | | |
Zynga, Inc., Class A (a) | | | 456,000 | | | | 4,501 | | |
| | | | 42,414 | | |
Communications Equipment (1.4%): | |
Lumentum Holdings, Inc. (a) | | | 56,900 | | | | 5,394 | | |
Consumer Discretionary (17.3%): | |
Amazon.com, Inc. (a) | | | 4,710 | | | | 15,340 | | |
Asbury Automotive Group, Inc. (a) | | | 36,900 | | | | 5,378 | | |
Boyd Gaming Corp. (a) | | | 102,800 | | | | 4,412 | | |
D.R. Horton, Inc. | | | 45,500 | | | | 3,136 | | |
Dollar General Corp. | | | 24,020 | | | | 5,051 | | |
Group 1 Automotive, Inc. | | | 32,800 | | | | 4,301 | | |
LCI Industries | | | 30,500 | | | | 3,955 | | |
LGI Homes, Inc. (a) | | | 52,800 | | | | 5,588 | | |
Lowe's Cos., Inc. | | | 40,300 | | | | 6,469 | | |
Malibu Boats, Inc., Class A (a) | | | 67,500 | | | | 4,215 | | |
Meritage Homes Corp. (a) | | | 33,900 | | | | 2,808 | | |
TopBuild Corp. (a) | | | 18,600 | | | | 3,424 | | |
Williams-Sonoma, Inc. (b) | | | 39,900 | | | | 4,063 | | |
| | | | 68,140 | | |
Consumer Staples (5.1%): | |
Monster Beverage Corp. (a) | | | 45,100 | | | | 4,171 | | |
PepsiCo, Inc. | | | 35,200 | | | | 5,220 | | |
Philip Morris International, Inc. | | | 43,300 | | | | 3,585 | | |
The Procter & Gamble Co. | | | 27,900 | | | | 3,882 | | |
Walmart, Inc. | | | 21,800 | | | | 3,142 | | |
| | | | 20,000 | | |
Energy (1.3%): | |
Chevron Corp. | | | 18,310 | | | | 1,546 | | |
Phillips 66 | | | 26,775 | | | | 1,873 | | |
Valero Energy Corp. | | | 31,800 | | | | 1,799 | | |
| | | | 5,218 | | |
Financials (9.2%): | |
Ameriprise Financial, Inc. | | | 12,800 | | | | 2,487 | | |
Bank of America Corp. | | | 134,900 | | | | 4,089 | | |
Flagstar Bancorp, Inc. | | | 102,300 | | | | 4,170 | | |
JPMorgan Chase & Co. | | | 50,700 | | | | 6,443 | | |
Morgan Stanley | | | 66,900 | | | | 4,585 | | |
Primerica, Inc. | | | 41,500 | | | | 5,558 | | |
See notes to financial statements.
27
Victory Portfolios
Victory Munder Multi-Cap Fund | | Schedule of Portfolio Investments — continued
December 31, 2020 | |
(Amounts in Thousands, Except for Shares) (Unaudited)
Security Description | | Shares | | Value | |
T. Rowe Price Group, Inc. | | | 26,400 | | | $ | 3,997 | | |
Western Alliance Bancorp | | | 90,700 | | | | 5,437 | | |
| | | | 36,766 | | |
Health Care (15.1%): | |
AbbVie, Inc. | | | 74,950 | | | | 8,031 | | |
AmerisourceBergen Corp. | | | 23,300 | | | | 2,278 | | |
Bristol-Myers Squibb Co. | | | 112,700 | | | | 6,991 | | |
Charles River Laboratories International, Inc. (a) | | | 19,700 | | | | 4,923 | | |
Hologic, Inc. (a) | | | 55,200 | | | | 4,020 | | |
ICON PLC (a) | | | 24,800 | | | | 4,836 | | |
Merck & Co., Inc. | | | 69,200 | | | | 5,661 | | |
Pfizer, Inc. | | | 49,500 | | | | 1,822 | | |
Quest Diagnostics, Inc. | | | 31,500 | | | | 3,753 | | |
Regeneron Pharmaceuticals, Inc. (a) | | | 11,200 | | | | 5,411 | | |
Stryker Corp. | | | 19,600 | | | | 4,803 | | |
Thermo Fisher Scientific, Inc. | | | 8,200 | | | | 3,819 | | |
UnitedHealth Group, Inc. | | | 10,125 | | | | 3,551 | | |
Viatris, Inc. (a) | | | 6,090 | | | | 114 | | |
| | | | 60,013 | | |
Industrials (10.1%): | |
Kansas City Southern | | | 30,500 | | | | 6,226 | | |
L3Harris Technologies, Inc. | | | 20,100 | | | | 3,799 | | |
Lockheed Martin Corp. | | | 11,200 | | | | 3,976 | | |
Marten Transport Ltd. | | | 229,200 | | | | 3,949 | | |
Masco Corp. | | | 91,200 | | | | 5,010 | | |
Old Dominion Freight Line, Inc. | | | 19,500 | | | | 3,806 | | |
Patrick Industries, Inc. | | | 37,200 | | | | 2,543 | | |
UFP Industries, Inc. | | | 98,000 | | | | 5,443 | | |
XPO Logistics, Inc. (a) | | | 42,800 | | | | 5,102 | | |
| | | | 39,854 | | |
IT Services (5.5%): | |
Akamai Technologies, Inc. (a) | | | 47,200 | | | | 4,956 | | |
Booz Allen Hamilton Holding Corp. | | | 58,700 | | | | 5,117 | | |
EPAM Systems, Inc. (a) | | | 12,100 | | | | 4,336 | | |
Fiserv, Inc. (a) | | | 42,400 | | | | 4,828 | | |
Visa, Inc., Class A | | | 13,500 | | | | 2,953 | | |
| | | | 22,190 | | |
Materials (3.8%): | |
Avery Dennison Corp. | | | 14,900 | | | | 2,311 | | |
Berry Global Group, Inc. (a) | | | 94,700 | | | | 5,321 | | |
Silgan Holdings, Inc. | | | 137,100 | | | | 5,084 | | |
Valvoline, Inc. | | | 101,000 | | | | 2,337 | | |
| | | | 15,053 | | |
Real Estate (1.1%): | |
American Tower Corp. | | | 19,800 | | | | 4,444 | | |
See notes to financial statements.
28
Victory Portfolios
Victory Munder Multi-Cap Fund | | Schedule of Portfolio Investments — continued
December 31, 2020 | |
(Amounts in Thousands, Except for Shares) (Unaudited)
Security Description | | Shares | | Value | |
Semiconductors & Semiconductor Equipment (4.8%): | |
Advanced Micro Devices, Inc. (a) | | | 57,400 | | | $ | 5,264 | | |
Broadcom, Inc. | | | 16,200 | | | | 7,093 | | |
NVIDIA Corp. | | | 13,200 | | | | 6,893 | | |
| | | | 19,250 | | |
Software (8.5%): | |
Adobe, Inc. (a) | | | 8,400 | | | | 4,201 | | |
Cadence Design Systems, Inc. (a) | | | 32,900 | | | | 4,489 | | |
Microsoft Corp. | | | 93,560 | | | | 20,809 | | |
ServiceNow, Inc. (a) | | | 8,300 | | | | 4,568 | | |
| | | | 34,067 | | |
Technology Hardware, Storage & Peripherals (5.0%): | |
Apple, Inc. | | | 149,480 | | | | 19,835 | | |
Total Common Stocks (Cost $272,162) | | | 392,638 | | |
Exchange-Traded Funds (1.0%) | |
iShares Russell 3000 ETF (b) | | | 18,000 | | | | 4,024 | | |
Total Exchange-Traded Funds (Cost $3,694) | | | 4,024 | | |
Collateral for Securities Loaned^ (1.1%) | |
BlackRock Liquidity Funds TempFund Portfolio, Institutional Class, 0.08% (c) | | | 74,914 | | | | 75 | | |
Fidelity Investments Money Market Government Portfolio, Class I, 0.01% (c) | | | 2,573,720 | | | | 2,574 | | |
Goldman Sachs Financial Square Prime Obligations Fund, Institutional Class,
0.04% (c) | | | 37,386 | | | | 37 | | |
JPMorgan Prime Money Market Fund, Capital Class, 0.12% (c) | | | 298,101 | | | | 298 | | |
Morgan Stanley Institutional Liquidity Prime Portfolio, Institutional Class,
0.09% (c) | | | 1,340,320 | | | | 1,340 | | |
Total Collateral for Securities Loaned (Cost $4,324) | | | 4,324 | | |
Total Investments (Cost $280,180) — 100.9% | | | 400,986 | | |
Liabilities in excess of other assets — (0.9)% | | | (3,637 | ) | |
NET ASSETS — 100.00% | | $ | 397,349 | | |
^ Purchased with cash collateral from securities on loan.
(a) Non-income producing security.
(b) All or a portion of this security is on loan.
(c) Rate disclosed is the daily yield on December 31, 2020.
ETF — Exchange-Traded Fund
PLC — Public Limited Company
See notes to financial statements.
29
Victory Portfolios
Victory S&P 500 Index Fund | | Schedule of Portfolio Investments
December 31, 2020 | |
(Amounts in Thousands, Except for Shares) (Unaudited)
Security Description | | Shares | | Value | |
Common Stocks (99.3%) | |
Communication Services (10.6%): | |
Activision Blizzard, Inc. | | | 5,919 | | | $ | 550 | | |
Alphabet, Inc., Class A (a) | | | 2,302 | | | | 4,035 | | |
Alphabet, Inc., Class C (a) | | | 2,223 | | | | 3,894 | | |
AT&T, Inc. | | | 54,571 | | | | 1,569 | | |
CenturyLink, Inc. | | | 7,562 | | | | 74 | | |
Charter Communications, Inc., Class A (a) | | | 1,117 | | | | 739 | | |
Comcast Corp., Class A | | | 34,966 | | | | 1,833 | | |
Discovery, Inc., Class A (a) (b) | | | 1,228 | | | | 37 | | |
Discovery, Inc., Class C (a) | | | 2,259 | | | | 59 | | |
DISH Network Corp., Class A (a) | | | 1,894 | | | | 61 | | |
Electronic Arts, Inc. | | | 2,221 | | | | 319 | | |
Facebook, Inc., Class A (a) | | | 18,410 | | | | 5,029 | | |
Fox Corp., Class A | | | 2,585 | | | | 75 | | |
Fox Corp., Class B | | | 1,185 | | | | 34 | | |
Live Nation Entertainment, Inc. (a) | | | 1,095 | | | | 80 | | |
Netflix, Inc. (a) | | | 3,383 | | | | 1,829 | | |
News Corp., Class A | | | 2,994 | | | | 54 | | |
News Corp., Class B | | | 933 | | | | 17 | | |
Omnicom Group, Inc. | | | 1,646 | | | | 103 | | |
Take-Two Interactive Software, Inc. (a) | | | 881 | | | | 183 | | |
The Interpublic Group of Cos., Inc. | | | 2,987 | | | | 70 | | |
The Walt Disney Co. (a) | | | 13,865 | | | | 2,512 | | |
T-Mobile U.S., Inc. (a) | | | 4,467 | | | | 602 | | |
Twitter, Inc. (a) | | | 6,091 | | | | 330 | | |
Verizon Communications, Inc. | | | 31,690 | | | | 1,862 | | |
ViacomCBS, Inc., Class B | | | 4,327 | | | | 161 | | |
| | | | 26,111 | | |
Communications Equipment (0.8%): | |
Arista Networks, Inc. (a) | | | 417 | | | | 121 | | |
Cisco Systems, Inc. | | | 32,359 | | | | 1,448 | | |
F5 Networks, Inc. (a) | | | 472 | | | | 83 | | |
Juniper Networks, Inc. | | | 2,525 | | | | 57 | | |
Motorola Solutions, Inc. | | | 1,298 | | | | 221 | | |
| | | | 1,930 | | |
Consumer Discretionary (12.6%): | |
Advance Auto Parts, Inc. | | | 520 | | | | 82 | | |
Amazon.com, Inc. (a) | | | 3,266 | | | | 10,637 | | |
Aptiv PLC | | | 2,068 | | | | 269 | | |
AutoZone, Inc. (a) | | | 177 | | | | 210 | | |
Best Buy Co., Inc. | | | 1,765 | | | | 176 | | |
Booking Holdings, Inc. (a) | | | 314 | | | | 699 | | |
BorgWarner, Inc. | | | 1,873 | | | | 72 | | |
CarMax, Inc. (a) | | | 1,257 | | | | 119 | | |
Carnival Corp. | | | 5,695 | | | | 123 | | |
Chipotle Mexican Grill, Inc. (a) | | | 214 | | | | 297 | | |
D.R. Horton, Inc. | | | 2,539 | | | | 175 | | |
See notes to financial statements.
30
Victory Portfolios
Victory S&P 500 Index Fund | | Schedule of Portfolio Investments — continued
December 31, 2020 | |
(Amounts in Thousands, Except for Shares) (Unaudited)
Security Description | | Shares | | Value | |
Darden Restaurants, Inc. | | | 997 | | | $ | 119 | | |
Dollar General Corp. | | | 1,876 | | | | 395 | | |
Dollar Tree, Inc. (a) | | | 1,801 | | | | 195 | | |
Domino's Pizza, Inc. | | | 302 | | | | 116 | | |
eBay, Inc. | | | 5,015 | | | | 252 | | |
Etsy, Inc. (a) | | | 966 | | | | 172 | | |
Expedia Group, Inc. | | | 1,041 | | | | 138 | | |
Ford Motor Co. | | | 29,924 | | | | 263 | | |
Garmin Ltd. | | | 1,142 | | | | 137 | | |
General Motors Co. | | | 9,646 | | | | 402 | | |
Genuine Parts Co. | | | 1,105 | | | | 111 | | |
Hanesbrands, Inc. | | | 2,667 | | | | 39 | | |
Hasbro, Inc. | | | 976 | | | | 91 | | |
Hilton Worldwide Holdings, Inc. | | | 2,125 | | | | 236 | | |
L Brands, Inc. | | | 1,789 | | | | 67 | | |
Las Vegas Sands Corp. | | | 2,515 | | | | 150 | | |
Leggett & Platt, Inc. | | | 1,015 | | | | 45 | | |
Lennar Corp., Class A | | | 2,107 | | | | 161 | | |
LKQ Corp. (a) | | | 2,144 | | | | 76 | | |
Lowe's Cos., Inc. | | | 5,611 | | | | 900 | | |
Marriott International, Inc., Class A | | | 2,037 | | | | 269 | | |
McDonald's Corp. | | | 5,706 | | | | 1,223 | | |
MGM Resorts International | | | 3,140 | | | | 99 | | |
Mohawk Industries, Inc. (a) | | | 458 | | | | 65 | | |
Newell Brands, Inc. | | | 2,892 | | | | 61 | | |
NIKE, Inc., Class B | | | 9,609 | | | | 1,360 | | |
Norwegian Cruise Line Holdings Ltd. (a) (b) | | | 2,417 | | | | 61 | | |
NVR, Inc. (a) | | | 27 | | | | 110 | | |
O'Reilly Automotive, Inc. (a) | | | 555 | | | | 251 | | |
Pool Corp. | | | 308 | | | | 114 | | |
PulteGroup, Inc. | | | 2,053 | | | | 89 | | |
PVH Corp. | | | 544 | | | | 51 | | |
Ralph Lauren Corp. | | | 369 | | | | 38 | | |
Ross Stores, Inc. | | | 2,726 | | | | 335 | | |
Royal Caribbean Cruises Ltd. | | | 1,426 | | | | 107 | | |
Starbucks Corp. | | | 8,988 | | | | 961 | | |
Tapestry, Inc. | | | 2,124 | | | | 66 | | |
Target Corp. | | | 3,835 | | | | 676 | | |
Tesla, Inc. (a) | | | 5,807 | | | | 4,098 | | |
The Gap, Inc. | | | 1,575 | | | | 32 | | |
The Home Depot, Inc. | | | 8,245 | | | | 2,189 | | |
The TJX Cos., Inc. | | | 9,194 | | | | 628 | | |
Tiffany & Co. | | | 828 | | | | 109 | | |
Tractor Supply Co. | | | 892 | | | | 125 | | |
Ulta Beauty, Inc. (a) | | | 431 | | | | 124 | | |
Under Armour, Inc., Class A (a) | | | 1,444 | | | | 25 | | |
Under Armour, Inc., Class C (a) | | | 1,490 | | | | 22 | | |
VF Corp. | | | 2,449 | | | | 209 | | |
Whirlpool Corp. | | | 479 | | | | 86 | | |
See notes to financial statements.
31
Victory Portfolios
Victory S&P 500 Index Fund | | Schedule of Portfolio Investments — continued
December 31, 2020 | |
(Amounts in Thousands, Except for Shares) (Unaudited)
Security Description | | Shares | | Value | |
Wynn Resorts Ltd. | | | 743 | | | $ | 84 | | |
Yum! Brands, Inc. | | | 2,310 | | | | 251 | | |
| | | | 30,842 | | |
Consumer Staples (6.4%): | |
Altria Group, Inc. | | | 14,232 | | | | 584 | | |
Archer-Daniels-Midland Co. | | | 4,261 | | | | 215 | | |
Brown-Forman Corp., Class B | | | 1,398 | | | | 111 | | |
Campbell Soup Co. | | | 1,551 | | | | 75 | | |
Church & Dwight Co., Inc. | | | 1,903 | | | | 166 | | |
Colgate-Palmolive Co. | | | 6,564 | | | | 561 | | |
Conagra Brands, Inc. | | | 3,741 | | | | 136 | | |
Constellation Brands, Inc., Class A | | | 1,298 | | | | 284 | | |
Costco Wholesale Corp. | | | 3,379 | | | | 1,273 | | |
General Mills, Inc. | | | 4,681 | | | | 275 | | |
Hormel Foods Corp. | | | 2,150 | | | | 100 | | |
Kellogg Co. | | | 1,948 | | | | 121 | | |
Kimberly-Clark Corp. | | | 2,605 | | | | 351 | | |
Lamb Weston Holdings, Inc. | | | 1,121 | | | | 88 | | |
McCormick & Co., Inc. | | | 1,905 | | | | 182 | | |
Molson Coors Beverage Co., Class B | | | 1,441 | | | | 65 | | |
Mondelez International, Inc., Class A | | | 10,952 | | | | 641 | | |
Monster Beverage Corp. (a) | | | 2,830 | | | | 262 | | |
PepsiCo, Inc. | | | 10,583 | | | | 1,569 | | |
Philip Morris International, Inc. | | | 11,926 | | | | 987 | | |
Sysco Corp. | | | 3,901 | | | | 290 | | |
The Clorox Co. | | | 965 | | | | 195 | | |
The Coca-Cola Co. | | | 29,619 | | | | 1,625 | | |
The Estee Lauder Cos., Inc., Class A | | | 1,735 | | | | 462 | | |
The Hershey Co. | | | 1,130 | | | | 172 | | |
The J.M. Smucker Co. | | | 874 | | | | 101 | | |
The Kraft Heinz Co. | | | 4,962 | | | | 172 | | |
The Kroger Co. | | | 5,930 | | | | 188 | | |
The Procter & Gamble Co. | | | 18,989 | | | | 2,643 | | |
Tyson Foods, Inc., Class A | | | 2,252 | | | | 145 | | |
Walgreens Boots Alliance, Inc. | | | 5,504 | | | | 219 | | |
Walmart, Inc. | | | 10,617 | | | | 1,531 | | |
| | | | 15,789 | | |
Electronic Equipment, Instruments & Components (0.6%): | |
Amphenol Corp., Class A | | | 2,291 | | | | 300 | | |
CDW Corp. | | | 1,095 | | | | 144 | | |
Corning, Inc. | | | 5,851 | | | | 211 | | |
FLIR Systems, Inc. | | | 1,004 | | | | 44 | | |
IPG Photonics Corp. (a) | | | 273 | | | | 61 | | |
Keysight Technologies, Inc. (a) | | | 1,419 | | | | 187 | | |
TE Connectivity Ltd. | | | 2,533 | | | | 307 | | |
Vontier Corp. (a) | | | 1,032 | | | | 34 | | |
Zebra Technologies Corp. (a) | | | 408 | | | | 157 | | |
| | | | 1,445 | | |
See notes to financial statements.
32
Victory Portfolios
Victory S&P 500 Index Fund | | Schedule of Portfolio Investments — continued
December 31, 2020 | |
(Amounts in Thousands, Except for Shares) (Unaudited)
Security Description | | Shares | | Value | |
Energy (2.2%): | |
Apache Corp. | | | 2,891 | | | $ | 41 | | |
Baker Hughes Co. | | | 5,252 | | | | 110 | | |
Cabot Oil & Gas Corp. | | | 3,052 | | | | 50 | | |
Chevron Corp. | | | 14,742 | | | | 1,245 | | |
Concho Resources, Inc. | | | 1,503 | | | | 88 | | |
ConocoPhillips | | | 8,178 | | | | 327 | | |
Devon Energy Corp. | | | 2,929 | | | | 46 | | |
Diamondback Energy, Inc. | | | 1,210 | | | | 59 | | |
EOG Resources, Inc. | | | 4,468 | | | | 223 | | |
Exxon Mobil Corp. | | | 32,380 | | | | 1,335 | | |
Halliburton Co. | | | 6,770 | | | | 127 | | |
Hess Corp. | | | 2,093 | | | | 110 | | |
HollyFrontier Corp. | | | 1,141 | | | | 29 | | |
Kinder Morgan, Inc. | | | 14,909 | | | | 204 | | |
Marathon Oil Corp. | | | 6,045 | | | | 40 | | |
Marathon Petroleum Corp. | | | 4,983 | | | | 206 | | |
National Oilwell Varco, Inc. | | | 2,973 | | | | 41 | | |
Occidental Petroleum Corp. | | | 6,418 | | | | 111 | | |
ONEOK, Inc. | | | 3,403 | | | | 131 | | |
Phillips 66 | | | 3,345 | | | | 234 | | |
Pioneer Natural Resources Co. | | | 1,259 | | | | 143 | | |
Schlumberger Ltd. | | | 10,660 | | | | 233 | | |
TechnipFMC PLC | | | 3,235 | | | | 30 | | |
The Williams Cos., Inc. | | | 9,294 | | | | 186 | | |
Valero Energy Corp. | | | 3,123 | | | | 177 | | |
| | | | 5,526 | | |
Financials (10.3%): | |
Aflac, Inc. | | | 5,003 | | | | 222 | | |
American Express Co. | | | 4,995 | | | | 605 | | |
American International Group, Inc. | | | 6,598 | | | | 250 | | |
Ameriprise Financial, Inc. | | | 903 | | | | 175 | | |
Aon PLC, Class A | | | 1,751 | | | | 370 | | |
Arthur J. Gallagher & Co. | | | 1,473 | | | | 182 | | |
Assurant, Inc. | | | 454 | | | | 62 | | |
Bank of America Corp. | | | 58,298 | | | | 1,767 | | |
Berkshire Hathaway, Inc., Class B (a) | | | 14,903 | | | | 3,456 | | |
BlackRock, Inc., Class A | | | 1,086 | | | | 783 | | |
Capital One Financial Corp. | | | 3,503 | | | | 346 | | |
Cboe Global Markets, Inc. | | | 827 | | | | 77 | | |
Chubb Ltd. | | | 3,457 | | | | 531 | | |
Cincinnati Financial Corp. | | | 1,146 | | | | 100 | | |
Citigroup, Inc. | | | 15,944 | | | | 983 | | |
Citizens Financial Group, Inc. | | | 3,271 | | | | 117 | | |
CME Group, Inc. | | | 2,749 | | | | 500 | | |
Comerica, Inc. | | | 1,065 | | | | 59 | | |
Discover Financial Services | | | 2,347 | | | | 212 | | |
Everest Re Group Ltd. | | | 306 | | | | 72 | | |
Fifth Third Bancorp | | | 5,456 | | | | 150 | | |
First Republic Bank | | | 1,332 | | | | 196 | | |
See notes to financial statements.
33
Victory Portfolios
Victory S&P 500 Index Fund | | Schedule of Portfolio Investments — continued
December 31, 2020 | |
(Amounts in Thousands, Except for Shares) (Unaudited)
Security Description | | Shares | | Value | |
Franklin Resources, Inc. | | | 2,087 | | | $ | 52 | | |
Globe Life, Inc. | | | 737 | | | | 70 | | |
Huntington Bancshares, Inc. | | | 7,791 | | | | 98 | | |
Intercontinental Exchange, Inc. | | | 4,298 | | | | 496 | | |
Invesco Ltd. | | | 2,884 | | | | 50 | | |
JPMorgan Chase & Co. | | | 23,343 | | | | 2,965 | | |
KeyCorp | | | 7,478 | | | | 123 | | |
Lincoln National Corp. | | | 1,391 | | | | 70 | | |
Loews Corp. | | | 1,789 | | | | 81 | | |
M&T Bank Corp. | | | 982 | | | | 125 | | |
MarketAxess Holdings, Inc. | | | 291 | | | | 166 | | |
Marsh & McLennan Cos., Inc. | | | 3,884 | | | | 455 | | |
MetLife, Inc. | | | 5,858 | | | | 275 | | |
Moody's Corp. | | | 1,237 | | | | 359 | | |
Morgan Stanley | | | 10,945 | | | | 750 | | |
MSCI, Inc. | | | 635 | | | | 284 | | |
Nasdaq, Inc. | | | 879 | | | | 117 | | |
Northern Trust Corp. | | | 1,594 | | | | 148 | | |
People's United Financial, Inc. | | | 3,254 | | | | 42 | | |
Principal Financial Group, Inc. | | | 1,957 | | | | 97 | | |
Prudential Financial, Inc. | | | 3,033 | | | | 237 | | |
Raymond James Financial, Inc. | | | 933 | | | | 89 | | |
Regions Financial Corp. | | | 7,355 | | | | 119 | | |
S&P Global, Inc. | | | 1,843 | | | | 606 | | |
State Street Corp. | | | 2,702 | | | | 197 | | |
SVB Financial Group (a) | | | 397 | | | | 154 | | |
Synchrony Financial | | | 4,158 | | | | 144 | | |
T. Rowe Price Group, Inc. | | | 1,734 | | | | 263 | | |
The Allstate Corp. | | | 2,329 | | | | 256 | | |
The Bank of New York Mellon Corp. | | | 6,243 | | | | 265 | | |
The Charles Schwab Corp. | | | 11,423 | | | | 606 | | |
The Goldman Sachs Group, Inc. | | | 2,635 | | | | 695 | | |
The Hartford Financial Services Group, Inc. | | | 2,744 | | | | 134 | | |
The PNC Financial Services Group, Inc. | | | 3,245 | | | | 484 | | |
The Progressive Corp. | | | 4,485 | | | | 443 | | |
The Travelers Cos., Inc. | | | 1,940 | | | | 272 | | |
Truist Financial Corp. | | | 10,324 | | | | 495 | | |
U.S. Bancorp | | | 10,498 | | | | 489 | | |
Unum Group | | | 1,560 | | | | 36 | | |
W.R. Berkley Corp. | | | 1,078 | | | | 72 | | |
Wells Fargo & Co. | | | 31,662 | | | | 956 | | |
Willis Towers Watson PLC | | | 987 | | | | 208 | | |
Zions Bancorp NA | | | 1,256 | | | | 55 | | |
| | | | 25,313 | | |
Health Care (13.4%): | |
Abbott Laboratories | | | 13,573 | | | | 1,486 | | |
AbbVie, Inc. | | | 13,520 | | | | 1,449 | | |
ABIOMED, Inc. (a) | | | 346 | | | | 112 | | |
Agilent Technologies, Inc. | | | 2,343 | | | | 278 | | |
Alexion Pharmaceuticals, Inc. (a) | | | 1,676 | | | | 262 | | |
See notes to financial statements.
34
Victory Portfolios
Victory S&P 500 Index Fund | | Schedule of Portfolio Investments — continued
December 31, 2020 | |
(Amounts in Thousands, Except for Shares) (Unaudited)
Security Description | | Shares | | Value | |
Align Technology, Inc. (a) | | | 549 | | | $ | 293 | | |
AmerisourceBergen Corp. | | | 1,126 | | | | 110 | | |
Amgen, Inc. | | | 4,458 | | | | 1,025 | | |
Anthem, Inc. | | | 1,905 | | | | 612 | | |
Baxter International, Inc. | | | 3,912 | | | | 314 | | |
Becton, Dickinson & Co. | | | 2,221 | | | | 556 | | |
Biogen, Inc. (a) | | | 1,178 | | | | 288 | | |
Bio-Rad Laboratories, Inc., Class A (a) | | | 165 | | | | 96 | | |
Boston Scientific Corp. (a) | | | 10,966 | | | | 394 | | |
Bristol-Myers Squibb Co. | | | 17,305 | | | | 1,073 | | |
Cardinal Health, Inc. | | | 2,247 | | | | 120 | | |
Catalent, Inc. (a) | | | 1,261 | | | | 131 | | |
Centene Corp. (a) | | | 4,440 | | | | 267 | | |
Cerner Corp. | | | 2,348 | | | | 184 | | |
Cigna Corp. | | | 2,767 | | | | 576 | | |
CVS Health Corp. | | | 10,024 | | | | 685 | | |
Danaher Corp. | | | 4,842 | | | | 1,076 | | |
DaVita, Inc. (a) | | | 566 | | | | 66 | | |
DENTSPLY SIRONA, Inc. | | | 1,674 | | | | 88 | | |
DexCom, Inc. (a) | | | 735 | | | | 272 | | |
Edwards Lifesciences Corp. (a) | | | 4,773 | | | | 435 | | |
Eli Lilly & Co. | | | 6,080 | | | | 1,027 | | |
Gilead Sciences, Inc. | | | 9,600 | | | | 559 | | |
HCA Healthcare, Inc. | | | 2,021 | | | | 332 | | |
Henry Schein, Inc. (a) | | | 1,093 | | | | 73 | | |
Hologic, Inc. (a) | | | 1,968 | | | | 143 | | |
Humana, Inc. | | | 1,013 | | | | 416 | | |
IDEXX Laboratories, Inc. (a) | | | 653 | | | | 326 | | |
Illumina, Inc. (a) | | | 1,118 | | | | 414 | | |
Incyte Corp. (a) | | | 1,426 | | | | 124 | | |
Intuitive Surgical, Inc. (a) | | | 900 | | | | 736 | | |
IQVIA Holdings, Inc. (a) | | | 1,468 | | | | 263 | | |
Johnson & Johnson | | | 20,160 | | | | 3,173 | | |
Laboratory Corp. of America Holdings (a) | | | 746 | | | | 152 | | |
McKesson Corp. | | | 1,230 | | | | 214 | | |
Medtronic PLC | | | 10,308 | | | | 1,207 | | |
Merck & Co., Inc. | | | 19,375 | | | | 1,585 | | |
Mettler-Toledo International, Inc. (a) | | | 182 | | | | 207 | | |
PerkinElmer, Inc. | | | 858 | | | | 123 | | |
Perrigo Co. PLC | | | 1,045 | | | | 47 | | |
Pfizer, Inc. | | | 42,566 | | | | 1,567 | | |
Quest Diagnostics, Inc. | | | 1,032 | | | | 123 | | |
Regeneron Pharmaceuticals, Inc. (a) | | | 803 | | | | 388 | | |
ResMed, Inc. | | | 1,110 | | | | 236 | | |
STERIS PLC | | | 653 | | | | 124 | | |
Stryker Corp. | | | 2,504 | | | | 614 | | |
Teleflex, Inc. | | | 357 | | | | 147 | | |
The Cooper Cos., Inc. | | | 376 | | | | 137 | | |
Thermo Fisher Scientific, Inc. | | | 3,035 | | | | 1,413 | | |
UnitedHealth Group, Inc. | | | 7,266 | | | | 2,547 | | |
See notes to financial statements.
35
Victory Portfolios
Victory S&P 500 Index Fund | | Schedule of Portfolio Investments — continued
December 31, 2020 | |
(Amounts in Thousands, Except for Shares) (Unaudited)
Security Description | | Shares | | Value | |
Universal Health Services, Inc., Class B | | | 595 | | | $ | 82 | | |
Varian Medical Systems, Inc. (a) | | | 700 | | | | 123 | | |
Vertex Pharmaceuticals, Inc. (a) | | | 1,991 | | | | 471 | | |
Viatris, Inc. (a) | | | 9,239 | | | | 173 | | |
Waters Corp. (a) | | | 475 | | | | 118 | | |
West Pharmaceutical Services, Inc. | | | 566 | | | | 160 | | |
Zimmer Biomet Holdings, Inc. | | | 1,587 | | | | 245 | | |
Zoetis, Inc. | | | 3,640 | | | | 602 | | |
| | | | 32,639 | | |
Industrials (8.3%): | |
3M Co. | | | 4,417 | | | | 772 | | |
Alaska Air Group, Inc. | | | 947 | | | | 49 | | |
Allegion PLC | | | 705 | | | | 82 | | |
American Airlines Group, Inc. (b) | | | 4,677 | | | | 74 | | |
AMETEK, Inc. | | | 1,762 | | | | 213 | | |
AO Smith Corp. | | | 1,037 | | | | 57 | | |
C.H. Robinson Worldwide, Inc. | | | 1,041 | | | | 98 | | |
Carrier Global Corp. | | | 6,239 | | | | 235 | | |
Caterpillar, Inc. | | | 4,160 | | | | 756 | | |
Cintas Corp. | | | 673 | | | | 238 | | |
Copart, Inc. (a) | | | 1,591 | | | | 202 | | |
CSX Corp. | | | 5,857 | | | | 532 | | |
Cummins, Inc. | | | 1,133 | | | | 257 | | |
Deere & Co. | | | 2,400 | | | | 646 | | |
Delta Air Lines, Inc. | | | 4,884 | | | | 196 | | |
Dover Corp. | | | 1,104 | | | | 139 | | |
Eaton Corp. PLC | | | 3,052 | | | | 367 | | |
Emerson Electric Co. | | | 4,580 | | | | 368 | | |
Equifax, Inc. | | | 932 | | | | 180 | | |
Expeditors International of Washington, Inc. | | | 1,296 | | | | 123 | | |
Fastenal Co. | | | 4,396 | | | | 215 | | |
FedEx Corp. | | | 1,850 | | | | 480 | | |
Flowserve Corp. | | | 998 | | | | 37 | | |
Fortive Corp. | | | 2,582 | | | | 183 | | |
Fortune Brands Home & Security, Inc. | | | 1,064 | | | | 91 | | |
General Dynamics Corp. | | | 1,780 | | | | 265 | | |
General Electric Co. | | | 67,083 | | | | 724 | | |
Honeywell International, Inc. | | | 5,374 | | | | 1,144 | | |
Howmet Aerospace, Inc. (a) | | | 2,988 | | | | 85 | | |
Huntington Ingalls Industries, Inc. | | | 310 | | | | 53 | | |
IDEX Corp. | | | 580 | | | | 116 | | |
IHS Markit Ltd. | | | 2,854 | | | | 257 | | |
Illinois Tool Works, Inc. | | | 2,206 | | | | 450 | | |
Ingersoll Rand, Inc. (a) | | | 2,847 | | | | 130 | | |
J.B. Hunt Transport Services, Inc. | | | 639 | | | | 87 | | |
Jacobs Engineering Group, Inc. | | | 993 | | | | 108 | | |
Johnson Controls International PLC | | | 5,544 | | | | 258 | | |
Kansas City Southern | | | 717 | | | | 146 | | |
L3Harris Technologies, Inc. | | | 1,609 | | | | 304 | | |
Lockheed Martin Corp. | | | 1,885 | | | | 669 | | |
See notes to financial statements.
36
Victory Portfolios
Victory S&P 500 Index Fund | | Schedule of Portfolio Investments — continued
December 31, 2020 | |
(Amounts in Thousands, Except for Shares) (Unaudited)
Security Description | | Shares | | Value | |
Masco Corp. | | | 2,004 | | | $ | 110 | | |
Nielsen Holdings PLC | | | 2,734 | | | | 57 | | |
Norfolk Southern Corp. | | | 1,945 | | | | 462 | | |
Northrop Grumman Corp. | | | 1,187 | | | | 362 | | |
Old Dominion Freight Line, Inc. | | | 737 | | | | 144 | | |
Otis Worldwide Corp. | | | 3,118 | | | | 211 | | |
PACCAR, Inc. | | | 2,653 | | | | 229 | | |
Parker-Hannifin Corp. | | | 986 | | | | 269 | | |
Pentair PLC | | | 1,274 | | | | 68 | | |
Quanta Services, Inc. | | | 1,063 | | | | 77 | | |
Raytheon Technologies Corp. | | | 11,630 | | | | 832 | | |
Republic Services, Inc. | | | 1,611 | | | | 155 | | |
Robert Half International, Inc. | | | 873 | | | | 55 | | |
Rockwell Automation, Inc. | | | 890 | | | | 223 | | |
Rollins, Inc. | | | 1,694 | | | | 66 | | |
Roper Technologies, Inc. | | | 803 | | | | 346 | | |
Snap-on, Inc. | | | 415 | | | | 71 | | |
Southwest Airlines Co. | | | 4,520 | | | | 211 | | |
Stanley Black & Decker, Inc. | | | 1,227 | | | | 219 | | |
Teledyne Technologies, Inc. (a) | | | 282 | | | | 111 | | |
Textron, Inc. | | | 1,753 | | | | 85 | | |
The Boeing Co. | | | 4,064 | | | | 869 | | |
Trane Technologies PLC | | | 1,839 | | | | 267 | | |
TransDigm Group, Inc. (a) | | | 417 | | | | 258 | | |
Union Pacific Corp. | | | 5,161 | | | | 1,075 | | |
United Airlines Holdings, Inc. (a) | | | 2,241 | | | | 97 | | |
United Parcel Service, Inc., Class B | | | 5,477 | | | | 923 | | |
United Rentals, Inc. (a) | | | 552 | | | | 128 | | |
Verisk Analytics, Inc. | | | 1,245 | | | | 258 | | |
W.W. Grainger, Inc. | | | 345 | | | | 141 | | |
Waste Management, Inc. | | | 2,977 | | | | 352 | | |
Westinghouse Air Brake Technologies Corp. | | | 1,370 | | | | 100 | | |
Xylem, Inc. | | | 1,380 | | | | 140 | | |
| | | | 20,357 | | |
IT Services (5.5%): | |
Accenture PLC, Class A | | | 4,852 | | | | 1,267 | | |
Akamai Technologies, Inc. (a) | | | 1,247 | | | | 131 | | |
Automatic Data Processing, Inc. | | | 3,284 | | | | 579 | | |
Broadridge Financial Solutions, Inc. | | | 885 | | | | 136 | | |
Cognizant Technology Solutions Corp., Class A | | | 4,094 | | | | 336 | | |
DXC Technology Co. | | | 1,948 | | | | 50 | | |
Fidelity National Information Services, Inc. | | | 4,752 | | | | 672 | | |
Fiserv, Inc. (a) | | | 4,261 | | | | 485 | | |
FleetCor Technologies, Inc. (a) | | | 639 | | | | 174 | | |
Gartner, Inc. (a) | | | 684 | | | | 110 | | |
Global Payments, Inc. | | | 2,292 | | | | 494 | | |
International Business Machines Corp. | | | 6,824 | | | | 859 | | |
Jack Henry & Associates, Inc. | | | 584 | | | | 95 | | |
Leidos Holdings, Inc. | | | 1,025 | | | | 108 | | |
Mastercard, Inc., Class A | | | 6,737 | | | | 2,405 | | |
See notes to financial statements.
37
Victory Portfolios
Victory S&P 500 Index Fund | | Schedule of Portfolio Investments — continued
December 31, 2020 | |
(Amounts in Thousands, Except for Shares) (Unaudited)
Security Description | | Shares | | Value | |
Paychex, Inc. | | | 2,450 | | | $ | 228 | | |
PayPal Holdings, Inc. (a) | | | 8,973 | | | | 2,101 | | |
The Western Union Co. | | | 3,148 | | | | 69 | | |
VeriSign, Inc. (a) | | | 769 | | | | 166 | | |
Visa, Inc., Class A | | | 12,986 | | | | 2,840 | | |
| | | | 13,305 | | |
Materials (2.7%): | |
Air Products & Chemicals, Inc. | | | 1,693 | | | | 463 | | |
Albemarle Corp. | | | 815 | | | | 120 | | |
Amcor PLC | | | 12,011 | | | | 141 | | |
Avery Dennison Corp. | | | 639 | | | | 99 | | |
Ball Corp. | | | 2,505 | | | | 233 | | |
Celanese Corp. | | | 895 | | | | 116 | | |
CF Industries Holdings, Inc. | | | 1,638 | | | | 63 | | |
Corteva, Inc. | | | 5,705 | | | | 221 | | |
Dow, Inc. | | | 5,680 | | | | 315 | | |
DuPont de Nemours, Inc. (b) | | | 5,620 | | | | 400 | | |
Eastman Chemical Co. | | | 1,037 | | | | 104 | | |
Ecolab, Inc. | | | 1,902 | | | | 412 | | |
FMC Corp. | | | 994 | | | | 114 | | |
Freeport-McMoRan, Inc. | | | 11,126 | | | | 289 | | |
International Flavors & Fragrances, Inc. (b) | | | 819 | | | | 89 | | |
International Paper Co. | | | 3,010 | | | | 150 | | |
Linde PLC | | | 4,019 | | | | 1,060 | | |
LyondellBasell Industries NV, Class A | | | 1,969 | | | | 180 | | |
Martin Marietta Materials, Inc. | | | 477 | | | | 135 | | |
Newmont Corp. | | | 6,152 | | | | 369 | | |
Nucor Corp. | | | 2,312 | | | | 123 | | |
Packaging Corp. of America | | | 726 | | | | 100 | | |
PPG Industries, Inc. | | | 1,809 | | | | 261 | | |
Sealed Air Corp. | | | 1,188 | | | | 54 | | |
The Mosaic Co. | | | 2,642 | | | | 61 | | |
The Sherwin-Williams Co. | | | 626 | | | | 460 | | |
Vulcan Materials Co. | | | 1,015 | | | | 151 | | |
Westrock Co. | | | 2,011 | | | | 88 | | |
| | | | 6,371 | | |
Real Estate (2.4%): | |
Alexandria Real Estate Equities, Inc. | | | 948 | | | | 169 | | |
American Tower Corp. | | | 3,402 | | | | 763 | | |
AvalonBay Communities, Inc. | | | 1,069 | | | | 171 | | |
Boston Properties, Inc. | | | 1,085 | | | | 103 | | |
CBRE Group, Inc., Class A (a) | | | 2,569 | | | | 161 | | |
Crown Castle International Corp. | | | 3,303 | | | | 526 | | |
Digital Realty Trust, Inc. | | | 2,146 | | | | 299 | | |
Duke Realty Corp. | | | 2,848 | | | | 114 | | |
Equinix, Inc. | | | 682 | | | | 487 | | |
Equity Residential | | | 2,623 | | | | 155 | | |
Essex Property Trust, Inc. | | | 499 | | | | 118 | | |
Extra Space Storage, Inc. | | | 990 | | | | 115 | | |
See notes to financial statements.
38
Victory Portfolios
Victory S&P 500 Index Fund | | Schedule of Portfolio Investments — continued
December 31, 2020 | |
(Amounts in Thousands, Except for Shares) (Unaudited)
Security Description | | Shares | | Value | |
Federal Realty Investment Trust | | | 527 | | | $ | 45 | | |
Healthpeak Properties, Inc. | | | 4,123 | | | | 125 | | |
Host Hotels & Resorts, Inc. | | | 5,401 | | | | 79 | | |
Iron Mountain, Inc. (b) | | | 2,207 | | | | 65 | | |
Kimco Realty Corp. | | | 3,312 | | | | 50 | | |
Mid-America Apartment Communities, Inc. | | | 876 | | | | 111 | | |
Prologis, Inc. | | | 5,661 | | | | 564 | | |
Public Storage | | | 1,165 | | | | 269 | | |
Realty Income Corp. | | | 2,688 | | | | 167 | | |
Regency Centers Corp. | | | 1,208 | | | | 55 | | |
SBA Communications Corp. | | | 851 | | | | 240 | | |
Simon Property Group, Inc. | | | 2,511 | | | | 214 | | |
SL Green Realty Corp. | | | 556 | | | | 33 | | |
UDR, Inc. | | | 2,255 | | | | 87 | | |
Ventas, Inc. | | | 2,868 | | | | 141 | | |
Vornado Realty Trust | | | 1,201 | | | | 45 | | |
Welltower, Inc. | | | 3,196 | | | | 207 | | |
Weyerhaeuser Co. | | | 5,716 | | | | 192 | | |
| | | | 5,870 | | |
Semiconductors & Semiconductor Equipment (5.2%): | |
Advanced Micro Devices, Inc. (a) | | | 9,210 | | | | 845 | | |
Analog Devices, Inc. | | | 2,830 | | | | 418 | | |
Applied Materials, Inc. | | | 6,994 | | | | 604 | | |
Broadcom, Inc. | | | 3,098 | | | | 1,356 | | |
Intel Corp. | | | 31,383 | | | | 1,564 | | |
KLA Corp. | | | 1,183 | | | | 306 | | |
Lam Research Corp. | | | 1,103 | | | | 521 | | |
Maxim Integrated Products, Inc. | | | 2,047 | | | | 181 | | |
Microchip Technology, Inc. | | | 1,994 | | | | 275 | | |
Micron Technology, Inc. (a) | | | 8,525 | | | | 641 | | |
NVIDIA Corp. | | | 4,740 | | | | 2,476 | | |
Qorvo, Inc. (a) | | | 873 | | | | 145 | | |
QUALCOMM, Inc. | | | 8,661 | | | | 1,319 | | |
Skyworks Solutions, Inc. | | | 1,272 | | | | 194 | | |
Teradyne, Inc. | | | 1,272 | | | | 153 | | |
Texas Instruments, Inc. | | | 7,030 | | | | 1,154 | | |
Xilinx, Inc. | | | 1,877 | | | | 266 | | |
| | | | 12,418 | | |
Software (8.6%): | |
Adobe, Inc. (a) | | | 3,674 | | | | 1,838 | | |
ANSYS, Inc. (a) | | | 658 | | | | 239 | | |
Autodesk, Inc. (a) | | | 1,684 | | | | 514 | | |
Cadence Design Systems, Inc. (a) | | | 2,136 | | | | 291 | | |
Citrix Systems, Inc. | | | 943 | | | | 123 | | |
Fortinet, Inc. (a) | | | 1,032 | | | | 153 | | |
Intuit, Inc. | | | 2,012 | | | | 764 | | |
Microsoft Corp. | | | 57,899 | | | | 12,879 | | |
NortonLifeLock, Inc. | | | 4,533 | | | | 94 | | |
Oracle Corp. | | | 14,526 | | | | 940 | | |
See notes to financial statements.
39
Victory Portfolios
Victory S&P 500 Index Fund | | Schedule of Portfolio Investments — continued
December 31, 2020 | |
(Amounts in Thousands, Except for Shares) (Unaudited)
Security Description | | Shares | | Value | |
Paycom Software, Inc. (a) | | | 375 | | | $ | 170 | | |
salesforce.com, Inc. (a) | | | 7,007 | | | | 1,559 | | |
ServiceNow, Inc. (a) | | | 1,494 | | | | 822 | | |
Synopsys, Inc. (a) | | | 1,169 | | | | 303 | | |
Tyler Technologies, Inc. (a) | | | 309 | | | | 135 | | |
| | | | 20,824 | | |
Technology Hardware, Storage & Peripherals (7.0%): | |
Apple, Inc. | | | 122,388 | | | | 16,239 | | |
Hewlett Packard Enterprise Co. | | | 9,856 | | | | 117 | | |
HP, Inc. | | | 10,518 | | | | 259 | | |
NetApp, Inc. | | | 1,711 | | | | 113 | | |
Seagate Technology PLC | | | 1,712 | | | | 106 | | |
Western Digital Corp. | | | 2,330 | | | | 129 | | |
Xerox Holdings Corp. | | | 1,276 | | | | 30 | | |
| | | | 16,993 | | |
Utilities (2.7%): | |
Alliant Energy Corp. | | | 1,913 | | | | 99 | | |
Ameren Corp. | | | 1,893 | | | | 148 | | |
American Electric Power Co., Inc. | | | 3,801 | | | | 317 | | |
American Water Works Co., Inc. | | | 1,388 | | | | 213 | | |
Atmos Energy Corp. | | | 964 | | | | 92 | | |
CenterPoint Energy, Inc. | | | 4,172 | | | | 90 | | |
CMS Energy Corp. | | | 2,193 | | | | 134 | | |
Consolidated Edison, Inc. | | | 2,620 | | | | 189 | | |
Dominion Energy, Inc. | | | 6,248 | | | | 471 | | |
DTE Energy Co. | | | 1,482 | | | | 180 | | |
Duke Energy Corp. | | | 5,636 | | | | 516 | | |
Edison International | | | 2,899 | | | | 182 | | |
Entergy Corp. | | | 1,533 | | | | 153 | | |
Evergy, Inc. | | | 1,737 | | | | 96 | | |
Eversource Energy | | | 2,625 | | | | 227 | | |
Exelon Corp. | | | 7,471 | | | | 315 | | |
FirstEnergy Corp. | | | 4,155 | | | | 127 | | |
NextEra Energy, Inc. | | | 15,003 | | | | 1,158 | | |
NiSource, Inc. | | | 2,935 | | | | 67 | | |
NRG Energy, Inc. | | | 1,870 | | | | 70 | | |
Pinnacle West Capital Corp. | | | 862 | | | | 69 | | |
PPL Corp. | | | 5,888 | | | | 166 | | |
Public Service Enterprise Group, Inc. | | | 3,874 | | | | 226 | | |
Sempra Energy | | | 2,209 | | | | 281 | | |
The AES Corp. | | | 5,094 | | | | 120 | | |
The Southern Co. | | | 8,089 | | | | 497 | | |
WEC Energy Group, Inc. | | | 2,416 | | | | 222 | | |
Xcel Energy, Inc. | | | 4,024 | | | | 268 | | |
| | | | 6,693 | | |
Total Common Stocks (Cost $49,202) | | | 242,426 | | |
See notes to financial statements.
40
Victory Portfolios
Victory S&P 500 Index Fund | | Schedule of Portfolio Investments — continued
December 31, 2020 | |
(Amounts in Thousands, Except for Shares) (Unaudited)
Security Description | | Shares | | Value | |
Collateral for Securities Loaned^ (0.3%) | |
BlackRock Liquidity Funds TempFund Portfolio, Institutional Class, 0.08% (c) | | | 12,589 | | | $ | 13 | | |
Fidelity Investments Money Market Government Portfolio, Class I, 0.01% (c) | | | 432,521 | | | | 433 | | |
Goldman Sachs Financial Square Prime Obligations Fund, Institutional Class,
0.04% (c) | | | 6,283 | | | | 6 | | |
JPMorgan Prime Money Market Fund, Capital Class, 0.12% (c) | | | 50,097 | | | | 50 | | |
Morgan Stanley Institutional Liquidity Prime Portfolio, Institutional Class,
0.09% (c) | | | 225,244 | | | | 225 | | |
Total Collateral for Securities Loaned (Cost $727) | | | 727 | | |
Total Investments (Cost $49,929) — 99.6% | | | 243,153 | | |
Other assets in excess of liabilities — 0.4% | | | 871 | | |
NET ASSETS — 100.00% | | $ | 244,024 | | |
^ Purchased with cash collateral from securities on loan.
(a) Non-income producing security.
(b) All or a portion of this security is on loan.
(c) Rate disclosed is the daily yield on December 31, 2020.
PLC — Public Limited Company
Futures Contracts Purchased
(Amounts not in thousands)
| | | Number of
Contracts | | Expiration
Date | | Notional
Amount | | Value | | Unrealized
Appreciation/
(Depreciation) | |
E-Mini S&P 500 Futures | | | 8 | | | 3/19/21 | | $ | 1,466,232 | | | $ | 1,499,520 | | | $ | 33,288 | | |
| | | Total unrealized appreciation | | | | | | | | $ | 33,288 | | |
| | | Total unrealized depreciation | | | | | | | | | — | | |
| | | Total net unrealized appreciation (depreciation) | | | | | | | | $ | 33,288 | | |
See notes to financial statements.
41
Victory Portfolios
Victory Munder Mid-Cap Core Growth Fund | | Schedule of Portfolio Investments
December 31, 2020 | |
(Amounts in Thousands, Except for Shares) (Unaudited)
Security Description | | Shares | | Value | |
Common Stocks (99.1%) | |
Communication Services (2.0%): | |
Live Nation Entertainment, Inc. (a) | | | 89,544 | | | $ | 6,580 | | |
Take-Two Interactive Software, Inc. (a) | | | 23,600 | | | | 4,904 | | |
| | | | 11,484 | | |
Consumer Discretionary (15.1%): | |
AutoZone, Inc. (a) | | | 5,900 | | | | 6,994 | | |
Chipotle Mexican Grill, Inc. (a) | | | 6,000 | | | | 8,319 | | |
Choice Hotels International, Inc. | | | 40,700 | | | | 4,344 | | |
D.R. Horton, Inc. | | | 123,900 | | | | 8,539 | | |
Dollar General Corp. | | | 29,300 | | | | 6,162 | | |
Five Below, Inc. (a) | | | 27,700 | | | | 4,847 | | |
Lear Corp. | | | 48,000 | | | | 7,633 | | |
Lithia Motors, Inc., Class A | | | 21,800 | | | | 6,380 | | |
Lululemon Athletica, Inc. (a) | | | 21,300 | | | | 7,413 | | |
Marriott Vacations Worldwide Corp. | | | 40,421 | | | | 5,547 | | |
NVR, Inc. (a) | | | 1,800 | | | | 7,344 | | |
Penn National Gaming, Inc. (a) (b) | | | 86,600 | | | | 7,480 | | |
YETI Holdings, Inc. (a) | | | 101,200 | | | | 6,929 | | |
| | | | 87,931 | | |
Consumer Staples (1.8%): | |
Darling Ingredients, Inc. (a) | | | 85,600 | | | | 4,937 | | |
Monster Beverage Corp. (a) | | | 61,300 | | | | 5,669 | | |
| | | | 10,606 | | |
Financials (8.9%): | |
Ally Financial, Inc. | | | 260,300 | | | | 9,282 | | |
Brown & Brown, Inc. | | | 165,400 | | | | 7,842 | | |
East West Bancorp, Inc. | | | 59,200 | | | | 3,002 | | |
MarketAxess Holdings, Inc. | | | 9,800 | | | | 5,591 | | |
MSCI, Inc. | | | 24,500 | | | | 10,940 | | |
Radian Group, Inc. | | | 376,977 | | | | 7,634 | | |
Synchrony Financial | | | 239,000 | | | | 8,296 | | |
| | | | 52,587 | | |
Health Care (15.2%): | |
ABIOMED, Inc. (a) | | | 17,700 | | | | 5,738 | | |
Agilent Technologies, Inc. | | | 68,393 | | | | 8,104 | | |
BioCryst Pharmaceuticals, Inc. (a) (b) | | | 561,000 | | | | 4,179 | | |
Dynavax Technologies Corp. (a) (b) | | | 301,100 | | | | 1,340 | | |
Edwards Lifesciences Corp. (a) | | | 66,200 | | | | 6,039 | | |
Horizon Therapeutics PLC (a) | | | 60,000 | | | | 4,389 | | |
IDEXX Laboratories, Inc. (a) | | | 13,200 | | | | 6,598 | | |
Insulet Corp. (a) | | | 27,600 | | | | 7,056 | | |
IQVIA Holdings, Inc. (a) | | | 43,700 | | | | 7,830 | | |
NanoString Technologies, Inc. (a) | | | 122,800 | | | | 8,212 | | |
Neurocrine Biosciences, Inc. (a) | | | 27,700 | | | | 2,655 | | |
Teladoc Health, Inc. (a) (b) | | | 12,700 | | | | 2,539 | | |
Teleflex, Inc. | | | 18,000 | | | | 7,409 | | |
See notes to financial statements.
42
Victory Portfolios
Victory Munder Mid-Cap Core Growth Fund | | Schedule of Portfolio Investments — continued
December 31, 2020 | |
(Amounts in Thousands, Except for Shares) (Unaudited)
Security Description | | Shares | | Value | |
Veeva Systems, Inc., Class A (a) | | | 33,000 | | | $ | 8,985 | | |
Zoetis, Inc. | | | 44,230 | | | | 7,320 | | |
| | | | 88,393 | | |
Industrials (17.4%): | |
ADT, Inc. | | | 453,400 | | | | 3,559 | | |
AMETEK, Inc. | | | 58,718 | | | | 7,101 | | |
Chart Industries, Inc. (a) | | | 54,500 | | | | 6,420 | | |
Clean Harbors, Inc. (a) | | | 68,900 | | | | 5,243 | | |
Copa Holdings SA (b) | | | 67,000 | | | | 5,174 | | |
CSX Corp. | | | 76,900 | | | | 6,979 | | |
FedEx Corp. | | | 23,800 | | | | 6,179 | | |
Jacobs Engineering Group, Inc. | | | 22,200 | | | | 2,419 | | |
Kratos Defense & Security Solutions, Inc. (a) | | | 192,500 | | | | 5,280 | | |
L3Harris Technologies, Inc. | | | 36,501 | | | | 6,900 | | |
Old Dominion Freight Line, Inc. | | | 41,250 | | | | 8,051 | | |
Owens Corning, Inc. | | | 103,800 | | | | 7,864 | | |
The Middleby Corp. (a) | | | 49,000 | | | | 6,317 | | |
Trane Technologies PLC | | | 66,500 | | | | 9,653 | | |
Trex Co., Inc. (a) | | | 42,100 | | | | 3,525 | | |
WESCO International, Inc. (a) | | | 139,600 | | | | 10,959 | | |
| | | | 101,623 | | |
Information Technology (22.4%): | |
Advanced Micro Devices, Inc. (a) | | | 146,300 | | | | 13,417 | | |
Amphenol Corp., Class A | | | 64,110 | | | | 8,384 | | |
Atlassian Corp. PLC, Class A (a) | | | 13,300 | | | | 3,110 | | |
CDW Corp. | | | 53,059 | | | | 6,993 | | |
Concentrix Corp. (a) | | | 30,800 | | | | 3,040 | | |
Crowdstrike Holdings, Inc., Class A (a) | | | 29,200 | | | | 6,185 | | |
DocuSign, Inc. (a) | | | 11,700 | | | | 2,601 | | |
EPAM Systems, Inc. (a) | | | 31,900 | | | | 11,432 | | |
Fidelity National Information Services, Inc. | | | 25,944 | | | | 3,670 | | |
Fiserv, Inc. (a) | | | 57,600 | | | | 6,558 | | |
Global Payments, Inc. | | | 26,000 | | | | 5,601 | | |
GoDaddy, Inc., Class A (a) | | | 88,394 | | | | 7,332 | | |
KLA Corp. | | | 27,800 | | | | 7,198 | | |
Lumentum Holdings, Inc. (a) | | | 32,000 | | | | 3,034 | | |
Microchip Technology, Inc. | | | 49,487 | | | | 6,835 | | |
Mimecast Ltd. (a) | | | 52,300 | | | | 2,973 | | |
ServiceNow, Inc. (a) | | | 12,400 | | | | 6,825 | | |
SS&C Technologies Holdings, Inc. | | | 122,379 | | | | 8,903 | | |
SYNNEX Corp. | | | 30,800 | | | | 2,508 | | |
Synopsys, Inc. (a) | | | 37,600 | | | | 9,748 | | |
Zendesk, Inc. (a) | | | 30,900 | | | | 4,422 | | |
| | | | 130,769 | | |
Materials (8.5%): | |
Ball Corp. | | | 86,459 | | | | 8,056 | | |
Cleveland-Cliffs, Inc. (b) | | | 607,200 | | | | 8,841 | | |
FMC Corp. | | | 50,732 | | | | 5,831 | | |
See notes to financial statements.
43
Victory Portfolios
Victory Munder Mid-Cap Core Growth Fund | | Schedule of Portfolio Investments — continued
December 31, 2020 | |
(Amounts in Thousands, Except for Shares) (Unaudited)
Security Description | | Shares | | Value | |
Franco-Nevada Corp. (b) | | | 33,400 | | | $ | 4,186 | | |
Freeport-McMoRan, Inc. | | | 354,800 | | | | 9,232 | | |
Louisiana-Pacific Corp. | | | 195,500 | | | | 7,267 | | |
The Scotts Miracle-Gro Co. | | | 33,200 | | | | 6,611 | | |
| | | | 50,024 | | |
Real Estate (5.1%): | |
CyrusOne, Inc. | | | 94,200 | | | | 6,891 | | |
Digital Realty Trust, Inc. | | | 61,346 | | | | 8,559 | | |
SBA Communications Corp. | | | 28,003 | | | | 7,900 | | |
Sun Communities, Inc. | | | 43,616 | | | | 6,627 | | |
| | | | 29,977 | | |
Utilities (2.7%): | |
Atmos Energy Corp. | | | 33,100 | | | | 3,159 | | |
Pinnacle West Capital Corp. | | | 40,800 | | | | 3,262 | | |
Sempra Energy | | | 41,239 | | | | 5,254 | | |
Southwest Gas Holdings, Inc. | | | 60,500 | | | | 3,675 | | |
| | | | 15,350 | | |
Total Common Stocks (Cost $366,698) | | | 578,744 | | |
Exchange-Traded Funds (1.0%) | |
SPDR S&P MidCap 400 ETF | | | 14,200 | | | | 5,963 | | |
Total Exchange-Traded Funds (Cost $5,482) | | | 5,963 | | |
Collateral for Securities Loaned^ (3.8%) | |
BlackRock Liquidity Funds TempFund Portfolio, Institutional Class, 0.08% (c) | | | 387,157 | | | | 387 | | |
Fidelity Investments Money Market Government Portfolio, Class I, 0.01% (c) | | | 13,301,122 | | | | 13,301 | | |
Goldman Sachs Financial Square Prime Obligations Fund, Institutional Class,
0.04% (c) | | | 193,211 | | | | 193 | | |
JPMorgan Prime Money Market Fund, Capital Class, 0.12% (c) | | | 1,540,602 | | | | 1,541 | | |
Morgan Stanley Institutional Liquidity Prime Portfolio, Institutional Class,
0.09% (c) | | | 6,926,846 | | | | 6,927 | | |
Total Collateral for Securities Loaned (Cost $22,349) | | | 22,349 | | |
Total Investments (Cost $394,529) — 103.9% | | | 607,056 | | |
Liabilities in excess of other assets — (3.9)% | | | (22,749 | ) | |
NET ASSETS — 100.00% | | $ | 584,307 | | |
^ Purchased with cash collateral from securities on loan.
(a) Non-income producing security.
(b) All or a portion of this security is on loan.
(c) Rate disclosed is the daily yield on December 31, 2020.
ETF — Exchange-Traded Fund
PLC — Public Limited Company
See notes to financial statements.
44
Victory Portfolios
Victory Munder Small Cap Growth Fund | | Schedule of Portfolio Investments
December 31, 2020 | |
(Amounts in Thousands, Except for Shares) (Unaudited)
Security Description | | Shares | | Value | |
Common Stocks (97.9%) | |
Biotechnology (22.1%): | |
4D Molecular Therapeutics, Inc. (a) | | | 662 | | | $ | 27 | | |
ADC Therapeutics SA (a) | | | 1,091 | | | | 35 | | |
Akero Therapeutics, Inc. (a) | | | 1,608 | | | | 41 | | |
Akouos, Inc. (a) | | | 663 | | | | 13 | | |
Annexon, Inc. (a) | | | 439 | | | | 11 | | |
Aprea Therapeutics, Inc. (a) | | | 867 | | | | 4 | | |
Arrowhead Pharmaceuticals, Inc. (a) | | | 1,813 | | | | 139 | | |
Athenex, Inc. (a) | | | 1,662 | | | | 18 | | |
Atreca, Inc., Class A (a) (b) | | | 1,590 | | | | 26 | | |
Aurinia Pharmaceuticals, Inc. (a) (b) | | | 6,904 | | | | 95 | | |
Avidity Biosciences, Inc. (a) | | | 1,205 | | | | 31 | | |
Beam Therapeutics, Inc. (a) | | | 1,499 | | | | 122 | | |
Bicycle Therapeutics PLC, ADR (a) | | | 5,276 | | | | 95 | | |
BioAtla, Inc. (a) | | | 665 | | | | 23 | | |
BioCryst Pharmaceuticals, Inc. (a) (b) | | | 11,342 | | | | 84 | | |
BioMarin Pharmaceutical, Inc. (a) | | | 283 | | | | 25 | | |
Black Diamond Therapeutics, Inc. (a) | | | 437 | | | | 14 | | |
C4 Therapeutics, Inc. (a) (b) | | | 249 | | | | 8 | | |
Cabaletta Bio, Inc. (a) (b) | | | 2,967 | | | | 37 | | |
Cara Therapeutics, Inc. (a) | | | 1,428 | | | | 22 | | |
Castle Biosciences, Inc. (a) | | | 2,000 | | | | 134 | | |
Codiak Biosciences, Inc. (a) (b) | | | 6,305 | | | | 205 | | |
Cortexyme, Inc. (a) | | | 409 | | | | 11 | | |
CRISPR Therapeutics AG (a) | | | 410 | | | | 63 | | |
Deciphera Pharmaceuticals, Inc. (a) | | | 708 | | | | 40 | | |
Dicerna Pharmaceuticals, Inc. (a) | | | 2,168 | | | | 48 | | |
Dynavax Technologies Corp. (a) (b) | | | 6,261 | | | | 28 | | |
Esperion Therapeutics, Inc. (a) (b) | | | 873 | | | | 23 | | |
Fusion Pharmaceuticals, Inc. (a) | | | 4,261 | | | | 50 | | |
Gamida Cell Ltd. (a) | | | 9,195 | | | | 77 | | |
Generation Bio Co. (a) (b) | | | 1,180 | | | | 33 | | |
Genetron Holdings Ltd., ADR (a) | | | 5,361 | | | | 75 | | |
IGM Biosciences, Inc. (a) (b) | | | 796 | | | | 70 | | |
Intellia Therapeutics, Inc. (a) (b) | | | 1,924 | | | | 105 | | |
Iovance Biotherapeutics, Inc. (a) | | | 2,461 | | | | 114 | | |
Natera, Inc. (a) | | | 2,234 | | | | 223 | | |
Neurocrine Biosciences, Inc. (a) | | | 336 | | | | 32 | | |
Novavax, Inc. (a) (b) | | | 473 | | | | 53 | | |
Nurix Therapeutics, Inc. (a) (b) | | | 439 | | | | 14 | | |
Orchard Therapeutics PLC, ADR (a) | | | 6,720 | | | | 29 | | |
Oyster Point Pharma, Inc. (a) | | | 396 | | | | 7 | | |
Passage Bio, Inc. (a) (b) | | | 1,346 | | | | 34 | | |
Relay Therapeutics, Inc. (a) | | | 44 | | | | 2 | | |
Stoke Therapeutics, Inc. (a) (b) | | | 1,486 | | | | 92 | | |
Sutro Biopharma, Inc. (a) | | | 3,661 | | | | 79 | | |
TCR2 Therapeutics, Inc. (a) | | | 8,824 | | | | 274 | | |
TG Therapeutics, Inc. (a) | | | 2,119 | | | | 110 | | |
Veracyte, Inc. (a) | | | 3,428 | | | | 169 | | |
See notes to financial statements.
45
Victory Portfolios
Victory Munder Small Cap Growth Fund | | Schedule of Portfolio Investments — continued
December 31, 2020 | |
(Amounts in Thousands, Except for Shares) (Unaudited)
Security Description | | Shares | | Value | |
Viking Therapeutics, Inc. (a) (b) | | | 5,623 | | | $ | 32 | | |
Xencor, Inc. (a) | | | 822 | | | | 36 | | |
Zai Lab Ltd., ADR (a) | | | 984 | | | | 133 | | |
| | | | 3,265 | | |
Communication Services (2.1%): | |
Iridium Communications, Inc. (a) | | | 2,861 | | | | 113 | | |
Vonage Holdings Corp. (a) | | | 15,601 | | | | 200 | | |
| | | | 313 | | |
Consumer Discretionary (12.7%): | |
Academy Sports & Outdoors, Inc. (a) (b) | | | 7,777 | | | | 161 | | |
Afya Ltd., Class A (a) | | | 4,565 | | | | 115 | | |
Burlington Stores, Inc. (a) | | | 509 | | | | 133 | | |
Cavco Industries, Inc. (a) | | | 567 | | | | 99 | | |
Chegg, Inc. (a) | | | 1,378 | | | | 124 | | |
Chewy, Inc., Class A (a) (b) | | | 1,303 | | | | 117 | | |
Five Below, Inc. (a) | | | 1,001 | | | | 175 | | |
Group 1 Automotive, Inc. | | | 1,287 | | | | 169 | | |
Legacy Housing Corp. (a) | | | 5,799 | | | | 88 | | |
Levi Strauss & Co., Class A | | | 6,726 | | | | 135 | | |
Marine Products Corp. | | | 3,094 | | | | 45 | | |
Nordstrom, Inc. | | | 4,923 | | | | 154 | | |
Polaris, Inc. | | | 1,361 | | | | 130 | | |
Skyline Champion Corp. (a) | | | 4,307 | | | | 133 | | |
Tractor Supply Co. | | | 724 | | | | 102 | | |
| | | | 1,880 | | |
Consumer Staples (2.4%): | |
Albertsons Cos., Inc., Class A (b) | | | 4,314 | | | | 76 | | |
Grocery Outlet Holding Corp. (a) | | | 2,063 | | | | 81 | | |
Performance Food Group Co. (a) | | | 4,200 | | | | 200 | | |
| | | | 357 | | |
Energy (0.8%): | |
Magnolia Oil & Gas Corp., Class A (a) (b) | | | 3,428 | | | | 24 | | |
Parsley Energy, Inc., Class A | | | 4,363 | | | | 62 | | |
Talos Energy, Inc. (a) | | | 3,132 | | | | 26 | | |
| | | | 112 | | |
Financials (8.8%): | |
Amerant Bancorp, Inc. (a) | | | 4,402 | | | | 67 | | |
American Business Bank (a) | | | 1,502 | | | | 48 | | |
Coastal Financial Corp. (a) | | | 8,400 | | | | 177 | | |
Colony Bankcorp, Inc. | | | 2,215 | | | | 32 | | |
Customers Bancorp, Inc., Class A (a) | | | 3,942 | | | | 72 | | |
First Western Financial, Inc. (a) | | | 6,683 | | | | 131 | | |
Lemonade, Inc. (a) (b) | | | 109 | | | | 13 | | |
Morningstar, Inc. | | | 668 | | | | 154 | | |
Radian Group, Inc. | | | 5,519 | | | | 112 | | |
Silvercrest Asset Management Group, Inc., Class A | | | 3,935 | | | | 55 | | |
SLM Corp. | | | 5,481 | | | | 68 | | |
See notes to financial statements.
46
Victory Portfolios
Victory Munder Small Cap Growth Fund | | Schedule of Portfolio Investments — continued
December 31, 2020 | |
(Amounts in Thousands, Except for Shares) (Unaudited)
Security Description | | Shares | | Value | |
South Plains Financial, Inc. | | | 5,120 | | | $ | 97 | | |
Tradeweb Markets, Inc., Class A | | | 2,436 | | | | 152 | | |
WTB Financial Corp., Class B | | | 360 | | | | 120 | | |
| | | | 1,298 | | |
Health Care Equipment & Supplies (5.8%): | |
Brainsway Ltd., ADR (a) (b) | | | 11,679 | | | | 89 | | |
Cerus Corp. (a) | | | 6,712 | | | | 46 | | |
Inari Medical, Inc. (a) | | | 42 | | | | 4 | | |
Insulet Corp. (a) | | | 546 | | | | 139 | | |
Merit Medical Systems, Inc. (a) | | | 1,525 | | | | 85 | | |
Nuvectra Corp. (a) (c) (d) | | | 2,334 | | | | — | | |
Outset Medical, Inc. (a) | | | 180 | | | | 10 | | |
PolyPid Ltd. (a) (b) | | | 7,333 | | | | 73 | | |
Pulmonx Corp. (a) | | | 1,906 | | | | 132 | | |
SI-BONE, Inc. (a) | | | 3,500 | | | | 105 | | |
Silk Road Medical, Inc. (a) | | | 2,804 | | | | 176 | | |
| | | | 859 | | |
Health Care Providers & Services (1.3%): | |
Guardant Health, Inc. (a) | | | 1,011 | | | | 130 | | |
RadNet, Inc. (a) | | | 3,159 | | | | 62 | | |
| | | | 192 | | |
Health Care Technology (0.1%): | |
American Well Corp., Class A (a) (b) | | | 26 | | | | 1 | | |
Schrodinger, Inc. (a) | | | 217 | | | | 17 | | |
| | | | 18 | | |
Industrials (11.1%): | |
ASGN, Inc. (a) | | | 1,743 | | | | 146 | | |
BWX Technologies, Inc. | | | 1,070 | | | | 64 | | |
Casella Waste Systems, Inc. (a) | | | 2,586 | | | | 161 | | |
Chart Industries, Inc. (a) | | | 1,114 | | | | 131 | | |
Comfort Systems USA, Inc. | | | 2,713 | | | | 143 | | |
Construction Partners, Inc., Class A (a) | | | 1,877 | | | | 55 | | |
ESCO Technologies, Inc. | | | 571 | | | | 59 | | |
Hydrofarm Holdings Group, Inc. (a) | | | 981 | | | | 52 | | |
Kaman Corp. | | | 1,610 | | | | 92 | | |
Kratos Defense & Security Solutions, Inc. (a) | | | 6,093 | | | | 168 | | |
Marten Transport Ltd. | | | 4,300 | | | | 74 | | |
McGrath RentCorp | | | 1,035 | | | | 69 | | |
Owens Corning, Inc. | | | 1,289 | | | | 98 | | |
Parsons Corp. (a) | | | 3,000 | | | | 109 | | |
PGT Innovations, Inc. (a) | | | 3,825 | | | | 78 | | |
Rexnord Corp. | | | 1,529 | | | | 60 | | |
The AZEK Co., Inc. (a) | | | 2,561 | | | | 98 | | |
| | | | 1,657 | | |
Information Technology (21.5%): | |
908 Devices, Inc. (a) (b) | | | 482 | | | | 27 | | |
Alteryx, Inc., Class A (a) | | | 441 | | | | 54 | | |
See notes to financial statements.
47
Victory Portfolios
Victory Munder Small Cap Growth Fund | | Schedule of Portfolio Investments — continued
December 31, 2020 | |
(Amounts in Thousands, Except for Shares) (Unaudited)
Security Description | | Shares | | Value | |
Blackline, Inc. (a) | | | 540 | | | $ | 72 | | |
Brooks Automation, Inc. | | | 1,901 | | | | 129 | | |
C3.ai, Inc., Class A (a) (b) | | | 327 | | | | 45 | | |
Cambium Networks Corp. (a) | | | 4,868 | | | | 122 | | |
Cloudflare, Inc., Class A (a) | | | 1,467 | | | | 111 | | |
Dropbox, Inc., Class A (a) | | | 1,247 | | | | 28 | | |
Elastic NV (a) | | | 1,342 | | | | 196 | | |
Endava PLC, ADR (a) | | | 1,434 | | | | 110 | | |
EPAM Systems, Inc. (a) | | | 305 | | | | 109 | | |
Globant SA (a) | | | 753 | | | | 164 | | |
Lumentum Holdings, Inc. (a) | | | 792 | | | | 75 | | |
Marvell Technology Group Ltd. | | | 1,167 | | | | 55 | | |
Napco Security Technologies, Inc. (a) | | | 6,551 | | | | 172 | | |
New Relic, Inc. (a) | | | 422 | | | | 28 | | |
ON Semiconductor Corp. (a) | | | 5,499 | | | | 180 | | |
OneSpan, Inc. (a) | | | 6,297 | | | | 130 | | |
PagerDuty, Inc. (a) | | | 3,709 | | | | 155 | | |
Ping Identity Holding Corp. (a) | | | 3,255 | | | | 93 | | |
Powerfleet, Inc. (a) | | | 9,414 | | | | 70 | | |
QAD, Inc., Class A (b) | | | 1,749 | | | | 111 | | |
RealPage, Inc. (a) | | | 1,156 | | | | 101 | | |
Sapiens International Corp. NV | | | 3,065 | | | | 94 | | |
SiTime Corp. (a) | | | 459 | | | | 51 | | |
Smartsheet, Inc., Class A (a) | | | 2,908 | | | | 202 | | |
Sumo Logic, Inc. (a) | | | 62 | | | | 2 | | |
Telos Corp. (a) | | | 1,641 | | | | 54 | | |
WNS Holdings Ltd., ADR (a) | | | 2,735 | | | | 197 | | |
Yext, Inc. (a) | | | 4,806 | | | | 76 | | |
Zix Corp. (a) | | | 23,117 | | | | 199 | | |
| | | | 3,212 | | |
Life Sciences Tools & Services (4.1%): | |
Adaptive Biotechnologies Corp. (a) | | | 1,407 | | | | 83 | | |
Berkeley Lights, Inc. (a) (b) | | | 609 | | | | 54 | | |
Maravai LifeSciences Holdings, Inc., Class A (a) (b) | | | 6,479 | | | | 182 | | |
NanoString Technologies, Inc. (a) | | | 4,359 | | | | 292 | | |
| | | | 611 | | |
Materials (0.9%): | |
Summit Materials, Inc., Class A (a) | | | 6,383 | | | | 128 | | |
Pharmaceuticals (1.5%): | |
Assembly Biosciences, Inc. (a) | | | 1,626 | | | | 10 | | |
Collegium Pharmaceutical, Inc. (a) (b) | | | 1,187 | | | | 24 | | |
Cymabay Therapeutics, Inc. (a) | | | 1,278 | | | | 7 | | |
Horizon Therapeutics PLC (a) | | | 987 | | | | 72 | | |
PMV Pharmaceuticals, Inc. (a) | | | 280 | | | | 17 | | |
Reata Pharmaceuticals, Inc., Class A (a) (b) | | | 645 | | | | 80 | | |
Vaxcyte, Inc. (a) | | | 129 | | | | 3 | | |
| | | | 213 | | |
See notes to financial statements.
48
Victory Portfolios
Victory Munder Small Cap Growth Fund | | Schedule of Portfolio Investments — continued
December 31, 2020 | |
(Amounts in Thousands, Except for Shares) (Unaudited)
Security Description | | Shares | | Value | |
Real Estate (2.7%): | |
FirstService Corp. | | | 868 | | | $ | 119 | | |
Rexford Industrial Realty, Inc. | | | 1,252 | | | | 61 | | |
The Macerich Co. (b) | | | 11,499 | | | | 123 | | |
UMH Properties, Inc. | | | 6,434 | | | | 95 | | |
| | | | 398 | | |
Total Common Stocks (Cost $9,145) | | | 14,513 | | |
Warrants (0.1%) | |
Health Care (0.1%): | |
BioNano Genomics, Inc. (a) (c) | | | 8,136 | | | | 16 | | |
Total Warrants (Cost $—) | | | 16 | | |
Collateral for Securities Loaned^ (12.9%) | |
BlackRock Liquidity Funds TempFund Portfolio, Institutional Class, 0.08% (e) | | | 33,023 | | | | 33 | | |
Fidelity Investments Money Market Government Portfolio I Shares, 0.01% (e) | | | 1,134,529 | | | | 1,135 | | |
Goldman Sachs Financial Square Prime Obligations Fund, Institutional Class,
0.04% (e) | | | 16,480 | | | | 16 | | |
JPMorgan Prime Money Market Fund, Capital Class, 0.12% (e) | | | 131,407 | | | | 131 | | |
Morgan Stanley Institutional Liquidity Prime Portfolio, Institutional Class,
0.09% (e) | | | 590,831 | | | | 591 | | |
Total Collateral for Securities Loaned (Cost $1,906) | | | 1,906 | | |
Total Investments (Cost $11,051) — 110.9% | | | 16,435 | | |
Liabilities in excess of other assets — (10.9)% | | | (1,609 | ) | |
NET ASSETS — 100.00% | | $ | 14,826 | | |
^ Purchased with cash collateral from securities on loan.
(a) Non-income producing security.
(b) All or a portion of this security is on loan.
(c) The Fund's Adviser has deemed this security to be illiquid based upon procedures approved by the Board of Trustees. As of December 31, 2020, illiquid securities were 0.1% of the Fund's net assets.
(d) Security was fair valued based upon procedures approved by the Board of Trustees and represents 0.0% of the Fund's net assets as of December 31, 2020. This security is classified as Level 3 within the fair value hierarchy. (See Note 2)
(e) Rate disclosed is the daily yield on December 31, 2020.
ADR — American Depositary Receipt
PLC — Public Limited Company
See notes to financial statements.
49
Victory Portfolios
Victory Trivalent Emerging Markets Small-Cap Fund | | Schedule of Portfolio Investments
December 31, 2020 | |
(Amounts in Thousands, Except for Shares) (Unaudited)
Security Description | | Shares | | Value | |
Common Stocks (96.8%) | |
Brazil (5.3%): | |
Consumer Discretionary (1.3%): | |
Afya Ltd., Class A (a) | | | 2,020 | | | $ | 51 | | |
MRV Engenharia e Participacoes SA | | | 22,900 | | | | 84 | | |
| | | | 135 | | |
Consumer Staples (0.6%): | |
SLC Agricola SA | | | 13,000 | | | | 69 | | |
Financials (1.0%): | |
Banco do Estado do Rio Grande do Sul SA, Preference Shares | | | 17,800 | | | | 50 | | |
Porto Seguro SA | | | 5,600 | | | | 53 | | |
| | | | 103 | | |
Industrials (1.3%): | |
Randon SA Implementos e Participacoes, Preference Shares | | | 27,800 | | | | 87 | | |
SIMPAR SA | | | 8,251 | | | | 56 | | |
| | | | 143 | | |
Utilities (1.1%): | |
Cia de Saneamento do Parana | | | 11,400 | | | | 57 | | |
Omega Geracao SA (a) | | | 7,500 | | | | 59 | | |
| | | | 116 | | |
| | | | 566 | | |
China (7.1%): | |
Consumer Discretionary (1.3%): | |
China New Higher Education Group Ltd. (b) | | | 95,000 | | | | 59 | | |
Tianneng Power International Ltd. (c) | | | 34,000 | | | | 82 | | |
| | | | 141 | | |
Consumer Staples (0.7%): | |
China Modern Dairy Holdings Ltd. (a) (c) | | | 293,000 | | | | 70 | | |
Industrials (1.9%): | |
Airtac International Group | | | 2,000 | | | | 64 | | |
China Lesso Group Holdings Ltd. | | | 56,000 | | | | 88 | | |
Zhejiang Expressway Co. Ltd., Class H | | | 64,000 | | | | 54 | | |
| | | | 206 | | |
Information Technology (1.6%): | |
Chinasoft International Ltd. | | | 100,000 | | | | 112 | | |
JinkoSolar Holding Co., ADR (a) (c) | | | 872 | | | | 54 | | |
| | | | 166 | | |
Real Estate (1.2%): | |
China SCE Group Holdings Ltd. | | | 204,000 | | | | 84 | | |
Times Neighborhood Holdings Ltd. | | | 45,798 | | | | 43 | | |
| | | | 127 | | |
See notes to financial statements.
50
Victory Portfolios
Victory Trivalent Emerging Markets Small-Cap Fund | | Schedule of Portfolio Investments — continued
December 31, 2020 | |
(Amounts in Thousands, Except for Shares) (Unaudited)
Security Description | | Shares | | Value | |
Utilities (0.4%): | |
China Tian Lun Gas Holdings Ltd. | | | 50,000 | | | $ | 48 | | |
| | | | 758 | | |
Cyprus (0.7%): | |
Financials (0.7%): | |
TCS Group Holding PLC, GDR | | | 2,313 | | | | 76 | | |
Egypt (0.6%): | |
Communication Services (0.6%): | |
Telecom Egypt Co. | | | 80,279 | | | | 61 | | |
Greece (1.7%): | |
Financials (0.7%): | |
National Bank of Greece SA (a) | | | 28,249 | | | | 77 | | |
Utilities (1.0%): | |
Terna Energy SA | | | 6,586 | | | | 106 | | |
| | | | 183 | | |
Hong Kong (5.1%): | |
Communication Services (0.5%): | |
NetDragon Websoft Holdings Ltd. | | | 22,500 | | | | 51 | | |
Financials (0.4%): | |
Far East Horizon Ltd. | | | 46,000 | | | | 47 | | |
Health Care (0.5%): | |
The United Laboratories International Holdings Ltd. | | | 74,000 | | | | 53 | | |
Industrials (0.6%): | |
Sinotruk Hong Kong Ltd. | | | 27,500 | | | | 70 | | |
Materials (1.3%): | |
China Resources Cement Holdings Ltd. | | | 58,000 | | | | 65 | | |
Nine Dragons Paper Holdings Ltd. | | | 53,000 | | | | 75 | | |
| | | | 140 | | |
Real Estate (0.9%): | |
China Overseas Grand Oceans Group Ltd. | | | 177,000 | | | | 95 | | |
Utilities (0.9%): | |
Canvest Environmental Protection Group Co. Ltd. | | | 108,000 | | | | 46 | | |
China Water Affairs Group Ltd. (c) | | | 64,000 | | | | 50 | | |
| | | | 96 | | |
| | | | 552 | | |
Hungary (0.7%): | |
Health Care (0.7%): | |
Richter Gedeon Nyrt | | | 3,104 | | | | 78 | | |
India (13.6%): | |
Communication Services (0.8%): | |
Tata Communications Ltd. | | | 5,721 | | | | 86 | | |
See notes to financial statements.
51
Victory Portfolios
Victory Trivalent Emerging Markets Small-Cap Fund | | Schedule of Portfolio Investments — continued
December 31, 2020 | |
(Amounts in Thousands, Except for Shares) (Unaudited)
Security Description | | Shares | | Value | |
Consumer Discretionary (1.0%): | |
Apollo Tyres Ltd. | | | 20,331 | | | $ | 50 | | |
Crompton Greaves Consumer Electricals Ltd. | | | 10,947 | | | | 57 | | |
| | | | 107 | | |
Consumer Staples (0.6%): | |
Kaveri Seed Co. Ltd. | | | 9,159 | | | | 65 | | |
Energy (0.5%): | |
Hindustan Petroleum Corp. Ltd. | | | 19,025 | | | | 57 | | |
Financials (2.2%): | |
LIC Housing Finance Ltd. | | | 14,129 | | | | 70 | | |
Muthoot Finance Ltd. | | | 6,367 | | | | 106 | | |
Power Finance Corp. Ltd. | | | 40,835 | | | | 64 | | |
| | | | 240 | | |
Health Care (2.3%): | |
Alembic Pharmaceuticals Ltd. | | | 6,300 | | | | 89 | | |
Granules India Ltd. | | | 16,343 | | | | 79 | | |
Ipca Laboratories Ltd. | | | 2,447 | | | | 73 | | |
| | | | 241 | | |
Industrials (1.7%): | |
Bharat Electronics Ltd. | | | 33,129 | | | | 55 | | |
Engineers India Ltd. | | | 34,783 | | | | 37 | | |
Escorts Ltd. | | | 5,410 | | | | 93 | | |
| | | | 185 | | |
Information Technology (1.3%): | |
eClerx Services Ltd. | | | 5,306 | | | | 64 | | |
Mphasis Ltd. | | | 3,389 | | | | 72 | | |
| | | | 136 | | |
Materials (2.0%): | |
Birla Corp. Ltd. | | | 6,154 | | | | 61 | | |
Coromandel International Ltd. | | | 6,033 | | | | 68 | | |
HeidelbergCement India Ltd. | | | 27,428 | | | | 85 | | |
| | | | 214 | | |
Utilities (1.2%): | |
CESC Ltd. | | | 5,377 | | | | 45 | | |
Gujarat Gas Ltd. | | | 16,445 | | | | 85 | | |
| | | | 130 | | |
| | | | 1,461 | | |
Indonesia (0.7%): | |
Communication Services (0.7%): | |
PT Media Nusantara Citra Tbk (a) | | | 900,200 | | | | 73 | | |
See notes to financial statements.
52
Victory Portfolios
Victory Trivalent Emerging Markets Small-Cap Fund | | Schedule of Portfolio Investments — continued
December 31, 2020 | |
(Amounts in Thousands, Except for Shares) (Unaudited)
Security Description | | Shares | | Value | |
Korea, Republic Of (18.9%): | |
Communication Services (1.7%): | |
AfreecaTV Co. Ltd. | | | 1,112 | | | $ | 62 | | |
Echo Marketing, Inc. | | | 2,316 | | | | 64 | | |
Neowiz (a) | | | 2,509 | | | | 52 | | |
| | | | 178 | | |
Consumer Discretionary (3.0%): | |
Coway Co. Ltd. (a) | | | 802 | | | | 54 | | |
Danawa Co. Ltd. (a) | | | 1,804 | | | | 51 | | |
GS Home Shopping, Inc. | | | 399 | | | | 51 | | |
S&T Motiv Co. Ltd. | | | 1,330 | | | | 60 | | |
SL Corp. | | | 3,928 | | | | 59 | | |
Youngone Corp. | | | 1,740 | | | | 51 | | |
| | | | 326 | | |
Consumer Staples (1.3%): | |
Hite Jinro Co. Ltd. (a) | | | 1,458 | | | | 43 | | |
Maeil Dairies Co. Ltd. | | | 1,425 | | | | 92 | | |
| | | | 135 | | |
Financials (1.4%): | |
DB Insurance Co. Ltd. | | | 1,340 | | | | 54 | | |
KIWOOM Securities Co. Ltd. | | | 837 | | | | 98 | | |
| | | | 152 | | |
Health Care (3.0%): | |
Chong Kun Dang Pharmaceutical Corp. (a) | | | 626 | | | | 131 | | |
Dongkook Pharmaceutical Co. Ltd. (a) | | | 2,305 | | | | 62 | | |
Osstem Implant Co. Ltd. (a) | | | 1,236 | | | | 58 | | |
Seegene, Inc. | | | 394 | | | | 70 | | |
| | | | 321 | | |
Industrials (2.1%): | |
Daelim Industrial Co. Ltd. (d) (f) | | | 1,013 | | | | 78 | | |
Hyundai Glovis Co. Ltd. | | | 426 | | | | 73 | | |
Samsung Engineering Co. Ltd. (a) | | | 6,318 | | | | 77 | | |
| | | | 228 | | |
Information Technology (4.2%): | |
Douzone Bizon Co. Ltd. | | | 1,175 | | | | 112 | | |
NHN KCP Corp. (a) | | | 2,019 | | | | 127 | | |
Partron Co. Ltd. | | | 5,863 | | | | 61 | | |
SFA Engineering Corp. (a) | | | 2,099 | | | | 75 | | |
Silicon Works Co. Ltd. (a) | | | 1,437 | | | | 77 | | |
| | | | 452 | | |
Materials (2.2%): | |
Korea Petrochemical Ind Co. Ltd. | | | 604 | | | | 128 | | |
Soulbrain Co. Ltd. (a) | | | 429 | | | | 108 | | |
| | | | 236 | | |
| | | | 2,028 | | |
See notes to financial statements.
53
Victory Portfolios
Victory Trivalent Emerging Markets Small-Cap Fund | | Schedule of Portfolio Investments — continued
December 31, 2020 | |
(Amounts in Thousands, Except for Shares) (Unaudited)
Security Description | | Shares | | Value | |
Malaysia (4.8%): | |
Communication Services (0.8%): | |
TIME dotCom Bhd | | | 24,700 | | | $ | 82 | | |
Energy (0.6%): | |
Serba Dinamik Holdings Bhd | | | 135,260 | | | | 59 | | |
Health Care (0.6%): | |
Supermax Corp. Bhd (a) | | | 43,444 | | | | 65 | | |
Information Technology (1.2%): | |
V.S. Industry Bhd | | | 199,400 | | | | 129 | | |
Materials (0.5%): | |
Scientex Bhd | | | 18,200 | | | | 58 | | |
Real Estate (0.6%): | |
Eco World Development Group Bhd (a) | | | 536,700 | | | | 66 | | |
Utilities (0.5%): | |
Mega First Corp. Bhd | | | 33,300 | | | | 57 | | |
| | | | 516 | | |
Mexico (3.8%): | |
Consumer Staples (0.6%): | |
La Comer SAB de CV | | | 28,441 | | | | 65 | | |
Energy (0.5%): | |
Vista Oil & Gas SAB de CV, ADR (a) | | | 19,153 | | | | 49 | | |
Financials (0.5%): | |
Banco del Bajio SA (a) (b) | | | 35,401 | | | | 49 | | |
Health Care (0.5%): | |
Genomma Lab Internacional SAB de CV, Class B (a) | | | 53,911 | | | | 51 | | |
Materials (1.1%): | |
Grupo Cementos de Chihuahua SAB de CV | | | 20,438 | | | | 123 | | |
Real Estate (0.6%): | |
Prologis Property Mexico SA de CV | | | 29,019 | | | | 65 | | |
| | | | 402 | | |
Pakistan (0.5%): | |
Energy (0.5%): | |
Oil & Gas Development Co. Ltd. | | | 81,803 | | | | 53 | | |
Poland (0.5%): | |
Communication Services (0.5%): | |
TEN Square Games SA | | | 355 | | | | 53 | | |
Qatar (0.6%): | |
Energy (0.6%): | |
Qatar Gas Transport Co. Ltd. | | | 73,094 | | | | 64 | | |
Russian Federation (1.4%): | |
Financials (0.5%): | |
Moscow Exchange MICEX PJSC | | | 24,310 | | | | 53 | | |
See notes to financial statements.
54
Victory Portfolios
Victory Trivalent Emerging Markets Small-Cap Fund | | Schedule of Portfolio Investments — continued
December 31, 2020 | |
(Amounts in Thousands, Except for Shares) (Unaudited)
Security Description | | Shares | | Value | |
Materials (0.9%): | |
Polymetal International PLC | | | 4,438 | | | $ | 102 | | |
| | | | 155 | | |
Saudi Arabia (0.5%): | |
Health Care (0.5%): | |
Mouwasat Medical Services Co. | | | 1,467 | | | | 54 | | |
South Africa (5.0%): | |
Consumer Discretionary (0.5%): | |
Mr. Price Group Ltd. | | | 4,446 | | | | 52 | | |
Energy (0.5%): | |
Exxaro Resources Ltd. | | | 6,266 | | | | 60 | | |
Industrials (0.6%): | |
Barloworld Ltd. | | | 10,381 | | | | 64 | | |
Materials (2.8%): | |
African Rainbow Minerals Ltd. | | | 8,413 | | | | 150 | | |
Impala Platinum Holdings Ltd. | | | 10,853 | | | | 149 | | |
| | | | 299 | | |
Real Estate (0.6%): | |
Redefine Properties Ltd. (a) | | | 265,884 | | | | 61 | | |
| | | | 536 | | |
Taiwan (18.9%): | |
Communication Services (0.8%): | |
International Games System Co. Ltd. | | | 3,000 | | | | 81 | | |
Consumer Discretionary (3.3%): | |
Gourmet Master Co. Ltd. | | | 15,000 | | | | 75 | | |
Makalot Industrial Co. Ltd. | | | 8,000 | | | | 55 | | |
Merida Industry Co. Ltd. | | | 14,000 | | | | 118 | | |
Nien Made Enterprise Co. Ltd. | | | 4,000 | | | | 46 | | |
Poya International Co. Ltd. | | | 3,000 | | | | 62 | | |
| | | | 356 | | |
Financials (0.8%): | |
King's Town Bank Co. Ltd. | | | 58,000 | | | | 80 | | |
Health Care (0.6%): | |
Ginko International Co. Ltd. | | | 13,000 | | | | 68 | | |
Industrials (2.4%): | |
Chicony Power Technology Co. Ltd. | | | 30,000 | | | | 76 | | |
Evergreen Marine Corp. Ltd. (a) | | | 91,000 | | | | 132 | | |
Kung Long Batteries Industrial Co. Ltd. | | | 10,000 | | | | 50 | | |
| | | | 258 | | |
Information Technology (10.4%): | |
AU Optronics Corp. (a) | | | 115,000 | | | | 58 | | |
Chipbond Technology Corp. | | | 47,000 | | | | 111 | | |
Elan Microelectronics Corp. | | | 24,200 | | | | 115 | | |
Gigabyte Technology Co. Ltd. | | | 23,000 | | | | 64 | | |
See notes to financial statements.
55
Victory Portfolios
Victory Trivalent Emerging Markets Small-Cap Fund | | Schedule of Portfolio Investments — continued
December 31, 2020 | |
(Amounts in Thousands, Except for Shares) (Unaudited)
Security Description | | Shares | | Value | |
Lite-On Technology Corp. | | | 38,000 | | | $ | 68 | | |
Macronix International | | | 35,000 | | | | 53 | | |
Parade Technologies Ltd. | | | 2,000 | | | | 79 | | |
Radiant Opto-Electronics Corp. | | | 26,000 | | | | 106 | | |
Simplo Technology Co. Ltd. | | | 7,000 | | | | 87 | | |
Sinbon Electronics Co. Ltd. | | | 16,000 | | | | 123 | | |
Tripod Technology Corp. | | | 22,000 | | | | 93 | | |
Unimicron Technology Corp. | | | 30,000 | | | | 94 | | |
Wistron Corp. | | | 60,000 | | | | 66 | | |
| | | | 1,117 | | |
Real Estate (0.6%): | |
Chong Hong Construction Co. Ltd. | | | 24,000 | | | | 68 | | |
| | | | 2,028 | | |
Thailand (2.1%): | |
Consumer Discretionary (0.5%): | |
Sri Trang Agro-Industry PCL | | | 57,200 | | | | 51 | | |
Financials (0.5%): | |
Thanachart Capital PCL | | | 52,500 | | | | 60 | | |
Information Technology (0.5%): | |
Hana Microelectronics PCL, Class R | | | 38,400 | | | | 51 | | |
Real Estate (0.6%): | |
Origin Property PCL | | | 257,000 | | | | 65 | | |
| | | | 227 | | |
Turkey (3.0%): | |
Consumer Discretionary (0.9%): | |
Arcelik A/S (a) | | | 24,488 | | | | 100 | | |
Consumer Staples (1.0%): | |
Coca-Cola Icecek A/S | | | 12,424 | | | | 110 | | |
Industrials (0.4%): | |
Tekfen Holding A/S | | | 16,250 | | | | 36 | | |
Turkiye Sise ve Cam Fabrikalari A/S | | | 1 | | | | — | (e) | |
| | | | 36 | | |
Utilities (0.7%): | |
Enerjisa Enerji A/S (b) | | | 41,872 | | | | 71 | | |
| | | | 317 | | |
United Arab Emirates (0.7%): | |
Industrials (0.7%): | |
Aramex PJSC | | | 62,604 | | | | 75 | | |
United States (0.6%): | |
Industrials (0.6%): | |
Bizlink Holding, Inc. | | | 7,000 | | | | 61 | | |
Total Common Stocks (Cost $7,989) | | | 10,377 | | |
See notes to financial statements.
56
Victory Portfolios
Victory Trivalent Emerging Markets Small-Cap Fund | | Schedule of Portfolio Investments — continued
December 31, 2020 | |
(Amounts in Thousands, Except for Shares) (Unaudited)
Security Description | | Shares | | Value | |
Rights (0.0%) (g) | |
Taiwan (0.0%): | |
Information Technology (0.0%): | |
Simplo Technology Co. Ltd. , Expires 3/26/21 (a) (d) (h) | | | 241 | | | $ | — | | |
Total Rights (Cost $—) | | | — | | |
Exchange-Traded Funds (2.5%) | |
United States (2.5%): | |
iShares MSCI Emerging Markets Small-Cap ETF (c) | | | 5,057 | | | | 267 | | |
Total Exchange-Traded Funds (Cost $219) | | | 267 | | |
Collateral for Securities Loaned^ (3.9%) | |
United States (3.9%): | |
BlackRock Liquidity Funds TempFund Portfolio, Institutional Class, 0.08% (i) | | | 7,321 | | | | 7 | | |
Fidelity Investments Money Market Government Portfolio, Class I, 0.01% (i) | | | 251,519 | | | | 252 | | |
Goldman Sachs Financial Square Prime Obligations Fund, Institutional Class,
0.04% (i) | | | 3,654 | | | | 4 | | |
JPMorgan Prime Money Market Fund, Capital Class, 0.12% (i) | | | 29,132 | | | | 29 | | |
Morgan Stanley Institutional Liquidity Prime Portfolio, Institutional Class, 0.09% (i) | | | 130,984 | | | | 131 | | |
Total Collateral for Securities Loaned (Cost $423) | | | 423 | | |
Total Investments (Cost $8,631) — 103.2% | | | 11,067 | | |
Liabilities in excess of other assets — (3.2)% | | | (347 | ) | |
NET ASSETS — 100.00% | | $ | 10,720 | | |
^ Purchased with cash collateral from securities on loan.
(a) Non-income producing security.
(b) Rule 144A security or other security that is restricted as to resale to institutional investors. The Fund's Adviser has deemed this security to be liquid based upon procedures approved by the Board of Trustees. As of December 31, 2020, the fair value of these securities was $179 (thousands) and amounted to 1.7% of net assets.
(c) All or a portion of this security is on loan.
(d) The Fund's Adviser has deemed this security to be illiquid based upon procedures approved by the Board of Trustees. As of December 31, 2020, illiquid securities were 0.7% of the Fund's net assets.
(e) Rounds to less than $1 thousand.
(f) Security was fair valued based upon procedures approved by the Board of Trustees and represents 0.7% of the Fund's net assets as of December 31, 2020. (See Note 2)
(g) Amount represents less than 0.05% of net assets.
(h) Security was fair valued based upon procedures approved by the Board of Trustees and represents 0.0% of the Fund's net assets as of December 31, 2020. This security is classified as Level 3 within the fair value hierarchy. (See Note 2)
(i) Rate disclosed is the daily yield on December 31, 2020.
ADR — American Depositary Receipt
ETF — Exchange-Traded Fund
GDR — Global Depositary Receipt
PCL — Public Company Limited
PLC — Public Limited Company
See notes to financial statements.
57
Victory Portfolios
Victory Trivalent International Fund-Core Equity | | Schedule of Portfolio Investments
December 31, 2020 | |
(Amounts in Thousands, Except for Shares) (Unaudited)
Security Description | | Shares | | Value | |
Common Stocks (97.7%) | |
Australia (3.9%): | |
Consumer Discretionary (0.3%): | |
Aristocrat Leisure Ltd. | | | 24,815 | | | $ | 596 | | |
Energy (0.5%): | |
Beach Energy Ltd. | | | 780,695 | | | | 1,089 | | |
Financials (0.9%): | |
Australia & New Zealand Banking Group Ltd. | | | 48,957 | | | | 859 | | |
Macquarie Group Ltd. | | | 8,445 | | | | 901 | | |
| | | | 1,760 | | |
Health Care (0.3%): | |
Sonic Healthcare Ltd. | | | 25,522 | | | | 632 | | |
Materials (1.2%): | |
Rio Tinto Ltd. | | | 26,457 | | | | 2,326 | | |
Real Estate (0.7%): | |
Charter Hall Group | | | 70,254 | | | | 798 | | |
Stockland | | | 196,363 | | | | 634 | | |
| | | | 1,432 | | |
| | | | 7,835 | | |
Austria (0.2%): | |
Financials (0.2%): | |
Raiffeisen Bank International AG (a) | | | 21,162 | | | | 430 | | |
Belgium (1.2%): | |
Consumer Staples (0.4%): | |
Anheuser-Busch InBev SA/NV | | | 12,323 | | | | 860 | | |
Financials (0.3%): | |
KBC Group NV (a) | | | 7,946 | | | | 556 | | |
Health Care (0.5%): | |
UCB SA | | | 9,343 | | | | 965 | | |
| | | | 2,381 | | |
Brazil (1.2%): | |
Energy (0.6%): | |
Petroleo Brasileiro SA, Preference Shares | | | 205,700 | | | | 1,117 | | |
Financials (0.6%): | |
Banco Santander Brasil SA | | | 147,200 | | | | 1,278 | | |
| | | | 2,395 | | |
Canada (4.7%): | |
Consumer Staples (0.4%): | |
Maple Leaf Foods, Inc. | | | 36,315 | | | | 805 | | |
See notes to financial statements.
58
Victory Portfolios
Victory Trivalent International Fund-Core Equity | | Schedule of Portfolio Investments — continued
December 31, 2020 | |
(Amounts in Thousands, Except for Shares) (Unaudited)
Security Description | | Shares | | Value | |
Energy (0.7%): | |
Parex Resources, Inc. (a) | | | 68,158 | | | $ | 938 | | |
Suncor Energy, Inc. | | | 28,434 | | | | 477 | | |
| | | | 1,415 | | |
Financials (2.3%): | |
Bank of Montreal | | | 11,274 | | | | 857 | | |
iA Financial Corp., Inc. | | | 17,870 | | | | 775 | | |
IGM Financial, Inc. (b) | | | 30,118 | | | | 817 | | |
National Bank of Canada (b) | | | 19,884 | | | | 1,119 | | |
Sun Life Financial, Inc. | | | 24,527 | | | | 1,091 | | |
| | | | 4,659 | | |
Industrials (0.6%): | |
Canadian Pacific Railway Ltd. | | | 3,822 | | | | 1,326 | | |
Materials (0.7%): | |
Barrick Gold Corp. | | | 30,815 | | | | 702 | | |
First Quantum Minerals Ltd. (b) | | | 39,157 | | | | 703 | | |
| | | | 1,405 | | |
| | | | 9,610 | | |
China (8.7%): | |
Communication Services (2.9%): | |
Baidu, Inc., ADR (a) | | | 4,957 | | | | 1,072 | | |
NetEase, Inc., ADR | | | 7,876 | | | | 754 | | |
Tencent Holdings Ltd. | | | 55,000 | | | | 3,958 | | |
| | | | 5,784 | | |
Consumer Discretionary (3.1%): | |
Alibaba Group Holding Ltd., ADR (a) | | | 18,690 | | | | 4,350 | | |
BYD Co. Ltd., Class H | | | 24,000 | | | | 632 | | |
JD.com, Inc., ADR (a) | | | 6,481 | | | | 569 | | |
Yum China Holdings, Inc. | | | 11,757 | | | | 671 | | |
| | | | 6,222 | | |
Consumer Staples (0.2%): | |
Tingyi Cayman Islands Holding Corp. | | | 300,000 | | | | 513 | | |
Financials (1.2%): | |
Bank of China Ltd., Class H | | | 2,382,275 | | | | 806 | | |
Huatai Securities Co. Ltd., Class H (c) | | | 488,800 | | | | 770 | | |
New China Life Insurance Co. Ltd., Class H | | | 215,800 | | | | 842 | | |
| | | | 2,418 | | |
Industrials (0.3%): | |
China Railway Group Ltd., Class H | | | 1,284,000 | | | | 567 | | |
Materials (0.7%): | |
Anhui Conch Cement Co. Ltd., Class H | | | 229,500 | | | | 1,438 | | |
Real Estate (0.3%): | |
Agile Group Holdings Ltd. | | | 526,000 | | | | 700 | | |
| | | | 17,642 | | |
See notes to financial statements.
59
Victory Portfolios
Victory Trivalent International Fund-Core Equity | | Schedule of Portfolio Investments — continued
December 31, 2020 | |
(Amounts in Thousands, Except for Shares) (Unaudited)
Security Description | | Shares | | Value | |
Denmark (2.6%): | |
Consumer Discretionary (0.3%): | |
Pandora A/S | | | 5,419 | | | $ | 607 | | |
Consumer Staples (0.5%): | |
Carlsberg A/S, Class B | | | 6,389 | | | | 1,024 | | |
Health Care (0.6%): | |
Genmab A/S (a) | �� | | 1,424 | | | | 577 | | |
GN Store Nord A/S | | | 8,802 | | | | 702 | | |
| | | | 1,279 | | |
Industrials (0.5%): | |
AP Moller — Maersk A/S, Class B | | | 456 | | | | 1,015 | | |
Utilities (0.7%): | |
Orsted A/S (c) | | | 6,531 | | | | 1,337 | | |
| | | | 5,262 | | |
Finland (0.5%): | |
Industrials (0.5%): | |
Metso Outotec Oyj | | | 93,525 | | | | 940 | | |
France (6.1%): | |
Communication Services (0.8%): | |
Publicis Groupe SA | | | 17,668 | | | | 878 | | |
Vivendi SA | | | 22,481 | | | | 725 | | |
| | | | 1,603 | | |
Consumer Discretionary (0.8%): | |
LVMH Moet Hennessy Louis Vuitton SE | | | 2,516 | | | | 1,575 | | |
Energy (0.6%): | |
TOTAL SE (b) | | | 28,181 | | | | 1,216 | | |
Financials (0.9%): | |
Amundi SA (c) | | | 6,559 | | | | 535 | | |
AXA SA | | | 17,657 | | | | 423 | | |
BNP Paribas SA (a) | | | 18,208 | | | | 961 | | |
| | | | 1,919 | | |
Health Care (0.6%): | |
Sanofi | | | 6,248 | | | | 605 | | |
Sartorius Stedim Biotech | | | 1,857 | | | | 662 | | |
| | | | 1,267 | | |
Industrials (1.0%): | |
Alstom SA (a) | | | 9,357 | | | | 533 | | |
Cie de Saint-Gobain (a) | | | 18,676 | | | | 859 | | |
Teleperformance | | | 2,190 | | | | 727 | | |
| | | | 2,119 | | |
See notes to financial statements.
60
Victory Portfolios
Victory Trivalent International Fund-Core Equity | | Schedule of Portfolio Investments — continued
December 31, 2020 | |
(Amounts in Thousands, Except for Shares) (Unaudited)
Security Description | | Shares | | Value | |
Information Technology (0.9%): | |
Capgemini SE | | | 6,296 | | | $ | 979 | | |
Worldline SA (a) (c) | | | 7,685 | | | | 747 | | |
| | | | 1,726 | | |
Materials (0.3%): | |
Arkema SA | | | 4,745 | | | | 543 | | |
Utilities (0.2%): | |
Rubis SCA | | | 8,341 | | | | 385 | | |
| | | | 12,353 | | |
Germany (6.6%): | |
Communication Services (0.7%): | |
Deutsche Telekom AG | | | 73,562 | | | | 1,343 | | |
Consumer Discretionary (1.1%): | |
HelloFresh SE (a) (b) | | | 8,037 | | | | 622 | | |
Volkswagen AG, Preference Shares | | | 8,980 | | | | 1,678 | | |
| | | | 2,300 | | |
Financials (1.1%): | |
Allianz SE | | | 4,810 | | | | 1,182 | | |
Hannover Rueck SE | | | 3,064 | | | | 488 | | |
Muenchener Rueckversicherungs-Gesellschaft AG, Class R | | | 1,839 | | | | 546 | | |
| | | | 2,216 | | |
Health Care (0.6%): | |
Fresenius Medical Care AG & Co. KGaA | | | 7,198 | | | | 600 | | |
Merck KGaA | | | 4,130 | | | | 708 | | |
| | | | 1,308 | | |
Industrials (1.0%): | |
Deutsche Post AG, Registered Shares | | | 25,923 | | | | 1,284 | | |
Siemens AG, Registered Shares | | | 5,286 | | | | 761 | | |
| | | | 2,045 | | |
Information Technology (0.7%): | |
SAP SE | | | 4,840 | | | | 627 | | |
TeamViewer AG (a) (c) | | | 13,171 | | | | 707 | | |
| | | | 1,334 | | |
Materials (0.2%): | |
HeidelbergCement AG | | | 5,916 | | | | 440 | | |
Real Estate (0.7%): | |
alstria office REIT-AG | | | 27,512 | | | | 501 | | |
LEG Immobilien AG | | | 5,372 | | | | 833 | | |
| | | | 1,334 | | |
Utilities (0.5%): | |
E.ON SE | | | 89,200 | | | | 988 | | |
| | | | 13,308 | | |
See notes to financial statements.
61
Victory Portfolios
Victory Trivalent International Fund-Core Equity | | Schedule of Portfolio Investments — continued
December 31, 2020 | |
(Amounts in Thousands, Except for Shares) (Unaudited)
Security Description | | Shares | | Value | |
Hong Kong (2.3%): | |
Consumer Staples (0.3%): | |
WH Group Ltd. (c) | | | 824,000 | | | $ | 691 | | |
Energy (0.4%): | |
Kunlun Energy Co. Ltd. | | | 826,000 | | | | 716 | | |
Financials (0.3%): | |
BOC Hong Kong Holdings Ltd. | | | 203,500 | | | | 617 | | |
Information Technology (0.7%): | |
Lenovo Group Ltd. (b) | | | 1,572,000 | | | | 1,486 | | |
Real Estate (0.4%): | |
CK Asset Holdings Ltd. | | | 67,895 | | | | 348 | | |
New World Development Co. Ltd. | | | 100,840 | | | | 469 | | |
| | | | 817 | | |
Utilities (0.2%): | |
China Water Affairs Group Ltd. | | | 546,000 | | | | 427 | | |
| | | | 4,754 | | |
Hungary (0.5%): | |
Financials (0.5%): | |
OTP Bank Nyrt (a) | | | 21,008 | | | | 948 | | |
India (2.8%): | |
Energy (0.5%): | |
Reliance Industries Ltd. | | | 39,199 | | | | 1,067 | | |
Financials (0.7%): | |
LIC Housing Finance Ltd. | | | 134,932 | | | | 668 | | |
Muthoot Finance Ltd. | | | 42,998 | | | | 713 | | |
| | | | 1,381 | | |
Health Care (0.7%): | |
Ipca Laboratories Ltd. | | | 46,143 | | | | 1,382 | | |
Information Technology (0.6%): | |
HCL Technologies Ltd. | | | 90,351 | | | | 1,173 | | |
Utilities (0.3%): | |
Power Grid Corp. of India Ltd. | | | 222,154 | | | | 577 | | |
| | | | 5,580 | | |
Indonesia (0.4%): | |
Communication Services (0.4%): | |
PT Sarana Menara Nusantara Tbk | | | 11,375,000 | | | | 778 | | |
Ireland (0.9%): | |
Health Care (0.6%): | |
ICON PLC (a) | | | 6,523 | | | | 1,272 | | |
Industrials (0.3%): | |
DCC PLC | | | 8,469 | | | | 599 | | |
| | | | 1,871 | | |
See notes to financial statements.
62
Victory Portfolios
Victory Trivalent International Fund-Core Equity | | Schedule of Portfolio Investments — continued
December 31, 2020 | |
(Amounts in Thousands, Except for Shares) (Unaudited)
Security Description | | Shares | | Value | |
Italy (1.4%): | |
Industrials (0.3%): | |
Leonardo SpA | | | 72,198 | | | $ | 522 | | |
Utilities (1.1%): | |
ACEA SpA | | | 30,357 | | | | 637 | | |
Enel SpA | | | 157,268 | | | | 1,600 | | |
| | | | 2,237 | | |
| | | | 2,759 | | |
Japan (15.8%): | |
Communication Services (1.9%): | |
Capcom Co. Ltd. | | | 10,300 | | | | 668 | | |
KDDI Corp. | | | 31,200 | | | | 925 | | |
Nintendo Co. Ltd. | | | 2,000 | | | | 1,284 | | |
Nippon Telegraph & Telephone Corp. | | | 39,500 | | | | 1,014 | | |
| | | | 3,891 | | |
Consumer Discretionary (3.2%): | |
Nitori Holdings Co. Ltd. | | | 2,500 | | | | 523 | | |
Sony Corp. | | | 37,100 | | | | 3,739 | | |
Toyo Tire Corp. | | | 36,100 | | | | 549 | | |
Toyota Motor Corp. | | | 22,100 | | | | 1,706 | | |
| | | | 6,517 | | |
Consumer Staples (0.7%): | |
Seven & i Holdings Co. Ltd. | | | 15,600 | | | | 553 | | |
Toyo Suisan Kaisha Ltd. | | | 18,600 | | | | 905 | | |
| | | | 1,458 | | |
Financials (1.8%): | |
Mizuho Financial Group, Inc. | | | 69,410 | | | | 881 | | |
Nomura Holdings, Inc. | | | 109,100 | | | | 577 | | |
ORIX Corp. | | | 72,500 | | | | 1,115 | | |
Sumitomo Mitsui Financial Group, Inc. | | | 18,925 | | | | 587 | | |
Sumitomo Mitsui Trust Holdings, Inc. | | | 12,900 | | | | 398 | | |
| | | | 3,558 | | |
Health Care (1.0%): | |
Astellas Pharma, Inc. | | | 44,200 | | | | 684 | | |
Ono Pharmaceutical Co. Ltd. | | | 26,500 | | | | 799 | | |
Shionogi & Co. Ltd. | | | 8,900 | | | | 487 | | |
| | | | 1,970 | | |
Industrials (2.7%): | |
ITOCHU Corp. | | | 66,000 | | | | 1,898 | | |
Mitsubishi Electric Corp. | | | 45,200 | | | | 683 | | |
Mitsui & Co. Ltd. | | | 40,300 | | | | 739 | | |
Obayashi Corp. | | | 54,600 | | | | 472 | | |
Secom Co. Ltd. | | | 6,900 | | | | 637 | | |
See notes to financial statements.
63
Victory Portfolios
Victory Trivalent International Fund-Core Equity | | Schedule of Portfolio Investments — continued
December 31, 2020 | |
(Amounts in Thousands, Except for Shares) (Unaudited)
Security Description | | Shares | | Value | |
Taisei Corp. | | | 15,000 | | | $ | 518 | | |
Yamato Holdings Co. Ltd. | | | 19,600 | | | | 500 | | |
| | | | 5,447 | | |
Information Technology (2.7%): | |
Anritsu Corp. | | | 25,000 | | | | 558 | | |
Fujitsu Ltd. | | | 7,100 | | | | 1,026 | | |
Hitachi Ltd. | | | 17,700 | | | | 699 | | |
Murata Manufacturing Co. Ltd. | | | 15,400 | | | | 1,394 | | |
Obic Co. Ltd. | | | 3,900 | | | | 784 | | |
Tokyo Electron Ltd. | | | 2,800 | | | | 1,046 | | |
| | | | 5,507 | | |
Materials (0.9%): | |
Rengo Co. Ltd. | | | 59,100 | | | | 496 | | |
Shin-Etsu Chemical Co. Ltd. | | | 4,400 | | | | 772 | | |
Tosoh Corp. | | | 34,100 | | | | 533 | | |
| | | | 1,801 | | |
Real Estate (0.6%): | |
Daiwa House Industry Co. Ltd. | | | 19,600 | | | | 583 | | |
Open House Co. Ltd. | | | 14,600 | | | | 537 | | |
| | | | 1,120 | | |
Utilities (0.3%): | |
Osaka Gas Co. Ltd. | | | 31,300 | | | | 642 | | |
| | | | 31,911 | | |
Jersey (0.3%): | |
Consumer Discretionary (0.3%): | |
boohoo Group PLC (a) | | | 140,199 | | | | 658 | | |
Korea, Republic Of (4.2%): | |
Consumer Discretionary (0.6%): | |
LG Electronics, Inc. | | | 9,891 | | | | 1,232 | | |
Consumer Staples (0.6%): | |
Hite Jinro Co. Ltd. (a) | | | 18,609 | | | | 547 | | |
Orion Corp. | | | 6,237 | | | | 712 | | |
| | | | 1,259 | | |
Health Care (0.4%): | |
Seegene, Inc. | | | 4,822 | | | | 858 | | |
Industrials (0.4%): | |
Samsung Engineering Co. Ltd. (a) | | | 62,324 | | | | 762 | | |
Information Technology (2.2%): | |
LG Innotek Co. Ltd. | | | 8,671 | | | | 1,460 | | |
Samsung Electronics Co. Ltd. | | | 39,952 | | | | 2,984 | | |
| | | | 4,444 | | |
| | | | 8,555 | | |
See notes to financial statements.
64
Victory Portfolios
Victory Trivalent International Fund-Core Equity | | Schedule of Portfolio Investments — continued
December 31, 2020 | |
(Amounts in Thousands, Except for Shares) (Unaudited)
Security Description | | Shares | | Value | |
Malaysia (1.1%): | |
Communication Services (0.5%): | |
Telekom Malaysia Bhd | | | 722,400 | | | $ | 973 | | |
Financials (0.6%): | |
RHB Bank Bhd | | | 863,600 | | | | 1,173 | | |
| | | | 2,146 | | |
Netherlands (4.2%): | |
Consumer Discretionary (1.2%): | |
Fiat Chrysler Automobiles NV (a) | | | 72,027 | | | | 1,301 | | |
Prosus NV | | | 10,309 | | | | 1,113 | | |
| | | | 2,414 | | |
Consumer Staples (1.0%): | |
Koninklijke Ahold Delhaize NV | | | 47,131 | | | | 1,329 | | |
X5 Retail Group NV, GDR | | | 18,325 | | | | 662 | | |
| | | | 1,991 | | |
Financials (0.5%): | |
ING Groep NV (a) | | | 43,948 | | | | 409 | | |
NN Group NV | | | 17,038 | | | | 736 | | |
| | | | 1,145 | | |
Health Care (0.3%): | |
QIAGEN NV (a) (b) | | | 10,834 | | | | 562 | | |
Information Technology (0.9%): | |
| ASML Holding NV | | | 1,465 | | | | 709 | | |
STMicroelectronics NV | | | 31,626 | | | | 1,170 | | |
| | | | 1,879 | | |
Materials (0.3%): | |
Akzo Nobel NV | | | 5,057 | | | | 543 | | |
| | | | 8,534 | | |
New Zealand (0.2%): | |
Health Care (0.2%): | |
Fisher & Paykel Healthcare Corp. Ltd. | | | 20,825 | | | | 494 | | |
Portugal (0.4%): | |
Communication Services (0.1%): | |
NOS SGPS SA | | | 73,551 | | | | 256 | | |
Energy (0.3%): | |
Galp Energia SGPS SA | | | 49,183 | | | | 521 | | |
| | | | 777 | | |
Russian Federation (1.2%): | |
Energy (0.5%): | |
LUKOIL PJSC, ADR | | | 14,221 | | | | 967 | | |
Financials (0.4%): | |
Sberbank of Russia PJSC | | | 208,090 | | | | 766 | | |
See notes to financial statements.
65
Victory Portfolios
Victory Trivalent International Fund-Core Equity | | Schedule of Portfolio Investments — continued
December 31, 2020 | |
(Amounts in Thousands, Except for Shares) (Unaudited)
Security Description | | Shares | | Value | |
Materials (0.3%): | |
Polymetal International PLC | | | 29,111 | | | $ | 670 | | |
| | | | 2,403 | | |
Singapore (1.3%): | |
Consumer Discretionary (0.3%): | |
Genting Singapore Ltd. | | | 942,500 | | | | 607 | | |
Consumer Staples (0.3%): | |
Wilmar International Ltd. | | | 167,000 | | | | 588 | | |
Financials (0.7%): | |
DBS Group Holdings Ltd. | | | 36,600 | | | | 694 | | |
Singapore Exchange Ltd. | | | 98,700 | | | | 693 | | |
| | | | 1,387 | | |
| | | | 2,582 | | |
South Africa (1.2%): | |
Communication Services (0.7%): | |
Naspers Ltd., Class N | | | 7,340 | | | | 1,504 | | |
Materials (0.5%): | |
Kumba Iron Ore Ltd. | | | 23,560 | | | | 1,003 | | |
| | | | 2,507 | | |
Spain (1.0%): | |
Industrials (0.5%): | |
ACS Actividades de Construccion y Servicios SA | | | 29,836 | | | | 991 | | |
Utilities (0.5%): | |
EDP Renovaveis SA | | | 38,472 | | | | 1,066 | | |
| | | | 2,057 | | |
Sweden (3.2%): | |
Consumer Staples (0.5%): | |
Swedish Match AB | | | 11,900 | | | | 926 | | |
Financials (0.3%): | |
Skandinaviska Enskilda Banken AB, Class A (a) | | | 63,581 | | | | 655 | | |
Industrials (1.3%): | |
Sandvik AB (a) | | | 31,345 | | | | 773 | | |
| SKF AB, Class B | | | 32,527 | | | | 847 | | |
Volvo AB, Class B | | | 39,956 | | | | 946 | | |
| | | | 2,566 | | |
Information Technology (0.4%): | |
Telefonaktiebolaget LM Ericsson, Class B | | | 64,866 | | | | 772 | | |
Materials (0.4%): | |
Boliden AB | | | 25,205 | | | | 895 | | |
Real Estate (0.3%): | |
Fastighets AB Balder, Class B (a) | | | 11,329 | | | | 592 | | |
| | | | 6,406 | | |
See notes to financial statements.
66
Victory Portfolios
Victory Trivalent International Fund-Core Equity | | Schedule of Portfolio Investments — continued
December 31, 2020 | |
(Amounts in Thousands, Except for Shares) (Unaudited)
Security Description | | Shares | | Value | |
Switzerland (7.0%): | |
Consumer Staples (1.5%): | |
Coca-Cola HBC AG | | | 14,761 | | | $ | 478 | | |
Nestle SA, Registered Shares | | | 21,304 | | | | 2,519 | | |
| | | | 2,997 | | |
Financials (1.5%): | |
Julius Baer Group Ltd. | | | 14,755 | | | | 850 | | |
Swiss Life Holding AG | | | 3,396 | | | | 1,585 | | |
UBS Group AG | | | 41,165 | | | | 580 | | |
| | | | 3,015 | | |
Health Care (2.5%): | |
Lonza Group AG, Registered Shares | | | 1,682 | | | | 1,084 | | |
Novartis AG, Registered Shares | | | 23,289 | | | | 2,193 | | |
Roche Holding AG | | | 5,281 | | | | 1,840 | | |
| | | | 5,117 | | |
Industrials (0.3%): | |
Adecco Group AG | | | 10,122 | | | | 674 | | |
Information Technology (0.8%): | |
Logitech International SA, Class R | | | 16,159 | | | | 1,570 | | |
Materials (0.4%): | |
LafargeHolcim Ltd. | | | 14,242 | | | | 782 | | |
| | | | 14,155 | | |
Taiwan (4.2%): | |
Communication Services (0.3%): | |
International Games System Co. Ltd. | | | 23,000 | | | | 622 | | |
Financials (1.0%): | |
Chailease Holding Co. Ltd. | | | 162,935 | | | | 975 | | |
Fubon Financial Holding Co. Ltd. | | | 565,000 | | | | 941 | | |
| | | | 1,916 | | |
Information Technology (2.9%): | |
Radiant Opto-Electronics Corp. | | | 222,000 | | | | 904 | | |
Realtek Semiconductor Corp. | | | 133,000 | | | | 1,853 | | |
Taiwan Semiconductor Manufacturing Co. Ltd. | | | 168,000 | | | | 3,179 | | |
| | | | 5,936 | | |
| | | | 8,474 | | |
Thailand (0.4%): | |
Consumer Staples (0.4%): | |
Charoen Pokphand Foods PCL | | | 804,100 | | | | 718 | | |
United Arab Emirates (0.3%): | |
Financials (0.3%): | |
Emirates NBD Bank PJSC | | | 216,988 | | | | 611 | | |
See notes to financial statements.
67
Victory Portfolios
Victory Trivalent International Fund-Core Equity | | Schedule of Portfolio Investments — continued
December 31, 2020 | |
(Amounts in Thousands, Except for Shares) (Unaudited)
Security Description | | Shares | | Value | |
United Kingdom (7.7%): | |
Consumer Discretionary (0.4%): | |
Barratt Developments PLC (a) | | | 79,761 | | | $ | 729 | | |
Consumer Staples (2.0%): | |
British American Tobacco PLC | | | 23,573 | | | | 875 | | |
Tate & Lyle PLC | | | 66,201 | | | | 610 | | |
Tesco PLC | | | 419,560 | | | | 1,324 | | |
Unilever PLC | | | 21,597 | | | | 1,295 | | |
| | | | 4,104 | | |
Energy (0.8%): | |
| BP PLC | | | 280,629 | | | | 968 | | |
Cairn Energy PLC (a) | | | 241,898 | | | | 694 | | |
| | | | 1,662 | | |
Financials (1.7%): | |
| 3i Group PLC | | | 90,462 | | | | 1,431 | | |
Barclays PLC | | | 340,266 | | | | 683 | | |
Legal & General Group PLC | | | 193,014 | | | | 703 | | |
Standard Chartered PLC | | | 103,556 | | | | 657 | | |
| | | | 3,474 | | |
Health Care (0.8%): | |
AstraZeneca PLC | | | 6,583 | | | | 656 | | |
Hikma Pharmaceuticals PLC | | | 29,229 | | | | 1,005 | | |
| | | | 1,661 | | |
Industrials (1.1%): | |
Ashtead Group PLC | | | 22,224 | | | | 1,047 | | |
BAE Systems PLC | | | 166,181 | | | | 1,108 | | |
| | | | 2,155 | | |
Materials (0.9%): | |
Anglo American PLC | | | 55,947 | | | | 1,847 | | |
| | | | 15,632 | | |
Total Common Stocks (Cost $169,914) | | | 197,466 | | |
Exchange-Traded Funds (0.8%) | |
United States (0.8%): | |
iShares Core MSCI EAFE ETF | | | 14,351 | | | | 992 | | |
iShares Core MSCI Emerging Markets ETF | | | 10,394 | | | | 645 | | |
| | | | 1,637 | | |
Total Exchange-Traded Funds (Cost $1,611) | | | 1,637 | | |
See notes to financial statements.
68
Victory Portfolios
Victory Trivalent International Fund-Core Equity | | Schedule of Portfolio Investments — continued
December 31, 2020 | |
(Amounts in Thousands, Except for Shares) (Unaudited)
Security Description | | Shares | | Value | |
Collateral for Securities Loaned^ (2.3%) | |
United States (2.3%): | |
BlackRock Liquidity Funds TempFund Portfolio, Institutional Class, 0.08% (d) | | | 79,412 | | | $ | 79 | | |
Fidelity Investments Money Market Government Portfolio I Shares, 0.01% (d) | | | 2,728,263 | | | | 2,728 | | |
Goldman Sachs Financial Square Prime Obligations Fund, Institutional Class,
0.04% (d) | | | 39,630 | | | | 40 | | |
JPMorgan Prime Money Market Fund, Capital Class, 0.12% (d) | | | 316,001 | | | | 316 | | |
Morgan Stanley Institutional Liquidity Prime Portfolio, Institutional Class,
0.09% (d) | | | 1,420,802 | | | | 1,421 | | |
Total Collateral for Securities Loaned (Cost $4,584) | | | 4,584 | | |
Total Investments (Cost $176,109) — 100.8% | | | 203,687 | | |
Liabilities in excess of other assets — (0.8)% | | | (1,586 | ) | |
NET ASSETS — 100.00% | | $ | 202,101 | | |
^ Purchased with cash collateral from securities on loan.
(a) Non-income producing security.
(b) All or a portion of this security is on loan.
(c) Rule 144A security or other security that is restricted as to resale to institutional investors. The Fund's Adviser has deemed this security to be liquid based upon procedures approved by the Board of Trustees. As of December 31, 2020, the fair value of these securities was $4,787 (thousands) and amounted to 2.4% of net assets.
(d) Rate disclosed is the daily yield on December 31, 2020.
ADR — American Depositary Receipt
ETF — Exchange-Traded Fund
GDR — Global Depositary Receipt
PCL — Public Company Limited
PLC — Public Limited Company
REIT — Real Estate Investment Trust
See notes to financial statements.
69
Victory Portfolios
Victory Trivalent International Small-Cap Fund | | Schedule of Portfolio Investments
December 31, 2020 | |
(Amounts in Thousands, Except for Shares) (Unaudited)
Security Description | | Shares | | Value | |
Common Stocks (97.6%) | |
Australia (6.7%): | |
Consumer Discretionary (0.8%): | |
Bapcor Ltd. | | | 1,700,014 | | | $ | 10,221 | | |
JB Hi-Fi Ltd. | | | 325,630 | | | | 12,224 | | |
| | | | 22,445 | | |
Energy (0.8%): | |
Beach Energy Ltd. | | | 15,163,664 | | | | 21,148 | | |
Financials (0.3%): | |
Pendal Group Ltd. | | | 1,712,563 | | | | 8,623 | | |
Health Care (0.4%): | |
Ansell Ltd. | | | 378,998 | | | | 10,129 | | |
Industrials (0.5%): | |
Seven Group Holdings Ltd. | | | 680,520 | | | | 12,287 | | |
Materials (2.9%): | |
CSR Ltd. | | | 2,074,989 | | | | 8,403 | | |
Mineral Resources Ltd. | | | 1,204,728 | | | | 34,825 | | |
OZ Minerals Ltd. | | | 1,390,540 | | | | 20,310 | | |
Silver Lake Resources Ltd. (a) | | | 9,215,271 | | | | 12,715 | | |
| | | | 76,253 | | |
Real Estate (1.0%): | |
Charter Hall Group | | | 1,800,361 | | | | 20,442 | | |
Shopping Centres Australasia Property Group | | | 3,988,986 | | | | 7,725 | | |
| | | | 28,167 | | |
| | | | 179,052 | | |
Belgium (0.5%): | |
Real Estate (0.5%): | |
Warehouses De Pauw CVA | | | 344,782 | | | | 11,952 | | |
Bermuda (0.3%): | |
Industrials (0.3%): | |
Kerry Logistics Network Ltd. | | | 3,571,000 | | | | 7,838 | | |
Canada (6.5%): | |
Consumer Discretionary (0.5%): | |
BRP, Inc. | | | 191,750 | | | | 12,669 | | |
Consumer Staples (0.4%): | |
Maple Leaf Foods, Inc. (b) | | | 470,660 | | | | 10,436 | | |
Energy (0.6%): | |
Parex Resources, Inc. (a) | | | 1,152,390 | | | | 15,864 | | |
Financials (0.4%): | |
Canadian Western Bank (b) | | | 506,397 | | | | 11,388 | | |
See notes to financial statements.
70
Victory Portfolios
Victory Trivalent International Small-Cap Fund | | Schedule of Portfolio Investments — continued
December 31, 2020 | |
(Amounts in Thousands, Except for Shares) (Unaudited)
Security Description | | Shares | | Value | |
Industrials (1.1%): | |
Finning International, Inc. | | | 543,362 | | | $ | 11,540 | | |
TFI International, Inc. (b) | | | 348,155 | | | | 17,926 | | |
| | | | 29,466 | | |
Information Technology (0.3%): | |
The Descartes Systems Group, Inc. (a) | | | 137,921 | | | | 8,068 | | |
Materials (1.3%): | |
Fortuna Silver Mines, Inc. (a) (b) | | | 1,270,108 | | | | 10,439 | | |
Kirkland Lake Gold Ltd. | | | 1 | | | | — | (c) | |
Pretium Resources, Inc. (a) | | | 684,981 | | | | 7,852 | | |
Stella-Jones, Inc. | | | 272,835 | | | | 9,921 | | |
Yamana Gold, Inc. | | | 1,159,352 | | | | 6,623 | | |
| | | | 34,835 | | |
Real Estate (1.2%): | |
Canadian Apartment Properties REIT (b) | | | 232,375 | | | | 9,127 | | |
Real Matters, Inc. (a) (b) | | | 589,179 | | | | 8,893 | | |
Tricon Residential, Inc. | | | 1,427,276 | | | | 12,818 | | |
| | | | 30,838 | | |
Utilities (0.7%): | |
Northland Power, Inc. (b) | | | 517,848 | | | | 18,583 | | |
| | | | 172,147 | | |
Denmark (1.4%): | |
Consumer Discretionary (0.5%): | |
Pandora A/S | | | 123,948 | | | | 13,874 | | |
Consumer Staples (0.5%): | |
Royal Unibrew A/S | | | 111,080 | | | | 12,865 | | |
Information Technology (0.4%): | |
Netcompany Group A/S (a) (b) (d) | | | 111,668 | | | | 11,453 | | |
| | | | 38,192 | | |
Finland (1.8%): | |
Industrials (1.1%): | |
Metso Outotec Oyj | | | 1,459,669 | | | | 14,664 | | |
Valmet Oyj | | | 565,554 | | | | 16,258 | | |
| | | | 30,922 | | |
Information Technology (0.4%): | |
TietoEVRY Oyj | | | 303,182 | | | | 9,975 | | |
Materials (0.3%): | |
Kemira Oyj | | | 528,864 | | | | 8,382 | | |
| | | | 49,279 | | |
France (8.0%): | |
Communication Services (0.6%): | |
Publicis Groupe SA | | | 326,989 | | | | 16,250 | | |
See notes to financial statements.
71
Victory Portfolios
Victory Trivalent International Small-Cap Fund | | Schedule of Portfolio Investments — continued
December 31, 2020 | |
(Amounts in Thousands, Except for Shares) (Unaudited)
Security Description | | Shares | | Value | |
Consumer Discretionary (1.4%): | |
Faurecia SE (a) | | | 392,429 | | | $ | 20,104 | | |
La Francaise des Jeux SAEM (d) | | | 182,014 | | | | 8,342 | | |
SEB SA | | | 49,248 | | | | 8,954 | | |
| | | | 37,400 | | |
Financials (0.4%): | |
SCOR SE (a) | | | 321,624 | | | | 10,431 | | |
Health Care (0.4%): | |
Korian SA (a) | | | 273,931 | | | | 10,485 | | |
Industrials (2.1%): | |
Alstom SA (a) | | | 171,008 | | | | 9,739 | | |
Eiffage SA | | | 214,307 | | | | 20,713 | | |
Elis SA (a) | | | 625,433 | | | | 10,360 | | |
Nexans SA | | | 224,550 | | | | 16,246 | | |
| | | | 57,058 | | |
Information Technology (1.4%): | |
Atos SE (a) | | | 126,157 | | | | 11,519 | | |
SOITEC (a) | | | 73,660 | | | | 14,282 | | |
Sopra Steria Group | | | 66,275 | | | | 10,682 | | |
| | | | 36,483 | | |
Materials (0.4%): | |
Arkema SA | | | 94,147 | | | | 10,771 | | |
Real Estate (0.9%): | |
Gecina SA | | | 89,194 | | | | 13,868 | | |
Klepierre SA | | | 395,571 | | | | 8,920 | | |
| | | | 22,788 | | |
Utilities (0.4%): | |
Rubis SCA | | | 247,462 | | | | 11,438 | | |
| | | | 213,104 | | |
Germany (8.2%): | |
Communication Services (1.2%): | |
Freenet AG | | | 549,138 | | | | 11,547 | | |
ProSiebenSat.1 Media SE (a) | | | 685,575 | | | | 11,541 | | |
United Internet AG, Registered Shares | | | 209,193 | | | | 8,805 | | |
| | | | 31,893 | | |
Consumer Discretionary (0.4%): | |
HelloFresh SE (a) (b) | | | 142,024 | | | | 10,984 | | |
Financials (0.8%): | |
Deutsche Pfandbriefbank AG (a) (d) | | | 810,832 | | | | 8,819 | | |
DWS Group GmbH & Co. KGaA (d) | | | 268,791 | | | | 11,380 | | |
| | | | 20,199 | | |
See notes to financial statements.
72
Victory Portfolios
Victory Trivalent International Small-Cap Fund | | Schedule of Portfolio Investments — continued
December 31, 2020 | |
(Amounts in Thousands, Except for Shares) (Unaudited)
Security Description | | Shares | | Value | |
Health Care (1.0%): | |
Carl Zeiss Meditec AG (b) | | | 86,342 | | | $ | 11,449 | | |
Gerresheimer AG | | | 131,607 | | | | 14,191 | | |
| | | | 25,640 | | |
Industrials (1.5%): | |
Brenntag AG | | | 171,909 | | | | 13,366 | | |
KION Group AG | | | 116,872 | | | | 10,134 | | |
Rheinmetall AG | | | 162,475 | | | | 17,201 | | |
| | | | 40,701 | | |
Information Technology (0.7%): | |
Bechtle AG | | | 83,328 | | | | 18,296 | | |
Materials (0.7%): | |
Aurubis AG | | | 127,653 | | | | 9,961 | | |
Covestro AG (d) | | | 155,947 | | | | 9,607 | | |
| | | | 19,568 | | |
Real Estate (1.3%): | |
alstria office REIT-AG (b) | | | 797,346 | | | | 14,505 | | |
TAG Immobilien AG | | | 627,975 | | | | 20,037 | | |
| | | | 34,542 | | |
Utilities (0.6%): | |
Encavis AG (b) | | | 653,960 | | | | 17,063 | | |
| | | | 218,886 | | |
Hong Kong (0.5%): | |
Health Care (0.3%): | |
The United Laboratories International Holdings Ltd. | | | 10,634,000 | | | | 7,537 | | |
Utilities (0.2%): | |
Towngas China Co. Ltd. | | | 12,900,000 | | | | 5,820 | | |
| | | | 13,357 | | |
Ireland (1.3%): | |
Consumer Discretionary (0.3%): | |
Dalata Hotel Group PLC (a) | | | 1,939,720 | | | | 8,950 | | |
Financials (0.4%): | |
Bank of Ireland Group PLC (a) | | | 2,450,699 | | | | 9,892 | | |
Health Care (0.6%): | |
UDG Healthcare PLC | | | 1,580,093 | | | | 16,863 | | |
| | | | 35,705 | | |
Isle of Man (0.4%): | |
Consumer Discretionary (0.4%): | |
Entain PLC (a) | | | 625,469 | | | | 9,700 | | |
Israel (0.5%): | |
Health Care (0.5%): | |
Inmode Ltd. (a) | | | 280,189 | | | | 13,303 | | |
See notes to financial statements.
73
Victory Portfolios
Victory Trivalent International Small-Cap Fund | | Schedule of Portfolio Investments — continued
December 31, 2020 | |
(Amounts in Thousands, Except for Shares) (Unaudited)
Security Description | | Shares | | Value | |
Italy (2.6%): | |
Financials (0.3%): | |
Banca Mediolanum SpA | | | 965,792 | | | $ | 8,389 | | |
Health Care (0.4%): | |
Amplifon SpA (a) (b) | | | 252,515 | | | | 10,495 | | |
Industrials (0.4%): | |
Interpump Group SpA | | | 218,367 | | | | 10,809 | | |
Information Technology (0.5%): | |
Reply SpA | | | 119,220 | | | | 13,956 | | |
Materials (0.5%): | |
Buzzi Unicem SpA | | | 530,507 | | | | 12,663 | | |
Utilities (0.5%): | |
ACEA SpA | | | 617,766 | | | | 12,978 | | |
| | | | 69,290 | | |
Japan (20.9%): | |
Communication Services (1.1%): | |
Capcom Co. Ltd. | | | 268,300 | | | | 17,403 | | |
Internet Initiative Japan, Inc. | | | 602,000 | | | | 11,863 | | |
| | | | 29,266 | | |
Consumer Discretionary (3.7%): | |
ASKUL Corp. | | | 271,600 | | | | 10,136 | | |
Komeri Co. Ltd. | | | 309,500 | | | | 8,752 | | |
Paltac Corp. | | | 186,100 | | | | 10,131 | | |
Resorttrust, Inc. | | | 547,300 | | | | 7,832 | | |
Starts Corp., Inc. | | | 303,200 | | | | 8,436 | | |
Sumitomo Forestry Co. Ltd. | | | 549,600 | | | | 11,500 | | |
Sushiro Global Holdings Ltd. | | | 518,700 | | | | 19,901 | | |
Tokyotokeiba Co. Ltd. | | | 179,500 | | | | 8,149 | | |
Toyo Tire Corp. | | | 893,700 | | | | 13,602 | | |
| | | | 98,439 | | |
Consumer Staples (1.3%): | |
Morinaga Milk Industry Co. Ltd. | | | 139,300 | | | | 6,865 | | |
Nichirei Corp. | | | 304,400 | | | | 8,555 | | |
Valor Holdings Co. Ltd. | | | 427,700 | | | | 10,968 | | |
Yaoko Co. Ltd. | | | 129,500 | | | | 9,020 | | |
| | | | 35,408 | | |
Financials (1.1%): | |
North Pacific Bank Ltd. | | | 3,286,000 | | | | 6,953 | | |
The Shiga Bank Ltd. | | | 387,200 | | | | 7,930 | | |
Zenkoku Hosho Co. Ltd. | | | 301,800 | | | | 13,827 | | |
| | | | 28,710 | | |
Health Care (2.2%): | |
Eiken Chemical Co. Ltd. | | | 577,500 | | | | 11,514 | | |
Japan Lifeline Co. Ltd. | | | 443,300 | | | | 6,997 | | |
Miraca Holdings, Inc. | | | 332,300 | | | | 8,956 | | |
See notes to financial statements.
74
Victory Portfolios
Victory Trivalent International Small-Cap Fund | | Schedule of Portfolio Investments — continued
December 31, 2020 | |
(Amounts in Thousands, Except for Shares) (Unaudited)
Security Description | | Shares | | Value | |
Nikkiso Co. Ltd. | | | 722,700 | | | $ | 7,042 | | |
Sawai Pharmaceutical Co. Ltd. | | | 239,600 | | | | 10,876 | | |
Ship Healthcare Holdings, Inc. | | | 232,400 | | | | 12,946 | | |
| | | | 58,331 | | |
Industrials (4.8%): | |
BayCurrent Consulting, Inc. | | | 96,700 | | | | 16,972 | | |
Bell System24 Holdings, Inc. | | | 437,500 | | | | 6,868 | | |
Daihen Corp. | | | 217,100 | | | | 10,576 | | |
Fuji Corp. | | | 634,300 | | | | 16,722 | | |
FULLCAST Holdings Co. Ltd. | | | 423,200 | | | | 6,594 | | |
Kanamoto Co. Ltd. | | | 333,900 | | | | 7,180 | | |
Kintetsu World Express, Inc. | | | 508,100 | | | | 12,069 | | |
Kumagai Gumi Co. Ltd. | | | 353,900 | | | | 8,925 | | |
Penta-Ocean Construction Co. Ltd. | | | 1,767,200 | | | | 15,215 | | |
Sankyu, Inc. | | | 193,700 | | | | 7,326 | | |
Sanwa Holdings Corp. | | | 875,200 | | | | 10,222 | | |
Takeuchi Manufacturing Co. Ltd. | | | 382,600 | | | | 9,036 | | |
| | | | 127,705 | | |
Information Technology (3.4%): | |
Anritsu Corp. (b) | | | 640,900 | | | | 14,309 | | |
Fuji Soft, Inc. (b) | | | 170,100 | | | | 8,511 | | |
NEC Networks & System Integration Corp. | | | 396,700 | | | | 6,860 | | |
Net One Systems Co. Ltd. | | | 336,000 | | | | 11,858 | | |
Nippon Electric Glass Co. Ltd. | | | 418,000 | | | | 9,158 | | |
Shinko Electric Industries Co. Ltd. | | | 803,500 | | | | 18,396 | | |
Taiyo Yuden Co. Ltd. | | | 302,500 | | | | 14,205 | | |
Tokyo Seimitsu Co. Ltd. | | | 183,700 | | | | 8,644 | | |
| | | | 91,941 | | |
Materials (1.7%): | |
Denka Co. Ltd. | | | 387,600 | | | | 15,158 | | |
Fuso Chemical Co. Ltd. | | | 210,600 | | | | 7,595 | | |
Kaneka Corp. | | | 234,300 | | | | 8,210 | | |
Rengo Co. Ltd. | | | 1,670,900 | | | | 14,007 | | |
| | | | 44,970 | | |
Real Estate (1.6%): | |
Invincible Investment Corp. | | | 18,345 | | | | 5,907 | | |
Kenedix Office Investment Corp. | | | 1,440 | | | | 9,778 | | |
Nippon Accommodations Fund, Inc. | | | 2,048 | | | | 11,514 | | |
Open House Co. Ltd. | | | 429,200 | | | | 15,792 | | |
| | | | 42,991 | | |
| | | | 557,761 | | |
Korea, Republic Of (5.9%): | |
Communication Services (0.7%): | |
Echo Marketing, Inc. | | | 316,169 | | | | 8,752 | | |
Neowiz (a) | | | 514,514 | | | | 10,656 | | |
| | | | 19,408 | | |
See notes to financial statements.
75
Victory Portfolios
Victory Trivalent International Small-Cap Fund | | Schedule of Portfolio Investments — continued
December 31, 2020 | |
(Amounts in Thousands, Except for Shares) (Unaudited)
Security Description | | Shares | | Value | |
Consumer Discretionary (0.5%): | |
Coway Co. Ltd. (a) | | | 102,989 | | | $ | 6,903 | | |
GS Home Shopping, Inc. | | | 43,139 | | | | 5,533 | | |
| | | | 12,436 | | |
Consumer Staples (0.8%): | |
Hite Jinro Co. Ltd. (a) | | | 471,523 | | | | 13,847 | | |
Maeil Dairies Co. Ltd. | | | 114,929 | | | | 7,402 | | |
| | | | 21,249 | | |
Health Care (1.5%): | |
Chong Kun Dang Pharmaceutical Corp. (a) | | | 80,665 | | | | 16,837 | | |
Osstem Implant Co. Ltd. (a) | | | 264,608 | | | | 12,443 | | |
Seegene, Inc. | | | 63,606 | | | | 11,321 | | |
| | | | 40,601 | | |
Industrials (0.3%): | |
Samsung Engineering Co. Ltd. (a) | | | 575,023 | | | | 7,031 | | |
Information Technology (1.2%): | |
Douzone Bizon Co. Ltd. | | | 153,238 | | | | 14,683 | | |
Partron Co. Ltd. | | | 964,109 | | | | 9,967 | | |
SFA Engineering Corp. (a) | | | 253,269 | | | | 9,013 | | |
| | | | 33,663 | | |
Materials (0.9%): | |
Soulbrain Co. Ltd. (a) | | | 94,097 | | | | 23,642 | | |
| | | | 158,030 | | |
Luxembourg (0.7%): | |
Consumer Discretionary (0.7%): | |
B&M European Value Retail SA | | | 2,513,890 | | | | 17,695 | | |
Malta (0.4%): | |
Consumer Discretionary (0.4%): | |
Kindred Group PLC | | | 1,006,763 | | | | 9,855 | | |
Monaco (0.4%): | |
Materials (0.4%): | |
Endeavour Mining Corp. (a) (b) | | | 472,154 | | | | 10,989 | | |
Netherlands (4.5%): | |
Energy (0.4%): | |
SBM Offshore NV | | | 579,067 | | | | 10,938 | | |
Financials (1.2%): | |
| ASR Nederland NV | | | 328,044 | | | | 13,124 | | |
Euronext NV (d) | | | 168,394 | | | | 18,546 | | |
| | | | 31,670 | | |
Health Care (0.4%): | |
Argenx SE (a) | | | 38,724 | | | | 11,410 | | |
See notes to financial statements.
76
Victory Portfolios
Victory Trivalent International Small-Cap Fund | | Schedule of Portfolio Investments — continued
December 31, 2020 | |
(Amounts in Thousands, Except for Shares) (Unaudited)
Security Description | | Shares | | Value | |
Industrials (1.3%): | |
AerCap Holdings NV (a) | | | 183,354 | | | $ | 8,358 | | |
Intertrust NV (a) (d) | | | 440,007 | | | | 7,462 | | |
Signify NV (a) (d) | | | 417,073 | | | | 17,509 | | |
| | | | 33,329 | | |
Information Technology (1.2%): | |
ASM International NV | | | 147,867 | | | | 32,263 | | |
| | | | 119,610 | | |
Norway (0.3%): | |
Financials (0.3%): | |
Sparebanken Vest | | | 875,512 | | | | 7,404 | | |
Singapore (0.8%): | |
Information Technology (0.3%): | |
AEM Holdings Ltd. (b) | | | 3,362,300 | | | | 8,790 | | |
Real Estate (0.5%): | |
Frasers Logistics & Commercial Trust | | | 12,753,600 | | | | 13,636 | | |
| | | | 22,426 | | |
Spain (1.9%): | |
Consumer Staples (0.4%): | |
Viscofan SA (b) | | | 125,753 | | | | 8,901 | | |
Financials (0.4%): | |
Bankinter SA | | | 2,005,557 | | | | 10,877 | | |
Industrials (0.7%): | |
Applus Services SA (a) | | | 985,538 | | | | 10,935 | | |
Cia de Distribucion Integral Logista Holdings SA | | | 414,507 | | | | 8,054 | | |
| | | | 18,989 | | |
Real Estate (0.4%): | |
Merlin Properties Socimi SA | | | 1,196,571 | | | | 11,408 | | |
| | | | 50,175 | | |
Sweden (3.3%): | |
Communication Services (1.0%): | |
Nordic Entertainment Group AB, Class B (a) | | | 202,723 | | | | 11,348 | | |
Stillfront Group AB (a) | | | 1,166,354 | | | | 14,162 | | |
| | | | 25,510 | | |
Consumer Discretionary (0.4%): | |
Dometic Group AB (d) | | | 897,851 | | | | 11,912 | | |
Health Care (1.0%): | |
Getinge AB, Class B | | | 530,433 | | | | 12,419 | | |
Recipharm AB, Class B (a) (b) | | | 579,654 | | | | 15,479 | | |
| | | | 27,898 | | |
Industrials (0.3%): | |
Peab AB, Class B (a) | | | 787,758 | | | | 8,585 | | |
See notes to financial statements.
77
Victory Portfolios
Victory Trivalent International Small-Cap Fund | | Schedule of Portfolio Investments — continued
December 31, 2020 | |
(Amounts in Thousands, Except for Shares) (Unaudited)
Security Description | | Shares | | Value | |
Real Estate (0.6%): | |
Wihlborgs Fastigheter AB | | | 658,727 | | | $ | 14,896 | | |
| | | | 88,801 | | |
Switzerland (7.5%): | |
Consumer Discretionary (0.3%): | |
Forbo Holding AG, Registered Shares | | | 5,068 | | | | 8,727 | | |
Consumer Staples (0.4%): | |
Coca-Cola HBC AG | | | 351,556 | | | | 11,383 | | |
Financials (2.3%): | |
Cembra Money Bank AG | | | 52,692 | | | | 6,384 | | |
Helvetia Holding AG, Registered Shares | | | 48,496 | | | | 5,124 | | |
Julius Baer Group Ltd. | | | 302,543 | | | | 17,436 | | |
Swiss Life Holding AG | | | 40,611 | | | | 18,950 | | |
Vontobel Holding AG, Class R | | | 180,696 | | | | 14,370 | | |
| | | | 62,264 | | |
Health Care (0.5%): | |
Tecan Group AG, Class R | | | 27,099 | | | | 13,296 | | |
Industrials (2.1%): | |
Adecco Group AG | | | 243,253 | | | | 16,207 | | |
Bucher Industries AG, Registered Shares | | | 29,321 | | | | 13,453 | | |
Sulzer AG, Registered Shares | | | 127,287 | | | | 13,466 | | |
Wizz Air Holdings PLC (a) (d) | | | 221,914 | | | | 13,853 | | |
| | | | 56,979 | | |
Information Technology (1.2%): | |
Logitech International SA, Class R | | | 316,104 | | | | 30,703 | | |
Real Estate (0.7%): | |
PSP Swiss Property AG, Registered Shares | | | 132,959 | | | | 17,719 | | |
| | | | 201,071 | | |
United Kingdom (11.9%): | |
Communication Services (0.5%): | |
Future PLC | | | 626,232 | | | | 14,842 | | |
Consumer Discretionary (2.1%): | |
Gamesys Group PLC | | | 657,585 | | | | 10,235 | | |
Marks & Spencer Group PLC (a) | | | 4,965,517 | | | | 9,209 | | |
Pets at Home Group PLC | | | 1,787,318 | | | | 10,167 | | |
Redrow PLC | | | 1,831,162 | | | | 14,282 | | |
Vistry Group PLC (a) | | | 899,698 | | | | 11,561 | | |
| | | | 55,454 | | |
Consumer Staples (1.1%): | |
Cranswick PLC | | | 185,268 | | | | 8,902 | | |
Stock Spirits Group PLC | | | 2,518,262 | | | | 9,234 | | |
Tate & Lyle PLC | | | 1,214,204 | | | | 11,186 | | |
| | | | 29,322 | | |
See notes to financial statements.
78
Victory Portfolios
Victory Trivalent International Small-Cap Fund | | Schedule of Portfolio Investments — continued
December 31, 2020 | |
(Amounts in Thousands, Except for Shares) (Unaudited)
Security Description | | Shares | | Value | |
Energy (0.6%): | |
Cairn Energy PLC (a) | | | 5,484,988 | | | $ | 15,725 | | |
Financials (1.2%): | |
IG Group Holdings PLC | | | 822,134 | | | | 9,657 | | |
Intermediate Capital Group PLC | | | 457,919 | | | | 10,773 | | |
OSB Group PLC (a) | | | 2,160,961 | | | | 12,516 | | |
| | | | 32,946 | | |
Health Care (0.4%): | |
Hikma Pharmaceuticals PLC | | | 301,379 | | | | 10,357 | | |
Industrials (1.7%): | |
IMI PLC | | | 885,335 | | | | 14,106 | | |
Serco Group PLC | | | 5,558,827 | | | | 9,126 | | |
Travis Perkins PLC | | | 669,329 | | | | 12,321 | | |
Ultra Electronics Holdings PLC | | | 336,027 | | | | 9,456 | | |
| | | | 45,009 | | |
Information Technology (2.2%): | |
Avast PLC (d) | | | 1,320,815 | | | | 9,697 | | |
Computacenter PLC | | | 565,457 | | | | 18,933 | | |
Electrocomponents PLC | | | 872,950 | | | | 10,378 | | |
Micro Focus International PLC (a) | | | 1,374,861 | | | | 7,909 | | |
Spirent Communications PLC | | | 2,958,033 | | | | 10,693 | | |
| | | | 57,610 | | |
Materials (0.3%): | |
Synthomer PLC | | | 1,349,734 | | | | 8,280 | | |
Real Estate (1.4%): | |
LondonMetric Property PLC | | | 3,890,459 | | | | 12,198 | | |
Safestore Holdings PLC | | | 1,419,561 | | | | 15,170 | | |
The Unite Group PLC (a) | | | 748,897 | | | | 10,696 | | |
| | | | 38,064 | | |
Utilities (0.4%): | |
Atlantica Sustainable Infrastructure PLC | | | 268,369 | | | | 10,193 | | |
| | | | 317,802 | | |
United States (0.4%): | |
Industrials (0.4%): | |
Reliance Worldwide Corp. Ltd. | | | 3,435,555 | | | | 10,755 | | |
Total Common Stocks (Cost $1,982,950) | | | 2,604,179 | | |
Exchange-Traded Funds (1.2%) | |
United States (1.2%): | |
Vanguard FTSE Developed Markets ETF (b) | | | 698,912 | | | | 32,996 | | |
Total Exchange-Traded Funds (Cost $31,626) | | | 32,996 | | |
See notes to financial statements.
79
Victory Portfolios
Victory Trivalent International Small-Cap Fund | | Schedule of Portfolio Investments — continued
December 31, 2020 | |
(Amounts in Thousands, Except for Shares) (Unaudited)
Security Description | | Shares | | Value | |
Collateral for Securities Loaned^ (2.9%) | |
United States (2.9%): | |
BlackRock Liquidity Funds TempFund Portfolio, Institutional Class, 0.08% (e) | | | 1,347,533 | | | $ | 1,348 | | |
Fidelity Investments Money Market Government Portfolio I Shares, 0.01% (e) | | | 46,295,647 | | | | 46,296 | | |
Goldman Sachs Financial Square Prime Obligations Fund, Institutional Class,
0.04% (e) | | | 672,486 | | | | 672 | | |
JPMorgan Prime Money Market Fund, Capital Class, 0.12% (e) | | | 5,362,191 | | | | 5,362 | | |
Morgan Stanley Institutional Liquidity Prime Portfolio, Institutional Class,
0.09% (e) | | | 24,109,457 | | | | 24,109 | | |
Total Collateral for Securities Loaned (Cost $77,787) | | | 77,787 | | |
Total Investments (Cost $2,092,363) — 101.7% | | | 2,714,962 | | |
Liabilities in excess of other assets — (1.7)% | | | (46,526 | ) | |
NET ASSETS — 100.00% | | $ | 2,668,436 | | |
^ Purchased with cash collateral from securities on loan.
(a) Non-income producing security.
(b) All or a portion of this security is on loan.
(c) Rounds to less than $1 thousand.
(d) Rule 144A security or other security that is restricted as to resale to institutional investors. The Fund's Adviser has deemed this security to be liquid based upon procedures approved by the Board of Trustees. As of December 31, 2020, the fair value of these securities was $128,580 (thousands) and amounted to 4.8% of net assets.
(e) Rate disclosed is the daily yield on December 31, 2020.
ETF — Exchange-Traded Fund
PLC — Public Limited Company
REIT — Real Estate Investment Trust
See notes to financial statements.
80
Victory Portfolios
Victory INCORE Total Return Bond Fund | | Schedule of Portfolio Investments
December 31, 2020 | |
(Amounts in Thousands, Except for Shares) (Unaudited)
Security Description | | Principal
Amount | | Value | |
Asset-Backed Securities (1.5%) | |
Ameriquest Mortgage Securities, Series 2004-R12, Class M1,
1.00% (LIBOR01M+86bps), 1/25/35, Callable 1/25/21 @ 100 (a) | | $ | 99 | | | $ | 99 | | |
Home Equity Asset Trust, Series 2005-2, Class M5,
1.24% (LIBOR01M+110bps), 7/25/35, Callable 1/25/21 @ 100 (a) | | | 553 | | | | 553 | | |
Park Place Securities, Inc., Series 2004-WCW2, Class M2,
1.12% (LIBOR01M+98bps), 10/25/34, Callable 1/25/21 @ 100 (a) | | | 47 | | | | 48 | | |
Santander Drive Auto Receivables Trust, Series 2020-1, Class A2A,
2.07%, 1/17/23, Callable 8/15/23 @ 100 (b) | | | 80 | | | | 81 | | |
Synchrony Credit Card Master Note Trust, Series 2018-1, Class A,
2.97%, 3/15/24 | | | 295 | | | | 296 | | |
Total Asset-Backed Securities (Cost $1,055) | | | 1,077 | | |
Collateralized Mortgage Obligations (1.2%) | |
Bank, Series 2020-BN26, Class AS, 2.69%, 3/15/63, Callable 3/15/30 @ 100 | | | 290 | | | | 311 | | |
Citigroup Commercial Mortgage Trust, Series 2020-GC46, Class AS,
2.92%, 2/15/53 | | | 257 | | | | 282 | | |
WFRBS Commercial Mortgage Trust, Series 2012-C10, Class A5,
3.24%, 12/15/45, Callable 12/15/22 @ 100 | | | 270 | | | | 269 | | |
Total Collateralized Mortgage Obligations (Cost $838) | | | 862 | | |
Preferred Stocks (1.9%) | |
Financials (0.7%): | |
AMG Capital Trust II, 5.15%, 10/15/37 | | | 585 | | | | 28 | | |
Bank of America Corp., Series L, 7.25% (c) | | | 100 | | | | 151 | | |
KKR & Co., Inc., Series C, 6.00%, 9/15/23 (d) | | | 2,010 | | | | 122 | | |
Wells Fargo & Co., Series L, 7.50% (c) | | | 115 | | | | 174 | | |
| | | | 475 | | |
Health Care (0.2%): | |
Danaher Corp., Series B, 5.00%, 4/15/23 (e) | | | 98 | | | | 128 | | |
Industrials (0.2%): | |
Stanley Black & Decker, Inc., 5.25%, 11/15/22 | | | 1,455 | | | | 163 | | |
Utilities (0.8%): | |
American Electric Power Co., Inc., 6.13%, 8/15/23 | | | 530 | | | | 27 | | |
Dominion Energy, Inc., Series A, 7.25%, 6/1/22 | | | 1,570 | | | | 157 | | |
DTE Energy Co., 6.25%, 11/1/22 | | | 2,094 | | | | 101 | | |
NextEra Energy, Inc., 5.28%, 3/1/23 | | | 2,740 | | | | 139 | | |
The Southern Co., Series 2019, 6.75%, 8/1/22 | | | 2,442 | | | | 127 | | |
| | | | 551 | | |
Total Preferred Stocks (Cost $1,280) | | | 1,317 | | |
Corporate Bonds (53.8%) | |
Communication Services (2.4%): | |
Alphabet, Inc., 2.05%, 8/15/50, Callable 2/15/50 @ 100 | | | 184 | | | | 175 | | |
See notes to financial statements.
81
Victory Portfolios
Victory INCORE Total Return Bond Fund | | Schedule of Portfolio Investments — continued
December 31, 2020 | |
(Amounts in Thousands, Except for Shares) (Unaudited)
Security Description | | Principal
Amount | | Value | |
AT&T, Inc.
4.25%, 3/1/27, Callable 12/1/26 @ 100 (b) | | $ | 129 | | | $ | 151 | | |
1.65%, 2/1/28, Callable 12/1/27 @ 100 | | | 117 | | | | 120 | | |
5.15%, 11/15/46, Callable 5/15/46 @ 100 (b) | | | 312 | | | | 402 | | |
CenturyLink, Inc., 6.75%, 12/1/23 | | | 115 | | | | 128 | | |
Comcast Corp.
3.45%, 2/1/50, Callable 8/1/49 @ 100 | | | 150 | | | | 177 | | |
2.80%, 1/15/51, Callable 7/15/50 @ 100 | | | 128 | | | | 133 | | |
Sirius XM Radio, Inc., 4.13%, 7/1/30, Callable 7/1/25 @ 102.06 (f) | | | 143 | | | | 152 | | |
Verizon Communications, Inc.
5.15%, 9/15/23 (b) (e) | | | 142 | | | | 160 | | |
3.38%, 2/15/25 (b) | | | 116 | | | | 129 | | |
| | | | 1,727 | | |
Consumer Discretionary (5.7%): | |
Booking Holdings, Inc.
0.90%, 9/15/21 | | | 30 | | | | 35 | | |
0.75%, 5/1/25 (e) (f) | | | 100 | | | | 146 | | |
D.R. Horton, Inc., 2.50%, 10/15/24, Callable 9/15/24 @ 100 | | | 670 | | | | 715 | | |
Dana, Inc., 5.63%, 6/15/28, Callable 6/15/23 @ 102.81 | | | 110 | | | | 119 | | |
Expedia Group, Inc., 3.60%, 12/15/23, Callable 11/15/23 @ 100 (f) | | | 201 | | | | 214 | | |
General Motors Co., 4.88%, 10/2/23 (b) | | | 229 | | | | 254 | | |
Hasbro, Inc., 2.60%, 11/19/22 | | | 300 | | | | 311 | | |
Hilton Domestic Operating Co., Inc., 4.88%, 1/15/30, Callable 1/15/25 @ 102.44 | | | 110 | | | | 121 | | |
Hilton Worldwide Finance LLC/Hilton Worldwide Finance Corp.,
4.88%, 4/1/27, Callable 4/1/22 @ 102.44 | | | 130 | | | | 137 | | |
Lear Corp., 3.50%, 5/30/30, Callable 2/28/30 @ 100 | | | 112 | | | | 122 | | |
Lennar Corp., 5.00%, 6/15/27, Callable 12/15/26 @ 100 | | | 212 | | | | 250 | | |
Marriott International, Inc., 3.60%, 4/15/24, Callable 3/15/24 @ 100 | | | 326 | | | | 349 | | |
NIKE, Inc., 3.88%, 11/1/45, Callable 5/1/45 @ 100 | | | 198 | | | | 257 | | |
NVR, Inc.
3.95%, 9/15/22, Callable 6/15/22 @ 100 (b) | | | 268 | | | | 282 | | |
3.00%, 5/15/30, Callable 11/15/29 @ 100 | | | 267 | | | | 291 | | |
Ross Stores, Inc.
3.38%, 9/15/24, Callable 6/15/24 @ 100 | | | 160 | | | | 172 | | |
0.88%, 4/15/26, Callable 3/15/26 @ 100 | | | 186 | | | | 186 | | |
| | | | 3,961 | | |
Consumer Staples (3.2%): | |
Altria Group, Inc., 4.40%, 2/14/26, Callable 12/14/25 @ 100 (b) | | | 202 | | | | 235 | | |
BAT Capital Corp., 5.28%, 4/2/50, Callable 10/2/49 @ 100 | | | 167 | | | | 206 | | |
Church & Dwight Co., Inc., 2.45%, 8/1/22, Callable 7/1/22 @ 100 (b) | | | 70 | | | | 72 | | |
Estee Lauder Cos., Inc., 4.15%, 3/15/47, Callable 9/15/46 @ 100 | | | 105 | | | | 138 | | |
Hormel Foods Corp., 1.80%, 6/11/30, Callable 3/11/30 @ 100 | | | 363 | | | | 376 | | |
Keurig Dr Pepper, Inc., 4.06%, 5/25/23, Callable 4/25/23 @ 100 (b) | | | 340 | | | | 369 | | |
Molson Coors Beverage Co., 4.20%, 7/15/46, Callable 1/15/46 @ 100 | | | 95 | | | | 109 | | |
Reynolds American, Inc., 6.15%, 9/15/43 (b) | | | 175 | | | | 228 | | |
The Coca-Cola Co., 2.95%, 3/25/25 | | | 263 | | | | 290 | | |
Tyson Foods, Inc., 5.10%, 9/28/48, Callable 3/28/48 @ 100 | | | 135 | | | | 193 | | |
| | | | 2,216 | | |
See notes to financial statements.
82
Victory Portfolios
Victory INCORE Total Return Bond Fund | | Schedule of Portfolio Investments — continued
December 31, 2020 | |
(Amounts in Thousands, Except for Shares) (Unaudited)
Security Description | | Principal
Amount | | Value | |
Energy (3.8%): | |
Chevron USA, Inc., 1.02%, 8/12/27, Callable 6/12/27 @ 100 | | $ | 320 | | | $ | 321 | | |
Continental Resources, Inc., 4.50%, 4/15/23, Callable 1/15/23 @ 100 (b) | | | 234 | | | | 241 | | |
EOG Resources, Inc., 4.95%, 4/15/50, Callable 10/15/49 @ 100 | | | 135 | | | | 183 | | |
EQM Midstream Partners LP, 4.75%, 7/15/23, Callable 6/15/23 @ 100 (b) | | | 248 | | | | 260 | | |
HollyFrontier Corp., 2.63%, 10/1/23 | | | 265 | | | | 271 | | |
Phillips 66 Partners LP, 4.90%, 10/1/46, Callable 4/1/46 @ 100 | | | 229 | | | | 257 | | |
Pioneer Natural Resources Co.
0.25%, 5/15/25 (e) (f) | | | 110 | | | | 146 | | |
1.90%, 8/15/30, Callable 5/15/30 @ 100 | | | 251 | | | | 249 | | |
Plains All American Pipeline LP/PAA Finance Corp.,
2.85%, 1/31/23, Callable 10/31/22 @ 100 (b) | | | 245 | | | | 253 | | |
Valero Energy Corp.
4.00%, 4/1/29, Callable 1/1/29 @ 100 (b) | | | 102 | | | | 115 | | |
10.50%, 3/15/39 | | | 195 | | | | 338 | | |
| | | | 2,634 | | |
Financials (14.0%): | |
Aflac, Inc.
2.88%, 10/15/26, Callable 7/15/26 @ 100 | | | 335 | | | | 371 | | |
4.75%, 1/15/49, Callable 7/15/48 @ 100 | | | 35 | | | | 49 | | |
Alleghany Corp.
3.63%, 5/15/30, Callable 2/15/30 @ 100 | | | 130 | | | | 147 | | |
4.90%, 9/15/44, Callable 3/15/44 @ 100 | | | 204 | | | | 263 | | |
Ares Capital Corp., 4.63%, 3/1/24 | | | 160 | | | | 169 | | |
Bank of America Corp.
2.50%, 10/21/22, Callable 10/21/21 @ 100, MTN | | | 515 | | | | 523 | | |
4.20%, 8/26/24, MTN (b) | | | 160 | | | | 179 | | |
3.25%, 10/21/27, Callable 10/21/26 @ 100, MTN | | | 205 | | | | 230 | | |
Capital One Financial Corp., 3.30%, 10/30/24, Callable 9/30/24 @ 100 (b) | | | 224 | | | | 246 | | |
Cincinnati Financial Corp., 6.13%, 11/1/34 | | | 230 | | | | 321 | | |
Citigroup, Inc.
2.75%, 4/25/22, Callable 3/25/22 @ 100 | | | 363 | | | | 374 | | |
3.88%, 3/26/25 | | | 108 | | | | 121 | | |
4.60%, 3/9/26 (b) | | | 232 | | | | 272 | | |
4.45%, 9/29/27 (b) | | | 108 | | | | 128 | | |
3.88% (LIBOR03M+117bps), 1/24/39, Callable 1/24/38 @ 100 (a) | | | 94 | | | | 113 | | |
Fifth Third Bancorp
1.63%, 5/5/23, Callable 4/5/23 @ 100 | | | 130 | | | | 134 | | |
3.65%, 1/25/24, Callable 12/25/23 @ 100 (b) | | | 584 | | | | 636 | | |
Ford Motor Credit Co. LLC, 4.06%, 11/1/24, Callable 10/1/24 @ 100 | | | 290 | | | | 305 | | |
General Motors Financial Co., Inc., 4.15%, 6/19/23, Callable 5/19/23 @ 100 | | | 110 | | | | 118 | | |
Globe Life, Inc., 2.15%, 8/15/30, Callable 5/15/30 @ 100 | | | 250 | | | | 254 | | |
JPMorgan Chase & Co.
2.95%, 10/1/26, Callable 7/1/26 @ 100 | | | 425 | | | | 472 | | |
5.60%, 7/15/41 | | | 87 | | | | 131 | | |
JPMorgan Chase Financial Co. LLC, 0.25%, 5/1/23 (f) | | | 120 | | | | 129 | | |
Morgan Stanley
4.88%, 11/1/22 (b) | | | 303 | | | | 327 | | |
3.13%, 7/27/26, MTN | | | 545 | | | | 609 | | |
Sixth Street Specialty Lending, Inc., 4.50%, 8/1/22 | | | 105 | | | | 113 | | |
See notes to financial statements.
83
Victory Portfolios
Victory INCORE Total Return Bond Fund | | Schedule of Portfolio Investments — continued
December 31, 2020 | |
(Amounts in Thousands, Except for Shares) (Unaudited)
Security Description | | Principal
Amount | | Value | |
SVB Financial Group, 3.13%, 6/5/30, Callable 3/5/30 @ 100 | | $ | 373 | | | $ | 420 | | |
The Goldman Sachs Group, Inc., 3.50%, 1/23/25, Callable 10/23/24 @ 100 | | | 275 | | | | 303 | | |
Truist Financial Corp., 2.75%, 4/1/22, MTN, Callable 3/1/22 @ 100 | | | 480 | | | | 494 | | |
Unum Group, 4.00%, 6/15/29, Callable 3/15/29 @ 100 | | | 195 | | | | 220 | | |
Wells Fargo & Co.
3.45%, 2/13/23 | | | 585 | | | | 620 | | |
4.30%, 7/22/27, MTN | | | 410 | | | | 481 | | |
4.90%, 11/17/45 (b) | | | 155 | | | | 206 | | |
Zions Bancorp NA, 3.25%, 10/29/29, Callable 7/29/29 @ 100 | | | 250 | | | | 263 | | |
| | | | 9,741 | | |
Health Care (6.2%): | |
AbbVie, Inc.
3.75%, 11/14/23, Callable 10/14/23 @ 100 | | | 317 | | | | 346 | | |
3.20%, 11/21/29, Callable 8/21/29 @ 100 | | | 285 | | | | 321 | | |
4.45%, 5/14/46, Callable 11/14/45 @ 100 | | | 142 | | | | 181 | | |
Amgen, Inc., 4.40%, 5/1/45, Callable 11/1/44 @ 100 | | | 250 | | | | 316 | | |
Anthem, Inc.
2.38%, 1/15/25, Callable 12/15/24 @ 100 | | | 148 | | | | 158 | | |
2.75%, 10/15/42 | | | 35 | | | | 157 | | |
Baxter International, Inc., 3.50%, 8/15/46, Callable 2/15/46 @ 100 | | | 109 | | | | 124 | | |
Bristol-Myers Squibb Co., 3.40%, 7/26/29, Callable 4/26/29 @ 100 | | | 455 | | | | 529 | | |
Centene Corp., 4.25%, 12/15/27, Callable 12/15/22 @ 102.13 | | | 168 | | | | 179 | | |
Gilead Sciences, Inc., 4.40%, 12/1/21, Callable 9/1/21 @ 100 (b) | | | 660 | | | | 678 | | |
HCA, Inc., 4.13%, 6/15/29, Callable 3/15/29 @ 100 | | | 193 | | | | 224 | | |
Hologic, Inc., 3.25%, 2/15/29, Callable 9/28/23 @ 101.63 (f) | | | 260 | | | | 265 | | |
Humana, Inc., 2.90%, 12/15/22, Callable 11/15/22 @ 100 (b) | | | 135 | | | | 141 | | |
Illumina, Inc.
0.50%, 6/15/21 | | | 65 | | | | 95 | | |
0.00%, 8/15/23 (i) | | | 55 | | | | 62 | | |
Merck & Co., Inc., 2.45%, 6/24/50, Callable 12/24/49 @ 100 | | | 135 | | | | 140 | | |
Regeneron Pharmaceuticals, Inc., 2.80%, 9/15/50, Callable 3/15/50 @ 100 | | | 146 | | | | 141 | | |
Teladoc Health, Inc., 1.25%, 6/1/27 (f) | | | 55 | | | | 66 | | |
Universal Health Services, Inc., 2.65%, 10/15/30, Callable 7/15/30 @ 100 (f) | | | 102 | | | | 106 | | |
Upjohn, Inc., 2.30%, 6/22/27, Callable 4/22/27 @ 100 (f) | | | 95 | | | | 101 | | |
| | | | 4,330 | | |
Industrials (5.1%): | |
Acuity Brands Lighting, Inc., 2.15%, 12/15/30, Callable 9/15/30 @ 100 | | | 241 | | | | 244 | | |
Carlisle Cos., Inc., 2.75%, 3/1/30, Callable 12/1/29 @ 100 | | | 150 | | | | 161 | | |
CSX Corp., 3.35%, 9/15/49, Callable 3/15/49 @ 100 | | | 195 | | | | 224 | | |
Delta Air Lines, Inc., 3.80%, 4/19/23, Callable 3/19/23 @ 100 (b) | | | 275 | | | | 281 | | |
Fortive Corp., 0.88%, 2/15/22 | | | 160 | | | | 165 | | |
Hillenbrand, Inc., 4.50%, 9/15/26, Callable 7/15/26 @ 100 | | | 420 | | | | 471 | | |
Honeywell International, Inc., 2.80%, 6/1/50, Callable 12/1/49 @ 100 | | | 82 | | | | 90 | | |
Oshkosh Corp., 3.10%, 3/1/30, Callable 12/1/29 @ 100 | | | 140 | | | | 152 | | |
PACCAR Financial Corp., 0.80%, 6/8/23, MTN | | | 226 | | | | 228 | | |
Rockwell Automation, Inc.
3.50%, 3/1/29, Callable 12/1/28 @ 100 | | | 165 | | | | 192 | | |
6.25%, 12/1/37 | | | 155 | | | | 226 | | |
Roper Technologies, Inc., 2.95%, 9/15/29, Callable 6/15/29 @ 100 (b) | | | 379 | | | | 417 | | |
See notes to financial statements.
84
Victory Portfolios
Victory INCORE Total Return Bond Fund | | Schedule of Portfolio Investments — continued
December 31, 2020 | |
(Amounts in Thousands, Except for Shares) (Unaudited)
Security Description | | Principal
Amount | | Value | |
Sensata Technologies, Inc., 3.75%, 2/15/31, Callable 2/15/26 @ 101.88 (f) | | $ | 130 | | | $ | 135 | | |
Snap-on, Inc., 4.10%, 3/1/48, Callable 9/1/47 @ 100 | | | 115 | | | | 148 | | |
Southwest Airlines Co., 1.25%, 5/1/25 | | | 95 | | | | 138 | | |
Valmont Industries, Inc., 5.00%, 10/1/44, Callable 4/1/44 @ 100 (b) | | | 279 | | | | 327 | | |
| | | | 3,599 | | |
Information Technology (6.4%): | |
Akamai Technologies, Inc., 0.13%, 5/1/25 | | | 80 | | | | 99 | | |
Apple, Inc., 4.65%, 2/23/46, Callable 8/23/45 @ 100 | | | 117 | | | | 167 | | |
Broadcom Corp., 3.00%, 1/15/22, Callable 12/15/21 @ 100 (b) | | | 160 | | | | 164 | | |
Broadcom Corp./Broadcom Cayman Finance Ltd.,
3.63%, 1/15/24, Callable 11/15/23 @ 100 (b) | | | 132 | | | | 143 | | |
Broadcom, Inc., 5.00%, 4/15/30, Callable 1/15/30 @ 100 | | | 315 | | | | 384 | | |
Cadence Design Systems, Inc., 4.38%, 10/15/24, Callable 7/15/24 @ 100 | | | 342 | | | | 384 | | |
Euronet Worldwide, Inc., 0.75%, 3/15/49, Callable 3/20/25 @ 100 | | | 120 | | | | 136 | | |
Intel Corp., 3.40%, 3/25/25, Callable 2/25/25 @ 100 | | | 228 | | | | 253 | | |
Lam Research Corp., 4.00%, 3/15/29, Callable 12/15/28 @ 100 (b) | | | 166 | | | | 199 | | |
Micron Technology, Inc.
4.19%, 2/15/27, Callable 12/15/26 @ 100 | | | 124 | | | | 145 | | |
5.33%, 2/6/29, Callable 11/6/28 @ 100 | | | 300 | | | | 376 | | |
3.13%, 5/1/32, Callable 5/4/21 @ 100 (g) | | | 18 | | | | 135 | | |
NCR Corp., 5.25%, 10/1/30, Callable 10/1/25 @ 102.63 (f) | | | 87 | | | | 93 | | |
NetApp, Inc., 3.25%, 12/15/22, Callable 9/15/22 @ 100 | | | 150 | | | | 157 | | |
Novellus Systems, Inc., 2.63%, 5/15/41 | | | 3 | | | | 44 | | |
NVIDIA Corp., 2.20%, 9/16/21, Callable 8/16/21 @ 100 | | | 165 | | | | 167 | | |
PayPal Holdings, Inc., 1.65%, 6/1/25, Callable 5/1/25 @ 100 | | | 415 | | | | 434 | | |
ServiceNow, Inc. 0.00%, 6/1/22 (i) | | | 5 | | | | 20 | | |
Texas Instruments, Inc., 4.15%, 5/15/48, Callable 11/15/47 @ 100 | | | 160 | | | | 214 | | |
Visa, Inc., 2.00%, 8/15/50, Callable 2/15/50 @ 100 (e) | | | 287 | | | | 273 | | |
VMware, Inc., 2.95%, 8/21/22, Callable 7/21/22 @ 100 | | | 360 | | | | 374 | | |
Western Digital Corp., 1.50%, 2/1/24 | | | 140 | | | | 139 | | |
| | | | 4,500 | | |
Materials (1.5%): | |
Celanese US Holdings LLC, 4.63%, 11/15/22 (b) | | | 210 | | | | 225 | | |
Domtar Corp., 6.75%, 2/15/44, Callable 8/15/43 @ 100 | | | 172 | | | | 217 | | |
Nucor Corp., 2.00%, 6/1/25, Callable 5/1/25 @ 100 | | | 160 | | | | 169 | | |
Southern Copper Corp., 5.25%, 11/8/42 (b) | | | 95 | | | | 127 | | |
Steel Dynamics, Inc.
2.40%, 6/15/25, Callable 5/15/25 @ 100 | | | 50 | | | | 53 | | |
1.65%, 10/15/27, Callable 8/15/27 @ 100 | | | 102 | | | | 105 | | |
3.25%, 10/15/50, Callable 4/15/50 @ 100 | | | 191 | | | | 199 | | |
| | | | 1,095 | | |
Real Estate (2.7%): | |
Duke Realty LP, 3.05%, 3/1/50, Callable 9/1/49 @ 100 | | | 159 | | | | 173 | | |
Highwoods Realty LP, 3.63%, 1/15/23, Callable 10/15/22 @ 100 | | | 630 | | | | 656 | | |
Iron Mountain, Inc., 5.25%, 7/15/30, Callable 7/15/25 @ 102.63 (f) | | | 108 | | | | 117 | | |
Physicians Realty LP, 3.95%, 1/15/28, Callable 10/15/27 @ 100 | | | 138 | | | | 148 | | |
Piedmont Operating Partnership LP, 3.15%, 8/15/30, Callable 5/15/30 @ 100 | | | 134 | | | | 136 | | |
Retail Properties of America, Inc., 4.00%, 3/15/25, Callable 12/15/24 @ 100 | | | 339 | | | | 348 | | |
See notes to financial statements.
85
Victory Portfolios
Victory INCORE Total Return Bond Fund | | Schedule of Portfolio Investments — continued
December 31, 2020 | |
(Amounts in Thousands, Except for Shares) (Unaudited)
Security Description | | Principal
Amount | | Value | |
Sabra Health Care LP, 5.13%, 8/15/26, Callable 5/15/26 @ 100 | | $ | 145 | | | $ | 162 | | |
STORE Capital Corp., 2.75%, 11/18/30, Callable 8/18/30 @ 100 | | | 184 | | | | 187 | | |
| | | | 1,927 | | |
Utilities (2.8%): | |
Ameren Illinois Co., 1.55%, 11/15/30, Callable 8/15/30 @ 100 | | | 225 | | | | 227 | | |
Arizona Public Service Co., 2.95%, 9/15/27, Callable 6/15/27 @ 100 | | | 250 | | | | 275 | | |
CenterPoint Energy, Inc., 4.57%, 9/15/29 | | | 1 | | | | 65 | | |
Consolidated Edison, Inc., 6.30%, 8/15/37 (e) | | | 250 | | | | 363 | | |
NextEra Energy Capital Holdings, Inc.,
2.80%, 1/15/23, Callable 12/15/22 @ 100 (b) | | | 310 | | | | 324 | | |
Oklahoma G&E Co., 5.25%, 5/15/41, Callable 11/15/40 @ 100 | | | 190 | | | | 254 | | |
Public Service Electric & Gas Co.,
3.95%, 5/1/42, MTN, Callable 11/1/41 @ 100 (b) | | | 159 | | | | 196 | | |
Vistra Operations Co. LLC, 3.70%, 1/30/27, Callable 11/30/26 @ 100 (f) | | | 287 | | | | 316 | | |
| | | | 2,020 | | |
Total Corporate Bonds (Cost $35,108) | | | 37,750 | | |
Residential Mortgage-Backed Securities (0.2%) | |
Credit Suisse First Boston Mortgage Securities Corp., Series 2002-HE16, Class M1,
1.47% (LIBOR01M+132bps), 10/25/32, Callable 1/25/21 @ 100 (a) | | | 96 | | | | 96 | | |
JPMorgan Mortgage Trust, Series 2016-4, Class A5,
3.50%, 10/25/46, Callable 12/25/22 @ 100 (b) (f) (h) | | | 51 | | | | 52 | | |
Total Residential Mortgage-Backed Securities (Cost $147) | | | 148 | | |
Yankee Dollars (9.0%) | |
Communication Services (0.9%): | |
Vodafone Group PLC
3.75%, 1/16/24 | | | 321 | | | | 351 | | |
5.25%, 5/30/48 | | | 193 | | | | 268 | | |
| | | | 619 | | |
Consumer Discretionary (0.8%): | |
Magna International, Inc., 3.63%, 6/15/24, Callable 3/15/24 @ 100 | | | 460 | | | | 504 | | |
Consumer Staples (3.0%): | |
Barry Callebaut Services NV, 5.50%, 6/15/23 (f) | | | 638 | | | | 700 | | |
Kerry Group Financial Services Unlimited Co.,
3.20%, 4/9/23, Callable 1/9/23 @ 100 (b) (f) | | | 670 | | | | 702 | | |
Suntory Holdings Ltd.
2.55%, 6/28/22, Callable 5/28/22 @ 100 (b) (f) | | | 574 | | | | 591 | | |
2.25%, 10/16/24, Callable 9/16/24 @ 100 (f) | | | 200 | | | | 208 | | |
| | | | 2,201 | | |
Energy (0.9%): | |
Canadian Natural Resources Ltd., 2.95%, 1/15/23, Callable 12/15/22 @ 100 | | | 140 | | | | 146 | | |
Ecopetrol SA, 5.88%, 9/18/23 (b) | | | 325 | | | | 363 | | |
Statoil ASA, 3.95%, 5/15/43 | | | 100 | | | | 122 | | |
| | | | 631 | | |
See notes to financial statements.
86
Victory Portfolios
Victory INCORE Total Return Bond Fund | | Schedule of Portfolio Investments — continued
December 31, 2020 | |
(Amounts in Thousands, Except for Shares) (Unaudited)
Security Description | | Principal
Amount | | Value | |
Financials (2.1%): | |
Barclays Bank PLC
0.00%, 2/4/25 (b) (i) | | $ | 75 | | | $ | 94 | | |
0.00%, 2/18/25 (i) | | | 65 | | | | 72 | | |
Enel Finance International NV, 2.88%, 5/25/22 (b) (f) | | | 415 | | | | 428 | | |
Newcrest Finance Pty Ltd.
5.75%, 11/15/41 (f) | | | 155 | | | | 217 | | |
4.20%, 5/13/50, Callable 11/13/49 @ 100 (f) | | | 110 | | | | 135 | | |
NXP BV/NXP Funding LLC, 4.63%, 6/1/23 (f) | | | 300 | | | | 329 | | |
Total Capital International SA, 2.99%, 6/29/41, Callable 12/29/40 @ 100 | | | 195 | | | | 212 | | |
| | | | 1,487 | | |
Industrials (0.4%): | |
AerCap Ireland Capital DAC/AerCap Global Aviation Trust,
6.50%, 7/15/25, Callable 6/15/25 @ 100 | | | 150 | | | | 179 | | |
Canadian National Railway Co., 3.20%, 8/2/46, Callable 2/2/46 @ 100 | | | 85 | | | | 100 | | |
| | | | 279 | | |
Materials (0.5%): | |
Rio Tinto Finance USA Ltd.
3.75%, 6/15/25, Callable 3/15/25 @ 100 | | | 190 | | | | 215 | | |
5.20%, 11/2/40 | | | 75 | | | | 109 | | |
| | | | 324 | | |
Utilities (0.4%): | |
Iberdrola International BV
6.75%, 9/15/33 | | | 50 | | | | 68 | | |
6.75%, 7/15/36 | | | 152 | | | | 231 | | |
| | | | 299 | | |
Total Yankee Dollars (Cost $5,949) | | | 6,344 | | |
U.S. Government Mortgage-Backed Agencies (26.4%) | |
Federal Home Loan Mortgage Corp.
9.00%, 4/1/25 (b) | | | 13 | | | | 15 | | |
7.50%, 8/1/29 (b) | | | 9 | | | | 10 | | |
Series 4395, Class PA, 2.50%, 4/15/37 – 7/1/50 (b) | | | 608 | | | | 642 | | |
5.00%, 7/1/39 (b) | | | 564 | | | | 642 | | |
Series 4320, Class AP, 3.50%, 7/15/39 – 10/15/40 (b) | | | 543 | | | | 567 | | |
Series 4444, Class CH, 3.00%, 1/15/41 – 10/1/46 (b) | | | 1,019 | | | | 1,062 | | |
Series 4049, Class AB, 2.75%, 12/15/41 (b) | | | 94 | | | | 96 | | |
Series 4494, Class JA, 3.75%, 5/15/42 (b) | | | 489 | | | | 508 | | |
4.50%, 7/1/44 – 12/1/45 (b) | | | 1,019 | | | | 1,141 | | |
| | | | 4,683 | | |
Federal National Mortgage Association
3.50%, 2/1/32 – 12/25/50 | | | 3,462 | | | | 3,675 | | |
6.00%, 2/1/37 (b) | | | 107 | | | | 125 | | |
Series 2011-21, Class PA, 4.50%, 5/25/40 – 5/1/50 (b) | | | 570 | | | | 610 | | |
3.00%, 6/1/40 – 5/1/48 | | | 4,872 | | | | 5,193 | | |
2.50%, 7/1/40 – 12/25/47 | | | 1,166 | | | | 1,231 | | |
Series 2013-81, Class KA, 2.75%, 9/25/42 (b) | | | 291 | | | | 302 | | |
See notes to financial statements.
87
Victory Portfolios
Victory INCORE Total Return Bond Fund | | Schedule of Portfolio Investments — continued
December 31, 2020 | |
(Amounts in Thousands, Except for Shares) (Unaudited)
Security Description | | Shares or
Principal
Amount | | Value | |
Series 2015-61, Class PV, 3.50%, 5/25/44 (b) (h) | | $ | 750 | | | $ | 831 | | |
4.00%, 3/1/47 – 6/1/49 | | | 1,444 | | | | 1,584 | | |
| | | | 13,551 | | |
Government National Mortgage Association
3.00%, 8/20/50 | | | 355 | | | | 372 | | |
Total U.S. Government Mortgage-Backed Agencies (Cost $17,896) | | | 18,606 | | |
U.S. Treasury Obligations (2.8%) | |
U.S. Treasury Bonds, 1.25%, 5/15/50 | | | 1,150 | | | | 1,044 | | |
U.S. Treasury Notes
2.00%, 8/15/25 (b) | | | 783 | | | | 843 | | |
0.25%, 8/31/25 | | | 102 | | | | 102 | | |
Total U.S. Treasury Obligations (Cost $2,034) | | | 1,989 | | |
Collateral for Securities Loaned^ (0.9%) | |
BlackRock Liquidity Funds TempFund Portfolio, Institutional Class, 0.08% (j) | | | 10,620 | | | | 11 | | |
Fidelity Investments Money Market Government Portfolio I Shares, 0.01% (j) | | | 364,842 | | | | 365 | | |
Goldman Sachs Financial Square Prime Obligations Fund, Institutional Class,
0.04% (j) | | | 5,300 | | | | 5 | | |
JPMorgan Prime Money Market Fund, Capital Class, 0.12% (j) | | | 42,258 | | | | 42 | | |
Morgan Stanley Institutional Liquidity Prime Portfolio, Institutional Class,
0.09% (j) | | | 189,999 | | | | 190 | | |
Total Collateral for Securities Loaned (Cost $613) | | | 613 | | |
Total Investments (Cost $64,920) — 97.7% | | | 68,706 | | |
Other assets in excess of liabilities — 2.3% | | | 1,651 | | |
NET ASSETS — 100.00% | | $ | 70,357 | | |
^ Purchased with cash collateral from securities on loan.
(a) Variable or Floating-Rate Security. Rate disclosed is as of December 31, 2020.
(b) All or a portion of this security has been segregated as collateral for derivative instruments.
(c) Security is perpetual and has no final maturity date but may be subject to calls at various dates in the future.
(d) Non-income producing security.
(e) All or a portion of this security is on loan.
(f) Rule 144A security or other security that is restricted as to resale to institutional investors. The Fund's Adviser has deemed this security to be liquid based upon procedures approved by the Board of Trustees. As of December 31, 2020, the fair value of these securities was $5,348 (thousands) and amounted to 7.6% of net assets.
(g) Continuously callable with 30 days' notice.
(h) The rate for certain asset-backed and mortgage-backed securities may vary based on factors relating to the pool of assets underlying the security. The rate disclosed is the rate in effect at December 31, 2020.
(i) Zero coupon bond.
(j) Rate disclosed is the daily yield on December 31, 2020.
See notes to financial statements.
88
Victory Portfolios
Victory INCORE Total Return Bond Fund | | Schedule of Portfolio Investments — continued
December 31, 2020 | |
(Unaudited)
bps — Basis points
LIBOR — London InterBank Offered Rate
LIBOR01M — 1 Month US Dollar LIBOR, rate disclosed as of December 31, 2020, based on the last reset date of the security
LIBOR03M — 3 Month US Dollar LIBOR, rate disclosed as of December 31, 2020, based on the last reset date of the security
LLC — Limited Liability Company
LP — Limited Partnership
MTN — Medium Term Note
PLC — Public Limited Company
Futures Contracts Purchased
(Amounts not in thousands)
| | | Number of
Contracts | | Expiration
Date | | Notional
Amount | | Value | | Unrealized
Appreciation/
(Depreciation) | |
5-Year U.S. Treasury Note Futures | | | 31 | | | 3/31/21 | | $ | 3,903,599 | | | $ | 3,911,085 | | | $ | 7,486 | | |
Ultra Long Term U.S. Treasury
Bond Futures | | | 7 | | | 3/22/21 | | | 1,512,125 | | | | 1,494,938 | | | | (17,187 | ) | |
| | | | | | | | | | | $ | (9,701 | ) | |
Futures Contracts Sold
(Amounts not in thousands)
| | | Number of
Contracts | | Expiration
Date | | Notional
Amount | | Value | | Unrealized
Appreciation/
(Depreciation) | |
10-Year U.S. Treasury Note Futures | | | 4 | | | 3/22/21 | | $ | 552,736 | | | $ | 552,312 | | | $ | 424 | | |
| | | Total unrealized appreciation | | | | | | | | $ | 7,910 | | |
| | | Total unrealized depreciation | | | | | | | | | (17,187 | ) | |
| | | Total net unrealized appreciation (depreciation) | | | | | | | | $ | (9,277 | ) | |
See notes to financial statements.
89
Victory Portfolios | | Statements of Assets and Liabilities
December 31, 2020 (Unaudited) | |
(Amounts in Thousands, Except Per Share Amounts)
| | | Victory
Integrity
Discovery
Fund | | Victory
Integrity
Mid-Cap
Value
Fund | | Victory
Integrity
Small-Cap
Value
Fund | |
ASSETS: | |
Investments, at value (Cost $71,741, $163,858
and $1,480,188) | | $ | 81,044 | (a) | | $ | 204,008 | (b) | | $ | 1,928,058 | (c) | |
Cash and cash equivalents | | | 536 | | | | 1,817 | | | | 9,098 | | |
Receivables: | |
Interest and dividends | | | 64 | | | | 282 | | | | 2,677 | | |
Capital shares issued | | | 159 | | | | 120 | | | | 1,289 | | |
Investments sold | | | 483 | | | | — | | | | 10,860 | | |
From Adviser | | | 5 | | | | 101 | | | | 1 | | |
Prepaid expenses | | | 55 | | | | 33 | | | | 144 | | |
Total Assets | | | 82,346 | | | | 206,361 | | | | 1,952,127 | | |
LIABILITIES: | |
Payables: | |
Collateral received on loaned securities | | | 6,578 | | | | 3,558 | | | | 99,310 | | |
Investments purchased | | | 242 | | | | 254 | | | | 4,775 | | |
Capital shares redeemed | | | 120 | | | | 184 | | | | 5,628 | | |
Accrued expenses and other payables: | |
Investment advisory fees | | | 63 | | | | 126 | | | | 1,331 | | |
Administration fees | | | 4 | | | | 11 | | | | 95 | | |
Custodian fees | | | 1 | | | | — | (d) | | | 14 | | |
Transfer agent fees | | | 41 | | | | 10 | | | | 274 | | |
Compliance fees | | | — | (d) | | | — | (d) | | | 1 | | |
Trustees' fees | | | 28 | | | | — | (d) | | | 33 | | |
| 12b-1 fees | | | 6 | | | | 1 | | | | 15 | | |
Other accrued expenses | | | 14 | | | | 20 | | | | 146 | | |
Total Liabilities | | | 7,097 | | | | 4,164 | | | | 111,622 | | |
NET ASSETS: | |
Capital | | | 75,405 | | | | 185,505 | | | | 1,558,772 | | |
Total accumulated earnings/(loss) | | | (156 | ) | | | 16,692 | | | | 281,733 | | |
Net Assets | | $ | 75,249 | | | $ | 202,197 | | | $ | 1,840,505 | | |
Net Assets | |
Class A Shares | | $ | 37,959 | | | $ | 10,778 | | | $ | 100,122 | | |
Class C Shares | | | 2,133 | | | | 65 | | | | 6,280 | | |
Class R Shares | | | 2,556 | | | | — | | | | 5,980 | | |
Class R6 Shares | | | — | | | | 178,669 | | | | 1,134,665 | | |
Class Y Shares | | | 32,469 | | | | 12,593 | | | | 593,458 | | |
Member Class | | | 132 | | | | 92 | | | | — | | |
Total | | $ | 75,249 | | | $ | 202,197 | | | $ | 1,840,505 | | |
Shares (unlimited number of shares authorized with
a par value of $0.001 per share): | |
Class A Shares | | | 1,124 | | | | 548 | | | | 2,900 | | |
Class C Shares | | | 93 | | | | 3 | | | | 214 | | |
Class R Shares | | | 81 | | | | — | | | | 180 | | |
Class R6 Shares | | | — | | | | 8,991 | | | | 31,578 | | |
Class Y Shares | | | 866 | | | | 635 | | | | 16,611 | | |
Member Class | | | 4 | | | | 5 | | | | — | | |
Total | | | 2,168 | | | | 10,182 | | | | 51,483 | | |
See notes to financial statements.
90
Victory Portfolios | | Statements of Assets and Liabilities
December 31, 2020 (Unaudited) | |
(Amounts in Thousands, Except Per Share Amounts) (continued)
| | | Victory
Integrity
Discovery
Fund | | Victory
Integrity
Mid-Cap
Value
Fund | | Victory
Integrity
Small-Cap
Value
Fund | |
Net asset value, offering (except Class A Shares) and
redemption price per share: (e) | |
Class A Shares | | $ | 33.77 | | | $ | 19.68 | | | $ | 34.52 | | |
Class C Shares (f) | | | 22.85 | | | | 19.83 | | | | 29.34 | | |
Class R Shares | | | 31.49 | | | | — | | | | 33.28 | | |
Class R6 Shares | | | — | | | | 19.87 | | | | 35.93 | | |
Class Y Shares | | | 37.49 | | | | 19.85 | | | | 35.73 | | |
Member Class | | | 33.78 | | | | 19.97 | | | | — | | |
Maximum Sales Charge — Class A Shares | | | 5.75 | % | | | 5.75 | % | | | 5.75 | % | |
Maximum offering price (100%/(100%-maximum
sales charge) of net asset value adjusted to the
nearest cent) per share — Class A Shares | | $ | 35.83 | | | $ | 20.88 | | | $ | 36.63 | | |
(a) Includes $6,447 of securities on loan.
(b) Includes $3,449 of securities on loan.
(c) Includes $96,126 of securities on loan.
(d) Rounds to less than $1 thousand.
(e) Per share amount may not recalculate due to rounding of net assets and/or shares outstanding.
(f) Redemption price per share varies by the length of time shares are held.
See notes to financial statements.
91
Victory Portfolios | | Statements of Assets and Liabilities
December 31, 2020 (Unaudited) | |
(Amounts in Thousands, Except Per Share Amounts)
| | | Victory
Integrity
Small/Mid-Cap
Value Fund | | Victory
Munder
Multi-Cap
Fund | | Victory
S&P 500
Index
Fund | |
ASSETS: | |
Investments, at value (Cost $123,642, $280,180
and $49,929) | | $ | 153,912 | (a) | | $ | 400,986 | (b) | | $ | 243,153 | (c) | |
Cash and cash equivalents | | | 1,277 | | | | 1,190 | | | | 1,049 | | |
Deposit with brokers for futures contracts | | | — | | | | — | | | | 447 | | |
Receivables: | |
Interest and dividends | | | 172 | | | | 252 | | | | 180 | | |
Capital shares issued | | | 151 | | | | 3 | | | | 19 | | |
Investments sold | | | 297 | | | | — | | | | — | | |
Variation margin on open futures contracts | | | — | | | | — | | | | 10 | | |
From Adviser | | | 35 | | | | 1 | | | | — | | |
Prepaid expenses | | | 32 | | | | 39 | | | | 47 | | |
Total Assets | | | 155,876 | | | | 402,471 | | | | 244,905 | | |
LIABILITIES: | |
Payables: | |
Collateral received on loaned securities | | | 5,297 | | | | 4,324 | | | | 727 | | |
Investments purchased | | | 318 | | | | — | | | | — | | |
Capital shares redeemed | | | 137 | | | | 153 | | | | 4 | | |
Accrued expenses and other payables: | |
Investment advisory fees | | | 100 | | | | 251 | | | | 41 | | |
Administration fees | | | 8 | | | | 21 | | | | 13 | | |
Custodian fees | | | 1 | | | | 3 | | | | 2 | | |
Transfer agent fees | | | — | (d) | | | 122 | | | | 30 | | |
Compliance fees | | | — | (d) | | | — | (d) | | | — | (d) | |
Trustees' fees | | | — | (d) | | | 155 | | | | 30 | | |
| 12b-1 fees | | | — | (d) | | | 41 | | | | 15 | | |
Other accrued expenses | | | 26 | | | | 52 | | | | 19 | | |
Total Liabilities | | | 5,887 | | | | 5,122 | | | | 881 | | |
NET ASSETS: | |
Capital | | | 131,407 | | | | 262,375 | | | | 45,459 | | |
Total accumulated earnings/(loss) | | | 18,582 | | | | 134,974 | | | | 198,565 | | |
Net Assets | | $ | 149,989 | | | $ | 397,349 | | | $ | 244,024 | | |
Net Assets | |
Class A Shares | | $ | 4,220 | | | $ | 356,408 | | | $ | 176,182 | | |
Class C Shares | | | — | | | | 5,060 | | | | — | | |
Class R Shares | | | — | | | | — | | | | 15,538 | | |
Class R6 Shares | | | 104,851 | | | | — | | | | — | | |
Class Y Shares | | | 40,659 | | | | 35,881 | | | | 52,304 | | |
Member Class | | | 259 | | | | — | | | | — | | |
Total | | $ | 149,989 | | | $ | 397,349 | | | $ | 244,024 | | |
Shares (unlimited number of shares authorized with
a par value of $0.001 per share): | |
Class A Shares | | | 231 | | | | 7,697 | | | | 7,801 | | |
Class C Shares | | | — | | | | 143 | | | | — | | |
Class R Shares | | | — | | | | — | | | | 690 | | |
Class R6 Shares | | | 5,661 | | | | — | | | | — | | |
Class Y Shares | | | 2,202 | | | | 706 | | | | 2,296 | | |
Member Class | | | 14 | | | | — | | | | — | | |
Total | | | 8,108 | | | | 8,546 | | | | 10,787 | | |
See notes to financial statements.
92
Victory Portfolios | | Statements of Assets and Liabilities
December 31, 2020 (Unaudited) | |
(Amounts in Thousands, Except Per Share Amounts) (continued)
| | | Victory
Integrity
Small/Mid-Cap
Value Fund | | Victory
Munder
Multi-Cap
Fund | | Victory
S&P 500
Index
Fund | |
Net asset value, offering (except Class A Shares) and
redemption price per share: (e) | |
Class A Shares | | $ | 18.29 | | | $ | 46.31 | | | $ | 22.58 | | |
Class C Shares (f) | | | — | | | | 35.38 | | | | — | | |
Class R Shares | | | — | | | | — | | | | 22.50 | | |
Class R6 Shares | | | 18.52 | | | | — | | | | — | | |
Class Y Shares | | | 18.46 | | | | 50.81 | | | | 22.78 | | |
Member Class | | | 18.43 | | | | — | | | | — | | |
Maximum Sales Charge — Class A Shares | | | 5.75 | % | | | 5.75 | % | | | 2.25 | % | |
Maximum offering price (100%/(100%-maximum
sales charge) of net asset value adjusted to the
nearest cent) per share — Class A Shares | | $ | 19.41 | | | $ | 49.14 | | | $ | 23.10 | | |
(a) Includes $5,084 of securities on loan.
(b) Includes $4,157 of securities on loan.
(c) Includes $713 of securities on loan.
(d) Rounds to less than $1 thousand.
(e) Per share amount may not recalculate due to rounding of net assets and/or shares outstanding.
(f) Redemption price per share varies by the length of time shares are held.
See notes to financial statements.
93
Victory Portfolios | | Statements of Assets and Liabilities
December 31, 2020 (Unaudited) | |
(Amounts in Thousands, Except Per Share Amounts)
| | | Victory
Munder
Mid-Cap
Core Growth
Fund | | Victory
Munder
Small Cap
Growth
Fund | | Victory
Trivalent
Emerging
Markets
Small-Cap
Fund | |
ASSETS: | |
Investments, at value (Cost $394,529, $11,051
and $8,631) | | $ | 607,056 | (a) | | $ | 16,435 | (b) | | $ | 11,067 | (c) | |
Cash and cash equivalents | | | 1,250 | | | | 309 | | | | 76 | | |
Receivables: | |
Interest and dividends | | | 315 | | | | 4 | | | | 23 | | |
Capital shares issued | | | 344 | | | | — | | | | 10 | | |
From Adviser | | | 2 | | | | 2 | | | | 13 | | |
Prepaid expenses | | | 54 | | | | 1 | | | | 6 | | |
Total Assets | | | 609,021 | | | | 16,751 | | | | 11,195 | | |
LIABILITIES: | |
Payables: | |
Collateral received on loaned securities | | | 22,349 | | | | 1,906 | | | | 423 | | |
Capital shares redeemed | | | 1,623 | | | | — | | | | — | (d) | |
Accrued foreign capital gains taxes | | | — | | | | — | | | | 17 | | |
Accrued expenses and other payables: | |
Investment advisory fees | | | 366 | | | | 10 | | | | 10 | | |
Administration fees | | | 28 | | | | 1 | | | | 1 | | |
Custodian fees | | | 6 | | | | — | (d) | | | 4 | | |
Transfer agent fees | | | 196 | | | | — | (d) | | | 3 | | |
Compliance fees | | | 1 | | | | — | (d) | | | — | (d) | |
Trustees' fees | | | 36 | | | | — | (d) | | | — | (d) | |
| 12b-1 fees | | | 31 | | | | — | (d) | | | — | (d) | |
Other accrued expenses | | | 78 | | | | 8 | | | | 17 | | |
Total Liabilities | | | 24,714 | | | | 1,925 | | | | 475 | | |
NET ASSETS: | |
Capital | | | 364,082 | | | | 9,333 | | | | 8,852 | | |
Total accumulated earnings/(loss) | | | 220,225 | | | | 5,493 | | | | 1,868 | | |
Net Assets | | $ | 584,307 | | | $ | 14,826 | | | $ | 10,720 | | |
Net Assets | |
Class A Shares | | $ | 207,347 | | | $ | 483 | | | $ | 1,123 | | |
Class C Shares | | | 12,936 | | | | — | | | | — | | |
Class I Shares | | | — | | | | 14,224 | | | | — | | |
Class R Shares | | | 14,362 | | | | — | | | | — | | |
Class R6 Shares | | | 98,699 | | | | — | | | | — | | |
Class Y Shares | | | 250,963 | | | | 119 | | | | 9,597 | | |
Total | | $ | 584,307 | | | $ | 14,826 | | | $ | 10,720 | | |
Shares (unlimited number of shares authorized with
a par value of $0.001 per share): | |
Class A Shares | | | 15,456 | | | | 27 | | | | 75 | | |
Class C Shares | | | 2,820 | | | | — | | | | — | | |
Class I Shares | | | — | | | | 790 | | | | — | | |
Class R Shares | | | 1,292 | | | | — | | | | — | | |
Class R6 Shares | | | 5,685 | | | | — | | | | — | | |
Class Y Shares | | | 15,198 | | | | 7 | | | | 644 | | |
Total | | | 40,451 | | | | 824 | | | | 719 | | |
See notes to financial statements.
94
Victory Portfolios | | Statements of Assets and Liabilities
December 31, 2020 (Unaudited) | |
(Amounts in Thousands, Except Per Share Amounts) (continued)
| | | Victory
Munder
Mid-Cap
Core Growth
Fund | | Victory
Munder
Small Cap
Growth
Fund | | Victory
Trivalent
Emerging
Markets
Small-Cap
Fund | |
Net asset value, offering (except Class A Shares) and
redemption price per share: (e) | |
Class A Shares | | $ | 13.42 | | | $ | 17.71 | | | $ | 14.89 | | |
Class C Shares (f) | | | 4.59 | | | | — | | | | — | | |
Class I Shares | | | — | | | | 18.01 | | | | — | | |
Class R Shares | | | 11.11 | | | | — | | | | — | | |
Class R6 Shares | | | 17.36 | | | | — | | | | — | | |
Class Y Shares | | | 16.51 | | | | 17.81 | | | | 14.91 | | |
Maximum Sales Charge — Class A Shares | | | 5.75 | % | | | 5.75 | % | | | 5.75 | % | |
Maximum offering price (100%/(100%-maximum
sales charge) of net asset value adjusted to the
nearest cent) per share — Class A Shares | | $ | 14.24 | | | $ | 18.79 | | | $ | 15.80 | | |
(a) Includes $21,580 of securities on loan.
(b) Includes $1,851 of securities on loan.
(c) Includes $404 of securities on loan.
(d) Rounds to less than $1 thousand.
(e) Per share amount may not recalculate due to rounding of net assets and/or shares outstanding.
(f) Redemption price per share varies by the length of time shares are held.
See notes to financial statements.
95
Victory Portfolios | | Statements of Assets and Liabilities
December 31, 2020 (Unaudited) | |
(Amounts in Thousands, Except Per Share Amounts)
| | | Victory
Trivalent
International
Fund-Core
Equity | | Victory
Trivalent
International
Small-Cap
Fund | | Victory
INCORE
Total Return
Bond
Fund | |
ASSETS: | |
Investments, at value (Cost $176,109, $2,092,363
and $64,920) | | $ | 203,687 | (a) | | $ | 2,714,962 | (b) | | $ | 68,706 | (c) | |
Foreign currency, at value (Cost $—(d), $616 and $—) | | | — | (d) | | | 629 | | | | — | | |
Cash and cash equivalents | | | 2,046 | | | | 30,090 | | | | 1,135 | | |
Deposit with brokers for swap agreements | | | — | | | | — | | | | 602 | | |
Deposit with brokers for futures contracts | | | — | | | | — | | | | 356 | | |
Receivables: | |
Interest and dividends | | | 229 | | | | 3,412 | | | | 434 | | |
Capital shares issued | | | 1,222 | | | | 2,608 | | | | — | | |
Investments sold | | | 164 | | | | 393 | | | | — | | |
Variation margin on open futures contracts | | | — | | | | — | | | | 7 | | |
Reclaims | | | 129 | | | | 2,703 | | | | — | | |
From Adviser | | | 147 | | | | 665 | | | | 11 | | |
Prepaid expenses | | | 63 | | | | 139 | | | | 40 | | |
Total Assets | | | 207,687 | | | | 2,755,601 | | | | 71,291 | | |
LIABILITIES: | |
Payables: | |
Collateral received on loaned securities | | | 4,584 | | | | 77,787 | | | | 613 | | |
Investments purchased | | | 652 | | | | 5,041 | | | | 222 | | |
Capital shares redeemed | | | 1 | | | | 1,600 | | | | — | (d) | |
Variation margin on open futures contracts | | | — | | | | — | | | | — | (d) | |
Accrued foreign capital gains taxes | | | 141 | | | | — | | | | — | | |
Accrued expenses and other payables: | |
Investment advisory fees | | | 133 | | | | 1,999 | | | | 24 | | |
Administration fees | | | 10 | | | | 134 | | | | 4 | | |
Custodian fees | | | 4 | | | | 45 | | | | 1 | | |
Transfer agent fees | | | 3 | | | | 398 | | | | 7 | | |
Compliance fees | | | — | (d) | | | 2 | | | | — | (d) | |
Trustees' fees | | | 43 | | | | 23 | | | | 49 | | |
| 12b-1 fees | | | 1 | | | | 10 | | | | 1 | | |
Other accrued expenses | | | 14 | | | | 126 | | | | 13 | | |
Total Liabilities | | | 5,586 | | | | 87,165 | | | | 934 | | |
NET ASSETS: | |
Capital | | | 182,050 | | | | 2,022,246 | | | | 70,815 | | |
Total accumulated earnings/(loss) | | | 20,051 | | | | 646,190 | | | | (458 | ) | |
Net Assets | | $ | 202,101 | | | $ | 2,668,436 | | | $ | 70,357 | | |
Net Assets | |
Class A Shares | | $ | 5,123 | | | $ | 78,214 | | | $ | 10,798 | | |
Class C Shares | | | 121 | | | | 4,721 | | | | 670 | | |
Class I Shares | | | 3,082 | | | | 1,627,012 | | | | — | | |
Class R6 Shares | | | 186,092 | | | | 107,801 | | | | 25,939 | | |
Class Y Shares | | | 7,683 | | | | 850,688 | | | | 32,950 | | |
Total | | $ | 202,101 | | | $ | 2,668,436 | | | $ | 70,357 | | |
See notes to financial statements.
96
Victory Portfolios | | Statements of Assets and Liabilities
December 31, 2020 (Unaudited) | |
(Amounts in Thousands, Except Per Share Amounts) (continued)
| | | Victory
Trivalent
International
Fund-Core
Equity | | Victory
Trivalent
International
Small-Cap
Fund | | Victory
INCORE
Total Return
Bond
Fund | |
Shares (unlimited number of shares authorized with
a par value of $0.001 per share): | |
Class A Shares | | $ | 669 | | | $ | 4,824 | | | $ | 1,074 | | |
Class C Shares | | | 16 | | | | 300 | | | | 66 | | |
Class I Shares | | | 401 | | | | 99,753 | | | | — | | |
Class R6 Shares | | | 24,059 | | | | 6,578 | | | | 2,575 | | |
Class Y Shares | | | 1,006 | | | | 52,378 | | | | 3,272 | | |
Total | | | 26,151 | | | | 163,833 | | | | 6,987 | | |
Net asset value, offering (except Class A Shares) and
redemption price per share: (e) | |
Class A Shares | | $ | 7.65 | | | $ | 16.21 | | | $ | 10.05 | | |
Class C Shares (f) | | | 7.67 | | | | 15.74 | | | | 10.12 | | |
Class I Shares | | | 7.69 | | | | 16.31 | | | | — | | |
Class R6 Shares | | | 7.73 | | | | 16.39 | | | | 10.07 | | |
Class Y Shares | | | 7.64 | | | | 16.24 | | | | 10.07 | | |
Maximum Sales Charge — Class A Shares | | | 5.75 | % | | | 5.75 | % | | | 2.25 | % | |
Maximum offering price (100%/(100%-maximum
sales charge) of net asset value adjusted to the
nearest cent) per share — Class A Shares | | $ | 8.12 | | | $ | 17.20 | | | $ | 10.28 | | |
(a) Includes $4,195 of securities on loan.
(b) Includes $73,940 of securities on loan.
(c) Includes $596 of securities on loan.
(d) Rounds to less than $1 thousand.
(e) Per share amount may not recalculate due to rounding of net assets and/or shares outstanding.
(f) Redemption price per share varies by the length of time shares are held.
See notes to financial statements.
97
Victory Portfolios | | Statements of Operations
For the Six Months Ended December 31, 2020 (Unaudited) | |
(Amounts in Thousands)
| | | Victory
Integrity
Discovery
Fund | | Victory
Integrity
Mid-Cap
Value
Fund | | Victory
Integrity
Small-Cap
Value
Fund | |
Investment Income: | |
Dividends | | $ | 696 | | | $ | 3,663 | | | $ | 14,824 | | |
Interest | | | — | (a) | | | — | (a) | | | 3 | | |
Securities lending (net of fees) | | | 7 | | | | 3 | | | | 115 | | |
Total Income | | | 703 | | | | 3,666 | | | | 14,942 | | |
Expenses: | |
Investment advisory fees | | | 318 | | | | 688 | | | | 6,989 | | |
Administration fees | | | 19 | | | | 55 | | | | 492 | | |
Sub-Administration fees | | | 8 | | | | 8 | | | | 8 | | |
12b-1 fees — Class A Shares | | | 41 | | | | 12 | | | | 107 | | |
12b-1 fees — Class C Shares | | | 10 | | | | — | (a) | | | 29 | | |
12b-1 fees — Class R Shares | | | 5 | | | | — | | | | 14 | | |
Custodian fees | | | 2 | | | | 6 | | | | 36 | | |
Transfer agent fees — Class A Shares | | | 32 | | | | 7 | | | | 109 | | |
Transfer agent fees — Class C Shares | | | 2 | | | | — | (a) | | | 5 | | |
Transfer agent fees — Class R Shares | | | 3 | | | | — | | | | 8 | | |
Transfer agent fees — Class R6 Shares | | | — | | | | 8 | | | | 38 | | |
Transfer agent fees — Class Y Shares | | | 25 | | | | 11 | | | | 438 | | |
Transfer agent fees — Member Class (b) | | | — | (a) | | | — | (a) | | | — | | |
Trustees' fees | | | 3 | | | | 8 | | | | 70 | | |
Compliance fees | | | — | (a) | | | 1 | | | | 8 | | |
Legal and audit fees | | | 6 | | | | 11 | | | | 55 | | |
State registration and filing fees | | | 31 | | | | 36 | | | | 51 | | |
Interfund lending fees | | | — | | | | — | | | | — | (a) | |
Other expenses | | | 10 | | | | 20 | | | | 149 | | |
Total Expenses | | | 515 | | | | 871 | | | | 8,606 | | |
Expenses waived/reimbursed by Adviser | | | (11 | ) | | | (292 | ) | | | (5 | ) | |
Net Expenses | | | 504 | | | | 579 | | | | 8,601 | | |
Net Investment Income (Loss) | | | 199 | | | | 3,087 | | | | 6,341 | | |
Realized/Unrealized Gains (Losses) from Investments: | |
Net realized gains (losses) from investment securities | | | 1,828 | | | | (2,388 | ) | | | 92,302 | | |
Net change in unrealized appreciation/depreciation on
investment securities | | | 19,766 | | | | 50,309 | | | | 476,816 | | |
Net realized/unrealized gains (losses) on investments | | | 21,594 | | | | 47,921 | | | | 569,118 | | |
Change in net assets resulting from operations | | $ | 21,793 | | | $ | 51,008 | | | $ | 575,459 | | |
(a) Rounds to less than $1 thousand.
(b) Victory Integrity Discovery Fund and Victory Integrity Mid-Cap Value Fund Member Class commenced operations on November 3, 2020.
See notes to financial statements.
98
Victory Portfolios | | Statements of Operations
For the Six Months Ended December 31, 2020 (Unaudited) | |
(Amounts in Thousands)
| | | Victory
Integrity
Small/Mid-Cap
Value Fund | | Victory
Munder
Multi-Cap
Fund | | Victory
S&P 500
Index
Fund | |
Investment Income: | |
Dividends | | $ | 2,714 | | | $ | 2,459 | | | $ | 1,992 | | |
Interest | | | — | (a) | | | 1 | | | | — | (a) | |
Securities lending (net of fees) | | | 3 | | | | 1 | | | | 2 | | |
Total Income | | | 2,717 | | | | 2,461 | | | | 1,994 | | |
Expenses: | |
Investment advisory fees | | | 513 | | | | 1,419 | | | | 231 | | |
Administration fees | | | 39 | | | | 114 | | | | 70 | | |
Sub-Administration fees | | | 8 | | | | 8 | | | | 9 | | |
12b-1 fees — Class A Shares | | | 4 | | | | 425 | | | | 125 | | |
12b-1 fees — Class C Shares | | | — | | | | 25 | | | | — | | |
12b-1 fees — Class R Shares | | | — | | | | — | | | | 37 | | |
Custodian fees | | | 3 | | | | 8 | | | | 5 | | |
Transfer agent fees — Class A Shares | | | 5 | | | | 399 | | | | 59 | | |
Transfer agent fees — Class C Shares | | | — | | | | 7 | | | | — | | |
Transfer agent fees — Class R Shares | | | — | | | | — | | | | 5 | | |
Transfer agent fees — Class R6 Shares | | | 1 | | | | — | | | | — | | |
Transfer agent fees — Class Y Shares | | | 7 | | | | 16 | | | | 25 | | |
Transfer agent fees — Member Class (b) | | | — | (a) | | | — | | | | — | | |
Trustees' fees | | | 5 | | | | 13 | | | | 10 | | |
Compliance fees | | | 1 | | | | 2 | | | | 1 | | |
Legal and audit fees | | | 8 | | | | 16 | | | | 11 | | |
State registration and filing fees | | | 27 | | | | 25 | | | | 26 | | |
Other expenses | | | 24 | | | | 45 | | | | 27 | | |
Total Expenses | | | 645 | | | | 2,522 | | | | 641 | | |
Expenses waived/reimbursed by Adviser | | | (96 | ) | | | (5 | ) | | | — | | |
Net Expenses | | | 549 | | | | 2,517 | | | | 641 | | |
Net Investment Income (Loss) | | | 2,168 | | | | (56 | ) | | | 1,353 | | |
Realized/Unrealized Gains (Losses) from Investments: | |
Net realized gains (losses) from investment securities | | | 3,401 | | | | 24,002 | | | | 12,821 | | |
Net realized gains (losses) from futures contracts | | | — | | | | — | | | | 212 | | |
Net change in unrealized appreciation/depreciation on
investment securities | | | 36,740 | | | | 47,442 | | | | 30,869 | | |
Net change in unrealized appreciation/depreciation on
futures contracts | | | — | | | | — | | | | 35 | | |
Net realized/unrealized gains (losses) on investments | | | 40,141 | | | | 71,444 | | | | 43,937 | | |
Change in net assets resulting from operations | | $ | 42,309 | | | $ | 71,388 | | | $ | 45,290 | | |
(a) Rounds to less than $1 thousand
(b) Victory Integrity Small/Mid-Cap Value Fund Member Class commenced operations on November 3, 2020.
See notes to financial statements.
99
Victory Portfolios | | Statements of Operations
For the Six Months Ended December 31, 2020 (Unaudited) | |
(Amounts in Thousands)
| | | Victory
Munder
Mid-Cap
Core Growth
Fund | | Victory
Munder
Small Cap
Growth
Fund | | Victory
Trivalent
Emerging
Markets
Small-Cap
Fund | |
Investment Income: | |
Dividends | | $ | 2,340 | | | $ | 24 | | | $ | 150 | | |
Interest | | | 1 | | | | — | (a) | | | — | (a) | |
Securities lending (net of fees) | | | 15 | | | | 11 | | | | 6 | | |
Foreign tax withholding | | | (1 | ) | | | — | (a) | | | (22 | ) | |
Total Income | | | 2,355 | | | | 35 | | | | 134 | | |
Expenses: | |
Investment advisory fees | | | 2,186 | | | | 52 | | | | 53 | | |
Administration fees | | | 176 | | | | 4 | | | | 3 | | |
Sub-Administration fees | | | 8 | | | | 8 | | | | 8 | | |
12b-1 fees — Class A Shares | | | 247 | | | | — | (a) | | | 1 | | |
12b-1 fees — Class C Shares | | | 66 | | | | — | | | | — | | |
12b-1 fees — Class R Shares | | | 34 | | | | — | | | | — | | |
Accounting fees | | | — | (a) | | | — | (a) | | | 9 | | |
Custodian fees | | | 14 | | | | 1 | | | | 17 | | |
Transfer agent fees — Class A Shares | | | 169 | | | | — | (a) | | | 1 | | |
Transfer agent fees — Class C Shares | | | 9 | | | | — | | | | — | | |
Transfer agent fees — Class I Shares | | | — | | | | — | (a) | | | — | | |
Transfer agent fees — Class R Shares | | | 18 | | | | — | | | | — | | |
Transfer agent fees — Class R6 Shares | | | 2 | | | | — | | | | — | | |
Transfer agent fees — Class Y Shares | | | 203 | | | | — | (a) | | | 5 | | |
Trustees' fees | | | 28 | | | | 1 | | | | 1 | | |
Compliance fees | | | 3 | | | | — | (a) | | | — | (a) | |
Legal and audit fees | | | 19 | | | | 4 | | | | 10 | | |
State registration and filing fees | | | 44 | | | | 5 | | | | 3 | | |
Other expenses | | | 55 | | | | 3 | | | | 4 | | |
Total Expenses | | | 3,281 | | | | 78 | | | | 115 | | |
Expenses waived/reimbursed by Adviser | | | (8 | ) | | | (8 | ) | | | (41 | ) | |
Net Expenses | | | 3,273 | | | | 70 | | | | 74 | | |
Net Investment Income (Loss) | | | (918 | ) | | | (35 | ) | | | 60 | | |
Realized/Unrealized Gains (Losses) from Investments: | |
Net realized gains (losses) from investment securities and
foreign currency translations | | | 80,752 | | | | 470 | | | | 1,079 | | |
Foreign taxes on realized gains | | | — | | | | — | | | | (2 | ) | |
Net change in unrealized appreciation/depreciation on
investment securities and foreign currency translations | | | 66,263 | | | | 3,464 | | | | 1,207 | | |
Net change in accrued foreign taxes on unrealized gains | | | — | | | | — | | | | (13 | ) | |
Net realized/unrealized gains (losses) on investments | | | 147,015 | | | | 3,934 | | | | 2,271 | | |
Change in net assets resulting from operations | | $ | 146,097 | | | $ | 3,899 | | | $ | 2,331 | | |
(a) Rounds to less than $1 thousand.
See notes to financial statements.
100
Victory Portfolios | | Statements of Operations
For the Six Months Ended December 31, 2020 (Unaudited) | |
(Amounts in Thousands)
| | | Victory
Trivalent
International
Fund-Core
Equity | | Victory
Trivalent
International
Small-Cap
Fund | | Victory
INCORE
Total Return
Bond
Fund | |
Investment Income: | |
Dividends | | $ | 2,130 | | | $ | 20,524 | | | $ | 26 | | |
Interest | | | — | (a) | | | 7 | | | | 797 | | |
Securities lending (net of fees) | | | 8 | | | | 294 | | | | 1 | | |
Foreign tax withholding | | | (215 | ) | | | (2,443 | ) | | | — | | |
Total Income | | | 1,923 | | | | 18,382 | | | | 824 | | |
Expenses: | |
Investment advisory fees | | | 647 | | | | 10,490 | | | | 142 | | |
Administration fees | | | 49 | | | | 687 | | | | 22 | | |
Sub-Administration fees | | | 8 | | | | 8 | | | | 8 | | |
12b-1 fees — Class A Shares | | | 6 | | | | 135 | | | | 14 | | |
12b-1 fees — Class C Shares | | | 1 | | | | 22 | | | | 3 | | |
Custodian fees | | | 50 | | | | 182 | | | | 5 | | |
Transfer agent fees — Class A Shares | | | 6 | | | | 172 | | | | 11 | | |
Transfer agent fees — Class C Shares | | | — | (a) | | | 3 | | | | 1 | | |
Transfer agent fees — Class I Shares | | | — | (a) | | | 889 | | | | — | | |
Transfer agent fees — Class R6 Shares | | | — | (a) | | | 2 | | | | — | (a) | |
Transfer agent fees — Class Y Shares | | | 1 | | | | 499 | | | | 7 | | |
Trustees' fees | | | 5 | | | | 89 | | | | 2 | | |
Compliance fees | | | 1 | | | | 10 | | | | — | (a) | |
Legal and audit fees | | | 14 | | | | 75 | | | | 8 | | |
State registration and filing fees | | | 34 | | | | 63 | | | | 28 | | |
Other expenses | | | 21 | | | | 168 | | | | 12 | | |
Total Expenses | | | 843 | | | | 13,494 | | | | 263 | | |
Expenses waived/reimbursed by Adviser | | | (381 | ) | | | (1,785 | ) | | | (33 | ) | |
Net Expenses | | | 462 | | | | 11,709 | | | | 230 | | |
Net Investment Income (Loss) | | | 1,461 | | | | 6,673 | | | | 594 | | |
Realized/Unrealized Gains (Losses) from Investments: | |
Net realized gains (losses) from investment securities | | | 1,425 | | | | 198,027 | | | | 277 | | |
Net realized gains (losses) from futures contracts | | | — | | | | — | | | | 112 | | |
Net realized gains (losses) from swap agreements | | | — | | | | — | | | | 18 | | |
Net change in unrealized appreciation/depreciation on
investment securities | | | 26,846 | | | | 323,212 | | | | 880 | | |
Net change in unrealized appreciation/depreciation on
futures contracts | | | — | | | | — | | | | (2 | ) | |
Net change in accrued foreign taxes on unrealized gains | | | (97 | ) | | | — | | | | — | | |
Net realized/unrealized gains (losses) on investments | | | 28,174 | | | | 521,239 | | | | 1,285 | | |
Change in net assets resulting from operations | | $ | 29,635 | | | $ | 527,912 | | | $ | 1,879 | | |
(a) Rounds to less than $1 thousand.
See notes to financial statements.
101
Victory Portfolios | | Statements of Changes in Net Assets | |
(Amounts in Thousands)
| | | Victory Integrity
Discovery Fund | | Victory Integrity Mid-Cap
Value Fund | | Victory Integrity Small-Cap
Value Fund | |
| | | Six
Months
Ended
December 31,
2020
(unaudited) | | Year
Ended
June 30,
2020 | | Six
Months
Ended
December 31,
2020
(unaudited) | | Year
Ended
June 30,
2020 | | Six
Months
Ended
December 31,
2020
(unaudited) | | Year
Ended
June 30,
2020 | |
From Investment Activities: | |
Operations: | |
Net investment income (loss) | | $ | 199 | | | $ | (140 | ) | | $ | 3,087 | | | $ | 3,811 | | | $ | 6,341 | | | $ | 10,994 | | |
Net realized gains (losses) from
investments | | | 1,828 | | | | (10,099 | ) | | | (2,388 | ) | | | (20,430 | ) | | | 92,302 | | | | (254,708 | ) | |
Net change in unrealized
appreciation/depreciation
on investments | | | 19,766 | | | | (18,876 | ) | | | 50,309 | | | | (17,425 | ) | | | 476,816 | | | | (257,100 | ) | |
Change in net assets resulting
from operations | | | 21,793 | | | | (29,115 | ) | | | 51,008 | | | | (34,044 | ) | | | 575,459 | | | | (500,814 | ) | |
Distributions to Shareholders: | |
Class A Shares | | | — | | | | (1,198 | ) | | | (240 | ) | | | (45 | ) | | | (90 | ) | | | (569 | ) | |
Class C Shares | | | — | | | | (191 | ) | | | (1 | ) | | | — | (a) | | | — | | | | (49 | ) | |
Class R Shares | | | — | | | | (98 | ) | | | — | | | | — | | | | — | | | | (43 | ) | |
Class R6 Shares | | | — | | | | — | | | | (4,563 | ) | | | (1,711 | ) | | | (5,456 | ) | | | (9,755 | ) | |
Class Y Shares | | | — | | | | (1,529 | ) | | | (303 | ) | | | (108 | ) | | | (1,954 | ) | | | (6,764 | ) | |
Member Class (b) | | | — | | | | — | | | | (1 | ) | | | — | | | | — | | | | — | | |
Change in net assets resulting from
distributions to shareholders | | | — | | | | (3,016 | ) | | | (5,108 | ) | | | (1,864 | ) | | | (7,500 | ) | | | (17,180 | ) | |
Change in net assets resulting from
capital transactions | | | (8,861 | ) | | | (37,894 | ) | | | (46,176 | ) | | | 153,096 | | | | (294,756 | ) | | | (238,280 | ) | |
Change in net assets | | | 12,932 | | | | (70,025 | ) | | | (276 | ) | | | 117,188 | | | | 273,203 | | | | (756,274 | ) | |
Net Assets: | |
Beginning of period | | | 62,317 | | | | 132,342 | | | | 202,473 | | | | 85,285 | | | | 1,567,302 | | | | 2,323,576 | | |
End of period | | $ | 75,249 | | | $ | 62,317 | | | $ | 202,197 | | | $ | 202,473 | | | $ | 1,840,505 | | | $ | 1,567,302 | | |
(a) Rounds to less than $1 thousand.
(b) Victory Integrity Discovery Fund and Victory Integrity Mid-Cap Value Fund Member Class commenced operations on November 3, 2020.
(continues on next page)
See notes to financial statements.
102
Victory Portfolios | | Statements of Changes in Net Assets | |
(Amounts in Thousands) (continued)
| | | Victory Integrity
Discovery Fund | | Victory Integrity Mid-Cap
Value Fund | | Victory Integrity Small-Cap
Value Fund | |
| | | Six
Months
Ended
December 31,
2020
(unaudited) | | Year
Ended
June 30,
2020 | | Six
Months
Ended
December 31,
2020
(unaudited) | | Year
Ended
June 30,
2020 | | Six
Months
Ended
December 31,
2020
(unaudited) | | Year
Ended
June 30,
2020 | |
Capital Transactions: | |
Class A Shares | |
Proceeds from shares issued | | $ | 1,052 | | | $ | 4,226 | | | $ | 662 | | | $ | 3,987 | | | $ | 11,217 | | | $ | 23,461 | | |
Distributions reinvested | | | — | | | | 1,058 | | | | 234 | | | | 44 | | | | 81 | | | | 495 | | |
Cost of shares redeemed | | | (5,055 | ) | | | (13,704 | ) | | | (1,100 | ) | | | (1,868 | ) | | | (21,311 | ) | | | (56,674 | ) | |
Total Class A Shares | | $ | (4,003 | ) | | $ | (8,420 | ) | | $ | (204 | ) | | $ | 2,163 | | | $ | (10,013 | ) | | $ | (32,718 | ) | |
Class C Shares | |
Proceeds from shares issued | | $ | 34 | | | $ | 219 | | | $ | 16 | | | $ | 54 | | | $ | 139 | | | $ | 538 | | |
Distributions reinvested | | | — | | | | 168 | | | | 1 | | | | — | (a) | | | — | | | | 47 | | |
Cost of shares redeemed | | | (770 | ) | | | (3,625 | ) | | | (11 | ) | | | — | | | | (1,625 | ) | | | (3,569 | ) | |
Total Class C Shares | | $ | (736 | ) | | $ | (3,238 | ) | | $ | 6 | | | $ | 54 | | | $ | (1,486 | ) | | $ | (2,984 | ) | |
Class R Shares | |
Proceeds from shares issued | | $ | 301 | | | $ | 1,386 | | | $ | — | | | $ | — | | | $ | 579 | | | $ | 2,040 | | |
Distributions reinvested | | | — | | | | 85 | | | | — | | | | — | | | | — | | | | 35 | | |
Cost of shares redeemed | | | (472 | ) | | | (1,514 | ) | | | — | | | | — | | | | (1,821 | ) | | | (5,439 | ) | |
Total Class R Shares | | $ | (171 | ) | | $ | (43 | ) | | $ | — | | | $ | — | | | $ | (1,242 | ) | | $ | (3,364 | ) | |
Class R6 Shares | |
Proceeds from shares issued | | $ | — | | | $ | — | | | $ | 9,102 | | | $ | 190,734 | | | $ | 72,502 | | | $ | 354,199 | | |
Distributions reinvested | | | — | | | | — | | | | 4,555 | | | | 1,707 | | | | 5,356 | | | | 9,428 | | |
Cost of shares redeemed | | | — | | | | — | | | | (60,304 | ) | | | (31,573 | ) | | | (283,141 | ) | | | (292,721 | ) | |
Total Class R6 Shares | | $ | — | | | $ | — | | | $ | (46,647 | ) | | $ | 160,868 | | | $ | (205,283 | ) | | $ | 70,906 | | |
Class Y Shares | |
Proceeds from shares issued | | $ | 5,732 | | | $ | 24,172 | | | $ | 1,234 | | | $ | 4,409 | | | $ | 59,510 | | | $ | 224,939 | | |
Distributions reinvested | | | — | | | | 1,407 | | | | 299 | | | | 107 | | | | 1,797 | | | | 6,413 | | |
Cost of shares redeemed | | | (9,806 | ) | | | (51,772 | ) | | | (950 | ) | | | (14,505 | ) | | | (138,039 | ) | | | (501,472 | ) | |
Total Class Y Shares | | $ | (4,074 | ) | | $ | (26,193 | ) | | $ | 583 | | | $ | (9,989 | ) | | $ | (76,732 | ) | | $ | (270,120 | ) | |
Member Class (b) | |
Proceeds from shares issued | | $ | 125 | | | $ | — | | | $ | 85 | | | $ | — | | | $ | — | | | $ | — | | |
Distributions reinvested | | | — | | | | — | | | | 1 | | | | — | | | | — | | | | — | | |
Cost of shares redeemed | | | (2 | ) | | | — | | | | — | | | | — | | | | — | | | | — | | |
Total Member Class | | $ | 123 | | | $ | — | | | $ | 86 | | | $ | — | | | $ | — | | | $ | — | | |
Change in net assets resulting from
capital transactions | | $ | (8,861 | ) | | $ | (37,894 | ) | | $ | (46,176 | ) | | $ | 153,096 | | | $ | (294,756 | ) | | $ | (238,280 | ) | |
(a) Rounds to less than $1 thousand.
(b) Victory Integrity Discovery Fund and Victory Integrity Mid-Cap Value Fund Member Class commenced operations on November 3, 2020.
(continues on next page)
See notes to financial statements.
103
Victory Portfolios | | Statements of Changes in Net Assets | |
(Amounts in Thousands) (continued)
| | | Victory Integrity
Discovery Fund | | Victory Integrity Mid-Cap
Value Fund | | Victory Integrity Small-Cap
Value Fund | |
| | | Six
Months
Ended
December 31,
2020
(unaudited) | | Year
Ended
June 30,
2020 | | Six
Months
Ended
December 31,
2020
(unaudited) | | Year
Ended
June 30,
2020 | | Six
Months
Ended
December 31,
2020
(unaudited) | | Year
Ended
June 30,
2020 | |
Share Transactions: | |
Class A Shares | |
Issued | | | 38 | | | | 159 | | | | 39 | | | | 250 | | | | 406 | | | | 846 | | |
Reinvested | | | — | | | | 31 | | | | 12 | | | | 2 | | | | 2 | | | | 15 | | |
Redeemed | | | (188 | ) | | | (495 | ) | | | (63 | ) | | | (116 | ) | | | (764 | ) | | | (1,943 | ) | |
Total Class A Shares | | | (150 | ) | | | (305 | ) | | | (12 | ) | | | 136 | | | | (356 | ) | | | (1,082 | ) | |
Class C Shares | |
Issued | | | 2 | | | | 12 | | | | 1 | | | | 3 | | | | 5 | | | | 22 | | |
Reinvested | | | — | | | | 7 | | | | — | (a) | | | — | (a) | | | — | | | | 2 | | |
Redeemed | | | (43 | ) | | | (182 | ) | | | (1 | ) | | | — | | | | (70 | ) | | | (143 | ) | |
Total Class C Shares | | | (41 | ) | | | (163 | ) | | | — | (b) | | | 3 | | | | (65 | ) | | | (119 | ) | |
Class R Shares | |
Issued | | | 11 | | | | 47 | | | | — | | | | — | | | | 23 | | | | 81 | | |
Reinvested | | | — | | | | 3 | | | | — | | | | — | | | | — | | | | 1 | | |
Redeemed | | | (19 | ) | | | (61 | ) | | | — | | | | — | | | | (68 | ) | | | (191 | ) | |
Total Class R Shares | | | (8 | ) | | | (11 | ) | | | — | | | | — | | | | (45 | ) | | | (109 | ) | |
Class R6 Shares | |
Issued | | | — | | | | — | | | | 538 | | | | 10,669 | | | | 2,471 | | | | 13,497 | | |
Reinvested | | | — | | | | — | | | | 235 | | | | 88 | | | | 152 | | | | 265 | | |
Redeemed | | | — | | | | — | | | | (3,710 | ) | | | (1,948 | ) | | | (9,774 | ) | | | (10,043 | ) | |
Total Class R6 Shares | | | — | | | | — | | | | (2,937 | ) | | | 8,809 | | | | (7,151 | ) | | | 3,719 | | |
Class Y Shares | |
Issued | | | 171 | | | | 815 | | | | 68 | | | | 259 | | | | 1,951 | | | | 8,217 | | |
Reinvested | | | — | | | | 37 | | | | 15 | | | | 6 | | | | 51 | | | | 182 | | |
Redeemed | | | (338 | ) | | | (1,830 | ) | | | (54 | ) | | | (852 | ) | | | (4,856 | ) | | | (18,245 | ) | |
Total Class Y Shares | | | (167 | ) | | | (978 | ) | | | 29 | | | | (587 | ) | | | (2,854 | ) | | | (9,846 | ) | |
Member Class (b) | |
Issued | | | 4 | | | | — | | | | 5 | | | | — | | | | — | | | | — | | |
Reinvested | | | — | | | | — | | | | — | (a) | | | — | | | | — | | | | — | | |
Redeemed | | | — | (a) | | | — | | | | — | | | | — | | | | — | | | | — | | |
Total Member Class | | | 4 | | | | — | | | | 5 | | | | — | | | | — | | | | — | | |
Change in Shares | | | (362 | ) | | | (1,457 | ) | | | (2,915 | ) | | | 8,361 | | | | (10,471 | ) | | | (7,437 | ) | |
(a) Rounds to less than 1 thousand.
(b) Victory Integrity Discovery Fund and Victory Integrity Mid-Cap Value Fund Member Class commenced operations on November 3, 2020.
See notes to financial statements.
104
Victory Portfolios | | Statements of Changes in Net Assets | |
(Amounts in Thousands)
| | | Victory Integrity Small/
Mid-Cap Value Fund | | Victory Munder Multi-Cap
Fund | | Victory S&P 500 Index
Fund | |
| | | Six
Months
Ended
December 31,
2020
(unaudited) | | Year
Ended
June 30,
2020 | | Six
Months
Ended
December 31,
2020
(unaudited) | | Year
Ended
June 30,
2020 | | Six
Months
Ended
December 31,
2020
(unaudited) | | Year
Ended
June 30,
2020 | |
From Investment Activities: | |
Operations: | |
Net investment income (loss) | | $ | 2,168 | | | $ | 1,209 | | | $ | (56 | ) | | $ | 369 | | | $ | 1,353 | | | $ | 3,075 | | |
Net realized gains (losses) from
investments | | | 3,401 | | | | (13,324 | ) | | | 24,002 | | | | (9,321 | ) | | | 13,033 | | | | 27,234 | | |
Net change in unrealized
appreciation/depreciation
on investments | | | 36,740 | | | | (14,023 | ) | | | 47,442 | | | | 14,670 | | | | 30,904 | | | | (15,381 | ) | |
Change in net assets resulting
from operations | | | 42,309 | | | | (26,138 | ) | | | 71,388 | | | | 5,718 | | | | 45,290 | | | | 14,928 | | |
Distributions to Shareholders: | |
Class A Shares | | | (59 | ) | | | (22 | ) | | | (244 | ) | | | (9,781 | ) | | | (11,146 | ) | | | (20,471 | ) | |
Class C Shares | | | — | | | | — | | | | — | | | | (265 | ) | | | — | | | | — | | |
Class R Shares | | | — | | | | — | | | | — | | | | — | | | | (946 | ) | | | (1,715 | ) | |
Class R6 Shares | | | (1,692 | ) | | | (815 | ) | | | — | | | | — | | | | — | | | | — | | |
Class Y Shares | | | (644 | ) | | | (283 | ) | | | (124 | ) | | | (917 | ) | | | (3,391 | ) | | | (5,159 | ) | |
Member Class (a) | | | (2 | ) | | | — | | | | — | | | | — | | | | — | | | | — | | |
Change in net assets resulting from
distributions to shareholders | | | (2,397 | ) | | | (1,120 | ) | | | (368 | ) | | | (10,963 | ) | | | (15,483 | ) | | | (27,345 | ) | |
Change in net assets resulting from
capital transactions | | | (6,020 | ) | | | 8,516 | | | | (21,340 | ) | | | (34,098 | ) | | | 705 | | | | (8,722 | ) | |
Change in net assets | | | 33,892 | | | | (18,742 | ) | | | 49,680 | | | | (39,343 | ) | | | 30,512 | | | | (21,139 | ) | |
Net Assets: | |
Beginning of period | | | 116,097 | | | | 134,839 | | | | 347,669 | | | | 387,012 | | | | 213,512 | | | | 234,651 | | |
End of period | | $ | 149,989 | | | $ | 116,097 | | | $ | 397,349 | | | $ | 347,669 | | | $ | 244,024 | | | $ | 213,512 | | |
(a) Victory Integrity Small/Mid-Cap Value Fund Member Class commenced operations on November 3, 2020.
(continues on next page)
See notes to financial statements.
105
Victory Portfolios | | Statements of Changes in Net Assets | |
(Amounts in Thousands) (continued)
| | | Victory Integrity Small/
Mid-Cap Value Fund | | Victory Munder Multi-Cap
Fund | | Victory S&P 500 Index
Fund | |
| | | Six
Months
Ended
December 31,
2020
(unaudited) | | Year
Ended
June 30,
2020 | | Six
Months
Ended
December 31,
2020
(unaudited) | | Year
Ended
June 30,
2020 | | Six
Months
Ended
December 31,
2020
(unaudited) | | Year
Ended
June 30,
2020 | |
Capital Transactions: | |
Class A Shares | |
Proceeds from shares issued | | $ | 397 | | | $ | 1,437 | | | $ | 2,954 | | | $ | 8,491 | | | $ | 4,053 | | | $ | 12,097 | | |
Distributions reinvested | | | 59 | | | | 22 | | | | 211 | | | | 8,468 | | | | 9,719 | | | | 17,860 | | |
Cost of shares redeemed | | | (587 | ) | | | (1,062 | ) | | | (22,186 | ) | | | (46,249 | ) | | | (12,803 | ) | | | (54,473 | ) | |
Total Class A Shares | | $ | (131 | ) | | $ | 397 | | | $ | (19,021 | ) | | $ | (29,290 | ) | | $ | 969 | | | $ | (24,516 | ) | |
Class C Shares | |
Proceeds from shares issued | | $ | — | | | $ | — | | | $ | 135 | | | $ | 401 | | | $ | — | | | $ | — | | |
Distributions reinvested | | | — | | | | — | | | | — | | | | 234 | | | | — | | | | — | | |
Cost of shares redeemed | | | — | | | | — | | | | (1,785 | ) | | | (4,844 | ) | | | — | | | | — | | |
Total Class C Shares | | $ | — | | | $ | — | | | $ | (1,650 | ) | | $ | (4,209 | ) | | $ | — | | | $ | — | | |
Class R Shares | |
Proceeds from shares issued | | $ | — | | | $ | — | | | $ | — | | | $ | — | | | $ | 1,593 | | | $ | 4,926 | | |
Distributions reinvested | | | — | | | | — | | | | — | | | | — | | | | 946 | | | | 1,715 | | |
Cost of shares redeemed | | | — | | | | — | | | | — | | | | — | | | | (2,614 | ) | | | (6,634 | ) | |
Total Class R Shares | | $ | — | | | $ | — | | | $ | — | | | $ | — | | | $ | (75 | ) | | $ | 7 | | |
Class R6 Shares | |
Proceeds from shares issued | | $ | 7,686 | | | $ | 22,861 | | | $ | — | | | $ | — | | | $ | — | | | $ | — | | |
Distributions reinvested | | | 1,689 | | | | 813 | | | | — | | | | — | | | | — | | | | — | | |
Cost of shares redeemed | | | (12,496 | ) | | | (20,141 | ) | | | — | | | | — | | | | — | | | | — | | |
Total Class R6 Shares | | $ | (3,121 | ) | | $ | 3,533 | | | $ | — | | | $ | — | | | $ | — | | | $ | — | | |
Class Y Shares | |
Proceeds from shares issued | | $ | 3,004 | | | $ | 8,038 | | | $ | 1,556 | | | $ | 5,469 | | | $ | 3,700 | | | $ | 37,717 | | |
Distributions reinvested | | | 511 | | | | 268 | | | | 82 | | | | 645 | | | | 3,202 | | | | 4,878 | | |
Cost of shares redeemed | | | (6,525 | ) | | | (3,720 | ) | | | (2,307 | ) | | | (6,713 | ) | | | (7,091 | ) | | | (26,808 | ) | |
Total Class Y Shares | | $ | (3,010 | ) | | $ | 4,586 | | | $ | (669 | ) | | $ | (599 | ) | | $ | (189 | ) | | $ | 15,787 | | |
Member Class (a) | |
Proceeds from shares issued | | $ | 249 | | | $ | — | | | $ | — | | | $ | — | | | $ | — | | | $ | — | | |
Distributions reinvested | | | 2 | | | | — | | | | — | | | | — | | | | — | | | | — | | |
Cost of shares redeemed | | | (9 | ) | | | — | | | | — | | | | — | | | | — | | | | — | | |
Total Member Class | | $ | 242 | | | $ | — | | | $ | — | | | $ | — | | | $ | — | | | $ | — | | |
Change in net assets resulting from
capital transactions | | $ | (6,020 | ) | | $ | 8,516 | | | $ | (21,340 | ) | | $ | (34,098 | ) | | $ | 705 | | | $ | (8,722 | ) | |
(a) Victory Integrity Small/Mid-Cap Value Fund Member Class commenced operations on November 3, 2020.
(continues on next page)
See notes to financial statements.
106
Victory Portfolios | | Statements of Changes in Net Assets | |
(Amounts in Thousands) (continued)
| | | Victory Integrity Small/
Mid-Cap Value Fund | | Victory Munder Multi-Cap
Fund | | Victory S&P 500 Index
Fund | |
| | | Six
Months
Ended
December 31,
2020
(unaudited) | | Year
Ended
June 30,
2020 | | Six
Months
Ended
December 31,
2020
(unaudited) | | Year
Ended
June 30,
2020 | | Six
Months
Ended
December 31,
2020
(unaudited) | | Year
Ended
June 30,
2020 | |
Share Transactions: | |
Class A Shares | |
Issued | | | 26 | | | | 97 | | | | 71 | | | | 214 | | | | 184 | | | | 612 | | |
Reinvested | | | 3 | | | | 1 | | | | 5 | | | | 204 | | | | 437 | | | | 880 | | |
Redeemed | | | (39 | ) | | | (74 | ) | | | (519 | ) | | | (1,212 | ) | | | (583 | ) | | | (2,651 | ) | |
Total Class A Shares | | | (10 | ) | | | 24 | | | | (443 | ) | | | (794 | ) | | | 38 | | | | (1,159 | ) | |
Class C Shares | |
Issued | | | — | | | | — | | | | 4 | | | | 13 | | | | — | | | | — | | |
Reinvested | | | — | | | | — | | | | — | | | | 7 | | | | — | | | | — | | |
Redeemed | | | — | | | | — | | | | (58 | ) | | | (157 | ) | | | — | | | | — | | |
Total Class C Shares | | | — | | | | — | | | | (54 | ) | | | (137 | ) | | | — | | | | — | | |
Class R Shares | |
Issued | | | — | | | | — | | | | — | | | | — | | | | 73 | | | | 246 | | |
Reinvested | | | — | | | | — | | | | — | | | | — | | | | 43 | | | | 85 | | |
Redeemed | | | — | | | | — | | | | — | | | | — | | | | (121 | ) | | | (326 | ) | |
Total Class R Shares | | | — | | | | — | | | | — | | | | — | | | | (5 | ) | | | 5 | | |
Class R6 Shares | |
Issued | | | 495 | | | | 1,535 | | | | — | | | | — | | | | — | | | | — | | |
Reinvested | | | 93 | | | | 46 | | | | — | | | | — | | | | — | | | | — | | |
Redeemed | | | (813 | ) | | | (1,330 | ) | | | — | | | | — | | | | — | | | | — | | |
Total Class R6 Shares | | | (225 | ) | | | 251 | | | | — | | | | — | | | | — | | | | — | | |
Class Y Shares | |
Issued | | | 199 | | | | 515 | | | | 34 | | | | 142 | | | | 167 | | | | 1,848 | | |
Reinvested | | | 28 | | | | 15 | | | | 2 | | | | 14 | | | | 143 | | | | 239 | | |
Redeemed | | | (420 | ) | | | (266 | ) | | | (50 | ) | | | (162 | ) | | | (322 | ) | | | (1,294 | ) | |
Total Class Y Shares | | | (193 | ) | | | 264 | | | | (14 | ) | | | (6 | ) | | | (12 | ) | | | 793 | | |
Member Class (a) | |
Issued | | | 14 | | | | — | | | | — | | | | — | | | | — | | | | — | | |
Reinvested | | | — | (b) | | | — | | | | — | | | | — | | | | — | | | | — | | |
Redeemed | | | — | (b) | | | — | | | | — | | | | — | | | | — | | | | — | | |
Total Member Class | | | 14 | | | | — | | | | — | | | | — | | | | — | | | | — | | |
Change in Shares | | | (414 | ) | | | 539 | | | | (511 | ) | | | (937 | ) | | | 21 | | | | (361 | ) | |
(a) Victory Integrity Small/Mid-Cap Value Fund Member Class commenced operations on November 3, 2020.
(b) Rounds to less than 1 thousand.
See notes to financial statements.
107
Victory Portfolios | | Statements of Changes in Net Assets | |
(Amounts in Thousands)
| | | Victory
Munder Mid-Cap Core
Growth Fund | | Victory
Munder Small Cap
Growth Fund | | Victory Trivalent
Emerging Markets
Small-Cap Fund | |
| | | Six
Months
Ended
December 31,
2020
(unaudited) | | Year
Ended
June 30,
2020 | | Six
Months
Ended
December 31,
2020
(unaudited) | | Year
Ended
June 30,
2020 | | Six
Months
Ended
December 31,
2020
(unaudited) | | Year
Ended
June 30,
2020 | |
From Investment Activities: | |
Operations: | |
Net investment income (loss) | | $ | (918 | ) | | $ | (2,195 | ) | | $ | (35 | ) | | $ | (38 | ) | | $ | 60 | | | $ | 106 | | |
Net realized gains (losses)
from investments | | | 80,752 | | | | 254,589 | | | | 470 | | | | 1,238 | | | | 1,077 | | | | (718 | ) | |
Net change in unrealized
appreciation/depreciation
on investments | | | 66,263 | | | | (273,091 | ) | | | 3,464 | | | | 92 | | | | 1,194 | | | | 600 | | |
Change in net assets resulting
from operations | | | 146,097 | | | | (20,697 | ) | | | 3,899 | | | | 1,292 | | | | 2,331 | | | | (12 | ) | |
Distributions to Shareholders: | |
Class A Shares | | | (23,341 | ) | | | (127,008 | ) | | | (36 | ) | | | (18 | ) | | | (8 | ) | | | (6 | ) | |
Class C Shares | | | (3,462 | ) | | | (17,343 | ) | | | — | | | | — | | | | — | | | | — | | |
Class I Shares | | | — | | | | — | | | | (1,071 | ) | | | (702 | ) | | | — | | | | — | | |
Class R Shares | | | (1,885 | ) | | | (8,983 | ) | | | — | | | | — | | | | — | | | | — | | |
Class R6 Shares | | | (8,673 | ) | | | (74,101 | ) | | | — | | | | — | | | | — | | | | — | | |
Class Y Shares | | | (23,441 | ) | | | (283,629 | ) | | | (9 | ) | | | (6 | ) | | | (82 | ) | | | (74 | ) | |
Change in net assets resulting from
distributions to shareholders | | | (60,802 | ) | | | (511,064 | ) | | | (1,116 | ) | | | (726 | ) | | | (90 | ) | | | (80 | ) | |
Change in net assets resulting from
capital transactions | | | (85,351 | ) | | | (342,469 | ) | | | 1,227 | | | | 950 | | | | 51 | | | | (390 | ) | |
Change in net assets | | | (56 | ) | | | (874,230 | ) | | | 4,010 | | | | 1,516 | | | | 2,292 | | | | (482 | ) | |
Net Assets: | |
Beginning of period | | | 584,363 | | | | 1,458,593 | | | | 10,816 | | | | 9,300 | | | | 8,428 | | | | 8,910 | | |
End of period | | $ | 584,307 | | | $ | 584,363 | | | $ | 14,826 | | | $ | 10,816 | | | $ | 10,720 | | | $ | 8,428 | | |
(continues on next page)
See notes to financial statements.
108
Victory Portfolios | | Statements of Changes in Net Assets | |
(Amounts in Thousands) (continued)
| | | Victory
Munder Mid-Cap Core
Growth Fund | | Victory
Munder Small Cap
Growth Fund | | Victory Trivalent
Emerging Markets
Small-Cap Fund | |
| | | Six
Months
Ended
December 31,
2020
(unaudited) | | Year
Ended
June 30,
2020 | | Six
Months
Ended
December 31,
2020
(unaudited) | | Year
Ended
June 30,
2020 | | Six
Months
Ended
December 31,
2020
(unaudited) | | Year
Ended
June 30,
2020 | |
Capital Transactions: | |
Class A Shares | |
Proceeds from shares issued | | $ | 9,084 | | | $ | 29,605 | | | $ | 29 | | | $ | 242 | | | $ | 14 | | | $ | 173 | | |
Distributions reinvested | | | 21,270 | | | | 114,821 | | | | 35 | | | | 18 | | | | 8 | | | | 6 | | |
Cost of shares redeemed | | | (35,672 | ) | | | (115,796 | ) | | | (30 | ) | | | (98 | ) | | | (76 | ) | | | (226 | ) | |
Total Class A Shares | | $ | (5,318 | ) | | $ | 28,630 | | | $ | 34 | | | $ | 162 | | | $ | (54 | ) | | $ | (47 | ) | |
Class C Shares | |
Proceeds from shares issued | | $ | 85 | | | $ | 1,741 | | | $ | — | | | $ | — | | | $ | — | | | $ | — | | |
Distributions reinvested | | | 3,445 | | | | 15,847 | | | | — | | | | — | | | | — | | | | — | | |
Cost of shares redeemed | | | (4,452 | ) | | | (12,234 | ) | | | — | | | | — | | | | — | | | | — | | |
Total Class C Shares | | $ | (922 | ) | | $ | 5,354 | | | $ | — | | | $ | — | | | $ | — | | | $ | — | | |
Class I Shares | |
Proceeds from shares issued | | $ | — | | | $ | — | | | $ | 113 | | | $ | 106 | | | $ | — | | | $ | — | | |
Distributions reinvested | | | — | | | | — | | | | 1,071 | | | | 701 | | | | — | | | | — | | |
Cost of shares redeemed | | | — | | | | — | | | | — | | | | (25 | ) | | | — | | | | — | | |
Total Class I Shares | | $ | — | | | $ | — | | | $ | 1,184 | | | $ | 782 | | | $ | — | | | $ | — | | |
Class R Shares | |
Proceeds from shares issued | | $ | 837 | | | $ | 2,169 | | | $ | — | | | $ | — | | | $ | — | | | $ | — | | |
Distributions reinvested | | | 1,882 | | | | 8,785 | | | | — | | | | — | | | | — | | | | — | | |
Cost of shares redeemed | | | (2,778 | ) | | | (6,902 | ) | | | — | | | | — | | | | — | | | | — | | |
Total Class R Shares | | $ | (59 | ) | | $ | 4,052 | | | $ | — | | | $ | — | | | $ | — | | | $ | — | | |
Class R6 Shares | |
Proceeds from shares issued | | $ | 7,050 | | | $ | 24,724 | | | $ | — | | | $ | — | | | $ | — | | | $ | — | | |
Distributions reinvested | | | 8,636 | | | | 73,891 | | | | — | | | | — | | | | — | | | | — | | |
Cost of shares redeemed | | | (47,084 | ) | | | (221,336 | ) | | | — | | | | — | | | | — | | | | — | | |
Total Class R6 Shares | | $ | (31,398 | ) | | $ | (122,721 | ) | | $ | — | | | $ | — | | | $ | — | | | $ | — | | |
Class Y Shares | |
Proceeds from shares issued | | $ | 7,415 | | | $ | 133,669 | | | $ | — | | | $ | — | | | $ | 392 | | | $ | 449 | | |
Distributions reinvested | | | 22,365 | | | | 256,344 | | | | 9 | | | | 6 | | | | 82 | | | | 74 | | |
Cost of shares redeemed | | | (77,434 | ) | | | (647,797 | ) | | | — | | | | — | | | | (369 | ) | | | (866 | ) | |
Total Class Y Shares | | $ | (47,654 | ) | | $ | (257,784 | ) | | $ | 9 | | | $ | 6 | | | $ | 105 | | | $ | (343 | ) | |
Change in net assets resulting from
capital transactions | | $ | (85,351 | ) | | $ | (342,469 | ) | | $ | 1,227 | | | $ | 950 | | | $ | 51 | | | $ | (390 | ) | |
(continues on next page)
See notes to financial statements.
109
Victory Portfolios | | Statements of Changes in Net Assets | |
(Amounts in Thousands) (continued)
| | | Victory
Munder Mid-Cap Core
Growth Fund | | Victory
Munder Small Cap
Growth Fund | | Victory Trivalent
Emerging Markets
Small-Cap Fund | |
| | | Six
Months
Ended
December 31,
2020
(unaudited) | | Year
Ended
June 30,
2020 | | Six
Months
Ended
December 31,
2020
(unaudited) | | Year
Ended
June 30,
2020 | | Six
Months
Ended
December 31,
2020
(unaudited) | | Year
Ended
June 30,
2020 | |
Share Transactions: | |
Class A Shares | |
Issued | | | 688 | | | | 2,039 | | | | 2 | | | | 18 | | | | 1 | | | | 14 | | |
Reinvested | | | 1,611 | | | | 8,445 | | | | 2 | | | | 1 | | | | 1 | | | | 1 | | |
Redeemed | | | (2,713 | ) | | | (7,341 | ) | | | (2 | ) | | | (8 | ) | | | (6 | ) | | | (21 | ) | |
Total Class A Shares | | | (414 | ) | | | 3,143 | | | | 2 | | | | 11 | | | | (4 | ) | | | (6 | ) | |
Class C Shares | |
Issued | | | 16 | | | | 252 | | | | — | | | | — | | | | — | | | | — | | |
Reinvested | | | 762 | | | | 2,542 | | | | — | | | | — | | | | — | | | | — | | |
Redeemed | | | (824 | ) | | | (1,609 | ) | | | — | | | | — | | | | — | | | | — | | |
Total Class C Shares | | | (46 | ) | | | 1,185 | | | | — | | | | — | | | | — | | | | — | | |
Class I Shares | |
Issued | | | — | | | | — | | | | 6 | | | | 8 | | | | — | | | | — | | |
Reinvested | | | — | | | | — | | | | 61 | | | | 50 | | | | — | | | | — | | |
Redeemed | | | — | | | | — | | | | — | | | | (1 | ) | | | — | | | | — | | |
Total Class I Shares | | | — | | | | — | | | | 67 | | | | 57 | | | | — | | | | — | | |
Class R Shares | |
Issued | | | 74 | | | | 188 | | | | — | | | | — | | | | — | | | | — | | |
Reinvested | | | 172 | | | | 752 | | | | — | | | | — | | | | — | | | | — | | |
Redeemed | | | (251 | ) | | | (514 | ) | | | — | | | | — | | | | — | | | | — | | |
Total Class R Shares | | | (5 | ) | | | 426 | | | | — | | | | — | | | | — | | | | — | | |
Class R6 Shares | |
Issued | | | 421 | | | | 1,234 | | | | — | | | | — | | | | — | | | | — | | |
Reinvested | | | 505 | | | | 4,387 | | | | — | | | | — | | | | — | | | | — | | |
Redeemed | | | (2,884 | ) | | | (9,938 | ) | | | — | | | | — | | | | — | | | | — | | |
Total Class R6 Shares | | | (1,958 | ) | | | (4,317 | ) | | | — | | | | — | | | | — | | | | — | | |
Class Y Shares | |
Issued | | | 469 | | | | 6,000 | | | | — | | | | — | | | | 28 | | | | 41 | | |
Reinvested | | | 1,376 | | | | 15,847 | | | | 1 | | | | — | (a) | | | 6 | | | | 6 | | |
Redeemed | | | (4,862 | ) | | | (35,576 | ) | | | — | | | | — | | | | (28 | ) | | | (80 | ) | |
Total Class Y Shares | | | (3,017 | ) | | | (13,729 | ) | | | 1 | | | | — | (a) | | | 6 | | | | (33 | ) | |
Change in Shares | | | (5,440 | ) | | | (13,292 | ) | | | 70 | | | | 68 | | | | 2 | | | | (39 | ) | |
(a) Rounds to less than 1 thousand
See notes to financial statements.
110
Victory Portfolios | | Statements of Changes in Net Assets | |
(Amounts in Thousands)
| | | Victory
Trivalent International
Fund-Core Equity | | Victory
Trivalent International
Small-Cap Fund | | Victory
INCORE Total Return
Bond Fund | |
| | | Six
Months
Ended
December 31,
2020
(unaudited) | | Year
Ended
June 30,
2020 | | Six
Months
Ended
December 31,
2020
(unaudited) | | Year
Ended
June 30,
2020 | | Six
Months
Ended
December 31,
2020
(unaudited) | | Year
Ended
June 30,
2020 | |
From Investment Activities: | |
Operations: | |
Net investment income (loss) | | $ | 1,461 | | | $ | 2,053 | | | $ | 6,673 | | | $ | 14,373 | | | $ | 594 | | | $ | 1,552 | | |
Net realized gains (losses) from
investments | | | 1,425 | | | | (4,895 | ) | | | 198,027 | | | | (70,162 | ) | | | 407 | | | | 2,336 | | |
Net change in unrealized
appreciation/depreciation
on investments | | | 26,749 | | | | (1,138 | ) | | | 323,212 | | | | 41,304 | | | | 878 | | | | 1,323 | | |
Change in net assets resulting
from operations | | | 29,635 | | | | (3,980 | ) | | | 527,912 | | | | (14,485 | ) | | | 1,879 | | | | 5,211 | | |
Distributions to Shareholders: | |
Class A Shares | | | (62 | ) | | | (48 | ) | | | — | | | | (1,886 | ) | | | (131 | ) | | | (300 | ) | |
Class C Shares | | | — | (a) | | | — | (a) | | | — | | | | (52 | ) | | | (5 | ) | | | (10 | ) | |
Class I Shares | | | (46 | ) | | | (33 | ) | | | (6,561 | ) | | | (21,459 | ) | | | — | | | | — | | |
Class R6 Shares | | | (2,687 | ) | | | (902 | ) | | | (355 | ) | | | (989 | ) | | | (340 | ) | | | (710 | ) | |
Class Y Shares | | | (110 | ) | | | (96 | ) | | | (2,549 | ) | | | (13,429 | ) | | | (433 | ) | | | (881 | ) | |
Change in net assets resulting from
distributions to shareholders | | | (2,905 | ) | | | (1,079 | ) | | | (9,465 | ) | | | (37,815 | ) | | | (909 | ) | | | (1,901 | ) | |
Change in net assets resulting from
capital transactions | | | 42,231 | | | | 116,106 | | | | 286,004 | | | | 108,621 | | | | (2,266 | ) | | | (434 | ) | |
Change in net assets | | | 68,961 | | | | 111,047 | | | | 804,451 | | | | 56,321 | | | | (1,296 | ) | | | 2,876 | | |
Net Assets: | |
Beginning of period | | | 133,140 | | | | 22,093 | | | | 1,863,985 | | | | 1,807,664 | | | | 71,653 | | | | 68,777 | | |
End of period | | $ | 202,101 | | | $ | 133,140 | | | $ | 2,668,436 | | | $ | 1,863,985 | | | $ | 70,357 | | | $ | 71,653 | | |
(a) Rounds to less than $1 thousand
(continues on next page)
See notes to financial statements.
111
Victory Portfolios | | Statements of Changes in Net Assets | |
(Amounts in Thousands) (continued)
| | | Victory
Trivalent International
Fund-Core Equity | | Victory
Trivalent International
Small-Cap Fund | | Victory
INCORE Total Return
Bond Fund | |
| | | Six
Months
Ended
December 31,
2020
(unaudited) | | Year
Ended
June 30,
2020 | | Six
Months
Ended
December 31,
2020
(unaudited) | | Year
Ended
June 30,
2020 | | Six
Months
Ended
December 31,
2020
(unaudited) | | Year
Ended
June 30,
2020 | |
Capital Transactions: | |
Class A Shares | |
Proceeds from shares issued | | $ | 507 | | | $ | 337 | | | $ | 19,384 | | | $ | 35,046 | | | $ | 321 | | | $ | 1,275 | | |
Distributions reinvested | | | 53 | | | | 42 | | | | — | | | | 1,735 | | | | 115 | | | | 252 | | |
Cost of shares redeemed | | | (788 | ) | | | (892 | ) | | | (72,898 | ) | | | (62,948 | ) | | | (1,263 | ) | | | (2,846 | ) | |
Total Class A Shares | | $ | (228 | ) | | $ | (513 | ) | | $ | (53,514 | ) | | $ | (26,167 | ) | | $ | (827 | ) | | $ | (1,319 | ) | |
Class C Shares | |
Proceeds from shares issued | | $ | 2 | | | $ | 10 | | | $ | 229 | | | $ | 664 | | | $ | 72 | | | $ | 340 | | |
Distributions reinvested | | | — | (a) | | | — | (a) | | | — | | | | 42 | | | | 5 | | | | 10 | | |
Cost of shares redeemed | | | (110 | ) | | | (118 | ) | | | (855 | ) | | | (1,180 | ) | | | (143 | ) | | | (230 | ) | |
Total Class C Shares | | $ | (108 | ) | | $ | (108 | ) | | $ | (626 | ) | | $ | (474 | ) | | $ | (66 | ) | | $ | 120 | | |
Class I Shares | |
Proceeds from shares issued | | $ | 0 | | | $ | 912 | | | $ | 454,896 | | | $ | 350,308 | | | $ | — | | | $ | — | | |
Distributions reinvested | | | 46 | | | | 32 | | | | 5,005 | | | | 10,793 | | | | — | | | | — | | |
Cost of shares redeemed | | | (1 | ) | | | (469 | ) | | | (146,708 | ) | | | (266,728 | ) | | | — | | | | — | | |
Total Class I Shares | | $ | 45 | | | $ | 475 | | | $ | 313,193 | | | $ | 94,373 | | | $ | — | | | $ | — | | |
Class R6 Shares | |
Proceeds from shares issued | | $ | 41,541 | | | $ | 118,773 | | | $ | 30,208 | | | $ | 46,552 | | | $ | 222 | | | $ | 536 | | |
Distributions reinvested | | | 2,687 | | | | 902 | | | | 354 | | | | 989 | | | | 340 | | | | 710 | | |
Cost of shares redeemed | | | (1,707 | ) | | | (2,003 | ) | | | (17,300 | ) | | | (16,987 | ) | | | (976 | ) | | | (1,392 | ) | |
Total Class R6 Shares | | $ | 42,521 | | | $ | 117,672 | | | $ | 13,262 | | | $ | 30,554 | | | $ | (414 | ) | | $ | (146 | ) | |
Class Y Shares | |
Proceeds from shares issued | | $ | 145 | | | $ | 241 | | | $ | 164,577 | | | $ | 257,621 | | | $ | 96 | | | $ | 1,271 | | |
Distributions reinvested | | | 97 | | | | 87 | | | | 2,460 | | | | 11,950 | | | | 305 | | | | 617 | | |
Cost of shares redeemed | | | (241 | ) | | | (1,748 | ) | | | (153,348 | ) | | | (259,236 | ) | | | (1,360 | ) | | | (977 | ) | |
Total Class Y Shares | | $ | 1 | | | $ | (1,420 | ) | | $ | 13,689 | | | $ | 10,335 | | | $ | (959 | ) | | $ | 911 | | |
Change in net assets resulting from
capital transactions | | $ | 42,231 | | | $ | 116,106 | | | $ | 286,004 | | | $ | 108,621 | | | $ | (2,266 | ) | | $ | (434 | ) | |
(continues on next page)
See notes to financial statements.
112
Victory Portfolios | | Statements of Changes in Net Assets | |
(Amounts in Thousands) (continued)
| | | Victory
Trivalent International
Fund-Core Equity | | Victory
Trivalent International
Small-Cap Fund | | Victory
INCORE Total Return
Bond Fund | |
| | | Six
Months
Ended
December 31,
2020
(unaudited) | | Year
Ended
June 30,
2020 | | Six
Months
Ended
December 31,
2020
(unaudited) | | Year
Ended
June 30,
2020 | | Six
Months
Ended
December 31,
2020
(unaudited) | | Year
Ended
June 30,
2020 | |
Share Transactions: | |
Class A Shares | |
Issued | | | 74 | | | | 51 | | | | 1,351 | | | | 2,784 | | | | 32 | | | | 133 | | |
Reinvested | | | 7 | | | | 6 | | | | — | | | | 124 | | | | 11 | | | | 26 | | |
Redeemed | | | (113 | ) | | | (134 | ) | | | (4,952 | ) | | | (5,054 | ) | | | (126 | ) | | | (297 | ) | |
Total Class A Shares | | | (32 | ) | | | (77 | ) | | | (3,601 | ) | | | (2,146 | ) | | | (83 | ) | | | (138 | ) | |
Class C Shares | |
Issued | | | — | (b) | | | 1 | | | | 16 | | | | 54 | | | | 7 | | | | 35 | | |
Reinvested | | | — | (b) | | | — | (b) | | | — | | | | 3 | | | | 1 | | | | 1 | | |
Redeemed | | | (16 | ) | | | (18 | ) | | | (62 | ) | | | (97 | ) | | | (15 | ) | | | (23 | ) | |
Total Class C Shares | | | (16 | ) | | | (17 | ) | | | (46 | ) | | | (40 | ) | | | (7 | ) | | | 13 | | |
Class I Shares | |
Issued | | | — | (b) | | | 135 | | | | 31,032 | | | | 27,996 | | | | — | | | | — | | |
Reinvested | | | 6 | | | | 4 | | | | 316 | | | | 769 | | | | — | | | | — | | |
Redeemed | | | — | (b) | | | (72 | ) | | | (9,998 | ) | | | (23,160 | ) | | | — | | | | — | | |
Total Class I Shares | | | 6 | | | | 67 | | | | 21,350 | | | | 5,605 | | | | — | | | | — | | |
Class R6 Shares | |
Issued | | | 5,775 | | | | 17,546 | | | | 2,073 | | | | 3,656 | | | | 22 | | | | 55 | | |
Reinvested | | | 357 | | | | 122 | | | | 22 | | | | 70 | | | | 34 | | | | 74 | | |
Redeemed | | | (240 | ) | | | (319 | ) | | | (1,171 | ) | | | (1,331 | ) | | | (97 | ) | | | (144 | ) | |
Total Class R6 Shares | | | 5,892 | | | | 17,349 | | | | 924 | | | | 2,395 | | | | (41 | ) | | | (15 | ) | |
Class Y Shares | |
Issued | | | 21 | | | | 35 | | | | 11,235 | | | | 20,940 | | | | 10 | | | | 130 | | |
Reinvested | | | 13 | | | | 12 | | | | 156 | | | | 855 | | | | 30 | | | | 64 | | |
Redeemed | | | (35 | ) | | | (275 | ) | | | (10,541 | ) | | | (21,266 | ) | | | (135 | ) | | | (102 | ) | |
Total Class Y Shares | | | (1 | ) | | | (228 | ) | | | 850 | | | | 529 | | | | (95 | ) | | | 92 | | |
Change in Shares | | | 5,849 | | | | 17,094 | | | | 19,477 | | | | 6,343 | | | | (226 | ) | | | (48 | ) | |
(a) Rounds to less than $1 thousand.
(b) Rounds to less than 1 thousand.
See notes to financial statements.
113
Victory Portfolios | | Financial Highlights | |
For a Share Outstanding Throughout Each Period
| | | | | Investment Activities | | Distributions to
Shareholders From | |
| | | Net Asset
Value,
Beginning of
Period | | Net
Investment
Income
(Loss)(a) | | Net
Realized and
Unrealized
Gains
(Losses) on
Investments | | Total from
Investment
Activities | | Net
Investment
Income | | Net Realized
Gains from
Investments | | Total
Distributions | |
Victory Integrity Discovery Fund | |
Class A | |
Six Months Ended
12/31/20
(unaudited) | | $ | 24.03 | | | | 0.08 | | | | 9.66 | | | | 9.74 | | | | — | | | | — | | | | — | | |
Year Ended
6/30/20 | | $ | 32.28 | | | | (0.05 | ) | | | (7.38 | ) | | | (7.43 | ) | | | — | | | | (0.82 | ) | | | (0.82 | ) | |
Year Ended
6/30/19 | | $ | 42.75 | | | | (0.11 | ) | | | (5.61 | ) | | | (5.72 | ) | | | — | | | | (4.75 | ) | | | (4.75 | ) | |
Year Ended
6/30/18 | | $ | 41.01 | | | | (0.16 | ) | | | 6.40 | | | | 6.24 | | | | — | | | | (4.50 | ) | | | (4.50 | ) | |
Year Ended
6/30/17 | | $ | 32.71 | | | | (0.19 | ) | | | 10.10 | | | | 9.91 | | | | — | | | | (1.61 | ) | | | (1.61 | ) | |
Year Ended
6/30/16 | | $ | 38.13 | | | | (0.09 | ) | | | (2.73 | ) | | | (2.82 | ) | | | — | | | | (2.65 | ) | | | (2.65 | ) | |
Class C | |
Six Months Ended
12/31/20
(unaudited) | | $ | 16.32 | | | | (0.02 | ) | | | 6.55 | | | | 6.53 | | | | — | | | | — | | | | — | | |
Year Ended
6/30/20 | | $ | 22.36 | | | | (0.22 | ) | | | (5.00 | ) | | | (5.22 | ) | | | — | | | | (0.82 | ) | | | (0.82 | ) | |
Year Ended
6/30/19 | | $ | 31.69 | | | | (0.28 | ) | | | (4.30 | ) | | | (4.58 | ) | | | — | | | | (4.75 | ) | | | (4.75 | ) | |
Year Ended
6/30/18 | | $ | 31.69 | | | | (0.34 | ) | | | 4.84 | | | | 4.50 | | | | — | | | | (4.50 | ) | | | (4.50 | ) | |
Year Ended
6/30/17 | | $ | 25.76 | | | | (0.38 | ) | | | 7.92 | | | | 7.54 | | | | — | | | | (1.61 | ) | | | (1.61 | ) | |
Year Ended
6/30/16 | | $ | 30.85 | | | | (0.28 | ) | | | (2.21 | ) | | | (2.49 | ) | | | — | | | | (2.65 | ) | | | (2.65 | ) | |
(a) Per share net investment income (loss) has been calculated using the average daily shares method.
(b) Not annualized for periods less than one year.
(c) Annualized for periods less than one year.
(d) Portfolio turnover is calculated on the basis of the Fund as a whole without distinguishing between the classes of shares issued.
(e) The Fund received monies related to a nonrecurring refund from the prior custodian. The corresponding impact to the total return was 0.16% for the year ended June 30, 2016 (See Note 8).
See notes to financial statements.
114
Victory Portfolios | | Financial Highlights — continued | |
For a Share Outstanding Throughout Each Period
| | | | | Ratios to Average Net Assets | | Supplemental Data | |
| | | Capital
Contributions
from Prior
Custodian,
Net (See
Note 8) | | Net Asset
Value,
End of
Period | | Total
Return
(Excludes
Sales
Charge)(b) | | Net
Expenses(c) | | Net
Investment
Income
(Loss)(c) | | Gross
Expenses(c) | | Net Assets,
End of
Period
(000's) | | Portfolio
Turnover(b)(d) | |
Victory Integrity Discovery Fund | |
Class A | |
Six Months Ended
12/31/20
(unaudited) | | | — | | | $ | 33.77 | | | | 40.53 | % | | | 1.64 | % | | | 0.58 | % | | | 1.64 | % | | $ | 37,959 | | | | 19 | % | |
Year Ended
6/30/20 | | | — | | | $ | 24.03 | | | | (23.78 | )% | | | 1.59 | % | | | (0.18 | )% | | | 1.59 | % | | $ | 30,614 | | | | 40 | % | |
Year Ended
6/30/19 | | | — | | | $ | 32.28 | | | | (12.02 | )% | | | 1.55 | % | | | (0.29 | )% | | | 1.55 | % | | $ | 50,963 | | | | 40 | % | |
Year Ended
6/30/18 | | | — | | | $ | 42.75 | | | | 15.76 | % | | | 1.54 | % | | | (0.39 | )% | | | 1.54 | % | | $ | 67,840 | | | | 45 | % | |
Year Ended
6/30/17 | | | — | | | $ | 41.01 | | | | 30.36 | % | | | 1.55 | % | | | (0.50 | )% | | | 1.55 | % | | $ | 85,228 | | | | 110 | % | |
Year Ended
6/30/16 | | | 0.05 | | | $ | 32.71 | | | | (7.34 | )%(e) | | | 1.60 | % | | | (0.27 | )% | | | 1.60 | % | | $ | 48,759 | | | | 42 | % | |
Class C | |
Six Months Ended
12/31/20
(unaudited) | | | — | | | $ | 22.85 | | | | 40.01 | % | | | 2.45 | % | | | (0.24 | )% | | | 2.92 | % | | $ | 2,133 | | | | 19 | % | |
Year Ended
6/30/20 | | | — | | | $ | 16.32 | | | | (24.42 | )% | | | 2.46 | % | | | (1.09 | )% | | | 2.52 | % | | $ | 2,194 | | | | 40 | % | |
Year Ended
6/30/19 | | | — | | | $ | 22.36 | | | | (12.74 | )% | | | 2.34 | % | | | (1.07 | )% | | | 2.34 | % | | $ | 6,633 | | | | 40 | % | |
Year Ended
6/30/18 | | | — | | | $ | 31.69 | | | | 14.88 | % | | | 2.32 | % | | | (1.10 | )% | | | 2.32 | % | | $ | 9,871 | | | | 45 | % | |
Year Ended
6/30/17 | | | — | | | $ | 31.69 | | | | 29.33 | % | | | 2.36 | % | | | (1.28 | )% | | | 2.36 | % | | $ | 15,796 | | | | 110 | % | |
Year Ended
6/30/16 | | | 0.05 | | | $ | 25.76 | | | | (8.04 | )%(e) | | | 2.38 | % | | | (1.05 | )% | | | 2.38 | % | | $ | 14,096 | | | | 42 | % | |
(continues on next page)
See notes to financial statements.
115
Victory Portfolios | | Financial Highlights | |
For a Share Outstanding Throughout Each Period
| | | | | Investment Activities | | Distributions to
Shareholders From | |
| | | Net Asset
Value,
Beginning of
Period | | Net
Investment
Income
(Loss)(a) | | Net
Realized and
Unrealized
Gains
(Losses) on
Investments | | Total from
Investment
Activities | | Net
Investment
Income | | Net Realized
Gains from
Investments | | Total
Distributions | |
Victory Integrity Discovery Fund | |
Class R | |
Six Months Ended
12/31/20
(unaudited) | | $ | 22.45 | | | | 0.02 | | | | 9.02 | | | | 9.04 | | | | — | | | | — | | | | — | | |
Year Ended
6/30/20 | | $ | 30.36 | | | | (0.18 | ) | | | (6.91 | ) | | | (7.09 | ) | | | — | | | | (0.82 | ) | | | (0.82 | ) | |
Year Ended
6/30/19 | | $ | 40.76 | | | | (0.28 | ) | | | (5.37 | ) | | | (5.65 | ) | | | — | | | | (4.75 | ) | | | (4.75 | ) | |
Year Ended
6/30/18 | | $ | 39.49 | | | | (0.28 | ) | | | 6.05 | | | | 5.77 | | | | — | | | | (4.50 | ) | | | (4.50 | ) | |
Year Ended
6/30/17 | | $ | 31.71 | | | | (0.37 | ) | | | 9.76 | | | | 9.39 | | | | — | | | | (1.61 | ) | | | (1.61 | ) | |
Year Ended
6/30/16 | | $ | 37.21 | | | | (0.24 | ) | | | (2.66 | ) | | | (2.90 | ) | | | — | | | | (2.65 | ) | | | (2.65 | ) | |
Class Y | |
Six Months Ended
12/31/20
(unaudited) | | $ | 26.64 | | | | 0.12 | | | | 10.73 | | | | 10.85 | | | | — | | | | — | | | | — | | |
Year Ended
6/30/20 | | $ | 35.65 | | | | — | (f) | | | (8.19 | ) | | | (8.19 | ) | | | — | | | | (0.82 | ) | | | (0.82 | ) | |
Year Ended
6/30/19 | | $ | 46.47 | | | | (0.03 | ) | | | (6.04 | ) | | | (6.07 | ) | | | — | | | | (4.75 | ) | | | (4.75 | ) | |
Year Ended
6/30/18 | | $ | 44.11 | | | | (0.05 | ) | | | 6.91 | | | | 6.86 | | | | — | (f) | | | (4.50 | ) | | | (4.50 | ) | |
Year Ended
6/30/17 | | $ | 35.02 | | | | (0.13 | ) | | | 10.83 | | | | 10.70 | | | | — | | | | (1.61 | ) | | | (1.61 | ) | |
Year Ended
6/30/16 | | $ | 40.52 | | | | (0.01 | ) | | | (2.89 | ) | | | (2.90 | ) | | | — | | | | (2.65 | ) | | | (2.65 | ) | |
Member Class | |
11/3/20(h)
through
12/31/20
(unaudited) | | $ | 26.37 | | | | 0.03 | | | | 7.38 | | | | 7.41 | | | | — | | | | — | | | | — | | |
(a) Per share net investment income (loss) has been calculated using the average daily shares method.
(b) Not annualized for periods less than one year.
(c) Annualized for periods less than one year.
(d) Portfolio turnover is calculated on the basis of the Fund as a whole without distinguishing between the classes of shares issued.
(e) The Fund received monies related to a nonrecurring refund from the prior custodian. The corresponding impact to the total return was 0.16% for the year ended June 30, 2016 (See Note 8).
(f) Amount is less than $0.005.
(g) Amount is less than 0.005%.
(h) Commencement of operations.
See notes to financial statements.
116
Victory Portfolios | | Financial Highlights — continued | |
For a Share Outstanding Throughout Each Period
| | | | | Ratios to Average Net Assets | | Supplemental Data | |
| | | Capital
Contributions
from Prior
Custodian,
Net (See
Note 8) | | Net Asset
Value,
End of
Period | | Total
Return
(Excludes
Sales
Charge)(b) | | Net
Expenses(c) | | Net
Investment
Income
(Loss)(c) | | Gross
Expenses(c) | | Net Assets,
End of
Period
(000's) | | Portfolio
Turnover(b)(d) | |
Victory Integrity Discovery Fund | |
Class R | |
Six Months Ended
12/31/20
(unaudited) | | | — | | | $ | 31.49 | | | | 40.20 | % | | | 2.08 | % | | | 0.14 | % | | | 2.43 | % | | $ | 2,556 | | | | 19 | % | |
Year Ended
6/30/20 | | | — | | | $ | 22.45 | | | | (24.10 | )% | | | 2.08 | % | | | (0.65 | )% | | | 2.33 | % | | $ | 1,990 | | | | 40 | % | |
Year Ended
6/30/19 | | | — | | | $ | 30.36 | | | | (12.49 | )% | | | 2.08 | % | | | (0.84 | )% | | | 2.41 | % | | $ | 3,038 | | | | 40 | % | |
Year Ended
6/30/18 | | | — | | | $ | 40.76 | | | | 15.15 | % | | | 2.08 | % | | | (0.70 | )% | | | 2.27 | % | | $ | 3,465 | | | | 45 | % | |
Year Ended
6/30/17 | | | — | | | $ | 39.49 | | | | 29.67 | % | | | 2.08 | % | | | (0.99 | )% | | | 2.56 | % | | $ | 2,291 | | | | 110 | % | |
Year Ended
6/30/16 | | | 0.05 | | | $ | 31.71 | | | | (7.76 | )%(e) | | | 2.08 | % | | | (0.75 | )% | | | 2.39 | % | | $ | 1,696 | | | | 42 | % | |
Class Y | |
Six Months Ended
12/31/20
(unaudited) | | | — | | | $ | 37.49 | | | | 40.73 | % | | | 1.40 | % | | | 0.78 | % | | | 1.40 | % | | $ | 32,469 | | | | 19 | % | |
Year Ended
6/30/20 | | | — | | | $ | 26.64 | | | | (23.64 | )% | | | 1.38 | % | | | — | %(g) | | | 1.38 | % | | $ | 27,519 | | | | 40 | % | |
Year Ended
6/30/19 | | | — | | | $ | 35.65 | | | | (11.81 | )% | | | 1.30 | % | | | (0.06 | )% | | | 1.30 | % | | $ | 71,708 | | | | 40 | % | |
Year Ended
6/30/18 | | | — | | | $ | 46.47 | | | | 16.08 | % | | | 1.28 | % | | | (0.12 | )% | | | 1.28 | % | | $ | 78,079 | | | | 45 | % | |
Year Ended
6/30/17 | | | — | | | $ | 44.11 | | | | 30.62 | % | | | 1.38 | % | | | (0.30 | )% | | | 1.38 | % | | $ | 49,468 | | | | 110 | % | |
Year Ended
6/30/16 | | | 0.05 | | | $ | 35.02 | | | | (7.10 | )%(e) | | | 1.35 | % | | | (0.03 | )% | | | 1.35 | % | | $ | 27,622 | | | | 42 | % | |
Member Class | |
11/3/20(h)
through
12/31/20
(unaudited) | | | — | | | $ | 33.78 | | | | 28.14 | % | | | 1.50 | % | | | 0.52 | % | | | 24.38 | % | | $ | 132 | | | | 19 | % | |
See notes to financial statements.
117
Victory Portfolios | | Financial Highlights | |
For a Share Outstanding Throughout Each Period
| | | | | Investment Activities | | Distributions to
Shareholders From | |
| | | Net Asset
Value,
Beginning of
Period | | Net
Investment
Income
(Loss)(a) | | Net Realized
and Unrealized
Gains (Losses)
on Investments | | Total from
Investment
Activities | | Net
Investment
Income | | Net Realized
Gains from
Investments | |
Victory Integrity Mid-Cap Value Fund | |
Class A | |
Six Months Ended
12/31/20 (unaudited) | | $ | 15.30 | | | | 0.27 | | | | 4.56 | | | | 4.83 | | | | (0.45 | ) | | | — | | |
Year Ended 6/30/20 | | $ | 17.86 | | | | 0.24 | | | | (2.70 | ) | | | (2.46 | ) | | | (0.10 | ) | | | — | | |
Year Ended 6/30/19 | | $ | 19.17 | | | | 0.19 | | | | (0.32 | ) | | | (0.13 | ) | | | (0.19 | ) | | | (0.99 | ) | |
Year Ended 6/30/18 | | $ | 17.91 | | | | 0.19 | | | | 1.84 | | | | 2.03 | | | | (0.15 | ) | | | (0.62 | ) | |
Year Ended 6/30/17 | | $ | 15.43 | | | | 0.03 | | | | 2.45 | | | | 2.48 | | | | — | | | | — | | |
Year Ended 6/30/16 | | $ | 15.54 | | | | 0.07 | | | | (0.01 | ) | | | 0.06 | | | | (0.04 | ) | | | (0.13 | ) | |
Class C | |
Six Months Ended
12/31/20 (unaudited) | | $ | 15.37 | | | | 0.20 | | | | 4.59 | | | | 4.79 | | | | (0.33 | ) | | | — | | |
11/4/19(e) through
6/30/20 | | $ | 18.75 | | | | 0.11 | | | | (3.39 | ) | | | (3.28 | ) | | | (0.10 | ) | | | — | | |
Class R6 | |
Six Months Ended
12/31/20 (unaudited) | | $ | 15.47 | | | | 0.30 | | | | 4.62 | | | | 4.92 | | | | (0.52 | ) | | | — | | |
Year Ended 6/30/20 | | $ | 18.02 | | | | 0.33 | | | | (2.74 | ) | | | (2.41 | ) | | | (0.14 | ) | | | — | | |
Year Ended 6/30/19 | | $ | 19.30 | | | | 0.26 | | | | (0.32 | ) | | | (0.06 | ) | | | (0.23 | ) | | | (0.99 | ) | |
Year Ended 6/30/18 | | $ | 18.02 | | | | 0.22 | | | | 1.87 | | | | 2.09 | | | | (0.19 | ) | | | (0.62 | ) | |
Year Ended 6/30/17 | | $ | 15.53 | | | | 0.12 | | | | 2.43 | | | | 2.55 | | | | (0.06 | ) | | | — | | |
12/15/15(e) through
6/30/16 | | $ | 14.38 | | | | 0.06 | | | | 1.30 | | | | 1.36 | | | | (0.08 | ) | | | (0.13 | ) | |
Class Y | |
Six Months Ended
12/31/20 (unaudited) | | $ | 15.44 | | | | 0.30 | | | | 4.60 | | | | 4.90 | | | | (0.49 | ) | | | — | | |
Year Ended 6/30/20 | | $ | 18.02 | | | | 0.25 | | | | (2.68 | ) | | | (2.43 | ) | | | (0.15 | ) | | | — | | |
Year Ended 6/30/19 | | $ | 19.34 | | | | 0.28 | | | | (0.37 | ) | | | (0.09 | ) | | | (0.24 | ) | | | (0.99 | ) | |
Year Ended 6/30/18 | | $ | 18.06 | | | | 0.24 | | | | 1.85 | | | | 2.09 | | | | (0.19 | ) | | | (0.62 | ) | |
Year Ended 6/30/17 | | $ | 15.58 | | | | 0.13 | | | | 2.43 | | | | 2.56 | | | | (0.08 | ) | | | — | | |
Year Ended 6/30/16 | | $ | 15.65 | | | | 0.13 | | | | (0.02 | ) | | | 0.11 | | | | (0.05 | ) | | | (0.13 | ) | |
Member Class | |
11/3/20(e) through
12/31/20 (unaudited) | | $ | 16.94 | | | | 0.26 | | | | 2.95 | | | | 3.21 | | | | (0.18 | ) | | | — | | |
(a) Per share net investment income (loss) has been calculated using the average daily shares method.
(b) Not annualized for periods less than one year.
(c) Annualized for periods less than one year.
(d) Portfolio turnover is calculated on the basis of the Fund as a whole without distinguishing between the classes of shares issued.
(e) Commencement of operations.
See notes to financial statements.
118
Victory Portfolios | | Financial Highlights — continued | |
For a Share Outstanding Throughout Each Period
| | | | | Ratios to Average Net Assets | | Supplemental Data | |
| | | Total
Distributions | | Net Asset
Value,
End of
Period | | Total
Return
(Excludes
Sales
Charge)(b) | | Net
Expenses(c) | | Net
Investment
Income
(Loss)(c) | | Gross
Expenses(c) | | Net Assets,
End of
Period
(000's) | | Portfolio
Turnover(b)(d) | |
Victory Integrity Mid-Cap Value Fund | |
Class A | |
Six Months Ended
12/31/20 (unaudited) | | | (0.45 | ) | | $ | 19.68 | | | | 31.63 | % | | | 1.00 | % | | | 3.08 | % | | | 1.41 | % | | $ | 10,778 | | | | 23 | % | |
Year Ended 6/30/20 | | | (0.10 | ) | | $ | 15.30 | | | | (13.90 | )% | | | 1.00 | % | | | 1.40 | % | | | 1.43 | % | | $ | 8,574 | | | | 82 | % | |
Year Ended 6/30/19 | | | (1.18 | ) | | $ | 17.86 | | | | 0.36 | % | | | 1.00 | % | | | 1.05 | % | | | 1.51 | % | | $ | 7,567 | | | | 73 | % | |
Year Ended 6/30/18 | | | (0.77 | ) | | $ | 19.17 | | | | 11.32 | % | | | 1.09 | % | | | 1.01 | % | | | 1.67 | % | | $ | 4,255 | | | | 73 | % | |
Year Ended 6/30/17 | | | — | | | $ | 17.91 | | | | 16.07 | % | | | 1.35 | % | | | 0.19 | % | | | 1.94 | % | | $ | 2,864 | | | | 68 | % | |
Year Ended 6/30/16 | | | (0.17 | ) | | $ | 15.43 | | | | 0.41 | % | | | 1.50 | % | | | 0.44 | % | | | 1.63 | % | | $ | 11,086 | | | | 71 | % | |
Class C | |
Six Months Ended
12/31/20 (unaudited) | | | (0.33 | ) | | $ | 19.83 | | | | 31.11 | % | | | 1.75 | % | | | 2.33 | % | | | 35.76 | % | | $ | 65 | | | | 23 | % | |
11/4/19(e) through
6/30/20 | | | (0.10 | ) | | $ | 15.37 | | | | (17.55 | )% | | | 1.75 | % | | | 1.02 | % | | | 43.95 | % | | $ | 44 | | | | 82 | % | |
Class R6 | |
Six Months Ended
12/31/20 (unaudited) | | | (0.52 | ) | | $ | 19.87 | | | | 31.90 | % | | | 0.60 | % | | | 3.37 | % | | | 0.89 | % | | $ | 178,669 | | | | 23 | % | |
Year Ended 6/30/20 | | | (0.14 | ) | | $ | 15.47 | | | | (13.53 | )% | | | 0.60 | % | | | 1.93 | % | | | 0.88 | % | | $ | 184,503 | | | | 82 | % | |
Year Ended 6/30/19 | | | (1.22 | ) | | $ | 18.02 | | | | 0.72 | % | | | 0.60 | % | | | 1.43 | % | | | 0.94 | % | | $ | 56,232 | | | | 73 | % | |
Year Ended 6/30/18 | | | (0.81 | ) | | $ | 19.30 | | | | 11.68 | % | | | 0.77 | % | | | 1.14 | % | | | 1.17 | % | | $ | 6,750 | | | | 73 | % | |
Year Ended 6/30/17 | | | (0.06 | ) | | $ | 18.02 | | | | 16.42 | % | | | 0.89 | % | | | 0.71 | % | | | 3.01 | % | | $ | 1,375 | | | | 68 | % | |
12/15/15(e) through
6/30/16 | | | (0.21 | ) | | $ | 15.53 | | | | 9.50 | % | | | 1.04 | % | | | 0.75 | % | | | 3.10 | % | | $ | 726 | | | | 71 | % | |
Class Y | |
Six Months Ended
12/31/20 (unaudited) | | | (0.49 | ) | | $ | 19.85 | | | | 31.81 | % | | | 0.75 | % | | | 3.43 | % | | | 1.19 | % | | $ | 12,593 | | | | 23 | % | |
Year Ended 6/30/20 | | | (0.15 | ) | | $ | 15.44 | | | | (13.67 | )% | | | 0.75 | % | | | 1.46 | % | | | 1.21 | % | | $ | 9,352 | | | | 82 | % | |
Year Ended 6/30/19 | | | (1.23 | ) | | $ | 18.02 | | | | 0.58 | % | | | 0.75 | % | | | 1.52 | % | | | 1.17 | % | | $ | 21,486 | | | | 73 | % | |
Year Ended 6/30/18 | | | (0.81 | ) | | $ | 19.34 | | | | 11.58 | % | | | 0.84 | % | | | 1.25 | % | | | 1.13 | % | | $ | 59,866 | | | | 73 | % | |
Year Ended 6/30/17 | | | (0.08 | ) | | $ | 18.06 | | | | 16.43 | % | | | 0.89 | % | | | 0.74 | % | | | 1.18 | % | | $ | 47,989 | | | | 68 | % | |
Year Ended 6/30/16 | | | (0.18 | ) | | $ | 15.58 | | | | 0.73 | % | | | 1.15 | % | | | 0.85 | % | | | 1.15 | % | | $ | 8,442 | | | | 71 | % | |
Member Class | |
11/3/20(e) through
12/31/20 (unaudited) | | | (0.18 | ) | | $ | 19.97 | | | | 18.98 | % | | | 0.85 | % | | | 8.29 | % | | | 29.99 | % | | $ | 92 | | | | 23 | % | |
See notes to financial statements.
119
Victory Portfolios | | Financial Highlights | |
For a Share Outstanding Throughout Each Period
| | | | | Investment Activities | | Distributions to
Shareholders From | |
| | | Net Asset
Value,
Beginning of
Period | | Net
Investment
Income
(Loss)(a) | | Net
Realized and
Unrealized
Gains
(Losses) on
Investments | | Total from
Investment
Activities | | Net
Investment
Income | | Net Realized
Gains from
Investments | | Total
Distributions | |
Victory Integrity Small-Cap Value Fund | |
Class A | |
Six Months Ended
12/31/20
(unaudited) | | $ | 24.40 | | | | 0.05 | | | | 10.10 | | | | 10.15 | | | | (0.03 | ) | | | — | | | | (0.03 | ) | |
Year Ended
6/30/20 | | $ | 32.37 | | | | 0.03 | | | | (7.86 | ) | | | (7.83 | ) | | | — | | | | (0.14 | ) | | | (0.14 | ) | |
Year Ended
6/30/19 | | $ | 40.06 | | | | 0.09 | | | | (3.59 | ) | | | (3.50 | ) | | | — | | | | (4.19 | ) | | | (4.19 | ) | |
Year Ended
6/30/18 | | $ | 37.70 | | | | (0.04 | ) | | | 4.76 | | | | 4.72 | | | | — | | | | (2.36 | ) | | | (2.36 | ) | |
Year Ended
6/30/17 | | $ | 30.72 | | | | (0.08 | ) | | | 7.06 | | | | 6.98 | | | | — | | | | — | | | | — | | |
Year Ended
6/30/16 | | $ | 33.48 | | | | 0.01 | | | | (2.31 | ) | | | (2.30 | ) | | | — | | | | (0.46 | ) | | | (0.46 | ) | |
Class C | |
Six Months Ended
12/31/20
(unaudited) | | $ | 20.81 | | | | (0.06 | ) | | | 8.59 | | | | 8.53 | | | | — | | | | — | | | | — | | |
Year Ended
6/30/20 | | $ | 27.85 | | | | (0.17 | ) | | | (6.73 | ) | | | (6.90 | ) | | | — | | | | (0.14 | ) | | | (0.14 | ) | |
Year Ended
6/30/19 | | $ | 35.40 | | | | (0.13 | ) | | | (3.23 | ) | | | (3.36 | ) | | | — | | | | (4.19 | ) | | | (4.19 | ) | |
Year Ended
6/30/18 | | $ | 33.76 | | | | (0.24 | ) | | | 4.24 | | | | 4.00 | | | | — | | | | (2.36 | ) | | | (2.36 | ) | |
Year Ended
6/30/17 | | $ | 27.69 | | | | (0.28 | ) | | | 6.35 | | | | 6.07 | | | | — | | | | — | | | | — | | |
Year Ended
6/30/16 | | $ | 30.45 | | | | (0.19 | ) | | | (2.11 | ) | | | (2.30 | ) | | | — | | | | (0.46 | ) | | | (0.46 | ) | |
(a) Per share net investment income (loss) has been calculated using the average daily shares method.
(b) Not annualized for periods less than one year.
(c) Annualized for periods less than one year.
(d) Portfolio turnover is calculated on the basis of the Fund as a whole without distinguishing between the classes of shares issued.
(e) Amount is less than $0.005 per share.
See notes to financial statements.
120
Victory Portfolios | | Financial Highlights — continued | |
For a Share Outstanding Throughout Each Period
| | | | | Ratios to Average Net Assets | | Supplemental Data | |
| | | Capital
Contributions
from Prior
Custodian,
Net (See
Note 8) | | Net Asset
Value,
End of
Period | | Total
Return
(Excludes
Sales
Charge)(b) | | Net
Expenses(c) | | Net
Investment
Income
(Loss)(c) | | Gross
Expenses(c) | | Net Assets,
End of
Period
(000's) | | Portfolio
Turnover(b)(d) | |
Victory Integrity Small-Cap Value Fund | |
Class A | |
Six Months Ended
12/31/20
(unaudited) | | | — | | | $ | 34.52 | | | | 41.61 | % | | | 1.47 | % | | | 0.37 | % | | | 1.47 | % | | $ | 100,122 | | | | 25 | % | |
Year Ended
6/30/20 | | | — | | | $ | 24.40 | | | | (24.33 | )% | | | 1.48 | % | | | 0.10 | % | | | 1.48 | % | | $ | 79,429 | | | | 80 | % | |
Year Ended
6/30/19 | | | — | | | $ | 32.37 | | | | (7.16 | )% | | | 1.50 | % | | | 0.25 | % | | | 1.58 | % | | $ | 140,439 | | | | 72 | % | |
Year Ended
6/30/18 | | | — | | | $ | 40.06 | | | | 12.55 | % | | | 1.50 | % | | | (0.10 | )% | | | 1.54 | % | | $ | 221,775 | | | | 70 | % | |
Year Ended
6/30/17 | | | — | | | $ | 37.70 | | | | 22.72 | % | | | 1.50 | % | | | (0.22 | )% | | | 1.52 | % | | $ | 219,113 | | | | 58 | % | |
Year Ended
6/30/16 | | | — | (e) | | $ | 30.72 | | | | (6.87 | )% | | | 1.50 | % | | | 0.04 | % | | | 1.57 | % | | $ | 216,492 | | | | 47 | % | |
Class C | |
Six Months Ended
12/31/20
(unaudited) | | | — | | | $ | 29.34 | | | | 40.99 | % | | | 2.34 | % | | | (0.51 | )% | | | 2.34 | % | | $ | 6,280 | | | | 25 | % | |
Year Ended
6/30/20 | | | — | | | $ | 20.81 | | | | (24.91 | )% | | | 2.25 | % | | | (0.69 | )% | | | 2.25 | % | | $ | 5,796 | | | | 80 | % | |
Year Ended
6/30/19 | | | — | | | $ | 27.85 | | | | (7.79 | )% | | | 2.16 | % | | | (0.42 | )% | | | 2.16 | % | | $ | 11,083 | | | | 72 | % | |
Year Ended
6/30/18 | | | — | | | $ | 35.40 | | | | 11.86 | % | | | 2.13 | % | | | (0.70 | )% | | | 2.13 | % | | $ | 16,746 | | | | 70 | % | |
Year Ended
6/30/17 | | | — | | | $ | 33.76 | | | | 21.92 | % | | | 2.16 | % | | | (0.89 | )% | | | 2.16 | % | | $ | 27,015 | | | | 58 | % | |
Year Ended
6/30/16 | | | — | (e) | | $ | 27.69 | | | | (7.56 | )% | | | 2.22 | % | | | (0.68 | )% | | | 2.22 | % | | $ | 27,987 | | | | 47 | % | |
(continues on next page)
See notes to financial statements.
121
Victory Portfolios | | Financial Highlights | |
For a Share Outstanding Throughout Each Period
| | | | | Investment Activities | | Distributions to
Shareholders From | |
| | | Net Asset
Value,
Beginning of
Period | | Net
Investment
Income
(Loss)(a) | | Net
Realized and
Unrealized
Gains
(Losses) on
Investments | | Total from
Investment
Activities | | Net
Investment
Income | | Net Realized
Gains from
Investments | | Total
Distributions | |
Victory Integrity Small-Cap Value Fund | |
Class R | |
Six Months Ended
12/31/20
(unaudited) | | $ | 23.53 | | | | 0.01 | | | | 9.74 | | | | 9.75 | | | | — | | | | — | | | | — | | |
Year Ended
6/30/20 | | $ | 31.32 | | | | (0.05 | ) | | | (7.60 | ) | | | (7.65 | ) | | | — | | | | (0.14 | ) | | | (0.14 | ) | |
Year Ended
6/30/19 | | $ | 39.02 | | | | (0.01 | ) | | | (3.50 | ) | | | (3.51 | ) | | | — | | | | (4.19 | ) | | | (4.19 | ) | |
Year Ended
6/30/18 | | $ | 36.86 | | | | (0.13 | ) | | | 4.65 | | | | 4.52 | | | | — | | | | (2.36 | ) | | | (2.36 | ) | |
Year Ended
6/30/17 | | $ | 30.11 | | | | (0.16 | ) | | | 6.91 | | | | 6.75 | | | | — | | | | — | | | | — | | |
Year Ended
6/30/16 | | $ | 33.00 | | | | (0.06 | ) | | | (2.37 | ) | | | (2.43 | ) | | | — | (e) | | | (0.46 | ) | | | (0.46 | ) | |
Class R6 | |
Six Months Ended
12/31/20
(unaudited) | | $ | 25.43 | | | | 0.13 | | | | 10.54 | | | | 10.67 | | | | (0.17 | ) | | | — | | | | (0.17 | ) | |
Year Ended
6/30/20 | | $ | 33.70 | | | | 0.19 | | | | (8.18 | ) | | | (7.99 | ) | | | (0.14 | ) | | | (0.14 | ) | | | (0.28 | ) | |
Year Ended
6/30/19 | | $ | 41.51 | | | | 0.24 | | | | (3.67 | ) | | | (3.43 | ) | | | (0.19 | ) | | | (4.19 | ) | | | (4.38 | ) | |
Year Ended
6/30/18 | | $ | 38.86 | | | | 0.18 | | | | 4.92 | | | | 5.10 | | | | (0.09 | ) | | | (2.36 | ) | | | (2.45 | ) | |
Year Ended
6/30/17 | | $ | 31.60 | | | | 0.12 | | | | 7.28 | | | | 7.40 | | | | (0.14 | ) | | | — | | | | (0.14 | ) | |
Year Ended
6/30/16 | | $ | 34.31 | | | | 0.18 | | | | (2.38 | ) | | | (2.20 | ) | | | (0.05 | ) | | | (0.46 | ) | | | (0.51 | ) | |
(a) Per share net investment income (loss) has been calculated using the average daily shares method.
(b) Not annualized for periods less than one year.
(c) Annualized for periods less than one year.
(d) Portfolio turnover is calculated on the basis of the Fund as a whole without distinguishing between the classes of shares issued.
(e) Amount is less than $0.005 per share.
See notes to financial statements.
122
Victory Portfolios | | Financial Highlights — continued | |
For a Share Outstanding Throughout Each Period
| | | | | Ratios to Average Net Assets | | Supplemental Data | |
| | | Capital
Contributions
from Prior
Custodian,
Net (See
Note 8) | | Net Asset
Value,
End of
Period | | Total
Return
(Excludes
Sales
Charge)(b) | | Net
Expenses(c) | | Net
Investment
Income
(Loss)(c) | | Gross
Expenses(c) | | Net Assets,
End of
Period
(000's) | | Portfolio
Turnover(b)(d) | |
Victory Integrity Small-Cap Value Fund | |
Class R | |
Six Months Ended
12/31/20
(unaudited) | | | — | | | $ | 33.28 | | | | 41.38 | % | | | 1.75 | % | | | 0.08 | % | | | 1.94 | % | | $ | 5,980 | | | | 25 | % | |
Year Ended
6/30/20 | | | — | | | $ | 23.53 | | | | (24.54 | )% | | | 1.75 | % | | | (0.19 | )% | | | 1.86 | % | | $ | 5,303 | | | | 80 | % | |
Year Ended
6/30/19 | | | — | | | $ | 31.32 | | | | (7.39 | )% | | | 1.75 | % | | | (0.03 | )% | | | 1.99 | % | | $ | 10,451 | | | | 72 | % | |
Year Ended
6/30/18 | | | — | | | $ | 39.02 | | | | 12.29 | % | | | 1.75 | % | | | (0.35 | )% | | | 1.89 | % | | $ | 14,952 | | | | 70 | % | |
Year Ended
6/30/17 | | | — | | | $ | 36.86 | | | | 22.42 | % | | | 1.75 | % | | | (0.46 | )% | | | 2.06 | % | | $ | 15,317 | | | | 58 | % | |
Year Ended
6/30/16 | | | — | (e) | | $ | 30.11 | | | | (7.36 | )% | | | 1.75 | % | | | (0.19 | )% | | | 1.96 | % | | $ | 15,042 | | | | 47 | % | |
Class R6 | |
Six Months Ended
12/31/20
(unaudited) | | | — | | | $ | 35.93 | | | | 41.98 | % | | | 0.97 | % | | | 0.86 | % | | | 0.97 | % | | $ | 1,134,665 | | | | 25 | % | |
Year Ended
6/30/20 | | | — | | | $ | 25.43 | | | | (23.95 | )% | | | 0.97 | % | | | 0.64 | % | | | 0.97 | % | | $ | 984,938 | | | | 80 | % | |
Year Ended
6/30/19 | | | — | | | $ | 33.70 | | | | (6.67 | )% | | | 0.96 | % | | | 0.65 | % | | | 0.96 | % | | $ | 1,179,915 | | | | 72 | % | |
Year Ended
6/30/18 | | | — | | | $ | 41.51 | | | | 13.17 | % | | | 0.95 | % | | | 0.45 | % | | | 0.95 | % | | $ | 938,831 | | | | 70 | % | |
Year Ended
6/30/17 | | | — | | | $ | 38.86 | | | | 23.40 | % | | | 0.96 | % | | | 0.33 | % | | | 0.96 | % | | $ | 871,150 | | | | 58 | % | |
Year Ended
6/30/16 | | | — | (e) | | $ | 31.60 | | | | (6.41 | )% | | | 1.00 | % | | | 0.57 | % | | | 1.00 | % | | $ | 608,927 | | | | 47 | % | |
(continues on next page)
See notes to financial statements.
123
Victory Portfolios | | Financial Highlights | |
For a Share Outstanding Throughout Each Period
| | | | | Investment Activities | | Distributions to
Shareholders From | |
| | | Net Asset
Value,
Beginning of
Period | | Net
Investment
Income
(Loss)(a) | | Net
Realized and
Unrealized
Gains
(Losses) on
Investments | | Total from
Investment
Activities | | Net
Investment
Income | | Net Realized
Gains from
Investments | | Total
Distributions | |
Victory Integrity Small-Cap Value Fund | |
Class Y | |
Six Months Ended
12/31/20
(unaudited) | | $ | 25.27 | | | | 0.10 | | | | 10.48 | | | | 10.58 | | | | (0.12 | ) | | | — | | | | (0.12 | ) | |
Year Ended
6/30/20 | | $ | 33.49 | | | | 0.14 | | | | (8.13 | ) | | | (7.99 | ) | | | (0.09 | ) | | | (0.14 | ) | | | (0.23 | ) | |
Year Ended
6/30/19 | | $ | 41.25 | | | | 0.21 | | | | (3.67 | ) | | | (3.46 | ) | | | (0.11 | ) | | | (4.19 | ) | | | (4.30 | ) | |
Year Ended
6/30/18 | | $ | 38.63 | | | | 0.11 | | | | 4.89 | | | | 5.00 | | | | (0.02 | ) | | | (2.36 | ) | | | (2.38 | ) | |
Year Ended
6/30/17 | | $ | 31.45 | | | | 0.05 | | | | 7.23 | | | | 7.28 | | | | (0.10 | ) | | | — | | | | (0.10 | ) | |
Year Ended
6/30/16 | | $ | 34.15 | | | | 0.13 | | | | (2.37 | ) | | | (2.24 | ) | | | — | (e) | | | (0.46 | ) | | | (0.46 | ) | |
(a) Per share net investment income (loss) has been calculated using the average daily shares method.
(b) Not annualized for periods less than one year.
(c) Annualized for periods less than one year.
(d) Portfolio turnover is calculated on the basis of the Fund as a whole without distinguishing between the classes of shares issued.
(e) Amount is less than $0.005 per share.
See notes to financial statements.
124
Victory Portfolios | | Financial Highlights — continued | |
For a Share Outstanding Throughout Each Period
| | | | | Ratios to Average Net Assets | | Supplemental Data | |
| | | Capital
Contributions
from Prior
Custodian,
Net (See
Note 8) | | Net Asset
Value,
End of
Period | | Total
Return
(Excludes
Sales
Charge)(b) | | Net
Expenses(c) | | Net
Investment
Income
(Loss)(c) | | Gross
Expenses(c) | | Net Assets,
End of
Period
(000's) | | Portfolio
Turnover(b)(d) | |
Victory Integrity Small-Cap Value Fund | |
Class Y | |
Six Months Ended
12/31/20
(unaudited) | | | — | | | $ | 35.73 | | | | 41.86 | % | | | 1.14 | % | | | 0.70 | % | | | 1.14 | % | | $ | 593,458 | | | | 25 | % | |
Year Ended
6/30/20 | | | — | | | $ | 25.27 | | | | (24.04 | )% | | | 1.11 | % | | | 0.47 | % | | | 1.11 | % | | $ | 491,836 | | | | 80 | % | |
Year Ended
6/30/19 | | | — | | | $ | 33.49 | | | | (6.83 | )% | | | 1.12 | % | | | 0.58 | % | | | 1.12 | % | | $ | 981,688 | | | | 72 | % | |
Year Ended
6/30/18 | | | — | | | $ | 41.25 | | | | 13.01 | % | | | 1.12 | % | | | 0.28 | % | | | 1.12 | % | | $ | 1,467,901 | | | | 70 | % | |
Year Ended
6/30/17 | | | — | | | $ | 38.63 | | | | 23.14 | % | | | 1.15 | % | | | 0.13 | % | | | 1.15 | % | | $ | 1,329,435 | | | | 58 | % | |
Year Ended
6/30/16 | | | — | (e) | | $ | 31.45 | | | | (6.54 | )% | | | 1.15 | % | | | 0.40 | % | | | 1.15 | % | | $ | 981,741 | | | | 47 | % | |
See notes to financial statements.
125
Victory Portfolios | | Financial Highlights | |
For a Share Outstanding Throughout Each Period
| | | | | Investment Activities | | Distributions to
Shareholders From | |
| | | Net Asset
Value,
Beginning of
Period | | Net
Investment
Income
(Loss)(a) | | Net Realized
and Unrealized
Gains (Losses)
on Investments | | Total from
Investment
Activities | | Net
Investment
Income | | Net Realized
Gains from
Investments | |
Victory Integrity Small/Mid-Cap Value Fund | |
Class A | |
Six Months Ended
12/31/20 (unaudited) | | $ | 13.46 | | | | 0.24 | | | | 4.85 | | | | 5.09 | | | | (0.26 | ) | | | — | | |
Year Ended 6/30/20 | | $ | 16.70 | | | | 0.10 | | | | (3.24 | ) | | | (3.14 | ) | | | (0.10 | ) | | | — | | |
Year Ended 6/30/19 | | $ | 17.75 | | | | 0.12 | | | | (0.53 | ) | | | (0.41 | ) | | | (0.12 | ) | | | (0.52 | ) | |
Year Ended 6/30/18 | | $ | 16.04 | | | | 0.07 | | | | 1.89 | | | | 1.96 | | | | (0.05 | ) | | | (0.20 | ) | |
Year Ended 6/30/17 | | $ | 13.26 | | | | 0.02 | | | | 2.76 | | | | 2.78 | | | | — | | | | — | | |
Year Ended 6/30/16 | | $ | 14.08 | | | | 0.02 | | | | (0.81 | ) | | | (0.79 | ) | | | (0.03 | ) | | | — | | |
Class R6 | |
Six Months Ended
12/31/20 (unaudited) | | $ | 13.64 | | | | 0.27 | | | | 4.91 | | | | 5.18 | | | | (0.30 | ) | | | — | | |
Year Ended 6/30/20 | | $ | 16.91 | | | | 0.15 | | | | (3.28 | ) | | | (3.13 | ) | | | (0.14 | ) | | | — | | |
Year Ended 6/30/19 | | $ | 17.96 | | | | 0.14 | | | | (0.51 | ) | | | (0.37 | ) | | | (0.16 | ) | | | (0.52 | ) | |
Year Ended 6/30/18 | | $ | 16.20 | | | | 0.05 | | | | 1.99 | | | | 2.04 | | | | (0.08 | ) | | | (0.20 | ) | |
Year Ended 6/30/17 | | $ | 13.35 | | | | 0.03 | | | | 2.82 | | | | 2.85 | | | | — | | | | — | | |
Year Ended 6/30/16 | | $ | 14.17 | | | | 0.05 | | | | (0.81 | ) | | | (0.76 | ) | | | (0.06 | ) | | | — | | |
Class Y | |
Six Months Ended
12/31/20 (unaudited) | | $ | 13.60 | | | | 0.26 | | | | 4.90 | | | | 5.16 | | | | (0.30 | ) | | | — | | |
Year Ended 6/30/20 | | $ | 16.86 | | | | 0.14 | | | | (3.27 | ) | | | (3.13 | ) | | | (0.13 | ) | | | — | | |
Year Ended 6/30/19 | | $ | 17.92 | | | | 0.22 | | | | (0.60 | ) | | | (0.38 | ) | | | (0.16 | ) | | | (0.52 | ) | |
Year Ended 6/30/18 | | $ | 16.17 | | | | 0.12 | | | | 1.91 | | | | 2.03 | | | | (0.08 | ) | | | (0.20 | ) | |
Year Ended 6/30/17 | | $ | 13.35 | | | | 0.06 | | | | 2.78 | | | | 2.84 | | | | (0.02 | ) | | | — | | |
Year Ended 6/30/16 | | $ | 14.16 | | | | 0.05 | | | | (0.81 | ) | | | (0.76 | ) | | | (0.05 | ) | | | — | | |
Member Class | |
11/3/20(e) through
12/31/20 (unaudited) | | $ | 14.86 | | | | 0.24 | | | | 3.47 | | | | 3.71 | | | | (0.14 | ) | | | — | | |
(a) Per share net investment income (loss) has been calculated using the average daily shares method.
(b) Not annualized for periods less than one year.
(c) Annualized for periods less than one year.
(d) Portfolio turnover is calculated on the basis of the Fund as a whole without distinguishing between the classes of shares issued.
(e) Commencement of operations.
See notes to financial statements.
126
Victory Portfolios | | Financial Highlights — continued | |
For a Share Outstanding Throughout Each Period
| | | | | Ratios to Average Net Assets | | Supplemental Data | |
| | | Total
Distributions | | Net Asset
Value,
End of
Period | | Total
Return
(Excludes
Sales
Charge)(b) | | Net
Expenses(c) | | Net
Investment
Income
(Loss)(c) | | Gross
Expenses(c) | | Net Assets,
End of
Period
(000's) | | Portfolio
Turnover(b)(d) | |
Victory Integrity Small/Mid-Cap Value Fund | |
Class A | |
Six Months Ended
12/31/20 (unaudited) | | | (0.26 | ) | | $ | 18.29 | | | | 37.86 | % | | | 1.13 | % | | | 3.11 | % | | | 1.86 | % | | $ | 4,220 | | | | 25 | % | |
Year Ended 6/30/20 | | | (0.10 | ) | | $ | 13.46 | | | | (18.97 | )% | | | 1.13 | % | | | 0.67 | % | | | 1.65 | % | | $ | 3,241 | | | | 72 | % | |
Year Ended 6/30/19 | | | (0.64 | ) | | $ | 16.70 | | | | (1.66 | )% | | | 1.13 | % | | | 0.70 | % | | | 1.71 | % | | $ | 3,626 | | | | 67 | % | |
Year Ended 6/30/18 | | | (0.25 | ) | | $ | 17.75 | | | | 12.16 | % | | | 1.13 | % | | | 0.42 | % | | | 1.74 | % | | $ | 2,996 | | | | 77 | % | |
Year Ended 6/30/17 | | | — | | | $ | 16.04 | | | | 20.97 | % | | | 1.21 | % | | | 0.13 | % | | | 2.40 | % | | $ | 2,304 | | | | 65 | % | |
Year Ended 6/30/16 | | | (0.03 | ) | | $ | 13.26 | | | | (5.59 | )% | | | 1.50 | % | | | 0.13 | % | | | 2.15 | % | | $ | 716 | | | | 60 | % | |
Class R6 | |
Six Months Ended
12/31/20 (unaudited) | | | (0.30 | ) | | $ | 18.52 | | | | 38.05 | % | | | 0.83 | % | | | 3.40 | % | | | 0.97 | % | | $ | 104,851 | | | | 25 | % | |
Year Ended 6/30/20 | | | (0.14 | ) | | $ | 13.64 | | | | (18.70 | )% | | | 0.83 | % | | | 0.97 | % | | | 0.97 | % | | $ | 80,284 | | | | 72 | % | |
Year Ended 6/30/19 | | | (0.68 | ) | | $ | 16.91 | | | | (1.39 | )% | | | 0.83 | % | | | 0.86 | % | | | 0.96 | % | | $ | 95,286 | | | | 67 | % | |
Year Ended 6/30/18 | | | (0.28 | ) | | $ | 17.96 | | | | 12.54 | % | | | 0.83 | % | | | 0.28 | % | | | 1.26 | % | | $ | 24,926 | | | | 77 | % | |
Year Ended 6/30/17 | | | — | | | $ | 16.20 | | | | 21.35 | % | | | 1.09 | % | | | 0.20 | % | | | 1.96 | % | | $ | 18 | | | | 65 | % | |
Year Ended 6/30/16 | | | (0.06 | ) | | $ | 13.35 | | | | (5.33 | )% | | | 1.21 | % | | | 0.40 | % | | | 1.58 | % | | $ | 3,381 | | | | 60 | % | |
Class Y | |
Six Months Ended
12/31/20 (unaudited) | | | (0.30 | ) | | $ | 18.46 | | | | 37.96 | % | | | 0.88 | % | | | 3.30 | % | | | 0.99 | % | | $ | 40,659 | | | | 25 | % | |
Year Ended 6/30/20 | | | (0.13 | ) | | $ | 13.60 | | | | (18.73 | )% | | | 0.88 | % | | | 0.92 | % | | | 1.01 | % | | $ | 32,572 | | | | 72 | % | |
Year Ended 6/30/19 | | | (0.68 | ) | | $ | 16.86 | | | | (1.45 | )% | | | 0.88 | % | | | 1.30 | % | | | 1.03 | % | | $ | 35,927 | | | | 67 | % | |
Year Ended 6/30/18 | | | (0.28 | ) | | $ | 17.92 | | | | 12.51 | % | | | 0.88 | % | | | 0.67 | % | | | 1.13 | % | | $ | 92,019 | | | | 77 | % | |
Year Ended 6/30/17 | | | (0.02 | ) | | $ | 16.17 | | | | 21.25 | % | | | 0.96 | % | | | 0.38 | % | | | 1.21 | % | | $ | 53,509 | | | | 65 | % | |
Year Ended 6/30/16 | | | (0.05 | ) | | $ | 13.35 | | | | (5.34 | )% | | | 1.25 | % | | | 0.37 | % | | | 1.26 | % | | $ | 18,918 | | | | 60 | % | |
Member Class | |
11/3/20(e) through
12/31/20 (unaudited) | | | (0.14 | ) | | $ | 18.43 | | | | 24.96 | % | | | 0.95 | % | | | 8.36 | % | | | 10.02 | % | | $ | 259 | | | | 25 | % | |
See notes to financial statements.
127
Victory Portfolios | | Financial Highlights | |
For a Share Outstanding Throughout Each Period
| | | | | Investment Activities | | Distributions to
Shareholders From | |
| | | Net Asset
Value,
Beginning of
Period | | Net
Investment
Income
(Loss)(a) | | Net
Realized and
Unrealized
Gains
(Losses) on
Investments | | Total from
Investment
Activities | | Net
Investment
Income | | Net Realized
Gains from
Investments | | Total
Distributions | |
Victory Munder Multi-Cap Fund | |
Class A | |
Six Months Ended
12/31/20
(unaudited) | | $ | 38.28 | | | | (0.01 | ) | | | 8.07 | | | | 8.06 | | | | (0.03 | ) | | | — | | | | (0.03 | ) | |
Year Ended
6/30/20 | | $ | 38.75 | | | | 0.03 | | | | 0.65 | | | | 0.68 | | | | (0.10 | ) | | | (1.05 | ) | | | (1.15 | ) | |
Year Ended
6/30/19 | | $ | 44.99 | | | | 0.10 | | | | 0.08 | | | | 0.18 | | | | — | | | | (6.42 | ) | | | (6.42 | ) | |
Year Ended
6/30/18 | | $ | 41.77 | | | | (0.03 | ) | | | 5.71 | | | | 5.68 | | | | — | (e) | | | (2.46 | ) | | | (2.46 | ) | |
Year Ended
6/30/17 | | $ | 35.58 | | | | 0.02 | | | | 6.17 | | | | 6.19 | | | | — | | | | — | | | | — | | |
Year Ended
6/30/16 | | $ | 44.91 | | | | 0.01 | | | | (1.58 | ) | | | (1.57 | ) | | | — | | | | (7.80 | ) | | | (7.80 | ) | |
Class C | |
Six Months Ended
12/31/20
(unaudited) | | $ | 29.35 | | | | (0.14 | ) | | | 6.17 | | | | 6.03 | | | | — | | | | — | | | | — | | |
Year Ended
6/30/20 | | $ | 30.10 | | | | (0.22 | ) | | | 0.52 | | | | 0.30 | | | | — | | | | (1.05 | ) | | | (1.05 | ) | |
Year Ended
6/30/19 | | $ | 36.81 | | | | (0.16 | ) | | | (0.13 | ) | | | (0.29 | ) | | | — | | | | (6.42 | ) | | | (6.42 | ) | |
Year Ended
6/30/18 | | $ | 34.82 | | | | (0.34 | ) | | | 4.79 | | | | 4.45 | | | | — | | | | (2.46 | ) | | | (2.46 | ) | |
Year Ended
6/30/17 | | $ | 29.90 | | | | (0.26 | ) | | | 5.18 | | | | 4.92 | | | | — | | | | — | | | | — | | |
Year Ended
6/30/16 | | $ | 39.29 | | | | (0.27 | ) | | | (1.36 | ) | | | (1.63 | ) | | | — | | | | (7.80 | ) | | | (7.80 | ) | |
(a) Per share net investment income (loss) has been calculated using the average daily shares method.
(b) Not annualized for periods less than one year.
(c) Annualized for periods less than one year.
(d) Portfolio turnover is calculated on the basis of the Fund as a whole without distinguishing between the classes of shares issued.
(e) Amount is less than $0.005 per share.
(f) During the year ended June 30, 2018, the Fund received monies related to certain nonrecurring litigation settlements. The corresponding impact to the total return was an increase of 0.22%.
(g) The Fund received monies related to a nonrecurring refund from the prior custodian. The corresponding impact to the total return was 0.10% for the year ended June 30, 2016 (See Note 8).
See notes to financial statements.
128
Victory Portfolios | | Financial Highlights — continued | |
For a Share Outstanding Throughout Each Period
| | | | | Ratios to Average Net Assets | | Supplemental Data | |
| | | Capital
Contributions
from Prior
Custodian,
Net (See
Note 8) | | Net Asset
Value,
End of
Period | | Total
Return
(Excludes
Sales
Charge)(b) | | Net
Expenses(c) | | Net
Investment
Income
(Loss)(c) | | Gross
Expenses(c) | | Net Assets,
End of
Period
(000's) | | Portfolio
Turnover(b)(d) | |
Victory Munder Multi-Cap Fund | |
Class A | |
Six Months Ended
12/31/20
(unaudited) | | | — | | | $ | 46.31 | | | | 21.06 | % | | | 1.35 | % | | | (0.05 | )% | | | 1.35 | % | | $ | 356,408 | | | | 30 | % | |
Year Ended
6/30/20 | | | — | | | $ | 38.28 | | | | 1.53 | % | | | 1.35 | % | | | 0.09 | % | | | 1.35 | % | | $ | 311,642 | | | | 100 | % | |
Year Ended
6/30/19 | | | — | | | $ | 38.75 | | | | 2.86 | % | | | 1.36 | % | | | 0.25 | % | | | 1.36 | % | | $ | 346,180 | | | | 107 | % | |
Year Ended
6/30/18 | | | — | | | $ | 44.99 | | | | 13.37 | %(f) | | | 1.36 | % | | | (0.07 | )% | | | 1.36 | % | | $ | 374,259 | | | | 123 | % | |
Year Ended
6/30/17 | | | — | | | $ | 41.77 | | | | 17.40 | % | | | 1.38 | % | | | 0.04 | % | | | 1.38 | % | | $ | 341,279 | | | | 109 | % | |
Year Ended
6/30/16 | | | 0.04 | | | $ | 35.58 | | | | (4.01 | )%(g) | | | 1.46 | % | | | 0.03 | % | | | 1.46 | % | | $ | 318,712 | | | | 117 | % | |
Class C | |
Six Months Ended
12/31/20
(unaudited) | | | — | | | $ | 35.38 | | | | 20.55 | % | | | 2.16 | % | | | (0.87 | )% | | | 2.34 | % | | $ | 5,060 | | | | 30 | % | |
Year Ended
6/30/20 | | | — | | | $ | 29.35 | | | | 0.69 | % | | | 2.18 | % | | | (0.73 | )% | | | 2.20 | % | | $ | 5,769 | | | | 100 | % | |
Year Ended
6/30/19 | | | — | | | $ | 30.10 | | | | 2.21 | % | | | 2.07 | % | | | (0.48 | )% | | | 2.07 | % | | $ | 10,056 | | | | 107 | % | |
Year Ended
6/30/18 | | | — | | | $ | 36.81 | | | | 12.48 | %(f) | | | 2.16 | % | | | (0.91 | )% | | | 2.16 | % | | $ | 18,383 | | | | 123 | % | |
Year Ended
6/30/17 | | | — | | | $ | 34.82 | | | | 16.45 | % | | | 2.21 | % | | | (0.80 | )% | | | 2.21 | % | | $ | 57,690 | | | | 109 | % | |
Year Ended
6/30/16 | | | 0.04 | | | $ | 29.90 | | | | (4.82 | )%(g) | | | 2.28 | % | | | (0.79 | )% | | | 2.28 | % | | $ | 68,112 | | | | 117 | % | |
(continues on next page)
See notes to financial statements.
129
Victory Portfolios | | Financial Highlights | |
For a Share Outstanding Throughout Each Period
| | | | | Investment Activities | | Distributions to
Shareholders From | |
| | | Net Asset
Value,
Beginning of
Period | | Net
Investment
Income
(Loss)(a) | | Net
Realized and
Unrealized
Gains
(Losses) on
Investments | | Total from
Investment
Activities | | Net
Investment
Income | | Net Realized
Gains from
Investments | | Total
Distributions | |
Victory Munder Multi-Cap Fund | |
Class Y | |
Six Months Ended
12/31/20
(unaudited) | | $ | 42.05 | | | | 0.07 | | | | 8.87 | | | | 8.94 | | | | (0.18 | ) | | | — | | | | (0.18 | ) | |
Year Ended
6/30/20 | | $ | 42.42 | | | | 0.19 | | | | 0.72 | | | | 0.91 | | | | (0.23 | ) | | | (1.05 | ) | | | (1.28 | ) | |
Year Ended
6/30/19 | | $ | 48.41 | | | | 0.27 | | | | 0.16 | | | | 0.43 | | | | — | | | | (6.42 | ) | | | (6.42 | ) | |
Year Ended
6/30/18 | | $ | 44.62 | | | | 0.14 | | | | 6.11 | | | | 6.25 | | | | — | | | | (2.46 | ) | | | (2.46 | ) | |
Year Ended
6/30/17 | | $ | 37.86 | | | | 0.17 | | | | 6.59 | | | | 6.76 | | | | — | | | | — | | | | — | | |
Year Ended
6/30/16 | | $ | 47.10 | | | | 0.20 | | | | (1.68 | ) | | | (1.48 | ) | | | — | | | | (7.80 | ) | | | (7.80 | ) | |
(a) Per share net investment income (loss) has been calculated using the average daily shares method.
(b) Not annualized for periods less than one year.
(c) Annualized for periods less than one year.
(d) Portfolio turnover is calculated on the basis of the Fund as a whole without distinguishing between the classes of shares issued.
(f) During the year ended June 30, 2018, the Fund received monies related to certain nonrecurring litigation settlements. The corresponding impact to the total return was an increase of 0.22%.
(g) The Fund received monies related to a nonrecurring refund from the prior custodian. The corresponding impact to the total return was 0.10% for the year ended June 30, 2016 (See Note 8).
See notes to financial statements.
130
Victory Portfolios | | Financial Highlights — continued | |
For a Share Outstanding Throughout Each Period
| | | | | Ratios to Average Net Assets | | Supplemental Data | |
| | | Capital
Contributions
from Prior
Custodian,
Net (See
Note 8) | | Net Asset
Value,
End of
Period | | Total
Return
(Excludes
Sales
Charge)(b) | | Net
Expenses(c) | | Net
Investment
Income
(Loss)(c) | | Gross
Expenses(c) | | Net Assets,
End of
Period
(000's) | | Portfolio
Turnover(b)(d) | |
Victory Munder Multi-Cap Fund | |
Class Y | |
Six Months Ended
12/31/20
(unaudited) | | | — | | | $ | 50.81 | | | | 21.26 | % | | | 0.98 | % | | | 0.32 | % | | | 0.98 | % | | $ | 35,881 | | | | 30 | % | |
Year Ended
6/30/20 | | | — | | | $ | 42.05 | | | | 1.92 | % | | | 0.99 | % | | | 0.46 | % | | | 0.99 | % | | $ | 30,258 | | | | 100 | % | |
Year Ended
6/30/19 | | | — | | | $ | 42.42 | | | | 3.21 | % | | | 1.00 | % | | | 0.61 | % | | | 1.00 | % | | $ | 30,776 | | | | 107 | % | |
Year Ended
6/30/18 | | | — | | | $ | 48.41 | | | | 13.81 | %(f) | | | 1.00 | % | | | 0.29 | % | | | 1.00 | % | | $ | 33,503 | | | | 123 | % | |
Year Ended
6/30/17 | | | — | | | $ | 44.62 | | | | 17.86 | % | | | 1.01 | % | | | 0.42 | % | | | 1.01 | % | | $ | 24,032 | | | | 109 | % | |
Year Ended
6/30/16 | | | 0.04 | | | $ | 37.86 | | | | (3.61 | )%(g) | | | 1.01 | % | | | 0.47 | % | | | 1.01 | % | | $ | 20,477 | | | | 117 | % | |
See notes to financial statements.
131
Victory Portfolios | | Financial Highlights | |
For a Share Outstanding Throughout Each Period
| | | | | Investment Activities | | Distributions to
Shareholders From | |
| | | Net Asset
Value,
Beginning of
Period | | Net
Investment
Income
(Loss)(a) | | Net
Realized and
Unrealized
Gains
(Losses) on
Investments | | Total from
Investment
Activities | | Net
Investment
Income | | Net Realized
Gains from
Investments | | Total
Distributions | |
Victory S&P 500 Index Fund | |
Class A | |
Six Months Ended
12/31/20
(unaudited) | | $ | 19.80 | | | | 0.13 | | | | 4.15 | | | | 4.28 | | | | (0.13 | ) | | | (1.37 | ) | | | (1.50 | ) | |
Year Ended
6/30/20 | | $ | 21.07 | | | | 0.29 | | | | 1.20 | | | | 1.49 | | | | (0.28 | ) | | | (2.48 | ) | | | (2.76 | ) | |
Year Ended
6/30/19 | | $ | 21.52 | | | | 0.31 | | | | 1.43 | | | | 1.74 | | | | (0.33 | ) | | | (1.86 | ) | | | (2.19 | ) | |
Year Ended
6/30/18 | | $ | 22.20 | | | | 0.31 | | | | 2.65 | | | | 2.96 | | | | (0.31 | ) | | | (3.33 | ) | | | (3.64 | ) | |
Year Ended
6/30/17 | | $ | 20.54 | | | | 0.31 | | | | 3.08 | | | | 3.39 | | | | (0.34 | ) | | | (1.39 | ) | | | (1.73 | ) | |
Year Ended
6/30/16 | | $ | 22.24 | | | | 0.34 | | | | 0.36 | | | | 0.70 | | | | (0.35 | ) | | | (2.07 | ) | | | (2.42 | ) | |
Class R | |
Six Months Ended
12/31/20
(unaudited) | | $ | 19.74 | | | | 0.08 | | | | 4.14 | | | | 4.22 | | | | (0.09 | ) | | | (1.37 | ) | | | (1.46 | ) | |
Year Ended
6/30/20 | | $ | 21.01 | | | | 0.21 | | | | 1.21 | | | | 1.42 | | | | (0.21 | ) | | | (2.48 | ) | | | (2.69 | ) | |
Year Ended
6/30/19 | | $ | 21.47 | | | | 0.22 | | | | 1.43 | | | | 1.65 | | | | (0.25 | ) | | | (1.86 | ) | | | (2.11 | ) | |
Year Ended
6/30/18 | | $ | 22.15 | | | | 0.21 | | | | 2.66 | | | | 2.87 | | | | (0.22 | ) | | | (3.33 | ) | | | (3.55 | ) | |
Year Ended
6/30/17 | | $ | 20.51 | | | | 0.22 | | | | 3.06 | | | | 3.28 | | | | (0.25 | ) | | | (1.39 | ) | | | (1.64 | ) | |
Year Ended
6/30/16 | | $ | 22.23 | | | | 0.25 | | | | 0.35 | | | | 0.60 | | | | (0.27 | ) | | | (2.07 | ) | | | (2.34 | ) | |
(a) Per share net investment income (loss) has been calculated using the average daily shares method.
(b) Not annualized for periods less than one year.
(c) Annualized for periods less than one year.
(d) Portfolio turnover is calculated on the basis of the Fund as a whole without distinguishing between the classes of shares issued.
(e) The Fund is receiving monies related to a nonrecurring refund from the prior custodian. The corresponding impact to the total return was 0.09% for the year ended June 30, 2016 (See Note 8).
See notes to financial statements.
132
Victory Portfolios | | Financial Highlights — continued | |
For a Share Outstanding Throughout Each Period
| | | | | Ratios to Average Net Assets | | Supplemental Data | |
| | | Capital
Contributions
from Prior
Custodian,
Net (See
Note 8) | | Net Asset
Value,
End of
Period | | Total
Return
(Excludes
Sales
Charge)(b) | | Net
Expenses(c) | | Net
Investment
Income
(Loss)(c) | | Gross
Expenses(c) | | Net Assets,
End of
Period
(000's) | | Portfolio
Turnover(b)(d) | |
Victory S&P 500 Index Fund | |
Class A | |
Six Months Ended
12/31/20
(unaudited) | | | — | | | $ | 22.58 | | | | 21.80 | % | | | 0.55 | % | | | 1.17 | % | | | 0.55 | % | | $ | 176,182 | | | | 2 | % | |
Year Ended
6/30/20 | | | — | | | $ | 19.80 | | | | 6.96 | % | | | 0.55 | % | | | 1.42 | % | | | 0.55 | % | | $ | 153,714 | | | | 4 | % | |
Year Ended
6/30/19 | | | — | | | $ | 21.07 | | | | 9.80 | % | | | 0.53 | % | | | 1.46 | % | | | 0.53 | % | | $ | 188,004 | | | | 3 | % | |
Year Ended
6/30/18 | | | — | | | $ | 21.52 | | | | 13.73 | % | | | 0.55 | % | | | 1.38 | % | | | 0.55 | % | | $ | 192,530 | | | | 2 | % | |
Year Ended
6/30/17 | | | — | | | $ | 22.20 | | | | 17.16 | % | | | 0.58 | % | | | 1.47 | % | | | 0.58 | % | | $ | 192,390 | | | | 4 | % | |
Year Ended
6/30/16 | | | 0.02 | | | $ | 20.54 | | | | 3.49 | %(e) | | | 0.58 | % | | | 1.66 | % | | | 0.58 | % | | $ | 186,089 | | | | 4 | % | |
Class R | |
Six Months Ended
12/31/20
(unaudited) | | | — | | | $ | 22.50 | | | | 21.50 | % | | | 0.97 | % | | | 0.74 | % | | | 0.97 | % | | $ | 15,538 | | | | 2 | % | |
Year Ended
6/30/20 | | | — | | | $ | 19.74 | | | | 6.57 | % | | | 0.95 | % | | | 1.02 | % | | | 0.95 | % | | $ | 13,726 | | | | 4 | % | |
Year Ended
6/30/19 | | | — | | | $ | 21.01 | | | | 9.31 | % | | | 0.96 | % | | | 1.04 | % | | | 0.96 | % | | $ | 14,501 | | | | 3 | % | |
Year Ended
6/30/18 | | | — | | | $ | 21.47 | | | | 13.31 | % | | | 0.97 | % | | | 0.97 | % | | | 0.97 | % | | $ | 17,052 | | | | 2 | % | |
Year Ended
6/30/17 | | | — | | | $ | 22.15 | | | | 16.59 | % | | | 1.03 | % | | | 1.02 | % | | | 1.03 | % | | $ | 15,487 | | | | 4 | % | |
Year Ended
6/30/16 | | | 0.02 | | | $ | 20.51 | | | | 3.03 | %(e) | | | 1.02 | % | | | 1.23 | % | | | 1.02 | % | | $ | 13,221 | | | | 4 | % | |
(continues on next page)
See notes to financial statements.
133
Victory Portfolios | | Financial Highlights | |
For a Share Outstanding Throughout Each Period
| | | | | Investment Activities | | Distributions to
Shareholders From | |
| | | Net Asset
Value,
Beginning of
Period | | Net
Investment
Income
(Loss)(a) | | Net
Realized and
Unrealized
Gains
(Losses) on
Investments | | Total from
Investment
Activities | | Net
Investment
Income | | Net Realized
Gains from
Investments | | Total
Distributions | |
Victory S&P 500 Index Fund | |
Class Y | |
Six Months Ended
12/31/20
(unaudited) | | $ | 19.96 | | | | 0.14 | | | | 4.19 | | | | 4.33 | | | | (0.14 | ) | | | (1.37 | ) | | | (1.51 | ) | |
Year Ended
6/30/20 | | $ | 21.22 | | | | 0.32 | | | | 1.21 | | | | 1.53 | | | | (0.31 | ) | | | (2.48 | ) | | | (2.79 | ) | |
Year Ended
6/30/19 | | $ | 21.66 | | | | 0.33 | | | | 1.45 | | | | 1.78 | | | | (0.36 | ) | | | (1.86 | ) | | | (2.22 | ) | |
Year Ended
6/30/18 | | $ | 22.31 | | | | 0.35 | | | | 2.67 | | | | 3.02 | | | | (0.34 | ) | | | (3.33 | ) | | | (3.67 | ) | |
Year Ended
6/30/17 | | $ | 20.64 | | | | 0.36 | | | | 3.08 | | | | 3.44 | | | | (0.38 | ) | | | (1.39 | ) | | | (1.77 | ) | |
Year Ended
6/30/16 | | $ | 22.33 | | | | 0.39 | | | | 0.36 | | | | 0.75 | | | | (0.39 | ) | | | (2.07 | ) | | | (2.46 | ) | |
(a) Per share net investment income (loss) has been calculated using the average daily shares method.
(b) Not annualized for periods less than one year.
(c) Annualized for periods less than one year.
(d) Portfolio turnover is calculated on the basis of the Fund as a whole without distinguishing between the classes of shares issued.
(e) The Fund is receiving monies related to a nonrecurring refund from the prior custodian. The corresponding impact to the total return was 0.09% for the year ended June 30, 2016 (See Note 8).
See notes to financial statements.
134
Victory Portfolios | | Financial Highlights — continued | |
For a Share Outstanding Throughout Each Period
| | | | | Ratios to Average Net Assets | | Supplemental Data | |
| | | Capital
Contributions
from Prior
Custodian,
Net (See
Note 8) | | Net Asset
Value,
End of
Period | | Total
Return
(Excludes
Sales
Charge)(b) | | Net
Expenses(c) | | Net
Investment
Income
(Loss)(c) | | Gross
Expenses(c) | | Net Assets,
End of
Period
(000's) | | Portfolio
Turnover(b)(d) | |
Victory S&P 500 Index Fund | |
Class Y | |
Six Months Ended
12/31/20
(unaudited) | | | — | | | $ | 22.78 | | | | 21.89 | % | | | 0.44 | % | | | 1.28 | % | | | 0.44 | % | | $ | 52,304 | | | | 2 | % | |
Year Ended
6/30/20 | | | — | | | $ | 19.96 | | | | 7.07 | % | | | 0.43 | % | | | 1.56 | % | | | 0.43 | % | | $ | 46,072 | | | | 4 | % | |
Year Ended
6/30/19 | | | — | | | $ | 21.22 | | | | 9.93 | % | | | 0.43 | % | | | 1.57 | % | | | 0.43 | % | | $ | 32,146 | | | | 3 | % | |
Year Ended
6/30/18 | | | — | | | $ | 21.66 | | | | 13.96 | % | | | 0.39 | % | | | 1.57 | % | | | 0.39 | % | | $ | 19,932 | | | | 2 | % | |
Year Ended
6/30/17 | | | — | | | $ | 22.31 | | | | 17.33 | % | | | 0.40 | % | | | 1.66 | % | | | 0.40 | % | | $ | 28,148 | | | | 4 | % | |
Year Ended
6/30/16 | | | 0.02 | | | $ | 20.64 | | | | 3.74 | %(e) | | | 0.38 | % | | | 1.86 | % | | | 0.38 | % | | $ | 35,777 | | | | 4 | % | |
See notes to financial statements.
135
Victory Portfolios | | Financial Highlights | |
For a Share Outstanding Throughout Each Period
| | | | | Investment Activities | | Distributions to
Shareholders From | |
| | | Net Asset
Value,
Beginning of
Period | | Net
Investment
Income
(Loss)(a) | | Net
Realized and
Unrealized
Gains
(Losses) on
Investments | | Total from
Investment
Activities | | Net Realized
Gains From
Investments | | Total
Distributions | |
Victory Munder Mid-Cap Core Growth Fund | |
Class A | |
Six Months Ended
12/31/20 (unaudited) | | $ | 11.76 | | | | (0.03 | ) | | | 3.35 | | | | 3.32 | | | | (1.66 | ) | | | (1.66 | ) | |
Year Ended 6/30/20 | | $ | 22.95 | | | | (0.07 | ) | | | 0.01 | (e) | | | (0.06 | ) | | | (11.13 | ) | | | (11.13 | ) | |
Year Ended 6/30/19 | | $ | 34.56 | | | | (0.13 | ) | | | (0.72 | ) | | | (0.85 | ) | | | (10.76 | ) | | | (10.76 | ) | |
Year Ended 6/30/18 | | $ | 37.21 | | | | (0.11 | ) | | | 4.55 | | | | 4.44 | | | | (7.09 | ) | | | (7.09 | ) | |
Year Ended 6/30/17 | | $ | 35.99 | | | | (0.08 | ) | | | 5.79 | | | | 5.71 | | | | (4.49 | ) | | | (4.49 | ) | |
Year Ended 6/30/16 | | $ | 43.31 | | | | (0.08 | ) | | | (3.36 | ) | | | (3.44 | ) | | | (3.88 | ) | | | (3.88 | ) | |
Class C | |
Six Months Ended
12/31/20 (unaudited) | | $ | 4.90 | | | | (0.03 | ) | | | 1.38 | | | | 1.35 | | | | (1.66 | ) | | | (1.66 | ) | |
Year Ended 6/30/20 | | $ | 15.96 | | | | (0.10 | ) | | | 0.17 | (e) | | | 0.07 | | | | (11.13 | ) | | | (11.13 | ) | |
Year Ended 6/30/19 | | $ | 27.98 | | | | (0.23 | ) | | | (1.03 | ) | | | (1.26 | ) | | | (10.76 | ) | | | (10.76 | ) | |
Year Ended 6/30/18 | | $ | 31.54 | | | | (0.29 | ) | | | 3.82 | | | | 3.53 | | | | (7.09 | ) | | | (7.09 | ) | |
Year Ended 6/30/17 | | $ | 31.34 | | | | (0.27 | ) | | | 4.96 | | | | 4.69 | | | | (4.49 | ) | | | (4.49 | ) | |
Year Ended 6/30/16 | | $ | 38.51 | | | | (0.29 | ) | | | (3.00 | ) | | | (3.29 | ) | | | (3.88 | ) | | | (3.88 | ) | |
Class R | |
Six Months Ended
12/31/20 (unaudited) | | $ | 9.98 | | | | (0.04 | ) | | | 2.83 | | | | 2.79 | | | | (1.66 | ) | | | (1.66 | ) | |
Year Ended 6/30/20 | | $ | 21.16 | | | | (0.09 | ) | | | 0.04 | (e) | | | (0.05 | ) | | | (11.13 | ) | | | (11.13 | ) | |
Year Ended 6/30/19 | | $ | 32.91 | | | | (0.20 | ) | | | (0.79 | ) | | | (0.99 | ) | | | (10.76 | ) | | | (10.76 | ) | |
Year Ended 6/30/18 | | $ | 35.82 | | | | (0.20 | ) | | | 4.38 | | | | 4.18 | | | | (7.09 | ) | | | (7.09 | ) | |
Year Ended 6/30/17 | | $ | 34.89 | | | | (0.16 | ) | | | 5.58 | | | | 5.42 | | | | (4.49 | ) | | | (4.49 | ) | |
Year Ended 6/30/16 | | $ | 42.22 | | | | (0.17 | ) | | | (3.28 | ) | | | (3.45 | ) | | | (3.88 | ) | | | (3.88 | ) | |
(a) Per share net investment income (loss) has been calculated using the average daily shares method.
(b) Not annualized for periods less than one year.
(c) Annualized for periods less than one year.
(d) Portfolio turnover is calculated on the basis of the Fund as a whole without distinguishing between the classes of shares issued.
(e) The amount shown for a share outstanding throughout the period does not accord with the change in aggregate gains and losses in the portfolio of securities during the period because of timing of sales and purchases of fund shares in relation to fluctuating market values during the period.
(f) Amount is less than $0.005 per share.
See notes to financial statements.
136
Victory Portfolios | | Financial Highlights — continued | |
For a Share Outstanding Throughout Each Period
| | | | | Ratios to Average Net Assets | | Supplemental Data | |
| | | Capital
Contributions
from Prior
Custodian,
Net (See
Note 8) | | Net Asset
Value,
End of
Period | | Total
Return
(Excludes
Sales
Charge)(b) | | Net
Expenses(c) | | Net
Investment
Income
(Loss)(c) | | Gross
Expenses(c) | | Net Assets,
End of
Period
(000's) | | Portfolio
Turnover(b)(d) | |
Victory Munder Mid-Cap Core Growth Fund | |
Class A | |
Six Months Ended
12/31/20 (unaudited) | | | — | | | $ | 13.42 | | | | 28.47 | % | | | 1.28 | % | | | (0.47 | )% | | | 1.28 | % | | $ | 207,347 | | | | 43 | % | |
Year Ended 6/30/20 | | | — | | | $ | 11.76 | | | | (3.04 | )% | | | 1.29 | % | | | (0.40 | )% | | | 1.29 | % | | $ | 186,571 | | | | 86 | % | |
Year Ended 6/30/19 | | | — | | | $ | 22.95 | | | | 4.18 | % | | | 1.28 | % | | | (0.49 | )% | | | 1.28 | % | | $ | 292,120 | | | | 82 | % | |
Year Ended 6/30/18 | | | — | | | $ | 34.56 | | | | 12.08 | % | | | 1.28 | % | | | (0.29 | )% | | | 1.28 | % | | $ | 575,926 | | | | 50 | % | |
Year Ended 6/30/17 | | | — | | | $ | 37.21 | | | | 17.18 | % | | | 1.31 | % | | | (0.21 | )% | | | 1.31 | % | | $ | 657,496 | | | | 55 | % | |
Year Ended 6/30/16 | | | — | (f) | | $ | 35.99 | | | | (7.94 | )% | | | 1.32 | % | | | (0.21 | )% | | | 1.34 | % | | $ | 970,418 | | | | 40 | % | |
Class C | |
Six Months Ended
12/31/20 (unaudited) | | | — | | | $ | 4.59 | | | | 28.09 | % | | | 2.08 | % | | | (1.28 | )% | | | 2.08 | % | | $ | 12,936 | | | | 43 | % | |
Year Ended 6/30/20 | | | — | | | $ | 4.90 | | | | (3.82 | )% | | | 2.03 | % | | | (1.15 | )% | | | 2.03 | % | | $ | 14,053 | | | | 86 | % | |
Year Ended 6/30/19 | | | — | | | $ | 15.96 | | | | 3.51 | % | | | 1.94 | % | | | (1.14 | )% | | | 1.94 | % | | $ | 26,825 | | | | 82 | % | |
Year Ended 6/30/18 | | | — | | | $ | 27.98 | | | | 11.28 | % | | | 1.96 | % | | | (0.94 | )% | | | 1.96 | % | | $ | 52,210 | | | | 50 | % | |
Year Ended 6/30/17 | | | — | | | $ | 31.54 | | | | 16.43 | % | | | 1.97 | % | | | (0.88 | )% | | | 1.97 | % | | $ | 148,305 | | | | 55 | % | |
Year Ended 6/30/16 | | | — | (f) | | $ | 31.34 | | | | (8.58 | )% | | | 2.00 | % | | | (0.89 | )% | | | 2.00 | % | | $ | 200,199 | | | | 40 | % | |
Class R | |
Six Months Ended
12/31/20 (unaudited) | | | — | | | $ | 11.11 | | | | 28.22 | % | | | 1.57 | % | | | (0.76 | )% | | | 1.68 | % | | $ | 14,362 | | | | 43 | % | |
Year Ended 6/30/20 | | | — | | | $ | 9.98 | | | | (3.28 | )% | | | 1.57 | % | | | (0.68 | )% | | | 1.67 | % | | $ | 12,943 | | | | 86 | % | |
Year Ended 6/30/19 | | | — | | | $ | 21.16 | | | | 3.85 | % | | | 1.57 | % | | | (0.79 | )% | | | 1.69 | % | | $ | 18,438 | | | | 82 | % | |
Year Ended 6/30/18 | | | — | | | $ | 32.91 | | | | 11.79 | % | | | 1.57 | % | | | (0.58 | )% | | | 1.65 | % | | $ | 25,939 | | | | 50 | % | |
Year Ended 6/30/17 | | | — | | | $ | 35.82 | | | | 16.87 | % | | | 1.57 | % | | | (0.47 | )% | | | 1.64 | % | | $ | 32,913 | | | | 55 | % | |
Year Ended 6/30/16 | | | — | (f) | | $ | 34.89 | | | | (8.19 | )% | | | 1.57 | % | | | (0.46 | )% | | | 1.62 | % | | $ | 39,928 | | | | 40 | % | |
(continues on next page)
See notes to financial statements.
137
Victory Portfolios | | Financial Highlights | |
For a Share Outstanding Throughout Each Period
| | | | | Investment Activities | | Distributions to
Shareholders From | |
| | | Net Asset
Value,
Beginning of
Period | | Net
Investment
Income
(Loss)(a) | | Net
Realized and
Unrealized
Gains
(Losses) on
Investments | | Total from
Investment
Activities | | Net Realized
Gains From
Investments | | Total
Distributions | |
Victory Munder Mid-Cap Core Growth Fund | |
Class R6 | |
Six Months Ended
12/31/20 (unaudited) | | $ | 14.80 | | | | (0.01 | ) | | | 4.23 | | | | 4.22 | | | | (1.66 | ) | | | (1.66 | ) | |
Year Ended 6/30/20 | | $ | 26.00 | | | | — | (f) | | | (0.07 | ) | | | (0.07 | ) | | | (11.13 | ) | | | (11.13 | ) | |
Year Ended 6/30/19 | | $ | 37.36 | | | | — | (f) | | | (0.60 | ) | | | (0.60 | ) | | | (10.76 | ) | | | (10.76 | ) | |
Year Ended 6/30/18 | | $ | 39.55 | | | | 0.06 | | | | 4.84 | | | | 4.90 | | | | (7.09 | ) | | | (7.09 | ) | |
Year Ended 6/30/17 | | $ | 37.82 | | | | 0.10 | | | | 6.12 | | | | 6.22 | | | | (4.49 | ) | | | (4.49 | ) | |
Year Ended 6/30/16 | | $ | 45.11 | | | | 0.10 | | | | (3.51 | ) | | | (3.41 | ) | | | (3.88 | ) | | | (3.88 | ) | |
Class Y | |
Six Months Ended
12/31/20 (unaudited) | | $ | 14.15 | | | | (0.02 | ) | | | 4.04 | | | | 4.02 | | | | (1.66 | ) | | | (1.66 | ) | |
Year Ended 6/30/20 | | $ | 25.37 | | | | (0.04 | ) | | | (0.05 | ) | | | (0.09 | ) | | | (11.13 | ) | | | (11.13 | ) | |
Year Ended 6/30/19 | | $ | 36.79 | | | | (0.07 | ) | | | (0.59 | ) | | | (0.66 | ) | | | (10.76 | ) | | | (10.76 | ) | |
Year Ended 6/30/18 | | $ | 39.10 | | | | (0.01 | ) | | | 4.79 | | | | 4.78 | | | | (7.09 | ) | | | (7.09 | ) | |
Year Ended 6/30/17 | | $ | 37.51 | | | | 0.02 | | | | 6.06 | | | | 6.08 | | | | (4.49 | ) | | | (4.49 | ) | |
Year Ended 6/30/16 | | $ | 44.85 | | | | 0.02 | | | | (3.48 | ) | | | (3.46 | ) | | | (3.88 | ) | | | (3.88 | ) | |
(a) Per share net investment income (loss) has been calculated using the average daily shares method.
(b) Not annualized for periods less than one year.
(c) Annualized for periods less than one year.
(d) Portfolio turnover is calculated on the basis of the Fund as a whole without distinguishing between the classes of shares issued.
(e) The amount shown for a share outstanding throughout the period does not accord with the change in aggregate gains and losses in the portfolio of securities during the period because of timing of sales and purchases of fund shares in relation to fluctuating market values during the period.
(f) Amount is less than $0.005 per share.
See notes to financial statements.
138
Victory Portfolios | | Financial Highlights — continued | |
For a Share Outstanding Throughout Each Period
| | | | | Ratios to Average Net Assets | | Supplemental Data | |
| | | Capital
Contributions
from Prior
Custodian,
Net (See
Note 8) | | Net Asset
Value,
End of
Period | | Total
Return
(Excludes
Sales
Charge)(b) | | Net
Expenses(c) | | Net
Investment
Income
(Loss)(c) | | Gross
Expenses(c) | | Net Assets,
End of
Period
(000's) | | Portfolio
Turnover(b)(d) | |
Victory Munder Mid-Cap Core Growth Fund | |
Class R6 | |
Six Months Ended
12/31/20 (unaudited) | | | — | | | $ | 17.36 | | | | 28.70 | % | | | 0.88 | % | | | (0.08 | )% | | | 0.88 | % | | $ | 98,699 | | | | 43 | % | |
Year Ended 6/30/20 | | | — | | | $ | 14.80 | | | | (2.60 | )% | | | 0.86 | % | | | 0.01 | % | | | 0.86 | % | | $ | 113,104 | | | | 86 | % | |
Year Ended 6/30/19 | | | — | | | $ | 26.00 | | | | 4.57 | % | | | 0.87 | % | | | (0.01 | )% | | | 0.87 | % | | $ | 310,949 | | | | 82 | % | |
Year Ended 6/30/18 | | | — | | | $ | 37.36 | | | | 12.56 | % | | | 0.84 | % | | | 0.15 | % | | | 0.84 | % | | $ | 685,568 | | | | 50 | % | |
Year Ended 6/30/17 | | | — | | | $ | 39.55 | | | | 17.73 | % | | | 0.85 | % | | | 0.26 | % | | | 0.85 | % | | $ | 761,607 | | | | 55 | % | |
Year Ended 6/30/16 | | | — | (f) | | $ | 37.82 | | | | (7.54 | )% | | | 0.87 | % | | | 0.25 | % | | | 0.87 | % | | $ | 752,971 | | | | 40 | % | |
Class Y | |
Six Months Ended
12/31/20 (unaudited) | | | — | | | $ | 16.51 | | | | 28.60 | % | | | 1.02 | % | | | (0.21 | )% | | | 1.02 | % | | $ | 250,963 | | | | 43 | % | |
Year Ended 6/30/20 | | | — | | | $ | 14.15 | | | | (2.76 | )% | | | 1.04 | % | | | (0.18 | )% | | | 1.04 | % | | $ | 257,692 | | | | 86 | % | |
Year Ended 6/30/19 | | | — | | | $ | 25.37 | | | | 4.47 | % | | | 1.02 | % | | | (0.22 | )% | | | 1.02 | % | | $ | 810,261 | | | | 82 | % | |
Year Ended 6/30/18 | | | — | | | $ | 36.79 | | | | 12.38 | % | | | 1.01 | % | | | (0.02 | )% | | | 1.01 | % | | $ | 2,240,305 | | | | 50 | % | |
Year Ended 6/30/17 | | | — | | | $ | 39.10 | | | | 17.49 | % | | | 1.04 | % | | | 0.06 | % | | | 1.05 | % | | $ | 2,345,812 | | | | 55 | % | |
Year Ended 6/30/16 | | | — | (f) | | $ | 37.51 | | | | (7.71 | )% | | | 1.06 | % | | | 0.05 | % | | | 1.06 | % | | $ | 2,965,306 | | | | 40 | % | |
See notes to financial statements.
139
Victory Portfolios | | Financial Highlights | |
For a Share Outstanding Throughout Each Period
| | | | | Investment Activities | | Distributions to
Shareholders From | |
| | | Net Asset
Value,
Beginning of
Period | | Net
Investment
Income
(Loss)(a) | | Net Realized
and Unrealized
Gains (Losses)
on Investments | | Total from
Investment
Activities | | Net
Investment
Income | | Net Realized
Gains from
Investments | |
Victory Munder Small Cap Growth Fund | |
Class A | |
Six Months Ended
12/31/20 (unaudited) | | $ | 14.13 | | | | (0.07 | ) | | | 5.09 | | | | 5.02 | | | | (0.02 | ) | | | (1.42 | ) | |
Year Ended 6/30/20 | | $ | 13.39 | | | | (0.09 | ) | | | 1.88 | | | | 1.79 | | | | — | | | | (1.05 | ) | |
Year Ended 6/30/19 | | $ | 13.81 | | | | (0.12 | ) | | | 1.12 | | | | 1.00 | | | | — | | | | (1.42 | ) | |
Year Ended 6/30/18 | | $ | 11.14 | | | | (0.10 | ) | | | 2.84 | | | | 2.74 | | | | — | | | | (0.07 | ) | |
Year Ended 6/30/17 | | $ | 8.59 | | | | (0.05 | ) | | | 2.60 | | | | 2.55 | | | | — | | | | — | | |
Year Ended 6/30/16 | | $ | 10.47 | | | | (0.07 | ) | | | (1.81 | ) | | | (1.88 | ) | | | — | | | | — | | |
Class I | |
Six Months Ended
12/31/20 (unaudited) | | $ | 14.35 | | | | (0.05 | ) | | | 5.18 | | | | 5.13 | | | | (0.05 | ) | | | (1.42 | ) | |
Year Ended 6/30/20 | | $ | 13.56 | | | | (0.05 | ) | | | 1.89 | | | | 1.84 | | | | — | | | | (1.05 | ) | |
Year Ended 6/30/19 | | $ | 13.92 | | | | (0.09 | ) | | | 1.15 | | | | 1.06 | | | | — | | | | (1.42 | ) | |
Year Ended 6/30/18 | | $ | 11.21 | | | | (0.07 | ) | | | 2.85 | | | | 2.78 | | | | — | | | | (0.07 | ) | |
Year Ended 6/30/17 | | $ | 8.62 | | | | (0.01 | ) | | | 2.60 | | | | 2.59 | | | | — | | | | — | | |
Year Ended 6/30/16 | | $ | 10.48 | | | | (0.05 | ) | | | (1.81 | ) | �� | | (1.86 | ) | | | — | | | | — | | |
Class Y | |
Six Months Ended
12/31/20 (unaudited) | | $ | 14.20 | | | | (0.05 | ) | | | 5.11 | | | | 5.06 | | | | (0.03 | ) | | | (1.42 | ) | |
Year Ended 6/30/20 | | $ | 13.44 | | | | (0.06 | ) | | | 1.87 | | | | 1.81 | | | | — | | | | (1.05 | ) | |
Year Ended 6/30/19 | | $ | 13.88 | | | | (0.11 | ) | | | 1.09 | | | | 0.98 | | | | — | | | | (1.42 | ) | |
Year Ended 6/30/18 | | $ | 11.18 | | | | (0.09 | ) | | | 2.86 | | | | 2.77 | | | | — | | | | (0.07 | ) | |
Year Ended 6/30/17 | | $ | 8.61 | | | | (0.02 | ) | | | 2.59 | | | | 2.57 | | | | — | | | | — | | |
Year Ended 6/30/16 | | $ | 10.48 | | | | (0.05 | ) | | | (1.82 | ) | | | (1.87 | ) | | | — | | | | — | | |
(a) Per share net investment income (loss) has been calculated using the average daily shares method.
(b) Not annualized for periods less than one year.
(c) Annualized for periods less than one year.
(d) Portfolio turnover is calculated on the basis of the Fund as a whole without distinguishing between the classes of shares issued.
See notes to financial statements.
140
Victory Portfolios | | Financial Highlights — continued | |
For a Share Outstanding Throughout Each Period
| | | | | Ratios to Average Net Assets | | Supplemental Data | |
| | | Total
Distributions | | Net Asset
Value,
End of
Period | | Total
Return
(Excludes
Sales
Charge)(b) | | Net
Expenses(c) | | Net
Investment
Income
(Loss)(c) | | Gross
Expenses(c) | | Net Assets,
End of
Period
(000's) | | Portfolio
Turnover(b)(d) | |
Victory Munder Small Cap Growth Fund | |
Class A | |
Six Months Ended
12/31/20 (unaudited) | | | (1.44 | ) | | $ | 17.71 | | | | 35.80 | % | | | 1.40 | % | | | (0.83 | )% | | | 2.12 | % | | $ | 483 | | | | 11 | % | |
Year Ended 6/30/20 | | | (1.05 | ) | | $ | 14.13 | | | | 13.64 | % | | | 1.40 | % | | | (0.67 | )% | | | 2.26 | % | | $ | 359 | | | | 56 | % | |
Year Ended 6/30/19 | | | (1.42 | ) | | $ | 13.39 | | | | 10.06 | % | | | 1.40 | % | | | (0.90 | )% | | | 2.31 | % | | $ | 189 | | | | 108 | % | |
Year Ended 6/30/18 | | | (0.07 | ) | | $ | 13.81 | | | | 24.73 | % | | | 1.40 | % | | | (0.86 | )% | | | 2.69 | % | | $ | 174 | | | | 62 | % | |
Year Ended 6/30/17 | | | — | | | $ | 11.14 | | | | 29.69 | % | | | 1.40 | % | | | (0.52 | )% | | | 4.67 | % | | $ | 83 | | | | 56 | % | |
Year Ended 6/30/16 | | | — | | | $ | 8.59 | | | | (17.96 | )% | | | 1.40 | % | | | (0.73 | )% | | | 11.23 | % | | $ | 49 | | | | 55 | % | |
Class I | |
Six Months Ended
12/31/20 (unaudited) | | | (1.47 | ) | | $ | 18.01 | | | | 36.02 | % | | | 1.15 | % | | | (0.57 | )% | | | 1.25 | % | | $ | 14,224 | | | | 11 | % | |
Year Ended 6/30/20 | | | (1.05 | ) | | $ | 14.35 | | | | 13.85 | % | | | 1.15 | % | | | (0.39 | )% | | | 1.32 | % | | $ | 10,370 | | | | 56 | % | |
Year Ended 6/30/19 | | | (1.42 | ) | | $ | 13.56 | | | | 10.44 | % | | | 1.15 | % | | | (0.65 | )% | | | 1.17 | % | | $ | 9,034 | | | | 108 | % | |
Year Ended 6/30/18 | | | (0.07 | ) | | $ | 13.92 | | | | 24.94 | % | | | 1.15 | % | | | (0.61 | )% | | | 1.31 | % | | $ | 7,518 | | | | 62 | % | |
Year Ended 6/30/17 | | | — | | | $ | 11.21 | | | | 30.05 | % | | | 1.15 | % | | | (0.12 | )% | | | 1.37 | % | | $ | 6,049 | | | | 56 | % | |
Year Ended 6/30/16 | | | — | | | $ | 8.62 | | | | (17.75 | )% | | | 1.15 | % | | | (0.51 | )% | | | 2.49 | % | | $ | 4,337 | | | | 55 | % | |
Class Y | |
Six Months Ended
12/31/20 (unaudited) | | | (1.45 | ) | | $ | 17.81 | | | | 35.96 | % | | | 1.25 | % | | | (0.67 | )% | | | 2.37 | % | | $ | 119 | | | | 11 | % | |
Year Ended 6/30/20 | | | (1.05 | ) | | $ | 14.20 | | | | 13.74 | % | | | 1.25 | % | | | (0.49 | )% | | | 2.84 | % | | $ | 87 | | | | 56 | % | |
Year Ended 6/30/19 | | | (1.42 | ) | | $ | 13.44 | | | | 9.84 | % | | | 1.25 | % | | | (0.77 | )% | | | 1.45 | % | | $ | 77 | | | | 108 | % | |
Year Ended 6/30/18 | | | (0.07 | ) | | $ | 13.88 | | | | 24.92 | % | | | 1.25 | % | | | (0.71 | )% | | | 2.98 | % | | $ | 70 | | | | 62 | % | |
Year Ended 6/30/17 | | | — | | | $ | 11.18 | | | | 29.85 | % | | | 1.25 | % | | | (0.22 | )% | | | 3.98 | % | | $ | 56 | | | | 56 | % | |
Year Ended 6/30/16 | | | — | | | $ | 8.61 | | | | (17.84 | )% | | | 1.25 | % | | | (0.59 | )% | | | 13.34 | % | | $ | 43 | | | | 55 | % | |
See notes to financial statements.
141
Victory Portfolios | | Financial Highlights | |
For a Share Outstanding Throughout Each Period
| | | | | Investment Activities | | Distributions to
Shareholders From | |
| | | Net Asset
Value,
Beginning of
Period | | Net
Investment
Income
(Loss)(a) | | Net Realized
and Unrealized
Gains (Losses)
on Investments | | Total from
Investment
Activities | | Net
Investment
Income | | Net Realized
Gains from
Investments | |
Victory Trivalent Emerging Markets Small-Cap Fund | |
Class A | |
Six Months Ended
12/31/20 (unaudited) | | $ | 11.74 | | | | 0.07 | | | | 3.19 | | | | 3.26 | | | | (0.11 | ) | | | — | | |
Year Ended 6/30/20 | | $ | 11.77 | | | | 0.12 | | | | (0.06 | ) | | | 0.06 | | | | (0.09 | ) | | | — | | |
Year Ended 6/30/19 | | $ | 13.62 | | | | 0.16 | | | | (1.07 | ) | | | (0.91 | ) | | | (0.16 | ) | | | (0.78 | ) | |
Year Ended 6/30/18 | | $ | 12.34 | | | | 0.12 | | | | 1.51 | | | | 1.63 | | | | (0.11 | ) | | | (0.24 | ) | |
Year Ended 6/30/17 | | $ | 10.40 | | | | 0.13 | | | | 1.90 | | | | 2.03 | | | | (0.09 | ) | | | — | | |
Year Ended 6/30/16 | | $ | 11.48 | | | | 0.10 | | | | (1.13 | ) | | | (1.03 | ) | | | (0.05 | ) | | | — | | |
Class Y | |
Six Months Ended
12/31/20 (unaudited) | | $ | 11.75 | | | | 0.09 | | | | 3.20 | | | | 3.29 | | | | (0.13 | ) | | | — | | |
Year Ended 6/30/20 | | $ | 11.78 | | | | 0.15 | | | | (0.07 | ) | | | 0.08 | | | | (0.11 | ) | | | — | | |
Year Ended 6/30/19 | | $ | 13.62 | | | | 0.19 | | | | (1.08 | ) | | | (0.89 | ) | | | (0.17 | ) | | | (0.78 | ) | |
Year Ended 6/30/18 | | $ | 12.38 | | | | 0.17 | | | | 1.50 | | | | 1.67 | | | | (0.19 | ) | | | (0.24 | ) | |
Year Ended 6/30/17 | | $ | 10.43 | | | | 0.12 | | | | 1.94 | | | | 2.06 | | | | (0.11 | ) | | | — | | |
Year Ended 6/30/16 | | $ | 11.51 | | | | 0.13 | | | | (1.13 | ) | | | (1.00 | ) | | | (0.08 | ) | | | — | | |
(a) Per share net investment income (loss) has been calculated using the average daily shares method.
(b) Not annualized for periods less than one year.
(c) Annualized for periods less than one year.
(d) Portfolio turnover is calculated on the basis of the Fund as a whole without distinguishing between the classes of shares issued.
See notes to financial statements.
142
Victory Portfolios | | Financial Highlights — continued | |
For a Share Outstanding Throughout Each Period
| | | | | Ratios to Average Net Assets | | Supplemental Data | |
| | | Total
Distributions | | Net Asset
Value,
End of
Period | | Total
Return
(Excludes
Sales
Charge)(b) | | Net
Expenses(c) | | Net
Investment
Income
(Loss)(c) | | Gross
Expenses(c) | | Net Assets,
End of
Period
(000's) | | Portfolio
Turnover(b)(d) | |
Victory Trivalent Emerging Markets Small-Cap Fund | |
Class A | |
Six Months Ended
12/31/20 (unaudited) | | | (0.11 | ) | | $ | 14.89 | | | | 27.76 | % | | | 1.73 | % | | | 1.03 | % | | | 2.75 | % | | $ | 1,123 | | | | 31 | % | |
Year Ended 6/30/20 | | | (0.09 | ) | | $ | 11.74 | | | | 0.48 | % | | | 1.73 | % | | | 1.07 | % | | | 3.18 | % | | $ | 933 | | | | 64 | % | |
Year Ended 6/30/19 | | | (0.94 | ) | | $ | 11.77 | | | | (5.97 | )% | | | 1.73 | % | | | 1.32 | % | | | 2.72 | % | | $ | 1,003 | | | | 78 | % | |
Year Ended 6/30/18 | | | (0.35 | ) | | $ | 13.62 | | | | 13.12 | % | | | 1.73 | % | | | 0.86 | % | | | 3.46 | % | | $ | 1,257 | | | | 93 | % | |
Year Ended 6/30/17 | | | (0.09 | ) | | $ | 12.34 | | | | 19.71 | % | | | 1.73 | % | | | 1.16 | % | | | 4.46 | % | | $ | 690 | | | | 81 | % | |
Year Ended 6/30/16 | | | (0.05 | ) | | $ | 10.40 | | | | (8.93 | )% | | | 1.73 | % | | | 0.95 | % | | | 1.74 | % | | $ | 278 | | | | 104 | % | |
Class Y | |
Six Months Ended
12/31/20 (unaudited) | | | (0.13 | ) | | $ | 14.91 | | | | 28.03 | % | | | 1.48 | % | | | 1.26 | % | | | 2.30 | % | | $ | 9,597 | | | | 31 | % | |
Year Ended 6/30/20 | | | (0.11 | ) | | $ | 11.75 | | | | 0.70 | % | | | 1.48 | % | | | 1.34 | % | | | 2.67 | % | | $ | 7,495 | | | | 64 | % | |
Year Ended 6/30/19 | | | (0.95 | ) | | $ | 11.78 | | | | (5.76 | )% | | | 1.48 | % | | | 1.57 | % | | | 2.22 | % | | $ | 7,907 | | | | 78 | % | |
Year Ended 6/30/18 | | | (0.43 | ) | | $ | 13.62 | | | | 13.38 | % | | | 1.48 | % | | | 1.22 | % | | | 3.02 | % | | $ | 7,767 | | | | 93 | % | |
Year Ended 6/30/17 | | | (0.11 | ) | | $ | 12.38 | | | | 20.01 | % | | | 1.48 | % | | | 1.08 | % | | | 3.46 | % | | $ | 4,894 | | | | 81 | % | |
Year Ended 6/30/16 | | | (0.08 | ) | | $ | 10.43 | | | | (8.69 | )% | | | 1.48 | % | | | 1.29 | % | | | 2.40 | % | | $ | 3,671 | | | | 104 | % | |
See notes to financial statements.
143
Victory Portfolios | | Financial Highlights | |
For a Share Outstanding Throughout Each Period
| | | | | Investment Activities | | Distributions to
Shareholders From | |
| | | Net Asset
Value,
Beginning of
Period | | Net
Investment
Income
(Loss)(a) | | Net
Realized and
Unrealized
Gains
(Losses) on
Investments | | Total from
Investment
Activities | | Net
Investment
Income | | Net Realized
Gains from
Investments | | Total
Distributions | |
Victory Trivalent International Fund-Core Equity | |
Class A | |
Six Months Ended
12/31/20
(unaudited) | | $ | 6.49 | | | | 0.05 | | | | 1.20 | | | | 1.25 | | | | (0.09 | ) | | | — | | | | (0.09 | ) | |
Year Ended
6/30/20 | | $ | 6.87 | | | | 0.12 | | | | (0.44 | ) | | | (0.32 | ) | | | (0.06 | ) | | | — | | | | (0.06 | ) | |
Year Ended
6/30/19 | | $ | 7.28 | | | | 0.14 | | | | (0.30 | ) | | | (0.16 | ) | | | (0.13 | ) | | | (0.12 | ) | | | (0.25 | ) | |
Year Ended
6/30/18 | | $ | 7.21 | | | | 0.13 | | | | 0.44 | | | | 0.57 | | | | (0.13 | ) | | | (0.37 | ) | | | (0.50 | ) | |
Year Ended
6/30/17 | | $ | 6.18 | | | | 0.08 | | | | 1.07 | | | | 1.15 | | | | (0.12 | ) | | | — | | | | (0.12 | ) | |
Year Ended
6/30/16 | | $ | 7.01 | | | | 0.08 | | | | (0.86 | ) | | | (0.78 | ) | | | (0.10 | ) | | | — | | | | (0.10 | ) | |
Class C | |
Six Months Ended
12/31/20
(unaudited) | | $ | 6.46 | | | | 0.04 | | | | 1.18 | | | | 1.22 | | | | (0.01 | ) | | | — | | | | (0.01 | ) | |
Year Ended
6/30/20 | | $ | 6.84 | | | | 0.06 | | | | (0.43 | ) | | | (0.37 | ) | | | (0.01 | ) | | | — | | | | (0.01 | ) | |
Year Ended
6/30/19 | | $ | 7.22 | | | | 0.08 | | | | (0.27 | ) | | | (0.19 | ) | | | (0.07 | ) | | | (0.12 | ) | | | (0.19 | ) | |
Year Ended
6/30/18 | | $ | 7.16 | | | | 0.05 | | | | 0.45 | | | | 0.50 | | | | (0.07 | ) | | | (0.37 | ) | | | (0.44 | ) | |
Year Ended
6/30/17 | | $ | 6.14 | | | | 0.03 | | | | 1.07 | | | | 1.10 | | | | (0.08 | ) | | | — | | | | (0.08 | ) | |
Year Ended
6/30/16 | | $ | 6.96 | | | | 0.04 | | | | (0.86 | ) | | | (0.82 | ) | | | (0.05 | ) | | | — | | | | (0.05 | ) | |
Class I | |
Six Months Ended
12/31/20
(unaudited) | | $ | 6.53 | | | | 0.07 | | | | 1.21 | | | | 1.28 | | | | (0.12 | ) | | | — | | | | (0.12 | ) | |
Year Ended
6/30/20 | | $ | 6.90 | | | | 0.14 | | | | (0.43 | ) | | | (0.29 | ) | | | (0.08 | ) | | | — | | | | (0.08 | ) | |
Year Ended
6/30/19 | | $ | 7.29 | | | | 0.17 | | | | (0.30 | ) | | | (0.13 | ) | | | (0.14 | ) | | | (0.12 | ) | | | (0.26 | ) | |
Year Ended
6/30/18 | | $ | 7.23 | | | | 0.24 | | | | 0.34 | | | | 0.58 | | | | (0.15 | ) | | | (0.37 | ) | | | (0.52 | ) | |
Year Ended
6/30/17 | | $ | 6.20 | | | | 0.12 | | | | 1.06 | | | | 1.18 | | | | (0.15 | ) | | | — | | | | (0.15 | ) | |
Year Ended
6/30/16 | | $ | 7.03 | | | | 0.11 | | | | (0.85 | ) | | | (0.74 | ) | | | (0.14 | ) | | | — | | | | (0.14 | ) | |
* Includes adjustments in accordance with U.S. generally accepted accounting principles.
(a) Per share net investment income (loss) has been calculated using the average daily shares method.
(b) Not annualized for periods less than one year.
(c) Annualized for periods less than one year.
(d) Portfolio turnover is calculated on the basis of the Fund as a whole without distinguishing between the classes of shares issued.
(e) The Fund received monies related to a nonrecurring refund from prior custodian. The corresponding impact to the total return was 0.76% for the year ended June 30, 2016. (See Note 8).
See notes to financial statements.
144
Victory Portfolios | | Financial Highlights — continued | |
For a Share Outstanding Throughout Each Period
| | | | | Ratios to Average Net Assets | | Supplemental Data | |
| | | Capital
Contributions
from Prior
Custodian,
Net (See
Note 8) | | Net Asset
Value,
End of
Period | | Total
Return
(Excludes
Sales
Charge)*(b) | | Net
Expenses(c) | | Net
Investment
Income
(Loss)(c) | | Gross
Expenses(c) | | Net Assets,
End of
Period
(000's) | | Portfolio
Turnover(b)(d) | |
Victory Trivalent International Fund-Core Equity | |
Class A | |
Six Months Ended
12/31/20
(unaudited) | | | — | | | $ | 7.65 | | | | 19.36 | % | | | 0.95 | % | | | 1.52 | % | | | 1.74 | % | | $ | 5,123 | | | | 23 | % | |
Year Ended
6/30/20 | | | — | | | $ | 6.49 | | | | (4.72 | )% | | | 0.95 | % | | | 1.73 | % | | | 1.84 | % | | $ | 4,550 | | | | 49 | % | |
Year Ended
6/30/19 | | | — | | | $ | 6.87 | | | | (1.69 | )% | | | 0.95 | % | | | 2.08 | % | | | 1.96 | % | | $ | 5,347 | | | | 56 | % | |
Year Ended
6/30/18 | | | — | | | $ | 7.28 | | | | 7.74 | % | | | 1.11 | % | | | 1.71 | % | | | 1.91 | % | | $ | 8,620 | | | | 51 | % | |
Year Ended
6/30/17 | | | — | | | $ | 7.21 | | | | 18.95 | % | | | 1.38 | % | | | 1.22 | % | | | 2.27 | % | | $ | 5,658 | | | | 91 | % | |
Year Ended
6/30/16 | | | 0.05 | | | $ | 6.18 | | | | (10.43 | )%(e) | | | 1.47 | % | | | 1.31 | % | | | 1.80 | % | | $ | 4,687 | | | | 61 | % | |
Class C | |
Six Months Ended
12/31/20
(unaudited) | | | — | | | $ | 7.67 | | | | 18.86 | % | | | 1.70 | % | | | 1.07 | % | | | 10.96 | % | | $ | 121 | | | | 23 | % | |
Year Ended
6/30/20 | | | — | | | $ | 6.46 | | | | (5.48 | )% | | | 1.70 | % | | | 0.87 | % | | | 6.44 | % | | $ | 204 | | | | 49 | % | |
Year Ended
6/30/19 | | | — | | | $ | 6.84 | | | | (2.19 | )% | | | 1.70 | % | | | 1.22 | % | | | 5.22 | % | | $ | 335 | | | | 56 | % | |
Year Ended
6/30/18 | | | — | | | $ | 7.22 | | | | 6.81 | % | | | 1.87 | % | | | 0.64 | % | | | 3.61 | % | | $ | 449 | | | | 51 | % | |
Year Ended
6/30/17 | | | — | | | $ | 7.16 | | | | 18.01 | % | | | 2.14 | % | | | 0.42 | % | | | 2.97 | % | | $ | 773 | | | | 91 | % | |
Year Ended
6/30/16 | | | 0.05 | | | $ | 6.14 | | | | (11.08 | )%(e) | | | 2.22 | % | | | 0.63 | % | | | 2.33 | % | | $ | 1,111 | | | | 61 | % | |
Class I | |
Six Months Ended
12/31/20
(unaudited) | | | — | | | $ | 7.69 | | | | 19.61 | % | | | 0.60 | % | | | 1.86 | % | | | 1.40 | % | | $ | 3,082 | | | | 23 | % | |
Year Ended
6/30/20 | | | — | | | $ | 6.53 | | | | (4.36 | )% | | | 0.60 | % | | | 2.12 | % | | | 1.54 | % | | $ | 2,579 | | | | 49 | % | |
Year Ended
6/30/19 | | | — | | | $ | 6.90 | | | | (1.19 | )% | | | 0.60 | % | | | 2.48 | % | | | 1.76 | % | | $ | 2,268 | | | | 56 | % | |
Year Ended
6/30/18 | | | — | | | $ | 7.29 | | | | 8.07 | % | | | 0.72 | % | | | 3.17 | % | | | 2.67 | % | | $ | 2,575 | | | | 51 | % | |
Year Ended
6/30/17 | | | — | | | $ | 7.23 | | | | 19.47 | % | | | 0.90 | % | | | 1.84 | % | | | 6.48 | % | | $ | 378 | | | | 91 | % | |
Year Ended
6/30/16 | | | 0.05 | | | $ | 6.20 | | | | (9.92 | )%(e) | | | 0.96 | % | | | 1.78 | % | | | 4.02 | % | | $ | 192 | | | | 61 | % | |
(continues on next page)
See notes to financial statements.
145
Victory Portfolios | | Financial Highlights | |
For a Share Outstanding Throughout Each Period
| | | | | Investment Activities | | Distributions to
Shareholders From | |
| | | Net Asset
Value,
Beginning of
Period | | Net
Investment
Income
(Loss)(a) | | Net
Realized and
Unrealized
Gains
(Losses) on
Investments | | Total from
Investment
Activities | | Net
Investment
Income | | Net Realized
Gains from
Investments | | Total
Distributions | |
Victory Trivalent International Fund-Core Equity | |
Class R6 | |
Six Months Ended
12/31/20
(unaudited) | | $ | 6.57 | | | | 0.07 | | | | 1.20 | | | | 1.27 | | | | (0.11 | ) | | | — | | | | (0.11 | ) | |
Year Ended
6/30/20 | | $ | 6.92 | | | | 0.14 | | | | (0.43 | ) | | | (0.29 | ) | | | (0.06 | ) | | | — | | | | (0.06 | ) | |
Year Ended
6/30/19 | | $ | 7.31 | | | | 0.17 | | | | (0.29 | ) | | | (0.12 | ) | | | (0.15 | ) | | | (0.12 | ) | | | (0.27 | ) | |
Year Ended
6/30/18 | | $ | 7.23 | | | | 0.21 | | | | 0.39 | | | | 0.60 | | | | (0.15 | ) | | | (0.37 | ) | | | (0.52 | ) | |
Year Ended
6/30/17 | | $ | 6.21 | | | | 0.11 | | | | 1.07 | | | | 1.18 | | | | (0.16 | ) | | | — | | | | (0.16 | ) | |
Year Ended
6/30/16 | | $ | 7.03 | | | | 0.12 | | | | (0.86 | ) | | | (0.74 | ) | | | (0.13 | ) | | | — | | | | (0.13 | ) | |
Class Y | |
Six Months Ended
12/31/20
(unaudited) | | $ | 6.48 | | | | 0.06 | | | | 1.21 | | | | 1.27 | | | | (0.11 | ) | | | — | | | | (0.11 | ) | |
Year Ended
6/30/20 | | $ | 6.87 | | | | 0.13 | | | | (0.44 | ) | | | (0.31 | ) | �� | | (0.08 | ) | | | — | | | | (0.08 | ) | |
Year Ended
6/30/19 | | $ | 7.26 | | | | 0.15 | | | | (0.28 | ) | | | (0.13 | ) | | | (0.14 | ) | | | (0.12 | ) | | | (0.26 | ) | |
Year Ended
6/30/18 | | $ | 7.20 | | | | 0.12 | | | | 0.46 | | | | 0.58 | | | | (0.15 | ) | | | (0.37 | ) | | | (0.52 | ) | |
Year Ended
6/30/17 | | $ | 6.17 | | | | 0.09 | | | | 1.08 | | | | 1.17 | | | | (0.14 | ) | | | — | | | | (0.14 | ) | |
Year Ended
6/30/16 | | $ | 7.00 | | | | 0.10 | | | | (0.86 | ) | | | (0.76 | ) | | | (0.12 | ) | | | — | | | | (0.12 | ) | |
* Includes adjustments in accordance with U.S. generally accepted accounting principles.
(a) Per share net investment income (loss) has been calculated using the average daily shares method.
(b) Not annualized for periods less than one year.
(c) Annualized for periods less than one year.
(d) Portfolio turnover is calculated on the basis of the Fund as a whole without distinguishing between the classes of shares issued.
(e) The Fund received monies related to a nonrecurring refund from prior custodian. The corresponding impact to the total return was 0.76% for the year ended June 30, 2016. (See Note 8).
See notes to financial statements.
146
Victory Portfolios | | Financial Highlights — continued | |
For a Share Outstanding Throughout Each Period
| | | | | Ratios to Average Net Assets | | Supplemental Data | |
| | | Capital
Contributions
from Prior
Custodian,
Net (See
Note 8) | | Net Asset
Value,
End of
Period | | Total
Return
(Excludes
Sales
Charge)*(b) | | Net
Expenses(c) | | Net
Investment
Income
(Loss)(c) | | Gross
Expenses(c) | | Net Assets,
End of
Period
(000's) | | Portfolio
Turnover(b)(d) | |
Victory Trivalent International Fund-Core Equity | |
Class R6 | |
Six Months Ended
12/31/20
(unaudited) | | | — | | | $ | 7.73 | | | | 19.44 | % | | | 0.55 | % | | | 1.81 | % | | | 0.99 | % | | $ | 186,092 | | | | 23 | % | |
Year Ended
6/30/20 | | | — | | | $ | 6.57 | | | | (4.34 | )% | | | 0.55 | % | | | 2.06 | % | | | 1.01 | % | | $ | 119,275 | | | | 49 | % | |
Year Ended
6/30/19 | | | — | | | $ | 6.92 | | | | (1.12 | )% | | | 0.55 | % | | | 2.53 | % | | | 1.45 | % | | $ | 5,661 | | | | 56 | % | |
Year Ended
6/30/18 | | | — | | | $ | 7.31 | | | | 8.14 | % | | | 0.71 | % | | | 2.71 | % | | | 1.71 | % | | $ | 5,975 | | | | 51 | % | |
Year Ended
6/30/17 | | | — | | | $ | 7.23 | | | | 19.39 | % | | | 0.91 | % | | | 1.63 | % | | | 2.44 | % | | $ | 1,628 | | | | 91 | % | |
Year Ended
6/30/16 | | | 0.05 | | | $ | 6.21 | | | | (9.86 | )%(e) | | | 0.96 | % | | | 1.86 | % | | | 2.19 | % | | $ | 1,575 | | | | 61 | % | |
Class Y | |
Six Months Ended
12/31/20
(unaudited) | | | — | | | $ | 7.64 | | | | 19.66 | % | | | 0.70 | % | | | 1.77 | % | | | 1.18 | % | | $ | 7,683 | | | | 23 | % | |
Year Ended
6/30/20 | | | — | | | $ | 6.48 | | | | (4.60 | )% | | | 0.70 | % | | | 1.95 | % | | | 1.32 | % | | $ | 6,532 | | | | 49 | % | |
Year Ended
6/30/19 | | | — | | | $ | 6.87 | | | | (1.34 | )% | | | 0.70 | % | | | 2.26 | % | | | 1.40 | % | | $ | 8,482 | | | | 56 | % | |
Year Ended
6/30/18 | | | — | | | $ | 7.26 | | | | 8.01 | % | | | 0.87 | % | | | 1.62 | % | | | 1.49 | % | | $ | 9,712 | | | | 51 | % | |
Year Ended
6/30/17 | | | — | | | $ | 7.20 | | | | 19.28 | % | | | 1.14 | % | | | 1.39 | % | | | 1.58 | % | | $ | 14,086 | | | | 91 | % | |
Year Ended
6/30/16 | | | 0.05 | | | $ | 6.17 | | | | (10.19 | )%(e) | | | 1.22 | % | | | 1.53 | % | | | 1.28 | % | | $ | 12,958 | | | | 61 | % | |
See notes to financial statements.
147
Victory Portfolios | | Financial Highlights | |
For a Share Outstanding Throughout Each Period
| | | | | Investment Activities | | Distributions to
Shareholders From | |
| | | Net Asset
Value,
Beginning of
Period | | Net
Investment
Income
(Loss)(a) | | Net Realized
and Unrealized
Gains (Losses)
on Investments | | Total from
Investment
Activities | | Net
Investment
Income | | Net Realized
Gains from
Investments | |
Victory Trivalent International Small-Cap Fund | |
Class A | |
Six Months Ended
12/31/20 (unaudited) | | $ | 12.83 | | | | 0.02 | | | | 3.36 | | | | 3.38 | | | | — | | | | — | | |
Year Ended 6/30/20 | | $ | 13.02 | | | | 0.06 | | | | (0.02 | ) | | | 0.04 | | | | (0.23 | ) | | | — | | |
Year Ended 6/30/19 | | $ | 14.46 | | | | 0.13 | | | | (1.22 | ) | | | (1.09 | ) | | | (0.09 | ) | | | (0.26 | ) | |
Year Ended 6/30/18 | | $ | 12.87 | | | | 0.10 | | | | 1.72 | | | | 1.82 | | | | (0.15 | ) | | | (0.08 | ) | |
Year Ended 6/30/17 | | $ | 10.67 | | | | 0.11 | | | | 2.22 | | | | 2.33 | | | | (0.13 | ) | | | — | | |
Year Ended 6/30/16 | | $ | 11.86 | | | | 0.10 | | | | (1.05 | ) | | | (0.95 | ) | | | (0.10 | ) | | | (0.14 | ) | |
Class C | |
Six Months Ended
12/31/20 (unaudited) | | $ | 12.51 | | | | (0.04 | ) | | | 3.27 | | | | 3.23 | | | | — | | | | — | | |
Year Ended 6/30/20 | | $ | 12.71 | | | | (0.03 | ) | | | (0.03 | ) | | | (0.06 | ) | | | (0.14 | ) | | | — | | |
Year Ended 6/30/19 | | $ | 14.12 | | | | 0.02 | | | | (1.17 | ) | | | (1.15 | ) | | | — | | | | (0.26 | ) | |
Year Ended 6/30/18 | | $ | 12.58 | | | | — | (e) | | | 1.67 | | | | 1.67 | | | | (0.05 | ) | | | (0.08 | ) | |
Year Ended 6/30/17 | | $ | 10.42 | | | | 0.02 | | | | 2.18 | | | | 2.20 | | | | (0.04 | ) | | | — | | |
Year Ended 6/30/16 | | $ | 11.62 | | | | 0.02 | | | | (1.04 | ) | | | (1.02 | ) | | | (0.04 | ) | | | (0.14 | ) | |
Class I | |
Six Months Ended
12/31/20 (unaudited) | | $ | 12.94 | | | | 0.05 | | | | 3.39 | | | | 3.44 | | | | (0.07 | ) | | | — | | |
Year Ended 6/30/20 | | $ | 13.13 | | | | 0.11 | | | | (0.02 | ) | | | 0.09 | | | | (0.28 | ) | | | — | | |
Year Ended 6/30/19 | | $ | 14.58 | | | | 0.18 | | | | (1.23 | ) | | | (1.05 | ) | | | (0.14 | ) | | | (0.26 | ) | |
Year Ended 6/30/18 | | $ | 12.96 | | | | 0.18 | | | | 1.71 | | | | 1.89 | | | | (0.19 | ) | | | (0.08 | ) | |
Year Ended 6/30/17 | | $ | 10.75 | | | | 0.17 | | | | 2.21 | | | | 2.38 | | | | (0.17 | ) | | | — | | |
Year Ended 6/30/16 | | $ | 11.93 | | | | 0.16 | | | | (1.07 | ) | | | (0.91 | ) | | | (0.13 | ) | | | (0.14 | ) | |
Class R6 | |
Six Months Ended
12/31/20 (unaudited) | | $ | 13.00 | | | | 0.04 | | | | 3.41 | | | | 3.45 | | | | (0.06 | ) | | | — | | |
Year Ended 6/30/20 | | $ | 13.19 | | | | 0.12 | | | | (0.04 | ) | | | 0.08 | | | | (0.27 | ) | | | — | | |
Year Ended 6/30/19 | | $ | 14.65 | | | | 0.17 | | | | (1.24 | ) | | | (1.07 | ) | | | (0.13 | ) | | | (0.26 | ) | |
Year Ended 6/30/18 | | $ | 13.02 | | | | 0.15 | | | | 1.73 | | | | 1.88 | | | | (0.17 | ) | | | (0.08 | ) | |
Year Ended 6/30/17 | | $ | 10.80 | | | | 0.18 | | | | 2.20 | | | | 2.38 | | | | (0.16 | ) | | | — | | |
Year Ended 6/30/16 | | $ | 11.99 | | | | 0.17 | | | | (1.10 | ) | | | (0.93 | ) | | | (0.12 | ) | | | (0.14 | ) | |
(a) Per share net investment income (loss) has been calculated using the average daily shares method.
(b) Not annualized for periods less than one year.
(c) Annualized for periods less than one year.
(d) Portfolio turnover is calculated on the basis of the Fund as a whole without distinguishing between the classes of shares issued.
(e) Amount is less than $0.005 per share.
See notes to financial statements.
148
Victory Portfolios | | Financial Highlights — continued | |
For a Share Outstanding Throughout Each Period
| | | | | Ratios to Average Net Assets | | Supplemental Data | |
| | | Total
Distributions | | Net Asset
Value,
End of
Period | | Total
Return
(Excludes
Sales
Charge)(b) | | Net
Expenses(c) | | Net
Investment
Income
(Loss)(c) | | Gross
Expenses(c) | | Net Assets,
End of
Period
(000's) | | Portfolio
Turnover(b)(d) | |
Victory Trivalent International Small-Cap Fund | |
Class A | |
Six Months Ended
12/31/20 (unaudited) | | | — | | | $ | 16.21 | | | | 26.34 | % | | | 1.35 | % | | | 0.23 | % | | | 1.61 | % | | $ | 78,214 | | | | 34 | % | |
Year Ended 6/30/20 | | | (0.23 | ) | | $ | 12.83 | | | | 0.15 | % | | | 1.35 | % | | | 0.47 | % | | | 1.63 | % | | $ | 108,115 | | | | 52 | % | |
Year Ended 6/30/19 | | | (0.35 | ) | | $ | 13.02 | | | | (7.12 | )% | | | 1.35 | % | | | 1.02 | % | | | 1.59 | % | | $ | 137,665 | | | | 54 | % | |
Year Ended 6/30/18 | | | (0.23 | ) | | $ | 14.46 | | | | 14.14 | % | | | 1.35 | % | | | 0.68 | % | | | 1.56 | % | | $ | 122,933 | | | | 62 | % | |
Year Ended 6/30/17 | | | (0.13 | ) | | $ | 12.87 | | | | 22.04 | % | | | 1.35 | % | | | 0.99 | % | | | 1.52 | % | | $ | 92,295 | | | | 55 | % | |
Year Ended 6/30/16 | | | (0.24 | ) | | $ | 10.67 | | | | (8.13 | )% | | | 1.35 | % | | | 0.88 | % | | | 1.75 | % | | $ | 78,511 | | | | 85 | % | |
Class C | |
Six Months Ended
12/31/20 (unaudited) | | | — | | | $ | 15.74 | | | | 25.82 | % | | | 2.10 | % | | | (0.50 | )% | | | 2.41 | % | | $ | 4,721 | | | | 34 | % | |
Year Ended 6/30/20 | | | (0.14 | ) | | $ | 12.51 | | | | (0.65 | )% | | | 2.10 | % | | | (0.28 | )% | | | 2.42 | % | | $ | 4,327 | | | | 52 | % | |
Year Ended 6/30/19 | | | (0.26 | ) | | $ | 12.71 | | | | (7.78 | )% | | | 2.10 | % | | | 0.15 | % | | | 2.42 | % | | $ | 4,909 | | | | 54 | % | |
Year Ended 6/30/18 | | | (0.13 | ) | | $ | 14.12 | | | | 13.28 | % | | | 2.10 | % | | | (0.03 | )% | | | 2.36 | % | | $ | 6,211 | | | | 62 | % | |
Year Ended 6/30/17 | | | (0.04 | ) | | $ | 12.58 | | | | 21.14 | % | | | 2.10 | % | | | 0.17 | % | | | 2.47 | % | | $ | 5,161 | | | | 55 | % | |
Year Ended 6/30/16 | | | (0.18 | ) | | $ | 10.42 | | | | (8.87 | )% | | | 2.10 | % | | | 0.22 | % | | | 2.36 | % | | $ | 5,788 | | | | 85 | % | |
Class I | |
Six Months Ended
12/31/20 (unaudited) | | | (0.07 | ) | | $ | 16.31 | | | | 26.57 | % | | | 0.95 | % | | | 0.66 | % | | | 1.16 | % | | $ | 1,627,012 | | | | 34 | % | |
Year Ended 6/30/20 | | | (0.28 | ) | | $ | 12.94 | | | | 0.54 | % | | | 0.95 | % | | | 0.88 | % | | | 1.18 | % | | $ | 1,014,425 | | | | 52 | % | |
Year Ended 6/30/19 | | | (0.40 | ) | | $ | 13.13 | | | | (6.69 | )% | | | 0.95 | % | | | 1.41 | % | | | 1.16 | % | | $ | 955,568 | | | | 54 | % | |
Year Ended 6/30/18 | | | (0.27 | ) | | $ | 14.58 | | | | 14.60 | % | | | 0.95 | % | | | 1.22 | % | | | 1.14 | % | | $ | 866,643 | | | | 62 | % | |
Year Ended 6/30/17 | | | (0.17 | ) | | $ | 12.96 | | | | 22.45 | % | | | 0.95 | % | | | 1.45 | % | | | 1.16 | % | | $ | 539,822 | | | | 55 | % | |
Year Ended 6/30/16 | | | (0.27 | ) | | $ | 10.75 | | | | (7.74 | )% | | | 0.95 | % | | | 1.41 | % | | | 1.18 | % | | $ | 378,011 | | | | 85 | % | |
Class R6 | |
Six Months Ended
12/31/20 (unaudited) | | | (0.06 | ) | | $ | 16.39 | | | | 26.61 | % | | | 1.04 | % | | | 0.57 | % | | | 1.04 | % | | $ | 107,801 | | | | 34 | % | |
Year Ended 6/30/20 | | | (0.27 | ) | | $ | 13.00 | | | | 0.36 | % | | | 1.06 | % | | | 0.94 | % | | | 1.06 | % | | $ | 73,480 | | | | 52 | % | |
Year Ended 6/30/19 | | | (0.39 | ) | | $ | 13.19 | | | | (6.86 | )% | | | 1.08 | % | | | 1.31 | % | | | 1.08 | % | | $ | 42,975 | | | | 54 | % | |
Year Ended 6/30/18 | | | (0.25 | ) | | $ | 14.65 | | | | 14.49 | % | | | 1.08 | % | | | 1.01 | % | | | 1.08 | % | | $ | 39,497 | | | | 62 | % | |
Year Ended 6/30/17 | | | (0.16 | ) | | $ | 13.02 | | | | 22.28 | % | | | 1.10 | % | | | 1.50 | % | | | 1.16 | % | | $ | 30,033 | | | | 55 | % | |
Year Ended 6/30/16 | | | (0.26 | ) | | $ | 10.80 | | | | (7.90 | )% | | | 1.10 | % | | | 1.51 | % | | | 1.30 | % | | $ | 13,179 | | | | 85 | % | |
(continues on next page)
See notes to financial statements.
149
Victory Portfolios | | Financial Highlights | |
For a Share Outstanding Throughout Each Period
| | | | | Investment Activities | | Distributions to
Shareholders From | |
| | | Net Asset
Value,
Beginning of
Period | | Net
Investment
Income
(Loss)(a) | | Net Realized
and Unrealized
Gains (Losses)
on Investments | | Total from
Investment
Activities | | Net
Investment
Income | | Net Realized
Gains from
Investments | |
Victory Trivalent International Small-Cap Fund | |
Class Y | |
Six Months Ended
12/31/20 (unaudited) | | $ | 12.88 | | | | 0.04 | | | | 3.37 | | | | 3.41 | | | | (0.05 | ) | | | — | | |
Year Ended 6/30/20 | | $ | 13.07 | | | | 0.10 | | | | (0.03 | ) | | | 0.07 | | | | (0.26 | ) | | | — | | |
Year Ended 6/30/19 | | $ | 14.52 | | | | 0.16 | | | | (1.22 | ) | | | (1.06 | ) | | | (0.13 | ) | | | (0.26 | ) | |
Year Ended 6/30/18 | | $ | 12.91 | | | | 0.15 | | | | 1.71 | | | | 1.86 | | | | (0.17 | ) | | | (0.08 | ) | |
Year Ended 6/30/17 | | $ | 10.71 | | | | 0.15 | | | | 2.21 | | | | 2.36 | | | | (0.16 | ) | | | — | | |
Year Ended 6/30/16 | | $ | 11.89 | | | | 0.18 | | | | (1.10 | ) | | | (0.92 | ) | | | (0.12 | ) | | | (0.14 | ) | |
(a) Per share net investment income (loss) has been calculated using the average daily shares method.
(b) Not annualized for periods less than one year.
(c) Annualized for periods less than one year.
(d) Portfolio turnover is calculated on the basis of the Fund as a whole without distinguishing between the classes of shares issued.
(e) Amount is less than $0.005 per share.
See notes to financial statements.
150
Victory Portfolios | | Financial Highlights — continued | |
For a Share Outstanding Throughout Each Period
| | | | | Ratios to Average Net Assets | | Supplemental Data | |
| | | Total
Distributions | | Net Asset
Value,
End of
Period | | Total
Return
(Excludes
Sales
Charge)(b) | | Net
Expenses(c) | | Net
Investment
Income
(Loss)(c) | | Gross
Expenses(c) | | Net Assets,
End of
Period
(000's) | | Portfolio
Turnover(b)(d) | |
Victory Trivalent International Small-Cap Fund | |
Class Y | |
Six Months Ended
12/31/20 (unaudited) | | | (0.05 | ) | | $ | 16.24 | | | | 26.48 | % | | | 1.10 | % | | | 0.51 | % | | | 1.16 | % | | $ | 850,688 | | | | 34 | % | |
Year Ended 6/30/20 | | | (0.26 | ) | | $ | 12.88 | | | | 0.41 | % | | | 1.10 | % | | | 0.75 | % | | | 1.19 | % | | $ | 663,638 | | | | 52 | % | |
Year Ended 6/30/19 | | | (0.39 | ) | | $ | 13.07 | | | | (6.88 | )% | | | 1.10 | % | | | 1.21 | % | | | 1.18 | % | | $ | 666,547 | | | | 54 | % | |
Year Ended 6/30/18 | | | (0.25 | ) | | $ | 14.52 | | | | 14.45 | % | | | 1.10 | % | | | 1.05 | % | | | 1.19 | % | | $ | 756,933 | | | | 62 | % | |
Year Ended 6/30/17 | | | (0.16 | ) | | $ | 12.91 | | | | 22.27 | % | | | 1.10 | % | | | 1.26 | % | | | 1.32 | % | | $ | 450,441 | | | | 55 | % | |
Year Ended 6/30/16 | | | (0.26 | ) | | $ | 10.71 | | | | (7.87 | )% | | | 1.10 | % | | | 1.64 | % | | | 1.37 | % | | $ | 360,989 | | | | 85 | % | |
See notes to financial statements.
151
Victory Portfolios | | Financial Highlights | |
For a Share Outstanding Throughout Each Period
| | | | | Investment Activities | | Distributions to
Shareholders From | |
| | | Net Asset
Value,
Beginning of
Period | | Net
Investment
Income
(Loss)(a) | | Net Realized
and Unrealized
Gains (Losses)
on Investments | | Total from
Investment
Activities | | Net
Investment
Income | | Total
Distributions | |
Victory INCORE Total Return Bond Fund | |
Class A | |
Six Months Ended
12/31/20 (unaudited) | | $ | 9.91 | | | | 0.07 | | | | 0.19 | | | | 0.26 | | | | (0.12 | ) | | | (0.12 | ) | |
Year Ended 6/30/20 | | $ | 9.46 | | | | 0.20 | | | | 0.50 | | | | 0.70 | | | | (0.25 | ) | | | (0.25 | ) | |
Year Ended 6/30/19 | | $ | 9.21 | | | | 0.21 | | | | 0.32 | | | | 0.53 | | | | (0.28 | ) | | | (0.28 | ) | |
Year Ended 6/30/18 | | $ | 9.54 | | | | 0.20 | | | | (0.24 | ) | | | (0.04 | ) | | | (0.29 | ) | | | (0.29 | ) | |
Year Ended 6/30/17 | | $ | 9.79 | | | | 0.23 | | | | (0.14 | ) | | | 0.09 | | | | (0.34 | ) | | | (0.34 | ) | |
Year Ended 6/30/16 | | $ | 9.79 | | | | 0.29 | | | | 0.02 | | | | 0.31 | | | | (0.32 | ) | | | (0.32 | ) | |
Class C | |
Six Months Ended
12/31/20 (unaudited) | | $ | 9.99 | | | | 0.04 | | | | 0.17 | | | | 0.21 | | | | (0.08 | ) | | | (0.08 | ) | |
Year Ended 6/30/20 | | $ | 9.53 | | | | 0.12 | | | | 0.52 | | | | 0.64 | | | | (0.18 | ) | | | (0.18 | ) | |
Year Ended 6/30/19 | | $ | 9.28 | | | | 0.15 | | | | 0.31 | | | | 0.46 | | | | (0.21 | ) | | | (0.21 | ) | |
Year Ended 6/30/18 | | $ | 9.60 | | | | 0.14 | | | | (0.25 | ) | | | (0.11 | ) | | | (0.21 | ) | | | (0.21 | ) | |
Year Ended 6/30/17 | | $ | 9.86 | | | | 0.15 | | | | (0.14 | ) | | | 0.01 | | | | (0.27 | ) | | | (0.27 | ) | |
Year Ended 6/30/16 | | $ | 9.86 | | | | 0.22 | | | | 0.02 | | | | 0.24 | | | | (0.25 | ) | | | (0.25 | ) | |
Class R6 | |
Six Months Ended
12/31/20 (unaudited) | | $ | 9.94 | | | | 0.09 | | | | 0.17 | | | | 0.26 | | | | (0.13 | ) | | | (0.13 | ) | |
Year Ended 6/30/20 | | $ | 9.48 | | | | 0.22 | | | | 0.51 | | | | 0.73 | | | | (0.27 | ) | | | (0.27 | ) | |
Year Ended 6/30/19 | | $ | 9.23 | | | | 0.24 | | | | 0.31 | | | | 0.55 | | | | (0.30 | ) | | | (0.30 | ) | |
Year Ended 6/30/18 | | $ | 9.55 | | | | 0.22 | | | | (0.23 | ) | | | (0.01 | ) | | | (0.31 | ) | | | (0.31 | ) | |
Year Ended 6/30/17 | | $ | 9.81 | | | | 0.25 | | | | (0.14 | ) | | | 0.11 | | | | (0.37 | ) | | | (0.37 | ) | |
Year Ended 6/30/16 | | $ | 9.81 | | | | 0.31 | | | | 0.02 | | | | 0.33 | | | | (0.34 | ) | | | (0.34 | ) | |
Class Y | |
Six Months Ended
12/31/20 (unaudited) | | $ | 9.94 | | | | 0.09 | | | | 0.17 | | | | 0.26 | | | | (0.13 | ) | | | (0.13 | ) | |
Year Ended 6/30/20 | | $ | 9.47 | | | | 0.22 | | | | 0.52 | | | | 0.74 | | | | (0.27 | ) | | | (0.27 | ) | |
Year Ended 6/30/19 | | $ | 9.23 | | | | 0.24 | | | | 0.30 | | | | 0.54 | | | | (0.30 | ) | | | (0.30 | ) | |
Year Ended 6/30/18 | | $ | 9.55 | | | | 0.23 | | | | (0.24 | ) | | | (0.01 | ) | | | (0.31 | ) | | | (0.31 | ) | |
Year Ended 6/30/17 | | $ | 9.81 | | | | 0.25 | | | | (0.14 | ) | | | 0.11 | | | | (0.37 | ) | | | (0.37 | ) | |
Year Ended 6/30/16 | | $ | 9.81 | | | | 0.32 | | | | 0.01 | | | | 0.33 | | | | (0.34 | ) | | | (0.34 | ) | |
(a) Per share net investment income (loss) has been calculated using the average daily shares method.
(b) Not annualized for periods less than one year.
(c) Annualized for periods less than one year.
(d) Portfolio turnover is calculated on the basis of the Fund as a whole without distinguishing between the classes of shares issued.
(e) Portfolio turnover rates excluding mortgage dollar roll transactions were 103%, 57% and 64% for the years ended June 30, 2018, June 30, 2017 and June 30, 2016, respectively.
(f) The Fund received monies related to a nonrecurring refund from prior custodian. The corresponding impact to the total return was 0.05% for the year ended June 30, 2016. (See Note 8)
See notes to financial statements.
152
Victory Portfolios | | Financial Highlights — continued | |
For a Share Outstanding Throughout Each Period
| | | | | Ratios to Average Net Assets | | Supplemental Data | |
| | | Capital
Contributions
from Prior
Custodian,
Net (See
Note 8) | | Net Asset
Value,
End of
Period | | Total
Return
(Excludes
Sales
Charge)(b) | | Net
Expenses(c) | | Net
Investment
Income
(Loss)(c) | | Gross
Expenses(c) | | Net Assets,
End of
Period
(000's) | | Portfolio
Turnover(b)(d)(e) | |
Victory INCORE Total Return Bond Fund | |
Class A | |
Six Months Ended
12/31/20 (unaudited) | | | — | | | $ | 10.05 | | | | 2.62 | % | | | 0.85 | % | | | 1.46 | % | | | 1.14 | % | | $ | 10,798 | | | | 33 | % | |
Year Ended 6/30/20 | | | — | | | $ | 9.91 | | | | 7.57 | % | | | 0.85 | % | | | 2.03 | % | | | 1.11 | % | | $ | 11,472 | | | | 74 | % | |
Year Ended 6/30/19 | | | — | | | $ | 9.46 | | | | 5.77 | % | | | 0.85 | % | | | 2.32 | % | | | 1.09 | % | | $ | 12,248 | | | | 150 | % | |
Year Ended 6/30/18 | | | — | | | $ | 9.21 | | | | (0.49 | )% | | | 0.85 | % | | | 2.15 | % | | | 1.11 | % | | $ | 12,592 | | | | 110 | % | |
Year Ended 6/30/17 | | | — | | | $ | 9.54 | | | | 0.97 | % | | | 0.85 | % | | | 2.35 | % | | | 1.07 | % | | $ | 14,569 | | | | 210 | % | |
Year Ended 6/30/16 | | | 0.01 | | | $ | 9.79 | | | | 3.34 | %(f) | | | 0.85 | % | | | 3.04 | % | | | 1.08 | % | | $ | 15,908 | | | | 423 | % | |
Class C | |
Six Months Ended
12/31/20 (unaudited) | | | — | | | $ | 10.12 | | | | 2.11 | % | | | 1.60 | % | | | 0.70 | % | | | 3.39 | % | | $ | 670 | | | | 33 | % | |
Year Ended 6/30/20 | | | — | | | $ | 9.99 | | | | 6.76 | % | | | 1.60 | % | | | 1.27 | % | | | 3.54 | % | | $ | 727 | | | | 74 | % | |
Year Ended 6/30/19 | | | — | | | $ | 9.53 | | | | 5.05 | % | | | 1.60 | % | | | 1.67 | % | | | 3.12 | % | | $ | 574 | | | | 150 | % | |
Year Ended 6/30/18 | | | — | | | $ | 9.28 | | | | (1.12 | )% | | | 1.60 | % | | | 1.43 | % | | | 2.31 | % | | $ | 973 | | | | 110 | % | |
Year Ended 6/30/17 | | | — | | | $ | 9.60 | | | | 0.13 | % | | | 1.60 | % | | | 1.60 | % | | | 1.61 | % | | $ | 2,073 | | | | 210 | % | |
Year Ended 6/30/16 | | | 0.01 | | | $ | 9.86 | | | | 2.56 | %(f) | | | 1.60 | % | | | 2.29 | % | | | 2.00 | % | | $ | 3,256 | | | | 423 | % | |
Class R6 | |
Six Months Ended
12/31/20 (unaudited) | | | — | | | $ | 10.07 | | | | 2.65 | % | | | 0.58 | % | | | 1.72 | % | | | 0.59 | % | | $ | 25,939 | | | | 33 | % | |
Year Ended 6/30/20 | | | — | | | $ | 9.94 | | | | 7.94 | % | | | 0.58 | % | | | 2.30 | % | | | 0.59 | % | | $ | 25,999 | | | | 74 | % | |
Year Ended 6/30/19 | | | — | | | $ | 9.48 | | | | 6.05 | % | | | 0.57 | % | | | 2.61 | % | | | 0.57 | % | | $ | 24,929 | | | | 150 | % | |
Year Ended 6/30/18 | | | — | | | $ | 9.23 | | | | (0.12 | )% | | | 0.58 | % | | | 2.37 | % | | | 0.62 | % | | $ | 25,438 | | | | 110 | % | |
Year Ended 6/30/17 | | | — | | | $ | 9.55 | | | | 1.19 | % | | | 0.58 | % | | | 2.63 | % | | | 0.91 | % | | $ | 6,698 | | | | 210 | % | |
Year Ended 6/30/16 | | | 0.01 | | | $ | 9.81 | | | | 3.60 | %(f) | | | 0.58 | % | | | 3.25 | % | | | 1.59 | % | | $ | 2,456 | | | | 423 | % | |
Class Y | |
Six Months Ended
12/31/20 (unaudited) | | | — | | | $ | 10.07 | | | | 2.64 | % | | | 0.60 | % | | | 1.70 | % | | | 0.66 | % | | $ | 32,950 | | | | 33 | % | |
Year Ended 6/30/20 | | | — | | | $ | 9.94 | | | | 7.92 | % | | | 0.60 | % | | | 2.28 | % | | | 0.62 | % | | $ | 33,455 | | | | 74 | % | |
Year Ended 6/30/19 | | | — | | | $ | 9.47 | | | | 5.99 | % | | | 0.60 | % | | | 2.63 | % | | | 0.63 | % | | $ | 31,026 | | | | 150 | % | |
Year Ended 6/30/18 | | | — | | | $ | 9.23 | | | | (0.13 | )% | | | 0.59 | % | | | 2.43 | % | | | 0.59 | % | | $ | 52,633 | | | | 110 | % | |
Year Ended 6/30/17 | | | — | | | $ | 9.55 | | | | 1.17 | % | | | 0.60 | % | | | 2.61 | % | | | 0.62 | % | | $ | 76,263 | | | | 210 | % | |
Year Ended 6/30/16 | | | 0.01 | | | $ | 9.81 | | | | 3.59 | %(f) | | | 0.60 | % | | | 3.29 | % | | | 0.61 | % | | $ | 78,705 | | | | 423 | % | |
See notes to financial statements.
153
Victory Portfolios | | Notes to Financial Statements
December 31, 2020 | |
(Unaudited)
1. Organization:
Victory Portfolios (the "Trust") was organized on December 6, 1995 as a Delaware statutory trust as a successor to a company named "The Victory Portfolios," which was organized as a Massachusetts business trust on February 5, 1986. The Trust is registered under the Investment Company Act of 1940, as amended (the "1940 Act"), as an open-end investment company. The Trust is comprised of 42 funds and is authorized to issue an unlimited number of shares, which are units of beneficial interest with a par value of $0.001 per share. Each Fund is classified as diversified under the 1940 Act.
The accompanying financial statements are those of the following 12 Funds (collectively, the "Funds" and individually, a "Fund"):
Funds (Legal Name) | | Funds (Short Name) | | Investment Share
Classes Offered | |
Victory Integrity Discovery Fund
| | Integrity Discovery Fund
| | Classes A, C, R, Y and
Member Class* | |
Victory Integrity Mid-Cap
Value Fund | | Integrity Mid-Cap
Value Fund | | Classes A, C, R6, Y and
Member Class* | |
Victory Integrity Small-Cap
Value Fund | | Integrity Small-Cap
Value Fund | | Classes A, C, R, R6 and Y
| |
Victory Integrity Small/Mid-Cap
Value Fund | | Integrity Small/Mid-Cap
Value Fund | | Classes A, R6, Y and
Member Class* | |
Victory Munder Multi-Cap Fund | | Munder Multi-Cap Fund | | Classes A, C and Y | |
Victory S&P 500 Index Fund | | S&P 500 Index Fund | | Classes A, R and Y | |
Victory Munder Mid-Cap Core
Growth Fund | | Munder Mid-Cap Core
Growth Fund | | Classes A, C, R, R6 and Y
| |
Victory Munder Small Cap
Growth Fund | | Munder Small Cap
Growth Fund | | Classes A, I and Y
| |
Victory Trivalent Emerging
Markets Small-Cap Fund | | Trivalent Emerging
Markets Small-Cap Fund | | Classes A and Y
| |
Victory Trivalent International
Fund-Core Equity | | Trivalent International
Fund-Core Equity | | Classes A, C, I, R6 and Y
| |
Victory Trivalent International
Small-Cap Fund | | Trivalent International
Small-Cap Fund | | Classes A, C, I, R6 and Y
| |
Victory INCORE Total Return
Bond Fund | | INCORE Total Return
Bond Fund | | Classes A, C, R6 and Y
| |
* Member Class commenced operations on November 3, 2020.
Each class of shares of a Fund has substantially identical rights and privileges except with respect to sales charges, fees paid under distribution plans, expenses allocable exclusively to each class of shares, voting rights on matters solely affecting a single class of shares, and the exchange privilege of each class of shares.
Under the Trust's organizational documents, its officers and trustees are indemnified against certain liabilities arising out of the performance of their duties to the Funds. In addition, in the normal course of business, the Funds enter into contracts with their vendors and others that provide for general indemnifications. The Funds' maximum exposure under these arrangements is unknown, as this would involve future claims that may be made against the Funds. However, based on experience, the Funds expect that risk of loss to be remote.
2. Significant Accounting Policies:
The following is a summary of significant accounting policies followed by the Trust in the preparation of its financial statements. The policies are in conformity with Generally Accepted Accounting Principles in the United States of America ("GAAP"). The preparation of financial statements in accordance with GAAP requires management to make estimates and assumptions that affect the reported amounts of assets and liabilities and disclosure of contingent assets and liabilities at the date of the financial
154
Victory Portfolios | | Notes to Financial Statements — continued
December 31, 2020 | |
(Unaudited)
statements and the reported amounts of income and expenses for the period. Actual results could differ from those estimates. The Funds follow the specialized accounting and reporting requirements under GAAP that are applicable to investment companies.
Investment Valuation:
The Funds record investments at fair value. Fair value is defined as the price that would be received to sell an asset or paid to transfer a liability in an orderly transaction between market participants at the measurement date.
The valuation techniques described below maximize the use of observable inputs and minimize the use of unobservable inputs in determining fair value. The inputs used for valuing the Funds' investments are summarized in the three broad levels listed below:
• Level 1 — quoted prices in active markets for identical securities
• Level 2 — other significant observable inputs (including quoted prices for similar securities or interest rates applicable to those securities, etc.)
• Level 3 — significant unobservable inputs (including the Funds' own assumptions in determining the fair value of investments)
Changes in valuation techniques may result in transfers in or out of an assigned level within the disclosure hierarchy. The inputs or methodologies used for valuation techniques are not necessarily an indication of the risk associated with entering into those investments.
Portfolio securities listed or traded on securities exchanges, including Exchange-Traded Funds ("ETFs"), American Depositary Receipts ("ADRs") and Rights, are valued at the closing price on the exchange or system where the security is principally traded, if available, or at the Nasdaq Official Closing Price. If there have been no sales for that day on the exchange or system, then a security is valued at the last available bid quotation on the exchange or system where the security is principally traded. In each of these situations, valuations are typically categorized as Level 1 in the fair value hierarchy.
Investments in open-end investment companies are valued at net asset value ("NAV"). These valuations are typically categorized as Level 1 in the fair value hierarchy.
Futures contracts are valued at the settlement price established each day by the board of trade or an exchange on which they are traded. These valuations are typically categorized as Level 1 in the fair value hierarchy. Swap agreements are valued at the mean between the current bid and ask prices. To the extent this model is utilized, these valuations are considered as Level 2 in the fair value hierarchy.
Debt securities of United States ("U.S.") issuers (other than short-term investments maturing in 60 days or less), including corporate and municipal securities, are valued on the basis of bid valuations provided by dealers or an independent pricing service approved by the Trust's Board of Trustees (the "Board"). Short-term investments maturing in 60 days or less may be valued at amortized cost, which approximates market value. Under the amortized cost method, premium or discount, if any, is amortized or accreted, respectively, on a constant basis to the maturity of the security. In each of these situations, valuations are typically categorized as Level 2 in the fair value hierarchy.
Investments for which there are no such quotations, or for which quotations do not appear reliable, are valued at fair value in accordance with procedures established by and under the general supervision and responsibility of the Board. These valuations are typically categorized as Level 2 or Level 3 in the fair value hierarchy, based on the observability of inputs used to determine the fair value.
In accordance with procedures adopted by the Board, fair value pricing may be used if events materially affecting the value of foreign securities occur between the time the exchange on which they are traded closes and the time the Funds' NAVs are calculated. The Trivalent Emerging Markets Small-Cap Fund, Trivalent International Fund-Core Equity and Trivalent International Small-Cap Fund use a systematic valuation model, provided daily by an independent third party to fair value their international equity securities. These valuations are considered as Level 2 in the fair value hierarchy.
155
Victory Portfolios | | Notes to Financial Statements — continued
December 31, 2020 | |
(Unaudited)
A summary of the valuations as of December 31, 2020, based upon the three levels defined above, is included in the table below while the breakdown, by category, of investments is disclosed on the Schedules of Portfolio Investments (amounts in thousands):
| | | Level 1 | | Level 2 | | Level 3 | | Total | |
Integrity Discovery Fund | |
Common Stocks | | $ | 74,466 | | | $ | — | | | $ | — | | | $ | 74,466 | | |
Collateral for Securities Loaned | | | 6,578 | | | | — | | | | — | | | | 6,578 | | |
Total | | $ | 81,044 | | | $ | — | | | $ | — | | | $ | 81,044 | | |
Integrity Mid-Cap Value Fund | |
Common Stocks | | $ | 200,450 | | | $ | — | | | $ | — | | | $ | 200,450 | | |
Collateral for Securities Loaned | | | 3,558 | | | | — | | | | — | | | | 3,558 | | |
Total | | $ | 204,008 | | | $ | — | | | $ | — | | | $ | 204,008 | | |
Integrity Small-Cap Value Fund | |
Common Stocks | | $ | 1,828,748 | | | $ | — | | | $ | — | | | $ | 1,828,748 | | |
Collateral for Securities Loaned | | | 99,310 | | | | — | | | | — | | | | 99,310 | | |
Total | | $ | 1,928,058 | | | $ | — | | | $ | — | | | $ | 1,928,058 | | |
Integrity Small/Mid-Cap Value Fund | |
Common Stocks | | $ | 148,615 | | | $ | — | | | $ | — | | | $ | 148,615 | | |
Collateral for Securities Loaned | | | 5,297 | | | | — | | | | — | | | | 5,297 | | |
Total | | $ | 153,912 | | | $ | — | | | $ | — | | | $ | 153,912 | | |
Munder Multi-Cap Fund | |
Common Stocks | | $ | 392,638 | | | $ | — | | | $ | — | | | $ | 392,638 | | |
Exchange-Traded Funds | | | 4,024 | | | | | | | | | | | | 4,024 | | |
Collateral for Securities Loaned | | | 4,324 | | | | — | | | | — | | | | 4,324 | | |
Total | | $ | 400,986 | | | $ | — | | | $ | — | | | $ | 400,986 | | |
S&P 500 Index Fund | |
Common Stocks | | $ | 242,426 | | | $ | — | | | $ | — | | | $ | 242,426 | | |
Collateral for Securities Loaned | | | 727 | | | | — | | | | — | | | | 727 | | |
Total | | $ | 243,153 | | | $ | — | | | $ | — | | | $ | 243,153 | | |
Other Financial Investments^: | |
Assets: | |
Futures Contracts | | $ | 33 | | | $ | — | | | $ | — | | | $ | 33 | | |
Total | | $ | 33 | | | $ | — | | | $ | — | | | $ | 33 | | |
Munder Mid-Cap Core Growth Fund | |
Common Stocks | | $ | 578,744 | | | $ | — | | | $ | — | | | $ | 578,744 | | |
Exchange-Traded Funds | | | 5,963 | | | | — | | | | — | | | | 5,963 | | |
Collateral for Securities Loaned | | | 22,349 | | | | — | | | | — | | | | 22,349 | | |
Total | | $ | 607,056 | | | $ | — | | | $ | — | | | $ | 607,056 | | |
Munder Small Cap Growth Fund | |
Common Stocks | | $ | 14,513 | | | $ | — | | | $ | — | | | $ | 14,513 | | |
Warrants | | | 16 | | | | — | | | | — | | | | 16 | | |
Collateral for Securities Loaned | | | 1,906 | | | | — | | | | — | | | | 1,906 | | |
Total | | $ | 16,435 | | | $ | — | | | $ | — | | | $ | 16,435 | | |
156
Victory Portfolios | | Notes to Financial Statements — continued
December 31, 2020 | |
(Unaudited)
| | | Level 1 | | Level 2 | | Level 3 | | Total | |
Trivalent Emerging Markets Small-Cap Fund | |
Common Stocks | | $ | 507 | | | $ | 9,870 | | | $ | — | | | $ | 10,377 | | |
Rights | | | — | | | | — | | | | — | (a) | | | — | | |
Exchange-Traded Funds | | | 267 | | | | — | | | | — | | | | 267 | | |
Collateral for Securities Loaned | | | 423 | | | | — | | | | — | | | | 423 | | |
Total | | $ | 1,197 | | | $ | 9,870 | | | $ | — | (a) | | $ | 11,067 | | |
Trivalent International Fund-Core Equity | |
Common Stocks | | $ | 18,299 | | | $ | 179,167 | | | $ | — | | | $ | 197,466 | | |
Exchange-Traded Funds | | | 1,637 | | | | 1,637 | | | | | | | | | | |
Collateral for Securities Loaned | | | 4,584 | | | | — | | | | — | | | | 4,584 | | |
Total | | $ | 24,520 | | | $ | 179,167 | | | $ | — | | | $ | 203,687 | | |
Trivalent International Small-Cap Fund | |
Common Stocks | | $ | 227,505 | | | $ | 2,376,674 | | | $ | — | | | $ | 2,604,179 | | |
Exchange-Traded Funds | | | 32,996 | | | | — | | | | | | | | 32,996 | | |
Collateral for Securities Loaned | | | 77,787 | | | | — | | | | — | | | | 77,787 | | |
Total | | $ | 338,288 | | | $ | 2,376,674 | | | $ | — | | | $ | 2,714,962 | | |
INCORE Total Return Bond Fund | |
Asset-Backed Securities | | $ | — | | | $ | 1,077 | | | $ | — | | | $ | 1,077 | | |
Collateralized Mortgage Obligations | | | — | | | | 862 | | | | — | | | | 862 | | |
Preferred Stocks | | | 1,317 | | | | — | | | | — | | | | 1,317 | | |
Corporate Bonds | | | — | | | | 37,750 | | | | — | | | | 37,750 | | |
Residential Mortgage-Backed
Securities | | | — | | | | 148 | | | | — | | | | 148 | | |
Yankee Dollars | | | — | | | | 6,344 | | | | — | | | | 6,344 | | |
U.S. Government Mortgage-Backed
Agencies | | | — | | | | 18,606 | | | | — | | | | 18,606 | | |
U.S. Treasury Obligations | | | — | | | | 1,989 | | | | — | | | | 1,989 | | |
Collateral for Securities Loaned | | | 613 | | | | — | | | | — | | | | 613 | | |
Total | | $ | 1,930 | | | $ | 66,776 | | | $ | — | | | $ | 68,706 | | |
Other Financial Investments ^: | |
Assets: | |
Futures Contracts | | $ | 8 | | | $ | — | | | $ | — | | | $ | 8 | | |
Liabilities: | |
Futures Contracts | | | (17 | ) | | | — | | | | — | | | | (17 | ) | |
Total | | $ | (9 | ) | | $ | — | | | $ | — | | | $ | (9 | ) | |
^ Futures contracts are valued at the unrealized appreciation (depreciation) on the investment.
(a) Amount is less than $1 thousand.
For the six months ended December 31, 2020, there were no transfers in or out of the Level 3 fair value hierarchy.
157
Victory Portfolios | | Notes to Financial Statements — continued
December 31, 2020 | |
(Unaudited)
Securities Purchased on a When-Issued Basis:
The Funds may purchase securities on a when-issued basis. When-issued securities are securities purchased for delivery beyond normal settlement periods at a stated price and/or yield, thereby involving the risk that the price and/or yield obtained may be more or less than those available in the market when delivery takes place. At the time a Fund makes the commitment to purchase a security on a when-issued basis, the Fund records the transaction and reflects the value of the security in determining NAV. No interest accrues to the Fund until the transaction settles and payment takes place. Normally, the settlement date occurs within one month of the purchase. A segregated account is established and the Fund maintains cash and/or marketable securities at least equal in value to commitments for when-issued securities. If a Fund owns when-issued securities, these values are included in Payable for investments purchased on the accompanying Statements of Assets and Liabilities and the segregated assets are identified on the Schedules of Portfolio Investments.
Real Estate Investment Trusts ("REITs"):
The Funds may invest in REITs, which report information on the source of their distributions annually. REITs are pooled investment vehicles that invest primarily in income-producing real estate or real- estate related loans or interests (such as mortgages). Certain distributions received from REITs during the year are recorded as realized gains or return of capital as estimated by the Funds or when such information becomes known.
Mortgage-Related and Asset-Backed Securities:
The values of some mortgage-related or asset-backed securities may be particularly sensitive to changes in prevailing interest rates. Early repayment of principal on some mortgage-related securities may expose a Fund to a lower rate of return upon reinvestment of principal. The values of mortgage- and asset-backed securities depend in part on the credit quality and adequacy of the underlying assets or collateral and may fluctuate in response to the market's perception of these factors as well as current and future repayment rates. Some mortgage-backed securities are backed by the full faith and credit of the U.S. government (e.g., mortgage-backed securities issued by the Government National Mortgage Association, commonly known as "Ginnie Mae"), while other mortgage-backed securities (e.g., mortgage- backed securities issued by the Federal National Mortgage Association and the Federal Home Loan Mortgage Corporation, commonly known as "Fannie Mae" and "Freddie Mac," respectively), are backed only by the credit of the government entity issuing them. In addition, some mortgage-backed securities are issued by private entities and, as such, are not guaranteed by the U.S. government or any agency or instrumentality of the U.S. government.
Investment Companies:
Exchange-Traded Funds:
The Funds may invest in ETFs, the shares of which are bought and sold on a securities exchange. An ETF trades like common stock and represents a portfolio of securities often designed to track the performance and dividend yield of a particular domestic or foreign market index. A Fund may purchase shares of an ETF to temporarily gain exposure to a portion of the U.S. or a foreign market while awaiting purchase of underlying securities. The risks of owning an ETF generally reflect the risks of owning the underlying securities they are designed to track, although the lack of liquidity of an ETF could result in it being more volatile. Additionally, ETFs have fees and expenses that reduce their value.
Open-End Funds:
The Funds may invest in portfolios of open-end investment companies. These investment companies value securities in their portfolios for which market quotations are readily available at their market values (generally the last reported sale price) and all other securities and assets at their fair value by the methods established by the board of directors of the underlying funds.
158
Victory Portfolios | | Notes to Financial Statements — continued
December 31, 2020 | |
(Unaudited)
Derivative Instruments:
Foreign Exchange Currency Contracts:
The Trivalent Emerging Markets Small-Cap Fund, Trivalent International Fund-Core Equity and Trivalent International Small-Cap Fund may enter into foreign exchange currency contracts to convert U.S. dollars to and from various foreign currencies. A foreign exchange currency contract is an obligation by a Fund to purchase or sell a specific currency at a future date at a price (in U.S. dollars) set at the time of the contract. The Funds do not engage in "cross-currency" foreign exchange contracts (i.e., contracts to purchase or sell one foreign currency in exchange for another foreign currency). The Funds' foreign exchange currency contracts might be considered spot contracts (typically a contract of one week or less) or forward contracts (typically a contract term over one week). A spot contract is entered into for purposes of hedging against foreign currency fluctuations relating to a specific portfolio transaction, such as the delay between a security transaction trade date and settlement date. Forward contracts are entered into for purposes of hedging portfolio holdings or concentrations of such holdings. The Trivalent Emerging Markets Small-Cap Fund, Trivalent International Fund-Core Equity and Trivalent International Small-Cap Fund enter into foreign exchange currency contracts solely for spot or forward hedging purposes, and not for speculative purposes (i.e., the Funds do not enter into such contracts solely for the purpose of earning foreign currency gains). Each foreign exchange currency contract is adjusted daily by the prevailing spot or forward rate of the underlying currency, and any appreciation or depreciation is recorded for financial statement purposes as unrealized until the contract settlement date, at which time the Fund records realized gains or losses equal to the difference between the value of a contract at the time it was opened and the value at the time it was closed. A Fund could be exposed to risk if a counterparty is unable to meet the terms of a foreign exchange currency contract or if the value of the foreign currency changes unfavorably. In addition, the use of foreign exchange currency contracts does not eliminate fluctuations in the underlying prices of the securities. As of December 31, 2020, the Funds had no open forward foreign exchange currency contracts.
Futures Contracts:
The Funds may enter into contracts for the future delivery of securities or foreign currencies and futures contracts based on a specific security, class of securities, foreign currency or an index, and purchase or sell options on any such futures contracts. A futures contract on a securities index is an agreement obligating either party to pay, and entitling the other party to receive, while the contract is outstanding, cash payments based on the level of a specified securities index. No physical delivery of the underlying asset is made. A Fund may enter into futures contracts in an effort to hedge against market risks. The acquisition of put and call options on futures contracts will give the Fund the right (but not the obligation), for a specified price, to sell or to purchase the underlying futures contract, upon exercise of the option, at any time during the option period. Futures transactions involve brokerage costs and require the Fund to segregate assets to cover contracts that would require it to purchase securities or currencies. A good faith margin deposit, known as initial margin, of cash or government securities with a broker or custodian is required to initiate and maintain open positions in futures contracts. Subsequent payments, known as variation margin, are made or received by the Fund based on the change in the market value of the position and are recorded as unrealized appreciation or depreciation until the contract is closed out, at which time the gain or loss is realized. A Fund may lose the expected benefit of futures transactions if interest rates, exchange rates or securities prices change in an unanticipated manner. Such unanticipated changes may also result in lower overall performance than if the Fund had not entered into any futures transactions. In addition, the value of a Fund's futures positions may not prove to be perfectly or even highly correlated with the value of its portfolio securities or foreign currencies, limiting a Fund's ability to hedge effectively against interest rate, exchange rate and/or market risk and giving rise to additional risks. There is no assurance of liquidity in the secondary market for purposes of closing out futures positions. The collateral held by the Funds is reflected on the Statements of Assets and Liabilities under Deposit with brokers for futures contracts.
As of December 31, 2020, the S&P 500 Index Fund and INCORE Total Return Bond Fund entered into futures contracts primarily for the strategy of hedging or other purposes, including but not limited to, providing liquidity and equitizing cash.
159
Victory Portfolios | | Notes to Financial Statements — continued
December 31, 2020 | |
(Unaudited)
Credit Derivatives:
The INCORE Total Return Bond Fund may enter into credit derivatives, including centrally cleared credit default swaps on individual obligations or credit indices. The Fund may use these investments (i) as alternatives to direct long or short investment in a particular security or securities, (ii) to adjust the Fund's asset allocation or risk exposure, or (iii) for hedging purposes. The use by the Fund of centrally cleared credit default swaps may have the effect of creating a short position in a security. Credit derivatives can create investment leverage and may create additional investment risks that may subject the Fund to greater volatility than investments in more traditional securities, as described in the Fund's Statement of Additional Information.
Centrally cleared credit default swap ("CDS") agreements on credit indices involve one party making a stream of payments (referred to as the buyer of protection) to another party (the seller of protection) in exchange for the right to receive a specified return in the event of a write-down, principal shortfall, interest shortfall or default of all or part of the referenced entities comprising the credit index. A credit index is a basket of credit instruments or exposures designed to be representative of a specific sector of the credit market as a whole. These indices are made up of reference credits that are judged by a poll of dealers to be the most liquid entities in the CDS.
The counterparty risk for cleared swap agreements is generally lower than uncleared over-the-counter swap agreements because generally a clearing organization becomes substituted for each counterparty to a centrally cleared swap agreement and, in effect, guarantees each party's performance under the contract as each party to a trade looks only to the clearing organization for performance of financial obligations. However, there can be no assurance that the clearing organization, or its members, will satisfy its obligations to the Fund.
The Fund may enter into CDS agreements either as a buyer or seller. The Fund may buy protection under a CDS to attempt to mitigate the risk of default or credit quality deterioration in one or more individual holdings or in a segment of the fixed income securities market. The Fund may sell protection under a CDS in an attempt to gain exposure to an underlying issuer's credit quality characteristics without investing directly in that issuer.
For swaps entered with an individual counterparty, the Fund bears the risk of loss of the uncollateralized amount expected to be received under a CDS agreement in the event of the default or bankruptcy of the counterparty. CDS agreements are generally valued at a price at which the counterparty to such agreement would terminate the agreement. The Fund may also enter into cleared swaps.
Upon entering into a cleared CDS, the Fund may be required to deposit with the broker an amount of cash or cash equivalents in the range of approximately 3% to 6% of the notional amount for CDS on high yield debt issuers (this amount is subject to change by the clearing organization that clears the trade). This amount, known as "initial margin," is in the nature of a performance bond or good faith deposit on the CDS and is returned to a Fund upon termination of the CDS, assuming all contractual obligations have been satisfied. Subsequent payments, known as "variation margin," to and from the broker will be made daily as the price of the CDS fluctuates, making the long and short positions in the CDS contract more or less valuable, a process known as "marking-to-market". The premium (discount) payments are built into the daily price of the CDS and thus are amortized through the variation margin. The variation margin payment also includes the daily portion of the periodic payment stream.
The maximum potential amount of future payments (undiscounted) that the Fund as a seller of protection could be required to make under a CDS agreement equals the notional amount of the agreement. Notional amounts of each individual CDS agreement outstanding as of period end for which the Fund is the seller of protection are disclosed on the Schedule of Portfolio Investments. These potential amounts would be partially offset by any recovery values of the respective referenced obligations, upfront payments received upon entering into the agreement, periodic interest payments, or net amounts received from the settlement of buy protection CDS agreements entered into by the Fund for the same referenced entity or entities. The collateral held by the Funds is presented on the Statements of Assets and Liabilities under Deposit with brokers for swap agreements.
The INCORE Total Return Bond Fund entered into centrally cleared CDS agreements primarily for the strategy of asset allocation and risk exposure management during the period. As of December 31, 2020, the INCORE Total Return Bond Fund held no swap agreements.
160
Victory Portfolios | | Notes to Financial Statements — continued
December 31, 2020 | |
(Unaudited)
Offsetting of Financial Assets and Derivatives Assets:
The Funds are subject to various Master Netting Arrangements, which govern the terms of certain transactions with select counterparties. The Master Netting Arrangements allow the Funds to close out and net total exposure to a counterparty in the event of a default with respect to all the transactions governed under a single agreement with a counterparty. The Master Netting Arrangements also specify collateral posting arrangements at pre-arranged exposure levels. Under the Master Netting Arrangements, collateral is routinely transferred if the total net exposure to certain transactions (net of existing collateral already in place) governed under the relevant Master Netting Arrangement with a counterparty in a given account exceeds a specified threshold depending on the counterparty and the type of Master Netting Arrangement.
The table below, as of December 31, 2020 (amounts in thousands), discloses both gross information and net information about instruments and transactions eligible for offset on the Statements of Assets and Liabilities and instruments and transactions that are subject to an agreement similar to a master netting agreement as well as amounts related to collateral held at clearing brokers and counterparties.
| | | | Gross Amounts not offset in the
Statements of Assets and Liabilities | |
| | | Gross Amounts
of Recognized
Assets | | Gross Amounts
of Available for
Offset | | Net Amounts
Presented in the
Statements of
Assets and
Liabilities | | Financial
Instruments
for offset | | Cash
Collateral
Received | | Net
Amount | |
S&P 500 Index Fund | |
| Futures — Goldman Sachs & Co. | | $ | 10 | | | $ | — | | | $ | 10 | | | $ | — | | | $ | — | | | $ | 10 | | |
INCORE Total Return Bond Fund | |
| Futures — Goldman Sachs & Co. | | | 7 | | | | — | | | | 7 | | | | — | (a) | | | — | | | | 7 | | |
| | | | Gross Amounts not offset in the
Statements of Assets and Liabilities | |
| | | Gross Amounts
of Recognized
Liabilities | | Gross Amounts
of Available for
Offset | | Net Amounts
Presented in the
Statements of
Assets and
Liabilities | | Financial
Instruments
for offset | | Cash
Collateral
Pledged* | | Net
Amount | |
INCORE Total Return Bond Fund | |
| Futures — Goldman Sachs & Co. | | $ | — | (a) | | $ | — | (a) | | $ | — | (a) | | $ | — | | | $ | — | | | $ | — | | |
* Cash collateral pledged may be in excess of the amounts shown in the table. The total cash collateral pledged by each Fund is disclosed on the Statements of Assets and Liabilities.
(a) Rounds to less than $1 thousand.
Summary of Derivative Instruments:
The following table summarizes the fair values of derivative instruments on the Statements of Assets and Liabilities, categorized by risk exposure, as of December 31, 2020, (amounts in thousands):
| | | Assets | | Liabilities | |
| | | Variation
Margin
Receivable on
Open Futures
Contracts* | | Variation
Margin
Payable on
Open Futures
Contracts* | |
Equity Risk Exposure: | |
S&P Index 500 Fund | | $ | 33 | | | $ | — | | |
Interest Rate Risk Exposure: | |
INCORE Total Return Bond Fund | | | 8 | | | | 17 | | |
* Includes cumulative unrealized appreciation/depreciation of futures contracts as reported on the Schedules of Portfolio Investments. Only current day's variation margin for both futures contracts and credit default swap agreements are reported within the Statements of Assets and Liabilities.
161
Victory Portfolios | | Notes to Financial Statements — continued
December 31, 2020 | |
(Unaudited)
The following table presents the effect of derivative instruments on the Statements of Operations, categorized by risk exposure, for the six months ended December 31, 2020, (amounts in thousands):
| | | Net Realized Gains (Losses)
on Derivatives
Recognized as a
Result from Operations | | Net Change in Unrealized
Appreciation/Depreciation
on Derivatives Recognized
as a Result of Operations | |
| | | Net Realized
Gains (Losses)
from Futures
Contracts | | Net Realized
Gains (Losses)
from Swap
Agreements | | Net Change in
Unrealized
Appreciation/
Depreciation
on Futures
Contracts | | Net Change in
Unrealized
Appreciation/
Depreciation
on Swap
Agreements | |
Equity Risk Exposure: | |
S&P 500 Index Fund | | $ | 212 | | | $ | — | | | $ | 35 | | | $ | — | | |
Credit Risk Exposure: | |
INCORE Total Return Bond Fund | | | — | | | | 18 | | | | — | | | | — | | |
Interest Rate Risk Exposure: | |
INCORE Total Return Bond Fund | | | 112 | | | | — | | | | (2 | ) | | | — | | |
All open derivative positions at period end are reflected on each respective Fund's Schedule of Portfolio Investments. The underlying face value of open derivative positions relative to the S&P 500 Index Fund's net assets at period end is generally representative of the notional amount of open positions to net assets throughout the period. The volume associated with derivative positions in the Total Return Bond Fund was 92% and 8% for futures contracts and swap agreements, respectively, based on average monthly notional amounts in comparison to net assets during the period.
Investment Transactions and Related Income:
Changes in holdings of investments are accounted for no later than one business day following the trade date. For financial reporting purposes, however, investment transactions are accounted for on trade date on the last business day of the reporting period. Interest income is determined on the basis of coupon interest accrued using the effective interest method which adjusts, where applicable, the amortization of premiums or accretion of discounts. Dividend income is recorded on the ex-dividend date. Gains or losses realized on sales of securities are determined by comparing the identified cost of the security lot sold with the net sales proceeds.
Withholding taxes on interest, dividends and gains as a result of certain investments in ADRs by the Funds have been provided for in accordance with each investment's applicable country's tax rules and rates.
Securities Lending:
The Trust has entered into a Master Securities Lending Agreement ("MSLA") with Citibank, N.A. ("Citibank" or the "Agent"). Under the terms of the MSLA, the Funds may lend securities to certain broker-dealers and banks in exchange for collateral in the amount of at least 102% of the value of U.S. securities loaned or at least 105% of the value of non-U.S. securities loaned, marked-to-market daily. Any collateral shortfalls associated with increases in the valuation of the securities loaned are adjusted the next business day. The collateral can be received in the form of cash collateral and/or non-cash collateral. Non-cash collateral can include U.S. Government Securities, letters of credit and certificates of deposit. The cash collateral is invested in short-term instruments or cash equivalents, primarily open-end investment companies, as noted on the Funds' Schedules of Portfolio Investments. The Trust does not have effective control of the non-cash collateral and therefore it is not disclosed on the Funds' Schedules of Portfolio Investments. During the time portfolio securities are on loan, the borrower will pay the Funds any dividends or interest paid on such securities plus any fee negotiated between the parties to the lending agreement. The Funds also earn a return from the collateral. The Funds pay the
162
Victory Portfolios | | Notes to Financial Statements — continued
December 31, 2020 | |
(Unaudited)
Agent various fees in connection with the investment of cash collateral and fees based on the investment income received from securities lending activities. Securities lending income (net of these fees) is disclosed on the Statements of Operations. Although risk is mitigated by the collateral, the Funds could experience a delay in recovering their securities and possible loss of income or value if the borrower fails to return them.
Securities lending transactions are entered into by a Fund under the MSLA, which permits the Fund, under certain circumstances such as an event of default, to offset amounts payable by the Fund to the same counterparty against amounts receivable from the counterparty to create a net payment due to or from the Fund.
The following table (amounts in thousands) is a summary of the Funds' securities lending transactions which are subject to offset under the MSLA as of December 31, 2020. These transactions are accounted for as secured borrowings with an overnight and continuous contractual maturity for cash collateral, and greater than overnight and continuous contractual maturity for non-cash collateral.
| | | Gross
Amount of
Recognized
Assets
(Value of | |
Value of
Cash | |
Value of Non-cash Collateral
Received by Maturity | |
| | | Securities
on Loan) | | Collateral
Received* | | <90 Days | | Between
30 & 90 Days | | >90 Days | | Net Amount | |
Integrity Discovery Fund | | $ | 6,447 | | | $ | 6,447 | | | $ | — | | | $ | — | | | $ | — | | | $ | — | | |
Integrity Mid-Cap Value Fund | | | 3,449 | | | | 3,449 | | | | — | | | | — | | | | — | | | | — | | |
Integrity Small-Cap Value Fund | | | 96,126 | | | | 96,126 | | | | — | | | | — | | | | — | | | | — | | |
Integrity Small/Mid-Cap
Value Fund | | | 5,084 | | | | 5,084 | | | | — | | | | — | | | | — | | | | — | | |
Munder Multi-Cap Fund | | | 4,157 | | | | 4,157 | | | | — | | | | — | | | | — | | | | — | | |
S&P 500 Index Fund | | | 713 | | | | 713 | | | | — | | | | — | | | | — | | | | — | | |
Munder Mid-Cap Core
Growth Fund | | | 21,580 | | | | 21,580 | | | | — | | | | — | | | | — | | | | — | | |
Munder Small Cap
Growth Fund | | | 1,851 | | | | 1,851 | | | | — | | | | — | | | | — | | | | — | | |
Trivalent Emerging Markets
Small-Cap Fund | | | 404 | | | | 404 | | | | — | | | | — | | | | — | | | | — | | |
Trivalent International
Fund-Core Equity | | | 4,195 | | | | 4,195 | | | | — | | | | — | | | | — | | | | — | | |
Trivalent International
Small-Cap Fund | | | 73,940 | | | | 73,940 | | | | — | | | | — | | | | — | | | | — | | |
INCORE Total Return
Bond Fund | | | 596 | | | | 596 | | | | — | | | | — | | | | — | | | | — | | |
* Collateral received in excess of the market value of securities on loan is not presented in this table. The total cash collateral received by each Fund is disclosed on the Statements of Assets and Liabilities.
163
Victory Portfolios | | Notes to Financial Statements — continued
December 31, 2020 | |
(Unaudited)
Foreign Currency Translations:
The accounting records of the Funds are maintained in U.S. dollars. Investment securities and other assets and liabilities of a Fund denominated in a foreign currency are translated into U.S. dollars at current exchange rates. Purchases and sales of securities, income receipts and expense payments are translated into U.S. dollars at the exchange rates on the date of the transactions. The Funds do not isolate the portion of the results of operations resulting from changes in foreign exchange rates on investments from fluctuations arising from changes in market prices of securities held. Such fluctuations are disclosed as net change in unrealized appreciation/depreciation on investments and foreign currency translations on the Statements of Operations. Any realized gains or losses from these fluctuations including foreign currency arising from in-kind redemptions, are disclosed as net realized gains (losses) from investment transactions and foreign currency translations on the Statements of Operations.
Foreign Taxes:
The Funds may be subject to foreign taxes related to foreign income received (a portion of which may be reclaimable), capital gains on the sale of securities, and certain foreign currency transactions. All foreign taxes are recorded in accordance with the applicable regulations and rates that exist in the foreign jurisdictions in which the Funds invest.
Mortgage Dollar Rolls:
The INCORE Total Return Bond Fund may enter into mortgage dollar roll transactions in which the Fund sells a mortgage-backed security to a counterparty to buy back similar, but not identical, securities on a specific future date at a predetermined price. Mortgage dollar rolls may be renewed by a new sale and repurchased with a cash settlement at each renewal without physical delivery of the securities. Certain risks may arise upon entering into mortgage dollar rolls from the potential inability of counterparties to meet the terms of their commitments. Additionally, the value of such securities may change adversely before the Fund is able to repurchase them. Mortgage dollar rolls are treated as financing transactions unless the sale and repurchase are determined to involve securities that are not substantially the same. Therefore, any gain or loss is considered unrealized until the roll reaches ultimate disposition or the sale and repurchase are determined to involve securities that are not substantially the same. Income is generated as consideration for entering into these transactions and is included in mortgage dollar roll income on the Fund's Statement of Operations. For the six months ended December 31, 2020, there were no mortgage dollar roll transactions.
Federal Income Taxes:
It is the policy of each Fund to continue to qualify as a regulated investment company by complying with the provisions available to certain investment companies, as defined in applicable sections of the Internal Revenue Code, and to make distributions of net investment income and net realized gains sufficient to relieve it from all, or substantially all, federal income taxes. Accordingly, no provision for federal income taxes is required in the financial statements. The Funds have a tax year end of June 30.
Management of the Funds has reviewed tax positions taken in tax years that remain subject to examination by all major tax jurisdictions, including federal (i.e., the last four tax years, which includes the current fiscal tax year end). Management believes that there is no tax liability resulting from unrecognized tax benefits related to uncertain tax positions taken.
Allocations:
Expenses directly attributable to a Fund are charged to the Fund, while expenses which are attributable to more than one fund in the Trust, or jointly with an affiliated trust, are allocated among the respective funds in the Trust and/or affiliated trust based upon net assets or another appropriate basis.
Income, expenses (other than class-specific expenses such as transfer agent fees, state registration fees, printing fees and 12b-1 fees), and realized and unrealized gains or losses on investments are allocated to each class of shares based on its relative net assets on the date income is earned or expenses and realized and unrealized gains and losses are incurred.
164
Victory Portfolios | | Notes to Financial Statements — continued
December 31, 2020 | |
(Unaudited)
3. Purchases and Sales of Securities:
Purchases and sales of securities (excluding securities maturing less than one year from acquisition) for the six months ended December 31, 2020, were as follows (amounts in thousands):
| | | Purchases
(excluding U.S.
Government
Securities) | | Sales
(excluding U.S.
Government
Securities) | | Purchases
of U.S.
Government
Securities | | Sales
of U.S.
Government
Securities | |
Integrity Discovery Fund | | $ | 11,688 | | | $ | 18,610 | | | $ | — | | | $ | — | | |
Integrity Mid-Cap Value Fund | | | 42,590 | | | | 64,383 | | | | — | | | | — | | |
Integrity Small-Cap Value Fund | | | 390,501 | | | | 622,320 | | | | — | | | | — | | |
Integrity Small/Mid-Cap Value Fund | | | 31,316 | | | | 38,067 | | | | — | | | | — | | |
Munder Multi-Cap Fund | | | 110,105 | | | | 129,066 | | | | — | | | | — | | |
S&P 500 Index Fund | | | 5,182 | | | | 18,168 | | | | | | | | — | | |
Munder Mid-Cap Core Growth Fund | | | 245,633 | | | | 374,298 | | | | — | | | | — | | |
Munder Small Cap Growth Fund | | | | | | | | | | | — | | | | — | | |
Trivalent Emerging Markets Small-Cap
Fund | | | 3,133 | | | | 2,983 | | | | — | | | | — | | |
Trivalent International Fund-Core
Equity | | | 74,550 | | | | 37,171 | | | | — | | | | — | | |
Trivalent International Small-Cap
Fund | | | 989,563 | | | | 768,772 | | | | — | | | | — | | |
INCORE Total Return Bond Fund | | | 12,147 | | | | 9,950 | | | | 9,706 | | | | 12,186 | | |
4. Fees and Transactions with Affiliates and Related Parties:
Investment advisory services are provided to the Funds by Victory Capital Management Inc. ("VCM" or the "Adviser"), a New York corporation registered as an investment adviser with the Securities and Exchange Commission ("SEC"). The Adviser is a wholly owned indirect subsidiary of Victory Capital Holdings, Inc., a publicly traded Delaware corporation and a wholly owned direct subsidiary of Victory Capital Operating, LLC. Amounts incurred and paid to VCM for the six months ended December 31, 2020, are reflected on the Statements of Operations as Investment advisory fees.
Under the terms of the Investment Advisory Agreement, the Adviser is entitled to receive fees based on a percentage of the average daily net assets of each Fund. The rates at which the Adviser is paid by each Fund are included in the table below. The Adviser may use its resources to assist with the Funds' distribution and marketing expenses.
| | | Flat Rate | |
Integrity Discovery Fund | | | 1.00 | % | |
Munder Small Cap Growth Fund | | | 0.85 | % | |
Trivalent Emerging Markets Small-Cap Fund | | | 1.10 | % | |
INCORE Total Return Bond Fund | | | 0.40 | % | |
| | | Tier Rate | |
S&P 500 Index Fund | |
Up to $250 million | | | 0.20 | % | |
$250 Million — $500 million | | | 0.12 | % | |
Over $500 million | | | 0.07 | % | |
Integrity Small-Cap Value Fund | |
Up to $300 million | | | 0.90 | % | |
Over $300 million | | | 0.85 | % | |
Integrity Small/Mid-Cap Value | |
Up to $300 million | | | 0.80 | % | |
Over $300 million | | | 0.75 | % | |
165
Victory Portfolios | | Notes to Financial Statements — continued
December 31, 2020 | |
(Unaudited)
| | | Tier Rate | |
Integrity Mid-Cap Value | |
Up to $500 million | | | 0.75 | % | |
Over $500 million | | | 0.70 | % | |
Munder Multi-Cap Fund | |
Up to $1 billion | | | 0.75 | % | |
$1 billion — $2 billion | | | 0.72 | % | |
Over $2 billion | | | 0.70 | % | |
Trivalent International Small-Cap Fund | |
Up to $1 billion | | | 0.95 | % | |
Over $1 billion | | | 0.90 | % | |
Trivalent International Fund-Core Equity | |
Up to $1 billion | | | 0.80 | % | |
Over $1 billion | | | 0.75 | % | |
Munder Mid-Cap Core Growth Fund | |
Up to $6 billion | | | 0.75 | % | |
$6 billion — $8 billion | | | 0.70 | % | |
Over $8 billion | | | 0.65 | % | |
VCM also serves as the Funds' administrator and fund accountant. Under the Administration and Fund Accounting Agreement, VCM is paid for its services an annual fee at a rate of 0.08% of the first $15 billion in average daily net assets of the Trust, Victory Variable Insurance Funds and Victory Portfolios II (collectively, the "Victory Funds Complex"), 0.05% of the average daily net assets above $15 billion to $30 billion of the Victory Funds Complex and 0.04% of the average daily net assets over $30 billion of the Victory Funds Complex. Amounts incurred for the six months ended December 31, 2020, are reflected on the Statements of Operations as Administration fees.
Citi Fund Services Ohio, Inc. ("Citi"), an affiliate of Citibank, acts as Sub-Administrator and Sub-Fund Accountant to the Funds pursuant to the Sub-Administration and Sub-Fund Accounting Services Agreement between VCM and Citi. VCM pays Citi a fee for providing these services. The Trust reimburses VCM and Citi for out-of-pocket expenses incurred in providing these services and certain other expenses specifically allocated to the Funds. Amounts incurred for the six months ended December 31, 2020, are reflected on the Statements of Operations as Sub-Administration fees.
Citibank serves as the Funds' custodian. The Funds pay Citibank a fee for providing these services. Amounts incurred for the year ended December 31, 2020, are reflected on the Statements of Operations as Custodian fees.
FIS Investor Services, LLC ("FIS") serves as the Funds' transfer agent. Under the Transfer Agent Agreement, the Trust pays FIS a fee for its services and reimburses FIS for all of their reasonable out-of-pocket expenses incurred in providing these services. Amounts incurred for the six months ended December 31, 2020, are reflected on the Statements of Operations as Transfer agent fees.
Victory Capital Transfer Agency, Inc., an affiliate of the Adviser, serves as sub-transfer agent for the Member Class shares of the Funds. Victory Capital Transfer Agency, Inc. receives no fee or other compensation for these services.
The Chief Compliance Officer ("CCO") is an employee of the Adviser, which pays the compensation of the CCO and his support staff. The Trust has entered into an Agreement to provide compliance services with the Adviser, pursuant to which the Adviser furnishes its compliance personnel, including the services of the CCO, and other resources reasonably necessary to provide the Trust with compliance oversight services related to the design, administration and oversight of a compliance program for the Trust in accordance with Rule 38a-1 under the 1940 Act. The Funds in the Victory Funds Complex, in aggregate, compensate the Adviser for these services. Amounts incurred for the six months ended December 31, 2020, are reflected on the Statements of Operations as Compliance fees.
Sidley Austin LLP provides legal services to the Trust.
166
Victory Portfolios | | Notes to Financial Statements — continued
December 31, 2020 | |
(Unaudited)
Victory Capital Services, Inc. (the "Distributor"), an affiliate of the Adviser, serves as distributor for the continuous offering of the shares of the Funds pursuant to a Distribution Agreement between the Distributor and the Trust. Effective June 30, 2020, the Distributor's name was changed from Victory Capital Advisers, Inc. Amounts incurred for the six months ended December 31, 2020, are reflected on the Statements of Operations as 12b-1 fees.
Pursuant to the Distribution and Service Plans adopted in accordance with Rule 12b-1 under the 1940 Act, the Distributor may receive a monthly distribution and service fee, at an annual rate of up to 0.25% of the average daily net assets of Class A Shares, except for S&P 500 Index Fund, at an annual rate of up to 0.50% of the average daily net assets of Class R Shares and 1.00% of the average daily net assets of Class C Shares of the Funds. The Distributor may receive a monthly distribution and service fee at an annual rate of up to 0.15% of the average daily net assets of Class A Shares of S&P 500 Index Fund. The distribution and service fees paid to the Distributor may be used by the Distributor to pay for activities primarily intended to result in the sale of Class A, Class R or Class C Shares of the Funds.
In addition, the Distributor is entitled to receive commissions on sales of the Class A Shares and of the Funds. For the six months ended December 31, 2020, the Distributor received approximately $19 thousand from commissions earned on sales of Class A Shares of the Funds.
The Adviser has entered into expense limitation agreements with certain Funds. Under the terms of the agreements, the Adviser has agreed to waive fees or reimburse certain expenses to the extent that ordinary operating expenses incurred by certain classes of a Fund in any fiscal year exceed the expense limit for such classes of the Fund. Such excess amounts will be the liability of the Adviser. Interest, taxes, brokerage commissions, other expenditures which are capitalized in accordance with GAAP, and other extraordinary expenses not incurred in the ordinary course of a Fund's business are excluded from the expense limits. As of December 31, 2020, the expense limits (excluding voluntary waivers) are as follows:
| | | In effect July 1, 2020 until October 31, 2021 | |
| | | Class A
Shares | | Class C
Shares | | Class I
Shares | | Class R
Shares | | Class R6
Shares | | Class Y
Shares | | Member
Class | |
| Integrity Discovery Fund | | | 1.66 | %(a) | | | 2.45 | % | | | N/A | | | | 2.08 | % | | | N/A | | | | 1.44 | %(a) | | | 1.50 | %(b) | |
Integrity Mid-Cap Value Fund | | | 1.00 | % | | | 1.75 | % | | | N/A | | | | N/A | | | | 0.60 | % | | | 0.75 | % | | | 0.85 | %(b) | |
Integrity Small-Cap Value Fund | | | 1.50 | % | | | 2.35 | %(a) | | | N/A | | | | 1.75 | % | | | N/A | | | | N/A | | | | N/A | | |
Integrity Small/Mid-Cap Value Fund | | | 1.13 | % | | | N/A | | | | N/A | | | | N/A | | | | 0.83 | % | | | 0.88 | % | | | 0.95 | %(b) | |
Munder Multi-Cap Fund | | | N/A | | | | 2.16 | % | | | N/A | | | | N/A | | | | N/A | | | | N/A | | | | N/A | | |
S&P 500 Index Fund | | | N/A | | | | N/A | | | | N/A | | | | N/A | | | | N/A | | | | N/A | | | | N/A | | |
Munder Mid-Cap Core Growth Fund | | | 1.32 | % | | | 2.12 | %(a) | | | N/A | | | | 1.57 | % | | | N/A | | | | N/A | | | | N/A | | |
Munder Small Cap Growth Fund | | | 1.40 | % | | | N/A | | | | 1.15 | % | | | N/A | | | | N/A | | | | 1.25 | % | | | N/A | | |
Trivalent Emerging Markets
Small-Cap Fund | | | 1.73 | % | | | N/A | | | | N/A | | | | N/A | | | | N/A | | | | 1.48 | % | | | N/A | | |
Trivalent International Fund-Core Equity | | | 0.95 | % | | | 1.70 | % | | | 0.60 | % | | | N/A | | | | 0.55 | % | | | 0.70 | % | | | N/A | | |
Trivalent International Small-Cap Fund | | | 1.35 | % | | | 2.10 | % | | | 0.95 | % | | | N/A | | | | 1.10 | % | | | 1.10 | % | | | N/A | | |
INCORE Total Return Bond Fund | | | 0.85 | % | | | 1.60 | % | | | N/A | | | | N/A | | | | 0.58 | % | | | 0.60 | % | | | N/A | | |
(a) In Effect November 1, 2020, until at least October 31, 2021.
(b) In Effect November 3, 2020, until at least October 31, 2021.
The Funds have agreed to repay fees and expenses that were waived or reimbursed by the Adviser for a period up to three fiscal years after such waiver or reimbursement was made to the extent such payments or repayments would not cause the expenses of a class to exceed the original expense limitation in place at the time of the waiver or reimbursement or any expense limitation agreement in place at the time of repayment. Amounts repaid to the Adviser during the year, if any, are reflected on the Statements of Operations as Recoupment of prior expenses waived/reimbursed by Adviser.
167
Victory Portfolios | | Notes to Financial Statements — continued
December 31, 2020 | |
(Unaudited)
As of December 31, 2020, the following amounts are available to be repaid to the Adviser (the amounts in thousands). The Funds have not recorded any amounts available to be repaid as a liability due to an assessment that such repayment is not probable at December 31, 2020.
| | | Expires
6/30/21 | | Expires
6/30/22 | | Expires
6/30/23 | | Expires
6/30/24 | | Total | |
Integrity Discovery Fund | | $ | 6 | | | $ | 10 | | | $ | 9 | | | $ | 11 | | | $ | 36 | | |
Integrity Mid-Cap Value Fund | | | 195 | | | | 292 | | | | 615 | | | | 292 | | | | 1,394 | | |
Integrity Small-Cap Value Fund | | | 108 | | | | 170 | | | | 8 | | | | 5 | | | | 291 | | |
Integrity Small/Mid-Cap Value Fund | | | 212 | | | | 189 | | | | 185 | | | | 96 | | | | 682 | | |
Munder Multi-Cap Fund | | | — | | | | — | | | | 2 | | | | 5 | | | | 7 | | |
Munder Mid-Cap Core Growth Fund | | | 23 | | | | 25 | | | | 16 | | | | 8 | | | | 72 | | |
Munder Small Cap Growth Fund | | | 13 | | | | 5 | | | | 19 | | | | 8 | | | | 45 | | |
Trivalent Emerging Markets Small-Cap
Fund | | | 113 | | | | 67 | | | | 99 | | | | 41 | | | | 320 | | |
Trivalent International Fund-Core
Equity | | | 206 | | | | 222 | | | | 522 | | | | 381 | | | | 1,331 | | |
Trivalent International Small-Cap
Fund | | | 2,107 | | | | 2,605 | | | | 3,170 | | | | 1,785 | | | | 9,667 | | |
INCORE Total Return Bond Fund | | | 52 | | | | 54 | | | | 52 | | | | 33 | | | | 191 | | |
The Adviser may voluntarily waive or reimburse additional fees to assist the Funds in maintaining competitive expense ratios. Voluntary waivers and reimbursements applicable to the Funds are not available to be recouped at a future time. There were no voluntary waivers or reimbursements for the six months ended December 31, 2020.
Certain officers and/or interested trustees of the Funds are also officers and/or employees of the Adviser, Administrator, Fund Accountant, Sub-Administrator, Sub-Fund Accountant, Custodian, Distributor and Legal Counsel.
5. Risks:
Each Fund may be subject to other risks in addition to these identified risks.
Equity Risk — An investment in the Funds' shares represents an indirect investment in the securities owned by the Funds, some of which will be traded on a national securities exchange or in the over-the-counter markets. The value of the securities in which the Funds invest, like other market investments, may move up or down, sometimes rapidly and unpredictably. The value of the securities in which the Funds invest may affect the value of the Funds' shares. An investment in the Funds' shares at any point in time may be worth less than the original investment, even after taking into account the reinvestment of the Funds' distributions.
Foreign Investments Risk — The Trivalent Emerging Markets Small-Cap Fund, Trivalent International Fund-Core Equity and Trivalent International Small-Cap Fund invest in securities of foreign issuers in various countries. Investing on an international basis involves certain risks not involved in domestic investments including the risk of nationalization or expropriation of assets, imposition of currency exchange controls or restrictions on the repatriation of foreign currency, confiscatory taxation, political or financial instability and diplomatic developments, which could affect the value of a Fund's investments in certain foreign countries. Governments of many countries have exercised and continue to exercise substantial influence over many aspects of the private sector through the ownership or control of many companies, including some of the largest in these countries. As a result, government actions in the future could have a significant effect on economic conditions which may adversely affect prices of certain portfolio securities. There is also generally less government supervision and regulation of stock exchanges, brokers and listed companies than in the United States. Dividends or interest on, or proceeds from the sale of, foreign securities may be subject to foreign withholding taxes, and special U.S. tax considerations may apply. Moreover, foreign economies may differ favorably or unfavorably from the
168
Victory Portfolios | | Notes to Financial Statements — continued
December 31, 2020 | |
(Unaudited)
U.S. economy in such respects as growth of gross national product, rate of inflation, capital re-investment, resource self- sufficiency and balance of payments position. The Schedule of Portfolio Investments includes information on each Fund's holdings, including industry and/or geographic composition, as relevant.
Interest Rate Risk — The INCORE Total Return Bond Fund is subject to credit and interest rate risk with respect to fixed income securities. Credit risk refers to the ability of an issuer to make timely payments of interest and principal. Interest rates may rise, or the rate of inflation may increase, impacting the value if investments in fixed income securities. A debt issuer's credit quality may be downgraded, or an issuer may default. Interest rates may fluctuate due to changes in governmental fiscal policy initiatives and resulting market reaction to those initiatives.
Credit Risk — The Funds will be subject to credit risk with respect to the amount each expects to receive from counterparties for financial instruments entered into by the Funds. The Funds may be negatively impacted if a counterparty becomes bankrupt or otherwise fails to perform its obligations due to financial difficulties. The Funds may experience significant delays in obtaining any recovery in bankruptcy or other reorganization proceeding and the Funds may obtain only limited recovery or may obtain no recovery in such circumstances. The Funds typically enter into transactions with counterparties whose credit ratings are investment grade, as determined by a nationally recognized statistical rating organization or, if unrated, judged by the Adviser to be of comparable quality.
Sector Risk — To the extent the Funds focus in one or more sectors, market or economic factors impacting those sectors could have a significant effect on the value of the Funds' investments and could make the Funds' performance more volatile. For example, the values of companies in the Information Technology sector are particularly vulnerable to economic downturns, short product cycles and aggressive pricing, market competition and changes in government regulation.
Geopolitical/Natural Disaster Risk — An outbreak of disease called COVID-19 has spread internationally. The transmission of COVID-19 and efforts to contain its spread have resulted in international, national and local border closings and other significant travel restrictions and disruptions, significant disruptions to business operations, supply chains and consumer activity, significant challenges in healthcare service preparation and delivery, quarantines and general concern and uncertainty. These negative impacts have caused significant volatility and declines in global financial markets, which have caused losses for Fund investors during and subsequent to period end. The impact of the COVID-19 pandemic may last for an extended period of time, and could result in a substantial economic downturn or recession. Public health crises may exacerbate other pre-existing political, social, economic, market and financial risks. The extent of the impact to the financial performance of the Funds' investments will depend on future developments, including (i) the duration and spread of the outbreak, (ii) the restrictions and advisories, (iii) the effects on the financial markets, and (iv) the effects on the economy overall, all of which are highly uncertain and cannot be predicted.
LIBOR Discontinuation Risk — Many debt securities, derivatives and other financial instruments, including some of the Funds' investments, use the London Interbank Offered Rate ("LIBOR") as the reference or benchmark rate for variable interest rate calculations. However, the use of LIBOR started to come under pressure following manipulation allegations in 2012. Despite increased regulation and other corrective actions since that time, concerns have arisen regarding its viability as a benchmark, due largely to reduced activity in the financial markets that it measures. In June 2017, the Alternative Reference Rates Committee, a group of large U.S. banks working with the Federal Reserve, announced its selection of a new Secured Overnight Funding Rate ("SOFR"), which is intended to be a broad measure of secured overnight U.S. Treasury repo rates, as an appropriate replacement for LIBOR. The Federal Reserve Bank of New York began publishing the SOFR in 2018, expecting that it could be used on a voluntary basis in new instruments and transactions. Bank working groups and regulators in other countries have suggested other alternatives for their markets, including the Sterling Overnight Interbank Average Rate ("SONIA") in England. In July 2017, the Financial Conduct Authority (the "FCA"), the United Kingdom financial regulatory body, announced that after 2021 it will cease its active encouragement of UK banks to provide the quotations needed to sustain LIBOR. That announcement
169
Victory Portfolios | | Notes to Financial Statements — continued
December 31, 2020 | |
(Unaudited)
suggests that LIBOR may cease to be published after that time. For U.S. dollar LIBOR, however, the relevant date may be deferred to June 30, 2023, for the most common tenors (overnight and one, three, six and 12 months). As to those tenors, the LIBOR administrator has published a consultation regarding its intention to cease publication of U.S. dollar LIBOR as of June 30, 2023 (instead of December 31, 2021, as previously expected), apparently based on continued rate submissions from banks. It is expected that there will be enough time for market participants to transition to the use of a different benchmark for both new and existing securities and transactions. Various financial industry groups have begun planning for that transition, but there are obstacles to converting certain longer-term securities and transactions to a new benchmark. Transition planning is at an early stage, and neither the effect of the transition process nor its ultimate success can yet be known. Although the foregoing may provide some sense of timing, there is no assurance that LIBOR, nor any particular currency and tenor, will continue to be published until any particular date, and it appears highly likely that LIBOR will be discontinued or modified after December 31, 2021, or June 30, 2023, depending on the currency and tenor. The transition process might lead to increased volatility and illiquidity in markets that currently rely on the LIBOR to determine interest rates. It could also lead to a reduction in the value of some LIBOR-based investments and reduce the effectiveness of new hedges placed against existing LIBOR-based instruments. Since the usefulness of LIBOR as a benchmark could deteriorate during the transition period, these effects could occur before the end of 2021.
6. Borrowing and Interfund Lending:
Line of Credit:
For the six months ended December 31, 2020, the Victory Funds Complex and the USAA Mutual Funds Complex (another series of mutual funds managed by the Adviser) participated in a short-term demand note "Line of Credit" agreement with Citibank. The Line of Credit agreement with Citibank was renewed on June 29, 2020, with a termination date of June 28, 2021. Under the agreement with Citibank, the Victory Funds Complex and USAA Mutual Funds Complex, combined, may borrow up to $600 million, of which $300 million is committed and $300 million is uncommitted. $40 million of the Line of Credit is reserved for use by the Victory Floating Rate Fund (herein, the "Fund"), another series of the Victory Funds Complex, with that Fund paying the related commitment fees for that amount. The purpose of the agreement is to meet temporary or emergency cash needs. For the six months ended December 31, 2020, Citibank received an annual commitment fee of 0.15% on $300 million for providing the Line of Credit. Each fund in the Victory Funds Complex pays a pro-rata portion of the commitment fees plus any interest (one month LIBOR plus one percent) on amounts borrowed. Effective June 29, 2020, under an amended Line of Credit agreement, Citibank will also receive an annual upfront fee of 0.10% on the $300 million committed line of credit. Each fund in the Victory Funds Complex will pay a pro-rata portion of the upfront fee. Interest charged to each Fund during the period, if applicable, is presented on the Statements of Operations under Line of credit fees.
The Funds did not utilize the Line of Credit during the fiscal six months ended December 31, 2020.
Interfund Lending:
The Trust and Adviser rely on an exemptive order granted by the SEC in March 2017 (the "Order"), permitting the establishment and operation of an Interfund Lending Facility (the "Facility"). The Facility allows each Fund to directly lend money to and borrow money from any other Victory Fund, that is permitted to participate in the Facility, relying upon the Order at rates beneficial to both the borrowing and lending funds. Advances under the Facility are allowed for temporary or emergency purposes, including the meeting of redemption requests that otherwise might require the untimely disposition of securities, and are subject to each Fund's borrowing restrictions. The interfund loan rate is determined, as specified in the Order, by averaging the current repurchase agreement rate and the current bank loan rate. As a Borrower, interest charged to each Fund during the period, if applicable, is presented on the Statements of Operations under Interfund lending fees. As a Lender, interest earned by each Fund during the period, if applicable, is presented on the Statements of Operations under Interfund lending income.
170
Victory Portfolios | | Notes to Financial Statements — continued
December 31, 2020 | |
(Unaudited)
The average borrowing for the days outstanding and average interest rate for each Fund during the six months ended December 31, 2020, were as follows (amounts in thousands):
| | | Borrower or
Lender | | Amount
Outstanding at
December 31, 2020 | | Average
Borrowing* | | Days
Borrowing
Outstanding | | Average
Interest
Rate | | Maximum
Borrowing
During the
Period | |
Integrity Small-Cap
Value Fund | | Borrower | | $ | — | | | $ | 5,096 | | | | 5 | | | | 0.62 | % | | $ | 5,671 | | |
* For the six months ended December 31, 2020, based on the number of days borrowings were outstanding.
7. Federal Income Tax Information:
Each of the Funds (except for INCORE Total Return Bond Fund and S&P 500 Index Fund) intend to declare and distribute net investment income at least annually, if any. INCORE Total Return Bond Fund declares and pays dividends from net investment income monthly, if any. S&P 500 Index Fund declares and pays dividends from net investment income quarterly, if any. Distributable net realized gains, if any, are declared and distributed at least annually from each Fund.
The amounts of dividends from net investment income and distributions from net realized gains (collectively, distributions to shareholders) are determined in accordance with federal income tax regulations, which may differ from GAAP. To the extent these "book/tax" differences are permanent in nature (e.g., net operating loss and distribution reclassification), such amounts are reclassified within the components of net assets based on their federal tax-basis treatment; temporary differences (e.g., wash sales) do not require reclassification. To the extent dividends and distributions exceed net investment income and net realized gains for tax purposes, they are reported as distributions of capital. Net investment losses incurred by a Fund may be reclassified as an offset to capital on the accompanying Statements of Assets and Liabilities.
The tax character of current year distributions paid and the tax basis of the current components of accumulated earnings (deficit) will be determined at the end of the current tax year ending June 30, 2021.
As of the most recent tax year ended June 30, 2020, the following Funds had net capital loss carryforwards ("CLCFs") as summarized in the tables below.
CLCFs not limited as a result as either short-term or long-term depending on the originating capital loss were as follows (amounts in thousands).
| | | Short-Term
Amount | | Long-Term
Amount | | Total | |
Integrity Discovery Fund | | $ | 3,937 | | | $ | 6,141 | | | $ | 10,078 | | |
Integrity Mid-Cap Value Fund | | | 19,296 | | | | 675 | | | | 19,971 | | |
Integrity Small-Cap Value Fund | | | 135,836 | | | | 94,837 | | | | 230,673 | | |
Integrity Small/Mid-Cap Value Fund | | | 11,685 | | | | 1,792 | | | | 13,477 | | |
Munder Multi-Cap Fund | | | 7,601 | | | | — | | | | 7,601 | | |
Trivalent Emerging Markets Small-Cap Fund | | | 1,304 | | | | 343 | | | | 1,647 | | |
Trivalent International Fund-Core Equity | | | 8,097 | | | | — | | | | 8,097 | | |
Trivalent International Small-Cap Fund | | | 138,291 | | | | 16,504 | | | | 154,795 | | |
INCORE Total Return Bond Fund | | | 614 | | | | 3,535 | | | | 4,149 | | |
8. Capital Contribution from Prior Custodian:
During 2016, certain Funds received notification from their prior custodian, State Street Bank and Trust ("State Street"), concerning issues related to billing on certain categories of expenses during the approximately 16-year period from 1998 through October 31, 2014. The over-billing primarily related to categories of expenses that involved an allocation of general costs among multiple clients.
171
Victory Portfolios | | Notes to Financial Statements — continued
December 31, 2020 | |
(Unaudited)
State Street paid the refunded amounts during January 2017. Based on billing information received during 2016 from State Street and an analysis of any expense limitation agreements that were in place during the period of the activities in question, including the application of any recoupment provisions in such agreements, the Adviser received a portion of the refund.
The portion of the refund retained by the Funds was accounted for as a capital contribution and is reflected on the Financial Highlights as "Capital Contribution from Prior Custodian, Net".
9. Fund Ownership:
Ownership of more than 25% of the voting securities of a fund creates presumptions of control of the fund, under section 2(a)(9) of the 1940 Act. As of December 31, 2020, the shareholders listed below held more than 25% of the shares outstanding of the Funds and may be deemed to control those Funds.
| | | Shareholder | | Percent | |
Integrity Mid-Cap Value Fund | | Gerlach Nominee and Co. LLC | | | 53.7 | % | |
Integrity Mid-Cap Value Fund | | Edward D. Jones & Co., L.P. | | | 25.9 | % | |
Integrity Small/Mid-Cap Value Fund | | Edward D. Jones & Co., L.P. | | | 48.2 | % | |
Integrity Small-Cap Value Fund | | National Financial Services, LLC | | | 28.0 | % | |
Munder Small Cap Growth Fund | | Brian S Matuszak | | | 34.2 | % | |
Munder Small Cap Growth Fund | | Tony Yee Dong | | | 48.4 | % | |
Trivalent International Fund-
Core Equity | | Gerlach Nominee and Co. LLC | | | 85.5 | % | |
Trivalent International Small-Cap Fund | | National Financial Services, LLC | | | 27.8 | % | |
INCORE Total Return Bond Fund | | Comerica Bank | | | 53.9 | % | |
Trivalent Emerging Markets
Small Cap Fund | | Victory Capital Management, Inc. | | | 54.2 | % | |
172
Victory Portfolios | | Supplemental Information
December 31, 2020 | |
(Unaudited)
Proxy Voting and Portfolio Holdings Information
Proxy Voting:
Information regarding the policies and procedures each Fund uses to determine how to vote proxies relating to portfolio securities is available without charge, upon request, by calling 800-539-3863. The information is also included in the Funds' Statement of Additional Information, which is available on the SEC's website at www.sec.gov.
Information relating to how the Funds voted proxies relating to portfolio securities held during the most recent twelve months ended June 30 is available on the SEC's website at www.sec.gov.
Availability of Schedules of Portfolio Investments:
The Trust files a complete list of Schedules of Portfolio Investments with the SEC for the first and third quarter of each fiscal year on Form N-PORT. Form N-PORT is available on the SEC's web site at www.sec.gov.
Expense Examples
As a shareholder of the Funds, you may incur two types of costs: (1) transaction costs, including sales charges (loads) on purchases; and (2) ongoing costs, including management fees, distribution and service (12b-1) fees and other Fund expenses. These examples are intended to help you understand your ongoing costs (in dollars) of investing in the Funds and to compare these costs with the ongoing costs of investing in other mutual funds.
These examples are based on an investment of $1,000 invested at the beginning of the period and held for the entire period from July 1, 2020, through December 31, 2020.
The Actual Expense figures in the table below provide information about actual account values and actual expenses. You may use the information below, together with the amount you invested, to estimate the expenses that you paid over the period. Simply divide your account value by $1,000 (for example, an $8,600 account value divided by $1,000 = 8.6), then multiply the result by the number in the table under the heading entitled "Actual Expenses Paid During Period" to estimate the expenses you paid on your account during this period.
The Hypothetical Expense figures in the table below provide information about hypothetical account values and hypothetical expenses based on each Fund's actual expense ratio and an assumed rate of return of 5% per year before expenses, which is not the Fund's actual return. The hypothetical account values and expenses may not be used to estimate the actual ending account balance or expenses you paid for the period. You may use this information to compare this 5% hypothetical example with the 5% hypothetical examples that appear in shareholder reports of other funds.
Please note the expenses shown in the table are meant to highlight your ongoing costs only and do not reflect any transactional costs. Therefore, the table is useful in comparing ongoing costs only, and will not help you determine the relative total costs of owning different funds. In addition, if these transactional costs were included, your costs would have been higher.
| | Beginning
Account
Value
7/1/20 | | Actual
Ending
Account
Value
12/31/20 | | Hypothetical
Ending
Account
Value
12/31/20 | | Actual
Expenses
Paid
During
Period
7/1/20-
12/31/20* | | Hypothetical
Expenses
Paid
During
Period
7/1/20-
12/31/20* | | Annualized
Expense
Ratio
During
Period
7/1/20-
12/31/20 | |
Integrity Discovery Fund | |
Class A Shares | | $ | 1,000.00 | | | $ | 1,405.30 | | | $ | 1,016.94 | | | $ | 9.94 | | | $ | 8.34 | | | | 1.64 | % | |
Class C Shares | | | 1,000.00 | | | | 1,400.10 | | | | 1,012.85 | | | | 14.82 | | | | 12.43 | | | | 2.45 | % | |
Class R Shares | | | 1,000.00 | | | | 1,402.00 | | | | 1,014.72 | | | | 12.59 | | | | 10.56 | | | | 2.08 | % | |
Class Y Shares | | | 1,000.00 | | | | 1,407.30 | | | | 1,018.15 | | | | 8.49 | | | | 7.12 | | | | 1.40 | % | |
Member Class** | | | 1,000.00 | | | | 1,281.40 | | | | 1,017.64 | | | | 2.77 | | | | 7.63 | | | | 1.50 | % | |
173
Victory Portfolios | | Supplemental Information — continued
December 31, 2020 | |
(Unaudited)
| | Beginning
Account
Value
7/1/20 | | Actual
Ending
Account
Value
12/31/20 | | Hypothetical
Ending
Account
Value
12/31/20 | | Actual
Expenses
Paid
During
Period
7/1/20-
12/31/20* | | Hypothetical
Expenses
Paid
During
Period
7/1/20-
12/31/20* | | Annualized
Expense
Ratio
During
Period
7/1/20-
12/31/20 | |
Integrity Mid-Cap Value Fund | |
Class A Shares | | $ | 1,000.00 | | | $ | 1,316.30 | | | $ | 1,020.16 | | | $ | 5.84 | | | $ | 5.09 | | | | 1.00 | % | |
Class C Shares | | | 1,000.00 | | | | 1,311.10 | | | | 1,016.38 | | | | 10.19 | | | | 8.89 | | | | 1.75 | % | |
Class R6 Shares | | | 1,000.00 | | | | 1,319.00 | | | | 1,022.18 | | | | 3.51 | | | | 3.06 | | | | 0.60 | % | |
Class Y Shares | | | 1,000.00 | | | | 1,318.10 | | | | 1,021.42 | | | | 4.38 | | | | 3.82 | | | | 0.75 | % | |
Member Class** | | | 1,000.00 | | | | 1,189.80 | | | | 1,020.92 | | | | 1.50 | | | | 4.33 | | | | 0.85 | % | |
Integrity Small-Cap Value Fund | |
Class A Shares | | | 1,000.00 | | | | 1,416.10 | | | | 1,017.80 | | | | 8.95 | | | | 7.48 | | | | 1.47 | % | |
Class C Shares | | | 1,000.00 | | | | 1,409.90 | | | | 1,013.41 | | | | 14.21 | | | | 11.88 | | | | 2.34 | % | |
Class R Shares | | | 1,000.00 | | | | 1,413.80 | | | | 1,016.38 | | | | 10.65 | | | | 8.89 | | | | 1.75 | % | |
Class R6 Shares | | | 1,000.00 | | | | 1,419.80 | | | | 1,020.32 | | | | 5.92 | | | | 4.94 | | | | 0.97 | % | |
Class Y Shares | | | 1,000.00 | | | | 1,418.60 | | | | 1,019.46 | | | | 6.95 | | | | 5.80 | | | | 1.14 | % | |
Integrity Small/Mid-Cap Value Fund | |
Class A Shares | | | 1,000.00 | | | | 1,378.60 | | | | 1,019.51 | | | | 6.77 | | | | 5.75 | | | | 1.13 | % | |
Class R6 Shares | | | 1,000.00 | | | | 1,380.50 | | | | 1,021.02 | | | | 4.98 | | | | 4.23 | | | | 0.83 | % | |
Class Y Shares | | | 1,000.00 | | | | 1,379.60 | | | | 1,020.77 | | | | 5.28 | | | | 4.48 | | | | 0.88 | % | |
Member Class** | | | 1,000.00 | | | | 1,249.60 | | | | 1,020.42 | | | | 1.73 | | | | 4.84 | | | | 0.95 | % | |
Munder Multi-Cap Fund | |
Class A Shares | | | 1,000.00 | | | | 1,210.60 | | | | 1,018.40 | | | | 7.52 | | | | 6.87 | | | | 1.35 | % | |
Class C Shares | | | 1,000.00 | | | | 1,205.50 | | | | 1,014.32 | | | | 12.01 | | | | 10.97 | | | | 2.16 | % | |
Class Y Shares | | | 1,000.00 | | | | 1,212.60 | | | | 1,020.27 | | | | 5.47 | | | | 4.99 | | | | 0.98 | % | |
S&P 500 Index Fund | |
Class A Shares | | | 1,000.00 | | | | 1,218.00 | | | | 1,022.43 | | | | 3.07 | | | | 2.80 | | | | 0.55 | % | |
Class R Shares | | | 1,000.00 | | | | 1,215.00 | | | | 1,020.32 | | | | 5.42 | | | | 4.94 | | | | 0.97 | % | |
Class Y Shares | | | 1,000.00 | | | | 1,218.90 | | | | 1,022.99 | | | | 2.46 | | | | 2.24 | | | | 0.44 | % | |
Munder Mid-Cap Core Growth Fund | |
Class A Shares | | | 1,000.00 | | | | 1,284.70 | | | | 1,018.75 | | | | 7.37 | | | | 6.51 | | | | 1.28 | % | |
Class C Shares | | | 1,000.00 | | | | 1,280.90 | | | | 1,014.72 | | | | 11.96 | | | | 10.56 | | | | 2.08 | % | |
Class R Shares | | | 1,000.00 | | | | 1,282.20 | | | | 1,017.29 | | | | 9.03 | | | | 7.98 | | | | 1.57 | % | |
Class R6 Shares | | | 1,000.00 | | | | 1,287.00 | | | | 1,020.77 | | | | 5.07 | | | | 4.48 | | | | 0.88 | % | |
Class Y Shares | | | 1,000.00 | | | | 1,286.00 | | | | 1,020.06 | | | | 5.88 | | | | 5.19 | | | | 1.02 | % | |
Munder Small Cap Growth Fund | |
Class A Shares | | | 1,000.00 | | | | 1,358.00 | | | | 1,018.15 | | | | 8.32 | | | | 7.12 | | | | 1.40 | % | |
Class I Shares | | | 1,000.00 | | | | 1,360.20 | | | | 1,019.41 | | | | 6.84 | | | �� | 5.85 | | | | 1.15 | % | |
Class Y Shares | | | 1,000.00 | | | | 1,359.60 | | | | 1,018.90 | | | | 7.43 | | | | 6.36 | | | | 1.25 | % | |
Trivalent Emerging Markets Small-Cap Fund | |
Class A Shares | | | 1,000.00 | | | | 1,277.60 | | | | 1,016.48 | | | | 9.93 | | | | 8.79 | | | | 1.73 | % | |
Class Y Shares | | | 1,000.00 | | | | 1,280.30 | | | | 1,017.74 | | | | 8.51 | | | | 7.53 | | | | 1.48 | % | |
Trivalent International Fund-Core Equity Fund | |
Class A Shares | | | 1,000.00 | | | | 1,193.60 | | | | 1,020.42 | | | | 5.25 | | | | 4.84 | | | | 0.95 | % | |
Class C Shares | | | 1,000.00 | | | | 1,188.60 | | | | 1,016.64 | | | | 9.38 | | | | 8.64 | | | | 1.70 | % | |
Class I Shares | | | 1,000.00 | | | | 1,196.10 | | | | 1,022.18 | | | | 3.32 | | | | 3.06 | | | | 0.60 | % | |
Class R6 Shares | | | 1,000.00 | | | | 1,194.40 | | | | 1,022.43 | | | | 3.04 | | | | 2.80 | | | | 0.55 | % | |
Class Y Shares | | | 1,000.00 | | | | 1,196.60 | | | | 1,021.68 | | | | 3.88 | | | | 3.57 | | | | 0.70 | % | |
174
Victory Portfolios | | Supplemental Information — continued
December 31, 2020 | |
(Unaudited)
| | Beginning
Account
Value
7/1/20 | | Actual
Ending
Account
Value
12/31/20 | | Hypothetical
Ending
Account
Value
12/31/20 | | Actual
Expenses
Paid
During
Period
7/1/20-
12/31/20* | | Hypothetical
Expenses
Paid
During
Period
7/1/20-
12/31/20* | | Annualized
Expense
Ratio
During
Period
7/1/20-
12/31/20 | |
Trivalent International Small-Cap Fund | |
Class A Shares | | $ | 1,000.00 | | | $ | 1,263.40 | | | $ | 1,018.40 | | | $ | 7.70 | | | $ | 6.87 | | | | 1.35 | % | |
Class C Shares | | | 1,000.00 | | | | 1,258.20 | | | | 1,014.62 | | | | 11.95 | | | | 10.66 | | | | 2.10 | % | |
Class I Shares | | | 1,000.00 | | | | 1,265.70 | | | | 1,020.42 | | | | 5.43 | | | | 4.84 | | | | 0.95 | % | |
Class R6 Shares | | | 1,000.00 | | | | 1,266.10 | | | | 1,019.96 | | | | 5.94 | | | | 5.30 | | | | 1.04 | % | |
Class Y Shares | | | 1,000.00 | | | | 1,264.80 | | | | 1,019.66 | | | | 6.28 | | | | 5.60 | | | | 1.10 | % | |
INCORE Total Return Bond Fund | |
Class A Shares | | | 1,000.00 | | | | 1,026.20 | | | | 1,020.92 | | | | 4.34 | | | | 4.33 | | | | 0.85 | % | |
Class C Shares | | | 1,000.00 | | | | 1,021.10 | | | | 1,017.14 | | | | 8.15 | | | | 8.13 | | | | 1.60 | % | |
Class R6 Shares | | | 1,000.00 | | | | 1,026.50 | | | | 1,022.28 | | | | 2.96 | | | | 2.96 | | | | 0.58 | % | |
Class Y Shares | | | 1,000.00 | | | | 1,026.40 | | | | 1,022.18 | | | | 3.06 | | | | 3.06 | | | | 0.60 | % | |
* Expenses are equal to the average account value multiplied by the Fund's annualized expense ratio multiplied by 184/365 (the number of days in the most recent half-year divided by the number of days in the fiscal year).
** Actual Expenses Paid are equal to the average account value multiplied by the Fund's annualized expense ratio multiplied by 59/365 to reflect the stub period from commencement of operations November 3, 2020, through December 31, 2020.
175
Victory Portfolios | | Supplemental Information — continued
December 31, 2020 | |
(Unaudited)
Considerations of the Board in Continuing the Investment Advisory Agreement (the "Agreement")
The Board approved the Agreement on behalf of each of the Funds at a meeting, which was called for that purpose, on December 2, 2020. The Board also considered information relating to the Funds and the Agreement provided throughout the year and, more specifically, at a meeting on October 27, 2020 called for the purpose of reviewing the Agreement. In considering whether to approve the Agreement, the Board requested, and the Adviser provided, information that the Board believed to be reasonably necessary to reach its conclusions.
The Board, including the Independent Trustees, evaluated this information along with other information obtained throughout the year and was advised by legal counsel to the Funds, which also serves as independent legal counsel to the Independent Trustees. In addition, the Independent Trustees considered a past review of their overall process for conducting the annual review of the Funds' advisory arrangements by an independent consultant retained through their counsel.
The Board took into consideration regular reports from the Adviser throughout the COVID-19 pandemic public health crisis concerning how the ongoing pandemic has affected market volatility, investment risk and the implementation and effectiveness of business continuity plans. These reports also had confirmed that the pandemic had no material impact on the Adviser's operations.
The Board considered each Fund's advisory fee, expense ratio and investment performance as significant factors in determining whether the Agreement should be continued. In considering whether the compensation paid to the Adviser was fair and reasonable, the Board also evaluated, among other things, the following factors:
• The requirements of the Funds for the services provided by the Adviser;
• The nature, quality and extent of the services provided and expected to be provided;
• The performance of the Funds as compared to comparable funds;
• The fees payable for the services and whether the fee arrangements provided for economies of scale that would benefit Fund shareholders as the Funds grow;
• Whether the fee would be sufficient to enable the Adviser to attract and retain experienced personnel and continue to provide quality services to the Funds;
• The fees paid by other clients of the Adviser whose accounts are managed in a similar investment style and any differences in the services provided to the other clients compared to those provided to the Funds;
• The total expenses of each Fund;
• Management's commitment to operating the Funds at competitive expense levels;
• The profitability of the Adviser (as reflected by comparing fees earned against an estimate of the Adviser's costs) with respect to the Adviser's relationship with the Funds;
• Research and other service benefits received by the Adviser obtained through payment of client commissions for securities transactions;
• Other benefits received by the Adviser, and its affiliates, including revenues paid to the Adviser, or its affiliates, by the Funds for administration and fund accounting services, and distribution;
• The capabilities and financial condition of the Adviser;
• Current economic and industry trends; and
• The historical relationship between each Fund and the Adviser.
The Board reviewed each Fund's current management fee, comprised of the advisory fee plus the administrative services fee paid to the Adviser, in the context of the Adviser's profitability with respect to each Fund individually. In addition, the Board compared each Fund's gross management fees and total operating expense ratio on a net and gross basis with the median gross management fee and median expense ratio of a universe of comparable mutual funds compiled by an independent consultant and a peer group of funds with similar investment strategies selected by that independent consultant from the universe. The Board reviewed the factors and methodology used by the independent consultant in the selection of each Fund's peer group, including the independent consultant's selection of a broad universe of funds, the more specific universe of comparable funds, and peer
176
Victory Portfolios | | Supplemental Information — continued
December 31, 2020 | |
(Unaudited)
groups of funds with comparable investment strategies and asset levels, among other factors. The Board also reviewed any changes to the independent consultant's methodology as compared to the prior year, including those resulting from the Adviser's input, if any. With respect to certain Funds, the Board also reviewed fees and other information related to the Adviser's management of similarly managed institutional or private accounts, and the differences in the services provided to the other accounts. The Board also noted that the breakpoints in the advisory fee schedule for some of the Funds evidenced one way in which the Adviser has shown a willingness to share in its economies of scale.
The Board also reviewed the compliance and administrative services provided to the Funds by the Adviser and its affiliates, including the Adviser's oversight of the Funds' day-to-day operations and oversight of Fund accounting, assistance in meeting legal and regulatory requirements, and other services necessary for the operation of the Funds and the Trust.
The Board found that the gross annual management fee paid by each Fund was within the range of management fees paid by each Fund's respective peer group. The Board noted that, except for the Integrity Discovery Fund, Munder Small Cap Growth Fund, Trivalent Emerging Markets Small-Cap Fund and INCORE Total Return Bond Fund, each Fund's advisory fee structure contained at least one breakpoint. The Board also found that each Fund's Class A net annual expense ratio, taking into account any shareholder servicing or distribution fees, was reasonable as compared with each Fund's respective peer group. The Board considered the Adviser's contractual agreement with each Fund, except for the S&P 500 Index Fund, to waive its fees and reimburse expenses of certain classes for a specified period of time, as described in the Fund's prospectus.
The Board reviewed each Fund's current management The Board reviewed each Fund's performance over one-, three-, five- and ten-year periods (as applicable) against the performance of the Fund's selected peer group and benchmark index. The Board recognized that the performance of the Funds and the peer group funds are net of expenses, while the performance of the benchmark index reflects gross returns.
The Board reviewed various other specific factors with respect to each Fund, as described below. In their deliberations, the Trustees did not rank the importance of any particular information or factor considered and each Trustee may have attributed different weights to various factors.
Integrity Discovery Fund
The Board compared the Fund's Class A performance for the one-, three-, five- and ten-year periods ended June 30, 2020, to that of the median performance of the Fund's peer group and benchmark index for the same periods and considered the fact that the Fund underperformed both the benchmark index and the peer group median for all of the periods reviewed, with the exception of the ten-year period. The Board brought the Fund's underperformance to management's attention and discussed with the Adviser any steps that had been or could be taken to enhance performance in the future.
Having considered, among other things: (1) the Fund's management fee compared to comparable mutual funds; (2) the Fund's total expense compared to comparable mutual funds; (3) that the Adviser's willingness to limit the expenses of certain classes for a period of time would provide stability to the Fund's expenses for those share classes during that period; and (4) the Fund's performance during the periods reviewed, the Board concluded that the Agreement continued to be in the best interests of the Fund's shareholders.
Integrity Mid-Cap Value Fund
Noting that the Fund commenced operations in 2011, the Board compared the Fund's Class A performance for the one-, three- and five-year periods ended June 30, 2020, to that of the median performance of the Fund's peer group and benchmark index for the same periods and considered the fact that the Fund underperformed the benchmark index for all of the periods reviewed, underperformed the peer group median for the one- and three-year periods, and matched the peer group median for the five-year period. The Board brought the Fund's underperformance to management's attention and discussed with the Adviser any steps that had been or could be taken to enhance performance in the future.
Having considered, among other things: (1) the Fund's management fee compared to comparable mutual funds; (2) the Fund's total expense ratio compared to comparable mutual funds; (3) that the Adviser's willingness to limit the expenses of certain classes for a period of time would provide stability to the Fund's expenses for those
177
Victory Portfolios | | Supplemental Information — continued
December 31, 2020 | |
(Unaudited)
share classes during that period; and (4) the Fund's performance during the periods reviewed, the Board concluded that the Agreement continued to be in the best interests of the Fund's shareholders.
Integrity Small-Cap Value Fund
The Board compared the Fund's Class A performance for the one-, three-, five- and ten-year periods ended June 30, 2020, to that of the median performance of the Fund's peer group and benchmark index for the same periods and considered the fact that the Fund underperformed both the benchmark index and the peer group median for all of the periods reviewed. The Board brought the Fund's underperformance to management's attention and discussed with the Adviser any steps that had been or could be taken to enhance performance in the future.
Having considered, among other things: (1) the Fund's management fee compared to comparable mutual funds; (2) the Fund's total expense ratio compared to comparable mutual funds; (3) that the Adviser's willingness to limit the expenses of certain classes for a period of time would provide stability to the Fund's expenses for those share classes during that period; and (4) the Fund's performance during the periods reviewed, the Board concluded that the Agreement continued to be in the best interests of the Fund's shareholders.
Integrity Small/Mid-Cap Value Fund
Noting that the Fund commenced operations in 2011, the Board compared the Fund's Class A performance for the one-, three- and five-year periods ended June 30, 2020, to that of the median performance of the Fund's peer group and benchmark index for the same periods and considered the fact that the Fund underperformed both the benchmark index and the peer group median for all of the periods reviewed. The Board brought the Fund's underperformance to management's attention and discussed with the Adviser any steps that had been or could be taken to enhance performance in the future.
Having considered, among other things: (1) the Fund's management fee compared to comparable mutual funds; (2) the Fund's total expense ratio compared to comparable mutual funds; (3) that the Adviser's willingness to limit the expenses of certain classes for a period of time would provide stability to the Fund's expenses for those share classes during that period; and (4) the Fund's performance during the periods reviewed, the Board concluded that the Agreement continued to be in the best interests of the Fund's shareholders.
Munder Multi-Cap Fund
The Board compared the Fund's Class A performance for the one-, three-, five- and ten-year periods ended June 30, 2020, to that of the median performance of the Fund's peer group and benchmark index for the same periods and considered the fact that the Fund underperformed both the benchmark index and the peer group median for all of the periods reviewed. The Board discussed the Fund's investment strategy, the Adviser's implementation of the strategy, and related market conditions, together with relevant fee and expense considerations. The Board also discussed the steps that had been or could be taken by the Adviser to enhance performance in the future, and the Board's continued monitoring of the Fund's performance.
Having considered, among other things: (1) the Fund's management fee compared to comparable mutual funds; (2) the Fund's total expense ratio compared to comparable mutual funds; (3) that the Adviser's willingness to limit the expenses of certain classes for a period of time would provide stability to the Fund's expenses for those share classes during that period; and (4) the Fund's performance during the periods reviewed, the Board concluded that the Agreement continued to be in the best interests of the Fund's shareholders.
S&P 500 Index Fund
The Board compared the Fund's Class A performance for the one-, three-, five- and ten-year periods ended June 30, 2020, to that of the median performance of the Fund's peer group and benchmark index for the same periods, noting that the Fund's investment objective is to track its benchmark index before fees and expenses. The Board recognized that the performance of the Fund is net of expenses, while the performance of the benchmark index is gross returns and as a result, the Fund generally will underperform its benchmark due to fees and expenses. The Board considered the fact that the Fund underperformed the benchmark index for all of the periods reviewed, underperformed the peer group median for the three-, five- and ten-year periods, and
178
Victory Portfolios | | Supplemental Information — continued
December 31, 2020 | |
(Unaudited)
matched the peer group median for the one-year period. The Board also considered the Fund's tracking error as a factor in evaluating performance. The Board discussed with the Adviser the implementation of the Fund's strategy, together with relevant fee and expense considerations, and any steps that had been or could be taken by the Adviser to enhance performance in the future.
Having considered, among other things: (1) the Fund's management fee compared to comparable mutual funds; (2) the Fund's total expense ratio compared to comparable mutual funds; and (3) the Fund's performance during the periods reviewed, the Board concluded that the Agreement continued to be in the best interests of the Fund's shareholders.
Munder Mid-Cap Core Growth Fund
The Board compared the Fund's Class A performance for the one-, three-, five- and ten-year periods ended June 30, 2020, to that of the median performance of the Fund's peer group and benchmark index for the same periods and considered the fact that the Fund underperformed both the benchmark index and the peer group median for all of the periods reviewed. The Board discussed the Fund's investment strategy, the Adviser's implementation of the strategy, and related market conditions, together with relevant fee and expense considerations. The Board also discussed the steps that had been or could be taken by the Adviser to enhance performance in the future, and the Board's continued monitoring of the Fund's performance.
Having considered, among other things: (1) the Fund's management fee compared to comparable mutual funds; (2) the Fund's total expense ratio compared to comparable mutual funds; (3) that the Adviser's willingness to limit the expenses of certain classes for a period of time would provide stability to the Fund's expenses for those share classes during that period; and (4) the Fund's performance during the periods reviewed, the Board concluded that the Agreement continued to be in the best interests of the Fund's shareholders.
Munder Small Cap Growth Fund
Noting that the Fund commenced operations in 2015, the Board compared the Fund's Class A performance for the one-, three- and five-year periods ended June 30, 2020, to that of the median performance of the Fund's peer group and benchmark index for the same periods and considered the fact that the Fund outperformed both the benchmark index and the peer group median for all of the periods reviewed.
Having considered, among other things: (1) the Fund's management fee compared to comparable mutual funds; (2) the Fund's total expense ratio compared to comparable mutual funds; (3) that the Adviser's willingness to limit the expenses of certain classes for a period of time would provide stability to the Fund's expenses for those share classes during that period; and (4) the Fund's performance during the periods reviewed, the Board concluded that the Agreement continued to be in the best interests of the Fund's shareholders.
Trivalent Emerging Markets Small-Cap Fund
Noting that the Fund commenced operations in 2013, the Board compared the Fund's Class A performance for the one-, three- and five-year periods ended June 30, 2020, to that of the median performance of the Fund's peer group and benchmark index for the same periods and considered the fact that the Fund outperformed the benchmark index for all of the periods reviewed, and outperformed the peer group median for all of the periods reviewed, with the exception of the one-year period.
Having considered, among other things: (1) the Fund's management fee compared to comparable mutual funds; (2) the Fund's total expense ratio compared to comparable mutual funds; (3) that the Adviser's willingness to limit the expenses of certain classes for a period of time would provide stability to the Fund's expenses for those share classes during that period; and (4) the Fund's performance during the periods reviewed, the Board concluded that the Agreement continued to be in the best interests of the Fund's shareholders.
Trivalent International Fund — Core Equity
The Board compared the Fund's Class A performance for the one-, three-, five- and ten-year periods ended June 30, 2020, to that of the median performance of the Fund's peer group and benchmark index for the same periods and considered the fact that the Fund underperformed the benchmark index for all of the periods
179
Victory Portfolios | | Supplemental Information — continued
December 31, 2020 | |
(Unaudited)
reviewed, with the exception of the ten-year period, and outperformed the peer group median for all of the periods reviewed, with the exception of the one-year period.
Having considered, among other things: (1) the Fund's management fee compared to comparable mutual funds; (2) the Fund's total expense ratio compared to comparable mutual funds; (3) that the Adviser's willingness to limit the expenses of certain classes for a period of time would provide stability to the Fund's expenses for those share classes during that period; and (4) the Fund's performance during the periods reviewed, the Board concluded that the Agreement continued to be in the best interests of the Fund's shareholders.
Trivalent International Small-Cap Fund
The Board compared the Fund's Class A performance for the one-, three-, five- and ten-year periods ended June 30, 2020, to that of the median performance of the Fund's peer group and benchmark index for the same periods and considered the fact that the Fund outperformed both the benchmark index and the peer group median for all of the periods reviewed.
Having considered, among other things: (1) the Fund's management fee was compared to comparable mutual funds; (2) the Fund's total expense ratio compared to comparable mutual funds; (3) that the Adviser's willingness to limit the expenses of certain classes for a period of time would provide stability to the Fund's expenses for those share classes during that period; and (4) the Fund's performance during the periods reviewed, the Board concluded that the Agreement continued to be in the best interests of the Fund's shareholders.
INCORE Total Return Bond Fund
The Board compared the Fund's Class A performance for the one-, three-, five- and ten-year periods ended June 30, 2020, to that of the median performance of the Fund's peer group and benchmark index for the same periods and considered the fact that the Fund underperformed the benchmark index for all of the periods reviewed, outperformed the peer group median for the one- and three-year periods, underperformed the peer group median for the five-year period, and matched the peer group median for the ten-year period.
Having considered, among other things: (1) the Fund's management fee compared to comparable mutual funds; (2) the Fund's total expense ratio compared to comparable mutual funds; (3) that the Adviser's willingness to limit the expenses of certain classes for a period of time would provide stability to the Fund's expenses for those share classes during that period; and (4) the Fund's performance during the periods reviewed, the Board concluded that the Agreement continued to be in the best interests of the Fund's shareholders.
Conclusion
Based on its review of the information requested and provided, and following extended discussions, the Board determined that the Agreement, on behalf of the Funds discussed above, was consistent with the best interests of each Fund and its shareholders, and the Board unanimously approved the Agreement, on behalf of each Fund, for an additional annual period on the basis of the foregoing review and discussions and the following considerations, among others:
• The fairness and reasonableness of the investment advisory fee payable to the Adviser under the Agreement in light of the investment advisory services provided, the costs of these services, the profitability of the Adviser's relationship with the Fund and the comparability of the fee paid to the fees paid by other investment companies;
• The nature, quality and extent of the investment advisory services provided by the Adviser;
• The Adviser's entrepreneurial commitment to the management of the Funds and the creation of a broad-based family of funds, which could entail a substantial commitment of the Adviser's resources to the successful operation of the Funds;
• The Adviser's representations regarding its staffing and capabilities to manage the Funds, including the retention of personnel with relevant portfolio management experience;
• The Adviser's efforts to enhance investment results by, among other things, developing quality portfolio management teams; and
• The overall high quality of the personnel, operations, financial condition, investment management capabilities, methodologies and performance of the Adviser.
180
Privacy Policy
Protecting the Privacy of Information
The Trust respects your right to privacy. We also know that you expect us to conduct and process your business in an accurate and efficient manner. To do so, we must collect and maintain certain personal information about you. This is the information we collect from you on applications or other forms, and from the transactions you make with us or third parties. It may include your name, address, social security number, account transactions and balances, and information about investment goals and risk tolerance.
We do not disclose any information about you or about former customers to anyone except as permitted or required by law. Specifically, we may disclose the information we collect to companies that perform services on our behalf, such as the transfer agent that processes shareholder accounts and printers and mailers that assist us in the distribution of investor materials. We may also disclose this information to companies that perform marketing services on our behalf. This allows us to continue to offer you Victory investment products and services that meet your investing needs, and to effect transactions that you request or authorize. These companies will use this information only in connection with the services for which we hired them. They are not permitted to use or share this information for any other purpose.
To protect your personal information internally, we permit access only by authorized employees and maintain physical, electronic and procedural safeguards to guard your personal information.*
* You may have received communications regarding information about privacy policies from other financial institutions which gave you the opportunity to "opt-out" of certain information sharing with companies which are not affiliated with that financial institution. The Trust does not share information with other companies for purposes of marketing solicitations for products other than the Trust. Therefore, the Trust does not provide opt-out options to their shareholders.
Victory Funds
P.O. Box 182593
Columbus, Ohio 43218-2593

Visit our website at: | | Call Victory at: | |
www.vcm.com | | 800-539-FUND (800-539-3863) | |
| | 800-235-8396 for Member Class | |
Item 2. Code of Ethics.
Not applicable – only for annual reports.
Item 3. Audit Committee Financial Expert.
Not applicable – only for annual reports.
Item 4. Principal Accountant Fees and Services.
Not applicable – only for annual reports.
Item 5. Audit Committee of Listed Registrants.
Not applicable.
Item 6. Schedule of Investments.
Item 7. Disclosure of Proxy Voting Policies and Procedures for Closed-End Management Investment Companies.
Not applicable.
Item 8. Portfolio Managers of Closed-End Management Investment Companies.
Not applicable.
Item 9. Purchases of Equity Securities by Closed-End Management Investment Company and Affiliated Purchasers.
Not applicable.
Item 10. Submission of Matters to a Vote of Security Holders.
Not applicable.
Item 11. Controls and Procedures.
| (a) | The registrant’s principal executive officer and principal financial officer have concluded, based on their evaluation of the registrant's disclosure controls and procedures as conducted within 90 days of the filing date of this report, that these disclosure controls and procedures are adequately designed and are operating effectively to ensure that information required to be disclosed by the registrant on Form N-CSR is recorded, processed, summarized and reported within the time periods specified in the Securities and Exchange Commission's rules and forms. |
| (b) | There were no changes in the registrant’s internal control over financial reporting (as defined in Rule 30a-3(d) under the Investment Company Act of 1940 (17 CFR 270.30a-3(d)) that occurred during the period covered by this report that have materially affected or are reasonably likely to materially affect, the registrant’s internal control over financial reporting. |
Item 12. Disclosure of Securities Lending Activities for Closed-End Management Investment Companies.
Item 13. Exhibits.
SIGNATURES
Pursuant to the requirements of the Securities Exchange Act of 1934 and the Investment Company Act of 1940, the registrant has duly caused this report to be signed on its behalf by the undersigned, thereunto duly authorized.
| (Registrant) | Victory Portfolios | |
| By (Signature and Title)* | /s/ Allan Shaer | |
| | Allan Shaer, Principal Financial Officer | |
Pursuant to the requirements of the Securities Exchange Act of 1934 and the Investment Company Act of 1940, this report has been signed below by the following persons on behalf of the registrant and in the capacities and on the dates indicated.
| By (Signature and Title)* | /s/ Christopher K. Dyer | |
| | Christopher K. Dyer, Principal Executive Officer | |
| By (Signature and Title)* | /s/ Allan Shaer | |
| | Allan Shaer, Principal Financial Officer | |