UNITED STATES
SECURITIES AND EXCHANGE COMMISSION
Washington, D.C. 20549
FORM N-CSR
CERTIFIED SHAREHOLDER REPORT OF REGISTERED MANAGEMENT
INVESTMENT COMPANIES
| Investment Company Act file number: | | 811-04864 |
| |
| Exact name of registrant as specified in charter: | | Jennison Value Fund |
| |
| Address of principal executive offices: | | Gateway Center 3 100 Mulberry Street Newark, New Jersey 07102 |
| |
| Name and address of agent for service: | | Marguerite E. H. Morrison Gateway Center 3 100 Mulberry Street Newark, New Jersey 07102 |
| |
| Registrant’s telephone number, including area code: | | 973-367-7525 |
| |
| Date of fiscal year end: | | October 31, 2003 |
| |
| Date of reporting period: | | October 31, 2003 |
Item 1 – Reports to Stockholders
[SHAREHOLDER REPORT TO BE INSERTED HERE IN THE EDGAR VERSION]
Jennison Value Fund
Formerly known as Prudential Value Fund
|
OCTOBER 31, 2003 | | ANNUAL REPORT |

FUND TYPE
Large-capitalization stock
OBJECTIVE
Capital appreciation
This report is not authorized for distribution to prospective investors unless preceded or accompanied by a current prospectus.
The views expressed in this report and information about the Fund’s portfolio holdings are for the period covered by this report and are subject to change thereafter.
JennisonDryden is a service mark of The Prudential Insurance Company of America.

Dear Shareholder,
December 16, 2003
As you may know, the mutual fund industry recently has been the subject of much media attention. There has been press coverage of Prudential, and recently, administrative complaints were filed against Prudential Securities* and some of its former brokers and branch managers in Massachusetts. As president of your Fund, I’d like to provide you with an update on the issues as they pertain to JennisonDryden mutual funds.
State and federal authorities have requested information regarding trading practices from many mutual fund companies across the nation. Our fund family has been cooperating with inquiries it has received, and at the same time, Prudential Financial, Inc. has been conducting its own internal review. This review encompasses the policies, systems, and procedures of our fund family, Prudential Financial’s investment units and its proprietary distribution channels, including the former Prudential Securities. The review also includes mutual fund trading activity by investment professionals who manage our funds.
Market timing
Prudential Investments LLC, the Fund’s investment manager, has actively discouraged disruptive market timing, and for years, our mutual fund prospectuses have identified and addressed this issue. Prudential Investments has established operating policies and procedures that are designed to detect and deter frequent trading activities that would be disruptive to the management of our mutual fund portfolios, and has rejected numerous orders placed by market timers in the past.
* Prudential Investments LLC, the manager of JennisonDryden mutual funds, and Prudential Investment Management Services LLC, the distributor of the funds, are part of the Investment Management segment of Prudential Financial, Inc. and are separate legal entities from the entity formerly known as Prudential Securities Incorporated, a retail brokerage firm. In February 2003, Prudential Financial and Wachovia Corporation announced they were combining their retail brokerage forces. The transaction was completed in July 2003. Wachovia Corporation has a 62% interest in the new firm, which is now known as Wachovia Securities LLC, and Prudential Financial owns the remaining 38%.
Late trading
The Securities and Exchange Commission requires that orders to purchase or redeem mutual fund shares be received either by the fund or by an intermediary (such as a broker, financial adviser, or 401(k) record keeper) before the time at which the fund calculates its net asset value (normally 4:00 p.m., Eastern time) if they are to receive that day’s price. The policies of our mutual funds do not make and have not made allowances for the practice known as “late trading”.
For more than 40 years we have offered investors quality investment products, financial guidance, and responsive customer service. Today we remain committed to this heritage and to the highest ethical principles in our investment practices.
Sincerely,

Judy A. Rice, President
Jennison Value Fund
Your Fund’s Performance
Fund Objective
The investment objective of the Jennison Value Fund (the Fund) is capital appreciation. There can be no assurance that the Fund will achieve its investment objective.
|
| Cumulative Total Returns1 as of 10/31/03 |
| | | One Year | | | Five Years | | | Ten Years | | | Since Inception2 |
Class A | | 19.97 | % | | 15.97 | % | | 123.87 | % | | 276.49% |
|
Class B | | 19.05 | | | 11.60 | | | 107.63 | | | 316.36 (316.07) |
|
Class C | | 19.05 | | | 11.60 | | | N/A | | | 103.02 |
|
Class Z | | 20.26 | | | 17.44 | | | N/A | | | 78.70 |
|
S&P 500 Index3 | | 20.79 | | | 2.68 | | | 169.59 | | | *** |
|
Russell 1000 Value Index4 | | 22.87 | | | 19.82 | | | 184.91 | | | **** |
|
Lipper Multi-Cap Value Funds Avg.5 | | 24.68 | | | 29.63 | | | 173.78 | | | ***** |
|
| | | | | | | | | | | | |
|
| Average Annual Total Returns1 as of 9/30/03 |
| | | One Year | | | Five Years | | | Ten Years | | | Since Inception2 |
Class A | | 17.31 | % | | 2.46 | % | | 7.61 | % | | 9.43% |
|
Class B | | 17.64 | | | 2.61 | | | 7.36 | | | 8.67 (8.66) |
|
Class C | | 20.42 | | | 2.54 | | | N/A | | | 7.45 |
|
Class Z | | 23.77 | | | 3.78 | | | N/A | | | 7.38 |
|
S&P 500 Index3 | | 24.37 | | | 1.00 | | | 10.04 | | | *** |
|
Russell 1000 Value Index4 | | 24.37 | | | 4.00 | | | 10.37 | | | **** |
|
Lipper Multi-Cap Value Funds Avg.5 | | 24.67 | | | 5.55 | | | 9.83 | | | ***** |
|
Past performance is not indicative of future results. Principal value and investment return will fluctuate so that an investor’s shares, when redeemed, may be worth more or less than their original cost. 1Source: Prudential Investments LLC and Lipper Inc. The cumulative total returns do not take into account applicable sales charges. The average annual total returns do take into account applicable sales charges. Without the distribution and service (12b-1) fee waiver of 0.05% for Class A shares annually, the returns would have been lower. The Fund charges a maximum front-end sales charge of 5% for Class A shares in most circumstances, and a 12b-1 fee of up to 0.30% annually. In some circumstances, Class A shares may not be subject to a front-end sales charge, but may be subject to a 1% contingent deferred sales charge (CDSC) for the first year. Class B shares are subject to a declining CDSC of 5%, 4%, 3%, 2%, 1%, and 1% for the first six years respectively after purchase, and a 12b-1 fee of 1% annually. Approximately seven years after purchase, Class B shares will automatically convert to Class A shares on a quarterly basis. Class C shares are subject to a front-end sales charge of 1%, a CDSC of 1% for shares redeemed within 18 months of purchase, and a 12b-1 fee of 1% annually. Class Z shares are not subject to a sales charge or 12b-1 fee. The returns in the tables above do not reflect the deduction of taxes that a shareholder would pay on fund distributions or following the redemption of fund shares. Without waiver of fees and/or expense subsidization, the Fund’s returns would have been lower, as indicated in parentheses. 2Inception dates: Class A, 1/22/90; Class B, 1/22/87; Class C, 8/1/94; and Class Z, 3/1/96. 3The Standard & Poor’s 500 Composite Stock Price Index (S&P 500 Index) is an unmanaged index of 500 stocks of large U.S. companies. It gives a broad look at how stock prices have performed in the United States. 4The Russell 1000 Value Index is an unmanaged index comprising those securities in the Russell 1000 Index with a lesser-
| 2 | | Visit our website at www.jennisondryden.com |
than-average growth orientation. Companies in this index generally have low price-to-book and price-to-earnings ratios, higher dividend yields, and lower forecasted growth values. 5The Lipper Multi-Cap Value Funds Average (Lipper Average) represents returns based on an average return of all funds in the Lipper Multi-Cap Value Funds category for the periods noted. Funds in the Lipper Average typically have a below-average price-to-earnings ratio, price-to-book ratio, and three-year sales-per-share growth value compared to the S&P SuperComposite 1500 Index. Investors cannot invest directly in an index. The returns for the S&P 500 Index, the Russell 1000 Value Index, and the Lipper Average would be lower if they included the effects of sales charges, operating expenses of a mutual fund, or taxes. Returns for the Lipper Average reflect the deduction of operating expenses of a mutual fund, but not sales charges or taxes. ***S&P 500 Index Since Inception cumulative total returns as of 10/31/03 are 331.35% for Class A, 472.71% for Class B, 169.50% for Class C, and 84.94% for Class Z. S&P 500 Index Since Inception average annual total returns as of 9/30/03 are 10.84% for Class A, 10.67% for Class B, 10.76% for Class C, and 7.66% for Class Z. **** Russell 1000 Value Index Since Inception cumulative total returns as of 10/31/03 are 367.46% for Class A, 508.95% for Class B, 185.18% for Class C, and 102.62% for Class Z. Russell 1000 Value Index Since Inception average annual total returns as of 9/30/03 are 11.46% for Class A, 11.05% for Class B, 11.39% for Class C, and 8.90% for Class Z. *****Lipper Average Since Inception cumulative total returns as of 10/31/03 are 348.91% for Class A, 478.53% for Class B, 171.72% for Class C, and 95.81% for Class Z. Lipper Average Since Inception average annual total returns as of 9/30/03 are 10.83% for Class A, 10.39% for Class B, 10.51% for Class C, and 8.06% for Class Z.
| |
| Five Largest Holdings expressed as a percentage of net assets as of 10/31/03 | | | |
Citigroup, Inc., Diversified Financials | | 4.0 | % |
|
Altria Group Corp., Tobacco | | 2.6 | |
|
XL Capital Ltd. (Class A), Insurance | | 2.3 | |
|
FirstEnergy Corp., Electric Utilities | | 2.3 | |
|
International Paper Co., Paper & Forest Products | | 2.2 | |
|
Holdings are subject to change.
| |
| Five Largest Industries expressed as a percentage of net assets as of 10/31/03 | | | |
Energy Equipment & Instrument | | 9.8 | % |
|
Capital Markets | | 8.3 | |
|
Insurance | | 6.8 | |
|
Media | | 6.3 | |
|
Oil & Gas | | 6.1 | |
|
Industry weightings are subject to change.
Investment Adviser’s Report
Overview
The year was very strong in absolute terms for the Fund, with triple-digit returns for some of our holdings. Although the Fund lagged both its Lipper peer group and the Russell 1000 Value Index, its total return was far in excess of the historical mean for equities. We have spent much of the year waiting for earnings catalysts to materialize, believing that the economic recovery could not rely on continued high consumer-spending levels and record housing starts. However, we maintained our flexibility and took advantage of excessive market sentiment shifts when they presented profit opportunities.
A good example of this flexibility was our opportunistic purchase of technology stocks in 2002. As winter fell, hopes for a robust holiday retail season acting to catalyze industrial production were fervent. However, the ramp-up in orders that preceded the run-up in share prices was ultimately used to fill inventories, and did not herald an increase in end-user demand. In late 2002 and early 2003, we were profitably exiting many of our more cyclical stocks, such as EMC, Cisco, and Applied Materials, before the effects of the weak Christmas selling season soured investor sentiment. Value investors rarely encounter the opportunity to invest in companies like these, and our timely purchases at depressed valuations worked out well.
Subsequently, we redeployed capital into high-quality, strong balance sheet, dividend-paying companies, such as select utilities and large-capitalization pharmaceuticals. These defensive stocks had been overlooked when investors continued to chase the high-flying names that we believed were vulnerable to continued economic uncertainty.
Following the quick equity gains after the war in Iraq, we were concerned that the markets had gotten ahead of themselves, but continued to benefit from many of our holdings in the finance sector, particularly the brokers, many of whom were able to report excellent profits on robust trading activity. By midyear we had become more optimistic about future earnings, encouraged by the fiscal stimuli put in place, and again increased our exposure to the more cyclical names in the Fund.
Benefits from technology
We have mentioned the opportunities presented to us by depressed valuations in many technology stocks going into 2003, and our subsequent profit taking. In addition to those technology names, many of our core technology holdings also performed extremely well. Among our top performers was Agere Systems, a communications chipmaker, which though still unprofitable, narrowed its losses in its second quarter through continued cost cutting and the sale of its optoelectronics
| 4 | | Visit our website at www.jennisondryden.com |
business. Management also expressed continued confidence in its third quarter profitability target, and stated it may exceed its fiscal year revenue targets. Another top performer in technology was Solectron, a contract electronics equipment manufacturer, which rebounded from the effects of a weak fiscal second quarter earnings announcement. Our investment in Solectron was predicated on the ability of its new management to successfully integrate acquisitions made by the firm’s prior management and on the balance sheet strength of the company. Though much of Wall Street reacted negatively and, in our view, myopically to the earnings report (and to the lack of short-term guidance), we believe the investment story remains intact. Customers remain with Solectron, its new CEO is executing the business plan, and liquidity is fine.
Our media companies were strong
In the consumer discretionary sector, News Corp., an international media company controlled by Rupert Murdoch, was among our top performers. News Corp. released a strong fiscal fourth quarter earnings report, and also benefited from the news that Fox Entertainment (81% owned by News Corp.) reported fiscal fourth quarter earnings that were better than expected on the strength of high ratings and rising advertising revenue. “American Idol” and other reality shows have been big hits for the Fox Broadcasting Network, in addition to continued success at the Fox News Channel. News Corp. is waiting for regulatory approval regarding its intent to buy a substantial stake in Hughes Electronics, owner of DirecTV. If approved, the transaction will provide additional distribution strength for the company’s media products. Echostar, a top contributor to the Fund’s return, performed well as investors reacted favorably to its termination of its proposed acquisition of Hughes Electronics. The company also announced a surprise repurchase of over 10% of its outstanding shares from Vivendi Universal, and investors remained focused on Echostar’s strong subscriber growth and expense controls. Echostar’s satellite network continues to add new subscribers at a robust pace, and has enticed viewers away from cable.
Strong markets helped the brokerage firms
Among our top performers was Citigroup (see Comments on Largest Holdings), the world’s largest financial services company. Citigroup’s latest profit report beat expectations on the strength of its mortgage lending, credit card business, and bond underwriting. Recently, positive analyst comments regarding the company’s global growth potential, in addition to Citigroup CEO’s upbeat comments on a strengthening U.S. economy and increasing consumer confidence, have led to gains. Succession issues surrounding the retirement of the CEO, Sanford Weill, have also been handled well by the company, whose new management team, with historical roots in the
company, is respected by the investor community. Strength in the equity and fixed income markets since the March equity lows provided a favorable backdrop for brokerage firms, two of which (Lehman Brothers and Merrill Lynch) performed extremely well for us.
In particular, Merrill reported strong revenues from its bond-trading activities and, coupled with the ongoing effects of the multi-year cost-cutting program at the firm, its largest pretax profit margins in 25 years.
Healthcare hurt performance
The weak performance of some of our healthcare stocks resulted in that sector being the only one to hurt Fund performance during the period. Among the disappointments was HCA, an international hospital management company, which preannounced surprisingly negative earnings. Subsequently, HCA reported that its earnings were short of expectations due to slow admissions caused by a mild flu season, the loss of two large contracts, and falling outpatient business caused by competitive pressures. We took advantage of a rebound in the stock price following the announcement of a large share repurchase (funded by borrowings that we perceived as a negative) to eliminate our position in the company. Tenet Healthcare also performed poorly, missing Wall Street analysts’ first quarter 2003 earnings expectations. Although revenue grew more than expected, there was a large increase in malpractice insurance expense (the company states it was a one-time event) that severely affected reported earnings. Baxter International, a diversified biotechnology company, also fell on the announcement of lowered sales and earnings targets. Prices for Baxter’s plasma protein product have fallen, and healthcare centers’ inventories of the company’s recombinant Factor VIII, a protein-free therapy used in hemophilia treatment, were drawn down by larger-than-expected amounts.
Fund outlook
Currently, we remain overweighted in industrials, basic industries, and the more leveraged energy companies (i.e., oil service) in order to participate in the brighter economic conditions that all the stimuli (lower short-term rates, weaker dollar, faster money growth, greater fiscal spending, and tax cuts) should bring about. Although we like consumer discretionary and technology stocks, we believe a lot of good news has already been discounted in these sectors. Utilities and telecommunications are underweighted because of our view of a lack of specific earnings’ catalysts and a lower sensitivity to improving economic conditions. Lastly, within the financial sector, we have taken a barbelled approach by overweighting insurance and brokerage firms and substantially underweighting banks and consumer finance
| 6 | | Visit our website at www.jennisondryden.com |
companies because of our belief that consumer spending and mortgages will be weak going forward, coming off of peak levels. The result is that we have maintained a net neutral position relative to our value universe, while, compared to the S&P 500 Index, we are more defensive, as is typical.
Jennison Value Fund Management Team
The Portfolio of Investments following this report shows the size of the Fund’s positions at period-end.
Comments on Largest Holdings
Holdings expressed as a percentage of the Fund’s net assets as of 10/31/03.
| 4.0% | Citigroup, Inc./Diversified Financials |
Citigroup is a diversified financial services company that, among other things, provides investment banking, retail brokerage, and corporate banking services.
| 2.6% | Altria Group Corp./Tobacco |
Altria is the parent of Philip Morris International, Philip Morris USA, and Kraft Foods. Altria’s brands include Marlboro cigarettes, Oreo cookies, and Maxwell House coffee.
| 2.3% | XL Capital Ltd./Insurance |
XL Capital is a global insurer that provides, among other products, reinsurance.
| 2.3% | FirstEnergy Corp./Electric Utilities |
FirstEnergy is an Ohio-based public utility holding company. The company is also involved with the exploration and production of oil and natural gas, the transmission and distribution of electricity, and other energy-related services.
| 2.2% | International Paper Co./Paper & Forest Products |
International Paper is producer and global exporter of various products, including printing paper, forest products, and packaging.
Holdings are subject to change.
| 8 | | Visit our website at www.jennisondryden.com |
| Shares | | Description | | Value (Note 1) |
| | | | | | |
LONG-TERM INVESTMENTS 96.0% | | | |
| |
COMMON STOCKS | | | |
| |
Aerospace & Defense 4.2% | | | |
|
| 201,800 | | General Dynamics Corp.(b) | | $ | 16,890,660 |
| 196,200 | | Northrop Grumman Corp. | | | 17,540,280 |
| | | | |
|
|
| | | | | | 34,430,940 |
| |
Capital Markets 8.3% | | | |
|
| 289,400 | | Bank of New York Co., Inc. | | | 9,026,386 |
| 48,100 | | Goldman Sachs Group, Inc. | | | 4,516,590 |
| 285,100 | | J.P. Morgan Chase & Co. | | | 10,235,090 |
| 235,400 | | Lehman Brothers Holdings, Inc. | | | 16,948,800 |
| 296,000 | | Mellon Financial Corp. | | | 8,841,520 |
| 250,900 | | Merrill Lynch & Co., Inc. | | | 14,853,280 |
| 80,100 | | Morgan Stanley | | | 4,395,087 |
| | | | |
|
|
| | | | | | 68,816,753 |
| |
Chemicals 2.0% | | | |
|
| 190,000 | | E.I. du Pont de Nemours & Co. | | | 7,676,000 |
| 710,200 | | IMC Global, Inc.(b) | | | 4,964,298 |
| 270,122 | | Lyondell Chemical Co.(b) | | | 3,862,745 |
| | | | |
|
|
| | | | | | 16,503,043 |
| |
Commercial Banks 0.7% | | | |
|
| 138,600 | | FleetBoston Financial Corp. | | | 5,598,054 |
| |
Commercial Services & Supplies 3.4% | | | |
|
| 539,700 | | Allied Waste Industries, Inc.(a)(b) | | | 6,087,816 |
| 467,700 | | Cendant Corp.(a)(b) | | | 9,555,111 |
| 480,400 | | Waste Management, Inc. | | | 12,451,968 |
| | | | |
|
|
| | | | | | 28,094,895 |
| |
Communications Equipment 1.2% | | | |
|
| 269,500 | | Harris Corp. | | | 10,030,790 |
| |
Computers & Peripherals 1.7% | | | |
|
| 624,221 | | Hewlett-Packard Co. | | | 13,926,370 |
| |
Consumer Finance 0.9% | | | |
|
| 158,900 | | American Express Co. | | | 7,457,177 |
See Notes to Financial Statements
Portfolio of Investments
as of October 31, 2003
Portfolio of Investments
as of October 31, 2003 Cont’d.
| Shares | | Description | | Value (Note 1) |
| | | | | | |
Diversified Financial Services 4.0% | | | |
|
| 699,000 | | Citigroup, Inc. | | $ | 33,132,600 |
| |
Diversified Telecommunication Services 3.8% | | | |
|
| 306,810 | | BellSouth Corp. | | | 8,072,171 |
| 445,400 | | SBC Communications, Inc. | | | 10,680,692 |
| 375,500 | | Verizon Communications, Inc. | | | 12,616,800 |
| | | | |
|
|
| | | | | | 31,369,663 |
| |
Electric Utilities 3.4% | | | |
|
| 550,500 | | FirstEnergy Corp. | | | 18,931,695 |
| 238,600 | | PG&E Corp.(a) | | | 5,833,770 |
| 167,900 | | TXU Corp. | | | 3,831,478 |
| | | | |
|
|
| | | | | | 28,596,943 |
| |
Electronic Equipment & Instruments 0.4% | | | |
|
| 656,200 | | Solectron Corp.(a)(b) | | | 3,635,348 |
| |
Energy Equipment & Services 9.8% | | | |
|
| 273,900 | | Baker Hughes, Inc. | | | 7,740,414 |
| 647,200 | | ENSCO International, Inc.(b) | | | 17,053,720 |
| 672,400 | | GlobalSantaFe Corp.(a)(b) | | | 15,135,724 |
| 676,000 | | Halliburton Co. | | | 16,142,880 |
| 210,600 | | Nabors Industries Ltd.(a) | | | 7,960,680 |
| 285,000 | | Schlumberger Ltd. (Netherlands) | | | 13,386,450 |
| 105,700 | | Weatherford International Ltd. (Bermuda)(a) | | | 3,673,075 |
| | | | |
|
|
| | | | | | 81,092,943 |
| |
Food & Staples Retailing 1.2% | | | |
|
| 578,600 | | The Kroger Co.(a) | | | 10,119,714 |
| |
Food Products 2.3% | | | |
|
| 441,500 | | ConAgra Foods, Inc. | | | 10,525,360 |
| 298,900 | | Kraft Foods, Inc. (Class A)(b) | | | 8,697,990 |
| | | | |
|
|
| | | | | | 19,223,350 |
| |
Health Care Providers & Services 5.1% | | | |
|
| 157,100 | | AmerisourceBergen Corp.(b) | | | 8,918,567 |
| 167,900 | | CIGNA Corp.(b) | | | 9,578,695 |
| 191,300 | | Laboratory Corp. of America Holdings(a)(b) | | | 6,781,585 |
| 310,970 | | Medco Health Solutions, Inc.(a) | | | 10,324,204 |
| 457,900 | | Tenet Healthcare Corp.(a)(b) | | | 6,319,020 |
| | | | |
|
|
| | | | | | 41,922,071 |
See Notes to Financial Statements.
| 10 | | Visit our website at www.jennisondryden.com |
| Shares | | Description | | Value (Note 1) |
| | | | | | |
Hotels Restaurants & Leisure 1.5% | | | |
|
| 512,300 | | McDonald’s Corp. | | $ | 12,812,623 |
| |
Household Products 2.0% | | | |
|
| 318,100 | | Kimberly-Clark Corp. | | | 16,798,861 |
| |
Industrial Conglomerates 1.4% | | | |
|
| 573,800 | | Tyco International Ltd.(b) | | | 11,980,944 |
| |
Insurance 6.8% | | | |
|
| 213,000 | | Allstate Corp. | | | 8,413,500 |
| 278,800 | | Hartford Financial Services Group, Inc.(b) | | | 15,306,120 |
| 520,853 | | Travelers Property Casualty Corp. (Class A) | | | 8,489,904 |
| 292,000 | | UnumProvident Corp. | | | 4,780,040 |
| 278,800 | | XL Capital Ltd. (Class A) | | | 19,376,600 |
| | | | |
|
|
| | | | | | 56,366,164 |
| |
Machinery 0.5% | | | |
|
| 107,300 | | Navistar International Corp.(a)(b) | | | 4,338,139 |
| |
Media 6.3% | | | |
|
| 503,200 | | General Motors Corp. (Class H Stock)(a)(b) | | | 8,267,576 |
| 1,067,000 | | Liberty Media Corp. (Series A)(a) | | | 10,766,030 |
| 183,300 | | New York Times Co. (Class A) | | | 8,712,249 |
| 450,858 | | News Corp. Ltd., ADR (Australia)(a)(b) | | | 13,300,311 |
| 268,100 | | Time Warner, Inc.(a)(b) | | | 4,099,249 |
| 170,700 | | Viacom, Inc. (Class B) | | | 6,805,809 |
| | | | |
|
|
| | | | | | 51,951,224 |
| |
Multiline Retail 0.8% | | | |
|
| 135,600 | | Federated Department Stores, Inc. | | | 6,447,780 |
| |
Office Electronics 1.6% | | | |
|
| 1,229,000 | | Xerox Corp.(a)(b) | | | 12,904,500 |
| |
Oil & Gas 6.1% | | | |
|
| 83,325 | | Apache Corp. | | | 5,809,419 |
| 336,500 | | Exxon Mobil Corp. | | | 12,309,170 |
| 458,500 | | Occidental Petroleum Corp.(b) | | | 16,166,710 |
| 33,800 | | Royal Dutch Petroleum Co. (Netherlands)(a) | | | 1,500,044 |
| 185,300 | | Total S.A., ADR (France)(b) | | | 14,466,371 |
| | | | |
|
|
| | | | | | 50,251,714 |
See Notes to Financial Statements.
Portfolio of Investments
as of October 31, 2003 Cont’d.
| Shares | | Description | | Value (Note 1) |
| | | | | | |
Paper & Forest Products 4.1% | | | |
|
| 218,200 | | Boise Cascade Corp. | | $ | 6,120,510 |
| 380,000 | | Georgia-Pacific Corp.(b) | | | 9,986,400 |
| 461,500 | | International Paper Co.(b) | | | 18,160,025 |
| | | | |
|
|
| | | | | | 34,266,935 |
| |
Pharmaceuticals 4.1% | | | |
|
| 113,900 | | Merck & Co., Inc.(b) | | | 5,040,075 |
| 209,300 | | Novartis A.G., ADR (Switzerland)(a)(b) | | | 8,030,841 |
| 392,720 | | Pfizer, Inc. | | | 12,409,952 |
| 187,419 | | Wyeth | | | 8,272,675 |
| | | | |
|
|
| | | | | | 33,753,543 |
| |
Road & Rail 1.2% | | | |
|
| 156,450 | | Union Pacific Corp.(b) | | | 9,793,770 |
| |
Real Estate 0.9% | | | |
|
| 697,200 | | Host Marriott Corp.(a) | | | 7,285,740 |
| |
Semiconductors & Semiconductor Equipment 0.6% | | | |
|
| 291,500 | | ASML Holding N.V. (Netherlands)(a)(b) | | | 5,115,825 |
| |
Software 0.6% | | | |
|
| 52,100 | | Mentor Graphics Corp.(a) | | | 872,675 |
| 154,500 | | Microsoft Corp. | | | 4,040,175 |
| | | | |
|
|
| | | | | | 4,912,850 |
| |
Specialty Retail 1.9% | | | |
|
| 359,000 | | Limited Brands | | | 6,318,400 |
| 693,500 | | Toys ‘R’ Us, Inc.(a) | | | 9,015,500 |
| | | | |
|
|
| | | | | | 15,333,900 |
| |
Tobacco 3.2% | | | |
|
| 468,500 | | Altria Group, Inc. | | | 21,785,250 |
| 195,900 | | Loews Corp. - Carolina Group(b) | | | 4,907,295 |
| | | | |
|
|
| | | | | | 26,692,545 |
| | | | |
|
|
| | | Total long-term investments (cost $714,484,329) | | | 794,957,711 |
| | | | |
|
|
| |
SHORT-TERM INVESTMENTS 23.0% | | | |
| |
Mutual Fund 23.0% | | | |
|
| | | Dryden Core Investment Fund - Taxable Money Market Series(c) | | | |
| 190,121,979 | | (cost $190,121,979; Note 3) | | $ | 190,121,979 |
| | | | |
|
|
See Notes to Financial Statements.
| 12 | | Visit our website at www.jennisondryden.com |
Principal Amount (000) | | Description | | Value (Note 1) | |
Repurchase Agreement | | | | |
|
| | | State Street Bank & Trust Co. Repurchase Agreement, dated
10/31/03, 0.05%, due 11/3/03(d) | | | | |
| $ 109 | | (cost $109,000) | | $ | 109,000 | |
| | | | |
|
|
|
| | | Total short-term investments (cost $190,230,979) | | | 190,230,979 | |
| | | | |
|
|
|
| | | Total Investments 119.0% | | | | |
| | | (cost $904,715,308; Note 5) | | | 985,188,690 | |
| | | Liabilities in excess of other assets (19.0%) | | | (157,311,365 | ) |
| | | | |
|
|
|
| | | Net Assets 100% | | $ | 827,877,325 | |
| | | | |
|
|
|
| (a) | Non-income producing security. |
| (b) | Security, or portion thereof, on loan, see Note 4. |
| (c) | Represents security, or portion thereof, purchased with cash collateral received for securities on loan. |
| (d) | Repurchase price of $109,000. Collateralized by $110,000 U.S. Treasury Notes with a rate of 3.50%, maturity date of 11/15/06, and aggregate market value, including accrued interest, of $117,025. |
ADR—American Depository Receipt.
See Notes to Financial Statements.
Statement of Assets and Liabilities
as of October 31, 2003
Assets | | | | |
|
Investments, at value including securities on loan of $150,939,659 (cost $904,715,308) | | $ | 985,188,690 | |
Cash | | | 26,835 | |
Receivable for investments sold | | | 7,804,490 | |
Dividends and interest receivable | | | 1,114,635 | |
Receivable for Fund shares sold | | | 219,742 | |
Tax reclaim receivable | | | 36,830 | |
Prepaid expenses and other assets | | | 24,769 | |
| | |
|
|
|
Total assets | | | 994,415,991 | |
| | |
|
|
|
| |
Liabilities | | | | |
|
Payable to broker for collateral for securities on loan (Note 4) | | | 155,901,264 | |
Payable for investments purchased | | | 7,151,667 | |
Payable for Fund shares reacquired | | | 1,910,896 | |
Accrued expenses | | | 862,384 | |
Management fee payable | | | 393,747 | |
Distribution fee payable | | | 318,708 | |
| | |
|
|
|
Total liabilities | | | 166,538,666 | |
| | |
|
|
|
| |
Net Assets | | $ | 827,877,325 | |
| | |
|
|
|
| | | | | |
|
Net assets were comprised of: | | | | |
Shares of beneficial interest, at par | | $ | 573,085 | |
Paid-in capital in excess of par | | | 867,337,618 | |
| | |
|
|
|
| | | | 867,910,703 | |
Undistributed net investment income | | | 4,529,657 | |
Accumulated net realized loss on investments | | | (125,036,417 | ) |
Net unrealized appreciation on investments | | | 80,473,382 | |
| | |
|
|
|
| |
Net assets, October 31, 2003 | | $ | 827,877,325 | |
| | |
|
|
|
See Notes to Financial Statements.
| 14 | | Visit our website at www.jennisondryden.com |
Class A | | | |
|
Net asset value and redemption price per share ($559,230,640 ÷ 38,575,379 shares of beneficial interest issued and outstanding) | | $ | 14.50 |
Maximum sales charge (5% of offering price) | | | .76 |
| | |
|
|
Maximum offering price to public | | $ | 15.26 |
| | |
|
|
| |
Class B | | | |
|
Net asset value, offering price and redemption price per share ($215,038,827 ÷ 15,022,928 shares of beneficial interest issued and outstanding) | | $ | 14.31 |
| | |
|
|
| |
Class C | | | |
|
Net asset value and redemption price per share ($21,267,907 ÷ 1,485,798 shares of beneficial interest issued and outstanding) | | $ | 14.31 |
Sales charge (1% of offering price) | | | .14 |
| | |
|
|
Offering price to public | | $ | 14.45 |
| | |
|
|
| |
Class Z | | | |
|
Net asset value, offering price and redemption price per share ($32,339,951 ÷ 2,224,371 shares of beneficial interest issued and outstanding) | | $ | 14.54 |
| | |
|
|
See Notes to Financial Statements.
Statement of Operations
Year Ended October 31, 2003
Net Investment Income | | | | |
|
Dividends (net of foreign withholding taxes of $60,768) | | $ | 16,032,163 | |
Interest | | | 8,343 | |
Income from securities loaned, (net) | | | 72,187 | |
| | |
|
|
|
Total income | | | 16,112,693 | |
| | |
|
|
|
| |
Expenses | | | | |
Management fee | | | 4,525,462 | |
Distribution fee—Class A | | | 1,324,900 | |
Distribution fee—Class B | | | 2,218,501 | |
Distribution fee—Class C | | | 220,076 | |
Transfer agent’s fees and expenses | | | 1,659,000 | |
Reports to shareholders | | | 453,000 | |
Custodian’s fees and expenses | | | 184,000 | |
Registration fees | | | 74,000 | |
Legal fees and expenses | | | 50,000 | |
Audit fee | | | 28,000 | |
Trustees’ fees | | | 21,000 | |
Insurance | | | 14,000 | |
Miscellaneous | | | 15,252 | |
| | |
|
|
|
Total expenses | | | 10,787,191 | |
| | |
|
|
|
Net investment income | | | 5,325,502 | |
| | |
|
|
|
| |
Realized And Unrealized Gain (Loss) On Investments | | | | |
|
Net realized loss on investment transactions | | | (30,625,296 | ) |
Net change in unrealized appreciation on investments | | | 169,812,824 | |
| | |
|
|
|
Net gain on investments | | | 139,187,528 | |
| | |
|
|
|
Net Increase In Net Assets Resulting From Operations | | $ | 144,513,030 | |
| | |
|
|
|
See Notes to Financial Statements.
| 16 | | Visit our website at www.jennisondryden.com |
Statement of Changes in Net Assets
| |
| | | Year Ended October 31,
| |
| | | 2003 | | | 2002 | |
Increase (Decrease) In Net Assets | | | | | | | | |
|
Operations | | | | | | | | |
Net investment income | | $ | 5,325,502 | | | $ | 5,426,340 | |
Net realized loss on investments and foreign currency transactions | | | (30,625,296 | ) | | | (90,774,290 | ) |
Net change in unrealized appreciation (depreciation) of investments | | | 169,812,824 | | | | (89,288,445 | ) |
| | |
|
|
| |
|
|
|
Net increase (decrease) in net assets resulting from operations | | | 144,513,030 | | | | (174,636,395 | ) |
| | |
|
|
| |
|
|
|
Dividends and distributions (Note 1) | | | | | | | | |
Dividends from net investment income | | | | | | | | |
Class A | | | (3,629,646 | ) | | | (4,302,044 | ) |
Class Z | | | (313,603 | ) | | | (562,409 | ) |
| | |
|
|
| |
|
|
|
| | | | (3,943,249 | ) | | | (4,864,453 | ) |
| | |
|
|
| |
|
|
|
Distributions from net realized gains | | | | | | | | |
Class A | | | — | | | | (63,947,693 | ) |
Class B | | | — | | | | (37,197,176 | ) |
Class C | | | — | | | | (2,861,741 | ) |
Class Z | | | — | | | | (5,853,100 | ) |
| | |
|
|
| |
|
|
|
| | | | — | | | | (109,859,710 | ) |
| | |
|
|
| |
|
|
|
Fund share transactions (net of share conversions) (Note 6) | | | | | | | | |
Proceeds from shares sold | | | 62,772,981 | | | | 144,192,974 | |
Net asset value of shares issued in reinvestment of dividends and distributions | | | 3,644,984 | | | | 107,139,107 | |
Cost of shares reacquired | | | (191,763,212 | ) | | | (328,410,307 | ) |
| | |
|
|
| |
|
|
|
Net decrease in net assets from Fund share transactions | | | (125,345,247 | ) | | | (77,078,226 | ) |
| | |
|
|
| |
|
|
|
Total increase (decrease) | | | 15,224,534 | | | | (366,438,784 | ) |
| | |
Net Assets | | | | | | | | |
|
Beginning of year | | | 812,652,791 | | | | 1,179,091,575 | |
| | |
|
|
| |
|
|
|
End of year(a) | | $ | 827,877,325 | | | $ | 812,652,791 | |
| | |
|
|
| |
|
|
|
(a) Includes undistributed net investment income of | | $ | 4,529,657 | | | $ | 3,944,025 | |
| | |
|
|
| |
|
|
|
See Notes to Financial Statements.
Notes to Financial Statements
Jennison Value Fund (the “Fund”), formerly known as Prudential Value Fund, is registered under the Investment Company Act of 1940 as a diversified, open-end, management investment company. The investment objective of the Fund is capital appreciation. It seeks to achieve this objective by investing primarily in common stocks and convertible securities that provide investment income returns above those of the Standard & Poor’s 500 Composite Stock Price Index or the NYSE Composite Index.
Note 1. Accounting Policies
The following is a summary of significant accounting policies followed by the Fund in the preparation of its financial statements.
Securities Valuation: Securities listed on a securities exchange are valued at the last sales price on such exchange on the day of valuation or, if there was no sale on such day, at the mean between the last reported bid and asked prices, or at the last bid price on such day in the absence of an asked price. Securities traded via Nasdaq are valued at the official closing price provided by Nasdaq. Securities that are actively traded in the over-the-counter market, including listed securities for which the primary market is believed by Prudential Investments LLC (“PI” or “Manager”) in consultation with the subadvisor, to be over-the-counter are valued at market value using prices provided by an independent pricing agent or principal market maker. Futures contracts and options thereon traded on a commodities exchange or board of trade are valued at the last sale price at the close of trading on such exchange or board of trade or, if there was no sale on the applicable commodities exchange or board of trade on such day, at the mean between the most recently quoted prices on such exchange or board of trade or at the last bid price in the absence of an asked price. Prices may be obtained from independent pricing services which use information provided by market makers or estimates of market values obtained from yield data relating to investments or securities with similar characteristics. Securities for which reliable market quotations are not readily available, or whose values have been affected by events occurring after the close of the security’s foreign market and before the Fund’s normal pricing time, are valued at fair value in accordance with Board of Trustees’ approved fair valuation procedures.
Investments in mutual funds are valued at their net asset value as of the close of the New York Stock Exchange on the date of valuation.
| 18 | | Visit our website at www.jennisondryden.com |
Short-term securities which mature in 60 days or less are valued at amortized cost, which approximates market value. The amortized cost method includes valuing a security at its cost on the date of purchase and thereafter assuming a constant amortization to maturity of the difference between the principal amount due at maturity and cost. Short-term securities which mature in more than 60 days are valued at current market quotations.
Repurchase Agreements: In connection with transactions in repurchase agreements with United States financial institutions, it is the Fund’s policy that its custodian or designated subcustodians under triparty repurchase agreements, as the case may be, take possession of the underlying collateral securities, the value of which exceeds the principal amount of the repurchase transaction, including accrued interest. To the extent that any repurchase transaction exceeds one business day, the value of the collateral is marked to market on a daily basis to ensure the adequacy of the collateral. If the seller defaults and the value of the collateral declines or if bankruptcy proceedings are commenced with respect to the seller of the security, realization of the collateral by the Fund may be delayed or limited.
Foreign Currency Translation: The books and records of the Fund are maintained in U.S. dollars. Foreign currency amounts are translated into U.S. dollars on the following basis:
(i) market value of investment securities, other assets and liabilities—at the current rates of exchange;
(ii) purchases and sales of investment securities, income and expenses—at the rates of exchange prevailing on the respective dates of such transactions.
Although the net assets of the Fund are presented at the foreign exchange rates and market values at the close of the fiscal year, the Fund does not isolate that portion of the results of operations arising as a result of changes in the foreign exchange rates from the fluctuations arising from changes in the market prices of long term securities held at the end of the fiscal year. Similarly, the Fund does not isolate the effect of changes in foreign exchange rates from the fluctuations arising from changes in the market prices of portfolio securities sold during the fiscal year. Accordingly, realized foreign currency gains or losses are included in the reported net realized gains or losses on investment transactions.
Net realized gains or losses on foreign currency transactions represent net foreign exchange gains or losses from the holding of foreign currencies, currency gains or losses realized between the trade and settlement dates on security transactions, and
Notes to Financial Statements
Cont’d
the difference between the amounts of dividends, interest and foreign withholding taxes recorded on the Fund’s books and the U.S. dollar equivalent amounts actually received or paid. Net unrealized currency gains or losses from valuing foreign currency denominated assets and liabilities (other than investments) at year end exchange rates are reflected as a component of net unrealized appreciation (depreciation) on foreign currencies.
Foreign security and currency transactions may involve certain considerations and risks not typically associated with those of domestic origin as a result of, among other factors, the possibility of political or economic instability or the level of governmental supervision and regulation of foreign securities markets.
Securities Transactions and Net Investment Income: Securities transactions are recorded on the trade date. Realized gains or losses from investment and currency transactions are calculated on the identified cost basis. Dividend income is recorded on the ex-dividend date and interest income, including amortization of premium and accretion of discount on debt securities, as required, is recorded on an accrual basis. Expenses are recorded on the accrual basis which may require the use of certain estimates by management.
Net investment income or loss, (other than distribution fees, which are charged directly to the respective class) and unrealized and realized gains or losses are allocated daily to each class of shares based upon the relative proportion of net assets of each class at the beginning of the day.
Taxes: For federal income tax purposes, it is the Fund’s policy to continue to meet the requirements under the Internal Revenue Code applicable to regulated investment companies and to distribute all of its taxable net income and capital gains, if any, to shareholders. Therefore, no federal income tax provision is required.
Withholding taxes on foreign dividends are recorded net of reclaimable amounts, at the time the related income is earned.
Dividends and Distributions: The Fund expects to pay dividends of net investment income and distributions of net realized capital and currency gains, if any, annually. Dividends and distributions to shareholders, which are determined in accordance
| 20 | | Visit our website at www.jennisondryden.com |
with federal income tax regulations and which may differ from generally accepted accounting principles, are recorded on the ex-dividend date.
Securities Lending: The Fund may lend its portfolio securities to broker-dealers. The loans are secured by collateral, at least equal, at all times to the market value of the securities loaned. Loans are subject to termination at the option of the borrower or the Fund. Upon termination of the loan, the borrower will return to the lender securities identical to the loaned securities. Should the borrower of the securities fail financially, the Fund has the right to repurchase the securities using the collateral in the open market. The Fund recognizes income, net of any rebate and securities lending agent fees, for lending its securities in the form of fees or interest on the investment of any cash received as collateral. The Fund also continues to receive interest and dividends or amounts equivalent thereto, on the securities loaned and recognizes any unrealized gain or loss in the market price of the securities loaned that may occur during the term of the loan.
Note 2. Agreements
The Fund has a management agreement with PI. Pursuant to this agreement, PI has responsibility for all investment advisory services and supervises the subadvisors’ performance of such service. Effective December 12, 2002, PI has entered into a subadvisory agreement with Jennison Associates LLC (“Jennison”), with Jennison managing 100% of assets. The subadvisory agreement provides that Jennison furnishes investment advisory services in connection with the management of the Fund. In connection therewith, Jennison assumes the day-to-day management responsibilities of the Fund and is obligated to keep certain books and records of the Fund. PI pays for the services of Jennison, the cost of compensation of officers and employees of the Fund, occupancy and certain clerical and bookkeeping costs of the Fund. The Fund bears all other costs and expenses.
Prior to December 12, 2002, PI had subadvisory agreements with Jennison, Deutsche Asset Management Inc. (“Deutsche”) and Victory Capital Management, Inc. (“Victory”), with Deutsche and Victory each managing approximately 25% of assets and Jennison retaining approximately half of the assets.
The management fee paid to PI is computed daily and payable monthly at an annual rate of .60 of 1% of the Fund’s average daily net assets up to $500 million, .50 of 1% of the next $500 million, .475 of 1% of the next $500 million and .45 of 1% of the average daily net assets in excess of $1.5 billion.
Notes to Financial Statements
Cont’d
The Fund has a distribution agreement with Prudential Investment Management Services LLC (“PIMS”), which acts as the distributor of the Class A, Class B, Class C and Class Z shares. The Fund compensates PIMS for distributing and servicing the Fund’s Class A, Class B and Class C shares, pursuant to plans of distribution (the “Class A, B and C Plans”), regardless of expenses actually incurred. The distribution fees are accrued daily and payable monthly. No distribution or service fees are paid to PIMS as distributor of the Class Z shares of the Fund.
Pursuant to the Class A, B and C Plans, the Fund compensates PIMS for distribution-related activities at an annual rate of up to .30 of 1%, 1% and 1%, of the average daily net assets of the Class A, B and C shares, respectively. For the year ended October 31, 2003, PIMS contractually agreed to limit such fees to .25 of 1% of the average daily net assets of the Class A shares.
PIMS has advised the Fund that it has received approximately $116,900 and $6,900 in front-end sales charges resulting from sales of Class A shares and Class C shares, respectively, during the year ended October 31, 2003. From these fees, PIMS paid such sales charges to affiliated broker-dealers, which in turn paid commissions to salespersons and incurred other distribution costs.
PIMS has advised the Fund that for the year ended October 31, 2003, it received approximately $326,300 and $2,400 in contingent deferred sales charges imposed upon certain redemptions by Class B and Class C shareholders, respectively.
PI, PIMS and Jennison are indirect, wholly-owned subsidiaries of Prudential Financial, Inc. (“Prudential”).
The Fund, along with other affiliated registered investment companies (the “Funds”), is a party to a syndicated credit agreement (“SCA”) with a group of banks. The SCA provided for a commitment of $800 million and allows the Funds to increase the commitment to $1 billion, if necessary. Interest on any borrowings will be incurred at market rates. The Funds pay a commitment fee of .08 of 1% of the unused portion of the SCA. The commitment fee is accrued and paid quarterly and is allocated to the Funds pro rata, based on net assets. The purpose of the SCA is to serve as an alternative source of funding for capital share redemptions. The expiration date of the SCA was May 2, 2003. On May 2, 2003, the SCA was renewed under the same terms and conditions (“May 2003 renewal”). The expiration date of the May 2003 renewal
| 22 | | Visit our website at www.jennisondryden.com |
is April 30, 2004. The Fund did not borrow any amounts pursuant to the SCA during the year ended October 31, 2003.
Note 3. Other Transactions with Affiliates
Prudential Mutual Fund Services LLC (“PMFS”), an affiliate of PI and an indirect, wholly-owned subsidiary of Prudential, serves as the Fund’s transfer agent. During the year ended October 31, 2003, the Fund incurred fees of approximately $1,179,400 for the services of PMFS. As of October 31, 2003, approximately $92,900 of such fees were due to PMFS. Transfer agent fees and expenses in the Statement of Operations include certain out-of-pocket expenses paid to non-affiliates, where applicable.
The Fund pays networking fees to affiliated and unaffiliated broker/dealers. These networking fees are payments made to broker/dealers that clear mutual fund transactions through a national clearing system. The Fund incurred approximately $149,700 in total networking fees, of which the amount relating to the services of Wachovia Securities, LLC. (“Wachovia”) and Prudential Securities, Inc. (“PSI”), affiliates of PI, was approximately $124,300 for the year ended October 31, 2003. Effective July 1, 2003, Prudential and Wachovia Corp. formed a joint venture (“Wachovia Securities, LLC”) whereby Prudential and Wachovia Corp. combined their brokerage business with Prudential holding a minority interest. Prior to July 1, 2003, PSI was an indirect, wholly-owned subsidiary of Prudential. As of October 31, 2003, approximately $9,600 of such fees were due to Wachovia. These amounts are included in transfer agent’s fees and expenses in the Statement of Operations.
PSI was the securities lending agent for the Fund. Effective July 1, 2003, Prudential Investment Management, Inc. (“PIM”), an indirect, wholly-owned subsidiary of Prudential, became the Fund’s securities lending agent. For the year ended October 31, 2003, PSI and PIM have been compensated approximately $13,800 and $10,200 for these services, respectively.
The Fund invests in the Taxable Money Market Series (the “portfolio”), a portfolio of Dryden Core Investment Fund, formerly Prudential Core Investment Fund, pursuant to an exemptive order received from the Securities and Exchange Commission. The portfolio is a money market mutual fund registered under the Investment Company Act of 1940, as amended, and managed by PI. During the year ended October 31, 2003, the Fund earned income portfolio of approximately $576,200 and 72,200, from the portfolio, by investing its excess cash and collateral received from securities lending, respectively.
Notes to Financial Statements
Cont’d
Note 4. Portfolio Securities
Purchases and sales of investment securities, other than short-term investments, for the year ended October 31, 2003 were $738,690,587 and $862,873,144, respectively.
As of October 31, 2003, the Fund had securities on loan with an aggregate market value of $150,939,659. The Fund received $155,901,264 in cash as collateral for securities on loan which was used to purchase highly liquid short-term investments in accordance with the Fund’s securities lending procedures.
Note 5. Distributions and Tax Information
Distributions to shareholders, which are determined in accordance with federal income tax regulations and which may differ from generally accepted accounting principles, are recorded on the ex-dividends date. In order to present undistributed net investment income (loss) and accumulated net realized gains (losses) on the Statement of Assets and Liabilities that more closely represent their tax character, certain adjustments have been made to paid-in-capital in excess of par, undistributed net investment income (loss) and accumulated net realized gain (loss) on investment. For the year ended October 31, 2003, the adjustments were to decrease undistributed net investment income and increase paid-in-capital in excess of par by $796,621 primarily for redemptions utilized as distributions for federal income tax purposes and other tax adjustments. Net investment income, net realized losses and net assets were not affected by this change.
For the year ended October 31, 2003, the tax character of dividends paid as reflected in the Statements of Changes in Net Assets, was $3,943,249 of ordinary income.
For the year ended October 31, 2002, the tax character of dividends paid as reflected in the Statements of Changes in Net Assets was $4,864,453 of ordinary income and $109,859,710 of long-term capital gains.
As of October 31, 2003, the accumulated undistributed earnings on tax basis consisted of $4,529,657 of ordinary income. As of October 31, 2003, the Fund had a capital loss carryforward for federal income tax purposes of approximately $119,100,000 which $84,270,000 expires in 2010 and $34,830,000 expires in 2011.
| 24 | | Visit our website at www.jennisondryden.com |
Accordingly, no capital gains distribution is expected to be paid to shareholders until net gains have been realized in excess of such carryforward. The income tax basis differs from the amount on the Statement of Assets and Liabilities primarily due to the deferral of wash sale losses.
The United States federal income tax basis of the Fund’s investments and the net unrealized appreciation as of October 31, 2003 were as follows:
Tax Basis
| | Appreciation
| | Depreciation
| | Total Net Unrealized Appreciation
|
| $910,651,312 | | $97,845,332 | | $23,307,954 | | $74,537,378 |
The difference between book basis is primarily attributable to the difference in the treatment of wash sale losses for book and tax purposes.
Note 6. Capital
The Fund offers Class A, Class B, Class C and Class Z shares. Class A shares are sold with a front-end sales charge of up to 5%. In some limited circumstances, Class A shares may not be subject to a front-end sales charge but may be subject to a 1% contingent deferred sales charge for the first year. Class B shares are sold with a contingent deferred sales charge which declines from 5% to zero depending on the period of time the shares are held. Class C shares are sold with a front-end sales charge of 1% and a contingent deferred sales charge of 1% during the first 18 months. Class B shares will automatically convert to Class A shares on a quarterly basis approximately seven years after purchase. A special exchange privilege is also available for shareholders who qualify to purchase Class A shares at net asset value . Class Z shares are not subject to any sales or redemption charge and are offered exclusively for sale to a limited group of investors.
The Fund has authorized an unlimited number of shares of beneficial interest at $.01 par value divided into four classes, designated Class A, Class B, Class C and Class Z.
Notes to Financial Statements
Cont’d
Transactions in shares of beneficial interest were as follows:
Class A
| | Shares
| | | Amount
| |
Year ended October 31, 2003: | | | | | | | |
Shares sold | | 2,635,292 | | | $ | 34,253,797 | |
Shares issued in reinvestment of dividends and distributions | | 265,713 | | | | 3,337,361 | |
Shares reacquired | | (9,578,707 | ) | | | (124,472,694 | ) |
| | |
|
| |
|
|
|
Net increase (decrease) in shares outstanding before conversion | | (6,677,702 | ) | | | (86,881,536 | ) |
Shares issued upon conversion from Class B | | 2,792,347 | | | | 36,258,030 | |
| | |
|
| |
|
|
|
Net increase (decrease) in shares outstanding | | (3,885,355 | ) | | $ | (50,623,506 | ) |
| | |
|
| |
|
|
|
Year ended October 31, 2002: | | | | | | | |
Shares sold | | 5,260,561 | | | $ | 79,965,297 | |
Shares issued in reinvestment of dividends and distributions | | 4,041,024 | | | | 62,797,511 | |
Shares reacquired | | (13,615,945 | ) | | | (198,415,787 | ) |
| | |
|
| |
|
|
|
Net increase (decrease) in shares outstanding before conversion | | (4,314,360 | ) | | | (55,652,979 | ) |
Shares issued upon conversion from Class B | | 3,857,723 | | | | 57,299,651 | |
| | |
|
| |
|
|
|
Net increase (decrease) in shares outstanding | | (456,637 | ) | | $ | 1,646,672 | |
| | |
|
| |
|
|
|
Class B
| | | | | | |
Year ended October 31, 2003: | | | | | | | |
Shares sold | | 1,162,472 | | | $ | 14,927,550 | |
Shares reacquired | | (3,444,354 | ) | | | (43,646,519 | ) |
| | |
|
| |
|
|
|
Net increase (decrease) in shares outstanding before conversion | | (2,281,882 | ) | | | (28,718,969 | ) |
Shares reacquired upon conversion into Class A | | (2,818,382 | ) | | | (36,258,030 | ) |
| | |
|
| |
|
|
|
Net increase (decrease) in shares outstanding | | (5,100,264 | ) | | $ | (64,976,999 | ) |
| | |
|
| |
|
|
|
Year ended October 31, 2002: | | | | | | | |
Shares sold | | 2,348,863 | | | $ | 34,521,419 | |
Shares issued in reinvestment of dividends and distributions | | 2,277,194 | | | | 35,228,187 | |
Shares reacquired | | (5,471,858 | ) | | | (75,693,521 | ) |
| | |
|
| |
|
|
|
Net increase (decrease) in shares outstanding before conversion | | (845,801 | ) | | | (5,943,915 | ) |
Shares reacquired upon conversion into Class A | | (3,888,117 | ) | | | (57,299,651 | ) |
| | |
|
| |
|
|
|
Net increase (decrease) in shares outstanding | | (4,733,918 | ) | | $ | (63,243,566 | ) |
| | |
|
| |
|
|
|
| 26 | | Visit our website at www.jennisondryden.com |
Class C
| | Shares
| | | Amount
| |
Year ended October 31, 2003: | | | | | | | |
Shares sold | | 334,634 | | | $ | 4,302,731 | |
Shares reacquired | | (739,544 | ) | | | (9,645,475 | ) |
| | |
|
| |
|
|
|
Net increase (decrease) in shares outstanding | | (404,910 | ) | | $ | (5,342,744 | ) |
| | |
|
| |
|
|
|
Year ended October 31, 2002: | | | | | | | |
Shares sold | | 560,206 | | | $ | 7,855,437 | |
Shares issued in reinvestment of dividends and distributions | | 182,198 | | | | 2,818,597 | |
Shares reacquired | | (764,351 | ) | | | (10,528,977 | ) |
| | |
|
| |
|
|
|
Net increase (decrease) in shares outstanding | | (21,947 | ) | | $ | 145,057 | |
| | |
|
| |
|
|
|
Class Z
| | | | | | |
Year ended October 31, 2003: | | | | | | | |
Shares sold | | 715,633 | | | $ | 9,288,903 | |
Shares issued in reinvestment of dividends and distributions | | 24,473 | | | | 307,623 | |
Shares reacquired | | (1,079,306 | ) | | | (13,998,524 | ) |
| | |
|
| |
|
|
|
Net increase (decrease) in shares outstanding | | (339,200 | ) | | $ | (4,401,998 | ) |
| | |
|
| |
|
|
|
Year ended October 31, 2002: | | | | | | | |
Shares sold | | 1,471,778 | | | $ | 21,850,821 | |
Shares issued in reinvestment of dividends and distributions | | 404,551 | | | | 6,294,812 | |
Shares reacquired | | (3,177,415 | ) | | | (43,772,022 | ) |
| | |
|
| |
|
|
|
Net increase (decrease) in shares outstanding | | (1,301,086 | ) | | $ | (15,626,389 | ) |
| | |
|
| |
|
|
|
Financial Highlights
| |
| | | Class A
| |
| | | Year Ended
October 31, 2003(c) | |
|
Per Share Operating Performance: | | | | |
Net Asset Value, Beginning Of Year | | $ | 12.17 | |
| | |
|
|
|
Income From Investment Operations: | | | | |
Net investment income | | | .11 | |
Net realized and unrealized gain (loss) on investment transactions | | | 2.31 | |
| | |
|
|
|
Total from investment operations | | | 2.42 | |
| | |
|
|
|
Less Distributions: | | | | |
Dividends from net investment income | | | (.09 | ) |
Dividends in excess of net investment income | | | — | |
Distributions from net realized gains | | | — | |
| | |
|
|
|
Total distributions | | | (.09 | ) |
| | |
|
|
|
Net asset value, end of year | | $ | 14.50 | |
| | |
|
|
|
Total Return(a): | | | 19.97 | % |
Ratios/Supplemental Data: | | | | |
Net assets, end of year (000) | | $ | 559,230 | |
Average net assets (000) | | $ | 529,960 | |
Ratios to average net assets: | | | | |
Expenses, including distribution and service (12b-1) fees(b) | | | 1.12 | % |
Expenses, excluding distribution and service (12b-1) fees | | | .87 | % |
Net investment income | | | .88 | % |
For Class A, B, C and Z shares: | | | | |
Portfolio turnover rate | | | 97 | % |
| (a) | Total return of shares does not consider the effects of sales loads. Total return is calculated assuming a purchase of shares on the first day and a sale on the last day of each year reported and includes reinvestment of dividends and distributions. |
| (b) | The distributor of the Fund contractually agreed to limit its distribution and service (12b-1) fees to .25 of 1% of the average net assets of the Class A shares. |
| (c) | Calculated based upon average shares outstanding during the year. |
See Notes to Financial Statements.
| 28 | | Visit our website at www.jennisondryden.com |
|
| Class A | |
|
| Year Ended October 31, | |
|
| 2002(c) | | | 2001 | | | 2000 | | | 1999 | |
|
| | | | | | | | | | | | | | | |
| $ | 16.09 | | | $ | 18.49 | | | $ | 18.12 | | | $ | 18.63 | |
|
|
| |
|
|
| |
|
|
| |
|
|
|
| | | | | | | | | | | | | | | |
| | .11 | | | | .16 | | | | .31 | | | | .33 | |
| | (2.43 | ) | | | (1.22 | ) | | | 2.49 | | | | .58 | |
|
|
| |
|
|
| |
|
|
| |
|
|
|
| | (2.32 | ) | | | (1.06 | ) | | | 2.80 | | | | .91 | |
|
|
| |
|
|
| |
|
|
| |
|
|
|
| | | | | | | | | | | | | | | |
| | (.10 | ) | | | (.12 | ) | | | (.25 | ) | | | (.33 | ) |
| | — | | | | — | | | | — | | | | (.03 | ) |
| | (1.50 | ) | | | (1.22 | ) | | | (2.18 | ) | | | (1.06 | ) |
|
|
| |
|
|
| |
|
|
| |
|
|
|
| | (1.60 | ) | | | (1.34 | ) | | | (2.43 | ) | | | (1.42 | ) |
|
|
| |
|
|
| |
|
|
| |
|
|
|
| $ | 12.17 | | | $ | 16.09 | | | $ | 18.49 | | | $ | 18.12 | |
|
|
| |
|
|
| |
|
|
| |
|
|
|
| | (16.56 | )% | | | (6.21 | )% | | | 17.60 | % | | | 5.03 | % |
| | | | | | | | | | | | | | | |
| $ | 516,702 | | | $ | 690,433 | | | $ | 634,991 | | | $ | 619,469 | |
| $ | 657,772 | | | $ | 714,431 | | | $ | 571,048 | | | $ | 653,798 | |
| | | | | | | | | | | | | | | |
| | 1.04 | % | | | 1.08 | % | | | 1.16 | % | | | 1.02 | % |
| | .79 | % | | | .83 | % | | | .91 | % | | | .77 | % |
| | .74 | % | | | .83 | % | | | 1.83 | % | | | 1.71 | % |
| | | | | | | | | | | | | | | |
| | 72 | % | | | 179 | % | | | 64 | % | | | 17 | % |
See Notes to Financial Statements
Financial Highlights
Cont’d
| |
| | | Class B
| |
| | | Year Ended
October 31, 2003(c) | |
|
Per Share Operating Performance: | | | | |
Net Asset Value, Beginning Of Year | | $ | 12.02 | |
| | |
|
|
|
Income From Investment Operations: | | | | |
Net investment income | | | .02 | |
Net realized and unrealized gain (loss) on investment transactions | | | 2.27 | |
| | |
|
|
|
Total from investment operations | | | 2.29 | |
| | |
|
|
|
Less Distributions: | | | | |
Dividends from net investment income | | | — | |
Dividends in excess of net investment income | | | — | |
Distributions from net realized gains | | | — | |
| | |
|
|
|
Total distributions | | | — | |
| | |
|
|
|
Net asset value, end of year | | $ | 14.31 | |
| | |
|
|
|
Total Return(a): | | | 19.05 | % |
Ratios/Supplemental Data: | | | | |
Net assets, end of year (000) | | $ | 215,039 | |
Average net assets (000) | | $ | 221,850 | |
Ratios to average net assets: | | | | |
Expenses, including distribution and service (12b-1) fees | | | 1.87 | % |
Expenses, excluding distribution and service (12b-1) fees | | | .87 | % |
Net investment income (loss) | | | .13 | % |
| (a) | Total return does not consider the effects of sales loads. Total return is calculated assuming a purchase of shares on the first day and a sale on the last day of each year reported and includes reinvestment of dividends and distributions. |
| (b) | Less than $.005 per share. |
| (c) | Calculated based upon average shares outstanding during the year. |
See Notes to Financial Statements
| 30 | | Visit our website at www.jennisondryden.com |
|
| Class B | |
|
| Year Ended October 31, | |
|
| 2002(c) | | | 2001 | | | 2000 | | | 1999 | |
|
| | | | | | | | | | | | | | | |
| $ | 15.92 | | | $ | 18.38 | | | $ | 18.06 | | | $ | 18.57 | |
|
|
| |
|
|
| |
|
|
| |
|
|
|
| | | | | | | | | | | | | | | |
| | — | (b) | | | .03 | | | | .20 | | | | .19 | |
| | (2.40 | ) | | | (1.22 | ) | | | 2.46 | | | | .58 | |
|
|
| |
|
|
| |
|
|
| |
|
|
|
| | (2.40 | ) | | | (1.19 | ) | | | 2.66 | | | | .77 | |
|
|
| |
|
|
| |
|
|
| |
|
|
|
| | | | | | | | | | | | | | | |
| | — | | | | (.05 | ) | | | (.16 | ) | | | (.19 | ) |
| | — | | | | — | | | | — | | | | (.03 | ) |
| | (1.50 | ) | | | (1.22 | ) | | | (2.18 | ) | | | (1.06 | ) |
|
|
| |
|
|
| |
|
|
| |
|
|
|
| | (1.50 | ) | | | (1.27 | ) | | | (2.34 | ) | | | (1.28 | ) |
|
|
| |
|
|
| |
|
|
| |
|
|
|
| $ | 12.02 | | | $ | 15.92 | | | $ | 18.38 | | | $ | 18.06 | |
|
|
| |
|
|
| |
|
|
| |
|
|
|
| | (17.21 | )% | | | (6.93 | )% | | | 16.71 | % | | | 4.25 | % |
| | | | | | | | | | | | | | | |
| $ | 241,923 | | | $ | 395,833 | | | $ | 639,755 | | | $ | 1,006,346 | |
| $ | 347,114 | | | $ | 529,705 | | | $ | 778,722 | | | $ | 1,200,663 | |
| | | | | | | | | | | | | | | |
| | 1.79 | % | | | 1.83 | % | | | 1.91 | % | | | 1.77 | % |
| | .79 | % | | | .83 | % | | | .91 | % | | | .77 | % |
| | (.01 | )% | | | .12 | % | | | 1.13 | % | | | .98 | % |
See Notes to Financial Statements
Financial Highlights
Cont’d
| |
| | | Class C
| |
| | | Year Ended
October 31, 2003(d) | |
|
Per Share Operating Performance: | | | | |
Net Asset Value, Beginning Of Year | | $ | 12.02 | |
| | |
|
|
|
Income From Investment Operations: | | | | |
Net investment income | | | .02 | |
Net realized and unrealized gain (loss) on investment transactions | | | 2.27 | |
| | |
|
|
|
Total from investment operations | | | 2.29 | |
| | |
|
|
|
Less Distributions: | | | | |
Dividends from net investment income | | | — | |
Dividends in excess of net investment income | | | — | |
Distributions from net realized gains | | | — | |
| | |
|
|
|
Total distributions | | | — | |
| | |
|
|
|
Net asset value, end of year | | $ | 14.31 | |
| | |
|
|
|
Total Return(a): | | | 19.05 | % |
Ratios/Supplemental Data: | | | | |
Net assets, end of year (000) | | $ | 21,268 | |
Average net assets (000) | | $ | 22,008 | |
Ratios to average net assets: | | | | |
Expenses, including distribution and service (12b-1) fees | | | 1.87 | % |
Expenses, excluding distribution and service (12b-1) fees | | | .87 | % |
Net investment income | | | .13 | % |
| (a) | Total return does not consider the effects of sales loads. Total return is calculated assuming a purchase of shares on the first day and a sale on the last day of each year reported and includes reinvestment of dividends and distributions. |
| (b) | Less than $.005 per share. |
| (d) | Calculated based upon average shares outstanding during the year. |
See Notes to Financial Statements
| 32 | | Visit our website at www.jennisondryden.com |
|
| Class C | |
|
| Year Ended October 31, | |
|
| 2002(d) | | | 2001 | | | 2000 | | | 1999 | |
|
| | | | | | | | | | | | | | | |
| $ | 15.92 | | | $ | 18.38 | | | $ | 18.06 | | | $ | 18.57 | |
|
|
| |
|
|
| |
|
|
| |
|
|
|
| | | | | | | | | | | | | | | |
| | — | (b) | | | .02 | | | | .19 | | | | .19 | |
| | (2.40 | ) | | | (1.21 | ) | | | 2.47 | | | | .58 | |
|
|
| |
|
|
| |
|
|
| |
|
|
|
| | (2.40 | ) | | | (1.19 | ) | | | 2.66 | | | | .77 | |
|
|
| |
|
|
| |
|
|
| |
|
|
|
| | | | | | | | | | | | | | | |
| | — | | | | (.05 | ) | | | (.16 | ) | | | (.19 | ) |
| | — | | | | — | | | | — | | | | (.03 | ) |
| | (1.50 | ) | | | (1.22 | ) | | | (2.18 | ) | | | (1.06 | ) |
|
|
| |
|
|
| |
|
|
| |
|
|
|
| | (1.50 | ) | | | (1.27 | ) | | | (2.34 | ) | | | (1.28 | ) |
|
|
| |
|
|
| |
|
|
| |
|
|
|
| $ | 12.02 | | | $ | 15.92 | | | $ | 18.38 | | | $ | 18.06 | |
|
|
| |
|
|
| |
|
|
| |
|
|
|
| | | | | | | | | | | | | | | |
| | (17.21 | )% | | | (6.93 | )% | | | 16.71 | % | | | 4.25 | % |
| $ | 22,728 | | | $ | 30,459 | | | $ | 28,032 | | | $ | 33,685 | |
| $ | 29,071 | | | $ | 31,358 | | | $ | 27,782 | | | $ | 36,981 | |
| | | | | | | | | | | | | | | |
| | 1.79 | % | | | 1.83 | % | | | 1.91 | % | | | 1.77 | % |
| | .79 | % | | | .83 | % | | | .91 | % | | | .77 | % |
| | 0 | %(c) | | | .08 | % | | | 1.10 | % | | | .98 | % |
See Notes to Financial Statements
Financial Highlights
Cont’d
| |
| | | Class Z
| |
| | | Year Ended
October 31, 2003(b) | |
|
Per Share Operating Performance: | | | | |
Net Asset Value, Beginning Of Year | | $ | 12.21 | |
| | |
|
|
|
Income From Investment Operations: | | | | |
Net investment income | | | .15 | |
Net realized and unrealized gain (loss) on investment transactions | | | 2.30 | |
| | |
|
|
|
Total from investment operations | | | 2.45 | |
| | |
|
|
|
Less Distributions: | | | | |
Dividends from net investment income | | | (.12 | ) |
Dividends in excess of net investment income | | | — | |
Distributions from net realized gains | | | — | |
| | |
|
|
|
Total distributions | | | (.12 | ) |
| | |
|
|
|
Net asset value, end of year | | $ | 14.54 | |
| | |
|
|
|
Total Return(a): | | | 20.26 | % |
Ratios/Supplemental Data: | | | | |
Net assets, end of year (000) | | $ | 32,340 | |
Average net assets (000) | | $ | 31,275 | |
Ratios to average net assets: | | | | |
Expenses, including distribution and service (12b-1) fees | | | .87 | % |
Expenses, excluding distribution and service (12b-1) fees | | | .87 | % |
Net investment income | | | 1.13 | % |
| (a) | Total return is calculated assuming a purchase of shares on the first day and a sale on the last day of each year reported and includes reinvestment of dividends and distributions. |
| (b) | Calculated based upon average shares outstanding during the year. |
See Notes to Financial Statements
| 34 | | Visit our website at www.jennisondryden.com |
|
| Class Z | |
|
| Year Ended October 31, | |
|
| 2002(b) | | | 2001 | | | 2000 | | | 1999 | |
|
| | | | | | | | | | | | | | | |
| $ | 16.14 | | | $ | 18.52 | | | $ | 18.13 | | | $ | 18.64 | |
|
|
| |
|
|
| |
|
|
| |
|
|
|
| | | | | | | | | | | | | | | |
| | .14 | | | | .28 | | | | .35 | | | | .38 | |
| | (2.43 | ) | | | (1.30 | ) | | | 2.50 | | | | .58 | |
|
|
| |
|
|
| |
|
|
| |
|
|
|
| | (2.29 | ) | | | (1.02 | ) | | | 2.85 | | | | .96 | |
|
|
| |
|
|
| |
|
|
| |
|
|
|
| | | | | | | | | | | | | | | |
| | (.14 | ) | | | (.14 | ) | | | (.28 | ) | | | (.38 | ) |
| | — | | | | — | | | | — | | | | (.03 | ) |
| | (1.50 | ) | | | (1.22 | ) | | | (2.18 | ) | | | (1.06 | ) |
|
|
| |
|
|
| |
|
|
| |
|
|
|
| | (1.64 | ) | | | (1.36 | ) | | | (2.46 | ) | | | (1.47 | ) |
|
|
| |
|
|
| |
|
|
| |
|
|
|
| $ | 12.21 | | | $ | 16.14 | | | $ | 18.52 | | | $ | 18.13 | |
|
|
| |
|
|
| |
|
|
| |
|
|
|
| | (16.34 | )% | | | (5.98 | )% | | | 17.94 | % | | | 5.28 | % |
| | | | | | | | | | | | | | | |
| $ | 31,300 | | | $ | 62,366 | | | $ | 153,246 | | | $ | 136,529 | |
| $ | 58,256 | | | $ | 69,810 | | | $ | 141,384 | | | $ | 144,747 | |
| | | | | | | | | | | | | | | |
| | .79 | % | | | .83 | % | | | .91 | % | | | .77 | % |
| | .79 | % | | | .83 | % | | | .91 | % | | | .77 | % |
| | .98 | % | | | 1.11 | % | | | 2.07 | % | | | 1.97 | % |
See Notes to Financial Statements
Report of Independent Auditors
To the Trustees and Shareholders of
Jennison Value Fund
In our opinion, the accompanying statement of assets and liabilities, including the portfolio of investments, and the related statements of operations and of changes in net assets and the financial highlights present fairly, in all material respects, the financial position of Jennison Value Fund, formerly Prudential Value Fund, (the “Fund”) at October 31, 2003, the results of its operations for the year then ended, the changes in its net assets for each of the two years in the period then ended and the financial highlights for each of the five years in the period then ended, in conformity with accounting principles generally accepted in the United States of America. These financial statements and financial highlights (hereafter referred to as “financial statements”) are the responsibility of the Fund’s management; our responsibility is to express an opinion on these financial statements based on our audits. We conducted our audits of these financial statements in accordance with auditing standards generally accepted in the United States of America, which require that we plan and perform the audit to obtain reasonable assurance about whether the financial statements are free of material misstatement. An audit includes examining, on a test basis, evidence supporting the amounts and disclosures in the financial statements, assessing the accounting principles used and significant estimates made by management, and evaluating the overall financial statement presentation. We believe that our audits, which included confirmation of securities at October 31, 2003 by correspondence with the custodian and brokers, provide a reasonable basis for our opinion.
PricewaterhouseCoopers LLP
New York, New York
December 22, 2003
| 36 | | Visit our website at www.jennisondryden.com |
Federal Income Tax Information
(Unaudited)
We are required by the Internal Revenue Code to advise you within 60 days of the Fund’s fiscal year end (October 31, 2003) as to the federal tax status of dividends paid by the Fund during such fiscal year. Accordingly, we are advising you that during the fiscal year ended October 31, 2003, dividends paid from net investment income totaling $0.09 per Class A share and $0.12 per Class Z are taxable as ordinary income. Further, we wish to advise you that 100% of the ordinary income dividend paid in the fiscal year ended October 31, 2003 qualified for the corporate dividends received deduction available to corporate taxpayers. Only funds that invest in U.S. equity securities are entitled to pass-through a corporate dividends received deduction.
In January 2004, you will be advised on IRS Form 1099 DIV or substitute Form 1099, as to the federal tax status of the distributions received by you in calendar 2003. The amounts that will be reported on such form 1099 DIV will be the amounts to use on your federal income tax return and will differ from the amounts which we must report for the Fund’s fiscal year ended October 31, 2003.
The Fund intends to designate the maximum amount of dividends, qualified for the reduced tax rate under The Jobs and Growth Tax Relief Reconciliation Act of 2003, allowable.
Supplemental Proxy Information
(Unaudited)
A meeting of the Fund’s shareholders was held on July 17, 2003. The meeting was held for the following purpose:
To approve the election of ten (10) trustees to the Board of Trustees, as follows:
| | • | | Douglas H. McCorkindale |
The results of the proxy solicitation on the preceding matters were:
Matter
| | Votes For
| | Votes
Against
| | Votes
Withheld
| | Abstentions
|
David E.A. Carson | | 37,397,288 | | — | | 624,804 | | — |
Robert E. La Blanc | | 37,392,959 | | — | | 629,133 | | — |
Robert F. Gunia | | 37,408,913 | | — | | 613,179 | | — |
Douglas H. McCorkindale | | 37,415,300 | | — | | 606,792 | | — |
Stephen P. Munn* | | 37,420,717 | | — | | 601,375 | | — |
Richard A. Redeker | | 37,425,524 | | — | | 596,568 | | — |
Judy A. Rice | | 37,398,984 | | — | | 623,108 | | — |
Robin B. Smith | | 37,394,924 | | — | | 627,168 | | — |
Stephen Stoneburn | | 37,417,141 | | — | | 604,951 | | — |
Clay T. Whitehead | | 37,409,112 | | — | | 612,980 | | — |
| * | Mr. Munn resigned effective November 30, 2003. |
| 38 | | Visit our website at www.jennisondryden.com |
Management of the Fund
(Unaudited)
Information pertaining to the Trustees of the Fund is set forth below. Trustees who are not deemed to be “interested persons” of the Fund, as defined in the 1940 Act are referred to as “Independent Trustees.” Trustees who are deemed to be “interested persons” of the Fund are referred to as “Interested Trustees.” “Fund Complex”† consists of the Fund and any other investment companies managed by PI.
Independent Trustees2
David E.A. Carson (69), Trustee since 20033 Oversees 99 portfolios in Fund complex
Principal occupations (last 5 years): Director (January 2000 to May 2000), Chairman (January 1999 to December 1999), Chairman and Chief Executive Officer (January 1998 to December 1998) and President, Chairman and Chief Executive Officer (1983-1997) of People’s Bank.
Other Directorships held:4 Director of United Illuminating and UIL Holdings (utility company), since 1993.
Robert E. La Blanc (69), Trustee since 20033 Oversees 119 portfolios in Fund complex
Principal occupations (last 5 years): President (since 1981) of Robert E. La Blanc Associates, Inc. (telecommunications); formerly General Partner at Salomon Brothers and Vice-Chairman of Continental Telecom; Trustee of Manhattan College.
Other Directorships held:4 Trustee of Storage Technology Corporation (since 1979) (technology), Chartered Semiconductor Manufacturing, Ltd. (since 1998); Titan Corporation (electronics) (since 1995), Computer Associates International, Inc. (since 2002) (software company); FiberNet Telecom Group, Inc. (since 2003) (telecom company); Director (since April 1999) of the High Yield Plus Fund, Inc.
Douglas H. McCorkindale (64), Trustee since 19873 Oversees 101 portfolios in Fund complex
Principal occupations (last 5 years): Chairman (since February 2001), Chief Executive Officer (since June 2000) and President (since September 1997) of Gannett Co. Inc. (publishing and media); formerly Vice Chairman (March 1984-May 2000) of Gannett Co., Inc.
Other Directorships held:4 Director of Gannett Co. Inc., Director of Continental Airlines, Inc. (since May 1993); Director of Lockheed Martin Corp. (aerospace and defense) (since May 2001); Director of The High Yield Plus Fund, Inc. (since 1996).
Richard A. Redeker (60), Trustee since 19933 Oversees 102 portfolios in Fund complex
Principal occupations (last 5 years): Management Consultant; formerly employee of Prudential Investments (October 1996-December 1998); Director of Invesmart, Inc. (since 2001) and Director of Penn Tank Lines, Inc. (since 1999).
Other Directorships held:4 None.
Robin B. Smith (64), Trustee since 19963 Oversees 109 portfolios in Fund complex
Principal occupations (last 5 years): Chairman of the Board (since January 2003) of Publishers Clearing House (direct marketing), formerly Chairman and Chief Executive Officer (August 1996-January 2003) of Publishers Clearing House.
Other Directorships held:4 Director of BellSouth Corporation (since 1992).
Stephen Stoneburn (60), Trustee since 20033 Oversees 107 portfolios in Fund complex
Principal occupations (last 5 years): President and Chief Executive Officer (since June 1996) of Quadrant Media Corp. (a publishing company); formerly President (June 1995-June 1996) of Argus Integrated Media, Inc.; Senior Vice President and Managing Director (January 1993-1995) of Cowles Business Media and Senior Vice President of Fairchild Publications, Inc. (1975-1989).
Other Directorships held:4 None
Clay T. Whitehead (64), Trustee since 19963 Oversees 106 portfolios in Fund complex
Principal occupations (last 5 years): President (since 1983) of National Exchange Inc. (new business development firm).
Other Directorships held:4 Director (since 2000) of the High Yield Plus Fund, Inc.
Interested Trustees
Judy A. Rice (55), President since 2003 and Trustee since 20003 Oversees 109 portfolios in Fund complex
Principal occupations (last 5 years): President, Chief Executive Officer, Chief Operating Officer and Officer-in-Charge (since 2003) of PI; Director, Officer-in-Charge, President, Chief Executive Officer and Chief Operating Officer (since May 2003) of American Skandia Advisory Services, Inc. and American Skandia Investment Services, Inc.; Director, Officer-in-Charge, President, Chief Executive Officer (since May 2003) of American Skandia Fund Services, Inc.; Vice President (since February 1999) of Prudential Investment Management Services LLC; President, Chief Executive Officer and Officer-In-Charge (since April 2003) of Prudential Mutual Fund Services LLC; formerly various positions to Senior Vice President (1992-1999) of Prudential Securities; and various positions to Managing Director (1975-1992) of Salomon Smith Barney; Member of Board of Governors of the Money Management Institute.
Other Directorships held:4 None
Robert F. Gunia (56), Vice President and Trustee since 19963 Oversees 189 portfolios in Fund complex
Principal occupations (last 5 years): Chief Administrative Officer (since June 1999) of PI; Executive Vice President and Treasurer (since January 1996) of PI; President (since April 1999) of Prudential Investment Management Services LLC (PIMS); Corporate Vice President (since September 1997) of The Prudential Insurance Company of America (Prudential); Director, Executive Vice President and Chief Administrative Officer (since May 2003) of American Skandia Investment Services, Inc., American Skandia Advisory Services, Inc. and American Skandia Fund Services, Inc.; President (since April 1999) of Prudential Investment Management Services LLC; Executive Vice President (since March 1999) and Treasurer (since May 2000) of Prudential Mutual Fund Services LLC; formerly Senior Vice President (March 1987-May 1999) of Prudential Securities.
Other Directorships held:4 Vice President and Director (since May 1989) and Treasurer (since 1999) of The Asia Pacific Fund, Inc.
| 40 | | Visit our website at www.jennisondryden.com |
Information pertaining to the Officers of the Fund is set forth below.
Officers2
Marguerite E.H. Morrison (47), Chief Legal Officer since 2003 and Assistant Secretary since 20023
Principal occupations (last 5 years): Vice President and Chief Legal Officer—Mutual Funds and Unit Investment Trust (since August 2000) of Prudential; Senior Vice President and Secretary (since April 2003) of PI; Senior Vice President and Secretary (since May 2003) of American Skandia Investment Services, Inc., American Skandia Advisory Services, Inc. and American Skandia Fund Services, Inc.; Vice President and Assistant Secretary of PIMS (since October 2001), previously Senior Vice President and Assistant Secretary (February 2001-April 2003) of PI, Vice President and Associate General Counsel (December 1996-February 2001) of PI.
Maryanne Ryan (39), Anti-Money Laundering Compliance Officer since 20023
Principal occupations (last 5 years): Vice President, Prudential (since November 1998), First Vice President, Prudential Securities (March 1997-May 1998); Anti-Money Laundering Compliance Officer (since 2003) of American Skandia Investment Services, Inc., American Skandia Advisory Services, Inc. and American Skandia Marketing, Inc.
Grace C. Torres (44), Treasurer and Principal Financial and Accounting Officer since 19983
Principal occupations (last 5 years): Senior Vice President (since January 2000) of PI, Senior Vice President and Assistant Treasurer (since May 2003) of American Skandia Investment Services, Inc. and American Skandia Advisory Services, Inc.; formerly First Vice President (December 1996-January 2000) of PI and First Vice President (March 1993-1999) of Prudential Securities.
| 1 | “Interested” Trustee, as defined in the 1940 Act, by reason of employment with the Manager, (Prudential Investments LLC or PI), the Subadviser (Jennison Associates LLC or Jennison) or the Distributor (Prudential Investment Management Services LLC or PIMS). |
| 2 | Unless otherwise noted, the address of the Trustees and Officers is c/o: Prudential Investments LLC, Gateway Center Three, 100 Mulberry Street, Newark, NJ 07102. |
| 3 | There is no set term of office for Trustees and Officers. The Independent Trustees have adopted a retirement policy, which calls for the retirement of Trustees on December 31 of the year in which they reach the age of 75. The table shows the individuals length of service as Trustee and/or Officer. |
| 4 | This includes only directorships of companies requested to register, or file reports with the SEC under the Securities and Exchange Act of 1934 (that is, “public companies”) or other investment companies registered under the 1940 Act. |
| † | The Fund Complex consists of all investment companies managed by PI. The Funds for which PI serves as manager include JennisonDryden Mutual Funds, Strategic Partners Funds, American Skandia Advisor Funds, Inc., The Prudential Variable Contract Accounts 2, 10, 11, The Target Portfolio Trust, The Prudential Series Fund, Inc., American Skandia Trust, and Prudential’s Gibraltar Fund. |
Additional information about the Fund’s Trustees is included in the Fund’s Statement of Additional Information which is available without charge, upon request, by calling (800) 521-7466 or (732) 482-7555 (Calling from outside the U.S.)
Growth of a $10,000 Investment
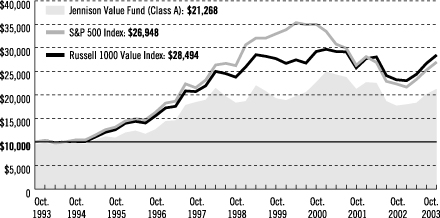
|
| Average Annual Total Returns (With Sales Charge) as of 10/31/03 |
| | | One Year | | | Five Years | | | Ten Years | | | Since Inception |
Class A | | 13.97 | % | | 1.96 | % | | 7.84 | % | | 9.69% |
|
Class B | | 14.05 | | | 2.08 | | | 7.58 | | | 8.88 (8.87) |
|
Class C | | 16.87 | | | 2.01 | | | N/A | | | 7.84 |
|
Class Z | | 20.26 | | | 3.27 | | | N/A | | | 7.86 |
|
| | | | | | | | | | | | |
|
| Average Annual Total Returns (Without Sales Charge) as of 10/31/03 |
| | | One Year | | | Five Years | | | Ten Years | | | Since Inception |
Class A | | 19.97 | % | | 3.01 | % | | 8.39 | % | | 10.10% |
|
Class B | | 19.05 | | | 2.22 | | | 7.58 | | | 8.88 (8.87) |
|
Class C | | 19.05 | | | 2.22 | | | N/A | | | 7.95 |
|
Class Z | | 20.26 | | | 3.27 | | | N/A | | | 7.86 |
|
Past performance is not indicative of future results. Principal value and investment return will fluctuate so that an investor’s shares, when redeemed, may be worth more or less than their original cost. Source: Prudential Investments LLC and Lipper Inc. Inception dates: Class A, 1/22/90; Class B, 1/22/87; Class C, 8/1/94; and Class Z, 3/1/96.
The graph compares a $10,000 investment in the Jennison Value Fund (Class A shares) with a similar investment in the S&P 500 Index and the Russell 1000 Value Index by portraying the initial account values at the beginning of the 10-year period for Class A shares (October 31, 1993) and the account values at the end of the current fiscal year (October 31, 2003) as measured on a quarterly basis. For purposes of the graph, and unless otherwise indicated, it has been assumed that (a) the maximum applicable front-end sales charge was deducted from the initial $10,000 investment in Class A shares; (b) all recurring fees (including management fees) were deducted; and (c) all dividends and distributions were reinvested. The line graph provides information for Class A shares only. As indicated in the tables provided earlier, performance for Class B, C, and Z shares will vary due to the differing charges and expenses applicable to each share class (as indicated in the following paragraphs).
| | | Visit our website at www.jennisondryden.com |
Without a distribution and service (12b-1) fee waiver of 0.05% for Class A shares through October 31, 2003, the returns shown in the graph and for Class A shares in the tables would have been lower.
The S&P 500 Index is an unmanaged index of 500 stocks of large U.S. companies. It gives a broad look at how stock prices have performed in the United States. The Russell 1000 Value Index is an unmanaged index comprising those securities in the Russell 1000 Index with a lesser-than-average growth orientation. Companies in this index generally have low price-to-book and price-to-earnings ratios, higher dividend yields, and lower forecasted growth values. The Indexes’ total returns include the reinvestment of all dividends, but do not include the effects of sales charges, operating expenses of a mutual fund, or taxes. These returns would be lower if they included the effects of sales charges, operating expenses, or taxes. The securities that comprise these indexes may differ substantially from the securities in the Fund. These are not the only indexes that may be used to characterize performance of large-capitalization stock funds. Other indexes may portray different comparative performance. Investors cannot invest directly in an index.
The Fund charges a maximum front-end sales charge of 5% for Class A shares in most circumstances, and a 12b-1 fee of up to 0.30% annually. In some circumstances, Class A shares may not be subject to a front-end sales charge, but may be subject to a 1% contingent deferred sales charge (CDSC) for the first year. Class B shares are subject to a declining CDSC of 5%, 4%, 3%, 2%, 1%, and 1% respectively for the first six years after purchase, and a 12b-1 fee of 1% annually. Approximately seven years after purchase, Class B shares will automatically convert to Class A shares on a quarterly basis. Class C shares are subject to a front-end sales charge of 1%, a CDSC of 1% for shares redeemed within 18 months of purchase, and a 12b-1 fee of 1% annually. Class Z shares are not subject to a sales charge or 12b-1 fee. Without waiver of fees and/or expense subsidization, the Fund’s returns in the tables would have been lower, as indicated in parentheses. The returns in the graph and the tables do not reflect the deduction of taxes that a shareholder would pay on Fund distributions or following the redemption of Fund shares.
| | |
| n MAIL | | n TELEPHONE | | n WEBSITE |
Gateway Center Three 100 Mulberry Street Newark, NJ 07102 | | (800) 225-1852 | | www.jennisondryden.com |
| TRUSTEES |
| David E.A. Carson•Robert F. Gunia•Robert E. La Blanc•Douglas H. McCorkindale• Richard A. Redeker•Judy A. Rice•Robin B. Smith•Stephen D. Stoneburn•Clay T. Whitehead |
| |
| OFFICERS |
Judy A. Rice, President•Robert F. Gunia, Vice President•Grace C. Torres, Treasurer and Principal
Financial and Accounting Officer•Marguerite E.H. Morrison, Chief Legal Officer and Assistant Secretary• Maryanne Ryan, Anti-Money Laundering Compliance Officer |
| MANAGER | | Prudential Investments LLC | | Gateway Center Three
100 Mulberry Street
Newark, NJ 07102 |
|
| INVESTMENT ADVISER | | Jennison Associates LLC | | 466 Lexington Avenue
New York, NY 10017 |
|
| DISTRIBUTOR | | Prudential Investment
Management Services LLC | | Gateway Center Three
14th Floor
100 Mulberry Street
Newark, NJ 07102 |
|
| CUSTODIAN | | State Street Bank
and Trust Company | | One Heritage Drive
North Quincy, MA 02171 |
|
| TRANSFER AGENT | | Prudential Mutual Fund
Services LLC | | PO Box 8098
Philadelphia, PA 19101 |
|
| INDEPENDENT AUDITORS | | PricewaterhouseCoopers LLP | | 1177 Avenue of the
Americas
New York, NY 10036 |
|
| FUND COUNSEL | | Sullivan & Cromwell LLP | | 125 Broad Street
New York, NY 10004 |
| | |
| Jennison Value Fund | | | | |
| Share Class | | | | A | | B | | C | | Z | | |
| | | | | | |
Nasdaq | | | | PBEAX | | PBQIX | | PEICX | | PEIZX | | |
CUSIP | | | | 476297106 | | 476297205 | | 476297304 | | 476297403 | | |
| | | | | | | | | | | | | |
Mutual Funds:
| ARE NOT INSURED BY THE FDIC OR ANY FEDERAL GOVERNMENT AGENCY | | MAY LOSE VALUE | | ARE NOT A DEPOSIT OF OR GUARANTEED BY ANY BANK OR ANY BANK AFFILIATE |
| | | |
| Jennison Value Fund | | | | | | |
| | | Share Class | | A | | B | | C | | Z | | |
| | | | | | |
| | | Nasdaq | | PBEAX | | PBQIX | | PEICX | | PEIZX | | |
| | | CUSIP | | 476297106 | | 476297205 | | 476297304 | | 476297403 | | |
| | | | | | | | | | | | | |
MF131E IFS-AO86511
Item 2 – Code of Ethics – See Exhibit (a)
As of the end of the period covered by this report, the registrant has adopted a code of ethics (the “Section 406 Standards for Investment Companies — Ethical Standards for Principal Executive and Financial Officers”) that applies to the registrant’s Principal Executive Officer and Principal Financial Officer; the registrant’s Principal Financial Officer also serves as the Principal Accounting Officer.
The registrant hereby undertakes to provide any person, without charge, upon request, a copy of the code of ethics. To request a copy of the code of ethics, contact the registrant at (973) 367-7525, and ask for a copy of the Section 406 Standards for Investment Companies – Ethical Standards for Principal Executive and Financial Officers.
Item 3 – Audit Committee Financial Expert –
Stephen Munn had been designated as the Fund’s Audit Committee Financial Expert, however, he resigned as a Director of the Fund effective November 30, 2003 and the Fund’s board is in the process of selecting a new designee.
Item 4 – Principal Accountant Fees and Services – Not required in this filing
Item 5 – Reserved
Item 6 – Reserved
Item 7 – Disclosure of Proxy Voting Policies and Procedures for Closed-End Management Investment Companies – Not required in this filing
Item 8 – Reserved
Item 9 – Controls and Procedures
(a) It is the conclusion of the registrant’s principal executive officer and principal financial officer that the effectiveness of the registrant’s current disclosure controls and procedures (such disclosure controls and procedures having been evaluated within 90 days of the date of this filing) provide reasonable assurance that the information required to be disclosed by the registrant has been recorded, processed, summarized and reported within the time period specified in the Commission’s rules and forms and that the information required to be disclosed by the registrant has been accumulated and communicated to the registrant’s principal executive officer and principal financial officer in order to allow timely decisions regarding required disclosure.
(b) There have been no significant changes in the registrant’s internal controls or in other factors that could significantly affect these controls subsequent to the date of their evaluation, including any corrective actions with regard to significant deficiencies and material weaknesses.
Item 10 – Exhibits
| | (a) | Code of Ethics – Attached hereto |
| | (b) | Certifications pursuant to Sections 302 and 906 of the Sarbanes-Oxley Act – Attached hereto |
SIGNATURES
Pursuant to the requirements of the Securities Exchange Act of 1934 and the Investment Company Act of 1940, the registrant has duly caused this report to be signed on its behalf by the undersigned, thereunto duly authorized.
| (Registrant) | | Jennison Value Fund |
| |
| By (Signature and Title)* | | /s/ Marguerite E. H. Morrison
|
| | | Marguerite E. H. Morrison |
| | | Assistant Secretary |
| |
| Date | | December 22, 2003 |
Pursuant to the requirements of the Securities Exchange Act of 1934 and the Investment Company Act of 1940, this report has been signed below by the following persons on behalf of the registrant and in the capacities and on the dates indicated.
| By (Signature and Title)* | | /s/ Judy A. Rice
|
| | | Judy A. Rice |
| | | President and Principal Executive Officer |
| |
| Date | | December 22, 2003 |
| |
| By (Signature and Title)* | | /s/ Grace C. Torres
|
| | | Grace C. Torres |
| | | Treasurer and Principal Financial Officer |
| |
| Date | | December 22, 2003 |
| * | Print the name and title of each signing officer under his or her signature. |
CODE OF ETHICS FOR PRINCIPAL EXECUTIVE AND
PRINCIPAL FINANCIAL OFFICERS
I. Covered Officers/Purpose of the Code
This code of ethics (the “Code”) is established for each fund listed on Attachment A hereto (each a Fund” and together the “Funds”) pursuant to Section 406 of the Sarbanes-Oxley Act and the rules adopted thereunder by the Securities and Exchange Commission (“SEC”). The Code applies to each Fund’s Principal Executive Officer, Principal Financial Officer and Principal Accounting Officer or Controller, or senior officers performing similar functions (the “Covered Officers” each of whom are set forth in Exhibit B) for the purpose of promoting:
| | • | honest and ethical conduct, including the ethical handling of actual or apparent conflicts of interest between personal and professional relationships; |
| | • | full, fair, accurate, timely and understandable disclosure in reports and documents that a registrant files with, or submits to, the SEC and in other public communications made by a Fund; |
| | • | compliance with applicable governmental laws, rules and regulations; |
| | • | the prompt internal reporting of violations of the Code to an appropriate person or persons identified in the Code; and |
| | • | accountability for adherence to the Code. |
Each Covered Officer should adhere to a high standard of business ethics and should be sensitive to situations that may give rise to actual as well as apparent conflicts of interest.
II. Conflicts of Interest
A “conflict of interest” occurs when a Covered Officer’s private interest interferes with the interests of, or his service to, a Fund. For example, a conflict of interest would arise if a Covered Officer, or a member of his family, receives improper personal benefits as a result of his position with a Fund.
Certain conflicts of interest arise out of the relationships between Covered Officers and a Fund and already are subject to conflict of interest provisions in the Investment Company Act of 1940, as amended (the “1940 Act”) and the Investment Advisers Act of 1940, as amended (the “Advisers Act”). For example, Covered Officers may not individually engage in certain transactions (such as the purchase or sale of securities or other property) with a Fund because of their status as “affiliated persons” of the Fund. A Fund’s and its investment adviser’s compliance programs and procedures are designed to prevent, or identify and correct, violations of these provisions. This Code does not, and is not intended to, repeat or replace these programs and procedures, and such conflicts fall outside of the parameters of this Code.
Although typically not presenting an opportunity for improper personal benefit, conflicts arise from, or as a result of, the contractual relationships between a Fund and the Fund’s investment adviser, principal underwriter, administrator, or other service providers to the Fund (together “Service Providers”), of which the Covered Officers may also be principals or employees. As a
result, this Code recognizes that the Covered Officers will, in the normal course of their duties (whether formally for a Fund or for a Service Provider, or for both), be involved in establishing policies and implementing decisions that will have different effects on such Service Providers and a Fund. The participation of the Covered Officers in such activities is inherent in the contractual relationships between a Fund and its Service Providers and is consistent with the performance by the Covered Officers of their duties as officers of the Fund. Thus, if performed in conformity with the provisions of the 1940 Act and the Advisers Act, such activities will be deemed to have been handled ethically. In addition, it is recognized by the Funds’ Board of Directors/Trustees (“Boards”) that the Covered Officers may also be officers or employees of one or more other investment companies covered by this or other codes.
Other conflicts of interest are covered by the Code, even if such conflicts of interest are not subject to provisions in the 1940 Act and the Advisers Act. The following list provides examples of conflicts of interest under the Code, but Covered Officers should keep in mind that these examples are not exhaustive. The overarching principle is that the personal interest of a Covered Officer should not be placed improperly before the interest of a Fund.
Each Covered Officer must:
| | • | not use his personal influence or personal relationships improperly to influence investment decisions or financial reporting by a Fund whereby the Covered Officer would benefit personally to the detriment of the Fund; |
| | • | not cause a Fund to take action, or fail to take action, for the individual personal benefit of the Covered Officer rather than the benefit the Fund; and |
| | • | not retaliate against any other Covered Officer or any employee of a Fund or its affiliated persons for reports of potential violations that are made in good faith. |
There are some actual or potential conflict of interest situations that should always be brought to the attention of, and discussed with, the Funds’ Chief Legal Officer or other senior legal officer, if material. Examples of these include:
| | • | service as a director on the board of any public or private company; |
| | • | the receipt of any non-nominal gifts; |
| | • | the receipt of any entertainment from any company with which a Fund has current or prospective business dealings unless such entertainment is business-related, reasonable in cost, appropriate as to time and place, and not so frequent as to raise any question of impropriety; |
| | • | any ownership interest in (other than insubstantial interests in publicly traded entities), or any consulting or employment relationship with, any of a Fund’s Service Providers, other than its investment adviser, principal underwriter, administrator or any affiliated person thereof; and |
| | • | a direct or indirect financial interest in commissions, transaction charges or spreads paid by a Fund for effecting portfolio transactions or for selling or redeeming shares other than an interest arising from the Covered Officer’s employment, such as compensation or equity ownership. |
2
III. Disclosure and Compliance
Each Covered Officer:
| | • | should familiarize himself with the disclosure requirements generally applicable to the Funds; |
| | • | should not knowingly misrepresent, or cause others to misrepresent, facts about a Fund to others, whether within or outside the Fund, including to the Fund’s Board of Directors/Trustees and its auditors, and to governmental regulators and self-regulatory organizations; |
| | • | should, to the extent appropriate within his area of responsibility, consult with other officers and employees of a Fund and its Service Providers with the goal of promoting full, fair, accurate, timely and understandable disclosure in the reports and documents the Fund files with, or submits to, the SEC and in other public communications made by the Fund; and |
| | • | is responsible to promote compliance with the standards and restrictions imposed by applicable laws, rules and regulations. |
IV. Reporting and Accountability
Each Covered Officer must:
| | • | upon adoption of the Code (or thereafter as applicable, upon becoming a Covered Officer), affirm in writing to the Board of Directors/Trustees that he has received, read, and understands the Code; |
| | • | annually thereafter affirm to the Board of Directors/Trustees that he has complied with the requirements of the Code; and |
| | • | notify the Funds’ Chief Legal Officer promptly if he knows of any violation of this Code. Failure to do so is itself a violation of this Code. |
The Funds’ Chief Legal Officer is responsible for applying this Code to specific situations in which questions are presented under it and has the authority to interpret this Code in any particular situation. In such situations, the Chief Legal Officer is authorized to consult, as appropriate, with counsel to the Funds, counsel to the Independent Directors/Trustees, a Board Committee comprised of Independent Directors/Trustees, or the full Board.
The Funds will follow the following procedures in investigating and enforcing this Code:
| | • | the Funds Chief Legal Officer will take all appropriate action to investigate any potential violations reported to her; |
| | • | if, after such investigation, the Chief Legal Officer believes that no violation has occurred, the Chief Legal Officer is not required to take any further action; |
| | • | any matter that the Chief Legal Officer believes is a violation or that the Chief Legal Officer believes should be reviewed by a Fund’s Board or Board Committee comprised of Independent Directors/Trustees will be reported to the Fund’s Board or Board Committee comprised of Independent Directors/Trustees; |
3
| | • | based upon its review of any matter referred to it, a Fund’s Board or Board Committee comprised of Independent Directors/Trustees shall determine whether or not a violation has occurred, whether a grant of waiver is appropriate or whether some other action should be taken. Based upon its determination, the Fund’s Board or Board Committee comprised of Independent Directors/Trustees may take such action as it deems appropriate, which may include without limitation: modifications of applicable policies and procedures; notification to appropriate personnel of the Fund’s investment adviser, principal underwriter or administrator, or their boards; notification to other Funds for which the Covered Officer serves as a Covered Officer; or recommendation to dismiss the Covered Officer; and |
| | • | any changes to or waivers of this Code will, to the extent required, be disclosed as provided by SEC rules. |
V. Other Policies and Procedures
This Code shall be the sole code of ethics adopted by the Funds for purposes of Section 406 of the Sarbanes-Oxley Act and the rules and forms applicable to registered investment companies thereunder. Insofar as other policies or procedures of a Fund or its Service Providers govern or purport to govern the behavior or activities of the Covered Officers who are subject to this Code, they are superseded by this Code to the extent that they overlap or conflict with the provisions of this Code. The Funds’ and their investment adviser’s and principal underwriter’s code of ethics under Rule 17j-1 under the 1940 Act are separate requirements applying to the Covered Officers and others, and are not part of this Code.
VI. Amendments
Any amendments to this Code, other than amendments to Exhibit A, must be approved or ratified by a majority vote of the Board, including a majority of Independent Directors/Trustees.
VII. Confidentiality
All reports and records prepared or maintained pursuant to this Code will be considered confidential and shall be maintained and protected accordingly. Except as otherwise required by law or this Code, such matters shall not be disclosed to anyone other than the Fund Board of Directors/Trustees, counsel to the Fund, and counsel to the Fund Independent Directors/Trustees.
VIII. Internal Use
The Code is intended solely for the internal use by the Funds and does not constitute an admission, by or on behalf of a Fund, as to any fact, circumstance, or legal conclusion.
IX. Recordkeeping
A Fund shall keep the information disclosed about waivers and amendments under the Code for the period of time as specified in the rules adopted pursuant to Section 406 of the Sarbanes-Oxley Act, and furnish such information to the SEC or its staff upon request.
Adopted and approved as of September 3, 2003.
4
EXHIBIT A
Funds Covered by this Code of Ethics
The Retail Funds:
Strategic Partners Asset Allocation Funds - Strategic Partners Moderate Growth Fund
Strategic Partners Asset Allocation Funds - Strategic Partners Conservative Growth Fund
Strategic Partners Style Specific Funds - Strategic Partners International Equity Fund
Strategic Partners Style Specific Funds - Strategic Partners Large Capitalization Growth Fund
Strategic Partners Style Specific Funds - Strategic Partners Small Capitalization Value Fund
Strategic Partners Style Specific Funds - Strategic Partners Large Capitalization Value Fund
Strategic Partners Asset Allocations Funds - Strategic Partners High Growth Fund
Strategic Partners Style Specific Funds - Strategic Partners Total Return Bond Fund
Strategic Partners Style Specific Funds - Strategic Partners Small Capitalization Growth Fund
Dryden California Municipal Fund: California Income Series
Dryden California Municipal Fund: California Money Market Series
Dryden California Municipal Fund: California Series
Dryden Municipal Series Fund: Florida Series
Dryden Municipal Series Fund: New Jersey Money Market Series
Dryden Municipal Series Fund: New Jersey Series
Dryden Municipal Series Fund: New York Money Market Series
Dryden Municipal Series Fund: New York Series
Dryden Municipal Series Fund: Pennsylvania Series
Cash Accumulation Trust - Liquid Assets Series
Cash Accumulation Trust - National Money Market Fund
Dryden Index Series Fund: Dryden Stock Index Fund
The Prudential Investment Portfolios, Inc., Jennison Equity Opportunity Fund
The Prudential Investment Portfolios, Inc., Jennison Growth Fund
The Prudential Investment Portfolios, Inc., Dryden Active Balanced Fund
Jennison Small Company Fund, Inc.
Dryden Tax-Managed Funds, Dryden Tax-Managed Equity Fund
Dryden Tax-Managed Small-Cap Fund, Inc.
Jennison U.S. Emerging Growth Fund, Inc.
Jennison Value Fund
Prudential World Fund, Inc., Jennison Global Growth Fund
Prudential World Fund, Inc., Strategic Partners International Value Fund
Prudential World Fund, Inc., Jennison International Growth Fund
A-1
Dryden Government Securities Trust - Money Market Series
Dryden Government Securities Trust - U.S.Treasury Money Market Series
Jennison Sector Funds, Inc. - Jennison Financial Services Fund
Jennison Sector Funds, Inc. - Jennison Health Sciences Fund
Jennison Sector Funds, Inc. - Jennison Technology Fund
Jennison Sector Funds, Inc. - Jennison Utility Fund
Strategic Partners Equity Fund, Inc.
Dryden Global Total Return Fund, Inc.
Dryden High Yield Fund, Inc.
MoneyMart Assets, Inc.
Dryden National Municipals Fund, Inc.
Dryden Short-Term Bond Fund, Inc. - Dryden Short-Term Corporate Bond Fund
Dryden Short-Term Bond Fund, Inc. - Dryden Ultra Short Bond Fund
Tax-Free Money Fund, Inc.
Dryden Total Return Bond Fund, Inc.
The Target Portfolio Trust - Intermediate-Term Bond Portfolio
The Target Portfolio Trust - International Bond Portfolio
The Target Portfolio Trust - International Equity Portfolio
The Target Portfolio Trust - Large Capitalization Growth Portfolio
The Target Portfolio Trust - Large Capitalization Value Portfolio
The Target Portfolio Trust - Mortgage Backed Securities Portfolio
The Target Portfolio Trust - Small Capitalization Growth Portfolio
The Target Portfolio Trust - Small Capitalization Value Portfolio
The Target Portfolio Trust - Total Return Bond Portfolio
The Target Portfolio Trust - U.S. Government Money Market Portfolio
Jennison 20/20 Focus Fund
Dryden Core Investment Fund
Dryden Government Income Fund, Inc.
Strategic Partners Opportunity Funds - Strategic Partners Focused Growth Fund
Strategic Partners Opportunity Funds - Strategic Partners Focused Value Fund
Strategic Partners Opportunity Funds - Strategic Partners Mid-Cap Value Fund
Strategic Partners Opportunity Funds - Strategic Partners New Era Growth Fund
Prudential Institutional Liquidity Portfolio, Inc. - Institutional Money Market Series
Strategic Partners Real Estate Securities Fund
A-2
Dryden Municipal Bond Fund - High Income Series
Dryden Municipal Bond Fund - Insured Series
Prudential Europe Growth Fund, Inc.
Prudential Pacific Growth Fund, Inc.
Jennison Natural Resources Fund, Inc.
COMMAND Government Fund
COMMAND Money Fund
COMMAND Tax-Free Fund
Special Money Market Fund, Inc. - Money Market Series
Nicholas-Applegate Fund, Inc. - Nicholas-Applegate Growth Equity Fund
American Skandia Advisor Funds, Inc. - ASAF American Century International Growth Fund
American Skandia Advisor Funds, Inc. - ASAF American Century Strategic Balanced Fund
American Skandia Advisor Funds, Inc. - ASAF DeAM International Equity Fund
American Skandia Advisor Funds, Inc. - ASAF Federated High Yield Bond Fund
American Skandia Advisor Funds, Inc. - ASAF Gabelli Small-Cap Value Fund
American Skandia Advisor Funds, Inc. - ASAF INVESCO Capital Income Fund
American Skandia Advisor Funds, Inc. - ASAF Goldman Sachs Concentrated Growth Fund
American Skandia Advisor Funds, Inc. - ASAF Money Market Fund
American Skandia Advisor Funds, Inc. - ASAF PIMCO Total Return Bond Fund
American Skandia Advisor Funds, Inc. - ASAF PBHG Small-Cap Growth Fund
American Skandia Advisor Funds, Inc. - ASAF Alliance Growth Fund
American Skandia Advisor Funds, Inc. - ASAF Alliance Growth and Income Fund
American Skandia Advisor Funds, Inc. - ASAF William Blair International Growth Fund
American Skandia Advisor Funds, Inc. - ASAF Marsico Capital Growth Fund
American Skandia Advisor Funds, Inc. - ASAF Neuberger Berman Mid-Cap Growth Fund
American Skandia Advisor Funds, Inc. - ASAF Neuberger Berman Mid-Cap Value Fund
American Skandia Advisor Funds, Inc. - ASAF MFS Growth with Income Fund
American Skandia Advisor Funds, Inc. - ASAF Sanford Bernstein Managed Index 500 Fund
American Skandia Advisor Funds, Inc. - ASAF Strong International Equity Fund
American Skandia Advisor Funds, Inc. - ASAF DeAM Small-Cap Growth Fund
American Skandia Advisor Funds, Inc. - ASAF Alger All-Cap Growth Fund
American Skandia Advisor Funds, Inc. - ASAF Gabelli All-Cap Value Fund
American Skandia Advisor Funds, Inc. - ASAF INVESCO Technology Fund
American Skandia Advisor Funds, Inc. - ASAF Goldman Sachs Mid-Cap Growth Fund
A-3
American Skandia Advisor Funds, Inc. - ASAF ProFund Managed OTC Fund
American Skandia Advisor Funds, Inc. - ASAF Alliance / Bernstein Growth + Value Fund
American Skandia Advisor Funds, Inc. - ASAF INVESCO Health Sciences Fund
American Skandia Advisor Funds, Inc. - ASAF Sanford Bernstein Core Value Fund
American Skandia Advisor Funds, Inc. - ASAF T. Rowe Price Tax Managed Fund
American Skandia Advisor Funds, Inc. - ASAF DeAM Large-Cap Growth Fund
American Skandia Advisor Funds, Inc. - ASAF DeAM Large-Cap Value Fund
The Insurance Funds:
American Skandia Trust - AST Strong International Equity Portfolio
American Skandia Trust - AST William Blair International Growth Portfolio
American Skandia Trust - AST American Century International Growth Portfolio
American Skandia Trust - AST DeAM International Equity Portfolio
American Skandia Trust - AST MFS Global Equity Portfolio
American Skandia Trust - AST PBHG Small-Cap Growth Portfolio
American Skandia Trust - AST DeAM Small-Cap Growth Portfolio
American Skandia Trust - AST Federated Aggressive Growth Portfolio
American Skandia Trust - AST Goldman Sachs Small-Cap Value Portfolio
American Skandia Trust - AST Gabelli Small-Cap Value Portfolio
American Skandia Trust - AST DeAM Small-Cap Value Portfolio
American Skandia Trust - AST Goldman Sachs Mid-Cap Growth Portfolio
American Skandia Trust - AST Neuberger Berman Mid-Cap Growth Portfolio
American Skandia Trust - AST Neuberger Berman Mid-Cap Value Portfolio
American Skandia Trust - AST Alger All-Cap Growth Portfolio
American Skandia Trust - AST Gabelli All-Cap Value Portfolio
American Skandia Trust - AST T. Rowe Price Natural Resources Portfolio
American Skandia Trust - AST Alliance Growth Portfolio
American Skandia Trust - AST MFS Growth Portfolio
American Skandia Trust - AST Marisco Capital Growth Portfolio
American Skandia Truat - AST Goldman Sachs Concentrated Growth Portfolio
American Skandia Trust - AST DeAM Large-Cap Growth Portfolio
American Skandia Trust - AST DeAM Large-Cap Value Portfolio
American Skandia Trust - AST Alliance/Bernstein Growth + Value Portfolio
American Skandia Trust - AST Sanford Bernstein Core Value Portfolio
American Skandia Trust - AST Cohen & Steers Realty Portfolio
American Skandia Trust - AST Sandford Bernstein Managed Index 500 Portfolio
American Skandia Trust - AST American Century Income & Growth Portfolio
American Skandia Trust - AST Alliance Growth and Income Portfolio
American Skandia Trust - AST MFS Growth with Income Portfolio
American Skandia Trust - AST INVESCO Capital Income Portfolio
American Skandia Trust - AST DeAM Global Allocation Portfolio
American Skandia Trust - AST American Century Strategic Balanced Portfolio
American Skandia Trust - AST T. Rowe Price Asset Allocation Portfolio
American Skandia Trust - AST T. Rowe Price Global Bond Portfolio
A-4
American Skandia Trust - AST Federated High Yield Portfolio
American Skandia Trust - AST Lord Abbett Bond-Debenture Portfolio
American Skandia Trust - AST DeAM Bond Portfolio
American Skandia Trust - AST PIMCO Total Return Bond Portfolio
American Skandia Trust - AST PIMCO Limited Maturity Bond Portfolio
American Skandia Trust - AST Money Market Portfolio
The Prudential Series Fund, Inc. - SP Aggressive Growth Asset Allocation Portfolio
The Prudential Series Fund, Inc. - SP AIM Aggressive Growth Portfolio
The Prudential Series Fund, Inc. - SP AIM Core Equity Portfolio
The Prudential Series Fund, Inc. - SP Alliance Large Cap Growth Portfolio
The Prudential Series Fund, Inc. - SP Alliance Technology Portfolio
The Prudential Series Fund, Inc. - SP Balanced Asset Allocation Portfolio
The Prudential Series Fund, Inc. - SP Conservative Asset Allocation Portfolio
The Prudential Series Fund, Inc. - SP Davis Value Portfolio
The Prudential Series Fund, Inc. - SP Deutsche International Equity Portfolio
The Prudential Series Fund, Inc. - SP Growth Asset Allocation Portfolio
The Prudential Series Fund, Inc. - SP INVESCO Small Company Growth Portfolio
The Prudential Series Fund, Inc. - SP Jennison International Growth Portfolio
The Prudential Series Fund, Inc. - SP Large Cap Value Portfolio
The Prudential Series Fund, Inc. - SP MFS Capital Opportunities Portfolio
The Prudential Series Fund, Inc. - SP MFS Mid Cap Growth Portfolio
The Prudential Series Fund, Inc. - SP PIMCO High Yield Portfolio
The Prudential Series Fund, Inc. - SP PIMCO Total Return Portfolio
The Prudential Series Fund, Inc. - SP Prudential U.S. Emerging Growth Portfolio
The Prudential Series Fund, Inc. - SP Small/Mid Cap Value Growth Portfolio
The Prudential Series Fund, Inc. - SP Strategic Partners Focused Growth Portfolio
The Prudential Series Fund, Inc. - Stock Index Portfolio
The Prudential Series Fund, Inc. - Jennison 20/20 Focus Portfolio
The Prudential Series Fund, Inc. - Conservative Balanced Portfolio
The Prudential Series Fund, Inc. - Diversified Bond Portfolio
The Prudential Series Fund, Inc. - Diversified Conservative Growth Portfolio
The Prudential Series Fund, Inc. - Equity Portfolio
The Prudential Series Fund, Inc. - Flexible Managed Portfolio
The Prudential Series Fund, Inc. - Global Portfolio
The Prudential Series Fund, Inc. - Government Income Portfolio
The Prudential Series Fund, Inc. - High Yield Bond Portfolio
The Prudential Series Fund, Inc. - Jennison Portfolio
The Prudential Series Fund, Inc. - Money Market Portfolio
The Prudential Series Fund, Inc. - Natural Resources Portfolio
The Prudential Series Fund, Inc. - Small Capitalization Stock Portfolio
The Prudential Series Fund, Inc. - Value Portfolio
The Prudential Series Fund, Inc. - Zero Coupon Bond Portfolio 2005
Prudential’s Gibraltar Fund, Inc.
A-5
EXHIBIT B
Persons Covered by this Code of Ethics
Judy A. Rice – President and Chief Executive Officer of the Retail Funds
David R. Odenath – President and Chief Executive Officer of the Insurance Funds
Grace C. Torres – Treasurer and Chief Financial Officer for the Retail and Insurance Funds
B-1
Item 10
Jennison Value Fund
Annual period ending 10/31/03
File No. 811-04864
CERTIFICATIONS
I, Judy A. Rice, certify that:
| | 1. | I have reviewed this report on Form N-CSR of Jennison Value Fund; |
| | 2. | Based on my knowledge, this report does not contain any untrue statement of a material fact or omit to state a material fact necessary to make the statements made, in light of the circumstances under which such statements were made, not misleading with respect to the period covered by this report; |
| | 3. | Based on my knowledge, the financial statements, and other financial information included in this report, fairly present in all material respects the financial condition, results of operations, changes in net assets, and cash flows (if the financial statements are required to include a statement of cash flows) of the registrant as of, and for, the periods presented in this report. |
| | 4. | The registrant’s other certifying officers and I are responsible for establishing and maintaining disclosure controls and procedures (as defined in Rule 30a-3(c) under the Investment Company Act of 1940) for the registrant and have: |
| | a) | Designed such disclosure controls and procedures, or caused such disclosure controls and procedures to be designed under our supervision, to ensure that material information relating to the registrant, including its consolidated subsidiaries, is made known to us by others within those entities, particularly during the period in which this report is being prepared; |
| | b) | Evaluated the effectiveness of the registrant’s disclosure controls and procedures and presented in this report our conclusions about the effectiveness of the disclosure controls and procedures, as of a date within 90 days prior to the filing date of this report based on such evaluation; and; |
| | c) | Disclosed in this report any change in the registrant’s internal control over financial reporting that occurred during the registrant’s most recent fiscal half-year (the registrant’s second fiscal half-year in the case of an annual report) that has materially affected, or is reasonably likely to materially affect, the registrant’s internal control over financial reporting; and |
| | 5. | The registrant’s other certifying officers and I have disclosed to the registrant’s auditors and the audit committee of the registrant’s board of directors (or persons performing the equivalent functions): |
| | a) | All significant deficiencies and material weaknesses in the design or operation of internal controls which are reasonably likely to adversely affect the registrant’s ability to record, process, summarize, and report financial information; and |
| | b) | Any fraud, whether or not material, that involves management or other employees who have a significant role in the registrant’s internal control over financial reporting. |
Date: December 22, 2003
/s/ Judy A. Rice
|
Judy A. Rice |
President and Principal Executive Officer |
Item 10
Jennison Value Fund
Annual period ending 10/31/03
File No. 811-04864
CERTIFICATIONS
I, Grace C. Torres, certify that:
| | 1. | I have reviewed this report on Form N-CSR of Jennison Value Fund; |
| | 2. | Based on my knowledge, this report does not contain any untrue statement of a material fact or omit to state a material fact necessary to make the statements made, in light of the circumstances under which such statements were made, not misleading with respect to the period covered by this report; |
| | 3. | Based on my knowledge, the financial statements, and other financial information included in this report, fairly present in all material respects the financial condition, results of operations, changes in net assets, and cash flows (if the financial statements are required to include a statement of cash flows) of the registrant as of, and for, the periods presented in this report. |
| | 4. | The registrant’s other certifying officers and I are responsible for establishing and maintaining disclosure controls and procedures (as defined in Rule 30a-3(c) under the Investment Company Act of 1940) for the registrant and have: |
| | a. | Designed such disclosure controls and procedures, or caused such disclosure controls and procedures to be designed under our supervision, to ensure that material information relating to the registrant, including its consolidated subsidiaries, is made known to us by others within those entities, particularly during the period in which this report is being prepared; |
| | b. | Evaluated the effectiveness of the registrant’s disclosure controls and procedures and presented in this report our conclusions about the effectiveness of the disclosure controls and procedures, as of a date within 90 days prior to the filing date of this report based on such evaluation; and; |
| | c. | Disclosed in this report any change in the registrant’s internal control over financial reporting that occurred during the registrant’s most recent fiscal half-year (the registrant’s second fiscal half-year in the case of an annual report) that has materially affected, or is reasonably likely to materially affect, the registrant’s internal control over financial reporting; and |
| | 5. | The registrant’s other certifying officers and I have disclosed to the registrant’s auditors and the audit committee of the registrant’s board of directors (or persons performing the equivalent functions): |
| | a. | All significant deficiencies and material weaknesses in the design or operation of internal controls which are reasonably likely to adversely affect the registrant’s ability to record, process, summarize, and report financial information; and |
| | b. | Any fraud, whether or not material, that involves management or other employees who have a significant role in the registrant’s internal control over financial reporting. |
Date: December 22, 2003
/s/ Grace C. Torres
|
Grace C. Torres |
Treasurer and Chief Financial Officer |
Certification Pursuant to 18 U.S.C. Section 1350,
As Adopted Pursuant to
Section 906 of the Sarbanes-Oxley Act of 2002
Name of Issuer: Jennison Value Fund
In connection with the Report on Form N-CSR of the above-named issuer that is accompanied by this certification, the undersigned hereby certifies, to his or her knowledge, that:
| 1. | The Report fully complies with the requirements of Section 13(a) or 15(d) of the Securities Exchange Act of 1934; and |
| 2. | The information contained in the Report fairly presents, in all material respects, the financial condition and results of operations of the Issuer. |
| Date: December 22, 2003 | | /s/ Judy A. Rice
|
| | | Judy A. Rice |
| | | President and Principal |
| | | Executive Officer |
| |
| Date: December 22, 2003 | | /s/ Grace C. Torres
|
| | | Grace C. Torres |
| | | Treasurer and Principal Financial Officer |