UNITED STATES
SECURITIES AND EXCHANGE COMMISSION
Washington, D.C. 20549
FORM N-CSR
CERTIFIED SHAREHOLDER REPORT OF REGISTERED MANAGEMENT
INVESTMENT COMPANIES
| | |
Investment Company Act file number: | | 811-04864 |
| |
Exact name of registrant as specified in charter: | | Jennison Value Fund |
| |
Address of principal executive offices: | | Gateway Center 3, 100 Mulberry Street, Newark, New Jersey 07102 |
| |
Name and address of agent for service: | | William V. Healey Gateway Center 3, 100 Mulberry Street, Newark, New Jersey 07102 |
| |
Registrant’s telephone number, including area code: | | 973-802-2991 |
| |
Date of fiscal year end: | | 10/31/2004 |
| |
Date of reporting period: | | 10/31/2004 |
Item 1 – Reports to Stockholders – [ INSERT REPORT ]

Jennison Value Fund
| | |
OCTOBER 31, 2004 | | ANNUAL REPORT |

FUND TYPE
Large-capitalization stock
OBJECTIVE
Capital appreciation
This report is not authorized for distribution to prospective investors unless preceded or accompanied by a current prospectus.
The views expressed in this report and information about the Fund’s portfolio holdings are for the period covered by this report and are subject to change thereafter.
JennisonDryden is a registered trademark of The Prudential Insurance Company of America.

Dear Shareholder,
December 15, 2004
We hope that you find the annual report for the Jennison Value Fund informative and useful. As a JennisonDryden mutual fund shareholder, you may be thinking where you can find additional growth opportunities. You could invest in last year’s top-performing asset class and hope that history repeats itself or you could stay in cash while waiting for the “right moment” to invest.
We believe it is wise to take advantage of developing domestic and global investment opportunities through a diversified portfolio of stock and bond mutual funds. A diversified asset allocation offers two advantages. It helps you manage downside risk by not being overly exposed to any particular asset class, plus it gives you a better opportunity of having at least some of your assets in the right place at the right time. Your financial professional can help you create a diversified investment plan that may include mutual funds that cover all the basic asset classes and is reflective of your personal investor profile and tolerance for risk.
JennisonDryden mutual funds give you a wide range of choices that can help you make progress toward your financial goals. Our funds offer the experience, resources, and professional discipline of three leading asset managers. They are recognized and respected in the institutional market and by discerning investors for excellence in their respective strategies. JennisonDryden equity funds are advised by Jennison Associates LLC and/or Quantitative Management Associates LLC (QMA). Prudential Investment Management, Inc. (PIM) advises the JennisonDryden fixed income and money market funds. Jennison Associates, QMA, and PIM are registered investment advisers and Prudential Financial companies.
Thank you for choosing JennisonDryden mutual funds.
Sincerely,

Judy A. Rice, President
Jennison Value Fund
Your Fund’s Performance
Fund objective
The investment objective of the Jennison Value Fund (the Fund) is capital appreciation. There can be no assurance that the Fund will achieve its investment objective.
Performance data quoted represent past performance. Past performance does not guarantee future results. The investment return and principal value of an investment will fluctuate so that an investor’s shares, when redeemed, may be worth more or less than their original cost. Current performance may be lower or higher than the past performance data quoted. An investor may obtain performance data current to the most recent month-end by visiting our website at www.jennisondryden.com or by calling (800) 225-1852. The maximum initial sales charge is 5.50% (Class A shares).
| | | | | | | | | | | |
Cumulative Total Returns1 as of 10/31/04 |
| | | One Year | | | Five Years | | | Ten Years | | | Since Inception2 |
Class A | | 16.21 | % | | 28.30 | % | | 151.40 | % | | 337.51% |
Class B | | 15.34 | | | 23.48 | | | 133.12 | | | 380.24 (379.95) |
Class C | | 15.34 | | | 23.48 | | | 133.12 | | | 134.17 |
Class Z | | 16.49 | | | 29.95 | | | N/A | | | 108.17 |
S&P 500 Index3 | | 9.41 | | | –10.60 | | | 184.01 | | | *** |
Russell 1000 Value Index4 | | 15.45 | | | 18.71 | | | 226.46 | | | **** |
Lipper Multi-Cap Value Funds Avg.5 | | 12.77 | | | 24.58 | | | 181.69 | | | ***** |
| | | | | | | | | | | | |
Average Annual Total Returns1 as of 9/30/04 |
| | | One Year | | | Five Years | | | Ten Years | | | Since Inception2 |
Class A | | 12.68 | % | | 3.55 | % | | 8.88 | % | | 10.03% |
Class B | | 13.28 | | | 3.78 | | | 8.68 | | | 9.19 (9.18) |
Class C | | 17.28 | | | 3.94 | | | 8.68 | | | 8.58 |
Class Z | | 19.52 | | | 4.98 | | | N/A | | | 8.72 |
S&P 500 Index3 | | 13.86 | | | –1.31 | | | 11.08 | | | *** |
Russell 1000 Value Index4 | | 20.52 | | | 4.31 | | | 12.53 | | | **** |
Lipper Multi-Cap Value Funds Avg.5 | | 17.67 | | | 4.81 | | | 10.71 | | | ***** |
The cumulative total returns do not reflect the deduction of applicable sales charges. If reflected, the applicable sales charges would reduce the cumulative total returns performance quoted. Class A shares are subject to a maximum front-end sales charge of 5.50%. Under certain circumstances, Class A shares may be subject to a contingent deferred sales charge (CDSC) of 1%. Class B and Class C shares are subject to a maximum CDSC of 5% and 1% respectively. Class Z shares are not subject to a sales charge.
| | |
| 2 | | Visit our website at www.jennisondryden.com |
1Source: Prudential Investments LLC and Lipper Inc. The average annual total returns take into account applicable sales charges. During certain periods shown, fee waivers and/or expense reimbursements were in effect. Without such fee waivers and expense reimbursements, the returns for the classes would have been lower. Class A, Class B, and Class C shares are subject to an annual distribution and service (12b-1) fee of up to 0.30%, 1.00%, and 1.00% respectively. Approximately seven years after purchase, Class B shares will automatically convert to Class A shares on a quarterly basis. Class Z shares are not subject to a 12b-1 fee. The returns in the tables do not reflect the deduction of taxes that a shareholder would pay on Fund distributions or following the redemption of Fund shares. Without waiver of fees and/or expense subsidization, the Fund’s returns would have been lower, as indicated in parentheses.
2Inception dates: Class A, 1/22/90; Class B, 1/22/87; Class C, 8/1/94; and Class Z, 3/1/96.
3The Standard & Poor’s 500 Composite Stock Price Index (S&P 500 Index) is an unmanaged index of 500 stocks of large U.S. companies. It gives a broad look at how stock prices have performed in the United States.
4The Russell 1000 Value Index is an unmanaged index comprising those securities in the Russell 1000 Index with a lesser-than-average growth orientation. Companies in this index generally have low price-to-book and price-to-earnings ratios, higher dividend yields, and lower forecasted growth values.
5The Lipper Multi-Cap Value Funds Average (Lipper Average) represents returns based on an average return of all funds in the Lipper Multi-Cap Value Funds category for the periods noted. Funds in the Lipper Average typically have a below-average price-to-earnings ratio, price-to-book ratio, and three-year sales-per-share growth value compared with the S&P SuperComposite 1500 Index.
Investors cannot invest directly in an index. The returns for the S&P 500 Index, the Russell 1000 Value Index, and the Lipper Average would be lower if they included the effects of sales charges, operating expenses, or taxes. Returns for the Lipper Average reflect the deduction of operating expenses, but not sales charges or taxes.
***S&P 500 Index Since Inception cumulative total returns as of 10/31/04 are 371.95% for Class A, 526.62% for Class B, 194.87% for Class C, and 102.34% for Class Z. S&P 500 Index Since Inception average annual total returns as of 9/30/04 are 11.04% for Class A, 10.85% for Class B, 11.06% for Class C, and 8.37% for Class Z.
**** Russell 1000 Value Index Since Inception cumulative total returns as of 10/31/04 are 439.70% for Class A, 603.05% for Class B, 229.25% for Class C, and 133.93% for Class Z. Russell 1000 Value Index Since Inception average annual total returns as of 9/30/04 are 12.05% for Class A, 11.57% for Class B, 12.25% for Class C, and 10.20% for Class Z.
*****Lipper Average Since Inception cumulative total returns as of 10/31/04 are 382.22% for Class A, 495.28% for Class B, 188.25% for Class C, and 107.91% for Class Z. Lipper Average Since Inception average annual total returns as of 9/30/04 are 10.99% for Class A, 10.27% for Class B, 10.69% for Class C, and 8.57% for Class Z.
| | | |
Five Largest Holdings expressed as a percentage of net assets as of 10/31/04 | | | |
Citigroup, Inc., Diversified Financial Services | | 3.0 | % |
Bank of America Corp., Commercial Banks | | 2.5 | |
TXU Corp., Electric Utilities | | 2.4 | |
Xerox Corp., Office Electronics | | 2.4 | |
Lehman Brothers Holdings, Inc., Capital Markets | | 2.3 | |
Holdings are subject to change.
| | | |
Five Largest Industries expressed as a percentage of net assets as of 10/31/04 | | | |
Oil & Gas | | 11.4 | % |
Insurance | | 8.4 | |
Capital Markets | | 6.3 | |
Diversified Financial Services | | 6.3 | |
Electric Utilities | | 5.8 | |
Industry weightings are subject to change.
Investment Adviser’s Report
Jennison Associates LLC
Overview
Over the fiscal year, the Fund’s Class A shares outperformed its benchmark, the Russell 1000 Value Index, as well as the S&P Barra Value and the S&P 500 Indexes. Over the past 12 months, the equity markets were unsettled by mixed economic data. In the first half of this period, we saw solid economic growth and a dramatic rebound in corporate earnings that led to stronger equity returns. However, consumer spending was crimped by the rise in energy costs, reduced mortgage refinancing activity, and the absence of tax rebates in 2004. The economy seemed stronger than it was because companies realized they had too little inventory and began to restock these inventories, so production exceeded end demand. In the second half of 2004 through the end of the Fund’s reporting period, growth slowed and market returns were relatively flat. Increased geopolitical uncertainty and the impact of high energy prices on the growth of corporate profits, the pace of economic activity, and inflation were among chief concerns for investors. Despite the slowdown in growth, we believe we are still in an expansionary economy; the U.S. Federal Reserve raised interest rates three times during the reporting period.
Energy holdings benefited from rising oil prices
Energy stocks led the Fund’s performance as oil’s rise from approximately $29 per barrel to more than $50 confirmed our bullish expectations. Demand for oil was much higher than original forecasts, pushing up its price. While attention has been focused on demand from the booming Chinese economy, demand for oil was much stronger than expected in almost all economies globally, including the United States. In addition, concerns regarding the supply of oil emerged over the last year. Major integrated oil companies reported declining production figures and/or restated their reserves. Experts are now questioning whether OPEC has sufficient slack capacity to handle current world demand. Terrorist attacks on oil targets in Iraq and Saudi Arabia, labor unrest in Nigeria and Venezuela, hurricanes in the Gulf of Mexico, and Yukos’ bankruptcy, among other factors, prodded fears of unpredictable supply disruptions. With non-OPEC oil production nearing its peak and OPEC operating at close to 100% of its capacity, we believe that oil prices will remain high relative to historical levels and will drive increased drilling and drilling-related activity. Together, these factors benefited our energy equipment & services holdings, such as Halliburton, GlobalSantaFe, and Schlumberger, and our oil & gas holdings, such as Occidental Petroleum, Total S.A., and Suncor Energy.
Our electric utilities holdings were strong contributors
Positions in TXU and FirstEnergy led the Fund’s utilities holdings. We watch for catalysts and warning signs to avoid “value traps”—stocks that appear attractively valued, but which will continue to underperform the market. TXU contains many of
| | |
| 4 | | Visit our website at www.jennisondryden.com |
the catalysts and none of the warning signs we look for when analyzing a security for purchase. It was the Fund’s top overall contributor.
We bought TXU in April 2003 when it was a “plain old” utility story, using strong cash flow to reduce bloated debt levels following a disastrous expansion effort in the late 1990s. New CEO John Wilder (formerly Entergy’s CFO) arrived in February 2004 and quickly crafted a plan to create an integrated energy merchant with superior earnings growth potential, free cash flow, financial flexibility, and senior management. The dramatic corporate restructuring had a greater impact on earnings than even the most bullish analysts expected. The company raised its earnings forecasts for the remainder of 2004 (the last two quarters of the year) to $2.65 and for 2005 to $5.70, up from 2003 earnings per share of $2.03, and announced additional details of its continuing cost-cutting efforts. Furthermore, TXU raised its dividend for the fourth quarter of 2004 by 350% over the previous quarter. Finally, TXU authorized a buyback of 50 million shares. We believe the stock price still does not reflect the full potential earnings impact of Wilder’s restructuring.
The current rules governing competition for utility companies in Texas, which are based on the prices of natural gas, have further benefited TXU. As an electric utility provider with a nuclear plant, TXU benefited from both higher power prices and relatively flat production costs. TXU has already used its allowed two price changes this year. Should natural gas prices fall and stay lower for a prolonged period of time, competitors could offer lower rates. However, with the current natural gas supply/demand imbalance, this is unlikely.
FirstEnergy performed well due to the return to service of its Davis-Besse nuclear plant, which had been off-line for roughly two years. This should allow FirstEnergy to return to its prior high levels of free cash flow. FirstEnergy shares also benefited when the company was found not negligent in the blackout of 2003.
Technology holdings varied
The technology sector was the biggest detractor from overall returns. However, individual positions in the sector, such as Xerox (see Comments on Largest Holdings), added significantly, while others, such as Agere Systems and Nortel Networks, hurt performance.
Agere was the biggest disappointment in the Fund. It is a supplier of semiconductors to the hard disk drive, wireless handset, and telecommunications infrastructure markets. When it was wholly owned by Lucent, Agere suffered from its inability to sell to certain potential customers that competed with Lucent. After its spinout in
Investment Adviser’s Report (continued)
2002, we expected Agere to rapidly increase its contracts with those companies. Moreover, hard disk drive units, wireless handset units, and telecommunications infrastructure were all rebounding from cyclical lows. We expected the stock, which was cheaper than any other semiconductor manufacturer, to rebound as well. Unfortunately, design wins from other customers were much slower than expected, so when two large customers faced inventory corrections, sales declined. Agere was still too dependent on four large firms for close to 40% of its sales. Were it just an inventory correction, we would have had more patience, but the lack of new customers pushed us to sell the stock after the end of the Fund’s fiscal year.
We established a position in Nortel Networks subsequent to revelations that forced it to restate its earnings. After the management team that was responsible was removed, the new management team—who had every incentive to tell the truth—insisted that the restatement would have minimal impact on the firm’s revenues and cash flow. We felt comfortable that so long as the revenues were sound, the new management team would be able to manage the business to high single-digit to low double-digit margins, and the stock would prove inexpensive. As we write this letter, however, Nortel still has not filed its audited financial statements. This has caused two problems. First, the uncertainty has driven the stock lower. Second, revenue guidance was lowered from mid-single-digit growth to low-single-digit growth, likely due to customers’ uncertainty from the lack of financials. Since the impact on revenue thus far appears to be minimal, we continue to hold the stock, but are monitoring the situation very closely.
Returns on our consumer staples trailed the benchmark
The largest detractor in the consumer staples sector was Kroger, the supermarket retailing chain. We initiated our position in August 2003 and continue to hold the stock. Our confidence in Kroger rests on two major factors. First, most of Kroger’s stores already compete with Wal-Mart, and Kroger has already been aggressive about lowering prices to compete; thus the incremental competition coming from Wal-Mart is low. Second, food-cost inflation, coming from its recent low levels, is good for supermarkets because they can raise prices slightly higher than the underlying inflation rate and expand margins. This is just beginning to happen. With the Southern California strikes resolved in the industry’s favor, we think that the relative cost structure will improve as well. We continue to like the story, especially if management were to cut capital expenditures as well. We expect the stock to be a strong performer for the Fund in the next couple of years.
Outlook
In general, we think earnings came through quite strongly for the first three quarters of 2004, and the question remains as to whether the economy will remain strong in
| | |
| 6 | | Visit our website at www.jennisondryden.com |
2005. We continue to look for attractively valued stocks with strong free cash flow and steadily rising earnings. We prefer companies that can produce steady growth regardless of the economic climate to companies with explosive growth whose ability to sustain that growth may be less certain.
Although we remain confident about the long-term supply/demand imbalance for energy, we have reduced our sector weighting somewhat because share prices have already risen substantially.
The Portfolio of Investments following this report shows the size of the Fund’s positions at period-end.
Comments on Largest Holdings
Holdings expressed as a percentage of the Fund’s net assets as of 10/31/04.
| 3.0% | Citigroup Inc./Diversified Financial Services |
Citigroup is a diversified financial services company that, among other things, provides investment banking, retail brokerage, and corporate banking services. We believe the company’s fundamentals are sound and the stock is reasonably valued.
| 2.5% | Bank of America Corp./Commercial Banks |
Bank of America provides financial services and products both domestically and internationally. As a shareholder of FleetBoston, we were issued stock in Bank of America when it merged with FleetBoston. We added to our position at an attractive price because of the market’s low expectations for the combined firm. However, the merger proved to be synergistic and resulted in cost savings. The bank’s better-than-expected bottom line and increase in revenues are among other positive developments.
| 2.4% | TXU Corp./Electric Utilities |
TXU’s rapid corporate transformation, designed by new CEO John Wilder, led to greater earnings revisions than even the most bullish analysts expected, including us. TXU has many catalysts that should positively affect its stock price and increase shareholder value.
| 2.4% | Xerox Corp./Office Electronics |
Our investment thesis on Xerox continues to unfold as the company’s massive restructuring has resulted in revenue growth that is close at hand. The stock is currently trading at 10 times free cash flow, and we believe the next move up in the stock will begin when revenue growth accelerates.
| 2.3% | Lehman Brothers Holdings, Inc./Capital Markets |
Lehman’s principal activity is to provide investment banking services to institutional, corporate, government, and high-net-worth individuals and customers. Despite Lehman being traditionally identified with the bond market, we believe investors underestimate the impact of rebounding equity activity on the company.
Holdings are subject to change.
| | |
| 8 | | Visit our website at www.jennisondryden.com |
Fees and Expenses (Unaudited)
As a shareholder of the Fund, you incur two types of costs: (1) transaction costs, including sales charges (loads) on purchase payments and redemptions, as applicable, and (2) ongoing costs, including management fees, distribution and/or service (12b-1) fees, and other Fund expenses, as applicable. This example is intended to help you understand your ongoing costs (in dollars) of investing in the Fund and to compare these costs with the ongoing costs of investing in other mutual funds.
The example is based on an investment of $1,000 invested on May 1, 2004, at the beginning of the period, and held through the six-month period ended October 31, 2004.
Actual Expenses
The first line for each share class in the following table provides information about actual account values and actual expenses. You may use the information in this line, together with the amount you invested, to estimate the expenses that you paid over the period. Simply divide your account value by $1,000 (for example, an $8,600 account value ÷ $1,000 = 8.6), then multiply the result by the number in the first line under the heading “Expenses Paid During the Six-Month Period” to estimate the expenses you paid on your account during this period. The Fund may charge additional fees to holders of certain accounts that are not included in the expenses shown in the table. These fees apply to Individual Retirement Accounts (IRAs), 403(b) accounts, and Section 529 plan accounts. As of the close of the six months covered by the table, IRA fees included a setup fee of $5, a maintenance fee of up to $36 annually ($18 for the six-month period), and a termination fee of $10. 403(b) accounts and Section 529 plan accounts are each charged an annual $25 fiduciary maintenance fee ($12.50 for the six-month period). Some of the fees vary in amount, or are waived, based on your total account balance or the number of JennisonDryden or Strategic Partners funds, including the Fund, that you own. You should consider the additional fees that were charged to your Fund account over the six-month period when you estimate the total ongoing expenses paid over the period and the impact of these fees on your ending account value, as these additional expenses are not reflected in the information provided in the expense table. Additional fees have the effect of reducing investment returns.
Hypothetical Example for Comparison Purposes
The second line for each share class in the following table provides information about hypothetical account values and hypothetical expenses based on the Fund’s actual expense ratio and an assumed rate of return of 5% per year before expenses, which is not the Fund’s actual return. The hypothetical account values and expenses may not be used to estimate the actual ending account balance or expenses you paid for the period. You may use this information to compare the ongoing costs of investing in the Fund and other funds. To do so, compare this 5% hypothetical example with the 5% hypothetical examples that appear in the shareholder reports of the other funds. The
Fund may charge additional fees to holders of certain accounts that are not included in the expenses shown in the table. These fees apply to Individual Retirement Accounts (IRAs), 403(b) accounts, and Section 529 plan accounts. As of the close of the six months covered by the table, IRA fees included a setup fee of $5, a maintenance fee of up to $36 annually ($18 for the six-month period), and a termination fee of $10. 403(b) accounts and Section 529 plan accounts are each charged an annual $25 fiduciary maintenance fee ($12.50 for the six-month period). Some of the fees vary in amount, or are waived, based on your total account balance or the number of JennisonDryden or Strategic Partners funds, including the Fund, that you own. You should consider the additional fees that were charged to your Fund account over the six-month period when you estimate the total ongoing expenses paid over the period and the impact of these fees on your ending account value, as such additional expenses are not reflected in the information provided in the expense table. Additional fees have the effect of reducing investment returns.
Please note that the expenses shown in the table are meant to highlight your ongoing costs only, and do not reflect any transactional costs such as sales charges (loads). Therefore the second line for each share class in the table is useful in comparing ongoing costs only, and will not help you determine the relative total costs of owning different funds. In addition, if these transactional costs were included, your costs would have been higher.
| | | | | | | | | | | | | | |
| Jennison Value Fund | | Beginning Account
Value May 1, 2004 | | Ending Account
Value October 31, 2004 | | Annualized
Expense Ratio
Based on the
Six-Month Period | | | Expenses Paid
During the Six-
Month Period* |
| | | | | | | | | | | | | | | |
| Class A | | Actual | | $ | 1,000 | | $ | 1,038 | | 1.07 | % | | $ | 5.48 |
| | | Hypothetical | | $ | 1,000 | | $ | 1,020 | | 1.07 | % | | $ | 5.43 |
| | | | | | | | | | | | | | | |
| Class B | | Actual | | $ | 1,000 | | $ | 1,034 | | 1.82 | % | | $ | 9.31 |
| | | Hypothetical | | $ | 1,000 | | $ | 1,016 | | 1.82 | % | | $ | 9.22 |
| | | | | | | | | | | | | | | |
| Class C | | Actual | | $ | 1,000 | | $ | 1,034 | | 1.82 | % | | $ | 9.31 |
| | | Hypothetical | | $ | 1,000 | | $ | 1,016 | | 1.82 | % | | $ | 9.22 |
| | | | | | | | | | | | | | | |
| Class Z | | Actual | | $ | 1,000 | | $ | 1,039 | | 0.82 | % | | $ | 4.20 |
| | | Hypothetical | | $ | 1,000 | | $ | 1,021 | | 0.82 | % | | $ | 4.17 |
| | | | | | | | | | | | | | | |
* Fund expenses for each share class are equal to the annualized expense ratio for each share class (provided in the table), multiplied by the average account value over the period, multiplied by the 184 days in the six-month period ended October 31, 2004, and divided by the 366 days in the year ended October 31, 2004 (to reflect the six-month period).
| | |
| 10 | | Visit our website at www.jennisondryden.com |
Portfolio of Investments
as of October 31, 2004
| | | | | |
| Shares | | Description | | Value (Note 1) |
| | | | | | |
LONG-TERM INVESTMENTS 97.2% | | | |
COMMON STOCKS | | | |
| |
Aerospace & Defense 3.0% | | | |
| 309,800 | | Lockheed Martin Corp. | | $ | 17,066,882 |
| 166,000 | | Northrop Grumman Corp.(b) | | | 8,590,500 |
| | | | |
|
|
| | | | | | 25,657,382 |
| |
Biotechnology 0.7% | | | |
| 215,800 | | MedImmune, Inc.(a)(b) | | | 6,133,036 |
| |
Capital Markets 6.3% | | | |
| 238,100 | | Lehman Brothers Holdings, Inc.(b) | | | 19,559,915 |
| 274,400 | | Mellon Financial Corp. | | | 7,930,160 |
| 225,000 | | Merrill Lynch & Co., Inc. | | | 12,136,500 |
| 419,300 | | The Bank of New York Co., Inc. | | | 13,610,478 |
| | | | |
|
|
| | | | | | 53,237,053 |
| |
Chemicals 1.2% | | | |
| 706,600 | | The Mosaic Co.(a)(b) | | | 10,627,264 |
| |
Commercial Banks 2.5% | | | |
| 465,718 | | Bank of America Corp.(b) | | | 20,859,509 |
| |
Commercial Services & Supplies 2.4% | | | |
| 403,000 | | Cendant Corp.(b) | | | 8,297,770 |
| 431,400 | | Waste Management, Inc. | | | 12,286,272 |
| | | | |
|
|
| | | | | | 20,584,042 |
| |
Communications Equipment 1.0% | | | |
| 2,477,700 | | Nortel Networks Corp. (Canada)(a) | | | 8,399,403 |
| |
Computers & Peripherals 0.7% | | | |
| 340,321 | | Hewlett-Packard Co.(b) | | | 6,350,390 |
| |
Consumer Finance 1.8% | | | |
| 123,000 | | American Express Co.(b) | | | 6,527,610 |
| 344,400 | | MBNA Corp. | | | 8,826,972 |
| | | | |
|
|
| | | | | | 15,354,582 |
| |
Diversified Financial Services 6.3% | | | |
| 581,900 | | Citigroup, Inc. | | | 25,818,903 |
| 362,200 | | J. P. Morgan Chase & Co. | | | 13,980,920 |
See Notes to Financial Statements.
Portfolio of Investments
as of October 31, 2004 Cont’d.
| | | | | |
| Shares | | Description | | Value (Note 1) |
| | | | | | |
| 367,400 | | Principal Financial Group, Inc. | | $ | 13,873,024 |
| | | | |
|
|
| | | | | | 53,672,847 |
| |
Diversified Telecommunication Services 4.2% | | | |
| 172,100 | | ALLTEL Corp. | | | 9,453,453 |
| 715,200 | | SBC Communications, Inc.(b) | | | 18,065,952 |
| 218,500 | | Verizon Communications, Inc.(b) | | | 8,543,350 |
| | | | |
|
|
| | | | | | 36,062,755 |
| |
Electric Utilities 5.8% | | | |
| 77,600 | | E.ON AG ADR (Germany) | | | 6,328,280 |
| 261,200 | | Exelon Corp.(b) | | | 10,348,744 |
| 104,300 | | FirstEnergy Corp. | | | 4,310,719 |
| 234,800 | | PG&E Corp.(a)(b) | | | 7,522,992 |
| 338,300 | | TXU Corp. | | | 20,710,726 |
| | | | |
|
|
| | | | | | 49,221,461 |
| |
Electronic Equipment & Instruments 0.9% | | | |
| 318,300 | | Agilent Technologies, Inc.(a)(b) | | | 7,976,598 |
| |
Energy Equipment & Services 5.2% | | | |
| 127,400 | | ENSCO International, Inc.(b) | | | 3,892,070 |
| 489,300 | | GlobalSantaFe Corp. | | | 14,434,350 |
| 502,300 | | Halliburton Co.(b) | | | 18,605,192 |
| 118,200 | | Schlumberger Ltd. (Netherlands)(b) | | | 7,439,508 |
| | | | |
|
|
| | | | | | 44,371,120 |
| |
Food & Staples Retailing 2.0% | | | |
| 1,098,900 | | The Kroger Co.(a)(b) | | | 16,604,379 |
| |
Health Care Providers & Services 4.0% | | | |
| 192,300 | | CIGNA Corp.(b) | | | 12,203,358 |
| 222,900 | | Express Scripts, Inc.(a)(b) | | | 14,265,600 |
| 216,270 | | Medco Health Solutions, Inc.(a) | | | 7,333,716 |
| | | | |
|
|
| | | | | | 33,802,674 |
| |
Hotels Restaurants & Leisure 0.9% | | | |
| 274,800 | | McDonald’s Corp. | | | 8,010,420 |
| |
Household Products 1.2% | | | |
| 177,500 | | Kimberly-Clark Corp. | | | 10,591,425 |
See Notes to Financial Statements.
| | |
| 12 | | Visit our website at www.jennisondryden.com |
| | | | | |
| Shares | | Description | | Value (Note 1) |
| | | | | | |
| |
Industrial Conglomerates 5.1% | | | |
| 496,600 | | General Electric Co. | | $ | 16,943,992 |
| 115,100 | | Phelps Dodge Corp.(b) | | | 10,075,854 |
| 522,900 | | Tyco International Ltd. | | | 16,288,335 |
| | | | |
|
|
| | | | | | 43,308,181 |
| |
Insurance 8.4% | | | |
| 196,200 | | Allstate Corp.(b) | | | 9,435,258 |
| 534,900 | | Genworth Financial, Inc. (Class A) | | | 12,762,714 |
| 212,700 | | Loews Corp. | | | 12,740,730 |
| 107,000 | | MBIA, Inc.(b) | | | 6,191,020 |
| 376,973 | | The St. Paul Travelers Cos., Inc. | | | 12,802,003 |
| 235,700 | | XL Capital Ltd. (Class A)(b) | | | 17,088,250 |
| | | | |
|
|
| | | | | | 71,019,975 |
| |
IT Services 1.2% | | | |
| 412,300 | | Accenture Ltd. (Class A)(Bermuda)(a) | | | 9,981,783 |
| |
Media 3.1% | | | |
| 269,945 | | News Corp. Ltd., ADR (Australia) (Class A)(b) | | | 8,487,071 |
| 580,000 | | The DIRECTV Group, Inc.(a)(b) | | | 9,726,600 |
| 214,115 | | Viacom, Inc. (Class B) | | | 7,813,056 |
| | | | |
|
|
| | | | | | 26,026,727 |
| |
Multi-Utilities & Unregulated 2.9% | | | |
| 180,300 | | Dominion Resources, Inc.(b) | | | 11,596,896 |
| 396,400 | | Sempra Energy | | | 13,295,256 |
| | | | |
|
|
| | | | | | 24,892,152 |
| |
Office Electronics 2.4% | | | |
| 1,362,800 | | Xerox Corp.(a)(b) | | | 20,128,556 |
| |
Oil & Gas 11.4% | | | |
| 134,400 | | Eni S.p.A., ADR (Italy) | | | 15,379,392 |
| 137,200 | | Exxon Mobil Corp. | | | 6,752,984 |
| 156,800 | | Kerr-McGee Corp.(b) | | | 9,285,696 |
| 357,200 | | Nexen, Inc. (Canada) | | | 15,202,432 |
| 317,100 | | Occidental Petroleum Corp. | | | 17,703,693 |
| 522,200 | | Suncor Energy, Inc. (Canada) | | | 17,807,020 |
| 137,900 | | Total S.A., ADR (France) | | | 14,380,212 |
| | | | |
|
|
| | | | | | 96,511,429 |
See Notes to Financial Statements.
Portfolio of Investments
as of October 31, 2004 Cont’d.
| | | | | |
| Shares | | Description | | Value (Note 1) |
| | | | | | |
| |
Paper & Forest Products 3.1% | | | |
| 229,200 | | Boise Cascade Corp. | | $ | 6,765,984 |
| 331,400 | | Georgia-Pacific Corp. | | | 11,463,126 |
| 208,400 | | International Paper Co.(b) | | | 8,025,484 |
| | | | |
|
|
| | | | | | 26,254,594 |
| |
Pharmaceuticals 3.6% | | | |
| 160,200 | | Eli Lilly & Co. | | | 8,796,582 |
| 307,600 | | Novartis A.G., ADR (Switzerland) | | | 14,767,876 |
| 184,419 | | Wyeth | | | 7,312,213 |
| | | | |
|
|
| | | | | | 30,876,671 |
| |
Semiconductor & Semiconductor Equipment 0.5% | | | |
| 3,364,400 | | Agere Systems, Inc. (Class B)(a) | | | 3,869,060 |
| |
Software 1.0% | | | |
| 316,800 | | Microsoft Corp. | | | 8,867,232 |
| |
Specialty Retail 1.4% | | | |
| 663,300 | | Toys ‘R’ Us, Inc.(a)(b) | | | 11,946,033 |
| |
Thrifts & Mortgage Finance 1.0% | | | |
| 125,000 | | Freddie Mac | | | 8,325,000 |
| |
Tobacco 2.0% | | | |
| 352,200 | | Altria Group, Inc. | | | 17,067,612 |
| | | | |
|
|
| | | Total long-term investments
(cost $673,762,838) | | | 826,591,345 |
| | | | |
|
|
See Notes to Financial Statements.
| | |
| 14 | | Visit our website at www.jennisondryden.com |
| | | | | | |
| Shares | | Description | | Value (Note 1) | |
| | | | | | | |
SHORT-TERM INVESTMENTS 30.7% | | | | |
| |
Mutual Fund 30.7% | | | | |
| 261,237,618 | | Dryden Core Investment Fund-Taxable Money Market Series(c) (Note 3) | | $ | 261,237,618 | |
| |
Repurchase Agreement | | | | |
Principal
Amount (000)
| | | | | |
| 122 | | State Street Bank & Trust Co. Repurchase Agreement,
dated 10/29/04, 0.25%, due 11/1/04(d) | | | 122,000 | |
| | | | |
|
|
|
| | | Total short-term investments
(cost $261,359,618) | | | 261,359,618 | |
| | | | |
|
|
|
| | | Total Investments 127.9%
(cost $935,122,456; Note 5) | | | 1,087,950,963 | |
| | | Liabilities in excess of other assets ( 27.9%) | | | (237,645,318 | ) |
| | | | |
|
|
|
| | | Net Assets 100% | | $ | 850,305,645 | |
| | | | |
|
|
|
| (a) | Non-income producing security. |
| (b) | Portion of securities on loan with an aggregate market value of $229,293,946; cash collateral $237,981,769 was received with which the portfolio purchased short term highly liquid securities. See Note 4. |
| (c) | Represents security, or portion thereof, purchased with cash collateral received for securities on loan. |
| (d) | Repurchase price of $122,000. Collateralized by $90,000 U.S. Treasury Notes with a rate of 8.875%, maturity date of 08/15/17, and aggregate market value, including accrued interest of $130,651. |
ADR—American Depositary Receipt.
See Notes to Financial Statements.
Portfolio of Investments
as of October 31, 2004 Cont’d.
The industry classification of long-term portfolio holdings, short term investments and other liabilities in excess of assets shown as a percentage of net assets as of October 31, 2004 was as follows:
| | | |
Oil & Gas | | 11.4 | % |
Insurance | | 8.4 | |
Capital Markets | | 6.3 | |
Diversified Financial Services | | 6.3 | |
Electric Utilities | | 5.8 | |
Energy Equipment & Services | | 5.2 | |
Industrial Conglomerates | | 5.1 | |
Diversified Telecommunication Services | | 4.2 | |
Health Care Providers & Services | | 4.0 | |
Pharmaceuticals | | 3.6 | |
Media | | 3.1 | |
Paper & Forest Products | | 3.1 | |
Aerospace & Defense | | 3.0 | |
Multi-Utilities & Unregulated | | 2.9 | |
Commercial Banks | | 2.5 | |
Commercial Services & Supplies | | 2.4 | |
Office Electronics | | 2.4 | |
Food & Staples Retailing | | 2.0 | |
Tobacco | | 2.0 | |
Consumer Finance | | 1.8 | |
Specialty Retail | | 1.4 | |
Chemicals | | 1.2 | |
Household Products | | 1.2 | |
IT Services | | 1.2 | |
Communications Equipment | | 1.0 | |
Software | | 1.0 | |
Thrifts & Mortgage Finance | | 1.0 | |
Electronic Equipment & Instruments | | 0.9 | |
Hotel Restaurants & Leisure | | 0.9 | |
Biotechnology | | 0.7 | |
Computers & Peripherals | | 0.7 | |
Semiconductor & Semiconductor Equipment | | 0.5 | |
Short Term Investments | | 30.7 | |
| | |
|
|
| | | 127.9 | |
Other liabilities in excess of assets | | (27.9 | ) |
| | |
|
|
Total | | 100.0 | % |
| | |
|
|
See Notes to Financial Statements.
| | |
| 16 | | Visit our website at www.jennisondryden.com |
Statement of Assets and Liabilities
| | |
| OCTOBER 31, 2004 | | ANNUAL REPORT |
Jennison Value Fund
Statement of Assets and Liabilities
as of October 31, 2004
| | | | |
Assets | | | | |
Investments, at value including securities on loan of $229,293,946 (cost $935,122,456) | | $ | 1,087,950,963 | |
Cash | | | 915 | |
Dividends and interest receivable | | | 864,745 | |
Receivable for investments sold | | | 784,182 | |
Receivable for Fund shares sold | | | 741,316 | |
Tax reclaim receivable | | | 72,818 | |
Prepaid expenses | | | 36,815 | |
| | |
|
|
|
Total assets | | | 1,090,451,754 | |
| | |
|
|
|
| |
Liabilities | | | | |
Payable to broker for collateral for securities on loan (Note 4) | | | 237,981,769 | |
Payable for Fund shares reacquired | | | 1,108,490 | |
Management fee payable | | | 400,068 | |
Accrued expenses | | | 341,175 | |
Distribution fee payable | | | 308,072 | |
Withholding tax payable | | | 4,517 | |
Deferred trustees’ fees | | | 2,018 | |
| | |
|
|
|
Total liabilities | | | 240,146,109 | |
| | |
|
|
|
| |
Net Assets | | $ | 850,305,645 | |
| | |
|
|
|
| | | | | |
Net assets were comprised of: | | | | |
Shares of beneficial interest, at par | | $ | 510,555 | |
Paid-in capital in excess of par | | | 768,183,823 | |
| | |
|
|
|
| | | | 768,694,378 | |
Undistributed net investment income | | | 3,355,008 | |
Accumulated net realized loss on investments and foreign currency transactions | | | (74,572,248 | ) |
Net unrealized appreciation on investments | | | 152,828,507 | |
| | |
|
|
|
Net assets, October 31, 2004 | | $ | 850,305,645 | |
| | |
|
|
|
See Notes to Financial Statements.
| | |
| 18 | | Visit our website at www.jennisondryden.com |
| | | |
Class A | | | |
Net asset value and redemption price per share | | | |
($610,345,404 ÷ 36,533,070 shares of beneficial interest issued and outstanding) | | $ | 16.71 |
Maximum sales charge (5.5% of offering price) | | | 0.97 |
| | |
|
|
Maximum offering price to public | | $ | 17.68 |
| | |
|
|
| |
Class B | | | |
Net asset value, offering price and redemption price per share | | | |
($193,229,524 ÷ 11,714,933 shares of beneficial interest issued and outstanding) | | $ | 16.49 |
| | |
|
|
| |
Class C | | | |
Net asset value, offering price and redemption price per share | | | |
($20,005,996 ÷ 1,212,926 shares of beneficial interest issued and outstanding) | | $ | 16.49 |
| | |
|
|
| |
Class Z | | | |
Net asset value, offering price and redemption price per share | | | |
($26,724,721 ÷ 1,594,523 shares of beneficial interest issued and outstanding) | | $ | 16.76 |
| | |
|
|
See Notes to Financial Statements.
Statement of Operations
Year Ended October 31, 2004
| | | |
Net Investment Income | | | |
Dividends and Interest (net of foreign withholding taxes of $245,283) | | $ | 14,805,349 |
Income from securities loaned, (net) | | | 183,914 |
| | |
|
|
Total income | | | 14,989,263 |
| | |
|
|
| |
Expenses | | | |
Management fee | | | 4,790,975 |
Distribution fee—Class A | | | 1,495,939 |
Distribution fee—Class B | | | 2,128,326 |
Distribution fee—Class C | | | 211,295 |
Transfer agent’s fees and expenses | | | 1,587,000 |
Reports to shareholders | | | 250,000 |
Custodian’s fees and expenses | | | 182,000 |
Registration fees | | | 68,000 |
Legal fees and expenses | | | 48,000 |
Trustees’ fees | | | 19,000 |
Audit fee | | | 18,000 |
Insurance | | | 15,000 |
Miscellaneous | | | 20,510 |
| | |
|
|
Total expenses | | | 10,834,045 |
| | |
|
|
Net investment income | | | 4,155,218 |
| | |
|
|
| |
Realized And Unrealized Gain On Investments and Foreign Currency Transactions | | | |
Net realized gain on: | | | |
Investment transactions | | | 50,464,169 |
Foreign currency transactions | | | 1,506 |
| | |
|
|
| | | | 50,465,675 |
| | |
|
|
Net change in unrealized appreciation on investments | | | 72,355,125 |
| | |
|
|
Net gain on investments | | | 122,820,800 |
| | |
|
|
Net Increase In Net Assets Resulting From Operations | | $ | 126,976,018 |
| | |
|
|
See Notes to Financial Statements.
| | |
| 20 | | Visit our website at www.jennisondryden.com |
Statement of Changes in Net Assets
| | | | | | | | |
| | | Year Ended October 31,
| |
| | | 2004 | | | 2003 | |
Increase (Decrease) In Net Assets | | | | | | | | |
Operations | | | | | | | | |
Net investment income | | $ | 4,155,218 | | | $ | 5,325,502 | |
Net realized gain (loss) on investments and foreign currency transactions | | | 50,465,675 | | | | (30,625,296 | ) |
Net change in unrealized appreciation on investments | | | 72,355,125 | | | | 169,812,824 | |
| | |
|
|
| |
|
|
|
Net increase in net assets resulting from operations | | | 126,976,018 | | | | 144,513,030 | |
| | |
|
|
| |
|
|
|
Dividends from net investment income (Note 1) | | | | | | | | |
Class A | | | (4,751,361 | ) | | | (3,629,646 | ) |
Class B | | | (208,524 | ) | | | — | |
Class C | | | (20,158 | ) | | | — | |
Class Z | | | (351,330 | ) | | | (313,603 | ) |
| | |
|
|
| |
|
|
|
| | | | (5,331,373 | ) | | | (3,943,249 | ) |
| | |
|
|
| |
|
|
|
| | |
Fund share transactions (net of share conversions) (Note 6) | | | | | | | | |
Net proceeds from shares sold | | | 73,749,089 | | | | 62,772,981 | |
Net asset value of shares issued in reinvestment of dividends | | | 4,922,847 | | | | 3,644,984 | |
Cost of shares reacquired | | | (177,888,261 | ) | | | (191,763,212 | ) |
| | |
|
|
| |
|
|
|
Net decrease in net assets from Fund share transactions | | | (99,216,325 | ) | | | (125,345,247 | ) |
| | |
|
|
| |
|
|
|
Total increase | | | 22,428,320 | | | | 15,224,534 | |
| | |
Net Assets | | | | | | | | |
Beginning of year | | | 827,877,325 | | | | 812,652,791 | |
| | |
|
|
| |
|
|
|
End of year(a) | | $ | 850,305,645 | | | $ | 827,877,325 | |
| | |
|
|
| |
|
|
|
(a) Includes undistributed net investment income of: | | $ | 3,355,008 | | | $ | 4,529,657 | |
| | |
|
|
| |
|
|
|
See Notes to Financial Statements.
Notes to Financial Statements
Jennison Value Fund (the “Fund”) is registered under the Investment Company Act of 1940 as a diversified, open-end, management investment company. The investment objective of the Fund is capital appreciation. It seeks to achieve this objective by investing primarily in common stocks and convertible securities that provide investment income returns above those of the Standard & Poor’s 500 Composite Stock Price Index or the NYSE Composite Index.
Note 1. Accounting Policies
The following is a summary of significant accounting policies followed by the Fund in the preparation of its financial statements.
Securities Valuation: Securities listed on a securities exchange are valued at the last sale price on such exchange on the day of valuation or, if there was no sale on such day, at the mean between the last reported bid and asked prices, or at the last bid price on such day in the absence of an asked price. Securities traded via Nasdaq are valued at the official closing price provided by Nasdaq. Securities that are actively traded in the over-the-counter market, including listed securities for which the primary market is believed by Prudential Investments LLC (“PI” or “Manager”) in consultation with the subadvisor, to be over-the-counter are valued at market value using prices provided by an independent pricing agent or principal market maker. Futures contracts and options thereon traded on a commodities exchange or board of trade are valued at the last sale price at the close of trading on such exchange or board of trade or, if there was no sale on the applicable commodities exchange or board of trade on such day, at the mean between the most recently quoted prices on such exchange or board of trade or at the last bid price in the absence of an asked price. Prices may be obtained from independent pricing services which use information provided by market makers or estimates of market values obtained from yield data relating to investments or securities with similar characteristics. Securities for which market quotations are not readily available, or whose values have been affected by events occurring after the close of the security’s foreign market and before the Series’ normal pricing time, are valued at fair value in accordance with the Board of Trustees approved fair valuation procedures. Using fair value to price securities may result in a value that is different from a security’s most recent closing price and from the price used by other mutual funds to calculate their net asset values. As of October 31, 2004, there were no securities valued in accordance with such procedures.
| | |
| 22 | | Visit our website at www.jennisondryden.com |
Investments in mutual funds are valued at their net asset value as of the close of the New York Stock Exchange on the date of valuation.
Short-term securities which mature in 60 days or less are valued at amortized cost, which approximates market-value. The amortized cost method includes valuing a security at its cost on the date of purchase and thereafter assuming a constant amortization to maturity of the difference between the principal amount due at maturity and cost. Short-term securities which mature in more than 60 days are valued at current market quotations.
Repurchase Agreements: In connection with transactions in repurchase agreements with United States financial institutions, it is the Fund’s policy that its custodian or designated subcustodians under triparty repurchase agreements, as the case may be, take possession of the underlying collateral securities, the value of which exceeds the principal amount of the repurchase transaction, including accrued interest. To the extent that any repurchase transaction exceeds one business day, the value of the collateral is marked to market on a daily basis to ensure the adequacy of the collateral. If the seller defaults and the value of the collateral declines or if bankruptcy proceedings are commenced with respect to the seller of the security, realization of the collateral by the Fund may be delayed or limited.
Foreign Currency Translation: The books and records of the Fund are maintained in U.S. dollars. Foreign currency amounts are translated into U.S. dollars on the following basis:
(i) market value of investment securities, other assets and liabilities—at the current rates of exchange;
(ii) purchases and sales of investment securities, income and expenses—at the rates of exchange prevailing on the respective dates of such transactions.
Although the net assets of the Fund are presented at the foreign exchange rates and market values at the close of the fiscal year, the Fund does not isolate that portion of the results of operations arising as a result of changes in the foreign exchange rates from the fluctuations arising from changes in the market prices of long term securities held at the end of the fiscal year. Similarly, the Fund does not isolate the effect of changes in foreign exchange rates from the fluctuations arising from changes in the market prices of portfolio securities sold during the fiscal year. Accordingly, realized foreign currency gains or losses are included in the reported net realized gains or losses on investment transactions.
Net realized gains or losses on foreign currency transactions represent net foreign exchange gains or losses from the holding of foreign currencies, currency gains or
Notes to Financial Statements
Cont’d
losses realized between the trade and settlement dates on security transactions, and the difference between the amounts of dividends, interest and foreign withholding taxes recorded on the Fund’s books and the U.S. dollar equivalent amounts actually received or paid. Net unrealized currency gains or losses from valuing foreign currency denominated assets and liabilities (other than investments) at year end exchange rates are reflected as a component of net unrealized appreciation (depreciation) on foreign currencies.
Foreign security and currency transactions may involve certain considerations and risks not typically associated with those of domestic origin as a result of, among other factors, the possibility of political or economic instability or the level of governmental supervision and regulation of foreign securities markets.
Securities Transactions and Net Investment Income: Securities transactions are recorded on the trade date. Realized gains or losses from investment and currency transactions are calculated on the identified cost basis. Dividend income is recorded on the ex-dividend date and interest income, including amortization of premium and accretion of discount on debt securities, as required, is recorded on the accrual basis. Expenses are recorded on an accrual basis.
Net investment income or loss, (other than distribution fees, which are charged directly to the respective class) and unrealized and realized gains or losses are allocated daily to each class of shares based upon the relative proportion of net assets of each class at the beginning of the day.
Taxes: For federal income tax purpose, it is the Fund’s policy to continue to meet the requirements under the Internal Revenue Code applicable to regulated investment companies and to distribute all of its taxable net income and capital gains, if any, to shareholders. Therefore, no federal income tax provision is required.
Withholding taxes on foreign dividends are recorded net of reclaimable amounts, at the time the related income is earned.
Dividends and Distributions: The Fund expects to pay dividends of net investment income and distributions of net realized capital and currency gains, if any, annually. Dividends and distributions to shareholders, which are determined in accordance with federal income tax regulations and which may differ from generally accepted accounting principles, are recorded on the ex-dividend date.
| | |
| 24 | | Visit our website at www.jennisondryden.com |
Securities Lending: The Fund may lend its portfolio securities to broker-dealers. The loans are secured by collateral at least equal, at all times, to the market value of the securities loaned. Loans are subject to termination at the option of the borrower or the Fund. Upon termination of the loan, the borrower will return to the lender securities identical to the loaned securities. Should the borrower of the securities fail financially, the Fund has the right to repurchase the securities using the collateral in the open market. The Fund recognizes income, net of any rebate and securities lending agent fees, for lending its securities in the form of fees or interest on the investment of any cash received as collateral. The Fund also continues to receive interest and dividends or amounts equivalent thereto, on the securities loaned and recognizes any unrealized gain or loss in the market price of the securities loaned that may occur during the term of the loan.
Estimates: The preparation of the financial statements requires management to make estimates and assumptions that affect the reported amounts and disclosures in the financial statements. Actual results could differ from those estimates.
Note 2. Agreements
The Fund has a management agreement with PI. Pursuant to this agreement, PI has responsibility for all investment advisory services and supervises the subadvisors’ performance of such services. PI has entered into a subadvisory agreement with Jennison Associates LLC (“Jennison”). The subadvisory agreement provides that Jennison furnishes investment advisory services in connection with the management of the Fund. In connection therewith, Jennison assumes the day-to-day management responsibilities of the Fund and is obligated to keep certain books and records of the Fund. PI pays for the services of Jennison, the cost of compensation of officers and employees of the Fund, occupancy and certain clerical and bookkeeping costs of the Fund. The Fund bears all other costs and expenses.
The management fee paid to PI is computed daily and payable monthly at an annual rate of .60 of 1% of the Fund’s average daily net assets up to $500 million, .50 of 1% of the next $500 million, .475 of 1% of the next $500 million and .45 of 1% of the average daily net assets in excess of $1.5 billion.
The Fund has a distribution agreement with Prudential Investment Management Services LLC (“PIMS”), which acts as the distributor of the Class A, Class B, Class C and Class Z shares. The Fund compensates PIMS for distributing and servicing the Fund’s Class A, Class B and Class C shares, pursuant to plans of distribution (the “Class A, B and C Plans”), regardless of expenses actually incurred. The distribution fees are accrued daily and payable monthly. No distribution or service fees are paid to PIMS as distributor of the Class Z shares of the Fund.
Notes to Financial Statements
Cont’d
Pursuant to the Class A, B and C Plans, the Fund compensates PIMS for distribution-related activities at an annual rate of up to .30 of 1%, 1% and 1%, of the average daily net assets of the Class A, B and C shares, respectively. For the year ended October 31, 2004, PIMS contractually agreed to limit such fees to .25 of 1% of the average daily net assets of the Class A shares.
PIMS has advised the Fund that it has received approximately $177,300 and $1,800 in front-end sales charges resulting from sales of Class A shares and Class C shares, respectively, during the year ended October 31, 2004. From these fees, PIMS paid such sales charges to affiliated broker-dealers, which in turn paid commissions to salespersons and incurred other distribution costs.
PIMS has advised the Fund that for the year ended October 31, 2004, it received approximately $230,700 and $1,500 in contingent deferred sales charges imposed upon certain redemptions by Class B and Class C shareholders, respectively.
PI, PIMS and Jennison are indirect, wholly-owned subsidiaries of Prudential Financial, Inc. (“Prudential”).
The Fund, along with other affiliated registered investment companies (the “Funds”), is a party to a syndicated credit agreement (“SCA”) with a group of banks. For the period from October 1, 2003 through April 30, 2004, the SCA provided for a commitment of $800 million and allowed the Funds to increase the commitment to $1 billion, if necessary. Effective May 3, 2004, the SCA provided for a commitment of $500 million. Interest on any borrowings under the SCA would be incurred at market rates. The Funds pay a commitment fee of .08 of 1% of the unused portion of the SCA. The commitment fee is accrued daily and paid quarterly and is allocated to the Funds pro rata, based on net assets. The purpose of the SCA is to serve as an alternative source of funding for capital share redemptions. The expiration date of the SCA is October 29, 2004. Effective October 29, 2004, the Funds entered into a revised credit agreement with two banks. The commitment under the revised credit agreement is $500 million. The Funds pay a commitment fee of .075% of 1% of the unused portion of the revised credit agreement. The expiration date of the revised credit agreement will be October 28, 2005. The Fund did not borrow any amounts pursuant to the SCA during the year ended October 31, 2004.
| | |
| 26 | | Visit our website at www.jennisondryden.com |
Note 3. Other Transactions with Affiliates
Prudential Mutual Fund Services LLC (“PMFS”), an affiliate of PI and an indirect, wholly-owned subsidiary of Prudential, serves as the Fund’s transfer agent. During the year ended October 31, 2004, the Fund incurred fees of approximately $1,020,100 for the services of PMFS. As of October 31, 2004, approximately $81,400 of such fees were due to PMFS. Transfer agent fees and expenses in the Statement of Operations include certain out-of-pocket expenses paid to non-affiliates, where applicable.
The Fund pays networking fees to affiliated and unaffiliated broker/dealers. These networking fees are payments made to broker/dealers that clear mutual fund transactions through a national clearing system. The Fund incurred approximately $115,100 in total networking fees, of which the amount relating to the services of Wachovia Securities, LLC. (“Wachovia”), an affiliate of PI, was approximately $103,400 for the year ended October 31, 2004. As of October 31, 2004, approximately $8,500 of such fees were due to Wachovia. These amounts are included in transfer agent’s fees and expenses in the Statement of Operations.
PIM is the securities lending agent for the Fund. For the year ended October 31, 2004, PIM has been compensated by the Fund approximately $61,300 for these services.
The Fund invests in the Taxable Money Market Series (the “Portfolio”), a portfolio of Dryden Core Investment Fund, pursuant to an exemptive order received from the Securities and Exchange Commission. The portfolio is a money market mutual fund registered under the Investment Company Act of 1940, as amended, and managed by PI. During the year ended October 31, 2004, the Fund earned income of $186,027 and $183,914, (net) from the portfolio, by investing its excess cash and collateral received from securities lending, respectively.
Note 4. Portfolio Securities
Purchases and sales of investment securities, other than short-term investments, for the year ended October 31, 2004 were $473,312,639 and $556,766,051, respectively.
As of October 31, 2004, the Fund had securities on loan with an aggregate market value of $229,293,946. The Fund received $237,981,769 in cash as collateral for securities on loan which was used to purchase highly liquid short-term investments in accordance with the Fund’s securities lending procedures.
Notes to Financial Statements
Cont’d
Note 5. Distributions and Tax Information
Distributions to shareholders, which are determined in accordance with federal income tax regulations and which may differ from generally accepted accounting principles, are recorded on the ex-dividend date. In order to present undistributed net investment income (loss) and accumulated net realized gains (losses) on investments and foreign currency transactions on the Statement of Assets and Liabilities that more closely represent their tax character, certain adjustments have been made to paid-in-capital in excess of par, undistributed net investment income (loss) and accumulated net realized gain (loss) on investment. For the year ended October 31, 2004, the adjustments were to increase undistributed net investment income and increase accumulated net realized loss on investments and foreign currency transactions by $1,506 due to the reclassification of net foreign currency gains. Net investment income, net realized losses and net assets were not affected by this change.
For the years ended October 31, 2004 and 2003, the tax character of dividends paid as reflected in the Statements of Changes in Net Assets, was $5,331,373 and $3,943,249, respectively of ordinary income.
As of October 31, 2004, the accumulated undistributed earnings on tax basis consisted of $3,357,025 of ordinary income. As of October 31, 2004, the Fund had a capital loss carryforward for federal income tax purposes of approximately $71,833,000 of which $37,003,000 expires in 2010 and $34,830,000 expires in 2011. Approximately $47,267,000 of its capital loss carryforward was used to offset net taxable gains realized in the fiscal year ended October 31, 2004. Accordingly, no capital gains distribution is expected to be paid to shareholders until net gains have been realized in excess of such carryforward. The income tax basis differs from the amount on the Statement of Assets and Liabilities primarily due to the deferral of wash sale losses.
The United States federal income tax basis of the Fund’s investments and the net unrealized appreciation as of October 31, 2004 were as follows:
| | | | | | |
Tax Basis
| | Appreciation
| | Depreciation
| | Total Net Unrealized
Appreciation
|
| $937,861,528 | | $164,072,473 | | $13,983,038 | | $150,089,435 |
The difference between book basis is primarily attributable to the difference in the treatment of wash sale losses for book and tax purposes.
| | |
| 28 | | Visit our website at www.jennisondryden.com |
Note 6. Capital
The Fund offers Class A, Class B, Class C and Class Z shares. Class A shares are sold with a front-end sales charge of up to 5.5%. Prior to March 15, 2004, Class A shares were sold with a front-end sales charge of 5%. Effective March 15, 2004, all investors who purchase Class A shares in an amount of $1 million or more and sell these shares within 12 months of purchase are subject to a contingent deferred sales charge (CDSC) of 1%, including investors who purchase their shares through broker-dealers affiliated with Prudential Financial, Inc. Class B shares are sold with a contingent deferred sales charge which declines from 5% to zero depending on the period of time the shares are held. Prior to February 2, 2004 Class C shares were sold with a front-end sales charge of 1% and a contingent deferred sales charge of 1% during the first 18 months. Class C shares purchased on or after February 2, 2004 are not subject to an initial sales charge and the contingent deferred sales charge (CDSC) for Class C shares will be 12 months from the date of purchase. Class B shares automatically convert to Class A shares on a quarterly basis approximately seven years after purchase. A special exchange privilege is also available for shareholders who qualified to purchase Class A shares at net asset value. Class Z shares are not subject to any sales or redemption charge and are offered exclusively for sale to a limited group of investors.
The Fund has authorized an unlimited number of shares of beneficial interest at $.01 par value divided into four classes, designated Class A, Class B, Class C and Class Z.
Transactions in shares of beneficial interest were as follows:
| | | | | | | |
Class A
| | Shares
| | | Amount
| |
Year ended October 31, 2004: | | | | | | | |
Shares sold | | 2,332,662 | | | $ | 37,341,107 | |
Shares issued in reinvestment of dividends and distributions | | 293,250 | | | | 4,360,621 | |
Shares reacquired | | (6,760,856 | ) | | | (107,958,726 | ) |
| | |
|
| |
|
|
|
Net increase (decrease) in shares outstanding before conversion | | (4,134,944 | ) | | | (66,256,998 | ) |
Shares issued upon conversion from Class B | | 2,092,635 | | | | 33,622,904 | |
| | |
|
| |
|
|
|
Net increase (decrease) in shares outstanding | | (2,042,309 | ) | | $ | (32,634,094 | ) |
| | |
|
| |
|
|
|
Year ended October 31, 2003: | | | | | | | |
Shares sold | | 2,635,292 | | | $ | 34,253,797 | |
Shares issued in reinvestment of dividends and distributions | | 265,713 | | | | 3,337,361 | |
Shares reacquired | | (9,578,707 | ) | | | (124,472,694 | ) |
| | |
|
| |
|
|
|
Net increase (decrease) in shares outstanding before conversion | | (6,677,702 | ) | | | (86,881,536 | ) |
Shares issued upon conversion from Class B | | 2,792,347 | | | | 36,258,030 | |
| | |
|
| |
|
|
|
Net increase (decrease) in shares outstanding | | (3,885,355 | ) | | $ | (50,623,506 | ) |
| | |
|
| |
|
|
|
Notes to Financial Statements
Cont’d
| | | | | | | |
Class B
| | Shares
| | | Amount
| |
Year ended October 31, 2004: | | | | | | | |
Shares sold | | 989,495 | | | $ | 15,686,689 | |
Shares issued in reinvestment of dividends and distributions | | 13,323 | | | | 196,920 | |
Shares reacquired | | (2,198,494 | ) | | | (34,764,429 | ) |
| | |
|
| |
|
|
|
Net increase (decrease) in shares outstanding before conversion | | (1,195,676 | ) | | | (18,880,820 | ) |
Shares issued upon conversion into Class A | | (2,112,319 | ) | | | (33,622,904 | ) |
| | |
|
| |
|
|
|
Net increase (decrease) in shares outstanding | | (3,307,995 | ) | | $ | (52,503,724 | ) |
| | |
|
| |
|
|
|
Year ended October 31, 2003: | | | | | | | |
Shares sold | | 1,162,472 | | | $ | 14,927,550 | |
Shares reacquired | | (3,444,354 | ) | | | (43,646,519 | ) |
| | |
|
| |
|
|
|
Net increase (decrease) in shares outstanding before conversion | | (2,281,882 | ) | | | (28,718,969 | ) |
Shares reacquired upon conversion into Class A | | (2,818,382 | ) | | | (36,258,030 | ) |
| | |
|
| |
|
|
|
Net increase (decrease) in shares outstanding | | (5,100,264 | ) | | $ | (64,976,999 | ) |
| | |
|
| |
|
|
|
Class C
| | | | | | |
Year ended October 31, 2004: | | | | | | | |
Shares sold | | 195,705 | | | $ | 3,114,846 | |
Shares issued in reinvestment of dividends and distributions | | 1,292 | | | | 19,103 | |
Shares reacquired | | (469,869 | ) | | | (7,381,699 | ) |
| | |
|
| |
|
|
|
Net increase (decrease) in shares outstanding | | (272,872 | ) | | $ | (4,247,750 | ) |
| | |
|
| |
|
|
|
Year ended October 31, 2003: | | | | | | | |
Shares sold | | 334,634 | | | $ | 4,302,731 | |
Shares reacquired | | (739,544 | ) | | | (9,645,475 | ) |
| | |
|
| |
|
|
|
Net increase (decrease) in shares outstanding | | (404,910 | ) | | $ | (5,342,744 | ) |
| | |
|
| |
|
|
|
Class Z
| | | | | | |
Year ended October 31, 2004: | | | | | | | |
Shares sold | | 1,090,896 | | | $ | 17,606,447 | |
Shares issued in reinvestment of dividends and distributions | | 23,251 | | | | 346,203 | |
Shares reacquired | | (1,743,995 | ) | | | (27,783,407 | ) |
| | |
|
| |
|
|
|
Net increase (decrease) in shares outstanding | | (629,848 | ) | | $ | (9,830,757 | ) |
| | |
|
| |
|
|
|
Year ended October 31, 2003: | | | | | | | |
Shares sold | | 715,633 | | | $ | 9,288,903 | |
Shares issued in reinvestment of dividends and distributions | | 24,473 | | | | 307,623 | |
Shares reacquired | | (1,079,306 | ) | | | (13,998,524 | ) |
| | |
|
| |
|
|
|
Net increase (decrease) in shares outstanding | | (339,200 | ) | | $ | (4,401,998 | ) |
| | |
|
| |
|
|
|
| | |
| 30 | | Visit our website at www.jennisondryden.com |
Financial Highlights
| | |
| OCTOBER 31, 2004 | | ANNUAL REPORT |
Jennison Value Fund
Financial Highlights
| | | | |
| | | Class A
| |
| | | Year Ended
10/31/2004(c) | |
Per Share Operating Performance: | | | | |
Net Asset Value, Beginning Of Year | | $ | 14.50 | |
| | |
|
|
|
Income (loss) from investment operations | | | | |
Net investment income | | | .11 | |
Net realized and unrealized gain (loss) on investment transactions | | | 2.22 | |
| | |
|
|
|
Total from investment operations | | | 2.33 | |
| | |
|
|
|
Less distributions | | | | |
Dividends from net investment income | | | (.12 | ) |
Distributions from net realized gains | | | — | |
| | |
|
|
|
Total distributions | | | (.12 | ) |
| | |
|
|
|
Net asset value, end of year | | $ | 16.71 | |
| | |
|
|
|
Total Return(a): | | | 16.21 | % |
Ratios/Supplemental Data: | | | | |
Net assets, end of year (000) | | $ | 610,345 | |
Average net assets (000) | | $ | 598,375 | |
Ratios to average net assets: | | | | |
Expenses, including distribution and service (12b-1) fees(b) | | | 1.07 | % |
Expenses, excluding distribution and service (12b-1) fees | | | .82 | % |
Net investment income | | | .68 | % |
For Class A, B, C and Z shares: | | | | |
Portfolio turnover rate | | | 56 | % |
| (a) | Total return of shares does not consider the effects of sales loads. Total return is calculated assuming a purchase of shares on the first day and a sale on the last day of each year reported and includes reinvestment of dividends and distributions. |
| (b) | The distributor of the Fund contractually agreed to limits its distribution and services (12b-1) fees to .25 of 1% of the average net assets of the Class A shares. |
| (c) | Calculated based upon average shares outstanding during the year. |
See Notes to Financial Statements.
| | |
| 32 | | Visit our website at www.jennisondryden.com |
| | | | | | | | | | | | | | |
| Class A | |
| Year Ended October 31, | |
| 2003(c) | | | 2002(c) | | | 2001 | | | 2000 | |
| | | | | | | | | | | | | | | |
| $ | 12.17 | | | $ | 16.09 | | | $ | 18.49 | | | $ | 18.12 | |
|
|
| |
|
|
| |
|
|
| |
|
|
|
| | | | | | | | | | | | | | | |
| | .11 | | | | .11 | | | | .16 | | | | .31 | |
| | 2.31 | | | | (2.43 | ) | | | (1.22 | ) | | | 2.49 | |
|
|
| |
|
|
| |
|
|
| |
|
|
|
| | 2.42 | | | | (2.32 | ) | | | (1.06 | ) | | | 2.80 | |
|
|
| |
|
|
| |
|
|
| |
|
|
|
| | | | | | | | | | | | | | | |
| | (.09 | ) | | | (.10 | ) | | | (.12 | ) | | | (.25 | ) |
| | — | | | | (1.50 | ) | | | (1.22 | ) | | | (2.18 | ) |
|
|
| |
|
|
| |
|
|
| |
|
|
|
| | (.09 | ) | | | (1.60 | ) | | | (1.34 | ) | | | (2.43 | ) |
|
|
| |
|
|
| |
|
|
| |
|
|
|
| $ | 14.50 | | | $ | 12.17 | | | $ | 16.09 | | | $ | 18.49 | |
|
|
| |
|
|
| |
|
|
| |
|
|
|
| | 19.97 | % | | | (16.56 | )% | | | (6.21 | )% | | | 17.60 | % |
| | | | | | | | | | | | | | | |
| $ | 559,230 | | | $ | 516,702 | | | $ | 690,433 | | | $ | 634,991 | |
| $ | 529,960 | | | $ | 657,772 | | | $ | 714,431 | | | $ | 571,048 | |
| | | | | | | | | | | | | | | |
| | 1.12 | % | | | 1.04 | % | | | 1.08 | % | | | 1.16 | % |
| | .87 | % | | | .79 | % | | | .83 | % | | | .91 | % |
| | .88 | % | | | .74 | % | | | .83 | % | | | 1.83 | % |
| | | | | | | | | | | | | | | |
| | 97 | % | | | 72 | % | | | 179 | % | | | 64 | % |
See Notes to Financial Statements.
Financial Highlights
Cont’d
| | | | |
| | | Class B
| |
| | | Year Ended
10/31/2004(c) | |
Per Share Operating Performance: | | | | |
Net Asset Value, Beginning Of Year | | $ | 14.31 | |
| | |
|
|
|
Income (loss) from investment operations | | | | |
Net investment income (loss) | | | (.01 | ) |
Net realized and unrealized gain (loss) on investment transactions | | | 2.20 | |
| | |
|
|
|
Total from investment operations | | | 2.19 | |
| | |
|
|
|
Less distributions | | | | |
Dividends from net investment income | | | (.01 | ) |
Distributions from net realized gains | | | — | |
| | |
|
|
|
Total distributions | | | (.01 | ) |
| | |
|
|
|
Net asset value, end of year | | $ | 16.49 | |
| | |
|
|
|
Total Return(a): | | | 15.34 | % |
Ratios/Supplemental Data: | | | | |
Net assets, end of year (000) | | $ | 193,230 | |
Average net assets (000) | | $ | 212,833 | |
Ratios to average net assets: | | | | |
Expenses, including distribution and service (12b-1) fees | | | 1.82 | % |
Expenses, excluding distribution and service (12b-1) fees | | | .82 | % |
Net investment income (loss) | | | (.06 | )% |
| (a) | Total return does not consider the effects of sales loads. Total return is calculated assuming a purchase of shares on the first day and a sale on the last day of each year reported and includes reinvestment of dividends and distributions. |
| (b) | Less than $.005 per share. |
| (c) | Calculated based upon average shares outstanding during the year. |
See Notes to Financial Statements.
| | |
| 34 | | Visit our website at www.jennisondryden.com |
| | | | | | | | | | | | | | |
| Class B | |
| Year Ended October 31, | |
| 2003(c) | | | 2002(c) | | | 2001 | | | 2000 | |
| | | | | | | | | | | | | | | |
| $ | 12.02 | | | $ | 15.92 | | | $ | 18.38 | | | $ | 18.06 | |
|
|
| |
|
|
| |
|
|
| |
|
|
|
| | | | | | | | | | | | | | | |
| | .02 | | | | — | (b) | | | .03 | | | | .20 | |
| | 2.27 | | | | (2.40 | ) | | | (1.22 | ) | | | 2.46 | |
|
|
| |
|
|
| |
|
|
| |
|
|
|
| | 2.29 | | | | (2.40 | ) | | | (1.19 | ) | | | 2.66 | |
|
|
| |
|
|
| |
|
|
| |
|
|
|
| | | | | | | | | | | | | | | |
| | — | | | | — | | | | (.05 | ) | | | (.16 | ) |
| | — | | | | (1.50 | ) | | | (1.22 | ) | | | (2.18 | ) |
|
|
| |
|
|
| |
|
|
| |
|
|
|
| | — | | | | (1.50 | ) | | | (1.27 | ) | | | (2.34 | ) |
|
|
| |
|
|
| |
|
|
| |
|
|
|
| $ | 14.31 | | | $ | 12.02 | | | $ | 15.92 | | | $ | 18.38 | |
|
|
| |
|
|
| |
|
|
| |
|
|
|
| | 19.05 | % | | | (17.21 | )% | | | (6.93 | )% | | | 16.71 | % |
| | | | | | | | | | | | | | | |
| $ | 215,039 | | | $ | 241,923 | | | $ | 395,833 | | | $ | 639,755 | |
| $ | 221,850 | | | $ | 347,114 | | | $ | 529,705 | | | $ | 778,722 | |
| | | | | | | | | | | | | | | |
| | 1.87 | % | | | 1.79 | % | | | 1.83 | % | | | 1.91 | % |
| | .87 | % | | | .79 | % | | | .83 | % | | | .91 | % |
| | .13 | % | | | (.01 | )% | | | .12 | % | | | 1.13 | % |
See Notes to Financial Statements.
Financial Highlights
Cont’d
| | | | |
| | | Class C
| |
| | | Year Ended
10/31/2004(d) | |
Per Share Operating Performance: | | | | |
Net Asset Value, Beginning Of Year | | $ | 14.31 | |
| | |
|
|
|
Income (loss) from investment operations | | | | |
Net investment income (loss) | | | (.01 | ) |
Net realized and unrealized gain (loss) on investment transactions | | | 2.20 | |
| | |
|
|
|
Total from investment operations | | | 2.19 | |
| | |
|
|
|
Less distributions | | | | |
Dividends from net investment income | | | (.01 | ) |
Distributions from net realized gains | | | — | |
| | |
|
|
|
Total distributions | | | (.01 | ) |
| | |
|
|
|
Net asset value, end of year | | $ | 16.49 | |
| | |
|
|
|
Total Return(a): | | | 15.34 | % |
Ratios/Supplemental Data: | | | | |
Net assets, end of year (000) | | $ | 20,006 | |
Average net assets (000) | | $ | 21,130 | |
Ratios to average net assets: | | | | |
Expenses, including distribution and service (12b-1) fees | | | 1.82 | % |
Expenses, excluding distribution and service (12b-1) fees | | | .82 | % |
Net investment income (loss) | | | (.07 | )% |
| (a) | Total return does not consider the effects of sales loads. Total return is calculated assuming a purchase of shares on the first day and a sale on the last day of each year reported and includes reinvestment of dividends and distributions. |
| (b) | Less than $.005 per share. |
| (d) | Calculated based upon average shares outstanding during the year. |
See Notes to Financial Statements.
| | |
| 36 | | Visit our website at www.jennisondryden.com |
| | | | | | | | | | | | | | |
| Class C | |
| Year Ended October 31, | |
| 2003(d) | | | 2002(d) | | | 2001 | | | 2000 | |
| | | | | | | | | | | | | | | |
| $ | 12.02 | | | $ | 15.92 | | | $ | 18.38 | | | $ | 18.06 | |
|
|
| |
|
|
| |
|
|
| |
|
|
|
| | | | | | | | | | | | | | | |
| | .02 | | | | — | (b) | | | .02 | | | | .19 | |
| | 2.27 | | | | (2.40 | ) | | | (1.21 | ) | | | 2.47 | |
|
|
| |
|
|
| |
|
|
| |
|
|
|
| | 2.29 | | | | (2.40 | ) | | | (1.19 | ) | | | 2.66 | |
|
|
| |
|
|
| |
|
|
| |
|
|
|
| | | | | | | | | | | | | | | |
| | — | | | | — | | | | (.05 | ) | | | (.16 | ) |
| | — | | | | (1.50 | ) | | | (1.22 | ) | | | (2.18 | ) |
|
|
| |
|
|
| |
|
|
| |
|
|
|
| | — | | | | (1.50 | ) | | | (1.27 | ) | | | (2.34 | ) |
|
|
| |
|
|
| |
|
|
| |
|
|
|
| $ | 14.31 | | | $ | 12.02 | | | $ | 15.92 | | | $ | 18.38 | |
|
|
| |
|
|
| |
|
|
| |
|
|
|
| | 19.05 | % | | | (17.21 | )% | | | (6.93 | )% | | | 16.71 | % |
| | | | | | | | | | | | | | | |
| $ | 21,268 | | | $ | 22,728 | | | $ | 30,459 | | | $ | 28,032 | |
| $ | 22,008 | | | $ | 29,071 | | | $ | 31,358 | | | $ | 27,782 | |
| | | | | | | | | | | | | | | |
| | 1.87 | % | | | 1.79 | % | | | 1.83 | % | | | 1.91 | % |
| | .87 | % | | | .79 | % | | | .83 | % | | | .91 | % |
| | .13 | % | | | 0 | %(c) | | | .08 | % | | | 1.10 | % |
See Notes to Financial Statements.
Financial Highlights
Cont’d
| | | | |
| | | Class Z
| |
| | | Year Ended
10/31/2004(b) | |
Per Share Operating Performance: | | | | |
Net Asset Value, Beginning Of Year | | $ | 14.54 | |
| | |
|
|
|
Income (loss) from investment operations | | | | |
Net investment income | | | .15 | |
Net realized and unrealized gain (loss) on investment transactions | | | 2.23 | |
| | |
|
|
|
Total from investment operations | | | 2.38 | |
| | |
|
|
|
Less distributions | | | | |
Dividends from net investment income | | | (.16 | ) |
Distributions from net realized gains | | | — | |
| | |
|
|
|
Total distributions | | | (.16 | ) |
| | |
|
|
|
Net asset value, end of year | | $ | 16.76 | |
| | |
|
|
|
Total Return(a): | | | 16.49 | % |
Ratios/Supplemental Data: | | | | |
Net assets, end of year (000) | | $ | 26,725 | |
Average net assets (000) | | $ | 25,857 | |
Ratios to average net assets: | | | | |
Expenses, including distribution and service (12b-1) fees | | | .82 | % |
Expenses, excluding distribution and service (12b-1) fees | | | .82 | % |
Net investment income | | | .93 | % |
| (a) | Total return is calculated assuming a purchase of shares on the first day and a sale on a purchase of shares on the first day and a sale on the last day of each year reported and includes reinvestment of dividends and distributions. |
| (b) | Calculated based upon average shares outstanding during the year. |
See Notes to Financial Statements.
| | |
| 38 | | Visit our website at www.jennisondryden.com |
| | | | | | | | | | | | | | |
| Class Z | |
| Year Ended October 31, | |
| 2003(b) | | | 2002(b) | | | 2001 | | | 2000 | |
| | | | | | | | | | | | | | | |
| $ | 12.21 | | | $ | 16.14 | | | $ | 18.52 | | | $ | 18.13 | |
|
|
| |
|
|
| |
|
|
| |
|
|
|
| | | | | | | | | | | | | | | |
| | .15 | | | | .14 | | | | .28 | | | | .35 | |
| | 2.30 | | | | (2.43 | ) | | | (1.30 | ) | | | 2.50 | |
|
|
| |
|
|
| |
|
|
| |
|
|
|
| | 2.45 | | | | (2.29 | ) | | | (1.02 | ) | | | 2.85 | |
|
|
| |
|
|
| |
|
|
| |
|
|
|
| | | | | | | | | | | | | | | |
| | (.12 | ) | | | (.14 | ) | | | (.14 | ) | | | (.28 | ) |
| | — | | | | (1.50 | ) | | | (1.22 | ) | | | (2.18 | ) |
|
|
| |
|
|
| |
|
|
| |
|
|
|
| | (.12 | ) | | | (1.64 | ) | | | (1.36 | ) | | | (2.46 | ) |
|
|
| |
|
|
| |
|
|
| |
|
|
|
| $ | 14.54 | | | $ | 12.21 | | | $ | 16.14 | | | $ | 18.52 | |
|
|
| |
|
|
| |
|
|
| |
|
|
|
| | 20.26 | % | | | (16.34 | )% | | | (5.98 | )% | | | 17.94 | % |
| | | | | | | | | | | | | | | |
| $ | 32,340 | | | $ | 31,300 | | | $ | 62,366 | | | $ | 153,246 | |
| $ | 31,275 | | | $ | 58,256 | | | $ | 69,810 | | | $ | 141,384 | |
| | | | | | | | | | | | | | | |
| | .87 | % | | | .79 | % | | | .83 | % | | | .91 | % |
| | .87 | % | | | .79 | % | | | .83 | % | | | .91 | % |
| | 1.13 | % | | | .98 | % | | | 1.11 | % | | | 2.07 | % |
See Notes to Financial Statements.
Report of Independent Registered Public Accounting Firm
The Board of Trustees and Shareholders of
Jennison Value Fund
We have audited the accompanying statement of assets and liabilities of Jennison Value Fund hereafter referred to as the “Fund”, including the portfolio of investments, as of October 31, 2004, and the related statement of operations, the statement of changes in net assets, and the financial highlights for the year then ended. These financial statements and financial highlights are the responsibility of the Fund’s management. Our responsibility is to express an opinion on these financial statements and financial highlights based on our audit. The statement of changes in net assets for the year ended October 31, 2003 and the financial highlights for the periods presented prior to October 31, 2004, were audited by another independent registered public accounting firm, whose report dated, December 22, 2003, expressed an unqualified opinion thereon.
We conducted our audit in accordance with the standards of the Public Company Accounting Oversight Board (United States). Those standards require that we plan and perform the audit to obtain reasonable assurance about whether the financial statements and financial highlights are free of material misstatement. An audit includes examining, on a test basis, evidence supporting the amounts and disclosures in the financial statements. Our procedures included confirmation of securities owned as of October 31, 2004, by correspondence with the custodian. As to securities purchased or sold but not yet received or delivered, we performed other appropriate auditing procedures. An audit also includes assessing the accounting principles used and significant estimates made by management, as well as evaluating the overall financial statement presentation. We believe that our audit provides a reasonable basis for our opinion.
In our opinion, the financial statements and financial highlights referred to above present fairly, in all material respects, the financial position of the Fund as of October 31, 2004, and the results of its operations, the changes in its net assets, and the financial highlights for the year then ended, in conformity with U.S. generally accepted accounting principles.

New York, New York
December 22, 2004
| | |
| 40 | | Visit our website at www.jennisondryden.com |
Federal Income Tax Information
(Unaudited)
We are required by the Internal Revenue Code to advise you within 60 days of the Fund’s fiscal year end (October 31, 2004) as to the federal tax status of dividends paid by the Fund during such fiscal year. Accordingly, we are advising you that during the fiscal year ended October 31, 2004, dividends paid from net investment income totaling $0.12 per Class A share, 0.01 per Class B and Class C and $0.16 per Class Z are taxable as ordinary income. Further, we wish to advise you that 100% of the ordinary income dividend paid in the fiscal year ended October 31, 2004 qualified for the corporate dividends received deduction available to corporate taxpayers. Only funds that invest in U.S. equity securities are entitled to pass-through a corporate dividends received deduction.
In January 2005, you will be advised on IRS Form 1099 DIV or substitute Form 1099, as to the federal tax status of the distributions received by you in calendar 2004. The amounts that will be reported on such form 1099 DIV will be the amounts to use on your federal income tax return and will differ from the amounts which we must report for the Fund’s fiscal year ended October 31, 2004.
The Fund intends to designate 100% of the ordinary income dividends as qualified for the reduced tax rate under The Jobs and Growth Tax Relief Reconciliation Act of 2003.
Management of the Fund
(Unaudited)
Information pertaining to the Trustees of the Fund is set forth below. Trustees who are not deemed to be “interested persons” of the Fund, as defined in the Investment Company Act of 1940 (the 1940 Act), are referred to as “Independent Trustees.” Trustees who are deemed to be “interested persons” of the Fund are referred to as “Interested Trustees.” “Fund Complex”1 consists of the Fund and any other investment companies managed by PI.
Independent Trustees(.)
David E.A. Carson (70), Trustee since 2003(.) Oversees 97 portfolios in Fund complex
Principal occupations (last 5 years): Director (January 2000 to May 2000), Chairman (January 1999 to December 1999), Chairman and Chief Executive Officer (January 1998 to December 1998) and President, Chairman and Chief Executive Officer (1983-1997) of People’s Bank.
Other Directorships held.(.) Director of United Illuminating and (.) Holdings (utility company), since 1993.
Robert E. La Blanc (70), Trustee since 2003(.) Oversees 100 portfolios in Fund complex
Principal occupations (last 5 years): President (since 1981) of Robert E. La Blanc Associates, Inc. (telecommunications); formerly General Partner at Salomon Brothers and Vice-Chairman of Continental Telecom; Trustee of Manhattan College.
Other Directorships held:(.) Director of Chartered Semiconductor Manufacturing, Ltd. (since 1998); Titan Corporation (electronics) (since 1995); Computer Associates International, Inc. (software company) (since 2002); FiberNet Telecom Group, Inc. (telecom company) (since 2003); Director (since April 1999) of the High Yield Plus Fund, Inc.
Douglas H. McCorkindale (65), Trustee since 1987 Oversees 93 portfolios in Fund complex
Principal occupations (last 5 years): Chairman (since February 2001), Chief Executive Officer (since June 2000) and President (since September 1997) of Gannett Co. Inc. (publishing and media); formerly Vice Chairman (March 1984-May 2000) of Gannett Co., Inc.
Other Directorships held: (.) Director of Gannett Co. Inc., Director of Continental Airlines, Inc. (since May 1993); Director of Lockheed Martin Corp. (aerospace and defense) (since May 2001); Director of The High Yield Plus Fund, Inc. (since 1996).
Richard A. Redeker (61), Trustee since 1993(.) Oversees 94 portfolios in Fund complex
Principal occupations (last 5 years): Management Consultant; Director of Investment, Inc. (since 2001) and Director of Penn Tank Lines, Inc. (since 1999).
Other Directorships held:(.) None.
Robin B. Smith (65), Trustee since 1996(.) Oversees 99 portfolios in Fund complex
Principal occupations (last 5 years): Chairman of the Board (since January 2003) of Publishers Clearing House (direct marketing); formerly Chairman and Chief Executive Officer (August 1996-January 2003) of Publishers Clearing House.
Other Directorships held:(.) Director of BellSouth Corporation (since 1992).
| | |
| 42 | | Visit our website at www.jennisondryden.com |
Stephen D. Stoneburn (61), Trustee since 2003(.) Oversees 97 portfolios in Fund complex
Principal occupations (last 5 years): President and Chief Executive Officer (since June 1996) of Quadrant Media Corp. (a publishing company); formerly President (June 1995-June 1996) of Argus Integrated Media, Inc.; Senior Vice President and Managing Director (January 1993-1995) of (.) Business Media and Senior Vice President of Fairchild Publications, Inc. (1975-1989).
Other Directorships held:(.) None
Clay T. Whitehead (66), Trustee since 1996(.) Oversees 98 portfolios in Fund complex
Principal occupations (last 5 years): President (since 1983) of National Exchange Inc. (new business development firm).
Other Directorships held:(.) Director (since 2000) of the High Yield Plus Fund, Inc.
Interested Trustees(.)
Judy A. Rice (56), President since 2003 and Trustee since 2000(.) Oversees 101 portfolios in Fund complex
Principal occupations (last 5 years): President, Chief Executive Officer, Chief Operating Officer and Officer-in-Charge (since 2003) of PI; Director, Officer-in-Charge, President, Chief Executive Officer and Chief Operating Officer (since May 2003) of American Skandia Advisory Services, Inc., and American Skandia Investment Services, Inc.; Director, Officer-in-Charge, President, Chief Executive Officer (since May 2003) of American Skandia Fund Services, Inc.; Vice President (since February 1999) of Prudential Investment Management Services LLC; President, Chief Executive Officer and Officer-in-Charge (since April 2003) of Prudential Mutual Fund Services LLC; formerly various positions to Senior Vice President (1992-1999) of Prudential Securities; and various positions to Managing Director (1975-1992) of Salomon Smith Barney; Member of Board of Governors of the Money Management Institute.
Other Directorships held:(.) None
Robert F. Gunia (58), Vice President and Trustee since 1996(.) Oversees 175 portfolios in Fund complex
Principal occupations (last 5 years): Chief Administrative Officer (since June 1999) of PI; Executive Vice President and Treasurer (since January 1996) of PI; President (since April 1999) of Prudential Investment Management Services LLC (PIMS); Corporate Vice President (since September 1997) of The Prudential Insurance Company of America (Prudential); Director, Executive Vice President and Chief Administrative Officer (since May 2003) of American Skandia Investment Services, Inc., American Skandia Advisory Services, Inc. and American Skandia Fund Services, Inc.; Executive Vice President (since March 1999) and Treasurer (since May 2000) of Prudential Mutual Fund Services LLC; formerly Senior Vice President (March 1987-May 1999) of Prudential Securities.
Other Directorships held:(.) Vice President and Director (since May 1989) and Treasurer (since 1999) of The Asia Pacific Fund, Inc.
Information pertaining to the Officers of the Fund who are not also Trustees is set forth below.
Officers(.)
William V. Healey (51), Chief Legal Officer and Secretary since 2004(.)
Principal occupations (last 5 years): Vice President and Associate General Counsel (since 1998) of Prudential; Executive Vice President and Chief Legal Officer (since February 1999) of Prudential Investments LLC; Senior Vice President, Chief Legal Officer and Secretary (since December 1998) of Prudential Investment Management Services LLC; Executive Vice President and Chief Legal Officer (since February 1999) of Prudential Mutual Fund Services LLC; Vice President and Secretary (since October 1998) of Prudential Investment Management, Inc.,
Executive Vice President and Chief Legal Officer (since May 2003) of American Skandia Investment Services, Inc., American Skandia Fund Services, Inc. and American Skandia Advisory Services, Inc.; Director (June 1999-June 2002 and June 2003-present) of ICI Mutual Insurance Company; prior to August 1998, Associate General Counsel of the Dreyfus Corporation (Dreyfus), a subsidiary of Mellon Bank, N.A. (Mellon Bank), and an officer and/or director of various affiliates of Mellon Bank and Dreyfus.
Deborah A. Docs (46), Assistant Secretary since 2004(3)
Vice President and Corporate Counsel (since January 2001) of Prudential; Vice President and Assistant Secretary (since December 1996) of PI; Vice President and Assistant Secretary (since May 2003) of American Skandia Investment Services, Inc.
Maryanne Ryan (40), Anti-Money Laundering Compliance Officer since 2002(.)
Principal occupations (last 5 years): Vice President, Prudential (since November 1998); First Vice President, Prudential Securities (March 1997-May 1998); Anti-Money Laundering Compliance Officer (since 2003) of American Skandia Investment Services, Inc., American Skandia Advisory Services, Inc. and American Skandia Marketing, Inc.
Lee D. Augsburger (45), Chief Compliance Officer since 2004(.)
Principal occupations (last 5 years): Vice President and Chief Compliance Officer (since May 2003) of PI; Vice President and Chief Compliance Officer (since October 2000) of Prudential Investment Management, Inc.: formerly Vice President and Chief Legal Officer—Annuities (August 1999-October 2000) of Prudential Insurance Company of America; Vice President and Corporate Counsel (November 1997-August 1999) of Prudential Insurance Company of America.
Grace C. Torres (45), Treasurer and Principal Financial and Accounting Officer since 1997(.)
Principal occupations (last 5 years): Senior Vice President (since January 2000) of PI; Senior Vice President and Assistant Treasurer (since May 2003) of American Skandia Investment Services, Inc. and American Skandia Advisory Services, Inc.; formerly First Vice President (December 1996-January 2000) of PI and First Vice President (March 1993-1999) of Prudential Securities.
| (.) | The Fund Complex consists of all investment companies managed by PI. The Funds for which PI serves as manager include Jennison Dryden Mutual Funds, Strategic Partners Funds, The Prudential Variable Contract Accounts 2, 10, 11. The Target Portfolio Trust, The Prudential Series Fund, Inc., American Skandia Trust, and Prudential’s Gibraltar Fund. |
| (1) | “Interested” Trustee, as defined in the 1940 Act, by reason of employment with the Manager (Prudential Investments LLC or PI), the Subadviser (Jennison Associates LLC or Jennison) or the Distributor (Prudential Investment Management Services LLC or PIMS). |
| (2) | Unless otherwise noted, the address of the Trustees and Officers is c/o: Prudential Investments LLC, Gateway Center Three, 100 Mulberry Street, Newark, NJ 07102. |
| (3) | There is no set term of office for Trustees and Officers. The independent Trustees have adopted a retirement policy, which calls for the retirement of Trustees on December 31 of the year in which they reach the age of 75. The table shows the individuals length of service as Trustee and/or Officer. |
| (4) | This includes only directorships of companies required to register, or file reports with the SEC under the Securities and Exchange Act of 1934 (that is, “public companies”) or other investment companies registered under the 1940 Act. |
Additional Information about the Fund’s Trustees is included in the Fund’s Statement of Additional Information which is available without charge, upon request, by calling (800) 521-7466 or (732) 482-7555 (Calling from outside the U.S.)
| | |
| 44 | | Visit our website at www.jennisondryden.com |
Additional Information
(Unaudited)
Commencing after October 31, 2004, the Fund will file a complete portfolio of holdings on the Fund’s first and third quarter-end on Form N-Q with the Securities and Exchange Commission (the “Commission”). Form N-Q will be available on the Commission’s website at http://www.sec.gov or by visiting the Commission’s Public Reference Room. For Information on the Commission’s Public Reference Room visit the Commission’s website.
Growth of a $10,000 Investment
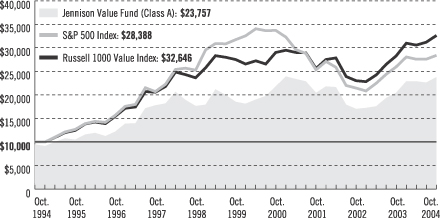
| | | | | | | | | | | |
| Average Annual Total Returns (With Sales Charges) as of 10/31/04 |
| | | One Year | | | Five Years | | | Ten Years | | | Since Inception |
Class A | | 9.81 | % | | 3.93 | % | | 9.04 | % | | 10.08% |
Class B | | 10.34 | | | 4.15 | | | 8.83 | | | 9.23 |
Class C | | 14.34 | | | 4.31 | | | 8.83 | | | 8.65 |
Class Z | | 16.49 | | | 5.38 | | | N/A | | | 8.82 |
| | | | | | | | | | | | |
| Average Annual Total Returns (Without Sales Charges) as of 10/31/04 |
| | | One Year | | | Five Years | | | Ten Years | | | Since Inception |
Class A | | 16.21 | % | | 5.11 | % | | 9.66 | % | | 10.50% |
Class B | | 15.34 | | | 4.31 | | | 8.83 | | | 9.23 (9.22) |
Class C | | 15.34 | | | 4.31 | | | 8.83 | | | 8.65 |
Class Z | | 16.49 | | | 5.38 | | | N/A | | | 8.82 |
Performance data quoted represent past performance. Past performance does not guarantee future results. The investment return and principal value of an investment will fluctuate so that an investor’s shares, when redeemed, may be worth more or less than their original cost. Current performance may be lower or higher than the past performance data quoted. The returns in the graph and the tables do not reflect the deduction of taxes that a shareholder would pay on Fund distributions or following the redemption of Fund shares. An investor may obtain performance data current to the most recent month-end by visiting our website at www.jennisondryden.com or by calling (800) 225-1852. The maximum initial sales charge is 5.50%.
| | |
| | | Visit our website at www.jennisondryden.com |
Source: Prudential Investments LLC and Lipper Inc. Inception dates: Class A, 1/22/90; Class B, 1/22/87; Class C, 8/1/94; and Class Z, 3/1/96.
The graph compares a $10,000 investment in the Jennison Value Fund (Class A shares) with a similar investment in the S&P 500 Index and the Russell 1000 Value Index by portraying the initial account values at the beginning of the 10-year period for Class A shares (October 31, 1994) and the account values at the end of the current fiscal year (October 31, 2004) as measured on a quarterly basis. For purposes of the graph, and unless otherwise indicated, it has been assumed that (a) the maximum applicable front-end sales charge was deducted from the initial $10,000 investment in Class A shares; (b) all recurring fees (including management fees) were deducted; and (c) all dividends and distributions were reinvested. The line graph provides information for Class A shares only. As indicated in the tables provided earlier, performance for Class B, Class C, and Class Z shares will vary due to the differing charges and expenses applicable to each share class (as indicated in the following paragraphs). Without a distribution and service (12b-1) fee waiver of 0.05% for Class A shares through October 31, 2004, the returns shown in the graph and for Class A shares in the tables would have been lower.
The S&P 500 Index is an unmanaged index of 500 stocks of large U.S. companies. It gives a broad look at how stock prices have performed in the United States. The Russell 1000 Value Index is an unmanaged index comprising those securities in the Russell 1000 Index with a lesser-than-average growth orientation. Companies in this index generally have low price-to-book and price-to-earnings ratios, higher dividend yields, and lower forecasted growth values. The Indexes’ total returns include the reinvestment of all dividends, but do not include the effects of sales charges, operating expenses of a mutual fund, or taxes. These returns would be lower if they included the effects of sales charges, operating expenses, or taxes. The securities that comprise these indexes may differ substantially from the securities in the Fund. These are not the only indexes that may be used to characterize performance of large-capitalization stock funds. Other indexes may portray different comparative performance. Investors cannot invest directly in an index.
Through March 14, 2004, the Fund charged a maximum front-end sales charge of 5.00% for Class A shares and a 12b-1 fee of up to 0.30% annually. Effective March 15, 2004, Class A shares are subject to a maximum front-end sales charge of 5.50% and a 12b-1 fee of up to 0.30% annually. Investors who purchase Class A shares in an amount of $1 million or more do not pay a front-end sales charge, but are subject to a contingent deferred sales charge (CDSC) of 1% for shares sold within 12 months of purchase. Class B shares are subject to a declining CDSC of 5%, 4%, 3%, 2%, 1%, and 1% respectively for the first six years after purchase and a 12b-1 fee of 1% annually. Approximately seven years after purchase, Class B shares will automatically convert to Class A shares on a quarterly basis. Until February 2, 2004, Class C shares were subject to a front-end sales charge of 1%, a CDSC of 1% for shares redeemed within 18 months of purchase, and a 12b-1 fee of 1% annually. Class C shares purchased on or after February 2, 2004, are not subject to a front-end sales charge, but charge a CDSC of 1% for Class C shares sold within 12 months from the date of purchase, and an annual 12b-1 fee of 1%. Class Z shares are not subject to a sales charge or 12b-1 fees. The returns in the graph and tables reflect the share class expense structure in effect at the close of the fiscal period. Without waiver of fees and/or expense subsidization, the Fund’s returns would have been lower as indicated in parentheses.
| | | | |
| n MAIL | | n TELEPHONE | | n WEBSITE |
Gateway Center Three 100 Mulberry Street Newark, NJ 07102 | | (800) 225-1852 | | www.jennisondryden.com |
|
| PROXY VOTING |
| The Board of Trustees of the Fund has delegated to the Fund’s investment adviser the responsibility for voting any proxies and maintaining proxy recordkeeping with respect to the Fund. A description of these proxy voting policies and procedures is available without charge, upon request, by calling (800) 225-1852 or by visiting the Securities and Exchange Commission’s (the Commission) website at http://www.sec.gov. Information regarding how the Fund voted proxies relating to portfolio securities during the most recent 12-month period ended June 30, 2004, is available on the Fund’s website at http://www.prudential.com and on the Commission’s website at http://www.sec.gov. |
|
| TRUSTEES |
David E.A. Carson • Robert F. Gunia • Robert E. La Blanc • Douglas H. McCorkindale • Richard A. Redeker • Judy A. Rice • Robin B. Smith • Stephen D. Stoneburn •
Clay T. Whitehead |
|
| OFFICERS |
Judy A. Rice, President • Robert F. Gunia, Vice President • Grace C. Torres, Treasurer and Principal Financial and Accounting Officer • William V. Healey, Chief Legal Officer •
Maryanne Ryan, Anti-Money Laundering Compliance Officer • Lee D. Augsburger,
Chief Compliance Officer |
| | | | |
| MANAGER | | Prudential Investments LLC | | Gateway Center Three
100 Mulberry Street
Newark, NJ 07102 |
|
| INVESTMENT ADVISER | | Jennison Associates LLC | | 466 Lexington Avenue
New York, NY 10017 |
|
| DISTRIBUTOR | | Prudential Investment
Management Services LLC | | Gateway Center Three
100 Mulberry Street
Newark, NJ 07102 |
|
| CUSTODIAN | | State Street Bank
and Trust Company | | One Heritage Drive
North Quincy, MA 02171 |
|
| TRANSFER AGENT | | Prudential Mutual Fund
Services LLC | | PO Box 8098
Philadelphia, PA 19176 |
|
| INDEPENDENT REGISTERED PUBLIC ACCOUNTING FIRM | | KPMG LLP | | 757 Third Avenue
New York, NY 10017 |
|
| FUND COUNSEL | | Sullivan & Cromwell LLP | | 125 Broad Street
New York, NY 10004 |
| | | | | | | | | | | | |
| Jennison Value Fund | | | | |
| Share Class | | | | A | | B | | C | | Z | | |
| | | NASDAQ | | PBEAX | | PBQIX | | PEICX | | PEIZX | | |
| | | CUSIP | | 476297106 | | 476297205 | | 476297304 | | 476297403 | | |
| | | | | | | | | | | | | |
|
| An investor should consider the investment objectives, risks, and charges and expenses of the Fund carefully before investing. The prospectus for the Fund contains this and other information about the Fund. An investor may obtain a prospectus by visiting our website at www.jennisondryden.com or by calling (800) 225-1852. The prospectus should be read carefully before investing. |
|
| Prudential Fixed Income is a business unit of Prudential Investment Management, Inc. (PIM). Quantitative Management Associates LLC, Jennison Associates LLC, and PIM are registered investment advisers and Prudential Financial companies. |
|
| E-DELIVERY |
To receive your mutual fund documents on-line, go to www.icsdelivery.com/prudential/funds
and enroll. Instead of receiving printed documents by mail, you will receive notification via e-mail when new materials are available. You can cancel your enrollment or change your e-mail
address at any time by clicking on the change/cancel enrollment option at the icsdelivery website address. |
|
| SHAREHOLDER COMMUNICATIONS WITH TRUSTEES |
| Shareholders of the Fund can communicate directly with the Board of Trustees by writing to the Chair of the Board, Jennison Value Fund, PO Box 13964, Philadelphia, PA 19176. Shareholders can communicate directly with an individual Trustee by writing to that Trustee at Jennison Value Fund, PO Box 13964, Philadelphia, PA 19176. Such communications to the Board or individual Trustees are not screened before being delivered to the addressee. |
|
| AVAILABILITY OF QUARTERLY PORTFOLIO SCHEDULE |
| The Fund files its complete schedule of portfolio holdings with the Securities and Exchange Commission (the “Commission”) for the first and third quarters of each fiscal year on Form N-Q. The Fund’s Forms N-Q are available on the Commission’s website at http://www.sec.gov. The Fund’s Forms N-Q may also be reviewed and copied at the Commission’s Public Reference Room in Washington, D.C. Information on the operation of the Public Reference Room may be obtained by calling 1-800-SEC-0330. The Fund will provide a full list of its portfolio holdings as of the end of each fiscal quarter on its website at www.jennisondryden.com within 60 days after the end of the fiscal quarter. |
Mutual Funds:
| | | | |
| ARE NOT INSURED BY THE FDIC OR ANY FEDERAL GOVERNMENT AGENCY | | MAY LOSE VALUE | | ARE NOT A DEPOSIT OF OR GUARANTEED BY ANY BANK OR ANY BANK AFFILIATE |
| | | | | | | | | | | | |
| Jennison Value Fund | | | | | | |
| | | Share Class | | A | | B | | C | | Z | | |
| | | NASDAQ | | PBEAX | | PBQIX | | PEICX | | PEIZX | | |
| | | CUSIP | | 476297106 | | 476297205 | | 476297304 | | 476297403 | | |
| | | | | | | | | | | | | |
MF131E IFS-AO98930 Ed. 12/2004
Item 2 – Code of Ethics – See Exhibit (a)
As of the end of the period covered by this report, the registrant has adopted a code of ethics (the “Section 406 Standards for Investment Companies – Ethical Standards for Principal Executive and Financial Officers”) that applies to the registrant’s Principal Executive Officer and Principal Financial Officer; the registrant’s Principal Financial Officer also serves as the Principal Accounting Officer.
The registrant hereby undertakes to provide any person, without charge, upon request, a copy of the code of ethics. To request a copy of the code of ethics, contact the registrant 973-802-2991, and ask for a copy of the Section 406 Standards for Investment Companies-Ethical Standards for Principal Executive and Financial Officers.
Item 3 – Audit Committee Financial Expert –
The registrant’s Board has determined that Mr. David Carson, member of the Board’s Audit Committee is an “audit committee financial expert,” and that he is “independent,” for purposes of this Item.
Item 4 – Principal Accountant Fees and Services –
(a) Audit Fees
For the fiscal year ended October 31, 2004, KPMG LLP, the Registrant’s principal accountant, billed the Registrant $16,700 for professional services rendered for the audit of the Registrant’s annual financial statements or services that are normally provided in connection with statutory and regulatory filings. KPMG did not serve as the Registrant’s principal accountant during fiscal year ended October 31, 2003, so no information for that fiscal year is provided.
(b) Audit-Related Fees
None.
(c) Tax Fees
None.
(d) All Other Fees
None.
(e) (1) Audit Committee Pre-Approval Policies and Procedures
THE PRUDENTIAL MUTUAL FUNDS
AUDIT COMMITTEE POLICY
on
Pre-Approval of Services Provided by the Independent Accountants
The Audit Committee of each Prudential Mutual Fund is charged with the responsibility to monitor the independence of the Fund’s independent accountants. As part of this responsibility, the Audit Committee must pre-approve any independent accounting firm’s engagement to render audit and/or permissible non-audit services, as required by law. In evaluating a proposed engagement of the independent accountants, the Audit Committee will assess the effect that the engagement might reasonably be expected to have on the accountant’s independence. The Committee’s evaluation will be based on:
| | • | a review of the nature of the professional services expected to be provided, |
| | • | a review of the safeguards put into place by the accounting firm to safeguard independence, and |
| | • | periodic meetings with the accounting firm. |
Policy for Audit and Non-Audit Services Provided to the Funds
On an annual basis, the scope of audits for each Fund, audit fees and expenses, and audit-related and non-audit services (and fees proposed in respect thereof) proposed to be performed by the Fund’s independent accountants will be presented by the Treasurer and the independent accountants to the Audit Committee for review and, as appropriate, approval prior to the initiation of such services. Such presentation shall be accompanied by confirmation by both the Treasurer and the independent accountants that the proposed services will not adversely affect the independence of the independent accountants. Proposed services shall be described in sufficient detail to enable the Audit Committee to assess the appropriateness of such services and fees, and the compatibility of the provision of such services with the auditor’s independence. The Committee shall receive periodic reports on the progress of the audit and other services which are approved by the Committee or by the Committee Chair pursuant to authority delegated in this Policy.
The categories of services enumerated under “Audit Services”, “Audit-related Services”, and “Tax Services” are intended to provide guidance to the Treasurer and the independent accountants as to those categories of services which the Committee believes are generally consistent with the independence of the independent accountants and which the Committee (or the Committee Chair) would expect upon the presentation of specific proposals to pre-approve. The enumerated categories are not intended as an exclusive list of audit, audit-related or tax services which the Committee (or the Committee Chair) would consider for pre-approval.
Audit Services
The following categories of audit services are considered to be consistent with the role of the Fund’s independent accountants:
| | • | Annual Fund financial statement audits |
| | • | Seed audits (related to new product filings, as required) |
| | • | SEC and regulatory filings and consents |
Audit-related Services
The following categories of audit-related services are considered to be consistent with the role of the Fund’s independent accountants:
| | • | Accounting consultations |
| | • | Fund merger support services |
| | • | Agreed Upon Procedure Reports |
| | • | Other Internal Control Reports |
Individual audit-related services that fall within one of these categories and are not presented to the Audit Committee as part of the annual pre-approval process will be subject to pre-approval by the Committee Chair (or any other Committee member on whom this responsibility has been delegated) so long as the estimated fee for those services does not exceed $50,000.
Tax Services
The following categories of tax services are considered to be consistent with the role of the Fund’s independent accountants:
| | • | Tax compliance services related to the filing or amendment of the following: |
| | • | Federal, state and local income tax compliance; and, |
| | • | Sales and use tax compliance |
| | • | Timely RIC qualification reviews |
| | • | Tax distribution analysis and planning |
| | • | Tax authority examination services |
| | • | Tax appeals support services |
| | • | Accounting methods studies |
| | • | Fund merger support services |
| | • | Tax consulting services and related projects |
Individual tax services that fall within one of these categories and are not presented to the Audit Committee as part of the annual pre-approval process will be subject to pre-approval by the Committee Chair (or any other Committee member on whom this responsibility has been delegated) so long as the estimated fee for those services does not exceed $50,000.
Other Non-audit Services
Certain non-audit services that the independent accountants are legally permitted to render will be subject to pre-approval by the Committee or by one or more Committee members to whom the Committee has delegated this authority and who will report to the full Committee any pre-approval decisions made pursuant to this Policy. Non-audit services presented for pre-approval pursuant to this paragraph will be accompanied by a confirmation from both the Treasurer and the independent accountants that the proposed services will not adversely affect the independence of the independent accountants.
Proscribed Services
The Fund’s independent accountants will not render services in the following categories of non-audit services:
| | • | Bookkeeping or other services related to the accounting records or financial statements of the Fund |
| | • | Financial information systems design and implementation |
| | • | Appraisal or valuation services, fairness opinions, or contribution-in-kind reports |
| | • | Internal audit outsourcing services |
| | • | Management functions or human resources |
| | • | Broker or dealer, investment adviser, or investment banking services |
| | • | Legal services and expert services unrelated to the audit |
| | • | Any other service that the Public Company Accounting Oversight Board determines, by regulation, is impermissible. |
Pre-approval of Non-Audit Services Provided to Other Entities Within the Prudential Fund Complex
Certain non-audit services provided to Prudential Investments LLC or any of its affiliates that also provide ongoing services to the Prudential Mutual Funds will be subject to pre-approval by the Audit Committee. The only non-audit services provided to these entities that will require pre-approval are those related directly to the operations and financial reporting of the Funds. Individual projects that are not presented to the Audit Committee as part of the annual pre-approval process, will be subject to pre-approval by the Committee Chair (or any other Committee member on whom this responsibility has been delegated) so long as the estimated fee for those services does not exceed $50,000. Services presented for pre-approval pursuant to this paragraph will be accompanied by a confirmation from both the Treasurer and the independent accountants that the proposed services will not adversely affect the independence of the independent accountants.
Although the Audit Committee will not pre-approve all services provided to Prudential Investments LLC and its affiliates, the Committee will receive an annual report from the Fund’s independent accounting firm showing the aggregate fees for all services provided to Prudential Investments and its affiliates.
(e) (2) Percentage of services referred to in 4(b)- (4)(d) that were approved by the audit committee –
Not applicable.
(f) Percentage of hours expended attributable to work performed by other than full time employees of principal accountant if greater than 50%.
Not applicable.
(g) Non-Audit Fees
Not applicable to Registrant. The aggregate non-audit fees billed by KPMG for services rendered to the registrant’s investment adviser and any entity controlling, controlled by, or under common control with the investment adviser that provides ongoing services to the registrant for the last fiscal year 2004 was $33,500. KPMG did not serve as the Registrant’s principal accountant during fiscal year 2003, so no information for that fiscal year is provided.
(h) Principal Accountants Independence
Not applicable as KPMG has not provided non-audit services to the registrant’s investment adviser and any entity controlling, controlled by, or under common control with the investment adviser that provides ongoing services to the registrant that were not pre-approved pursuant to Rule 2-01(c)(7)(ii) of Regulation S-X.
Item 5 – Audit Committee of Listed Registrants – Not applicable.
Item 6 – Schedule of Investments – The schedule is included as part of the report to shareholders filed under Item 1 of this Form.
Item 7 – Disclosure of Proxy Voting Policies and Procedures for Closed-End Management Investment Companies – Not applicable.
Item 8 – Purchases of Equity Securities by Closed-End Management Investment Company and Affiliated Purchasers – Not applicable.
Item 9 – Submission of Matters to a Vote of Security Holders:
On September 1, 2004, the Board of Trustees adopted the following nominations and communications policy:
Nominating and Governance Committee. The Nominating and Governance Committee of the Board of Trustees is responsible for nominating trustees and making recommendations to the Board concerning Board composition, committee structure and governance, director education, and governance practices. The Board has determined that each member of the Nominating and Governance Committee is not an “interested person” as defined in the 1940 Act.
The Nominating and Governance Committee Charter is available on the Funds’ website at www.jennisondryden.com.
Selection of Trustee Nominees. The Nominating and Governance Committee is responsible for considering nominees for trustees at such times as it considers electing new members to the Board. The Nominating and Governance Committee may consider recommendations by business and personal contacts of current Board members, and by executive search firms which the Committee may engage from time to time and will also consider shareholder recommendations. The Nominating and Governance Committee has not established specific, minimum qualifications that it believes must be met by a nominee. In evaluating nominees, the Nominating and Governance Committee considers, among other things, an individual’s background, skills, and experience; whether the individual is an “interested person” as defined in the 1940 Act; and whether the individual would be deemed an “audit committee financial expert” within the meaning of applicable SEC rules. The Nominating and Governance Committee also considers whether the individual’s background, skills, and experience will complement the background, skills, and experience of other nominees and will contribute to the diversity of the Board. There are no differences in the manner in which the Nominating and Governance Committee evaluates nominees for the Board based on whether the nominee is recommended by a shareholder.
A shareholder who wishes to recommend a trustee nominee should submit his or her recommendation in writing to the Chair of the Board (Robin Smith) or the Chair of the Nominating and Governance Committee (Richard Redeker), in either case at Jennison Value Fund, P.O. Box 13964, Philadelphia, PA 19176. At a minimum, the recommendation should include:
| | • | the name, address, and business, educational, and/or other pertinent background of the person being recommended; |
| | • | a statement concerning whether the person is an “interested person” as defined in the Investment Company Act of 1940; |
| | • | any other information that the Funds would be required to include in a proxy statement concerning the person if he or she was nominated; and |
| | • | the name and address of the person submitting the recommendation, together with the number of Fund shares held by such person and the period for which the shares have been held. |
The recommendation also can include any additional information which the person submitting it believes would assist the Nominating and Governance Committee in evaluating the recommendation.
Shareholders should note that a person who owns securities issued by Prudential Financial, Inc. (the parent company of the Funds’ investment adviser) would be deemed an “interested person” under the 1940 Act. In addition, certain other relationships with Prudential Financial, Inc. or its subsidiaries, with registered broker-dealers, or with the Funds’ outside legal counsel may cause a person to be deemed an “interested person.”
Before the Nominating and Governance Committee decides to nominate an individual to the Board, Committee members and other Board members customarily interview the individual in person. In addition, the individual customarily is asked to complete a detailed questionnaire which is designed to elicit information which must be
disclosed under SEC and stock exchange rules and to determine whether the individual is subject to any statutory disqualification from serving on the board of a registered investment company.
Shareholder Communications with Trustees
Shareholders of the Funds can communicate directly with the Board of Trustees by writing to the Chair of the Board, Jennison Value Fund, P.O. Box 13964, Philadelphia, PA 19176. Shareholders can communicate directly with an individual Trustee by writing to that director at Jennison Value Fund, P.O. Box 13964, Philadelphia, PA 19176. Such communications to the Board or individual trustees are not screened before being delivered to the addressee.
Item 10 – Controls and Procedures
| | (a) | It is the conclusion of the registrant’s principal executive officer and principal financial officer that the effectiveness of the registrant’s current disclosure controls and procedures (such disclosure controls and procedures having been evaluated within 90 days of the date of this filing) provide reasonable assurance that the information required to be disclosed by the registrant has been recorded, processed, summarized and reported within the time period specified in the Commission’s rules and forms and that the information required to be disclosed by the registrant has been accumulated and communicated to the registrant’s principal executive officer and principal financial officer in order to allow timely decisions regarding required disclosure. |
| | (b) | There have been no significant changes in the registrant’s internal controls or in other factors that could significantly affect these controls subsequent to the date of their evaluation, including any corrective actions with regard to significant deficiencies and material weaknesses. |
Item 11 – Exhibits
| | (a) | Code of Ethics – Attached hereto |
| | (b) | Certifications pursuant to Section 302 and 906 of the Sarbanes-Oxley Act – Attached hereto |
SIGNATURES
Pursuant to the requirements of the Securities Exchange Act of 1934 and the Investment Company Act of 1940, the registrant has duly caused this report to be signed on its behalf by the undersigned, thereunto duly authorized.
| | |
| (Registrant) | | Jennison Value Fund |
| | |
| |
| By (Signature and Title)* | | /s/ WILLIAM V. HEALEY |
| | | William V. Healey Chief Legal Officer |
Pursuant to the requirements of the Securities Exchange Act of 1934 and the Investment Company Act of 1940, this report has been signed below by the following persons on behalf of the registrant and in the capacities and on the dates indicated.
| | |
| |
| By (Signature and Title)* | | /s/ JUDY A. RICE |
| | | Judy A. Rice President and Principal Executive Officer |
| | |
| |
| By (Signature and Title)* | | /s/ GRACE C. TORRES |
| | | Grace C. Torres Treasurer and Principal Financial Officer |
| * | Print the name and title of each signing officer under his or her signature. |