UNITED STATES
SECURITIES AND EXCHANGE COMMISSION
Washington, D.C. 20549
FORM N-CSR
CERTIFIED SHAREHOLDER REPORT OF REGISTERED MANAGEMENT
INVESTMENT COMPANIES
| | |
Investment Company Act file number: | | 811-04864 |
| |
Exact name of registrant as specified in charter: | | Jennison Value Fund |
| |
Address of principal executive offices: | | Gateway Center 3, |
| | 100 Mulberry Street, |
| | Newark, New Jersey 07102 |
| |
Name and address of agent for service: | | Deborah A. Docs |
| | Gateway Center 3, |
| | 100 Mulberry Street, |
| | Newark, New Jersey 07102 |
| |
Registrant’s telephone number, including area code: | | 973-367-7521 |
| |
Date of fiscal year end: | | 10/31/2006 |
| |
Date of reporting period: | | 10/31/2006 |
Item 1 – Reports to Stockholders

Jennison Value Fund
| | |
| OCTOBER 31, 2006 | | ANNUAL REPORT |

FUND TYPE
Large-capitalization stock
OBJECTIVE
Capital appreciation
This report is not authorized for distribution to prospective investors unless preceded or accompanied by a current prospectus.
The views expressed in this report and information about the Fund’s portfolio holdings are for the period covered by this report and are subject to change thereafter.
JennisonDryden is a registered trademark of The Prudential Insurance Company of America.

December 15, 2006
Dear Shareholder:
We hope you find the annual report for the Jennison Value Fund informative and useful. As a JennisonDryden mutual fund shareholder, you may be thinking about where you can find additional growth opportunities. You could invest in last year’s top-performing asset class and hope that history repeats itself or you could stay in cash while waiting for the “right moment” to invest.
Instead, we believe it is better to take advantage of developing domestic and global investment opportunities through a diversified portfolio of stock and bond mutual funds. A diversified asset allocation offers two potential advantages. It helps you manage downside risk by not being overly exposed to any particular asset class, plus it gives you a better opportunity to have at least some of your assets in the right place at the right time. Your financial professional can help you create a diversified investment plan that may include mutual funds covering all the basic asset classes and that reflects your personal investor profile and tolerance for risk.
JennisonDryden Mutual Funds gives you a wide range of choices that can help you make progress toward your financial goals. Our funds offer the experience, resources, and professional discipline of three leading asset managers. They are recognized and respected in the institutional market and by discerning investors for excellence in their respective strategies. JennisonDryden equity funds are advised by Jennison Associates LLC or Quantitative Management Associates LLC (QMA). Prudential Investment Management, Inc. (PIM) advises the JennisonDryden fixed income and money market funds. Jennison Associates, QMA, and PIM are registered investment advisers and Prudential Financial companies.
Thank you for choosing JennisonDryden Mutual Funds.
Sincerely,

Judy A. Rice, President
Jennison Value Fund
Your Fund’s Performance
Fund objective
The investment objective of the Jennison Value Fund is capital appreciation. There can be no assurance that the Fund will achieve its investment objective.
Performance data quoted represent past performance. Past performance does not guarantee future results. The investment return and principal value of an investment will fluctuate, so that an investor’s shares, when redeemed, may be worth more or less than their original cost. Current performance may be lower or higher than the past performance data quoted. An investor may obtain performance data as of the most recent month-end by visiting our website at www.jennisondryden.com or by calling (800) 225-1852. The maximum initial sales charge is 5.50% (Class A shares).
| | | | | | | | | | | |
| Cumulative Total Returns as of 10/31/06 |
| | | One Year | | | Five Years | | | Ten Years | | | Since Inception1 |
Class A | | 19.85 | % | | 66.33 | % | | 178.88 | % | | — |
Class B | | 18.96 | | | 60.17 | | | 158.71 | | | — |
Class C | | 18.95 | | | 60.24 | | | 158.83 | | | — |
Class R | | 19.21 | | | N/A | | | N/A | | | 28.52% (6/3/05) |
Class Z | | 20.15 | | | 68.40 | | | 186.11 | | | — |
S&P 500 Index2 | | 16.33 | | | 41.90 | | | 128.99 | | | ** |
Russell 1000 Value Index3 | | 21.46 | | | 73.43 | | | 187.44 | | | *** |
Lipper Multi-Cap Value Funds Avg.4 | | 17.77 | | | 62.80 | | | 153.37 | | | **** |
| | | | | | | | | | | |
| Average Annual Total Returns5 as of 9/30/06 |
| | | One Year | | | Five Years | | | Ten Years | | | Since Inception1 |
Class A | | 6.93 | % | | 9.23 | % | | 9.90 | % | | — |
Class B | | 7.28 | | | 9.50 | | | 9.69 | | | — |
Class C | | 11.27 | | | 9.65 | | | 9.69 | | | — |
Class R | | 12.48 | | | N/A | | | N/A | | | 18.40% (6/3/05) |
Class Z | | 13.41 | | | 10.75 | | | 10.79 | | | — |
S&P 500 Index2 | | 10.78 | | | 6.97 | | | 8.59 | | | ** |
Russell 1000 Value Index3 | | 14.62 | | | 10.73 | | | 11.20 | | | *** |
Lipper Multi-Cap Value Funds Avg.4 | | 11.14 | | | 9.85 | | | 9.35 | | | **** |
The cumulative total returns do not reflect the deduction of applicable sales charges. If reflected, the applicable sales charges would reduce the cumulative total returns performance quoted. Class A shares are subject to a maximum front-end sales charge of 5.50%. Under certain circumstances, Class A shares may be subject to a contingent deferred sales charge (CDSC) of 1%. Class B and Class C shares are subject to a maximum CDSC of 5% and 1%, respectively. Class Z shares are not subject to a sales charge.
| | |
| 2 | | Visit our website at www.jennisondryden.com |
Source: Prudential Investments LLC and Lipper Inc. Performance figures may reflect fee waivers and/or expense reimbursements. In the absence of such fee waivers and/or expense reimbursements, total returns would be lower.
1Inception date returns are provided for any share class with less than 10 calendar years.
2The Standard & Poor’s 500 Composite Stock Price Index (S&P 500 Index) is an unmanaged index of 500 stocks of large U.S. companies. It gives a broad look at how stock prices have performed in the United States.
3The Russell 1000 Value Index is an unmanaged index comprising those securities in the Russell 1000 Index with a less-than-average growth orientation. Companies in this index generally have low price-to-book and price-to-earnings ratios, higher dividend yields, and lower forecasted growth values.
4The Lipper Multi-Cap Value Funds Average (Lipper Average) represents returns based on an average return of all funds in the Lipper Multi-Cap Value Funds category for the periods noted. Funds in the Lipper Average typically have a below-average price-to-earnings ratio, price-to-book ratio, and three-year sales-per-share growth value compared with the S&P SuperComposite 1500 Index.
5The average annual total returns take into account applicable sales charges. Class A, Class B, Class C, and Class R shares are subject to an annual distribution and service (12b-1) fee of up to 0.30%, 1.00%, 1.00%, and 0.75%, respectively. Approximately seven years after purchase, Class B shares will automatically convert to Class A shares on a quarterly basis. Class Z shares are not subject to a 12b-1 fee. The returns in the tables do not reflect the deduction of taxes that a shareholder would pay on Fund distributions or following the redemption of Fund shares.
Investors cannot invest directly in an index. The returns for the S&P 500 Index, the Russell 1000 Value Index, and the Lipper Average would be lower if they included the effects of sales charges, operating expenses of a mutual fund, or taxes. Returns for the Lipper Average reflect the deduction of operating expenses, but not sales charges or taxes.
**S&P 500 Index Since Inception cumulative total return as of 10/31/06 is 18.68% for Class R. S&P 500 Index Since Inception average annual total return as of 9/30/06 is 11.00% for Class R.
*** Russell 1000 Value Index Since Inception cumulative total return as of 10/31/06 is 24.32% for Class R. Russell 1000 Value Index Since Inception average annual total return as of 9/30/06 is 14.92% for Class R.
****Lipper Average Since Inception cumulative total return as of 10/31/06 is 20.73% for Class R. Lipper Average Since Inception average annual total return as of 9/30/06 is 12.38% for Class R.
| | | |
| Five Largest Holdings expressed as a percentage of net assets as of 10/31/06 | | | |
Citigroup, Inc., Diversified Financial Services | | 2.8 | % |
Altria Group, Inc., Tobacco | | 2.7 | |
American International Group, Inc., Insurance | | 2.6 | |
Merrill Lynch & Co., Inc., Capital Markets | | 2.4 | |
Bank of America Corp., Diversified Financial Services | | 2.2 | |
Holdings reflect only long-term investments and are subject to change.
| | | |
| Five Largest Industries expressed as a percentage of net assets as of 10/31/06 | | | |
Oil, Gas & Consumable Fuels | | 13.1 | % |
Insurance | | 7.9 | |
Capital Markets | | 7.7 | |
Diversified Financial Services | | 7.7 | |
Media | | 4.7 | |
Industry weightings reflect only long-term investments and are subject to change.
Investment Subadviser’s Report
Jennison Associates LLC
Performance overview
Over 12 months ended October 31, 2006, the Fund had a very strong return. Although the Fund’s Class A shares underperformed the Russell 1000® Value Index (the Index), which was substantially above its long-term average, they outperformed the Lipper Multi-Cap Value Funds Average by about two percentage points. The return of the Index, which is weighted by market capitalization, was boosted by stocks of a few very large companies—Exxon Mobil, AT&T, Bellsouth, Chevron, Pfizer, and Merck—that were among the market leaders in 2006. Our analysis of the fundamentals of these companies made us unenthusiastic about the stocks and led us to avoid them. However, investors nonetheless shifted assets to these easily traded and relatively stable stocks. Although the earnings of these firms were only slightly above average, investors were willing to pay a rapidly rising multiple of earnings for the shares. Performance relative to the Index was enhanced by the Fund’s positions in stocks not included in the Index, such as Inco, TXU, Liberty Global, Suncor Energy, Nexen, Lazard, and UBS. Every sector within the Fund finished the reporting period in positive territory.
Market environment
Despite economic concerns such as higher commodity prices, inflation, and rising interest rates, overall stock market performance was strong for this period. After raising its target for the federal funds rate (the overnight lending rate for banks) by 0.25 percentage points each time it met for more than two years, the Federal Open Market Committee took no action at its recent meetings. The significance of this pause was the subject of debate between those pointing to signs of economic strength and inflation and those already seeing deceleration. A marked decline in oil and natural gas prices, along with moderation in the prices of other commodities, lifted consumer confidence as the reporting period drew to a close; allaying worries that consumer discretionary spending would wane. Weaker consumer activity did little to diminish the overall strength of corporate profits during the third quarter of 2006, but expectations for profits and activity in the fourth quarter were scaled back.
Financials provided the largest contribution to returns
Although we found few attractive investment opportunities in the financials sector, several positions we did hold—including Merrill Lynch, Bank of America (see Comments on Largest Holdings for both), Loews, and Lazard—added substantially to the Fund’s return.
| | |
| 4 | | Visit our website at www.jennisondryden.com |
Merrill Lynch shares lagged the market during most of the reporting period, but broke out of their range after the company reported a stellar third quarter of 2006 with a 48% rise in revenue. Its three business segments delivered solid year-over-year revenue and earnings growth in an environment that was more challenging than in the first half of the calendar year. Bank of America performed well as it reported strong earnings in the first two quarters of 2006, well in excess of expectations. Key drivers were growth in consumer and small-business banking.
We originally purchased shares of Lazard in 2005 after they dropped almost 20% immediately after the company first issued them. They then traded at about half the multiple of earnings of other merger and acquisition (M&A) specialists. Lazard’s shares gained ground as it reported solid profits amid strong M&A activity. Even though Lazard does not have market share comparable to the top brokers, it has high “wallet” share, that is, it is well compensated as a trusted adviser that adds value to the process. It also operates throughout the deal-size spectrum and does very well in the underserved midtier segment. We took our profits on the position shortly after the close of the reporting period because its valuation reached our target.
Energy and materials were noteworthy sources of gain
The Fund’s energy positions, including Suncor Energy and Nexen, finished the period substantially higher despite a correction in the third quarter of 2006. Despite possible short-term corrections, we remain convinced that the prices of energy resources will continue to rise over the long term. Growth of demand continues to be strong and supply tenuous.
Canadian nickel miner Inco and copper miner Phelps Dodge made strong contributions to the Fund’s performance. Global supply/demand imbalances should persist for the long term, giving metals and mining companies pricing power. In May 2006, we closed the Fund’s position in Inco because it had hit our price target, taking a significant profit over our initial purchase price in November 2004.
We had solid stock selection in the consumer discretionary and utilities sectors
Since our initial purchase of Comcast, the largest U.S. cable television operator, in March 2006, the stock has appreciated nearly 53%. Comcast continues to increase revenue with its “triple-play bundle,” a package of digital video, broadband, and telephone services. Comcast also gained on its acquisition with Time Warner Cable of bankrupt cable operator Adelphia Communications. We believe the combination of declining capital expenditures with rising earnings from new services should generate significant free cash flow.
Investment Subadviser’s Report (continued)
TXU, a Texas-based power provider, led the Fund’s utility holdings. It stunned the market with its plans to build 8,600 megawatts of low-cost, clean coal-fired generation plants in Texas by 2010. These plants may add $3.45 per share to earnings and will be financed so as to preserve TXU’s free cash flow over the next five years.
The Fund’s weakest positions declined slightly
Our investment process focuses on both a stock’s attractive prospects for appreciation and its limited risk of decline. We did an excellent job controlling risk this reporting period. Only four positions—Dell, OSI Restaurant Partners, Omnicare, and Sprint Nextel—detracted more than 0.20 percentage points from performance. Three of these rebounded after the end of the reporting period. Shares of computer company Dell fell due to investor disappointment in the growth outlook for its U.S. PC business and lower margins due to slowing sales. Although we thought the stock was inexpensive even with the lower growth rate, we liquidated our shares when Dell reduced margins in order to spur growth, and sales in the PC segment plateaued.
The Fund had a small position in restaurateur OSI Restaurant Partners, which operates and franchises casual dining restaurants such as Outback Steakhouse, Carrabba’s Italian Grill, and Bonefish Grill. Over the past several months, customer traffic in the casual dining industry has slowed while costs have risen. However, a consortium of private equity funds and management made a buyout offer to public shareholders in an effort to take the company private. OSI shares rose more than 20% after the end of the reporting period as a result.
Omnicare provides pharmaceuticals and related pharmacy services to long-term care institutions. Its shares declined in response to a poor third quarter. The most surprising factor was that bed count declined to the lowest level since Omnicare acquired NeighborCare in 2005. We added to our position on the weakness, believing the stock to be attractively valued. Omnicare commands more than 40% of the long-term beds. We expect bed count to resume growing next quarter and continue through 2007.
The shares of wireless telecommunication firm Sprint were driven down by disappointing second-quarter performance, plans to spend billions of dollars on a high-speed wireless network, and the departure of Chief Operating Officer Len Lauer. We believe the weakness was an overreaction to these factors and to structural issues that should be resolved shortly. Sprint has a stable customer base and should benefit from the strong demand for wireless services. We believe the stock’s current valuation remains compelling.
| | |
| 6 | | Visit our website at www.jennisondryden.com |
Outlook
We still believe that the global economy will continue to grow at a modest pace. The U.S. stock market overall is reasonably priced if our modest expectations of economic growth come to fruition. The biggest risk we see is that the profit margins of many companies are at all-time highs, and they will likely fall without economic growth. We continue to look for attractively valued stocks with strong free cash flow and steadily rising earnings that have lower risk of margin compression. Over the past several months, we have found many companies across a variety of industries with strong and steady free cash flow.
The Portfolio of Investments following this report shows the size of the Fund’s positions at period-end.
Comments on Largest Holdings
Holdings expressed as a percentage of the Fund’s net assets as of 10/31/06.
| 2.8% | Citigroup, Inc./Diversified Financial Services |
Citigroup is a diversified financial services company that, among other things, provides investment banking, retail brokerage, and corporate banking services. We believe the company’s fundamentals are sound and the stock is reasonably valued.
| 2.7% | Altria Group, Inc./Tobacco |
Altria Group is the largest tobacco company in the world through its Philip Morris subsidiaries as well as 85% owner of Kraft Foods. We believe once legal obstacles are resolved, Altria can be broken up. In our opinion, the restructuring should be a boon to investors, unlocking the pent-up value in the tobacco operations and leading to a higher stock price.
| 2.6% | American International Group, Inc./Insurance |
AIG is engaged in a range of insurance and insurance-related activities in the United States and abroad. AIG’s primary activities include both General Insurance and Life Insurance & Retirement Services operations. We believe AIG is attractively valued and is poised to produce continued revenue and earnings growth, especially from its international insurance business (particularly in Asia).
| 2.4% | Merrill Lynch & Co., Inc./Capital Markets |
Merrill Lynch, the largest U.S. brokerage, has a very strong balance sheet, with book value now over $40. We continue to believe its stock price does not fully reflect the quality of Merrill’s franchise and are encouraged by the company’s focus on shareholder value via share buybacks.
| 2.2% | Bank of America Corp./Diversified Financial Services |
Bank of America is the second largest bank in the United States by assets. It operates both domestically and internationally. Its deposit-raising abilities give it a cost advantage. We like its continued focus on shareholder value. It approved buybacks of 200 million shares in March 2005 and again in March 2006.
Holdings are subject to change.
| | |
| 8 | | Visit our website at www.jennisondryden.com |
Fees and Expenses (Unaudited)
As a shareholder of the Fund, you incur two types of costs: (1) transaction costs, including sales charges (loads) on purchase payments and redemptions, as applicable, and (2) ongoing costs, including management fees, distribution and/or service (12b-1) fees, and other Fund expenses, as applicable. This example is intended to help you understand your ongoing costs (in dollars) of investing in the Fund and to compare these costs with the ongoing costs of investing in other mutual funds.
The example is based on an investment of $1,000 invested on May 1, 2006, at the beginning of the period, and held through the six-month period ended October 31, 2006.
The Fund’s transfer agent may charge additional fees to holders of certain accounts that are not included in the expenses shown in the table on the following page. These fees apply to Individual Retirement Accounts (IRAs) and Section 403(b) accounts. As of the close of the six-month period covered by the table, IRA fees included an annual maintenance fee of $15 per account (subject to a maximum annual maintenance fee of $25 for all accounts held by the same shareholder). Section 403(b) accounts are charged an annual $25 fiduciary maintenance fee. Some of the fees may vary in amount, or may be waived, based on your total account balance or the number of JennisonDryden or Strategic Partners Funds, including the Fund, that you own. You should consider the additional fees that were charged to your Fund account over the six-month period when you estimate the total ongoing expenses paid over the period and the impact of these fees on your ending account value, as these additional expenses are not reflected in the information provided in the expense table. Additional fees have the effect of reducing investment returns.
Actual Expenses
The first line for each share class in the table on the following page provides information about actual account values and actual expenses. You may use the information on this line, together with the amount you invested, to estimate the expenses that you paid over the period. Simply divide your account value by $1,000 (for example, an $8,600 account value ÷ $1,000 = 8.6), then multiply the result by the number on the first line under the heading “Expenses Paid During the Six-Month Period” to estimate the expenses you paid on your account during this period.
Hypothetical Example for Comparison Purposes
The second line for each share class in the table on the following page provides information about hypothetical account values and hypothetical expenses based on the Fund’s actual expense ratio and an assumed rate of return of 5% per year before expenses, which is not the Fund’s actual return. The hypothetical account values and expenses may not be used to estimate the actual ending account balance or expenses
Fees and Expenses (continued)
you paid for the period. You may use this information to compare the ongoing costs of investing in the Fund and other funds. To do so, compare this 5% hypothetical example with the 5% hypothetical examples that appear in the shareholder reports of the other funds.
Please note that the expenses shown in the table are meant to highlight your ongoing costs only, and do not reflect any transactional costs such as sales charges (loads). Therefore the second line for each share class in the table is useful in comparing ongoing costs only, and will not help you determine the relative total costs of owning different funds. In addition, if these transactional costs were included, your costs would have been higher.
| | | | | | | | | | | | | | |
| Jennison Value Fund | | Beginning Account
Value May 1, 2006 | | Ending Account
Value October 31, 2006 | | Annualized
Expense Ratio
Based on the
Six-Month Period | | | Expenses Paid
During the Six-
Month Period* |
| | | | | | | | | | | | | | | |
| Class A | | Actual | | $ | 1,000.00 | | $ | 1,039.80 | | 0.96 | % | | $ | 4.94 |
| | | Hypothetical | | $ | 1,000.00 | | $ | 1,020.37 | | 0.96 | % | | $ | 4.89 |
| | | | | | | | | | | | | | | |
| Class B | | Actual | | $ | 1,000.00 | | $ | 1,035.50 | | 1.71 | % | | $ | 8.77 |
| | | Hypothetical | | $ | 1,000.00 | | $ | 1,016.59 | | 1.71 | % | | $ | 8.69 |
| | | | | | | | | | | | | | | |
| Class C | | Actual | | $ | 1,000.00 | | $ | 1,035.90 | | 1.71 | % | | $ | 8.78 |
| | | Hypothetical | | $ | 1,000.00 | | $ | 1,016.59 | | 1.71 | % | | $ | 8.69 |
| | | | | | | | | | | | | | | |
| Class R | | Actual | | $ | 1,000.00 | | $ | 1,038.50 | | 1.21 | % | | $ | 6.22 |
| | | Hypothetical | | $ | 1,000.00 | | $ | 1,019.11 | | 1.21 | % | | $ | 6.16 |
| | | | | | | | | | | | | | | |
| Class Z | | Actual | | $ | 1,000.00 | | $ | 1,041.10 | | 0.71 | % | | $ | 3.65 |
| | | Hypothetical | | $ | 1,000.00 | | $ | 1,021.63 | | 0.71 | % | | $ | 3.62 |
| | | | | | | | | | | | | | | |
* Fund expenses (net of fee waivers or subsidies, if any) for each share class are equal to the annualized expense ratio for each share class (provided in the table), multiplied by the average account value over the period, multiplied by the 184 days in the six-month period ended October 31, 2006, and divided by the 365 days in the Fund’s fiscal year ended October 31, 2006 (to reflect the six-month period).
| | |
| 10 | | Visit our website at www.jennisondryden.com |
Portfolio of Investments
as of October 31, 2006
| | | | | |
| Shares | | Description | | Value (Note 1) |
| | | | | |
LONG-TERM INVESTMENTS 97.1% | | | |
COMMON STOCKS | | | |
| |
Aerospace & Defense 2.0% | | | |
| 569,400 | | Honeywell International, Inc. | | $ | 23,983,128 |
| |
Building Products 1.2% | | | |
| 321,000 | | American Standard Cos., Inc. | | | 14,217,090 |
| |
Capital Markets 7.7% | | | |
| 688,100 | | Bank of New York Co., Inc. (The) | | | 23,649,997 |
| 156,700 | | Lazard Ltd. (Class A)(b) | | | 6,644,080 |
| 228,000 | | Mellon Financial Corp. | | | 8,846,400 |
| 316,500 | | Merrill Lynch & Co., Inc. | | | 27,668,430 |
| 404,400 | | UBS AG | | | 24,199,296 |
| | | | | |
| | | | | 91,008,203 |
| |
Chemicals 2.4% | | | |
| 355,300 | | E.I. du Pont de Nemours & Co. | | | 16,272,740 |
| 647,100 | | Mosaic Co. (The)(a)(b) | | | 12,113,712 |
| | | | | |
| | | | | 28,386,452 |
| |
Commercial Banks 1.3% | | | |
| 417,758 | | Royal Bank of Scotland Group PLC (United Kingdom) | | | 14,886,060 |
| |
Commercial Services & Supplies 2.0% | | | |
| 613,100 | | Waste Management, Inc. | | | 22,978,988 |
| |
Communications Equipment 2.8% | | | |
| 1,426,800 | | Avaya, Inc.(a) | | | 18,277,308 |
| 636,600 | | Motorola, Inc. | | | 14,679,996 |
| | | | | |
| | | | | 32,957,304 |
| |
Computers & Peripherals 1.1% | | | |
| 136,800 | | International Business Machines Corp. | | | 12,630,744 |
| |
Consumer Finance 1.0% | | | |
| 206,500 | | American Express Co. | | | 11,937,765 |
| |
Diversified Consumer Services 2.1% | | | |
| 596,400 | | Career Education Corp.(a)(b) | | | 13,287,792 |
| 540,400 | | H&R Block, Inc. | | | 11,813,144 |
| | | | | |
| | | | | 25,100,936 |
See Notes to Financial Statements.
Portfolio of Investments
as of October 31, 2006 Cont’d.
| | | | | |
| Shares | | Description | | Value (Note 1) |
| | | | | |
Diversified Financial Services 7.7% | | | |
| 484,346 | | Bank of America Corp. | | $ | 26,091,719 |
| 656,200 | | Citigroup, Inc.(b) | | | 32,914,993 |
| 354,800 | | JPMorgan Chase & Co. | | | 16,831,712 |
| 120,000 | | KKR Private Equity Investors LLP(a) | | | 2,610,000 |
| 536,200 | | KKR Private Equity Investors LLP - RDU, Physical, Private Placement, 144A (cost $13,370,899; purchased 5/3/06 - 5/5/06)(a)(f)(g)(h) | | | 11,662,350 |
| | | | | |
| | | | | 90,110,774 |
| |
Diversified Telecommunication Services 1.0% | | | |
| 327,000 | | Verizon Communications, Inc. | | | 12,099,000 |
| |
Electric Utilities 1.2% | | | |
| 229,300 | | Exelon Corp. | | | 14,212,014 |
| |
Food & Staples Retailing 2.8% | | | |
| 930,000 | | Kroger Co. (The) | | | 20,915,700 |
| 232,600 | | Wal-Mart Stores, Inc. | | | 11,462,528 |
| | | | | |
| | | | | 32,378,228 |
| |
Food Products 3.4% | | | |
| 508,100 | | Cadbury Schweppes PLC, ADR (United Kingdom) | | | 20,623,779 |
| 744,800 | | ConAgra Foods, Inc. | | | 19,476,520 |
| | | | | |
| | | | | 40,100,299 |
| |
Health Care Providers & Services 2.4% | | | |
| 123,800 | | CIGNA Corp. | | | 14,482,124 |
| 370,500 | | Omnicare, Inc.(b) | | | 14,034,540 |
| | | | | |
| | | | | 28,516,664 |
| |
Hotels, Restaurants & Leisure 1.6% | | | |
| 218,400 | | Hilton Hotels Corp. | | | 6,316,128 |
| 374,800 | | OSI Restaurant Partners, Inc. | | | 12,469,596 |
| | | | | |
| | | | | 18,785,724 |
| |
Household Products 1.7% | | | |
| 302,500 | | Kimberly-Clark Corp. | | | 20,122,300 |
| |
Independent Power Producers & Energy Traders 3.3% | | | |
| 399,000 | | NRG Energy, Inc.(a) | | | 19,211,850 |
| 306,100 | | TXU Corp. | | | 19,324,093 |
| | | | | |
| | | | | 38,535,943 |
See Notes to Financial Statements.
| | |
| 12 | | Visit our website at www.jennisondryden.com |
| | | | | |
| Shares | | Description | | Value (Note 1) |
| | | | | |
Industrial Conglomerates 3.1% | | | |
| 457,500 | | General Electric Co. | | $ | 16,062,825 |
| 704,400 | | Tyco International Ltd. | | | 20,730,492 |
| | | | | |
| | | | | 36,793,317 |
| |
Insurance 7.9% | | | |
| 461,400 | | American International Group, Inc. | | | 30,992,238 |
| 404,400 | | Axis Capital Holdings Ltd. | | | 13,284,540 |
| 237,700 | | Genworth Financial, Inc. (Class A) | | | 7,948,688 |
| 602,100 | | Loews Corp. | | | 23,433,732 |
| 960,600 | | Montpelier Re Holdings Ltd.(b) | | | 17,050,650 |
| | | | | |
| | | | | 92,709,848 |
| |
Internet & Catalog Retail 0.9% | | | |
| 353,600 | | IAC/InterActiveCorp.(a)(b) | | | 10,954,528 |
| |
Media 4.7% | | | |
| 502,100 | | Comcast Corp. (Class A)(a)(b) | | | 20,420,407 |
| 672,712 | | Liberty Global, Inc. (Series C)(a) | | | 17,107,066 |
| 464,957 | | Viacom, Inc. (Class B)(a) | | | 18,096,126 |
| | | | | |
| | | | | 55,623,599 |
| |
Metals & Mining 1.8% | | | |
| 205,200 | | Phelps Dodge Corp. | | | 20,597,976 |
| |
Multi-Utilities 1.3% | | | |
| 297,700 | | Sempra Energy | | | 15,790,008 |
| |
Office Electronics 2.1% | | | |
| 1,464,800 | | Xerox Corp.(a) | | | 24,901,600 |
| |
Oil, Gas & Consumable Fuels 13.1% | | | |
| 317,300 | | Anadarko Petroleum Corp. | | | 14,729,066 |
| 284,700 | | Hess Corp.(b) | | | 12,071,280 |
| 226,100 | | Marathon Oil Corp. | | | 19,535,040 |
| 311,500 | | Nexen, Inc. | | | 16,609,180 |
| 482,400 | | Occidental Petroleum Corp. | | | 22,643,856 |
| 196,400 | | Petroleo Brasileiro S.A., ADR (Brazil) | | | 17,432,464 |
| 294,900 | | Suncor Energy, Inc. | | | 22,604,085 |
| 236,629 | | Trident Resources Corp., Private (Canada)
(cost $9,942,621; purchased 3/11/05 - 1/5/06)(a)(f)(g) | | | 10,536,043 |
| 344,100 | | Valero Energy Corp. | | | 18,006,753 |
| | | | | |
| | | | | 154,167,767 |
See Notes to Financial Statements.
Portfolio of Investments
as of October 31, 2006 Cont’d.
| | | | | | |
| Shares | | Description | | Value (Note 1) | |
Pharmaceuticals 3.6% | | | | |
| | | | | | |
| 281,200 | | Abbott Laboratories | | $ | 13,359,812 | |
| 291,400 | | Novartis AG, ADR (Switzerland) | | | 17,696,722 | |
| 264,700 | | Sanofi-Aventis, ADR (France)(b) | | | 11,300,043 | |
| | | | | | |
| | | | | 42,356,577 | |
| |
Software 2.0% | | | | |
| 684,600 | | CA, Inc. | | | 16,950,696 | |
| 304,900 | | Symantec Corp.(a) | | | 6,049,216 | |
| | | | | | |
| | | | | 22,999,912 | |
| |
Textiles, Apparel & Luxury Goods 1.1% | | | | |
| 136,200 | | Nike, Inc. (Class B) | | | 12,514,056 | |
| |
Thrifts & Mortgage Finance 0.6% | | | | |
| 184,300 | | Countrywide Financial Corp. | | | 7,025,516 | |
| |
Tobacco 2.7% | | | | |
| 395,000 | | Altria Group, Inc. | | | 32,125,350 | |
| |
Wireless Telecommunication Services 3.5% | | | | |
| 355,300 | | Alltel Corp. | | | 18,941,043 | |
| 1,194,275 | | Sprint Nextel Corp.(b) | | | 22,321,000 | |
| | | | | | |
| | | | | 41,262,043 | |
| | | | | | |
| | Total long-term investments
(cost $894,711,786) | | | 1,142,769,713 | |
| | | | | | |
SHORT-TERM INVESTMENT 13.1% | | | | |
| |
Affiliated Money Market Mutual Fund | | | | |
| | Dryden Core Investment Fund - Taxable Money Market Series | | | | |
| 154,147,352 | | (cost 154,147,352; includes $120,315,933 of cash collateral received for securities on loan)(Note 3)(c)(d) | | | 154,147,352 | |
| | | | | | |
| | Total Investments(e) 110.2%
(cost $1,048,859,138; Note 5) | | | 1,296,917,065 | |
| | Liabilities in excess of other assets (10.2%) | | | (120,258,510 | ) |
| | | | | | |
| | Net Assets 100.0% | | $ | 1,176,658,555 | |
| | | | | | |
The following abbreviations are used in portfolio descriptions:
ADR—American Depositary Receipt
RDU—Restricted Depositary Unit
| (a) | Non-income producing security. |
See Notes to Financial Statements.
| | |
| 14 | | Visit our website at www.jennisondryden.com |
| (b) | All or a portion of the security is on loan. The aggregate market value of such securities is $114,977,139; cash collateral of $120,315,933 (included in liabilities) was received with which the Fund purchased highly liquid short-term investments. |
| (c) | Represents security, or portion thereof, purchased with cash collateral received for securities on loan. |
| (d) | Prudential Investments LLC, the manager of the Fund, also serves as manager of the Dryden Core Investment Fund—Taxable Money Market Series. |
| (e) | As of October 31, 2006, two securities representing $22,198,393 and 1.7% of the total market value were fair valued in accordance with the policies adopted by the Board of Trustees. |
| (f) | Indicates an illiquid security. |
| (g) | Indicates a security restricted to resale. The aggregate cost of such securities is $23,313,520. The aggregate value of $22,198,393 is approximately 1.9% of net assets. |
| (h) | Securities were purchased pursuant to Rule 144A under the Securities Act of 1933 and may not be resold subject to that rule except to qualified institutional buyers. Unless otherwise noted, 144A securities are deemed to be liquid. |
See Notes to Financial Statements.
Portfolio of Investments
as of October 31, 2006 Cont’d.
The industry classification of portfolio holdings and liabilities in excess of other assets shown as a percentage of net assets as of October 31, 2006 was as follow:
| | | |
Affiliated Money Market Mutual Fund (including 10.2% of collateral received for securities on loan) | | 13.1 | % |
Oil, Gas & Consumable Fuels | | 13.1 | |
Insurance | | 7.9 | |
Capital Markets | | 7.7 | |
Diversified Financial Services | | 7.7 | |
Media | | 4.7 | |
Pharmaceuticals | | 3.6 | |
Wireless Telecommunication Services | | 3.5 | |
Food Products | | 3.4 | |
Independent Power Producers & Energy Traders | | 3.3 | |
Industrial Conglomerates | | 3.1 | |
Communications Equipment | | 2.8 | |
Food & Staples Retailing | | 2.8 | |
Tobacco | | 2.7 | |
Chemicals | | 2.4 | |
Health Care Providers & Services | | 2.4 | |
Diversified Consumer Services | | 2.1 | |
Office Electronics | | 2.1 | |
Aerospace & Defense | | 2.0 | |
Commercial Services & Supplies | | 2.0 | |
Software | | 2.0 | |
Metals & Mining | | 1.8 | |
Household Products | | 1.7 | |
Hotel, Restaurants & Leisure | | 1.6 | |
Commercial Banks | | 1.3 | |
Multi-Utilities | | 1.3 | |
Building Products | | 1.2 | |
Electric Utilities | | 1.2 | |
Computers & Peripherals | | 1.1 | |
Textiles, Apparel & Luxury Goods | | 1.1 | |
Consumer Finance | | 1.0 | |
Diversified Telecommunication Services | | 1.0 | |
Internet & Catalog Retail | | 0.9 | |
Thrifts & Mortgage Finance | | 0.6 | |
| | | |
| | 110.2 | |
Liabilities in excess of other assets | | (10.2 | ) |
| | | |
| | 100.0 | % |
| | | |
See Notes to Financial Statements.
| | |
| 16 | | Visit our website at www.jennisondryden.com |
Financial Statements
| | |
| OCTOBER 31, 2006 | | ANNUAL REPORT |
Jennison Value Fund
Statement of Assets and Liabilities
as of October 31, 2006
| | | |
Assets | | | |
Investments at value, including securities on loan of $114,977,139: | | | |
Unaffiliated investments (cost $894,711,786) | | $ | 1,142,769,713 |
Affiliated investments (cost $154,147,352) | | | 154,147,352 |
Cash | | | 5,520,482 |
Foreign currency, at value (cost $9,312) | | | 9,630 |
Receivable for Fund shares sold | | | 2,515,358 |
Dividends and interest receivable | | | 711,670 |
Receivable for investments sold | | | 372,739 |
Foreign tax reclaim receivable | | | 75,079 |
Prepaid expenses | | | 25,567 |
| | | |
Total assets | | | 1,306,147,590 |
| | | |
| |
Liabilities | | | |
Payable to broker for collateral for securities on loan (Note 4) | | | 120,315,933 |
Payable for investments purchased | | | 6,080,277 |
Payable for Fund shares reacquired | | | 1,510,473 |
Management fee payable | | | 532,961 |
Accrued expenses | | | 512,432 |
Distribution fee payable | | | 314,468 |
Transfer agent fee payable | | | 219,636 |
Deferred trustees’ fees | | | 2,855 |
| | | |
Total liabilities | | | 129,489,035 |
| | | |
| |
Net Assets | | $ | 1,176,658,555 |
| | | |
| | | | |
Net assets were comprised of: | | | |
Shares of beneficial interest, at par | | $ | 523,922 |
Paid-in capital in excess of par | | | 802,618,674 |
| | | |
| | | 803,142,596 |
Undistributed net investment income | | | 8,195,035 |
Accumulated net realized gain on investment and foreign currency transactions | | | 117,262,679 |
Net unrealized appreciation on investments and foreign currencies | | | 248,058,245 |
| | | |
Net assets, October 31, 2006 | | $ | 1,176,658,555 |
| | | |
See Notes to Financial Statements.
| | |
| 18 | | Visit our website at www.jennisondryden.com |
| | | |
Class A | | | |
Net asset value and redemption price per share
($946,314,544 ÷ 42,078,297 shares of beneficial interest issued and outstanding) | | $ | 22.49 |
Maximum sales charge (5.50% of offering price) | | | 1.31 |
| | | |
Maximum offering price to public | | $ | 23.80 |
| | | |
| |
Class B | | | |
Net asset value, offering price and redemption price per share
($105,824,094 ÷ 4,770,440 shares of beneficial interest issued and outstanding) | | $ | 22.18 |
| | | |
| |
Class C | | | |
Net asset value, offering price and redemption price per share
($32,188,767 ÷ 1,450,827 shares of beneficial interest issued and outstanding) | | $ | 22.19 |
| | | |
| |
Class R | | | |
Net asset value, offering price and redemption price per share
($63,705 ÷ 2,846 shares of beneficial interest issued and outstanding) | | $ | 22.39 |
| | | |
| |
Class Z | | | |
Net asset value, offering price and redemption price per share
($92,267,445 ÷ 4,089,794 shares of beneficial interest issued and outstanding) | | $ | 22.56 |
| | | |
See Notes to Financial Statements.
Statement of Operations
Year Ended October 31, 2006
| | | | |
Net Investment Income | | | | |
Income | | | | |
Unaffiliated dividends (net of foreign withholding taxes of $275,596) | | $ | 20,418,964 | |
Affiliated dividend income | | | 1,285,081 | |
Affiliated income from securities loaned, net | | | 113,339 | |
| | | | |
Total income | | | 21,817,384 | |
| | | | |
| |
Expenses | | | | |
Management fee | | | 5,854,442 | |
Distribution fee—Class A | | | 2,180,195 | |
Distribution fee—Class B | | | 1,120,700 | |
Distribution fee—Class C | | | 248,124 | |
Distribution fee—Class R | | | 104 | |
Transfer agent’s fees and expenses (including affiliated expense of $1,158,000) (Note 3) | | | 1,500,000 | |
Reports to shareholders | | | 140,000 | |
Custodian’s fees and expenses | | | 100,000 | |
Registration fees | | | 82,000 | |
Legal fees and expenses | | | 63,000 | |
Insurance | | | 27,000 | |
Trustees’ fees | | | 25,000 | |
Audit fee | | | 17,000 | |
Miscellaneous | | | 22,329 | |
| | | | |
Total expenses | | | 11,379,894 | |
| | | | |
Net investment income | | | 10,437,490 | |
| | | | |
| |
Realized And Unrealized Gain (Loss) On Investment And Foreign Currency Transactions | | | | |
Net realized gain (loss) on: | | | | |
Investment transactions | | | 118,758,928 | |
Foreign currency transactions | | | (24,055 | ) |
| | | | |
| | | 118,734,873 | |
| | | | |
Net change in unrealized appreciation on: | | | | |
Investments | | | 61,050,024 | |
Foreign currencies | | | 318 | |
| | | | |
| | | 61,050,342 | |
| | | | |
Net gain on investments and foreign currency transactions | | | 179,785,215 | |
| | | | |
Net Increase In Net Assets Resulting From Operations | | $ | 190,222,705 | |
| | | | |
See Notes to Financial Statements.
| | |
| 20 | | Visit our website at www.jennisondryden.com |
Statement of Changes in Net Assets
| | | | | | | | |
| | | Year Ended October 31, | |
| | | 2006 | | | 2005 | |
Increase (Decrease) In Net Assets | | | | | | | | |
Operations | | | | | | | | |
Net investment income | | $ | 10,437,490 | | | $ | 5,891,791 | |
Net realized gain on investments and foreign currency transactions | | | 118,734,873 | | | | 117,720,036 | |
Net change in unrealized appreciation on investments and foreign currencies | | | 61,050,342 | | | | 34,179,396 | |
| | | | | | | | |
Net increase in net assets resulting from operations | | | 190,222,705 | | | | 157,791,223 | |
| | | | | | | | |
Dividends from net investment income (Note 1) | | | | | | | | |
Class A | | | (5,369,140 | ) | | | (5,295,657 | ) |
Class B | | | — | | | | (115,838 | ) |
Class C | | | — | | | | (12,108 | ) |
Class R | | | (12 | ) | | | — | |
Class Z | | | (420,806 | ) | | | (307,762 | ) |
| | | | | | | | |
| | | (5,789,958 | ) | | | (5,731,365 | ) |
| | | | | | | | |
Distributions from net realized gains | | | | | | | | |
Class A | | | (35,966,579 | ) | | | — | |
Class B | | | (5,595,023 | ) | | | — | |
Class C | | | (971,592 | ) | | | — | |
Class R | | | (128 | ) | | | — | |
Class Z | | | (2,054,591 | ) | | | — | |
| | | | | | | | |
| | | (44,587,913 | ) | | | — | |
| | | | | | | | |
| | |
Fund share transactions (Net of share conversions) (Note 6) | | | | | | | | |
Net proceeds from shares sold | | | 213,569,167 | | | | 115,477,435 | |
Net asset value of shares issued in reinvestment of dividends and distributions | | | 47,372,650 | | | | 5,283,291 | |
Cost of shares reacquired | | | (177,217,214 | ) | | | (170,037,111 | ) |
| | | | | | | | |
Net increase (decrease) in net assets from Fund share transactions | | | 83,724,603 | | | | (49,276,385 | ) |
| | | | | | | | |
Total increase | | | 223,569,437 | | | | 102,783,473 | |
| | |
Net Assets | | | | | | | | |
Beginning of year | | | 953,089,118 | | | | 850,305,645 | |
| | | | | | | | |
End of year(a) | | $ | 1,176,658,555 | | | $ | 953,089,118 | |
| | | | | | | | |
(a) Includes undistributed net investment income of: | | $ | 8,195,035 | | | $ | 3,571,558 | |
| | | | | | | | |
See Notes to Financial Statements.
Notes to Financial Statements
Jennison Value Fund (the “Fund”) is registered under the Investment Company Act of 1940 as a diversified, open-end, management investment company. The investment objective of the Fund is capital appreciation. It seeks to achieve this objective by investing primarily in common stocks and convertible securities that provide investment income returns above those of the Standard & Poor’s 500 Composite Stock Price Index or the NYSE Composite Index.
Note 1. Accounting Policies
The following is a summary of significant accounting policies followed by the Fund in the preparation of its financial statements.
Securities Valuation: Securities listed on a securities exchange are valued at the last sale price on such exchange on the day of valuation or, if there was no sale on such day, at the mean between the last reported bid and asked prices, or at the last bid price on such day in the absence of an asked price. Securities traded via Nasdaq are valued at the official closing price provided by Nasdaq. Securities that are actively traded in the over-the-counter market, including listed securities for which the primary market is believed by Prudential Investments LLC (“PI” or “Manager”), in consultation with the subadvisor; to be over-the-counter, are valued at market value using prices provided by an independent pricing agent or principal market maker. Futures contracts and options thereon traded on a commodities exchange or board of trade are valued at the last sale price at the close of trading on such exchange or board of trade or, if there was no sale on the applicable commodities exchange or board of trade on such day, at the mean between the most recently quoted prices on such exchange or board of trade or at the last bid price in the absence of an asked price. Prices may be obtained from independent pricing services which use information provided by market makers or estimates of market values obtained from yield data relating to investments or securities with similar characteristics. Securities for which reliable market quotations are not readily available, or whose values have been affected by events occurring after the close of the security’s foreign market and before the Series’ normal pricing time, are valued at fair value in accordance with the Board of Trustees’ approved fair valuation procedures. When determining the fair valuation of securities some of the factors influencing the valuation include, the nature of any restrictions on disposition of the securities; assessment of the general liquidity of the securities; the issuer’s financial condition and the markets in which it does business; the cost of the investment; the size of the holding and the capitalization of issuer; the prices of any recent transactions or bids/offers for such securities or any comparable securities; any available analyst media or other reports
| | |
| 22 | | Visit our website at www.jennisondryden.com |
or information deemed reliable by the investment adviser regarding the issuer or the markets or industry in which it operates. Using fair value to price securities may result in a value that is different from a security’s most recent closing price and from the price used by other mutual funds to calculate their net asset values. As of October 31, 2006, there were no securities whose values were impacted by events occurring after the close of the security’s foreign market.
Investments in mutual funds are valued at their net asset value as of the close of the New York Stock Exchange on the date of valuation.
Short-term securities which mature in 60 days or less are valued at amortized cost, which approximates market-value. The amortized cost method includes valuing a security at its cost on the date of purchase and thereafter assuming a constant amortization to maturity of the difference between the principal amount due at maturity and cost. Short-term securities which mature in more than 60 days are valued at current market quotations.
Foreign Currency Translation: The books and records of the Fund are maintained in U.S. dollars. Foreign currency amounts are translated into U.S. dollars on the following basis:
(i) market value of investment securities, other assets and liabilities-at the current rates of exchange;
(ii) purchases and sales of investment securities, income and expenses-at the rates of exchange prevailing on the respective dates of such transactions.
Although the net assets of the Fund are presented at the foreign exchange rates and market values at the close of the fiscal year, the Fund does not isolate that portion of the results of operations arising as a result of changes in the foreign exchange rates from the fluctuations arising from changes in the market prices of long term securities held at the end of the fiscal year. Similarly, the Fund does not isolate the effect of changes in foreign exchange rates from the fluctuations arising from changes in the market prices of portfolio securities sold during the fiscal year. Accordingly, realized foreign currency gains or losses are included in the reported net realized gains or losses on investment transactions.
Net realized gains or losses on foreign currency transactions represent net foreign exchange gains or losses from the holding of foreign currencies, currency gains or losses realized between the trade and settlement dates on security transactions, and the difference between the amounts of dividends, interest and foreign withholding taxes recorded on the Fund’s books and the U.S. dollar equivalent amounts actually
Notes to Financial Statements
Cont’d
received or paid. Net unrealized currency gains or losses from valuing foreign currency denominated assets and liabilities (other than investments) at period end exchange rates are reflected as a component of net unrealized appreciation (depreciation) on foreign currencies.
Foreign security and currency transactions may involve certain considerations and risks not typically associated with those of domestic origin as a result of, among other factors, the possibility of political or economic instability or the level of governmental supervision and regulation of foreign securities markets.
Securities Transactions and Net Investment Income: Securities transactions are recorded on the trade date. Realized gains or losses from investment and currency transactions are calculated on the identified cost basis. Dividend income is recorded on the ex-dividend date and interest income, including amortization of premium and accretion of discount on debt securities, as required, is recorded on the accrual basis. Expenses are recorded on an accrual basis.
Net investment income or loss, (other than distribution fees, which are charged directly to the respective class) and unrealized and realized gains or losses are allocated daily to each class of shares based upon the relative proportion of net assets of each class at the beginning of the day.
Taxes: For federal income tax purposes, it is the Fund’s policy to continue to meet the requirements under the Internal Revenue Code applicable to regulated investment companies and to distribute all of its taxable net income and capital gains, if any, to shareholders. Therefore, no federal income tax provision is required.
Withholding taxes on foreign dividends are recorded net of reclaimable amounts, at the time the related income is earned.
Dividends and Distributions: The Fund expects to pay dividends of net investment income and distributions of net realized capital and currency gains, if any, annually. Dividends and distributions to shareholders, which are determined in accordance with federal income tax regulations and which may differ from generally accepted accounting principles, are recorded on the ex-dividend date.
Securities Lending: The Fund may lend its portfolio securities to broker-dealers. The loans are secured by collateral at least equal, at all times, to the market value of the
| | |
| 24 | | Visit our website at www.jennisondryden.com |
securities loaned. Loans are subject to termination at the option of the borrower or the Fund. Upon termination of the loan, the borrower will return to the lender securities identical to the loaned securities. Should the borrower of the securities fail financially, the Fund has the right to repurchase the securities using the collateral in the open market. The Fund recognizes income, net of any rebate and securities lending agent fees, for lending its securities in the form of fees or interest on the investment of any cash received as collateral. The Fund also continues to receive interest and dividends or amounts equivalent thereto, on the securities loaned and recognizes any unrealized gain or loss in the market price of the securities loaned that may occur during the term of the loan.
Estimates: The preparation of the financial statements requires management to make estimates and assumptions that affect the reported amounts and disclosures in the financial statements. Actual results could differ from those estimates.
Note 2. Agreements
The Fund has a management agreement with PI. Pursuant to this agreement, PI has responsibility for all investment advisory services and supervises the subadvisors’ performance of such services. PI has entered into a subadvisory agreement with Jennison Associates LLC (“Jennison”). The subadvisory agreement provides that Jennison furnishes investment advisory services in connection with the management of the Fund. In connection therewith, Jennison assumes the day-to-day management responsibilities of the Fund and is obligated to keep certain books and records of the Fund. PI pays for the services of Jennison, the cost of compensation of officers and employees of the Fund, occupancy and certain clerical and bookkeeping costs of the Fund. The Fund bears all other costs and expenses.
The management fee paid to PI is computed daily and payable monthly at an annual rate of .60 of 1% of the Fund’s average daily net assets up to $500 million, .50 of 1% of the next $500 million, .475 of 1% of the next $500 million and .45 of 1% of the average daily net assets in excess of $1.5 billion. The effective management fee rate was .54 of 1% of the Fund’s average daily net assets for the year ended October 31, 2006.
The Fund has a distribution agreement with Prudential Investment Management Services LLC (“PIMS”), which acts as the distributor of the Class A, Class B, Class C, Class R and Class Z shares. The Fund compensates PIMS for distributing and servicing the Fund’s Class A, Class B, Class C and Class R shares, pursuant to plans of distribution (the “Class A, B, C and R Plans”), regardless of expenses actually incurred. The distribution fees are accrued daily and payable monthly. No distribution or service fees are paid to PIMS as distributor of the Class Z shares of the
Notes to Financial Statements
Cont’d
Fund. Pursuant to the Class A, B, C and R Plans, the Fund compensates PIMS for distribution related activities at an annual rate of up to .30 of 1%, 1%, 1% and ..75% of 1% of the average daily net assets of the Class A, B, C and R shares, respectively. For the year ended October 31, 2006, PIMS contractually agreed to limit such fees to .25 of 1% and .50% of 1% of the average daily net assets of the Class A and Class R shares, respectively.
PIMS has advised the Fund that it has received approximately $586,100 in front-end sales charges resulting from sales of Class A shares, during the year ended October 31, 2006. From these fees, PIMS paid such sales charges to affiliated broker-dealers, which in turn paid commissions to salespersons and incurred other distribution costs.
PIMS has advised the Fund that for the year ended October 31, 2006, it received approximately $2,800, $110,700 and $1,200 in contingent deferred sales charges imposed upon certain redemptions by Class A, B and Class C shareholders, respectively.
PI, PIMS and Jennison are indirect, wholly-owned subsidiaries of Prudential Financial, Inc. (“Prudential”).
The Fund, along with other affiliated registered investment companies (the “Funds”), is a party to a Syndicated Credit Agreement (“SCA”) with two banks. The SCA provides for a commitment of $500 million. Interest on any borrowings under the SCA is incurred at contracted market rates and a commitment fee for the unused amount is accrued daily and paid quarterly. Effective October 27, 2006, the Funds renewed SCA with the banks. The commitment under the renewed SCA continues to be $500 million. The Funds pay a commitment fee of .07 of 1% of the unused portion of the renewed SCA. The expiration date of the renewed SCA will be October 26, 2007. For the period from October 29, 2005 through October 26, 2006, the Funds paid a commitment fee of .0725 of 1% of the unused portion of the agreement. The purpose of the SCA is to provide an alternative source of temporary funding for capital share redemptions. The Fund did not borrow any amounts pursuant to the SCA during the year ended October 31, 2006.
Note 3. Other Transactions with Affiliates
Prudential Mutual Fund Services LLC (“PMFS”), an affiliate of PI and an indirect, wholly-owned subsidiary of Prudential, serves as the Fund’s transfer agent. Transfer
| | |
| 26 | | Visit our website at www.jennisondryden.com |
agent fees and expenses in the Statement of Operations include certain out-of-pocket expenses paid to non-affiliates, where applicable.
The Fund pays networking fees to affiliated and unaffiliated broker/dealers. These networking fees are payments made to broker/dealers that clear mutual fund transactions through a national clearing system. First Clearing Corporation, an affiliate of PI, serves as broker/dealer. For the year ended October 31, 2006, the Fund incurred approximately $235,500 in total networking fees. These amounts are included in transfer agent’s fees and expenses in the Statement of Operations.
The Fund invests in the Taxable Money Market Series (the “Series”), a portfolio of Dryden Core Investment Fund, pursuant to an exemptive order received from the Securities and Exchange Commission. The Series is a money market mutual fund registered under the Investment Company Act of 1940, as amended, and managed by PI.
Note 4. Portfolio Securities
Purchases and sales of investment securities, other than short-term investments, for the year ended October 31, 2006 were $540,658,842 and $511,759,769, respectively.
As of October 31, 2006, the Fund had securities on loan with an aggregate market value of $114,977,139. The Fund received $120,315,933 in cash as collateral for securities on loan which was used to purchase highly liquid short-term investments in accordance with the Fund’s securities lending procedures.
Note 5. Distributions and Tax Information
Distributions to shareholders, which are determined in accordance with federal income tax regulations and which may differ from generally accepted accounting principles, are recorded on the ex-dividends date. In order to present undistributed net investment income (loss) and accumulated net realized gains (losses) on investments and foreign currency transactions on the Statement of Assets and Liabilities that more closely represent their tax character, certain adjustments have been made to undistributed net investment income (loss) and accumulated net realized gain (loss) on investment and foreign currency transactions. For the year ended October 31, 2006, the adjustments were to decrease undistributed net investment income and increase accumulated net realized gain on investments and foreign currency transactions by $24,055 due to the reclassification of net foreign currency losses. Net investment income, net realized losses and net assets were not affected by this change.
Notes to Financial Statements
Cont’d
For the year ended October 31, 2006 and 2005, the tax character of dividends paid as reflected in the Statements of Changes in Net Assets, were $5,789,958 and $5,731,365, respectively of ordinary income. In addition, for the year ended October 31, 2006, the fund paid a long-term capital gain distribution of $44,587,913.
As of October 31, 2006, the accumulated undistributed earnings on tax basis consisted of $27,626,594 of ordinary income and $99,172,530 of long-term capital gains.
The United States federal income tax basis of the Fund’s investments and the net unrealized appreciation as of October 31, 2006 were as follows:
| | | | | | |
Tax Basis | | Appreciation | | Depreciation | | Net Unrealized
Appreciation |
| $1,050,197,696 | | $262,700,098 | | $15,980,729 | | $246,719,369 |
The difference between book basis is primarily attributable to the difference in the treatment of wash sale losses for book and tax purposes. The adjusted net unrealized appreciation on a tax basis was $246,719,687 which included other tax basis adjustments of $318 that were primarily attributable to appreciation of foreign currency.
Note 6. Capital
The Fund offers Class A, Class B, Class C, Class R and Class Z shares. Class A shares are sold with a front-end sales charge of up to 5.5%. All investors who purchase Class A shares in an amount of $1 million or more and sell these shares within 12 months of purchase are subject to a contingent deferred sales charge (CDSC) of 1%, including investors who purchase their shares through broker-dealers affiliated with Prudential. Class B shares are sold with a contingent deferred sales charge which declines from 5% to zero depending on the period of time the shares are held. Class C shares are sold with a contingent deferred sales charge of 1% during the first 12 months. Class B shares automatically convert to Class A shares on a quarterly basis approximately seven years after purchase. A special exchange privilege is also available for shareholders who qualified to purchase Class A shares at net asset value. Class R and Class Z shares are not subject to any sales or redemption charge and are offered exclusively for sale to a limited group of investors.
The Fund has authorized an unlimited number of shares of beneficial interest at $.01 par value divided into five classes, designated Class A, Class B, Class C, Class R and Class Z.
| | |
| 28 | | Visit our website at www.jennisondryden.com |
Transactions in shares of beneficial interest were as follows:
| | | | | | | |
Class A | | Shares | | | Amount | |
Year ended October 31, 2006: | | | | | | | |
Shares sold | | 6,622,418 | | | $ | 139,018,128 | |
Shares issued in reinvestment of dividends and distributions | | 1,959,077 | | | | 38,613,402 | |
Shares reacquired | | (6,950,376 | ) | | | (145,837,152 | ) |
| | | | | | | |
Net increase (decrease) in shares outstanding before conversion | | 1,631,119 | | | | 31,794,378 | |
Shares issued upon conversion from Class B | | 1,414,535 | | | | 29,084,598 | |
| | | | | | | |
Net increase (decrease) in shares outstanding | | 3,045,654 | | | $ | 60,878,976 | |
| | | | | | | |
Year ended October 31, 2005: | | | | | | | |
Shares sold | | 4,459,037 | | | $ | 83,324,115 | |
Shares issued in reinvestment of dividends | | 279,079 | | | | 4,855,977 | |
Shares reacquired | | (6,942,598 | ) | | | (128,617,514 | ) |
| | | | | | | |
Net increase (decrease) in shares outstanding before conversion | | (2,204,482 | ) | | | (40,437,422 | ) |
Shares issued upon conversion from Class B | | 4,704,055 | | | | 87,747,613 | |
| | | | | | | |
Net increase (decrease) in shares outstanding | | 2,499,573 | | | $ | 47,310,191 | |
| | | | | | | |
Class B | | | | | | |
Year ended October 31, 2006: | | | | | | | |
Shares sold | | 597,144 | | | $ | 12,499,038 | |
Shares issued in reinvestment of dividends and distributions | | 274,279 | | | | 5,367,640 | |
Shares reacquired | | (776,972 | ) | | | (16,100,691 | ) |
| | | | | | | |
Net increase (decrease) in shares outstanding before conversion | | 94,451 | | | | 1,765,987 | |
Shares reacquired upon conversion into Class A | | (1,427,998 | ) | | | (29,084,598 | ) |
| | | | | | | |
Net increase (decrease) in shares outstanding | | (1,333,547 | ) | | $ | (27,318,611 | ) |
| | | | | | | |
Year ended October 31, 2005: | | | | | | | |
Shares sold | | 657,252 | | | $ | 11,934,704 | |
Shares issued in reinvestment of dividends | | 6,332 | | | | 109,543 | |
Shares reacquired | | (1,529,879 | ) | | | (27,808,404 | ) |
| | | | | | | |
Net increase (decrease) in shares outstanding before conversion | | (866,295 | ) | | | (15,764,157 | ) |
Shares reacquired upon conversion into Class A | | (4,744,651 | ) | | | (87,747,613 | ) |
| | | | | | | |
Net increase (decrease) in shares outstanding | | (5,610,946 | ) | | $ | (103,511,770 | ) |
| | | | | | | |
Class C | | | | | | |
Year ended October 31, 2006: | | | | | | | |
Shares sold | | 640,946 | | | $ | 13,451,472 | |
Shares issued in reinvestment of dividends and distributions | | 47,187 | | | | 923,919 | |
Shares reacquired | | (289,618 | ) | | | (6,006,912 | ) |
| | | | | | | |
Net increase (decrease) in shares outstanding | | 398,515 | | | $ | 8,368,479 | |
| | | | | | | |
Year ended October 31, 2005: | | | | | | | |
Shares sold | | 181,114 | | | $ | 3,316,652 | |
Shares issued in reinvestment of dividends | | 661 | | | | 11,439 | |
Shares reacquired | | (342,389 | ) | | | (6,303,904 | ) |
| | | | | | | |
Net increase (decrease) in shares outstanding | | (160,614 | ) | | $ | (2,975,813 | ) |
| | | | | | | |
Notes to Financial Statements
Cont’d
| | | | | | | |
Class R | | Shares | | | Amount | |
Year ended October 31, 2006: | | | | | | | |
Shares sold | | 2,949 | | | $ | 63,162 | |
Shares issued in reinvestment of dividends and distributions | | — | * | | | 3 | |
Shares reacquired | | (242 | ) | | | (4,980 | ) |
| | | | | | | |
Net increase (decrease) in shares outstanding | | 2,707 | | | $ | 58,185 | |
| | | | | | | |
* Less than .5 share. | | | | | | | |
Period ended October 31, 2005**: | | | | | | | |
Shares sold | | 139 | | | $ | 2,547 | |
Shares issued in reinvestment of dividends | | — | | | | — | |
Shares reacquired | | — | | | | — | |
| | | | | | | |
Net increase (decrease) in shares outstanding | | 139 | | | $ | 2,547 | |
| | | | | | | |
** Inception date on June 3, 2005. | | | | | | | |
Class Z | | | | | | |
Year ended October 31, 2006: | | | | | | | |
Shares sold | | 2,294,435 | | | $ | 48,537,367 | |
Shares issued in reinvestment of dividends and distributions | | 125,136 | | | | 2,467,686 | |
Shares reacquired | | (440,315 | ) | | | (9,267,479 | ) |
| | | | | | | |
Net increase (decrease) in shares outstanding | | 1,979,256 | | | $ | 41,737,574 | |
| | | | | | | |
Year ended October 31, 2005: | | | | | | | |
Shares sold | | 895,343 | | | $ | 16,899,417 | |
Shares issued in reinvestment of dividends | | 17,585 | | | | 306,332 | |
Shares reacquired | | (396,913 | ) | | | (7,307,289 | ) |
| | | | | | | |
Net increase (decrease) in shares outstanding | | 516,015 | | | $ | 9,898,460 | |
| | | | | | | |
Note 7. New Accounting Pronouncements
On July 13, 2006, the Financial Accounting Standards Board (FASB) released FASB Interpretation No. 48 “Accounting for Uncertainty in Income Taxes” (FIN 48). FIN 48 provides guidance for how uncertain tax positions should be recognized, measured, presented and disclosed in the financial statements. FIN 48 requires the evaluation of tax positions taken or expected to be taken in the course of preparing the Fund’s tax returns to determine whether the tax positions are “more-likely-than-not” of being sustained by the applicable tax authority. Tax benefits or expenses resulting from tax positions not deemed to meet the more-likely-than-not threshold would be recorded in the year in which they arise. Adoption of FIN 48 is required for fiscal years beginning after December 15, 2006 and interim periods within those fiscal years and
| | |
| 30 | | Visit our website at www.jennisondryden.com |
is to be applied to all open tax years as of the effective date. At this time, management is evaluating the implications of FIN 48 and its impact, if any, in the financial statements has not yet been determined.
On September 20, 2006, the FASB released Statement of Financial Accounting Standards No. 157 “Fair Value Measurements” (FAS 157). FAS 157 establishes an authoritative definition of fair value, sets out a framework for measuring fair value, and requires additional disclosures about fair-value measurements. The application of FAS 157 is required for fiscal years beginning after November 15, 2007 and interim periods within those fiscal years. At this time, management is evaluating the implications of FAS 157 and its impact, if any, in the financial statements has not yet been determined.
Financial Highlights
| | | | |
| | | Class A | |
| | | Year Ended
October 31, 2006(a) | |
Per Share Operating Performance: | | | | |
Net Asset Value, Beginning Of Year | | $ | 19.77 | |
| | | | |
Income (loss) from investment operations: | | | | |
Net investment income | | | .22 | |
Net realized and unrealized gain (loss) on investment transactions | | | 3.56 | |
| | | | |
Total from investment operations | | | 3.78 | |
| | | | |
Less Dividends and Distributions: | | | | |
Dividends from net investment income | | | (.14 | ) |
Distributions from net realized gains | | | (.92 | ) |
| | | | |
Total dividends and distributions | | | (1.06 | ) |
| | | | |
Net asset value, end of year | | $ | 22.49 | |
| | | | |
Total Return(b): | | | 19.85 | % |
Ratios/Supplemental Data: | | | | |
Net assets, end of year (000) | | $ | 946,315 | |
Average net assets (000) | | $ | 872,078 | |
Ratios to average net assets: | | | | |
Expenses, including distribution and service (12b-1) fees(c) | | | .98 | % |
Expenses, excluding distribution and service (12b-1) fees | | | .73 | % |
Net investment income | | | 1.05 | % |
For Class A, B, C, R and Z shares: | | | | |
Portfolio turnover rate | | | 49 | % |
| (a) | Calculated based upon average shares outstanding during the year. |
| (b) | Total return does not consider the effects of sales loads. Total return is calculated assuming a purchase of shares on the first day and a sale on the last day of each year reported, and includes reinvestment of dividends and distributions. |
| (c) | The distributor of the Fund has contractually agreed to limit its distribution and service (12b-1) fees to .25 of 1% of the average daily net assets of the Class A shares. |
See Notes to Financial Statements.
| | |
| 32 | | Visit our website at www.jennisondryden.com |
| | | | | | | | | | | | | | |
| Class A | |
| Year Ended October 31, | |
| 2005(a) | | | 2004(a) | | | 2003(a) | | | 2002(a) | |
| | | | | | | | | | | | | | |
| $ | 16.71 | | | $ | 14.50 | | | $ | 12.17 | | | $ | 16.09 | |
| | | | | | | | | | | | | | | |
| | | | | | | | | | | | | | |
| | .14 | | | | .11 | | | | .11 | | | | .11 | |
| | 3.07 | | | | 2.22 | | | | 2.31 | | | | (2.43 | ) |
| | | | | | | | | | | | | | | |
| | 3.21 | | | | 2.33 | | | | 2.42 | | | | (2.32 | ) |
| | | | | | | | | | | | | | | |
| | | | | | | | | | | | | | |
| | (.15 | ) | | | (.12 | ) | | | (.09 | ) | | | (.10 | ) |
| | — | | | | — | | | | — | | | | (1.50 | ) |
| | | | | | | | | | | | | | | |
| | (.15 | ) | | | (.12 | ) | | | (.09 | ) | | | (1.60 | ) |
| | | | | | | | | | | | | | | |
| $ | 19.77 | | | $ | 16.71 | | | $ | 14.50 | | | $ | 12.17 | |
| | | | | | | | | | | | | | | |
| | 19.31 | % | | | 16.21 | % | | | 19.97 | % | | | (16.56 | )% |
| | | | | | | | | | | | | | |
| $ | 771,540 | | | $ | 610,345 | | | $ | 559,230 | | | $ | 516,702 | |
| $ | 699,013 | | | $ | 598,375 | | | $ | 529,960 | | | $ | 657,772 | |
| | | | | | | | | | | | | | |
| | 1.04 | % | | | 1.07 | % | | | 1.12 | % | | | 1.04 | % |
| | .79 | % | | | .82 | % | | | .87 | % | | | .79 | % |
| | .77 | % | | | .68 | % | | | .88 | % | | | .74 | % |
| | | | | | | | | | | | | | |
| | 56 | % | | | 56 | % | | | 97 | % | | | 72 | % |
See Notes to Financial Statements.
Financial Highlights
Cont’d
| | | | |
| | | Class B | |
| | | Year Ended
October 31, 2006(a) | |
Per Share Operating Performance: | | | | |
Net Asset Value, Beginning Of Year | | $ | 19.52 | |
| | | | |
Income (loss) from investment operations: | | | | |
Net investment income (loss) | | | .07 | |
Net realized and unrealized gain (loss) on investment transactions | | | 3.51 | |
| | | | |
Total from investment operations | | | 3.58 | |
| | | | |
Less Dividends and Distributions: | | | | |
Dividends from net investment income | | | — | |
Distributions from net realized gains | | | (.92 | ) |
| | | | |
Total dividends and distributions | | | (.92 | ) |
| | | | |
Net asset value, end of year | | $ | 22.18 | |
| | | | |
Total Return(c): | | | 18.96 | % |
Ratios/Supplemental Data: | | | | |
Net assets, end of year (000) | | $ | 105,824 | |
Average net assets (000) | | $ | 112,070 | |
Ratios to average net assets: | | | | |
Expenses, including distribution and service (12b-1) fees | | | 1.73 | % |
Expenses, excluding distribution and service (12b-1) fees | | | .73 | % |
Net investment income (loss) | | | .32 | % |
| (a) | Calculated based upon average shares outstanding during the year. |
| (b) | Less than $.005 per share. |
| (c) | Total return does not consider the effects of sales loads. Total return is calculated assuming a purchase of shares on the first day and a sale on the last day of each year reported, and includes reinvestment of dividends and distributions. |
See Notes to Financial Statements.
| | |
| 34 | | Visit our website at www.jennisondryden.com |
| | | | | | | | | | | | | | |
| Class B | |
| Year Ended October 31, | |
| 2005(a) | | | 2004(a) | | | 2003(a) | | | 2002(a) | |
| | | | | | | | | | | | | | |
| $ | 16.49 | | | $ | 14.31 | | | $ | 12.02 | | | $ | 15.92 | |
| | | | | | | | | | | | | | | |
| | | | | | | | | | | | | | |
| | .02 | | | | (.01 | ) | | | .02 | | | | — | (b) |
| | 3.02 | | | | 2.20 | | | | 2.27 | | | | (2.40 | ) |
| | | | | | | | | | | | | | | |
| | 3.04 | | | | 2.19 | | | | 2.29 | | | | (2.40 | ) |
| | | | | | | | | | | | | | | |
| | | | | | | | | | | | | | |
| | (.01 | ) | | | (.01 | ) | | | — | | | | — | |
| | — | | | | — | | | | — | | | | (1.50 | ) |
| | | | | | | | | | | | | | | |
| | (.01 | ) | | | (.01 | ) | | | — | | | | (1.50 | ) |
| | | | | | | | | | | | | | | |
| $ | 19.52 | | | $ | 16.49 | | | $ | 14.31 | | | $ | 12.02 | |
| | | | | | | | | | | | | | | |
| | 18.44 | % | | | 15.34 | % | | | 19.05 | % | | | (17.21 | )% |
| | | | | | | | | | | | | | |
| $ | 119,151 | | | $ | 193,230 | | | $ | 215,039 | | | $ | 241,923 | |
| $ | 161,840 | | | $ | 212,833 | | | $ | 221,850 | | | $ | 347,114 | |
| | | | | | | | | | | | | | |
| | 1.79 | % | | | 1.82 | % | | | 1.87 | % | | | 1.79 | % |
| | .79 | % | | | .82 | % | | | .87 | % | | | .79 | % |
| | .04 | % | | | (.06 | )% | | | .13 | % | | | (.01 | )% |
See Notes to Financial Statements.
Financial Highlights
Cont’d
| | | | |
| | | Class C | |
| | | Year Ended
October 31, 2006(a) | |
Per Share Operating Performance: | | | | |
Net Asset Value, Beginning Of Year | | $ | 19.52 | |
| | | | |
Income (loss) from investment operations: | | | | |
Net investment income (loss) | | | .06 | |
Net realized and unrealized gain (loss) on investment transactions | | | 3.53 | |
| | | | |
Total from investment operations | | | 3.59 | |
| | | | |
Less Dividends and Distributions: | | | | |
Dividends from net investment income | | | — | |
Distributions from net realized gains | | | (.92 | ) |
| | | | |
Total dividends and distributions | | | (.92 | ) |
| | | | |
Net asset value, end of year | | $ | 22.19 | |
| | | | |
Total Return(c): | | | 18.95 | % |
Ratios/Supplemental Data: | | | | |
Net assets, end of year (000) | | $ | 32,189 | |
Average net assets (000) | | $ | 24,812 | |
Ratios to average net assets: | | | | |
Expenses, including distribution and service (12b-1) fees | | | 1.73 | % |
Expenses, excluding distribution and service (12b-1) fees | | | .73 | % |
Net investment income (loss) | | | .29 | % |
| (a) | Calculated based upon average shares outstanding during the year. |
| (b) | Less than $.005 per share. |
| (c) | Total return does not consider the effects of sales loads. Total return is calculated assuming a purchase of shares on the first day and a sale on the last day of each year reported, and includes reinvestment of dividends and distributions. |
See Notes to Financial Statements.
| | |
| 36 | | Visit our website at www.jennisondryden.com |
| | | | | | | | | | | | | | |
| Class C | |
| Year Ended October 31, | |
| 2005(a) | | | 2004(a) | | | 2003(a) | | | 2002(a) | |
| | | | | | | | | | | | | | |
| $ | 16.49 | | | $ | 14.31 | | | $ | 12.02 | | | $ | 15.92 | |
| | | | | | | | | | | | | | | |
| | | | | | | | | | | | | | |
| | .01 | | | | (.01 | ) | | | .02 | | | | — | (b) |
| | 3.03 | | | | 2.20 | | | | 2.27 | | | | (2.40 | ) |
| | | | | | | | | | | | | | | |
| | 3.04 | | | | 2.19 | | | | 2.29 | | | | (2.40 | ) |
| | | | | | | | | | | | | | | |
| | | | | | | | | | | | | | |
| | (.01 | ) | | | (.01 | ) | | | — | | | | — | |
| | — | | | | — | | | | — | | | | (1.50 | ) |
| | | | | | | | | | | | | | | |
| | (.01 | ) | | | (.01 | ) | | | — | | | | (1.50 | ) |
| | | | | | | | | | | | | | | |
| $ | 19.52 | | | $ | 16.49 | | | $ | 14.31 | | | $ | 12.02 | |
| | | | | | | | | | | | | | | |
| | 18.44 | % | | | 15.34 | % | | | 19.05 | % | | | (17.21 | )% |
| | | | | | | | | | | | | | |
| $ | 20,540 | | | $ | 20,006 | | | $ | 21,268 | | | $ | 22,728 | |
| $ | 20,814 | | | $ | 21,130 | | | $ | 22,008 | | | $ | 29,071 | |
| | | | | | | | | | | | | | |
| | 1.79 | % | | | 1.82 | % | | | 1.87 | % | | | 1.79 | % |
| | .79 | % | | | .82 | % | | | .87 | % | | | .79 | % |
| | .05 | % | | | (.07 | )% | | | .13 | % | | | — | (d) |
See Notes to Financial Statements.
Financial Highlights
Cont’d
| | | | | | | | |
| | | Class R | |
| | | Year Ended
October 31, 2006(a) | | | June 3, 2005(a)
Through
October 31, 2005(b) | |
Per Share Operating Performance: | | | | | | | | |
Net Asset Value, Beginning Of Period | | $ | 19.74 | | | $ | 18.31 | |
| | | | | | | | |
Income from investment operations: | | | | | | | | |
Net investment income | | | .13 | | | | .01 | |
Net realized and unrealized gain on investment transactions | | | 3.53 | | | | 1.42 | |
| | | | | | | | |
Total from investment operations | | | 3.66 | | | | 1.43 | |
| | | | | | | | |
Less Dividends and Distributions: | | | | | | | | |
Dividends from net investment income | | | (.09 | ) | | | — | |
Distributions from net realized gains | | | (.92 | ) | | | — | |
| | | | | | | | |
Total dividends and distributions | | | (1.01 | ) | | | — | |
| | | | | | | | |
Net asset value, end of period | | $ | 22.39 | | | $ | 19.74 | |
| | | | | | | | |
Total Return(c): | | | 19.21 | % | | | 7.81 | % |
Ratios/Supplemental Data: | | | | | | | | |
Net assets, end of period (000) | | $ | 64 | | | $ | 3 | |
Average net assets (000) | | $ | 21 | | | $ | 3 | |
Ratios to average net assets: | | | | | | | | |
Expenses, including distribution and service (12b-1) fees(d) | | | 1.23 | % | | | 1.29 | %(e) |
Expenses, excluding distribution and service (12b-1) fees | | | .73 | % | | | .79 | %(e) |
Net investment income | | | .61 | % | | | .19 | %(e) |
| (a) | Inception date of Class R shares. |
| (b) | Calculated based upon average shares outstanding during the period. |
| (c) | Total return does not consider the effects of sales loads. Total return is calculated assuming a purchase of shares on the first day and a sale on the last day of each period reported, and includes reinvestment of dividends and distributions. Total returns for periods less than a full year are not annualized. |
| (d) | The distributor of the Fund has contractually agreed to limit its distribution and service (12b-1) fees to .50 of 1% of the average daily net assets of the Class R shares. |
See Notes to Financial Statements.
| | |
| 38 | | Visit our website at www.jennisondryden.com |
This Page Intentionally Left Blank
Financial Highlights
Cont’d
| | | | |
| | | Class Z | |
| | | Year Ended
October 31, 2006(a) | |
Per Share Operating Performance: | | | | |
Net Asset Value, Beginning Of Year | | $ | 19.83 | |
| | | | |
Income (loss) from investment operations: | | | | |
Net investment income | | | .27 | |
Net realized and unrealized gain (loss) on investment transactions | | | 3.57 | |
| | | | |
Total from investment operations | | | 3.84 | |
| | | | |
Less Dividends and Distributions: | | | | |
Dividends from net investment income | | | (.19 | ) |
Distributions from net realized gains | | | (.92 | ) |
| | | | |
Total dividends and distributions | | | (1.11 | ) |
| | | | |
Net asset value, end of year | | $ | 22.56 | |
| | | | |
Total Return(b): | | | 20.15 | % |
Ratios/Supplemental Data: | | | | |
Net assets, end of year (000) | | $ | 92,267 | |
Average net assets (000) | | $ | 65,638 | |
Ratios to average net assets: | | | | |
Expenses, including distribution and service (12b-1) fees | | | .73 | % |
Expenses, excluding distribution and service (12b-1) fees | | | .73 | % |
Net investment income | | | 1.28 | % |
| (a) | Calculated based upon average shares outstanding during the year. |
| (b) | Total return is calculated assuming a purchase of shares on the first day and a sale on the last day of each year reported, and includes reinvestment of dividends and distributions. |
See Notes to Financial Statements.
| | |
| 40 | | Visit our website at www.jennisondryden.com |
| | | | | | | | | | | | | | |
| Class Z | |
| Year Ended October 31, | |
| 2005(a) | | | 2004(a) | | | 2003(a) | | | 2002(a) | |
| | | | | | | | | | | | | | |
| $ | 16.76 | | | $ | 14.54 | | | $ | 12.21 | | | $ | 16.14 | |
| | | | | | | | | | | | | | | |
| | | | | | | | | | | | | | |
| | .19 | | | | .15 | | | | .15 | | | | .14 | |
| | 3.07 | | | | 2.23 | | | | 2.30 | | | | (2.43 | ) |
| | | | | | | | | | | | | | | |
| | 3.26 | | | | 2.38 | | | | 2.45 | | | | (2.29 | ) |
| | | | | | | | | | | | | | | |
| | | | | | | | | | | | | | |
| | (.19 | ) | | | (.16 | ) | | | (.12 | ) | | | (.14 | ) |
| | — | | | | — | | | | — | | | | (1.50 | ) |
| | | | | | | | | | | | | | | |
| | (.19 | ) | | | (.16 | ) | | | (.12 | ) | | | (1.64 | ) |
| | | | | | | | | | | | | | | |
| $ | 19.83 | | | $ | 16.76 | | | $ | 14.54 | | | $ | 12.21 | |
| | | | | | | | | | | | | | | |
| | 19.59 | % | | | 16.49 | % | | | 20.26 | % | | | (16.34 | )% |
| | | | | | | | | | | | | | |
| $ | 41,856 | | | $ | 26,725 | | | $ | 32,340 | | | $ | 31,300 | |
| $ | 32,824 | | | $ | 25,857 | | | $ | 31,275 | | | $ | 58,256 | |
| | | | | | | | | | | | | | |
| | .79 | % | | | .82 | % | | | .87 | % | | | .79 | % |
| | .79 | % | | | .82 | % | | | .87 | % | | | .79 | % |
| | 1.00 | % | | | .93 | % | | | 1.13 | % | | | .98 | % |
See Notes to Financial Statements.
Report of Independent Registered Public
Accounting Firm
The Board of Trustees and Shareholders of
Jennison Value Fund:
We have audited the accompanying statement of assets and liabilities of the Jennison Value Fund (hereafter referred to as the “Fund”), including the portfolio of investments, as of October 31, 2006, and the related statement of operations for the year then ended, the statement of changes in net assets for each of the years in the two-year period then ended, and the financial highlights for each of the years in the three-year period then ended. These financial statements and financial highlights are the responsibility of the Fund’s management. Our responsibility is to express an opinion on these financial statements and financial highlights based on our audits. The financial highlights for the years presented prior to the year ended October 31, 2004, were audited by another independent registered public accounting firm whose report dated December 22, 2003, expressed an unqualified opinion thereon.
We conducted our audits in accordance with the standards of the Public Company Accounting Oversight Board (United States). Those standards require that we plan and perform the audit to obtain reasonable assurance about whether the financial statements and financial highlights are free of material misstatement. An audit includes examining, on a test basis, evidence supporting the amounts and disclosures in the financial statements. Our procedures included confirmation of securities owned as of October 31, 2006, by correspondence with the custodian and brokers or by other appropriate auditing procedures where replies from brokers were not received. An audit also includes assessing the accounting principles used and significant estimates made by management, as well as evaluating the overall financial statement presentation. We believe that our audits provide a reasonable basis for our opinion.
In our opinion, the financial statements and financial highlights referred to above present fairly, in all material respects, the financial position of the Fund as of October 31, 2006, and the results of its operations for the year then ended, the changes in its net assets for each of the years in the two-year period then ended, and the financial highlights for each of the years in the three-year period then ended, in conformity with U.S. generally accepted accounting principles.

New York, New York
December 22, 2006
| | |
| 42 | | Visit our website at www.jennisondryden.com |
Tax Information
(Unaudited)
As required by the Internal Revenue Code, we wish to advise you as to the federal status of dividends and distributions paid by the Fund during its fiscal year ended October 31, 2006.
During the fiscal year ended October 31, 2006, the Fund paid dividends and distributions as follows:
| | | | | | | | | | | | | | | |
| | | Class |
| | | A | | B | | C | | R | | Z |
| | | | | |
Ordinary Income | | $ | .14 | | $ | — | | $ | — | | $ | .09 | | $ | .19 |
Long-Term Capital Gains | | | .92 | | | .92 | | | .92 | | | .92 | | | .92 |
| | | | | | | | | | | | | | | |
| | $ | 1.06 | | $ | .92 | | $ | .92 | | $ | 1.01 | | $ | 1.11 |
| | | | | | | | | | | | | | | |
Further, we wish to advise you that 87.70% of ordinary income dividends paid during the fiscal year ended October 31, 2006 qualified for the corporate dividends received deduction available to corporate taxpayers.
For the fiscal year ended October 31, 2006, the Fund designated 87.82% as qualified dividend income for the reduced tax rate under the jobs and Growth Tax Relief Reconciliation Act of 2003.
In January 2007, you will be advised on IRS Form 1099 DIV or Substitute 1099 DIV as to federal tax status of the dividends and distributions received by you in calendar year 2006.
Management of the Fund
(Unaudited)
Information pertaining to the Directors of the Fund is set forth below. Directors who are not deemed to be “interested persons” of the Fund, as defined in the Investment Company Act of 1940 (the 1940 Act), are referred to as “Independent Directors.” Directors who are deemed to be “interested persons” of the Fund are referred to as “Interested Directors.” “Fund Complex”† consists of the Fund and any other investment companies managed by PI.
Independent Directors(2)
Linda W. Bynoe (54), Director since 2005(3) Oversees 73 portfolios in Fund complex
Principal occupations (last 5 years): President and Chief Executive Officer (since March 1995) of Telemat, Ltd. (management consulting); formerly Vice President at Morgan Stanley & Co.
Other Directorships held: Director of Simon Property Group, Inc. (real estate investment trust) (since May 2003); Anixter International (communication products distributor) (since January 2006); Director of Northern Trust Corporation (since April 2006).
David E.A. Carson (72), Director since 2003(3) Oversees 77 portfolios in Fund complex
Principal occupations (last 5 years): Formerly Director (January 2000-May 2000), Chairman (January 1999-December 1999), Chairman and Chief Executive Officer (January 1998-December 1998) and President, Chairman and Chief Executive Officer of People’s Bank (1983-1997).
Robert E. La Blanc (72), Director since 2003(3) Oversees 75 portfolios in Fund complex
Principal occupations (last 5 years): President (since 1981) of Robert E. La Blanc Associates, Inc. (telecommunications).
Other Directorships held:(4) Director of Chartered Semiconductor Manufacturing, Ltd. (since 1998); Computer Associates International, Inc. (since 2002) (software company); FiberNet Telecom Group, Inc. (since 2003) (telecom company).
Douglas H. McCorkindale (67), Director since 1996(3) Oversees 73 portfolios in Fund complex
Principal occupations (last 5 years): Formerly Chairman (February 2001- June 2006), Chief Executive Officer (June 2000-July 2005), President (September 1997-July 2005) and Vice Chairman (March 1984-May 2000) of Gannett Co. Inc. (publishing and media).
Other Directorships held:(4) Director of Continental Airlines, Inc. (since May 1993); Director of Lockheed Martin Corp. (aerospace and defense) (since May 2001).
Richard A. Redeker (63), Director since 1995(3) Oversees 74 portfolios in Fund complex
Principal occupations (last 5 years): Management Consultant; Director (since 2001) and Chairman of the Board (since 2006) of Invesmart, Inc.; Director of Penn Tank Lines, Inc. (since 1999).
Robin B. Smith (67), Director since 1996(3) Oversees 75 portfolios in Fund complex
Principal occupations (last 5 years): Chairman of the Board (since January 2003) of Publishers Clearing House (direct marketing); formerly Chairman and Chief Executive Officer (August 1996-January 2003) of Publishers Clearing House.
Other Directorships held:(4) Director of BellSouth Corporation (since 1992).
| | |
| 44 | | Visit our website at www.jennisondryden.com |
Stephen G. Stoneburn (63), Director since 2003(3) Oversees 75 portfolios in Fund complex
Principal occupations (last 5 years): President and Chief Executive Officer (since June 1996) of Quadrant Media Corp. (publishing company); formerly President (June 1995-June 1996) of Argus Integrated Media, Inc.; Senior Vice President and Managing Director (January 1993-1995) of Cowles Business Media; Senior Vice President of Fairchild Publications, Inc. (1975-1989).
Clay T. Whitehead (68), Director since 1996(3) Oversees 75 portfolios in Fund complex
Principal occupations (last 5 years): President (since 1983) of YCO (new business development firm).
Interested Directors(1)
Judy A. Rice (58), President since 2003 and Director since 2000(3) Oversees 73 portfolios in Fund complex
Principal occupations (last 5 years): President, Chief Executive Officer, Chief Operating Officer and Officer-In-Charge (since February 2003) of Prudential Investments LLC; Vice President (since February 1999) of Prudential Investment Management Services LLC; President, Chief Executive Officer and Officer-In-Charge (since April 2003) of Prudential Mutual Fund Services LLC; formerly Director (May 2003-March 2006) and Executive Vice President (June 2005-March 2006) of American Skandia Investment Services, Inc.; formerly Executive Vice President (September 1999-February 2003) of Prudential Investments LLC; Member of Board of Governors of the Investment Company Institute.
Robert F. Gunia (59), Vice President and Director since 1996(3) Oversees 153 portfolios in Fund complex
Principal occupations (last 5 years): Chief Administrative Officer (since September 1999) and Executive Vice President (since December 1996) of Prudential Investments LLC; President (since April 1999) of Prudential Investment Management Services LLC; Executive Vice President (since March 1999) and Treasurer (since May 2000) of Prudential Mutual Fund Services LLC; Chief Administrative Officer, Executive Vice President and Director (since May 2003) of American Skandia Investment Services, Inc.
Other Directorships held:(4) Vice President and Director (since May 1989) and Treasurer (since 1999) of The Asia Pacific Fund, Inc.
Information pertaining to the Officers of the Fund who are not also Directors is set forth below.
Officers(2)
Kathryn L. Quirk (53), Chief Legal Officer since 2005(3)
Principal occupations (last 5 years): Vice President and Corporate Counsel (since September 2004) of Prudential; Executive Vice President, Chief Legal Officer and Secretary (since July 2005) of Prudential Investments LLC and Prudential Mutual Fund Services LLC; formerly Managing Director, General Counsel, Chief Compliance Officer, Chief Risk Officer and Corporate Secretary (1997-2002) of Zurich Scudder Investments, Inc.
Deborah A. Docs (48), Secretary since 2005(3)
Principal occupations (last 5 years): Vice President and Corporate Counsel (since January 2001) of Prudential; Vice President (since December 1996) and Assistant Secretary (since March 1999) of PI; formerly Vice President and Assistant Secretary (May 2003-June 2005) of American Skandia Investment Services, Inc.
Jonathan D. Shain (48), Assistant Secretary since 2005(3)
Principal occupations (last 5 years): Vice President and Corporate Counsel (since August 1998) of Prudential; Vice President and Assistant Secretary (since May 2001) of PI; Vice President and Assistant Secretary (since February 2001) of PMFS; formerly Vice President and Assistant Secretary (May 2003-June 2005) of American Skandia Investment Services, Inc.
Claudia DiGiacomo (32), Assistant Secretary since 2005(3)
Principal occupations (last 5 years): Vice President and Corporate Counsel (since January 2005) of Prudential; Vice President and Assistant Secretary of PI (since December 2005); Associate at Sidley Austin Brown Wood LLP (1999-2004).
Lee D. Augsburger (47), Chief Compliance Officer since 2004(3)
Principal occupations (last 5 years): Senior Vice President and Chief Compliance Officer (since April 2003) of PI; Vice President (since November 2000) and Chief Compliance Officer (since October 2000) of Prudential Investment Management, Inc.; Chief Compliance Officer and Senior Vice President (since May 2003) of American Skandia Investment Services, Inc.
Grace C. Torres (47), Treasurer and Principal Financial and Accounting Officer since 1998(3)
Principal occupations (last 5 years): Assistant Treasurer (since March 1999) and Senior Vice President (since September 1999) of PI; Assistant Treasurer (since May 2003) and Vice President (since June 2005) of American Skandia Investment Services, Inc.; Senior Vice President and Assistant Treasurer (since May 2003) of American Skandia Advisory Services, Inc.; formerly Senior Vice President (May 2003-June 2005) of American Skandia Investment Services, Inc.
John P. Schwartz (35), Assistant Secretary since 2006(3)
Principal occupations (last 5 years): Vice President and Corporate Counsel (since April 2005) of Prudential; Vice President and Assistant Secretary of PI (since December 2005); Associate at Sidley, Austin Brown & Wood LLP (1997-2005).
M. Sadiq Peshimam (42), Assistant Treasurer since 2006(3)
Principal occupations (last 5 years): Vice President (since 2005) and Director (2000-2005) within Prudential Mutual Fund Administration.
Jack Benintende (42), Assistant Treasurer since 2006(3)
Principal occupations (last 5 years): Vice President (since June 2000) within Prudential Mutual Fund Administration; formerly Senior Manager within the investment management practice of PricewaterhouseCoopers LLP (May 1994 through June 2000).
Andrew R. French (43), Assistant Secretary since October 2006(3)
Principal occupations (last 5 years): Director and Corporate Counsel (since May 2006) of Prudential; formerly Senior Legal Analyst of Prudential Mutual Fund Law Department (1997-2006).
Noreen M. Fierro (42), Anti-Money Laundering Compliance Officer since October 2006(3)
Principal occupations (last 5 years): Vice President, Corporate Compliance (since May 2006) of Prudential; formerly Corporate Vice President, Associate General Counsel (April 2002-May 2005) of UBS Financial Services, Inc., in their Money Laundering Prevention Group; Senior Manager (May 2005-May 2006) of Deloitte Financial Advisory Services, LLP, in their Forensic and Dispute Services, Anti-Money Laundering Group.
| | |
| 46 | | Visit our website at www.jennisondryden.com |
| † | The Fund Complex consists of all investment companies managed by PI. The Funds for which PI serves as manager include Jennison Dryden Mutual Funds, Strategic Partners Funds, The Prudential Variable Contract Accounts 2, 10, 11. The Target Portfolio Trust, The Prudential Series Fund, The High Yield Income Fund, Inc., The High Yield Plus Fund, Inc., Nicholas-Applegate Fund, Inc., American Skandia Trust, and Prudential’s Gibraltar Fund, Inc. |
| (1) | “Interested” Directors, as defined in the 1940 Act, by reason of employment with the Manager, a Subadvisor or the Distributor. |
| (2) | Unless otherwise noted, the address of the Directors and Officers is c/o: Prudential Investments LLC, Gateway Center Three, 100 Mulberry Street, Newark, NJ 07102. |
| (3) | There is no set term of office for Directors and Officers. The Independent Directors have adopted a retirement policy, which calls for the retirement of Directors on December 31 of the year in which they reach the age of 75. The table shows the individual’s length of service as Directors and/or Officer. |
| (4) | This includes only directorships of companies required to register, or file reports with the SEC under the Securities and Exchange Act of 1934 (that is, “public companies”) or other investment companies registered under the 1940 Act. |
Additional Information about the Directors is included in the Statement of Additional Information which is available without charge, upon request, by calling (800) 521-7466 or (732) 482-7555 (Calling from outside the U.S.)
Approval of Advisory Agreements
The Board of Trustees (the “Board”) of Jennison Value Fund (the “Fund”) oversees the management of the Fund and, as required by law, determines annually whether to renew the Fund’s management agreement with Prudential Investments LLC (“PI”) and the Fund’s subadvisory agreement with Jennison Associates LLC (“Jennison”). In considering the renewal of the agreements, the Board, including all of the Independent Trustees, met on June 7-8, 2006 and approved the renewal of the agreements through July 31, 2007, after concluding that renewal of the agreements was in the best interests of the Fund and its shareholders.
In advance of the meetings, the Board received materials relating to the agreements, and had the opportunity to ask questions and request further information in connection with their consideration. Among other things, the Board considered comparisons with other mutual funds in relevant Peer Universes and Peer Groups. The mutual funds included in each Peer Universe or Peer Group were objectively determined solely by Lipper Inc., an independent provider of mutual fund data. The comparisons placed the Fund in various quartiles over one-year, three-year and five-year time periods ending December 31, with the first quartile being the best 25% of the mutual funds (for performance, the best performing mutual funds and, for expenses, the lowest cost mutual funds).
In approving the agreements, the Board, including the Independent Trustees advised by independent legal counsel, considered the factors they deemed relevant, including the nature, quality and extent of services provided, the performance of the Fund, the profitability of PI and its affiliates, expenses and fees, and the potential for economies of scale that may be shared with the Fund and its shareholders. In their deliberations, the Trustees did not identify any single factor that was dispositive and each Director attributed different weights to the various factors. In connection with their deliberations, the Board considered information provided by PI throughout the year at regular Board meetings, presentations from portfolio managers and other information, as well as information furnished at or in advance of the meetings on June 7-8, 2006.
The Trustees determined that the overall arrangements between the Fund and PI, which serves as the Fund’s investment manager pursuant to a management agreement, and between PI and Jennison, which serves as the Fund’s subadviser pursuant to the terms of a subadvisory agreement with PI, are fair and reasonable in light of the services performed, fees charged and such other matters as the Trustees considered relevant in the exercise of their business judgment.
Approval of Advisory Agreements (continued)
Several of the material factors and conclusions that formed the basis for the Trustees reaching their determinations to approve the continuance of the agreements are separately discussed below.
Nature, Quality and Extent of Services
The Board received and considered information regarding the nature and extent of services provided to the Fund by PI and Jennison. The Board considered the services provided by PI, including but not limited to the oversight of the subadviser for the Fund, as well as the provision of fund recordkeeping, compliance, and other services to the Fund. With respect to PI’s oversight of the subadviser, the Board noted that PI’s Strategic Investment Research Group (“SIRG”), which is a business unit of PI, is responsible for monitoring and reporting to PI’s senior management on the performance and operations of the subadviser. The Board also considered that PI pays the salaries of all of the officers and non-independent Trustees of the Fund. The Board also considered the investment subadvisory services provided by Jennison, as well as adherence to the Fund’s investment restrictions and compliance with applicable Fund policies and procedures.
The Board reviewed the qualifications, backgrounds and responsibilities of PI’s senior management responsible for the oversight of the Fund and Jennison, and also reviewed the qualifications, backgrounds and responsibilities of Jennison’s portfolio managers who are responsible for the day-to-day management of the Fund’s portfolio. The Board was provided with information pertaining to PI’s and Jennison’s organizational structure, senior management, investment operations, and other relevant information pertaining to both PI and Jennison. The Board also noted that it received favorable compliance reports from the Fund’s Chief Compliance Officer (“CCO”) as to both PI and Jennison. The Board noted that Jennison is affiliated with PI.
The Board concluded that it was satisfied with the nature, extent and quality of the investment management services provided by PI and the subadvisory services provided to the Fund by Jennison, and that there was a reasonable basis on which to conclude that the Fund benefits from the services provided by PI and Jennison under the management and subadvisory agreements.
Performance of Jennison Value Fund
The Board received and considered information about the Fund’s historical performance, noting that the Fund had achieved performance that was in the first quartile over one-year, three-year, five-year and ten-year periods ending December 31 in relation to the group of comparable funds in a Peer Universe. The Board noted that the Fund had outperformed against its benchmark index over the same one-year,
| | |
| | Visit our website at www.jennisondryden.com |
three-year and five-year time periods and had achieved performance above the median of mutual funds in the Peer Universe.
The Board concluded that the Fund’s performance was satisfactory.
Fees and Expenses
The Board considered the management fee for the Fund as compared to the management fee charged by PI to other funds and accounts and the fee charged by other advisers to comparable mutual funds.
The Fund’s management fee ranked in the second quartile in its Peer Group. The Board concluded that the management and subadvisory fees were reasonable.
The Board further noted that during 2005 and continuing through 2006, several initiatives had commenced which, when fully implemented, were expected to result in cost savings and expense reductions for the Fund.
Costs of Services and Profits Realized by PI
The Board was provided with information on the profitability of PI and its affiliates in serving as the Fund’s investment manager. The Board discussed with PI the methodology utilized in assembling the information regarding profitability and considered its reasonableness. The Board recognized that it is difficult to make comparisons of profitability from fund management contracts because comparative information is not generally publicly available and is affected by numerous factors, including the structure of the particular adviser, the types of funds it manages, its business mix, numerous assumptions regarding allocations and the adviser’s capital structure and cost of capital. Taking these factors into account, the Board concluded that the profitability of PI and its affiliates in relation to the services rendered was not unreasonable. The Board did not separately consider the profitability of the subadviser, an affiliate of PI, as its profitability was reflected in the profitability report for PI. Taking these factors into account, the Board concluded that the profitability of PI and its affiliates in relation to the services rendered was not unreasonable.
Economies of Scale
The Board noted that the management fee schedule for the Fund includes breakpoints, which have the effect of decreasing the fee rate as assets increase, and that at its current level of assets the Fund’s effective fee rate reflected some of those rate reductions. The Board received and discussed information concerning whether PI realizes economies of scale as the Fund’s assets grow beyond current levels. The Board took note that the Fund’s fee structure currently results in benefits to Fund shareholders whether or not PI realizes any economies of scale.
Approval of Advisory Agreements (continued)
Other Benefits to PI and Jennison
The Board considered potential ancillary benefits that might be received by PI and Jennison and their affiliates as a result of their relationship with the Fund. The Board concluded that potential benefits to be derived by PI included brokerage commissions received by affiliates of PI, transfer agency fees received by the Fund’s transfer agent (which is affiliated with PI), as well as reputational or other intangible benefits resulting from PI’s association with the Fund. The Board concluded that the potential benefits to be derived by Jennison included its ability to use soft dollar credits, brokerage commissions received by affiliates of Jennison, as well as the potential benefits consistent with those generally resulting from an increase in assets under management, specifically, potential access to additional research resources and reputational benefits. The Board concluded that the benefits derived by PI and Jennison were consistent with the types of benefits generally derived by investment managers and subadvisers to mutual funds.
| | |
| | Visit our website at www.jennisondryden.com |
Growth of a $10,000 Investment
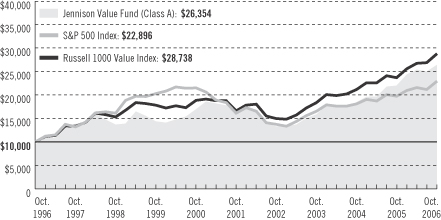
| | | | | | | | | | | |
| Average Annual Total Returns (With Sales Charges) as of 10/31/06 |
| | | One Year | | | Five Years | | | Ten Years | | | Since Inception |
Class A | | 13.26 | % | | 9.47 | % | | 10.18 | % | | — |
Class B | | 13.96 | | | 9.74 | | | 9.97 | | | — |
Class C | | 17.95 | | | 9.89 | | | 9.98 | | | — |
Class R | | 19.21 | | | N/A | | | N/A | | | 19.44% (6/3/05) |
Class Z | | 20.15 | | | 10.99 | | | 11.08 | | | — |
| | | | | | | | | | | |
| Average Annual Total Returns (Without Sales Charges) as of 10/31/06 |
| | | One Year | | | Five Years | | | Ten Years | | | Since Inception |
Class A | | 19.85 | % | | 10.71 | % | | 10.80 | % | | — |
Class B | | 18.96 | | | 9.88 | | | 9.97 | | | — |
Class C | | 18.95 | | | 9.89 | | | 9.98 | | | — |
Class R | | 19.21 | | | N/A | | | N/A | | | 19.44% (6/3/05) |
Class Z | | 20.15 | | | 10.99 | | | 11.08 | | | — |
Performance data quoted represent past performance. Past performance does not guarantee future results. The investment return and principal value of an investment will fluctuate, so that an investor’s shares, when redeemed, may be worth more or less than their original cost. Current performance may be lower or higher than the past performance data quoted. An investor may obtain performance data as of the most recent month-end by visiting our website at www.jennisondryden.com or by calling (800) 225-1852. The maximum initial sales charge is 5.50%.
The returns in the graph and the tables do not reflect the deduction of taxes that a shareholder would pay on Fund distributions or following the redemption of Fund shares.
| | |
| | Visit our website at www.jennisondryden.com |
Source: Prudential Investments LLC and Lipper Inc.
Inception date returns are provided for any share class with less than 10 years of returns.
The graph compares a $10,000 investment in the Jennison Value Fund (Class A shares) with a similar investment in the S&P 500 Index and the Russell 1000 Value Index by portraying the initial account values at the beginning of the 10-year period for Class A shares (October 31, 1996) and the account values at the end of the current fiscal year (October 31, 2006) as measured on a quarterly basis. For purposes of the graph, and unless otherwise indicated, it has been assumed that (a) the maximum applicable front-end sales charge was deducted from the initial $10,000 investment in Class A shares; (b) all recurring fees (including management fees) were deducted; and (c) all dividends and distributions were reinvested. The line graph provides information for Class A shares only. As indicated in the tables provided earlier, performance for Class B, Class C, and Class Z shares will vary due to the differing charges and expenses applicable to each share class (as indicated in the following paragraphs). Without a distribution and service (12b-1) fee waiver of 0.05% for Class A shares through October 31, 2006, the returns shown in the graph and for Class A shares in the tables would have been lower.
The S&P 500 Index is an unmanaged index of 500 stocks of large U.S. companies. It gives a broad look at how stock prices have performed in the United States. The Russell 1000 Value Index is an unmanaged index comprising those securities in the Russell 1000 Index with a lesser-than-average growth orientation. Companies in this index generally have low price-to-book and price-to-earnings ratios, higher dividend yields, and lower forecasted growth values. The Indexes’ total returns include the reinvestment of all dividends, but do not include the effects of sales charges, operating expenses of a mutual fund, or taxes. These returns would be lower if they included the effects of sales charges, operating expenses, or taxes. The securities that comprise these indexes may differ substantially from the securities in the Fund. These are not the only indexes that may be used to characterize performance of large-capitalization stock funds. Other indexes may portray different comparative performance. Investors cannot invest directly in an index.
Class A shares are subject to a maximum front-end sales charge of 5.50% and a 12b-1 fee of up to 0.30% annually. Investors who purchase Class A shares in an amount of $1 million or more do not pay a front-end sales charge, but are subject to a contingent deferred sales charge (CDSC) of 1% for shares sold within 12 months of purchase, in certain circumstances. Class B shares are subject to a declining CDSC of 5%, 4%, 3%, 2%, 1%, and 1%, respectively, for the first six years after purchase and a 12b-1 fee of 1% annually. Approximately seven years after purchase, Class B shares will automatically convert to Class A shares on a quarterly basis. Class C shares purchased are not subject to a front-end sales charge, but charge a CDSC of 1% for Class C shares sold within 12 months from the date of purchase, and an annual 12b-1 fee of 1%. Class Z shares are not subject to a sales charge or 12b-1 fees. The returns in the graph and tables reflect the share class expense structure in effect at the close of the fiscal period. Without waiver of fees and/or expense subsidization, the Fund’s returns would have been lower.
| | | | |
| n MAIL | | n TELEPHONE | | n WEBSITE |
Gateway Center Three 100 Mulberry Street Newark, NJ 07102 | | (800) 225-1852 | | www.jennisondryden.com |
|
| PROXY VOTING |
| The Board of Trustees of the Fund has delegated to the Fund’s investment subadviser the responsibility for voting any proxies and maintaining proxy recordkeeping with respect to the Fund. A description of these proxy voting policies and procedures is available without charge, upon request, by calling (800) 225-1852 or by visiting the Securities and Exchange Commission’s website at www.sec.gov. Information regarding how the Fund voted proxies relating to portfolio securities during the most recent 12-month period ended June 30 is available on the Fund’s website and on the Commission’s website. |
|
| TRUSTEES |
| Linda W. Bynoe • David E.A. Carson • Robert F. Gunia • Robert E. La Blanc • Douglas H. McCorkindale • Richard A. Redeker • Judy A. Rice • Robin B. Smith • Stephen G. Stoneburn • Clay T. Whitehead |
|
| OFFICERS |
| Judy A. Rice, President • Robert F. Gunia, Vice President • Grace C. Torres, Treasurer and Principal Financial and Accounting Officer • Kathryn L. Quirk, Chief Legal Officer • Deborah A. Docs, Secretary • Lee D. Augsburger, Chief Compliance Officer • Noreen M. Fierro, Anti-Money Laundering Compliance Officer • Jonathan D. Shain, Assistant Secretary • Claudia DiGiacomo, Assistant Secretary • John P. Schwartz, Assistant Secretary • Andrew R. French, Assistant Secretary • Jack Benintende, Assistant Treasurer • M. Sadiq Peshimam, Assistant Treasurer |
| | | | |
| MANAGER | | Prudential Investments LLC | | Gateway Center Three
100 Mulberry Street
Newark, NJ 07102 |
|
| INVESTMENT SUBADVISER | | Jennison Associates LLC | | 466 Lexington Avenue
New York, NY 10017 |
|
| DISTRIBUTOR | | Prudential Investment
Management Services LLC | | Gateway Center Three
100 Mulberry Street
Newark, NJ 07102 |
|
| CUSTODIAN | | The Bank of New York | | One Wall Street
New York, NY 10286 |
|
| TRANSFER AGENT | | Prudential Mutual Fund
Services LLC | | PO Box 8098
Philadelphia, PA 19176 |
|
INDEPENDENT REGISTERED
PUBLIC ACCOUNTING FIRM | | KPMG LLP | | 345 Park Avenue
New York, NY 10154 |
|
| FUND COUNSEL | | Sullivan & Cromwell LLP | | 125 Broad Street
New York, NY 10004 |
|
| An investor should consider the investment objectives, risks, charges, and expenses of the Fund carefully before investing. The prospectus for the Fund contains this and other information about the Fund. An investor may obtain a prospectus by visiting our website at www.jennisondryden.com or by calling (800) 225-1852. The prospectus should be read carefully before investing. |
|
| E-DELIVERY |
To receive your mutual fund documents on-line, go to www.icsdelivery.com/prudential/funds
and enroll. Instead of receiving printed documents by mail, you will receive notification via e-mail when new materials are available. You can cancel your enrollment or change your e-mail
address at any time by clicking on the change/cancel enrollment option at the icsdelivery
website address. |
|
| SHAREHOLDER COMMUNICATIONS WITH TRUSTEES |
| Shareholders can communicate directly with the Board of Trustees by writing to the Chair of the Board, Jennison Value Fund, PO Box 13964, Philadelphia, PA 19176. Shareholders can communicate directly with an individual Trustee by writing to the same address. Communications are not screened before being delivered to the addressee. |
|
| AVAILABILITY OF PORTFOLIO SCHEDULE |
| The Fund files its complete schedule of portfolio holdings with the Securities and Exchange Commission for the first and third quarters of each fiscal year on Form N-Q. The Fund’s Forms N-Q are available on the Commission’s website at www.sec.gov. The Fund’s Forms N-Q may also be reviewed and copied at the Commission’s Public Reference Room in Washington, D.C. Information on the operation and location of the Public Reference Room may be obtained by calling (800) SEC-0330 (732-0330). The Fund’s schedule of portfolio holdings is also available on the Fund’s website as of the end of each fiscal quarter. |
|
| The Fund’s Statement of Additional Information contains additional information about the Fund’s Trustees and is available without charge, upon request, by calling (800) 225-1852. |
Mutual Funds:
| | | | |
| ARE NOT INSURED BY THE FDIC OR ANY FEDERAL GOVERNMENT AGENCY | | MAY LOSE VALUE | | ARE NOT A DEPOSIT OF OR GUARANTEED BY ANY BANK OR ANY BANK AFFILIATE |

| | | | | | | | | | | | | | |
| Jennison Value Fund | | | | | | | | |
| | Share Class | | A | | B | | C | | R | | Z | | |
| | NASDAQ | | PBEAX | | PBQIX | | PEICX | | JDVRX | | PEIZX | | |
| | CUSIP | | 476297106 | | 476297205 | | 476297304 | | 476297502 | | 476297403 | | |
| | | | | | | | | | | | | | |
MF131E IFS-A127701 Ed. 12/2006
Item 2 – Code of Ethics — See Exhibit (a)
As of the end of the period covered by this report, the registrant has adopted a code of ethics (the “Section 406 Standards for Investment Companies – Ethical Standards for Principal Executive and Financial Officers”) that applies to the registrant’s Principal Executive Officer and Principal Financial Officer; the registrant’s Principal Financial Officer also serves as the Principal Accounting Officer.
The registrant hereby undertakes to provide any person, without charge, upon request, a copy of the code of ethics. To request a copy of the code of ethics, contact the registrant 973-367-7521, and ask for a copy of the Section 406 Standards for Investment Companies - Ethical Standards for Principal Executive and Financial Officers.
Item 3 – Audit Committee Financial Expert –
The registrant’s Board has determined that Mr. David E. A. Carson, member of the Board’s Audit Committee is an “audit committee financial expert,” and that he is “independent,” for purposes of this Item.
Item 4 – Principal Accountant Fees and Services –
(a) Audit Fees
For the fiscal years ended October 31, 2006 and October 31, 2005, KPMG LLP (“KPMG”), the Registrant’s principal accountant, billed the Registrant $16,700 and $16,700, respectively, for professional services rendered for the audit of the Registrant’s annual financial statements or services that are normally provided in connection with statutory and regulatory filings.
(b) Audit-Related Fees
None.
(c) Tax Fees
None.
(d) All Other Fees
None.
(e) (1) Audit Committee Pre-Approval Policies and Procedures
THE PRUDENTIAL MUTUAL FUNDS
AUDIT COMMITTEE POLICY
on
Pre-Approval of Services Provided by the Independent Accountants
The Audit Committee of each Prudential Mutual Fund is charged with the responsibility to monitor the independence of the Fund’s independent accountants. As part of this responsibility, the Audit Committee must pre-approve any independent accounting firm’s engagement to render audit and/or permissible non-audit services, as required by law. In evaluating a proposed engagement of the independent accountants, the Audit Committee will assess the effect that the engagement might reasonably be expected to have on the accountant’s independence. The Committee’s evaluation will be based on:
| | • | | a review of the nature of the professional services expected to be provided, |
| | • | | a review of the safeguards put into place by the accounting firm to safeguard independence, and |
| | • | | periodic meetings with the accounting firm. |
Policy for Audit and Non-Audit Services Provided to the Funds
On an annual basis, the scope of audits for each Fund, audit fees and expenses, and audit-related and non-audit services (and fees proposed in respect thereof) proposed to be performed by the Fund’s independent accountants will be presented by the Treasurer and the independent accountants to the Audit Committee for review and, as appropriate, approval prior to the initiation of such services. Such presentation shall be accompanied by confirmation by both the Treasurer and the independent accountants that the proposed services will not adversely affect the independence of the independent accountants. Proposed services shall be described in sufficient detail to enable the Audit Committee to assess the appropriateness of such services and fees, and the compatibility of the provision of such services with the auditor’s independence. The Committee shall receive periodic reports on the progress of the audit and other services which are approved by the Committee or by the Committee Chair pursuant to authority delegated in this Policy.
The categories of services enumerated under “Audit Services”, “Audit-related Services”, and “Tax Services” are intended to provide guidance to the Treasurer and the independent accountants as to those categories of services which the Committee believes are generally consistent with the independence of the independent accountants and which the Committee (or the Committee Chair) would expect upon the presentation of specific proposals to pre-approve. The enumerated categories are not intended as an exclusive list of audit, audit-related or tax services, which the Committee (or the Committee Chair) would consider for pre-approval.
Audit Services
The following categories of audit services are considered to be consistent with the role of the Fund’s independent accountants:
| | • | | Annual Fund financial statement audits |
| | • | | Seed audits (related to new product filings, as required) |
| | • | | SEC and regulatory filings and consents |
Audit-related Services
The following categories of audit-related services are considered to be consistent with the role of the Fund’s independent accountants:
| | • | | Accounting consultations |
| | • | | Fund merger support services |
| | • | | Agreed Upon Procedure Reports |
| | • | | Other Internal Control Reports |
Individual audit-related services that fall within one of these categories and are not presented to the Audit Committee as part of the annual pre-approval process will be subject to pre-approval by the Committee Chair (or any other Committee member on whom this responsibility has been delegated) so long as the estimated fee for those services does not exceed $50,000.
Tax Services
The following categories of tax services are considered to be consistent with the role of the Fund’s independent accountants:
| | • | | Tax compliance services related to the filing or amendment of the following: |
| | • | | Federal, state and local income tax compliance; and, |
| | • | | Sales and use tax compliance |
| | • | | Timely RIC qualification reviews |
| | • | | Tax distribution analysis and planning |
| | • | | Tax authority examination services |
| | • | | Tax appeals support services |
| | • | | Accounting methods studies |
| | • | | Fund merger support services |
| | • | | Tax consulting services and related projects |
Individual tax services that fall within one of these categories and are not presented to the Audit Committee as part of the annual pre-approval process will be subject to pre-approval by the Committee Chair (or any other Committee member on whom this responsibility has been delegated) so long as the estimated fee for those services does not exceed $50,000.
Other Non-audit Services
Certain non-audit services that the independent accountants are legally permitted to render will be subject to pre-approval by the Committee or by one or more Committee members to whom the Committee has delegated this authority and who will report to the full Committee any pre-approval decisions made pursuant to this Policy. Non-audit services presented for pre-approval pursuant to this paragraph will be accompanied by a confirmation from both the Treasurer and the independent accountants that the proposed services will not adversely affect the independence of the independent accountants.
Proscribed Services
The Fund’s independent accountants will not render services in the following categories of non-audit services:
| | • | | Bookkeeping or other services related to the accounting records or financial statements of the Fund |
| | • | | Financial information systems design and implementation |
| | • | | Appraisal or valuation services, fairness opinions, or contribution-in-kind reports |
| | • | | Internal audit outsourcing services |
| | • | | Management functions or human resources |
| | • | | Broker or dealer, investment adviser, or investment banking services |
| | • | | Legal services and expert services unrelated to the audit |
| | • | | Any other service that the Public Company Accounting Oversight Board determines, by regulation, is impermissible. |
Pre-approval of Non-Audit Services Provided to Other Entities Within the Prudential Fund Complex
Certain non-audit services provided to Prudential Investments LLC or any of its affiliates that also provide ongoing services to the Prudential Mutual Funds will be subject to pre-approval by the Audit Committee. The only non-audit services provided to these entities that will require pre-approval are those related directly to the operations and financial reporting of the Funds. Individual projects that are not presented to the Audit Committee as part of the annual pre-approval process will be subject to pre-approval by the Committee Chair (or any other Committee member on whom this responsibility has been delegated) so long as the estimated fee for those services does not exceed $50,000. Services presented for pre-approval pursuant to this paragraph will be accompanied by a confirmation from both the Treasurer and the independent accountants that the proposed services will not adversely affect the independence of the independent accountants.
Although the Audit Committee will not pre-approve all services provided to Prudential Investments LLC and its affiliates, the Committee will receive an annual report from the Fund’s independent accounting firm showing the aggregate fees for all services provided to Prudential Investments and its affiliates.
(e) (2) Percentage of services referred to in 4(b)- (4)(d) that were approved by the audit committee –
Not applicable.
(f) Percentage of hours expended attributable to work performed by other than full time employees of principal accountant if greater than 50%.
Not applicable.
(g) Non-Audit Fees
Not applicable to Registrant for the fiscal years 2006 and 2005. The aggregate non-audit fees billed by KPMG for services rendered to the registrant’s investment adviser and any entity controlling, controlled by, or under common control with the investment adviser that provides ongoing services to the registrant for the fiscal years 2006 and 2005 was $317,300 and $51,000, respectively.
(h) Principal Accountant’s Independence
Not applicable as KPMG has not provided non-audit services to the registrant’s investment adviser and any entity controlling, controlled by, or under common control with the investment adviser that provides ongoing services to the registrant that were not pre-approved pursuant to Rule 2-01(c)(7)(ii) of Regulation S-X.
Item 5 – Audit Committee of Listed Registrants – Not applicable.
Item 6 – Schedule of Investments – The schedule is included as part of the report to shareholders filed under Item 1 of this Form.
Item 7 – Disclosure of Proxy Voting Policies and Procedures for Closed-End Management Investment Companies – Not applicable.
Item 8 – Portfolio Managers of Closed-End Management Investment Companies – Not applicable.
Item 9 – Purchases of Equity Securities by Closed-End Management Investment Company and Affiliated Purchasers – Not applicable.
Item 10 – Submission of Matters to a Vote of Security Holders – Not applicable.
Item 11 – Controls and Procedures
| | (a) | It is the conclusion of the registrant’s principal executive officer and principal financial officer that the effectiveness of the registrant’s current disclosure controls and procedures (such disclosure controls and procedures having been evaluated within 90 days of the date of this filing) provide reasonable assurance that the information required to be disclosed by the registrant has been recorded, processed, summarized and reported within the time period specified in the Commission’s rules and forms and that the information required to be disclosed by the registrant has been accumulated and communicated to the registrant’s principal executive officer and principal financial officer in order to allow timely decisions regarding required disclosure. |
| | (b) | There has been no significant change in the registrant’s internal control over financial reporting that occurred during the registrant’s most recent fiscal quarter of the period covered by this report that has materially affected, or is likely to materially affect, the registrant’s internal control over financial reporting. |
Item 12 – Exhibits
| | |
| (a) | | (1) Code of Ethics – Attached hereto as Exhibit EX-99.CODE-ETH |
| |
| | (2) Certifications pursuant to Section 302 of the Sarbanes-Oxley Act – Attached hereto as Exhibit EX-99.CERT. |
| |
| | (3) Any written solicitation to purchase securities under Rule 23c-1. – Not applicable. |
| |
(b) | | Certifications pursuant to Section 906 of the Sarbanes-Oxley Act – Attached hereto as Exhibit EX-99.906CERT. |
SIGNATURES
Pursuant to the requirements of the Securities Exchange Act of 1934 and the Investment Company Act of 1940, the registrant has duly caused this report to be signed on its behalf by the undersigned, thereunto duly authorized.
| | |
| (Registrant) Jennison Value Fund |
| |
| By (Signature and Title)* | | /s/ Deborah A. Docs |
| | Deborah A. Docs |
| | Secretary |
|
| Date December 22, 2006 |
Pursuant to the requirements of the Securities Exchange Act of 1934 and the Investment Company Act of 1940, this report has been signed below by the following persons on behalf of the registrant and in the capacities and on the dates indicated.
| | |
| By (Signature and Title)* | | /s/ Judy A. Rice |
| | Judy A. Rice |
| | President and Principal Executive Officer |
|
| Date December 22, 2006 |
| |
| By (Signature and Title)* | | /s/ Grace C. Torres |
| | Grace C. Torres |
| | Treasurer and Principal Financial Officer |
|
| Date December 22, 2006 |
| * | Print the name and title of each signing officer under his or her signature. |