UNITED STATES
SECURITIES AND EXCHANGE COMMISSION
Washington, D.C. 20549
FORM N-CSR
CERTIFIED SHAREHOLDER REPORT OF REGISTERED
MANAGEMENT INVESTMENT COMPANIES
| | |
Investment Company Act file number: | | 811-04864 |
JennisonDryden Portfolios
|
| Exact name of registrant as specified in charter |
|
Gateway Center 3, 100 Mulberry Street, Newark, New Jersey 07102 |
| Address of principal executive offices |
Deborah A. Docs
Gateway Center 3,
100 Mulberry Street,
Newark, New Jersey 07102
|
| Name and address of agent for service |
Registrant’s telephone number, including area code: 800-225-1852
Date of fiscal year end: 8/31/2008
Date of reporting period: 8/31/2008
Item 1 – Reports to Stockholders


| | |
| AUGUST 31, 2008 | | ANNUAL REPORT |
Jennison Value Fund
FUND TYPE
Large-capitalization stock
OBJECTIVE
Capital appreciation
This report is not authorized for distribution to prospective investors unless preceded or accompanied by a current prospectus.
The views expressed in this report and information about the Fund’s portfolio holdings are for the period covered by this report and are subject to change thereafter.
JennisonDryden, Jennison, Prudential Financial and the Rock Prudential logo are registered service marks of The Prudential Insurance Company of America, Newark, NJ, and its affiliates.

October 15, 2008
Dear Shareholder:
We hope you find the annual report for the Jennison Value Fund informative and useful. As a JennisonDryden mutual fund shareholder, you may be thinking about where you can find additional growth opportunities. You could invest in last year’s top-performing asset class and hope that history repeats itself or you could stay in cash while waiting for the “right moment” to invest.
Instead, we believe it is better to take advantage of developing domestic and global investment opportunities through a diversified portfolio of stock and bond mutual funds. A diversified asset allocation offers two potential advantages. It helps you manage downside risk by not being overly exposed to any particular asset class, plus it gives you a better opportunity to have at least some of your assets in the right place at the right time. Your financial professional can help you create a diversified investment plan that may include mutual funds covering all the basic asset classes and that reflects your personal investor profile and tolerance for risk. Keep in mind that diversification and asset allocation do not assure against loss in declining markets.
JennisonDryden Mutual Funds gives you a wide range of choices that can help you make progress toward your financial goals. Our funds offer the experience, resources, and professional discipline of four leading asset managers. They are recognized and respected in the institutional market and by discerning investors for excellence in their respective strategies. JennisonDryden equity funds are advised by Jennison Associates LLC, Quantitative Management Associates LLC (QMA), or PREI® (Prudential Real Estate Investors). Prudential Investment Management, Inc. (PIM) advises the JennisonDryden fixed income and money market funds. Jennison Associates, QMA, and PIM are registered investment advisers and Prudential Financial companies. PREI is a registered investment adviser and a unit of PIM.
Thank you for choosing JennisonDryden Mutual Funds.
Sincerely,

Judy A. Rice, President
Jennison Value Fund
Your Fund’s Performance
Fund objective
The investment objective of the Jennison Value Fund is capital appreciation. There can be no assurance that the Fund will achieve its investment objective.
Performance data quoted represent past performance. Past performance does not guarantee future results. The investment return and principal value of an investment will fluctuate, so that an investor’s shares, when redeemed, may be worth more or less than their original cost. Current performance may be lower or higher than the past performance data quoted. An investor may obtain performance data as of the most recent month-end by visiting our website at www.jennisondryden.com or by calling (800) 225-1852. Class A and Class L shares have a maximum initial sales charge of 5.50% and 5.75%, respectively. Gross operating expenses: Class A, 1.03%; Class B, 1.73%; Class C, 1.73%; Class L, 1.23%; Class M, 1.73%; Class R, 1.48%; Class X, 1.02%; Class Z, 0.73%. Net operating expenses apply to: Class A, 1.00%; Class B, 1.73%; Class C, 1.73%; Class L, 1.23%; Class M, 1.73%; Class R, 1.23%; Class X, 1.02%; Class Z, 0.73%, after contractual reduction through 2/29/2008 for Class A shares and 12/31/2009 for Class R shares.
| | | | | | | | | | | |
| Cumulative Total Returns as of 8/31/08 | | | |
| | | One Year | | | Five Years | | | Ten Years | | | Since Inception1 |
Class A | | –9.95 | % | | 66.50 | % | | 113.74 | % | | — |
Class B | | –10.65 | | | 60.33 | | | 98.13 | | | — |
Class C | | –10.66 | | | 60.31 | | | 98.11 | | | — |
Class L | | –10.17 | | | N/A | | | N/A | | | –5.42% (3/19/07) |
Class M | | –10.55 | | | N/A | | | N/A | | | –6.05 (3/19/07) |
Class R | | –10.12 | | | N/A | | | N/A | | | 25.27 (6/3/05) |
Class X | | –10.38 | | | N/A | | | N/A | | | –5.87 (3/19/07) |
Class Z | | –9.72 | | | 68.52 | | | 119.21 | | | — |
Russell 1000 Value Index2 | | –14.66 | | | 50.72 | | | 95.79 | | | ** |
S&P 500 Index3 | | –11.13 | | | 39.72 | | | 57.90 | | | *** |
Lipper Multi-Cap Value Funds Avg.4 | | –14.96 | | | 43.22 | | | 112.93 | | | **** |
| | |
| 2 | | Visit our website at www.jennisondryden.com |
| | | | | | | | | | | |
| Average Annual Total Returns5 as of 9/30/08 |
| | | One Year | | | Five Years | | | Ten Years | | | Since Inception1 |
Class A | | –30.94 | % | | 6.14 | % | | 4.82 | % | | — |
Class B | | –30.51 | | | 6.39 | | | 4.63 | | | — |
Class C | | –28.10 | | | 6.54 | | | 4.63 | | | — |
Class L | | –31.27 | | | N/A | | | N/A | | | –17.04% (3/19/07) |
Class M | | –31.12 | | | N/A | | | N/A | | | –16.57 (3/19/07) |
Class R | | –27.06 | | | N/A | | | N/A | | | 1.60 (6/3/05) |
Class X | | –30.78 | | | N/A | | | N/A | | | –16.33 (3/19/07) |
Class Z | | –26.73 | | | 7.61 | | | 5.68 | | | — |
Russell 1000 Value Index2 | | –23.56 | | | 7.12 | | | 5.55 | | | ** |
S&P 500 Index3 | | –21.96 | | | 5.17 | | | 3.06 | | | *** |
Lipper Multi-Cap Value Funds Avg.4 | | –24.90 | | | 5.30 | | | 5.96 | | | **** |
The cumulative total returns do not reflect the deduction of applicable sales charges. If reflected, the applicable sales charges would reduce the cumulative total returns performance quoted. The average annual total returns assume the payment of the maximum applicable sales charge. Class A and Class L shares are subject to a maximum front-end sales charge of 5.50% and 5.75%, respectively. Under certain circumstances, Class A shares may be subject to a contingent deferred sales charge (CDSC) of 1%. Class B, Class C, Class L, Class M, and Class X shares are subject to a maximum CDSC of 5%, 1%, 1%, 6%, and 6%, respectively. Class R and Class Z shares are not subject to a sales charge.
Source: Prudential Investments LLC and Lipper Inc. Performance figures may reflect fee waivers and/or expense reimbursements. In the absence of such fee waivers and/or expense reimbursements, total returns would be lower.
1Inception date returns are provided for any share class with less than 10 calendar years.
2The Russell 1000 Value Index is an unmanaged index comprising those securities in the Russell 1000 Index with a less-than-average growth orientation. Companies in this index generally have low price-to-book and price-to-earnings ratios, higher dividend yields, and lower forecasted growth values.
3The S&P 500 Index is an unmanaged index of 500 stocks of large U.S. public companies. It gives an indication of how U.S. stock prices have performed.
4The Lipper Multi-Cap Value Funds Average (Lipper Average) represents returns based on an average return of all funds in the Lipper Multi-Cap Value Funds category for the periods noted. Funds in the Lipper Average typically have a below-average price-to-earnings ratio, price-to-book ratio, and three-year sales-per-share growth value compared with the S&P SuperComposite 1500 Index.
5The average annual total returns take into account applicable sales charges. Class A, Class B, Class C, Class L, Class M, Class R, and Class X shares are subject to an annual distribution and service (12b-1) fee of up to 0.30%, 1.00%, 1.00%, 0.50%, 1.00%, 0.75%, and 1.00%, respectively. Approximately seven years after purchase, Class B shares will automatically convert to Class A shares on a quarterly basis. Approximately eight years after purchase, Class M shares will automatically convert to Class A shares on a quarterly basis. Approximately 10 years after purchase (eight years in the case of shares purchased prior to August 19, 1998),
Your Fund’s Performance (continued)
Class X shares will automatically convert to Class A shares on a quarterly basis. Class Z shares are not subject to a 12b-1 fee. The returns in the tables do not reflect the deduction of taxes that a shareholder would pay on Fund distributions or following the redemption of Fund shares.
**Russell 1000 Value Index Closest Month-End to Inception cumulative total return as of 8/31/08 is –13.64% for Class L, Class M, and Class X; and 13.67% for Class R. Russell 1000 Value Index Closest Month-End to Inception average annual total returns as of 9/30/08 are –13.81% for Class L, Class M, and Class X; and 1.57% for Class R.
***S&P 500 Index Closest Month-End to Inception cumulative total return as of 8/31/08 is –7.11% for Class L, Class M, and Class X; and 14.64% for Class R. S&P 500 Index Closest Month-End to Inception average annual total returns as of 9/30/08 are –10.54% for Class L, Class M, and Class X; and 1.31% for Class R.
****Lipper Average Closest Month-End to Inception cumulative total return as of 8/31/08 is –13.85% for Class L, Class M, and Class X; and 10.64% for Class R. Lipper Average Closest Month-End to Inception average annual total returns as of 9/30/08 are –15.29% for Class L, Class M, and Class X; and –0.01% for Class R.
Investors cannot invest directly in an index. The returns for the Russell 1000 Value Index, the S&P 500 Index, and the Lipper Average would be lower if they included the effects of sales charges, operating expenses of a mutual fund, or taxes. Returns for the Lipper Average reflect the deduction of operating expenses, but not sales charges or taxes.
| | | |
| Five Largest Holdings expressed as a percentage of net assets as of 8/31/08 | | | |
Symantec Corp., Software | | 3.3 | % |
Comcast Corp. (Class A), Media | | 3.2 | |
NII Holdings, Inc., Wireless Telecommunication Services | | 2.8 | |
Liberty Global, Inc., Media | | 2.7 | |
H&R Block, Inc., Diversified Consumer Services | | 2.6 | |
Holdings reflect only long-term investments and are subject to change.
| | | |
| Five Largest Industries expressed as a percentage of net assets as of 8/31/08 | | | |
Oil, Gas & Consumable Fuels | | 12.9 | % |
Insurance | | 7.4 | |
Media | | 7.0 | |
Pharmaceuticals | | 6.9 | |
Software | | 6.6 | |
Industry weightings reflect only long-term investments and are subject to change.
| | |
| 4 | | Visit our website at www.jennisondryden.com |
Strategy and Performance Overview
How did the Fund perform?
The Jennison Value Fund Class A shares declined 9.95% for the 12-month reporting period ended August 31, 2008, outperforming its benchmark, the Russell 1000® Value Index (the Index), which declined 14.66%, and the Lipper Multi-Cap Value Funds Average, which was down 14.96%. The Fund also outperformed the Lipper Large-Cap Value Funds Average, which fell 14.33%.
Within the benchmark, the energy, healthcare, and consumer staples sectors added a nominal amount to returns. The Fund’s energy positions bolstered performance and meaningfully outperformed those held by the Index. Securities in the industrials sector also made a positive impact on the Fund’s returns and outperformed the Index by a wide margin. Stocks in the consumer staples sector finished in positive territory, and the Fund’s larger exposure to the sector lifted relative performance. Although the consumer discretionary and information technology sectors landed in negative territory, stronger stock selection in both sectors resulted with gains relative to the Index.
The beleaguered financials sector was the largest detractor from returns in the Fund and in the Index. While the Fund’s holdings in financials trailed those held by the Index, the Fund’s lower exposure to this weak sector meaningfully mitigated losses. Positions in materials and telecommunication services were also a drag on returns.
What was the market environment like during the reporting period?
Problems stemming from the subprime mortgage market spread throughout the financial system in the year ended August 31, 2008, creating a full-blown liquidity/credit crisis that roiled global markets. Engulfed in the spiraling credit crisis, the financial sector turned in its worst performance in recent history. Major banks and brokerage houses reported additional write-downs, exceeding previous estimations of losses tied to the securitization of subprime mortgage loans. When events became even more chaotic in March, the Federal Reserve and the Treasury Department intervened to facilitate the sale of the faltering securities firm Bear Stearns, which had been immobilized by liquidity problems.
The salutary effects of these actions were limited, however. Increased loan defaults and higher rates of non-performing assets throughout the global financial system reflected a growing list of consumer woes—substantial housing declines, tighter lending standards, rampant energy price escalation (crude oil and gasoline prices soared to record highs), and food price inflation. Softening labor markets and broadening declines in consumption joined housing weakness and higher commodity prices as strains on the economy. Declining markets and the U.S. dollar’s devaluation
Strategy and Performance Overview (continued)
soured consumer sentiment. Citing increased concerns about inflationary pressures stemming from rising food and energy prices, the Federal Open Market Committee held short-term interest rates steady at its June and August 2008 meetings, ending a series of rate reductions that began in September 2007. It noted that tight credit conditions, the ongoing housing contraction, and the rise in energy prices are likely to weigh on economic growth over the next few quarters, as economic activity continues to be anemic.
Which holdings made the largest positive contribution to the Fund’s return?
H&R Block was the top contributor and delivered a double-digit return, rising primarily on the sale of its Option One mortgage business. The nationwide tax preparer subsequently entered into an agreement with bank regulators, in which the company can reduce the amount of capital it is required to maintain. This agreement enabled H&R Block to announce a $2 billion stock buyback authorization. Additionally, H&R Block has agreed to sell its securities brokerage unit, H&R Block Financial Advisors, to Ameriprise Financial, Inc., leaving its core tax preparation business, which is gaining market share. The manager believes the company is well positioned, especially from recently implemented cost saving initiatives and growth in H&R’s Express Tax offices. The manager has taken some profit due to H&R Block’s valuation.
Energy positions Petroleo Brasileiro (Petrobras), Hess and Occidental Petroleum were among the top four strongest contributors. Brazilian oil and gas company Petrobras was a stellar performer, mostly due to the announcement that its Tupi Sul discovery in the Santos Basin off the coast of Brazil may hold five to eight billion barrels of crude oil, in addition to massive natural gas reserves. While the manager retains its conviction in Petrobras, Jennison has taken some profit during the reporting period due to its favorable valuation.
Shares of global integrated energy company Hess appreciated considerably as the company expanded reserve life and production. The company’s exploration in Brazil also boosted the stock price. Since the Fund’s initial purchase in October 2005, Hess appreciated approximately 140% (adjusted for a 3:1 stock split), with some valuation help from Brazilian speculation. Jennison took profit and sold the position, taking advantage of a favorable valuation. The manager believes the secular, or long-term, supply/demand imbalance for many commodities will persist. However, in the short- to medium-term there could be a cyclical correction as demand moderates. Within the oil and gas industry, the manager continues to focus on companies with solid international production growth, exposure to resource opportunities, and attractive valuations.
Symantec, Wal-Mart, and NII Holdings led their respective sectors. For Symantec and NII Holdings, see the Comments on Five Largest Holdings section. Wal-Mart operates
| | |
| 6 | | Visit our website at www.jennisondryden.com |
retail stores in various formats around the world. The company’s operations comprise three business segments: Wal-Mart Stores, Sam’s Club, and International. The merchandising initiatives put in place nearly two years ago are finally bearing fruit. While traffic remains challenging, the combination of difficult economic times and a re-focus on the all-important value proposition (“Save money. Live Better.”), in Jennison’s view, positions the company well for the remainder of this calendar year.
Insurance and reinsurance company XL Capital Ltd. showed particular strength. The Fund opened a position in XL, whose shares were trading at their lowest levels in a decade, in mid-July. XL rose approximately 17% from the initial purchase on July 11 to July 22, and the Fund sold at a profit due to XL’s valuation. Jennison became concerned the stock would drop upon reaching a settlement with the New York State insurance regulator that would allow XL to separate the liabilities associated with Security Capital Assurance Ltd., a financial guarantee company involved in the subprime and CDO markets, from the XL balance sheet. Jennison anticipated that, in order to reach a settlement, XL would have to make a large payment to the subsidiary. The Fund then re-purchased XL at the end of July, after its stock price bottomed. With the approval of the insurance commissions of Delaware, New York and Bermuda, the future risk to XL is minimized. The manager also has confidence its new CEO can lead the stock higher. XL outperformed in August after A.M. Best Co., a key rating agency for insurance companies, removed XL from “under review” and affirmed issuer credit ratings of “bbb.” A.M. Best also affirmed all of XL’s debt ratings and life/health subsidiaries’ ratings as stable. While this was expected, many of XL’s clients have been waiting for this affirmation and removal of negative review to resume full normal business ties with XL.
What holdings detracted most from the Fund’s return?
Financials stocks, Fannie Mae, American International Group (AIG), Citigroup and MBIA were the largest detractors from performance. Fannie Mae was a government sponsored enterprise (GSE) that provided funds to mortgage lenders. The manager thought Fannie Mae would be able to navigate through the mortgage crisis, and should the company need to raise capital, Jennison did not think it would be as much as most believed. Jennison also thought Fannie Mae could win new business at very attractive spreads, both from non-GSE mortgage players and from fellow GSE Freddie Mac, who had a deeper capital need than Fannie. In this past August, the stock fell sharply as the company accelerated the time of recognition of reserve loss, which negatively impacted earnings. The manager maintained the position, as its estimate of Fannie’s cumulative losses remained unchanged. Fannie continued to decline further as fears mounted that it, as well as Freddie Mac, will soon need a bailout from the government, leaving stockholders with nothing. (Note: Shortly after the Fund’s reporting period, the U.S. Government seized control of Fannie Mae and Freddie Mac.)
Strategy and Performance Overview (continued)
The Fund invested in AIG for its unmatched global property/casualty and life insurance businesses. AIG also has a great financial services franchise, including one of the world’s premier airplane leasing businesses (ILFC). AIG’s financial products business, which historically had been extremely profitable while navigating complicated financial markets, had become deeply troubled as the credit markets quickly deteriorated. AIG holds highly desirable businesses and assets. AIG’s extensive efforts to shore up its capital base in the wake of frozen credit markets left it unable to raise enough capital to keep its share value from plunging. Despite AIG’s having raised capital, the market is concerned that the company will have to raise more capital if rating agencies downgrade it; a downgrade would require AIG to post collateral against its counterparty obligations. The cost of a de-risking strategy especially for AIG’s credit default swap (CDS) business is another concern. (Note: Shortly after the reporting period The U.S. Federal Reserve took control of AIG in an $85 billion bailout to prevent the country’s largest insurer from failing.)
MBIA, the bond insurer, conducts most of its business in municipal bond guarantees. However, nearly a third of its holdings were comprised of structured finance guarantees designed to provide credit protection to issuers of highly complex debt transactions. This smaller portion of MBIA’s portfolio had garnered the market’s focus without the acknowledgement it was 95% AAA rated. The company attempted to assure investors that its exposure to subprime debt was minimal. Despite the fall in MBIA’s share price, the manager remained comfortable with the Fund’s position in MBIA, especially after the company received over $1 billion from a major private equity firm to help shore up the balance sheet and offset losses. To the manager’s dismay, however, what were thought to be “plain-vanilla” CDOs were later reclassified by MBIA as “CDOs-squared,” which are high-risk derivatives. This news undermined the manager’s confidence, and the Fund sold its MBIA position in January.
In telecommunications, Virgin Mobile USA was the weakest performer. The Fund initially purchased Virgin Mobile USA, which provides prepaid wireless services over Sprint’s Code Division Multiple Access (CDMA) network, in October at the company’s IPO. Virgin Mobile shares significantly underperformed after the company issued disappointing forecasts, exacerbating fears of its sustainability of future growth due to increased competition from the traditional carriers for pre-paid customers and a weaker economic outlook. The Fund continues to hold Virgin Mobile USA, as the manager monitors the competitive environment, particularly for revenue from its sales of handsets.
| | |
| 8 | | Visit our website at www.jennisondryden.com |
Were there significant changes to the portfolio?
During the reporting period there were no significant changes to the portfolio. The Fund is constructed one stock at a time based on in-house analysis of individual company fundamentals rather than on overarching themes. The determination of a stock’s weighting is as much a part of this bottom-up process as is the decision to include the stock in the portfolio. Sector and industry allocations are an outgrowth of this stock selection process.
Comments on Five Largest Holdings
| 3.3% | Symantec Corp., Software |
Symantec provides a range of tools to help individuals and enterprises assure the security, availability, and integrity of their IT infrastructure and data. Symantec outperformed after the company reported two consecutive quarters that exceeded analysts’ expectations. The manager believes these results highlight Symantec’s turnaround and should improve investor sentiment, leading the stock higher.
| 3.2% | Comcast Corp. (Class A), Media |
Comcast, the largest U.S. provider of cable services, should continue to make solid gains in higher-margin phone and data subscriptions that should offset losses on seasonal declines in basic video subscriptions. With declining capital expenditures and expected rising earnings from sales of its triple-play package, the manager believes Comcast will be able to generate significant and growing free cash flow and is attractively valued with a long-term competitive position.
| 2.8% | NII Holdings, Inc., Wireless Telecommunication Services |
NII Holdings is one of the only post-paid wireless providers in the rapidly growing emerging markets of Latin America, Mexico, and Brazil. The manager believes it is growing at a faster rate than other wireless companies, and is encouraged by the company’s new CEO and recent stock repurchase programs.
| 2.7% | Liberty Global, Inc. (Series C), Media |
Liberty Global is an international communications provider of video, voice and broadband Internet services, with consolidated broadband communications and/or direct-to-home satellite operations. The manager retains its confidence in Liberty Global, which has a higher free cash flow yield and lower enterprise value to earnings than comparable U.S. cable companies but operates in faster growing markets. (Enterprise value is a more accurate measure of valuation, including a firm’s debt.) Additionally, the company’s management has reiterated its commitment to buy back stock in large volumes. It should be noted that the company has used internally generated cash flow to buy back roughly 30% of the shares outstanding in the last 3 years.
| 2.6% | H&R Block, Inc., Diversified Consumer Services |
See section in this report on the largest positive contributors to Fund returns.
| | |
| 10 | | Visit our website at www.jennisondryden.com |
Fees and Expenses (Unaudited)
As a shareholder of the Fund, you incur two types of costs: (1) transaction costs, including sales charges (loads) on purchase payments and redemptions, as applicable, and (2) ongoing costs, including management fees, distribution and/or service (12b-1) fees, and other Fund expenses, as applicable. This example is intended to help you understand your ongoing costs (in dollars) of investing in the Fund and to compare these costs with the ongoing costs of investing in other mutual funds.
The example is based on an investment of $1,000 invested on March 1, 2008, at the beginning of the period, and held through the six-month period ended August 31, 2008. The example is for illustrative purposes only; you should consult the Prospectus for information on initial and subsequent minimum investment requirements.
The Fund’s transfer agent may charge additional fees to holders of certain accounts that are not included in the expenses shown in the table on the following page. These fees apply to individual retirement accounts (IRAs) and Section 403(b) accounts. As of the close of the six-month period covered by the table, IRA fees included an annual maintenance fee of $15 per account (subject to a maximum annual maintenance fee of $25 for all accounts held by the same shareholder). Section 403(b) accounts are charged an annual $25 fiduciary maintenance fee. Some of the fees may vary in amount, or may be waived, based on your total account balance or the number of JennisonDryden funds, including the Fund, that you own. You should consider the additional fees that were charged to your Fund account over the six-month period when you estimate the total ongoing expenses paid over the period and the impact of these fees on your ending account value, as these additional expenses are not reflected in the information provided in the expense table. Additional fees have the effect of reducing investment returns.
Actual Expenses
The first line for each share class in the table on the following page provides information about actual account values and actual expenses. You may use the information on this line, together with the amount you invested, to estimate the expenses that you paid over the period. Simply divide your account value by $1,000 (for example, an $8,600 account value ÷ $1,000 = 8.6), then multiply the result by the number on the first line under the heading “Expenses Paid During the Six-Month Period” to estimate the expenses you paid on your account during this period.
Hypothetical Example for Comparison Purposes
The second line for each share class in the table on the following page provides information about hypothetical account values and hypothetical expenses based on the Fund’s actual expense ratio and an assumed rate of return of 5% per year before expenses, which is not the Fund’s actual return. The hypothetical account values and expenses may not be used to estimate the actual ending account balance or expenses you paid for the period. You may use this information to compare the ongoing costs
Fees and Expenses (continued)
of investing in the Fund and other funds. To do so, compare this 5% hypothetical example with the 5% hypothetical examples that appear in the shareholder reports of the other funds.
Please note that the expenses shown in the table are meant to highlight your ongoing costs only and do not reflect any transactional costs such as sales charges (loads). Therefore, the second line for each share class in the table is useful in comparing ongoing costs only and will not help you determine the relative total costs of owning different funds. In addition, if these transactional costs were included, your costs would have been higher.
| | | | | | | | | | | | | | |
| Jennison Value Fund | | Beginning Account
Value March 1, 2008 | | Ending Account
Value August 31, 2008 | | Annualized
Expense Ratio
Based on the
Six-Month Period | | | Expenses Paid
During the
Six-Month Period* |
| | | | | | | | | | | | | | |
| Class A | | Actual | | $ | 1,000.00 | | $ | 995.80 | | 1.03 | % | | $ | 5.17 |
| | | Hypothetical | | $ | 1,000.00 | | $ | 1,019.96 | | 1.03 | % | | $ | 5.23 |
| | | | | | | | | | | | | | |
| Class B | | Actual | | $ | 1,000.00 | | $ | 992.10 | | 1.73 | % | | $ | 8.66 |
| | | Hypothetical | | $ | 1,000.00 | | $ | 1,016.44 | | 1.73 | % | | $ | 8.77 |
| | | | | | | | | | | | | | |
| Class C | | Actual | | $ | 1,000.00 | | $ | 991.50 | | 1.73 | % | | $ | 8.66 |
| | | Hypothetical | | $ | 1,000.00 | | $ | 1,016.44 | | 1.73 | % | | $ | 8.77 |
| | | | | | | | | | | | | | |
| Class L | | Actual | | $ | 1,000.00 | | $ | 994.60 | | 1.23 | % | | $ | 6.17 |
| | | Hypothetical | | $ | 1,000.00 | | $ | 1,018.95 | | 1.23 | % | | $ | 6.24 |
| | | | | | | | | | | | | | |
| Class M | | Actual | | $ | 1,000.00 | | $ | 992.70 | | 1.73 | % | | $ | 8.67 |
| | | Hypothetical | | $ | 1,000.00 | | $ | 1,016.44 | | 1.73 | % | | $ | 8.77 |
| | | | | | | | | | | | | | |
| Class R | | Actual | | $ | 1,000.00 | | $ | 994.60 | | 1.23 | % | | $ | 6.17 |
| | | Hypothetical | | $ | 1,000.00 | | $ | 1,018.95 | | 1.23 | % | | $ | 6.24 |
| | | | | | | | | | | | | | |
| Class X | | Actual | | $ | 1,000.00 | | $ | 995.10 | | 0.50 | % | | $ | 2.51 |
| | | Hypothetical | | $ | 1,000.00 | | $ | 1,022.62 | | 0.50 | % | | $ | 2.54 |
| | | | | | | | | | | | | | |
| Class Z | | Actual | | $ | 1,000.00 | | $ | 997.00 | | 0.73 | % | | $ | 3.66 |
| | | Hypothetical | | $ | 1,000.00 | | $ | 1,021.47 | | 0.73 | % | | $ | 3.71 |
* Fund expenses (net of fee waivers or subsidies, if any) for each share class are equal to the annualized expense ratio for each share class (provided in the table), multiplied by the average account value over the period, multiplied by the 184 days in the six-month period ended August 31, 2008, and divided by the 366 days in the Fund’s fiscal year ended August 31, 2008 (to reflect the six-month period). Expenses presented in the table include the expenses of any underlying portfolios in which the Fund may invest.
| | |
| 12 | | Visit our website at www.jennisondryden.com |
Portfolio of Investments
as of August 31, 2008
| | | | | |
| Shares | | Description | | Value (Note 1) |
| | | | | |
LONG-TERM INVESTMENTS 98.4% | | | |
COMMON STOCKS 97.7% | | | |
| |
Beverages 0.6% | | | |
| 238,848 | | Dr Pepper Snapple Group Inc.(a)(b) | | $ | 5,901,934 |
| |
Capital Markets 4.4% | | | |
| 453,762 | | The Bank of New York Mellon | | | 15,704,703 |
| 117,700 | | KKR Private Equity Investors LLP | | | 1,440,648 |
| 536,200 | | KKR Private Equity Investors LLP - RDU, Private Placement, 144A
(cost $13,370,899; purchased 5/3/06 - 5/5/06)(f)(g) | | | 6,563,088 |
| 436,800 | | Merrill Lynch & Co., Inc.(b) | | | 12,383,280 |
| 520,100 | | TD Ameritrade Holding Corp.(a) | | | 10,625,643 |
| | | | | |
| | | | | 46,717,362 |
| |
Chemicals 0.9% | | | |
| 222,700 | | E.I. du Pont de Nemours & Co. | | | 9,896,788 |
| |
Commercial Banks 1.5% | | | |
| 384,600 | | SunTrust Banks, Inc. | | | 16,110,894 |
| |
Commercial Services & Supplies 1.7% | | | |
| 508,760 | | Waste Management, Inc. | | | 17,898,177 |
| |
Communications Equipment 1.0% | | | |
| 195,900 | | QUALCOMM, Inc. | | | 10,314,135 |
| |
Computers & Peripherals 1.2% | | | |
| 497,900 | | NetApp Inc.(a)(b) | | | 12,686,492 |
| |
Consumer Finance 2.3% | | | |
| 1,462,000 | | SLM Corp.(a) | | | 24,137,620 |
| |
Diversified Consumer Services 4.2% | | | |
| 929,700 | | Career Education Corp.(a)(b) | | | 17,431,875 |
| 1,068,400 | | H&R Block, Inc. | | | 27,286,936 |
| | | | | |
| | | | | 44,718,811 |
| |
Diversified Financial Services 1.8% | | | |
| 1,005,800 | | Citigroup, Inc. | | | 19,100,142 |
| |
Electric Utilities 1.3% | | | |
| 130,500 | | Entergy Corp.(b) | | | 13,492,395 |
See Notes to Financial Statements.
Portfolio of Investments
as of August 31, 2008 continued
| | | | | |
| Shares | | Description | | Value (Note 1) |
| | | | | |
COMMON STOCKS (Continued) | | | |
| |
Energy Equipment & Services 2.8% | | | |
| 390,000 | | Halliburton Co. | | $ | 17,136,600 |
| 162,500 | | National-Oilwell Varco, Inc.(a)(b) | | | 11,981,125 |
| | | | | |
| | | | | 29,117,725 |
| |
Food & Staples Retailing 5.4% | | | |
| 437,400 | | CVS Caremark Corp.(b) | | | 16,008,840 |
| 891,200 | | Kroger Co. (The) | | | 24,614,944 |
| 275,300 | | Wal-Mart Stores, Inc.(b) | | | 16,261,971 |
| | | | | |
| | | | | 56,885,755 |
| |
Food Products 3.7% | | | |
| 380,664 | | Cadbury PLC, ADR (United Kingdom)(b) | | | 17,556,224 |
| 1,008,300 | | ConAgra Foods, Inc.(b) | | | 21,446,541 |
| | | | | |
| | | | | 39,002,765 |
| |
Healthcare Providers & Services 3.6% | | | |
| 275,700 | | Cardinal Health, Inc. | | | 15,157,986 |
| 720,100 | | Omnicare, Inc. | | | 23,223,225 |
| | | | | |
| | | | | 38,381,211 |
| |
Hotels Restaurants & Leisure 0.4% | | | |
| 284,500 | | Interval Leisure Group, Inc.(a) | | | 3,695,655 |
| |
Household Products 1.8% | | | |
| 301,000 | | Kimberly-Clark Corp. | | | 18,565,680 |
| |
Independent Power Producers & Energy Traders 1.7% | | | |
| 477,500 | | NRG Energy, Inc.(a)(b) | | | 17,973,100 |
| |
Insurance 7.4% | | | |
| 188,000 | | Allstate Corp. | | | 8,484,440 |
| 461,700 | | American International Group, Inc.(b) | | | 9,921,933 |
| 332,000 | | Axis Capital Holdings Ltd.(b) | | | 11,098,760 |
| 564,100 | | Genworth Financial, Inc. (Class A) | | | 9,053,805 |
| 345,500 | | Loews Corp. | | | 15,005,065 |
| 1,222,800 | | XL Capital Ltd. (Class A)(b) | | | 24,578,280 |
| | | | | |
| | | | | 78,142,283 |
See Notes to Financial Statements.
| | |
| 14 | | Visit our website at www.jennisondryden.com |
| | | | | |
| Shares | | Description | | Value (Note 1) |
| | | | | |
COMMON STOCKS (Continued) | | | |
| |
Internet & Catalog Retail 1.0% | | | |
| 284,500 | | HSN, Inc.(a) | | $ | 4,167,925 |
| 284,500 | | Ticket Master(a) | | | 6,096,835 |
| | | | | |
| | | | | 10,264,760 |
| |
Internet Software & Services 1.9% | | | |
| 1,217,450 | | IAC/InterActiveCorp(a)(b) | | | 20,209,670 |
| |
Media 7.0% | | | |
| 1,596,600 | | Comcast Corp. (Class A) | | | 33,815,988 |
| 847,312 | | Liberty Global, Inc. (Series C)(a)(b) | | | 28,147,705 |
| 8,695,840 | | Sirius XM Radio, Inc.(a)(b) | | | 11,565,467 |
| | | | | |
| | | | | 73,529,160 |
| |
Multi-Utilities 2.1% | | | |
| 380,200 | | Sempra Energy | | | 22,021,184 |
| |
Office Electronics 1.9% | | | |
| 1,464,500 | | Xerox Corp. | | | 20,400,485 |
| |
Oil, Gas & Consumable Fuels 12.2% | | | |
| 171,900 | | Devon Energy Corp. | | | 17,542,395 |
| 444,400 | | Nexen, Inc. | | | 13,896,388 |
| 278,100 | | Occidental Petroleum Corp. | | | 22,070,016 |
| 231,800 | | Petroleo Brasileiro SA, ADR (Brazil)(b) | | | 12,225,132 |
| 315,400 | | Suncor Energy, Inc. | | | 17,927,336 |
| 733,300 | | Talisman Energy, Inc. | | | 12,898,747 |
| 534,000 | | The Williams Cos., Inc. | | | 16,495,260 |
| 236,629 | | Trident Resources Corp., Private (Canada)
(cost $9,942,621; purchased 3/11/05 - 1/5/06)(a)(f)(g) | | | 2,228,565 |
| 282,900 | | XTO Energy, Inc. | | | 14,260,989 |
| | | | | |
| | | | | 129,544,828 |
| |
Paper & Forest Products 1.2% | | | |
| 2,291,800 | | Domtar Corp.(a) | | | 13,086,178 |
| |
Pharmaceuticals 6.9% | | | |
| 252,700 | | Abbott Laboratories(b) | | | 14,512,561 |
| 1,306,600 | | Mylan, Inc.(a)(b) | | | 16,842,074 |
| 1,088,600 | | Schering-Plough Corp. | | | 21,118,840 |
| 480,100 | | Wyeth | | | 20,778,728 |
| | | | | |
| | | | | 73,252,203 |
See Notes to Financial Statements.
Portfolio of Investments
as of August 31, 2008 continued
| | | | | |
| Shares | | Description | | Value (Note 1) |
| | | | | |
COMMON STOCKS (Continued) | | | |
| |
Semiconductors & Semiconductor Equipment 2.2% | | | |
| 1,291,400 | | Marvell Technology Group Ltd.(a) | | $ | 18,221,654 |
| 2,359,600 | | Spansion, Inc. (Class A)(a)(b) | | | 5,309,100 |
| | | | | |
| | | | | 23,530,754 |
| |
Software 6.6% | | | |
| 977,700 | | CA, Inc. | | | 23,376,807 |
| 443,100 | | Microsoft Corp. | | | 12,092,199 |
| 1,552,100 | | Symantec Corp.(a)(b) | | | 34,627,350 |
| | | | | |
| | | | | 70,096,356 |
| |
Thrifts & Mortgage Finance 2.0% | | | |
| 621,000 | | Fannie Mae(b) | | | 4,247,640 |
| 926,340 | | People’s United Financial, Inc. | | | 16,600,013 |
| 47,416 | | Tree.com, Inc.(a) | | | 360,361 |
| | | | | |
| | | | | 21,208,014 |
| |
Tobacco 0.4% | | | |
| 181,440 | | Altria Group, Inc.(b) | | | 3,815,683 |
| |
Wireless Telecommunication Services 4.6% | | | |
| 557,400 | | NII Holdings, Inc.(a)(b) | | | 29,274,648 |
| 1,703,025 | | Sprint Nextel Corp. | | | 14,850,378 |
| 1,508,900 | | Virgin Mobile USA, Inc.(a)(b) | | | 3,968,407 |
| | | | | |
| | | | | 48,093,433 |
| | | | | |
| | TOTAL COMMON STOCKS
(cost $1,021,184,865) | | | 1,031,791,632 |
| | | | | |
| |
Principal
Amount (000)# | | |
CORPORATE BOND 0.7% | | | |
| |
Oil, Gas & Consumable Fuels 0.7% | | | |
| CAD 8,166 | | Trident Resources Corp., Note, Private, (Canada) PIK, 9.97%, 08/12/12
(cost $7,789,454; purchased 8/20/07)(f)(g) | | | 6,990,650 |
| | | | | |
See Notes to Financial Statements.
| | |
| 16 | | Visit our website at www.jennisondryden.com |
| | | | | | |
| Units | | Description | | Value (Note 1) | |
| | | | | | |
WARRANT | | | | | | |
| |
Oil, Gas & Consumable Fuels | | | | |
| 720,366 | | Trident Resources Corp., Private, (Canada) expiring 1/01/15
(cost $0; purchased 8/20/07)(a)(f)(g) | | $ | 68 | |
| | | | | | |
| | TOTAL LONG-TERM INVESTMENTS
(cost $1,028,974,319) | | | 1,038,782,350 | |
| | | | | | |
| |
| Shares | | | |
SHORT-TERM INVESTMENT 25.5% | | | | |
| |
AFFILIATED MONEY MARKET MUTUAL FUND | | | | |
| 269,253,793 | | Dryden Core Investment Fund - Taxable Money Market Series
(cost $269,253,793; includes $252,103,110 of cash collateral received for securities on loan) (Note 3)(c)(d) | | | 269,253,793 | |
| | | | | | |
| | TOTAL INVESTMENTS(e) 123.9%
(cost $1,298,228,112; Note 5) | | | 1,308,036,143 | |
| | Liabilities in excess of other assets (23.9%) | | | (252,232,313 | ) |
| | | | | | |
| | NET ASSETS 100.0% | | $ | 1,055,803,830 | |
| | | | | | |
The following abbreviations are used in portfolio descriptions:
144A—Securities were purchased pursuant to Rule 144A under the Securities Act of 1933 and may not be resold subject to that rule except to qualified institutional buyers. Unless otherwise noted, 144A securities are deemed to be liquid.
ADR—American Depositary Receipt
CAD—Canadian Dollar
PIK—Payment in Kind
RDU—Restricted Depositary Unit
| # | Principal amount is shown in U.S. dollars unless otherwise stated. |
| (a) | Non-income producing security. |
| (b) | All or a portion of security is on loan. The aggregate market value of such securities is $232,451,335; cash collateral of $252,103,110 (included in liabilities) was received with which the Fund purchased highly liquid short-term investments. |
| (c) | Represents security, or portion thereof, purchased with cash collateral received for securities on loan. |
| (d) | Prudential Investments LLC, the Manager of the Fund, also serves as Manager of the Dryden Core Investment Fund—Taxable Money Market Series. |
| (e) | As of August 31, 2008, four securities valued at $15,782,371 and representing 1.5% of net assets were fair valued in accordance with the policies adopted by the Board of Trustees. |
| (f) | Indicates an illiquid security. |
| (g) | Indicates a security restricted to resale. The aggregate cost of such a security is $31,102,974. The aggregate value of $15,782,371 is approximately 1.5% of net assets. |
See Notes to Financial Statements.
Portfolio of Investments
as of August 31, 2008 continued
The industry classification of portfolio holdings and liabilities in excess of other assets shown as a percentage of net assets as of August 31, 2008 were as follows:
| | | |
Affiliated Money Market Mutual Fund (including 23.9% of collateral received for securities on loan) | | 25.5 | % |
Oil, Gas & Consumable Fuels | | 12.9 | |
Insurance | | 7.4 | |
Media | | 7.0 | |
Pharmaceuticals | | 6.9 | |
Software | | 6.6 | |
Food & Staples Retailing | | 5.4 | |
Wireless Telecommunication Services | | 4.6 | |
Capital Markets | | 4.4 | |
Diversified Consumer Services | | 4.2 | |
Food Products | | 3.7 | |
Healthcare Providers & Services | | 3.6 | |
Energy Equipment & Services | | 2.8 | |
Consumer Finance | | 2.3 | |
Semiconductors & Semiconductor Equipment | | 2.2 | |
Multi-Utilities | | 2.1 | |
Thrifts & Mortgage Finance | | 2.0 | |
Internet Software & Services | | 1.9 | |
Office Electronics | | 1.9 | |
Diversified Financial Services | | 1.8 | |
Household Products | | 1.8 | |
Commercial Services & Supplies | | 1.7 | |
Independent Power Producers & Energy Traders | | 1.7 | |
Commercial Banks | | 1.5 | |
Electric Utilities | | 1.3 | |
Computers & Peripherals | | 1.2 | |
Paper & Forest Products | | 1.2 | |
Communications Equipment | | 1.0 | |
Internet & Catalog Retail | | 1.0 | |
Chemicals | | 0.9 | |
Beverages | | 0.6 | |
Hotels Restaurants & Leisure | | 0.4 | |
Tobacco | | 0.4 | |
| | | |
| | 123.9 | |
Liabilities in excess of other assets | | (23.9 | ) |
| | | |
| | 100.0 | % |
| | | |
See Notes to Financial Statements.
| | |
| 18 | | Visit our website at www.jennisondryden.com |
Financial Statements
| | |
| AUGUST 31, 2008 | | ANNUAL REPORT |
Jennison Value Fund
Statement of Assets and Liabilities
as of August 31, 2008
| | | |
Assets | | | |
Investments at value, including securities on loan of $232,451,335: | | | |
Unaffiliated Investments (cost $1,028,974,319) | | $ | 1,038,782,350 |
Affiliated Investments (cost $269,253,793) | | | 269,253,793 |
Cash | | | 183,311 |
Foreign currency, at value (cost $6) | | | 6 |
Dividends and interest receivable | | | 1,631,559 |
Receivable for Fund shares sold | | | 524,435 |
Foreign tax reclaim receivable | | | 183,774 |
Prepaid expenses | | | 318 |
| | | |
Total assets | | | 1,310,559,546 |
| | | |
| |
Liabilities | | | |
Payable to broker for collateral for securities on loan | | | 252,103,110 |
Payable for Fund shares reacquired | | | 1,390,208 |
Management fee payable | | | 450,448 |
Distribution fee payable | | | 311,575 |
Accrued expenses | | | 288,615 |
Transfer agent fee payable | | | 170,889 |
Payable to shareholders | | | 31,743 |
Deferred trustees’ fees | | | 9,128 |
| | | |
Total liabilities | | | 254,755,716 |
| | | |
| |
Net Assets | | $ | 1,055,803,830 |
| | | |
| | | | |
Net assets were comprised of: | | | |
Shares of beneficial interest, at par | | $ | 638,942 |
Paid-in capital in excess of par | | | 999,958,255 |
| | | |
| | | 1,000,597,197 |
Undistributed net investment income | | | 5,741,188 |
Accumulated net realized gain on investment and foreign currency transactions | | | 39,654,184 |
Net unrealized appreciation on investments and foreign currencies | | | 9,811,261 |
| | | |
Net assets, August 31, 2008 | | $ | 1,055,803,830 |
| | | |
See Notes to Financial Statements.
| | |
| 20 | | Visit our website at www.jennisondryden.com |
| | | |
Class A | | | |
Net asset value and redemption price per share
($819,162,489 ÷ 49,499,303 shares of beneficial interest issued and outstanding) | | $ | 16.55 |
Maximum sales charge (5.50% of offering price) | | | .96 |
| | | |
Maximum offering price to public | | $ | 17.51 |
| | | |
| |
Class B | | | |
Net asset value, offering price and redemption price per share
($65,519,506 ÷ 4,023,604 shares of beneficial interest issued and outstanding) | | $ | 16.28 |
| | | |
| |
Class C | | | |
Net asset value, offering price and redemption price per share
($45,881,856 ÷ 2,817,320 shares of beneficial interest issued and outstanding) | | $ | 16.29 |
| | | |
| |
Class L | | | |
Net asset value, offering price and redemption price per share
($2,896,318 ÷ 175,754 shares of beneficial interest issued and outstanding) | | $ | 16.48 |
| | | |
| |
Class M | | | |
Net asset value, offering price and redemption price per share
($5,897,528 ÷ 361,887 shares of beneficial interest issued and outstanding) | | $ | 16.30 |
| | | |
| |
Class R | | | |
Net asset value, offering price and redemption price per share
($4,795,768 ÷ 290,903 shares of beneficial interest issued and outstanding) | | $ | 16.49 |
| | | |
| |
Class X | | | |
Net asset value, offering price and redemption price per share
($2,116,996 ÷ 129,351 shares of beneficial interest issued and outstanding) | | $ | 16.37 |
| | | |
| |
Class Z | | | |
Net asset value, offering price and redemption price per share
($109,533,369 ÷ 6,596,073 shares of beneficial interest issued and outstanding) | | $ | 16.61 |
| | | |
See Notes to Financial Statements.
Statement of Operations
Year Ended August 31, 2008
| | | | |
Net Investment Income | | | | |
Income | | | | |
Unaffiliated dividends (net of foreign withholding taxes of $121,544) | | $ | 18,943,493 | |
Affiliated income from securities loaned, net | | | 1,112,169 | |
Unaffiliated interest income | | | 884,873 | |
Affiliated dividend income | | | 633,700 | |
| | | | |
Total income | | | 21,574,235 | |
| | | | |
| |
Expenses | | | | |
Management fee | | | 6,346,469 | |
Distribution fee—Class A | | | 2,490,100 | |
Distribution fee—Class B | | | 872,759 | |
Distribution fee—Class C | | | 555,264 | |
Distribution fee—Class L | | | 20,506 | |
Distribution fee—Class M | | | 99,678 | |
Distribution fee—Class R | | | 17,784 | |
Distribution fee—Class X | | | 8,489 | |
Transfer agent’s fees and expenses (including affiliated expense of $832,000) (Note 3) | | | 1,644,000 | |
Registration fees | | | 167,000 | |
Custodian’s fees and expenses | | | 134,000 | |
Reports to shareholders | | | 120,000 | |
Trustees’ fees | | | 39,000 | |
Insurance | | | 27,000 | |
Legal fees and expenses | | | 27,000 | |
Interest expense | | | 24,461 | |
Audit fee | | | 21,000 | |
Loan interest expense (Note 8) | | | 2,106 | |
Miscellaneous | | | 18,810 | |
| | | | |
Total expenses | | | 12,635,426 | |
| | | | |
Net investment income | | | 8,938,809 | |
| | | | |
| |
Realized And Unrealized Gain (Loss) On Investment And Foreign Currency Transactions | | | | |
Net realized gain on: | | | | |
Investment transactions | | | 57,634,557 | |
Foreign currency transactions | | | 7,328 | |
| | | | |
| | | 57,641,885 | |
| | | | |
Net change in unrealized appreciation (depreciation) on: | | | | |
Investments | | | (190,702,791 | ) |
Foreign currencies | | | (5,366 | ) |
| | | | |
| | | (190,708,157 | ) |
| | | | |
Net loss on investment and foreign currency transactions | | | (133,066,272 | ) |
| | | | |
Net Decrease In Net Assets Resulting From Operations | | $ | (124,127,463 | ) |
| | | | |
See Notes to Financial Statements.
| | |
| 22 | | Visit our website at www.jennisondryden.com |
Statement of Changes in Net Assets
| | | | | | | | | | | | |
| | | Year Ended
August 31,
2008 | | | Ten Months
Ended
August 31,
2007 | | | Year Ended
October 31,
2006 | |
Increase (Decrease) In Net Assets | | | | | | | | | | | | |
Operations | | | | | | | | | | | | |
Net investment income | | $ | 8,938,809 | | | $ | 8,941,886 | | | $ | 10,437,490 | |
Net realized gain on investment and foreign currency transactions | | | 57,641,885 | | | | 172,850,967 | | | | 118,734,873 | |
Net change in unrealized appreciation (depreciation) on investments and foreign currencies | | | (190,708,157 | ) | | | (72,511,058 | ) | | | 61,050,342 | |
| | | | | | | | | | | | |
Net increase (decrease) in net assets resulting from operations | | | (124,127,463 | ) | | | 109,281,795 | | | | 190,222,705 | |
| | | | | | | | | | | | |
Dividends and distributions (Note 1) | | | | | | | | | | | | |
Dividends from net investment income: | | | | | | | | | | | | |
Class A | | | (9,073,325 | ) | | | (8,164,199 | ) | | | (5,369,140 | ) |
Class B | | | (292,113 | ) | | | (147,136 | ) | | | — | |
Class C | | | (178,854 | ) | | | (45,182 | ) | | | — | |
Class L | | | (36,658 | ) | | | — | | | | — | |
Class M | | | (35,867 | ) | | | — | | | | — | |
Class R | | | (18,636 | ) | | | (393 | ) | | | (12 | ) |
Class X | | | (25,623 | ) | | | (15,820 | ) | | | — | |
Class Z | | | (1,205,555 | ) | | | (1,038,985 | ) | | | (420,806 | ) |
| | | | | | | | | | | | |
| | | (10,866,631 | ) | | | (9,411,715 | ) | | | (5,789,958 | ) |
| | | | | | | | | | | | |
Distributions from net realized gains: | | | | | | | | | | | | |
Class A | | | (145,035,070 | ) | | | (95,071,115 | ) | | | (35,966,579 | ) |
Class B | | | (15,566,446 | ) | | | (10,773,756 | ) | | | (5,595,023 | ) |
Class C | | | (9,531,318 | ) | | | (3,308,355 | ) | | | (971,592 | ) |
Class L | | | (732,602 | ) | | | — | | | | — | |
Class M | | | (1,911,149 | ) | | | — | | | | — | |
Class R | | | (372,374 | ) | | | (7,650 | ) | | | (128 | ) |
Class X | | | (516,833 | ) | | | — | | | | — | |
Class Z | | | (15,416,633 | ) | | | (9,486,716 | ) | | | (2,054,591 | ) |
| | | | | | | | | | | | |
| | | (189,082,425 | ) | | | (118,647,592 | ) | | | (44,587,913 | ) |
| | | | | | | | | | | | |
Capital Contributions | | | 5,731 | | | | 3,442 | | | | — | |
| | | | | | | | | | | | |
| | | |
Fund share transactions (Net of share conversions) (Note 6) | | | | | | | | | | | | |
Net proceeds from shares sold | | | 135,802,668 | | | | 129,130,638 | | | | 213,569,167 | |
Net asset value of shares issued in connection with merger (Note 7) | | | — | | | | 127,217,340 | | | | — | |
Net asset value of shares issued in reinvestment of dividends and distributions | | | 188,802,367 | | | | 120,759,467 | | | | 47,372,650 | |
Cost of shares reacquired | | | (262,686,914 | ) | | | (217,035,433 | ) | | | (177,217,214 | ) |
| | | | | | | | | | | | |
Net increase in net assets from Fund share transactions | | | 61,918,121 | | | | 160,072,012 | | | | 83,724,603 | |
| | | | | | | | | | | | |
Total increase (decrease) | | | (262,152,667 | ) | | | 141,297,942 | | | | 223,569,437 | |
| | | |
Net Assets | | | | | | | | | | | | |
Beginning of period | | | 1,317,956,497 | | | | 1,176,658,555 | | | | 953,089,118 | |
| | | | | | | | | | | | |
End of period(a) | | $ | 1,055,803,830 | | | $ | 1,317,956,497 | | | $ | 1,176,658,555 | |
| | | | | | | | | | | | |
(a) Includes undistributed net investment income of: | | $ | 5,741,188 | | | $ | 7,731,882 | | | $ | 8,195,035 | |
| | | | | | | | | | | | |
See Notes to Financial Statements.
Notes to Financial Statements
JennisonDryden Portfolios, Inc.—Jennison Value Fund (the “Fund”) is registered under the Investment Company Act of 1940 as a diversified, open-end, management investment company. The investment objective of the Fund is capital appreciation. It seeks to achieve this objective by investing primarily in common stocks and convertible securities that provide investment income returns above those of the Standard & Poor’s 500 Composite Stock Price Index or the NYSE Composite Index.
The Fund’s fiscal year has changed from an annual reporting period that ends October 31 to one that ends August 31, effective August 31, 2007. This change should have no impact on the way the Fund is managed. Shareholders will receive future annual and semi-annual reports on the new fiscal year-end schedule.
Note 1. Accounting Policies
The following is a summary of significant accounting policies followed by the Fund in the preparation of its financial statements.
Securities Valuation: Securities listed on a securities exchange are valued at the last sale price on such exchange on the day of valuation or, if there was no sale on such day, at the mean between the last reported bid and asked prices, or at the last bid price on such day in the absence of an asked price. Securities traded via Nasdaq are valued at the official closing price provided by Nasdaq. Securities that are actively traded in the over-the-counter market, including listed securities for which the primary market is believed by Prudential Investments LLC (“PI” or “Manager”), in consultation with the subadviser; to be over-the-counter, are valued at market value using prices provided by an independent pricing agent or principal market maker. Futures contracts and options thereon traded on a commodities exchange or board of trade are valued at the last sale price at the close of trading on such exchange or board of trade or, if there was no sale on the applicable commodities exchange or board of trade on such day, at the mean between the most recently quoted prices on such exchange or board of trade or at the last bid price in the absence of an asked price. Prices may be obtained from independent pricing services which use information provided by market makers or estimates of market values obtained from yield data relating to investments or securities with similar characteristics. Securities for which reliable market quotations are not readily available, or whose values have been affected by events occurring after the close of the security’s foreign market and before the Series’ normal pricing time, are valued at fair value in accordance with the
| | |
| 24 | | Visit our website at www.jennisondryden.com |
Board of Trustees’ approved fair valuation procedures. When determining the fair valuation of securities some of the factors influencing the valuation include, the nature of any restrictions on disposition of the securities; assessment of the general liquidity of the securities; the issuer’s financial condition and the markets in which it does business; the cost of the investment; the size of the holding and the capitalization of issuer; the prices of any recent transactions or bids/offers for such securities or any comparable securities; any available analyst media or other reports or information deemed reliable by the investment adviser regarding the issuer or the markets or industry in which it operates. Using fair value to price securities may result in a value that is different from a security’s most recent closing price and from the price used by other mutual funds to calculate their net asset values. As of August 31, 2008, there were no securities whose values were impacted by events occurring after the close of the security’s foreign market.
Investments in mutual funds are valued at their net asset value as of the close of the New York Stock Exchange on the date of valuation.
Short-term debt securities which mature in 60 days or less are valued at amortized cost, which approximates market-value. The amortized cost method includes valuing a security at its cost on the date of purchase and thereafter assuming a constant amortization to maturity of the difference between the principal amount due at maturity and cost. Short-term debt securities which mature in more than 60 days are valued at current market quotations.
Foreign Currency Translation: The books and records of the Fund are maintained in U.S. dollars. Foreign currency amounts are translated into U.S. dollars on the following basis:
(i) market value of investment securities, other assets and liabilities-at the current rates of exchange;
(ii) purchases and sales of investment securities, income and expenses-at the rates of exchange prevailing on the respective dates of such transactions.
The Fund does not isolate that portion of the results of operations arising as a result of changes in the foreign exchange rates from the fluctuations arising from changes in the market prices of long term securities held at the end of the fiscal year. Similarly, the Fund does not isolate the effect of changes in foreign exchange rates from the fluctuations arising from changes in the market prices of portfolio securities sold during the fiscal year. Accordingly, realized foreign currency gains or losses are included in the reported net realized gains or losses on investment transactions. Net realized gains or losses on foreign currency transactions represent net foreign
Notes to Financial Statements
continued
exchange gains or losses from the holding of foreign currencies, currency gains or losses realized between the trade and settlement dates on security transactions, and the difference between the amounts of dividends, interest and foreign withholding taxes recorded on the Fund’s books and the U.S. dollar equivalent amounts actually received or paid. Net unrealized currency gains or losses from valuing foreign currency denominated assets and liabilities (other than investments) at period end exchange rates are reflected as a component of net unrealized appreciation (depreciation) on foreign currencies.
Foreign security and currency transactions may involve certain considerations and risks not typically associated with those of domestic origin as a result of, among other factors, the possibility of political or economic instability or the level of governmental supervision and regulation of foreign securities markets.
Restricted Securities: The Fund may hold up to 15% of its net assets in illiquid securities, including those which are restricted as to disposition under securities law (“restricted securities”). Restricted securities held by the Fund at the end of the fiscal period may include registration rights under which the Fund may demand registration by the issuers, of which the Fund may bear the cost of such registration. Restricted securities are valued pursuant to the valuation procedures noted above.
Securities Transactions and Net Investment Income: Securities transactions are recorded on the trade date. Realized gains or losses from investment and currency transactions are calculated on the identified cost basis. Dividend income is recorded on the ex-dividend date and interest income, including amortization of premium and accretion of discount on debt securities, as required, is recorded on the accrual basis. Expenses are recorded on an accrual basis.
Net investment income or loss, (other than distribution fees, which are charged directly to the respective class) and unrealized and realized gains or losses are allocated daily to each class of shares based upon the relative proportion of net assets of each class at the beginning of the day.
Taxes: For federal income tax purposes, it is the Fund’s policy to continue to meet the requirements under the Internal Revenue Code applicable to regulated investment companies and to distribute all of its taxable net income and capital gains, if any, to shareholders. Therefore, no federal income tax provision is required.
| | |
| 26 | | Visit our website at www.jennisondryden.com |
Withholding taxes on foreign dividends are recorded net of reclaimable amounts, at the time the related income is earned.
Dividends and Distributions: The Fund expects to pay dividends from net investment income and distributions from net realized capital and currency gains, if any, annually. Dividends and distributions to shareholders, which are determined in accordance with federal income tax regulations and which may differ from generally accepted accounting principles, are recorded on the ex-dividend date.
Securities Lending: The Fund may lend its portfolio securities to broker-dealers. The loans are secured by collateral at least equal, at all times, to the market value of the securities loaned.
Loans are subject to termination at the option of the borrower or the Fund. Upon termination of the loan, the borrower will return to the Fund securities identical to the loaned securities. Should the borrower of the securities fail financially, the Fund has the right to repurchase the securities using the collateral in the open market. The Fund recognizes income, net of any rebate and securities lending agent fees, for lending its securities in the form of fees or interest on the investment of any cash received as collateral. The Fund also continues to receive interest and dividends or amounts equivalent thereto, on the securities loaned and recognizes any unrealized gain or loss in the market price of the securities loaned that may occur during the term of the loan.
Estimates: The preparation of the financial statements requires management to make estimates and assumptions that affect the reported amounts and disclosures in the financial statements. Actual results could differ from those estimates.
Note 2. Agreements
The Fund has a management agreement with PI. Pursuant to this agreement, PI has responsibility for all investment advisory services and supervises the subadvisors’ performance of such services. PI has entered into a subadvisory agreement with Jennison Associates LLC (“Jennison”). The subadvisory agreement provides that Jennison furnishes investment advisory services in connection with the management of the Fund. In connection therewith, Jennison assumes the day-to-day management responsibilities of the Fund and is obligated to keep certain books and records of the Fund. PI pays for the services of Jennison, the cost of compensation of officers and employees of the Fund, occupancy and certain clerical and bookkeeping costs of the Fund. The Fund bears all other costs and expenses.
Notes to Financial Statements
continued
The management fee paid to PI is computed daily and payable monthly at an annual rate of .60 of 1% of the Fund’s average daily net assets up to $500 million, .50 of 1% of the next $500 million, .475 of 1% of the next $500 million and .45 of 1% of the average daily net assets in excess of $1.5 billion. The effective management fee rate was .54 of 1% of the Fund’s average daily net assets for the year ended August 31, 2008.
The Fund has a distribution agreement with Prudential Investment Management Services LLC (“PIMS”), which acts as the distributor of the Class A, Class B, Class C, Class L, Class M, Class R, Class X and Class Z shares. The Fund compensates PIMS for distributing and servicing the Fund’s Class A, Class B, Class C, Class L, Class M, Class R and Class X shares, pursuant to plans of distribution (the “Class A, B, C, L, M, R and X Plans”), regardless of expenses actually incurred. The distribution fees are accrued daily and payable monthly. No distribution or service fees are paid to PIMS as distributor of the Class Z shares of the Fund. Pursuant to the Class A, B, C, L, M, R and X Plans, the Fund compensates PIMS for distribution related activities at an annual rate of up to .30 of 1%, 1%, 1%, .50 of 1%, 1%, .75 of 1% and 1% of the average daily net assets of the Class A, B, C, L, M, R and X shares, respectively. For the period through February 29, 2008, PIMS had contractually agreed to limit such fees to .25 of 1% of the average daily net assets of the Class A shares. However, effective March 1, 2008 such waiver has been terminated. The effective distribution fee rate for Class A was .27 of 1% for the year ended August 31, 2008. Class R fees continue to be limited to .50 of 1% of the average daily net assets to December 31, 2009. Subsequent to year end, management determined that Class X shareholders had been charged sales charges in excess of regulatory limits. The manager has agreed to pay for the over charge. This amount is reflected as a reduction to current distribution expense and a contribution to capital. The impact of this matter for the ten months ended August 31, 2007 has been reflected in the Statement of Changes in Net Assets and in the Financial Highlights.
PIMS has advised the Fund that it has received approximately $271,500 in front-end sales charges resulting from sales of Class A shares, during the year ended August 31, 2008. From these fees, PIMS paid such sales charges to affiliated broker-dealers, which in turn paid commissions to salespersons and incurred other distribution costs.
PIMS has advised the Fund that for the year ended August 31, 2008, it received approximately $100, $110,700, $10,300, $21,600 and $3,300 in contingent deferred sales charges imposed upon certain redemptions by Class A, Class B, Class C, Class M and Class X shareholders, respectively.
| | |
| 28 | | Visit our website at www.jennisondryden.com |
PI, PIMS and Jennison are indirect, wholly-owned subsidiaries of Prudential Financial, Inc. (“Prudential”).
Note 3. Other Transactions with Affiliates
Prudential Mutual Fund Services LLC (“PMFS”), an affiliate of PI and an indirect, wholly-owned subsidiary of Prudential, serves as the Fund’s transfer agent. Transfer agent fees and expenses in the Statement of Operations include certain out-of-pocket expenses paid to non-affiliates, where applicable.
The Fund pays networking fees to affiliated and unaffiliated broker/dealers including fees relating to the services of Wachovia Securities, LLC (“Wachovia”) and First Clearing, LLC (“First Clearing”), affiliates of PI. These networking fees are payments made to broker/dealers that clear mutual fund transactions through a national clearing system. For the year ended August 31, 2008, the Fund incurred approximately $368,600 in total networking fees, of which approximately $160,300 and $400 were paid to First Clearing and Wachovia, respectively. These amounts are included in transfer agent’s fees and expenses in the Statement of Operations.
Prudential Investment Management, Inc. (“PIM”), an indirect, wholly-owned subsidiary of Prudential, is the Fund’s security lending agent. For the year ended August 31, 2008 PIM has been compensated approximately $476,600 for these services.
The Fund invests in the Taxable Money Market Series (the “Series”), a portfolio of Dryden Core Investment Fund, pursuant to an exemptive order received from the Securities and Exchange Commission. The Series is a money market mutual fund registered under the Investment Company Act of 1940, as amended, and managed by PI.
Note 4. Portfolio Securities
Purchases and sales of investment securities, other than short-term investments, for the year ended August 31, 2008 were $591,718,410 and $734,467,186, respectively.
Note 5. Distributions and Tax Information
Distributions to shareholders, which are determined in accordance with federal income tax regulations and which may differ from generally accepted accounting principles, are recorded on the ex-dividends date. In order to present undistributed
Notes to Financial Statements
continued
net investment income, accumulated net realized gain on investment and foreign currency transactions and paid-in capital in excess of par on the Statement of Assets and Liabilities that more closely represent their tax character, certain adjustments have been made to undistributed net investment income and accumulated net realized gain on investment and foreign currency transactions. For the year ended August 31, 2008, the adjustments were to decrease undistributed net investment income by $62,872, increase accumulated net realized gain on investment and foreign currency transactions by $65,682 and increase paid-in capital in excess of par by $4,004 due to the reclassification of net foreign currency losses and other book to tax adjustments. Net investment income, net realized gain on investment and foreign currency transactions and net assets were not affected by this change.
For the year ended August 31, 2008, the tax character of dividends and distributions paid by the fund were $55,030,114 from ordinary income and $144,903,019 from long-term capital gains. For the ten-months ended August 31, 2007, the tax character of distributions paid by the Fund were $28,870,957 from ordinary income and $99,172,530 from long-term capital gains.
As of August 31, 2008, the accumulated undistributed earnings on tax basis consisted of $5,695,510 from ordinary income and $58,998,436 from long-term capital gains.
The United States federal income tax basis of the Fund’s investments and the net unrealized depreciation as of August 31, 2008 were as follows:
| | | | | | | | | | |
Tax Basis | | Appreciation | | Depreciation | | Net
Unrealized
Depreciation | | Other Cost
Basis
Adjustments | | Total Net
Unrealized
Depreciation |
| $1,317,366,762 | | $152,944,753 | | $(162,275,372) | | $(9,330,619) | | $(27) | | $(9,330,646) |
The difference between book basis and tax basis is primarily attributable to the difference in the treatment of losses on wash sales and investments in partnerships. Other cost basis adjustments are attributable to mark-to-market of unrealized appreciation of foreign currencies.
The Fund elected to treat post-October currency losses of approximately $161,000 as having been incurred in the following fiscal year (August 31, 2009).
| | |
| 30 | | Visit our website at www.jennisondryden.com |
Management has analyzed the Fund’s tax positions taken on federal income tax returns for all open tax years and has concluded that as of August 31, 2008, no provision for income tax would be required in the Fund’s financial statements. The Fund’s federal and state income and federal excise tax returns for tax years for which the applicable statutes of limitations have not expired are subject to examination by the Internal Revenue Service and state departments of revenue.
Note 6. Capital
The Fund offers Class A, Class B, Class C, Class L, Class M, Class R, Class X and Class Z shares. Class A and Class L shares are sold with a front-end sales charge of up to 5.50% and 5.75%, respectively. All investors who purchase Class A or Class L shares in an amount of $1 million or more and sell these shares within 12 months of purchase are subject to a contingent deferred sales charge (CDSC) of 1%, including investors who purchase their shares through broker-dealers affiliated with Prudential. Class B shares are sold with a contingent deferred sales charge which declines from 5% to zero depending on the period of time the shares are held. Class C shares are sold with a contingent deferred sales charge of 1% during the first 12 months. Class M and Class X shares are sold with a contingent deferred sales charge which declines from 6% to zero depending on the period of time the shares are held. Class B shares automatically convert to Class A shares on a quarterly basis approximately seven years after purchase. Class M shares automatically convert to Class A shares approximately eight years after purchase. Class X shares automatically convert to Class A shares on a quarterly basis approximately ten years (eight years in the case of shares purchased prior to August 19, 1998) after purchase. A special exchange privilege is also available for shareholders who qualified to purchase Class A shares at net asset value. Class L shares are closed to most new purchases (with the exception of reinvested dividends). Class L and Class M shares are only exchangeable with Class L and Class M shares, respectively, offered by certain other Strategic Partners Funds. Class X shares are closed to new purchases. Class R and Class Z shares are not subject to any sales or redemption charge and are available exclusively for sale to a limited group of investors.
The Fund has authorized an unlimited number of shares of beneficial interest at $.01 par value divided into eight classes, designated Class A, Class B, Class C, Class L, Class M, Class R, Class X and Class Z.
Notes to Financial Statements
continued
Transactions in shares of beneficial interest were as follows:
| | | | | | | |
Class A | | Shares | | | Amount | |
Year ended August 31, 2008: | | | | | | | |
Shares sold | | 3,753,928 | | | $ | 67,911,482 | |
Shares issued in reinvestment of dividends and distributions | | 7,997,153 | | | | 145,467,708 | |
Shares reacquired | | (9,964,961 | ) | | | (180,103,805 | ) |
| | | | | | | |
Net increase (decrease) in shares outstanding before conversion | | 1,786,120 | | | | 33,275,385 | |
Shares issued upon conversion from Class B, Class M, and Class X | | 1,406,404 | | | | 25,377,914 | |
| | | | | | | |
Net increase (decrease) in shares outstanding | | 3,192,524 | | | $ | 58,653,299 | |
| | | | | | | |
Ten-month period ended August 31, 2007: | | | | | | | |
Shares sold | | 3,332,640 | | | $ | 72,760,145 | |
Shares issued in connection with the merger | | 2,232,067 | | | | 46,198,226 | |
Shares issued in reinvestment of dividends and distributions | | 4,759,755 | | | | 97,051,409 | |
Shares reacquired | | (7,031,586 | ) | | | (154,093,876 | ) |
| | | | | | | |
Net increase (decrease) in shares outstanding before conversion | | 3,292,876 | | | | 61,915,904 | |
Shares issued upon conversion from Class B, Class M and Class X | | 935,606 | | | | 20,149,514 | |
| | | | | | | |
Net increase (decrease) in shares outstanding | | 4,228,482 | | | $ | 82,065,418 | |
| | | | | | | |
Year ended October 31, 2006: | | | | | | | |
Shares sold | | 6,622,418 | | | $ | 139,018,128 | |
Shares issued in reinvestment of dividends and distributions | | 1,959,077 | | | | 38,613,402 | |
Shares reacquired | | (6,950,376 | ) | | | (145,837,152 | ) |
| | | | | | | |
Net increase (decrease) in shares outstanding before conversion | | 1,631,119 | | | | 31,794,378 | |
Shares issued upon conversion from Class B | | 1,414,535 | | | | 29,084,598 | |
| | | | | | | |
Net increase (decrease) in shares outstanding | | 3,045,654 | | | $ | 60,878,976 | |
| | | | | | | |
Class B | | | | | | |
Year ended August 31, 2008: | | | | | | | |
Shares sold | | 262,016 | | | $ | 4,741,609 | |
Shares issued in reinvestment of dividends and distributions | | 851,426 | | | | 15,317,191 | |
Shares reacquired | | (1,069,626 | ) | | | (19,143,157 | ) |
| | | | | | | |
Net increase (decrease) in shares outstanding before conversion | | 43,816 | | | | 915,643 | |
Shares reacquired upon conversion into Class A | | (1,229,818 | ) | | | (21,823,805 | ) |
| | | | | | | |
Net increase (decrease) in shares outstanding | | (1,186,002 | ) | | $ | (20,908,162 | ) |
| | | | | | | |
| | |
| 32 | | Visit our website at www.jennisondryden.com |
| | | | | | | |
Class B | | Shares | | | Amount | |
Ten-month period ended August 31, 2007: | | | | | | | |
Shares sold | | 414,740 | | | $ | 8,955,241 | |
Shares issued in connection with the merger | | 1,047,992 | | | | 21,471,958 | |
Shares issued in reinvestment of dividends and distributions | | 519,027 | | | | 10,499,923 | |
Shares reacquired | | (682,047 | ) | | | (14,796,064 | ) |
| | | | | | | |
Net increase (decrease) in shares outstanding before conversion | | 1,299,712 | | | | 26,131,058 | |
Shares reacquired upon conversion into Class A | | (860,546 | ) | | | (18,277,134 | ) |
| | | | | | | |
Net increase (decrease) in shares outstanding | | 439,166 | | | $ | 7,853,924 | |
| | | | | | | |
Year ended October 31, 2006: | | | | | | | |
Shares sold | | 597,144 | | | $ | 12,499,038 | |
Shares issued in reinvestment of dividends and distributions | | 274,279 | | | | 5,367,640 | |
Shares reacquired | | (776,972 | ) | | | (16,100,691 | ) |
| | | | | | | |
Net increase (decrease) in shares outstanding before conversion | | 94,451 | | | | 1,765,987 | |
Shares reacquired upon conversion into Class A | | (1,427,998 | ) | | | (29,084,598 | ) |
| | | | | | | |
Net increase (decrease) in shares outstanding | | (1,333,547 | ) | | $ | (27,318,611 | ) |
| | | | | | | |
Class C | | | | | | |
Year ended August 31, 2008: | | | | | | | |
Shares sold | | 437,995 | | | $ | 8,285,181 | |
Shares issued in reinvestment of dividends and distributions | | 470,674 | | | | 8,472,370 | |
Shares reacquired | | (1,098,765 | ) | | | (19,562,879 | ) |
| | | | | | | |
Net increase (decrease) in shares outstanding | | (190,096 | ) | | $ | (2,805,328 | ) |
| | | | | | | |
Ten-month period ended August 31, 2007: | | | | | | | |
Shares sold | | 408,595 | | | $ | 8,780,853 | |
Shares issued in connection with the merger | | 1,514,551 | | | | 31,036,065 | |
Shares issued in reinvestment of dividends and distributions | | 146,223 | | | | 2,958,100 | |
Shares reacquired | | (512,780 | ) | | | (11,178,671 | ) |
| | | | | | | |
Net increase (decrease) in shares outstanding | | 1,556,589 | | | $ | 31,596,347 | |
| | | | | | | |
Year ended October 31, 2006: | | | | | | | |
Shares sold | | 640,946 | | | $ | 13,451,472 | |
Shares issued in reinvestment of dividends and distributions | | 47,187 | | | | 923,919 | |
Shares reacquired | | (289,618 | ) | | | (6,006,912 | ) |
| | | | | | | |
Net increase (decrease) in shares outstanding | | 398,515 | | | $ | 8,368,479 | |
| | | | | | | |
Class L | | | | | | |
Year ended August 31, 2008: | | | | | | | |
Shares sold | | 1,862 | | | $ | 34,221 | |
Shares issued in reinvestment of dividends and distributions | | 41,848 | | | | 759,124 | |
Shares reacquired | | (111,696 | ) | | | (1,995,368 | ) |
| | | | | | | |
Net increase (decrease) in shares outstanding | | (67,986 | ) | | $ | (1,202,023 | ) |
| | | | | | | |
Notes to Financial Statements
continued
| | | | | | | |
Class L | | Shares | | | Amount | |
March 16, 2007* through August 31, 2007: | | | | | | | |
Shares sold | | 4,049 | | | $ | 86,210 | |
Shares issued in connection with the merger | | 284,025 | | | | 5,865,932 | |
Shares reacquired | | (44,334 | ) | | | (993,357 | ) |
| | | | | | | |
Net increase (decrease) in shares outstanding | | 243,740 | | | $ | 4,958,785 | |
| | | | | | | |
Class M | | | | | | |
Year ended August 31, 2008: | | | | | | | |
Shares sold | | 18,974 | | | $ | 370,311 | |
Shares issued in reinvestment of dividends and distributions | | 100,754 | | | | 1,813,579 | |
Shares reacquired | | (274,577 | ) | | | (5,006,324 | ) |
| | | | | | | |
Net increase (decrease) in shares outstanding before conversion | | (154,849 | ) | | | (2,822,434 | ) |
Shares reacquired upon conversion into Class A | | (191,919 | ) | | | (3,501,964 | ) |
| | | | | | | |
Net increase (decrease) in shares outstanding | | (346,768 | ) | | $ | (6,324,398 | ) |
| | | | | | | |
March 16, 2007* through August 31, 2007: | | | | | | | |
Shares sold | | 32,745 | | | $ | 709,825 | |
Shares issued in connection with the merger | | 911,413 | | | | 18,673,645 | |
Shares reacquired | | (152,598 | ) | | | (3,395,448 | ) |
| | | | | | | |
Net increase (decrease) in shares outstanding before conversion | | 791,560 | | | | 15,988,022 | |
Shares reacquired upon conversion into Class A | | (82,905 | ) | | | (1,839,714 | ) |
| | | | | | | |
Net increase (decrease) in shares outstanding | | 708,655 | | | $ | 14,148,308 | |
| | | | | | | |
Class R | | | | | | |
Year ended August 31, 2008: | | | | | | | |
Shares sold | | 258,696 | | | $ | 4,583,766 | |
Shares issued in reinvestment of dividends and distributions | | 21,518 | | | | 390,552 | |
Shares reacquired | | (74,745 | ) | | | (1,299,260 | ) |
| | | | | | | |
Net increase (decrease) in shares outstanding | | 205,469 | | | $ | 3,675,058 | |
| | | | | | | |
Ten-month period ended August 31, 2007: | | | | | | | |
Shares sold | | 90,036 | | | $ | 1,970,956 | |
Shares issued in reinvestment of dividends and distributions | | 379 | | | | 7,717 | |
Shares reacquired | | (7,827 | ) | | | (172,132 | ) |
| | | | | | | |
Net increase (decrease) in shares outstanding | | 82,588 | | | $ | 1,806,541 | |
| | | | | | | |
Year ended October 31, 2006: | | | | | | | |
Shares sold | | 2,949 | | | $ | 63,162 | |
Shares issued in reinvestment of dividends and distributions | | — | ** | | | 3 | |
Shares reacquired | | (242 | ) | | | (4,980 | ) |
| | | | | | | |
Net increase (decrease) in shares outstanding | | 2,707 | | | $ | 58,185 | |
| | | | | | | |
| | |
| 34 | | Visit our website at www.jennisondryden.com |
| | | | | | | |
Class X | | Shares | | | Amount | |
Year ended August 31, 2008: | | | | | | | |
Shares sold | | 3,673 | | | $ | 61,423 | |
Shares issued in reinvestment of dividends and distributions | | 28,948 | | | | 520,780 | |
Shares reacquired | | (74,307 | ) | | | (1,327,908 | ) |
| | | | | | | |
Net increase (decrease) in shares outstanding before conversion | | (41,686 | ) | | | (745,705 | ) |
Shares reacquired upon conversion into Class A | | (3,207 | ) | | | (52,145 | ) |
| | | | | | | |
Net increase (decrease) in shares outstanding | | (44,893 | ) | | $ | (797,850 | ) |
| | | | | | | |
March 16, 2007* through August 31, 2007: | | | | | | | |
Shares sold | | 13,800 | | | $ | 301,628 | |
Shares issued in connection with the merger | | 193,839 | | | | 3,971,514 | |
Shares reacquired | | (31,949 | ) | | | (699,454 | ) |
| | | | | | | |
Net increase (decrease) in shares outstanding before conversion | | 175,690 | | | | 3,573,688 | |
Shares reacquired upon conversion into Class A | | (1,446 | ) | | | (32,666 | ) |
| | | | | | | |
Net increase (decrease) in shares outstanding | | 174,244 | | | $ | 3,541,022 | |
| | | | | | | |
Class Z | | | | | | |
Year ended August 31, 2008: | | | | | | | |
Shares sold | | 2,797,692 | | | $ | 49,814,675 | |
Shares issued in reinvestment of dividends and distributions | | 881,507 | | | | 16,061,063 | |
Shares reacquired | | (1,872,828 | ) | | | (34,248,213 | ) |
| | | | | | | |
Net increase (decrease) in shares outstanding | | 1,806,371 | | | $ | 31,627,525 | |
| | | | | | | |
Ten-month period ended August 31, 2007: | | | | | | | |
Shares sold | | 1,634,144 | | | $ | 35,565,780 | |
Shares issued in reinvestment of dividends and distributions | | 501,829 | | | | 10,242,318 | |
Shares reacquired | | (1,436,065 | ) | | | (31,706,431 | ) |
| | | | | | | |
Net increase (decrease) in shares outstanding | | 699,908 | | | $ | 14,101,667 | |
| | | | | | | |
Year ended October 31, 2006: | | | | | | | |
Shares sold | | 2,294,435 | | | $ | 48,537,367 | |
Shares issued in reinvestment of dividends and distributions | | 125,136 | | | | 2,467,686 | |
Shares reacquired | | (440,315 | ) | | | (9,267,479 | ) |
| | | | | | | |
Net increase (decrease) in shares outstanding | | 1,979,256 | | | $ | 41,737,574 | |
| | | | | | | |
Note 7. Reorganization
On March 16, 2007, the Fund acquired all of the net assets of Strategic Partners Core Value Fund and Strategic Partners Large Capitalization Value Fund (the merged funds) pursuant to a plan of reorganization approved by the Strategic Partners Core Value Fund and Strategic Partners Large Capitalization Value Fund shareholders on December 14, 2006. The acquisition was accomplished by a tax-free issue of Class A,
Notes to Financial Statements
continued
Class B, Class C, Class L, Class M and Class X shares for the corresponding classes of shares of Strategic Partners Core Value Fund and Strategic Partners Large Capitalization Value Fund. The following table shows the number of shares of the merged funds and how many shares they became in the Jennison Value Fund and the total value.
| | | | | | | | | |
Strategic Partners Core Value Fund | | Jennison Value Fund |
Class | | Shares | | Class | | Shares | | Value |
A | | 465,322 | | A | | 289,328 | | $ | 5,988,365 |
B | | 106,392 | | B | | 66,858 | | | 1,369,838 |
C | | 683,831 | | C | | 429,581 | | | 8,802,951 |
L | | 456,096 | | L | | 284,025 | | | 5,865,932 |
M | | 1,454,212 | | M | | 911,413 | | | 18,673,645 |
X | | 308,721 | | X | | 193,839 | | | 3,971,514 |
| |
Strategic Partners Large
Capitalization Value Fund | | Jennison Value Fund |
Class | | Shares | | Class | | Shares | | Value |
A | | 3,013,804 | | A | | 1,942,739 | | $ | 40,209,861 |
B | | 1,543,177 | | B | | 981,134 | | | 20,102,120 |
C | | 1,706,263 | | C | | 1,084,970 | | | 22,233,114 |
The aggregate net assets and net unrealized appreciation/(depreciation) of the merged funds immediately before the acquisition were:
| | | | | | |
| | | Total
Net Assets | | Net Unrealized
Appreciation |
Strategic Partners Core Value Fund | | $ | 44,672,245 | | $ | 10,466,895 |
Strategic Partners Large Capitalization Value Fund | | | 82,545,095 | | | 14,505,336 |
The aggregate net assets of Jennison Value Fund immediately before the acquisition were $1,197,808,121.
Note 8. Borrowing
The Fund, along with other affiliated registered investment companies (the “Funds”), is a party to a Syndicated Credit Agreement (“SCA”) with two banks. The SCA provides for a commitment of $500 million. Interest on any borrowings under the SCA is incurred at contracted market rates and a commitment fee for the unused amount is accrued daily and paid quarterly. Effective October 24, 2008, the Funds renewed SCA with the banks. The commitment under the renewed SCA continues to
| | |
| 36 | | Visit our website at www.jennisondryden.com |
be $500 million. The Funds pay a commitment fee of .13 of 1% of the unused portion of the renewed SCA. The expiration date of the renewed SCA will be October 23, 2009. For the period from October 26, 2007 through October 23, 2008, the Funds paid a commitment fee of .06 of 1% of the unused portion of the agreement. The purpose of the SCA is to provide an alternative source of temporary funding for capital share redemptions.
The Fund utilized the line of credit during the year ended August 31, 2008. The average daily balance for the 13 days the Fund had an outstanding balance was $1,322,692 at a weighted average interest rate of 4.41%. At August 31, 2008, the Fund did not have an outstanding loan amount.
During the year ended August 31, 2008, the Fund paid interest to the custodian for temporary overdrawn balances. The average outstanding balance was $740,813 at a weighted average interest rate of 4.62%.
Note 9. New Accounting Pronouncements
On September 20, 2006, the Financial Accounting Standards Board (“FASB”) released Statement of Financial Accounting Standards No. 157 “Fair Value Measurements” (“FAS 157”). FAS 157 establishes an authoritative definition of fair value, sets out a framework for measuring fair value, and requires additional disclosures about fair-value measurements. The application of FAS 157 is required for fiscal years beginning after November 15, 2007 and interim periods within those fiscal years. At this time, management is evaluating the implications of FAS 157 and its impact, if any, on the financial statements has not yet been determined.
In addition, in March 2008, the FASB released Statement of Financial Accounting Standards No. 161, “Disclosures about Derivative Instruments and Hedging Activities” (“FAS 161”). FAS 161 requires qualitative disclosures about objectives and strategies for using derivatives, quantitative disclosures about fair value amounts of and gains and losses on derivative instruments, and disclosures about credit-risk-related contingent features in derivative agreements. The application of FAS 161 is required for any reporting period beginning after November 15, 2008. At this time, management is evaluating the implications of FAS 161 and its impact on the financial statements has not yet been determined.
Note 10. Subsequent Events
As noted in the Portfolio of Investments, the Fund held securities issued by Federal Housing Finance Agency and American International Group (AIG). Subsequent to the year end, the Federal Housing Finance Agency has placed Fannie Mae and Freddie
Notes to Financial Statements
continued
Mac into conservatorship. With respect to securities issued by AIG or for which AIG is counterparty, the Federal Reserve Board, with the full support of the Treasury Department, authorized the Federal Reserve Bank of New York to lend up to $122.8 billion to AIG. The secured loan has terms and conditions designed to protect the interests of the U.S. government and taxpayers. The values of the positions held by the Fund have been adversely impacted since the date of these financial statements; however, the impact on the net assets of the Fund is not material.
As a result of the bankruptcy filing by Lehman Brothers Holdings Inc., which was the parent company to the Fund’s Securities Lending Counter Party, Lehman Brothers Inc. (Lehman), the Fund’s Securities Lending Agent utilized collateral held on behalf of the Fund for securities out on loan to compensate the Fund for the failure of Lehman to return the securities.
| | |
| 38 | | Visit our website at www.jennisondryden.com |
Financial Highlights
| | |
| AUGUST 31, 2008 | | ANNUAL REPORT |
Jennison Value Fund
Financial Highlights
| | | | | | | | |
| | | Class A | |
| | | Year Ended
August 31,
2008(a) | | | Ten-Month
Period Ended
August 31,
2007(a)(c) | |
Per Share Operating Performance: | | | | | | | | |
Net Asset Value, Beginning Of Period | | $ | 21.81 | | | $ | 22.49 | |
| | | | | | | | |
Income (loss) from investment operations: | | | | | | | | |
Net investment income | | | .15 | | | | .16 | |
Net realized and unrealized gain (loss) on investment transactions | | | (2.01 | ) | | | 1.61 | |
| | | | | | | | |
Total from investment operations | | | (1.86 | ) | | | 1.77 | |
| | | | | | | | |
Less Dividends and Distributions: | | | | | | | | |
Dividends from net investment income | | | (.20 | ) | | | (.19 | ) |
Distributions from net realized gains | | | (3.20 | ) | | | (2.26 | ) |
| | | | | | | | |
Total dividends and distributions | | | (3.40 | ) | | | (2.45 | ) |
| | | | | | | | |
Net asset value, end of period | | $ | 16.55 | | | $ | 21.81 | |
| | | | | | | | |
Total Return(b): | | | (9.95 | )% | | | 8.66 | % |
Ratios/Supplemental Data: | | | | | | | | |
Net assets, end of period (000) | | $ | 819,162 | | | $ | 1,010,160 | |
Average net assets (000) | | $ | 910,313 | | | $ | 1,028,798 | |
Ratios to average net assets(g): | | | | | | | | |
Expenses, including distribution and service (12b-1) fees(d) | | | 1.00 | % | | | .95 | %(e) |
Expenses, excluding distribution and service (12b-1) fees | | | .73 | % | | | .70 | %(e) |
Net investment income | | | .83 | % | | | .90 | %(e) |
Portfolio turnover rate | | | 51 | % | | | 55 | %(f) |
| (a) | Calculated based upon average shares outstanding during the period. |
| (b) | Total return does not consider the effects of sales loads. Total return is calculated assuming a purchase of a share on the first day and a sale on the last day of each period reported, and includes reinvestment of dividends and distributions. Total returns may reflect adjustments to conform to generally accepted accounting principles. Total returns for periods less than a full year are not annualized. |
| (c) | For the ten-month period ended August 31, 2007. The Fund changed its fiscal year end from October 31 to August 31, effective August 31, 2007. |
| (d) | The distributor of the Fund has contractually agreed to limit its distribution and service (12b-1) fees to .25 of 1% of the average daily net assets of the Class A shares for the period September 1, 2007 to February 29, 2008. |
| (g) | Does not include expenses of the underlying portfolios in which the Fund invests. |
See Notes to Financial Statements.
| | |
| 40 | | Visit our website at www.jennisondryden.com |
| | | | | | | | | | | | | | |
|
| Class A | |
| Year Ended October 31, | |
| 2006(a) | | | 2005(a) | | | 2004(a) | | | 2003(a) | |
| | | | | | | | | | | | | | |
| $ | 19.77 | | | $ | 16.71 | | | $ | 14.50 | | | $ | 12.17 | |
| | | | | | | | | | | | | | | |
| | | | | | | | | | | | | | |
| | .22 | | | | .14 | | | | .11 | | | | .11 | |
| | 3.56 | | | | 3.07 | | | | 2.22 | | | | 2.31 | |
| | | | | | | | | | | | | | | |
| | 3.78 | | | | 3.21 | | | | 2.33 | | | | 2.42 | |
| | | | | | | | | | | | | | | |
| | | | | | | | | | | | | | |
| | (.14 | ) | | | (.15 | ) | | | (.12 | ) | | | (.09 | ) |
| | (.92 | ) | | | — | | | | — | | | | — | |
| | | | | | | | | | | | | | | |
| | (1.06 | ) | | | (.15 | ) | | | (.12 | ) | | | (.09 | ) |
| | | | | | | | | | | | | | | |
| $ | 22.49 | | | $ | 19.77 | | | $ | 16.71 | | | $ | 14.50 | |
| | | | | | | | | | | | | | | |
| | 19.85 | % | | | 19.31 | % | | | 16.21 | % | | | 19.97 | % |
| | | | | | | | | | | | | | |
| $ | 946,315 | | | $ | 771,540 | | | $ | 610,345 | | | $ | 559,230 | |
| $ | 872,078 | | | $ | 699,013 | | | $ | 598,375 | | | $ | 529,960 | |
| | | | | | | | | | | | | | |
| | .98 | % | | | 1.04 | % | | | 1.07 | % | | | 1.12 | % |
| | .73 | % | | | .79 | % | | | .82 | % | | | .87 | % |
| | 1.05 | % | | | .77 | % | | | .68 | % | | | .88 | % |
| | 49 | % | | | 56 | % | | | 56 | % | | | 97 | % |
See Notes to Financial Statements.
Financial Highlights
continued
| | | | | | | | |
| | | Class B | |
| | | Year Ended
August 31,
2008(a) | | | Ten-Month
Period Ended
August 31,
2007(a)(b) | |
Per Share Operating Performance: | | | | | | | | |
Net Asset Value, Beginning Of Period | | $ | 21.52 | | | $ | 22.18 | |
| | | | | | | | |
Income (loss) from investment operations: | | | | | | | | |
Net investment income (loss) | | | .02 | | | | .03 | |
Net realized and unrealized gain (loss) on investment transactions | | | (2.00 | ) | | | 1.60 | |
| | | | | | | | |
Total from investment operations | | | (1.98 | ) | | | 1.63 | |
| | | | | | | | |
Less Dividends and Distributions: | | | | | | | | |
Dividends from net investment income | | | (.06 | ) | | | (.03 | ) |
Distributions from net realized gains | | | (3.20 | ) | | | (2.26 | ) |
| | | | | | | | |
Total dividends and distributions | | | (3.26 | ) | | | (2.29 | ) |
| | | | | | | | |
Net asset value, end of period | | $ | 16.28 | | | $ | 21.52 | |
| | | | | | | | |
Total Return(c): | | | (10.65 | )% | | | 8.02 | % |
Ratios/Supplemental Data: | | | | | | | | |
Net assets, end of period (000) | | $ | 65,520 | | | $ | 112,108 | |
Average net assets (000) | | $ | 87,249 | | | $ | 112,785 | |
Ratios to average net assets(e): | | | | | | | | |
Expenses, including distribution and service (12b-1) fees | | | 1.73 | % | | | 1.70 | %(d) |
Expenses, excluding distribution and service (12b-1) fees | | | .73 | % | | | .70 | %(d) |
Net investment income (loss) | | | .11 | % | | | .15 | %(d) |
| (a) | Calculated based upon average shares outstanding during the period. |
| (b) | For the ten-month period ended August 31, 2007. The Fund changed its fiscal year end from October 31 to August 31, effective August 31, 2007. |
| (c) | Total return does not consider the effects of sales loads. Total return is calculated assuming a purchase of a share on the first day and a sale on the last day of each period reported, and includes reinvestment of dividends and distributions. Total returns may reflect adjustments to conform to generally accepted accounting principles. Total returns for periods less than a full year are not annualized. |
| (e) | Does not include expenses of the underlying portfolios in which the Fund invests. |
See Notes to Financial Statements.
| | |
| 42 | | Visit our website at www.jennisondryden.com |
| | | | | | | | | | | | | | |
|
| Class B | |
| Year Ended October 31, | |
| 2006(a) | | | 2005(a) | | | 2004(a) | | | 2003(a) | |
| | | | | | | | | | | | | | |
| $ | 19.52 | | | $ | 16.49 | | | $ | 14.31 | | | $ | 12.02 | |
| | | | | | | | | | | | | | | |
| | | | | | | | | | | | | | |
| | .07 | | | | .02 | | | | (.01 | ) | | | .02 | |
| | 3.51 | | | | 3.02 | | | | 2.20 | | | | 2.27 | |
| | | | | | | | | | | | | | | |
| | 3.58 | | | | 3.04 | | | | 2.19 | | | | 2.29 | |
| | | | | | | | | | | | | | | |
| | | | | | | | | | | | | | |
| | — | | | | (.01 | ) | | | (.01 | ) | | | — | |
| | (.92 | ) | | | — | | | | — | | | | — | |
| | | | | | | | | | | | | | | |
| | (.92 | ) | | | (.01 | ) | | | (.01 | ) | | | — | |
| | | | | | | | | | | | | | | |
| $ | 22.18 | | | $ | 19.52 | | | $ | 16.49 | | | $ | 14.31 | |
| | | | | | | | | | | | | | | |
| | 18.96 | % | | | 18.44 | % | | | 15.34 | % | | | 19.05 | % |
| | | | | | | | | | | | | | |
| $ | 105,824 | | | $ | 119,151 | | | $ | 193,230 | | | $ | 215,039 | |
| $ | 112,070 | | | $ | 161,840 | | | $ | 212,833 | | | $ | 221,850 | |
| | | | | | | | | | | | | | |
| | 1.73 | % | | | 1.79 | % | | | 1.82 | % | | | 1.87 | % |
| | .73 | % | | | .79 | % | | | .82 | % | | | .87 | % |
| | .32 | % | | | .04 | % | | | (.06 | )% | | | .13 | % |
See Notes to Financial Statements.
Financial Highlights
continued
| | | | | | | | |
| | | Class C | |
| | | Year Ended
August 31,
2008(a) | | | Ten-Month
Period Ended
August 31,
2007(a)(b) | |
Per Share Operating Performance: | | | | | | | | |
Net Asset Value, Beginning Of Period | | $ | 21.52 | | | $ | 22.19 | |
| | | | | | | | |
Income (loss) from investment operations: | | | | | | | | |
Net investment income (loss) | | | .02 | | | | .02 | |
Net realized and unrealized gain (loss) on investment transactions | | | (1.99 | ) | | | 1.60 | |
| | | | | | | | |
Total from investment operations | | | (1.97 | ) | | | 1.62 | |
| | | | | | | | |
Less Dividends and Distributions: | | | | | | | | |
Dividends from net investment income | | | (.06 | ) | | | (.03 | ) |
Distributions from net realized gains | | | (3.20 | ) | | | (2.26 | ) |
| | | | | | | | |
Total dividends and distributions | | | (3.26 | ) | | | (2.29 | ) |
| | | | | | | | |
Net asset value, end of period | | $ | 16.29 | | | $ | 21.52 | |
| | | | | | | | |
Total Return(c): | | | (10.61 | )% | | | 7.98 | % |
Ratios/Supplemental Data: | | | | | | | | |
Net assets, end of period (000) | | $ | 45,882 | | | $ | 64,731 | |
Average net assets (000) | | $ | 55,511 | | | $ | 52,776 | |
Ratios to average net assets(e): | | | | | | | | |
Expenses, including distribution and service (12b-1) fees | | | 1.73 | % | | | 1.70 | %(d) |
Expenses, excluding distribution and service (12b-1) fees | | | .73 | % | | | .70 | %(d) |
Net investment income (loss) | | | .10 | % | | | .11 | %(d) |
| (a) | Calculated based upon average shares outstanding during the period. |
| (b) | For the ten-month period ended August 31, 2007. The Fund changed its fiscal year end from October 31 to August 31, effective August 31, 2007. |
| (c) | Total return does not consider the effects of sales loads. Total return is calculated assuming a purchase of a share on the first day and a sale on the last day of each period reported, and includes reinvestment of dividends and distributions. Total returns may reflect adjustments to conform to generally accepted accounting principles. Total returns for periods less than a full year are not annualized. |
| (e) | Does not include expenses of the underlying portfolios in which the Fund invests. |
See Notes to Financial Statements.
| | |
| 44 | | Visit our website at www.jennisondryden.com |
| | | | | | | | | | | | | | |
|
| Class C | |
| Year Ended October 31, | |
| 2006(a) | | | 2005(a) | | | 2004(a) | | | 2003(a) | |
| | | | | | | | | | | | | | |
| $ | 19.52 | | | $ | 16.49 | | | $ | 14.31 | | | $ | 12.02 | |
| | | | | | | | | | | | | | | |
| | | | | | | | | | | | | | |
| | .06 | | | | .01 | | | | (.01 | ) | | | .02 | |
| | 3.53 | | | | 3.03 | | | | 2.20 | | | | 2.27 | |
| | | | | | | | | | | | | | | |
| | 3.59 | | | | 3.04 | | | | 2.19 | | | | 2.29 | |
| | | | | | | | | | | | | | | |
| | | | | | | | | | | | | | |
| | — | | | | (.01 | ) | | | (.01 | ) | | | — | |
| | (.92 | ) | | | — | | | | — | | | | — | |
| | | | | | | | | | | | | | | |
| | (.92 | ) | | | (.01 | ) | | | (.01 | ) | | | — | |
| | | | | | | | | | | | | | | |
| $ | 22.19 | | | $ | 19.52 | | | $ | 16.49 | | | $ | 14.31 | |
| | | | | | | | | | | | | | | |
| | 18.95 | % | | | 18.44 | % | | | 15.34 | % | | | 19.05 | % |
| | | | | | | | | | | | | | |
| $ | 32,189 | | | $ | 20,540 | | | $ | 20,006 | | | $ | 21,268 | |
| $ | 24,812 | | | $ | 20,814 | | | $ | 21,130 | | | $ | 22,008 | |
| | | | | | | | | | | | | | |
| | 1.73 | % | | | 1.79 | % | | | 1.82 | % | | | 1.87 | % |
| | .73 | % | | | .79 | % | | | .82 | % | | | .87 | % |
| | .29 | % | | | .05 | % | | | (.07 | )% | | | .13 | % |
See Notes to Financial Statements.
Financial Highlights
continued
| | | | | | | | |
| | | Class L | |
| | | Year Ended
August 31,
2008(b) | | | March 16, 2007(a)
through
August 31, 2007(b)(c) | |
Per Share Operating Performance: | | | | | | | | |
Net Asset Value, Beginning Of Period | | $ | 21.74 | | | $ | 20.65 | |
| | | | | | | | |
Income (loss) from investment operations: | | | | | | | | |
Net investment income | | | .11 | | | | .05 | |
Net realized and unrealized gain (loss) on investment transactions | | | (2.01 | ) | | | 1.04 | |
| | | | | | | | |
Total from investment operations | | | (1.90 | ) | | | 1.09 | |
| | | | | | | | |
Less Dividends and Distributions: | | | | | | | | |
Dividends from net investment income | | | (.16 | ) | | | — | |
Distributions from net realized gains | | | (3.20 | ) | | | — | |
| | | | | | | | |
Total dividends and distributions | | | (3.36 | ) | | | — | |
| | | | | | | | |
Net asset value, end of period | | $ | 16.48 | | | $ | 21.74 | |
| | | | | | | | |
Total Return(d): | | | (10.17 | )% | | | 5.28 | % |
Ratios/Supplemental Data: | | | | | | | | |
Net assets, end of period (000) | | $ | 2,896 | | | $ | 5,299 | |
Average net assets (000) | | $ | 4,100 | | | $ | 3,274 | |
Ratios to average net assets(f): | | | | | | | | |
Expenses, including distribution and service (12b-1) fees | | | 1.23 | % | | | 1.20 | %(e) |
Expenses, excluding distribution and service (12b-1) fees | | | .73 | % | | | .70 | %(e) |
Net investment income | | | .61 | % | | | .51 | %(e) |
| (a) | Inception date of Class L shares. |
| (b) | Calculated based upon average shares outstanding during the period. |
| (c) | For the period ended August 31, 2007. The Fund changed its fiscal year end from October 31 to August 31, effective August 31, 2007. |
| (d) | Total return does not consider the effects of sales loads. Total return is calculated assuming a purchase of a share on the first day and a sale on the last day of each period reported, and includes reinvestment of dividends and distributions. Total returns may reflect adjustments to conform to generally accepted accounting principles. Total returns for periods less than a full year are not annualized. |
| (f) | Does not include expenses of the underlying portfolios in which the Fund invests. |
See Notes to Financial Statements.
| | |
| 46 | | Visit our website at www.jennisondryden.com |
| | | | | | | | |
| | | Class M | |
| | | Year Ended
August 31,
2008(b) | | | March 16, 2007(a)
through
August 31, 2007(b)(c) | |
Per Share Operating Performance: | | | | | | | | |
Net Asset Value, Beginning Of Period | | $ | 21.53 | | | $ | 20.49 | |
| | | | | | | | |
Income (loss) from investment operations: | | | | | | | | |
Net investment income | | | .02 | | | | — | (e) |
Net realized and unrealized gain (loss) on investment transactions | | | (1.99 | ) | | | 1.04 | |
| | | | | | | | |
Total from investment operations | | | (1.97 | ) | | | 1.04 | |
| | | | | | | | |
Less Dividends and Distributions: | | | | | | | | |
Dividends from net investment income | | | (.06 | ) | | | — | |
Distributions from net realized gains | | | (3.20 | ) | | | — | |
| | | | | | | | |
Total dividends and distributions | | | (3.26 | ) | | | — | |
| | | | | | | | |
Net asset value, end of period | | $ | 16.30 | | | $ | 21.53 | |
| | | | | | | | |
Total Return(d): | | | (10.59 | )% | | | 5.08 | % |
Ratios/Supplemental Data: | | | | | | | | |
Net assets, end of period (000) | | $ | 5,898 | | | $ | 15,256 | |
Average net assets (000) | | $ | 9,964 | | | $ | 9,920 | |
Ratios to average net assets(g): | | | | | | | | |
Expenses, including distribution and service (12b-1) fees | | | 1.73 | % | | | 1.70 | %(f) |
Expenses, excluding distribution and service (12b-1) fees | | | .73 | % | | | .70 | %(f) |
Net investment income | | | .11 | % | | | .01 | %(f) |
| (a) | Inception date of Class M shares. |
| (b) | Calculated based upon average shares outstanding during the period. |
| (c) | For the period ended August 31, 2007. The Fund changed its fiscal year end from October 31 to August 31, effective August 31, 2007. |
| (d) | Total return does not consider the effects of sales loads. Total return is calculated assuming a purchase of a share on the first day and a sale on the last day of each period reported, and includes reinvestment of dividends and distributions. Total returns may reflect adjustments to conform to generally accepted accounting principles. Total returns for periods less than a full year are not annualized. |
| (e) | Less than $.005 per share. |
| (g) | Does not include expenses of the underlying portfolios in which the Fund invests. |
See Notes to Financial Statements.
Financial Highlights
continued
| | | | |
| |
| | | Class R | |
| | | Year Ended
August 31, 2008(b) | |
Per Share Operating Performance: | | | | |
Net Asset Value, Beginning Of Period | | $ | 21.75 | |
| | | | |
Income (loss) from investment operations: | | | | |
Net investment income | | | .11 | |
Net realized and unrealized gain (loss) on investment transactions | | | (2.01 | ) |
| | | | |
Total from investment operations | | | (1.90 | ) |
| | | | |
Less Dividends and Distributions: | | | | |
Dividends from net investment income | | | (.16 | ) |
Distributions from net realized gains | | | (3.20 | ) |
| | | | |
Total dividends and distributions | | | (3.36 | ) |
| | | | |
Net asset value, end of period | | $ | 16.49 | |
| | | | |
Total Return(d): | | | (10.16 | )% |
Ratios/Supplemental Data: | | | | |
Net assets, end of period (000) | | $ | 4,796 | |
Average net assets (000) | | $ | 3,557 | |
Ratios to average net assets(g): | | | | |
Expenses, including distribution and service (12b-1) fees(e) | | | 1.23 | % |
Expenses, excluding distribution and service (12b-1) fees | | | .73 | % |
Net investment income | | | .60 | % |
| (a) | Inception date of Class R shares. |
| (b) | Calculated based upon average shares outstanding during the period. |
| (c) | For the ten-month period ended August 31, 2007. The Fund changed its fiscal year end from October 31 to August 31, effective August 31, 2007. |
| (d) | Total return is calculated assuming a purchase of a share on the first day and a sale on the last day of each period reported, and includes reinvestment of dividends and distributions. Total returns may reflect adjustments to conform to generally accepted accounting principles. Total returns for periods less than a full year are not annualized. |
| (e) | The distributor of the Fund has contractually agreed to limit its distribution and service (12b-1) fees to .50 of 1% of the average daily net assets of the Class R shares. |
| (g) | Does not include expenses of the underlying portfolios in which the Fund invests. |
See Notes to Financial Statements.
| | |
| 48 | | Visit our website at www.jennisondryden.com |
| | | | | | | | | | |
| Class R | |
Ten-Month
Period Ended
August 31, 2007(b)(c) | | | Year Ended
October 31, 2006(b) | | | June 3, 2005(a)
through
October 31, 2005(b) | |
| | | | | | | | | | |
| $ | 22.39 | | | $ | 19.74 | | | $ | 18.31 | |
| | | | | | | | | | | |
| | | | | | | | | | |
| | .05 | | | | .13 | | | | .01 | |
| | 1.69 | | | | 3.53 | | | | 1.42 | |
| | | | | | | | | | | |
| | 1.74 | | | | 3.66 | | | | 1.43 | |
| | | | | | | | | | | |
| | | | | | | | | | |
| | (.12 | ) | | | (.09 | ) | | | — | |
| | (2.26 | ) | | | (.92 | ) | | | — | |
| | | | | | | | | | | |
| | (2.38 | ) | | | (1.01 | ) | | | — | |
| | | | | | | | | | | |
| $ | 21.75 | | | $ | 22.39 | | | $ | 19.74 | |
| | | | | | | | | | | |
| | 8.44 | % | | | 19.21 | % | | | 7.81 | % |
| | | | | | | | | | |
| $ | 1,858 | | | $ | 64 | | | $ | 3 | |
| $ | 685 | | | $ | 21 | | | $ | 3 | |
| | | | | | | | | | |
| | 1.20 | %(f) | | | 1.23 | % | | | 1.29 | %(f) |
| | .70 | %(f) | | | .73 | % | | | .79 | %(f) |
| | .62 | %(f) | | | .61 | % | | | .19 | %(f) |
See Notes to Financial Statements.
Financial Highlights
continued
| | | | | | | | |
| | | Class X | |
| | | Year Ended
August 31,
2008(b) | | | March 16, 2007(a)
through
August 31, 2007(b)(c)(g) | |
Per Share Operating Performance: | | | | | | | | |
Net Asset Value, Beginning Of Period | | $ | 21.52 | | | $ | 20.49 | |
| | | | | | | | |
Income (loss) from investment operations: | | | | | | | | |
Net investment income | | | .15 | | | | .07 | |
Net realized and unrealized gain (loss) on investment transactions | | | (1.99 | ) | | | 1.03 | |
| | | | | | | | |
Total from investment operations | | | (1.84 | ) | | | 1.10 | |
| | | | | | | | |
Less Dividends and Distributions: | | | | | | | | |
Dividends from net investment income | | | (.15 | ) | | | (.09 | ) |
Distributions from net realized gains | | | (3.20 | ) | | | — | |
| | | | | | | | |
Total dividends and distributions | | | (3.35 | ) | | | (.09 | ) |
| | | | | | | | |
Capital Contributions: | | | .04 | | | | .02 | |
| | | | | | | | |
Net asset value, end of period | | $ | 16.37 | | | $ | 21.52 | |
| | | | | | | | |
Total Return(d): | | | (9.67 | )% | | | 5.47 | % |
Ratios/Supplemental Data: | | | | | | | | |
Net assets, end of period (000) | | $ | 2,117 | | | $ | 3,749 | |
Average net assets (000) | | $ | 2,927 | | | $ | 2,334 | |
Ratios to average net assets(f): | | | | | | | | |
Expenses, including distribution and service (12b-1) fees | | | 1.02 | % | | | 1.01 | %(e) |
Expenses, excluding distribution and service (12b-1) fees | | | .73 | % | | | .70 | %(e) |
Net investment income | | | .82 | % | | | .71 | %(e) |
| (a) | Inception date of Class X shares. |
| (b) | Calculated based upon average shares outstanding during the period. |
| (c) | For the period ended August 31, 2007. The Fund changed its fiscal year end from October 31 to August 31, effective August 31, 2007. |
| (d) | Total return does not consider the effects of sales loads. Total return is calculated assuming a purchase of a share on the first day and a sale on the last day of each period reported, and includes reinvestment of dividends and distributions. Total returns may reflect adjustments to conform to generally accepted accounting principles. Total returns for periods less than a full year are not annualized. |
| (f) | Does not include expenses of the underlying portfolios in which the Fund invests. |
| (g) | Certain information has been adjusted to reflect a manager payment for sales charges incurred by shareholders in excess of the regulatory limits. |
See Notes to Financial Statements.
| | |
| 50 | | Visit our website at www.jennisondryden.com |
This Page Intentionally Left Blank
Financial Highlights
continued
| | | | | | | | |
| | | Class Z | |
| | | Year Ended
August 31,
2008(a) | | | Ten-Month
Period Ended
August 31,
2007(a)(c) | |
Per Share Operating Performance: | | | | | | | | |
Net Asset Value, Beginning Of Period | | $ | 21.88 | | | $ | 22.56 | |
| | | | | | | | |
Income (loss) from investment operations: | | | | | | | | |
Net investment income | | | .20 | | | | .23 | |
Net realized and unrealized gain (loss) on investment transactions | | | (2.02 | ) | | | 1.60 | |
| | | | | | | | |
Total from investment operations | | | (1.82 | ) | | | 1.83 | |
| | | | | | | | |
Less Dividends and Distributions: | | | | | | | | |
Dividends from net investment income | | | (.25 | ) | | | (.25 | ) |
Distributions from net realized gains | | | (3.20 | ) | | | (2.26 | ) |
| | | | | | | | |
Total dividends and distributions | | | (3.45 | ) | | | (2.51 | ) |
| | | | | | | | |
Net asset value, end of period | | $ | 16.61 | | | $ | 21.88 | |
| | | | | | | | |
Total Return(b): | | | (9.72 | )% | | | 8.91 | % |
Ratios/Supplemental Data: | | | | | | | | |
Net assets, end of period (000) | | $ | 109,533 | | | $ | 104,793 | |
Average net assets (000) | | $ | 104,223 | | | $ | 105,962 | |
Ratios to average net assets(e): | | | | | | | | |
Expenses, including distribution and service (12b-1) fees | | | .73 | % | | | .70 | %(d) |
Expenses, excluding distribution and service (12b-1) fees | | | .73 | % | | | .70 | %(d) |
Net investment income | | | 1.11 | % | | | 1.16 | %(d) |
| (a) | Calculated based upon average shares outstanding during the period. |
| (b) | Total return is calculated assuming a purchase of a share on the first day and a sale on the last day of each period reported, and includes reinvestment of dividends and distributions. Total returns may reflect adjustments to conform to generally accepted accounting principles. Total returns for periods less than a full year are not annualized. |
| (c) | For the ten-month period ended August 31, 2007. The Fund changed its fiscal year end from October 31 to August 31, effective August 31, 2007. |
| (e) | Does not include expenses of the underlying portfolios in which the Fund invests. |
See Notes to Financial Statements.
| | |
| 52 | | Visit our website at www.jennisondryden.com |
| | | | | | | | | | | | | | |
|
| Class Z | |
| Year Ended October 31, | |
| 2006(a) | | | 2005(a) | | | 2004(a) | | | 2003(a) | |
| | | | | | | | | | | | | | |
| $ | 19.83 | | | $ | 16.76 | | | $ | 14.54 | | | $ | 12.21 | |
| | | | | | | | | | | | | | | |
| | | | | | | | | | | | | | |
| | .27 | | | | .19 | | | | .15 | | | | .15 | |
| | 3.57 | | | | 3.07 | | | | 2.23 | | | | 2.30 | |
| | | | | | | | | | | | | | | |
| | 3.84 | | | | 3.26 | | | | 2.38 | | | | 2.45 | |
| | | | | | | | | | | | | | | |
| | | | | | | | | | | | | | |
| | (.19 | ) | | | (.19 | ) | | | (.16 | ) | | | (.12 | ) |
| | (.92 | ) | | | — | | | | — | | | | — | |
| | | | | | | | | | | | | | | |
| | (1.11 | ) | | | (.19 | ) | | | (.16 | ) | | | (.12 | ) |
| | | | | | | | | | | | | | | |
| $ | 22.56 | | | $ | 19.83 | | | $ | 16.76 | | | $ | 14.54 | |
| | | | | | | | | | | | | | | |
| | 20.15 | % | | | 19.59 | % | | | 16.49 | % | | | 20.26 | % |
| | | | | | | | | | | | | | |
| $ | 92,267 | | | $ | 41,856 | | | $ | 26,725 | | | $ | 32,340 | |
| $ | 65,638 | | | $ | 32,824 | | | $ | 25,857 | | | $ | 31,275 | |
| | | | | | | | | | | | | | |
| | .73 | % | | | .79 | % | | | .82 | % | | | .87 | % |
| | .73 | % | | | .79 | % | | | .82 | % | | | .87 | % |
| | 1.28 | % | | | 1.00 | % | | | .93 | % | | | 1.13 | % |
See Notes to Financial Statements.
Report of Independent Registered Public Accounting Firm
The Board of Trustees and Shareholders of Jennison Value Fund:
We have audited the accompanying statement of assets and liabilities of the Jennison Value Fund (hereafter referred to as the “Fund”), including the portfolio of investments, as of August 31, 2008, and the related statement of operations for the year then ended the statement of changes in net assets for the year ended August 31, 2008, for the period ended August 31, 2007 and for the year ended October 31, 2006 and the financial highlights for the year ended August 31, 2008, for the period ended August 31, 2007 and each of the years in the three-year period ended October 31, 2006. These financial statements and financial highlights are the responsibility of the Fund’s management. Our responsibility is to express an opinion on these financial statements and financial highlights based on our audits. The financial highlights for the year ended October 31, 2003 were audited by another independent registered public accounting firm, whose report dated December 22, 2003, expressed an unqualified opinion thereon.
We conducted our audits in accordance with the standards of the Public Company Accounting Oversight Board (United States). Those standards require that we plan and perform the audit to obtain reasonable assurance about whether the financial statements and financial highlights are free of material misstatement. An audit includes examining, on a test basis, evidence supporting the amounts and disclosures in the financial statements. Our procedures included confirmation of securities owned as of August 31, 2008, by correspondence with the custodian and brokers or by other appropriate auditing procedures when replies from brokers were not received. An audit also includes assessing the accounting principles used and significant estimates made by management, as well as evaluating the overall financial statement presentation. We believe that our audits provide a reasonable basis for our opinion.
In our opinion, the financial statements and financial highlights referred to above present fairly, in all material respects, the financial position of the Fund as of August 31, 2008, and the results of its operations for the year then ended, the changes in its net assets for the year ended August 31, 2008, the period ended August 31, 2007 and the year ended October 31, 2006 and the financial highlights for the year ended August 31, 2008, for the period ended August 31, 2007 and each of the years in the three-year period ended October 31, 2006, in conformity with U.S. generally accepted accounting principles.

New York, New York
October 27, 2008
| | |
| 54 | | Visit our website at www.jennisondryden.com |
Tax Information
(Unaudited)
We are required by the Internal Revenue Code to advise you within 60 days of the Fund’s fiscal year end (August 31, 2008) as to the federal income tax status of dividends and distributions paid by the Fund during such period. We are advising you that during its fiscal year ended August 31, 2008, the Fund paid dividends for Class A, Class B, Class C, Class L, Class M, Class R, Class X and Class Z shares of $0.200 per share, $0.060 per share, $0.060 per share, $0.160 per share, $0.060 per share, $0.160 per share, $0.060 per share, and $0.250 per share, respectively, from net investment income and $0.747 per share of short-term capital gains for Class A, Class B, Class C, Class L, Class M, Class R, Class X and Class Z shares which are taxable as ordinary income. Additionally, the Fund paid $2.450 per share of long-term capital gains for Class A, Class B, Class C, Class L, Class M, Class R, Class X and Class Z shares which are taxable as such.
As required by the Internal Revenue Code, the following percentages of ordinary income dividends paid for the fiscal year ended August 31, 2008 have been designated as 1) Qualified for the reduced tax rate (QDI) under The Job and Growth Tax Relief Reconciliation Act of 2003 2) dividends received deduction (DRD) eligible for corporate shareholders 3) interest related (QII) dividends under The American Jobs Creation Act of 2004 and 4) short-term capital gain (QSTCG) dividends under The American Jobs Creation Act of 2004:
| | | | | | | | | | | | |
| | | QDI(1) | | | DRD(2) | | | QII(3) | | | QSTCG(4) | |
| | | | |
Jennison Value Fund | | 39.56 | % | | 31.27 | % | | 0.00 | % | | 93.15 | % |
In January 2009, you will be advised on IRS 1099 DIV or substitute Form 1099, as to the Federal tax status of the distributions received by you in calendar year 2008.
For more detailed information regarding your state and local taxes, you should contact your tax advisor or the state/local taxing authorities.
MANAGEMENT OF THE FUND
(Unaudited)
Information about Fund Directors/Trustees (referred to herein as “Board Members”) and Fund Officers is set forth below. Board Members who are not deemed to be “interested persons,” as defined in the 1940 Act, are referred to as “Independent Board Members.” Board Members who are deemed to be “interested persons” are referred to as “Interested Board Members.” The Board Members are responsible for the overall supervision of the operations of the Fund and perform the various duties imposed on the directors or trustees of investment companies by the 1940 Act.
| | | | |
| Independent Board Members | | | | |
| | | |
Name, Address, Age Position(s) Portfolios Overseen (1) | | Principal Occupation(s) During Past Five Years | | Other Directorships Held |
Kevin J. Bannon (56) Board Member Portfolios Overseen: 63 | | Managing Director (since April 2008) of Highmount Capital LLC (registered investment adviser); formerly Executive Vice President and Chief Investment Officer (January 2003-August 2007) of Bank of New York Company; President (May 2003-May 2007) of BNY Hamilton Family of Mutual Funds. | | None. |
Linda W. Bynoe (56) Board Member Portfolios Overseen: 63 | | President and Chief Executive Officer (since March 1995) of Telemat Ltd. (management consulting); formerly Vice President at Morgan Stanley & Co. (broker-dealer). | | Director of Simon Property Group, Inc. (real estate investment trust) (since May 2003); Anixter International (communication products distributor) (since January 2006); Director of Northern Trust Corporation (banking) (since April 2006). |
David E.A. Carson (74) Board Member Portfolios Overseen: 63 | | Director (since May 2008) of Liberty Bank; Director (since October 2007) of ICI Mutual Insurance Company; formerly President, Chairman and Chief Executive Officer of People’s Bank (1987 – 2000). | | None. |
Michael S. Hyland, CFA (63) Board Member Portfolios Overseen: 63 | | Independent Consultant (since February 2005); formerly Senior Managing Director (July 2001-February 2005) of Bear Stearns & Co., Inc. | | None. |
Robert E. La Blanc (74) Board Member Portfolios Overseen: 63 | | President (since 1981) of Robert E. La Blanc Associates, Inc. (telecommunications). | | Director of CA, Inc. (since 2002) (software company); FiberNet Telecom Group, Inc. (since 2003) (telecom company). |
Visit our website at www.jennisondryden.com
| | | | |
Douglas H. McCorkindale (69) Board Member Portfolios Overseen: 63 | | Formerly Chairman (February 2001-June 2006), Chief Executive Officer (June 2000-July 2005), President (September 1997-July 2005) and Vice Chairman (March 1984-May 2000) of Gannett Co. Inc. (publishing and media). | | Director of Continental Airlines, Inc. (since May 1993); Director of Lockheed Martin Corp. (aerospace and defense) (since May 2001). |
Stephen P. Munn (66) Board Member Portfolios Overseen: 63 | | Lead Director (since 2007) and formerly Chairman (1993-2007) of Carlisle Companies Incorporated (manufacturer of industrial products). | | None. |
Richard A. Redeker (65) Board Member Portfolios Overseen: 63 | | Retired Mutual Fund Executive (36 years); Management Consultant; Director of Penn Tank Lines, Inc. (since 1999). | | None. |
Robin B. Smith (69) Board Member & Independent Chair Portfolios Overseen: 63 | | Chairman of the Board (since January 2003) of Publishers Clearing House (direct marketing); formerly Chairman and Chief Executive Officer (August 1996-January 2003) of Publishers Clearing House. | | Formerly Director of BellSouth Corporation (telecommunications) (1992-2006). |
Stephen G. Stoneburn (65) Board Member Portfolios Overseen: 63 | | President and Chief Executive Officer (since June 1996) of Quadrant Media Corp. (publishing company); formerly President (June 1995-June 1996) of Argus Integrated Media, Inc.; Senior Vice President and Managing Director (January 1993-1995) of Cowles Business Media; Senior Vice President of Fairchild Publications, Inc (1975-1989). | | None. |
| | |
| | | | |
| Interested Board Members | | | | |
Judy A. Rice (60) Board Member & President Portfolios Overseen: 63 | | President, Chief Executive Officer, Chief Operating Officer and Officer-In-Charge (since February 2003) of Prudential Investments LLC; President, Chief Executive Officer and Officer-In-Charge (since April 2003) of Prudential Mutual Fund Services LLC; formerly Vice President (February 1999-April 2006) of Prudential Investment Management Services LLC; formerly President, Chief Executive Officer, Chief Operating Officer and Officer-In-Charge (May 2003-June 2005) and Director (May 2003-March 2006) and Executive Vice President (June 2005-March 2006) of AST Investment Services, Inc.; Member of Board of Governors of the Investment Company Institute. | | None. |
Jennison Value Fund
| | | | |
Robert F. Gunia (61) Board Member & Vice President Portfolios Overseen: 147 | | Chief Administrative Officer (since September 1999) and Executive Vice President (since December 1996) of Prudential Investments LLC; President (since April 1999) of Prudential Investment Management Services LLC; Executive Vice President (since March 1999) and Treasurer (since May 2000) of Prudential Mutual Fund Services LLC; Chief Administrative Officer, Executive Vice President and Director (since May 2003) of AST Investment Services, Inc. | | Director (since May 1989) of The Asia Pacific Fund, Inc. and Vice President (since January 2007) of The Greater China Fund, Inc. |
1 | The year that each Board Member joined the Fund’s Board is as follows: Kevin J. Bannon, 2008; Linda W. Bynoe, 2005; David E.A. Carson, 2003; Michael S. Hyland, 2008; Robert E. La Blanc, 2003; Douglas H. McCorkindale, 1987; Stephen P. Munn, 2008; Richard A. Redeker, 1993; Robin B. Smith, 1996; Stephen G. Stoneburn, 2003; Judy A. Rice, Director since 2000 and President since 2003; Robert F. Gunia, Vice President since 1999 and Board Member since 1996. |
Visit our website at www.jennisondryden.com
| | |
| Fund Officers (a)(1) |
| | |
Name, Address and Age Position with Fund | | Principal Occupation(s) During Past Five Years |
Kathryn L. Quirk (55) Chief Legal Officer | | Vice President and Corporate Counsel (since September 2004) of Prudential; Executive Vice President, Chief Legal Officer and Secretary (since July 2005) of PI and Prudential Mutual Fund Services LLC; Vice President and Corporate Counsel (since June 2005) and Secretary (since February 2006) of AST Investment Services, Inc.; formerly Senior Vice President and Assistant Secretary (November 2004-August 2005) of PI; formerly Assistant Secretary (June 2005-February 2006) of AST Investment Services, Inc.; formerly Managing Director, General Counsel, Chief Compliance Officer, Chief Risk Officer and Corporate Secretary (1997-2002) of Zurich Scudder Investments, Inc. |
Deborah A. Docs (50) Secretary | | Vice President and Corporate Counsel (since January 2001) of Prudential; Vice President (since December 1996) and Assistant Secretary (since March 1999) of PI; formerly Vice President and Assistant Secretary (May 2003-June 2005) of AST Investment Services, Inc. |
Jonathan D. Shain (50) Assistant Secretary | | Vice President and Corporate Counsel (since August 1998) of Prudential; Vice President and Assistant Secretary (since May 2001) of PI; Vice President and Assistant Secretary (since February 2001) of PMFS; formerly Vice President and Assistant Secretary (May 2003-June 2005) of AST Investment Services, Inc. |
Claudia DiGiacomo (34) Assistant Secretary | | Vice President and Corporate Counsel (since January 2005) of Prudential; Vice President and Assistant Secretary of PI (since December 2005); Associate at Sidley Austin LLP (1999-2004). |
John P. Schwartz (37) Assistant Secretary | | Vice President and Corporate Counsel (since April 2005) of Prudential; Vice President and Assistant Secretary of PI (since December 2005); Associate at Sidley Austin LLP (1997-2005). |
Andrew R. French (45) Assistant Secretary | | Director and Corporate Counsel (since May 2006) of Prudential; Vice President and Assistant Secretary (since January 2007) of PI; Vice President and Assistant Secretary (since January 2007) of PMFS; formerly Senior Legal Analyst of Prudential Mutual Fund Law Department (1997-2006). |
Timothy J. Knierim (49) Chief Compliance Officer | | Chief Compliance Officer of Prudential Investment Management, Inc. (PIM) (since July 2007); formerly Chief Risk Officer of PIM and PI (2002-2007) and formerly Chief Ethics Officer of PIM and PI (2006-2007). |
Valerie M. Simpson (50) Deputy Chief Compliance Officer | | Chief Compliance Officer (since April 2007) of PI and AST Investment Services, Inc.; formerly Vice President-Financial Reporting (June 1999-March 2006) for Prudential Life and Annuities Finance. |
Theresa C. Thompson (46) Deputy Chief Compliance Officer | | Vice President, Mutual Fund Compliance, PI (since April 2004); and Director, Compliance, PI (2001 - 2004). |
Jennison Value Fund
| | |
Noreen M. Fierro (44) Anti-Money Laundering Compliance Officer | | Vice President, Corporate Compliance (since May 2006) of Prudential; formerly Corporate Vice President, Associate General Counsel (April 2002-May 2005) of UBS Financial Services, Inc., in their Money Laundering Prevention Group; Senior Manager (May 2005-May 2006) of Deloitte Financial Advisory Services, LLP, in their Forensic and Dispute Services, Anti-Money Laundering Group. |
Grace C. Torres (49) Treasurer and Principal Financial and Accounting Officer | | Assistant Treasurer (since March 1999) and Senior Vice President (since September 1999) of PI; Assistant Treasurer (since May 2003) and Vice President (since June 2005) of AST Investment Services, Inc.; Senior Vice President and Assistant Treasurer (since May 2003) of Prudential Annuities Advisory Services, Inc.; formerly Senior Vice President (May 2003-June 2005) of AST Investment Services, Inc. |
M. Sadiq Peshimam (44) Assistant Treasurer | | Vice President (since 2005) and Director (2000-2005) within Prudential Mutual Fund Administration. |
Peter Parrella (50) Assistant Treasurer | | Vice President (since 2007) and Director (2004-2007) within Prudential Mutual Fund Administration; formerly Tax Manager at SSB Citi Fund Management LLC (1997-2004). |
(a) | Excludes interested Board Members who also serve as President or Vice President. |
1 | The year that each individual became an Officer of the Fund is as follows: |
Kathryn L. Quirk, 2005; Deborah A. Docs, 2005; Timothy J. Knierim, 2007; Valerie M. Simpson, 2007; Theresa C. Thompson, 2008; Grace C. Torres, 1997; Noreen M. Fierro, 2006; Jonathan D. Shain, 2005; Claudia DiGiacomo, 2005; Andrew R. French, 2006; John P. Schwartz, 2006; Peter Parrella, 2007; M. Sadiq Peshimam, 2006.
Explanatory Notes
| • | | Board Members are deemed to be “Interested,” as defined in the 1940 Act, by reason of their affiliation with Prudential Investments LLC and/or an affiliate of Prudential Investments LLC. |
| • | | Unless otherwise noted, the address of all Board Members and Officers is c/o Prudential Investments LLC, Gateway Center Three, 100 Mulberry Street, Newark, New Jersey 07102. |
| • | | There is no set term of office for Board Members or Officers. The Board Members have adopted a retirement policy, which calls for the retirement of Board Members on December 31st of the year in which they reach the age of 75. |
| • | | “Other Directorships Held” includes only directorships of companies required to register or file reports with the SEC under the Securities Exchange Act of 1934 (that is, “public companies”) or other investment companies registered under the 1940 Act. |
| • | | “Portfolios Overseen” includes all investment companies managed by Prudential Investments LLC. The investment companies for which PI serves as manager include the JennisonDryden Funds, Strategic Partners Funds, The Prudential Variable Contract Accounts, The Target Portfolio Trust, The Prudential Series Fund, The High Yield Income Fund, Inc., The High Yield Plus Fund, Inc., Nicholas-Applegate Fund, Inc., Prudential’s Gibraltar Fund, Inc. and the Advanced Series Trust. |
Visit our website at www.jennisondryden.com
Approval of Advisory Agreements
The Board of Trustees (the “Board”) of JennisonDryden Portfolios oversees the management of the Jennison Value Fund (the “Fund”) and, as required by law, determines annually whether to renew the Fund’s management agreement with Prudential Investments LLC (“PI”) and the Fund’s subadvisory agreement with Jennison Associates LLC (“Jennison”). In considering the renewal of the agreements, the Board, including all of the Independent Trustees, met on June 3-5, 2008 and approved the renewal of the agreements through July 31, 2009, after concluding that renewal of the agreements was in the best interests of the Fund and its shareholders.
In advance of the meetings, the Board received materials relating to the agreements, and had the opportunity to ask questions and request further information in connection with their consideration. Among other things, the Board considered comparisons with other mutual funds in relevant Peer Universes and Peer Groups. The mutual funds included in each Peer Universe or Peer Group were objectively determined solely by Lipper Inc., an independent provider of mutual fund data. The comparisons placed the Fund in various quartiles over the one-, three-, five- and ten-year periods ending December 31, 2007, with the first quartile being the best 25% of the mutual funds (for performance, the best performing mutual funds and, for expenses, the lowest cost mutual funds).
In approving the agreements, the Board, including the Independent Trustees advised by independent legal counsel, considered the factors they deemed relevant, including the nature, quality and extent of services provided, the performance of the Fund, the profitability of PI and its affiliates, expenses and fees, and the potential for economies of scale that may be shared with the Fund and its shareholders. In their deliberations, the Trustees did not identify any single factor which alone was responsible for the Board’s decision to approve the agreements with respect to the Fund. In connection with their deliberations, the Board considered information provided by PI throughout the year at regular Board meetings, presentations from portfolio managers and other information, as well as information furnished at or in advance of the meetings on June 3-5, 2008.
The Trustees determined that the overall arrangements between the Fund and PI, which serves as the Fund’s investment manager pursuant to a management agreement, and between PI and Jennison, which serves as the Fund’s subadviser pursuant to the terms of a subadvisory agreement with PI, are fair and reasonable in light of the services performed, fees charged and such other matters as the Trustees considered relevant in the exercise of their business judgment.
Approval of Advisory Agreements (continued)
The material factors and conclusions that formed the basis for the Trustees’ reaching their determinations to approve the continuance of the agreements are separately discussed below.
Nature, Quality and Extent of Services
The Board received and considered information regarding the nature and extent of services provided to the Fund by PI and Jennison. The Board considered the services provided by PI, including but not limited to the oversight of the subadviser for the Fund, as well as the provision of fund recordkeeping, compliance, and other services to the Fund. With respect to PI’s oversight of the subadviser, the Board noted that PI’s Strategic Investment Research Group (“SIRG”), which is a business unit of PI, is responsible for monitoring and reporting to PI’s senior management on the performance and operations of the subadviser. The Board also considered that PI pays the salaries of all of the officers and non-independent Trustees of the Fund. The Board also considered the investment subadvisory services provided by Jennison, as well as adherence to the Fund’s investment restrictions and compliance with applicable Fund policies and procedures. The Board considered PI’s evaluation of the subadviser as well as PI’s recommendation, based on its review of the subadviser, to renew the subadvisory agreement.
The Board reviewed the qualifications, backgrounds and responsibilities of PI’s senior management responsible for the oversight of the Fund and Jennison, and also reviewed the qualifications, backgrounds and responsibilities of Jennison’s portfolio managers who are responsible for the day-to-day management of the Fund’s portfolio. The Board was provided with information pertaining to PI’s and Jennison’s organizational structure, senior management, investment operations, and other relevant information pertaining to both PI and Jennison. The Board also noted that it received favorable compliance reports from the Fund’s Chief Compliance Officer (“CCO”) as to both PI and Jennison. The Board noted that Jennison is affiliated with PI.
The Board concluded that it was satisfied with the nature, extent and quality of the investment management services provided by PI and the subadvisory services provided to the Fund by Jennison, and that there was a reasonable basis on which to conclude that the Fund benefits from the services provided by PI and Jennison under the management and subadvisory agreements.
| | |
| | Visit our website at www.jennisondryden.com |
Performance of Jennison Value Fund
The Board received and considered information about the Fund’s historical performance. The Board considered that the Fund’s gross performance in relation to its Peer Universe (the Lipper Large-Cap Value Funds Performance Universe)1 was in the first quartile for the three- and five-year periods, in the second quartile for the ten-year period, and in the third quartile for the one-year period. The Board further noted that the Fund outperformed against its benchmark index for the one-, three-, five- and ten-year periods. The Board concluded that, in light of the Fund’s competitive performance, it would be in the interest of the Fund and its shareholders to renew the agreements.
Fees and Expenses
The Board considered that the Fund’s actual management fee (which reflects any subsidies, expense caps or waivers) ranked in the Expense Group’s second quartile and that the Fund’s total expenses ranked in the Expense Group’s first quartile. In light of the Fund’s total expense ranking and the fact that the Fund’s expenses were below 0.75% (excluding 12b-1 fees), the Board concurred with PI’s recommendation to remove the existing management fee waiver which provided for a waiver of up to 1 basis point of the management fee to the extent that Fund expenses exceed 0.75% (exclusive of 12b-1 fees and certain other fees), with the removal of the waiver effective as of July 1, 2008. The Board concluded that the management and subadvisory fees are reasonable in light of the services provided.
Costs of Services and Profits Realized by PI
The Board was provided with information on the profitability of PI and its affiliates in serving as the Fund’s investment manager. The Board discussed with PI the methodology utilized in assembling the information regarding profitability and considered its reasonableness. The Board recognized that it is difficult to make comparisons of profitability from fund management contracts because comparative information is not generally publicly available and is affected by numerous factors, including the structure of the particular adviser, the types of funds it manages, its business mix, numerous assumptions regarding allocations and the adviser’s capital structure and cost of capital. The Board did not separately consider the profitability of the subadviser, an affiliate of PI, as its profitability was reflected in the profitability report for PI. Taking these factors into account, the Board concluded that the profitability of PI and its affiliates in relation to the services rendered was not unreasonable.
1 The Fund was compared to the Lipper Large-Cap Value Funds Performance Universe, although Lipper classifies the Fund in the Multi-Cap Value Funds Performance Universe. The Fund was compared to the Lipper Large-Cap Value Funds Performance Universe because PI believes that the funds included in this Universe provide a more appropriate basis for Fund performance comparisons.
Approval of Advisory Agreements (continued)
Economies of Scale
The Board noted that the management fee schedule for the Fund includes breakpoints, which have the effect of decreasing the fee rate as assets increase, and that at its current level of assets the Fund’s effective fee rate reflected some of those rate reductions. The Board received and discussed information concerning whether PI realizes economies of scale as the Fund’s assets grow beyond current levels. The Board took note that the Fund’s fee structure currently results in benefits to Fund shareholders whether or not PI realizes any economies of scale.
Other Benefits to PI and Jennison
The Board considered potential ancillary benefits that might be received by PI and Jennison and their affiliates as a result of their relationship with the Fund. The Board concluded that potential benefits to be derived by PI included brokerage commissions received by affiliates of PI, transfer agency fees received by the Fund’s transfer agent (which is affiliated with PI), as well as benefits to the reputation or other intangible benefits resulting from PI’s association with the Fund. The Board concluded that the potential benefits to be derived by Jennison included its ability to use soft dollar credits, brokerage commissions received by affiliates of Jennison, as well as the potential benefits consistent with those generally resulting from an increase in assets under management, specifically, potential access to additional research resources and benefits to the reputation. The Board concluded that the benefits derived by PI and Jennison were consistent with the types of benefits generally derived by investment managers and subadvisers to mutual funds.
After full consideration of these factors, the Board concluded that the approval of the agreements was in the best interest of the Fund and its shareholders.
| | |
| | Visit our website at www.jennisondryden.com |
Growth of a $10,000 Investment
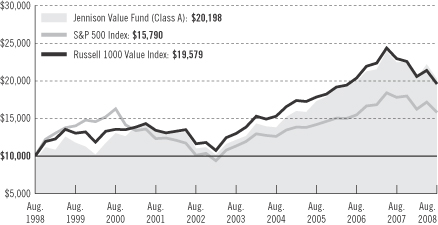
| | | | | | | | | | | |
| Average Annual Total Returns (With Sales Charges) as of 8/31/08 |
| | | One Year | | | Five Years | | | Ten Years | | | Since Inception |
Class A | | –14.90 | % | | 9.49 | % | | 7.28 | % | | — |
Class B | | –14.44 | | | 9.76 | | | 7.08 | | | — |
Class C | | –11.42 | | | 9.90 | | | 7.08 | | | — |
Class L | | –15.33 | | | N/A | | | N/A | | | –7.59% (3/19/07) |
Class M | | –15.10 | | | N/A | | | N/A | | | –7.00 (3/19/07) |
Class R | | –10.12 | | | N/A | | | N/A | | | 7.18 (6/3/05) |
Class X | | –14.93 | | | N/A | | | N/A | | | –6.88 (3/19/07) |
Class Z | | –9.72 | | | 11.00 | | | 8.16 | | | — |
| | | | | | | | | | | |
| Average Annual Total Returns (Without Sales Charges) as of 8/31/08 |
| | | One Year | | | Five Years | | | Ten Years | | | Since Inception |
Class A | | –9.95 | % | | 10.73 | % | | 7.89 | % | | — |
Class B | | –10.65 | | | 9.90 | | | 7.08 | | | — |
Class C | | –10.66 | | | 9.90 | | | 7.08 | | | — |
Class L | | –10.17 | | | N/A | | | N/A | | | –3.76% (3/19/07) |
Class M | | –10.55 | | | N/A | | | N/A | | | –4.20 (3/19/07) |
Class R | | –10.12 | | | N/A | | | N/A | | | 7.18 (6/3/05) |
Class X | | –10.38 | | | N/A | | | N/A | | | –4.07 (3/19/07) |
Class Z | | –9.72 | | | 11.00 | | | 8.16 | | | — |
Performance data quoted represent past performance. Past performance does not guarantee future results. The investment return and principal value of an investment
| | |
| | Visit our website at www.jennisondryden.com |
will fluctuate, so that an investor’s shares, when redeemed, may be worth more or less than their original cost. Current performance may be lower or higher than the past performance data quoted. An investor may obtain performance data as of the most recent month-end by visiting our website at www.jennisondryden.com or by calling (800) 225-1852. Class A and Class L shares have a maximum initial sales charge of 5.50% and 5.75%, respectively. Gross operating expenses: Class A, 1.03%; Class B, 1.73%; Class C, 1.73%; Class L, 1.23%; Class M, 1.73%; Class R, 1.48%; Class X, 1.02%; Class Z, 0.73%. Net operating expenses apply to: Class A, 1.00%; Class B, 1.73%; Class C, 1.73%; Class L, 1.23%; Class M, 1.73%; Class R, 1.23%; Class X, 1.02%; Class Z, 0.73%, after contractual reduction through 2/29/2008 for Class A shares and 12/31/2009 for Class R shares.
The returns in the graph and the tables do not reflect the deduction of taxes that a shareholder would pay on Fund distributions or following the redemption of Fund shares.
Source: Prudential Investments LLC and Lipper Inc.
Inception date returns are provided for any share class with less than 10 years of returns.
The graph compares a $10,000 investment in the Jennison Value Fund (Class A shares) with a similar investment in the S&P 500 Index and the Russell 1000 Value Index by portraying the initial account values at the beginning of the 10-year period for Class A shares (August 31, 1998) and the account values at the end of the current fiscal year (August 31, 2008) as measured on a quarterly basis. For purposes of the graph, and unless otherwise indicated, it has been assumed that (a) the maximum applicable front-end sales charge was deducted from the initial $10,000 investment in Class A shares; (b) all recurring fees (including management fees) were deducted; and (c) all dividends and distributions were reinvested. The line graph provides information for Class A shares only. As indicated in the tables provided earlier, performance for Class B, Class C, Class L, Class M, Class R, Class X, and Class Z shares will vary due to the differing charges and expenses applicable to each share class (as indicated in the following paragraphs). Without a distribution and service (12b-1) fee waiver of 0.05% for Class A shares through August 31, 2008, the returns shown in the graph and for Class A shares in the tables would have been lower.
The S&P 500 Index is an unmanaged index of 500 stocks of large U.S. companies. It gives a broad look at how stock prices have performed in the United States. The Russell 1000 Value Index is an unmanaged index comprising those securities in the Russell 1000 Index with a lesser-than-average growth orientation. Companies in this index generally have low price-to-book and price-to-earnings ratios, higher dividend yields, and lower forecasted growth values. The Indexes’ total returns include the reinvestment of all dividends, but do not include the effects of sales charges, operating expenses of a mutual fund, or taxes. These returns would be lower if they included the effects of sales charges, operating expenses, or taxes. The securities that comprise these indexes may differ substantially from the securities in the Fund. These are not the only indexes that may be used to characterize performance of large-capitalization stock funds. Other indexes may portray different comparative performance. Investors cannot invest directly in an index.
Class A and Class L shares are subject to a maximum front-end sales charge of 5.50% and 5.75%, respectively, and a 12b-1 fee of up to 0.30% and 0.50%, respectively, annually. Investors who purchase Class A or Class L shares in an amount of $1 million or more do not pay a front-end sales charge, but are subject to a contingent
Growth of a $10,000 Investment (continued)
deferred sales charge (CDSC) of 1% for shares sold within 12 months of purchase; in certain circumstances. Class B shares are subject to a declining CDSC of 5%, 4%, 3%, 2%, 1%, and 1%, respectively, for the first six years after purchase and a 12b-1 fee of 1% annually. Approximately seven years after purchase, Class B shares will automatically convert to Class A shares on a quarterly basis. Class C shares purchased are not subject to a front-end sales charge, but are subject to a CDSC of 1% for shares sold within 12 months from the date of purchase, and an annual 12b-1 fee of 1%. Class M and Class X shares purchased are not subject to a front-end sales charge, but are subject to a CDSC of 6% and a 12b-1 fee of 1%. The CDSC for Class M and Class X shares decreases by 1% annually to 2% in the fifth and sixth years after purchase, 1% in the seventh year and 0% in the eighth year after purchase. Class M and Class X shares convert to Class A shares approximately eight years after purchase. Class R shares are not subject to a sales charge, but charge a 12b-1 fee of up to 0.75%. Class Z shares are not subject to a sales charge or 12b-1 fees. The returns in the graph and tables reflect the share class expense structure in effect at the close of the fiscal period. Without waiver of fees and/or expense subsidization, the Fund’s returns would have been lower.
| | |
| | Visit our website at www.jennisondryden.com |
| | | | |
| n MAIL | | n TELEPHONE | | n WEBSITE |
Gateway Center Three 100 Mulberry Street Newark, NJ 07102 | | (800) 225-1852 | | www.jennisondryden.com |
|
| PROXY VOTING |
| The Board of Trustees of the Fund has delegated to the Fund’s investment subadviser the responsibility for voting any proxies and maintaining proxy recordkeeping with respect to the Fund. A description of these proxy voting policies and procedures is available without charge, upon request, by calling (800) 225-1852 or by visiting the Securities and Exchange Commission’s website at www.sec.gov. Information regarding how the Fund voted proxies relating to portfolio securities during the most recent 12-month period ended June 30 is available on the Fund’s website and on the Commission’s website. |
|
| TRUSTEES |
| Kevin J. Bannon • Linda W. Bynoe • David E.A. Carson • Robert F. Gunia • Michael S. Hyland • Robert E. La Blanc • Douglas H. McCorkindale • Stephen P. Munn • Richard A. Redeker • Judy A. Rice • Robin B. Smith • Stephen G. Stoneburn |
|
| OFFICERS |
| Judy A. Rice, President • Robert F. Gunia, Vice President • Grace C. Torres, Treasurer and Principal Financial and Accounting Officer • Kathryn L. Quirk, Chief Legal Officer • Deborah A. Docs, Secretary • Timothy J. Knierim, Chief Compliance Officer • Valerie M. Simpson, Deputy Chief Compliance Officer • Theresa C. Thompson, Deputy Chief Compliance Officer • Noreen M. Fierro, Anti-Money Laundering Compliance Officer • Jonathan D. Shain, Assistant Secretary • Claudia DiGiacomo, Assistant Secretary • John P. Schwartz, Assistant Secretary • Andrew R. French, Assistant Secretary • M. Sadiq Peshimam, Assistant Treasurer • Peter Parrella, Assistant Treasurer |
| | | | |
| MANAGER | | Prudential Investments LLC | | Gateway Center Three
100 Mulberry Street Newark, NJ 07102 |
|
| INVESTMENT SUBADVISER | | Jennison Associates LLC | | 466 Lexington Avenue
New York, NY 10017 |
|
| DISTRIBUTOR | | Prudential Investment
Management Services LLC | | Gateway Center Three
100 Mulberry Street
Newark, NJ 07102 |
|
| CUSTODIAN | | The Bank of New York Mellon | | One Wall Street
New York, NY 10286 |
|
| TRANSFER AGENT | | Prudential Mutual Fund
Services LLC | | PO Box 9658
Providence, RI 02940 |
|
INDEPENDENT REGISTERED
PUBLIC ACCOUNTING FIRM | | KPMG LLP | | 345 Park Avenue
New York, NY 10154 |
|
| FUND COUNSEL | | Willkie Farr & Gallagher LLP | | 787 Seventh Avenue
New York, NY 10019 |
|
| An investor should consider the investment objectives, risks, charges, and expenses of the Fund carefully before investing. The prospectus for the Fund contains this and other information about the Fund. An investor may obtain a prospectus by visiting our website at www.jennisondryden.com or by calling (800) 225-1852. The prospectus should be read carefully before investing. |
|
| E-DELIVERY |
| To receive your mutual fund documents on-line, go to www.icsdelivery.com/prudential/funds and enroll. Instead of receiving printed documents by mail, you will receive notification via e-mail when new materials are available. You can cancel your enrollment or change your e-mail address at any time by clicking on the change/cancel enrollment option at the icsdelivery website address. |
|
| SHAREHOLDER COMMUNICATIONS WITH TRUSTEES |
| Shareholders can communicate directly with the Board of Trustees by writing to the Chair of the Board, Jennison Value Fund, Prudential Investments, Attn: Board of Trustees, 100 Mulberry Street, Gateway Center Three, Newark, NJ 07102. Shareholders can communicate directly with an individual Trustee by writing to the same address. Communications are not screened before being delivered to the addressee. |
|
| AVAILABILITY OF PORTFOLIO SCHEDULE |
| The Fund files its complete schedule of portfolio holdings with the Securities and Exchange Commission for the first and third quarters of each fiscal year on Form N-Q. The Fund’s Forms N-Q are available on the Commission’s website at www.sec.gov. The Fund’s Forms N-Q may also be reviewed and copied at the Commission’s Public Reference Room in Washington, D.C. Information on the operation and location of the Public Reference Room may be obtained by calling (800) SEC-0330 (732-0330). The Fund’s schedule of portfolio holdings is also available on the Fund’s website as of the end of each fiscal quarter. |
|
| The Fund’s Statement of Additional Information contains additional information about the Fund’s Trustees and is available without charge, upon request, by calling (800) 225-1852. |
Mutual Funds:
| | | | |
| ARE NOT INSURED BY THE FDIC OR ANY FEDERAL GOVERNMENT AGENCY | | MAY LOSE VALUE | | ARE NOT A DEPOSIT OF OR GUARANTEED BY ANY BANK OR ANY BANK AFFILIATE |

| | | | | | | | | | | | | | | | | | | | |
| Jennison Value Fund | | | | | | | | | | | | | | |
| | Share Class | | A | | B | | C | | L | | M | | R | | X | | Z | | |
| | NASDAQ | | PBEAX | | PBQIX | | PEICX | | N/A | | N/A | | JDVRX | | N/A | | PEIZX | | |
| | CUSIP | | 476297106 | | 476297205 | | 476297304 | | 476297601 | | 476297700 | | 476297502 | | 476297809 | | 476297403 | | |
| | | | | | | | | | | | | | | | | | | | |
MF131E IFS-A156659 Ed. 10/2008


| | |
| AUGUST 31, 2008 | | ANNUAL REPORT |
Dryden US Equity Active Extension Fund
FUND TYPE
Large-capitalization stock
OBJECTIVE
Long-term capital appreciation
This report is not authorized for distribution to prospective investors unless preceded or accompanied by a current prospectus.
The views expressed in this report and information about the Fund’s portfolio holdings are for the period covered by this report and are subject to change thereafter.
JennisonDryden, Dryden, Prudential Financial and the Rock Prudential logo are registered service marks of The Prudential Insurance Company of America, Newark, NJ, and its affiliates.

October 15, 2008
Dear Shareholder:
We hope you find the annual report for the Dryden US Equity Active Extension Fund informative and useful. As a JennisonDryden mutual fund shareholder, you may be thinking about where you can find additional growth opportunities. You could invest in last year’s top-performing asset class and hope that history repeats itself or you could stay in cash while waiting for the “right moment” to invest.
Instead, we believe it is better to take advantage of developing domestic and global investment opportunities through a diversified portfolio of stock and bond mutual funds. A diversified asset allocation offers two potential advantages. It helps you manage downside risk by not being overly exposed to any particular asset class, plus it gives you a better opportunity to have at least some of your assets in the right place at the right time. Your financial professional can help you create a diversified investment plan that may include mutual funds covering all the basic asset classes and that reflects your personal investor profile and tolerance for risk. Keep in mind that diversification and asset allocation do not assure against loss in declining markets.
JennisonDryden Mutual Funds gives you a wide range of choices that can help you make progress toward your financial goals. Our funds offer the experience, resources, and professional discipline of four leading asset managers. They are recognized and respected in the institutional market and by discerning investors for excellence in their respective strategies. JennisonDryden equity funds are advised by Jennison Associates LLC, Quantitative Management Associates LLC (QMA), or PREI® (Prudential Real Estate Investors). Prudential Investment Management, Inc. (PIM) advises the JennisonDryden fixed income and money market funds. Jennison Associates, QMA, and PIM are registered investment advisers and Prudential Financial companies. PREI is a registered investment adviser and a unit of PIM.
Thank you for choosing JennisonDryden Mutual Funds.
Sincerely,

Judy A. Rice, President
Dryden US Equity Active Extension Fund
| | |
| Dryden US Equity Active Extension Fund | | 1 |
Your Fund’s Performance
Fund objective
The investment objective of the Dryden US Equity Active Extension Fund is capital appreciation. There can be no assurance that the Fund will achieve its investment objective.
Performance data quoted represent past performance. Past performance does not guarantee future results. The investment return and principal value of an investment will fluctuate, so that an investor’s shares, when redeemed, may be worth more or less than their original cost. Current performance may be lower or higher than the past performance data quoted. An investor may obtain performance data as of the most recent month-end by visiting our website at www.jennisondryden.com or by calling (800) 225-1852. Class A shares have a maximum initial sales charge of 5.50%. Gross operating expenses: Class A, 2.93%; Class Z, 2.63%. Net operating expenses apply to: Class A, 1.89%; Class Z, 1.64%, after contractual reduction through 12/31/2009.
| | | | | | |
| Cumulative Total Returns as of 8/31/08 | |
| | | Six Months | | | Since Inception1 | |
Class A | | –3.31 | % | | –12.50 | % |
Class Z | | –3.31 | | | –12.40 | |
Russell 1000 Index2 | | –2.36 | | | –11.02 | |
Lipper Extended U.S. Large-Cap Core Funds Avg.3 | | –4.36 | | | –13.39 | |
| | |
| Average Annual Total Returns4 as of 9/30/08 |
| | | Since Inception1 |
Class A | | N/A |
Class Z | | N/A |
Russell 1000 Index2 | | N/A |
Lipper Extended U.S. Large-Cap Core Funds Avg.3 | | N/A |
The cumulative total returns do not reflect the deduction of applicable sales charges. If reflected, the applicable sales charges would reduce the cumulative total returns performance quoted. The average annual total returns assume the payment of the maximum applicable sales charge. Class A shares are subject to a maximum front-end sales charge of 5.50%. Under certain circumstances, Class A shares may be subject to a contingent deferred sales charge (CDSC) of 1%. Class Z shares are not subject to a sales charge.
Source: Prudential Investments LLC and Lipper Inc. Performance figures may reflect fee waivers and/or expense reimbursements. In the absence of such fee waivers and/or expense reimbursements, total returns would be lower.
1Inception date: 12/27/07.
| | |
| 2 | | Visit our website at www.jennisondryden.com |
2The Russell 1000 Index includes the 1,000 largest companies in the Russell 3000 Index. The Russell 1000 Index represents the universe of stocks from which most active money managers typically select. The Russell 1000 Index return reflects adjustments for income dividends and capital gains distributions reinvested as of the ex-dividend dates.
3Lipper Extended U.S. Large-Cap Core Funds Average (Lipper Average) are Funds that combine long and short stock selection to invest in a diversified portfolio of U.S. large-cap equities, with a target net exposure of 100% long.
4The average annual total returns take into account applicable sales charges. Class A shares are subject to an annual distribution and service (12b-1) fee of up to 0.25%. Class Z shares are not subject to a 12b-1 fee. The returns in the tables do not reflect the deduction of taxes that a shareholder would pay on Fund distributions or following the redemption of Fund shares.
Investors cannot invest directly in an index. The returns for the Russell 1000 Index and the Lipper Average would be lower if they included the effects of sales charges, operating expenses of a mutual fund, or taxes. Returns for the Lipper Average reflect the deduction of operating expenses, but not sales charges or taxes.
| | | |
| Five Largest Holdings expressed as a percentage of net assets as of 8/31/08 | | | |
Exxon Mobil Corp., Oil, Gas & Consumable Fuels | | 3.6 | % |
Microsoft Corp., Software | | 2.3 | |
General Electric Co., Industrial Conglomerates | | 2.0 | |
Procter & Gamble Co., Household Products | | 1.9 | |
Chevron Corp., Oil, Gas & Consumable Fuels | | 1.9 | |
Holdings reflect only long-term investments and are subject to change.
| | | |
| Five Largest Industries expressed as a percentage of net assets as of 8/31/08 | | | |
Oil, Gas & Consumable Fuels | | 12.8 | % |
Pharmaceuticals | | 6.9 | |
Semiconductors & Semiconductor Equipment | | 6.4 | |
Insurance | | 5.7 | |
Energy Equipment & Services | | 5.3 | |
Industry weightings reflect only long-term investments and are subject to change.
| | |
| Dryden US Equity Active Extension Fund | | 3 |
Strategy and Performance Overview
How did the Fund perform?
The Dryden US Equity Active Extension Fund began offering shares to investors on December 27, 2007. From this date through August 31, 2008, the Fund’s Class A shares declined 12.50%, which was more than the 11.02% decline of the Russell 1000 Index (the Index) but less than the 13.39% decline of the Lipper Extended U.S. Large-Cap Core Funds Average.
How is the Fund managed?
Quantitative Management Associates LLC (QMA) manages the Fund, which employs a two-pronged active extension strategy. On the one hand, the Fund goes long by buying shares of companies that QMA believes will increase in value. On the other hand, the Fund sells stocks short, i.e., it borrows shares and then sells them in the hope that they can be bought back at a cheaper price. In this way, the Fund can potentially profit from declining share prices. However, if the price of the stock goes up, a short sale can result in a loss, since the Fund would have to buy the stock back at a higher price than it was sold. The Fund uses proceeds from short selling to purchase additional shares that QMA expects to gain in value, resulting in a targeted weight of up to 130% of its assets in long positions and 30% in short positions, with a targeted 100% net exposure to the stock market.
The active extension strategy allows QMA greater flexibility to exploit positive and negative information about stocks that it uncovers through research. QMA believes focusing on valuation measures for stocks with slow earnings growth, and indications of positive or negative “news” for stocks with fast earnings growth is an effective way to identify which shares will outperform or underperform the broader stock market in coming months. This investment process also closely monitors how each holding affects the Fund’s ability to perform better than the Index.
What were conditions like in the U.S. stock market?
Conditions in the U.S. stock market were very challenging. Rising delinquencies and foreclosures on subprime mortgages in the United States caused a burgeoning credit crisis in which commercial banks and securities firms have already taken massive write-downs on debt securities linked to the risky home loans. As the credit crisis continued, the inventory of houses for sale climbed, home prices tumbled, the U.S. economy shed thousands of jobs, consumer confidence sank, and corporate earnings declined. Commercial banks grew increasingly reluctant to lend to businesses and individuals. Economic growth was further threatened by the rising cost of commodities such as crude oil, which briefly soared to more than $140 per barrel on the back of strong demand from China and other economically developing nations.
| | |
| 4 | | Visit our website at www.jennisondryden.com |
During the reporting period, the Federal Reserve (the Fed) repeatedly cut short-term interest rates in the hope that sharply lower borrowing costs might stimulate economic growth in the United States and thus help steady financial markets. Consequently, its target for the federal funds rate charged on overnight loans between banks declined to 2.00% in April 2008 from 4.25% in December 2007. It also took unusual steps to aid the embattled financial sector. Most notably, it facilitated the hurried purchase of Bear Stearns Cos. by J.P. Morgan Chase & Co. as the former careened toward bankruptcy.
Among stocks of large companies tracked by the Index, growth shares beat value shares, though both ended the reporting period in the red along with the broader U.S. stock market. All 10 sectors in the Index declined. Not surprisingly, financials posted the largest loss, tumbling more than 20.0%. Others that suffered double-digit drops included telecommunications and information technology.
The remaining seven sectors posted single-digit losses. Industrials and utilities both declined more than 9.0%. Consumer discretionary was next in line, pressured by fear that the U.S. economy, driven largely by consumer spending, might already be in a recession. It was followed by healthcare and energy, which ended in negative territory as the price of crude oil in July and August slid back towards the crucial threshold of $100 per barrel. Materials and consumer staples posted the smallest declines for the reporting period. The latter’s defensive attributes may have helped limit its loss as demand for products of companies in the consumer staples sector tends to hold up relatively well in tough economic times.
Which stock market sectors and holdings detracted most from the Fund’s return?
The Fund held stocks in all four categories of earnings growth—slow, moderately slow, fast, and moderately fast. Of the four, poor security selection among stocks with slow or moderately fast earnings growth detracted from the Fund’s return because these shares did not perform as predicted by QMA’s quantitative model. For example, the “news” indicator in the quantitative model, which is driven by revisions of earnings estimates, did not accurately predict returns for moderately fast growing stocks. As it turned out, stocks with “poor” news managed to outperform companies with “good” news.
The Fund also held shares of small companies, middle-sized companies, and large companies. Of these, it was poor stock selection among small- and mid-cap stocks that detracted from the Fund’s return. From the perspective of market sectors, exposure to industrials and the deeply troubled financials sector detracted most from the Fund’s return for the reporting period.
| | |
| Dryden US Equity Active Extension Fund | | 5 |
Strategy and Performance Overview (continued)
Which stock market sectors and holdings contributed most to the Fund’s return?
The Fund benefited most from favorable security selection among shares with the fastest earnings growth such as Millenium Pharmaceuticals (up 65% for the reporting period) and among large-cap stocks such as Cypress Semiconductor. The Fund had an underweight exposure to Cypress, which declined 61% for the reporting period.
From the perspective of sector allocation, the Fund benefited most from good stock selection within the information technology and energy sectors. Most notably, the Fund held shares of Google Inc., Micron Technology, and Apple Inc., which performed relatively well in the former sector, and shares of Exterran Holdings and Sandridge Energy, which performed relatively well in the latter sector.
| | |
| 6 | | Visit our website at www.jennisondryden.com |
Fees and Expenses (Unaudited)
As a shareholder of the Fund, you incur two types of costs: (1) transaction costs, including sales charges (loads) on purchase payments and redemptions, as applicable, and (2) ongoing costs, including management fees, distribution and/or service (12b-1) fees, and other Fund expenses, as applicable. This example is intended to help you understand your ongoing costs (in dollars) of investing in the Fund and to compare these costs with the ongoing costs of investing in other mutual funds.
The example is based on an investment of $1,000 invested on March 1, 2008, at the beginning of the period, and held through the six-month period ended August 31, 2008. The example is for illustrative purposes only; you should consult the Prospectus for information on initial and subsequent minimum investment requirements.
The Fund’s transfer agent may charge additional fees to holders of certain accounts that are not included in the expenses shown in the table on the following page. These fees apply to individual retirement accounts (IRAs) and Section 403(b) accounts. As of the close of the six-month period covered by the table, IRA fees included an annual maintenance fee of $15 per account (subject to a maximum annual maintenance fee of $25 for all accounts held by the same shareholder). Section 403(b) accounts are charged an annual $25 fiduciary maintenance fee. Some of the fees may vary in amount, or may be waived, based on your total account balance or the number of JennisonDryden funds, including the Fund, that you own. You should consider the additional fees that were charged to your Fund account over the six-month period when you estimate the total ongoing expenses paid over the period and the impact of these fees on your ending account value, as these additional expenses are not reflected in the information provided in the expense table. Additional fees have the effect of reducing investment returns.
Actual Expenses
The first line for each share class in the table on the following page provides information about actual account values and actual expenses. You may use the information on this line, together with the amount you invested, to estimate the expenses that you paid over the period. Simply divide your account value by $1,000 (for example, an $8,600 account value ÷ $1,000 = 8.6), then multiply the result by the number on the first line under the heading “Expenses Paid During the Six-Month Period” to estimate the expenses you paid on your account during this period.
Hypothetical Example for Comparison Purposes
The second line for each share class in the table on the following page provides information about hypothetical account values and hypothetical expenses based on
the Fund’s actual expense ratio and an assumed rate of return of 5% per year before
| | |
| Dryden US Equity Active Extension Fund | | 7 |
Fees and Expenses (continued)
expenses, which is not the Fund’s actual return. The hypothetical account values and expenses may not be used to estimate the actual ending account balance or expenses you paid for the period. You may use this information to compare the ongoing costs of investing in the Fund and other funds. To do so, compare this 5% hypothetical example with the 5% hypothetical examples that appear in the shareholder reports of the other funds.
Please note that the expenses shown in the table are meant to highlight your ongoing costs only and do not reflect any transactional costs such as sales charges (loads). Therefore, the second line for each share class in the table is useful in comparing ongoing costs only and will not help you determine the relative total costs of owning different funds. In addition, if these transactional costs were included, your costs would have been higher.
| | | | | | | | | | | | | | |
Dryden US Equity Active
Extension Fund | | Beginning Account
Value March 1, 2008 | | Ending Account
Value
August 31, 2008 | | Annualized
Expense Ratio
Based on the
Six-Month Period | | | Expenses Paid
During the
Six-Month Period* |
| | | | | | | | | | | | | | |
| Class A | | Actual | | $ | 1,000.00 | | $ | 966.90 | | 1.92 | % | | $ | 9.49 |
| | | Hypothetical | | $ | 1,000.00 | | $ | 1,015.48 | | 1.92 | % | | $ | 9.73 |
| | | | | | | | | | | | | | |
| Class Z | | Actual | | $ | 1,000.00 | | $ | 966.90 | | 1.67 | % | | $ | 8.26 |
| | | Hypothetical | | $ | 1,000.00 | | $ | 1,016.74 | | 1.67 | % | | $ | 8.47 |
* Fund expenses (net of fee waivers or subsidies, if any) for each share class are equal to the annualized expense ratio for each share class (provided in the table), multiplied by the average account value over the period, multiplied by the 184 days in the six-month period ended August 31, 2008, and divided by the 366 days in the Fund’s fiscal year ended August 31, 2008 (to reflect the six-month period). Expenses presented in the table include the expenses of any underlying portfolios in which the Fund may invest.
| | |
| 8 | | Visit our website at www.jennisondryden.com |
Portfolio of Investments
as of August 31, 2008
| | | | | |
| Shares | | Description | | Value (Note 1) |
| | | | | |
LONG-TERM INVESTMENTS 128.0% | | | |
COMMON STOCKS | | | |
| |
Aerospace/Defense 3.5% | | | |
| 1,700 | | Argon ST, Inc.(a) | | $ | 42,449 |
| 3,800 | | Boeing Co. | | | 249,128 |
| 1,200 | | Honeywell International, Inc. | | | 60,204 |
| 3,000 | | Lockheed Martin Corp. | | | 349,320 |
| 3,800 | | Northrop Grumman Corp. | | | 261,630 |
| 4,700 | | Raytheon Co. | | | 281,953 |
| | | | | |
| | | | | 1,244,684 |
| |
Air Freight & Logistics 1.0% | | | |
| 2,700 | | C.H. Robinson Worldwide, Inc. | | | 140,697 |
| 1,700 | | United Parcel Service, Inc. (Class B) | | | 109,004 |
| 5,600 | | UTi Worldwide, Inc. | | | 112,560 |
| | | | | |
| | | | | 362,261 |
| |
Auto Components 0.4% | | | |
| 4,600 | | Johnson Controls, Inc. | | | 142,232 |
| |
Beverages 1.7% | | | |
| 5,400 | | Coca-Cola Co.(The) | | | 281,178 |
| 6,000 | | Pepsi Bottling Group, Inc. | | | 177,480 |
| 3,100 | | PepsiAmericas, Inc. | | | 72,633 |
| 1,200 | | PepsiCo, Inc. | | | 82,176 |
| | | | | |
| | | | | 613,467 |
| |
Biotechnology 1.7% | | | |
| 900 | | Alkermes, Inc.(a) | | | 12,033 |
| 7,100 | | Amgen, Inc.(a) | | | 446,235 |
| 600 | | Cephalon, Inc.(a) | | | 45,972 |
| 1,800 | | Martek Biosciences Corp.(a) | | | 60,138 |
| 600 | | OSI Pharmaceuticals, Inc.(a) | | | 30,300 |
| | | | | |
| | | | | 594,678 |
| |
Building Products 0.2% | | | |
| 3,200 | | Aaon, Inc. | | | 68,352 |
| |
Capital Markets 2.2% | | | |
| 4,400 | | Charles Schwab Corp.(The) | | | 105,556 |
| 2,000 | | Goldman Sachs Group, Inc.(The) | | | 327,940 |
| 2,100 | | Investment Technology Group, Inc.(a) | | | 67,200 |
See Notes to Financial Statements.
| | |
| Dryden US Equity Active Extension Fund | | 9 |
Portfolio of Investments
as of August 31, 2008 continued
| | | | | |
| Shares | | Description | | Value (Note 1) |
| | | | | |
COMMON STOCKS (Continued) | | | |
| |
Capital Markets (cont’d.) | | | |
| 400 | | Janus Capital Group, Inc. | | $ | 10,788 |
| 500 | | Knight Cap Group, Inc.(a) | | | 8,620 |
| 4,500 | | Morgan Stanley | | | 183,735 |
| 1,900 | | OptionsXpress Holdings, Inc. | | | 43,833 |
| 600 | | Raymond James Financial, Inc. | | | 18,498 |
| 700 | | Riskmetrics Group, Inc.(a) | | | 15,547 |
| | | | | |
| | | | | 781,717 |
| |
Chemicals 3.7% | | | |
| 7,900 | | Dow Chemical Co.(The) | | | 269,627 |
| 4,900 | | E.I. Du Pont de Nemours & Co. | | | 217,756 |
| 2,300 | | Eastman Chemical Co. | | | 138,736 |
| 1,300 | | Interpid Potash, Inc.(a) | | | 61,568 |
| 1,100 | | Lubrizol Corp. | | | 58,289 |
| 900 | | Monsanto Co. | | | 102,825 |
| 2,500 | | Mosaic Co.(The) | | | 266,850 |
| 3,000 | | Olin Corp. | | | 80,730 |
| 2,100 | | Terra Industries, Inc. | | | 105,525 |
| | | | | |
| | | | | 1,301,906 |
| |
Commercial Banks 2.3% | | | |
| 5,300 | | BB&T Corp. | | | 159,000 |
| 4,900 | | Fifth Third Bancorp. | | | 77,322 |
| 2,200 | | Huntington Bancshares, Inc. | | | 16,104 |
| 12,700 | | Regions Financial Corp. | | | 117,729 |
| 12,500 | | Wachovia Corp. | | | 198,625 |
| 3,600 | | Wells Fargo & Co. | | | 108,972 |
| 4,500 | | Zions Bancorp. | | | 120,780 |
| | | | | |
| | | | | 798,532 |
| |
Commercial Services & Supplies 0.7% | | | |
| 2,600 | | Cenveo, Inc.(a) | | | 26,962 |
| 3,800 | | Corporate Executive Board Co.(The) | | | 138,320 |
| 1,500 | | Manpower, Inc. | | | 72,090 |
| 2,400 | | Steelcase, Inc. (Class A) | | | 26,640 |
| | | | | |
| | | | | 264,012 |
| |
Communications Equipment 3.7% | | | |
| 3,700 | | Avocent Corp.(a) | | | 86,839 |
| 11,000 | | Brocade Communications Systems, Inc.(a) | | | 81,620 |
See Notes to Financial Statements.
| | |
| 10 | | Visit our website at www.jennisondryden.com |
| | | | | |
| Shares | | Description | | Value (Note 1) |
| | | | | |
COMMON STOCKS (Continued) | | | |
| |
Communications Equipment (cont’d.) | | | |
| 2,900 | | Ciena Corp.(a) | | $ | 50,402 |
| 6,900 | | Cisco Systems, Inc.(a) | | | 165,945 |
| 1,900 | | Corning, Inc. | | | 39,026 |
| 4,500 | | Harris Corp. | | | 235,620 |
| 5,200 | | Juniper Networks, Inc.(a) | | | 133,640 |
| 1,200 | | PC-Tel, Inc. | | | 12,132 |
| 9,200 | | QUALCOMM, Inc. | | | 484,380 |
| | | | | |
| | | | | 1,289,604 |
| |
Computers & Peripherals 4.8% | | | |
| 900 | | Apple, Inc.(a) | | | 152,577 |
| 2,500 | | Dell, Inc.(a) | | | 54,325 |
| 6,600 | | Hewlett-Packard Co. | | | 309,672 |
| 4,200 | | International Business Machines Corp. | | | 511,266 |
| 2,300 | | NCR Corp.(a) | | | 60,858 |
| 9,800 | | NetApp, Inc.(a) | | | 249,704 |
| 14,100 | | QLogic Corp.(a) | | | 263,388 |
| 3,000 | | Western Digital Corp.(a) | | | 81,780 |
| | | | | |
| | | | | 1,683,570 |
| |
Construction & Engineering 0.8% | | | |
| 3,200 | | Fluor Corp. | | | 256,416 |
| 1,500 | | Perini Corp.(a) | | | 40,065 |
| | | | | |
| | | | | 296,481 |
| |
Consumer Finance 1.1% | | | |
| 5,700 | | Capital One Financial Corp. | | | 251,598 |
| 5,400 | | Discover Financial Services | | | 88,830 |
| 1,700 | | First Cash Financial Services, Inc.(a) | | | 31,501 |
| | | | | |
| | | | | 371,929 |
| |
Containers & Packaging 0.7% | | | |
| 3,600 | | Greif, Inc. (Class A) | | | 248,796 |
| |
Diversified Consumer Services 0.8% | | | |
| 1,700 | | Apollo Group, Inc. (Class A)(a) | | | 108,256 |
| 2,100 | | ITT Educational Services, Inc.(a) | | | 186,711 |
| | | | | |
| | | | | 294,967 |
See Notes to Financial Statements.
| | |
| Dryden US Equity Active Extension Fund | | 11 |
Portfolio of Investments
as of August 31, 2008 continued
| | | | | |
| Shares | | Description | | Value (Note 1) |
| | | | | |
COMMON STOCKS (Continued) | | | |
| |
Diversified Financial Services 2.8% | | | |
| 7,600 | | Bank of America Corp. | | $ | 236,664 |
| 21,000 | | Citigroup, Inc. | | | 398,790 |
| 700 | | Interactive Brokers Group, Inc. (Class A)(a) | | | 19,110 |
| 3,400 | | JPMorgan Chase & Co. | | | 130,866 |
| 4,300 | | Liberty Media Holding - Capital(a) | | | 69,875 |
| 4,200 | | MSCI, Inc.(a) | | | 125,370 |
| | | | | |
| | | | | 980,675 |
| |
Diversified Telecommunication Services 3.4% | | | |
| 14,500 | | AT&T, Inc. | | | 463,855 |
| 5,700 | | CenturyTel, Inc. | | | 220,191 |
| 8,000 | | Verizon Communications, Inc. | | | 280,960 |
| 19,600 | | Windstream Corp. | | | 243,432 |
| | | | | |
| | | | | 1,208,438 |
| |
Electric Utilities 2.3% | | | |
| 5,800 | | American Electric Power Co., Inc. | | | 226,432 |
| 1,400 | | DPL, Inc. | | | 34,748 |
| 800 | | Duke Energy Corp. | | | 13,952 |
| 4,900 | | Edison International | | | 225,008 |
| 200 | | ITC Holdings Corp. | | | 11,202 |
| 5,700 | | Pepco Holdings, Inc. | | | 144,495 |
| 14,900 | | Sierra Pacific Resources | | | 167,476 |
| | | | | |
| | | | | 823,313 |
| |
Electrical Equipment 2.2% | | | |
| 1,200 | | Acuity Brands, Inc. | | | 52,212 |
| 3,700 | | Emerson Electric Co. | | | 173,160 |
| 1,300 | | Energy Conversion Devices, Inc.(a) | | | 97,721 |
| 900 | | First Solar, Inc.(a) | | | 248,985 |
| 4,300 | | Hubbell, Inc. (Class B) | | | 187,093 |
| 500 | | Rockwell Automation, Inc. | | | 23,605 |
| | | | | |
| | | | | 782,776 |
| |
Electronic Equipment & Instruments 1.9% | | | |
| 2,100 | | Cognex Corp. | | | 42,483 |
| 4,300 | | Daktronics, Inc. | | | 75,379 |
| 12,600 | | Ingram Micro, Inc. (Class A)(a) | | | 238,266 |
| 11,100 | | Jabil Circuit, Inc. | | | 187,146 |
| 200 | | Mettler Toledo International, Inc.(a) | | | 21,040 |
See Notes to Financial Statements.
| | |
| 12 | | Visit our website at www.jennisondryden.com |
| | | | | |
| Shares | | Description | | Value (Note 1) |
| | | | | |
COMMON STOCKS (Continued) | | | |
| |
Electronic Equipment & Instruments (cont’d.) | | | |
| 3,400 | | Multi-Fineline Electronix, Inc.(a) | | $ | 58,004 |
| 600 | | Radisys Corp.(a) | | | 6,642 |
| 1,200 | | Trimble Navigation Ltd.(a) | | | 40,620 |
| | | | | |
| | | | | 669,580 |
| |
Energy Equipment & Services 5.3% | | | |
| 4,000 | | Cameron International Corp.(a) | | | 186,360 |
| 300 | | Diamond Offshore Drilling, Inc. | | | 32,973 |
| 2,300 | | ENSCO International, Inc. | | | 155,894 |
| 3,400 | | Halliburton Co. | | | 149,396 |
| 1,500 | | Helmerich & Payne, Inc. | | | 85,680 |
| 4,400 | | Noble Corp. | | | 221,276 |
| 8,200 | | Patterson-UTI Energy, Inc. | | | 233,044 |
| 2,500 | | Pride International, Inc.(a) | | | 96,025 |
| 2,800 | | Schlumberger Ltd. | | | 263,816 |
| 1,800 | | SEACOR Holdings, Inc.(a) | | | 158,670 |
| 1,100 | | Tidewater, Inc. | | | 66,737 |
| 3,500 | | Unit Corp.(a) | | | 237,055 |
| | | | | |
| | | | | 1,886,926 |
| |
Food & Staples Retailing 2.1% | | | |
| 10,200 | | Kroger Co.(The) | | | 281,724 |
| 4,000 | | Safeway, Inc. | | | 105,360 |
| 6,300 | | Wal-Mart Stores, Inc. | | | 372,141 |
| | | | | |
| | | | | 759,225 |
| |
Food Products 1.2% | | | |
| 1,600 | | Bunge Ltd. | | | 142,976 |
| 900 | | ConAgra Food, Inc. | | | 19,143 |
| 13,300 | | Del Monte Foods Co. | | | 113,316 |
| 10,200 | | Sara Lee Corp. | | | 137,700 |
| | | | | |
| | | | | 413,135 |
| |
Healthcare Equipment & Supplies 3.6% | | | |
| 4,100 | | Baxter International, Inc. | | | 277,816 |
| 400 | | Becton Dickinson & Co. | | | 34,952 |
| 800 | | Cryolife, Inc.(a) | | | 12,624 |
| 1,300 | | Edwards Lifesciences Corp.(a) | | | 76,973 |
| 4,100 | | Idexx Laboratories, Inc.(a) | | | 230,830 |
| 600 | | Intuitive Surgical, Inc.(a) | | | 177,162 |
See Notes to Financial Statements.
| | |
| Dryden US Equity Active Extension Fund | | 13 |
Portfolio of Investments
as of August 31, 2008 continued
| | | | | |
| Shares | | Description | | Value (Note 1) |
| | | | | |
COMMON STOCKS (Continued) | | | |
| |
Healthcare Equipment & Supplies (cont’d.) | | | |
| 5,800 | | Medtronic, Inc. | | $ | 316,680 |
| 2,700 | | Merit Medical Systems, Inc.(a) | | | 52,272 |
| 2,200 | | Somanetics Corp.(a) | | | 54,560 |
| 2,100 | | Spectranetics Corp.(a) | | | 16,884 |
| 200 | | Synovis Life Technologies, Inc.(a) | | | 4,392 |
| | | | | |
| | | | | 1,255,145 |
| |
Healthcare Providers & Services 2.1% | | | |
| 900 | | Aetna, Inc. | | | 38,826 |
| 3,800 | | Express Scripts, Inc.(a) | | | 278,958 |
| 4,800 | | Humana, Inc.(a) | | | 222,720 |
| 1,100 | | Psychiatric Solutions, Inc.(a) | | | 41,525 |
| 5,700 | | UnitedHealth Group, Inc. | | | 173,565 |
| | | | | |
| | | | | 755,594 |
| |
Hotels, Restaurants & Leisure 1.8% | | | |
| 3,000 | | Boyd Gaming Corp. | | | 36,570 |
| 10,200 | | Brinker International, Inc. | | | 192,984 |
| 640 | | Interval Leisure Group, Inc.(a) | | | 8,314 |
| 8,500 | | Jack in the Box, Inc.(a) | | | 201,705 |
| 2,400 | | McDonald’s Corp. | | | 148,800 |
| 1,700 | | Wyndham Worldwide Corp. | | | 32,776 |
| | | | | |
| | | | | 621,149 |
| |
Household Durables 0.6% | | | |
| 4,500 | | Stanley Works (The) | | | 215,775 |
| |
Household Products 2.9% | | | |
| 900 | | Colgate-Palmolive Co. | | | 68,427 |
| 4,300 | | Kimberly-Clark Corp. | | | 265,224 |
| 9,700 | | Procter & Gamble Co. | | | 676,769 |
| | | | | |
| | | | | 1,010,420 |
| |
Independent Power Producers & Energy Traders 0.3% | | | |
| 8,200 | | AES Corp. (The)(a) | | | 125,132 |
| |
Industrial Conglomerates 3.0% | | | |
| 1,100 | | 3M Co. | | | 78,760 |
| 25,100 | | General Electric Co. | | | 705,310 |
| 6,800 | �� | Tyco International Ltd. | | | 291,584 |
| | | | | |
| | | | | 1,075,654 |
See Notes to Financial Statements.
| | |
| 14 | | Visit our website at www.jennisondryden.com |
| | | | | |
| Shares | | Description | | Value (Note 1) |
| | | | | |
COMMON STOCKS (Continued) | | | |
| |
Insurance 5.7% | | | |
| 4,500 | | Allied World Assurance Co. Holdings Ltd. | | $ | 173,790 |
| 7,900 | | American Financial Group, Inc. | | | 225,387 |
| 2,800 | | American International Group, Inc. | | | 60,172 |
| 2,900 | | American Physicians Capital, Inc. | | | 122,670 |
| 3,300 | | Arch Capital Group Ltd.(a) | | | 230,208 |
| 2,400 | | Axis Capital Holdings Ltd. | | | 80,232 |
| 3,300 | | Endurance Specialty Holdings Ltd. | | | 107,646 |
| 2,100 | | Everest Re Group Ltd. | | | 172,473 |
| 600 | | Hartford Financial Services Group, Inc. | | | 37,848 |
| 1,100 | | MetLife, Inc. | | | 59,620 |
| 3,800 | | Montpelier Re Holdings Ltd. | | | 61,522 |
| 3,000 | | PartnerRe Ltd. | | | 206,730 |
| 1,100 | | Platinum Underwriters Holdings Ltd. | | | 39,765 |
| 2,600 | | SeaBright Insurance Holdings, Inc.(a) | | | 31,564 |
| 400 | | Tower Group, Inc. | | | 8,380 |
| 5,300 | | Travelers Cos., Inc.(The) | | | 234,048 |
| 4,300 | | W.R. Berkley Corp. | | | 101,308 |
| 2,300 | | XL Capital Ltd. (Class A) | | | 46,230 |
| | | | | |
| | | | | 1,999,593 |
| |
Internet & Catalog Retail 0.5% | | | |
| 1,740 | | Home Shopping Network, Inc.(a) | | | 25,491 |
| 10,100 | | Stamps.com, Inc.(a) | | | 138,673 |
| | | | | |
| | | | | 164,164 |
| |
Internet Software & Services 1.6% | | | |
| 6,300 | | CMGI, Inc.(a) | | | 74,277 |
| 11,000 | | Earthlink, Inc.(a) | | | 102,520 |
| 4,700 | | eBay, Inc.(a) | | | 117,171 |
| 200 | | Google, Inc. (Class A)(a) | | | 92,658 |
| 4,350 | | IAC/InteractiveCorp.(a) | | | 72,210 |
| 8,200 | | Valueclick, Inc.(a) | | | 105,698 |
| | | | | |
| | | | | 564,534 |
| |
IT Services 2.5% | | | |
| 7,300 | | Accenture Ltd. (Class A) | | | 301,928 |
| 600 | | Affiliated Computer Services, Inc. (Class A)(a) | | | 31,944 |
| 100 | | Alliance Data Systems Corp.(a) | | | 6,424 |
| 1,200 | | Integral Systems, Inc. | | | 53,988 |
See Notes to Financial Statements.
| | |
| Dryden US Equity Active Extension Fund | | 15 |
Portfolio of Investments
as of August 31, 2008 continued
| | | | | |
| Shares | | Description | | Value (Note 1) |
| | | | | |
COMMON STOCKS (Continued) | | | |
| |
IT Services (cont’d.) | | | |
| 800 | | Mastercard, Inc. (Class A) | | $ | 194,040 |
| 4,000 | | Visa, Inc. (Class A) | | | 303,600 |
| | | | | |
| | | | | 891,924 |
| |
Leisure Equipment & Products 0.4% | | | |
| 6,200 | | Jakks Pacific, Inc.(a) | | | 154,690 |
| |
Life Sciences, Tools & Services 1.2% | | | |
| 600 | | Albany Molecular Research, Inc.(a) | | | 10,458 |
| 7,200 | | Applied Biosystems, Inc. | | | 262,728 |
| 1,100 | | Covance, Inc.(a) | | | 103,774 |
| 700 | | Dionex Corp.(a) | | | 45,633 |
| 100 | | Techne Corp.(a) | | | 7,717 |
| | | | | |
| | | | | 430,310 |
| |
Machinery 3.1% | | | |
| 400 | | AGCO Corp.(a) | | | 24,652 |
| 2,300 | | Bucyrus International, Inc. (Class A) | | | 160,655 |
| 200 | | Caterpillar, Inc. | | | 14,146 |
| 1,500 | | Columbus McKinnon Corp.(a) | | | 40,935 |
| 4,800 | | Crane Co. | | | 176,256 |
| 4,200 | | Cummins, Inc. | | | 273,672 |
| 300 | | Eaton Corp. | | | 21,954 |
| 600 | | Illinois Tool Works, Inc. | | | 29,766 |
| 2,000 | | Ingersoll-Rand Co. (Class A) | | | 73,860 |
| 820 | | John Bean Technologies Corp.(a) | | | 10,660 |
| 1,000 | | Manitowoc Co., Inc.(The) | | | 25,180 |
| 2,500 | | Parker Hannifin Corp. | | | 160,175 |
| 2,600 | | Titan International, Inc. | | | 69,524 |
| | | | | |
| | | | | 1,081,435 |
| |
Media 2.7% | | | |
| 4,900 | | CBS Corp. (Class B) | | | 79,282 |
| 8,100 | | Comcast Corp. (Class A) | | | 171,558 |
| 10,800 | | DIRECTV Group, Inc.(The)(a) | | | 304,668 |
| 5,700 | | Gannett Co., Inc. | | | 101,403 |
| 300 | | Liberty Media Corp. - Entertainment (Series A)(a) | | | 8,337 |
| 2,100 | | Time Warner Cable, Inc. (Class A)(a) | | | 56,175 |
| 8,400 | | Time Warner, Inc. | | | 137,508 |
| 3,000 | | Walt Disney Co.(The) | | | 97,050 |
| | | | | |
| | | | | 955,981 |
See Notes to Financial Statements.
| | |
| 16 | | Visit our website at www.jennisondryden.com |
| | | | | |
| Shares | | Description | | Value (Note 1) |
| | | | | |
COMMON STOCKS (Continued) | | | |
| |
Metals & Mining 0.8% | | | |
| 2,700 | | Alcoa, Inc. | | $ | 86,751 |
| 900 | | Freeport-McMoRan Copper & Gold, Inc. | | | 80,388 |
| 1,200 | | Reliance Steel & Aluminum Co. | | | 68,412 |
| 300 | | United States Steel Corp. | | | 39,921 |
| | | | | |
| | | | | 275,472 |
| |
Multi-line Retail 0.5% | | | |
| 400 | | Big Lots, Inc.(a) | | | 11,828 |
| 3,300 | | J.C. Penney Co., Inc. | | | 128,601 |
| 2,500 | | Macy’s, Inc. | | | 52,050 |
| | | | | |
| | | | | 192,479 |
| |
Multi-Utilities 0.5% | | | |
| 1,800 | | CenterPoint Energy, Inc. | | | 28,584 |
| 1,400 | | CMS Energy Corp. | | | 18,998 |
| 200 | | Dominion Resources, Inc. | | | 8,706 |
| 6,400 | | NiSource, Inc. | | | 105,472 |
| | | | | |
| | | | | 161,760 |
| |
Office Electronics 0.7% | | | |
| 16,200 | | Xerox Corp. | | | 225,666 |
| 200 | | Zebra Technologies Corp. (Class A)(a) | | | 6,244 |
| | | | | |
| | | | | 231,910 |
| |
Oil, Gas & Consumable Fuels 12.8% | | | |
| 600 | | Anadarko Petroleum Corp. | | | 37,038 |
| 1,400 | | Apache Corp. | | | 160,132 |
| 4,900 | | Chesapeake Energy Corp. | | | 237,160 |
| 7,700 | | Chevron Corp. | | | 664,664 |
| 500 | | Clayton Williams Energy, Inc.(a) | | | 40,470 |
| 6,800 | | ConocoPhillips | | | 561,068 |
| 2,600 | | Devon Energy Corp. | | | 265,330 |
| 15,700 | | Exxon Mobil Corp. | | | 1,256,157 |
| 500 | | Hess Corp. | | | 52,355 |
| 2,200 | | Marathon Oil Corp. | | | 99,154 |
| 1,800 | | Massey Energy Co. | | | 118,728 |
| 100 | | Noble Energy, Inc. | | | 7,173 |
| 4,600 | | Occidental Petroleum Corp. | | | 365,056 |
| 600 | | Overseas Shipholding Group, Inc. | | | 43,044 |
| 6,800 | | Southwestern Energy Co.(a) | | | 260,916 |
See Notes to Financial Statements.
| | |
| Dryden US Equity Active Extension Fund | | 17 |
Portfolio of Investments
as of August 31, 2008 continued
| | | | | |
| Shares | | Description | | Value (Note 1) |
| | | | | |
COMMON STOCKS (Continued) | | | |
| |
Oil, Gas & Consumable Fuels (cont’d.) | | | |
| 100 | | Stone Energy Corp.(a) | | $ | 4,767 |
| 1,500 | | Swift Energy Co.(a) | | | 70,065 |
| 700 | | W&T Offshore, Inc. | | | 24,612 |
| 7,700 | | Williams Cos., Inc. | | | 237,853 |
| | | | | |
| | | | | 4,505,742 |
| |
Paper & Forest Products 0.1% | | | |
| 800 | | International Paper Co. | | | 21,640 |
| |
Personal Products | | | |
| 400 | | Nu Skin Enterprises, Inc. (Class A) | | | 6,700 |
| |
Pharmaceuticals 6.9% | | | |
| 2,700 | | Abbott Laboratories | | | 155,061 |
| 12,100 | | Bristol-Myers Squibb Co. | | | 258,214 |
| 5,800 | | Eli Lilly & Co. | | | 270,570 |
| 1,500 | | Endo Pharmaceuticals Holdings(a) | | | 34,080 |
| 3,400 | | Forest Laboratories, Inc.(a) | | | 121,346 |
| 4,500 | | Johnson & Johnson | | | 316,935 |
| 12,000 | | King Pharmaceuticals, Inc.(a) | | | 137,280 |
| 4,100 | | Medicines Co.(a) | | | 99,876 |
| 8,700 | | Merck & Co., Inc. | | | 310,329 |
| 27,500 | | Pfizer, Inc. | | | 525,525 |
| 12,200 | | Warner Chilcott Ltd. (Class A)(a) | | | 195,200 |
| 200 | | Wyeth | | | 8,656 |
| | | | | |
| | | | | 2,433,072 |
| |
Real Estate Investment Trust 3.1% | | | |
| 3,500 | | Annaly Mortgage Management, Inc. | | | 52,360 |
| 13,300 | | Brandywine Realty Trust | | | 231,420 |
| 600 | | Capitalsource, Inc. | | | 7,548 |
| 9,400 | | CBL & Associates Properties, Inc. | | | 203,886 |
| 1,800 | | General Growth Properties, Inc. | | | 46,674 |
| 3,600 | | Hospitality Properties Trust | | | 81,648 |
| 2,500 | | iStar Financial, Inc. | | | 13,975 |
| 2,300 | | Parkway Properties, Inc. | | | 82,731 |
| 500 | | Pennsylvania Real Estate Investment Trust | | | 9,925 |
| 12,600 | | Sunstone Hotel Investors, Inc. | | | 178,668 |
| 5,200 | | Weingarten Realty Investors | | | 171,860 |
| | | | | |
| | | | | 1,080,695 |
See Notes to Financial Statements.
| | |
| 18 | | Visit our website at www.jennisondryden.com |
| | | | | |
| Shares | | Description | | Value (Note 1) |
| | | | | |
COMMON STOCKS (Continued) | | | |
| |
Road & Rail 1.1% | | | |
| 2,300 | | CSX Corp. | | $ | 148,764 |
| 3,500 | | Norfolk Southern Corp. | | | 257,355 |
| | | | | |
| | | | | 406,119 |
| |
Semiconductors & Semiconductor Equipment 6.4% | | | |
| 4,700 | | Amkor Technology, Inc.(a) | | | 35,297 |
| 5,400 | | Analog Devices, Inc. | | | 150,984 |
| 11,700 | | Applied Micro Circuits Corp.(a) | | | 93,132 |
| 700 | | Authentec Inc.(a) | | | 5,688 |
| 9,700 | | Broadcom Corp., (Class A)(a) | | | 233,382 |
| 1,300 | | Cabot Microelectronics Corp.(a) | | | 50,206 |
| 20,000 | | Intel Corp. | | | 457,400 |
| 8,600 | | Intergrated Device Technologies, Inc.(a) | | | 91,074 |
| 1,200 | | Intersil Corp. | | | 28,116 |
| 23,800 | | LSI Corp.(a) | | | 158,270 |
| 2,300 | | Micrel, Inc. | | | 21,183 |
| 9,800 | | National Semiconductor Corp. | | | 210,014 |
| 500 | | Pericom Semiconductor Corp.(a) | | | 6,820 |
| 6,300 | | Silicon Laboratories, Inc.(a) | | | 212,373 |
| 900 | | Skyworks Solutions, Inc.(a) | | | 8,730 |
| 7,800 | | Teradyne, Inc.(a) | | | 72,774 |
| 8,900 | | Texas Instruments, Inc. | | | 218,139 |
| 8,600 | | Volterra Semiconductor Corp.(a) | | | 135,192 |
| 2,100 | | Xilinx, Inc. | | | 54,558 |
| | | | | |
| | | | | 2,243,332 |
| |
Software 5.0% | | | |
| 6,800 | | Adobe Systems, Inc.(a) | | | 291,244 |
| 100 | | Ansys, Inc.(a) | | | 4,435 |
| 300 | | BMC Software, Inc.(a) | | | 9,768 |
| 3,000 | | Factset Research Systems, Inc. | | | 188,130 |
| 29,400 | | Microsoft Corp. | | | 802,326 |
| 3,100 | | Oracle Corp.(a) | | | 67,983 |
| 14,000 | | Symantec Corp.(a) | | | 312,340 |
| 5,000 | | Synopsys, Inc.(a) | | | 107,650 |
| | | | | |
| | | | | 1,783,876 |
| |
Specialty Retail 2.5% | | | |
| 11,300 | | American Eagle Outfitters, Inc. | | | 170,065 |
| 2,900 | | Best Buy Co., Inc. | | | 129,833 |
See Notes to Financial Statements.
| | |
| Dryden US Equity Active Extension Fund | | 19 |
Portfolio of Investments
as of August 31, 2008 continued
| | | | | |
| Shares | | Description | | Value (Note 1) |
| | | | | |
COMMON STOCKS (Continued) | | | |
| |
Specialty Retail (cont’d.) | | | |
| 6,600 | | Cache, Inc.(a) | | $ | 77,286 |
| 200 | | Gamestop Corp. (Class A)(a) | | | 8,774 |
| 5,200 | | Gap, Inc. | | | 101,140 |
| 4,000 | | Rent-A-Center, Inc.(a) | | | 90,640 |
| 400 | | The Buckle Inc. | | | 20,772 |
| 1,600 | | TJX Cos., Inc. | | | 57,984 |
| 5,300 | | Tween Brands, Inc.(a) | | | 57,558 |
| 4,900 | | Urban Outfitters, Inc.(a) | | | 174,538 |
| | | | | |
| | | | | 888,590 |
| |
Textiles, Apparel & Luxury Goods 1.6% | | | |
| 8,100 | | Coach, Inc.(a) | | | 234,819 |
| 800 | | Deckers Outdoor Corp.(a) | | | 90,952 |
| 5,200 | | Fgx International Holdings Ltd.(a) | | | 67,652 |
| 600 | | Hanesbrands, Inc.(a) | | | 14,304 |
| 8,500 | | Jones Apparel Group, Inc. | | | 168,810 |
| | | | | |
| | | | | 576,537 |
| |
Thrifts & Mortgage Finance 0.9% | | | |
| 15,000 | | Hudson City Bancorp, Inc. | | | 276,600 |
| 289 | | TREE.COM, Inc.(a) | | | 2,196 |
| 1,700 | | Washington Federal Inc. | | | 29,291 |
| | | | | |
| | | | | 308,087 |
| |
Tobacco 1.4% | | | |
| 6,400 | | Altria Group, Inc. | | | 134,592 |
| 2,900 | | Philip Morris International, Inc. | | | 155,730 |
| 3,900 | | Reynolds American, Inc. | | | 206,622 |
| | | | | |
| | | | | 496,944 |
| |
Trading Companies & Distributors 0.5% | | | |
| 400 | | Fastenal Co. | | | 20,772 |
| 3,000 | | United Rental, Inc.(a) | | | 48,570 |
| 2,800 | | WESCO International, Inc.(a) | | | 107,632 |
| | | | | |
| | | | | 176,974 |
| |
Water Utilites 0.2% | | | |
| 2,900 | | American Water Works Co. | | | 66,555 |
See Notes to Financial Statements.
| | |
| 20 | | Visit our website at www.jennisondryden.com |
| | | | | | |
| Shares | | Description | | Value (Note 1) | |
| | | | | | |
COMMON STOCKS (Continued) | | | | |
| |
Wireless Telecommunication Services 0.5% | | | | |
| 700 | | Leap Wireless International, Inc.(a) | | $ | 31,262 | |
| 18,000 | | Sprint Nextel Corp. | | | 156,960 | |
| | | | | | |
| | | | | 188,222 | |
| | | | | | |
| | Total long-term investments
(cost $47,144,567) | | | 45,227,462 | |
| | | | | | |
SHORT-TERM INVESTMENTS 1.5% | | | | |
| |
Affiliated Money Market Mutual Fund 1.4% | | | | |
| 484,896 | | Dryden Core Investment Fund - Taxable Money Market Series(b)
(cost $484,896)(Note 3) | | | 484,896 | |
| |
U.S. Treasury Security 0.1% | | | | |
| | |
Principal Amount | | | | | |
| $50,000 | | United States Treasury Bill, 1.92%, 9/18/2008(c)(d)
(cost $49,955) | | | 49,964 | |
| | | | | | |
| | Total short-term investments
(cost $534,851) | | | 534,860 | |
| | | | | | |
| | Total Investments, Before Securities Sold Short 129.5%
(cost $47,679,418) | | | 45,762,322 | |
| | | | | | |
| | |
Shares | | | | | |
SECURITIES SOLD SHORT (29.7)% | | | | |
COMMON STOCKS | | | | |
| |
Air Freight & Logistics (0.4)% | | | | |
| 4,300 | | Expeditors International Washington, Inc. | | | (155,187 | ) |
| |
Airlines (0.4)% | | | | |
| 12,400 | | AMR Corp.(a) | | | (128,092 | ) |
| |
Auto Components | | | | |
| 500 | | Goodyear Tire & Rubber Co.(The)(a) | | | (9,805 | ) |
| |
Biotechnology (0.7)% | | | | |
| 1,600 | | Amylin Pharmaceuticals, Inc.(a) | | | (35,168 | ) |
| 7,200 | | Biomarin Pharmaceutical, Inc.(a) | | | (217,008 | ) |
| | | | | | |
| | | | | (252,176 | ) |
See Notes to Financial Statements.
| | |
| Dryden US Equity Active Extension Fund | | 21 |
Portfolio of Investments
as of August 31, 2008 continued
| | | | | | |
| Shares | | Description | | Value (Note 1) | |
| | | | | | |
COMMON STOCKS (Continued) | | | | |
| |
Capital Markets (0.2)% | | | | |
| 1,500 | | Lazard Ltd. (Class A) | | $ | (63,585 | ) |
| |
Chemicals (0.3)% | | | | |
| 3,100 | | Sensient Technologies Corp. | | | (90,551 | ) |
| |
Commercial Banks (0.3)% | | | | |
| 800 | | Bancorpsouth, Inc. | | | (18,416 | ) |
| 1,500 | | Commerce Bancshares, Inc. | | | (67,500 | ) |
| 1,100 | | FirstMerit Corp. | | | (22,264 | ) |
| | | | | | |
| | | | | (108,180 | ) |
| |
Commercial Services & Supplies (0.2)% | | | | |
| 1,700 | | Avery Dennison Corp. | | | (82,008 | ) |
| |
Communications Equipment (1.4)% | | | | |
| 4,800 | | CommScope, Inc.(a) | | | (235,056 | ) |
| 8,700 | | Polycom, Inc.(a) | | | (243,948 | ) |
| | | | | | |
| | | | | (479,004 | ) |
| |
Computers & Peripherals | | | | |
| 1,100 | | SanDisk Corp.(a) | | | (15,906 | ) |
| |
Construction & Engineering (0.5)% | | | | |
| 1,900 | | Aecom Technology Corp.(a) | | | (60,724 | ) |
| 4,100 | | Quanta Services, Inc.(a) | | | (130,954 | ) |
| | | | | | |
| | | | | (191,678 | ) |
| |
Distributors (0.4)% | | | | |
| 2,200 | | Central European Distribution Corp.(a) | | | (126,918 | ) |
| |
Diversified Consumer Services (1.0)% | | | | |
| 2,500 | | Hillenbrand, Inc. | | | (59,450 | ) |
| 1,500 | | Matthews International Corp. | | | (75,390 | ) |
| 7,600 | | Sotheby’s | | | (204,744 | ) |
| | | | | | |
| | | | | (339,584 | ) |
| |
Electric Utilities (0.4)% | | | | |
| 100 | | Allegheny Energy, Inc. | | | (4,533 | ) |
| 3,300 | | PPL Corp. | | | (144,441 | ) |
| | | | | | |
| | | | | (148,974 | ) |
See Notes to Financial Statements.
| | |
| 22 | | Visit our website at www.jennisondryden.com |
| | | | | | |
| Shares | | Description | | Value (Note 1) | |
| | | | | | |
COMMON STOCKS (Continued) | | | | |
| |
Electrical Equipment (0.7)% | | | | |
| 3,200 | | General Cable Corp.(a) | | $ | (157,504 | ) |
| 1,900 | | Thomas & Betts Corp.(a) | | | (87,552 | ) |
| | | | | | |
| | | | | (245,056 | ) |
| |
Electronic Equipment & Instruments (0.8)% | | | | |
| 1,900 | | Amphenol Corp. (Class A) | | | (90,288 | ) |
| 8,300 | | Molex, Inc. | | | (200,196 | ) |
| | | | | | |
| | | | | (290,484 | ) |
| |
Energy Equipment & Services (1.1)% | | | | |
| 3,000 | | Exterran Holdings, Inc.(a) | | | (137,130 | ) |
| 13,200 | | Global Industries Ltd.(a) | | | (127,644 | ) |
| 400 | | National Oilwell Varco, Inc.(a) | | | (29,492 | ) |
| 800 | | Transocean, Inc. | | | (101,760 | ) |
| | | | | | |
| | | | | (396,026 | ) |
| |
Gas Utilities (0.1)% | | | | |
| 800 | | Nicor, Inc. | | | (36,712 | ) |
| |
Healthcare Equipment & Supplies (0.1)% | | | | |
| 400 | | Resmed, Inc.(a) | | | (18,720 | ) |
| |
Healthcare Providers & Services (0.8)% | | | | |
| 1,300 | | Cardinal Health, Inc. | | | (71,474 | ) |
| 3,100 | | Henry Schein, Inc.(a) | | | (181,288 | ) |
| 600 | | Lincare Holdings, Inc.(a) | | | (19,800 | ) |
| | | | | | |
| | | | | (272,562 | ) |
| |
Hotels, Restaurants & Leisure (0.9)% | | | | |
| 3,800 | | Orient Express Hotels Ltd. (Class A) | | | (136,420 | ) |
| 6,400 | | Scientific Games Corp. (Class A)(a) | | | (192,704 | ) |
| | | | | | |
| | | | | (329,124 | ) |
| |
Household Durables (0.8)% | | | | |
| 2,600 | | Pulte Homes, Inc. | | | (37,726 | ) |
| 10,400 | | Toll Brothers, lnc.(a) | | | (258,752 | ) |
| | | | | | |
| | | | | (296,478 | ) |
| |
Independent Power Producers & Energy Traders | | | | |
| 1,100 | | Dynegy, Inc. (Class A)(a) | | | (6,556 | ) |
See Notes to Financial Statements.
| | |
| Dryden US Equity Active Extension Fund | | 23 |
Portfolio of Investments
as of August 31, 2008 continued
| | | | | | |
| Shares | | Description | | Value (Note 1) | |
| | | | | | |
COMMON STOCKS (Continued) | | | | |
| |
Insurance (1.1)% | | | | |
| 2,600 | | AON Corp. | | $ | (123,474 | ) |
| 2,500 | | Brown & Brown, Inc. | | | (50,800 | ) |
| 2,400 | | Fidelity National Title | | | (33,672 | ) |
| 3,000 | | First American Corp. | | | (75,810 | ) |
| 400 | | Mercury General Corp. | | | (20,376 | ) |
| 200 | | White Mountains Insurance Group Ltd. | | | (94,580 | ) |
| | | | | | |
| | | | | (398,712 | ) |
| |
Internet Software & Services (0.8)% | | | | |
| 2,400 | | Equinix, Inc.(a) | | | (193,200 | ) |
| 2,400 | | VeriSign, Inc.(a) | | | (76,728 | ) |
| | | | | | |
| | | | | (269,928 | ) |
| |
IT Services (1.1)% | | | | |
| 2,300 | | Cognizant Technology Solutions Corp.(a) | | | (67,436 | ) |
| 3,300 | | Iron Mountain, Inc.(a) | | | (95,403 | ) |
| 2,500 | | NeuStar, Inc. (Class A)(a) | | | (60,025 | ) |
| 6,700 | | SRA International, Inc.(a) | | | (157,316 | ) |
| | | | | | |
| | | | | (380,180 | ) |
| |
Life Sciences, Tools & Services (0.3)% | | | | |
| 900 | | Millipore Corp.(a) | | | (67,509 | ) |
| 500 | | Pharmaceutical Product Development, Inc. | | | (20,400 | ) |
| | | | | | |
| | | | | (87,909 | ) |
| |
Machinery (0.6)% | | | | |
| 6,300 | | Kennametal, Inc. | | | (221,949 | ) |
| |
Marine (0.1)% | | | | |
| 900 | | Alexander & Baldwin, Inc. | | | (40,257 | ) |
| |
Media (0.6)% | | | | |
| 12,100 | | Clear Channel Outdoor Holdings, Inc. (Class A)(a) | | | (202,917 | ) |
| 1,800 | | News Corp. (Class A) | | | (25,488 | ) |
| | | | | | |
| | | | | (228,405 | ) |
| |
Oil, Gas & Consumable Fuels (2.7)% | | | | |
| 1,100 | | Cabot Oil & Gas Corp. | | | (48,884 | ) |
| 3,500 | | Foundation Coal Holdings, Inc. | | | (207,025 | ) |
| 5,300 | | Holly Corp. | | | (169,600 | ) |
| 900 | | Plains Exploration & Production Co.(a) | | | (48,510 | ) |
See Notes to Financial Statements.
| | |
| 24 | | Visit our website at www.jennisondryden.com |
| | | | | | |
| Shares | | Description | | Value (Note 1) | |
| | | | | | |
COMMON STOCKS (Continued) | | | | |
| |
Oil, Gas & Consumable Fuels (cont’d.) | | | | |
| 2,700 | | Range Resources Corp. | | $ | (125,334 | ) |
| 3,100 | | SandRidge Energy, Inc.(a) | | | (108,500 | ) |
| 5,200 | | Sunoco, Inc. | | | (230,776 | ) |
| | | | | | |
| | | | | (938,629 | ) |
| |
Paper & Forest Products (0.1)% | | | | |
| 400 | | Weyerhaeuser Co. | | | (22,196 | ) |
| |
Pharmaceuticals (0.2)% | | | | |
| 2,700 | | Par Pharmaceutical Cos., Inc.(a) | | | (38,448 | ) |
| 1,000 | | Schering-Plough Corp. | | | (19,400 | ) |
| | | | | | |
| | | | | (57,848 | ) |
| |
Real Estate Investment Trust (2.5)% | | | | |
| 800 | | Alexandria Real Estate Equities, Inc. | | | (86,168 | ) |
| 1,700 | | Essex Property Trust, Inc. | | | (199,495 | ) |
| 1,300 | | HCP, Inc. | | | (47,086 | ) |
| 1,200 | | Nationwide Health Properties, Inc. | | | (41,304 | ) |
| 2,800 | | Plum Creek Timber Co., Inc. | | | (138,936 | ) |
| 2,100 | | Potlatch Corp New | | | (98,049 | ) |
| 1,500 | | Rayonier, Inc. | | | (67,485 | ) |
| 4,700 | | Ventas, Inc. | | | (213,474 | ) |
| | | | | | |
| | | | | (891,997 | ) |
| |
Road & Rail (0.2)% | | | | |
| 1,600 | | Kansas City Southern Industries, Inc.(a) | | | (82,288 | ) |
| |
Semiconductors & Semiconductor Equipment (4.1)% | | | | |
| 3,100 | | Applied Materials, Inc. | | | (55,552 | ) |
| 7,800 | | Cypress Semiconductor Corp.(a) | | | (252,876 | ) |
| 4,700 | | KLA-Tencor Corp. | | | (174,182 | ) |
| 5,000 | | Lam Research Corp.(a) | | | (183,800 | ) |
| 28,900 | | Micron Technology, Inc.(a) | | | (122,536 | ) |
| 9,700 | | Novellus Systems, Inc.(a) | | | (219,899 | ) |
| 14,500 | | NVIDIA Corp.(a) | | | (183,280 | ) |
| 9,200 | | ON Semiconductor Corp.(a) | | | (87,124 | ) |
| 5,600 | | Varian Semiconductor Equipment(a) | | | (180,880 | ) |
| | | | | | |
| | | | | (1,460,129 | ) |
See Notes to Financial Statements.
| | |
| Dryden US Equity Active Extension Fund | | 25 |
Portfolio of Investments
as of August 31, 2008 continued
| | | | | | |
| Shares | | Description | | Value (Note 1) | |
| | | | | | |
COMMON STOCKS (Continued) | | | | |
| |
Software (1.4)% | | | �� | |
| 1,600 | | Electronic Arts, Inc.(a) | | $ | (78,096 | ) |
| 11,900 | | Macrovision Solutions Corp.(a) | | | (184,688 | ) |
| 9,400 | | Red Hat, Inc.(a) | | | (197,400 | ) |
| 2,800 | | Wind River Systems, Inc.(a) | | | (30,940 | ) |
| | | | | | |
| | | | | (491,124 | ) |
| |
Specialty Retail (1.2)% | | | | |
| 6,600 | | O’Reilly Automotive, Inc.(a) | | | (192,192 | ) |
| 9,100 | | Petsmart, Inc. | | | (245,427 | ) |
| | | | | | |
| | | | | (437,619 | ) |
| |
Wireless Telecommunication Services (1.2)% | | | | |
| 11,300 | | MetroPCS Communications, Inc.(a) | | | (190,631 | ) |
| 4,300 | | Nii Holdings, Inc.(a) | | | (225,836 | ) |
| | | | | | |
| | | | | (416,467 | ) |
| | | | | | |
| | Total securities sold short
(cost $10,706,748) | | | (10,509,003 | ) |
| | | | | | |
| | Total Investments, Net of Securities Sold Short 99.8%
(cost $36,972,670) | | | 35,253,319 | |
| | Other assets in excess of liabilities(e) 0.2% | | | 71,973 | |
| | | | | | |
| | Net Assets 100.0% | | $ | 35,325,292 | |
| | | | | | |
| (a) | Non-income producing security. |
| (b) | Prudential Investments LLC, the Manager of the Fund, also serves as Manager of the Dryden Core Investment Fund—Taxable Money Market Series. |
| (c) | Percentage quoted represents yield-to-maturity as of purchase date. |
| (d) | Security segregated as collateral for futures contracts. |
| (e) | Other assets in excess of liabilities include net unrealized appreciation on financial future contracts as follows: |
Open futures contracts outstanding at August 31, 2008:
| | | | | | | | | | | | | |
Number of
Contracts | | Type | | Expiration
Date | | Value at
August 31,
2008 | | Value at
Trade
Date | | Unrealized
Appreciation |
| | Long Position: | | | | | | | | | | | |
| 8 | | Russell 1000 Mini | | Sept. 08 | | $ | 561,680 | | $ | 558,240 | | $ | 3,440 |
| | | | | | | | | | | | | |
See Notes to Financial Statements.
| | |
| 26 | | Visit our website at www.jennisondryden.com |
Various inputs are used in determining the value of the Portfolio’s investments. These inputs are summarized in the three broad levels listed below.
Level 1—quoted prices in active markets for identical securities
Level 2—other significant observable inputs (including quoted prices for similar securities, interest rates, prepayment speeds, credit risk, etc.)
Level 3—significant unobservable inputs (including the Portfolio’s own assumptions in determining the fair value of investments)
The following is a summary of the inputs used as of August 31, 2008 in valuing the Fund’s assets carried at fair value:
| | | | | | | |
Valuation inputs | | Investments
in Securities | | | Other Financial
Instruments* |
Level 1—Quoted Prices—Long | | $ | 45,712,358 | | | $ | 3,440 |
Level 1—Quoted Prices—Short | | | (10,509,003 | ) | | | |
Level 2—Other Significant Observable Inputs | | | 49,964 | | | | — |
Level 3—Significant Unobservable Inputs | | | — | | | | — |
| | | | | | | |
Total | | $ | 35,253,319 | | | $ | 3,440 |
| | | | | | | |
| * | Other financial instruments are derivative instruments not reflected in the Portfolio of Investments, such as futures, forwards and swap contracts, which are valued at the unrealized appreciation/depreciation on the instrument. |
As of August 31, 2008, the Fund did not use any significant unobservable inputs (Level 3) in determining the valuation of investments.
The industry classification of portfolio holdings and liabilities in excess of other assets shown as a percentage of net assets as of August 31, 2008 were as follows:
| | | |
Oil, Gas & Consumable Fuels | | 12.8 | % |
Pharmaceuticals | | 6.9 | |
Semiconductors & Semiconductor Equipment | | 6.4 | |
Insurance | | 5.7 | |
Energy Equipment & Services | | 5.3 | |
Software | | 5.0 | |
Computers & Peripherals | | 4.8 | |
Chemicals | | 3.7 | |
Communications Equipment | | 3.7 | |
Healthcare Equipment & Supplies | | 3.6 | |
See Notes to Financial Statements.
| | |
| Dryden US Equity Active Extension Fund | | 27 |
Portfolio of Investments
as of August 31, 2008 continued
| | | |
Aerospace/Defense | | 3.5 | % |
Diversified Telecommunication Services | | 3.4 | |
Machinery | | 3.1 | |
Real Estate Investment Trust | | 3.1 | |
Industrial Conglomerates | | 3.0 | |
Household Products | | 2.9 | |
Diversified Financial Services | | 2.8 | |
Media | | 2.7 | |
IT Services | | 2.5 | |
Specialty Retail | | 2.5 | |
Commercial Banks | | 2.3 | |
Electric Utilities | | 2.3 | |
Capital Markets | | 2.2 | |
Electrical Equipment | | 2.2 | |
Food & Staples Retailing | | 2.1 | |
Healthcare Providers & Services | | 2.1 | |
Electronic Equipment & Instruments | | 1.9 | |
Hotel, Restaurants & Leisure | | 1.8 | |
Beverages | | 1.7 | |
Biotechnology | | 1.7 | |
Internet Software & Services | | 1.6 | |
Textiles, Apparel & Luxury Goods | | 1.6 | |
Affiliated Money Market Mutual Fund | | 1.4 | |
Tobacco | | 1.4 | |
Food Products | | 1.2 | |
Life Sciences, Tools & Services | | 1.2 | |
Consumer Finance | | 1.1 | |
Road & Rail | | 1.1 | |
Air Freight & Logistics | | 1.0 | |
Thrifts & Mortgage Finance | | 0.9 | |
Construction & Engineering | | 0.8 | |
Diversified Consumer Services | | 0.8 | |
Metals & Mining | | 0.8 | |
Commercial Services & Supplies | | 0.7 | |
Containers & Packaging | | 0.7 | |
Office Electronics | | 0.7 | |
Household Durables | | 0.6 | |
Internet & Catalog Retail | | 0.5 | |
Multi-line Retail | | 0.5 | |
Multi-Utilities | | 0.5 | |
Trading Companies & Distributors | | 0.5 | |
Wireless Telecommunication Services | | 0.5 | |
Auto Components | | 0.4 | |
Leisure Equipment & Products | | 0.4 | |
Independent Power Producers & Energy Traders | | 0.3 | |
Building Products | | 0.2 | |
Water Utilities | | 0.2 | |
Paper & Forest Products | | 0.1 | |
U.S. Government Treasury Security | | 0.1 | |
See Notes to Financial Statements.
| | |
| 28 | | Visit our website at www.jennisondryden.com |
| | | |
Gas Utilities | | (0.1 | )% |
Healthcare Equipment & Supplies | | (0.1 | ) |
Marine | | (0.1 | ) |
Paper & Forest Products | | (0.1 | ) |
Capital Markets | | (0.2 | ) |
Commercial Services & Supplies | | (0.2 | ) |
Pharmaceuticals | | (0.2 | ) |
Road & Rail | | (0.2 | ) |
Chemicals | | (0.3 | ) |
Commercial Banks | | (0.3 | ) |
Life Sciences, Tools & Services | | (0.3 | ) |
Air Freight & Logistics | | (0.4 | ) |
Airlines | | (0.4 | ) |
Distributors | | (0.4 | ) |
Electric Utilities | | (0.4 | ) |
Construction & Engineering | | (0.5 | ) |
Machinery | | (0.6 | ) |
Media | | (0.6 | ) |
Biotechnology | | (0.7 | ) |
Electrical Equipment | | (0.7 | ) |
Electronic Equipment & Instruments | | (0.8 | ) |
Healthcare Providers & Services | | (0.8 | ) |
Household Durables | | (0.8 | ) |
Internet Software & Services | | (0.8 | ) |
Hotel, Restaurants & Leisure | | (0.9 | ) |
Diversified Consumer Services | | (1.0 | ) |
Energy Equipment & Services | | (1.1 | ) |
Insurance | | (1.1 | ) |
IT Services | | (1.1 | ) |
Specialty Retail | | (1.2 | ) |
Wireless Telecommunication Services | | (1.2 | ) |
Communications Equipment | | (1.4 | ) |
Software | | (1.4 | ) |
Real Estate Investment Trust | | (2.5 | ) |
Oil, Gas & Consumable Fuels | | (2.7 | ) |
Semiconductors & Semiconductor Equipment | | (4.1 | ) |
| | | |
| | 99.8 | |
Other assets in excess of liabilities | | 0.2 | |
| | | |
| | 100.0 | % |
| | | |
See Notes to Financial Statements.
| | |
| Dryden US Equity Active Extension Fund | | 29 |
Statement of Assets and Liabilities
as of August 31, 2008
| | | | |
Assets | | | | |
Investments at value: | | | | |
Unaffiliated Investments (cost $47,194,522) | | $ | 45,277,426 | |
Affiliated Investments (cost $484,896) | | | 484,896 | |
Cash | | | 33,267 | |
Receivable for investments sold | | | 2,623,397 | |
Dividends and interest receivable | | | 75,250 | |
Receivable for Fund shares sold | | | 5,933 | |
| | | | |
Total assets | | | 48,500,169 | |
| | | | |
| |
Liabilities | | | | |
Securities sold short, at value (proceeds $10,706,748) | | | 10,509,003 | |
Payable for investments purchased | | | 2,553,602 | |
Accrued expenses | | | 84,601 | |
Management fee payable | | | 14,594 | |
Dividends payable on securities sold short | | | 6,795 | |
Due to broker—variation margin | | | 6,240 | |
Affiliated transfer agent fee payable | | | 29 | |
Distribution fee payable | | | 13 | |
| | | | |
Total liabilities | | | 13,174,877 | |
| | | | |
| |
Net Assets | | $ | 35,325,292 | |
| | | | |
| | | | | |
Net assets were comprised of: | | | | |
Shares of beneficial interest, at par | | $ | 4,032 | |
Paid-in capital in excess of par | | | 38,333,202 | |
| | | | |
| | | 38,337,234 | |
Undistributed net investment income | | | 195,582 | |
Accumulated net realized loss on investment, short sales and futures transactions | | | (1,491,613 | ) |
Net unrealized depreciation on investments, short sales and futures | | | (1,715,911 | ) |
| | | | |
Net assets, August 31, 2008 | | $ | 35,325,292 | |
| | | | |
| | |
| |
Class A | | |
Net asset value and redemption price per share
($61,741 ÷ 7,057 shares of beneficial interest issued and outstanding) | | $8.75 |
Maximum sales charge (5.50% of offering price) | | .51 |
| | |
Maximum offering price to public | | $9.26 |
| | |
| |
Class Z | | |
Net asset value, offering price and redemption price per share
($35,263,551 ÷ 4,024,770 shares of beneficial interest issued and outstanding) | | $8.76 |
| | |
See Notes to Financial Statements.
| | |
| 30 | | Visit our website at www.jennisondryden.com |
Statement of Operations
For the period December 27, 2007(a) through August 31, 2008
| | | | |
Net Investment Income | | | | |
Income | | | | |
Unaffiliated dividends | | $ | 488,427 | |
Affiliated dividend income | | | 29,784 | |
Interest | | | 1,525 | |
| | | | |
Total income | | | 519,736 | |
| | | | |
| |
Expenses | | | | |
Management fee | | | 198,875 | |
Distribution fee—Class A | | | 68 | |
Registration fees | | | 75,000 | |
Legal fees and expenses | | | 60,000 | |
Custodian’s fees and expenses | | | 45,000 | |
Dividend expense on short positions | | | 43,820 | |
Broker fees and expenses on short sales | | | 33,053 | |
Reports to shareholders | | | 25,000 | |
Audit fee | | | 23,000 | |
Trustees’ fees | | | 7,000 | |
Transfer agent’s fees and expenses (including affiliated expenses of $81)(Note 3) | | | 2,000 | |
Interest expense | | | 19 | |
Miscellaneous | | | 8,706 | |
| | | | |
Total expenses | | | 521,541 | |
Less: Management fee waiver | | | (196,361 | ) |
| | | | |
Net expenses | | | 325,180 | |
| | | | |
Net investment income | | | 194,556 | |
| | | | |
| |
Realized And Unrealized Loss On Investments, Short Sales And Futures | | | | |
Net realized loss on: | | | | |
Investment transactions | | | (1,275,000 | ) |
Short sale transactions | | | (154,634 | ) |
Financial futures transactions | | | (61,979 | ) |
| | | | |
| | | (1,491,613 | ) |
| | | | |
Net unrealized appreciation (depreciation) on: | | | | |
Investments | | | (1,917,096 | ) |
Short sales | | | 197,745 | |
Financial futures contracts | | | 3,440 | |
| | | | |
| | | (1,715,911 | ) |
| | | | |
Net loss on investments, short sales and futures | | | (3,207,524 | ) |
| | | | |
Net Decrease In Net Assets Resulting From Operations | | $ | (3,012,968 | ) |
| | | | |
| (a) | Commencement of investment operations. |
See Notes to Financial Statements.
| | |
| Dryden US Equity Active Extension Fund | | 31 |
Statement of Cash Flows
For the period December 27, 2007(a) through August 31, 2008
| | | | |
Increase (Decrease) in Cash | | | | |
Cash flows provided from (used in) operating activities: | | | | |
Interest and dividends received (excluding discount accretion of $488) | | $ | 406,973 | |
Operating expenses paid | | | (182,123 | ) |
Decrease in variation margin payable | | | (52,299 | ) |
Purchases of short-term portfolio investments, net | | | (534,363 | ) |
Purchases of long-term portfolio investments | | | (64,662,868 | ) |
Increase in proceeds from securities sold short | | | 19,632,613 | |
Decrease in purchases to cover | | | (9,080,500 | ) |
Proceeds from disposition of long-term portfolio investments | | | 16,173,507 | |
| | | | |
Net cash used in operating activities | | | (38,299,060 | ) |
| | | | |
| |
Cash flows provided from (used in) financing activities: | | | | |
Increase in shares of beneficial interest sold | | | 38,332,327 | |
| | | | |
Net cash provided from financing activities | | | 38,332,327 | |
| | | | |
Net increase in cash | | | 33,267 | |
Cash at beginning of period | | | — | |
| | | | |
Cash at end of period | | $ | 33,267 | |
| | | | |
|
Reconciliation of Net Decrease in Net Assets to Net Cash Provided
from (used in) Operating Activities | |
Net decrease in net assets resulting from operations | | $ | (3,012,968 | ) |
| | | | |
| |
Increase in investments | | | (48,969,846 | ) |
Increase in net unrealized depreciation on investments, short sales and futures | | | 1,715,911 | |
Net realized loss on investment, short sales and futures transactions | | | 1,491,613 | |
Increase in receivable for investments sold | | | (2,623,397 | ) |
Increase in dividends and interest receivable | | | (75,250 | ) |
Increase in payable for investments purchased | | | 2,553,602 | |
Increase in management fee payable | | | 14,594 | |
Increase in dividends payable on securities sold short | | | 6,795 | |
Increase in due to broker—variation margin | | | 6,240 | |
Increase in affiliated transfer agent fee payable | | | 29 | |
Increase in distribution fee payable | | | 13 | |
Increase in securities sold short, at value | | | 10,509,003 | |
Increase in accrued expenses | | | 84,601 | |
| | | | |
Total adjustments | | | (35,286,092 | ) |
| | | | |
Net cash used in operating activities | | $ | (38,299,060 | ) |
| | | | |
| (a) | Commencement of investment operations. |
See Notes to Financial Statements.
| | |
| 32 | | Visit our website at www.jennisondryden.com |
Statement of Changes in Net Assets
| | | | |
| | | December 27, 2007*
through
August 31, 2008 | |
Increase In Net Assets | | | | |
Operations | | | | |
Net investment income | | $ | 194,556 | |
Net realized loss on investment, short sales and futures transactions | | | (1,491,613 | ) |
Net unrealized depreciation on investments, short sales and futures | | | (1,715,911 | ) |
| | | | |
Net decrease in net assets resulting from operations | | | (3,012,968 | ) |
| | | | |
| |
Fund share transactions (Net of share conversions) (Note 6) | | | | |
Net proceeds from shares sold | | | 38,943,748 | |
Cost of shares reacquired | | | (605,488 | ) |
| | | | |
Net increase in net assets from Fund share transactions | | | 38,338,260 | |
| | | | |
Total increase | | | 35,325,292 | |
| |
Net Assets | | | | |
Beginning of period | | | — | |
| | | | |
End of period(a) | | $ | 35,325,292 | |
| | | | |
(a) Includes undistributed net investment income of: | | $ | 195,582 | |
| | | | |
| * | Commencement of investment operations. |
See Notes to Financial Statements.
| | |
| Dryden US Equity Active Extension Fund | | 33 |
Notes to Financial Statements
JennisonDryden Portfolios, Inc. (the “Portfolios”) is registered under the Investment Company Act of 1940, as amended, as a diversified, open-end, management investment company and currently consists of two funds: Dryden US Equity Active Extension Fund (the “Fund”) and Jennison Value Fund. These financial statements relate to the Dryden US Equity Active Extension Fund. The financial statements of the other fund are not represented herein. The Fund commenced investment operations on December 27, 2007. The investment objective of the Fund is long-term capital appreciation. The Fund seeks to achieve its objective through the use of a long/short investment strategy.
Note 1. Accounting Policies
The following is a summary of significant accounting policies followed by the Portfolios and the Fund in the preparation of its financial statements.
Securities Valuation: Securities listed on a securities exchange are valued at the last sale price on such exchange on the day of valuation or, if there was no sale on such day, at the mean between the last reported bid and asked prices, or at the last bid price on such day in the absence of an asked price. Securities that are actively traded via NASDAQ are valued at the official closing price provided by NASDAQ. Securities that are actively traded in the over-the-counter market, including listed securities for which the primary market is believed by Prudential Investments LLC (“PI” or “Manager”) in consultation with the subadvisor, to be over-the-counter are valued at market value using prices provided by an independent pricing agent or principal market maker. Futures contracts and options thereon traded on a commodities exchange or board of trade are valued at the last sale price at the close of trading on such exchange or board of trade or, if there was no sale on the applicable commodities exchange or board of trade on such day, at the mean between the most recently quoted bid and asked prices on such exchange or board of trade or at the last bid price in the absence of an asked price. Securities for which reliable market quotations are not readily available, or whose values have been affected by events occurring after the close of the security’s foreign market and before the Fund’s normal pricing time, are valued at fair value in accordance with the Board of Directors’ approved fair valuation procedures. When determining the fair valuation of securities some of the factors influencing the valuation include, the nature of any restrictions on disposition of the securities; assessment of the general liquidity of the securities; the issuer’s financial condition and the markets in which it does business; the cost of the
| | |
| 34 | | Visit our website at www.jennisondryden.com |
investment; the size of the holding and the capitalization of issuer; the prices of any recent transactions or bids/offers for such securities or any comparable securities; any available analyst media or other reports or information deemed reliable by the investment adviser regarding the issuer or the markets or industry in which it operates. Using fair value to price securities may result in a value that is different from a security’s most recent closing price and from the price used by other mutual funds to calculate their net asset values.
Investments in mutual funds are valued at their net asset value as of the close of the New York Stock Exchange on the date of valuation.
Short-term debt securities which mature in 60 days or less are valued at amortized cost, which approximates market value. The amortized cost method includes valuing a security at its cost on the date of purchase and thereafter assuming a constant amortization to maturity of the difference between the principal amount due at maturity and cost. Short-term debt securities which mature in more than 60 days are valued at current market quotations.
Financial Futures Contracts: A financial futures contract is an agreement to purchase (long) or sell (short) an agreed amount of securities at a set price for delivery on a future date. Upon entering into a financial futures contract, the Fund is required to pledge to the broker an amount of cash and/or other assets equal to a certain percentage of the contract amount. This amount is known as the “initial margin.” Subsequent payments, known as “variation margin,” are made or received by the Fund each day, depending on the daily fluctuations in the value of the underlying security. Such variation margin is recorded for financial statement purposes on a daily basis as unrealized gain or loss. When the contract expires or is closed, the gain or loss is realized and is presented in the Statement of Operations as net realized gain or loss on financial futures transactions.
The Fund invests in financial futures contracts in order to hedge its existing portfolio securities, or securities the Fund intends to purchase, against fluctuations in value caused by changes in prevailing interest rates or market conditions. Should interest rates move unexpectedly, the Fund may not achieve the anticipated benefits of the financial futures contracts and may realize a loss.
The use of futures transactions involves the risk of imperfect correlation in movements in the price of futures contracts, interest rates and the underlying hedged assets.
Financial futures contracts involve elements of both market and credit risk in excess of the amounts reflected on the Statement of Assets and Liabilities.
| | |
| Dryden US Equity Active Extension Fund | | 35 |
Notes to Financial Statements
continued
Short Sales: The Fund engages in short sales (selling securities it does not own) as part of its normal investment activities. These short sales are collateralized at all times by cash deposits with the prime broker and securities held in a segregated account at the custodian. The short stock rebate included in the Statement of Operations represents the net income earned on short sale proceeds held on deposit with the prime broker and margin interest earned or incurred on short sale transactions. Margin interest is the income earned (or expense incurred) as a result of the market value of securities sold short being less than (or greater than) the proceeds received from the short sales. Dividends declared on short positions are recorded on the ex-dividend date as an expense on the Statement of Operations and included in the expense ratio in the Financial Highlights. Liability for securities sold short is reported at market value on the Statement of Assets and Liabilities. The Fund records a loss if the price of the security increases between the date of the short sale and the date on which the Fund replaces the borrowed security. The Fund records a gain if the price of the security declines between those dates. Short selling involves the off-balance sheet risk of potentially unlimited increase in the market value of the security sold short, which could result in potentially unlimited loss for the Fund. The Fund is subject to risk of loss if the broker were to fail to perform its obligation under contractual terms. A gain, limited to the price at which the company sold the security short, or a loss, unlimited in size, will be recognized upon the termination of the short sale.
Securities Transactions and Net Investment Income: Securities transactions are recorded on the trade date. Realized gains or losses on sales of securities are calculated on the identified cost basis. Dividend income is recorded on the ex-dividend date. Interest income, including amortization of premium and accretion of discount on debt securities as required, is recorded on an accrual basis. Expenses are recorded on an accrual basis. The Fund amortizes premiums and accretes discounts on purchases of debt securities as adjustments to interest income.
Net investment income or loss (other than distribution fees which are charged directly to the respective class) and unrealized and realized gains or losses are allocated daily to each class of shares based upon the relative proportion of net assets of each class at the beginning of the day.
Dividends and Distributions: The Fund expects to pay dividends of net investment income and distributions of net realized capital gains, if any, annually. Dividends and distributions to shareholders, which are determined in accordance with federal
| | |
| 36 | | Visit our website at www.jennisondryden.com |
income tax regulations and which may differ from generally accepted accounting principles, are recorded on the ex-dividend date. Permanent book/tax differences relating to income and gains are reclassified amongst undistributed net investment income, accumulated net realized gain or loss and paid-in capital in excess of par, as appropriate.
Taxes: For federal income tax purposes, it is the Fund’s policy to continue to meet the requirements of the Internal Revenue Code applicable to regulated investment companies and to distribute all of its taxable net investment income and capital gains, if any, to shareholders. Therefore, no federal income tax provision is required.
Withholding taxes on foreign dividends are recorded, net of reclaimable amounts, at the time the related income is earned.
Estimates: The preparation of the financial statements requires management to make estimates and assumptions that affect the reported amounts and disclosures in the financial statements. Actual results could differ from those estimates.
Note 2. Agreements
The Portfolios have a management agreement with PI. Pursuant to this agreement, PI has responsibility for all investment advisory services and supervises the sub-advisor’s performance of such services. PI has entered into a subadvisory agreement with Quantitative Management Associates (“QMA”). The subadvisory agreement provides that QMA furnishes investment advisory services in connection with the management of the Fund. In connection therewith, QMA is obligated to keep certain books and records of the Fund. PI pays for the services of QMA, the compensation of officers of the Fund, occupancy and certain clerical and bookkeeping costs of the Fund. The Fund bears all other costs and expenses.
The management fee paid to PI is computed daily and payable monthly at an annual rate of 1.00% of the average daily net assets of the Fund.
PI has contractually agreed until December 31, 2009 to waive a portion of their management fee and/or reimburse the Fund in order to limit operating expenses (excluding distribution and service (12b-1) fees, dividend expenses related to short sales, taxes, interest, brokerage commissions and certain extraordinary expenses) to each class of shares to not exceed 1.25% of the Fund’s daily average net assets.
The Fund has a distribution agreement with Prudential Investment Management Services LLC (“PIMS”), which acts as the distributor of the Class A and Class Z shares
| | |
| Dryden US Equity Active Extension Fund | | 37 |
Notes to Financial Statements
continued
of the Fund. The Fund compensates PIMS for distributing and servicing the Fund’s Class A shares pursuant to plans of distribution (the “Class A Plan”), regardless of expenses actually incurred by PIMS. The distribution fees are accrued daily and payable monthly. No distribution or service fees are paid to PIMS as distributor of the Class Z shares of the Fund.
Pursuant to the Class A Plan, the Fund compensates PIMS for distribution related activities at an annual rate of up to .30 of 1% of the average daily net assets of the Class A shares, respectively. PIMS contractually agreed to limit such fees to .25 of 1% of the average daily net assets of the Class A shares.
PI, QMA and PIMS are indirect, wholly-owned subsidiaries of Prudential Financial, Inc. (“The Prudential”).
The Portfolios, along with other affiliated registered investment companies (the “Funds”), are parties to a syndicated credit agreement (“SCA”) with two banks. The SCA provides for a commitment of $500 million. Interest on any borrowings under the SCA is incurred at contracted market rates and a commitment fee for the unused amount is accrued daily and paid quarterly. The Funds pay a commitment fee of .06 of 1% of the unused portion of the SCA. The expiration date of the SCA will be October 24, 2008. The purpose of the SCA is to provide an alternative source of temporary funding for capital share redemptions. The Fund did not borrow any amounts pursuant to the SCA during the period ended August 31, 2008.
Note 3. Other Transactions with Affiliates
Prudential Mutual Fund Services LLC (“PMFS”), an affiliate of PI and an indirect, wholly-owned subsidiary of Prudential, serves as the Fund’s transfer agent. Transfer agent’s fees and expenses on the Statement of Operations include certain out-of-pocket expenses paid to non-affiliates, where applicable.
The Fund invests in the Taxable Money Market Series (the “Portfolio”), a portfolio of Dryden Core Investment Fund, pursuant to an exemptive order received from the Securities and Exchange Commission. The Portfolio is a money market mutual fund registered under the Investment Company Act of 1940, as amended, and managed by PI.
| | |
| 38 | | Visit our website at www.jennisondryden.com |
Note 4. Portfolio Securities
Purchases and sales of investment securities, other than short-term investments, for the period ended August 31, 2008 were $67,216,470 and $18,787,770, respectively. Short sales and purchases to cover were $19,632,613 and $9,080,500, respectively.
Note 5. Distributions and Tax Information
Distributions to shareholders, which are determined in accordance with federal income tax regulations and which may differ from generally accepted accounting principles, are recorded on the ex-dividend date. In order to present undistributed net investment income, accumulated net realized loss on investment, short sale and futures transactions and paid-in capital in excess of par on the Statement of Assets and Liabilities that more closely represent their tax character, certain adjustments have been made to undistributed net investment income and paid-in capital in excess of par. For the period ended August 31, 2008, the adjustments were to increase undistributed net investment income and decrease paid-in-capital in excess of par by $1,026 due to the reclassification of non-deductible expenses. Net investment income, net realized loss and net assets were not affected by this change.
As of August 31, 2008, the accumulated undistributed earnings on a tax basis was $195,582 from ordinary income.
As of August 31, 2008, the Fund elected to treat post-October capital gain losses of approximately $1,413,000 as having been incurred in the following fiscal year.
The United States federal income tax basis of the Funds’ investments and the net unrealized depreciation as of August 31, 2008 were as follows:
| | | | | | | | | | |
Tax Basis of
Investments | | Appreciation | | Depreciation | | Net
Unrealized
Depreciation | | Other Cost
Basis
Adjustments | | Total Net
Unrealized
Depreciation |
| $47,726,789 | | $2,111,759 | | $(4,076,226) | | $(1,964,467) | | $197,745 | | $(1,766,722) |
The difference between book basis and tax basis is primarily attributable to deferred losses on wash sales. The other cost basis adjustments are primarily attributable to appreciation on short sales.
Management has analyzed the Fund’s tax positions taken on federal income tax returns for all open tax years and has concluded that as of August 31, 2008, no provision for income tax would be required in the Funds’ financial statements. The
| | |
| Dryden US Equity Active Extension Fund | | 39 |
Notes to Financial Statements
continued
Fund’s federal and state income and federal excise tax returns for tax years for which the applicable statutes of limitations have not expired are subject to examination by the Internal Revenue Service and state departments of revenue.
Note 6. Capital
The Fund consists of Class A, Class B, Class C and Class Z shares. For the period ended August 31, 2008, only Class A and Class Z were available for investment. Class A shares are sold with a front-end sales charge of up to 5.5%. All investors who purchase Class A shares in an amount of $1 million or more and sell these shares within 12 months of purchase are subject to a contingent deferred sales charge (CDSC) of 1%, including investors who purchase their shares through broker-dealers affiliated with Prudential. Class Z shares are not subject to any sales or redemption charge and are offered exclusively for sale to a limited group of investors.
At August 31, 2008, 49.6% of the shares outstanding were owned by the Manager and its affiliates.
The Fund has authorized an unlimited number of shares of beneficial interest at $.01 par value divided into four classes, designated Class A, Class B, Class C and Class Z.
Transactions in shares of common stock were as follows:
| | | | | | | |
Class A | | Shares | | | Amount | |
Period ended August 31, 2008:* | | | | | | | |
Shares sold | | 7,680 | | | $ | 68,928 | |
Shares issued in reinvestment of dividends | | — | | | | — | |
Shares reacquired | | (623 | ) | | | (5,480 | ) |
| | | | | | | |
Net increase (decrease) in shares outstanding | | 7,057 | | | $ | 63,448 | |
| | | | | | | |
Class Z | | | | | | |
Period ended August 31, 2008:* | | | | | | | |
Shares sold | | 4,093,715 | | | $ | 38,874,820 | |
Shares issued in reinvestment of dividends | | — | | | | — | |
Shares reacquired | | (68,945 | ) | | | (600,008 | ) |
| | | | | | | |
Net increase (decrease) in shares outstanding | | 4,024,770 | | | $ | 38,274,812 | |
| | | | | | | |
| * | Commenced operations on December 27, 2007. |
| | |
| 40 | | Visit our website at www.jennisondryden.com |
Note 7. New Accounting Pronouncements
In March 2008, the FASB released Statement of Financial Accounting Standards No. 161, “Disclosures about Derivative Instruments and Hedging Activities” (“FAS 161”). FAS 161 requires qualitative disclosures about objectives and strategies for using derivatives, quantitative disclosures about fair value amounts of and gains and losses on derivative instruments, and disclosures about credit-risk-related contingent features in derivative agreements. The application of FAS 161 is required for fiscal years beginning after November 15, 2008 and interim periods within those fiscal years. At this time, management is evaluating the implications of FAS 161 and its impact on the financial statements has not yet been determined.
Note 8. Subsequent Events
As noted in the Portfolio of Investments, the Series held securities issued by American International Group (AIG). With respect to securities issued by AIG or for which AIG is counterparty, the Federal Reserve Board with the full support of the Treasury Department, authorized the Federal Reserve Bank of New York to lend up to $122.8 billion to AIG. The secured loan has terms and conditions designed to protect the interests of the U.S. government and taxpayers. The values of the positions held by the Series have been adversely impacted since the date of these financial statements; however, the impact on the net assets of the Series is not material.
| | |
| Dryden US Equity Active Extension Fund | | 41 |
Financial Highlights
| | | | |
| | | Class A | |
| | | December 27, 2007(a)
through
August 31, 2008 | |
Per Share Operating Performance: | | | | |
Net Asset Value, Beginning Of Period | | $ | 10.00 | |
| | | | |
Income (loss) from investment operations: | | | | |
Net investment income | | | .02 | |
Net realized and unrealized loss on investment transactions | | | (1.27 | ) |
| | | | |
Total from investment operations | | | (1.25 | ) |
| | | | |
Net asset value, end of period | | $ | 8.75 | |
| | | | |
Total Return(b): | | | (12.50 | )% |
Ratios/Supplemental Data: | | | | |
Net assets, end of period (000) | | $ | 62 | |
Average net assets (000) | | $ | 40 | |
Ratios to average net assets(c)(d)(e): | | | | |
Expenses, including distribution and service (12b-1) fees | | | 1.89 | %(f) |
Expenses, excluding distribution and service (12b-1) fees | | | 1.64 | %(f) |
Expenses, excluding distribution and service (12b-1) fees, interest and dividend expense on short positions and broker fees and expenses on short sales | | | 1.25 | %(f) |
Net investment income | | | .55 | %(f) |
For Class A and Z shares: | | | | |
Portfolio turnover rate | | | 33 | %(g) |
| (a) | Inception date of Class A shares. |
| (b) | Total return does not consider the effects of sales loads. Total return is calculated assuming a purchase of a share on the first day and a sale on the last day of each period reported, and includes reinvestment of dividends and distributions. Total returns for periods less than a full year are not annualized. Total investment returns may reflect adjustments to conform to generally accepted accounting principles. |
| (c) | Does not include expenses of the underlying portfolios in which the Fund invests. |
| (d) | The distributor of the Fund has contractually agreed to limit its distribution and service (12b-1) fees to .25 of 1% of the average daily net assets of the Class A shares. |
| (e) | Net of expense waiver/reimbursement. If the investment manager had not waived/reimbursed expenses, the expense ratio including distribution and service (12b-1) fees and net investment income ratio would have been 2.88% and -0.44%, respectively, for the period ended August 31, 2008. Does not include expenses of the underlying funds in which the Fund invests. |
See Notes to Financial Statements.
| | |
| 42 | | Visit our website at www.jennisondryden.com |
| | | | |
| | | Class Z | |
| | | December 27, 2007(a)
through
August 31, 2008 | |
Per Share Operating Performance: | | | | |
Net Asset Value, Beginning Of Period | | $ | 10.00 | |
| | | | |
Income (loss) from investment operations: | | | | |
Net investment income | | | .05 | |
Net realized and unrealized loss on investment transactions | | | (1.29 | ) |
| | | | |
Total from investment operations | | | (1.24 | ) |
| | | | |
Net asset value, end of period | | $ | 8.76 | |
| | | | |
Total Return(b): | | | (12.40 | )% |
Ratios/Supplemental Data: | | | | |
Net assets, end of period (000) | | $ | 35,264 | |
Average net assets (000) | | $ | 29,266 | |
Ratios to average net assets(c)(d): | | | | |
Expenses, including distribution and service (12b-1) fees | | | 1.64 | %(e) |
Expenses, excluding distribution and service (12b-1) fees | | | 1.64 | %(e) |
Expenses, excluding distribution and service (12b-1) fees, interest and dividend expense on short positions and broker fees and expenses on short sales | | | 1.25 | %(e) |
Net investment income | | | .98 | %(e) |
| (a) | Inception date of Class Z shares. |
| (b) | Total return does not consider the effects of sales loads. Total return is calculated assuming a purchase of a share on the first day and a sale on the last day of each period reported, and includes reinvestment of dividends and distributions. Total returns for periods less than a full year are not annualized. Total investment returns may reflect adjustments to conform to generally accepted accounting principles. |
| (c) | Does not include expenses of the underlying portfolios in which the Fund invests. |
| (d) | Net of expense waiver/reimbursement. If the investment manager had not waived/reimbursed expenses, the expense ratio including distribution and service (12b-1) fees and net investment income ratio would have been 2.63% and -0.01%, respectively, for the period ended August 31, 2008. Does not include expenses of the underlying funds in which the Fund invests. |
See Notes to Financial Statements.
| | |
| Dryden US Equity Active Extension Fund | | 43 |
Report of Independent Registered Public Accounting Firm
The Board of Directors and Shareholders
Dryden US Equity Active Extension Fund
We have audited the accompanying statement of assets and liabilities of Dryden US Equity Active Extension Fund (hereafter referred to as the “Fund”), including the portfolio of investments, as of August 31, 2008, and the related statements of operations, cash flows, changes in net assets and the financial highlights for the period from December 27, 2007 (commencement of operations) to August 31, 2008. These financial statements and financial highlights are the responsibility of the Fund’s management. Our responsibility is to express an opinion on these financial statements and financial highlights based on our audit.
We conducted our audit in accordance with the standards of the Public Company Accounting Oversight Board (United States). Those standards require that we plan and perform the audit to obtain reasonable assurance about whether the financial statements and financial highlights are free of material misstatement. An audit includes examining, on a test basis, evidence supporting the amounts and disclosures in the financial statements. Our procedures included confirmation of securities owned as of August 31, 2008, by correspondence with the custodian and brokers or by other appropriate auditing procedures where replies from brokers were not received. An audit also includes assessing the accounting principles used and significant estimates made by management, as well as evaluating the overall financial statement presentation. We believe that our audit provides a reasonable basis for our opinion.
In our opinion, the financial statements and financial highlights referred to above present fairly, in all material respects, the financial position of the Fund as of August 31, 2008, and the results of its operations, cash flows, changes in its net assets and the financial highlights for the period December 27, 2007 through August 31, 2008, in conformity with U.S. generally accepted accounting principles.

New York, New York
October 27, 2008
| | |
| 44 | | Visit our website at www.jennisondryden.com |
MANAGEMENT OF THE FUND
(Unaudited)
Information about Fund Directors/Trustees (referred to herein as “Board Members”) and Fund Officers is set forth below. Board Members who are not deemed to be “interested persons,” as defined in the 1940 Act, are referred to as “Independent Board Members.” Board Members who are deemed to be “interested persons” are referred to as “Interested Board Members.” The Board Members are responsible for the overall supervision of the operations of the Fund and perform the various duties imposed on the directors or trustees of investment companies by the 1940 Act.
| | | | |
Independent Board Members | | |
| | | |
Name, Address, Age Position(s) Portfolios
Overseen (1) | | Principal Occupation(s) During Past Five Years | | Other Directorships Held |
Kevin J. Bannon (56) Board Member Portfolios Overseen: 63 | | Managing Director (since April 2008) of Highmount Capital LLC (registered investment adviser); formerly Executive Vice President and Chief Investment Officer (January 2003-August 2007) of Bank of New York Company; President (May 2003-May 2007) of BNY Hamilton Family of Mutual Funds. | | None. |
| | | |
Linda W. Bynoe (56) Board Member Portfolios Overseen: 63 | | President and Chief Executive Officer (since March 1995) of Telemat Ltd. (management consulting); formerly Vice President at Morgan Stanley & Co. (broker-dealer). | | Director of Simon Property Group, Inc. (real estate investment trust) (since May 2003); Anixter International (communication products distributor) (since January 2006); Director of Northern Trust Corporation (banking) (since April 2006). |
| | | |
David E.A. Carson (74) Board Member Portfolios Overseen: 63 | | Director (since May 2008) of Liberty Bank; Director (since October 2007) of ICI Mutual Insurance Company; formerly President, Chairman and Chief Executive Officer of People’s Bank (1987 – 2000). | | None. |
| | | |
Michael S. Hyland, CFA (63) Board Member Portfolios Overseen: 63 | | Independent Consultant (since February 2005); formerly Senior Managing Director (July 2001-February 2005) of Bear Stearns & Co., Inc. | | None. |
| | | |
Robert E. La Blanc (74) Board Member Portfolios Overseen: 63 | | President (since 1981) of Robert E. La Blanc Associates, Inc. (telecommunications). | | Director of CA, Inc. (since 2002) (software company); FiberNet Telecom Group, Inc. (since 2003) (telecom company). |
Dryden US Equity Active Extension Fund
| | | | |
Douglas H. McCorkindale (69) Board Member Portfolios Overseen: 63 | | Formerly Chairman (February 2001-June 2006), Chief Executive Officer (June 2000-July 2005), President (September 1997-July 2005) and Vice Chairman (March 1984-May 2000) of Gannett Co. Inc. (publishing and media). | | Director of Continental Airlines, Inc. (since May 1993); Director of Lockheed Martin Corp. (aerospace and defense) (since May 2001). |
| | | |
Stephen P. Munn (66) Board Member Portfolios Overseen: 63 | | Lead Director (since 2007) and formerly Chairman (1993-2007) of Carlisle Companies Incorporated (manufacturer of industrial products). | | None. |
| | | |
Richard A. Redeker (65) Board Member Portfolios Overseen: 63 | | Retired Mutual Fund Executive (36 years); Management Consultant; Director of Penn Tank Lines, Inc. (since 1999). | | None. |
| | | |
Robin B. Smith (69) Board Member & Independent Chair Portfolios Overseen: 63 | | Chairman of the Board (since January 2003) of Publishers Clearing House (direct marketing); formerly Chairman and Chief Executive Officer (August 1996-January 2003) of Publishers Clearing House. | | Formerly Director of BellSouth Corporation (telecommunications) (1992-2006). |
| | | |
Stephen G. Stoneburn (65) Board Member Portfolios Overseen: 63 | | President and Chief Executive Officer (since June 1996) of Quadrant Media Corp. (publishing company); formerly President (June 1995-June 1996) of Argus Integrated Media, Inc.; Senior Vice President and Managing Director (January 1993-1995) of Cowles Business Media; Senior Vice President of Fairchild Publications, Inc (1975-1989). | | None. |
| | | |
Interested Board Members | | | | |
| | | |
Judy A. Rice (60) Board Member & President Portfolios Overseen: 63 | | President, Chief Executive Officer, Chief Operating Officer and Officer-In-Charge (since February 2003) of Prudential Investments LLC; President, Chief Executive Officer and Officer-In-Charge (since April 2003) of Prudential Mutual Fund Services LLC; formerly Vice President (February 1999-April 2006) of Prudential Investment Management Services LLC; formerly President, Chief Executive Officer, Chief Operating Officer and Officer-In-Charge (May 2003-June 2005) and Director (May 2003-March 2006) and Executive Vice President (June 2005-March 2006) of AST Investment Services, Inc.; Member of Board of Governors of the Investment Company Institute. | | None. |
Visit our website at www.jennisondryden.com
| | | | |
Robert F. Gunia (61) Board Member & Vice President Portfolios Overseen: 147 | | Chief Administrative Officer (since September 1999) and Executive Vice President (since December 1996) of Prudential Investments LLC; President (since April 1999) of Prudential Investment Management Services LLC; Executive Vice President (since March 1999) and Treasurer (since May 2000) of Prudential Mutual Fund Services LLC; Chief Administrative Officer, Executive Vice President and Director (since May 2003) of AST Investment Services, Inc. | | Director (since May 1989) of The Asia Pacific Fund, Inc. and Vice President (since January 2007) of The Greater China Fund, Inc. |
1 | The year that each Board Member joined the Fund’s Board is as follows: Kevin J. Bannon, 2008; Linda W. Bynoe, 2005; David E.A. Carson, 2003; Michael S. Hyland, 2008; Robert E. La Blanc, 2003; Douglas H. McCorkindale, 1987; Stephen P. Munn, 2008; Richard A. Redeker, 1993; Robin B. Smith, 1996; Stephen G. Stoneburn, 2003; Judy A. Rice, Director since 2000 and President since 2003; Robert F. Gunia, Vice President since 1999 and Board Member since 1996. |
Dryden US Equity Active Extension Fund
| | |
Fund Officers (a)(1) | | |
| | |
Name, Address and Age
Position with Fund | | Principal Occupation(s) During Past Five Years |
Kathryn L. Quirk (55) Chief Legal Officer | | Vice President and Corporate Counsel (since September 2004) of Prudential; Executive Vice President, Chief Legal Officer and Secretary (since July 2005) of PI and Prudential Mutual Fund Services LLC; Vice President and Corporate Counsel (since June 2005) and Secretary (since February 2006) of AST Investment Services, Inc.; formerly Senior Vice President and Assistant Secretary (November 2004-August 2005) of PI; formerly Assistant Secretary (June 2005-February 2006) of AST Investment Services, Inc.; formerly Managing Director, General Counsel, Chief Compliance Officer, Chief Risk Officer and Corporate Secretary (1997-2002) of Zurich Scudder Investments, Inc. |
| | |
Deborah A. Docs (50) Secretary | | Vice President and Corporate Counsel (since January 2001) of Prudential; Vice President (since December 1996) and Assistant Secretary (since March 1999) of PI; formerly Vice President and Assistant Secretary (May 2003-June 2005) of AST Investment Services, Inc. |
| | |
Jonathan D. Shain (50) Assistant Secretary | | Vice President and Corporate Counsel (since August 1998) of Prudential; Vice President and Assistant Secretary (since May 2001) of PI; Vice President and Assistant Secretary (since February 2001) of PMFS; formerly Vice President and Assistant Secretary (May 2003-June 2005) of AST Investment Services, Inc. |
| | |
Claudia DiGiacomo (34) Assistant Secretary | | Vice President and Corporate Counsel (since January 2005) of Prudential; Vice President and Assistant Secretary of PI (since December 2005); Associate at Sidley Austin LLP (1999-2004). |
| | |
John P. Schwartz (37) Assistant Secretary | | Vice President and Corporate Counsel (since April 2005) of Prudential; Vice President and Assistant Secretary of PI (since December 2005); Associate at Sidley Austin LLP (1997-2005). |
| | |
Andrew R. French (45) Assistant Secretary | | Director and Corporate Counsel (since May 2006) of Prudential; Vice President and Assistant Secretary (since January 2007) of PI; Vice President and Assistant Secretary (since January 2007) of PMFS; formerly Senior Legal Analyst of Prudential Mutual Fund Law Department (1997-2006). |
| | |
Timothy J. Knierim (49) Chief Compliance Officer | | Chief Compliance Officer of Prudential Investment Management, Inc. (PIM) (since July 2007); formerly Chief Risk Officer of PIM and PI (2002-2007) and formerly Chief Ethics Officer of PIM and PI (2006-2007). |
| | |
Valerie M. Simpson (50) Deputy Chief Compliance Officer | | Chief Compliance Officer (since April 2007) of PI and AST Investment Services, Inc.; formerly Vice President-Financial Reporting (June 1999-March 2006) for Prudential Life and Annuities Finance. |
| | |
Theresa C. Thompson (46) Deputy Chief Compliance Officer | | Vice President, Mutual Fund Compliance, PI (since April 2004); and Director, Compliance, PI (2001 - 2004). |
Visit our website at www.jennisondryden.com
| | |
Noreen M. Fierro (44) Anti-Money Laundering Compliance Officer | | Vice President, Corporate Compliance (since May 2006) of Prudential; formerly Corporate Vice President, Associate General Counsel (April 2002-May 2005) of UBS Financial Services, Inc., in their Money Laundering Prevention Group; Senior Manager (May 2005-May 2006) of Deloitte Financial Advisory Services, LLP, in their Forensic and Dispute Services, Anti-Money Laundering Group. |
| | |
Grace C. Torres (49) Treasurer and Principal Financial and Accounting Officer | | Assistant Treasurer (since March 1999) and Senior Vice President (since September 1999) of PI; Assistant Treasurer (since May 2003) and Vice President (since June 2005) of AST Investment Services, Inc.; Senior Vice President and Assistant Treasurer (since May 2003) of Prudential Annuities Advisory Services, Inc.; formerly Senior Vice President (May 2003-June 2005) of AST Investment Services, Inc. |
| | |
M. Sadiq Peshimam (44) Assistant Treasurer | | Vice President (since 2005) and Director (2000-2005) within Prudential Mutual Fund Administration. |
| | |
Peter Parrella (50) Assistant Treasurer | | Vice President (since 2007) and Director (2004-2007) within Prudential Mutual Fund Administration; formerly Tax Manager at SSB Citi Fund Management LLC (1997-2004). |
(a) | Excludes interested Board Members who also serve as President or Vice President. |
1 | The year that each individual became an Officer of the Fund is as follows: |
Kathryn L. Quirk, 2005; Deborah A. Docs, 2005; Timothy J. Knierim, 2007; Valerie M. Simpson, 2007; Theresa C. Thompson, 2008; Grace C. Torres, 1997; Noreen M. Fierro, 2006; Jonathan D. Shain, 2005; Claudia DiGiacomo, 2005; Andrew R. French, 2006; John P. Schwartz, 2006; Peter Parrella, 2007; M. Sadiq Peshimam, 2006.
Explanatory Notes
| • | | Board Members are deemed to be “Interested,” as defined in the 1940 Act, by reason of their affiliation with Prudential Investments LLC and/or an affiliate of Prudential Investments LLC. |
| • | | Unless otherwise noted, the address of all Board Members and Officers is c/o Prudential Investments LLC, Gateway Center Three, 100 Mulberry Street, Newark, New Jersey 07102. |
| • | | There is no set term of office for Board Members or Officers. The Board Members have adopted a retirement policy, which calls for the retirement of Board Members on December 31st of the year in which they reach the age of 75. |
| • | | “Other Directorships Held” includes only directorships of companies required to register or file reports with the SEC under the Securities Exchange Act of 1934 (that is, “public companies”) or other investment companies registered under the 1940 Act. |
| • | | “Portfolios Overseen” includes all investment companies managed by Prudential Investments LLC. The investment companies for which PI serves as manager include the JennisonDryden Funds, Strategic Partners Funds, The Prudential Variable Contract Accounts, The Target Portfolio Trust, The Prudential Series Fund, The High Yield Income Fund, Inc., The High Yield Plus Fund, Inc., Nicholas-Applegate Fund, Inc., Prudential’s Gibraltar Fund, Inc. and the Advanced Series Trust. |
Dryden US Equity Active Extension Fund
Approval of Advisory Agreements
At meetings of the Board held on November 8-9, 2007, the Board approved the creation of a new fund, to be known as the Dryden US Equity Active Extension Fund (the “New Fund”), and at the same meetings approved an amended management agreement with Prudential Investments LLC (the “Manager”) and a new subadvisory agreement with Quantitative Management Associates LLC (“QMA” or the “new subadviser”). The material factors and conclusions that formed the basis for the Trustees’ determinations to approve the new agreements are discussed separately below.
Nature, Quality and Extent of Services
With respect to the Manager, the Board noted that in connection with the approval of the management agreement, it had received and considered information about the Manager at the November 8-9, 2007 meetings, and concluded that it was satisfied with the nature, quality and extent of services to be provided by the Manager under the management agreement. The Board determined that it was reasonable to conclude that the nature, quality and extent of services to be provided by the Manager under the amended management agreement covering the New Fund would be similar in nature to those provided to other Prudential mutual funds under the existing management agreement.
With respect to QMA, the Board received and considered information regarding the nature and extent of services that would be provided to the New Fund under the new subadvisory agreement.
With respect to the quality of services, the Board considered, among other things, the background and experience of the portfolio manager for the new subadviser. The Board was also provided with information pertaining to the organizational structure, senior management, investment operations, and other relevant information pertaining to the new subadviser. The Board noted that it received favorable compliance reports from the Fund’s Chief Compliance Officer (CCO) as to the new subadviser. The Board considered the new subadviser’s experience and reputation in managing other funds with similar investment objectives and strategies.
The Board concluded that with it was reasonable to expect that it would be satisfied with the nature, extent and quality of investment management and investment subadvisory services to be provided by the Manager and the new subadviser, respectively.
Performance
Because the New Fund had not commenced operations, no performance of the New Fund itself existed for Board review. The Board, however, received and considered
| | |
| Dryden US Equity Active Extension Fund | | |
Approval of Advisory Agreements (continued)
information regarding the performance of the new subadviser in managing strategies and funds with similar investment objectives and strategies. The Board concluded that it was satisfied with the performance records of the Manager and the new subadviser.
Fee Rates
The Board considered the proposed management fees to be paid by the New Fund to the Manager and the proposed subadvisory fees to be paid by the Manager to the new subadviser, as set forth below. The Board also received and considered comparative fee information of a group of comparable funds that was provided by management, and considered the Manager’s assertion that, because of the peculiar investment strategy of the New Fund, the Manager’s independent data service had not been able to provide a comparable group of funds. The Board considered that the New Fund’s estimated annual operating expenses and contractual management fees were lower than those of the peer group.
| | | | |
Fund | | Management
Fees | | Subadvisory Fees |
Dryden US Equity Active Extension Fund | | 1.00% | | 0.50% of average daily net assets |
The Board concluded that the fees were reasonable in light of the services to be provided.
Profitability
Because the New Fund had not commenced operations, the Board noted that there was no historical profitability to be reviewed. The Board noted that it would review profitability at its next annual approval of the agreements.
Economies of Scale
The Board noted that the advisory fee schedule for the New Fund did not contain breakpoints that would reduce the fee rate on assets above specified levels. The Board concluded that it would be reasonable to approve the agreement and to re-consider economies of scale at its next annual review of the agreements. The Board also noted that the profitability of the Manager would be reviewed annually in connection with the review of the advisory agreement.
Other Benefits to the Manager and the Subadviser
The Board considered potential “fall-out” or ancillary benefits anticipated to be received by the Manager and the new subadviser. The Board considered that any potential benefits to be derived by the Manager were similar to benefits derived by
| | |
| | Visit our website at www.jennisondryden.com |
the Manager in connection with its services to the other Prudential mutual funds, which are reviewed on an annual basis. The Board considered that any potential benefits to be derived by the new subadviser were consistent with those generally derived by other subadvisers to the other Prudential mutual funds, and that those benefits are reviewed on an annual basis.
| | |
| Dryden US Equity Active Extension Fund | | |
Growth of a $10,000 Investment
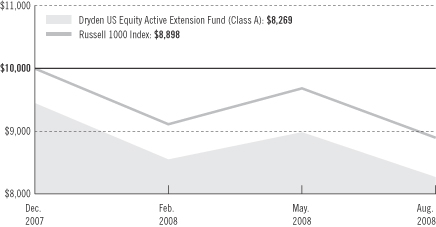
| | |
| Average Annual Total Returns (With Sales Charges) as of 8/31/08 | | |
| | | Since Inception1 |
Class A | | N/A |
Class Z | | N/A |
| | |
| Average Annual Total Returns (Without Sales Charges) as of 8/31/08 | | |
| | | Since Inception1 |
Class A | | N/A |
Class Z | | N/A |
Performance data quoted represent past performance. Past performance does not guarantee future results. The investment return and principal value of an investment will fluctuate, so that an investor’s shares, when redeemed, may be worth more or less than their original cost. Current performance may be lower or higher than the past performance data quoted. An investor may obtain performance data as of the most recent month-end by visiting our website at www.jennisondryden.com or by calling (800) 225-1852. Class A shares have a maximum initial sales charge of 5.50%. Gross operating expenses: Class A, 2.93%; Class Z, 2.63%. Net operating expenses apply to: Class A, 1.89%; Class Z, 1.64%, after contractual reduction through 12/31/2009.
The returns in the graph and the tables do not reflect the deduction of taxes that a shareholder would pay on Fund distributions or following the redemption of Fund shares.
| | |
| | Visit our website at www.jennisondryden.com |
Source: Prudential Investments LLC and Lipper Inc.
1Inception date: 12/27/07.
The graph compares a $10,000 investment in the Dryden US Equity Active Extension Fund (Class A shares) with a similar investment in the Russell 1000 Index by portraying the initial account values at the commencement of operations for Class A shares (December 27, 2007) and the account values at the end of the current fiscal year (August 31, 2008) as measured on a quarterly basis. For purposes of the graph, and unless otherwise indicated, it has been assumed that (a) the maximum applicable front-end sales charge was deducted from the initial $10,000 investment in Class A shares; (b) all recurring fees (including management fees) were deducted; and (c) all dividends and distributions were reinvested. The line graph provides information for Class A shares only. As indicated in the tables provided earlier, performance for Class Z shares will vary due to the differing charges and expenses applicable to each share class (as indicated in the following paragraphs). Without a distribution and service (12b-1) fee waiver of 0.25% for Class A shares through August 31, 2008, the returns shown in the graph and for Class A shares in the tables would have been lower.
The Russell 1000 Index includes the 1,000 largest companies in the Russell 3000 Index. The Russell 1000 Index represents the universe of stocks from which most active money managers typically select. The Russell 1000 Index return reflects adjustments for income dividends and capital gains distributions reinvested as of the exdividend dates. The returns for the Index would be lower if they included the effects of sales charges, operating expenses, or taxes. The securities that comprise the Index may differ substantially from the securities in the Fund. This is not the only index that may be used to characterize performance of junk bond funds. Other indexes may portray different comparative performance. Investors cannot invest directly in an index.
Class A shares are subject to a maximum front-end sales charge of 5.50% and a 12b-1 fee of up to 0.25% annually, and all investors who purchase Class A shares in an amount of $1 million or more and sell these shares within 12 months of purchase are not subject to a contingent deferred sales charge (CDSC) of 1%. Class Z shares are not subject to a 12b-1 fee or sales charge. The returns in the graph and tables reflect the share class expense structure in effect at the close of the fiscal period. The returns in the graph and the tables do not reflect the deduction of taxes that a shareholder would pay on Fund distributions or following the redemption of Fund shares.
| | |
| Dryden US Equity Active Extension Fund | | |
| | | | |
| n MAIL | | n TELEPHONE | | n WEBSITE |
Gateway Center Three 100 Mulberry Street Newark, NJ 07102 | | (800) 225-1852 | | www.jennisondryden.com |
|
| PROXY VOTING |
| The Board of Trustees of the Fund has delegated to the Fund’s investment subadviser the responsibility for voting any proxies and maintaining proxy recordkeeping with respect to the Fund. A description of these proxy voting policies and procedures is available without charge, upon request, by calling (800) 225-1852 or by visiting the Securities and Exchange Commission’s website at www.sec.gov. Information regarding how the Fund voted proxies relating to portfolio securities during the most recent 12-month period ended June 30 is available on the Fund’s website and on the Commission’s website. |
|
| TRUSTEES |
| Kevin J. Bannon • Linda W. Bynoe • David E.A. Carson • Robert F. Gunia • Michael S. Hyland • Robert E. La Blanc • Douglas H. McCorkindale • Stephen P. Munn • Richard A. Redeker • Judy A. Rice • Robin B. Smith • Stephen G. Stoneburn |
|
| OFFICERS |
| Judy A. Rice, President • Robert F. Gunia, Vice President • Grace C. Torres, Treasurer and Principal Financial and Accounting Officer • Kathryn L. Quirk, Chief Legal Officer • Deborah A. Docs, Secretary • Timothy J. Knierim, Chief Compliance Officer • Valerie M. Simpson, Deputy Chief Compliance Officer • Theresa C. Thompson, Deputy Chief Compliance Officer • Noreen M. Fierro, Anti-Money Laundering Compliance Officer • Jonathan D. Shain, Assistant Secretary • Claudia DiGiacomo, Assistant Secretary • John P. Schwartz, Assistant Secretary • Andrew R. French, Assistant Secretary • M. Sadiq Peshimam, Assistant Treasurer • Peter Parrella, Assistant Treasurer |
| | | | |
| MANAGER | | Prudential Investments LLC | | Gateway Center Three
100 Mulberry Street
Newark, NJ 07102 |
|
| INVESTMENT SUBADVISER | | Quantitative Management
Associates LLC | | Gateway Center Two
100 Mulberry Street
Newark, NJ 07102 |
|
| DISTRIBUTOR | | Prudential Investment
Management Services LLC | | Gateway Center Three
100 Mulberry Street
Newark, NJ 07102 |
|
| CUSTODIAN | | The Bank of New York Mellon | | One Wall Street
New York, NY 10286 |
|
| TRANSFER AGENT | | Prudential Mutual Fund
Services LLC | | PO Box 9658
Providence, RI 02940 |
|
INDEPENDENT REGISTERED
PUBLIC ACCOUNTING FIRM | | KPMG LLP | | 345 Park Avenue
New York, NY 10154 |
|
| FUND COUNSEL | | Willkie Farr & Gallagher LLP | | 787 Seventh Avenue
New York, NY 10019 |
|
| An investor should consider the investment objectives, risks, charges, and expenses of the Fund carefully before investing. The prospectus for the Fund contains this and other information about the Fund. An investor may obtain a prospectus by visiting our website at www.jennisondryden.com or by calling (800) 225-1852. The prospectus should be read carefully before investing. |
|
| E-DELIVERY |
To receive your mutual fund documents on-line, go to www.icsdelivery.com/prudential/funds
and enroll. Instead of receiving printed documents by mail, you will receive notification via e-mail when new materials are available. You can cancel your enrollment or change your e-mail
address at any time by clicking on the change/cancel enrollment option at the icsdelivery
website address. |
|
| SHAREHOLDER COMMUNICATIONS WITH TRUSTEES |
| Shareholders can communicate directly with the Board of Trustees by writing to the Chair of the Board, Dryden US Equity Active Extension Fund, Prudential Investments, Attn: Board of Trustees, 100 Mulberry Street, Gateway Center Three, Newark, NJ 07102. Shareholders can communicate directly with an individual Trustee by writing to the same address. Communications are not screened before being delivered to the addressee. |
|
| AVAILABILITY OF PORTFOLIO SCHEDULE |
| The Fund files its complete schedule of portfolio holdings with the Securities and Exchange Commission for the first and third quarters of each fiscal year on Form N-Q. The Fund’s Forms N-Q are available on the Commission’s website at www.sec.gov. The Fund’s Forms N-Q may also be reviewed and copied at the Commission’s Public Reference Room in Washington, D.C. Information on the operation and location of the Public Reference Room may be obtained by calling (800) SEC-0330 (732-0330). The Fund’s schedule of portfolio holdings is also available on the Fund’s website as of the end of each fiscal quarter. |
|
| The Fund’s Statement of Additional Information contains additional information about the Fund’s Trustees and is available without charge, upon request, by calling (800) 225-1852. |
Mutual Funds:
| | | | |
ARE NOT INSURED BY THE FDIC OR ANY
FEDERAL GOVERNMENT AGENCY | | MAY LOSE VALUE | | ARE NOT A DEPOSIT OF OR GUARANTEED
BY ANY BANK OR ANY BANK AFFILIATE |

| | | | | | | | |
| Dryden US Equity Active Extension Fund |
| | Share Class | | A | | Z | | |
| | NASDAQ | | DUEAX | | DUEZX | | |
| | CUSIP | | 476297858 | | 476297866 | | |
| | | | | | | | |
MF200E IFS-A156590 Ed. 10/2008

Item 2 – Code of Ethics — See Exhibit (a)
As of the end of the period covered by this report, the registrant has adopted a code of ethics (the “Section 406 Standards for Investment Companies – Ethical Standards for Principal Executive and Financial Officers”) that applies to the registrant’s Principal Executive Officer and Principal Financial Officer; the registrant’s Principal Financial Officer also serves as the Principal Accounting Officer.
The registrant hereby undertakes to provide any person, without charge, upon request, a copy of the code of ethics. To request a copy of the code of ethics, contact the registrant 800-225-1852, and ask for a copy of the Section 406 Standards for Investment Companies—Ethical Standards for Principal Executive and Financial Officers.
Item 3 – Audit Committee Financial Expert –
The registrant’s Board has determined that Mr. David E. A. Carson, member of the Board’s Audit Committee is an “audit committee financial expert,” and that he is “independent,” for purposes of this Item.
Item 4 – Principal Accountant Fees and Services –
(a) Audit Fees
For the fiscal year ended August 31, 2008 and fiscal period November 1, 2006 through August 31, 2007, KPMG LLP (“KPMG”), the Registrant’s principal accountant, billed the Registrant $46,738 and $19,859, respectively, for professional services rendered for the audit of the Registrant’s annual financial statements or services that are normally provided in connection with statutory and regulatory filings.
None.
(c) Tax Fees
None.
(d) All Other Fees
None.
(e) (1) Audit Committee Pre-Approval Policies and Procedures
THE PRUDENTIAL MUTUAL FUNDS
AUDIT COMMITTEE POLICY
on
Pre-Approval of Services Provided by the Independent Accountants
The Audit Committee of each Prudential Mutual Fund is charged with the responsibility to monitor the independence of the Fund’s independent accountants. As part of this responsibility, the Audit Committee must pre-approve any independent accounting firm’s engagement to render audit and/or permissible non-audit services, as required by law. In evaluating a proposed engagement of the independent accountants, the Audit Committee will assess the effect that the engagement might reasonably be expected to have on the accountant’s independence. The Committee’s evaluation will be based on:
| | • | | a review of the nature of the professional services expected to be provided, |
| | • | | a review of the safeguards put into place by the accounting firm to safeguard independence, and |
| | • | | periodic meetings with the accounting firm. |
Policy for Audit and Non-Audit Services Provided to the Funds
On an annual basis, the scope of audits for each Fund, audit fees and expenses, and audit-related and non-audit services (and fees proposed in respect thereof) proposed to be performed by the Fund’s independent accountants will be presented by the Treasurer and the independent accountants to the Audit Committee for review and, as appropriate, approval prior to the initiation of such services. Such presentation shall be accompanied by confirmation by both the Treasurer and the independent accountants that the proposed services will not adversely affect the independence of the independent accountants. Proposed services shall be described in sufficient detail to enable the Audit Committee to assess the appropriateness of such services and fees, and the compatibility of the provision of such services with the auditor’s independence. The Committee shall receive periodic reports on the progress of the audit and other services which are approved by the Committee or by the Committee Chair pursuant to authority delegated in this Policy.
The categories of services enumerated under “Audit Services”, “Audit-related Services”, and “Tax Services” are intended to provide guidance to the Treasurer and the independent accountants as to those categories of services which the Committee believes are generally consistent with the independence of the independent accountants and which the Committee (or the Committee Chair) would expect upon the presentation of specific proposals to pre-approve. The enumerated categories are not intended as an exclusive list of audit, audit-related or tax services, which the Committee (or the Committee Chair) would consider for pre-approval.
Audit Services
The following categories of audit services are considered to be consistent with the role of the Fund’s independent accountants:
| | • | | Annual Fund financial statement audits |
| | • | | Seed audits (related to new product filings, as required) |
| | • | | SEC and regulatory filings and consents |
Audit-related Services
The following categories of audit-related services are considered to be consistent with the role of the Fund’s independent accountants:
| | • | | Accounting consultations |
| | • | | Fund merger support services |
| | • | | Agreed Upon Procedure Reports |
| | • | | Other Internal Control Reports |
Individual audit-related services that fall within one of these categories and are not presented to the Audit Committee as part of the annual pre-approval process will be subject to pre-approval by the Committee Chair (or any other Committee member on whom this responsibility has been delegated) so long as the estimated fee for those services does not exceed $50,000.
Tax Services
The following categories of tax services are considered to be consistent with the role of the Fund’s independent accountants:
| | • | | Tax compliance services related to the filing or amendment of the following: |
| | • | | Federal, state and local income tax compliance; and, |
| | • | | Sales and use tax compliance |
| | • | | Timely RIC qualification reviews |
| | • | | Tax distribution analysis and planning |
| | • | | Tax authority examination services |
| | • | | Tax appeals support services |
| | • | | Accounting methods studies |
| | • | | Fund merger support services |
| | • | | Tax consulting services and related projects |
Individual tax services that fall within one of these categories and are not presented to the Audit Committee as part of the annual pre-approval process will be subject to pre-approval by the Committee Chair (or any other Committee member on whom this responsibility has been delegated) so long as the estimated fee for those services does not exceed $50,000.
Other Non-audit Services
Certain non-audit services that the independent accountants are legally permitted to render will be subject to pre-approval by the Committee or by one or more Committee members to whom the Committee has delegated this authority and who will report to the full Committee any pre-approval decisions made pursuant to this Policy. Non-audit services presented for pre-approval pursuant to this paragraph will be accompanied by a confirmation from both the Treasurer and the independent accountants that the proposed services will not adversely affect the independence of the independent accountants.
Proscribed Services
The Fund’s independent accountants will not render services in the following categories of non-audit services:
| | • | | Bookkeeping or other services related to the accounting records or financial statements of the Fund |
| | • | | Financial information systems design and implementation |
| | • | | Appraisal or valuation services, fairness opinions, or contribution-in-kind reports |
| | • | | Internal audit outsourcing services |
| | • | | Management functions or human resources |
| | • | | Broker or dealer, investment adviser, or investment banking services |
| | • | | Legal services and expert services unrelated to the audit |
| | • | | Any other service that the Public Company Accounting Oversight Board determines, by regulation, is impermissible. |
Pre-approval of Non-Audit Services Provided to Other Entities Within the Prudential Fund Complex
Certain non-audit services provided to Prudential Investments LLC or any of its affiliates that also provide ongoing services to the Prudential Mutual Funds will be subject to pre-approval by the Audit Committee. The only non-audit services provided to these entities that will require pre-approval are those related directly to the operations and financial reporting of the Funds. Individual projects that are not presented to the Audit Committee as part of the annual pre-approval process will be subject to pre-approval by the Committee Chair (or any other Committee member on whom this responsibility has been delegated) so long as the estimated fee for those services does not exceed $50,000. Services presented for pre-approval pursuant to this paragraph will be accompanied by a confirmation from both the Treasurer and the independent accountants that the proposed services will not adversely affect the independence of the independent accountants.
Although the Audit Committee will not pre-approve all services provided to Prudential Investments LLC and its affiliates, the Committee will receive an annual report from the Fund’s independent accounting firm showing the aggregate fees for all services provided to Prudential Investments and its affiliates.
(e) (2) Percentage of services referred to in 4(b) – 4(d) that were approved by the audit committee –
Not applicable.
(f) Percentage of hours expended attributable to work performed by other than full time employees of principal accountant if greater than 50%.
The percentage of hours expended on the principal accountant’s engagement to audit the registrant’s financial statements for the most recent fiscal year that were attributed to work performed by persons other than the principal accountant’s full-time, permanent employees was 0%.
(g) Non-Audit Fees
Not applicable to Registrant for the fiscal year 2008 and fiscal period November 1, 2006 through August 31, 2007. The aggregate non-audit fees billed by KPMG for services rendered to the registrant’s investment adviser and any entity controlling, controlled by, or under common control with the investment adviser that provides ongoing services to the registrant for the fiscal year 2008 and fiscal period November 1, 2006 through August 31, 2007 was $0 and $44,700, respectively.
(h) Principal Accountant’s Independence
Not applicable as KPMG has not provided non-audit services to the registrant’s investment adviser and any entity controlling, controlled by, or under common control with the investment adviser that provides ongoing services to the registrant that were not pre-approved pursuant to Rule 2-01(c)(7)(ii) of Regulation S-X.
Item 5 – Audit Committee of Listed Registrants – Not applicable.
Item 6 – Schedule of Investments – The schedule is included as part of the report to shareholders filed under Item 1 of this Form.
Item 7 – Disclosure of Proxy Voting Policies and Procedures for Closed-End Management Investment Companies – Not applicable.
Item 8 – Portfolio Managers of Closed-End Management Investment Companies – Not applicable.
Item 9 – Purchases of Equity Securities by Closed-End Management Investment Company and Affiliated Purchasers – Not applicable.
Item 10 – Submission of Matters to a Vote of Security Holders – Not applicable.
Item 11 – Controls and Procedures
| | (a) | It is the conclusion of the registrant’s principal executive officer and principal financial officer that the effectiveness of the registrant’s current disclosure controls and procedures (such disclosure controls and procedures having been evaluated within 90 days of the date of this filing) provide reasonable assurance that the information required to be disclosed by the registrant has been recorded, processed, summarized and reported within the time period specified in the Commission’s rules and forms and that the information required to be disclosed by the registrant has been accumulated and communicated to the registrant’s principal executive officer and principal financial officer in order to allow timely decisions regarding required disclosure. |
| | (b) | There has been no significant change in the registrant’s internal control over financial reporting that occurred during the registrant’s most recent fiscal quarter of the period covered by this report that has materially affected, or is likely to materially affect, the registrant’s internal control over financial reporting. |
Item 12 – Exhibits
(a) (1) Code of Ethics – Attached hereto as Exhibit EX-99.CODE-ETH
(2) Certifications pursuant to Section 302 of the Sarbanes-Oxley Act – Attached hereto as Exhibit EX-99.CERT.
(3) Any written solicitation to purchase securities under Rule 23c-1. – Not applicable.
(b) Certifications pursuant to Section 906 of the Sarbanes-Oxley Act – Attached hereto as Exhibit EX-99.906CERT.
SIGNATURES
Pursuant to the requirements of the Securities Exchange Act of 1934 and the Investment Company Act of 1940, the registrant has duly caused this report to be signed on its behalf by the undersigned, thereunto duly authorized.
| | | | |
| (Registrant) | | JennisonDryden Portfolios | | |
| | |
| By (Signature and Title)* | | /s/ Deborah A. Docs | | |
| | Deborah A. Docs | | |
| | Secretary | | |
| | |
| Date October 24, 2008 | | | | |
Pursuant to the requirements of the Securities Exchange Act of 1934 and the Investment Company Act of 1940, this report has been signed below by the following persons on behalf of the registrant and in the capacities and on the dates indicated.
| | | | |
| By (Signature and Title)* | | /s/ Judy A. Rice | | |
| | Judy A. Rice | | |
| | President and Principal Executive Officer | | |
| | |
| Date October 24, 2008 | | | | |
| | |
| By (Signature and Title)* | | /s/ Grace C. Torres | | |
| | Grace C. Torres | | |
| | Treasurer and Principal Financial Officer | | |
| | |
| Date October 24, 2008 | | | | |
* | Print the name and title of each signing officer under his or her signature. |