UNITED STATES
SECURITIES AND EXCHANGE COMMISSION
Washington, D.C. 20549
FORM N-CSR
CERTIFIED SHAREHOLDER REPORT OF REGISTERED
MANAGEMENT INVESTMENT COMPANIES
| | |
| Investment Company Act file number: | | 811-04864 |
| |
| Exact name of registrant as specified in charter: | | JennisonDryden Portfolios |
| |
| Address of principal executive offices: | | Gateway Center 3, 100 Mulberry Street, Newark, New Jersey 07102 |
| |
| Name and address of agent for service: | | Deborah A. Docs Gateway Center 3, 100 Mulberry Street, Newark, New Jersey 07102 |
| |
| Registrant’s telephone number, including area code: | | 800-225-1852 |
| |
| Date of fiscal year end: | | 8/31/2007 |
| | (Registrant changed its fiscal year end from October 31) |
| |
| Date of reporting period: | | 8/31/2007 |
Item 1 – Reports to Stockholders


| | |
| AUGUST 31, 2007 | | ANNUAL REPORT |
Jennison Value Fund
FUND TYPE
Large-capitalization stock
OBJECTIVE
Capital appreciation
This report is not authorized for distribution to prospective investors unless preceded or accompanied by a current prospectus.
The views expressed in this report and information about the Fund’s portfolio holdings are for the period covered by this report and are subject to change thereafter.
JennisonDryden, Jennison, Prudential Financial and the Rock Prudential logo are registered service marks of The Prudential Insurance Company of America, Newark, NJ, and its affiliates.

October 15, 2007
Dear Shareholder:
On the following pages, you’ll find your annual report for the Jennison Value Fund, which includes performance data, an analysis of Fund performance, and a listing of its holdings at period-end. The Fund’s fiscal year has changed from a reporting period that ends October 31 to one that ends August 31. This change should have no impact on the way the Fund is managed. Shareholders will receive future annual and semiannual reports on the new fiscal year-end schedule.
Mutual fund prices and returns will rise or fall over time, and asset managers tend to have periods when they perform better or worse than their long-term average. The best measures of a mutual fund’s quality are its return compared to that of similar investments and the variability of its return over the long term. We recommend that you review your portfolio regularly with your financial adviser.
Sincerely,

Judy A. Rice, President
Jennison Value Fund
Your Fund’s Performance
Fund objective
The investment objective of the Jennison Value Fund is capital appreciation. There can be no assurance that the Fund will achieve its investment objective.
Performance data quoted represent past performance. Past performance does not guarantee future results. The investment return and principal value of an investment will fluctuate, so that an investor’s shares, when redeemed, may be worth more or less than their original cost. Current performance may be lower or higher than the past performance data quoted. An investor may obtain performance data as of the most recent month-end by visiting our website at www.jennisondryden.com or by calling (800) 225-1852. Class A and Class L shares have a maximum initial sales charge of 5.50% and 5.75%, respectively. Gross operating expenses: Class A, 1.00%; Class B, 1.70%; Class C, 1.70%; Class L, 1.20%; Class M, 1.70%; Class R, 1.45%; Class X, 1.70%; Class Z, 0.70%. Net operating expenses apply to: Class A, 0.95%; Class B, 1.70%; Class C, 1.70%; Class L, 1.20%; Class M, 1.70%; Class R, 1.20%; Class X, 1.70%; Class Z, 0.70%, after contractual reduction through 2/28/2008.
| | | | | | | | | | | |
| Cumulative Total Returns as of 8/31/07 |
| | | One Year | | | Five Years | | | Ten Years | | | Since Inception1 |
Class A | | 12.88 | % | | 104.03 | % | | 118.11 | % | | — |
Class B | | 12.01 | | | 96.58 | | | 102.34 | | | — |
Class C | | 12.01 | | | 96.57 | | | 102.34 | | | — |
Class L | | N/A | | | N/A | | | N/A | | | 5.28%(3/19/07) |
Class M | | N/A | | | N/A | | | N/A | | | 5.03(3/19/07) |
Class R | | 12.62 | | | N/A | | | N/A | | | 39.37(6/3/05) |
Class X | | N/A | | | N/A | | | N/A | | | 5.03(3/19/07) |
Class Z | | 13.18 | | | 106.55 | | | 123.64 | | | — |
S&P 500 Index2 | | 15.13 | | | 76.18 | | | 92.11 | | | ** |
Russell 1000 Value Index3 | | 12.85 | | | 97.15 | | | 138.35 | | | *** |
Lipper Multi-Cap Value Funds Avg.4 | | 12.83 | | | 87.79 | | | 119.31 | | | **** |
| | |
| 2 | | Visit our website at www.jennisondryden.com |
| | | | | | | | | | | |
| Average Annual Total Returns5 as of 9/30/07 |
| | | One Year | | | Five Years | | | Ten Years | | | Since Inception1 |
Class A | | 9.37 | % | | 17.88 | % | | 7.07 | % | | — |
Class B | | 9.89 | | | 18.23 | | | 6.81 | | | — |
Class C | | 13.89 | | | 18.34 | | | 6.81 | | | — |
Class L | | N/A | | | N/A | | | N/A | | | N/A |
Class M | | N/A | | | N/A | | | N/A | | | N/A |
Class R | | 15.53 | | | N/A | | | N/A | | | 17.16% (6/3/05) |
Class X | | N/A | | | N/A | | | N/A | | | N/A |
Class Z | | 16.03 | | | 19.50 | | | 7.88 | | | — |
S&P 500 Index2 | | 16.42 | | | 15.44 | | | 6.57 | | | ** |
Russell 1000 Value Index3 | | 14.45 | | | 18.07 | | | 8.80 | | | *** |
Lipper Multi-Cap Value Funds Avg.4 | | 13.55 | | | 16.56 | | | 7.78 | | | **** |
The cumulative total returns do not reflect the deduction of applicable sales charges. If reflected, the applicable sales charges would reduce the cumulative total returns performance quoted. The average annual total returns assume the payment of the maximum applicable sales charge. Class A and Class L shares are subject to a maximum front-end sales charge of 5.50% and 5.75%, respectively. Under certain circumstances, Class A shares may be subject to a contingent deferred sales charge (CDSC) of 1%. Class B, Class C, Class L, Class M, and Class X shares are subject to a maximum CDSC of 5%, 1%, 1%, 6%, and 6%, respectively. Class R and Class Z shares are not subject to a sales charge.
Source: Prudential Investments LLC and Lipper Inc. Performance figures may reflect fee waivers and/or expense reimbursements. In the absence of such fee waivers and/or expense reimbursements, total returns would be lower.
1Inception date returns are provided for any share class with less than 10 calendar years.
2The S&P 500 Index is an unmanaged index of 500 stocks of large U.S. public companies. It gives a broad look at how U.S. stock prices have performed.
3The Russell 1000 Value Index is an unmanaged index comprising those securities in the Russell 1000 Index with a less-than-average growth orientation. Companies in this index generally have low price-to-book and price-to-earnings ratios, higher dividend yields, and lower forecasted growth values.
4The Lipper Multi-Cap Value Funds Average (Lipper Average) represents returns based on an average return of all funds in the Lipper Multi-Cap Value Funds category for the periods noted. Funds in the Lipper Average typically have a below-average price-to-earnings ratio, price-to-book ratio, and three-year sales-per-share growth value compared with the S&P SuperComposite 1500 Index.
5The average annual total returns take into account applicable sales charges. Class A, Class B, Class C, Class L, Class M, Class R, and Class X shares are subject to an annual distribution and service (12b-1) fee of up to 0.30%, 1.00%, 1.00%, 0.50%, 1.00%, 0.75%, and 1.00%, respectively. Approximately seven years after purchase, Class B shares will automatically convert to Class A shares on a quarterly basis. Approximately eight years after purchase, Class M shares will automatically convert to Class A shares on a quarterly basis. Approximately 10 years after purchase (eight years in the case of shares purchased prior to August 19, 1998), Class X shares will automatically convert to Class A shares on a quarterly basis. Class Z shares are not subject to a 12b-1 fee. The returns in the tables do not reflect the deduction of taxes that a shareholder would pay on Fund distributions or following the redemption of Fund shares.
Your Fund’s Performance (continued)
**S&P 500 Index Closest Month-End to Inception cumulative total return as of 8/31/07 is 4.52% for Class L, Class M, and Class X; and 29.00% for Class R. S&P 500 Index Closest Month-End to Inception average annual total return as of 9/30/07 is 13.29% for Class R. Class L, Class M, and Class X shares have been in existence for less than one year and have no average annual total return performance information available.
***Russell 1000 Value Index Closest Month-End to Inception cumulative total return as of 8/31/07 is 1.19% for Class L, Class M, and Class X; and 33.19% for Class R. Russell 1000 Value Index Closest Month-End to Inception average annual total return as of 9/30/07 is 14.72% for Class R. Class L, Class M, and Class X shares have been in existence for less than one year and have no average annual total return performance information available.
****Lipper Average Closest Month-End to Inception cumulative total return as of 8/31/07 is 1.36% for Class L, Class M, and Class X; and 29.36% for Class R. Lipper Average Closest Month-End to Inception average annual total return as of 9/30/07 is 12.96% for Class R. Class L, Class M, and Class X shares have been in existence for less than one year and have no average annual total return performance information available.
Investors cannot invest directly in an index. The returns for the S&P 500 Index, the Russell 1000 Value Index, and the Lipper Average would be lower if they included the effects of sales charges, operating expenses of a mutual fund, or taxes. Returns for the Lipper Average reflect the deduction of operating expenses, but not sales charges or taxes.
| | | |
| Five Largest Holdings expressed as a percentage of net assets as of 8/31/07 | | | |
Cadbury Schweppes PLC, Food Products | | 2.5 | % |
Citigroup, Inc., Diversified Financial Services | | 2.4 | |
American International Group, Inc., Insurance | | 2.4 | |
General Electric Co., Industrial Conglomerates | | 2.3 | |
H & R Block, Inc., Diversified Consumer Services | | 2.2 | |
Holdings reflect only long-term investments and are subject to change.
| | | |
| Five Largest Industries expressed as a percentage of net assets as of 8/31/07 | | | |
Oil, Gas & Consumable Fuels | | 14.9 | % |
Insurance | | 6.9 | |
Diversified Financial Services | | 6.6 | |
Media | | 5.4 | |
Food Products | | 4.7 | |
Industry weightings reflect only long-term investments and are subject to change.
| | |
| 4 | | Visit our website at www.jennisondryden.com |
Strategy and Performance Overview
How did the Fund perform during the reporting period?
The Jennison Value Fund’s Class A shares returned 8.66% for the 10-month reporting period from November 1, 2006, through August 31, 2007*, outperforming the 7.14% return of its benchmark, the Russell 1000 Value Index (the Value Index), the 6.96% return of the Lipper Multi-Cap Value Funds Average, and the 7.93% return of the Lipper Large-Cap Value Funds Average.
A diverse group of stocks drove the Fund’s strong performance relative to the Value Index, illustrating the effectiveness of our bottom-up approach to portfolio construction in which we select stocks one at a time based on in-house analysis of individual company fundamentals. The top 10 contributors came from seven different sectors, and all posted double-digit returns. The overarching theme in the current market environment is that there is no theme; it is truly a stock-picker’s market. During the reporting period, every sector, except healthcare, added to the Fund’s returns.
The Fund’s holdings in the poorly performing financials sector were its largest source of relative gain, due to a combination of good stock selection and the Fund’s substantial underweight exposure, especially in commercial banks. We maintained our contrarian stance that banks are fundamentally unattractive because of their understated expenses and their lower earnings. Banks are also prey to a contraction in net interest margin, a percentage that reflects income left over after subtracting interest paid to depositors from interest earned on investments and loans. Stock selection in consumer discretionary, materials, and consumer staples also meaningfully added to the Fund’s relative returns.
In the energy sector, the Fund underperformed the Value Index because it did not own a few large top-performing integrated oil companies, such as Exxon Mobil and Chevron. It did own Trident Resources, which declined in value. (Trident Resources is mentioned in the section below that discusses greatest detractors.) While positions in the telecom services sector added to the Fund’s returns, it trailed its benchmark in this sector primarily because it did not own AT&T, a stock whose fundamentals we continue to dislike even though it rose nearly 20% during the reporting period. The Fund also lagged the Value Index in healthcare and information technology due to individual stock disappointments.
What was the market environment like for value stocks?
In the beginning of the period, U.S. economic growth moderated. Robust foreign economies stepped in to pick up the slack, driving the strongest cumulative growth in global gross domestic product of the decade. The final quarter of 2006 proved to be a
*Fund changed its fiscal year-end to August 31. Refer to the Fund’s previous annual report for performance information prior to November 1, 2006.
Strategy and Performance Overview (continued)
good one for U.S. equities, as well as markets around the globe, thanks to a continued mix of strong corporate profits, low interest rates, and abundant liquidity.
While the market was up the majority of the reporting period, the environment changed in 2007 amid worries that problems in the U.S. market for subprime mortgages (home loans made to borrowers with poor credit histories) might expand into a widespread credit crunch. This, in turn, prompted central banks around the world to inject money into their monetary systems in early August in an effort to ensure liquidity. On August 17, the Federal Open Market Committee (FOMC) cut the discount rate—the rate at which member banks borrow short-term funds directly from a Federal Reserve Bank—to 5.75% from 6.25%. Although recent data suggested the economy would continue to expand at a moderate pace, the FOMC noted that “downside risks to growth have increased appreciably.” It said that it is “prepared to act as needed to mitigate the adverse effects on the economy arising from the disruptions in financial markets.” These actions seem to have had somewhat of a stabilizing effect. While we expect growth to slow over the next two or three quarters, we believe the equity market remains healthy.
Financials shares declined overall, as investors feared the subprime-mortgage contagion would continue to spill into the broader markets. While the Fund did not have holdings that were highly exposed to the mortgage market, its positions were not immune to the negative headlines that chronicled the subprime-mortgage crisis.
What holdings made the largest positive contributions to the Fund’s return?
The Fund’s energy holdings made the strongest contribution to its returns. During the reporting period, the spot price for crude oil climbed steadily and surpassed $78 per barrel, supporting our long-term, bullish outlook for the sector. In our view, supply / demand imbalances will continue, keeping oil prices above historical levels. Hess, Petroleo Brasileiro (Petrobras), and Occidental Petroleum all advanced. Petrobras is a partially government-owned enterprise that operates in all sectors of the oil and gas industry in Brazil and the rest of Latin America, the United States, and offshore-West Africa. Petrobras is rare among its peer group of very large integrated oil companies with estimated production growth roughly 10% per year over the next several years. Production growth is driven by attractive exposure to potential deepwater discoveries located offshore of Brazil and Nigeria. In addition to strong upstream growth prospects, Petrobras implemented refining upgrades, has a growing gas business that should generate cash, and sizeable potential in international markets.
Stock selection in consumer discretionary, materials, consumer staples, industrials, and utilities sectors also meaningfully added to the Fund’s returns. Consumer discretionary stock Liberty Global, materials holding Mosaic, consumer staples
| | |
| 6 | | Visit our website at www.jennisondryden.com |
position Kroger, industrials stock Honeywell International, and utilities position NRG Energy were standout performers. Liberty Global, an international broadband communications provider, gained over 55% during the reporting period. We believe that Liberty Global is poised to benefit from subscriber growth as high definition television, digital cable, and Internet phone become more widespread. We continue to like its attractive valuation, believing it to be one of the cheapest stocks in its peer group.
Mosaic Co. was formed in 2004 through the merger of IMC Global and the fertilizer business of Cargill. It is primarily a producer of fertilizers, including phosphate, potash, and nitrogen. Shares of Mosaic rose dramatically when fertilizer demand and prices surged as U.S. growers prepared for an unprecedented 10 million acre increase in corn plantings to meet the demand from biofuels and export markets. Demand is also increasing in international markets like China and India. We sold the position at a profit because it had become overvalued. Since our initial purchase in June 2003, the stock had appreciated approximately 364%.
Merchant power generation company NRG Energy benefited from the potential acquisition of Texas-based utility company TXU by a private equity firm. The proposed deal demonstrated to the public market that private equity firms are valuing energy generation assets very highly, and NRG rose in price. In our view, NRG is attractively valued and should benefit from declining spare generation capacity as demand growth catches up to supply. Additionally, we believe its portfolio of attractive low-cost power generation plants should help the company increase profit margins in an environment of rising energy and capacity prices.
Although Honeywell International, an aerospace and defense company, lagged its peers, we originally purchased the stock in June 2005 expecting a cyclical upturn due to the high demand for replacement parts following an increase in new airplane sales. We believed this would drive acceleration in revenue growth. Additionally, the company’s aerospace division was undergoing a series of restructuring efforts that, in our view, should result in greater profitability. These assumptions proved correct. In April, Honeywell reported its best quarter since the 1999 Allied Signal merger, beating consensus. The results were strong across aerospace and automation and control units. Honeywell advanced again in July as the company delivered another quarter that exceeded expectations, driven by better-than-expected margin performance. Since our initial purchase, the stock has appreciated significantly. We sold our position at a profit with the view that Honeywell shares had become fairly valued.
The Fund’s holdings in the financials sector delivered a positive total return, while those in the Value Index fell more than 4.0%. Bank of New York Mellon and Loews
Strategy and Performance Overview (continued)
Corporation were among the top contributors. Loews is a holding company with many subsidiaries in several industries. We believe its shares are significantly undervalued, currently trading at approximately an 18% discount based on the total value of its subsidiaries. Impressively, each subsidiary could support itself without financial help from the parent, is strongly capitalized, and generates free cash flow. We also like Loews’ focus on shareholder value via share repurchases and have confidence in management’s capital allocation decisions.
Positions in information technology finished in positive territory; however, performance among individual holdings varied. There were strong gains made by select holdings such as Avaya, a global telecommunications company that was purchased by private equity firms.
What holdings detracted most from the Fund’s return?
Despite the gains made by many of the Fund’s energy holdings, Trident Resources, a Canadian coalbed methane producer, was the weakest position in the Fund. Trident Resources is a privately held company with no publicly traded securities. We originally invested in Trident Resources in March 2005, as we believed it had outstanding reserve potential as well as the potential to benefit from a combination of production growth and favorable natural gas prices. During February, we downwardly revalued the security due to changes in company fundamentals and financials. We are hoping that the company will re-file an initial public offering (IPO) to sell stock within the next couple years. Information related to Trident Resources is confidential. Disclosure and/or use of such information is not permitted without the prior written consent of Jennison Associates.
Healthcare was the only sector that detracted from the Fund’s returns, as Omnicare, Amgen, and Novartis declined. Omnicare is a provider of pharmaceuticals and related pharmacy services to long-term care institutions as well as clinical research to the pharmaceutical and biotechnology industries. Its shares declined as the company failed to meet expectations due to a combination of bed loss (albeit at only 1%), discounting of generics, and higher labor costs. We expect bed growth to resume and continue to believe Omnicare is attractively valued, with its stock trading at a price that is 13 times estimated earnings for the coming year.
Biotech Amgen declined due to warnings issued by a Federal Drug Administration (FDA) cancer panel regarding erythropoiesis-stimulating agents (ESAs), the family of drugs to which Aranesp, the company’s cancer-related anemia treatment, belongs. According to FDA analysis, ESAs reduce survival, which is markedly different from Amgen’s meta-analysis, which suggests no difference in survival. Most recently, the Centers for Medicare and Medicaid Services (CMS) announced its final ESA cancer national coverage determination (NCD), which was not as draconian as the initial
| | |
| 8 | | Visit our website at www.jennisondryden.com |
proposal and mostly in line with Wall Street analysts’ expectations. The final NCD provides coverage with restrictions for the treatment of anemia secondary to myelosuppressive anticancer chemotherapy in certain cancer conditions. The details these restrictions, which include limiting initiation of ESA therapy to when the hemoglobin level is less than 10 grams per deciliter, limiting the ESA treatment duration to a maximum of eight weeks after a chemotherapy session ends, limiting the starting dose to the FDA recommended starting dose, and limiting dose escalation levels. CMS has effectively set a new upper hemoglobin target of 10 grams per deciliter for the use of ESAs in the oncology setting. If duplicated by private payors, this could significantly dent Amgen’s revenue. We continue to hold Amgen, believing its current stock price more than compensates for the declined Aranesp usage.
Within the technology sector, there were declines in Motorola and Spansion. (For Motorola, please see the significant changes section below.)
Shares of Spansion, the world’s number one maker of NOR flash memory chips, performed poorly in the recent market volatility, a victim of major holders with high profile liquidity problems. In our view, Spansion’s fundamentals remain intact and the company stands to benefit from the merger of Intel and STMicro’s NOR flash operations, which should lead to more stable industry pricing. Moreover, we think Spansion’s planned cost cuts and renewed focus on profitability should lead its stock price higher.
Were there significant changes to the portfolio?
Major purchases and sales during the period reflected company-specific fundamentals and developments. Significant new positions were established in Seagate Technology, Best Buy, and XM Satellite Radio.
Seagate Technology is the world’s largest manufacturer of disk drives. We initiated a position in Seagate believing the company stands to benefit from continued consolidation in the hard drive industry. Also, we do not believe that the market is fully pricing in the benefit of Seagate’s technology lead in Perpendicular Magnetic Recording and the cost savings resulting from the closure of the Maxtor facilities. We believe that there are two reasons for the stock’s recent decline: concerns about flash memory replacing the hard disk drive as the primary mode of information storage on personal computers and concerns about lackluster growth in sales of personal computers driven by problems with the Windows Vista operating system. We believe both these concerns are overly discounted in the price of Seagate stock, which currently trades at nine times earnings.
Strategy and Performance Overview (continued)
Best Buy is a specialty retailer of consumer electronics, home-office products, entertainment software, appliances, and related services. Best Buy had generally fallen out of favor with investors due to disappointing earnings in 2006, which was driven, in large part, by rapid declines in large screen TV pricing. However, we believe Best Buy is poised to benefit from a moderation in price declines in 2007 and improvement in other electronics categories. Moreover, Best Buy also offers services such as Geek Squad, home installation, and Best Buy for Business, which we believe have superior revenue growth and comparable margins to that of its core business. Additionally, in our view, the company’s strong balance sheet provides downside protection with high free cash flow, and its business model is stronger than expected.
We purchased shares of XM Satellite Radio as we think its stock price is inexpensive, whether or not the merger with Sirius Satellite Radio occurs. The number of cars where XM will be available on purchase is accelerating 30% per year for the next couple of years. If the merger goes through, the cost cutting and rationalization that result could make the stock price appreciate significantly. We believe the two companies have many synergies that, in the long term, should accommodate Federal Communications Commission conditions aimed at safeguarding the “public interest.” While the Department of Justice (DOJ) has its own specific criteria to satisfy to ensure that the deal is in the “public interest,” we anticipate the DOJ’s antitrust concerns will be assuaged or eliminated.
Holdings in other securities, such as Motorola, Lazard, and Merrill Lynch, were eliminated.
Motorola, the world’s second-largest mobile phone maker, fell primarily due to challenges in the mobile handset business. Although its two other businesses, networks and cable modems, are healthy, a large part of our evaluation was dependent on the state of the mobile handset business. Motorola has had trouble following up the stunning 2004 success of the RAZR with a new product. Margins have fallen, as the company has had to lower prices to sell its units. While we thought the situation at Motorola would be bad, it is even worse than we anticipated; we consequently sold the position.
Lazard operates as an international financial advisory and asset management firm that serves a diverse set of clients, including corporations, partnerships, institutions, government, and high-net worth individuals. We initiated a position in Lazard after its stock price dropped close to 20% below its IPO price and traded at 13 times estimated earnings for the coming year, which was half the multiple of other banks involved in the merger and acquisition (M&A) business. Shares of Lazard gained
| | |
| 10 | | Visit our website at www.jennisondryden.com |
ground as the company reported solid profits amid strong M&A activity, and we sold our position at a profit as the stock became fairly valued.
Merrill Lynch provides broker-dealer, investment banking, financing, wealth management, advisory, asset management, insurance, lending, and related products and services on a global basis. From our initial purchase of Merrill Lynch shares in February 2003 through June 2007, the stock appreciated approximately 140%. We closed our position as the stock had become fairly valued.
Comments on Largest Holdings
| 2.5% | Cadbury Schweppes PLC / Food Products |
We bought shares of Cadbury Schweppes due to its overall business mix of beverages, gum, and chocolate. Moreover, Cadbury is in the process of restructuring. Its cost-cutting program, “Fuel for Growth,” should generate cost savings, simultaneously expand margins and fund the innovation that has led to new gum and mint products, which have been driving revenue growth. We also like the stock’s valuation, both on an absolute (intrinsic) and relative (compared to its peers) basis.
| 2.4% | Citigroup, Inc. / Diversified Financial Services |
Citigroup is a diversified financial services company that, among other things, provides investment banking, retail brokerage, and corporate banking services. In our view, Citigroup represents high growth opportunities due to its international exposure, high return on equity, and cheap valuation at less than 11 times earnings. Citigroup has underperformed what we believe the franchise can achieve.
| 2.4% | American International Group, Inc. / Insurance |
AIG is engaged in a range of insurance and insurance-related activities in the United States and abroad. Its primary activities include general insurance as well as life insurance and retirement services operations. Although AIG shares declined as investors questioned whether the company could grow in the aftermath of management changes stemming from an investigation led by then New York Attorney General Eliot Spitzer, we believe its businesses and competitive position remain intact. As AIG and its management team prove they still can operate efficiently and continue to generate organic growth, the stock’s valuation should continue to recover. We believe AIG is poised to increase revenue and earnings, especially from its international insurance business, particularly in Asia.
| 2.3% | General Electric Co. / Industrial Conglomerates |
General Electric is a diversified conglomerate that recently completed the sale of its plastics business. This sale is part of GE’s strategy of focusing on higher-growth, higher-return technology businesses. The proceeds from this sale will be used to complete its current $27 billion stock buyback program as well as to restructure the company, which we believe will strengthen prospects for future growth. GE’s other divisions also appear healthy, which we think will increase investors’ inclination to pay a higher multiple of earnings for its shares.
| 2.2% | H&R Block, Inc. / Diversified Consumer Services |
H&R Block is primarily a tax preparer with a mortgage business, which the company is selling. We initiated a position in H&R Block, believing the stock was trading at a discount on the basis that selling the company’s parts individually would bring in more money than selling it as a whole. While H&R Block lost market share in its tax preparation business to aggressive competitors over the past several years, it has undertaken efforts to stabilize and grow this business. Additionally, continued
| | |
| 12 | | Visit our website at www.jennisondryden.com |
weakness in the subprime mortgage market has resulted in negative first-quarter results, which in turn caused a sell-off in the stock. Investors feared H&R Block would either get a low price for or cancel the sale of its Option One Mortgage business. We believe it will complete the sale, allowing the company to focus on its steadily improving tax preparation business.
Fees and Expenses (Unaudited)
As a shareholder of the Fund, you incur two types of costs: (1) transaction costs, including sales charges (loads) on purchase payments and redemptions, as applicable, and (2) ongoing costs, including management fees, distribution and/or service (12b-1) fees, and other Fund expenses, as applicable. This example is intended to help you understand your ongoing costs (in dollars) of investing in the Fund and to compare these costs with the ongoing costs of investing in other mutual funds.
The example is based on an investment of $1,000 invested on March 1, 2007, at the beginning of the period, and held through the six-month period ended August 31, 2007. The example is for illustrative purposes only; you should consult the Prospectus for information on initial and subsequent minimum investment requirements.
The Fund’s transfer agent may charge additional fees to holders of certain accounts that are not included in the expenses shown in the table on the following page. These fees apply to Individual Retirement Accounts (IRAs) and Section 403(b) accounts. As of the close of the six-month period covered by the table, IRA fees included an annual maintenance fee of $15 per account (subject to a maximum annual maintenance fee of $25 for all accounts held by the same shareholder). Section 403(b) accounts are charged an annual $25 fiduciary maintenance fee. Some of the fees may vary in amount, or may be waived, based on your total account balance or the number of JennisonDryden Funds, including the Fund, that you own. You should consider the additional fees that were charged to your Fund account over the six-month period when you estimate the total ongoing expenses paid over the period and the impact of these fees on your ending account value, as these additional expenses are not reflected in the information provided in the expense table. Additional fees have the effect of reducing investment returns.
Actual Expenses
The first line for each share class in the table on the following page provides information about actual account values and actual expenses. You may use the information on this line, together with the amount you invested, to estimate the expenses that you paid over the period. Simply divide your account value by $1,000 (for example, an $8,600 account value ÷ $1,000 = 8.6), then multiply the result by the number on the first line under the heading “Expenses Paid During the Six-Month Period” to estimate the expenses you paid on your account during this period.
Hypothetical Example for Comparison Purposes
The second line for each share class in the table on the following page provides information about hypothetical account values and hypothetical expenses based on
| | |
| 14 | | Visit our website at www.jennisondryden.com |
the Fund’s actual expense ratio and an assumed rate of return of 5% per year before expenses, which is not the Fund’s actual return. The hypothetical account values and expenses may not be used to estimate the actual ending account balance or expenses you paid for the period. You may use this information to compare the ongoing costs of investing in the Fund and other funds. To do so, compare this 5% hypothetical example with the 5% hypothetical examples that appear in the shareholder reports of the other funds.
Please note that the expenses shown in the table are meant to highlight your ongoing costs only, and do not reflect any transactional costs such as sales charges (loads). Therefore the second line for each share class in the table is useful in comparing ongoing costs only, and will not help you determine the relative total costs of owning different funds. In addition, if these transactional costs were included, your costs would have been higher.
| | | | | | | | | | | | | | |
| Jennison Value Fund | | Beginning Account
Value March 1, 2007 | | Ending Account
Value August 31, 2007 | | Annualized
Expense Ratio
Based on the
Six-Month Period | | | Expenses Paid
During the
Six-Month Period* |
| | | | | | | | | | | | | | |
| Class A | | Actual | | $ | 1,000.00 | | $ | 1,043.50 | | 0.95 | % | | $ | 4.89 |
| | | Hypothetical | | $ | 1,000.00 | | $ | 1,020.42 | | 0.95 | % | | $ | 4.84 |
| | | | | | | | | | | | | | |
| Class B | | Actual | | $ | 1,000.00 | | $ | 1,039.60 | | 1.70 | % | | $ | 8.74 |
| | | Hypothetical | | $ | 1,000.00 | | $ | 1,016.64 | | 1.70 | % | | $ | 8.64 |
| | | | | | | | | | | | | | |
| Class C | | Actual | | $ | 1,000.00 | | $ | 1,039.60 | | 1.70 | % | | $ | 8.74 |
| | | Hypothetical | | $ | 1,000.00 | | $ | 1,016.64 | | 1.70 | % | | $ | 8.64 |
| | | | | | | | | | | | | | |
| Class L | | Actual** | | $ | 1,000.00 | | $ | 1,052.80 | | 1.20 | % | | $ | 5.67 |
| | | Hypothetical | | $ | 1,000.00 | | $ | 1,019.16 | | 1.20 | % | | $ | 6.11 |
| | | | | | | | | | | | | | |
| Class M | | Actual** | | $ | 1,000.00 | | $ | 1,050.30 | | 1.70 | % | | $ | 8.02 |
| | | Hypothetical | | $ | 1,000.00 | | $ | 1,016.64 | | 1.70 | % | | $ | 8.64 |
| | | | | | | | | | | | | | |
| Class R | | Actual | | $ | 1,000.00 | | $ | 1,042.20 | | 1.20 | % | | $ | 6.18 |
| | | Hypothetical | | $ | 1,000.00 | | $ | 1,019.16 | | 1.20 | % | | $ | 6.11 |
| | | | | | | | | | | | | | |
| Class X | | Actual** | | $ | 1,000.00 | | $ | 1,050.30 | | 1.70 | % | | $ | 8.02 |
| | | Hypothetical | | $ | 1,000.00 | | $ | 1,016.64 | | 1.70 | % | | $ | 8.64 |
| | | | | | | | | | | | | | |
| Class Z | | Actual | | $ | 1,000.00 | | $ | 1,044.90 | | 0.70 | % | | $ | 3.61 |
| | | Hypothetical | | $ | 1,000.00 | | $ | 1,021.68 | | 0.70 | % | | $ | 3.57 |
| | | | | | | | | | | | | | |
Fees and Expenses (continued)
* Fund expenses (net of fee waivers or subsidies, if any) for each share class are equal to the annualized expense ratio for each share class (provided in the table), multiplied by the average account value over the period, multiplied by the 184 days in the six-month period ended August 31, 2007, and divided by 365 days (to reflect the six-month period) with the exception of the Class L, Class M and Class X “Actual” information which reflects the 168 day period ended August 31, 2007 due to its inception date of March 16, 2007. Expenses presented in the table include the expenses of any underlying portfolios in which the Fund may invest.
** Class L, M and X shares inception date of March 16, 2007.
| | |
| 16 | | Visit our website at www.jennisondryden.com |
Portfolio of Investments
as of August 31, 2007
| | | | | |
| Shares | | Description | | Value (Note 1) |
| | | | | |
LONG-TERM INVESTMENT 99.8% | | | |
COMMON STOCKS 99.3% | | | |
| |
Auto Components 0.4% | | | |
| 119,800 | | Wabco Holdings Inc. | | $ | 5,422,148 |
| |
Biotechnology 1.4% | | | |
| 365,400 | | Amgen, Inc.(a) | | | 18,310,194 |
| |
Building Products 1.5% | | | |
| 550,300 | | American Standard Cos., Inc. | | | 20,267,549 |
| |
Capital Markets 4.2% | | | |
| 524,362 | | Bank of New York Mellon Corp. (The) | | | 21,199,956 |
| 535,600 | | TD Ameritrade Holding Corp.(a) | | | 9,721,140 |
| 461,700 | | UBS AG | | | 24,119,208 |
| | | | | |
| | | | | 55,040,304 |
| | | | | |
| |
Chemicals 1.0% | | | |
| 268,300 | | E.I. du Pont de Nemours & Co.(b) | | | 13,079,625 |
| |
Commercial Banks 1.5% | | | |
| 1,707,874 | | Royal Bank of Scotland Group PLC (United Kingdom) | | | 19,782,923 |
| |
Commercial Services & Supplies 1.9% | | | |
| 648,760 | | Waste Management, Inc. | | | 24,438,789 |
| |
Communications Equipment 1.2% | | | |
| 385,400 | | QUALCOMM, Inc. | | | 15,373,606 |
| |
Computers & Peripherals 1.9% | | | |
| 968,100 | | Seagate Technology | | | 24,996,342 |
| |
Consumer Finance 2.2% | | | |
| 218,500 | | American Express Co. | | | 12,808,470 |
| 326,400 | | SLM Corp. | | | 16,411,392 |
| | | | | |
| | | | | 29,219,862 |
| | | | | |
| |
Diversified Consumer Services 3.5% | | | |
| 542,700 | | Career Education Corp.(a)(b) | | | 16,118,190 |
| 1,486,600 | | H&R Block, Inc. | | | 29,494,144 |
| | | | | |
| | | | | 45,612,334 |
| | | | | |
See Notes to Financial Statements.
Portfolio of Investments
as of August 31, 2007 continued
| | | | | |
| Shares | | Description | | Value (Note 1) |
| | | | | |
Diversified Financial Services 6.6% | | | |
| 526,403 | | Bank of America Corp. | | $ | 26,678,104 |
| 679,500 | | Citigroup, Inc. | | | 31,854,960 |
| 356,300 | | JPMorgan Chase & Co. | | | 15,862,476 |
| 120,000 | | KKR Private Equity Investors LLP | | | 2,280,000 |
| 536,200 | | KKR Private Equity Investors LLP—RDU, Private Placement, 144A
(cost $13,370,899; purchased 5/3/06 - 5/5/06)(f)(g) | | | 10,187,800 |
| | | | | |
| | | | | 86,863,340 |
| | | | | |
| |
Diversified Telecommunication Services 1.6% | | | |
| 515,150 | | Verizon Communications, Inc. | | | 21,574,482 |
| |
Electric Utilities 2.4% | | | |
| 179,200 | | Entergy Corp. | | | 18,568,704 |
| 270,400 | | Progress Energy, Inc. | | | 12,405,952 |
| | | | | |
| | | | | 30,974,656 |
| | | | | |
| |
Electronic Equipment & Instruments 1.3% | | | |
| 360,200 | | Sony Corp. ADR (Japan) | | | 17,210,356 |
| |
Food & Staples Retailing 3.4% | | | |
| 1,035,000 | | Kroger Co. (The) | | | 27,510,300 |
| 381,600 | | Wal-Mart Stores, Inc. | | | 16,649,208 |
| | | | | |
| | | | | 44,159,508 |
| | | | | |
| |
Food Products 4.7% | | | |
| 700,700 | | Cadbury Schweppes PLC, ADR (United Kingdom) | | | 33,094,062 |
| 1,110,700 | | ConAgra Foods, Inc. | | | 28,556,097 |
| | | | | |
| | | | | 61,650,159 |
| | | | | |
| |
Healthcare Providers & Services 1.8% | | | |
| 721,900 | | Omnicare, Inc. | | | 23,555,597 |
| |
Household Products 1.7% | | | |
| 330,400 | | Kimberly-Clark Corp.(b) | | | 22,695,176 |
| |
Independent Power Producers & Energy Traders 1.5% | | | |
| 521,400 | | NRG Energy, Inc.(a)(b) | | | 19,860,126 |
| |
Industrial Conglomerates 2.3% | | | |
| 770,500 | | General Electric Co. | | | 29,949,335 |
See Notes to Financial Statements.
| | |
| 18 | | Visit our website at www.jennisondryden.com |
| | | | | |
| Shares | | Description | | Value (Note 1) |
| | | | | |
Insurance 6.9% | | | |
| 475,500 | | American International Group, Inc. | | $ | 31,383,000 |
| 428,100 | | Axis Capital Holdings Ltd. | | | 15,454,410 |
| 544,100 | | Loews Corp. | | | 25,578,141 |
| 317,900 | | MBIA, Inc.(b) | | | 19,074,000 |
| | | | | |
| | | | | 91,489,551 |
| | | | | |
| |
Internet & Catalog Retail 1.6% | | | |
| 762,600 | | IAC/InterActiveCorp(a)(b) | | | 21,192,654 |
| |
Media 5.4% | | | |
| 934,800 | | Comcast Corp. (Class A)(a)(b) | | | 24,388,932 |
| 711,512 | | Liberty Global, Inc. (Series C)(a) | | | 28,069,148 |
| 42,400 | | Time Warner, Inc. | | | 804,752 |
| 1,475,400 | | XM Satellite Radio Holdings, Inc. (Class A)(a)(b) | | | 18,398,238 |
| | | | | |
| | | | | 71,661,070 |
| | | | | |
| |
Metals & Mining 1.2% | | | |
| 176,932 | | Freeport-McMoRan Copper & Gold, Inc. | | | 15,467,395 |
| |
Multi-Utilities 1.7% | | | |
| 418,200 | | Sempra Energy | | | 23,013,546 |
| |
Office Electronics 1.4% | | | |
| 1,067,500 | | Xerox Corp.(a) | | | 18,286,275 |
| |
Oil, Gas & Consumable Fuels 14.9% | | | |
| 335,400 | | Anadarko Petroleum Corp.(b) | | | 16,427,892 |
| 143,700 | | Devon Energy Corp. | | | 10,822,047 |
| 440,400 | | Hess Corp. | | | 27,027,348 |
| 400,100 | | Marathon Oil Corp. | | | 21,561,389 |
| 219,000 | | Murphy Oil Corp.(b) | | | 13,345,860 |
| 613,400 | | Nexen, Inc. | | | 17,095,458 |
| 496,000 | | Occidental Petroleum Corp. | | | 28,118,240 |
| 380,700 | | Petroleo Brasileiro SA, ADR (Brazil)(b) | | | 23,542,488 |
| 290,000 | | Suncor Energy, Inc. | | | 25,923,100 |
| 319,000 | | The Williams Cos., Inc. | | | 9,889,000 |
| 236,629 | | Trident Resources Corp., Private (Canada)
(cost $ 9,942,621; purchased 3/11/05 - 1/5/06)(a)(f)(g) | | | 2,240,805 |
| | | | | |
| | | | | 195,993,627 |
| | | | | |
See Notes to Financial Statements.
Portfolio of Investments
as of August 31, 2007 continued
| | | | | |
| Shares | | Description | | Value (Note 1) |
| | | | | |
Pharmaceuticals 4.0% | | | |
| 260,100 | | Abbott Laboratories | | $ | 13,501,791 |
| 380,300 | | Novartis AG, ADR (Switzerland) | | | 20,022,795 |
| 428,200 | | Wyeth | | | 19,825,660 |
| | | | | |
| | | | | 53,350,246 |
| | | | | |
| |
Semiconductors & Semiconductor Equipment 1.7% | | | |
| 2,429,800 | | Spansion, Inc. (Class A)(a)(b) | | | 22,111,180 |
| |
Software 2.9% | | | |
| 456,300 | | Microsoft Corp. | | | 13,109,499 |
| 1,364,400 | | Symantec Corp.(a) | | | 25,664,364 |
| | | | | |
| | | | | 38,773,863 |
| | | | | |
| |
Specialty Retail 1.7% | | | |
| 511,800 | | Best Buy Co., Inc.(b) | | | 22,493,610 |
| |
Textiles, Apparel & Luxury Goods | | | |
| 200 | | NIKE, Inc. (Class B) | | | 11,268 |
| |
Thrifts & Mortgage Finance 2.3% | | | |
| 236,125 | | Fannie Mae | | | 15,492,161 |
| 826,740 | | People’s United Financial, Inc.(b) | | | 14,616,763 |
| | | | | |
| | | | | 30,108,924 |
| |
Tobacco 2.0% | | | |
| 377,840 | | Altria Group, Inc. | | | 26,225,874 |
| |
Wireless Telecommunication Services 3.6% | | | |
| 303,000 | | Alltel Corp. | | | 20,682,780 |
| 1,436,825 | | Sprint Nextel Corp.(b) | | | 27,184,729 |
| | | | | |
| | | | | 47,867,509 |
| | | | | |
| | TOTAL COMMON STOCKS
(cost $1,107,560,023) | | | 1,308,083,003 |
| | | | | |
See Notes to Financial Statements.
| | |
| 20 | | Visit our website at www.jennisondryden.com |
| | | | | | |
Principal
Amount
(000) | | | | Value (Note 1) | |
| | | | | | |
CORPORATE BOND 0.5% | | | | |
| |
Oil, Gas & Consumable Fuels 0.5% | | | | |
| $7,357 | | Trident Resources Corp., Note, Private, 13.04%, 8/12/12(f)(g)
(cost $6,979,462) | |
$ |
6,967,235 |
|
| | | | | | |
| Units | | | | | |
| | | | | | | |
WARRANT | | | | | | |
| |
Oil, Gas & Consumable Fuels | | | | |
| 730,398 | | Trident Resources Corp., Private, expiring 1/01/15(f)(g) (cost $0) | | | 69 | |
| | | | | | |
| | TOTAL LONG-TERM INVESTMENTS
(cost $1,114,539,485) | | | 1,315,050,307 | |
| | | | | | |
| Shares | | | | | |
| | | | | | | |
SHORT-TERM INVESTMENT 16.2% | | | | |
| |
Affiliated Money Market Mutual Fund | | | | |
| 213,758,200 | | Dryden Core Investment Fund - Taxable Money Market Series
(cost $213,758,200; includes $213,758,200 of cash collateral received for securities on loan) (Note 3)(c)(d) | | | 213,758,200 | |
| | | | | | |
| | TOTAL INVESTMENTS(e) 116.0%
(cost $1,328,297,685; Note 5) | | | 1,528,808,507 | |
| | Liabilities in excess of other assets (16.0%) | | | (210,853,093 | ) |
| | | | | | |
| | NET ASSETS 100.0% | | $ | 1,317,955,414 | |
| | | | | | |
The following abbreviations are used in portfolio descriptions:
144A—Securities were purchased pursuant to Rule 144A under the Securities Act of 1933 and may not be resold subject to that rule except to qualified institutional buyers. Unless otherwise noted, 144A securities are deemed to be liquid.
ADR—American Depositary Receipt
RDU—Restricted Depositary Unit
| (a) | Non-income producing security. |
| (b) | All or a portion of security is on loan. The aggregate market value of such securities is $207,592,760; cash collateral of $213,758,200 (included in liabilities) was received with which the Fund purchased highly liquid short-term investments. |
| (c) | Represents security, or portion thereof, purchased with cash collateral received for securities on loan. |
| (d) | Prudential Investments LLC, the Manager of the Fund, also serves as Manager of the Dryden Core Investment Fund—Taxable Money Market Series. |
| (e) | As of August 31, 2007, four securities valued at $19,395,909 and representing 1.5% of the total net assets were fair valued in accordance with the policies adopted by the Board of Trustees. |
| (f) | Indicates an illiquid security. |
| (g) | Indicates a security restricted to resale. The aggregate cost of such a security is $30,292,982. The aggregate value of $19,395,909 is approximately 1.5% of net assets. |
See Notes to Financial Statements.
Portfolio of Investments
as of August 31, 2007 continued
The industry classification of portfolio holdings and liabilities in excess of other assets shown as a percentage of nets assets as of August 31, 2007 were as follows:
| | | |
Affiliated Money Market Mutual Fund (including 16.2% of collateral received for securities on loan) | | 16.2 | % |
Oil, Gas & Consumable Fuels | | 15.4 | |
Insurance | | 6.9 | |
Diversified Financial Services | | 6.6 | |
Media | | 5.4 | |
Food Products | | 4.7 | |
Capital Markets | | 4.2 | |
Pharmaceuticals | | 4.0 | |
Wireless Telecommunication Services | | 3.6 | |
Diversified Consumer Services | | 3.5 | |
Food & Staples Retailing | | 3.4 | |
Software | | 2.9 | |
Electric Utilities | | 2.4 | |
Thrifts & Mortgage Finance | | 2.3 | |
Industrial Conglomerates | | 2.3 | |
Consumer Finance | | 2.2 | |
Tobacco | | 2.0 | |
Computers & Peripherals | | 1.9 | |
Commercial Services & Supplies | | 1.9 | |
Healthcare Products & Services | | 1.8 | |
Speciality Retail | | 1.7 | |
Semiconductors & Semiconductor Equipment | | 1.7 | |
Multi-Utilities | | 1.7 | |
Household Products | | 1.7 | |
Internet & Catalog Retail | | 1.6 | |
Diversified Telecommunication Services | | 1.6 | |
Independent Power Producers & Energy Traders | | 1.5 | |
Commercial Banks | | 1.5 | |
Building Products | | 1.5 | |
Office Electronics | | 1.4 | |
Biotechnology | | 1.4 | |
Electronic Equipment & Instruments | | 1.3 | |
Metals & Mining | | 1.2 | |
Communications Equipment | | 1.2 | |
Chemicals | | 1.0 | |
Auto Components | | 0.4 | |
| | | |
| | 116.0 | |
Liabilities in excess of other assets | | (16.0 | ) |
| | | |
| | 100.0 | % |
| | | |
See Notes to Financial Statements.
| | |
| 22 | | Visit our website at www.jennisondryden.com |
Financial Statements
| | |
| AUGUST 31, 2007 | | ANNUAL REPORT |
Jennison Value Fund
Statement of Assets and Liabilities
as of August 31, 2007
| | | |
Assets | | | |
Investments at value, including securities on loan of $207,592,760: | | | |
Unaffiliated investments (cost $1,114,539,485) | | $ | 1,315,050,307 |
Affiliated investments (cost $213,758,200) | | | 213,758,200 |
Foreign currency, at value (cost $9,935) | | | 10,805 |
Receivable for investments sold | | | 9,274,714 |
Dividends and interest receivable | | | 2,004,476 |
Receivable for Fund shares sold | | | 599,266 |
Foreign tax reclaim receivable | | | 183,774 |
Prepaid expenses | | | 27,413 |
| | | |
Total assets | | | 1,540,908,955 |
| | | |
| |
Liabilities | | | |
Payable to broker for collateral for securities on loan | | | 213,758,200 |
Payable for investments purchased | | | 4,332,678 |
Payable for Fund shares reacquired | | | 2,101,248 |
Loan payable | | | 856,000 |
Management fee payable | | | 593,350 |
Accrued expenses | | | 427,738 |
Distribution fee payable | | | 382,213 |
Payable to custodian | | | 322,136 |
Transfer agent fee payable | | | 170,662 |
Deferred trustees' fees | | | 9,161 |
Loan interest payable | | | 155 |
| | | |
Total liabilities | | | 222,953,541 |
| | | |
| |
Net Assets | | $ | 1,317,955,414 |
| | | |
| | | | |
Net assets were comprised of: | | | |
Shares of beneficial interest, at par | | $ | 605,256 |
Paid-in capital in excess of par | | | 938,069,816 |
| | | |
| | | 938,675,072 |
Undistributed net investment income | | | 7,731,882 |
Accumulated net realized gain on investment and foreign currency transactions | | | 171,029,042 |
Net unrealized appreciation on investments and foreign currencies | | | 200,519,418 |
| | | |
Net assets, August 31, 2007 | | $ | 1,317,955,414 |
| | | |
See Notes to Financial Statements.
| | |
| 24 | | Visit our website at www.jennisondryden.com |
| | | |
Class A | | | |
Net asset value and redemption price per share
($1,010,160,279 ÷ 46,306,779 shares of beneficial interest issued and outstanding) | | $ | 21.81 |
Maximum sales charge (5.50% of offering price) | | | 1.27 |
| | | |
Maximum offering price to public | | $ | 23.08 |
| | | |
| |
Class B | | | |
Net asset value, offering price and redemption price per share
($112,108,415 ÷ 5,209,606 shares of beneficial interest issued and outstanding) | | $ | 21.52 |
| | | |
| |
Class C | | | |
Net asset value, offering price and redemption price per share
($64,730,619 ÷ 3,007,416 shares of beneficial interest issued and outstanding) | | $ | 21.52 |
| | | |
| |
Class L | | | |
Net asset value, offering price and redemption price per share
($5,299,333 ÷ 243,740 shares of beneficial interest issued and outstanding) | | $ | 21.74 |
| | | |
| |
Class M | | | |
Net asset value, offering price and redemption price per share
($15,255,893 ÷ 708,655 shares of beneficial interest issued and outstanding) | | $ | 21.53 |
| | | |
| |
Class R | | | |
Net asset value, offering price and redemption price per share
($1,858,287 ÷ 85,434 shares of beneficial interest issued and outstanding) | | $ | 21.75 |
| | | |
| |
Class X | | | |
Net asset value, offering price and redemption price per share
($3,749,394 ÷ 174,244 shares of beneficial interest issued and outstanding) | | $ | 21.52 |
| | | |
| |
Class Z | | | |
Net asset value, offering price and redemption price per share
($104,793,194 ÷ 4,789,702 shares of beneficial interest issued and outstanding) | | $ | 21.88 |
| | | |
See Notes to Financial Statements.
Statement of Operations
| | | | | | | | |
| | | Ten Months
Ended
August 31, 2007 | | | Year
Ended
October 31, 2006 | |
Net Investment Income | | | | | | | | |
Income | | | | | | | | |
Unaffiliated dividends (net of foreign withholding taxes of $228,658 and $275,596, respectively) | | $ | 18,234,239 | | | $ | 20,418,964 | |
Affiliated dividend income | | | 1,863,807 | | | | 1,285,081 | |
Affiliated income from securities loaned, net | | | 124,167 | | | | 113,339 | |
Unaffiliated interest income | | | 34,457 | | | | — | |
| | | | | | | | |
Total income | | | 20,256,670 | | | | 21,817,384 | |
| | | | | | | | |
| | |
Expenses | | | | | | | | |
Management fee | | | 5,829,409 | | | | 5,854,442 | |
Distribution fee—Class A | | | 2,141,292 | | | | 2,180,195 | |
Distribution fee—Class B | | | 937,619 | | | | 1,120,700 | |
Distribution fee—Class C | | | 437,014 | | | | 248,124 | |
Distribution fee—Class L | | | 13,633 | | | | — | |
Distribution fee—Class M | | | 82,620 | | | | — | |
Distribution fee—Class R | | | 2,854 | | | | 104 | |
Distribution fee—Class X | | | 19,441 | | | | — | |
Transfer agent’s fees and expenses (including affiliated expense of $933,000 and $1,158,000, respectively) (Note 3) | | | 1,487,000 | | | | 1,500,000 | |
Custodian’s fees and expenses | | | 121,000 | | | | 100,000 | |
Registration fees | | | 97,000 | | | | 82,000 | |
Reports to shareholders | | | 50,000 | | | | 140,000 | |
Insurance | | | 26,000 | | | | 27,000 | |
Trustees’ fees | | | 25,000 | | | | 25,000 | |
Audit fee | | | 20,000 | | | | 17,000 | |
Legal fees and expenses | | | 15,000 | | | | 63,000 | |
Loan interest expense (Note 2) | | | 1,432 | | | | — | |
Miscellaneous | | | 21,931 | | | | 22,329 | |
| | | | | | | | |
Total expenses | | | 11,328,245 | | | | 11,379,894 | |
| | | | | | | | |
Net investment income | | | 8,928,425 | | | | 10,437,490 | |
| | | | | | | | |
| | |
Realized And Unrealized Gain (Loss) On Investment And Foreign Currency Transactions | | | | | | | | |
Net realized gain on: | | | | | | | | |
Investment transactions | | | 172,362,563 | | | | 118,758,928 | |
Foreign currency transactions | | | 97,227 | | | | (24,055 | ) |
Short Sales | | | 391,177 | | | | — | |
| | | | | | | | |
| | | 172,850,967 | | | | 118,734,873 | |
| | | | | | | | |
Net change in unrealized appreciation (depreciation) on: | | | | | | | | |
Investments | | | (72,519,336 | ) | | | 61,050,024 | |
Foreign currencies | | | 8,278 | | | | 318 | |
| | | | | | | | |
| | | (72,511,058 | ) | | | 61,050,342 | |
| | | | | | | | |
Net gain on investment and foreign currency transactions | | | 100,339,909 | | | | 179,785,215 | |
| | | | | | | | |
Net Increase In Net Assets Resulting From Operations | | $ | 109,268,334 | | | $ | 190,222,705 | |
| | | | | | | | |
See Notes to Financial Statements.
| | |
| 26 | | Visit our website at www.jennisondryden.com |
Statement of Changes in Net Assets
| | | | | | | | | | | | |
| | | Ten Months
Ended | | | Year Ended October 31, | |
| | August 31, 2007 | | | 2006 | | | 2005 | |
Increase (Decrease) In Net Assets | | | | | | | | | | | | |
Operations | | | | | | | | | | | | |
Net investment income | | $ | 8,928,425 | | | $ | 10,437,490 | | | $ | 5,891,791 | |
Net realized gain on investment and foreign currency transactions | | | 172,850,967 | | | | 118,734,873 | | | | 117,720,036 | |
Net change in unrealized appreciation (depreciation) on investments and foreign currencies | | | (72,511,058 | ) | | | 61,050,342 | | | | 34,179,396 | |
| | | | | | | | | | | | |
Net increase in net assets resulting from operations | | | 109,268,334 | | | | 190,222,705 | | | | 157,791,223 | |
| | | | | | | | | | | | |
Dividends and distributions (Note 1) | | | | | | | | | | | | |
Dividends from net investment income: | | | | | | | | | | | | |
Class A | | | (8,164,199 | ) | | | (5,369,140 | ) | | | (5,295,657 | ) |
Class B | | | (147,136 | ) | | | — | | | | (115,838 | ) |
Class C | | | (45,182 | ) | | | — | | | | (12,108 | ) |
Class R | | | (393 | ) | | | (12 | ) | | | — | |
Class Z | | | (1,038,985 | ) | | | (420,806 | ) | | | (307,762 | ) |
| | | | | | | | | | | | |
| | | (9,395,895 | ) | | | (5,789,958 | ) | | | (5,731,365 | ) |
| | | | | | | | | | | | |
Distributions from net realized gains: | | | | | | | | | | | | |
Class A | | | (95,071,115 | ) | | | (35,966,579 | ) | | | — | |
Class B | | | (10,773,756 | ) | | | (5,595,023 | ) | | | — | |
Class C | | | (3,308,355 | ) | | | (971,592 | ) | | | — | |
Class R | | | (7,650 | ) | | | (128 | ) | | | — | |
Class Z | | | (9,486,716 | ) | | | (2,054,591 | ) | | | — | |
| | | | | | | | | | | | |
| | | (118,647,592 | ) | | | (44,587,913 | ) | | | — | |
| | | | | | | | | | | | |
Fund share transactions (Net of share conversions) (Note 6) | | | | | | | | | | | | |
Net proceeds from shares sold | | | 129,130,638 | | | | 213,569,167 | | | | 115,477,435 | |
Net asset value of shares issued in connection with merger (Note 7) | | | 127,217,340 | | | | — | | | | — | |
Net asset value of shares issued in reinvestment of dividends and distributions | | | 120,759,467 | | | | 47,372,650 | | | | 5,283,291 | |
Cost of shares reacquired | | | (217,035,433 | ) | | | (177,217,214 | ) | | | (170,037,111 | ) |
| | | | | | | | | | | | |
Net increase (decrease) in net assets from Fund share transactions | | | 160,072,012 | | | | 83,724,603 | | | | (49,276,385 | ) |
| | | | | | | | | | | | |
Total increase | | | 141,296,859 | | | | 223,569,437 | | | | 102,783,473 | |
| | | |
Net Assets | | | | | | | | | | | | |
Beginning of period | | | 1,176,658,555 | | | | 953,089,118 | | | | 850,305,645 | |
| | | | | | | | | | | | |
End of period(a) | | $ | 1,317,955,414 | | | $ | 1,176,658,555 | | | $ | 953,089,118 | |
| | | | | | | | | | | | |
(a) Includes undistributed net investment income of: | | $ | 7,731,882 | | | $ | 8,195,035 | | | $ | 3,571,558 | |
| | | | | | | | | | | | |
See Notes to Financial Statements.
Notes to Financial Statements
JennisonDryden Portfolios, Inc.—Jennison Value Fund (the “Fund”) (formerly known as Jennison Value Fund) is registered under the Investment Company Act of 1940 as a diversified, open-end, management investment company. The investment objective of the Fund is capital appreciation. It seeks to achieve this objective by investing primarily in common stocks and convertible securities that provide investment income returns above those of the Standard & Poor’s 500 Composite Stock Price Index or the NYSE Composite Index.
The Fund’s fiscal year has changed from an annual reporting period that ends October 31 to one that ends August 31. This change should have no impact on the way the Fund is managed. Shareholders will receive future annual and semi-annual reports on the new fiscal year-end schedule.
Note 1. Accounting Policies
The following is a summary of significant accounting policies followed by the Fund in the preparation of its financial statements.
Securities Valuation: Securities listed on a securities exchange are valued at the last sale price on such exchange on the day of valuation or, if there was no sale on such day, at the mean between the last reported bid and asked prices, or at the last bid price on such day in the absence of an asked price. Securities traded via Nasdaq are valued at the official closing price provided by Nasdaq. Securities that are actively traded in the over-the-counter market, including listed securities for which the primary market is believed by Prudential Investments LLC (“PI” or “Manager”), in consultation with the subadvisor; to be over-the-counter, are valued at market value using prices provided by an independent pricing agent or principal market maker. Futures contracts and options thereon traded on a commodities exchange or board of trade are valued at the last sale price at the close of trading on such exchange or board of trade or, if there was no sale on the applicable commodities exchange or board of trade on such day, at the mean between the most recently quoted prices on such exchange or board of trade or at the last bid price in the absence of an asked price. Prices may be obtained from independent pricing services which use information provided by market makers or estimates of market values obtained from yield data relating to investments or securities with similar characteristics. Securities for which reliable market quotations are not readily available, or whose values have been affected by events occurring after the close of the security’s foreign market and before the Series’ normal pricing time, are valued at fair value in accordance with the Board of Trustees’ approved fair valuation procedures. When determining the fair
| | |
| 28 | | Visit our website at www.jennisondryden.com |
valuation of securities some of the factors influencing the valuation include, the nature of any restrictions on disposition of the securities; assessment of the general liquidity of the securities; the issuer’s financial condition and the markets in which it does business; the cost of the investment; the size of the holding and the capitalization of issuer; the prices of any recent transactions or bids/offers for such securities or any comparable securities; any available analyst media or other reports or information deemed reliable by the investment adviser regarding the issuer or the markets or industry in which it operates. Using fair value to price securities may result in a value that is different from a security’s most recent closing price and from the price used by other mutual funds to calculate their net asset values. As of August 31, 2007, there were no securities whose values were impacted by events occurring after the close of the security’s foreign market.
Investments in mutual funds are valued at their net asset value as of the close of the New York Stock Exchange on the date of valuation.
Short-term debt securities which mature in 60 days or less are valued at amortized cost, which approximates market-value. The amortized cost method includes valuing a security at its cost on the date of purchase and thereafter assuming a constant amortization to maturity of the difference between the principal amount due at maturity and cost. Short-term debt securities which mature in more than 60 days are valued at current market quotations.
Foreign Currency Translation: The books and records of the Fund are maintained in U.S. dollars. Foreign currency amounts are translated into U.S. dollars on the following basis:
(i) market value of investment securities, other assets and liabilities-at the current rates of exchange;
(ii) purchases and sales of investment securities, income and expenses-at the rates of exchange prevailing on the respective dates of such transactions.
The Fund does not isolate that portion of the results of operations arising as a result of changes in the foreign exchange rates from the fluctuations arising from changes in the market prices of long term securities held at the end of the fiscal year. Similarly, the Fund does not isolate the effect of changes in foreign exchange rates from the fluctuations arising from changes in the market prices of portfolio securities sold during the fiscal year. Accordingly, realized foreign currency gains or losses are included in the reported net realized gains or losses on investment transactions.
Notes to Financial Statements
continued
Net realized gains or losses on foreign currency transactions represent net foreign exchange gains or losses from the holding of foreign currencies, currency gains or losses realized between the trade and settlement dates on security transactions, and the difference between the amounts of dividends, interest and foreign withholding taxes recorded on the Fund’s books and the U.S. dollar equivalent amounts actually received or paid. Net unrealized currency gains or losses from valuing foreign currency denominated assets and liabilities (other than investments) at period end exchange rates are reflected as a component of net unrealized appreciation (depreciation) on foreign currencies.
Foreign security and currency transactions may involve certain considerations and risks not typically associated with those of domestic origin as a result of, among other factors, the possibility of political or economic instability or the level of governmental supervision and regulation of foreign securities markets.
Restricted Securities: The Fund may hold up to 15% of its net assets in illiquid securities, including those which are restricted as to disposition under securities law (“restricted securities”). Restricted securities held by the Fund at the end of the fiscal period may include registration rights under which the Fund may demand registration by the issuers, of which the Fund may bear the cost of such registration. Restricted securities are valued pursuant to the valuation procedures noted above.
Short Sales: The Fund may make short sales of securities as a method of hedging potential price declines in similar securities owned. The Fund may sell a security it does not own in anticipation of a decline in the market value of that security (short sale). When the Fund makes a short sale, it will borrow the security sold short and deliver it to the broker-dealer through which it made the short sale as collateral for its obligation to deliver the security upon conclusion of the sale. The Fund may have to pay a fee to borrow the particular securities and may be obligated to return any interest or dividends received on such borrowed securities. A gain, limited to the price at which the Fund sold the security short, or a loss, unlimited as to dollar amount, will be recognized upon the termination of a short sale if the market price is less or greater than the proceeds originally received, respectively, and is presented in the Statement of Operations as net realized gain or loss on short sales.
Securities Transactions and Net Investment Income: Securities transactions are recorded on the trade date. Realized gains or losses from investment and currency
| | |
| 30 | | Visit our website at www.jennisondryden.com |
transactions are calculated on the identified cost basis. Dividend income is recorded on the ex-dividend date and interest income, including amortization of premium and accretion of discount on debt securities, as required, is recorded on the accrual basis. Expenses are recorded on an accrual basis.
Net investment income or loss, (other than distribution fees, which are charged directly to the respective class) and unrealized and realized gains or losses are allocated daily to each class of shares based upon the relative proportion of net assets of each class at the beginning of the day.
Taxes: For federal income tax purposes, it is the Fund’s policy to continue to meet the requirements under the Internal Revenue Code applicable to regulated investment companies and to distribute all of its taxable net income and capital gains, if any, to shareholders. Therefore, no federal income tax provision is required.
Withholding taxes on foreign dividends are recorded net of reclaimable amounts, at the time the related income is earned.
Dividends and Distributions: The Fund expects to pay dividends of net investment income and distributions of net realized capital and currency gains, if any, annually. Dividends and distributions to shareholders, which are determined in accordance with federal income tax regulations and which may differ from generally accepted accounting principles, are recorded on the ex-dividend date.
Securities Lending: The Fund may lend its portfolio securities to broker-dealers. The loans are secured by collateral at least equal, at all times, to the market value of the securities loaned.
Loans are subject to termination at the option of the borrower or the Fund. Upon termination of the loan, the borrower will return to the lender securities identical to the loaned securities. Should the borrower of the securities fail financially, the Fund has the right to repurchase the securities using the collateral in the open market. The Fund recognizes income, net of any rebate and securities lending agent fees, for lending its securities in the form of fees or interest on the investment of any cash received as collateral. The Fund also continues to receive interest and dividends or amounts equivalent thereto, on the securities loaned and recognizes any unrealized gain or loss in the market price of the securities loaned that may occur during the term of the loan.
Notes to Financial Statements
continued
Estimates: The preparation of the financial statements requires management to make estimates and assumptions that affect the reported amounts and disclosures in the financial statements. Actual results could differ from those estimates.
Note 2. Agreements
The Fund has a management agreement with PI. Pursuant to this agreement, PI has responsibility for all investment advisory services and supervises the subadvisors’ performance of such services. PI has entered into a subadvisory agreement with Jennison Associates LLC (“Jennison”). The subadvisory agreement provides that Jennison furnishes investment advisory services in connection with the management of the Fund. In connection therewith, Jennison assumes the day-to-day management responsibilities of the Fund and is obligated to keep certain books and records of the Fund. PI pays for the services of Jennison, the cost of compensation of officers and employees of the Fund, occupancy and certain clerical and bookkeeping costs of the Fund. The Fund bears all other costs and expenses.
The management fee paid to PI is computed daily and payable monthly at an annual rate of .60 of 1% of the Fund’s average daily net assets up to $500 million, .50 of 1% of the next $500 million, .475 of 1% of the next $500 million and .45 of 1% of the average daily net assets in excess of $1.5 billion. The effective management fee rate was .53 of 1% of the Fund’s average daily net assets for the ten-month period ended August 31, 2007.
The Fund has a distribution agreement with Prudential Investment Management Services LLC (“PIMS”), which acts as the distributor of the Class A, Class B, Class C, Class L, Class M, Class R, Class X and Class Z shares. The Fund compensates PIMS for distributing and servicing the Fund’s Class A, Class B, Class C, Class L, Class M, Class R and Class X shares, pursuant to plans of distribution (the “Class A, B, C, L, M, R and X Plans”), regardless of expenses actually incurred. The distribution fees are accrued daily and payable monthly. No distribution or service fees are paid to PIMS as distributor of the Class Z shares of the Fund. Pursuant to the Class A, B, C, L, M, R and X Plans, the Fund compensates PIMS for distribution related activities at an annual rate of up to .30 of 1%, 1%, 1%, .50 of 1%, 1%, .75 of 1% and 1% of the average daily net assets of the Class A, B, C, L, M, R and X shares, respectively. For the ten-month period ended August 31, 2007, PIMS contractually agreed to limit such fees to .25 of 1% of the average daily net assets of the Class A shares
| | |
| 32 | | Visit our website at www.jennisondryden.com |
through February 28, 2008 and .50% of 1% of the average daily net assets of the Class R shares.
PIMS has advised the Fund that it has received approximately $517,400 in front-end sales charges resulting from sales of Class A shares, during the ten-month period ended August 31, 2007. From these fees, PIMS paid such sales charges to affiliated broker-dealers, which in turn paid commissions to salespersons and incurred other distribution costs.
PIMS has advised the Fund that for the ten-month period ended August 31, 2007, it received approximately $98,500, $3,600, $117,900 and $14,400 in contingent deferred sales charges imposed upon certain redemptions by Class B, Class C, Class M and Class X shareholders, respectively.
PI, PIMS and Jennison are indirect, wholly-owned subsidiaries of Prudential Financial, Inc. (“Prudential”).
The Fund, along with other affiliated registered investment companies (the “Funds”), is a party to a Syndicated Credit Agreement (“SCA”) with two banks. The SCA, which was renewed on October 27, 2006, provides for a commitment of $500 million. Interest on any borrowings under the SCA is incurred at contracted market rates and a commitment fee for the unused amount would be accrued daily and paid quarterly. The Funds pay a commitment fee of .07 of 1% of the unused portion of the renewed SCA. The expiration date of the renewed SCA is October 26, 2007. The SCA is in the process of being renewed through October 24, 2008. For the period from October 29, 2005 through October 26, 2006, the Funds paid a commitment fee of .0725 of 1% of the unused portion of the agreement. The purpose of the SCA is to provide an alternative source of temporary funding for capital share redemptions.
The Fund utilized the line of credit during the ten-month period ended August 31, 2007. The average daily balance for the 5 days the Fund had an outstanding balance was approximately $1,892,400 at a weighted average interest rate of approximately 5.45%. At August 31, 2007, the Fund had an outstanding loan amount of approximately $856,000.
Note 3. Other Transactions with Affiliates
Prudential Mutual Fund Services LLC (“PMFS”), an affiliate of PI and an indirect, wholly-owned subsidiary of Prudential, serves as the Fund’s transfer agent. Transfer agent fees and expenses in the Statement of Operations include certain out-of-pocket expenses paid to non-affiliates, where applicable.
Notes to Financial Statements
continued
The Fund pays networking fees to affiliated and unaffiliated broker/dealers including fees relating to the services of Wachovia Securities, LLC (“Wachovia”) and First Clearing, LLC (“First Clearing”), affiliates of PI. These networking fees are payments made to broker/dealers that clear mutual fund transactions through a national clearing system. For the ten-month period ended August 31, 2007 and the year ended October 31, 2006, the Fund incurred approximately $295,700 and $235,500, respectively, in total networking fees, of which approximately $146,200 and $161,200, respectively, was paid to First Clearing. These amounts are included in transfer agent’s fees and expenses in the Statement of Operations.
Prudential Investment Management, Inc. (“PIM”), an indirect, wholly-owned subsidiary of Prudential, is the Fund’s security lending agent. For the ten-month period ended August, 31, 2007 and the year ended October 31, 2006, PIM has been compensated approximately $53,200 and $48,600, respectively, for these services.
The Fund invests in the Taxable Money Market Series (the “Series”), a portfolio of Dryden Core Investment Fund, pursuant to an exemptive order received from the Securities and Exchange Commission. The Series is a money market mutual fund registered under the Investment Company Act of 1940, as amended, and managed by PI.
Note 4. Portfolio Securities
Purchases and sales of investment securities, other than short-term investments, for the ten-month period ended August 31, 2007 were $695,043,809 and $740,597,179, respectively.
Note 5. Distributions and Tax Information
Distributions to shareholders, which are determined in accordance with federal income tax regulations and which may differ from generally accepted accounting principles, are recorded on the ex-dividends date. In order to present undistributed
| | |
| 34 | | Visit our website at www.jennisondryden.com |
net investment income, accumulated net realized gain on investment and foreign currency transactions and paid-in capital in excess of par on the Statement of Assets and Liabilities that more closely represent their tax character, certain adjustments have been made to undistributed net investment income, accumulated net realized gain on investment and foreign currency transactions and paid-in capital in excess of par. For the ten-month period ended August 31, 2007, the adjustments were to increase undistributed net investment income by $4,317, decrease accumulated net realized gain on investment and foreign currency transactions by $437,012 and increase paid-in-capital in excess of par by $432,695 due to the reclassification of net foreign currency losses, reclassifications of disallowed losses on wash sales and deferred trustees’ compensation from reorganization, reclassifications of dividends received from partnership and other book to tax adjustments. Net investment income, net realized gains on investment and foreign currency transactions and net assets were not affected by this change.
For the ten-months ended August 31, 2007, the tax character of dividends and distributions paid as reflected in Statement of Changes in Net Assets were $28,870,957 from ordinary income and $99,172,530 from long-term capital gains.
For the fiscal years ended October 31, 2006 and 2005, the tax character of dividends and distributions paid were $5,789,958 and $5,731,365 from ordinary income and $44,587,913 and zero from long-term capital gains, respectively. The Fund did not distribute any long-term capital gains for the fiscal year ended October 31, 2005.
As of August 31, 2007, the accumulated undistributed earnings on tax basis consisted of $51,258,891 from ordinary income and $128,777,279 from long-term capital gains.
The United States federal income tax basis of the Fund’s investments and the net unrealized appreciation as of August 31, 2007 were as follows:
| | | | | | | | | | |
Tax Basis | | Appreciation | | Depreciation | | Net Unrealized
Appreciation | | Other Cost
Basis
Adjustments | | Total Net
Unrealized
Appreciation |
| $1,329,573,492 | | $243,508,418 | | $(44,273,403) | | $199,235,015 | | $5,340 | | $199,240,355 |
The difference between book basis and tax basis is primarily attributable to the difference in the treatment of losses on wash sales and other book to tax differences. Other cost basis adjustments are attributable to mark-to-market of appreciation on foreign currencies and receivables and payables.
Notes to Financial Statements
continued
Note 6. Capital
The Fund offers Class A, Class B, Class C, Class L, Class M, Class R, Class X and Class Z shares. Class A and Class L shares are sold with a front-end sales charge of up to 5.50% and 5.75%, respectively. All investors who purchase Class A or Class L shares in an amount of $1 million or more and sell these shares within 12 months of purchase are subject to a contingent deferred sales charge (CDSC) of 1%, including investors who purchase their shares through broker-dealers affiliated with Prudential. Class B shares are sold with a contingent deferred sales charge which declines from 5% to zero depending on the period of time the shares are held. Class C shares are sold with a contingent deferred sales charge of 1% during the first 12 months. Class M and Class X shares are sold with a contingent deferred sales charge which declines from 6% to zero depending on the period of time the shares are held. Class B shares automatically convert to Class A shares on a quarterly basis approximately seven years after purchase. Class M shares automatically convert to Class A shares approximately eight years after purchase. Class X shares automatically convert to Class A shares on a quarterly basis approximately ten years (eight years in the case of shares purchased prior to August 19, 1998) after purchase. A special exchange privilege is also available for shareholders who qualified to purchase Class A shares at net asset value. Class L shares are closed to most new purchases (with the exception of reinvested dividends). Class L and Class M shares are only exchangable with Class L and Class M shares, respectively, offered by certain other Strategic Partners Funds. Class X shares are closed to new purchases. Class R and Class Z shares are not subject to any sales or redemption charge and are available exclusively for sale to a limited group of investors.
The Fund has authorized an unlimited number of shares of beneficial interest at $.01 par value divided into eight classes, designated Class A, Class B, Class C, Class L, Class M, Class R, Class X and Class Z.
Transactions in shares of beneficial interest were as follows:
| | | | | | | |
Class A | | Shares | | | Amount | |
Ten-month period ended August 31, 2007: | | | | | | | |
Shares sold | | 3,332,640 | | | $ | 72,760,145 | |
Shares issued in connection with the merger | | 2,232,067 | | | | 46,198,226 | |
Shares issued in reinvestment of dividends and distributions | | 4,759,755 | | | | 97,051,409 | |
Shares reacquired | | (7,031,586 | ) | | | (154,093,876 | ) |
| | | | | | | |
Net increase (decrease) in shares outstanding before conversion | | 3,292,876 | | | | 61,915,904 | |
Shares issued upon conversion from Class B, Class M and Class X | | 935,606 | | | | 20,149,514 | |
| | | | | | | |
Net increase (decrease) in shares outstanding | | 4,228,482 | | | $ | 82,065,418 | |
| | | | | | | |
| | |
| 36 | | Visit our website at www.jennisondryden.com |
| | | | | | | |
Class A | | Shares | | | Amount | |
Year ended October 31, 2006: | | | | | | | |
Shares sold | | 6,622,418 | | | $ | 139,018,128 | |
Shares issued in reinvestment of dividends and distributions | | 1,959,077 | | | | 38,613,402 | |
Shares reacquired | | (6,950,376 | ) | | | (145,837,152 | ) |
| | | | | | | |
Net increase (decrease) in shares outstanding before conversion | | 1,631,119 | | | | 31,794,378 | |
Shares issued upon conversion from Class B | | 1,414,535 | | | | 29,084,598 | |
| | | | | | | |
Net increase (decrease) in shares outstanding | | 3,045,654 | | | $ | 60,878,976 | |
| | | | | | | |
Year ended October 31, 2005: | | | | | | | |
Shares sold | | 4,459,037 | | | $ | 83,324,115 | |
Shares issued in reinvestment of dividends | | 279,079 | | | | 4,855,977 | |
Shares reacquired | | (6,942,598 | ) | | | (128,617,514 | ) |
| | | | | | | |
Net increase (decrease) in shares outstanding before conversion | | (2,204,482 | ) | | | (40,437,422 | ) |
Shares issued upon conversion from Class B | | 4,704,055 | | | | 87,747,613 | |
| | | | | | | |
Net increase (decrease) in shares outstanding | | 2,499,573 | | | $ | 47,310,191 | |
| | | | | | | |
Class B | | | | | | |
Ten-month period ended August 31, 2007: | | | | | | | |
Shares sold | | 414,740 | | | $ | 8,955,241 | |
Shares issued in connection with the merger | | 1,047,992 | | | | 21,471,958 | |
Shares issued in reinvestment of dividends and distributions | | 519,027 | | | | 10,499,923 | |
Shares reacquired | | (682,047 | ) | | | (14,796,064 | ) |
| | | | | | | |
Net increase (decrease) in shares outstanding before conversion | | 1,299,712 | | | | 26,131,058 | |
Shares reacquired upon conversion from Class A | | (860,546 | ) | | | (18,277,134 | ) |
| | | | | | | |
Net increase (decrease) in shares outstanding | | 439,166 | | | $ | 7,853,924 | |
| | | | | | | |
Year ended October 31, 2006: | | | | | | | |
Shares sold | | 597,144 | | | $ | 12,499,038 | |
Shares issued in reinvestment of dividends and distributions | | 274,279 | | | | 5,367,640 | |
Shares reacquired | | (776,972 | ) | | | (16,100,691 | ) |
| | | | | | | |
Net increase (decrease) in shares outstanding before conversion | | 94,451 | | | | 1,765,987 | |
Shares reacquired upon conversion into Class A | | (1,427,998 | ) | | | (29,084,598 | ) |
| | | | | | | |
Net increase (decrease) in shares outstanding | | (1,333,547 | ) | | $ | (27,318,611 | ) |
| | | | | | | |
Year ended October 31, 2005: | | | | | | | |
Shares sold | | 657,252 | | | $ | 11,934,704 | |
Shares issued in reinvestment of dividends | | 6,332 | | | | 109,543 | |
Shares reacquired | | (1,529,879 | ) | | | (27,808,404 | ) |
| | | | | | | |
Net increase (decrease) in shares outstanding before conversion | | (866,295 | ) | | | (15,764,157 | ) |
Shares reacquired upon conversion into Class A | | (4,744,651 | ) | | | (87,747,613 | ) |
| | | | | | | |
Net increase (decrease) in shares outstanding | | (5,610,946 | ) | | $ | (103,511,770 | ) |
| | | | | | | |
Class C | | | | | | |
Ten-month period ended August 31, 2007: | | | | | | | |
Shares sold | | 408,595 | | | $ | 8,780,853 | |
Shares issued in connection with the merger | | 1,514,551 | | | | 31,036,065 | |
Shares issued in reinvestment of dividends and distributions | | 146,223 | | | | 2,958,100 | |
Shares reacquired | | (512,780 | ) | | | (11,178,671 | ) |
| | | | | | | |
Net increase (decrease) in shares outstanding | | 1,556,589 | | | $ | 31,596,347 | |
| | | | | | | |
Notes to Financial Statements
continued
| | | | | | | |
Class C | | Shares | | | Amount | |
Year ended October 31, 2006: | | | | | | | |
Shares sold | | 640,946 | | | $ | 13,451,472 | |
Shares issued in reinvestment of dividends and distributions | | 47,187 | | | | 923,919 | |
Shares reacquired | | (289,618 | ) | | | (6,006,912 | ) |
| | | | | | | |
Net increase (decrease) in shares outstanding | | 398,515 | | | $ | 8,368,479 | |
| | | | | | | |
Year ended October 31, 2005: | | | | | | | |
Shares sold | | 181,114 | | | $ | 3,316,652 | |
Shares issued in reinvestment of dividends | | 661 | | | | 11,439 | |
Shares reacquired | | (342,389 | ) | | | (6,303,904 | ) |
| | | | | | | |
Net increase (decrease) in shares outstanding | | (160,614 | ) | | $ | (2,975,813 | ) |
| | | | | | | |
Class L | | | | | | |
March 16, 2007* through August 31, 2007: | | | | | | | |
Shares sold | | 4,049 | | | $ | 86,210 | |
Shares issued in connection with the merger | | 284,025 | | | | 5,865,932 | |
Shares reacquired | | (44,334 | ) | | | (993,357 | ) |
| | | | | | | |
Net increase (decrease) in shares outstanding | | 243,740 | | | $ | 4,958,785 | |
| | | | | | | |
Class M | | | | | | |
March 16, 2007* through August 31, 2007: | | | | | | | |
Shares sold | | 32,745 | | | $ | 709,825 | |
Shares issued in connection with the merger | | 911,413 | | | | 18,673,645 | |
Shares reacquired | | (152,598 | ) | | | (3,395,448 | ) |
| | | | | | | |
Net increase (decrease) in shares outstanding before conversion | | 791,560 | | | | 15,988,022 | |
Shares reacquired upon conversion into Class A | | (82,905 | ) | | | (1,839,714 | ) |
| | | | | | | |
Net increase (decrease) in shares outstanding | | 708,655 | | | $ | 14,148,308 | |
| | | | | | | |
Class R | | | | | | |
Ten-month period ended August 31, 2007: | | | | | | | |
Shares sold | | 90,036 | | | $ | 1,970,956 | |
Shares issued in reinvestment of dividends and distributions | | 379 | | | | 7,717 | |
Shares reacquired | | (7,827 | ) | | | (172,132 | ) |
| | | | | | | |
Net increase (decrease) in shares outstanding | | 82,588 | | | $ | 1,806,541 | |
| | | | | | | |
Year ended October 31, 2006: | | | | | | | |
Shares sold | | 2,949 | | | $ | 63,162 | |
Shares issued in reinvestment of dividends and distributions | | — | ** | | | 3 | |
Shares reacquired | | (242 | ) | | | (4,980 | ) |
| | | | | | | |
Net increase (decrease) in shares outstanding | | 2,707 | | | $ | 58,185 | |
| | | | | | | |
| | |
| 38 | | Visit our website at www.jennisondryden.com |
| | | | | | | |
Class R | | Shares | | | Amount | |
June 3, 2005* through October 31, 2005: | | | | | | | |
Shares sold | | 139 | | | $ | 2,547 | |
Shares issued in reinvestment of dividends | | — | | | | | |
Shares reacquired | | — | | | | | |
| | | | | | | |
Net increase (decrease) in shares outstanding | | 139 | | | $ | 2,547 | |
| | | | | | | |
Class X | | | | | | |
March 16, 2007* through August 31, 2007: | | | | | | | |
Shares sold | | 13,800 | | | $ | 301,628 | |
Shares issued in connection with the merger | | 193,839 | | | | 3,971,514 | |
Shares reacquired | | (31,949 | ) | | | (699,454 | ) |
| | | | | | | |
Net increase (decrease) in shares outstanding before conversion | | 175,690 | | | | 3,573,688 | |
Shares reacquired upon conversion into Class A | | (1,446 | ) | | | (32,666 | ) |
| | | | | | | |
Net increase (decrease) in shares outstanding | | 174,244 | | | $ | 3,541,022 | |
| | | | | | | |
Class Z | | | | | | |
Ten-month period ended August 31, 2007: | | | | | | | |
Shares sold | | 1,634,144 | | | $ | 35,565,780 | |
Shares issued in reinvestment of dividends and distributions | | 501,829 | | | | 10,242,318 | |
Shares reacquired | | (1,436,065 | ) | | | (31,706,431 | ) |
| | | | | | | |
Net increase (decrease) in shares outstanding | | 699,908 | | | $ | 14,101,667 | |
| | | | | | | |
Year ended October 31, 2006: | | | | | | | |
Shares sold | | 2,294,435 | | | $ | 48,537,367 | |
Shares issued in reinvestment of dividends and distributions | | 125,136 | | | | 2,467,686 | |
Shares reacquired | | (440,315 | ) | | | (9,267,479 | ) |
| | | | | | | |
Net increase (decrease) in shares outstanding | | 1,979,256 | | | $ | 41,737,574 | |
| | | | | | | |
Year ended October 31, 2005: | | | | | | | |
Shares sold | | 895,343 | | | $ | 16,899,417 | |
Shares issued in reinvestment of dividends | | 17,585 | | | | 306,332 | |
Shares reacquired | | (396,913 | ) | | | (7,307,289 | ) |
| | | | | | | |
Net increase (decrease) in shares outstanding | | 516,015 | | | $ | 9,898,460 | |
| | | | | | | |
Notes to Financial Statements
continued
Note 7. Reorganization
On March 16, 2007, the Fund acquired all of the net assets of Strategic Partners Core Value Fund and Strategic Partners Large Capitalization Value Fund (the merged funds) pursuant to a plan of reorganization approved by the Strategic Partners Core Value Fund and Strategic Partners Large Capitalization Value Fund shareholders on December 14, 2006. The acquisition was accomplished by a tax-free issue of Class A, Class B, Class C, Class L, Class M and Class X shares for the corresponding classes of shares of Strategic Partners Core Value Fund and Strategic Partners Large Capitalization Value Fund. The following table shows the number of shares of the merged funds and how many shares they became in the Jennison Value Fund and the total value.
| | | | | | | | | |
Strategic Partners Core Value Fund | | Jennison Value Fund |
Class | | Shares | | Class | | Shares | | Value |
A | | 465,322 | | A | | 289,328 | | $ | 5,988,365 |
B | | 106,392 | | B | | 66,858 | | | 1,369,838 |
C | | 683,831 | | C | | 429,581 | | | 8,802,951 |
L | | 456,096 | | L | | 284,025 | | | 5,865,932 |
M | | 1,454,212 | | M | | 911,413 | | | 18,673,645 |
X | | 308,721 | | X | | 193,839 | | | 3,971,514 |
Strategic Partners Large Capitalization
Value Fund | | Jennison Value Fund |
Class | | Shares | | Class | | Shares | | Value |
A | | 3,013,804 | | A | | 1,942,739 | | $ | 40,209,861 |
B | | 1,543,177 | | B | | 981,134 | | | 20,102,120 |
C | | 1,706,263 | | C | | 1,084,970 | | | 22,233,114 |
The aggregate net assets and net unrealized appreciation/(depreciation) of the merged funds immediately before the acquisition were:
| | | | | | |
| | | Total
Net Assets | | Net Unrealized
Appreciation |
Strategic Partners Core Value Fund | | $ | 44,672,245 | | $ | 10,466,895 |
Strategic Partners Large Capitalization Value Fund | | | 82,545,095 | | | 14,505,336 |
The aggregate net assets of Jennison Value Fund immediately before the acquisition were $1,197,808,121.
| | |
| 40 | | Visit our website at www.jennisondryden.com |
Note 8. New Accounting Pronouncements
On July 13, 2006, the Financial Accounting Standards Board (FASB) released FASB Interpretation No. 48 “Accounting for Uncertainty in Income Taxes” (FIN 48). FIN 48 provides guidance for how uncertain tax positions should be recognized, measured, presented and disclosed in the financial statements. FIN 48 requires the evaluation of tax positions taken or expected to be taken in the course of preparing the Fund’s tax returns to determine whether the tax positions are “more-likely-than-not” of being sustained by the applicable tax authority. The impact of the tax positions not deemed to meet the more-likely-than-not threshold would be recorded in the year in which they arise. On December 22, 2006 the Securities and Exchange Commission delayed the effective date until the last net asset value calculation in the first required financial reporting period for its fiscal year beginning after December 15, 2006. The Fund’s financial statements have not been impacted by the adoption of FIN 48. However, the conclusions regarding FIN 48 may be subject to review and adjusted at a later date based on factors including, but not limited to, further implementation guidance expected from FASB and on-going analysis of tax laws, regulations and interpretations thereof.
On September 20, 2006, the FASB released Statement of Financial Accounting Standards No. 157 “Fair Value Measurements” (FAS 157). FAS 157 establishes an authoritative definition of fair value, sets out a framework for measuring fair value, and requires additional disclosures about fair-value measurements. The application of FAS 157 is required for fiscal years beginning after November 15, 2007 and interim periods within those fiscal years. At this time, management is evaluating the implications of FAS 157 and its impact, if any, in the financial statements has not yet been determined.
Financial Highlights
| | | | |
| | | Class A | |
| | | Ten-Month
Period Ended August 31, 2007(a)(c) | |
Per Share Operating Performance: | | | | |
Net Asset Value, Beginning of Period | | $ | 22.49 | |
| | | | |
Income (loss) from investment operations: | | | | |
Net investment income | | | .16 | |
Net realized and unrealized gain (loss) on investment transactions | | | 1.61 | |
| | | | |
Total from investment operations | | | 1.77 | |
| | | | |
Less Dividends and Distributions: | | | | |
Dividends from net investment income | | | (.19 | ) |
Distributions from net realized gains | | | (2.26 | ) |
| | | | |
Total dividends and distributions | | | (2.45 | ) |
| | | | |
Net asset value, end of period | | $ | 21.81 | |
| | | | |
Total Return(b): | | | 8.66 | % |
Ratios/Supplemental Data: | | | | |
Net assets, end of period (000) | | $ | 1,010,160 | |
Average net assets (000) | | $ | 1,028,798 | |
Ratios to average net assets: | | | | |
Expenses, including distribution and service (12b-1) fees(d) | | | .95 | %(e) |
Expenses, excluding distribution and service (12b-1) fees | | | .70 | %(e) |
Net investment income | | | .90 | %(e) |
For Class A, B, C, L, M, R, X and Z shares: | | | | |
Portfolio turnover rate | | | 55 | %(f) |
| (a) | Calculated based upon average shares outstanding during the period. |
| (b) | Total return does not consider the effects of sales loads. Total return is calculated assuming a purchase of a share on the first day and a sale on the last day of each period reported, and includes reinvestment of dividends and distributions. Total investment returns may reflect adjustments to conform to generally accepted accounting principles. Total returns for periods less than a full year are not annualized. |
| (c) | For the ten-month period ended August 31, 2007. The Fund changed it’s fiscal year end from October 31 to August 31, effective August 31, 2007. |
| (d) | The distributor of the Fund has contractually agreed to limit its distribution and service (12b-1) fees to .25 of 1% of the average daily net assets of the Class A shares. |
See Notes to Financial Statements.
| | |
| 42 | | Visit our website at www.jennisondryden.com |
| | | | | | | | | | | | | | | | | | |
|
| Class A | |
| Year Ended October 31, | |
| 2006(a) | | | 2005(a) | | | 2004(a) | | | 2003(a) | | | 2002(a) | |
| | | | | | | | | | | | | | | | | | |
| $ | 19.77 | | | $ | 16.71 | | | $ | 14.50 | | | $ | 12.17 | | | $ | 16.09 | |
| | | | | | | | | | | | | | | | | | | |
| | | | | | | | | | | | | | | | | | |
| | .22 | | | | .14 | | | | .11 | | | | .11 | | | | .11 | |
| | 3.56 | | | | 3.07 | | | | 2.22 | | | | 2.31 | | | | (2.43 | ) |
| | | | | | | | | | | | | | | | | | | |
| | 3.78 | | | | 3.21 | | | | 2.33 | | | | 2.42 | | | | (2.32 | ) |
| | | | | | | | | | | | | | | | | | | |
| | | | | | | | | | | | | | | | | | |
| | (.14 | ) | | | (.15 | ) | | | (.12 | ) | | | (.09 | ) | | | (.10 | ) |
| | (.92 | ) | | | — | | | | — | | | | — | | | | (1.50 | ) |
| | | | | | | | | | | | | | | | | | | |
| | (1.06 | ) | | | (.15 | ) | | | (.12 | ) | | | (.09 | ) | | | (1.60 | ) |
| | | | | | | | | | | | | | | | | | | |
| $ | 22.49 | | | $ | 19.77 | | | $ | 16.71 | | | $ | 14.50 | | | $ | 12.17 | |
| | | | | | | | | | | | | | | | | | | |
| | 19.85 | % | | | 19.31 | % | | | 16.21 | % | | | 19.97 | % | | | (16.56 | )% |
| | | | | | | | | | | | | | | | | | |
| $ | 946,315 | | | $ | 771,540 | | | $ | 610,345 | | | $ | 559,230 | | | $ | 516,702 | |
| $ | 872,078 | | | $ | 699,013 | | | $ | 598,375 | | | $ | 529,960 | | | $ | 657,772 | |
| | | | | | | | | | | | | | | | | | |
| | .98 | % | | | 1.04 | % | | | 1.07 | % | | | 1.12 | % | | | 1.04 | % |
| | .73 | % | | | .79 | % | | | .82 | % | | | .87 | % | | | .79 | % |
| | 1.05 | % | | | .77 | % | | | .68 | % | | | .88 | % | | | .74 | % |
| | | | | | | | | | | | | | | | | | |
| | 49 | % | | | 56 | % | | | 56 | % | | | 97 | % | | | 72 | % |
See Notes to Financial Statements.
Financial Highlights
continued
| | | | |
| | | Class B | |
| | | Ten-Month Period Ended
August 31, 2007(a)(c) | |
Per Share Operating Performance: | | | | |
Net Asset Value, Beginning of Period | | $ | 22.18 | |
| | | | |
Income (loss) from investment operations: | | | | |
Net investment income (loss) | | | .03 | |
Net realized and unrealized gain (loss) on investment transactions | | | 1.60 | |
| | | | |
Total from investment operations | | | 1.63 | |
| | | | |
Less Dividends and Distributions: | | | | |
Dividends from net investment income | | | (.03 | ) |
Distributions from net realized gains | | | (2.26 | ) |
| | | | |
Total dividends and distributions | | | (2.29 | ) |
| | | | |
Net asset value, end of period | | $ | 21.52 | |
| | | | |
Total Return(d): | | | 8.02 | % |
Ratios/Supplemental Data: | | | | |
Net assets, end of period (000) | | $ | 112,108 | |
Average net assets (000) | | $ | 112,785 | |
Ratios to average net assets: | | | | |
Expenses, including distribution and service (12b-1) fees | | | 1.70 | %(e) |
Expenses, excluding distribution and service (12b-1) fees | | | .70 | %(e) |
Net investment income (loss) | | | .15 | %(e) |
| (a) | Calculated based upon average shares outstanding during the period. |
| (b) | Less than $.005 per share. |
| (c) | For the ten-month period ended August 31, 2007. The Fund changed it’s fiscal year end from October 31 to August 31, effective August 31, 2007. |
| (d) | Total return does not consider the effects of sales loads. Total return is calculated assuming a purchase of a share on the first day and a sale on the last day of each period reported, and includes reinvestment of dividends and distributions. Total investment returns may reflect adjustments to conform to generally accepted accounting principles. Total returns for periods less than a full year are not annualized. |
See Notes to Financial Statements.
| | |
| 44 | | Visit our website at www.jennisondryden.com |
| | | | | | | | | | | | | | | | | | |
| Class B | |
| Year Ended October 31, | |
| | | | |
| 2006(a) | | | 2005(a) | | | 2004(a) | | | 2003(a) | | | 2002(a) | |
| | | | | | | | | | | | | | | | | | |
| $ | 19.52 | | | $ | 16.49 | | | $ | 14.31 | | | $ | 12.02 | | | $ | 15.92 | |
| | | | | | | | | | | | | | | | | | | |
| | | | | | | | | | | | | | | | | | |
| | .07 | | | | .02 | | | | (.01 | ) | | | .02 | | | | — | (b) |
| | 3.51 | | | | 3.02 | | | | 2.20 | | | | 2.27 | | | | (2.40 | ) |
| | | | | | | | | | | | | | | | | | | |
| | 3.58 | | | | 3.04 | | | | 2.19 | | | | 2.29 | | | | (2.40 | ) |
| | | | | | | | | | | | | | | | | | | |
| | | | | | | | | | | | | | | | | | |
| | — | | | | (.01 | ) | | | (.01 | ) | | | — | | | | — | |
| | (.92 | ) | | | — | | | | — | | | | — | | | | (1.50 | ) |
| | | | | | | | | | | | | | | | | | | |
| | (.92 | ) | | | (.01 | ) | | | (.01 | ) | | | — | | | | (1.50 | ) |
| | | | | | | | | | | | | | | | | | | |
| $ | 22.18 | | | $ | 19.52 | | | $ | 16.49 | | | $ | 14.31 | | | $ | 12.02 | |
| | | | | | | | | | | | | | | | | | | |
| | 18.96 | % | | | 18.44 | % | | | 15.34 | % | | | 19.05 | % | | | (17.21 | )% |
| | | | | | | | | | | | | | | | | | |
| $ | 105,824 | | | $ | 119,151 | | | $ | 193,230 | | | $ | 215,039 | | | $ | 241,923 | |
| $ | 112,070 | | | $ | 161,840 | | | $ | 212,833 | | | $ | 221,850 | | | $ | 347,114 | |
| | | | | | | | | | | | | | | | | | |
| | 1.73 | % | | | 1.79 | % | | | 1.82 | % | | | 1.87 | % | | | 1.79 | % |
| | .73 | % | | | .79 | % | | | .82 | % | | | .87 | % | | | .79 | % |
| | .32 | % | | | .04 | % | | | (.06 | )% | | | .13 | % | | | (.01 | )% |
See Notes to Financial Statements.
Financial Highlights
continued
| | | | |
| | | Class C | |
| | | Ten-Month Period Ended
August 31, 2007(a)(c) | |
Per Share Operating Performance: | | | | |
Net Asset Value, Beginning of Period | | $ | 22.19 | |
| | | | |
Income (loss) from investment operations: | | | | |
Net investment income (loss) | | | .02 | |
Net realized and unrealized gain (loss) on investment transactions | | | 1.60 | |
| | | | |
Total from investment operations | | | 1.62 | |
| | | | |
Less Dividends and Distributions: | | | | |
Dividends from net investment income | | | (.03 | ) |
Distributions from net realized gains | | | (2.26 | ) |
| | | | |
Total dividends and distributions | | | (2.29 | ) |
| | | | |
Net asset value, end of period | | $ | 21.52 | |
| | | | |
Total Return(d): | | | 7.98 | % |
Ratios/Supplemental Data: | | | | |
Net assets, end of period (000) | | $ | 64,731 | |
Average net assets (000) | | $ | 52,776 | |
Ratios to average net assets: | | | | |
Expenses, including distribution and service (12b-1) fees | | | 1.70 | %(e) |
Expenses, excluding distribution and service (12b-1) fees | | | .70 | %(e) |
Net investment income (loss) | | | .11 | %(e) |
| (a) | Calculated based upon average shares outstanding during the period. |
| (b) | Less than $.005 per share. |
| (c) | For the ten-month period ended August 31, 2007. The Fund changed it’s fiscal year end from October 31 to August 31, effective August 31, 2007. |
| (d) | Total return does not consider the effects of sales loads. Total return is calculated assuming a purchase of a share on the first day and a sale on the last day of each period reported, and includes reinvestment of dividends and distributions. Total investment returns may reflect adjustments to conform to generally accepted accounting principles. Total returns for periods less than a full year are not annualized. |
See Notes to Financial Statements.
| | |
| 46 | | Visit our website at www.jennisondryden.com |
| | | | | | | | | | | | | | | | | | |
| Class C | |
| Year Ended October 31, | |
| | | | |
| 2006(a) | | | 2005(a) | | | 2004(a) | | | 2003(a) | | | 2002(a) | |
| | | | | | | | | | | | | | | | | | |
| $ | 19.52 | | | $ | 16.49 | | | $ | 14.31 | | | $ | 12.02 | | | $ | 15.92 | |
| | | | | | | | | | | | | | | | | | | |
| | | | | | | | | | | | | | | | | | |
| | .06 | | | | .01 | | | | (.01 | ) | | | .02 | | | | — | (b) |
| | 3.53 | | | | 3.03 | | | | 2.20 | | | | 2.27 | | | | (2.40 | ) |
| | | | | | | | | | | | | | | | | | | |
| | 3.59 | | | | 3.04 | | | | 2.19 | | | | 2.29 | | | | (2.40 | ) |
| | | | | | | | | | | | | | | | | | | |
| | | | | | | | | | | | | | | | | | |
| | — | | | | (.01 | ) | | | (.01 | ) | | | — | | | | — | |
| | (.92 | ) | | | — | | | | — | | | | — | | | | (1.50 | ) |
| | | | | | | | | | | | | | | | | | | |
| | (.92 | ) | | | (.01 | ) | | | (.01 | ) | | | — | | | | (1.50 | ) |
| | | | | | | | | | | | | | | | | | | |
| $ | 22.19 | | | $ | 19.52 | | | $ | 16.49 | | | $ | 14.31 | | | $ | 12.02 | |
| | | | | | | | | | | | | | | | | | | |
| | 18.95 | % | | | 18.44 | % | | | 15.34 | % | | | 19.05 | % | | | (17.21 | )% |
| | | | | | | | | | | | | | | | | | |
| $ | 32,189 | | | $ | 20,540 | | | $ | 20,006 | | | $ | 21,268 | | | $ | 22,728 | |
| $ | 24,812 | | | $ | 20,814 | | | $ | 21,130 | | | $ | 22,008 | | | $ | 29,071 | |
| | | | | | | | | | | | | | | | | | |
| | 1.73 | % | | | 1.79 | % | | | 1.82 | % | | | 1.87 | % | | | 1.79 | % |
| | .73 | % | | | .79 | % | | | .82 | % | | | .87 | % | | | .79 | % |
| | .29 | % | | | .05 | % | | | (.07 | )% | | | .13 | % | | | — | (f) |
See Notes to Financial Statements.
Financial Highlights
continued
| | | | |
| | | Class L | |
| | | March 16, 2007(a)
Through
August 31, 2007(b)(c) | |
Per Share Operating Performance: | | | | |
Net Asset Value, Beginning of Period | | $ | 20.65 | |
| | | | |
Income from investment operations: | | | | |
Net investment income | | | .05 | |
Net realized and unrealized gain on investment transactions | | | 1.04 | |
| | | | |
Total from investment operations | | | 1.09 | |
| | | | |
Net asset value, end of period | | $ | 21.74 | |
| | | | |
Total Return(d): | | | 5.28 | % |
Ratios/Supplemental Data: | | | | |
Net assets, end of period (000) | | $ | 5,299 | |
Average net assets (000) | | $ | 3,274 | |
Ratios to average net assets: | | | | |
Expenses, including distribution and service (12b-1) fees | | | 1.20 | %(e) |
Expenses, excluding distribution and service (12b-1) fees | | | .70 | %(e) |
Net investment income | | | .51 | %(e) |
| (a) | Inception date of Class L shares. |
| (b) | Calculated based upon average shares outstanding during the period. |
| (c) | For the period ended August 31, 2007. The Fund changed it’s fiscal year end from October 31 to August 31, effective August 31, 2007. |
| (d) | Total return does not consider the effects of sales loads. Total return is calculated assuming a purchase of a share on the first day and a sale on the last day of each period reported, and includes reinvestment of dividends and distributions. Total investment returns may reflect adjustments to conform to generally accepted accounting principles. Total returns for periods less than a full year are not annualized. |
See Notes to Financial Statements.
| | |
| 48 | | Visit our website at www.jennisondryden.com |
| | | | |
| | | Class M | |
| | | March 16, 2007(a)
Through
August 31, 2007(b)(c) | |
Per Share Operating Performance: | | | | |
Net Asset Value, Beginning of Period | | $ | 20.49 | |
| | | | |
Income from investment operations | | | | |
Net investment income | | | — | (e) |
Net realized and unrealized gain on investment transactions | | | 1.04 | |
| | | | |
Total from investment operations | | | 1.04 | |
| | | | |
Net asset value, end of period | | $ | 21.53 | |
| | | | |
Total Return(d): | | | 5.08 | % |
Ratios/Supplemental Data: | | | | |
Net assets, end of period (000) | | $ | 15,256 | |
Average net assets (000) | | $ | 9,920 | |
Ratios to average net assets: | | | | |
Expenses, including distribution and service (12b-1) fees | | | 1.70 | %(f) |
Expenses, excluding distribution and service (12b-1) fees | | | .70 | %(f) |
Net investment income | | | .01 | %(f) |
| (a) | Inception date of Class M shares. |
| (b) | Calculated based upon average shares outstanding during the period. |
| (c) | For the period ended August 31, 2007. The Fund changed it’s fiscal year end from October 31 to August 31, effective August 31, 2007. |
| (d) | Total return does not consider the effects of sales loads. Total return is calculated assuming a purchase of a share on the first day and a sale on the last day of each period reported, and includes reinvestment of dividends and distributions. Total investment returns may reflect adjustments to conform to generally accepted accounting principles. Total returns for periods less than a full year are not annualized. |
| (e) | Less than $.005 per share. |
See Notes to Financial Statements.
Financial Highlights
continued
| | | | |
| | | Class R | |
| | | Ten-Month
Period Ended
August 31, 2007(b)(c) | |
Per Share Operating Performance: | | | | |
Net Asset Value, Beginning of Period | | $ | 22.39 | |
| | | | |
Income from investment operations: | | | | |
Net investment income | | | .05 | |
Net realized and unrealized gain on investment transactions | | | 1.69 | |
| | | | |
Total from investment operations | | | 1.74 | |
| | | | |
Less Dividends and Distributions: | | | | |
Dividends from net investment income | | | (.12 | ) |
Distributions from net realized gains | | | (2.26 | ) |
| | | | |
Total dividends and distributions | | | (2.38 | ) |
| | | | |
Net asset value, end of period | | $ | 21.75 | |
| | | | |
Total Return(d): | | | 8.44 | % |
Ratios/Supplemental Data: | | | | |
Net assets, end of period (000) | | $ | 1,858 | |
Average net assets (000) | | $ | 685 | |
Ratios to average net assets: | | | | |
Expenses, including distribution and service (12b-1) fees(e) | | | 1.20 | %(f) |
Expenses, excluding distribution and service (12b-1) fees | | | .70 | %(f) |
Net investment income | | | .62 | %(f) |
| (a) | Inception date of Class R shares. |
| (b) | Calculated based upon average shares outstanding during the period. |
| (c) | For the ten-month period ended August 31, 2007. The Fund changed it’s fiscal year end from October 31 to August 31, effective August 31, 2007. |
| (d) | Total return is calculated assuming a purchase of a share on the first day and a sale on the last day of each period reported, and includes reinvestment of dividends and distributions. Total investment returns may reflect adjustments to conform to generally accepted accounting principles. Total returns for periods less than a full year are not annualized. |
| (e) | The distributor of the Fund has contractually agreed to limit its distribution and service (12b-1) fees to .50 of 1% of the average daily net assets of the Class R shares. |
See Notes to Financial Statements.
| | |
| 50 | | Visit our website at www.jennisondryden.com |
| | | | | | |
| Class R | |
Year Ended
October 31, 2006(b) | | | June 3, 2005(a)
Through
October 31, 2005(b) | |
| | | | | | |
| $ | 19.74 | | | $ | 18.31 | |
| | | | | | | |
| | | | | | |
| | .13 | | | | .01 | |
| | 3.53 | | | | 1.42 | |
| | | | | | | |
| | 3.66 | | | | 1.43 | |
| | | | | | | |
| | | | | | |
| | (.09 | ) | | | — | |
| | (.92 | ) | | | — | |
| | | | | | | |
| | (1.01 | ) | | | — | |
| | | | | | | |
| $ | 22.39 | | | $ | 19.74 | |
| | | | | | | |
| | 19.21 | % | | | 7.81 | % |
| | | | | | |
| $ | 64 | | | $ | 3 | |
| $ | 21 | | | $ | 3 | |
| | | | | | |
| | 1.23 | % | | | 1.29 | %(f) |
| | .73 | % | | | .79 | %(f) |
| | .61 | % | | | .19 | %(f) |
See Notes to Financial Statements.
Financial Highlights
continued
| | | | |
| | | Class X | |
| | | March 16, 2007(a)
Through
August 31, 2007(b)(c) | |
Per Share Operating Performance: | | | | |
Net Asset Value, Beginning of Period | | $ | 20.49 | |
| | | | |
Income from investment operations | | | | |
Net investment loss | | | — | (e) |
Net realized and unrealized gain on investment transactions | | | 1.03 | |
| | | | |
Total from investment operations | | | 1.03 | |
| | | | |
Less Dividends and Distributions: | | | | |
Net asset value, end of period | | $ | 21.52 | |
| | | | |
Total Return(d): | | | 5.03 | % |
Ratios/Supplemental Data: | | | | |
Net assets, end of period (000) | | $ | 3,749 | |
Average net assets (000) | | $ | 2,334 | |
Ratios to average net assets: | | | | |
Expenses, including distribution and service (12b-1) fees | | | 1.70 | %(f) |
Expenses, excluding distribution and service (12b-1) fees | | | .70 | %(f) |
Net investment income | | | .02 | %(f) |
| (a) | Inception date of Class X shares. |
| (b) | Calculated based upon average shares outstanding during the period. |
| (c) | For the period ended August 31, 2007. The Fund changed it’s fiscal year end from October 31 to August 31, effective August 31, 2007. |
| (d) | Total return does not consider the effects of sales loads. Total return is calculated assuming a purchase of a share on the first day and a sale on the last day of each period reported, and includes reinvestment of dividends and distributions. Total investment returns may reflect adjustments to conform to generally accepted accounting principles. Total returns for periods less than a full year are not annualized. |
| (e) | Less than $.005 per share. |
See Notes to Financial Statements.
| | |
| 52 | | Visit our website at www.jennisondryden.com |
This Page Intentionally Left Blank
Financial Highlights
continued
| | | | |
| | | Class Z | |
| | | Ten-Month
Period Ended
August 31, 2007(a)(c) | |
Per Share Operating Performance: | | | | |
Net Asset Value, Beginning of Period | | $ | 22.56 | |
| | | | |
Income (loss) from investment operations: | | | | |
Net investment income | | | .23 | |
Net realized and unrealized gain (loss) on investment transactions | | | 1.60 | |
| | | | |
Total from investment operations | | | 1.83 | |
| | | | |
Less Dividends and Distributions: | | | | |
Dividends from net investment income | | | (.25 | ) |
Distributions from net realized gains | | | (2.26 | ) |
| | | | |
Total dividends and distributions | | | (2.51 | ) |
| | | | |
Net asset value, end of period | | $ | 21.88 | |
| | | | |
Total Return(b): | | | 8.91 | % |
Ratios/Supplemental Data: | | | | |
Net assets, end of period (000) | | $ | 104,793 | |
Average net assets (000) | | $ | 105,962 | |
Ratios to average net assets: | | | | |
Expenses, including distribution and service (12b-1) fees | | | .70 | %(d) |
Expenses, excluding distribution and service (12b-1) fees | | | .70 | %(d) |
Net investment income | | | 1.16 | %(d) |
| (a) | Calculated based upon average shares outstanding during the period. |
| (b) | Total return is calculated assuming a purchase of a share on the first day and a sale on the last day of each year reported, and includes reinvestment of dividends and distributions. Total investment returns may reflect adjustments to conform to generally accepted accounting principles. Total returns for periods less than a full year are not annualized. |
| (c) | For the ten-month period ended August 31, 2007. The Fund changed it’s fiscal year end from October 31 to August 31, effective August 31, 2007. |
See Notes to Financial Statements.
| | |
| 54 | | Visit our website at www.jennisondryden.com |
| | | | | | | | | | | | | | | | | | |
| Class Z | |
| Year Ended October 31, | |
| | | | |
| 2006(a) | | | 2005(a) | | | 2004(a) | | | 2003(a) | | | 2002(a) | |
| | | | | | | | | | | | | | | | | | |
| $ | 19.83 | | | $ | 16.76 | | | $ | 14.54 | | | $ | 12.21 | | | $ | 16.14 | |
| | | | | | | | | | | | | | | | | | | |
| | | | | | | | | | | | | | | | | | |
| | .27 | | | | .19 | | | | .15 | | | | .15 | | | | .14 | |
| | 3.57 | | | | 3.07 | | | | 2.23 | | | | 2.30 | | | | (2.43 | ) |
| | | | | | | | | | | | | | | | | | | |
| | 3.84 | | | | 3.26 | | | | 2.38 | | | | 2.45 | | | | (2.29 | ) |
| | | | | | | | | | | | | | | | | | | |
| | | | | | | | | | | | | | | | | | |
| | (.19 | ) | | | (.19 | ) | | | (.16 | ) | | | (.12 | ) | | | (.14 | ) |
| | (.92 | ) | | | — | | | | — | | | | — | | | | (1.50 | ) |
| | | | | | | | | | | | | | | | | | | |
| | (1.11 | ) | | | (.19 | ) | | | (.16 | ) | | | (.12 | ) | | | (1.64 | ) |
| | | | | | | | | | | | | | | | | | | |
| $ | 22.56 | | | $ | 19.83 | | | $ | 16.76 | | | $ | 14.54 | | | $ | 12.21 | |
| | | | | | | | | | | | | | | | | | | |
| | 20.15 | % | | | 19.59 | % | | | 16.49 | % | | | 20.26 | % | | | (16.34 | )% |
| | | | | | | | | | | | | | | | | | |
| $ | 92,267 | | | $ | 41,856 | | | $ | 26,725 | | | $ | 32,340 | | | $ | 31,300 | |
| $ | 65,638 | | | $ | 32,824 | | | $ | 25,857 | | | $ | 31,275 | | | $ | 58,256 | |
| | | | | | | | | | | | | | | | | | |
| | .73 | % | | | .79 | % | | | .82 | % | | | .87 | % | | | .79 | % |
| | .73 | % | | | .79 | % | | | .82 | % | | | .87 | % | | | .79 | % |
| | 1.28 | % | | | 1.00 | % | | | .93 | % | | | 1.13 | % | | | .98 | % |
See Notes to Financial Statements.
Report of Independent Registered Public
Accounting Firm
The Board of Trustees and Shareholders of
Jennison Value Fund:
We have audited the accompanying statement of assets and liabilities of the Jennison Value Fund (hereafter referred to as the “Fund”), including the portfolio of investments, as of August 31, 2007, and the related statement of operations for the period ended August 31, 2007 and the year ended October 31, 2006, the statement of changes in net assets for the period ended August 31, 2007 and each of the years in the two-year period ended October 31, 2006 and the financial highlights for the period ended August 31, 2007 and each of the years in the three-year period ended October 31, 2006. These financial statements and financial highlights are the responsibility of the Fund’s management. Our responsibility is to express an opinion on these financial statements and financial highlights based on our audits. The financial highlights for the years presented prior to the year ended October 31, 2004 were audited by another independent registered public accounting firm, whose report dated December 22, 2003, expressed an unqualified opinion thereon.
We conducted our audits in accordance with the standards of the Public Company Accounting Oversight Board (United States). Those standards require that we plan and perform the audit to obtain reasonable assurance about whether the financial statements and financial highlights are free of material misstatement. An audit includes examining, on a test basis, evidence supporting the amounts and disclosures in the financial statements. Our procedures included confirmation of securities owned as of August 31, 2007, by correspondence with the custodian and brokers or by other appropriate auditing procedures where replies from brokers were not received. An audit also includes assessing the accounting principles used and significant estimates made by management, as well as evaluating the overall financial statement presentation. We believe that our audits provide a reasonable basis for our opinion.
In our opinion, the financial statements and financial highlights referred to above present fairly, in all material respects, the financial position of the Fund as of August 31, 2007, and the results of its operations for the period ended August 31, 2007 and the year ended October 31, 2006, the changes in its net assets for the period ended August 31, 2007 and each of the years in the two-year period ended October 31, 2006 and the financial highlights for the period ended August 31, 2007 and each of the years in the three-year period ended October 31, 2006, in conformity with U.S. generally accepted accounting principles.

New York, New York
October 26, 2007
| | |
| 56 | | Visit our website at www.jennisondryden.com |
Tax Information
(Unaudited)
We are required by the Internal Revenue Code to advise you within 60 days of the Fund’s ten-month period ended August 31, 2007 as to the federal income tax status of dividends and distributions paid by the Fund during such period. Accordingly, we are advising you that during its ten-month period ended August 31, 2007, the Fund paid dividends for Class A, Class B, Class C, Class R and Class Z shares of $0.1943 per share, $0.0309 per share, $0.0309 per share, $0.1161 per share and $0.2478 per share, respectively, from net investment income and $0.3707 per share of short-term capital gains for Class A, Class B, Class C, Class R and Class Z shares which are taxable as ordinary income. Additionally, the Fund paid $1.8919 per share of long-term capital gains for Class A, Class B, Class C, Class R and Class Z shares which are taxable as such.
As required by the Internal Revenue Code, the following percentages of ordinary income dividends paid for the ten-month period ended August 31, 2007 have been designated as 1) Qualified for the reduced tax rate (QDI) under The Job and Growth Tax Relief Reconciliation Act of 2003 2) dividends received deduction (DRD) eligible for corporate shareholders 3) qualified interest income (QII) dividends under The American Jobs Creation Act of 2004 and 4) qualified short-term capital gain (QSTCG) dividends under The American Jobs Creation Act of 2004:
| | | | | | | | | | | | |
| | | QDI(1) | | | DRD(2) | | | QII(3) | | | QSTCG(4) | |
Jennison Value Fund | | 66.75 | % | | 66.06 | % | | 0.00 | % | | 100 | % |
In January 2008, you will be advised on IRS 1099DIV or substitute Form 1099, as to the Federal tax status of the distributions received by you in calendar year 2007.
For more detailed information regarding your state and local taxes, you should contact your tax advisor or the state/local taxing authorities.
Management of the Fund
(Unaudited)
Information pertaining to the Trustees of the Jennison Value Fund (the “Fund”) is set forth below. Trustees who are not deemed to be “interested persons” of the Fund, as defined in the Investment Company Act of 1940 (the 1940 Act), are referred to as “Independent Trustees.” Trustees who are deemed to be “interested persons” of the Fund are referred to as “Interested Trustees.” “Fund Complex”† consists of the Fund and any other investment companies managed by PI.
Independent Trustees(2)
Linda W. Bynoe (55), Trustee since 2005(3) Oversees 60 portfolios in Fund complex
Principal occupations (last 5 years): President and Chief Executive Officer (since March 1995) of Telemat, Ltd. (management consulting); formerly Vice President at Morgan Stanley & Co.
Other Directorships held: Director of Simon Property Group, Inc. (real estate investment trust) (since May 2003); Anixter International (communication products distributor) (since January 2006); Director of Northern Trust Corporation (since April 2006).
David E.A. Carson (73), Trustee since 2003(3) Oversees 64 portfolios in Fund complex
Principal occupations (last 5 years): Formerly Director (January 2000-May 2000), Chairman (January 1999-December 1999), Chairman and Chief Executive Officer (January 1998-December 1998) and President, Chairman and Chief Executive Officer of People’s Bank (1983-1997).
Robert E. La Blanc (73), Trustee since 2003(3) Oversees 62 portfolios in Fund complex
Principal occupations (last 5 years): President (since 1981) of Robert E. La Blanc Associates, Inc. (telecommunications).
Other Directorships held:(4) Director of CA, Inc. (since 2002) (software company); FiberNet Telecom Group, Inc. (since 2003) (telecom company).
Douglas H. McCorkindale (68), Trustee since 1987(3) Oversees 60 portfolios in Fund complex
Principal occupations (last 5 years): Formerly Chairman (February 2001-June 2006), Chief Executive Officer (June 2000-July 2005), President (September 1997-July 2005) and Vice Chairman (March 1984-May 2000) of Gannett Co. Inc. (publishing and media).
Other Directorships held:(4) Director of Continental Airlines, Inc. (since May 1993); Director of Lockheed Martin Corp. (aerospace and defense) (since May 2001).
Richard A. Redeker (64), Trustee since 1995(3) Oversees 61 portfolios in Fund complex
Principal occupations (last 5 years): Management Consultant; Director (since 2001) and Chairman of the Board (since 2006) of Invesmart, Inc.; Director of Penn Tank Lines, Inc. (since 1999).
Robin B. Smith (67), Trustee since 1996(3) Oversees 62 portfolios in Fund complex
Principal occupations (last 5 years): Chairman of the Board (since January 2003) of Publishers Clearing House (direct marketing); formerly Chairman and Chief Executive Officer (August 1996-January 2003) of Publishers Clearing House.
Other Directorships held:(4) Formerly Director of BellSouth Corporation (1992-2006).
| | |
| 58 | | Visit our website at www.jennisondryden.com |
Stephen G. Stoneburn (64), Trustee since 2003(3) Oversees 62 portfolios in Fund complex
Principal occupations (last 5 years): President and Chief Executive Officer (since June 1996) of Quadrant Media Corp. (publishing company); formerly President (June 1995-June 1996) of Argus Integrated Media, Inc.; Senior Vice President and Managing Director (January 1993-1995) of Cowles Business Media; Senior Vice President of Fairchild Publications, Inc. (1975-1989).
Clay T. Whitehead (68), Trustee since 1996(3) Oversees 62 portfolios in Fund complex
Principal occupations (last 5 years): President (since 1983) of YCO (new business development firm).
Interested Trustees(1)
Judy A. Rice (59), President since 2003 and Trustee since 2000(3) Oversees 61 portfolios in Fund complex
Principal occupations (last 5 years): President, Chief Executive Officer, Chief Operating Officer and Officer-In-Charge (since February 2003) of Prudential Investments LLC; Vice President (since February 1999) of Prudential Investment Management Services LLC; President, Chief Executive Officer and Officer-In-Charge (since April 2003) of Prudential Mutual Fund Services LLC; formerly Director (May 2003-March 2006) and Executive Vice President (June 2005-March 2006) of AST Investment Services, Inc.; formerly Executive Vice President (September 1999-February 2003) of Prudential Investments LLC; Member of Board of Governors of the Investment Company Institute.
Robert F. Gunia (60), Vice President since 1999 and Trustee since 1996(3) Oversees 141 portfolios in Fund complex
Principal occupations (last 5 years): Chief Administrative Officer (since September 1999) and Executive Vice President (since December 1996) of Prudential Investments LLC; President (since April 1999) of Prudential Investment Management Services LLC; Executive Vice President (since March 1999) and Treasurer (since May 2000) of Prudential Mutual Fund Services LLC; Chief Administrative Officer, Executive Vice President and Director (since May 2003) of AST Investment Services, Inc.
Other Directorships held:(4) Vice President and Director (since May 1989) and Treasurer (since 1999) of The Asia Pacific Fund, Inc.
Information pertaining to the Officers of the Fund who are not also Trustees is set forth below.
Officers(2)
Kathryn L. Quirk (54), Chief Legal Officer since 2005(3)
Principal occupations (last 5 years): Vice President and Corporate Counsel (since September 2004) of Prudential; Executive Vice President, Chief Legal Officer and Secretary (since July 2005) of Prudential Investments LLC and Prudential Mutual Fund Services LLC; formerly Managing Director, General Counsel, Chief Compliance Officer, Chief Risk Officer and Corporate Secretary (1997-2002) of Zurich Scudder Investments, Inc.
Deborah A. Docs (49), Secretary since 2005(3)
Principal occupations (last 5 years): Vice President and Corporate Counsel (since January 2001) of Prudential; Vice President (since December 1996) and Assistant Secretary (since March 1999) of PI; formerly Vice President and Assistant Secretary (May 2003-June 2005) of AST Investment Services, Inc.
Jonathan D. Shain (49), Assistant Secretary since 2005(3)
Principal occupations (last 5 years): Vice President and Corporate Counsel (since August 1998) of Prudential; Vice President and Assistant Secretary (since May 2001) of PI; Vice President and Assistant Secretary (since February 2001) of PMFS; formerly Vice President and Assistant Secretary (May 2003-June 2005) of AST Investment Services, Inc.
Claudia DiGiacomo (32), Assistant Secretary since 2005(3)
Principal occupations (last 5 years): Vice President and Corporate Counsel (since January 2005) of Prudential; Vice President and Assistant Secretary of PI (since December 2005); Associate at Sidley Austin Brown Wood LLP (1999-2004).
Timothy J. Knierim (48), Chief Compliance Officer since 2007(3)
Principal occupations (last 5 years): Chief Compliance Officer of Prudential Investment Management, Inc. (since July 2007); formerly Chief Risk Officer of PIM and PI (2002-2007) and formerly Chief Ethics Officer of PIM and PI (2006-2007).
Valerie M. Simpson (49), Deputy Chief Compliance Officer of the Retail Funds since 2007(3)
Principal occupations (last 5 years): Vice President and Senior Compliance Officer (since March 2006) of PI; Vice President-Financial Reporting (since March 2006) for Prudential Life and Annuities Finance.
Grace C. Torres (48), Treasurer and Principal Financial and Accounting Officer since 1997(3)
Principal occupations (last 5 years): Assistant Treasurer (since March 1999) and Senior Vice President (since September 1999) of PI; Assistant Treasurer (since May 2003) and Vice President (since June 2005) of AST Investment Services, Inc.; Senior Vice President and Assistant Treasurer (since May 2003) of Prudential Annuities Advisory Services, Inc.; formerly Senior Vice President (May 2003-June 2005) of AST Investment Services, Inc.
John P. Schwartz (36), Assistant Secretary since 2006(3)
Principal occupations (last 5 years): Vice President and Corporate Counsel (since April 2005) of Prudential; Vice President and Assistant Secretary of PI (since December 2005); Associate at Sidley, Austin Brown & Wood LLP (1997-2005).
M. Sadiq Peshimam (43), Assistant Treasurer since 2006(3)
Principal occupations (last 5 years): Vice President (since 2005) and Director (2000-2005) within Prudential Mutual Fund Administration.
Peter Parella (49), Assistant Treasurer since 2007(3)
Principal occupations (last 5 years): Vice President (since June 2007) within Prudential Mutual Fund Administration; formerly Tax Manager at SSB Citi Fund Management LLC (1997-2004).
Andrew R. French (44), Assistant Secretary since 2006(3)
Principal occupations (last 5 years): Director and Corporate Counsel (since May 2006) of Prudential; Vice President and Assistant Secretary (since January 2007) of PI; Vice President and Assistant Secretary (since January 2007) of PMFS; formerly Senior Legal Analyst of Prudential Mutual Fund Law Department (1997-2006).
Noreen M. Fierro (43), Anti-Money Laundering Compliance Officer since October 2006(3)
Principal occupations (last 5 years): Vice President, Corporate Compliance (since May 2006) of Prudential; formerly Corporate Vice President, Associate General Counsel (April 2002-May 2005) of UBS Financial Services, Inc., in their Money Laundering Prevention Group; Senior Manager (May 2005-May 2006) of Deloitte Financial Advisory Services, LLP, in their Forensic and Dispute Services, Anti-Money Laundering Group.
| | |
| 60 | | Visit our website at www.jennisondryden.com |
† | The Fund Complex consists of all investment companies managed by PI. The Funds for which PI serves as manager include Jennison Dryden Mutual Funds, Strategic Partners Funds, The Prudential Variable Contract Accounts 2, 10, 11. The Target Portfolio Trust, The Prudential Series Fund, The High Yield Income Fund, Inc., The High Yield Plus Fund, Inc., Nicholas-Applegate Fund, Inc., American Skandia Trust, and Prudential’s Gibraltar Fund, Inc. |
(1) | “Interested” Trustees, as defined in the 1940 Act, by reason of employment with the Manager, a Subadvisor or the Distributor. |
(2) | Unless otherwise noted, the address of the Trustees and Officers is c/o: Prudential Investments LLC, Gateway Center Three, 100 Mulberry Street, Newark, NJ 07102. |
(3) | There is no set term of office for Trustees and Officers. The Independent Trustees have adopted a retirement policy, which calls for the retirement of Trustees on December 31 of the year in which they reach the age of 75. The table shows the individual’s length of service as Trustee and/or Officer. |
(4) | This includes only directorships of companies required to register, or file reports with the SEC under the Securities and Exchange Act of 1934 (that is, “public companies”) or other investment companies registered under the 1940 Act. |
Additional Information about the Trustees is included in the Statement of Additional Information which is available without charge, upon request, by calling (800) 521-7466 or (732) 482-7555 (Calling from outside the U.S.)
Approval of Advisory Agreements
The Board of Trustees (the “Board”) of Jennison Value Fund (the “Fund”) oversees the management of the Fund and, as required by law, determines annually whether to renew the Fund’s management agreement with Prudential Investments LLC (“PI”) and the Fund’s subadvisory agreement with Jennison Associates LLC (“Jennison”). In considering the renewal of the agreements, the Board, including all of the Independent Trustees, met on June 6-7, 2007 and approved the renewal of the agreements through July 31, 2008, after concluding that renewal of the agreements was in the best interests of the Fund and its shareholders.
In advance of the meetings, the Board received materials relating to the agreements, and had the opportunity to ask questions and request further information in connection with their consideration. Among other things, the Board considered comparisons with other mutual funds in relevant Peer Universes and Peer Groups. The mutual funds included in each Peer Universe or Peer Group were objectively determined solely by Lipper Inc., an independent provider of mutual fund data. The comparisons placed the Fund in various quartiles over the one-, three-, five- and ten-year periods ending December 31, 2006, with the first quartile being the best 25% of the mutual funds (for performance, the best performing mutual funds and, for expenses, the lowest cost mutual funds).
In approving the agreements, the Board, including the Independent Trustees advised by independent legal counsel, considered the factors they deemed relevant, including the nature, quality and extent of services provided, the performance of the Fund, the profitability of PI and its affiliates, expenses and fees, and the potential for economies of scale that may be shared with the Fund and its shareholders. In their deliberations, the Trustees did not identify any single factor which alone was responsible for the Board’s decision to approve the agreements with respect to the Fund. In connection with their deliberations, the Board considered information provided by PI throughout the year at regular Board meetings, presentations from portfolio managers and other information, as well as information furnished at or in advance of the meetings on June 6-7, 2007.
The Trustees determined that the overall arrangements between the Fund and PI, which serves as the Fund’s investment manager pursuant to a management agreement, and between PI and Jennison, which serves as the Fund’s subadviser pursuant to the terms of a subadvisory agreement with PI, are fair and reasonable in light of the services performed, fees charged and such other matters as the Trustees considered relevant in the exercise of their business judgment.
The material factors and conclusions that formed the basis for the Trustees’ reaching their determinations to approve the continuance of the agreements are separately discussed below.
Approval of Advisory Agreements (continued)
Nature, quality and extent of services
The Board received and considered information regarding the nature and extent of services provided to the Fund by PI and Jennison. The Board considered the services provided by PI, including but not limited to the oversight of the subadviser for the Fund, as well as the provision of fund recordkeeping, compliance, and other services to the Fund. With respect to PI’s oversight of the subadviser, the Board noted that PI’s Strategic Investment Research Group (“SIRG”), which is a business unit of PI, is responsible for monitoring and reporting to PI’s senior management on the performance and operations of the subadviser. The Board also considered that PI pays the salaries of all of the officers and non-independent Trustees of the Fund. The Board also considered the investment subadvisory services provided by Jennison, as well as adherence to the Fund’s investment restrictions and compliance with applicable Fund policies and procedures. The Board considered PI’s evaluation of the subadviser as well as PI’s recommendation, based on its review of the subadviser, to renew the subadvisory agreement.
The Board reviewed the qualifications, backgrounds and responsibilities of PI’s senior management responsible for the oversight of the Fund and Jennison, and also reviewed the qualifications, backgrounds and responsibilities of Jennison’s portfolio managers who are responsible for the day-to-day management of the Fund’s portfolio. The Board was provided with information pertaining to PI’s and Jennison’s organizational structure, senior management, investment operations, and other relevant information pertaining to both PI and Jennison. The Board also noted that it received favorable compliance reports from the Fund’s Chief Compliance Officer (“CCO”) as to both PI and Jennison. The Board noted that Jennison is affiliated with PI.
The Board concluded that it was satisfied with the nature, extent and quality of the investment management services provided by PI and the subadvisory services provided to the Fund by Jennison, and that there was a reasonable basis on which to conclude that the Fund benefits from the services provided by PI and Jennison under the management and subadvisory agreements.
Performance of Jennison Value Fund
The Board received and considered information about the Fund’s historical performance. The Board considered that the Fund’s gross performance and net performance (which reflects any subsidies, expense caps or waivers) in relation to its Peer Universe (the Lipper Retail and Institutional Large-Cap Value Funds Performance Universe) was in the second quartile for the one-year period, and was in the first quartile for the three-, five- and ten-year periods. The Board further noted that the
| | |
| | Visit our website at www.jennisondryden.com |
Fund outperformed against its benchmark index over the three-, five- and ten-year periods, although it underperformed against the benchmark index over the one-year period. The Board concluded that, in light of the Fund’s competitive performance, it would be in the interest of the Fund and its shareholders to renew the agreements.
Fees and Expenses
The Board considered that the Fund’s contractual management fee and total expenses ranked in the Expense Group’s first quartile. The Board also noted that the Fund’s actual management fee (which reflects any subsidies, expense caps or waivers) ranked in the Expense Group’s second quartile. The Board concluded that the management and subadvisory fees are reasonable in light of the services provided.
Costs of Services and Profits Realized by PI
The Board was provided with information on the profitability of PI and its affiliates in serving as the Fund’s investment manager. The Board discussed with PI the methodology utilized in assembling the information regarding profitability and considered its reasonableness. The Board recognized that it is difficult to make comparisons of profitability from fund management contracts because comparative information is not generally publicly available and is affected by numerous factors, including the structure of the particular adviser, the types of funds it manages, its business mix, numerous assumptions regarding allocations and the adviser’s capital structure and cost of capital. The Board did not separately consider the profitability of the subadviser, an affiliate of PI, as its profitability was reflected in the profitability report for PI. Taking these factors into account, the Board concluded that the profitability of PI and its affiliates in relation to the services rendered was not unreasonable.
Economies of Scale
The Board noted that the management fee schedule for the Fund includes breakpoints, which have the effect of decreasing the fee rate as assets increase, and that at its current level of assets the Fund’s effective fee rate reflected some of those rate reductions. The Board received and discussed information concerning whether PI realizes economies of scale as the Fund’s assets grow beyond current levels. The Board took note that the Fund’s fee structure currently results in benefits to Fund shareholders whether or not PI realizes any economies of scale.
Other Benefits to PI and Jennison
The Board considered potential ancillary benefits that might be received by PI and Jennison and their affiliates as a result of their relationship with the Fund. The Board
Approval of Advisory Agreements (continued)
concluded that potential benefits to be derived by PI included brokerage commissions received by affiliates of PI, transfer agency fees received by the Fund’s transfer agent (which is affiliated with PI), as well as reputational or other intangible benefits resulting from PI’s association with the Fund. The Board concluded that the potential benefits to be derived by Jennison included its ability to use soft dollar credits, brokerage commissions received by affiliates of Jennison, as well as the potential benefits consistent with those generally resulting from an increase in assets under management, specifically, potential access to additional research resources and reputational benefits. The Board concluded that the benefits derived by PI and Jennison were consistent with the types of benefits generally derived by investment managers and subadvisers to mutual funds.
After full consideration of these factors, the Board concluded that the approval of the agreements was in the best interest of the Fund and its shareholders.
| | |
| | Visit our website at www.jennisondryden.com |
Growth of a $10,000 Investment
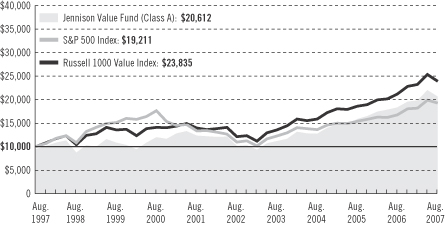
| | | | | | | | | | | |
| Average Annual Total Returns (With Sales Charges) as of 8/31/07 |
| | | One Year | | | Five Years | | | Ten Years | | | Since Inception |
Class A | | 6.67 | % | | 14.03 | % | | 7.50 | % | | — |
Class B | | 7.01 | | | 14.36 | | | 7.30 | | | — |
Class C | | 11.01 | | | 14.47 | | | 7.30 | | | — |
Class L | | N/A | | | N/A | | | N/A | | | N/A (3/19/07) |
Class M | | N/A | | | N/A | | | N/A | | | N/A (3/19/07) |
Class R | | 12.62 | | | N/A | | | N/A | | | 15.94% (6/3/05) |
Class X | | N/A | | | N/A | | | N/A | | | N/A (3/19/07) |
Class Z | | 13.18 | | | 15.61 | | | 8.38 | | | — |
| | | | | | | | | | | |
| Average Annual Total Returns (Without Sales Charges) as of 8/31/07 |
| | | One Year | | | Five Years | | | Ten Years | | | Since Inception |
Class A | | 12.88 | % | | 15.33 | % | | 8.11 | % | | — |
Class B | | 12.01 | | | 14.47 | | | 7.30 | | | — |
Class C | | 12.01 | | | 14.47 | | | 7.30 | | | — |
Class L | | N/A | | | N/A | | | N/A | | | N/A (3/19/07) |
Class M | | N/A | | | N/A | | | N/A | | | N/A (3/19/07) |
Class R | | 12.62 | | | N/A | | | N/A | | | 15.94% (6/3/05) |
Class X | | N/A | | | N/A | | | N/A | | | N/A (3/19/07) |
Class Z | | 13.18 | | | 15.61 | | | 8.38 | | | — |
Performance data quoted represent past performance. Past performance does not guarantee future results. The investment return and principal value of an investment will fluctuate, so that an investor’s shares, when redeemed, may be worth more or
| | |
| | Visit our website at www.jennisondryden.com |
less than their original cost. Current performance may be lower or higher than the past performance data quoted. An investor may obtain performance data as of the most recent month-end by visiting our website at www.jennisondryden.com or by calling (800) 225-1852. Class A and Class L shares have a maximum initial sales charge of 5.50% and 5.75%, respectively. Gross operating expenses: Class A, 1.00%; Class B, 1.70%; Class C, 1.70%; Class L, 1.20%; Class M, 1.70%; Class R, 1.45%; Class X, 1.70%; Class Z, 0.70%. Net operating expenses apply to: Class A, 0.95%; Class B, 1.70%; Class C, 1.70%; Class L, 1.20%; Class M, 1.70%; Class R, 1.20%; Class X, 1.70%; Class Z, 0.70%, after contractual reduction through 2/28/2008.
The returns in the graph and the tables do not reflect the deduction of taxes that a shareholder would pay on Fund distributions or following the redemption of Fund shares.
Source: Prudential Investments LLC and Lipper Inc.
Inception date returns are provided for any share class with less than 10 years of returns.
The graph compares a $10,000 investment in the Jennison Value Fund (Class A shares) with a similar investment in the S&P 500 Index and the Russell 1000 Value Index by portraying the initial account values at the beginning of the 10-year period for Class A shares (August 31, 1997) and the account values at the end of the current fiscal year (August 31, 2007) as measured on a quarterly basis. For purposes of the graph, and unless otherwise indicated, it has been assumed that (a) the maximum applicable front-end sales charge was deducted from the initial $10,000 investment in Class A shares; (b) all recurring fees (including management fees) were deducted; and (c) all dividends and distributions were reinvested. The line graph provides information for Class A shares only. As indicated in the tables provided earlier, performance for Class B, Class C, Class L, Class M, Class R, Class X, and Class Z shares will vary due to the differing charges and expenses applicable to each share class (as indicated in the following paragraphs). Without a distribution and service (12b-1) fee waiver of 0.05% for Class A shares through August 31, 2007, the returns shown in the graph and for Class A shares in the tables would have been lower.
The S&P 500 Index is an unmanaged index of 500 stocks of large U.S. companies. It gives a broad look at how stock prices have performed in the United States. The Russell 1000 Value Index is an unmanaged index comprising those securities in the Russell 1000 Index with a lesser-than-average growth orientation. Companies in this index generally have low price-to-book and price-to-earnings ratios, higher dividend yields, and lower forecasted growth values. The Indexes’ total returns include the reinvestment of all dividends, but do not include the effects of sales charges, operating expenses of a mutual fund, or taxes. These returns would be lower if they included the effects of sales charges, operating expenses, or taxes. The securities that comprise these indexes may differ substantially from the securities in the Fund. These are not the only indexes that may be used to characterize performance of large-capitalization stock funds. Other indexes may portray different comparative performance. Investors cannot invest directly in an index.
Class A and Class L shares are subject to a maximum front-end sales charge of 5.50% and 5.75%, respectively, and a 12b-1 fee of up to 0.30% and 0.50%, respectively, annually. Investors who purchase Class A or Class L shares in an amount of $1 million or more do not pay a front-end sales charge, but are subject to a contingent deferred sales charge (CDSC) of 1% for shares sold within 12 months of purchase; in certain circumstances. Class B shares are subject to a declining CDSC of 5%, 4%, 3%, 2%, 1%, and 1%, respectively, for the first six years after purchase and a 12b-1 fee of 1% annually. Approximately seven years after purchase, Class B shares
Growth of a $10,000 Investment (continued)
will automatically convert to Class A shares on a quarterly basis. Class C shares purchased are not subject to a front-end sales charge, but are subject to a CDSC of 1% for shares sold within 12 months from the date of purchase, and an annual 12b-1 fee of 1%. Class M and Class X shares purchased are not subject to a front-end sales charge, but are subject to a CDSC of 6% and a 12b-1 fee of 1%. The CDSC for Class M and Class X shares decreases by 1% annually to 2% in the fifth and sixth years after purchase, 1% in the seventh year and 0% in the eighth year after purchase. Class M and Class X shares convert to Class A shares approximately eight years after purchase. Class R shares are not subject to a sales charge, but charge a 12b-1 fee of up to 0.75%. Class Z shares are not subject to a sales charge or 12b-1 fees. The returns in the graph and tables reflect the share class expense structure in effect at the close of the fiscal period. Without waiver of fees and/or expense subsidization, the Fund’s returns would have been lower.
| | |
| | Visit our website at www.jennisondryden.com |
| | | | |
| n MAIL | | n TELEPHONE | | n WEBSITE |
Gateway Center Three 100 Mulberry Street Newark, NJ 07102 | | (800) 225-1852 | | www.jennisondryden.com |
|
| PROXY VOTING |
| The Board of Trustees of the Fund has delegated to the Fund’s investment subadviser the responsibility for voting any proxies and maintaining proxy recordkeeping with respect to the Fund. A description of these proxy voting policies and procedures is available without charge, upon request, by calling (800) 225-1852 or by visiting the Securities and Exchange Commission’s website at www.sec.gov. Information regarding how the Fund voted proxies relating to portfolio securities during the most recent 12-month period ended June 30 is available on the Fund’s website and on the Commission’s website. |
|
| TRUSTEES |
| Linda W. Bynoe • David E.A. Carson • Robert F. Gunia • Robert E. La Blanc • Douglas H. McCorkindale • Richard A. Redeker • Judy A. Rice • Robin B. Smith • Stephen G. Stoneburn • Clay T. Whitehead |
|
| OFFICERS |
| Judy A. Rice, President • Robert F. Gunia, Vice President • Grace C. Torres, Treasurer and Principal Financial and Accounting Officer • Kathryn L. Quirk, Chief Legal Officer • Deborah A. Docs, Secretary • Timothy J. Knierim, Chief Compliance Officer • Valerie M. Simpson, Deputy Chief Compliance Officer • Noreen M. Fierro, Anti-Money Laundering Compliance Officer • Jonathan D. Shain, Assistant Secretary • Claudia DiGiacomo, Assistant Secretary • John P. Schwartz, Assistant Secretary • Andrew R. French, Assistant Secretary • M. Sadiq Peshimam, Assistant Treasurer • Peter Parrella, Assistant Treasurer |
| | | | |
| MANAGER | | Prudential Investments LLC | | Gateway Center Three
100 Mulberry Street
Newark, NJ 07102 |
|
| INVESTMENT SUBADVISER | | Jennison Associates LLC | | 466 Lexington Avenue
New York, NY 10017 |
|
| DISTRIBUTOR | | Prudential Investment
Management Services LLC | | Gateway Center Three
100 Mulberry Street
Newark, NJ 07102 |
|
| CUSTODIAN | | The Bank of New York
Mellon Corp. | | One Wall Street
New York, NY 10286 |
|
| TRANSFER AGENT | | Prudential Mutual Fund
Services LLC | | P.O. Box 9658
Providence, RI 02940 |
|
INDEPENDENT REGISTERED
PUBLIC ACCOUNTING FIRM | | KPMG LLP | | 345 Park Avenue
New York, NY 10154 |
|
| FUND COUNSEL | | Willkie Farr & Gallagher LLP | | 787 Seventh Avenue
New York, NY 10019 |
|
| An investor should consider the investment objectives, risks, charges, and expenses of the Fund carefully before investing. The prospectus for the Fund contains this and other information about the Fund. An investor may obtain a prospectus by visiting our website at www.jennisondryden.com or by calling (800) 225-1852. The prospectus should be read carefully before investing. |
|
| E-DELIVERY |
To receive your mutual fund documents on-line, go to www.icsdelivery.com/prudential/funds
and enroll. Instead of receiving printed documents by mail, you will receive notification via e-mail when new materials are available. You can cancel your enrollment or change your e-mail
address at any time by clicking on the change/cancel enrollment option at the icsdelivery
website address. |
|
| SHAREHOLDER COMMUNICATIONS WITH TRUSTEES |
| Shareholders can communicate directly with the Board of Trustees by writing to the Chair of the Board, Jennison Value Fund, Prudential Investments, Attn: Board of Trustees, 100 Mulberry Street, Gateway Center Three, Newark, NJ 07102. Shareholders can communicate directly with an individual Trustee by writing to the same address. Communications are not screened before being delivered to the addressee. |
|
| AVAILABILITY OF PORTFOLIO SCHEDULE |
| The Fund files its complete schedule of portfolio holdings with the Securities and Exchange Commission for the first and third quarters of each fiscal year on Form N-Q. The Fund’s Forms N-Q are available on the Commission’s website at www.sec.gov. The Fund’s Forms N-Q may also be reviewed and copied at the Commission’s Public Reference Room in Washington, D.C. Information on the operation and location of the Public Reference Room may be obtained by calling (800) SEC-0330 (732-0330). The Fund’s schedule of portfolio holdings is also available on the Fund’s website as of the end of each fiscal quarter. |
The Fund’s Statement of Additional Information contains additional information about the Fund’s Trustees and is available without charge, upon request, by calling (800) 225-1852.
Mutual Funds:
| | | | |
| ARE NOT INSURED BY THE FDIC OR ANY FEDERAL GOVERNMENT AGENCY | | MAY LOSE VALUE | | ARE NOT A DEPOSIT OF OR GUARANTEED BY ANY BANK OR ANY BANK AFFILIATE |

| | | | | | | | | | | | | | | | | | | | |
| Jennison Value Fund | | | | | | | | | | | | | | |
| | Share Class | | A | | B | | C | | L | | M | | R | | X | | Z | | |
| | NASDAQ | | PBEAX | | PBQIX | | PEICX | | N/A | | N/A | | JDVRX | | N/A | | PEIZX | | |
| | CUSIP | | 476297106 | | 476297205 | | 476297304 | | 476297601 | | 476297700 | | 476297502 | | 476297809 | | 476297403 | | |
| | | | | | | | | | | | | | | | | | | | |
MF131E IFS-A139945 Ed. 10/2007

Item 2 – Code of Ethics – – See Exhibit (a)
As of the end of the period covered by this report, the Registrant has adopted a code of ethics (the “Section 406 Standards for Investment Companies – Ethical Standards for Principal Executive and Financial Officers”) that applies to the Registrant’s Principal Executive Officer and Principal Financial Officer; the Registrant’s Principal Financial Officer also serves as the Principal Accounting Officer.
The Registrant hereby undertakes to provide any person, without charge, upon request, a copy of the code of ethics. To request a copy of the code of ethics, contact the registrant 800-225-1852, and ask for a copy of the Section 406 Standards for Investment Companies - Ethical Standards for Principal Executive and Financial Officers.
Item 3 – Audit Committee Financial Expert –
The Registrant’s Board has determined that Mr. David E. A. Carson, member of the Board’s Audit Committee is an “audit committee financial expert,” and that he is “independent,” for purposes of this Item.
Item 4 – Principal Accountant Fees and Services –
(a) Audit Fees
For the fiscal period November 1, 2006 through August 31, 2007 and fiscal year ended October 31, 2006, KPMG LLP (“KPMG”), the Registrant’s principal accountant, billed the Registrant $19,859 and $16,700, respectively, for professional services rendered for the audit of the Registrant’s annual financial statements or services that are normally provided in connection with statutory and regulatory filings.
(b) Audit-Related Fees
For the fiscal period November 1, 2006 through August 31, 2007, KPMG, the Registrant’s principal accountant, did not bill the Registrant for assurance and related services that are reasonably related to the performance of the audit of the Registrant’s financial statements. For the fiscal year ended October 31, 2006, KPMG, the Registrant’s principal accountant, did not bill the Registrant for assurance and related services that are reasonably related to the performance of the audit of the Registrant’s financial statements.
(c) Tax Fees
None.
(d) All Other Fees
None.
(e) (1) Audit Committee Pre-Approval Policies and Procedures
THE PRUDENTIAL MUTUAL FUNDS
AUDIT COMMITTEE POLICY
on
Pre-Approval of Services Provided by the Independent Accountants
The Audit Committee of each Prudential Mutual Fund is charged with the responsibility to monitor the independence of the Fund’s independent accountants. As part of this responsibility, the Audit Committee must pre-approve any independent accounting firm’s engagement to render audit and/or permissible non-audit services, as required by law. In evaluating a proposed engagement of the independent accountants, the Audit Committee will assess the effect that the engagement might reasonably be expected to have on the accountant’s independence. The Committee’s evaluation will be based on:
| | • | | a review of the nature of the professional services expected to be provided, |
| | • | | a review of the safeguards put into place by the accounting firm to safeguard independence, and |
| | • | | periodic meetings with the accounting firm. |
Policy for Audit and Non-Audit Services Provided to the Funds
On an annual basis, the scope of audits for each Fund, audit fees and expenses, and audit-related and non-audit services (and fees proposed in respect thereof) proposed to be performed by the Fund’s independent accountants will be presented by the Treasurer and the independent accountants to the Audit Committee for review and, as appropriate, approval prior to the initiation of such services. Such presentation shall be accompanied by confirmation by both the Treasurer and the independent accountants that the proposed services will not adversely affect the independence of the independent accountants. Proposed services shall be described in sufficient detail to enable the Audit Committee to assess the appropriateness of such services and fees, and the compatibility of the provision of such services with the auditor’s independence. The Committee shall receive periodic reports on the progress of the audit and other services which are approved by the Committee or by the Committee Chair pursuant to authority delegated in this Policy.
The categories of services enumerated under “Audit Services”, “Audit-related Services”, and “Tax Services” are intended to provide guidance to the Treasurer and the independent accountants as to those categories of services which the Committee believes are generally consistent with the independence of the independent accountants and which the Committee (or the Committee Chair) would expect upon the presentation of specific proposals to pre-approve. The enumerated categories are not intended as an exclusive list of audit, audit-related or tax services, which the Committee (or the Committee Chair) would consider for pre-approval.
Audit Services
The following categories of audit services are considered to be consistent with the role of the Fund’s independent accountants:
| | • | | Annual Fund financial statement audits |
| | • | | Seed audits (related to new product filings, as required) |
| | • | | SEC and regulatory filings and consents |
Audit-related Services
The following categories of audit-related services are considered to be consistent with the role of the Fund’s independent accountants:
| | • | | Accounting consultations |
| | • | | Fund merger support services |
| | • | | Agreed Upon Procedure Reports |
| | • | | Other Internal Control Reports |
Individual audit-related services that fall within one of these categories and are not presented to the Audit Committee as part of the annual pre-approval process will be subject to pre-approval by the Committee Chair (or any other Committee member on whom this responsibility has been delegated) so long as the estimated fee for those services does not exceed $50,000.
Tax Services
The following categories of tax services are considered to be consistent with the role of the Fund’s independent accountants:
| | • | | Tax compliance services related to the filing or amendment of the following: |
| | • | | Federal, state and local income tax compliance; and, |
| | • | | Sales and use tax compliance |
| | • | | Timely RIC qualification reviews |
| | • | | Tax distribution analysis and planning |
| | • | | Tax authority examination services |
| | • | | Tax appeals support services |
| | • | | Accounting methods studies |
| | • | | Fund merger support services |
| | • | | Tax consulting services and related projects |
Individual tax services that fall within one of these categories and are not presented to the Audit Committee as part of the annual pre-approval process will be subject to pre-approval by the Committee Chair (or any other Committee member on whom this responsibility has been delegated) so long as the estimated fee for those services does not exceed $50,000.
Other Non-audit Services
Certain non-audit services that the independent accountants are legally permitted to render will be subject to pre-approval by the Committee or by one or more Committee members to whom the Committee has delegated this authority and who will report to the full Committee any pre-approval decisions made pursuant to this Policy. Non-audit services presented for pre-approval pursuant to this paragraph will be accompanied by a confirmation from both the Treasurer and the independent accountants that the proposed services will not adversely affect the independence of the independent accountants.
Proscribed Services
The Fund’s independent accountants will not render services in the following categories of non-audit services:
| | • | | Bookkeeping or other services related to the accounting records or financial statements of the Fund |
| | • | | Financial information systems design and implementation |
| | • | | Appraisal or valuation services, fairness opinions, or contribution-in-kind reports |
| | • | | Internal audit outsourcing services |
| | • | | Management functions or human resources |
| | • | | Broker or dealer, investment adviser, or investment banking services |
| | • | | Legal services and expert services unrelated to the audit |
| | • | | Any other service that the Public Company Accounting Oversight Board determines, by regulation, is impermissible. |
Pre-approval of Non-Audit Services Provided to Other Entities Within the Prudential Fund Complex
Certain non-audit services provided to Prudential Investments LLC or any of its affiliates that also provide ongoing services to the Prudential Mutual Funds will be subject to pre-approval by the Audit Committee. The only non-audit services provided to these entities that will require pre-approval are those related directly to the operations and financial reporting of the Funds. Individual projects that are not presented to the Audit Committee as part of the annual pre-approval process will be subject to pre-approval by the Committee Chair (or any other Committee member on whom this responsibility has been delegated) so long as the estimated fee for those services does not exceed $50,000. Services presented for pre-approval pursuant to this paragraph will be accompanied by a confirmation from both the Treasurer and the independent accountants that the proposed services will not adversely affect the independence of the independent accountants.
Although the Audit Committee will not pre-approve all services provided to Prudential Investments LLC and its affiliates, the Committee will receive an annual report from the Fund’s independent accounting firm showing the aggregate fees for all services provided to Prudential Investments and its affiliates.
(e) (2) Percentage of services referred to in 4(b)- (4)(d) that were approved by the audit committee –
Not applicable.
(f) Percentage of hours expended attributable to work performed by other than full time employees of principal accountant if greater than 50%.
Not applicable.
(g) Non-Audit Fees
Not applicable to Registrant for the fiscal period November 1, 2006 through August 31, 2007 and fiscal year 2006. The aggregate non-audit fees billed by KPMG for services rendered to the registrant’s investment adviser and any entity controlling, controlled by, or under common control with the investment adviser that provides ongoing services to the registrant for the fiscal period November 1, 2006 through August 31, 2007 and fiscal year 2006 was $44,700 and $317,300, respectively.
(h) Principal Accountant’s Independence
Not applicable as KPMG has not provided non-audit services to the Registrant’s investment adviser and any entity controlling, controlled by, or under common control with the investment adviser that provides ongoing services to the registrant that were not pre-approved pursuant to Rule 2-01(c)(7)(ii) of Regulation S-X.
Item 5 – Audit Committee of Listed Registrants – Not applicable.
Item 6 – Schedule of Investments – The schedule is included as part of the report to shareholders filed under Item 1 of this Form.
Item 7 – Disclosure of Proxy Voting Policies and Procedures for Closed-End Management Investment Companies – Not applicable.
Item 8 – Portfolio Managers of Closed-End Management Investment Companies – Not applicable.
Item 9 – Purchases of Equity Securities by Closed-End Management Investment Company and Affiliated Purchasers – Not applicable.
Item 10 – Submission of Matters to a Vote of Security Holders – Not applicable.
Item 11 – Controls and Procedures
| | (a) | It is the conclusion of the Registrant’s principal executive officer and principal financial officer that the effectiveness of the Registrant’s current disclosure controls and procedures (such disclosure controls and procedures having been evaluated within 90 days of the date of this filing) provide reasonable assurance that the information required to be disclosed by the Registrant has been recorded, processed, summarized and reported within the time period specified in the Commission’s rules and forms and that the information required to be disclosed by the Registrant has been accumulated and communicated to the Registrant’s principal executive officer and principal financial officer in order to allow timely decisions regarding required disclosure. |
| | (b) | There has been no significant change in the Registrant’s internal control over financial reporting that occurred during the registrant’s most recent fiscal quarter of the period covered by this report that has materially affected, or is likely to materially affect, the Registrant’s internal control over financial reporting. |
Item 12 – Exhibits
| | |
| (a) | | (1) Code of Ethics – Attached hereto as Exhibit EX-99.CODE-ETH |
| |
| | (2) Certifications pursuant to Section 302 of the Sarbanes-Oxley Act – Attached hereto as Exhibit EX-99.CERT. |
| |
| | (3) Any written solicitation to purchase securities under Rule 23c-1. – Not applicable. |
| |
| (b) | | Certifications pursuant to Section 906 of the Sarbanes-Oxley Act – Attached hereto as Exhibit EX-99.906CERT. |
SIGNATURES
Pursuant to the requirements of the Securities Exchange Act of 1934 and the Investment Company Act of 1940, the registrant has duly caused this report to be signed on its behalf by the undersigned, thereunto duly authorized.
(Registrant) Jennison Value Fund
| | | | |
| By (Signature and Title)* | | /s/ Deborah A. Docs | | |
| | Deborah A. Docs | | |
| | Secretary | | |
Date October 24, 2007
Pursuant to the requirements of the Securities Exchange Act of 1934 and the Investment Company Act of 1940, this report has been signed below by the following persons on behalf of the registrant and in the capacities and on the dates indicated.
| | | | |
| By (Signature and Title)* | | /s/ Judy A. Rice | | |
| | Judy A. Rice | | |
| | President and Principal Executive Officer | | |
Date October 24, 2007
| | | | |
| By (Signature and Title)* | | /s/ Grace C. Torres | | |
| | Grace C. Torres | | |
| | Treasurer and Principal Financial Officer | | |
Date October 24, 2007
| * | Print the name and title of each signing officer under his or her signature. |