UNITED STATES
SECURITIES AND EXCHANGE COMMISSION
Washington, D.C. 20549
FORM N-CSR
CERTIFIED SHAREHOLDER REPORT OF REGISTERED
MANAGEMENT INVESTMENT COMPANIES
Investment Company Act file number: 811-04864
Prudential Investment Portfolios 7
Exact name of registrant as specified in charter:
Gateway Center 3,
100 Mulberry Street,
Newark, New Jersey 07102
Address of principal executive offices:
Deborah A. Docs
Gateway Center 3,
100 Mulberry Street,
Newark, New Jersey 07102
Name and address of agent for service:
Registrant’s telephone number, including area code: 800-225-1852
Date of fiscal year end: 8/31/2010
Date of reporting period: 8/31/2010
Item 1 – Reports to Stockholders –

| | |
| ANNUAL REPORT | | AUGUST 31, 2010 |
Prudential Jennison Value Fund
| | | | |
Fund Type Large cap stock Objective Capital appreciation | | | | This report is not authorized for distribution to prospective investors unless preceded or accompanied by a current prospectus. The views expressed in this report and information about the Fund’s portfolio holdings are for the period covered by this report and are subject to change thereafter. Prudential Investments, Prudential, Jennison, the Prudential logo and the Rock symbol are service marks of Prudential Financial, Inc. and its related entities, registered in many jurisdictions worldwide. |
| | |

| | To enroll in e-delivery, go to www.prudentialfunds.com/edelivery |
October 15, 2010
Dear Shareholder:
We hope you find the annual report for the Prudential Jennison Value Fund informative and useful. Because of ongoing market volatility, we understand that this is a difficult time to be an investor. While it is impossible to predict what the future holds, we continue to believe a prudent response to uncertainty is to maintain a diversified portfolio, including stock and bond mutual funds consistent with your tolerance for risk, time horizon, and financial goals.
A diversified asset allocation offers two potential advantages: It limits your exposure to any particular asset class; plus it provides a better opportunity to invest some of your assets in the right place at the right time. Your financial professional can help you create a diversified investment plan that may include mutual funds covering all the basic asset classes and that reflects your personal investor profile and risk tolerance. Keep in mind that diversification and asset allocation strategies do not assure a profit or protect against loss in declining markets.
Prudential Investments® provides a wide range of mutual funds to choose from that can help you make progress toward your financial goals. Our funds offer the experience, resources, and professional discipline of Prudential Financial’s affiliated asset managers. Most of Prudential Investments’ equity funds are advised by Jennison Associates LLC, Quantitative Management Associates LLC (QMA), or Prudential Real Estate Investors. Prudential Investment Management, Inc. (PIM) advises the Prudential Investments fixed income and money market funds through its Prudential Fixed Income unit. Jennison Associates, QMA, and PIM are registered investment advisers and Prudential Financial companies. Prudential Real Estate Investors is a unit of PIM.
Thank you for choosing the Prudential Investments family of mutual funds.
Sincerely,

Judy A. Rice, President
Prudential Jennison Value Fund
| | |
| Prudential Jennison Value Fund | | 1 |
Your Fund’s Performance
Performance data quoted represent past performance. Past performance does not guarantee future results. The investment return and principal value of an investment will fluctuate, so that an investor’s shares, when redeemed, may be worth more or less than their original cost. Current performance may be lower or higher than the past performance data quoted. An investor may obtain performance data as of the most recent month-end by visiting our website at www.prudentialfunds.com or by calling (800) 225-1852. Class A and Class L shares have a maximum initial sales charge of 5.50% and 5.75%, respectively. Gross operating expenses: Class A, 1.07%; Class B, 1.77%; Class C, 1.77%; Class L, 1.27%; Class M, 1.77%; Class R, 1.52%; Class X, 1.77%; Class Z, 0.77%. Net operating expenses: Class A, 1.07%; Class B, 1.77%; Class C, 1.77%; Class L, 1.27%; Class M, 1.02%; Class R, 1.27%; Class X, 1.02%; Class Z, 0.77%, after contractual reduction through 12/31/2011 for Class R shares.
| | | | | | | | | | | | | | |
Cumulative Total Returns (Without Sales Charges) as of 8/31/10 |
| | | One Year | | | Five Years | | | Ten Years | | | Since Inception |
Class A | | | 5.44 | % | | | –2.21 | % | | | 29.44 | % | | — |
Class B | | | 4.78 | | | | –5.64 | | | | 20.30 | | | — |
Class C | | | 4.69 | | | | –5.78 | | | | 20.19 | | | — |
Class L | | | 5.28 | | | | N/A | | | | N/A | | | –21.32% (3/16/07) |
Class M | | | 5.58 | | | | N/A | | | | N/A | | | –21.62 (3/16/07) |
Class R | | | 5.27 | | | | –3.60 | | | | N/A | | | 4.24 (6/3/05) |
Class X | | | 5.51 | | | | N/A | | | | N/A | | | –20.77 (3/16/07) |
Class Z | | | 5.78 | | | | –0.90 | | | | 32.86 | | | — |
Russell 1000® Value Index | | | 4.96 | | | | –8.15 | | | | 20.94 | | | — |
S&P 500 Index | | | 4.93 | | | | –4.45 | | | | –16.70 | | | — |
Lipper Multi-Cap Core Funds Avg. | | | 5.20 | | | | –2.57 | | | | 9.31 | | | — |
Lipper Large-Cap Value Funds Avg. | | | 2.11 | | | | –9.75 | | | | 14.88 | | | — |
| | |
| 2 | | Visit our website at www.prudentialfunds.com |
| | | | | | | | | | | | | | | | |
Average Annual Total Returns (With Sales Charges) as of 9/30/10 | |
| | | One Year | | | Five Years | | | Ten Years | | | Since Inception | |
Class A | | | 1.57 | % | | | –0.57 | % | | | 3.03 | % | | | — | |
Class B | | | 1.71 | | | | –0.30 | | | | 2.85 | | | | — | |
Class C | | | 5.71 | | | | –0.18 | | | | 2.85 | | | | — | |
Class L | | | 1.08 | | | | N/A | | | | N/A | | | | –6.04% (3/16/07) | |
Class M | | | 1.64 | | | | N/A | | | | N/A | | | | –5.17 (3/16/07) | |
Class R | | | 7.24 | | | | 0.27 | | | | N/A | | | | 2.28 (6/3/05) | |
Class X | | | 1.57 | | | | N/A | | | | N/A | | | | –5.07 (3/16/07) | |
Class Z | | | 7.74 | | | | 0.83 | | | | 3.88 | | | | — | |
Russell 1000® Value Index | | | 8.90 | | | | –0.48 | | | | 2.59 | | | | — | |
S&P 500 Index | | | 10.18 | | | | 0.64 | | | | –0.43 | | | | — | |
Lipper Multi-Cap Core Funds Avg. | | | 9.95 | | | | 0.94 | | | | 1.54 | | | | — | |
Lipper Large-Cap Value Funds Avg. | | | 7.05 | | | | –0.74 | | | | 2.08 | | | | — | |
| | | | | | | | | | | | | | | | |
Average Annual Total Returns (With Sales Charges) as of 8/31/10 | |
| | | One Year | | | Five Years | | | Ten Years | | | Since Inception | |
Class A | | | –0.36 | % | | | –1.57 | % | | | 2.04 | % | | | — | |
Class B | | | –0.22 | | | | –1.28 | | | | 1.87 | | | | — | |
Class C | | | 3.69 | | | | –1.18 | | | | 1.86 | | | | — | |
Class L | | | –0.78 | | | | N/A | | | | N/A | | | | –8.29% (3/16/07) | |
Class M | | | –0.42 | | | | N/A | | | | N/A | | | | –7.43 (3/16/07) | |
Class R | | | 5.27 | | | | –0.73 | | | | N/A | | | | 0.79 (6/3/05) | |
Class X | | | -0.49 | | | | N/A | | | | N/A | | | | –7.34 (3/16/07) | |
Class Z | | | 5.78 | | | | –0.18 | | | | 2.88 | | | | — | |
| | | | | | | | | | | | | | | | |
Average Annual Total Returns (Without Sales Charges) as of 8/31/10 | |
| | | One Year | | | Five Years | | | Ten Years | | | Since Inception | |
Class A | | | 5.44 | % | | | –0.45 | % | | | 2.61 | % | | | — | |
Class B | | | 4.78 | | | | –1.16 | | | | 1.87 | | | | — | |
Class C | | | 4.69 | | | | –1.18 | | | | 1.86 | | | | — | |
Class L | | | 5.28 | | | | N/A | | | | N/A | | | | –6.70% (3/16/07) | |
Class M | | | 5.58 | | | | N/A | | | | N/A | | | | –6.81 (3/16/07) | |
Class R | | | 5.27 | | | | –0.73 | | | | N/A | | | | 0.79 (6/3/05) | |
Class X | | | 5.51 | | | | N/A | | | | N/A | | | | –6.52 (3/16/07) | |
Class Z | | | 5.78 | | | | –0.18 | | | | 2.88 | | | | — | |
| | | | |
| Prudential Jennison Value Fund | | | 3 | |
Your Fund’s Performance (continued)
Growth of a $10,000 Investment
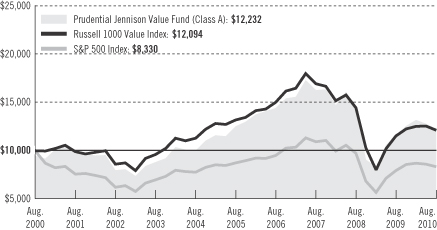
The graph compares a $10,000 investment in the Prudential Jennison Value Fund (Class A shares) with a similar investment in the Russell 1000 Value Index and the S&P 500 Index by portraying the initial account values at the beginning of the 10-year period for Class A shares (August 31, 2000) and the account values at the end of the current fiscal year (August 31, 2010) as measured on a quarterly basis. For purposes of the graph, and unless otherwise indicated, it has been assumed that (a) the maximum applicable front-end sales charge was deducted from the initial $10,000 investment in Class A shares; (b) all recurring fees (including management fees) were deducted; and (c) all dividends and distributions were reinvested. The line graph provides information for Class A shares only. As indicated in the tables provided earlier, performance for Class B, Class C, Class L, Class M, Class R, Class X, and Class Z shares will vary due to the differing charges and expenses applicable to each share class (as indicated in the following paragraphs). Without a distribution and service (12b-1) fee waiver of 0.05% for Class A shares through February 29, 2008, the returns shown in the graph and for Class A shares in the tables would have been lower.
Source: Prudential Investments LLC and Lipper Inc. Performance figures may reflect fee waivers and/or expense reimbursements. In the absence of such fee waivers and/or expense reimbursements, total returns would be lower.
Inception returns are provided for any share class with less than 10 calendar years.
The average annual total returns take into account applicable sales charges. Class A and Class L shares are subject to a maximum front-end sales charge of 5.50% and 5.75%, respectively, and a 12b-1 fee of up to 0.30% and 0.50%, respectively, annually. Investors who purchase Class A or Class L shares in an amount of $1 million or more do not pay a front-end sales charge, but are subject to a contingent deferred sales charge (CDSC) of 1% for shares sold within 12 months of purchase; in certain circumstances, Class B shares are subject to a declining CDSC of 5%, 4%, 3%, 2%, 1%, and 1%, respectively, for the first six years after purchase and a 12b-1 fee of 1% annually. Approximately seven years after purchase, Class B shares will automatically convert to Class A shares on a quarterly basis. Class C shares purchased are not subject to a front-end sales charge, but are subject to a CDSC of 1% for shares sold within 12 months from the date of purchase, and an annual 12b-1 fee of 1%. Class M and Class X shares purchased are not subject to a front-end sales charge, but are subject to a CDSC of 6% and a 12b-1 fee of 1%. The CDSC for Class M and Class X shares decreases by 1% annually to 2% in the fifth and sixth
| | |
| 4 | | Visit our website at www.prudentialfunds.com |
years after purchase, to 1% in the seventh year and to 0% in the eighth year after purchase. Class M and Class X shares convert to Class A shares approximately eight years after purchase. Class R shares are not subject to a sales charge, but charge a 12b-1 fee of up to 0.75%. Class Z shares are not subject to a sales charge or 12b-1 fees. The returns in the graph and tables reflect the share class expense structure in effect at the close of the fiscal period. Without waiver of fees and/or expense subsidization, the Fund’s returns would have been lower.
Benchmark Definitions
Russell 1000 Value Index
The Russell 1000 Value Index is an unmanaged index comprising those securities in the Russell 1000 Index with a less-than-average growth orientation. Companies in this index generally have low price-to-book and price-to-earnings ratios, higher dividend yields, and lower forecasted growth values. Russell 1000 Value Index Closest Month-End to Inception cumulative total returns as of 8/31/10 are –27.73% for Class L, Class M, and Class X; and –4.87% for Class R. Russell 1000 Value Index Closest Month-End to Inception average annual total returns as of 9/30/10 are –6.89% for Class L, Class M, and Class X; and 0.47% for Class R.
S&P 500 Index
The S&P 500 Index is an unmanaged index of 500 stocks of large U.S. public companies. It gives an indication of how U.S. stock prices have performed. S&P 500 Index Closest Month-End to Inception cumulative total returns as of 8/31/10 are –20.32% for Class L, Class M, and Class X; and –1.66% for Class R. S&P 500 Index Closest Month-End to Inception average annual total returns as of 9/30/10 are –3.97% for Class L, Class M, and Class X; and 1.30% for Class R.
Lipper Multi-Cap Core Funds Average
The Lipper Multi-Cap Core Funds Average (Lipper Average) are funds that, by portfolio practice, invest in a variety of market capitalization ranges without concentrating 75% of their equity assets in any one market capitalization range over an extended period of time. Multi-cap core funds typically have an average price-to-earnings ratio, price-to-book ratio, and three-year sales-per-share growth value, compared to the S&P SuperComposite 1500 Index. Lipper Multi-Cap Core Funds Avg. Closest Month-End to Inception cumulative total returns as of 8/31/10 are –18.90% for Class L, Class M, and Class X; and 2.41% for Class R. Lipper Multi-Cap Core Funds Avg. Closest Month-End to Inception average annual total returns as of 9/30/10 are –3.54% for Class L, Class M, and Class X; and 2.02% for Class R.
Lipper Large-Cap Value Funds Average
The Lipper Large-Cap Value Funds Average (Lipper Average) represents returns based on average return of all funds in the Lipper Large-Cap Value Funds category for the periods noted. Funds in the Lipper Average invest at least 75% of their equity assets in companies with market capitalizations (on a three-year weighted basis) greater than 300% of the dollar-weighted median market capitalization of the middle 1,000 securities of the S&P SuperComposite 1500 Index. Large-cap value funds typically have a lower-than-average price-to-earnings ratio, price-to-book ratio, and three-year sales-per-share growth value compared with the S&P 500 Index. Although Lipper classifies the Fund in the Lipper Multi-Cap Core Funds Category, the returns for the Lipper Large-Cap Value Funds Average are also shown, as we believe the Lipper Large-Cap Value Funds Average is more consistent with the management of the Fund. Lipper Large-Cap Value Funds Avg. Closest Month-End to Inception cumulative total returns as of 8/31/10 are –26.33% for Class L, Class M, and Class X; and –6.49% for Class R. Lipper Large-Cap Value Funds Avg. Closest Month-End to Inception average total returns as of 9/30/10 are –6.33% for Class L, Class M, and Class X; and 0.16% for Class R.
| | |
| Prudential Jennison Value Fund | | 5 |
Your Fund’s Performance (continued)
Investors cannot invest directly in an index or average. The returns for the Russell 1000 Value Index, the S&P 500 Index, and the Lipper Average would be lower if they included the effects of sales charges, operating expenses of a mutual fund, or taxes. Returns for the Lipper Average reflect the deduction of operating expenses, but not sales charges or taxes.
| | | |
| Five Largest Holdings expressed as a percentage of net assets as of 8/31/10 | | | |
Liberty Global, Inc. (Series C), Media | | 2.7 | % |
CA, Inc., Software | | 2.5 | |
Symantec Corp., Software | | 2.3 | |
Lear Corp., Auto Components | | 2.1 | |
JPMorgan Chase & Co., Diversified Financial Services | | 2.1 | |
Holdings reflect only long-term investments and are subject to change.
| | | |
| Five Largest Industries expressed as a percentage of net assets as of 8/31/10 | | | |
Oil, Gas & Consumable Fuels | | 14.2 | % |
Media | | 7.5 | |
Capital Markets | | 6.7 | |
Insurance | | 6.4 | |
Pharmaceuticals | | 6.2 | |
Industry weightings reflect only long-term investments and are subject to change.
| | |
| 6 | | Visit our website at www.prudentialfunds.com |
Strategy and Performance Overview
How did the Fund perform?
The Prudential Jennison Value Fund’s Class A shares gained 5.44% for the 12-month reporting period that ended August 31, 2010, outperforming the 4.96% return of its benchmark, the Russell 1000 Value Index, and the 2.11% return of the Lipper Large-Cap Value Funds Average*.
Nearly all sectors in the Index ended the reporting period in positive territory. Six posted double-digit gains led by the consumer discretionary sector, which was followed by materials, industrials, telecommunication services, utilities, and consumer staples. Energy and healthcare scored modest, single-digit gains, while the financials and information technology sectors declined.
The Fund had gains across a variety of sectors that enabled it to provide a positive return and to outperform the Index. Telecommunication services and materials returned more than 46%, consumer discretionary and industrials delivered returns in excess of 15%, and energy, healthcare, and consumer staples also gained. Nearly all the aforementioned sectors also helped the Fund outperform the Index, except for industrials and consumer staples, as the Fund’s residual sector allocations resulted in relative loss.
As in the Index, the Fund’s positions in both financials and information technology finished the reporting period with losses. However, the Fund had an underweight in the former sector that contributed to its positive performance versus the Index. The Fund’s positions in utilities also declined, underperforming that of the Index.
What was the investment environment like for U.S. stocks?
Early in the reporting period that began on September 1, 2009, signs of economic stabilization led to a strong resurgence in the U.S. equity market. Distressed sale prices, low interest rates, increased availability of mortgage credit, and a tax credit for first-time homebuyers helped boost housing activity. Stimulus measures had also begun to revitalize car sales, and declines in retail sales and corporate revenue moderated.
In early 2010, the recovery in the United States seemed to be gaining momentum, as manufacturing activity increased and employment showed signs of reaching a positive turning point. Corporate profits improved largely due to workforce and inventory reductions. Favorable interest rate and liquidity conditions contributed to a continued rally in the equity market, as well.
*Prudential Investments believes the Lipper Large-Cap Value Funds Average is a more appropriate peer group for the Fund than the Lipper Multi-Cap Core Funds Average, which is the Fund’s official peer group.
| | | | |
| Prudential Jennison Value Fund | | | 7 | |
Strategy and Performance Overview (continued)
Clouds began to gather on the growth horizon as the year went on, however, and the pace of the economic recovery in the United States decelerated. Markets grappled with the effects of reduced stimulus in the housing sector, persistently subpar job creation, and flagging confidence indicators. On the other hand, wages continued to increase, private sector payrolls continued to grow, and corporate earnings continued to expand.
Certain developments in foreign nations also cast a shadow over the global economic recovery. An ongoing sovereign debt crisis in several European Union (EU) member states weakened the euro and prompted the EU to devise a lending and support package of almost $1 trillion. While stock prices initially rallied when the package was announced in May, the U.S. stock market ultimately posted a loss that month due in part to continued concern about the situation in Europe. Attempts in China to cool the domestic property market likewise had raised fears that global growth might slow more than anticipated.
The U.S. stock market also rose and fell with turns in Washington policy debates. Back in March, President Obama signed legislation to overhaul the U.S. health care system. Although the plan is projected to reduce the federal deficit over the longer term, many of its cost-savings provisions are slated to take effect later in the decade, suggesting that the budget deficit will likely surge in the near term, as health care expenditures compound the expansive debt incurred through stimulus spending and federal bailouts.
The President signed financial regulatory legislation in July that expands federal banking and securities regulation, subjecting a wider range of financial companies to government oversight. Among other things, it establishes a council of federal regulators with power to constrain and dismantle troubled companies; creates a new regulator to protect consumers of financial products; imposes regulations on derivatives; and generally restricts the ability of banks whose deposits are federally insured from trading for their own benefit.
In August, the U.S. Department of Commerce revised lower its estimate of real gross domestic product growth for the second quarter of 2010. The Federal Open Market Committee, the policy-setting arm of the Federal Reserve (the Fed), also lowered its assessment of U.S. growth prospects. Discussing economic performance over the past year, Fed Chairman Ben Bernanke described the recovery as “incomplete,” but added preconditions for a pickup in growth in 2011 appear to “remain in place,” as bank lending increases, concerns about the European sovereign debt crisis recede, and consumer savings increase. Though the stock market posted a loss for August amid
| | |
| 8 | | Visit our website at www.prudentialfunds.com |
lingering concern the U.S. economic recovery might stall, it still scored a gain for the reporting period overall.
Which holdings made the largest positive contribution to the Fund’s return?
The top contributors were telecom position NII Holdings, consumer-oriented holdings Cadbury, Ticketmaster Entertainment, Liberty Global, and information technology position IAC/InterActiveCorp.
Shares of Latin American wireless telecom service provider NII Holdings appreciated significantly, benefiting from stronger-than-expected net customer additions. During the second quarter, the company increased its full-year 2010 guidance. The company continues to benefit from the relatively strong Brazilian economy and an improving environment in Mexico. The Jennison investment team remains optimistic on NII Holdings’ strong fundamentals and significant growth potential in the emerging markets it serves.
The Fund owned Cadbury, which was Britain’s leading confectionary company, as the Jennison investment team thought the stock price did not fully reflect the firm’s improving margins and earnings resulting from its restructuring. Shares of Cadbury soared primarily due to Kraft Foods’ bid to acquire it. Cadbury also advanced after reporting a stellar third quarter of 2009. The portfolio managers sold the position at a profit as Cadbury’s shares were trading well above the price of the Kraft offer, which made the risk/reward profile less compelling, in their opinion.
Following the merger of Ticketmaster Entertainment and Live Nation, shares of the newly formed Live Nation Entertainment rose from Liberty Media’s announced tender offer to increase its stake in the merged entity. This acted as somewhat of a floor on valuation given the $12 tender offer. Live Nation Entertainment reported a fiscal fourth quarter that was in line with expectations and provided guidance for 2010. The portfolio managers sold the position in Live Nation Entertainment at a profit in the beginning of April on the view that its stock was almost fully valued.
Shares of Liberty Global, an international cable operator, rose as the provider of broadband internet and other services reported strong profits, driven by subscriber growth in two consecutive quarters. The firm also completed two major transactions thus far in 2010. In late January, it bought all of Unity Media, the second largest cable operator in Germany. Jennison views the acquisition as a strategic fit with Liberty Global’s core European businesses at UPC Broadband and Telenet. In February, Liberty Global completed the sale of its 37.8% stake in Japanese cable operator J:Com, leaving Liberty Global a more streamlined company focused only on
| | | | |
| Prudential Jennison Value Fund | | | 9 | |
Strategy and Performance Overview (continued)
European cable operations. It continues to generate tremendous free cash flow and has authorized an increase of $250 million in its stock repurchase program, bringing total availability to about $309 million. Year-to-date, it has bought about $480 million of its common stock.
The Jennison investment team is not overly concerned with Liberty Global’s results for its fiscal second quarter, which missed consensus expectations due to losses on foreign currency transactions. Jennison maintains its conviction in Liberty Global, which trades at a significant discount to Jennison’s estimate of the private market value of the international cable operator. Liberty Global also has a higher free cash flow yield and higher growth than domestic cable operators, yet operates in less competitive markets. The Jennison investment team took some profits by trimming the Fund’s position due to valuation.
IAC/InterActiveCorp is an Internet company with more than 50 brands serving consumer audiences across more than 30 countries. The firm operates in four business segments: Search, Match, ServiceMagic and Media and Other Businesses. IAC has surpassed consensus expectations on a fairly regular basis and is enjoying faster growth than industry peers. In the most recently reported quarter (the second calendar quarter of 2010), IAC had significant upside to revenue and operating income before amortization, with performance driven across all segments.
IAC also generated a large amount of free cash flow and repurchased shares, enhancing shareholder value. With its solid cash position, primary revenue base in the United States (limited foreign exchange risk), strength in search, leadership in personal ads, and a share buyback program, the stock is viewed by Jennison as an alternative play on an Internet advertising recovery. The Jennison investment team took some profit by trimming the position due to valuation, but continues to hold the stock, as it is selling at a discount to free cash flow.
Which holdings detracted most from the Fund’s return?
Information technology positions Flextronics International, CA Technologies (CA), and Dell, as well as financials holding Wells Fargo, were among the biggest detractors from the Fund’s return.
Jennison continues to believe in its investment thesis on Flextronics. Shares of Flextronics fell as expectations for growth in the demand for personal computers by businesses and consumers moderated amid an uncertain economic recovery. According to the Jennison investment team, Flextronics’ two competitive advantages are its scale and footprint. Flextronics is the second largest electronics, manufacturing
| | |
| 10 | | Visit our website at www.prudentialfunds.com |
and services company in the world and among the lowest-cost producers, primarily due to its dominant presence in newly industrialized nations such as China, Hungary, Mexico, and Poland. Jennison believes the market underestimates the company’s operating leverage and earnings strength. During August, Flextronics also announced that its board of directors authorized an additional $200 million of share repurchases, which should help support the price of its stock.
CA, an enterprise software company, underperformed primarily due to declines in May 2010, when the company reported a shortfall in revenues and a drop in bookings, partially due to weaker results in the Internet security business. The disappointment came on the heels of the previous month’s announcement of lowered guidance. Accordingly, analysts adjusted their expectations lower, and the results still failed to meet those lowered expectations.
In its latest fiscal quarter, CA beat consensus estimates for both revenues and earnings per share. However, bookings, a volatile metric on a quarterly basis, were weak. The Jennison investment team expects the corporate cycle for replacing mainframe computers to accelerate during the remainder of 2010, and it believes CA’s stock price does not reflect the firm’s potential earnings and ability to generate large amounts of free cash flow. While Jennison believes CA has the right strategy, it may take time for the company’s name to become closely associated with virtualization and cloud computing in the minds of consumers. As part of its continued investment in virtualization and cloud management, CA acquired privately-held 4Base Technology, a virtualization and cloud infrastructure consulting firm, and privately-held Arcot Systems, a leader in providing advanced authentication and fraud prevention services through on-premises software or cloud services.
Despite reporting two consecutive solid quarters of profit growth, computer holding Dell declined due to disappointing gross margins. The company reaffirmed its outlook for the second half of its fiscal year, anticipating revenue growth of 14% to 19% and income growth of 18% to 23%, excluding items. Jennison thinks Dell should continue to benefit from the corporate refresh cycles for replacing personal computers and servers. Furthermore, Dell’s integration of Perot Systems shows early signs of going well, with revenue from services doubling year over year. Potential cost savings from restructuring initiatives could also provide upside to Dell shares.
Wells Fargo & Co provides retail, commercial, and corporate banking services principally in the United States. While Wells Fargo’s housing and mortgage exposure has hurt its stock in recent months, the Jennison investment team believes it still has an attractive risk/reward profile. Like most of its peers, Wells Fargo has experienced
| | | | |
| Prudential Jennison Value Fund | | | 11 | |
Strategy and Performance Overview (continued)
contraction in net interest margin as loan growth declines and maturing higher-yielding loans and investments are replaced by lower-yielding ones. However, credit quality seems to be improving from a combination of slowly recovering economic conditions and steps taken by the bank over the past several years to tighten underwriting standards, mitigate losses, and exit portfolios with unattractive credit metrics.
Wells Fargo has seen the positive impact of these actions in the second calendar quarter of 2010, and Jennison expects lower loan-loss provisions for future quarters. Another overhang on the stock was recent legislative and regulatory changes from Washington, which have limited the ability of banks to increase interest rates and assess certain fees on debit cards and automated teller machine cards. Jennison believes the market has exaggerated the impact on Wells Fargo’s bottom line. In the manager’s view, Wells Fargo is attractively valued, trading under six times its normal earnings. The Wachovia Bank merger appears to be going well, and, in Jennison’s opinion, Wells Fargo should benefit from an economic turnaround.
| | |
| 12 | | Visit our website at www.prudentialfunds.com |
Comments on Five Largest Holdings
| 2.7% | Liberty Global, Inc., Media |
Please see comments in the largest positive contributors section.
Please see comments in the largest positive contributors section.
| 2.3% | Symantec Corp., Software |
Symantec is the world’s biggest provider of security, storage, and systems management solutions that help businesses and consumers secure and manage information. Symantec shares recently climbed on news of the pending Hewlett-Packard acquisition of 3PAR, a provider of utility storage systems, and the Intel acquisition of McAfee, a computer-security software maker, both of which priced in a premium on assets. In Jennison’s view, these mergers highlight the value of Symantec’s assets, which are currently not reflected in the stock price. Jennison believes Symantec’s valuation is compelling on the basis of its earnings and free cash. However, the Jennison investment team is monitoring Symantec’s effort to improve revenue performance.
| 2.1% | Lear Corp., Auto Components |
Lear is one of the largest and most well-known suppliers in two stable auto markets—automotive seat systems and electrical distribution systems. The Jennison investment team believes a combination of a multi-year recovery in global light vehicle production and new business are key drivers of long-term revenue growth for Lear. Jennison also likes Lear’s cash position, which could provide some measure of downside protection for its share price.
| 2.1% | JPMorgan Chase & Co., Diversified Financial Services |
JPMorgan Chase is one of the world’s largest financial services firms. It has more than 5,000 consumer bank branches in the United States and is among the nation’s top mortgage lenders and credit card issuers. JPM also boasts formidable investment banking and asset management operations. Jennison expects the bank’s profitability to rise as the economy recovers.
| | | | |
| Prudential Jennison Value Fund | | | 13 | |
Fees and Expenses (Unaudited)
As a shareholder of the Fund, you incur two types of costs: (1) transaction costs, including sales charges (loads) on purchase payments and redemptions, as applicable, and (2) ongoing costs, including management fees, distribution and/or service (12b-1) fees, and other Fund expenses, as applicable. This example is intended to help you understand your ongoing costs (in dollars) of investing in the Fund and to compare these costs with the ongoing costs of investing in other mutual funds.
The example is based on an investment of $1,000 invested on March 1, 2010, at the beginning of the period, and held through the six-month period ended August 31, 2010. The example is for illustrative purposes only; you should consult the Prospectus for information on initial and subsequent minimum investment requirements.
The Fund’s transfer agent may charge additional fees to holders of certain accounts that are not included in the expenses shown in the table on the following page. These fees apply to individual retirement accounts (IRAs) and Section 403(b) accounts. As of the close of the six-month period covered by the table, IRA fees included an annual maintenance fee of $15 per account (subject to a maximum annual maintenance fee of $25 for all accounts held by the same shareholder). Section 403(b) accounts are charged an annual $25 fiduciary maintenance fee. Some of the fees may vary in amount, or may be waived, based on your total account balance or the number of Prudential Investments funds, including the Fund, that you own. You should consider the additional fees that were charged to your Fund account over the six-month period when you estimate the total ongoing expenses paid over the period and the impact of these fees on your ending account value, as these additional expenses are not reflected in the information provided in the expense table. Additional fees have the effect of reducing investment returns.
Actual Expenses
The first line for each share class in the table on the following page provides information about actual account values and actual expenses. You may use the information on this line, together with the amount you invested, to estimate the expenses that you paid over the period. Simply divide your account value by $1,000 (for example, an $8,600 account value ÷ $1,000 = 8.6), then multiply the result by the number on the first line under the heading “Expenses Paid During the Six-Month Period” to estimate the expenses you paid on your account during this period.
Hypothetical Example for Comparison Purposes
The second line for each share class in the table on the following page provides information about hypothetical account values and hypothetical expenses based on the Fund’s actual expense ratio and an assumed rate of return of 5% per year before expenses, which is not the Fund’s actual return. The hypothetical account values and expenses may not be used to estimate the actual ending account balance or expenses you paid for the period. You may use this information to compare the ongoing costs
| | |
| 14 | | Visit our website at www.prudentialfunds.com |
of investing in the Fund and other funds. To do so, compare this 5% hypothetical example with the 5% hypothetical examples that appear in the shareholder reports of the other funds.
Please note that the expenses shown in the table are meant to highlight your ongoing costs only and do not reflect any transactional costs such as sales charges (loads). Therefore, the second line for each share class in the table is useful in comparing ongoing costs only and will not help you determine the relative total costs of owning different funds. In addition, if these transactional costs were included, your costs would have been higher.
| | | | | | | | | | | | | | | | | | |
Prudential Jennison
Value Fund | | Beginning Account
Value March 1, 2010 | | | Ending Account
Value August 31, 2010 | | | Annualized
Expense Ratio
Based on the
Six-Month Period | | | Expenses Paid
During the
Six-Month Period* | |
| | | | | | | | | | | | | | | | | | |
| Class A | | Actual | | $ | 1,000.00 | | | $ | 929.50 | | | | 1.08 | % | | $ | 5.25 | |
| | | Hypothetical | | $ | 1,000.00 | | | $ | 1,019.76 | | | | 1.08 | % | | $ | 5.50 | |
| | | | | | | | | | | | | | | | | | |
| Class B | | Actual | | $ | 1,000.00 | | | $ | 926.30 | | | | 1.78 | % | | $ | 8.64 | |
| | | Hypothetical | | $ | 1,000.00 | | | $ | 1,016.23 | | | | 1.78 | % | | $ | 9.05 | |
| | | | | | | | | | | | | | | | | | |
| Class C | | Actual | | $ | 1,000.00 | | | $ | 925.60 | | | | 1.78 | % | | $ | 8.64 | |
| | | Hypothetical | | $ | 1,000.00 | | | $ | 1,016.23 | | | | 1.78 | % | | $ | 9.05 | |
| | | | | | | | | | | | | | | | | | |
| Class L | | Actual | | $ | 1,000.00 | | | $ | 928.60 | | | | 1.28 | % | | $ | 6.22 | |
| | | Hypothetical | | $ | 1,000.00 | | | $ | 1,018.75 | | | | 1.28 | % | | $ | 6.51 | |
| | | | | | | | | | | | | | | | | | |
| Class M | | Actual | | $ | 1,000.00 | | | $ | 929.90 | | | | 1.03 | % | | $ | 5.01 | |
| | | Hypothetical | | $ | 1,000.00 | | | $ | 1,020.01 | | | | 1.03 | % | | $ | 5.24 | |
| | | | | | | | | | | | | | | | | | |
| Class R | | Actual | | $ | 1,000.00 | | | $ | 928.70 | | | | 1.28 | % | | $ | 6.22 | |
| | | Hypothetical | | $ | 1,000.00 | | | $ | 1,018.75 | | | | 1.28 | % | | $ | 6.51 | |
| | | | | | | | | | | | | | | | | | |
| Class X | | Actual | | $ | 1,000.00 | | | $ | 929.30 | | | | 1.03 | % | | $ | 5.01 | |
| | | Hypothetical | | $ | 1,000.00 | | | $ | 1,020.01 | | | | 1.03 | % | | $ | 5.24 | |
| | | | | | | | | | | | | | | | | | |
| Class Z | | Actual | | $ | 1,000.00 | | | $ | 931.10 | | | | 0.78 | % | | $ | 3.80 | |
| | | Hypothetical | | $ | 1,000.00 | | | $ | 1,021.27 | | | | 0.78 | % | | $ | 3.97 | |
* Fund expenses (net of fee waivers or subsidies, if any) for each share class are equal to the annualized expense ratio for each share class (provided in the table), multiplied by the average account value over the period, multiplied by the 184 days in the six-month period ended August 31, 2010, and divided by the 365 days in the Fund's fiscal year ended August 31, 2010 (to reflect the six-month period). Expenses presented in the table include the expenses of any underlying portfolios in which the Fund may invest.
| | | | |
| Prudential Jennison Value Fund | | | 15 | |
Portfolio of Investments
as of August 31, 2010
| | | | | |
| Shares | | Description | | Value (Note 1) |
| | | | | |
LONG-TERM INVESTMENTS 96.9% |
COMMON STOCKS 94.9% |
|
Aerospace & Defense 1.6% |
| 94,766 | | Precision Castparts Corp. | | $ | 10,725,616 |
| 64,045 | | United Technologies Corp. | | | 4,176,374 |
| | | | | |
| | | | | 14,901,990 |
|
Auto Components 2.5% |
| 132,854 | | Johnson Controls, Inc. | | | 3,524,617 |
| 264,240 | | Lear Corp.(a) | | | 19,463,918 |
| | | | | |
| | | | | 22,988,535 |
|
Capital Markets 6.7% |
| 654,883 | | Bank of New York Mellon Corp. (The) | | | 15,894,010 |
| 64,869 | | Goldman Sachs Group, Inc. (The) | | | 8,883,161 |
| 357,398 | | Lazard Ltd. (Class A Stock) | | | 11,172,262 |
| 585,681 | | Morgan Stanley | | | 14,460,464 |
| 760,192 | | TD Ameritrade Holding Corp.(a)(b) | | | 11,106,405 |
| | | | | |
| | | | | 61,516,302 |
|
Chemicals 1.4% |
| 516,741 | | Dow Chemical Co. (The) | | | 12,592,978 |
|
Commercial Banks 1.5% |
| 570,421 | | Wells Fargo & Co. | | | 13,433,414 |
|
Commercial Services & Supplies 2.0% |
| 540,619 | | Waste Management, Inc.(b) | | | 17,889,083 |
|
Communications Equipment 1.0% |
| 233,950 | | QUALCOMM, Inc. | | | 8,962,624 |
|
Computers & Peripherals 1.5% |
| 1,145,732 | | Dell, Inc.(a) | | | 13,485,266 |
|
Consumer Finance 1.2% |
| 1,015,533 | | SLM Corp.(a)(b) | | | 11,221,640 |
|
Diversified Consumer Services 2.5% |
| 249,689 | | Apollo Group, Inc. (Class A Stock)(a) | | | 10,606,789 |
| 922,593 | | H&R Block, Inc. | | | 11,855,320 |
| | | | | |
| | | | | 22,462,109 |
See Notes to Financial Statements.
| | |
| Prudential Jennison Value Fund | | 17 |
Portfolio of Investments
as of August 31, 2010 continued
| | | | | |
| Shares | | Description | | Value (Note 1) |
| | | | | |
COMMON STOCKS (Continued) | | | |
| |
Diversified Financial Services 3.3% | | | |
| 875,562 | | Bank of America Corp. | | $ | 10,900,747 |
| 523,374 | | JPMorgan Chase & Co. | | | 19,029,878 |
| | | | | |
| | | | | 29,930,625 |
| |
Electric Utilities 2.0% | | | |
| 231,639 | | Entergy Corp. | | | 18,262,419 |
| |
Electronic Equipment & Instruments 1.7% | | | |
| 3,156,844 | | Flextronics International Ltd.(a) | | | 15,563,241 |
| |
Food & Staples Retailing 2.5% | | | |
| 476,703 | | Kroger Co. (The) | | | 9,405,350 |
| 267,716 | | Wal-Mart Stores, Inc. | | | 13,423,280 |
| | | | | |
| | | | | 22,828,630 |
| |
Food Products 5.4% | | | |
| 284,345 | | Bunge Ltd.(b) | | | 15,070,285 |
| 789,181 | | ConAgra Foods, Inc. | | | 17,038,418 |
| 270,329 | | Kraft Foods, Inc. (Class A Stock) | | | 8,096,354 |
| 559,325 | | Tyson Foods, Inc. (Class A Stock) | | | 9,161,743 |
| | | | | |
| | | | | 49,366,800 |
| |
Healthcare Providers & Services 3.0% | | | |
| 186,718 | | Aetna, Inc. | | | 4,989,105 |
| 549,105 | | Omnicare, Inc. | | | 10,542,816 |
| 196,467 | | UnitedHealth Group, Inc. | | | 6,231,933 |
| 104,764 | | WellPoint, Inc.(a) | | | 5,204,676 |
| | | | | |
| | | | | 26,968,530 |
| |
Hotels, Restaurants & Leisure 1.3% | | | |
| 278,490 | | Yum! Brands, Inc. | | | 11,613,033 |
| |
Independent Power Producers & Energy Traders 1.9% | | | |
| 771,590 | | Calpine Corp.(a) | | | 9,814,625 |
| 388,210 | | NRG Energy, Inc.(a) | | | 7,888,427 |
| | | | | |
| | | | | 17,703,052 |
See Notes to Financial Statements.
| | |
| 18 | | Visit our website at www.prudentialfunds.com |
| | | | | |
| Shares | | Description | | Value (Note 1) |
| | | | | |
COMMON STOCKS (Continued) | | | |
| |
Insurance 6.4% | | | |
| 156,670 | | Arch Capital Group Ltd.(a) | | $ | 12,502,266 |
| 423,281 | | Axis Capital Holdings Ltd. | | | 13,070,917 |
| 131,748 | | Berkshire Hathaway, Inc. (Class B Stock)(a) | | | 10,379,108 |
| 344,894 | | MetLife, Inc. | | | 12,968,014 |
| 199,079 | | Travelers Cos., Inc. (The) | | | 9,750,889 |
| | | | | |
| | | | | 58,671,194 |
| |
Internet Software & Services 2.0% | | | |
| 754,722 | | IAC/InterActiveCorp(a) | | | 18,709,558 |
| |
Machinery 1.4% | | | |
| 379,366 | | Ingersoll-Rand PLC(b) | | | 12,340,776 |
| |
Media 7.5% | | | |
| 1,004,339 | | Comcast Corp. (Class A Stock) | | | 17,194,284 |
| 885,574 | | Liberty Global, Inc. (Series C)(a)(b) | | | 24,388,708 |
| 279,574 | | Time Warner Cable, Inc. | | | 14,428,814 |
| 404,087 | | Viacom, Inc. (Class B Stock) | | | 12,696,413 |
| | | | | |
| | | | | 68,708,219 |
| |
Metals & Mining 2.0% | | | |
| 295,553 | | Newmont Mining Corp. | | | 18,123,310 |
| |
Multi-Utilities 2.1% | | | |
| 368,513 | | Sempra Energy | | | 18,764,682 |
| |
Oil, Gas & Consumable Fuels 14.2% | | | |
| 291,098 | | Anadarko Petroleum Corp. | | | 13,387,597 |
| 196,567 | | Apache Corp. | | | 17,661,545 |
| 407,605 | | Canadian Natural Resources Ltd. | | | 13,080,044 |
| 164,911 | | EOG Resources, Inc. | | | 14,325,819 |
| 215,311 | | Murphy Oil Corp. | | | 11,532,057 |
| 160,216 | | Noble Energy, Inc.(b) | | | 11,179,873 |
| 210,252 | | Occidental Petroleum Corp. | | | 15,365,216 |
| 232,142 | | Southwestern Energy Co.(a) | | | 7,595,686 |
| 283,595 | | Suncor Energy, Inc. | | | 8,581,585 |
| 907,162 | | Williams Cos., Inc. (The) | | | 16,446,847 |
| | | | | |
| | | | | 129,156,269 |
See Notes to Financial Statements.
| | |
| Prudential Jennison Value Fund | | 19 |
Portfolio of Investments
as of August 31, 2010 continued
| | | | | |
| Shares | | Description | | Value (Note 1) |
| | | | | |
COMMON STOCKS (Continued) | | | |
| |
Pharmaceuticals 4.6% | | | |
| 325,254 | | Merck & Co., Inc. | | $ | 11,435,931 |
| 296,360 | | Mylan, Inc.(a)(b) | | | 5,085,538 |
| 250,331 | | Novartis AG (Switzerland), ADR(b) | | | 13,139,874 |
| 763,868 | | Pfizer, Inc. | | | 12,168,417 |
| | | | | |
| | | | | 41,829,760 |
| |
Real Estate Investment Trusts 0.7% | | | |
| 367,047 | | Annaly Capital Management, Inc. | | | 6,379,277 |
| |
Road & Rail 1.4% | | | |
| 259,760 | | CSX Corp. | | | 12,959,426 |
| |
Software 5.8% | | | |
| 1,290,849 | | CA, Inc. | | | 23,248,191 |
| 621,256 | | Nuance Communications, Inc.(a) | | | 9,120,038 |
| 1,533,198 | | Symantec Corp.(a) | | | 20,897,489 |
| | | | | |
| | | | | 53,265,718 |
| |
Thrifts & Mortgage Finance 0.8% | | | |
| 586,023 | | People’s United Financial, Inc. | | | 7,454,213 |
| |
Wireless Telecommunication Services 3.0% | | | |
| 1,501,217 | | MetroPCS Communications, Inc.(a) | | | 13,420,880 |
| 392,931 | | NII Holdings, Inc.(a) | | | 14,243,749 |
| | | | | |
| | | | | 27,664,629 |
| | | | | |
| | TOTAL COMMON STOCKS
(cost $843,664,980) | | | 865,717,302 |
| | | | | |
| |
PREFERRED STOCKS 2.0% | | | |
| |
Consumer Finance 0.4% | | | |
| 6,530 | | SLM Corp., 7.250%, 12/15/10 (Series C) | | | 3,757,101 |
| |
Pharmaceuticals 1.6% | | | |
| 13,720 | | Mylan, Inc., 6.500%, 11/15/10 | | | 14,202,395 |
| | | | | |
| | TOTAL PREFERRED STOCKS
(cost $14,510,989) | | | 17,959,496 |
| | | | | |
| | TOTAL LONG-TERM INVESTMENTS
(cost $858,175,969) | | | 883,676,798 |
| | | | | |
See Notes to Financial Statements.
| | |
| 20 | | Visit our website at www.prudentialfunds.com |
| | | | | | |
| Shares | | Description | | Value (Note 1) | |
| | | | | | |
SHORT-TERM INVESTMENT 12.1% | | | | |
| |
AFFILIATED MONEY MARKET MUTUAL FUND 12.1% | | | | |
| 110,637,548 | | Prudential Investment Portfolios 2-Prudential Core Taxable Money Market Fund (cost $110,637,548; includes $84,741,115 of cash collateral received for securities on loan) (Note 3)(c)(d) | | $ | 110,637,548 | |
| | | | | | |
| | TOTAL INVESTMENTS 109.0%
(cost $968,813,517; Note 5) | | | 994,314,346 | |
| | Liabilities in excess of other assets (9.0%) | | | (82,307,415 | ) |
| | | | | | |
| | NET ASSETS 100.0% | | $ | 912,006,931 | |
| | | | | | |
The following abbreviation is used in the portfolio descriptions:
ADR—American Depositary Receipt
| (a) | Non-income producing security. |
| (b) | All or a portion of security is on loan. The aggregate market value of such securities is $82,134,187; cash collateral of $84,741,115 (included in liabilities) was received with which the Fund purchased highly liquid short-term investments. |
| (c) | Prudential Investments LLC, the manager of the Fund, also serves as manager of the Prudential Investment Portfolios 2-Prudential Core Taxable Money Market Fund. |
| (d) | Represents security, or a portion thereof, purchased with cash collateral received for securities on loan. |
Various inputs are used in determining the value of the Fund’s investments. These inputs are summarized in the three broad levels listed below.
Level 1—quoted prices in active markets for identical securities
Level 2—other significant observable inputs (including quoted prices for similar securities, interest rates, prepayment speeds, credit risk, etc.)
Level 3—significant unobservable inputs (including the Fund’s own assumptions in determining the fair value of investments)
See Notes to Financial Statements.
| | |
| Prudential Jennison Value Fund | | 21 |
Portfolio of Investments
as of August 31, 2010 continued
The following is a summary of the inputs used as of August 31, 2010 in valuing the Fund’s assets carried at fair value:
| | | | | | | | | |
| | | Level 1 | | Level 2 | | Level 3 |
Investments in Securities | | | | | | | | | |
Common Stocks | | $ | 865,717,302 | | $ | — | | $ | — |
Preferred Stocks | | | 17,959,496 | | | — | | | — |
Affiliated Money Market Mutual Fund | | | 110,637,548 | | | — | | | — |
| | | | | | | | | |
Total | | $ | 994,314,346 | | $ | — | | $ | — |
| | | | | | | | | |
The industry classification of portfolio holdings and liabilities in excess of other assets shown as a percentage of net assets as of August 31, 2010 were as follows:
| | | |
Oil, Gas & Consumable Fuels | | 14.2 | % |
Affiliated Money Market Mutual Fund (including 9.3% of collateral received for securities on loan) | | 12.1 | |
Media | | 7.5 | |
Capital Markets | | 6.7 | |
Insurance | | 6.4 | |
Pharmaceuticals | | 6.2 | |
Software | | 5.8 | |
Food Products | | 5.4 | |
Diversified Financial Services | | 3.3 | |
Healthcare Providers & Services | | 3.0 | |
Wireless Telecommunication Services | | 3.0 | |
Auto Components | | 2.5 | |
Diversified Consumer Services | | 2.5 | |
Food & Staples Retailing | | 2.5 | |
Multi-Utilities | | 2.1 | |
Commercial Services & Supplies | | 2.0 | |
Electric Utilities | | 2.0 | |
Internet Software & Services | | 2.0 | |
Metals & Mining | | 2.0 | |
Independent Power Producers & Energy Traders | | 1.9 | |
Electronic Equipment & Instruments | | 1.7 | |
Aerospace & Defense | | 1.6 | |
Consumer Finance | | 1.6 | |
Commercial Banks | | 1.5 | |
Computers & Peripherals | | 1.5 | |
See Notes to Financial Statements.
| | |
| 22 | | Visit our website at www.prudentialfunds.com |
| | | |
Chemicals | | 1.4 | % |
Machinery | | 1.4 | |
Road & Rail | | 1.4 | |
Hotels, Restaurants & Leisure | | 1.3 | |
Communications Equipment | | 1.0 | |
Thrifts & Mortgage Finance | | 0.8 | |
Real Estate Investment Trusts | | 0.7 | |
| | | |
| | 109.0 | |
Liabilities in excess of other assets | | (9.0 | ) |
| | | |
| | 100.0 | % |
| | | |
See Notes to Financial Statements.
| | |
| Prudential Jennison Value Fund | | 23 |
Statement of Assets and Liabilities
as of August 31, 2010
| | | | |
Assets | | | | |
Investments at value, including securities on loan of $82,134,187: | | | | |
Unaffiliated investments (cost $858,175,969) | | $ | 883,676,798 | |
Affiliated investments (cost $110,637,548) | | | 110,637,548 | |
Cash | | | 6 | |
Receivable for Fund shares sold | | | 11,613,922 | |
Receivable for investments sold | | | 9,081,443 | |
Dividends and interest receivable | | | 1,414,916 | |
Foreign tax reclaim receivable | | | 158,144 | |
Prepaid expenses | | | 23,765 | |
| | | | |
Total assets | | | 1,016,606,542 | |
| | | | |
| |
Liabilities | | | | |
Payable to broker for collateral for securities on loan | | | 84,741,115 | |
Payable for Fund shares reacquired | | | 11,916,894 | |
Payable for investments purchased | | | 6,893,026 | |
Management fee payable | | | 442,668 | |
Accrued expenses | | | 293,786 | |
Distribution fee payable | | | 195,604 | |
Affiliated transfer agent fee payable | | | 107,960 | |
Deferred trustees' fees | | | 8,558 | |
| | | | |
Total liabilities | | | 104,599,611 | |
| | | | |
| |
Net Assets | | $ | 912,006,931 | |
| | | | |
| | | | | |
Net assets were comprised of: | | | | |
Shares of beneficial interest, at par | | $ | 743,594 | |
Paid-in capital in excess of par | | | 1,128,328,961 | |
| | | | |
| | | 1,129,072,555 | |
Undistributed net investment income | | | 3,239,926 | |
Accumulated net realized loss on investment and foreign currency transactions | | | (245,809,637 | ) |
Net unrealized appreciation on investments and foreign currencies | | | 25,504,087 | |
| | | | |
Net assets, August 31, 2010 | | $ | 912,006,931 | |
| | | | |
See Notes to Financial Statements.
| | |
| 24 | | Visit our website at www.prudentialfunds.com |
| | | |
Class A | | | |
Net asset value and redemption price per share | | | |
($543,424,121 ÷ 44,293,870 shares of beneficial interest issued and outstanding) | | $ | 12.27 |
Maximum sales charge (5.50% of offering price) | | | .71 |
| | | |
Maximum offering price to public | | $ | 12.98 |
| | | |
| |
Class B | | | |
Net asset value, offering price and redemption price per share | | | |
($23,812,545 ÷ 1,973,582 shares of beneficial interest issued and outstanding) | | $ | 12.07 |
| | | |
| |
Class C | | | |
Net asset value, offering price and redemption price per share | | | |
($28,712,666 ÷ 2,380,536 shares of beneficial interest issued and outstanding) | | $ | 12.06 |
| | | |
| |
Class L | | | |
Net asset value, offering price and redemption price per share | | | |
($1,549,891 ÷ 126,762 shares of beneficial interest issued and outstanding) | | $ | 12.23 |
| | | |
| |
Class M | | | |
Net asset value, offering price and redemption price per share | | | |
($1,186,056 ÷ 97,243 shares of beneficial interest issued and outstanding) | | $ | 12.20 |
| | | |
| |
Class R | | | |
Net asset value, offering price and redemption price per share | | | |
($9,583,315 ÷ 783,151 shares of beneficial interest issued and outstanding) | | $ | 12.24 |
| | | |
| |
Class X | | | |
Net asset value, offering price and redemption price per share | | | |
($571,939 ÷ 46,793 shares of beneficial interest issued and outstanding) | | $ | 12.22 |
| | | |
| |
Class Z | | | |
Net asset value, offering price and redemption price per share | | | |
($303,166,398 ÷ 24,657,432 shares of beneficial interest issued and outstanding) | | $ | 12.30 |
| | | |
See Notes to Financial Statements.
| | |
| Prudential Jennison Value Fund | | 25 |
Statement of Operations
Year Ended August 31, 2010
| | | | |
Net Investment Income | | | | |
Income | | | | |
Unaffiliated dividends (net of foreign withholding taxes of $181,060) | | $ | 13,335,459 | |
Affiliated income from securities loaned, net | | | 124,813 | |
Affiliated dividend income | | | 74,308 | |
Unaffiliated interest income | | | 17,123 | |
| | | | |
Total income | | | 13,551,703 | |
| | | | |
| |
Expenses | | | | |
Management fee | | | 5,210,559 | |
Distribution fee—Class A | | | 1,826,388 | |
Distribution fee—Class B | | | 290,603 | |
Distribution fee—Class C | | | 312,591 | |
Distribution fee—Class L | | | 9,079 | |
Distribution fee—Class M | | | 4,942 | |
Distribution fee—Class R | | | 42,240 | |
Distribution fee—Class X | | | 2,273 | |
Transfer agent’s fees and expenses (including affiliated expense of $501,600) (Note 3) | | | 1,421,000 | |
Reports to shareholders | | | 218,000 | |
Custodian’s fees and expenses | | | 128,000 | |
Registration fees | | | 124,000 | |
Trustees’ fees | | | 38,000 | |
Legal fees and expenses | | | 36,000 | |
Audit fee | | | 22,000 | |
Insurance | | | 17,000 | |
Miscellaneous | | | 18,269 | |
| | | | |
Total expenses | | | 9,720,944 | |
| | | | |
Net investment income | | | 3,830,759 | |
| | | | |
| |
Realized And Unrealized Gain (Loss) On Investment And Foreign Currency Transactions | | | | |
Net realized gain on: | | | | |
Investment transactions | | | 35,460,580 | |
Foreign currency transactions | | | 323 | |
| | | | |
| | | 35,460,903 | |
| | | | |
Net change in unrealized appreciation (depreciation) on: | | | | |
Investments | | | (5,072,871 | ) |
Foreign currencies | | | (69 | ) |
| | | | |
| | | (5,072,940 | ) |
| | | | |
Net gain on investment and foreign currency transactions | | | 30,387,963 | |
| | | | |
Net Increase In Net Assets Resulting From Operations | | $ | 34,218,722 | |
| | | | |
See Notes to Financial Statements.
| | |
| 26 | | Visit our website at www.prudentialfunds.com |
Statement of Changes in Net Assets
| | | | | | | | |
| | | Year Ended August 31, | |
| | | 2010 | | | 2009 | |
Increase (Decrease) In Net Assets | | | | | | | | |
Operations | | | | | | | | |
Net investment income | | $ | 3,830,759 | | | $ | 4,332,472 | |
Net realized gain (loss) on investment and foreign currency transactions | | | 35,460,903 | | | | (262,732,442 | ) |
Net change in unrealized appreciation (depreciation) on investments and foreign currencies | | | (5,072,940 | ) | | | 20,765,766 | |
| | | | | | | | |
Net increase (decrease) in net assets resulting from operations | | | 34,218,722 | | | | (237,634,204 | ) |
| | | | | | | | |
Dividends and distributions (Note 1) | | | | | | | | |
Dividends from net investment income: | | | | | | | | |
Class A | | | (1,720,099 | ) | | | (5,718,887 | ) |
Class B | | | (253 | ) | | | (49,455 | ) |
Class C | | | (272 | ) | | | (36,609 | ) |
Class L | | | (2,137 | ) | | | (13,511 | ) |
Class M | | | (5,068 | ) | | | (4,469 | ) |
Class R | | | (7,751 | ) | | | (30,346 | ) |
Class X | | | (3,352 | ) | | | (11,336 | ) |
Class Z | | | (1,340,154 | ) | | | (1,189,492 | ) |
| | | | | | | | |
| | | (3,079,086 | ) | | | (7,054,105 | ) |
| | | | | | | | |
Distributions from net realized gains: | | | | | | | | |
Class A | | | — | | | | (45,131,403 | ) |
Class B | | | — | | | | (3,373,547 | ) |
Class C | | | — | | | | (2,497,205 | ) |
Class L | | | — | | | | (151,796 | ) |
Class M | | | — | | | | (304,877 | ) |
Class R | | | — | | | | (340,944 | ) |
Class X | | | — | | | | (121,645 | ) |
Class Z | | | — | | | | (6,884,634 | ) |
| | | | | | | | |
| | | — | | | | (58,806,051 | ) |
| | | | | | | | |
Capital Contributions (Note 2) | | | | | | | | |
Class M | | | 1,912 | | | | 1,032 | |
Class X | | | 398 | | | | 2,885 | |
| | | | | | | | |
| | | 2,310 | | | | 3,917 | |
| | | | | | | | |
Fund share transactions (Net of share conversions) (Note 6) | | | | | | | | |
Net proceeds from shares sold | | | 423,060,582 | | | | 92,398,458 | |
Net asset value of shares issued in reinvestment of dividends and distributions | | | 2,133,448 | | | | 62,510,424 | |
Cost of shares reacquired | | | (266,942,821 | ) | | | (184,608,493 | ) |
| | | | | | | | |
Net increase (decrease) in net assets from Fund share transactions | | | 158,251,209 | | | | (29,699,611 | ) |
| | | | | | | | |
Total increase (decrease) | | | 189,393,155 | | | | (333,190,054 | ) |
Net Assets | | | | | | | | |
Beginning of year | | | 722,613,776 | | | | 1,055,803,830 | |
| | | | | | | | |
End of year(a) | | $ | 912,006,931 | | | $ | 722,613,776 | |
| | | | | | | | |
(a) Includes undistributed net investment income of: | | $ | 3,239,926 | | | $ | 2,566,065 | |
| | | | | | | | |
See Notes to Financial Statements.
| | |
| Prudential Jennison Value Fund | | 27 |
Notes to Financial Statements
Prudential Investment Portfolios 7 (the “Portfolios”) is registered under the Investment Company Act of 1940, as amended, as a diversified, open-end, management investment company and currently consists of Prudential Jennison Value Fund (the “Fund”). The investment objective of the Fund is capital appreciation. It seeks to achieve this objective by investing primarily in common stocks and convertible securities that provide investment income returns above those of the Standard & Poor’s 500 Composite Stock Price Index and the Russell 1000 Value Index.
Note 1. Accounting Policies
The following is a summary of significant accounting policies followed by the Fund in the preparation of its financial statements.
Securities Valuation: Securities listed on a securities exchange are valued at the last sale price on such exchange on the day of valuation or, if there was no sale on such day, at the mean between the last reported bid and asked prices, or at the last bid price on such day in the absence of an asked price. Securities traded via NASDAQ are valued at the NASDAQ official closing price (“NOCP”) on the day of valuation, or if there was no NOCP, at the last sale price. Securities that are actively traded in the over-the-counter market, including listed securities for which the primary market is believed by Prudential Investments LLC (“PI” or “Manager”), in consultation with the Subadvisor(s); to be over-the-counter, are valued at market value using prices provided by an independent pricing agent or principal market maker. Futures contracts and options thereon traded on a commodities exchange or board of trade are valued at the last sale price at the close of trading on such exchange or board of trade or, if there was no sale on the applicable commodities exchange or board of trade on such day, at the mean between the most recently quoted prices on such exchange or board of trade or at the last bid price in the absence of an asked price. Prices may be obtained from independent pricing services which use information provided by market makers or estimates of market values obtained from yield data relating to investments or securities with similar characteristics. Securities for which reliable market quotations are not readily available, or whose values have been affected by events occurring after the close of the security’s foreign market and before the Fund’s normal pricing time, are valued at fair value in accordance with the Board of Trustees’ approved fair valuation procedures. When determining the fair valuation of securities, some of the factors influencing the valuation include the nature of any restrictions on disposition of the securities; assessment of the general liquidity of the
| | |
| 28 | | Visit our website at www.prudentialfunds.com |
securities; the issuer’s financial condition and the markets in which it does business; the cost of the investment; the size of the holding and the capitalization of issuer; the prices of any recent transactions or bids/offers for such securities or any comparable securities; any available analyst media or other reports or information deemed reliable by the investment adviser regarding the issuer or the markets or industry in which it operates. Using fair value to price securities may result in a value that is different from a security’s most recent closing price and from the price used by other mutual funds to calculate their net asset values.
Investments in open end, non exchange-traded mutual funds are valued at their net asset value as of the close of the New York Stock Exchange on the date of valuation.
Short-term debt securities of sufficient credit quality which mature in 60 days or less, are valued at amortized cost, which approximates fair value. The amortized cost method includes valuing a security at its cost on the date of purchase and thereafter assuming a constant amortization to maturity of the difference between the principal amount due at maturity and cost. Short-term debt securities which mature in more than 60 days are valued at fair value.
Foreign Currency Translation: The books and records of the Fund are maintained in U.S. dollars. Foreign currency amounts are translated into U.S. dollars on the following basis:
(i) market value of investment securities, other assets and liabilities-at the current rates of exchange;
(ii) purchases and sales of investment securities, income and expenses-at the rates of exchange prevailing on the respective dates of such transactions.
The Fund does not isolate that portion of the results of operations arising as a result of changes in the foreign exchange rates from the fluctuations arising from changes in the market prices of long term securities held at the end of the fiscal year. Similarly, the Fund does not isolate the effect of changes in foreign exchange rates from the fluctuations arising from changes in the market prices of portfolio securities sold during the fiscal year. Accordingly, realized foreign currency gains or losses are included in the reported net realized gains or losses on investment transactions. Net realized gains or losses on foreign currency transactions represent net foreign exchange gains or losses from the holding of foreign currencies, currency gains or losses realized between the trade and settlement dates on security transactions, and the difference between the amounts of dividends, interest and foreign withholding taxes recorded on the Fund’s books and the U.S. dollar equivalent amounts actually received or paid. Net unrealized currency gains or losses from valuing foreign
| | |
| Prudential Jennison Value Fund | | 29 |
Notes to Financial Statements
continued
currency denominated assets and liabilities (other than investments) at period end exchange rates are reflected as a component of net unrealized appreciation (depreciation) on foreign currencies.
Foreign security and currency transactions may involve certain considerations and risks not typically associated with those of domestic origin as a result of, among other factors, the possibility of political or economic instability or the level of governmental supervision and regulation of foreign securities markets.
Restricted Securities: The Fund may hold up to 15% of its net assets in illiquid securities, including those which are restricted as to disposition under securities law (“restricted securities”). Restricted securities are valued pursuant to the valuation procedures noted above.
Warrants: The Fund may hold warrants acquired either through a direct purchase, including as part of private placement, or pursuant to corporate actions. Warrants entitle the holder to buy a proportionate amount of common stock at a specific price and time through the expiration dates. Such warrants are held as long positions by the Fund until exercised, sold or expired. Warrants are valued at fair value in accordance with the Board of Trustees’ approved fair valuation procedures.
Securities Transactions and Net Investment Income: Securities transactions are recorded on the trade date. Realized gains or losses from investment and currency transactions are calculated on the identified cost basis. Dividend income is recorded on the ex-dividend date and interest income, including amortization of premium and accretion of discount on debt securities, as required, is recorded on the accrual basis. Expenses are recorded on an accrual basis.
Net investment income or loss, (other than distribution fees, which are charged directly to the respective class) and unrealized and realized gains or losses are allocated daily to each class of shares based upon the relative proportion of net assets of each class at the beginning of the day.
Taxes: For federal income tax purposes, it is the Fund’s policy to continue to meet the requirements under the Internal Revenue Code applicable to regulated investment companies and to distribute all of its taxable net income and capital gains, if any, to shareholders. Therefore, no federal income tax provision is required.
| | |
| 30 | | Visit our website at www.prudentialfunds.com |
Withholding taxes on foreign dividends are recorded net of reclaimable amounts, at the time the related income is earned.
Dividends and Distributions: The Fund expects to pay dividends from net investment income and distributions from net realized capital and currency gains, if any, annually. Dividends and distributions to shareholders, which are determined in accordance with federal income tax regulations and which may differ from generally accepted accounting principles, are recorded on the ex-dividend date.
Securities Lending: The Fund may lend its portfolio securities to broker-dealers. The loans are secured by collateral at least equal, at all times, to the market value of the securities loaned.
Loans are subject to termination at the option of the borrower or the Fund. Upon termination of the loan, the borrower will return to the Fund securities identical to the loaned securities. Should the borrower of the securities fail financially, the Fund has the right to repurchase the securities using the collateral in the open market. The Fund recognizes income, net of any rebate and securities lending agent fees, for lending its securities in the form of fees or interest on the investment of any cash received as collateral. The Fund also continues to receive interest and dividends or amounts equivalent thereto, on the securities loaned and recognizes any unrealized gain or loss in the market price of the securities loaned that may occur during the term of the loan.
Estimates: The preparation of the financial statements requires management to make estimates and assumptions that affect the reported amounts and disclosures in the financial statements. Actual results could differ from those estimates.
Note 2. Agreements
The Fund has a management agreement with PI. Pursuant to this agreement, PI has responsibility for all investment advisory services and supervises the subadvisor’s performance of such services. PI has entered into a subadvisory agreement with Jennison Associates LLC (“Jennison”). The subadvisory agreement provides that Jennison furnishes investment advisory services in connection with the management of the Fund. In connection therewith, Jennison assumes the day-to-day management responsibilities of the Fund and is obligated to keep certain books and records of the Fund. PI pays for the services of Jennison, the cost of compensation of officers and employees of the Fund, occupancy and certain clerical and bookkeeping costs of the Fund. The Fund bears all other costs and expenses.
| | |
| Prudential Jennison Value Fund | | 31 |
Notes to Financial Statements
continued
The management fee paid to PI is computed daily and payable monthly at an annual rate of .60% of the Fund’s average daily net assets up to $500 million, .50% of the next $500 million, .475% of the next $500 million and .45% of the average daily net assets in excess of $1.5 billion. The effective management fee rate was .55% of the Fund’s average daily net assets for the year ended August 31, 2010.
The Fund has a distribution agreement with Prudential Investment Management Services LLC (“PIMS”), which acts as the distributor of the Class A, Class B, Class C, Class L, Class M, Class R, Class X and Class Z shares. The Fund compensates PIMS for distributing and servicing the Fund’s Class A, Class B, Class C, Class L, Class M, Class R and Class X shares, pursuant to plans of distribution (the “Class A, B, C, L, M, R and X Plans”), regardless of expenses actually incurred. The distribution fees are accrued daily and payable monthly. No distribution or service fees are paid to PIMS as distributor of the Class Z shares of the Fund. Pursuant to the Class A, B, C, L, M, R and X Plans, the Fund compensates PIMS for distribution related activities at an annual rate of up to .30%, 1%, 1%, .50%, 1%, .75% and 1% of the average daily net assets of the Class A, B, C, L, M, R and X shares, respectively. For the year ended August 31, 2010, PIMS contractually agreed to limit such fees to .50% of the average daily net assets of the Class R shares.
Management has received the maximum allowable amount of sales charges for Class M and Class X shares in accordance with regulatory limits. As such, any contingent deferred sales charges received by the manager are contributed back into the Fund and included in the Statement of Changes and Financial Highlights as a contribution to capital.
PIMS has advised the Fund that it has received $165,391 in front-end sales charges resulting from sales of Class A shares, during the year ended August 31, 2010. From these fees, PIMS paid such sales charges to affiliated broker-dealers, which in turn paid commissions to salespersons and incurred other distribution costs.
PIMS has advised the Fund that for the year ended August 31, 2010, it received $178, $43,008 and $1,904 in contingent deferred sales charges imposed upon certain redemptions by Class A, Class B and Class C shareholders, respectively.
PI, PIMS and Jennison are indirect, wholly-owned subsidiaries of Prudential Financial, Inc. (“Prudential”).
| | |
| 32 | | Visit our website at www.prudentialfunds.com |
Note 3. Other Transactions with Affiliates
Prudential Mutual Fund Services LLC (“PMFS”), an affiliate of PI and an indirect, wholly-owned subsidiary of Prudential, serves as the Fund’s transfer agent. Transfer agent fees and expenses in the Statement of Operations include certain out-of-pocket expenses paid to non-affiliates, where applicable.
The Fund pays networking fees to affiliated and unaffiliated broker/dealers including fees relating to the services of First Clearing, LLC (“First Clearing”) and Wells Fargo Advisors, LLC (“Wells Fargo”), affiliates of PI through December 31, 2009. These networking fees are payments made to broker/dealers that clear mutual fund transactions through a national clearing system. For the year ended August 31, 2010, the Fund incurred approximately $538,700 in total networking fees, of which approximately $10,600 and $40,400 were paid to First Clearing and Wells Fargo, respectively. These amounts are included in transfer agent’s fees and expenses in the Statement of Operations.
For the year ended August 31, 2010, Wells Fargo earned approximately $6,000 in broker commissions from portfolio transactions executed on behalf of the Fund.
Prudential Investment Management, Inc. (“PIM”), an indirect, wholly-owned subsidiary of Prudential, is the Fund’s security lending agent. For the year ended August 31, 2010, PIM has been compensated approximately $44,300 for these services.
The Fund invests in the Prudential Core Taxable Money Market Fund (the “Core Fund”), a portfolio of Prudential Investment Portfolios 2. The Core Fund is a money market mutual fund registered under the Investment Company Act of 1940, as amended, and managed by PI. Earnings from the Core Fund are disclosed on the Statement of Operations as affiliated dividend income.
Note 4. Portfolio Securities
Purchases and sales of investment securities, other than short-term investments, for the year ended August 31, 2010 were $658,646,430 and $506,502,056, respectively.
Note 5. Distributions and Tax Information
Distributions to shareholders, which are determined in accordance with federal income tax regulations and which may differ from generally accepted accounting
| | |
| Prudential Jennison Value Fund | | 33 |
Notes to Financial Statements
continued
principles, are recorded on the ex-dividend date. In order to present undistributed net investment income, accumulated net realized loss on investment and foreign currency transactions and paid-in capital in excess of par on the Statement of Assets and Liabilities that more closely represent their tax character, certain adjustments have been made to undistributed net investment income and accumulated net realized loss on investment and foreign currency transactions. For the year ended August 31, 2010, the adjustments were to decrease undistributed net investment income and decrease accumulated net realized loss on investment and foreign currency transactions by $77,812 due to the reclassification of net foreign currency losses. Net investment income, net realized gain on investment and foreign currency transactions and net assets were not affected by this change.
For the year ended August 31, 2010, the tax character of dividends paid by the Fund was $3,079,086 from ordinary income. For the year ended August 31, 2009, the tax character of dividends and distributions paid by the Fund were $7,054,105 from ordinary income and $58,806,051 from long-term capital gains.
As of August 31, 2010, the accumulated undistributed earnings on tax basis consisted of $3,281,869 from ordinary income.
The United States federal income tax basis of the Fund’s investments and the net unrealized appreciation as of August 31, 2010 were as follows:
| | | | | | |
Tax Basis | | Appreciation | | Depreciation | | Net
Unrealized
Appreciation |
| $976,869,634 | | $94,582,995 | | $(77,138,283) | | $17,444,712 |
The difference between book basis and tax basis is primarily attributable to the difference in the treatment of losses on wash sales and investments in partnerships.
For federal income tax purposes, the Fund had a capital loss carryforward as of August 31, 2010 of approximately $227,251,000 of which $119,928,000 expires in 2017 and $107,323,000 expires in 2018. Accordingly, no capital gains distribution is expected to be paid to shareholders until net gains have been realized in excess of such carryforwards. It is uncertain if the Fund will be able to realize the full benefit of the remaining carryforwards prior to the expiration date. The Fund elected to treat
| | |
| 34 | | Visit our website at www.prudentialfunds.com |
post-October capital and foreign currency losses of approximately $10,457,000 and $78,000, respectively, as having been incurred in the fiscal year ending August 31, 2011.
Management has analyzed the Fund’s tax positions taken on federal income tax returns for all open tax years and has concluded that as of August 31, 2010, no provision for income tax would be required in the Fund’s financial statements. The Fund’s federal and state income and federal excise tax returns for tax years for which the applicable statutes of limitations have not expired are subject to examination by the Internal Revenue Service and state departments of revenue.
Note 6. Capital
The Fund offers Class A, Class B, Class C, Class L, Class M, Class R, Class X and Class Z shares. Class A and Class L shares are sold with a front-end sales charge of up to 5.50% and 5.75%, respectively. All investors who purchase Class A or Class L shares in an amount of $1 million or more and sell these shares within 12 months of purchase are subject to a contingent deferred sales charge (“CDSC”) of 1%, including investors who purchase their shares through broker-dealers affiliated with Prudential. Class B shares are sold with a contingent deferred sales charge which declines from 5% to zero depending on the period of time the shares are held. Class C shares are sold with a contingent deferred sales charge of 1% during the first 12 months. Class M and Class X shares are sold with a contingent deferred sales charge which declines from 6% to zero depending on the period of time the shares are held. Class B shares automatically convert to Class A shares on a quarterly basis approximately seven years after purchase. Class M shares automatically convert to Class A shares approximately eight years after purchase. Class X shares automatically convert to Class A shares on a quarterly basis approximately ten years after purchase. A special exchange privilege is also available for shareholders who qualified to purchase Class A shares at net asset value. Class L shares are closed to most new purchases (with the exception of reinvested dividends). Class M and Class X shares are closed to new initial purchases. Class L, Class M and Class X shares are only available through exchanges from the same class of shares of certain other funds. Class R and Class Z shares are not subject to any sales or redemption charge and are available exclusively for sale to a limited group of investors.
The Fund has authorized an unlimited number of shares of beneficial interest at $.01 par value divided into eight classes, designated Class A, Class B, Class C, Class L, Class M, Class R, Class X and Class Z.
| | |
| Prudential Jennison Value Fund | | 35 |
Notes to Financial Statements
continued
Transactions in shares of beneficial interest were as follows:
| | | | | | | |
Class A | | Shares | | | Amount | |
Year ended August 31, 2010: | | | | | | | |
Shares sold | | 5,103,886 | | | $ | 66,610,153 | |
Shares issued in reinvestment of dividends and distributions | | 130,411 | | | | 1,661,453 | |
Shares reacquired | | (9,916,864 | ) | | | (128,623,050 | ) |
| | | | | | | |
Net increase (decrease) in shares outstanding before conversion | | (4,682,567 | ) | | | (60,351,444 | ) |
Shares issued upon conversion from Class B, Class M, and Class X | | 517,151 | | | | 6,667,403 | |
| | | | | | | |
Net increase (decrease) in shares outstanding | | (4,165,416 | ) | | $ | (53,684,041 | ) |
| | | | | | | |
Year ended August 31, 2009: | | | | | | | |
Shares sold | | 4,301,975 | | | $ | 43,805,134 | |
Shares issued in reinvestment of dividends and distributions | | 5,541,724 | | | | 48,156,908 | |
Shares reacquired | | (12,185,172 | ) | | | (123,855,946 | ) |
| | | | | | | |
Net increase (decrease) in shares outstanding before conversion | | (2,341,473 | ) | | | (31,893,904 | ) |
Shares issued upon conversion from Class B, Class M, and Class X | | 1,301,456 | | | | 13,857,269 | |
| | | | | | | |
Net increase (decrease) in shares outstanding | | (1,040,017 | ) | | $ | (18,036,635 | ) |
| | | | | | | |
Class B | | | | | | |
Year ended August 31, 2010: | | | | | | | |
Shares sold | | 206,481 | | | $ | 2,662,822 | |
Shares issued in reinvestment of dividends and distributions | | 20 | | | | 245 | |
Shares reacquired | | (497,284 | ) | | | (6,382,717 | ) |
| | | | | | | |
Net increase (decrease) in shares outstanding before conversion | | (290,783 | ) | | | (3,719,650 | ) |
Shares reacquired upon conversion into Class A | | (417,502 | ) | | | (5,285,329 | ) |
| | | | | | | |
Net increase (decrease) in shares outstanding | | (708,285 | ) | | $ | (9,004,979 | ) |
| | | | | | | |
Year ended August 31, 2009: | | | | | | | |
Shares sold | | 271,966 | | | $ | 2,776,288 | |
Shares issued in reinvestment of dividends and distributions | | 385,007 | | | | 3,318,820 | |
Shares reacquired | | (814,775 | ) | | | (8,207,232 | ) |
| | | | | | | |
Net increase (decrease) in shares outstanding before conversion | | (157,802 | ) | | | (2,112,124 | ) |
Shares reacquired upon conversion into Class A | | (1,183,935 | ) | | | (12,558,935 | ) |
| | | | | | | |
Net increase (decrease) in shares outstanding | | (1,341,737 | ) | | $ | (14,671,059 | ) |
| | | | | | | |
| | |
| 36 | | Visit our website at www.prudentialfunds.com |
| | | | | | | |
Class C | | Shares | | | Amount | |
Year ended August 31, 2010: | | | | | | | |
Shares sold | | 475,103 | | | $ | 6,132,360 | |
Shares issued in reinvestment of dividends and distributions | | 18 | | | | 225 | |
Shares reacquired | | (542,990 | ) | | | (6,959,009 | ) |
| | | | | | | |
Net increase (decrease) in shares outstanding | | (67,869 | ) | | $ | (826,424 | ) |
| | | | | | | |
Year ended August 31, 2009: | | | | | | | |
Shares sold | | 313,252 | | | $ | 3,253,098 | |
Shares issued in reinvestment of dividends and distributions | | 267,574 | | | | 2,306,491 | |
Shares reacquired | | (949,741 | ) | | | (9,692,923 | ) |
| | | | | | | |
Net increase (decrease) in shares outstanding | | (368,915 | ) | | $ | (4,133,334 | ) |
| | | | | | | |
Class L | | | | | | |
Year ended August 31, 2010: | | | | | | | |
Shares sold | | 2,656 | | | $ | 33,432 | |
Shares issued in reinvestment of dividends and distributions | | 165 | | | | 2,095 | |
Shares reacquired | | (30,480 | ) | | | (391,405 | ) |
| | | | | | | |
Net increase (decrease) in shares outstanding | | (27,659 | ) | | $ | (355,878 | ) |
| | | | | | | |
Year ended August 31, 2009: | | | | | | | |
Shares sold | | 9,298 | | | $ | 97,867 | |
Shares issued in reinvestment of dividends and distributions | | 18,840 | | | | 163,533 | |
Shares reacquired | | (49,471 | ) | | | (527,831 | ) |
| | | | | | | |
Net increase (decrease) in shares outstanding | | (21,333 | ) | | $ | (266,431 | ) |
| | | | | | | |
Class M | | | | | | |
Year ended August 31, 2010: | | | | | | | |
Shares sold | | 1,515 | | | $ | 18,997 | |
Shares issued in reinvestment of dividends and distributions | | 370 | | | | 4,678 | |
Shares reacquired | | (35,493 | ) | | | (453,370 | ) |
| | | | | | | |
Net increase (decrease) in shares outstanding before conversion | | (33,608 | ) | | | (429,695 | ) |
Shares reacquired upon conversion into Class A | | (83,363 | ) | | | (1,090,110 | ) |
| | | | | | | |
Net increase (decrease) in shares outstanding | | (116,971 | ) | | $ | (1,519,805 | ) |
| | | | | | | |
Year ended August 31, 2009: | | | | | | | |
Shares sold | | 16,534 | | | $ | 176,971 | |
Shares issued in reinvestment of dividends and distributions | | 33,709 | | | | 290,908 | |
Shares reacquired | | (91,837 | ) | | | (971,917 | ) |
| | | | | | | |
Net increase (decrease) in shares outstanding before conversion | | (41,594 | ) | | | (504,038 | ) |
Shares reacquired upon conversion into Class A | | (106,079 | ) | | | (1,059,011 | ) |
| | | | | | | |
Net increase (decrease) in shares outstanding | | (147,673 | ) | | $ | (1,563,049 | ) |
| | | | | | | |
| | |
| Prudential Jennison Value Fund | | 37 |
Notes to Financial Statements
continued
| | | | | | | |
Class R | | Shares | | | Amount | |
Year ended August 31, 2010: | | | | | | | |
Shares sold | | 540,389 | | | $ | 7,153,607 | |
Shares issued in reinvestment of dividends and distributions | | 592 | | | | 7,535 | |
Shares reacquired | | (237,258 | ) | | | (3,062,817 | ) |
| | | | | | | |
Net increase (decrease) in shares outstanding | | 303,723 | | | $ | 4,098,325 | |
| | | | | | | |
Year ended August 31, 2009: | | | | | | | |
Shares sold | | 348,849 | | | $ | 3,733,531 | |
Shares issued in reinvestment of dividends and distributions | | 42,775 | | | | 371,290 | |
Shares reacquired | | (203,099 | ) | | | (2,084,567 | ) |
| | | | | | | |
Net increase (decrease) in shares outstanding | | 188,525 | | | $ | 2,020,254 | |
| | | | | | | |
Class X | | | | | | |
Year ended August 31, 2010: | | | | | | | |
Shares sold | | 1,998 | | | $ | 26,707 | |
Shares issued in reinvestment of dividends and distributions | | 258 | | | | 3,270 | |
Shares reacquired | | (21,883 | ) | | | (278,260 | ) |
| | | | | | | |
Net increase (decrease) in shares outstanding before conversion | | (19,627 | ) | | | (248,283 | ) |
Shares reacquired upon conversion into Class A | | (22,386 | ) | | | (291,964 | ) |
| | | | | | | |
Net increase (decrease) in shares outstanding | | (42,013 | ) | | $ | (540,247 | ) |
| | | | | | | |
Year ended August 31, 2009: | | | | | | | |
Shares sold | | 13,558 | | | $ | 143,093 | |
Shares issued in reinvestment of dividends and distributions | | 15,380 | | | | 132,578 | |
Shares reacquired | | (44,524 | ) | | | (432,606 | ) |
| | | | | | | |
Net increase (decrease) in shares outstanding before conversion | | (15,586 | ) | | | (156,935 | ) |
Shares reacquired upon conversion into Class A | | (24,959 | ) | | | (239,323 | ) |
| | | | | | | |
Net increase (decrease) in shares outstanding | | (40,545 | ) | | $ | (396,258 | ) |
| | | | | | | |
Class Z | | | | | | |
Year ended August 31, 2010: | | | | �� | | | |
Shares sold | | 26,515,157 | | | $ | 340,422,504 | |
Shares issued in reinvestment of dividends and distributions | | 35,632 | | | | 453,947 | |
Shares reacquired | | (9,352,597 | ) | | | (120,792,193 | ) |
| | | | | | | |
Net increase (decrease) in shares outstanding | | 17,198,192 | | | $ | 220,084,258 | |
| | | | | | | |
Year ended August 31, 2009: | | | | | | | |
Shares sold | | 3,741,738 | | | $ | 38,412,476 | |
Shares issued in reinvestment of dividends and distributions | | 895,149 | | | | 7,769,896 | |
Shares reacquired | | (3,773,720 | ) | | | (38,835,471 | ) |
| | | | | | | |
Net increase (decrease) in shares outstanding | | 863,167 | | | $ | 7,346,901 | |
| | | | | | | |
| | |
| 38 | | Visit our website at www.prudentialfunds.com |
Note 7. Borrowings
The Fund, along with other affiliated registered investment companies (the “Funds”), is a party to a Syndicated Credit Agreement (“SCA”) with two banks. The SCA provides for a commitment of $500 million. Interest on any borrowings under the SCA would be incurred at contracted market rates and a commitment fee for the unused amount is accrued daily and paid quarterly. Effective October 22, 2009, the Funds renewed the SCA with the banks. The commitment under the renewed SCA continues to be $500 million. The Funds pay a commitment fee of ..15% of the unused portion of the renewed SCA. The expiration date of the renewed SCA has been extended from October 20, 2010 through December 24, 2010 under the same terms. The purpose of the SCA is to provide an alternative source of temporary funding for capital share redemptions. The Fund did not utilize the line of credit during the fiscal year ended August 31, 2010.
Note 8. New Accounting Pronouncement
In January 2010, the Financial Accounting Standards Board issued Accounting Standards Update (“ASU”) No. 2010-06 “Improving Disclosures about Fair Value Measurements”. ASU 2010-06 will require reporting entities to make new disclosures about amounts and reasons for significant transfers in and out of Level 1 and Level 2 fair value measurements and input and valuation techniques used to measure fair value for both recurring and nonrecurring fair value measurements that fall in either Level 2 or Level 3, and information on purchases, sales, issuances, and settlements in the roll forward of activity in Level 3 fair value measurements. The new and revised disclosures are effective for interim and annual reporting periods beginning after December 15, 2009 except for the disclosures about purchases, sales, issuances, and settlements in the roll forward of activity in Level 3 fair value measurements, which are effective for interim and annual reporting periods beginning after December 15, 2010. At this time, management is evaluating the implications of ASU No. 2010-06 and its impact on the financial statements has not been determined.
| | | | |
| Prudential Jennison Value Fund | | | 39 | |
Financial Highlights
| | | | | | | | | | | | | | | | | | |
| Class A Shares | |
| | | Year Ended August 31, | | | Ten-Month
Period
Ended
August 31, | | | Year Ended
October 31, | |
| | | 2010(a) | | | 2009(a) | | | 2008(a) | | | 2007(a)(c) | | | 2006(a) | | | 2005(a) | |
| Per Share Operating Performance: | | | | | | | | | | | | | | | | | | |
| Net Asset Value, Beginning Of Period | | $11.67 | | | $16.55 | | | $21.81 | | | $22.49 | | | $19.77 | | | $16.71 | |
| Income (loss) from investment operations: | | | | | | | | | | | | | | | | |
| Net investment income | | .05 | | | .07 | | | .15 | | | .16 | | | .22 | | | .14 | |
| Net realized and unrealized gain (loss) on investment and foreign currency transactions | | .59 | | | (3.87 | ) | | (2.01 | ) | | 1.61 | | | 3.56 | | | 3.07 | |
| Total from investment operations | | .64 | | | (3.80 | ) | | (1.86 | ) | | 1.77 | | | 3.78 | | | 3.21 | |
| Less Dividends and Distributions: | | | | | | | | | | | | | | | | | | |
| Dividends from net investment income | | (.04 | ) | | (.12 | ) | | (.20 | ) | | (.19 | ) | | (.14 | ) | | (.15 | ) |
| Distributions from net realized gains | | - | | | (.96 | ) | | (3.20 | ) | | (2.26 | ) | | (.92 | ) | | - | |
| Total dividends and distributions | | (.04 | ) | | (1.08 | ) | | (3.40 | ) | | (2.45 | ) | | (1.06 | ) | | (.15 | ) |
| Net asset value, end of period | | $12.27 | | | $11.67 | | | $16.55 | | | $21.81 | | | $22.49 | | | $19.77 | |
| Total Return(b): | | 5.44% | | | (20.76)% | | | (9.95)% | | | 8.66% | | | 19.85% | | | 19.31% | |
| |
| Ratios/Supplemental Data: | |
| Net assets, end of period (000) | | $543,424 | | | $565,420 | | | $819,162 | | | $1,010,160 | | | $946,315 | | | $771,540 | |
| Average net assets (000) | | $608,797 | | | $518,332 | | | $910,313 | | | $1,028,798 | | | $872,078 | | | $699,013 | |
| Ratios to average net assets(g): | | | | | | | | | | | | | | | | | | |
| Expenses, including distribution and service (12b-1) fees | | 1.07% | | | 1.14% | | | 1.00% | (d) | | .95% | (d)(e) | | .98% | (d) | | 1.04% | (d) |
| Expenses, excluding distribution and service (12b-1) fees | | .77% | | | .84% | | | .73% | | | .70% | (e) | | .73% | | | .79% | |
| Net investment income | | .36% | | | .68% | | | .83% | | | .90% | (e) | | 1.05% | | | .77% | |
| For Class A, B, C, L, M, R, X and Z shares: | | | | | | | | | | | | | | | | | | |
| Portfolio turnover rate | | 56% | | | 60% | | | 51% | | | 55% | (f) | | 49% | | | 56% | |
(a) Calculated based upon average shares outstanding during the period.
(b) Total return does not consider the effects of sales loads. Total return is calculated assuming a purchase of a share on the first day and a sale on the last day of each period reported, and includes reinvestment of dividends and distributions. Total returns may reflect adjustments to conform to generally accepted accounting principles. Total returns for periods less than a full year are not annualized.
(c) For the ten-month period ended August 31, 2007. The Fund changed its fiscal year end from October 31 to August 31, effective August 31, 2007.
(d) The distributor of the Fund contractually agreed to limit its distribution and service (12b-1) fees to .25% of the average daily net assets of the Class A shares through February 29, 2008.
(e) Annualized.
(f) Not annualized.
(g) Does not include expenses of the underlying portfolio in which the Fund invests.
See Notes to Financial Statements.
| | |
| 40 | | Visit our website at www.prudentialfunds.com |
| | | | | | | | | | | | | | | | | | |
| Class B Shares | |
| | | Year Ended August 31, | | | Ten-Month
Period
Ended
August 31, | | | Year Ended
October 31, | |
| | | 2010(a) | | | 2009(a) | | | 2008(a) | | | 2007(a)(b) | | | 2006(a) | | | 2005(a) | |
| Per Share Operating Performance: | | | | | | | | | | | | | | | | | | |
| Net Asset Value, Beginning Of Period | | $11.52 | | | $16.28 | | | $21.52 | | | $22.18 | | | $19.52 | | | $16.49 | |
| Income (loss) from investment operations: | | | | | | | | | | | | | | | | |
| Net investment income (loss) | | (.04 | ) | | - | (f) | | .02 | | | .03 | | | .07 | | | .02 | |
| Net realized and unrealized gain (loss) on investment and foreign currency transactions | | .59 | | | (3.79 | ) | | (2.00 | ) | | 1.60 | | | 3.51 | | | 3.02 | |
| Total from investment operations | | .55 | | | (3.79 | ) | | (1.98 | ) | | 1.63 | | | 3.58 | | | 3.04 | |
| Less Dividends and Distributions: | | | | | | | | | | | | | | | | | | |
| Dividends from net investment income | | - | (f) | | (.01 | ) | | (.06 | ) | | (.03 | ) | | - | | | (.01 | ) |
| Distributions from net realized gains | | - | | | (.96 | ) | | (3.20 | ) | | (2.26 | ) | | (.92 | ) | | - | |
| Total dividends and distributions | | - | (f) | | (.97 | ) | | (3.26 | ) | | (2.29 | ) | | (.92 | ) | | (.01 | ) |
| Net asset value, end of period | | $12.07 | | | $11.52 | | | $16.28 | | | $21.52 | | | $22.18 | | | $19.52 | |
| Total Return(c): | | 4.78% | | | (21.28)% | | | (10.65)% | | | 8.02% | | | 18.96% | | | 18.44% | |
| |
| Ratios/Supplemental Data: | |
| Net assets, end of period (000) | | $23,813 | | | $30,905 | | | $65,520 | | | $112,108 | | | $105,824 | | | $119,151 | |
| Average net assets (000) | | $29,060 | | | $33,718 | | | $87,249 | | | $112,785 | | | $112,070 | | | $161,840 | |
| Ratios to average net assets(e): | | | | | | | | | | | | | | | | | | |
| Expenses, including distribution and service (12b-1) fees | | 1.77% | | | 1.84% | | | 1.73% | | | 1.70% | (d) | | 1.73% | | | 1.79% | |
| Expenses, excluding distribution and service (12b-1) fees | | .77% | | | .84% | | | .73% | | | .70% | (d) | | .73% | | | .79% | |
| Net investment income (loss) | | (.33)% | | | - | (g) | | .11% | | | .15% | (d) | | .32% | | | .04% | |
(a) Calculated based upon average shares outstanding during the period.
(b) For the ten-month period ended August 31, 2007. The Fund changed its fiscal year end from October 31 to August 31, effective August 31, 2007.
(c) Total return does not consider the effects of sales loads. Total return is calculated assuming a purchase of a share on the first day and a sale on the last day of each period reported, and includes reinvestment of dividends and distributions. Total returns may reflect adjustments to conform to generally accepted accounting principles. Total returns for periods less than a full year are not annualized.
(d) Annualized.
(e) Does not include expenses of the underlying portfolio in which the Fund invests.
(f) Less than $.005 per share.
(g) Less than .005%.
See Notes to Financial Statements.
| | |
| Prudential Jennison Value Fund | | 41 |
Financial Highlights
continued
| | | | | | | | | | | | | | | | | | |
| Class C Shares | |
| | | Year Ended August 31, | | | Ten-Month
Period
Ended
August 31, | | | Year Ended October 31, | |
| | | 2010(a) | | | 2009(a) | | | 2008(a) | | | 2007(a)(b) | | | 2006(a) | | | 2005(a) | |
| Per Share Operating Performance: | | | | | | | | | | | | | | | | | | |
| Net Asset Value, Beginning Of Period | | $11.52 | | | $16.29 | | | $21.52 | | | $22.19 | | | $19.52 | | | $16.49 | |
| Income (loss) from investment operations: | | | | | | | | | | | | | | | | |
| Net investment income (loss) | | (.04 | ) | | - | (f) | | .02 | | | .02 | | | .06 | | | .01 | |
| Net realized and unrealized gain (loss) on investment and foreign currency transactions | | .58 | | | (3.80 | ) | | (1.99 | ) | | 1.60 | | | 3.53 | | | 3.03 | |
| Total from investment operations | | .54 | | | (3.80 | ) | | (1.97 | ) | | 1.62 | | | 3.59 | | | 3.04 | |
| Less Dividends and Distributions: | | | | | | | | | | | | | | | | | | |
| Dividends from net investment income | | - | (f) | | (.01 | ) | | (.06 | ) | | (.03 | ) | | - | | | (.01 | ) |
| Distributions from net realized gains | | - | | | (.96 | ) | | (3.20 | ) | | (2.26 | ) | | (.92 | ) | | - | |
| Total dividends and distributions | | - | (f) | | (.97 | ) | | (3.26 | ) | | (2.29 | ) | | (.92 | ) | | (.01 | ) |
| Net asset value, end of period | | $12.06 | | | $11.52 | | | $16.29 | | | $21.52 | | | $22.19 | | | $19.52 | |
| Total Return(c): | | 4.69% | | | (21.33)% | | | (10.61)% | | | 7.98% | | | 18.95% | | | 18.44% | |
| |
| Ratios/Supplemental Data: | |
| Net assets, end of period (000) | | $28,713 | | | $28,205 | | | $45,882 | | | $64,731 | | | $32,189 | | | $20,540 | |
| Average net assets (000) | | $31,259 | | | $27,260 | | | $55,511 | | | $52,776 | | | $24,812 | | | $20,814 | |
| Ratios to average net assets(e): | | | | | | | | | | | | | | | | | | |
| Expenses, including distribution and service (12b-1) fees | | 1.77% | | | 1.84% | | | 1.73% | | | 1.70% | (d) | | 1.73% | | | 1.79% | |
| Expenses, excluding distribution and service (12b-1) fees | | .77% | | | .84% | | | .73% | | | .70% | (d) | | .73% | | | .79% | |
| Net investment income (loss) | | (.33)% | | | (.02)% | | | .10% | | | .11% | (d) | | .29% | | | .05% | |
(a) Calculated based upon average shares outstanding during the period.
(b) For the ten-month period ended August 31, 2007. The Fund changed its fiscal year end from October 31 to August 31, effective August 31, 2007.
(c) Total return does not consider the effects of sales loads. Total return is calculated assuming a purchase of a share on the first day and a sale on the last day of each period reported, and includes reinvestment of dividends and distributions. Total returns may reflect adjustments to conform to generally accepted accounting principles. Total returns for periods less than a full year are not annualized.
(d) Annualized.
(e) Does not include expenses of the underlying portfolio in which the Fund invests.
(f) Less than $.005 per share.
See Notes to Financial Statements.
| | |
| 42 | | Visit our website at www.prudentialfunds.com |
| | | | | | | | | | | | |
| Class L Shares | |
| | | Year Ended August 31, | | | March 16, 2007(a)
through
August 31, | |
| | | 2010(b) | | | 2009(b) | | | 2008(b) | | | 2007(b)(c) | |
| Per Share Operating Performance: | | | | | | | | | | | | |
| Net Asset Value, Beginning Of Period | | $11.63 | | | $16.48 | | | $21.74 | | | $20.65 | |
| Income (loss) from investment operations: | | | | | | | |
| Net investment income | | .02 | | | .05 | | | .11 | | | .05 | |
| Net realized and unrealized gain (loss) on investment and foreign currency transactions | | .59 | | | (3.85 | ) | | (2.01 | ) | | 1.04 | |
| Total from investment operations | | .61 | | | (3.80 | ) | | (1.90 | ) | | 1.09 | |
| Less Dividends and Distributions: | | | | | | | | | | | | |
| Dividends from net investment income | | (.01 | ) | | (.09 | ) | | (.16 | ) | | - | |
| Distributions from net realized gains | | - | | | (.96 | ) | | (3.20 | ) | | - | |
| Total dividends and distributions | | (.01 | ) | | (1.05 | ) | | (3.36 | ) | | - | |
| Net asset value, end of period | | $12.23 | | | $11.63 | | | $16.48 | | | $21.74 | |
| Total Return(d): | | 5.28% | | | (20.97)% | | | (10.17)% | | | 5.28% | |
| |
| Ratios/Supplemental Data: | | | | | | | | | | | | |
| Net assets, end of period (000) | | $1,550 | | | $1,796 | | | $2,896 | | | $5,299 | |
| Average net assets (000) | | $1,816 | | | $1,707 | | | $4,100 | | | $3,274 | |
| Ratios to average net assets(f): | | | | | | | | | | | | |
Expenses, including distribution and service
(12b-1) fees | | 1.27% | | | 1.34% | | | 1.23% | | | 1.20% | (e) |
Expenses, excluding distribution and service
(12b-1) fees | | .77% | | | .84% | | | .73% | | | .70% | (e) |
| Net investment income | | .16% | | | .48% | | | .61% | | | .51% | (e) |
(a) Inception date of Class L shares.
(b) Calculated based upon average shares outstanding during the period.
(c) For the period ended August 31, 2007. The Fund changed its fiscal year end from October 31 to August 31, effective August 31, 2007.
(d) Total return does not consider the effects of sales loads. Total return is calculated assuming a purchase of a share on the first day and a sale on the last day of each period reported, and includes reinvestment of dividends and distributions. Total returns may reflect adjustments to conform to generally accepted accounting principles. Total returns for periods less than a full year are not annualized.
(e) Annualized.
(f) Does not include expenses of the underlying portfolio in which the Fund invests.
See Notes to Financial Statements.
| | |
| Prudential Jennison Value Fund | | 43 |
Financial Highlights
continued
| | | | | | | | | | | | |
| Class M Shares | |
| | | Year Ended August 31, | | | March 16, 2007(a)
through
August 31, | |
| | | 2010(b) | | | 2009(b) | | | 2008(b) | | | 2007(b)(c) | |
| Per Share Operating Performance: | | | | | | | | | | | | |
| Net Asset Value, Beginning Of Period | | $11.58 | | | $16.30 | | | $21.53 | | | $20.49 | |
Income (loss) from investment operations | | | | | | | | | | | | |
| Net investment income | | .05 | | | .03 | | | .02 | | | - | (e) |
Net realized and unrealized gain (loss) on investment and foreign currency transactions | | .59 | | | (3.78 | ) | | (1.99 | ) | | 1.04 | |
| Total from investment operations | | .64 | | | (3.75 | ) | | (1.97 | ) | | 1.04 | |
| Less Dividends and Distributions: | | | | | | | | | | | | |
| Dividends from net investment income | | (.03 | ) | | (.01 | ) | | (.06 | ) | | - | |
| Distributions from net realized gains | | - | | | (.96 | ) | | (3.20 | ) | | - | |
| Total dividends and distributions | | (.03 | ) | | (.97 | ) | | (3.26 | ) | | - | |
| Capital Contributions: | | .01 | | | - | (e) | | - | | | - | |
| Net asset value, end of period | | $12.20 | | | $11.58 | | | $16.30 | | | $21.53 | |
| Total Return(d): | | 5.58% | | | (20.98)% | | | (10.59)% | | | 5.08% | |
| |
| Ratios/Supplemental Data: | |
| Net assets, end of period (000) | | $1,186 | | | $2,480 | | | $5,898 | | | $15,256 | |
| Average net assets (000) | | $1,977 | | | $3,046 | | | $9,964 | | | $9,920 | |
| Ratios to average net assets(g): | | | | | | | | | | | | |
Expenses, including distribution and service (12b-1) fees | | 1.02% | | | 1.52% | | | 1.73% | | | 1.70% | (f) |
Expenses, excluding distribution and service (12b-1) fees | | .77% | | | .84% | | | .73% | | | .70% | (f) |
| Net investment income | | .39% | | | .31% | | | .11% | | | .01% | (f) |
(a) Inception date of Class M shares.
(b) Calculated based upon average shares outstanding during the period.
(c) For the period ended August 31, 2007. The Fund changed its fiscal year end from October 31 to August 31, effective August 31, 2007.
(d) Total return does not consider the effects of sales loads. Total return is calculated assuming a purchase of a share on the first day and a sale on the last day of each period reported, and includes reinvestment of dividends and distributions. Total returns may reflect adjustments to conform to generally accepted accounting principles. Total returns for periods less than a full year are not annualized.
(e) Less than $.005 per share.
(f) Annualized.
(g) Does not include expenses of the underlying portfolio in which the Fund invests.
See Notes to Financial Statements.
| | |
| 44 | | Visit our website at www.prudentialfunds.com |
| | | | | | | | | | | | | | | | | | |
| Class R Shares | |
| | | Year Ended August 31, | | | Ten-Month
Period
Ended August 31, | | | Year Ended
October 31, | | | June 3, 2005(a)
through
October 31, | |
| | | 2010(b) | | | 2009(b) | | | 2008(b) | | | 2007(b)(c) | | | 2006(b) | | | 2005(b) | |
| Per Share Operating Performance: | | | | | | | | | | | | | | | | | | |
| Net Asset Value, Beginning Of Period | | $11.64 | | | $16.49 | | | $21.75 | | | $22.39 | | | $19.74 | | | $18.31 | |
| Income (loss) from investment operations: | | | | | | | | | | | | | | | | | | |
| Net investment income | | .02 | | | .05 | | | .11 | | | .05 | | | .13 | | | .01 | |
| Net realized and unrealized gain (loss) on investment and foreign currency transactions | | .59 | | | (3.85 | ) | | (2.01 | ) | | 1.69 | | | 3.53 | | | 1.42 | |
| Total from investment operations | | .61 | | | (3.80 | ) | | (1.90 | ) | | 1.74 | | | 3.66 | | | 1.43 | |
| Less Dividends and Distributions: | | | | | | | | | | | | | | | | | | |
| Dividends from net investment income | | (.01 | ) | | (.09 | ) | | (.16 | ) | | (.12 | ) | | (.09 | ) | | - | |
| Distributions from net realized gains | | - | | | (.96 | ) | | (3.20 | ) | | (2.26 | ) | | (.92 | ) | | - | |
| Total dividends and distributions | | (.01 | ) | | (1.05 | ) | | (3.36 | ) | | (2.38 | ) | | (1.01 | ) | | - | |
| Net asset value, end of period | | $12.24 | | | $11.64 | | | $16.49 | | | $21.75 | | | $22.39 | | | $19.74 | |
| Total Return(d): | | 5.27% | | | (20.95)% | | | (10.16)% | | | 8.44% | | | 19.21% | | | 7.81% | |
| |
| Ratios/Supplemental Data: | |
| Net assets, end of period (000) | | $9,583 | | | $5,582 | | | $4,796 | | | $1,858 | | | $64 | | | $3 | |
| Average net assets (000) | | $8,448 | | | $4,424 | | | $3,557 | | | $685 | | | $21 | | | $3 | |
| Ratios to average net assets(g): | | | | | | | | | | | | | | | | | | |
Expenses, including distribution and service (12b-1) fees(e) | | 1.27% | | | 1.34% | | | 1.23% | | | 1.20% | (f) | | 1.23% | | | 1.29% | (f) |
Expenses, excluding distribution and service (12b-1) fees | | .77% | | | .84% | | | .73% | | | .70% | (f) | | .73% | | | .79% | (f) |
| Net investment income | | .18% | | | .47% | | | .60% | | | .62% | (f) | | .61% | | | .19% | (f) |
(a) Inception date of Class R shares.
(b) Calculated based upon average shares outstanding during the period.
(c) For the ten-month period ended August 31, 2007. The Fund changed its fiscal year end from October 31 to August 31, effective August 31, 2007.
(d) Total return is calculated assuming a purchase of a share on the first day and a sale on the last day of each period reported, and includes reinvestment of dividends and distributions. Total returns may reflect adjustments to conform to generally accepted accounting principles. Total returns for periods less than a full year are not annualized.
(e) The distributor of the Fund contractually agreed to limit its distribution and service (12b-1) fees to .50% of the average daily net assets of the Class R shares.
(f) Annualized.
(g) Does not include expenses of the underlying portfolio in which the Fund invests.
See Notes to Financial Statements.
| | |
| Prudential Jennison Value Fund | | 45 |
Financial Highlights
continued
| | | | | | | | | | | | |
| Class X Shares | |
| | | Year Ended August 31, | | | March 16, 2007(a)
through August 31, | |
| | | 2010(b) | | | 2009(b) | | | 2008(b) | | | 2007(b)(c)(g) | |
| Per Share Operating Performance: | | | | | | | | | | | | |
| Net Asset Value, Beginning Of Period | | $11.62 | | | $16.37 | | | $21.52 | | | $20.49 | |
| Income (loss) from investment operations | | | | | | | | | | | | |
| Net investment income | | .05 | | | .08 | | | .15 | | | .07 | |
| Net realized and unrealized gain (loss) on investment and foreign currency transactions | | .58 | | | (3.81 | ) | | (1.99 | ) | | 1.03 | |
| Total from investment operations | | .63 | | | (3.73 | ) | | (1.84 | ) | | 1.10 | |
| Less Dividends and Distributions: | | | | | | | | | | | | |
| Dividends from net investment income | | (.04 | ) | | (.09 | ) | | (.15 | ) | | (.09 | ) |
| Distributions from net realized gains | | - | | | (.96 | ) | | (3.20 | ) | | - | |
| Total dividends and distributions | | (.04 | ) | | (1.05 | ) | | (3.35 | ) | | (.09 | ) |
| Capital Contributions: | | .01 | | | .03 | | | .04 | | | .02 | |
| Net asset value, end of period | | $12.22 | | | $11.62 | | | $16.37 | | | $21.52 | |
| Total Return(d): | | 5.51% | | | (20.42)% | | | (9.67)% | | | 5.47% | |
| |
| Ratios/Supplemental Data: | |
| Net assets, end of period (000) | | $572 | | | $1,032 | | | $2,117 | | | $3,749 | |
| Average net assets (000) | | $909 | | | $1,175 | | | $2,927 | | | $2,334 | |
| Ratios to average net assets(f): | | | | | | | | | | | | |
| Expenses, including distribution and service (12b-1) fees | | 1.02% | | | 1.09% | | | 1.02% | | | 1.01% | (e) |
| Expenses, excluding distribution and service (12b-1) fees | | .77% | | | .84% | | | .73% | | | .70% | (e) |
| Net investment income | | .40% | | | .80% | | | .82% | | | .71% | (e) |
(a) Inception date of Class X shares.
(b) Calculated based upon average shares outstanding during the period.
(c) For the period ended August 31, 2007. The Fund changed its fiscal year end from October 31 to August 31, effective August 31, 2007.
(d) Total return does not consider the effects of sales loads. Total return is calculated assuming a purchase of a share on the first day and a sale on the last day of each period reported, and includes reinvestment of dividends and distributions. Total returns may reflect adjustments to conform to generally accepted accounting principles. Total returns for periods less than a full year are not annualized.
(e) Annualized.
(f) Does not include expenses of the underlying portfolio in which the Fund invests.
(g) Certain information has been adjusted to reflect a manager payment for sales charges incurred by shareholders in excess of the regulatory limits.
See Notes to Financial Statements.
| | |
| 46 | | Visit our website at www.prudentialfunds.com |
| | | | | | | | | | | | | | | | | | |
| Class Z Shares | |
| | | Year Ended August 31, | | | Ten-Month
Period
Ended
August 31, | | | Year Ended
October 31, | |
| | | 2010(a) | | | 2009(a) | | | 2008(a) | | | 2007(a)(c) | | | 2006(a) | | | 2005(a) | |
| Per Share Operating Performance: | | | | | | | | | | | | | | | | | | |
| Net Asset Value, Beginning Of Period | | $11.69 | | | $16.61 | | | $21.88 | | | $22.56 | | | $19.83 | | | $16.76 | |
| Income (loss) from investment operations: | | | | | | | | | | | | | | | | | | |
| Net investment income | | .09 | | | .10 | | | .20 | | | .23 | | | .27 | | | .19 | |
| Net realized and unrealized gain (loss) on investment and foreign currency transactions | | .59 | | | (3.89 | ) | | (2.02 | ) | | 1.60 | | | 3.57 | | | 3.07 | |
| Total from investment operations | | .68 | | | (3.79 | ) | | (1.82 | ) | | 1.83 | | | 3.84 | | | 3.26 | |
| Less Dividends and Distributions: | | | | | | | | | | | | | | | | | | |
| Dividends from net investment income | | (.07 | ) | | (.17 | ) | | (.25 | ) | | (.25 | ) | | (.19 | ) | | (.19 | ) |
| Distributions from net realized gains | | - | | | (.96 | ) | | (3.20 | ) | | (2.26 | ) | | (.92 | ) | | - | |
| Total dividends and distributions | | (.07 | ) | | (1.13 | ) | | (3.45 | ) | | (2.51 | ) | | (1.11 | ) | | (.19 | ) |
| Net asset value, end of period | | $12.30 | | | $11.69 | | | $16.61 | | | $21.88 | | | $22.56 | | | $19.83 | |
| Total Return(b): | | 5.78% | | | (20.54)% | | | (9.72)% | | | 8.91% | | | 20.15% | | | 19.59% | |
| |
| Ratios/Supplemental Data: | |
| Net assets, end of period (000) | | $303,166 | | | $87,194 | | | $109,533 | | | $104,793 | | | $92,267 | | | $41,856 | |
| Average net assets (000) | | $259,824 | | | $80,680 | | | $104,223 | | | $105,962 | | | $65,638 | | | $32,824 | |
| Ratios to average net assets(e): | | | | | | | | | | | | | | | | | | |
| Expenses, including distribution and service (12b-1) fees | | .77% | | | .84% | | | .73% | | | .70% | (d) | | .73% | | | .79% | |
| Expenses, excluding distribution and service (12b-1) fees | | .77% | | | .84% | | | .73% | | | .70% | (d) | | .73% | | | .79% | |
| Net investment income | | .69% | | | .98% | | | 1.11% | | | 1.16% | (d) | | 1.28% | | | 1.00% | |
(a) Calculated based upon average shares outstanding during the period.
(b) Total return is calculated assuming a purchase of a share on the first day and a sale on the last day of each period reported, and includes reinvestment of dividends and distributions. Total returns may reflect adjustments to conform to generally accepted accounting principles. Total returns for periods less than a full year are not annualized.
(c) For the ten-month period ended August 31, 2007. The Fund changed its fiscal year end from October 31 to August 31, effective August 31, 2007.
(d) Annualized.
(e) Does not include expenses of the underlying portfolio in which the Fund invests.
See Notes to Financial Statements.
| | |
| Prudential Jennison Value Fund | | 47 |
Report of Independent Registered Public
Accounting Firm
The Board of Trustees and Shareholders
Prudential Investment Portfolios 7:
We have audited the accompanying statement of assets and liabilities of the Prudential Jennison Value Fund of Prudential Investment Portfolios 7 (formerly Jennison Value Fund of JennisonDryden Portfolios) (hereafter referred to as the “Fund”), including the portfolio of investments, as of August 31, 2010, and the related statement of operations for the year then ended, the statement of changes in net assets for each of the years in the two-year period then ended and the financial highlights for each of the years in the three-year period ended August 31, 2010, the ten-month period ended August 31, 2007 and each of the years in the two-year period ended October 31, 2006. These financial statements and financial highlights are the responsibility of the Fund’s management. Our responsibility is to express an opinion on these financial statements and financial highlights based on our audits.
We conducted our audits in accordance with the standards of the Public Company Accounting Oversight Board (United States). Those standards require that we plan and perform the audit to obtain reasonable assurance about whether the financial statements and financial highlights are free of material misstatement. An audit includes examining, on a test basis, evidence supporting the amounts and disclosures in the financial statements. Our procedures included confirmation of securities owned as of August 31, 2010, by correspondence with the custodian, transfer agent and brokers or by other appropriate auditing procedures when replies from brokers were not received. An audit also includes assessing the accounting principles used and significant estimates made by management, as well as evaluating the overall financial statement presentation. We believe that our audits provide a reasonable basis for our opinion.
In our opinion, the financial statements and financial highlights referred to above present fairly, in all material respects, the financial position of the Fund as of August 31, 2010, and the results of its operations for the year then ended, the changes in its net assets for each of the years in the two-year period then ended and the financial highlights for each of the years in the three-year period ended August 31, 2010, the ten-month period August 31, 2007 and each of the years in the two-year period ended October 31, 2006, in conformity with U.S. generally accepted accounting principles.

New York, New York
October 21, 2010
| | |
| 48 | | Visit our website at www.prudentialfunds.com |
Tax Information
(Unaudited)
We are required by the Internal Revenue Code of 1986, as amended (“the Code”), to advise you within 60 days of the Fund’s fiscal year end (August 31, 2010) as to the federal income tax status of dividends paid by the Fund during such fiscal year. We are advising you that during its fiscal year ended August 31, 2010, the Fund paid ordinary income dividends of $0.0360 per share for Class A, $0.0001 per share for Classes B and C, $0.0142 per share for Classes L and R, $0.0272 per share for Class M, $0.0420 per share for Class X, and $0.0683 per share for Class Z, which are taxable as such.
For the fiscal year ended August 31, 2010 the Fund designates the maximum amount allowable under Section 854 of the Internal Revenue Code but not less than the following percentages of the ordinary income distributions paid as: 1) qualified dividend income (QDI); and 2) eligible for the corporate dividends received deduction (DRD):
| | | | | | | | |
| | | QDI | | | DRD | |
| | |
Prudential Jennison Value Fund | | | 100 | % | | | 100 | % |
In January 2011, you will be advised on IRS Form 1099 DIV or substitute 1099 DIV as to the Federal tax status of the distributions received by you in calendar year 2010.
| | | | |
| Prudential Jennison Value Fund | | | 49 | |
MANAGEMENT OF THE FUND
(Unaudited)
Information about Fund Directors/Trustees (referred to herein as “Board Members”) and Fund Officers is set forth below. Board Members who are not deemed to be “interested persons,” as defined in the 1940 Act, are referred to as “Independent Board Members.” Board Members who are deemed to be “interested persons” are referred to as “Interested Board Members.” The Board Members are responsible for the overall supervision of the operations of the Fund and perform the various duties imposed on the directors or trustees of investment companies by the 1940 Act.
| | | | |
| Independent Board Members (1) |
Name, Address, Age Position(s) Portfolios Overseen | | Principal Occupation(s) During Past Five Years | | Other Directorships Held |
Kevin J. Bannon (58) Board Member Portfolios Overseen: 55 | | Managing Director (since April 2008) and Chief Investment Officer (since October 2008) of Highmount Capital LLC (registered investment adviser); formerly Executive Vice President and Chief Investment Officer (April 1993-August 2007) of Bank of New York Company; President (May 2003-May 2007) of BNY Hamilton Family of Mutual Funds. | | Director of Urstadt Biddle Properties (since September 2008). |
Linda W. Bynoe (58) Board Member Portfolios Overseen: 55 | | President and Chief Executive Officer (since March 1995) and formerly Chief Operating Officer (December 1989- February 1995) of Telemat Ltd. (management consulting); formerly Vice President (January 1985-June 1989) at Morgan Stanley & Co (broker-dealer). | | Director of Simon Property Group, Inc. (retail real estate) (since May 2003); Anixter International, Inc. (communication products distributor) (since January 2006); Director of Northern Trust Corporation (financial services) (since April 2006); Trustee of Equity Residential (residential real estate) (since December 2009); formerly Director of Dynegy Inc. (power generation) (September 2002-May 2006), CitiStreet Funds, Inc. (mutual funds) (May 1993-February 2005), AM- CH, Inc. (restaurant holding company) (November 2004-February 2005). |
Michael S. Hyland, CFA (64) Board Member Portfolios Overseen: 55 | | Independent Consultant (since February 2005); formerly Senior Managing Director (July 2001-February 2005) of Bear Stearns & Co, Inc.; Global Partner, INVESCO (1999-2001); Managing Director and President of Salomon Brothers Asset Management (1989-1999). | | None. |
Visit our website at www.prudentialfunds.com
| | | | |
Douglas H. McCorkindale (71) Board Member Portfolios Overseen: 55 | | Formerly Chairman (February 2001-June 2006), Chief Executive Officer (June 2000-July 2005), President (September 1997-July 2005) and Vice Chairman (March 1984-May 2000) of Gannett Co. Inc. (publishing and media). | | Director of Continental Airlines, Inc. (since May 1993); Director of Lockheed Martin Corp. (aerospace and defense) (since May 2001). |
Stephen P. Munn (68) Board Member Portfolios Overseen: 55 | | Lead Director (since 2007) and formerly Chairman (1993-2007) of Carlisle Companies Incorporated (manufacturer of industrial products). | | Lead Director (since 2007) of Carlisle Companies Incorporated (manufacturer of industrial products). |
Richard A. Redeker (67) Board Member Portfolios Overseen: 55 | | Retired Mutual Fund Senior Executive (42 years); Management Consultant; Independent Directors Council (organization of 2,800 Independent Mutual Fund Directors)-Executive Committee, Chair of Policy Steering Committee, Governing Council. | | None. |
Robin B. Smith (70) Board Member & Independent Chair Portfolios Overseen: 55 | | Chairman of the Board (since January 2003) of Publishers Clearing House (direct marketing); formerly Chairman and Chief Executive Officer (August 1996-January 2003) of Publishers Clearing House. | | Formerly Director of BellSouth Corporation (telecommunications) (1992-2006). |
Stephen G. Stoneburn (67) Board Member Portfolios Overseen: 55 | | President and Chief Executive Officer (since June 1996) of Quadrant Media Corp. (publishing company); formerly President (June 1995-June 1996) of Argus Integrated Media, Inc.; Senior Vice President and Managing Director (January 1993-1995) of Cowles Business Media; Senior Vice President of Fairchild Publications, Inc (1975-1989). | | None. |
Prudential Jennison Value Fund
| | | | |
| Interested Board Members (1) |
Name, Address, Age Position(s) Portfolios Overseen | | Principal Occupation(s) During Past Five Years | | Other Directorships Held |
Judy A. Rice (62) Board Member & President Portfolios Overseen: 55 | | President, Chief Executive Officer, Chief Operating Officer and Officer-In-Charge (since February 2003) of Prudential Investments LLC; President, Chief Executive Officer and Officer-In-Charge (since April 2003) of Prudential Mutual Fund Services LLC; Executive Vice President (since December 2008) of Prudential Investment Management Services LLC; formerly Vice President (February 1999-April 2006) of Prudential Investment Management Services LLC; formerly President, Chief Executive Officer, Chief Operating Officer and Officer-In-Charge (May 2003-June 2005) and Director (May 2003-March 2006) and Executive Vice President (June 2005- March 2006) of AST Investment Services, Inc.; Member of Board of Governors of the Investment Company Institute. | | None. |
Scott E. Benjamin (37) Board Member & Vice President Portfolios Overseen: 55 | | Executive Vice President (since June 2009) of Prudential Investments LLC and Prudential Investment Management Services LLC; Executive Vice President (since September 2009) of AST Investment Services, Inc.; Senior Vice President of Product Development and Marketing, Prudential Investments (since February 2006); Vice President of Product Development and Product Management, Prudential Investments (2003-2006). | | None. |
| (1) | The year that each Board Member joined the Fund’s Board is as follows: Kevin J. Bannon, 2008; Linda W. Bynoe, 2005; Michael S. Hyland, 2008; Douglas H. McCorkindale, 1987; Stephen P. Munn, 2008; Richard A. Redeker, 1993; Robin B. Smith, 1996; Stephen G. Stoneburn, 2003; Judy A. Rice, Director since 2000 and President since 2003; Scott E. Benjamin, Board Member since 2010 and Vice President since 2009. |
Visit our website at www.prudentialfunds.com
| | |
| Fund Officers (a)(1) | | |
Name, Address and Age Position with Fund | | Principal Occupation(s) During Past Five Years |
Kathryn L. Quirk (57) Chief Legal Officer | | Vice President and Corporate Counsel (since September 2004) of Prudential; Executive Vice President, Chief Legal Officer and Secretary (since July 2005) of PI and Prudential Mutual Fund Services LLC; Vice President and Corporate Counsel (since June 2005) and Secretary (since February 2006) of AST Investment Services, Inc.; formerly Senior Vice President and Assistant Secretary (November 2004-August 2005) of PI; formerly Assistant Secretary (June 2005-February 2006) of AST Investment Services, Inc.; formerly Managing Director, General Counsel, Chief Compliance Officer, Chief Risk Officer and Corporate Secretary (1997-2002) of Zurich Scudder Investments, Inc. |
Deborah A. Docs (52) Secretary | | Vice President and Corporate Counsel (since January 2001) of Prudential; Vice President (since December 1996) and Assistant Secretary (since March 1999) of PI; formerly Vice President and Assistant Secretary (May 2003-June 2005) of AST Investment Services, Inc. |
Jonathan D. Shain (52) Assistant Secretary | | Vice President and Corporate Counsel (since August 1998) of Prudential; Vice President and Assistant Secretary (since May 2001) of PI; Vice President and Assistant Secretary (since February 2001) of PMFS; formerly Vice President and Assistant Secretary (May 2003-June 2005) of AST Investment Services, Inc. |
Claudia DiGiacomo (35) Assistant Secretary | | Vice President and Corporate Counsel (since January 2005) of Prudential; Vice President and Assistant Secretary of PI (since December 2005); Associate at Sidley Austin Brown & Wood LLP (1999-2004). |
John P. Schwartz (39) Assistant Secretary | | Vice President and Corporate Counsel (since April 2005) of Prudential; Vice President and Assistant Secretary of PI (since December 2005); Associate at Sidley Austin Brown & Wood LLP (1997-2005). |
Andrew R. French (47) Assistant Secretary | | Vice President and Corporate Counsel (since February 2010) of Prudential; formerly Director and Corporate Counsel (2006-2010) of Prudential; Vice President and Assistant Secretary (since January 2007) of PI; Vice President and Assistant Secretary (since January 2007) of PMFS; formerly Senior Legal Analyst of Prudential Mutual Fund Law Department (1997-2006). |
Timothy J. Knierim (51) Chief Compliance Officer | | Chief Compliance Officer of Prudential Investment Management, Inc. (since July 2007); formerly Chief Risk Officer of PIM and PI (2002-2007) and formerly Chief Ethics Officer of PIM and PI (2006-2007). |
Valerie M. Simpson (52) Deputy Chief Compliance Officer | | Chief Compliance Officer (since April 2007) of PI and AST Investment Services, Inc.; formerly Vice President-Financial Reporting (June 1999-March 2006) for Prudential Life and Annuities Finance. |
Theresa C. Thompson (48) Deputy Chief Compliance Officer | | Vice President, Compliance, PI (since April 2004); and Director, Compliance, PI (2001-2004). |
Prudential Jennison Value Fund
| | |
Noreen M. Fierro (46) Anti-Money Laundering Compliance Officer | | Vice President, Corporate Compliance (since May 2006) of Prudential; formerly Corporate Vice President, Associate General Counsel (April 2002-May 2005) of UBS Financial Services, Inc., in their Money Laundering Prevention Group; Senior Manager (May 2005-May 2006) of Deloitte Financial Advisory Services, LLP, in their Forensic and Dispute Services, Anti-Money Laundering Group. |
Grace C. Torres (51) Treasurer and Principal Financial and Accounting Officer | | Assistant Treasurer (since March 1999) and Senior Vice President (since September 1999) of PI; Assistant Treasurer (since May 2003) and Vice President (since June 2005) of AST Investment Services, Inc.; Senior Vice President and Assistant Treasurer (since May 2003) of Prudential Annuities Advisory Services, Inc.; formerly Senior Vice President (May 2003-June 2005) of AST Investment Services, Inc. |
M. Sadiq Peshimam (46) Assistant Treasurer | | Vice President (since 2005) of Prudential Investments LLC. |
Peter Parrella (52) Assistant Treasurer | | Vice President (since 2007) and Director (2004-2007) within Prudential Mutual Fund Administration; formerly Tax Manager at SSB Citi Fund Management LLC (1997-2004). |
| (a) | Excludes Ms. Rice and Mr. Benjamin, interested Board Members who also serve as President and Vice President, respectively. |
| (1) | The year that each individual joined the Funds’ Board is as follows: |
Linda. W. Bynoe, 2005; Richard A. Redeker, 1993; Robin B. Smith, 1996; Stephen G. Stoneburn, 2003; Kevin J. Bannon, 2008; Michael S. Hyland, 2008; Stephen P. Munn, 2008; Judy A. Rice, Board Member since 2000 and President since 2003: Scott E. Benjamin, Board Member since 2010 and Vice President since 2009.
Explanatory Notes to Tables:
| | • | | Board Members are deemed to be “Interested,” as defined in the 1940 Act, by reason of their affiliation with Prudential Investments LLC and/or an affiliate of Prudential Investments LLC. |
| | • | | Unless otherwise noted, the address of all Board Members and Officers is c/o Prudential Investments LLC, Gateway Center Three, 100 Mulberry Street, Newark, New Jersey 07102-4077. |
| | • | | There is no set term of office for Board Members or Officers. The Board Members have adopted a retirement policy, which calls for the retirement of Board Members on December 31 of the year in which they reach the age of 75. |
| | • | | “Other Directorships Held” includes only directorships of companies required to register or file reports with the Commission under the Securities Exchange Act of 1934, as amended (the “Exchange Act”) (that is, “public companies”) or other investment companies registered under the 1940 Act. |
| | • | | “Portfolios Overseen” includes all investment companies managed by Prudential Investments LLC. The investment companies for which PI serves as manager include the Prudential Investments Mutual Funds, The Prudential Variable Contract Accounts, Target Mutual Funds, The Prudential Series Fund, Prudential’s Gibraltar Fund, Inc. and the Advanced Series Trust. |
Visit our website at www.prudentialfunds.com
Approval of Advisory Agreements
The Fund’s Board of Trustees
The Board of Trustees (the “Board”) of Prudential Jennison Value Fund (the “Fund”)1 consists of 10 individuals, eight of whom are not “interested persons” of the Fund, as defined in the Investment Company Act of 1940, as amended (the “1940 Act”) (the “Independent Trustees”). The Board is responsible for the oversight of the Fund and its operations, and performs the various duties imposed on the directors of investment companies by the 1940 Act. The Independent Trustees have retained independent legal counsel to assist them in connection with their duties. The Chair of the Board is an Independent Trustee. The Board has established three standing committees: the Audit Committee, the Nominating and Governance Committee, and the Investment Committee. Each committee is chaired by, and composed of, Independent Trustees.
Annual Approval of the Fund’s Advisory Agreements
As required under the 1940 Act, the Board determines annually whether to renew the Fund’s management agreement with Prudential Investments LLC (“PI”) and the Fund’s subadvisory agreement with Jennison Associates LLC (“Jennison”). In considering the renewal of the agreements, the Board, including all of the Independent Trustees, met on June 21-23, 2010 and approved the renewal of the agreements through July 31, 2011, after concluding that the renewal of the agreements was in the best interests of the Fund and its shareholders.
In advance of the meetings, the Board requested and received materials relating to the agreements, and had the opportunity to ask questions and request further information in connection with its consideration. Among other things, the Board considered comparative fee information from PI and Jennison. Also, the Board considered comparisons with other mutual funds in relevant Peer Universes and Peer Groups. The mutual funds included in each Peer Universe or Peer Group were objectively determined by Lipper Inc (“Lipper”)., an independent provider of mutual fund data. To the extent that PI deems appropriate, and for reasons addressed in detail with the Board, PI may provide supplemental data compiled by Lipper for the Board’s consideration. The comparisons placed the Fund in various quartiles over the one-, three-, five- and 10-year periods ending December 31, 2009, with the first quartile being the best 25% of the mutual funds (for performance, the best performing mutual funds and, for expenses, the lowest cost mutual funds).
In approving the agreements, the Board, including the Independent Trustees advised by independent legal counsel, considered the factors it deemed relevant, including
| 1 | Prudential Jennison Value Fund is a series of Prudential Investment Portfolios 7. |
| | |
| Prudential Jennison Value Fund | | |
Approval of Advisory Agreements (continued)
the nature, quality and extent of services provided by PI and the subadviser, the performance of the Fund, the profitability of PI and its affiliates, expenses and fees, and the potential for economies of scale that may be shared with the Fund and its shareholders as the Fund’s assets grow. In their deliberations, the Trustees did not identify any single factor which alone was responsible for the Board’s decision to approve the agreements with respect to the Fund. In connection with its deliberations, the Board considered information provided by PI throughout the year at regular Board meetings, presentations from portfolio managers and other information, as well as information furnished at or in advance of the meetings on June 21-23, 2010.
The Trustees determined that the overall arrangements between the Fund and PI, which serves as the Fund’s investment manager pursuant to a management agreement, and between PI and Jennison, which serves as the Fund’s subadviser pursuant to the terms of a subadvisory agreement with PI, are in the interest of the Fund and its shareholders in light of the services performed, fees charged and such other matters as the Trustees considered relevant in the exercise of their business judgment.
The material factors and conclusions that formed the basis for the Trustees’ reaching their determinations to approve the continuance of the agreements are separately discussed below.
Nature, Quality, and Extent of Services
The Board received and considered information regarding the nature, quality and extent of services provided to the Fund by PI and Jennison. The Board considered the services provided by PI, including but not limited to the oversight of the subadviser for the Fund, as well as the provision of fund recordkeeping, compliance, and other services to the Fund. With respect to PI’s oversight of the subadviser, the Board noted that PI’s Strategic Investment Research Group (“SIRG”), which is a business unit of PI, is responsible for monitoring and reporting to PI’s senior management on the performance and operations of the subadviser. The Board also considered that PI pays the salaries of all of the officers and non-independent Trustees of the Fund. The Board also considered the investment subadvisory services provided by Jennison, as well as adherence to the Fund’s investment restrictions and compliance with applicable Fund policies and procedures. The Board considered PI’s evaluation of the subadviser as well as PI’s recommendation, based on its review of the subadviser, to renew the subadvisory agreement.
The Board reviewed the qualifications, backgrounds and responsibilities of PI’s senior management responsible for the oversight of the Fund and Jennison, and also reviewed the qualifications, backgrounds and responsibilities of Jennison’s portfolio
| | |
| | Visit our website at www.prudentialfunds.com |
managers who are responsible for the day-to-day management of the Fund’s portfolio. The Board was provided with information pertaining to PI’s and Jennison’s organizational structure, senior management, investment operations, and other relevant information pertaining to both PI and Jennison. The Board also noted that it received favorable compliance reports from the Fund’s Chief Compliance Officer (“CCO”) as to both PI and Jennison. The Board noted that Jennison is affiliated with PI.
The Board concluded that it was satisfied with the nature, extent and quality of the investment management services provided by PI and the subadvisory services provided to the Fund by Jennison, and that there was a reasonable basis on which to conclude that the Fund benefits from the services provided by PI and Jennison under the management and subadvisory agreements.
Performance of the Fund
The Board received and considered information about the Fund’s historical performance. The Board considered that the Fund’s gross performance in relation to its Peer Universe (the Lipper Large-Cap Value Funds Performance Universe)2 was in the first quartile for the one-, five- and 10-year periods, and in the second quartile for the three-year period. The Board further noted that the Fund outperformed its benchmark index for all periods. The Board concluded that, in light of the Fund’s competitive performance, it would be in the interest of the Fund and its shareholders to renew the agreements.
Fees and Expenses
The Board considered that the Fund’s actual management fee (which reflects any subsidies, expense caps or waivers) ranked in the Expense Group’s second quartile and that total expenses ranked in the Expense Group’s third quartile. The Board concluded that the management fees and total expenses were reasonable in light of the services provided.
Costs of Services and Profits Realized by PI
The Board was provided with information on the profitability of PI and its affiliates in serving as the Fund’s investment manager. The Board discussed with PI the
| 2 | The Fund was compared to the Lipper Large-Cap Value Funds Performance Universe, although Lipper classifies the Fund in the Multi-Cap Core Funds Performance Universe. The Fund was compared to the Lipper Large-Cap Value Funds Performance Universe because PI believes that the funds included in this Universe provide a more appropriate basis for Fund performance comparisons. |
| | | | |
| Prudential Jennison Value Fund | | | | |
Approval of Advisory Agreements (continued)
methodology utilized in assembling the information regarding profitability and considered its reasonableness. The Board recognized that it is difficult to make comparisons of profitability from fund management contracts because comparative information is not generally publicly available and is affected by numerous factors, including the structure of the particular adviser, the types of funds it manages, its business mix, numerous assumptions regarding allocations and the adviser’s capital structure and cost of capital. The Board did not separately consider the profitability of the subadviser, an affiliate of PI, as its profitability was reflected in the profitability report for PI. Taking these factors into account, the Board concluded that the profitability of PI and its affiliates in relation to the services rendered was not unreasonable.
Economies of Scale
The Board noted that the management fee schedule for the Fund includes breakpoints, which have the effect of decreasing the fee rate as assets increase, and that at its current level of assets the Fund’s effective fee rate reflected some of those rate reductions. The Board received and discussed information concerning whether PI realizes economies of scale as the Fund’s assets grow beyond current levels. The Board took note that the Fund’s fee structure currently results in benefits to Fund shareholders whether or not PI realizes any economies of scale.
Other Benefits to PI and Jennison
The Board considered potential ancillary benefits that might be received by PI and Jennison and their affiliates as a result of their relationship with the Fund. The Board concluded that potential benefits to be derived by PI included brokerage commissions received by affiliates of PI, transfer agency fees received by the Fund’s transfer agent (which is affiliated with PI), as well as benefits to the reputation or other intangible benefits resulting from PI’s association with the Fund. The Board concluded that the potential benefits to be derived by Jennison included its ability to use soft dollar credits, brokerage commissions received by affiliates of Jennison, as well as the potential benefits consistent with those generally resulting from an increase in assets under management, specifically, potential access to additional research resources and benefits to the reputation. The Board concluded that the benefits derived by PI and Jennison were consistent with the types of benefits generally derived by investment managers and subadvisers to mutual funds.
After full consideration of these factors, the Board concluded that the approval of the agreements was in the best interest of the Fund and its shareholders.
| | |
| | Visit our website at www.prudentialfunds.com |
| | | | |
| n MAIL | | n TELEPHONE | | n WEBSITE |
Gateway Center Three 100 Mulberry Street Newark, NJ 07102 | | (800) 225-1852 | | www.prudentialfunds.com |
|
| PROXY VOTING |
| The Board of Trustees of the Fund has delegated to the Fund’s investment subadviser the responsibility for voting any proxies and maintaining proxy recordkeeping with respect to the Fund. A description of these proxy voting policies and procedures is available without charge, upon request, by calling (800) 225-1852 or by visiting the Securities and Exchange Commission’s website at www.sec.gov. Information regarding how the Fund voted proxies relating to portfolio securities during the most recent 12-month period ended June 30 is available on the Fund’s website and on the Commission’s website. |
|
| TRUSTEES |
| Kevin J. Bannon • Scott E. Benjamin • Linda W. Bynoe • Michael S. Hyland • Douglas H. McCorkindale • Stephen P. Munn • Richard A. Redeker • Judy A. Rice • Robin B. Smith • Stephen G. Stoneburn |
|
| OFFICERS |
| Judy A. Rice, President • Scott E. Benjamin, Vice President • Grace C. Torres, Treasurer and Principal Financial and Accounting Officer • Kathryn L. Quirk, Chief Legal Officer • Deborah A. Docs, Secretary • Timothy J. Knierim, Chief Compliance Officer • Valerie M. Simpson, Deputy Chief Compliance Officer • Theresa C. Thompson, Deputy Chief Compliance Officer • Noreen M. Fierro, Anti-Money Laundering Compliance Officer • Jonathan D. Shain, Assistant Secretary • Claudia DiGiacomo, Assistant Secretary • John P. Schwartz, Assistant Secretary • Andrew R. French, Assistant Secretary • M. Sadiq Peshimam, Assistant Treasurer • Peter Parrella, Assistant Treasurer |
| | | | |
| MANAGER | | Prudential Investments LLC | | Gateway Center Three
100 Mulberry Street Newark, NJ 07102 |
|
| INVESTMENT SUBADVISER | | Jennison Associates LLC | | 466 Lexington Avenue
New York, NY 10017 |
|
| DISTRIBUTOR | | Prudential Investment
Management Services LLC | | Gateway Center Three
100 Mulberry Street
Newark, NJ 07102 |
|
| CUSTODIAN | | The Bank of New York Mellon | | One Wall Street
New York, NY 10286 |
|
| TRANSFER AGENT | | Prudential Mutual Fund
Services LLC | | PO Box 9658
Providence, RI 02940 |
|
INDEPENDENT REGISTERED
PUBLIC ACCOUNTING FIRM | | KPMG LLP | | 345 Park Avenue
New York, NY 10154 |
|
| FUND COUNSEL | | Willkie Farr & Gallagher LLP | | 787 Seventh Avenue
New York, NY 10019 |
|
| An investor should consider the investment objectives, risks, charges, and expenses of the Fund carefully before investing. The prospectus for the Fund contains this and other information about the Fund. An investor may obtain a prospectus by visiting our website at www.prudentialfunds.com or by calling (800) 225-1852. The prospectus should be read carefully before investing. |
|
| E-DELIVERY |
| To receive your mutual fund documents online, go to www.prudentialfund.com/edelivery and enroll. Instead of receiving printed documents by mail, you will receive notification via e-mail when new materials are available. You can cancel your enrollment or change your e-mail address at any time by visiting the website address above. |
|
| SHAREHOLDER COMMUNICATIONS WITH TRUSTEES |
| Shareholders can communicate directly with the Board of Trustees by writing to the Chair of the Board, Prudential Jennison Value Fund, Prudential Investments, Attn: Board of Trustees, 100 Mulberry Street, Gateway Center Three, Newark, NJ 07102. Shareholders can communicate directly with an individual Trustee by writing to the same address. Communications are not screened before being delivered to the addressee. |
|
| AVAILABILITY OF PORTFOLIO SCHEDULE |
| The Fund files its complete schedule of portfolio holdings with the Securities and Exchange Commission for the first and third quarters of each fiscal year on Form N-Q. The Fund’s Forms N-Q are available on the Commission’s website at www.sec.gov. The Fund’s Forms N-Q may also be reviewed and copied at the Commission’s Public Reference Room in Washington, D.C. Information on the operation and location of the Public Reference Room may be obtained by calling (202) 551-8090. The Fund’s schedule of portfolio holdings is also available on the Fund’s website as of the end of each fiscal quarter. |
|
| The Fund’s Statement of Additional Information contains additional information about the Fund’s Trustees and is available without charge, upon request, by calling (800) 225-1852. |
Mutual Funds:
| | | | |
| ARE NOT INSURED BY THE FDIC OR ANY FEDERAL GOVERNMENT AGENCY | | MAY LOSE VALUE | | ARE NOT A DEPOSIT OF OR GUARANTEED BY ANY BANK OR ANY BANK AFFILIATE |

| | | | | | | | | | | | | | | | | | | | |
| Prudential Jennison Value Fund | | | | | | | | | | | | | | |
| | Share Class | | A | | B | | C | | L | | M | | R | | X | | Z | | |
| | NASDAQ | | PBEAX | | PBQIX | | PEICX | | N/A | | N/A | | JDVRX | | N/A | | PEIZX | | |
| | CUSIP | | 74440N102 | | 74440N201 | | 74440N300 | | 74440N409 | | 74440N508 | | 74440N607 | | 74440N706 | | 74440N805 | | |
| | | | | | | | | | | | | | | | | | | | |
MF131E 0188452-00001-00
Item 2 – Code of Ethics — See Exhibit (a)
As of the end of the period covered by this report, the registrant has adopted a code of ethics (the “Section 406 Standards for Investment Companies – Ethical Standards for Principal Executive and Financial Officers”) that applies to the registrant’s Principal Executive Officer and Principal Financial Officer; the registrant’s Principal Financial Officer also serves as the Principal Accounting Officer.
The registrant hereby undertakes to provide any person, without charge, upon request, a copy of the code of ethics. To request a copy of the code of ethics, contact the registrant 800-225-1852, and ask for a copy of the Section 406 Standards for Investment Companies—Ethical Standards for Principal Executive and Financial Officers.
Item 3 – Audit Committee Financial Expert –
The registrant’s Board has determined that Mr. Stephen P. Munn, member of the Board’s Audit Committee is an “audit committee financial expert,” and that he is “independent,” for purposes of this Item.
Item 4 – Principal Accountant Fees and Services –
(a) Audit Fees
For the fiscal years ended August 31, 2010 and August 31, 2009, KPMG LLP (“KPMG”), the Registrant’s principal accountant, billed the Registrant $21,500 and $20,869, respectively, for professional services rendered for the audit of the Registrant’s annual financial statements or services that are normally provided in connection with statutory and regulatory filings.
(b) Audit-Related Fees
Not applicable for the fiscal year ended August 31, 2010. During the fiscal year ended August 31, 2009, KPMG, the Registrant’s principal accountant, billed the Registrant $1,558 for professional services rendered in connection with agreed upon procedures performed related to a custody conversion.
(c) Tax Fees
None.
(d) All Other Fees
None.
(e) (1) Audit Committee Pre-Approval Policies and Procedures
THE PRUDENTIAL MUTUAL FUNDS
AUDIT COMMITTEE POLICY
on
Pre-Approval of Services Provided by the Independent Accountants
The Audit Committee of each Prudential Mutual Fund is charged with the responsibility to monitor the independence of the Fund’s independent accountants. As part of this responsibility, the Audit Committee must pre-approve any independent accounting firm’s engagement to render audit and/or permissible non-audit services, as required by law. In evaluating a proposed engagement of the independent accountants, the Audit Committee will assess the effect that the engagement might reasonably be expected to have on the accountant’s independence. The Committee’s evaluation will be based on:
| | • | | a review of the nature of the professional services expected to be provided, |
| | • | | a review of the safeguards put into place by the accounting firm to safeguard independence, and |
| | • | | periodic meetings with the accounting firm. |
Policy for Audit and Non-Audit Services Provided to the Funds
On an annual basis, the scope of audits for each Fund, audit fees and expenses, and audit-related and non-audit services (and fees proposed in respect thereof) proposed to be performed by the Fund’s independent accountants will be presented by the Treasurer and the independent accountants to the Audit Committee for review and, as appropriate, approval prior to the initiation of such services. Such presentation shall be accompanied by confirmation by both the Treasurer and the independent accountants that the proposed services will not adversely affect the independence of the independent accountants. Proposed services shall be described in sufficient detail to enable the Audit Committee to assess the appropriateness of such services and fees, and the compatibility of the provision of such services with the auditor’s independence. The Committee shall receive periodic reports on the progress of the audit and other services which are approved by the Committee or by the Committee Chair pursuant to authority delegated in this Policy.
The categories of services enumerated under “Audit Services”, “Audit-related Services”, and “Tax Services” are intended to provide guidance to the Treasurer and the independent accountants as to those categories of services which the Committee believes are generally consistent with the independence of the independent accountants and which the Committee (or the Committee Chair) would expect upon the presentation of specific proposals to pre-approve. The enumerated categories are not intended as an exclusive list of audit, audit-related or tax services, which the Committee (or the Committee Chair) would consider for pre-approval.
Audit Services
The following categories of audit services are considered to be consistent with the role of the Fund’s independent accountants:
| | • | | Annual Fund financial statement audits |
| | • | | Seed audits (related to new product filings, as required) |
| | • | | SEC and regulatory filings and consents |
Audit-related Services
The following categories of audit-related services are considered to be consistent with the role of the Fund’s independent accountants:
| | • | | Accounting consultations |
| | • | | Fund merger support services |
| | • | | Agreed Upon Procedure Reports |
| | • | | Other Internal Control Reports |
Individual audit-related services that fall within one of these categories and are not presented to the Audit Committee as part of the annual pre-approval process will be subject to pre-approval by the Committee Chair (or any other Committee member on whom this responsibility has been delegated) so long as the estimated fee for those services does not exceed $50,000.
Tax Services
The following categories of tax services are considered to be consistent with the role of the Fund’s independent accountants:
| | • | | Tax compliance services related to the filing or amendment of the following: |
| | • | | Federal, state and local income tax compliance; and, |
| | • | | Sales and use tax compliance |
| | • | | Timely RIC qualification reviews |
| | • | | Tax distribution analysis and planning |
| | • | | Tax authority examination services |
| | • | | Tax appeals support services |
| | • | | Accounting methods studies |
| | • | | Fund merger support services |
| | • | | Tax consulting services and related projects |
Individual tax services that fall within one of these categories and are not presented to the Audit Committee as part of the annual pre-approval process will be subject to pre-approval by the Committee Chair (or any other Committee member on whom this responsibility has been delegated) so long as the estimated fee for those services does not exceed $50,000.
Other Non-audit Services
Certain non-audit services that the independent accountants are legally permitted to render will be subject to pre-approval by the Committee or by one or more Committee members to whom the Committee has delegated this authority and who will report to the full Committee any pre-approval
decisions made pursuant to this Policy. Non-audit services presented for pre-approval pursuant to this paragraph will be accompanied by a confirmation from both the Treasurer and the independent accountants that the proposed services will not adversely affect the independence of the independent accountants.
Proscribed Services
The Fund’s independent accountants will not render services in the following categories of non-audit services:
| | • | | Bookkeeping or other services related to the accounting records or financial statements of the Fund |
| | • | | Financial information systems design and implementation |
| | • | | Appraisal or valuation services, fairness opinions, or contribution-in-kind reports |
| | • | | Internal audit outsourcing services |
| | • | | Management functions or human resources |
| | • | | Broker or dealer, investment adviser, or investment banking services |
| | • | | Legal services and expert services unrelated to the audit |
| | • | | Any other service that the Public Company Accounting Oversight Board determines, by regulation, is impermissible. |
Pre-approval of Non-Audit Services Provided to Other Entities Within the Prudential Fund Complex
Certain non-audit services provided to Prudential Investments LLC or any of its affiliates that also provide ongoing services to the Prudential Mutual Funds will be subject to pre-approval by the Audit Committee. The only non-audit services provided to these entities that will require pre-approval are those related directly to the operations and financial reporting of the Funds. Individual projects that are not presented to the Audit Committee as part of the annual pre-approval process will be subject to pre-approval by the Committee Chair (or any other Committee member on whom this responsibility has been delegated) so long as the estimated fee for those services does not exceed $50,000. Services presented for pre-approval pursuant to this paragraph will be accompanied by a confirmation from both the Treasurer and the independent accountants that the proposed services will not adversely affect the independence of the independent accountants.
Although the Audit Committee will not pre-approve all services provided to Prudential Investments LLC and its affiliates, the Committee will receive an annual report from the Fund’s independent accounting firm showing the aggregate fees for all services provided to Prudential Investments and its affiliates.
(e) (2) Percentage of services referred to in 4(b) – 4(d) that were approved by the audit committee –
One hundred percent of the services described in Item 4(b) was approved by the audit committee.
(f) Percentage of hours expended attributable to work performed by other than full time employees of principal accountant if greater than 50%.
The percentage of hours expended on the principal accountant’s engagement to audit the registrant’s financial statements for the most recent fiscal year that were attributed to work performed by persons other than the principal accountant’s full-time, permanent employees was 0%.
(g) Non-Audit Fees
Not applicable to Registrant for the fiscal years 2010 and 2009. The aggregate non-audit fees billed by KPMG for services rendered to the registrant’s investment adviser and any entity controlling, controlled by, or under common control with the investment adviser that provides ongoing services to the registrant for the fiscal years 2010 and 2009 was $0 and $0, respectively.
(h) Principal Accountant’s Independence
Not applicable as KPMG has not provided non-audit services to the registrant’s investment adviser and any entity controlling, controlled by, or under common control with the investment adviser that provides ongoing services to the registrant that were not pre-approved pursuant to Rule 2-01(c)(7)(ii) of Regulation S-X.
Item 5 – Audit Committee of Listed Registrants – Not applicable.
Item 6 – Schedule of Investments – The schedule is included as part of the report to shareholders filed under Item 1 of this Form.
Item 7 – Disclosure of Proxy Voting Policies and Procedures for Closed-End Management Investment Companies – Not applicable.
Item 8 – Portfolio Managers of Closed-End Management Investment Companies – Not applicable.
Item 9 – Purchases of Equity Securities by Closed-End Management Investment Company and Affiliated Purchasers – Not applicable.
Item 10 – Submission of Matters to a Vote of Security Holders – Not applicable.
Item 11 – Controls and Procedures
| | (a) | It is the conclusion of the registrant’s principal executive officer and principal financial officer that the effectiveness of the registrant’s current disclosure controls and procedures (such disclosure controls and procedures having been evaluated within 90 days of the date of this filing) provide reasonable assurance that the information required to be disclosed by the registrant has been recorded, processed, summarized and reported within the time period specified in the Commission’s rules and forms and that the information required to be disclosed by the registrant has been accumulated and communicated to the registrant’s principal executive officer and principal financial officer in order to allow timely decisions regarding required disclosure. |
| | (b) | There has been no significant change in the registrant’s internal control over financial reporting that occurred during the registrant’s most recent fiscal quarter of the period covered by this report that has materially affected, or is likely to materially affect, the registrant’s internal control over financial reporting. |
Item 12 – Exhibits
| | |
(a) | | (1) Code of Ethics – Attached hereto as Exhibit EX-99.CODE-ETH |
| |
| | (2) Certifications pursuant to Section 302 of the Sarbanes-Oxley Act – Attached hereto as Exhibit EX-99.CERT. |
| |
| | (3) Any written solicitation to purchase securities under Rule 23c-1. – Not applicable. |
| |
(b) | | Certifications pursuant to Section 906 of the Sarbanes-Oxley Act – Attached hereto as Exhibit EX-99.906CERT. |
SIGNATURES
Pursuant to the requirements of the Securities Exchange Act of 1934 and the Investment Company Act of 1940, the registrant has duly caused this report to be signed on its behalf by the undersigned, thereunto duly authorized.
| | |
Registrant: Prudential Investment Portfolios 7 |
| |
| By: | | /S/ DEBORAH A. DOCS |
| | Deborah A. Docs |
| | Secretary |
October 21, 2010
Pursuant to the requirements of the Securities Exchange Act of 1934 and the Investment Company Act of 1940, this report has been signed below by the following persons on behalf of the registrant and in the capacities and on the dates indicated.
| | |
| |
| By: | | /S/ JUDY A. RICE |
| | Judy A. Rice |
| | President and Principal Executive Officer |
October 21, 2010 |
| |
| By: | | /S/ GRACE C. TORRES |
| | Grace C. Torres |
| | Treasurer and Principal Financial Officer |
October 21, 2010 |