Name of Registrant: Royce Value Trust, Inc.
A Closed-End Fund Offers Several Distinct Advantages Not Available from an Open-End Fund Structure
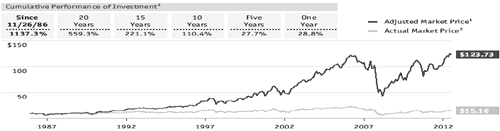
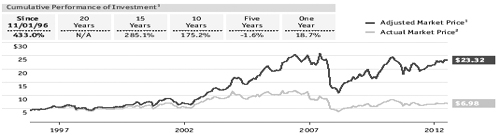
The following table details the share accumulations by an initial investor in the Funds who reinvested all distributions and participated fully in primary subscriptions for each of the rights offerings. Full participation in distribution reinvestments and rights offerings can maximize the returns available to a long-term investor. This table should be read in conjunction with the Performance and Portfolio Reviews of the Funds.
The following table details the share accumulations by an initial investor in the Funds who reinvested all distributions and participated fully in primary subscriptions for each of the rights offerings. Full participation in distribution reinvestments and rights offerings can maximize the returns available to a long-term investor. This table should be read in conjunction with the Performance and Portfolio Reviews of the Funds.
This table is presented to show selected data for a share of Common Stock outstanding throughout each period, and to assist stockholders in evaluating the Fund’s performance for the periods presented.
Royce Value Trust, Inc. (the "Fund"), was incorporated under the laws of the State of Maryland on July 1, 1986, as a diversified closed-end investment company. The Fund commenced operations on November 26, 1986.
The Board of Directors of the Fund (the “Board”) has approved, subject to stockholder approval, the contribution of a portion of the Fund’s assets to a newly formed closed-end investment company, Royce Global Value Trust, Inc. (“RGT”). All of the RGT’s common shares would then be distributed to the Common Stockholders of the Fund.
The Fund would contribute to RGT approximately $100 million of its cash and/or securities, and would then distribute all of the shares of RGT pro rata to the Common Stockholders of the Fund.
RGT is a closed-end management investment company, organized as a Maryland corporation and registered under the 1940 Act, whose objective is long-term growth of capital. RGT had no operations prior to June 30, 2013, other than the sale of 10,160 common shares for $100,076 to the Fund on June 19, 2013.
The preparation of financial statements in conformity with accounting principles generally accepted in the United States of America requires management to make estimates and assumptions that affect the reported amounts of assets and liabilities and the disclosure of contingent assets and liabilities at the date of the financial statements and the reported amounts of income and expenses during the reporting period. Actual results could differ from those estimates.
The inputs or methodology used for valuing securities are not necessarily an indication of the risk associated with investing in those securities.
The following is a summary of the inputs used to value the Fund’s investments as of June 30, 2013. For a detailed breakout of common stocks by sector classification, please refer to the Schedule of Investments.
For the six months ended June 30, 2013, certain securities have transferred in and out of Level 1 and Level 2 measurements as a result of the fair value pricing procedures for international equities. The Fund recognizes transfers between levels as of the end of the reporting period. At June 30, 2013, securities valued at $207,379,737 were transferred from Level 2 to Level 1 and securities valued at $21,411 were transferred from Level 1 to Level 2 within the fair value hierarchy.
This table is presented to show selected data for a share of Common Stock outstanding throughout each period, and to assist stockholders in evaluating the Fund’s performance for the periods presented.
Royce Micro-Cap Trust, Inc. (the "Fund"), was incorporated under the laws of the State of Maryland on September 9, 1993, as a diversified closed-end investment company. The Fund commenced operations on December 14, 1993.
The preparation of financial statements in conformity with accounting principles generally accepted in the United States of America requires management to make estimates and assumptions that affect the reported amounts of assets and liabilities and the disclosure of contingent assets and liabilities at the date of the financial statements and the reported amounts of income and expenses during the reporting period. Actual results could differ from those estimates.
Securities are valued as of the close of trading on the New York Stock Exchange (NYSE) (generally 4:00 p.m. Eastern time) on the valuation date. Securities that trade on an exchange, and securities traded on Nasdaq’s Electronic Bulletin Board, are valued at their last reported sales price or Nasdaq official closing price taken from the primary market in which each security trades or, if no sale is reported for such day, at their bid price. Other over-the-counter securities for which market quotations are readily available are valued at their highest bid price, except in the case of some bonds and other fixed income securities which may be valued by reference to other securities with comparable ratings, interest rates and maturities, using established independent pricing services. The Fund values its non-U.S. dollar denominated securities in U.S. dollars daily at the prevailing foreign currency exchange rates as quoted by a major bank. Securities for which market quotations are not readily available are valued at their fair value in accordance with the provisions of the 1940 Act, under procedures approved by the Fund’s Board of Directors, and are reported as Level 3 securities. As a general principle, the fair value of a security is the amount which the Fund might reasonably expect to receive for the security upon its current sale. However, in light of the judgment involved in fair valuations, there can be no assurance that a fair value assigned to a particular security will be the amount which the Fund might be able to receive upon its current sale. In addition, if, between the time trading ends on a particular security and the close of the customary trading session on the NYSE, events occur that are significant and may make the closing price unreliable, the Fund may fair value the security. The Fund uses an independent pricing service to provide fair value estimates for relevant non-U.S. equity securities on days when the U.S. market volatility exceeds a certain threshold. This pricing service uses proprietary correlations it has developed between the movement of prices of non-U.S. equity securities and indices of U.S.-traded securities, futures contracts and other indications to estimate the fair value of relevant non-U.S. securities. When fair value pricing is employed, the prices of securities used by the Fund may differ from quoted or published prices for the same security. Investments in money market funds are valued at net asset value per share.
Various inputs are used in determining the value of the Fund’s investments, as noted above. These inputs are summarized in the three broad levels below:| Level 1 – | quoted prices in active markets for identical securities. |
| Level 2 – | other significant observable inputs (including quoted prices for similar securities, foreign securities that may be fair valued and repurchase agreements). The table below includes all Level 2 securities. Level 2 securities with values based on quoted prices for similar securities are noted in the Schedule of Investments. |
| Level 3 – | significant unobservable inputs (including last trade price before trading was suspended, or at a discount thereto for lack of marketability or otherwise, market price information regarding other securities, information received from the company and/or published documents, including SEC filings and financial statements, or other publicly available information). |
The inputs or methodology used for valuing securities are not necessarily an indication of the risk associated with investing in those securities.
The following is a summary of the inputs used to value the Fund’s investments as of June 30, 2013. For a detailed breakout of common stocks by sector classification, please refer to the Schedule of Investments.
| | | | Level 1 | | | Level 2 | | | Level 3 | | | Total |
| Common Stocks | | $ | 381,572,893 | | $ | 8,999,545 | | $ | 129,710 | | $ | 390,702,148 |
| Preferred Stocks | | | – | | | 1,342,290 | | | – | | | 1,342,290 |
| Cash Equivalents | | | – | | | 5,996,000 | | | – | | | 5,996,000 |
For the six months ended June 30, 2013, certain securities have transferred in and out of Level 1 and Level 2 measurements as a result of the fair value pricing procedures for international equities. The Fund recognizes transfers between levels as of the end of the reporting period. At June 30, 2013, securities valued at $22,013,321 were transferred from Level 2 to Level 1 and securities valued at $2,400 were transferred from Level 1 to Level 2 within the fair value hierarchy.
Level 3 Reconciliation:
| | | | | | | Realized and Unrealized | | | | |
| | | | Balance as of 12/31/12 | | | Gain (Loss)1 | | | | Balance as of 6/30/13 |
| Common Stocks | | | $197,755 | | | $(68,045) | | | | $129,710 |
| 1 | The net change in unrealized appreciation (depreciation) is included in the accompanying Statement of Operations. Change in unrealized appreciation (depreciation) includes net unrealized appreciation (depreciation) resulting from changes in investment values during the reporting period and the reversal of previously recorded unrealized appreciation (depreciation) when gains or losses are realized. Net realized gain (loss) from investments and foreign currency transactions is included in the accompanying Statement of Operations. |
| | | 2013 Semiannual Report to Stockholders | 45 |
| Royce Micro-Cap Trust | |
|
| | Notes to Financial Statements (unaudited) (continued) |
|
Repurchase Agreements:
The Fund may enter into repurchase agreements with institutions that the Fund’s investment adviser has determined are creditworthy. The Fund restricts repurchase agreements to maturities of no more than seven days. Securities pledged as collateral for repurchase agreements, which are held until maturity of the repurchase agreements, are marked-to-market daily and maintained at a value at least equal to the principal amount of the repurchase agreement (including accrued interest). Repurchase agreements could involve certain risks in the event of default or insolvency of the counter-party, including possible delays or restrictions upon the ability of the Fund to dispose of its underlying securities.
Foreign Currency:
Net realized foreign exchange gains or losses arise from sales and maturities of short-term securities, sales of foreign currencies, expiration of currency forward contracts, currency gains or losses realized between the trade and settlement dates on securities transactions, and the difference between the amounts of dividends, interest, and foreign withholding taxes recorded on the Fund’s books and the U.S. dollar equivalent of the amounts actually received or paid. Net unrealized foreign exchange gains and losses arise from changes in the value of assets and liabilities, including investments in securities at the end of the reporting period, as a result of changes in foreign currency exchange rates.
Taxes:
As a qualified regulated investment company under Subchapter M of the Internal Revenue Code, the Fund is not subject to income taxes to the extent that it distributes substantially all of its taxable income for its fiscal year. The Schedule of Investments includes information regarding income taxes under the caption “Tax Information”.
Distributions:
The Fund pays quarterly distributions on the Fund’s Common Stock at the annual rate of 5% of the rolling average of the prior four calendar quarter-end NAVs of the Fund’s Common Stock, with the fourth quarter distribution being the greater of 1.25% of the rolling average or the distribution required by IRS regulations. Prior to November 15, 2012, distributions to Preferred Stockholders were accrued daily and paid quarterly. Distributions to Common Stockholders are recorded on ex-dividend date. Distributable capital gains and/or net investment income were first allocated to Preferred Stockholder distributions, with any excess allocable to Common Stockholders. If capital gains and/or net investment income were allocated to both Preferred and Common Stockholders, the tax character of such allocations was proportional. To the extent that distributions are not paid from long-term capital gains, net investment income or net short-term capital gains, they will represent a return of capital. Distributions are determined in accordance with income tax regulations that may differ from accounting principles generally accepted in the United States of America. Permanent book and tax differences relating to stockholder distributions will result in reclassifications within the capital accounts. Undistributed net investment income may include temporary book and tax basis differences, which will reverse in a subsequent period. Any taxable income or gain remaining undistributed at fiscal year end is distributed in the following year.
Investment Transactions and Related Investment Income:
Investment transactions are accounted for on the trade date. Dividend income is recorded on the ex-dividend date. Non-cash dividend income is recorded at the fair market value of the securities received. Interest income is recorded on an accrual basis. Premium and discounts on debt securities are amortized using the effective yield-to-maturity method. Realized gains and losses from investment transactions are determined on the basis of identified cost for book and tax purposes.
Expenses:
The Fund incurs direct and indirect expenses. Expenses directly attributable to the Fund are charged to the Fund’s operations, while expenses applicable to more than one of the Royce Funds are allocated equitably. Certain personnel, occupancy costs and other administrative expenses related to the Royce Funds are allocated by Royce & Associates, LLC (“Royce”) under an administration agreement and are included in administrative and office facilities and professional fees. The Fund has adopted a deferred fee agreement that allows the Directors to defer the receipt of all or a portion of directors’ fees otherwise payable. The deferred fees are invested in certain Royce Funds until distributed in accordance with the agreement.
Compensating Balance Credits:
The Fund has an arrangement with its custodian bank, whereby a portion of the custodian’s fee is paid indirectly by credits earned on the Fund’s cash on deposit with the bank. This deposit arrangement is an alternative to purchasing overnight investments. Conversely, the Fund pays interest to the custodian on any cash overdrafts, to the extent they are not offset by credits earned on positive cash balances.
Capital Stock:
The Fund issued 326,304 and 804,089 shares of Common Stock as reinvestment of distributions by Common Stockholders for the six months ended June 30, 2013 and the year ended December 31, 2012, respectively.
| 46 | 2013 Semiannual Report to Stockholders | | |
| Royce Micro-Cap Trust | |
|
| | Notes to Financial Statements (unaudited) (continued) |
|
Borrowings:
The Fund entered into a $45,000,000 revolving credit agreement (the credit agreement) with BNP Paribas Prime Brokerage Inc. (BNPP) on November 14, 2012. The Fund pays a commitment fee of 0.50% per annum on the unused portion of the credit agreement. The credit agreement has a 360-day rolling term that resets daily; however, if the Fund exceeds certain net asset value triggers, the credit agreement may convert to a 60-day rolling term that resets daily. The Fund is required to pledge portfolio securities as collateral in an amount up to two times the loan balance outstanding and has granted a security interest in the securities pledged to, and in favor of, BNPP as security for the loan balance outstanding. If the Fund fails to meet certain requirements, or maintain other financial covenants required under the credit agreement, the Fund may be required to repay immediately, in part or in full, the loan balance outstanding under the credit agreement necessitating the sale of portfolio securities at potentially inopportune times. The credit agreement also permits, subject to certain conditions, BNPP to rehypothecate portfolio securities pledged by the Fund up to the amount of the loan balance outstanding. The Fund continues to receive payments in lieu of dividends and interest on rehypothecated securities. The Fund also has the right under the credit agreement to recall the rehypothecated securities from BNPP on demand. If BNPP fails to deliver the recalled security in a timely manner, the Fund will be compensated by BNPP for any fees or losses related to the failed delivery or, in the event a recalled security will not be returned by BNPP, the Fund, upon notice to BNPP, may reduce the loan balance outstanding by the amount of the recalled security failed to be returned. The Fund will receive a portion of the fees earned by BNPP in connection with the rehypothecation of portfolio securities.
As of June 30, 2013, the Fund has outstanding borrowings of $45,000,000. During the six months ended June 30, 2013, the Fund borrowed an average daily balance of $45,000,000 at a weighted average borrowing cost of 1.23%. As of June 30, 2013, the aggregate value of rehypothecated securities was $42,626,259. During the six months ended June 30, 2013, the Fund earned $59,030 in fees from rehypothecated securities.
Investment Advisory Agreement:
As compensation for its services under the Investment Advisory Agreement, Royce receives a fee comprised of a Basic Fee (“Basic Fee”) and an adjustment to the Basic Fee based on the investment performance of the Fund in relation to the investment record of the Russell 2000.
The Basic Fee is a monthly fee equal to 1/12 of 1% (1% on an annualized basis) of the average of the Fund’s month-end net assets applicable to Common Stockholders, plus the liquidation value of outstanding Preferred Stock, for the rolling 36-month period ending with such month (the "performance period"). The Basic Fee for each month is increased or decreased at the rate of 1/12 of .05% for each percentage point that the investment performance of the Fund exceeds, or is exceeded by, the percentage change in the investment record of the Russell 2000 for the performance period by more than two percentage points. The performance period for each such month is a rolling 36-month period ending with such month. The maximum increase or decrease in the Basic Fee for any month may not exceed 1/12 of .5%. Accordingly, for each month, the maximum monthly fee rate as adjusted for performance is 1/12 of 1.5% and is payable if the investment performance of the Fund exceeds the percentage change in the investment record of the Russell 2000 by 12 or more percentage points for the performance period, and the minimum monthly fee rate as adjusted for performance is 1/12 of .5% and is payable if the percentage change in the investment record of the Russell 2000 exceeds the investment performance of the Fund by 12 or more percentage points for the performance period.
For the six rolling 36-month periods ended June 2013, the Fund’s investment performance ranged from 4% to 8% below the investment performance of the Russell 2000. Accordingly, the net investment advisory fee consisted of a Basic Fee of $1,743,313 and a net downward adjustment of $348,897 for the performance of the Fund relative to that of the Russell 2000. For the six months ended June 30, 2013, the Fund accrued and paid Royce investment advisory fees totaling $1,394,416.
Purchases and Sales of Investment Securities:
For the six months ended June 30, 2013, the costs of purchases and proceeds from sales of investment securities, other than short-term securities, amounted to $63,462,427 and $60,328,900, respectively.
Transactions in Affiliated Companies:
An “Affiliated Company” as defined in the Investment Company Act of 1940, is a company in which a fund owns 5% or more of the company’s outstanding voting securities at any time during the period. The Fund effected the following transactions in shares of such companies for the six months ended June 30, 2013:
| | | Shares | | | Market Value | | Cost of | | Cost of | | | Realized | | Dividend | | Shares | | | Market Value |
| Affiliated Company | | 12/31/12 | | | 12/31/12 | | Purchases | | Sales | | | Gain (Loss) | | Income | | 6/30/13 | | | 6/30/13 |
| Integrated Electrical Services | | 1,099,679 | | | $5,124,504 | | – | | $187,181 | | | $381,992 | | – | | 998,500 | | | $4,443,325 |
| | | | | | $5,124,504 | | | | | | | $381,992 | | | | | | | $4,443,325 |
| | | 2013 Semiannual Report to Stockholders | 47 |
Royce Focus Trust
| | | SHARES | | | VALUE |
| COMMON STOCKS – 97.4% | | | | | |
| | | | | | |
| Consumer Discretionary – 11.6% | | | | | |
| Automobiles - 2.7% | | | | | |
Thor Industries | | 90,000 | | $ | 4,426,200 |
| | | | |
|
| Household Durables - 1.6% | | | | | |
| Garmin | | 75,000 | | | 2,712,000 |
| | | | |
|
| Specialty Retail - 7.3% | | | | | |
Buckle (The) | | 100,000 | | | 5,202,000 |
GameStop Corporation Cl. A | | 100,000 | | | 4,203,000 |
† Signet Jewelers | | 40,000 | | | 2,697,200 |
| | | | |
|
| | | | | | 12,102,200 |
| | | | |
|
| Total (Cost $14,094,677) | | | | | 19,240,400 |
| | | | |
|
| Consumer Staples – 6.4% | | | | | |
| Food Products - 4.0% | | | | | |
Cal-Maine Foods | | 45,000 | | | 2,092,950 |
Industrias Bachoco ADR | | 85,000 | | | 2,949,500 |
Sanderson Farms | | 25,000 | | | 1,660,500 |
| | | | |
|
| | | | | | 6,702,950 |
| | | | |
|
| Personal Products - 2.4% | | | | | |
Nu Skin Enterprises Cl. A | | 65,000 | | | 3,972,800 |
| | | | |
|
| Total (Cost $7,703,781) | | | | | 10,675,750 |
| | | | |
|
| Energy – 12.8% | | | | | |
| Energy Equipment & Services - 9.8% | | | | | |
Helmerich & Payne | | 85,000 | | | 5,308,250 |
Pason Systems | | 220,000 | | | 3,999,620 |
† TGS-NOPEC Geophysical | | 50,000 | | | 1,452,830 |
Trican Well Service | | 250,000 | | | 3,323,191 |
Unit Corporation 1 | | 50,000 | | | 2,129,000 |
| | | | |
|
| | | | | | 16,212,891 |
| | | | |
|
| Oil, Gas & Consumable Fuels - 3.0% | | | | | |
Exxon Mobil | | 55,000 | | | 4,969,250 |
| | | | |
|
| Total (Cost $16,781,514) | | | | | 21,182,141 |
| | | | |
|
| Financials – 17.7% | | | | | |
| Capital Markets - 11.2% | | | | | |
† Artisan Partners Asset Management 1 | | 30,000 | | | 1,497,300 |
Ashmore Group | | 550,000 | | | 2,875,127 |
† Federated Investors Cl. B | | 110,000 | | | 3,015,100 |
Franklin Resources | | 40,000 | | | 5,440,800 |
Partners Group Holding | | 7,000 | | | 1,895,347 |
Sprott | | 600,000 | | | 1,597,413 |
Value Partners Group | | 4,300,000 | | | 2,317,417 |
| | | | |
|
| | | | | | 18,638,504 |
| | | | |
|
| Insurance - 4.1% | | | | | |
Berkshire Hathaway Cl. B 1 | | 60,000 | | | 6,715,200 |
| | | | |
|
| Real Estate Management & Development - 2.4% | | | | | |
Kennedy-Wilson Holdings | | 240,000 | | | 3,993,600 |
| | | | |
|
| Total (Cost $22,975,393) | | | | | 29,347,304 |
| | | | |
|
| Health Care – 2.9% | | | | | |
| Biotechnology - 2.9% | | | | | |
Myriad Genetics 1 | | 180,000 | | | 4,836,600 |
| | | | |
|
| Total (Cost $4,565,125) | | | | | 4,836,600 |
| | | | |
|
| Industrials – 7.4% | | | | | |
| Construction & Engineering - 2.0% | | | | | |
Jacobs Engineering Group 1 | | 60,000 | | | 3,307,800 |
| | | | |
|
| Electrical Equipment - 0.6% | | | | | |
GrafTech International 1 | | 150,000 | | | 1,092,000 |
| | | | |
|
| Machinery - 3.2% | | | | | |
Lincoln Electric Holdings | | 45,000 | | | 2,577,150 |
Semperit AG Holding | | 75,000 | | | 2,694,415 |
| | | | |
|
| | | | | | 5,271,565 |
| | | | |
|
| Road & Rail - 1.6% | | | | | |
Patriot Transportation Holding 1 | | 90,000 | | | 2,703,600 |
| | | | |
|
| Total (Cost $9,961,915) | | | | | 12,374,965 |
| | | | |
|
| Information Technology – 19.1% | | | | | |
| Computers & Peripherals - 9.6% | | | | | |
Apple | | 10,000 | | | 3,960,800 |
SanDisk Corporation 1 | | 65,000 | | | 3,971,500 |
Western Digital | | 130,000 | | | 8,071,700 |
| | | | |
|
| | | | | | 16,004,000 |
| | | | |
|
| Semiconductors & Semiconductor Equipment - 5.3% | | | | | |
Analog Devices | | 70,000 | | | 3,154,200 |
Cirrus Logic 1 | | 140,000 | | | 2,430,400 |
MKS Instruments | | 120,000 | | | 3,184,800 |
| | | | |
|
| | | | | | 8,769,400 |
| | | | |
|
| Software - 4.2% | | | | | |
Microsoft Corporation | | 200,000 | | | 6,906,000 |
| | | | |
|
| Total (Cost $24,702,472) | | | | | 31,679,400 |
| | | | |
|
| Materials – 19.5% | | | | | |
| Chemicals - 4.5% | | | | | |
LSB Industries 1 | | 20,000 | | | 608,200 |
Mosaic Company (The) | | 90,000 | | | 4,842,900 |
Westlake Chemical | | 20,000 | | | 1,928,200 |
| | | | |
|
| | | | | | 7,379,300 |
| | | | |
|
| Metals & Mining - 13.6% | | | | | |
Alamos Gold | | 160,000 | | | 1,938,196 |
Allied Nevada Gold 1 | | 120,000 | | | 777,600 |
Endeavour Mining 1 | | 450,000 | | | 239,612 |
Fresnillo | | 120,000 | | | 1,609,773 |
Globe Specialty Metals | | 200,000 | | | 2,174,000 |
Major Drilling Group International | | 250,000 | | | 1,702,006 |
Nucor Corporation | | 45,000 | | | 1,949,400 |
Pan American Silver | | 200,000 | | | 2,328,000 |
Pretium Resources 1 | | 200,000 | | | 1,320,000 |
† Randgold Resources ADR | | 25,000 | | | 1,601,250 |
Reliance Steel & Aluminum | | 60,000 | | | 3,933,600 |
Schnitzer Steel Industries Cl. A | | 75,000 | | | 1,753,500 |
Seabridge Gold 1 | | 135,000 | | | 1,273,050 |
| | | | |
|
| | | | | | 22,599,987 |
| | | | |
|
| 48 | 2013 Semiannual Report to Stockholders | | THE ACCOMPANYING NOTES ARE AN INTEGRAL PART OF THESE FINANCIAL STATEMENTS. |
June 30, 2013 (unaudited)
|
| | | SHARES | | | VALUE |
| Materials (continued) | | | | | |
| Paper & Forest Products - 1.4% | | | | | |
Stella-Jones | | 25,000 | | $ | 2,330,512 |
| | | | |
|
| Total (Cost $36,994,746) | | | | | 32,309,799 |
| | | | |
|
| TOTAL COMMON STOCKS | | | | | |
(Cost $137,779,623) | | | | | 161,646,359 |
| | | | |
|
| REPURCHASE AGREEMENT – 2.6% | | | | | |
| Fixed Income Clearing Corporation, | | | | | |
0.01% dated 6/28/13, due 7/1/13, | | | | | |
maturity value $4,219,004 (collateralized | | | | | |
by obligations of various U.S. Government | | | | | |
Agencies, 4.125% due 4/15/14, valued at | | | | | |
$4,305,619) | | | | | |
(Cost $4,219,000) | | | | | 4,219,000 |
| | | | |
|
| | | | | | |
| TOTAL INVESTMENTS – 100.0% | | | | | |
(Cost $141,998,623) | | | | | 165,865,359 |
| | | | | | |
| CASH AND OTHER ASSETS | | | | | |
LESS LIABILITIES – 0.0% | | | | | 59,405 |
| | | | |
|
| | | | | | |
| NET ASSETS – 100.0% | | | | $ | 165,924,764 |
| | | | |
|
| | |
|
| † | New additions in 2013. |
| 1 | Non-income producing. |
| | |
| | Bold indicates the Fund's 20 largest equity holdings in terms of June 30, 2013, market value. |
| | |
| | TAX INFORMATION: The cost of total investments for Federal income tax purposes was $141,998,623. At June 30, 2013, net unrealized appreciation for all securities was $23,866,736, consisting of aggregate gross unrealized appreciation of $38,177,000 and aggregate gross unrealized depreciation of $14,310,264. |
|
| THE ACCOMPANYING NOTES ARE AN INTEGRAL PART OF THESE FINANCIAL STATEMENTS. | 2013 Semiannual Report to Stockholders | 49 |
| Royce Focus Trust | | June 30, 2013 (unaudited) |
|
| Statement of Assets and Liabilities |
| ASSETS: | | | |
| Total investments at value | | $ | 161,646,359 |
| Repurchase agreements (at cost and value) | | | 4,219,000 |
| Cash and foreign currency | | | 33,764 |
| Receivable for dividends and interest | | | 212,537 |
| Prepaid expenses and other assets | | | 18,462 |
| |
Total Assets | | | 166,130,122 |
| |
| LIABILITIES: | | | |
| Payable for investment advisory fee | | | 139,678 |
| Accrued expenses | | | 65,680 |
| |
Total Liabilities | | | 205,358 |
| |
Net Assets | | $ | 165,924,764 |
| |
| ANALYSIS OF NET ASSETS: | | | |
| Paid-in capital - $0.001 par value per share; 21,697,322 shares outstanding (150,000,000 shares authorized) | | $ | 139,674,114 |
| Undistributed net investment income (loss) | | | 576,211 |
| Accumulated net realized gain (loss) on investments and foreign currency | | | 5,886,145 |
| Net unrealized appreciation (depreciation) on investments and foreign currency | | | 23,863,287 |
| Quarterly distributions | | | (4,074,993) |
| |
Net Assets (net asset value per share - $7.65) | | $ | 165,924,764 |
| |
Investments at identified cost | | $ | 137,779,623 |
| 50 | 2013 Semiannual Report to Stockholders | | THE ACCOMPANYING NOTES ARE AN INTEGRAL PART OF THESE FINANCIAL STATEMENTS. |
| Royce Focus Trust | | Six Months Ended June 30, 2013 (unaudited) |
|
| INVESTMENT INCOME: | | | | |
| Income: | | | | |
Dividends | | $ | 1,583,731 | |
Foreign withholding tax | | | (69,410 | ) |
Interest | | | 280 | |
Securities lending | | | 1,673 | |
| |
| Total income | | | 1,516,274 | |
| |
| Expenses: | | | | |
Investment advisory fees | | | 829,539 | |
Stockholder reports | | | 37,887 | |
Custody and transfer agent fees | | | 25,735 | |
Directors’ fees | | | 19,948 | |
Professional fees | | | 14,132 | |
Administrative and office facilities | | | 9,919 | |
Other expenses | | | 25,337 | |
| |
| Total expenses | | | 962,497 | |
| Compensating balance credits | | | (8 | ) |
| |
| Net expenses | | | 962,489 | |
| |
| Net investment income (loss) | | | 553,785 | |
| |
| REALIZED AND UNREALIZED GAIN (LOSS) ON INVESTMENTS AND FOREIGN CURRENCY: | | | | |
| Net realized gain (loss): | | | | |
Investments | | | 4,592,222 | |
Foreign currency transactions | | | 7,172 | |
| Net change in unrealized appreciation (depreciation): | | | | |
Investments and foreign currency translations | | | (1,071,659 | ) |
Other assets and liabilities denominated in foreign currency | | | (1,612 | ) |
| |
| Net realized and unrealized gain (loss) on investments and foreign currency | | | 3,526,123 | |
| |
| NET INCREASE (DECREASE) IN NET ASSETS FROM INVESTMENT OPERATIONS | | | 4,079,908 | |
| THE ACCOMPANYING NOTES ARE AN INTEGRAL PART OF THESE FINANCIAL STATEMENTS. | 2013 Semiannual Report to Stockholders | 51 |
| Statement of Change in Net Assets Applicable to Common Stockholders |
| | | Six months ended | | | | |
| | | 6/30/13 | | Year ended | |
| | | (unaudited) | | 12/31/12 | |
| INVESTMENT OPERATIONS: | | | | | | | | |
| Net investment income (loss) | | $ | 553,785 | | | $ | 1,179,309 | |
| Net realized gain (loss) on investments and foreign currency | | | 4,599,394 | | | | 10,385,671 | |
| Net change in unrealized appreciation (depreciation) on investments and foreign currency | | | (1,073,271 | ) | | | 6,238,326 | |
| |
| Net increase (decrease) in net assets from investment operations | | | 4,079,908 | | | | 17,803,306 | |
| |
| DISTRIBUTIONS TO PREFERRED STOCKHOLDERS: | | | | | | | | |
| Net investment income | | | – | | | | (119,929 | ) |
| Net realized gain on investments and foreign currency | | | – | | | | (1,192,581 | ) |
| |
| Total distributions to Preferred Stockholders | | | – | | | | (1,312,510 | ) |
| |
NET INCREASE (DECREASE) IN NET ASSETS APPLICABLE TO COMMON STOCKHOLDERS FROM INVESTMENT OPERATIONS | | | 4,079,908 | | | | 16,490,796 | |
| |
| DISTRIBUTIONS TO COMMON STOCKHOLDERS: | | | | | | | | |
| Net investment income | | | – | | | | (874,175 | ) |
| Net realized gain on investments and foreign currency | | | – | | | | (8,693,633 | ) |
| Quarterly distributions1 | | | (4,074,993 | ) | | | – | |
| |
| Total distributions to Common Stockholders | | | (4,074,993 | ) | | | (9,567,808 | ) |
| |
| CAPITAL STOCK TRANSACTIONS: | | | | | | | | |
| Reinvestment of distributions to Common Stockholders | | | 2,331,705 | | | | 5,809,237 | |
| |
| Total capital stock transactions | | | 2,331,705 | | | | 5,809,237 | |
| |
| NET INCREASE (DECREASE) IN NET ASSETS APPLICABLE TO COMMON STOCKHOLDERS | | | 2,336,620 | | | | 12,732,225 | |
| |
| NET ASSETS APPLICABLE TO COMMON STOCKHOLDERS: | | | | | | | | |
Beginning of period | | | 163,588,144 | | | | 150,855,919 | |
| |
End of period (including undistributed net investment income (loss) of $576,211 at 6/30/13 and $22,426 at 12/31/12) | | $ | 165,924,764 | | | $ | 163,588,144 | |
| 1 | To be allocated to net investment income, net realized gains and/or return of capital at year end. |
| 52 | 2013 Semiannual Report to Stockholders | | THE ACCOMPANYING NOTES ARE AN INTEGRAL PART OF THESE FINANCIAL STATEMENTS. |
This table is presented to show selected data for a share of Common Stock outstanding throughout each period, and to assist stockholders in evaluating the Fund's performance for the periods presented.
| | | Six months ended | | | | | | | | | | | | | | | | | | | | |
| | | June 30, 2013 | | Years ended December 31, |
| | | | | | | |
| | | (unaudited) | | | 2012 | | | | 2011 | | | | 2010 | | | | 2009 | | | | 2008 | |
| |
| NET ASSET VALUE, BEGINNING OF PERIOD | | $ | 7.66 | | | $ | 7.36 | | | $ | 8.72 | | | $ | 7.16 | | | $ | 4.76 | | | $ | 8.92 | |
| |
| INVESTMENT OPERATIONS: | | | | | | | | | | | | | | | | | | | | | | | | |
Net investment income (loss) | | | 0.03 | | | | 0.06 | | | | 0.02 | | | | (0.01 | ) | | | 0.03 | | | | 0.07 | |
Net realized and unrealized gain (loss) on investments and foreign currency | | | 0.16 | | | | 0.81 | | | | (0.86 | ) | | | 1.65 | | | | 2.54 | | | | (3.67 | ) |
| |
Total investment operations | | | 0.19 | | | | 0.87 | | | | (0.84 | ) | | | 1.64 | | | | 2.57 | | | | (3.60 | ) |
| |
| DISTRIBUTIONS TO PREFERRED STOCKHOLDERS: | | | | | | | | | | | | | | | | | | | | | | | | |
Net investment income | | | – | | | | (0.01 | ) | | | – | | | | (0.05 | ) | | | (0.08 | ) | | | (0.01 | ) |
Net realized gain on investments and foreign currency | | | – | | | | (0.06 | ) | | | (0.07 | ) | | | (0.03 | ) | | | – | | | | (0.07 | ) |
| |
Total distributions to Preferred Stockholders | | | – | | | | (0.07 | ) | | | (0.07 | ) | | | (0.08 | ) | | | (0.08 | ) | | | (0.08 | ) |
| |
NET INCREASE (DECREASE) IN NET ASSETS APPLICABLE TO COMMON STOCKHOLDERS FROM INVESTMENT OPERATIONS | | | 0.19 | | | | 0.80 | | | | (0.91 | ) | | | 1.56 | | | | 2.49 | | | | (3.68 | ) |
| |
| DISTRIBUTIONS TO COMMON STOCKHOLDERS: | | | | | | | | | | | | | | | | | | | | | | | | |
Net investment income | | | – | | | | (0.04 | ) | | | – | | | | – | | | | (0.00 | ) | | | (0.07 | ) |
Net realized gain on investments and foreign currency | | | – | | | | (0.42 | ) | | | (0.29 | ) | | | – | | | | – | | | | (0.37 | ) |
Return of capital | | | – | | | | – | | | | (0.12 | ) | | | – | | | | (0.09 | ) | | | (0.03 | ) |
Quarterly distributions1 | | | (0.19 | ) | | | – | | | | – | | | | – | | | | – | | | | – | |
| |
Total distributions to Common Stockholders | | | (0.19 | ) | | | (0.46 | ) | | | (0.41 | ) | | | – | | | | (0.09 | ) | | | (0.47 | ) |
| |
| CAPITAL STOCK TRANSACTIONS: | | | | | | | | | | | | | | | | | | | | | | | | |
Effect of reinvestment of distributions by Common Stockholders | | | (0.01 | ) | | | (0.04 | ) | | | (0.04 | ) | | | – | | | | (0.00 | ) | | | (0.01 | ) |
| |
Total capital stock transactions | | | (0.01 | ) | | | (0.04 | ) | | | (0.04 | ) | | | – | | | | (0.00 | ) | | | (0.01 | ) |
| |
| NET ASSET VALUE, END OF PERIOD | | $ | 7.65 | | | $ | 7.66 | | | $ | 7.36 | | | $ | 8.72 | | | $ | 7.16 | | | $ | 4.76 | |
| |
| MARKET VALUE, END OF PERIOD | | $ | 6.98 | | | $ | 6.60 | | | $ | 6.30 | | | $ | 7.57 | | | $ | 6.33 | | | $ | 4.60 | |
| |
| TOTAL RETURN:2 | | | | | | | | | | | | | | | | | | | | | | | | |
| Market Value | | | 8.65 | %3 | | | 12.14 | % | | | (11.75 | )% | | | 19.59 | % | | | 40.84 | % | | | (44.94 | )% |
| Net Asset Value | | | 2.60 | %3 | | | 11.42 | % | | | (10.51 | )% | | | 21.79 | % | | | 53.95 | % | | | (42.71 | )% |
RATIOS BASED ON AVERAGE NET ASSETS APPLICABLE TO COMMON STOCKHOLDERS: | | | | | | | | | | | | | | | | | | | | | | | | |
Investment advisory fee expense | | | 1.00 | %4 | | | 1.14 | % | | | 1.15 | % | | | 1.17 | % | | | 1.16 | % | | | 1.13 | % |
Other operating expenses | | | 0.16 | %4 | | | 0.19 | % | | | 0.18 | % | | | 0.20 | % | | | 0.26 | % | | | 0.21 | % |
| Total expenses (net)5 | | | 1.16 | %4 | | | 1.33 | % | | | 1.33 | % | | | 1.37 | % | | | 1.42 | % | | | 1.34 | % |
| Expenses prior to fee waivers and balance credits | | | 1.16 | %4 | | | 1.33 | % | | | 1.33 | % | | | 1.37 | % | | | 1.48 | % | | | 1.39 | % |
| Expenses prior to fee waivers | | | 1.16 | %4 | | | 1.33 | % | | | 1.33 | % | | | 1.37 | % | | | 1.48 | % | | | 1.39 | % |
| Net investment income (loss) | | | 0.67 | %4 | | | 0.74 | % | | | 0.27 | % | | | (0.15 | )% | | | 0.49 | % | | | 0.72 | % |
| SUPPLEMENTAL DATA: | | | | | | | | | | | | | | | | | | | | | | | | |
Net Assets Applicable to Common Stockholders, End of Period (in thousands) | | $ | 165,925 | | | $ | 163,588 | | | $ | 150,856 | | | $ | 172,291 | | | $ | 141,497 | | | $ | 92,550 | |
Liquidation Value of Preferred Stock, End of Period (in thousands) | | | | | | | | | | $ | 25,000 | | | $ | 25,000 | | | $ | 25,000 | | | $ | 25,000 | |
| Portfolio Turnover Rate | | | 13 | % | | | 16 | % | | | 33 | % | | | 36 | % | | | 46 | % | | | 51 | % |
| PREFERRED STOCK: | | | | | | | | | | | | | | | | | | | | | | | | |
| Total shares outstanding | | | | | | | | | | | 1,000,000 | | | | 1,000,000 | | | | 1,000,000 | | | | 1,000,000 | |
| Asset coverage per share | | | | | | | | | | $ | 175.86 | | | $ | 197.29 | | | $ | 166.48 | | | $ | 117.55 | |
| Liquidation preference per share | | | | | | | | | | $ | 25.00 | | | $ | 25.00 | | | $ | 25.00 | | | $ | 25.00 | |
| Average month-end market value per share | | | | | | | | | | $ | 25.65 | | | $ | 25.38 | | | $ | 23.56 | | | $ | 22.89 | |
| |
| 1 | To be allocated to net investment income, net realized gains and/or return of capital at year end. |
| 2 | The Market Value Total Return is calculated assuming a purchase of Common Stock on the opening of the first business day and a sale on the closing of the last business day of each period. Dividends and distributions are assumed for the purposes of this calculation to be reinvested at prices obtained under the Fund's Distribution Reinvestment and Cash Purchase Plan. Net Asset Value Total Return is calculated on the same basis, except that the Fund's net asset value is used on the purchase and sale dates instead of market value. |
| 3 | Not annualized |
| 4 | Annualized |
| 5 | Expense ratios based on total average net assets including liquidation value of Preferred Stock were 1.17%, 1.16%, 1.17%, 1.16% and 1.14% for the years ended December 31, 2012, 2011, 2010, 2009 and 2008, respectively. |
| THE ACCOMPANYING NOTES ARE AN INTEGRAL PART OF THESE FINANCIAL STATEMENTS. | 2013 Semiannual Report to Stockholders | 53 |
| Notes to Financial Statements (unaudited) |
Summary of Significant Accounting Policies:
Royce Focus Trust, Inc. (the "Fund"), is a diversified closed-end investment company incorporated under the laws of the State of Maryland. The Fund commenced operations on March 2, 1988, and Royce & Associates, LLC (“Royce”) assumed investment management responsibility for the Fund on November 1, 1996.
The preparation of financial statements in conformity with accounting principles generally accepted in the United States of America requires management to make estimates and assumptions that affect the reported amounts of assets and liabilities and the disclosure of contingent assets and liabilities at the date of the financial statements and the reported amounts of income and expenses during the reporting period. Actual results could differ from those estimates.
At June 30, 2013, officers, employees of Royce, Fund directors, the Royce retirement plans and other affiliates owned 26% of the Fund.
Valuation of Investments: Securities are valued as of the close of trading on the New York Stock Exchange (NYSE) (generally 4:00 p.m. Eastern time) on the valuation date. Securities that trade on an exchange, and securities traded on Nasdaq's Electronic Bulletin Board, are valued at their last reported sales price or Nasdaq official closing price taken from the primary market in which each security trades or, if no sale is reported for such day, at their bid price. Other over-the-counter securities for which market quotations are readily available are valued at their highest bid price, except in the case of some bonds and other fixed income securities which may be valued by reference to other securities with comparable ratings, interest rates and maturities, using established independent pricing services. The Fund values its non-U.S. dollar denominated securities in U.S. dollars daily at the prevailing foreign currency exchange rates as quoted by a major bank. Securities for which market quotations are not readily available are valued at their fair value in accordance with the provisions of the 1940 Act, under procedures approved by the Fund's Board of Directors, and are reported as Level 3 securities. As a general principle, the fair value of a security is the amount which the Fund might reasonably expect to receive for the security upon its current sale. However, in light of the judgment involved in fair valuations, there can be no assurance that a fair value assigned to a particular security will be the amount which the Fund might be able to receive upon its current sale. In addition, if, between the time trading ends on a particular security and the close of the customary trading session on the NYSE, events occur that are significant and may make the closing price unreliable, the Fund may fair value the security. The Fund uses an independent pricing service to provide fair value estimates for relevant non-U.S. equity securities on days when the U.S. market volatility exceeds a certain threshold. This pricing service uses proprietary correlations it has developed between the movement of prices of non-U.S. equity securities and indices of U.S.-traded securities, futures contracts and other indications to estimate the fair value of relevant non-U.S. securities. When fair value pricing is employed, the prices of securities used by the Fund may differ from quoted or published prices for the same security. Investments in money market funds are valued at net asset value per share.
Various inputs are used in determining the value of the Fund’s investments, as noted above. These inputs are summarized in the three broad levels below:
Level 1 – quoted prices in active markets for identical securities.
Level 2 – other significant observable inputs (including quoted prices for similar securities, foreign securities that may be fair valued and repurchase agreements). The table below includes all Level 2 securities. Any Level 2 securities with values based on quoted prices for similar securities would be noted in the Schedule of Investments.
Level 3 – significant unobservable inputs (including last trade price before trading was suspended, or at a discount thereto for lack of marketability or otherwise, market price information regarding other securities, information received from the company and/or published documents, including SEC filings and financial statements, or other publicly available information).
The inputs or methodology used for valuing securities are not necessarily an indication of the risk associated with investing in those securities.
The following is a summary of the inputs used to value the Fund’s investments as of June 30, 2013. For a detailed breakout of common stocks by sector classification, please refer to the Schedule of Investments.
| | | Level 1 | | Level 2 | | Level 3 | | Total |
| Common Stocks | | | $ | 161,646,359 | | | | $ | – | | | | $ | – | | | | $ | 161,646,359 | |
| Cash Equivalents | | | | – | | | | | 4,219,000 | | | | | – | | | | | 4,219,000 | |
For the six months ended June 30, 2013, certain securities have transferred in and out of Level 1 and Level 2 measurements as a result of the fair value pricing procedures for international equities. The Fund recognizes transfers between levels as of the end of the reporting period. At June 30, 2013, securities valued at $27,842,628 were transferred from Level 2 to Level 1 within the fair value hierarchy.
Repurchase Agreements:
The Fund may enter into repurchase agreements with institutions that the Fund’s investment adviser has determined are creditworthy. The Fund restricts repurchase agreements to maturities of no more than seven days. Securities pledged as collateral for repurchase agreements, which are held until maturity of the repurchase agreements, are marked-to-market daily and maintained at a value at least equal to the principal amount of the repurchase agreement (including accrued interest). Repurchase agreements could involve certain risks in the event of default or insolvency of the counter-party, including possible delays or restrictions upon the ability of the Fund to dispose of its underlying securities.
| 54 | 2013 Semiannual Report to Stockholders | | |
| Notes to Financial Statements (unaudited) (continued) |
Foreign Currency:
Net realized foreign exchange gains or losses arise from sales and maturities of short-term securities, sales of foreign currencies, expiration of currency forward contracts, currency gains or losses realized between the trade and settlement dates on securities transactions, and the difference between the amounts of dividends, interest, and foreign withholding taxes recorded on the Fund's books and the U.S. dollar equivalent of the amounts actually received or paid. Net unrealized foreign exchange gains and losses arise from changes in the value of assets and liabilities, including investments in securities at the end of the reporting period, as a result of changes in foreign currency exchange rates.
Securities Lending:
The Fund loans securities through a lending agent to qualified institutional investors for the purpose of realizing additional income. Collateral for the Fund on all securities loaned is accepted in cash and cash equivalents and invested temporarily by the custodian. The collateral maintained is at least 100% of the current market value of the loaned securities. The market value of the loaned securities is determined at the close of business of the Fund and any additional required collateral is delivered to the Fund on the next business day. The Fund retains the risk of any loss on the securities on loan as well as incurring the potential loss on investments purchased with cash collateral received for securities lending. The Fund’s securities lending income consists of the income earned on investing cash collateral, plus any premium payments received for lending certain securities, less any rebates paid to borrowers and lending agent fees associated with the loan. The lending agent is not affiliated with Royce.
Taxes:
As a qualified regulated investment company under Subchapter M of the Internal Revenue Code, the Fund is not subject to income taxes to the extent that it distributes substantially all of its taxable income for its fiscal year. The Schedule of Investments includes information regarding income taxes under the caption “Tax Information”.
Distributions:
The Fund pays quarterly distributions on the Fund’s Common Stock at the annual rate of 5% of the rolling average of the prior four calendar quarter-end NAVs of the Fund’s Common Stock, with the fourth quarter distribution being the greater of 1.25% of the rolling average or the distribution required by IRS regulations. Prior to November 15, 2012, distributions to Preferred Stockholders were accrued daily and paid quarterly. Distributions to Common Stockholders are recorded on ex-dividend date. Distributable capital gains and/or net investment income were first allocated to Preferred Stockholder distributions, with any excess allocable to Common Stockholders. If capital gains and/or net investment income were allocated to both Preferred and Common Stockholders, the tax character of such allocations was proportional. To the extent that distributions are not paid from long-term capital gains, net investment income or net short-term capital gains, they will represent a return of capital. Distributions are determined in accordance with income tax regulations that may differ from accounting principles generally accepted in the United States of America. Permanent book and tax differences relating to stockholder distributions will result in reclassifications within the capital accounts. Undistributed net investment income may include temporary book and tax basis differences, which will reverse in a subsequent period. Any taxable income or gain remaining undistributed at fiscal year end is distributed in the following year.
Investment Transactions and Related Investment Income:
Investment transactions are accounted for on the trade date. Dividend income is recorded on the ex-dividend date. Non-cash dividend income is recorded at the fair market value of the securities received. Interest income is recorded on an accrual basis. Premium and discounts on debt securities are amortized using the effective yield-to-maturity method. Realized gains and losses from investment transactions are determined on the basis of identified cost for book and tax purposes.
Expenses:
The Fund incurs direct and indirect expenses. Expenses directly attributable to the Fund are charged to the Fund’s operations, while expenses applicable to more than one of the Royce Funds are allocated equitably. Certain personnel, occupancy costs and other administrative expenses related to the Royce Funds are allocated by Royce under an administration agreement and are included in administrative and office facilities and professional fees. The Fund has adopted a deferred fee agreement that allows the Directors to defer the receipt of all or a portion of directors’ fees otherwise payable. The deferred fees are invested in certain Royce Funds until distributed in accordance with the agreement.
Compensating Balance Credits:
The Fund has an arrangement with its custodian bank, whereby a portion of the custodian's fee is paid indirectly by credits earned on the Fund's cash on deposit with the bank. This deposit arrangement is an alternative to purchasing overnight investments. Conversely, the Fund pays interest to the custodian on any cash overdrafts, to the extent they are not offset by credits earned on positive cash balances.
Capital Stock:
The Fund issued 333,222 and 869,648 shares of Common Stock as reinvestment of distributions by Common Stockholders for the six months ended June 30, 2013 and the year ended December 31, 2012, respectively.
| | 2013 Semiannual Report to Stockholders | 55 |
| Notes to Financial Statements (unaudited) (continued) |
Investment Advisory Agreement:
The Investment Advisory Agreement between Royce and the Fund provides for fees to be paid at an annual rate of 1.0% of the Fund’s average daily net assets. For the six months ended June 30, 2013, the Fund accrued and paid Royce investment advisory fees totaling $829,539.
Purchases and Sales of Investment Securities:
For the six months ended June 30, 2013, the costs of purchases and proceeds from sales of investment securities, other than short-term securities and collateral received for securities loaned, amounted to $21,489,038 and $23,913,883, respectively.
| 56 | 2013 Semiannual Report to Stockholders | | |
| All Directors and Officers may be reached c/o The Royce Funds,745 Fifth Avenue, New York, NY 10151 |
Charles M. Royce, Director1, President
Age: 73 | Number of Funds Overseen: 34 | Tenure: Since 1982
Non-Royce Directorships: Director of TICC Capital Corp.
Principal Occupation(s) During Past Five Years: President, Co-Chief Investment Officer and Member of Board of Managers of Royce & Associates, LLC (“Royce”), The Royce Funds’ investment adviser.
W. Whitney George, Director1, Vice President
Age: 55 | Number of Funds Overseen: 3 | Tenure: Since April 2013
Non-Royce Directorships: None
Principal Occupation(s) During Past 5 Years: Co-Chief Investment Officer, Managing Director and Vice President of Royce, having been employed by Royce since October 1991.
Patricia W. Chadwick, Director
Age: 64 | Number of Funds Overseen: 34 | Tenure: Since 2009
Non-Royce Directorships: Trustee of ING Mutual Funds and Director of Wisconsin Energy Corp.
Principal Occupation(s) During Past 5 Years: Consultant and President of Ravengate Partners LLC (since 2000).
Richard M. Galkin, Director
Age: 75 | Number of Funds Overseen: 34 | Tenure: Since 1982
Non-Royce Directorships: None
Principal Occupation(s) During Past Five Years: Private investor. Mr. Galkin’s prior business experience includes having served as President of Richard M. Galkin Associates, Inc., telecommunications consultants, President of Manhattan Cable Television (a subsidiary of Time, Inc.), President of Haverhills Inc. (another Time, Inc. subsidiary), President of Rhode Island Cable Television and Senior Vice President of Satellite Television Corp. (a subsidiary of Comsat).
Stephen L. Isaacs, Director
Age: 73 | Number of Funds Overseen: 34 | Tenure: Since 1989
Non-Royce Directorships: None
Principal Occupation(s) During Past Five Years: Attorney and President of Health Policy Associates, Inc., consultants. Mr. Isaacs’s prior business experience includes having served as President of the Center for Health and Social Policy (from 1996 to 2012); Director of Columbia University Development Law and Policy Program and Professor at Columbia University (until August 1996).
Arthur S. Mehlman, Director
Age: 71 | Number of Funds Overseen: 48 | Tenure: Since 2004
Non-Royce Directorships: Director/Trustee of registered investment companies constituting the 14 Legg Mason Funds.
Principal Occupation(s) During Past Five Years: Director of The League for People with Disabilities, Inc.; Director of University of Maryland Foundation (non-profits). Formerly: Director of Municipal Mortgage & Equity, LLC (from October 2004 to April 1, 2011); Director of University of Maryland College Park Foundation (non-profit) (from 1998 to 2005); Partner, KPMG LLP (international accounting firm) (from 1972 to 2002); Director of Maryland Business Roundtable for Education (from July 1984 to June 2002).
David L. Meister, Director
Age: 73 | Number of Funds Overseen: 34 | Tenure: Since 1982
Non-Royce Directorships: None
Principal Occupation(s) During Past Five Years: Consultant. Chairman and Chief Executive Officer of The Tennis Channel (from June 2000 to March 2005). Mr. Meister’s prior business experience includes having served as Chief Executive Officer of Seniorlife.com, a consultant to the communications industry, President of Financial News Network, Senior Vice President of HBO, President of Time-Life Films and Head of Broadcasting for Major League Baseball.
G. Peter O’Brien, Director
Age: 67 | Number of Funds Overseen: 48 | Tenure: Since 2001
Non-Royce Directorships: Director/Trustee of registered investment companies constituting the 14 Legg Mason Funds; Director of TICC Capital Corp.
Principal Occupation(s) During Past Five Years: Trustee Emeritus of Colgate University (since 2005); Board Member of Hill House, Inc. (since 1999); Formerly: Trustee of Colgate University (from 1996 to 2005), President of Hill House, Inc. (from 2001 to 2005) and Managing Director/Equity Capital Markets Group of Merrill Lynch & Co. (from 1971 to 1999).
John D. Diederich, Vice President and Treasurer
Age: 61 | Tenure: Since 2001
Principal Occupation(s) During Past Five Years: Chief Operating Officer, Managing Director and member of the Board of Managers of Royce; Chief Financial Officer of Royce; Director of Administration of The Royce Funds; and President of Royce Fund Services, Inc. (“RFS”), having been employed by Royce since April 1993.
Jack E. Fockler, Jr., Vice President
Age: 54 | Tenure: Since 1995
Principal Occupation(s) During Past Five Years: Managing Director and Vice President of Royce, and Vice President of RFS, having been employed by Royce since October 1989.
Daniel A. O’Byrne, Vice President and Assistant Secretary
Age: 51 | Tenure: Since 1994
Principal Occupation(s) During Past Five Years: Principal and Vice President of Royce, having been employed by Royce since October 1986.
John E. Denneen, Secretary and Chief Legal Officer
Age: 46 | Tenure: 1996-2001 and Since April 2002
Principal Occupation(s) During Past Five Years: General Counsel, Principal, Chief Legal and Compliance Officer and Secretary of Royce; Secretary and Chief Legal Officer of The Royce Funds.
Lisa Curcio, Chief Compliance Officer
Age: 53 | Tenure: Since 2004
Principal Occupation(s) During Past Five Years: Chief Compliance Officer of The Royce Funds (since October 2004) and Compliance Officer of Royce (since June 2004).
1 Interested Director.
Directors will hold office until their successors have been duly elected and qualified or until their earlier resignation or removal.
| | The Royce Funds 2013 Semiannual Report to Stockholders | 57 |
| Board Approval of Investment Advisory Agreements |
|
At meetings held on June 11-12, 2013, the Funds’ respective Boards of Directors, including all of the non-interested directors, approved the continuance of the Investment Advisory Agreements between Royce & Associates, LLC (“R&A”) and each of Royce Value Trust, Inc., Royce Micro-Cap Trust, Inc., and Royce Focus Trust, Inc. (each, a “Fund” and collectively, the “Funds”). In reaching these decisions, each Board reviewed the materials provided by R&A, which included, among other things, information prepared internally by R&A and independently by Morningstar Associates, LLC (“Morningstar”) containing detailed expense ratio and investment performance comparisons for the Funds with other funds in their “peer group,” information regarding the past performance of the Funds and other registered investment companies managed by R&A and a memorandum outlining the legal duties of each Board prepared by independent counsel to the non-interested directors. R&A also provided the directors with an analysis of its profitability with respect to providing investment advisory services to each of the Funds. In addition, each Board took into account information furnished throughout the year at regular Board meetings, including reports on investment performance, stockholder services, regulatory compliance, brokerage commissions and research, and brokerage and execution products and services provided to the Funds. Each Board also considered other matters it deemed important to the approval process such as allocation of Fund brokerage commissions, “soft dollar” research services R&A receives and other direct and indirect benefits to R&A and its affiliates, from their relationship with the Fund. The directors also met throughout the year with investment advisory personnel from R&A. Each Board, in its deliberations, recognized that, for many of the Funds’ stockholders, the decision to purchase Fund shares included a decision to select R&A as the investment adviser and that there was a strong association in the minds of Fund stockholders between R&A and each Fund. In considering factors relating to the approval of the continuance of the Investment Advisory Agreements, the non-interested directors received assistance and advice from, and met separately with, their independent counsel. While the Investment Advisory Agreements were considered at the same Board meetings, the Boards dealt with each agreement separately. Among other factors, the directors considered the following:
The nature, extent and quality of services provided by R&A:
Each Board considered the following factors to be of fundamental importance to its consideration of whether to approve the continuance of the relevant Fund’s Investment Advisory Agreement: (i) R&A’s more than 40 years of value investing experience and track record; (ii) the history of long-tenured R&A portfolio managers managing the Funds; (iii) R&A’s focus on mid-cap, small-cap and micro-cap value investing; (iv) the consistency of R&A’s approach to managing both the Funds and open-end mutual funds over more than 40 years; (v) the integrity and high ethical standards adhered to at R&A; (vi) R&A’s specialized experience in the area of trading small- and micro-cap securities; (vii) R&A’s historical ability to attract and retain portfolio management talent and (viii) R&A’s focus on stockholder interests as exemplified by its voluntary fee waiver policy on preferred stock assets in certain circumstances where the Funds’ total return performance from the issuance of the preferred does not exceed the coupon rate on the preferred, and expansive stockholder reporting and communications. Each Board reviewed the services that R&A provides to each Fund, including, but not limited to, managing each Fund’s investments in accordance with the stated policies of each Fund. Each Board considered the fact that R&A provided certain administrative services to the Funds pursuant to the Administration Agreement between the Funds and R&A which went into effect on January 1, 2008 and the methodology used by R&A in allocating the compensation paid to certain R&A personnel and other administrative expenses to the Funds pursuant to that Agreement. Each Board determined that the services to be provided to the Funds by R&A would be the same as those that R&A previously provided to the Funds. The Boards also took into consideration the histories, reputations and backgrounds of R&A’s portfolio managers for the Funds, finding that these would likely have an impact on the continued success of the Funds. Lastly, each Board noted R&A’s ability to attract and retain quality and experienced personnel. The directors concluded that the investment advisory services provided by R&A to each Fund compared favorably to services provided by R&A to other R&A client accounts, including other funds, in both nature and quality, and that the scope of services provided by R&A would continue to be suitable for the Funds.
Investment performance of the Funds and R&A:
In light of R&A’s risk-averse approach to investing, each Board believes that risk-adjusted performance continues to be an appropriate measure of each Fund’s investment performance. One measure of risk-adjusted performance the Boards have historically used in their review of the Funds’ performance is the Sharpe Ratio. The Sharpe Ratio is a risk-adjusted measure of performance developed by Nobel Laureate William Sharpe. It is calculated by dividing a fund’s annualized excess returns by its annualized standard deviation to determine reward per unit of risk. The higher the Sharpe Ratio, the better a fund’s historical risk-adjusted performance. Each Board attaches primary importance to risk-adjusted performance over relatively long periods of time, typically 3 to 10 years. Using Morningstar data, the Sharpe Ratio for Royce Value Trust, Inc. (“RVT”) placed in the 4th quartile within the Small Blend category assigned by Morningstar for the 3-year and 5-year periods and the 3rd quartile for the 10-year period ended December 31, 2012, as the Fund’s use of leverage through preferred stock created higher volatility and adversely affected investment performance. Using Morningstar data, as measured against its peer group, the Sharpe Ratio for Royce Micro-Cap Trust, Inc. (“RMT”) placed in the 3rd quartile, 4th quartile, and 61st percentile within the Small Blend category assigned by Morningstar for the 3-year, 5-year, and 10-year periods ended December 31, 2012, respectively, as the Fund’s use of leverage through preferred stock created higher volatility and adversely affected investment performance. Finally, using Morningstar data, the concentrated portfolio of Royce Focus Trust, Inc. (“RFT”) led to its bottom quartile performance in its category as measured by Sharpe Ratio for the 3-year period, 3rd quartile performance for the 5-year period, and 2nd quartile performance for the 10-year period ended December 31, 2012.
In addition to each Fund’s risk-adjusted performance, the directors also reviewed and considered each Fund’s absolute total returns, down market performance, and long-term performance records over periods of 10 years or longer. Each Board also considered it important to look beyond the current snapshot of performance as of December 31, 2012 and therefore examined extended performance histories for each Fund since its inception using monthly rolling average return periods through March 31, 2013.
Each Board noted that R&A manages a number of funds that invest in small-cap and micro-cap issuers, many of which had outperformed their benchmark indexes and their competitors over longer-term periods. Although each Board recognized that past performance is not necessarily an indicator of future results, it found that R&A had the necessary qualifications, experience and track record in managing small-cap and micro-cap securities to manage the relevant Fund. The directors determined that R&A continued to be an appropriate investment adviser for the Funds and concluded that each Fund’s performance supported the continuation of its Investment Advisory Agreement.
| 58 | The Royce Funds 2013 Semiannual Report to Stockholders | | |
Cost of the services provided and profits realized by R&A from its relationship with the Funds:
Each Board considered the cost of the services provided by R&A and profits realized by R&A from its relationship with each Fund. As part of the analysis, each Board discussed with R&A its methodology in allocating its costs to each Fund and concluded that its allocations were reasonable. Each Board concluded that R&A’s profits were reasonable in relation to the nature and quality of services provided.
The extent to which economies of scale would be realized as the Funds grow and whether fee levels would reflect such economies of scale:
Each Board considered whether there have been economies of scale in respect of the management of the Funds, whether each Fund has appropriately benefited from any economies of scale and whether there is potential for realization of any further economies of scale. Each Board noted the time and effort involved in managing portfolios of small- and micro-cap stocks and that they did not involve the same efficiencies as do portfolios of large cap stocks. Each Board concluded that the current fee structure for each Fund was reasonable, that stockholders sufficiently participated in economies of scale and that no changes were currently necessary.
Comparison of services to be rendered and fees to be paid to those under other investment advisory contracts, such as contracts of the same and other investment advisers or other clients:
Each Board reviewed the investment advisory fee paid by each Fund and compared both the services to be rendered and the fees to be paid under the Investment Advisory Agreements to other contracts of R&A and to contracts of other investment advisers to registered investment companies investing in small- and micro-cap stocks, as provided by Morningstar. In the case of RVT, its Board noted that it had a 1.00% basic fee that is subject to adjustment up or down (up to 0.50% in either direction) based on its performance versus the S&P 600 SmallCap Index over a rolling period of 60 months. The fee is charged on average net assets over that rolling period. As a result, in a rising market, the fee will be smaller than a fee calculated on the current year’s average net assets, and vice versa. The Board determined that the performance adjustment feature continued to serve as an appropriate incentive to R&A to manage RVT for the benefit of its long-term common stockholders. The Board noted that R&A had also agreed to waive its management fee on that portion of RVT’s assets equal to the liquidation preference of RVT’s preferred stock that was redeemed in November 2012 if the Fund’s total return from issuance of the preferred on such amount is less than the preferred stock’s fixed dividend rate. The Board also noted that the fee arrangement, which also includes a provision for no fee in periods where RVT’s trailing three-year performance is negative, requires R&A to measure the Fund’s performance monthly against the S&P 600, an unmanaged index. Instead of receiving a set fee regardless of its performance, R&A is penalized for poor performance. The Board noted that RVT’s expense ratio placed in the 1st quartile within its Morningstar peer group and category for 2012. In the case of RMT, its Board noted that it also had a 1.00% basic fee subject to adjustment up or down based on its performance versus the Russell 2000 Index over a rolling 36-month period. The fee is charged on average net assets over that rolling period. As a result, in a rising market, the fee will be smaller than a fee calculated on the current year’s average net assets, and visa versa. The Board determined that the performance adjustment feature continued to serve as an incentive to R&A to manage RMT for the benefit of its long-term stockholders. The Board also noted R&A’s voluntary waiver of its fee on the liquidation value of RMT’s preferred stock that was redeemed in November 2012 in circumstances where the Fund’s total return performance from the issuance of the preferred is less than the fixed dividend rate on the preferred stock for each month during the year. The Board noted that RMT’s net expense ratio based on net assets applicable to its common stock, would rank in the 1st quartile when compared against its Morningstar peer group and category for 2012. Finally, in the case of RFT, its Board noted that RFT’s expense ratio based on average net assets fell within the 3rd quartile of its Morningstar-peer group, 7 basis points above the Morningstar peer group median.
Each Board also considered fees charged by R&A to institutional and other clients and noted that, given the greater levels of services that R&A provides to registered investment companies such as the Funds as compared to other accounts, the Funds’ base advisory fees compared favorably to the advisory fees charged to those other accounts.
It was noted that no single factor was cited as determinative to the decision of the directors. Rather, after weighing all of considerations and conclusions discussed above, each full Board, including all the non-interested directors, approved the continuation of the existing Investment Advisory Agreements, concluding that a contract continuation on the existing terms was in the best interest of the stockholders of each Fund and that each investment advisory fee rate was reasonable in relation to the services provided.
| | The Royce Funds 2013 Semiannual Report to Stockholders | 59 |
| Notes to Performance and Other Important Information |
|
The thoughts expressed in this Review and Report concerning recent market movements and future prospects for small company stocks are solely the opinion of Royce at June 30, 2013, and, of course, historical market trends are not necessarily indicative of future market movements. Statements regarding the future prospects for particular securities held in the Funds’ portfolios and Royce’s investment intentions with respect to those securities reflect Royce’s opinions as of June 30, 2013 and are subject to change at any time without notice. There can be no assurance that securities mentioned in this Review and Report will be included in any Royce-managed portfolio in the future. Investments in securities of micro-cap, small-cap and/or mid-cap companies may involve considerably more risk than investments in securities of larger-cap companies. All publicly released material information is always disclosed by the Funds on the website at www.roycefunds.com.
Sector weightings are determined using the Global Industry Classification Standard (“GICS”). GICS was developed by, and is the exclusive property of, Standard & Poor’s Financial Services LLC (“S&P”) and MSCI Inc. (“MSCI”). GICS is the trademark of S&P and MSCI. “Global Industry Classification Standard (GICS)” and “GICS Direct” are service marks of S&P and MSCI.
All indexes referred to are unmanaged and capitalization weighted. Each index’s returns include net reinvested dividends and/or interest income. Russell Investment Group is the source and owner of the trademarks, service marks, and copyrights related to the Russell Indexes. Russell® is a trademark of Russell Investment Group. The Russell 2000 Index is an index of domestic small-cap stocks. It measures the performance of the 2,000 smallest publicly traded U.S. companies in the Russell 3000 Index. The Russell 2500 is an index of 2,500 smallest publicly traded U.S. companies in the Russell 3000 Index. The Russell Microcap Index includes 1,000 of the smallest securities in the Russell 2000 Index along with the next smallest eligible securities as determined by Russell. The Russell 1000 Index is an index of domestic large-cap stocks. It measures the performance of the 1,000 largest publicly traded companies in the Russell 3000 Index. The Russell Midcap Index measures the performance of the mid-cap segment of the U.S. equity universe. It includes approximately 800 of the smallest securities in the Russell 1000 Index. The Russell Global ex-U.S. Large Cap Index is an index of global large-cap stocks, excluding the United States. The Russell Global ex-U.S. Small Cap Index is an index of global small-cap stocks, excluding the United States. The CBOE Volatility Index (VIX) measures market expectations of near-term volatility conveyed by S&P 500 stock index option prices. The S&P 500 and SmallCap 600 are indexes of U.S. large- and small-cap stocks, respectively, selected by Standard & Poor’s based on market size, liquidity, and industry grouping, among other factors. The Nasdaq Composite is an index of the more than 3,000 common equities listed on the Nasdaq stock exchange. The performance of an index does not represent exactly any particular investment, as you cannot invest directly in an index. Returns for the market indexes used in this report were based on information supplied to Royce by Russell Investments. |
| |
| Forward-Looking Statements |
This material contains forward-looking statements within the meaning of the Securities Exchange Act of 1934, as amended (the “Exchange Act”), that involve risks and uncertainties, including, among others, statements as to: |
| • | the Funds’ future operating results |
| • | the prospects of the Funds’ portfolio companies |
| • | the impact of investments that the Funds have made or may make |
| • | the dependence of the Funds’ future success on the general economy and its impact on the companies and industries in which the Funds invest, and |
| • | the ability of the Funds’ portfolio companies to achieve their objectives. |
This Review and Report uses words such as “anticipates,” “believes,” “expects,” “future,” “intends,” and similar expressions to identify forward-looking statements. Actual results may differ materially from those projected in the forward-looking statements for any reason. |
The Royce Funds have based the forward-looking statements included in this Review and Report on information available to us on the date of the report, and we assume no obligation to update any such forward-looking statements. Although The Royce Funds undertake no obligation to revise or update any forward-looking statements, whether as a result of new information, future events or otherwise, you are advised to consult any additional disclosures that we may make through future stockholder communications or reports. |
| |
| Authorized Share Transactions |
Royce Value Trust, Royce Micro-Cap Trust and Royce Focus Trust may each repurchase up to 5% of the issued and outstanding shares of its respective common stock during the year ending December 31, 2013. Any such repurchases would take place at then prevailing prices in the open market or in other transactions. Common stock repurchases would be effected at a price per share that is less than the share’s then current net asset value. |
Royce Value Trust, Royce Micro-Cap Trust and Royce Focus Trust are also authorized to offer their common stockholders an opportunity to subscribe for additional shares of their common stock through rights offerings at a price per share that may be less than the share’s then current net asset value. The timing and terms of any such offerings are within each Board’s discretion. |
| |
| Annual Certifications |
As required, the Funds have submitted to the New York Stock Exchange (“NYSE”) for Royce Value Trust and Royce Micro-Cap Trust and to Nasdaq for Royce Focus Trust, respectively, the annual certification of the Funds’ Chief Executive Officer that he is not aware of any violation of the NYSE’s or Nasdaq’s Corporate Governance listing standards. The Funds also have included the certification of the Funds’ Chief Executive Officer and Chief Financial Officer required by section 302 of the Sarbanes-Oxley Act of 2002 as exhibits to the Funds’ form N-CSR for the period ended December 31, 2012, filed with the Securities and Exchange Commission. |
| |
| Proxy Voting |
A copy of the policies and procedures that The Royce Funds use to determine how to vote proxies relating to portfolio securities and information regarding how each of The Royce Funds voted proxies relating to portfolio securities during the most recent 12-month period ended June 30 is available, without charge, on The Royce Funds’ website at www.roycefunds.com, by calling (800) 221-4268 (toll-free) and on the website of the Securities and Exchange Commission (“SEC”), at www.sec.gov. |
| |
| Form N-Q Filing |
The Funds file their complete schedules of investments with the SEC for the first and third quarters of each fiscal year on Form N-Q. The Funds’ Forms N-Q are available on the SEC’s website at www.sec.gov. The Royce Funds’ holdings are also on the Funds’ website approximately 15 to 20 days after each calendar quarter end and remain available until the next quarter’s holdings are posted. The Funds’ Forms N-Q may also be reviewed and copied at the SEC’s Public Reference Room in Washington, D.C. To find out more about this public service, call the SEC at (800) 732-0330. The Funds’ complete schedules of investments are updated quarterly, and are available at www.roycefunds.com. |
| 60 | The Royce Funds 2013 Semiannual Report to Stockholders | | |
| Searching for Super Small-Cap Companies Through the Macro Noise |
|
Portfolio Manager and Principal Chris Clark offers insights into our disciplined, long-term investment process by emphasizing the role that contrarian thinking plays in our portfolios.
Watching Man of Steel on its opening weekend, the latest movie based on the iconic Superman comic books, I was struck by the fact that one “tail risk” not regularly appearing on the seemingly endless list of macroeconomic concerns is the possibility, however slight, that a well-armed villain from another galaxy might unexpectedly show up and wreak havoc on our sometimes peaceful and unprepared planet. It may be the one global catastrophe that we have not been warned about by market pundits.
Without giving away the plot, let’s just say that some variation of this unlikely turn of events does indeed occur, and while the film made no reference to the impact this unfriendly visit had on financial markets (sadly for me), it’s no stretch to conclude that there would probably be more sellers than buyers during the initial period of panic and uncertainty.
Not wanting to miss the full effects of this thriller, I convinced my wife and daughters to see the movie in IMAX 3D. In hindsight, this was probably not a great call on my part. To say that the whole experience overwhelmed the senses understates the continuous visual and audio assault that exhausted more than it entertained several moviegoers, my wife and youngest daughter included.
Other viewers had a similar experience, with several congregating outside the theater doors also attempting to regain their lost senses. I was able to make it through to the ending but felt disoriented by the whole experience. It took several hours for the effects to fully wear off.
Clearly the theater’s supersized viewing screen and deafening Dolby Surround Sound, combined with the movie’s exhilarating action and awesome 3-D imagery, had the desired effect of hijacking the senses. However, it also had the unintended consequence of numbing the viewer to the underlying plot.
Although no one will pay hard-earned dollars to watch the action on trading floors or Ben Bernanke’s press conferences, the corollaries to today’s investment climate are otherwise surprisingly close. Systemic risks abound and while clearly different and (perhaps) less fantastic than those depicted in the movie, they are no less unsettling when followed to their potential conclusion.
The most dramatic systemic risks imply the end of civilization due to natural resource exhaustion, civil strife over wealth disparity, wars over unpaid liabilities (people generally like to get paid back), and religious fanaticism. Of course, risks are one thing and outcomes can be entirely different—therein lies the true challenge for today’s would-be heroic investor.
The prognostications from market pundits through the various media outlets are overwhelming and constant. Much like the IMAX 3-D experience, the extreme noise can make the underlying plot tough to discern. And weighing the probabilities of any outcome is another challenge entirely.
One recent favorite of the pundits has been the inherently flawed eurozone currency structure. Another doomsday scenario centers on Japanese Prime Minister Shinzo Abe’s attempt to target inflation through extreme monetary and fiscal policies. A third recent view sees China struggling with demographic and environmental catastrophe while also facing an economic hard landing that will unleash massive social upheaval in the world’s most populous country. And there’s always the old favorite involving the respective pursuits of nuclear weapons by North Korea and Iran, as well as each nation’s stated goals of annihilating their adversaries (a list that often includes the U.S.).

The investment team at Royce is often asked to weigh in on macroeconomic issues and while we oblige, somewhat reluctantly, we always offer the same caveat—our expertise is evaluating and understanding companies, their value, quality, and future prospects, not predicting economic, political, or strategic outcomes, especially those that resemble the plot of a summer blockbuster. For us, the multitude of variables that go into that type of analysis would cause sensory and intellectual overload. Even more importantly, we might miss the underlying story.
This is important because we invest in companies, not headlines or economic statistics. Like the best-drawn movie characters, companies can be resilient and dynamic entities that more often than not self-determine their long-term success or failure. There is no question that macroeconomic factors provide relevant inputs. Yet from our perspective they are often far less important than investors believe.
So whether or not the investment community decides to sell everything because chaos and destruction appear imminent is less of a concern to us than which companies look likely to survive, adapt, and ultimately grow stronger in whatever the aftermath. That is our business, and we are sticking with it. All that loud noise is like Kryptonite to us.
The thoughts in this essay concerning the stock market are solely those of Royce & Associates and, of course, there can be no assurance with regard to future market movements.
| This page is not part of the 2013 Semiannual Report to Stockholders |
| |
| | | |
| | | |
| |  | | |
| | | |
| | | |
| | |
| | |
| |  | |
| | |
| | |
| | |
| | |
| | |
| | |
| | |
| | |
| | |
| | About The Royce Funds
Wealth Of Experience
With approximately $36 billion in total assets under management, Royce & Associates is committed to the same small-company investing principles that have served us well for 40 years. Charles M. Royce, our President and Co-Chief Investment Officer, enjoys one of the longest tenures of any active mutual fund manager. Royce’s investment staff also includes Co-Chief Investment Officer W. Whitney George, 18 Portfolio Managers, four assistant portfolio managers and analysts, and nine traders.
Multiple Funds, Common Focus
Our goal is to offer both individual and institutional investors the best available smaller-cap portfolios. Unlike a lot of mutual fund groups with broad product offerings, we have chosen to concentrate on smaller-company investing by providing investors with a range of funds that take full advantage of this large and diverse sector.
Consistent Discipline
Our approach emphasizes paying close attention to risk and maintaining the same discipline, regardless of market movements and trends. The price we pay for a security must be significantly below our appraisal of its current worth. This requires a thorough analysis of the financial and business dynamics of an enterprise, as though we were purchasing the entire company.
Co-Ownership Of Funds
It is important that our employees and shareholders share a common financial goal; our officers, employees, and their families currently have approximately $168 million invested in The Royce Funds. |
| | | | |
| | | | | | | | | | | | | | | |
| | | | | | | | | | | | | | | |
| | | | | | | | | | | | | | | |
| | Contact Us | |
| | General Information
Additional Report Copies
and Prospectus Inquiries
(800) 221-4268 | | RIA/BD Services
Fund Materials and
Performance Updates
(800) 33-ROYCE (337-6923) | | Broker/Dealer Services
Fund Materials and
Performance Updates
(800) 59-ROYCE (597-6923) | | Computershare
Transfer Agent
and Registrar
(800) 426-5523 | | | | | |  | |
| | | | | | | | | | | | | | | | | |
| | | | | | | | | | | | | | | | | |
Item 2. Code(s) of Ethics. Not applicable to this semi-annual report.
Item 3. Audit Committee Financial Expert. Not applicable to this semi-annual report.
Item 4. Principal Accountant Fees and Services. Not applicable to this semi-annual report.
Item 5. Audit Committee of Listed Registrants. Not applicable to this semi-annual report.
Item 6. Investments.
(a) See Item 1.
(b) Not applicable.
Item 7. Disclosure of Proxy Voting Policies and Procedures for Closed-End Management Investment Companies. Not applicable to this semi-annual report.
Item 8. Portfolio Managers of Closed-End Management Investment Companies. Not applicable to this semi-annual report.
Item 9. Purchases of Equity Securities by Closed-End Management Investment Company and Affiliated Purchasers. Not Applicable.
Item 10. Submission of Matters to a Vote of Security Holders. Not Applicable.
Item 11. Controls and Procedures.
(a) Disclosure Controls and Procedures. The Principal Executive and Financial Officers concluded that the Registrant’s Disclosure Controls and Procedures are effective based on their evaluation of the Disclosure Controls and Procedures as of a date within 90 days of the filing date of this report.
(b) Internal Control over Financial Reporting. There were no significant changes in Registrant’s internal control over financial reporting or in other factors that could significantly affect this control subsequent to the date of the evaluation, including any corrective actions with regard to significant deficiencies and material weaknesses during the second fiscal quarter of the period covered by this report.
Item 12. Exhibits. Attached hereto.
(a)(1) Not applicable to this semi-annual report.
(a)(2) Separate certifications by the Registrant’s Principal Executive Officer and Principal Financial Officer as required by Rule 30a-2(a) under the Investment Company Act of 1940.
(a)(3) Not Applicable
(b) Separate certifications by the Registrant’s Principal Executive Officer and Principal Financial Officer, pursuant to Section 906 of the Sarbanes-Oxley Act of 2002 and required by Rule 30a-2(b) under the Investment Company Act of 1940.
Pursuant to the requirements of the Securities Exchange Act of 1934 and the Investment Company Act of 1940, the registrant has duly caused this report to be signed on its behalf by the undersigned, thereunto duly authorized.
ROYCE VALUE TRUST, INC.
| BY: | /s/ Charles M. Royce |
| | Charles M. Royce |
| | President |
Date: August 27, 2013
Pursuant to the requirements of the Securities Exchange Act of 1934 and the Investment Company Act of 1940, this report has been signed below by the following persons on behalf of the registrant and in the capacities and on the dates indicated.
| ROYCE VALUE TRUST, INC. | | ROYCE VALUE TRUST, INC. |
| | | | | |
| BY: | /s/ Charles M. Royce | | BY: | /s/ John D. Diederich |
| | Charles M. Royce | | | John D. Diederich |
| | President | | | Chief Financial Officer |
| | | | | |
| Date: August 27, 2013 | | Date: August 27, 2013 |