UNITED STATES
SECURITIES AND EXCHANGE COMMISSION
Washington, D.C. 20549
FORM N-CSR
CERTIFIED SHAREHOLDER REPORT
OF
REGISTERED MANAGEMENT INVESTMENT COMPANIES
Investment Company Act File Number: 811-04875
Name of Registrant: Royce Value Trust, Inc.
Address of Registrant: 745 Fifth Avenue
New York, NY 10151
| Name and address of agent for service: | John E. Denneen, Esquire
745 Fifth Avenue
New York, NY 10151
|
Registrant’s telephone number, including area code: (212) 508-4500
Date of fiscal year end: December 31
Date of reporting period: January 1, 2014 – December 31, 2014
| Item 1. Reports to Shareholders. |
| | | DECEMBER 31, 2014 |
| | | |
| | | |
| | | |
| | | 2014 Annual |
| | | Review and Report to Stockholders |
| | | |
| | | |
| | | |
| | | |
| | | |
| | | |
| | | |
| | | Royce Value Trust |
| | | | |
| | | Royce Micro-Cap Trust |
| | | | |
| | | Royce Global Value Trust | |
| | | | |
| | | | |
| | | | |
| | | | |
| | | | |
| | | | |
| | | | |
| | | | |
| | | | |
| | | | |
| | | | |
| | | | |
| | | | |
| | | | |
| | | | |
| | | | |
| | | | |
| | | | |
| | | | |
| | | | |
| | | | |
| | | | |
| | | | |
| | | | |
| | | | |
| | | | |
| | | | |
| | | | |
| | | roycefunds.com |  |
| | | | |
| | | | |
| | | | |
| A Few Words on Closed-End Funds |
| |
Royce & Associates, LLC manages three closed-end funds: Royce Value Trust, which invests primarily in small-cap securities; Royce Micro-Cap Trust, which invests primarily in micro-cap securities; and Royce Global Value Trust, which invests in both U.S. and non-U.S. small-cap stocks. A closed-end fund is an investment company whose shares are listed and traded on a stock exchange. Like all investment companies, including open-end mutual funds, the assets of a closed-end fund are professionally managed in accordance with the investment objectives and policies approved by the fund’s Board of Directors. A closed-end fund raises cash for investment by issuing a fixed number of shares through initial and other public offerings that may include shelf offerings and periodic rights offerings. Proceeds from the offerings are invested in an actively managed portfolio of securities. Investors wanting to buy or sell shares of a publicly traded closed-end fund after the offerings must do so on a stock exchange, as with any publicly traded stock. Shares of closed-end funds frequently trade at a discount to their net asset value. This is in contrast to open-end mutual funds, which sell and redeem their shares at net asset value on a continuous basis. |
| A Closed-End Fund Can Offer Several Distinct Advantages |
| | | |
| • | | A closed-end fund does not issue redeemable securities or offer its securities on a continuous basis, so it does not need to liquidate securities or hold uninvested assets to meet investor demands for cash redemptions. |
| | | |
| • | | In a closed-end fund, not having to meet investor redemption requests or invest at inopportune times can be effective for value managers who attempt to buy stocks when prices are depressed and sell securities when prices are high. |
| | | |
| • | | A closed-end fund may invest in less liquid portfolio securities because it is not subject to potential stockholder redemption demands. This is potentially beneficial for Royce-managed closed-end funds, which invest primarily in small- and microcap securities. |
| | | |
| • | | The fixed capital structure allows permanent leverage to be employed as a means to enhance capital appreciation potential. |
| | | |
| • | | Royce Value Trust and Royce Micro-Cap Trust distribute capital gains on a quarterly basis. Each of these Funds has adopted a quarterly distribution policy for its common stock. |
| | | |
| We believe that the closed-end fund structure can be an appropriate investment for a long-term investor who understands the benefits of a more stable pool of capital. |
| Why Dividend Reinvestment Is Important |
| |
| A very important component of an investor’s total return comes from the reinvestment of distributions. By reinvesting distributions, our investors can maintain an undiluted investment in a Fund. To get a fair idea of the impact of reinvested distributions, please see the charts on pages 12 and 13. For additional information on the Funds’ Distribution Reinvestment and Cash Purchase Options and the benefits for stockholders, please see page 14 or visit our website at www.roycefunds.com. |
| |
| Managed Distribution Policy |
| |
| The Board of Directors of each of Royce Value Trust and Royce Micro-Cap Trust has authorized a managed distribution policy (“MDP”). Under the MDP, Royce Value Trust and Royce Micro-Cap Trust pay quarterly distributions at an annual rate of 7% of the average of the prior four quarter-end net asset values, with the fourth quarter being the greater of these annualized rates or the distribution required by IRS regulations. With each distribution, the Fund will issue a notice to its stockholders and an accompanying press release that provides detailed information regarding the amount and composition of the distribution (including whether any portion of the distribution represents a return of capital) and other information required by a Fund’s MDP. You should not draw any conclusions about a Fund’s investment performance from the amount of distributions or from the terms of a Fund’s MDP. A Fund’s Board of Directors may amend or terminate the MDP at any time without prior notice to stockholders; however, at this time there are no reasonably foreseeable circumstances that might cause the termination of any of the MDPs. |
| This page is not part of the 2014 Annual Report to Stockholders |
| Table of Contents | | | |
| | | | |
| | | | |
| Annual Review | | | |
| | | | |
| Letter to Our Stockholders | | 2 | |
| | | | |
| Performance | | 5 | |
| | | | |
| Annual Report to Stockholders | | | |
| | | | |
| Manager’s Discussions of Fund Performance | | | |
| | | | |
Royce Value Trust | | 6 | |
| | | | |
Royce Micro-Cap Trust | | 8 | |
| | | | |
Royce Global Value Trust | | 10 | |
| | | | |
| History Since Inception | | 12 | |
| | | |
| Distribution Reinvestment and Cash Purchase Options | | 14 | |
| | | |
| Schedules of Investments and Other Financial Statements | | | |
| | | |
Royce Value Trust | | 15 | |
| | | |
Royce Micro-Cap Trust | | 32 | |
| | | |
Royce Global Value Trust | | 47 | |
| | | | |
| Directors and Officers | | 59 | |
| | | | |
| Notes to Performance and Other Important Information | | 60 | |
| | | | |
| Results of Stockholders Meeting | Inside Back Cover | |

| This page is not part of the 2014 Annual Report to Stockholders | 1 |
Letter to Our Stockholders
A TALE OF TWO MARKETS
It wasn’t the best of times; it wasn’t the worst of times. As 2014 began, it all seemed just right, with small-caps easing into the year on a more mutedly bullish note following their extraordinary run in 2013. So relaxed was the pace of returns, and in such stark contrast to the eventful years of 2008-2013, that in our June 30 Semiannual Review we remarked on how agreeably peaceful and undramatic it all was. During the year’s first six months, inflation was nearly non-existent, most commodity prices were stable, and volatility, as measured by the VIX, reached the end of June at its lowest level since 2007. These factors, along with a sprightly M&A market, looked to us like clear signs of ongoing growth. The case appeared even stronger as the Federal Reserve moved further and further into the background of the U.S. economy. We were not alone in thinking that the anticipated end of QE (“quantitative easing”) and what looked like an inevitable rise in interest rates would set the stage for a more dynamic pace of economic expansion. We also thought an extension of the bull market that began off the March 9, 2009 bottom seemed likely, though we were expecting both lower returns and increased volatility.
As it happens, this call was somewhat accurate: the economy did pick up speed in the second half while the bull market rolled on for large-cap stocks. More turbulent, small-caps (along with most Energy stocks) could not keep up. Of course, equity markets simply do not stay undisturbed for long, so the increased volatility in the second half of 2014 was not a surprise. Yet its highly selective reach was puzzling, even allowing for the historically higher volatility exhibited by smaller companies. Shortly after the |
Russell 2000 Index established a year-to-date high on July 3 (a high that would last into late December), small-cap prices began to fall. They slid most precipitously in July and September and rallied to varying degrees in August, October, November, and December. The downdrafts were sharper than the upswings, however—it took a furious rally in the final two weeks of the year’s closing month to shore up a modest positive return for the Russell 2000 in the second half. Meanwhile, the S&P 500 and Russell 1000 Indexes lost comparatively little in those two bearish months and posted solid gains during the other four. The upshot was such a strong year for large-cap companies that 2014 was the ninth-largest calendar-year spread between the Russell 2000 and the S&P 500 in the 36-year history of the small-cap index.
What, then, to make of a year in which the Russell 2000 posted a relatively undistinguished single-digit gain of 4.9%, ceded leadership to its larger siblings, and still bested most actively managed small-cap portfolios? A few developments in particular stood out. First, the rotation in leadership from small-cap to large in 2014 looked very much like a classic case of reversion to the mean to us. The former led the market decisively from the bottom in March of 2009 through the end of 2013, a prolonged period of small-cap leadership that made a shift all but inevitable. The second trend was more worrisome. Within small-cap, more economically cyclical sectors continued to lag in spite of the growing economy. The same held true for what we define as quality companies—those with strong balance sheets and high returns on invested capital. Even with the economy accelerating, investors tended to ignore profitable companies with solid fundamentals while they continued to be |
| 2 | This page is not part of the 2014 Annual Report to Stockholders |
| LETTER TO OUR STOCKHOLDERS |
| | | |
| drawn more to defensive and/or high-growth areas. This included utilities and REITs among the highly successful defensive areas of 2014, and social media, biotech, and pharmaceuticals among the speedy growth industries. In most instances, companies in these sectors and industries do not satisfy our purchase criteria because they lack the combination of balance-sheet strength and a long-term history of profitability that we find most attractive. | | volatility as an ally, agreeing with Warren Buffett’s statement: “Look at market fluctuations as your friend rather than your enemy; profit from folly rather than participate in it.” So while many investors think of volatility as being synonymous (or nearly so) with risk or even loss, we have never seen it that way. Instead, we try to take advantage of market movements—an essential skill for any successful active manager. Those times when the market cannot seem to make up its mind are exactly when securities tend to be most mispriced. And therein lies one of the keys to outperformance for active managers—the identification and purchase of mispriced securities. |
| | | |
| Even with the economy accelerating, investors tended to ignore profitable companies with solid fundamentals while they continued to be drawn more to defensive and/or high-growth areas. | | While many investors think of volatility as being synonymous (or nearly so) with risk or even loss, we have never seen it that way. |
| | | |
We were hopeful that the end of QE (along with rising rates) would help to reverse this trend. But the strengthening U.S. dollar and monetary stimulus efforts in Japan and Europe conspired to make the October conclusion of QE something of a non-event, while interest rates fell through most of the year. On the whole, then, 2014 was an often confounding period for us, especially its second half. Indeed, if there is a theme that best captures the year, it might be “A Tale of Two Markets.”And we should point out that Dickens’s rubric covers not just the very different halves of the year for small-cap stocks but also the disparity in results and volatility between small-caps and their bigger siblings. (More index returns can be found in the table below.) | | We conducted research that looked at some of the market forces that have helped to shape the current cycle, in particular the years from 2011-2014 when many active approaches struggled on a relative basis. (The full results of this research are available on our website at www.roycefunds.com/4qresearch.) As we have previously argued, the Fed’s easy-money policies of QE and ZIRP (“zero-interest rates”) have had the unintentional effect of stoking appetites for high yield and creating too few (if any) consequences for companies carrying a lot of debt. This led many investors to relatively neglect businesses with more pristine balance sheets and/or those with steady but smaller dividends. It also meant that from the beginning of 2011 through the end of 2014, the small-cap market was in a peculiar state, one characterized by a pile-up of anomalies—the combination of declining volatility with higher-than-average returns converging with contracting credit spreads. |
| | |
| VOLATILITY—OUR MUTUAL FRIEND | |
| Yet the level of conviction in our value-oriented approaches remains high. Although it may seem counterintuitive (or worse), the current extended period of relative underperformance for many Royce-managed portfolios actually helps to fuel our confidence in the years to come. Let us explain why. First, we have always viewed | |
Equity Indexes
As of December 31, 2014 (%) |
| | | |
| • | | The third quarter was the worst for the Russell 2000 since 9/30/11 and, relative to the S&P 500, was the index’s worst quarterly performance since 3/31/99. It also ended a streak of eight consecutive quarters of positive performance. |
| | | |
| • | | Small-caps rallied in October and December to outpace their large-cap counterparts in the fourth quarter. |
| | | |
| • | | 2014 marked just the fifth time since its inception in 1979 that the Russell 2000 had a gain in the single digits (+4.9%). Small-caps trailed large-caps by the widest margin since 1998. |
| | | |
| • | | Within the Russell 2000, Health Care, Utilities, and REITs were the best-performing areas in 2014 while Energy was by far the largest detractor. |
| |
| | | 3Q14 | 1 | 4Q14 | 1 | 1-YR | | 3-YR | | 5-YR | | 10-YR | |
| |
| Russell 2000 | | -7.36 | | 9.73 | | 4.89 | | 19.21 | | 15.55 | | 7.77 | |
| |
| S&P 500 | | 1.13 | | 4.93 | | 13.69 | | 20.41 | | 15.45 | | 7.67 | |
| |
| Russell 1000 | | 0.65 | | 4.88 | | 13.24 | | 20.62 | | 15.64 | | 7.96 | |
| |
| Nasdaq Composite | | 1.93 | | 5.40 | | 13.40 | | 22.05 | | 15.85 | | 8.09 | |
| |
| Russell Midcap | | -1.66 | | 5.94 | | 13.22 | | 21.40 | | 17.19 | | 9.56 | |
| |
| Russell Microcap | | -8.21 | | 11.19 | | 3.65 | | 21.81 | | 16.14 | | 5.96 | |
| |
| Russell Global ex-U.S. Small Cap | | -6.21 | | -4.45 | | -3.63 | | 10.31 | | 6.40 | | 6.65 | |
| |
| Russell Global ex-U.S. Large Cap | | -5.35 | | -3.72 | | -3.57 | | 9.41 | | 4.80 | | 5.36 | |
| |
| 1Not annualized |
| For details on The Royce Funds’ performance in the period, please turn to the Managers’ Discussions that begin on page 8. |
| This page is not part of the 2014 Annual Report to Stockholders | 3 |
| LETTER TO OUR STOCKHOLDERS |
| |
Needless to say, our risk-conscious, balance-sheet-centric approaches have been challenged in this setting, at least on a relative basis. Low volatility has arguably created the highest hurdle. We have always felt most comfortable in markets with higher levels of volatility, which usually create the differentiation that lies at the core of our active management styles. We analyze, assess, and evaluate multiple aspects of a company before determining whether or not the current stock price reflects the long-term prospects we see. Opportunities to purchase what we deem to be attractively undervalued companies tend to proliferate when stock prices are volatile rather than when markets are calm. Yet for most of the last four years, volatility has been falling, at least until the second half of 2014. This has made it far more difficult for our funds to outpace their respective benchmarks.
GREAT EXPECTATIONS
The questions are: How much longer is this going to last? More specifically, are interest rates going to remain at or near zero? Is the pace of economic growth likely to slacken? Are financial markets going to continue to behave atypically even as the economy continues to normalize? Will small-cap companies indefinitely gain an advantage by carrying more debt? Are three- and five-year average annual total returns for the Russell 2000 going to remain at levels higher than the index’s historical monthly rolling averages of 8.2% and 7.6%, respectively? For those who believe that most, or even some, of these things are likely to happen, then our approach would seem a bit at odds.
We confess that we have been anticipating some of these shifts for nearly two years. This has meant re-learning the hard lesson that change seldom occurs when we most want it to. Yet we are convinced that markets remain cyclical (recent events notwithstanding). In our view, reversion to the mean is as close to an iron law as the capital markets allow. Most trends reverse, though they may linger for longer than initially anticipated (or desired). Widening credit spreads, increasing volatility, and decreasing stock correlation should all help active management and allow stock pickers the chance to emerge as performance leaders. | | We also expect equity returns to remain attractive, though we see a decrease from the high levels we have seen over the last three to five years. Cyclical companies appear due for a round of revenue acceleration, particularly those in the Consumer Discretionary and Industrials sectors, as do some industries in the Information Technology sector. The best-managed companies within these areas could also see solid margin expansion. Among other cyclical sectors, we also see a number of profitable, conservatively capitalized businesses that have either been ignored or whose returns have lagged. We expect this to change.
On the valuation front, the picture looked admittedly tricky at the end of 2014. For example, an examination of trailing 12-month earnings for many companies suggests that small-cap share prices may be on the high side. But if you believe, as we do, that the economy is going to keep growing, that credit spreads will continue to expand, and that a more robust CAPEX cycle is in the offing, then valuations seem pretty reasonable, if not attractive in certain areas, Energy in particular. Many stocks look fairly valued though not fully valued to us. So while we do not shrink from the sobering truth of relative underperformance through much of this now-long bullish cycle, we continue to see good times ahead for our risk-conscious, fundamentally based approach.
While we do not shrink from the sobering truth of relative underperformance through much of this now-long bullish cycle, we continue to see good times ahead for our risk-conscious, fundamentally based approach.
The argument that we have been making for more than four decades remains the same. Small-cap is an inefficient area of the market in which we search for qualitative advantages and valuation discrepancies. Our belief that fundamentally strong companies trading at discounts to their private worth can outperform over the long term, often with lower volatility, will not change. It is our core investment principle, and it has served us very, very well over most of the last 40+ years. |
 | |  | |  |
| Charles M. Royce | | Christopher D. Clark | | Francis D. Gannon |
| Chairman and Chief Executive Officer, | | President and Co-Chief Investment Officer, | | Co-Chief Investment Officer, |
| Royce & Associates, LLC | | Royce & Associates, LLC | | Royce & Associates, LLC |
| | | | | |
| January 26, 2015 | | | | |
| 4 | This page is not part of the 2014 Annual Report to Stockholders |
| | | LETTER TO OUR STOCKHOLDERS |
| | | |
| Performance | | |
| | | |
| NAV Average Annual Total Returns | | | | | | | | | | | | | | | | | |
| As of December 31, 2014 (%) | | | | | | | | | | | | | | | | | | |
| | | | | | | | | | | | | | | | | | | |
| FUND | | 1-YR | | 3-YR | | 5-YR | | 10-YR | | 15-YR | | 20-YR | | 25-YR | | SINCE INCEPTION | | INCEPTION DATE |
| |
 Royce Value Trust Royce Value Trust | | 0.78 | | 15.98 | | 12.82 | | 6.94 | | 9.29 | | 10.84 | | 10.84 | | 10.74 | | 11/26/86 |
| |
| Royce Micro-Cap Trust | | 3.55 | | 20.64 | | 15.81 | | 8.15 | | 10.97 | | 11.85 | | n.a. | | 11.50 | | 12/14/93 |
| |
| Royce Global Value Trust | | -6.23 | | n.a. | | n.a. | | n.a. | | n.a. | | n.a. | | n.a. | | -3.03 | | 10/17/13 |
| |
| INDEX | | | | | | | | | | | | | | | | | | |
| |
| Russell 2000 | | 4.89 | | 19.21 | | 15.55 | | 7.77 | | 7.38 | | 9.63 | | 9.75 | | n.a. | | n.a. |
| |
| Russell Microcap | | 3.65 | | 21.81 | | 16.14 | | 5.96 | | n.a. | | n.a. | | n.a. | | n.a. | | n.a. |
| |
| Russell Global Small Cap | | -0.28 | | 13.57 | | 9.56 | | 6.87 | | 6.88 | | n.a. | | n.a. | | n.a. | | n.a. |
| |
| | | | | | | | | | | | | | | | | | | |
Important Performance and Risk Information
All performance information in this Review and Report reflects past performance, is presented on a total return basis, and reflects the reinvestment of distributions. Past performance is no guarantee of future results. Investment return and principal value of an investment will fluctuate, so that shares may be worth more or less than their original cost when sold. Current performance may be higher or lower than performance quoted. Current month-end performance may be obtained at www.roycefunds.com. The Funds are closed-end registered investment companies whose respective shares of common stock may trade at a discount to the net asset value. Shares of each Fund’s common stock are also subject to the market risk of investing in the underlying portfolio securities held by each Fund. Certain immaterial adjustments were made to the net assets of Royce Global Value Trust at 12/31/14 and Royce Micro-Cap Trust at 12/31/12, as well as 12/31/14, for financial reporting purposes, and as a result the net asset value originally calculated on that date and the total return based on that net asset value differs from the adjusted net asset value and total return reported in the Financial Highlights. All indexes referenced are unmanaged and capitalization-weighted. Each index’s returns include net reinvested dividends and/or interest income. Russell Investment Group is the source and owner of the trademarks, service marks and copyrights related to the Russell Indexes. Russell® is a trademark of Russell Investment Group. The Russell 2000 Index is an index of domestic small-cap stocks that measures the performance of the 2,000 smallest publicly traded U.S. companies in the Russell 3000 Index. The Russell Microcap Index includes 1,000 of the smallest securities in the small-cap Russell 2000 Index, along with the next smallest eligible securities as determined by Russell. The Russell Global Small Cap Index is an unmanaged, capitalization-weighted index of global small-cap stocks. The performance of an index does not represent exactly any particular investment, as you cannot invest directly in an index. Index returns include net reinvested dividends and/or interest income. Royce Value, Micro-Cap and Global Value Trust shares of common stock trade on the NYSE. Royce Fund Services, Inc (“RFS”) is a member of FINRA and has filed this Review and Report with FINRA on behalf of each Fund. RFS is not an underwriter or distributor of any of the Funds. |
| This page is not part of the 2014 Annual Report to Stockholders | 5 |
| | | MANAGER’S DISCUSSION |
| | | |
| Royce Value Trust | | |
| | | |
 |
| Chuck Royce |
| FUND PERFORMANCE |
| In what was a solid year for small-caps overall, we were disappointed that Royce Value Trust (“RVT”) was unable to keep pace on a relative scale. The Fund was up 0.8% on an NAV (net asset value) basis and 0.9% on a market price basis in 2014 versus respective gains of 4.9% and 5.7% for its small-cap benchmarks, the Russell 2000 and the S&P 600 Indexes, for the same period. Equally frustrating was the fact that RVT was more competitive for the six-month period ended June 30, 2014, in which it outperformed both the Russell 2000 and S&P 600’s 3.2% advance on a market price basis (+3.9%) and narrowly lagged on a NAV basis (+3.0%). |
| |
| Unlike the first half of the year when equity returns were placid yet decidedly bullish, the last six months were a more volatile period for small-caps. Historically, the Fund has exhibited an ability to hold more value than its benchmarks during down markets. However, this was not the case in the third quarter of 2014, when RVT fell 7.5% on a NAV basis and 7.4% on a market price basis. (The Russell 2000 lost 7.4% and the S&P 600 lost 6.7%.) The Fund’s relative performance woes would continue into the fourth quarter, though its absolute results were respectable. During this period small-caps had a prominent upward bias, especially in the last few weeks of December when they rallied to finish the year well in the black. RVT gained 5.8% on an NAV basis and 4.9% on a market price basis while the Russell 2000 advanced 9.7% and the S&P 600 climbed 9.8%. Despite the Fund’s near- and intermediate-term struggles, we remain proud of RVT’s longer-term performance. On an NAV and market price basis, RVT outperformed the Russell 2000 for the 15-, 20-, 25-year, and since inception (11/26/86) periods ended December 30, 2014. The Fund’s average annual NAV total return since inception was 10.7%. |
| |
| WHAT WORKED... AND WHAT DIDN’T |
| Six of the Fund’s 10 equity sectors posted net gains in 2014, with Information Technology leading the list by a solid margin. Health Care also made a sizable contribution to performance at the sector level, followed by a modest net gain for Financials. The top contributor to first-half performance, Idenix Pharmaceuticals focuses on the development of drugs for the treatment of infections caused by HIV, hepatitis B, and hepatitis C. In early June, news of pharmaceutical giant Merck’s acquisition of the company helped the stock price to more than triple. By the middle of the month we had sold our stake. RVT also benefited from IT services company Sapient Corporation’s takeout by French advertising giant Publicis Groupe in early November. A long-time holding in the portfolio, Sapient provides integrated management consulting services, Internet commerce solutions, and systems implementation services. While the acquisition confirmed Sapient’s value and the increasing importance (and share gains) of digital marketing for more traditional advertising businesses, the company’s valuation exceeded our sell targets and we sold our shares shortly after the announcement. Miami-based technology consulting firm The Hackett Group provides executive advisory programs, best practice research, and benchmarking services. Its stock price was generally flat for much of 2014 until the company announced third-quarter earnings that topped Wall Street expectations in early November. We took some gains in early December and decided to hold our position. |
| |
| Conversely, net losses from Industrials, Energy, and Materials detracted from 2014 performance. Three of RVT’s top detractors came from the Industrials sector, including Houston-based engineering and construction firm KBR. Further execution delivery issues on several fixed-price projects, as well as a decline in bookings and cautious commentary regarding possible delays in oil and gas work in light of the oil price decline, continued to weigh on results. Later in the quarter, the company’s relatively new CEO unveiled a restructuring plan after strategic review of the business that includes streamlining operations and reducing overhead costs, refocusing on core E&C areas where it has had traditional strength, and exiting four non-core businesses. Bullish on the company’s prospects and an eventual turnaround in Energy, we last added to our position in mid-December. It was a top-40 holding at year end. Persistent weakness in the mining sector continued to stifle a sustained return to organic sales growth for cutting tools manufacturer Kennametal. Having some exposure to the oil and gas drilling market created some near-term headwinds for its business. Interested to hear what initial strategic priorities the company’s recently appointed CEO may implement, we held on to our remaining shares after trimming a bit in April, October, and November. |
| Top Contributors to Performance For 2014 (%)1 | | |
| | | |
| Idenix Pharmaceuticals | | 0.44 |
| |
| Sapient Corporation | | 0.31 |
| |
| Hackett Group (The) | | 0.29 |
| |
| Nautilus | | 0.29 |
| |
| Mechanics Bank | | 0.21 |
| |
| 1 Includes dividends | | |
| Top Detractors from Performance For 2014 (%)2 | | |
| | | |
| KBR | | -0.31 |
| |
| Kennametal | | -0.24 |
| |
| Steel Excel | | -0.23 |
| |
| Raven Industries | | -0.22 |
| |
| Qalaa Holdings | | -0.19 |
| |
| 2 Net of dividends | | |
| CURRENT POSITIONING AND OUTLOOK |
| We remain overweight in more economically sensitive areas such as Industrials and Information Technology. Despite recent headwinds in Energy, we believe the U.S. economy is still growing (albeit slowly), credit spreads will continue to expand, and that increasing volatility and decreasing stock correlation can help stock pickers to emerge as performance leaders. |
| 6 | 2014 Annual Report to Stockholders |
| PERFORMANCE AND PORTFOLIO REVIEW | | SYMBOLS MARKET PRICE RVT NAV XRVTX |
| |
| Performance | | | | | | | | | | | | | | | | | | |
| Average Annual Total Return (%) Through 12/31/14 |
| | | JUL-DEC 2014* | | 1-YR | | 3-YR | | 5-YR | | 10-YR | | 15-YR | | 20-YR | | 25-YR | | SINCE INCEPTION (11/26/86) |
| |
| RVT (NAV) | | -2.15 | | 0.78 | | 15.98 | | 12.82 | | 6.94 | | 9.29 | | 10.84 | | 10.84 | | 10.74 |
| |
| *Not Annualized | | | | | | | | | | | | | | | |
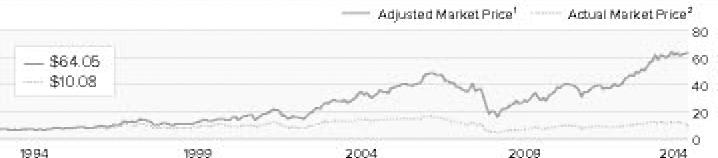
Market Price Performance History Since Inception (11/26/86)Cumulative Performance of Investment through 12/31/141 | | | 1-YR | | 5-YR | | 10-YR | | 15-YR | | 20-YR | | SINCE INCEPTION (11/26/86) |
| |
| RVT | | 0.9% | | 92.4% | | 60.0% | | 305.4% | | 679.2% | | 1361.9% |
| |

| 1 | Reflects the cumulative performance of an investment made by a stockholder who purchased one share at inception ($10.00 IPO), reinvested all distributions and fully participated in primary subscriptions of the Fund’s rights offerings. |
| 2 | Reflects the actual month-end market price movement of one share as it has traded on the NYSE. |
| Morningstar Style MapTM | As of 12/31/14 |
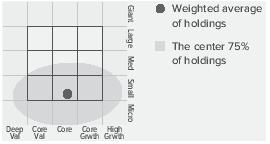
The Morningstar Style Map is the Morningstar Style BoxTM with the center 75% of fund holdings plotted as the Morningstar Ownership ZoneTM. The Morningstar Style Box is designed to reveal a fund’s investment strategy. The Morningstar Ownership Zone provides detail about a portfolio’s investment style by showing the range of stock sizes and styles. The Ownership Zone is derived by plotting each stock in the portfolio within the proprietary Morningstar Style Box. Over time, the shape and location of a fund’s ownership zone may vary. See page 60 for additional information. |
|
| Portfolio Diagnostics | | |
| | | |
| Fund Net Assets | | $1,232 million |
| |
| Number of Holdings | | 567 |
| |
| Turnover Rate | | 40% |
| |
| Net Asset Value | | $16.24 |
| |
| Market Price | | $14.33 |
| |
| Average Market Capitalization1 | | $1,289 million |
| |
| Weighted Average P/E Ratio2,3 | | 19.7x |
| |
| Weighted Average P/B Ratio2 | | 1.8x |
| |
| Holdings ≥ 75% of Total Investments | | 182 |
| |
| Active Share4 | | 88% |
| |
| U.S. Investments (% of Net Assets) | | 84.9% |
| |
| Non-U.S. Investments (% of Net Assets) | | 18.0% |
| |
| 1 | Geometric Average. This weighted calculation uses each portfolio holding’s market cap in a way designed to not skew the effect of very large or small holdings; instead, it aims to better identify the portfolio’s center, which Royce believes offers a more accurate measure of average market cap than a simple mean or median. | |
| 2 | Harmonic Average. This weighted calculation evaluates a portfolio as if it were a single stock and measures it overall. It compares the total market value of the portfolio to the portfolio’s share in the earnings or book value, as the case may be, of its underlying stocks. | |
| 3 | The Fund’s P/E ratio calculation excludes companies with zero or negative earnings (12% of portfolio holdings as of 12/31/14). | |
| 4 | Active Share is the sum of the absolute values of the different weightings of each holding in the Fund versus each holding in the benchmark, divided by two. | |
|
| Calendar Year Total Returns (%) | | |
| | | |
| YEAR | | RVT (NAV) |
| |
| 2014 | | 0.8 |
| |
| 2013 | | 34.1 |
| |
| 2012 | | 15.4 |
| |
| 2011 | | -10.1 |
| |
| 2010 | | 30.3 |
| |
| 2009 | | 44.6 |
| |
| 2008 | | -45.6 |
| |
| 2007 | | 5.0 |
| |
| 2006 | | 19.5 |
| |
| 2005 | | 8.4 |
| |
| 2004 | | 21.4 |
| |
| 2003 | | 40.8 |
| |
| 2002 | | -15.6 |
| |
| 2001 | | 15.2 |
| |
| 2000 | | 16.6 |
| |
|
| Top 10 Positions | | |
| % of Net Assets | | |
| | | |
| HEICO Corporation | | 1.5 |
| |
| Ritchie Bros. Auctioneers | | 1.0 |
| |
| Hackett Group (The) | | 0.9 |
| |
| On Assignment | | 0.9 |
| |
| Newport Corporation | | 0.9 |
| |
| Forward Air | | 0.9 |
| |
| SEACOR Holdings | | 0.8 |
| |
| Nautilus | | 0.8 |
| |
| Tejon Ranch | | 0.8 |
| |
| Woodward | | 0.8 |
| |
|
| Portfolio Sector Breakdown | | |
| % of Net Assets | | |
| | | |
| Industrials | | 29.9 |
| |
| Information Technology | | 20.6 |
| |
| Financials | | 15.7 |
| |
| Consumer Discretionary | | 11.8 |
| |
| Materials | | 7.5 |
| |
| Health Care | | 5.9 |
| |
| Energy | | 3.6 |
| |
| Consumer Staples | | 2.2 |
| |
| Telecommunication Services | | 0.7 |
| |
| Miscellaneous | | 4.9 |
| |
| Preferred Stock | | 0.1 |
| |
| Outstanding Line of Credit, Net of Cash and Cash Equivalents | | -2.9 |
| |
| Important Performance and Risk Information |
| All performance information reflects past performance, is presented on a total return basis, and reflects the reinvestment of distributions. Past performance is no guarantee of future results. Current performance may be higher or lower than performance quoted. Returns as of the most recent month-end may be obtained at www.roycefunds.com. The market price of the Fund’s shares will fluctuate, so that shares may be worth more or less than their original cost when sold. The Fund invests primarily in securities of small- and micro-cap companies, which may involve considerably more risk than investing in larger-cap companies. The Fund’s broadly diversified portfolio does not ensure a profit or guarantee against loss. Regarding the “Top Contributors” and “Top Detractors” tables shown on page 6, the sum of all contributors to, and all detractors from, performance for all securities in the portfolio would approximate the Fund’s performance for 2014. |
| 2014 Annual Report to Stockholders | 7 |
| | | MANAGER’S DISCUSSION |
| | | |
 Royce Micro-Cap Trust Royce Micro-Cap Trust | | |
 |
| Chuck Royce |
| FUND PERFORMANCE |
| Royce Micro-Cap Trust (“RMT”) gained 3.5% on an NAV (net asset value) basis and 3.1% on a market price basis in 2014, trailing its benchmarks, the Russell 2000 Index and Russell Microcap Index, which had respective returns of 4.9% and 3.6% for the same period. We were frustrated that RMT gave up its first-half advantage, a period in which RMT advanced 3.1% on an NAV basis and 3.9% on a market price basis compared to the small-cap index’s 3.2% advance and the Russell Microcap’s 1.6% advance. Following a small-cap high on July 3, small-caps entered a volatile phase that saw July and September in the red. RMT outperformed both benchmarks for the third quarter as a whole, losing 7.1% on an NAV basis and 4.8% on a market price basis against the Russell 2000’s 7.4% decline and the Russell Microcap’s 8.2% decrease. The Fund’s absolute performance in the fourth quarter was fine, though RMT was short of both indexes during this bullish swing. During the final quarter of the year, RMT was up 8.2% on an NAV basis and 4.2% on a market price basis, falling behind respective increases of 9.7% and 11.2% for the Russell 2000 and Russell Microcap. |
| |
| We were pleased with the Fund’s absolute and relative performance results over longer-term periods. On an NAV basis, RMT outperformed the Russell 2000 for the three-, five-, 10-, 15-, 20-year, and since inception (12/14/93) periods ended December 31, 2014. RMT also outperformed the Russell Microcap on an NAV basis during the 10-year period. (Data for the Russell Microcap only goes back to June 2000.) On a market price basis, the Fund bested the Russell 2000 for the three-, five-, 15-, 20-year, and since inception periods and beat the Russell Microcap for the five- and 10-year periods. RMT’s average annual NAV total return for the since inception period was 11.5%, a long-term performance record that gives us great pride. |
| |
| WHAT WORKED... AND WHAT DIDN’T |
| Seven of the Fund’s 10 equity sectors made a positive impact on 2014 performance. Health Care was RMT’s largest contributor by more than 160 basis points, followed by Consumer Discretionary and Information Technology. Energy and Industrials were the Fund’s largest detractors, with Materials posting modest net losses. A developer of drugs for the treatment of infections caused by HIV, hepatitis B, and hepatitis C, Idenix Pharmaceuticals was a take-out target by pharmaceutical giant Merck in early June. News of the acquisition helped triple the company’s stock price, and we gradually sold our stake by the middle of the month. We also sold our shares of Medical Action Industries in June. A Virginia-based manufacturer and distributor of disposable medical products, including operating room supplies, custom procedure trays, sterilizing products, and patient apparel, Medical Action Industries was acquired by Owens & Minor for a 95% premium. Outside of Health Care, long-time holding and a top contributor to first-half performance Rentrak Corporation is a digital media measurement and research company that serves the entertainment, television, and advertising industries. Its share price began to really take off in early September. Investors seemed to like the healthy revenue growth and optimistic outlook the company reported in June. The company cemented a deal to expand its alliance with ABC while also establishing new agreements with CBS and Fox. In October, the firm announced its purchase of Kantar Media, the U.S. television measurement arm of advertising conglomerate WPP. In addition, Rentrak acquired new patents that solidified its position as a leading viewership data provider. We started reducing our position in October. |
| |
| Computer Task Group is an IT services and staffing company. Its stock price began to decline steeply in early July after reporting lower-than-expected earnings largely due to higher costs and lower revenues from its healthcare business. While the company claimed these higher expenses were likely anomalous, it also boosted its projected medical costs for the rest of 2014, thus revising guidance downward. Heritage-Crystal Clean provides parts cleaning, used oil re-refining, and hazardous and non-hazardous waste services to small and mid-sized customers in the manufacturing and vehicle service industries. Its shares took a hit in December when the firm announced that it was issuing more stock to pay down debt incurred to make two recent acquisitions. We added shares in the hope of a rebound. Earnings misses hindered the performance of Sioux Falls-based Raven Industries. Softening demand for agricultural equipment put pressure on its shares. |
| Top Contributors to Performance For 2014 (%)1 | | |
| Rentrak Corporation | | 0.79 |
| |
| Idenix Pharmaceuticals | | 0.66 |
| |
| Medical Action Industries | | 0.56 |
| |
| Universal Electronics | | 0.49 |
| |
| Integrated Electrical Services | | 0.42 |
| |
| 1 Includes dividends | | |
| Top Detractors from Performance For 2014 (%)2 | | |
| Computer Task Group | | -0.36 |
| |
| Heritage-Crystal Clean | | -0.33 |
| |
| Raven Industries | | -0.31 |
| |
| Le Chateau Cl. A | | -0.28 |
| |
| Cache | | -0.26 |
| |
| 2 Net of dividends | | |
| CURRENT POSITIONING AND OUTLOOK |
| We remain overweight in economically sensitive cyclical sectors such as Industrials, Information Technology, and Consumer Discretionary—areas where we have seen a number of profitable, conservatively capitalized businesses trading at attractive valuations. As the U.S. economy continues to grow and normalize, we believe fundamentals will matter more to investors, especially in an inefficient asset class such as micro-cap. |
| 8 | 2014 Annual Report to Stockholders |
| PERFORMANCE AND PORTFOLIO REVIEW | | SYMBOLS MARKET PRICE RMT NAV XOTCX |
| |
| Performance | | | | | | | | | | | | | | | | |
| Average Annual Total Return (%) Through 12/31/14 | | | | | | | | |
| | | JUL-DEC 2014* | | 1-YR | | 3-YR | | 5-YR | | 10-YR | | 15-YR | | 20-YR | | SINCE INCEPTION (12/14/93) |
| |
| RMT (NAV) | | 0.47 | | 3.55 | | 20.64 | | 15.81 | | 8.15 | | 10.97 | | 11.85 | | 11.50 |
| |
| *Not Annualized | | | | | | | | | | | | | |
Market Price Performance History Since Inception (12/14/93)Cumulative Performance of Investment1 | | | 1-YR | | 5-YR | | 10-YR | | 15-YR | | 20-YR | | SINCE INCEPTION (12/14/93) |
| |
| RMT | | 3.1% | | 123.6% | | 83.1% | | 418.0% | | 803.9% | | 754.0% |
| |
|
| 1 | Reflects the cumulative performance experience of a continuous common stockholder who purchased one share at inception ($7.50 IPO), reinvested all distributions and fully participated in the primary subscription of the Fund’s 1994 rights offering. |
| 2 | Reflects the actual month-end market price movement of one share as it has traded on NYSE and, prior to 12/1/03, on the Nasdaq. |
| Morningstar Style MapTM | | As of 12/31/14 |
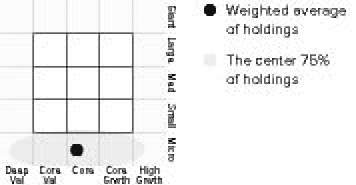
| The Morningstar Style Map is the Morningstar Style BoxTM with the center 75% of fund holdings plotted as the Morningstar Ownership ZoneTM. The Morningstar Style Box is designed to reveal a fund’s investment strategy. The Morningstar Ownership Zone provides detail about a portfolio’s investment style by showing the range of stock sizes and styles. The Ownership Zone is derived by plotting each stock in the portfolio within the proprietary Morningstar Style Box. Over time, the shape and location of a fund’s ownership zone may vary. See page 60 for additional information. |
|
| Portfolio Diagnostics | | |
| | | |
| Fund Net Assets | | $387 million |
| |
| Number of Holdings | | 387 |
| |
| Turnover Rate | | 41% |
| |
| Net Asset Value | | $11.34 |
| |
| Market Price | | $10.08 |
| |
| Average Market Capitalization1 | | $348 million |
| |
| Weighted Average P/E Ratio2,3 | | 19.6x |
| |
| Weighted Average P/B Ratio2 | | 1.6x |
| |
| Holdings ≥ 75% of Total Investments | | 160 |
| |
| Active Share4 | | 94% |
| |
| U.S. Investments (% of Net Assets) | | 98.2% |
| |
| Non-U.S. Investments (% of Net Assets) | | 11.5% |
| |
| 1 | Geometric Average. This weighted calculation uses each portfolio holding’s market cap in a way designed to not skew the effect of very large or small holdings; instead, it aims to better identify the portfolio’s center, which Royce believes offers a more accurate measure of average market cap than a simple mean or median. | |
| 2 | Harmonic Average. This weighted calculation evaluates a portfolio as if it were a single stock and measures it overall. It compares the total market value of the portfolio to the portfolio’s share in the earnings or book value, as the case may be, of its underlying stocks. | |
| 3 | The Fund’s P/E ratio calculation excludes companies with zero or negative earnings (23% of portfolio holdings as of 12/31/14). | |
| 4 | Active Share is the sum of the absolute values of the different weightings of each holding in the Fund versus each holding in the benchmark, divided by two. | |
|
| Calendar Year Total Returns (%) | | |
| | | |
| YEAR | | RMT (NAV) |
| |
| 2014 | | 3.5 |
| |
| 2013 | | 44.5 |
| |
| 2012 | | 17.3 |
| |
| 2011 | | -7.7 |
| |
| 2010 | | 28.5 |
| |
| 2009 | | 46.5 |
| |
| 2008 | | -45.5 |
| |
| 2007 | | 0.6 |
| |
| 2006 | | 22.5 |
| |
| 2005 | | 6.8 |
| |
| 2004 | | 18.7 |
| |
| 2003 | | 55.5 |
| |
| 2002 | | -13.8 |
| |
| 2001 | | 23.4 |
| |
| 2000 | | 10.9 |
| |
|
| Top 10 Positions | | |
| % of Net Assets | | |
| | | |
| Newport Corporation | | 1.2 |
| |
| Integrated Electrical Services | | 1.1 |
| |
| FRP Holdings | | 1.1 |
| |
| Atrion Corporation | | 1.1 |
| |
| Seneca Foods | | 1.0 |
| |
| Permian Basin Royalty Trust | | 1.0 |
| |
| Diamond Hill Investment Group | | 1.0 |
| |
| Universal Truckload Services | | 1.0 |
| |
| MVC Capital | | 1.0 |
| |
| Silvercrest Asset Management Group Cl. A | | 0.9 |
| |
|
| Portfolio sector Breakdown | | |
| % of Net Assets | | |
| | | |
| Industrials | | 23.1 |
| |
| Information Technology | | 23.0 |
| |
| Consumer Discretionary | | 18.9 |
| |
| Financials | | 18.0 |
| |
| Health Care | | 10.4 |
| |
| Materials | | 6.9 |
| |
| Energy | | 2.4 |
| |
| Consumer Staples | | 1.8 |
| |
| Utilities | | 0.0 |
| |
| Miscellaneous | | 4.9 |
| |
| Preferred Stock | | 0.3 |
| |
| Outstanding Line of Credit, Net of Cash and Cash Equivalents | | -9.7 |
| |
| Important Performance and Risk Information |
| All performance information reflects past performance, is presented on a total return basis, and reflects the reinvestment of distributions. Past performance is no guarantee of future results. Current performance may be higher or lower than performance quoted. Returns as of the most recent month-end may be obtained at www.roycefunds.com. Certain immaterial adjustments were made to the net assets of Royce Micro-Cap Trust at 12/31/12 and 12/31/14 for financial reporting purposes, and as a result the net asset value originally calculated on that date and the total return based on that net asset value differs from the adjusted net asset value and total return reported in the Financial Highlights. The market price of the Fund’s shares will fluctuate, so that shares may be worth more or less than their original cost when sold. The Fund normally invests in micro-cap companies, which may involve considerably more risk than investing in larger-cap companies. The Fund’s broadly diversified portfolio does not ensure a profit or guarantee against loss. Regarding the “Top Contributors” and “Top Detractors” tables shown on page 8, the sum of all contributors to, and all detractors from, performance for all securities in the portfolio would approximate the Fund’s performance for 2014. |
| 2014 Annual Report to Stockholders | 9 |
| | | MANAGER’S DISCUSSION |
| | | |
| Royce Global Value Trust | | |
| | | |
 |
| Chuck Royce |
| FUND PERFORMANCE |
| Royce Global Value Trust (“RGT”) fell 6.2% on an NAV (net asset value) basis and 7.9% on a market price basis in 2014, results that considerably trailed its benchmark, the Russell Global Small Cap Index, which lost 0.3% for the same period. The Fund’s difficulties on both a relative and absolute basis were mostly attributable to a poor second half. The year began on a solidly bullish note. For the six-month period ended June 30, 2014 RGT climbed 5.6% on an NAV basis and 5.8% on a market price basis, essentially sandwiching its benchmark, which was up 5.7% for the same period. A strengthening Europe helped to compensate for a generally less robust Asia during the first few months of 2014. There were notable contributions from portfolio holdings in Canada, France, and Japan in the first half as well as trouble spots for positions headquartered in Hong Kong and the U.S. Stocks across the globe corrected (with the exception of U.S. large-caps) in the third quarter, with European shares among the most adversely affected. The Fund lost 7.1% on an NAV basis and 7.4% on a market price basis versus a decline of 6.7% for the Russell Global Small Cap Index. Portfolio holdings headquartered in the U.S., Canada, Hong Kong, and France were the largest detractors from quarterly results. Unfortunately, the Fund fell farther behind in the fourth quarter, a period in which U.S. small-caps rallied off a mid-October low while many non-U.S. companies saw additional losses or treaded water. For the fourth quarter, the Fund was down 4.4% on an NAV basis and 6.0% based on market price compared to a 1.1% increase for its global benchmark. In contrast to the third quarter, holdings headquartered in Japan, Brazil, and the U.K. had the most significant negative impact. While we were not pleased with the Fund’s thus-far brief since inception (10/17/13) results, we are confident that our disciplined, value-oriented approach can be successful. |
| |
| WHAT WORKED... AND WHAT DIDN’T |
| For the full year, those countries with the greatest positive impact were South Africa, Argentina, and the Philippines while holdings headquartered in Hong Kong, the U.S., the U.K., and Brazil detracted most from RGT’s calendar-year results. On a sector basis, only Information Technology and Consumer Staples finished 2014 in the black, though their respective net gains were modest. Industrials posted the largest net losses, nearly doubling the negative impact of the Fund’s next-biggest loser, Materials. The Consumer Discretionary sector also registered a decent-sized net loss for the year. BBVA Banco Frances is one of Argentina’s largest banks. Its strong revenue growth and terrific history of earnings per share growth helped to reassure investors otherwise anxious over the nation’s recent debt woes. We reduced our position as its stock price climbed. We chose to hold our position in food distribution business Universal Robina, one of the largest food companies in the Philippines. Improved domestic and international sales helped to move its shares higher. |
| |
LPS Brasil Consultoria de Imoveis provides integrated solutions in the real estate brokerage industry as well as consulting and financing promotion services in Brazil. A weak real estate market and depressed consumer sentiment contributed to the company’s fading share price, which was also hampered by Brazil’s overall sluggish economy. Not entirely sure of the timing for a turnaround, we began to reduce our stake in September. We were more confident in the long-term prospects for retailer New World Department Store China. We like how the company is positioned for a pick-up in the Chinese economy as well as its management and very generous dividend policy. LPKF Laser & Electronics develops specialized mechanical engineering products for electronics production, the automotive industry, and the manufacture of solar cells. A revised outlook for 2014 kept investors selling, but we believe the case for long-term growth remained intact. Its financing is solid and its profitability remains above-average, despite the recent revenue downturn. We think it can resume growth in 2015. Freund Corporation manufactures and sells granulation and coating equipment for the pharmaceutical, food, and chemical industries in Japan and internationally. Contracting demand for equipment shipments, surging prices in raw materials, and a rise in operating expenses all hurt its stock price. We added shares in the first half. The strength of the U.S. dollar was also a factor in the performance of non-U.S. holdings. |
| Top Contributors to Performance For 2014 (%)1 | | |
| BBVA Banco Frances ADR | | 0.49 |
| |
| Universal Robina | | 0.46 |
| |
| Relo Holdings | | 0.42 |
| |
| Shimano | | 0.38 |
| |
| Regent Manner International Holdings | | 0.31 |
| |
| 1 Includes dividends | | |
| Top Detractors from Performance For 2014 (%)2 | | |
| LPS Brasil Consultoria de Imoveis | | -0.58 |
| |
| New World Department Store China | | -0.57 |
| |
| LPKF Laser & Electronics | | -0.54 |
| |
| Freund Corporation | | -0.41 |
| |
| Pico Far East Holdings | | -0.39 |
| |
| 2 Net of dividends | | |
| CURRENT POSITIONING AND OUTLOOK |
| The Fund invests in a broadly diversified portfolio of both U.S. and non-U.S. small-cap stocks. At the end of 2014, RGT was overweight in cyclical sectors such as Consumer Discretionary and Industrials. We significantly added to our exposure in the latter during 2014. The portfolio also had reasonable exposure to Financials and Information Technology. The former group was underweight versus the benchmark, but was built up considerably in 2014. The Fund’s sector weightings reflect our belief in the recovery of global economic growth. |
| 10 | 2014 Annual Report to Stockholders |
| PERFORMANCE AND PORTFOLIO REVIEW | | SYMBOLS MARKET PRICE RGT NAV XRGTX |
| |
| Performance | | | | | | |
| Average Annual Total Return (%) Through 12/31/14 | | | | |
| | | JUL-DEC 2014* | | 1-YR | | SINCE INCEPTION (10/17/13) |
| |
| RGT (NAV) | | -11.18 | | -6.23 | | -3.03 |
| |
| *Not Annualized | | | | | | |
|
| Morningstar Style MapTM | | As of 12/31/14 |

| The Morningstar Style Map is the Morningstar Style BoxTM with the center 75% of fund holdings plotted as the Morningstar Ownership ZoneTM. The Morningstar Style Box is designed to reveal a fund’s investment strategy. The Morningstar Ownership Zone provides detail about a portfolio’s investment style by showing the range of stock sizes and styles. The Ownership Zone is derived by plotting each stock in the portfolio within the proprietary Morningstar Style Box. Over time, the shape and location of a fund’s ownership zone may vary. See page 60 for additional information. |
|
| Top 10 Positions | | |
| % of Net Assets | | |
| |
| Pico Far East Holdings | | 1.5 |
| |
| Ritchie Bros. Auctioneers | | 1.5 |
| |
| Lazard Cl. A | | 1.5 |
| |
| Relo Holdings | | 1.5 |
| |
| EPS Corporation | | 1.4 |
| |
| Clarkson | | 1.4 |
| |
| Silverlake Axis | | 1.4 |
| |
| Consort Medical | | 1.3 |
| |
| CETIP - Mercados Organizados | | 1.3 |
| |
| TGS-NOPEC Geophysical | | 1.2 |
| |
|
| Portfolio Sector Breakdown | | |
| % of Net Assets | | |
| |
| Industrials | | 22.3 |
| |
| Financials | | 19.6 |
| |
| Consumer Discretionary | | 17.5 |
| |
| Materials | | 14.2 |
| |
| Information Technology | | 13.5 |
| |
| Health Care | | 7.3 |
| |
| Energy | | 3.2 |
| |
| Consumer Staples | | 2.7 |
| |
| Other Net Liabilities | | -0.3 |
| |
|
| Calendar Year Total Returns (%) | | |
| | | |
| YEAR | | RGT (NAV) |
| |
| 2014 | | -6.2 |
| |
|
| Portfolio Country Breakdown1,2 | | |
| % of Net Assets | | |
| |
| United States | | 14.8 |
| |
| Japan | | 11.0 |
| |
| Hong Kong | | 10.0 |
| |
| United Kingdom | | 9.6 |
| |
| Canada | | 7.9 |
| |
| France | | 6.8 |
| |
| South Africa | | 5.1 |
| |
| Brazil | | 3.8 |
| |
| 1 | Represents countries that are 3% or more of net assets. |
| 2 | Securities are categorized by the country of their headquarters. |
|
| Portfolio Diagnostics | | |
| |
| Fund Net Assets | | $95 million |
| |
| Number of Holdings | | 229 |
| |
| Turnover Rate | | 43% |
| |
| Net Asset Value | | $9.25 |
| |
| Market Price | | $8.04 |
| |
| Average Market Capitalization1 | | $953 million |
| |
| Weighted Average P/E Ratio2,3 | | 16.3x |
| |
| Weighted Average P/B Ratio2 | | 1.7x |
| |
| Holdings ≥ 75% of Total Investments | | 91 |
| |
| Active Share4 | | 98% |
| |
| 1 | Geometric Average. This weighted calculation uses each portfolio holding’s market cap in a way designed to not skew the effect of very large or small holdings; instead, it aims to better identify the portfolio’s center, which Royce believes offers a more accurate measure of average market cap than a simple mean or median. |
| 2 | Harmonic Average. This weighted calculation evaluates a portfolio as if it were a single stock and measures it overall. It compares the total market value of the portfolio to the portfolio’s share in the earnings or book value, as the case may be, of its underlying stocks. |
| 3 | The Fund’s P/E ratio calculation excludes companies with zero or negative earnings (9% of portfolio holdings as of 12/31/14). |
| 4 | Active Share is the sum of the absolute values of the different weightings of each holding in the Fund versus each holding in the benchmark, divided by two. |
Important Performance and Risk Information
All performance information reflects past performance, is presented on a total return basis, and reflects the reinvestment of distributions. Past performance is no guarantee of future results. Current performance may be higher or lower than performance quoted. Returns as of the most recent month-end may be obtained at www.roycefunds.com. Certain immaterial adjustments were made to the net assets of Royce Global Value Trust at 12/31/14 for financial reporting purposes, and as a result the net asset value originally calculated on that date and the total return based on that net asset value differs from the adjusted net asset value and total return reported in the Financial Highlights. The market price of the Fund’s shares will fluctuate, so that shares may be worth more or less than their original cost when sold. The Fund invests primarily in securities of small- and micro-cap companies, which may involve considerably more risk than investments in securities of larger-cap companies. The Fund’s broadly diversified portfolio does not ensure a profit or guarantee against loss. From time to time, the Fund may invest a significant portion of its net assets in foreign securities, which may involve political, economic, currency and other risks not encountered in U.S. investments. Regarding the “Top Contributors” and “Top Detractors” tables shown on page 10, the sum of all contributors to, and all detractors from, performance for all securities in the portfolio would approximate the Fund’s performance for 2014. |
| 2014 Annual Report to Stockholders | 11 |
History Since Inception
The following table details the share accumulations by an initial investor in the Funds who reinvested all distributions and participated fully in primary subscriptions for each of the rights offerings. Full participation in distribution reinvestments and rights offerings can maximize the returns available to a long-term investor. This table should be read in conjunction with the Performance and Portfolio Reviews of the Funds.
| HISTORY | | | | AMOUNT INVESTED | | PURCHASE PRICE1 | | SHARES | | NAV VALUE2 | | MARKET VALUE3 | |
| |
| Royce Value Trust |
| 11/26/86 | | Initial Purchase | | $ | 10,000 | | $ | 10.000 | | | 1,000 | | $ | 9,280 | | $ | 10,000 | |
| |
| 10/15/87 | | Distribution $0.30 | | | | | | 7.000 | | | 42 | | | | | | | |
| |
| 12/31/87 | | Distribution $0.22 | | | | | | 7.125 | | | 32 | | | 8,578 | | | 7,250 | |
| |
| 12/27/88 | | Distribution $0.51 | | | | | | 8.625 | | | 63 | | | 10,529 | | | 9,238 | |
| |
| 9/22/89 | | Rights Offering | | | 405 | | | 9.000 | | | 45 | | | | | | | |
| |
| 12/29/89 | | Distribution $0.52 | | | | | | 9.125 | | | 67 | | | 12,942 | | | 11,866 | |
| |
| 9/24/90 | | Rights Offering | | | 457 | | | 7.375 | | | 62 | | | | | | | |
| |
| 12/31/90 | | Distribution $0.32 | | | | | | 8.000 | | | 52 | | | 11,713 | | | 11,074 | |
| |
| 9/23/91 | | Rights Offering | | | 638 | | | 9.375 | | | 68 | | | | | | | |
| |
| 12/31/91 | | Distribution $0.61 | | | | | | 10.625 | | | 82 | | | 17,919 | | | 15,697 | |
| |
| 9/25/92 | | Rights Offering | | | 825 | | | 11.000 | | | 75 | | | | | | | |
| |
| 12/31/92 | | Distribution $0.90 | | | | | | 12.500 | | | 114 | | | 21,999 | | | 20,874 | |
| |
| 9/27/93 | | Rights Offering | | | 1,469 | | | 13.000 | | | 113 | | | | | | | |
| |
| 12/31/93 | | Distribution $1.15 | | | | | | 13.000 | | | 160 | | | 26,603 | | | 25,428 | |
| |
| 10/28/94 | | Rights Offering | | | 1,103 | | | 11.250 | | | 98 | | | | | | | |
| |
| 12/19/94 | | Distribution $1.05 | | | | | | 11.375 | | | 191 | | | 27,939 | | | 24,905 | |
| |
| 11/3/95 | | Rights Offering | | | 1,425 | | | 12.500 | | | 114 | | | | | | | |
| |
| 12/7/95 | | Distribution $1.29 | | | | | | 12.125 | | | 253 | | | 35,676 | | | 31,243 | |
| |
| 12/6/96 | | Distribution $1.15 | | | | | | 12.250 | | | 247 | | | 41,213 | | | 36,335 | |
| |
| 1997 | | Annual distribution total $1.21 | | | | | | 15.374 | | | 230 | | | 52,556 | | | 46,814 | |
| |
| 1998 | | Annual distribution total $1.54 | | | | | | 14.311 | | | 347 | | | 54,313 | | | 47,506 | |
| |
| 1999 | | Annual distribution total $1.37 | | | | | | 12.616 | | | 391 | | | 60,653 | | | 50,239 | |
| |
| 2000 | | Annual distribution total $1.48 | | | | | | 13.972 | | | 424 | | | 70,711 | | | 61,648 | |
| |
| 2001 | | Annual distribution total $1.49 | | | | | | 15.072 | | | 437 | | | 81,478 | | | 73,994 | |
| |
| 2002 | | Annual distribution total $1.51 | | | | | | 14.903 | | | 494 | | | 68,770 | | | 68,927 | |
| |
| 1/28/03 | | Rights Offering | | | 5,600 | | | 10.770 | | | 520 | | | | | | | |
| |
| 2003 | | Annual distribution total $1.30 | | | | | | 14.582 | | | 516 | | | 106,216 | | | 107,339 | |
| |
| 2004 | | Annual distribution total $1.55 | | | | | | 17.604 | | | 568 | | | 128,955 | | | 139,094 | |
| |
| 2005 | | Annual distribution total $1.61 | | | | | | 18.739 | | | 604 | | | 139,808 | | | 148,773 | |
| |
| 2006 | | Annual distribution total $1.78 | | | | | | 19.696 | | | 693 | | | 167,063 | | | 179,945 | |
| |
| 2007 | | Annual distribution total $1.85 | | | | | | 19.687 | | | 787 | | | 175,469 | | | 165,158 | |
| |
| 2008 | | Annual distribution total $1.723 | | | | | | 12.307 | | | 1,294 | | | 95,415 | | | 85,435 | |
| |
| 3/11/09 | | Distribution $0.323 | | | | | | 6.071 | | | 537 | | | 137,966 | | | 115,669 | |
| |
| 12/2/10 | | Distribution $0.03 | | | | | | 13.850 | | | 23 | | | 179,730 | | | 156,203 | |
| |
| 2011 | | Annual distribution total $0.783 | | | | | | 13.043 | | | 656 | | | 161,638 | | | 139,866 | |
| |
| 2012 | | Annual distribution total $0.80 | | | | | | 13.063 | | | 714 | | | 186,540 | | | 162,556 | |
| |
| 2013 | | Annual distribution total $2.194 | | | | | | 16.647 | | | 1,658 | | | 250,219 | | | 220,474 | |
| |
| 2014 | | Annual distribution total $1.82 | | | | | | 14.840 | | | 1,757 | | | | | | | |
| |
| 12/31/14 | | | | $ | 21,922 | | | | | | 15,528 | | $ | 252,175 | | $ | 222,516 | |
| |
| 1 | The purchase price used for annual distribution totals is a weighted average of the distribution reinvestment prices for the year. |
| 2 | Values are stated as of December 31 of the year indicated, after reinvestment of distributions, other than for initial purchase. |
| 3 | Includes a return of capital. |
| 4 | Includes Royce Global Value Trust spin-off of $1.40 per share. |
| 12 | 2014 Annual Report to Stockholders |
| HISTORY | | | | AMOUNT INVESTED | | PURCHASE PRICE1 | | SHARES | | NAV VALUE2 | | MARKET VALUE2 | |
| |
| Royce Micro-Cap Trust |
| |
| 12/14/93 | | Initial Purchase | | $ | 7,500 | | $ | 7.500 | | | 1,000 | | $ | 7,250 | | $ | 7,500 | |
| |
| 10/28/94 | | Rights Offering | | | 1,400 | | | 7.000 | | | 200 | | | | | | | |
| |
| 12/19/94 | | Distribution $0.05 | | | | | | 6.750 | | | 9 | | | 9,163 | | | 8,462 | |
| |
| 12/7/95 | | Distribution $0.36 | | | | | | 7.500 | | | 58 | | | 11,264 | | | 10,136 | |
| |
| 12/6/96 | | Distribution $0.80 | | | | | | 7.625 | | | 133 | | | 13,132 | | | 11,550 | |
| |
| 12/5/97 | | Distribution $1.00 | | | | | | 10.000 | | | 140 | | | 16,694 | | | 15,593 | |
| |
| 12/7/98 | | Distribution $0.29 | | | | | | 8.625 | | | 52 | | | 16,016 | | | 14,129 | |
| |
| 12/6/99 | | Distribution $0.27 | | | | | | 8.781 | | | 49 | | | 18,051 | | | 14,769 | |
| |
| 12/6/00 | | Distribution $1.72 | | | | | | 8.469 | | | 333 | | | 20,016 | | | 17,026 | |
| |
| 12/6/01 | | Distribution $0.57 | | | | | | 9.880 | | | 114 | | | 24,701 | | | 21,924 | |
| |
| 2002 | | Annual distribution total $0.80 | | | | | | 9.518 | | | 180 | | | 21,297 | | | 19,142 | |
| |
| 2003 | | Annual distribution total $0.92 | | | | | | 10.004 | | | 217 | | | 33,125 | | | 31,311 | |
| |
| 2004 | | Annual distribution total $1.33 | | | | | | 13.350 | | | 257 | | | 39,320 | | | 41,788 | |
| |
| 2005 | | Annual distribution total $1.85 | | | | | | 13.848 | | | 383 | | | 41,969 | | | 45,500 | |
| |
| 2006 | | Annual distribution total $1.55 | | | | | | 14.246 | | | 354 | | | 51,385 | | | 57,647 | |
| |
| 2007 | | Annual distribution total $1.35 | | | | | | 13.584 | | | 357 | | | 51,709 | | | 45,802 | |
| |
| 2008 | | Annual distribution total $1.193 | | | | | | 8.237 | | | 578 | | | 28,205 | | | 24,807 | |
| |
| 3/11/09 | | Distribution $0.223 | | | | | | 4.260 | | | 228 | | | 41,314 | | | 34,212 | |
| |
| 12/2/10 | | Distribution $0.08 | | | | | | 9.400 | | | 40 | | | 53,094 | | | 45,884 | |
| |
| 2011 | | Annual distribution total $0.533 | | | | | | 8.773 | | | 289 | | | 49,014 | | | 43,596 | |
| |
| 2012 | | Annual distribution total $0.51 | | | | | | 9.084 | | | 285 | | | 57,501 | | | 49,669 | |
| |
| 2013 | | Annual distribution total $1.38 | | | | | | 11.864 | | | 630 | | | 83,110 | | | 74,222 | |
| |
| 2014 | | Annual distribution total $2.90 | | | | | | 10.513 | | | 1,704 | | | | | | | |
| |
| 12/31/14 | | | | $ | 8,900 | | | | | | 7,590 | | $ | 86,071 | | $ | 76,507 | |
| |
| Royce Global Value Trust |
| 10/17/13 | | Initial Purchase | | $ | 8,975 | | $ | 8.975 | | | 1,000 | | $ | 9,780 | | $ | 8,975 | |
| |
| 12/11/14 | | Distribution $0.15 | | | | | | 7.970 | | | 19 | | | | | | | |
| |
| 12/31/14 | | | | $ | 8,975 | | | | | | 1,019 | | $ | 9,426 | | $ | 8,193 | |
| |
| 1 | The purchase price used for annual distribution totals is a weighted average of the distribution reinvestment prices for the year. |
| 2 | Values are stated as of December 31 of the year indicated, after reinvestment of distributions, other than for initial purchase. |
| 3 | Includes a return of capital. |
| 2014 Annual Report to Stockholders | 13 |
Distribution Reinvestment and Cash Purchase Options
Why should I reinvest my distributions?
By reinvesting distributions, a stockholder can maintain an undiluted investment in the Fund. The regular reinvestment of distributions has a significant impact on stockholder returns. In contrast, the stockholder who takes distributions in cash is penalized when shares are issued below net asset value to other stockholders.
How does the reinvestment of distributions from the Royce closed-end funds work?
The Funds automatically issue shares in payment of distributions unless you indicate otherwise. The shares are generally issued at the lower of the market price or net asset value on the valuation date.
How does this apply to registered stockholders?
If your shares are registered directly with a Fund, your distributions are automatically reinvested unless you have otherwise instructed the Funds’ transfer agent, Computershare, in writing, in which case you will receive your distribution in cash. A registered stockholder also may have the option to receive the distribution in the form of a stock certificate.
What if my shares are held by a brokerage firm or a bank?
If your shares are held by a brokerage firm, bank, or other intermediary as the stockholder of record, you should contact your brokerage firm or bank to be certain that it is automatically reinvesting distributions on your behalf. If they are unable to reinvest distributions on behalf, you should have your shares registered in your name in order to participate.
What other features are available for registered stockholders?
The Distribution Reinvestment and Cash Purchase Plans also allow registered stockholders to make optional cash purchases of shares of a Fund’s common stock directly through Computershare on a monthly basis, and to deposit certificates representing your RVT and RMT shares with Computershare for safekeeping. (RGT does not issue shares in certificated form). Plan participants are subject to a $0.75 service fee for each voluntary cash purchase under the Plans. The Funds’ investment adviser absorbed all commissions on optional cash purchases under the Plans through December 31, 2014. |
How do the Plans work for registered stockholders?
Computershare maintains the accounts for registered stockholders in the Plans and sends written confirmation of all transactions in the account. Shares in the account of each participant will be held by Computershare in non-certificated form in the name of the participant, and each participant will be able to vote those shares at a stockholder meeting or by proxy. A participant may also send stock certificates for RVT and RMT held by them to Computershare to be held in non-certificated form. RGT does not issue shares in certificated form. There is no service fee charged to participants for reinvesting distributions. If a participant elects to sell shares from a Plan account, Computershare will deduct a $2.50 service fee from the sale transaction. The Funds’ investment adviser absorbed all commissions on optional sales under the Plans through December 31, 2014. If a nominee is the registered owner of your shares, the nominee will maintain the accounts on your behalf.
How can I get more information on the Plans?
You can call an Investor Services Representative at (800) 221-4268 or you can request a copy of the Plan for your Fund from Computershare. All correspondence (including notifications) should be directed to: [Name of Fund] Distribution Reinvestment and Cash Purchase Plan, c/o Computershare, PO Box 43078, Providence, RI 02940-3078, telephone (800) 426-5523 (from 9:00 A.M. to 5:00 P.M.). |
| 14 | 2014 Annual Report to Stockholders |
| Royce Value Trust | December 31, 2014 |
| |
Schedule of Investments
Common Stocks – 102.8% | | | | | | |
| | | SHARES | | | | VALUE |
| |
| | | | | | | |
| CONSUMER DISCRETIONARY – 11.8% | | | | | | |
| AUTO COMPONENTS - 0.9% | | | | | | |
| | 29,206 | | | $ | 1,491,551 |
| | 122,000 | | | | 1,334,680 |
| Gentex Corporation | | 122,740 | | | | 4,434,596 |
| | 35,500 | | | | 1,275,040 |
| Selamat Sempurna | | 6,867,400 | | | | 2,619,299 |
| Standard Motor Products | | 15,052 | | | | 573,782 |
| | | | | | |
| | | | | | | 11,728,948 |
| | | | | | |
| AUTOMOBILES - 0.9% | | | | | | |
| | 124,980 | | | | 6,982,633 |
| Winnebago Industries | | 211,400 | | | | 4,600,064 |
| | | | | | |
| | | | | | | 11,582,697 |
| | | | | | |
| DISTRIBUTORS - 0.2% | | | | | | |
| Weyco Group | | 97,992 | | | | 2,907,423 |
| | | | | | |
| DIVERSIFIED CONSUMER SERVICES - 1.5% | | | | | | |
American Public Education 1 | | 36,100 | | | | 1,331,007 |
| Benesse Holdings | | 35,000 | | | | 1,039,698 |
| | 20,000 | | | | 139,200 |
| Collectors Universe | | 72,300 | | | | 1,508,178 |
†Lincoln Educational Services | | 721,700 | | | | 2,035,194 |
| MegaStudy | | 15,000 | | | | 725,406 |
| | 233,800 | | | | 3,918,488 |
| Sotheby’s | | 138,200 | | | | 5,967,476 |
| Universal Technical Institute | | 130,432 | | | | 1,283,451 |
| | | | | | |
| | | | | | | 17,948,098 |
| | | | | | |
| HOTELS, RESTAURANTS & LEISURE - 0.0% | | | | | | |
| | 32,100 | | | | 80,250 |
Tropicana Entertainment 1,4 | | 8,000 | | | | 134,800 |
| | | | | | |
| | | | | | | 215,050 |
| | | | | | |
| HOUSEHOLD DURABLES - 2.4% | | | | | | |
| De’Longhi | | 20,000 | | | | 362,219 |
Ethan Allen Interiors | | 320,800 | | | | 9,935,176 |
| Flexsteel Industries | | 24,800 | | | | 799,800 |
| Harman International Industries | | 28,600 | | | | 3,051,906 |
| Lifetime Brands | | 54,426 | | | | 936,127 |
| | 28,000 | | | | 4,350,080 |
| | 2,096,300 | | | | 3,249,265 |
| | 2,600 | | | | 3,315,858 |
| | 1,012,235 | | | | 2,773,524 |
| | 184,782 | | | | 589,454 |
| | | | | | |
| | | | | | | 29,363,409 |
| | | | | | |
| INTERNET & CATALOG RETAIL - 0.2% | | | | | | |
| | 34,800 | | | | 1,253,148 |
| Manutan International | | 26,000 | | | | 1,289,144 |
| | | | | | |
| | | | | | | 2,542,292 |
| | | | | | |
| LEISURE PRODUCTS - 1.2% | | | | | | |
| Arctic Cat | | 15,800 | | | | 560,900 |
| | 55,000 | | | | 770,204 |
LeapFrog Enterprises Cl. A 1 | | 240,100 | | | | 1,133,272 |
| | 676,100 | | | | 10,263,198 |
| Shimano | | 11,000 | | | | 1,422,852 |
Smith & Wesson Holding Corporation 1 | | 39,300 | | | | 372,171 |
| | | | | | |
| | | | | | | 14,522,597 |
| | | | | | |
| MEDIA - 1.2% | | | | | | |
E.W. Scripps Company Cl. A 1 | | 53,300 | | | | 1,191,255 |
| Media Chinese International | | 7,650,000 | | | | 1,640,664 |
| Morningstar | | 84,600 | | | | 5,474,466 |
| Pico Far East Holdings | | 6,575,000 | | | | 1,506,650 |
RLJ Entertainment 1 | | 35,600 | | | | 71,200 |
SinoMedia Holding | | 500,000 | | | | 278,852 |
T4F Entretenimento 1 | | 141,800 | | | | 153,651 |
Television Broadcasts | | 308,400 | | | | 1,790,162 |
Wiley (John) & Sons Cl. A | | 48,200 | | | | 2,855,368 |
| | | | | | |
| | | | | | | 14,962,268 |
| | | | | | |
| MULTILINE RETAIL - 0.2% | | | | | | |
New World Department Store China | | 6,427,200 | | | | 2,054,707 |
| | | | | | |
| SPECIALTY RETAIL - 1.5% | | | | | | |
Aeropostale 1 | | 110,000 | | | | 255,200 |
Ascena Retail Group 1 | | 109,485 | | | | 1,375,132 |
Buckle (The) 2 | | 59,615 | | | | 3,130,980 |
Genesco 1 | | 42,785 | | | | 3,278,187 |
I.T | | 1,127,000 | | | | 324,855 |
Lewis Group | | 200,000 | | | | 1,279,730 |
Oriental Watch Holdings | | 543,000 | | | | 104,848 |
Sears Hometown and Outlet Stores 1 | | 10,400 | | | | 136,760 |
Signet Jewelers | | 8,000 | | | | 1,052,560 |
Stein Mart | | 167,800 | | | | 2,453,236 |
Systemax 1 | | 194,000 | | | | 2,619,000 |
TravelCenters of America LLC 1 | | 62,500 | | | | 788,750 |
West Marine 1 | | 131,100 | | | | 1,693,812 |
| | | | | | |
| | | | | | | 18,493,050 |
| | | | | | |
| TEXTILES, APPAREL & LUXURY GOODS - 1.6% | | | | | | |
Asia Brands | | 117,100 | | | | 99,663 |
†Crown Crafts | | 247,241 | | | | 1,903,756 |
Culp | | 55,500 | | | | 1,203,240 |
Daphne International Holdings | | 4,412,800 | | | | 1,600,804 |
Grendene | | 200,000 | | | | 1,150,320 |
Huvis Corporation | | 18,600 | | | | 188,375 |
J.G. Boswell Company 4 | | 2,292 | | | | 2,159,087 |
Movado Group | | 75,161 | | | | 2,132,317 |
Pacific Textiles Holdings | | 550,000 | | | | 727,505 |
Stella International Holdings | | 300,000 | | | | 787,202 |
Van de Velde | | 22,500 | | | | 1,060,022 |
Wolverine World Wide 2 | | 123,500 | | | | 3,639,545 |
†YGM Trading | | 1,382,600 | | | | 2,505,446 |
| | | | | | |
| | | | | | | 19,157,282 |
| |
| Total (Cost $121,593,230) | | | | | | 145,477,821 |
| |
| | | | | | | |
| CONSUMER STAPLES – 2.2% | | | | | | |
| BEVERAGES - 0.0% | | | | | | |
Crimson Wine Group 1,4 | | 11,876 | | | | 111,635 |
| | | | | | |
| FOOD & STAPLES RETAILING - 0.1% | | | | | | |
FamilyMart | | 37,000 | | | | 1,381,268 |
| | | | | | |
| FOOD PRODUCTS - 1.5% | | | | | | |
Alico | | 51,000 | | | | 2,551,530 |
Cal-Maine Foods | | 29,176 | | | | 1,138,739 |
Farmer Bros. 1 | | 28,900 | | | | 851,105 |
Industrias Bachoco ADR 1 | | 41,865 | | | | 2,088,226 |
Lancaster Colony | | 10,700 | | | | 1,001,948 |
Seneca Foods Cl. A 1 | | 219,255 | | | | 5,926,463 |
Seneca Foods Cl. B 1 | | 13,840 | | | | 445,648 |
Sipef | | 3,700 | | | | 213,472 |
Tootsie Roll Industries 2 | | 124,135 | | | | 3,804,738 |
Waterloo Investment Holdings 1,6 | | 598,676 | | | | 227,497 |
| | | | | | |
| | | | | | | 18,249,366 |
| | | | | | |
| THE ACCOMPANYING NOTES ARE AN INTEGRAL PART OF THESE FINANCIAL STATEMENTS | 2014 Annual Report to Stockholders | 15 |
| |
| Schedule of Investments (continued) | | | | | | |
| | | SHARES | | | | VALUE |
| |
| | | | | | | |
| CONSUMER STAPLES (continued) | | | | | | |
| PERSONAL PRODUCTS - 0.6% | | | | | | |
Nu Skin Enterprises Cl. A 2,3 | | 161,310 | | | $ | 7,049,247 |
| |
| Total (Cost $24,078,392) | | | | | | 26,791,516 |
| |
| | | | | | | |
| ENERGY – 3.6% | | | | | | |
| ENERGY EQUIPMENT & SERVICES - 3.2% | | | | | | |
Cal Dive International 1,4 | | 276,250 | | | | 19,337 |
CARBO Ceramics 2,3 | | 63,000 | | | | 2,523,150 |
Ensign Energy Services | | 134,000 | | | | 1,176,450 |
Helmerich & Payne | | 49,710 | | | | 3,351,448 |
ION Geophysical 1 | | 361,500 | | | | 994,125 |
Oil States International 1 | | 48,713 | | | | 2,382,066 |
Pason Systems | | 359,480 | | | | 6,773,125 |
SEACOR Holdings 1 | | 141,092 | | | | 10,414,001 |
Steel Excel 1,4 | | 156,880 | | | | 3,922,000 |
TGS-NOPEC Geophysical | | 125,070 | | | | 2,706,057 |
Tidewater | | 24,000 | | | | 777,840 |
Trican Well Service | | 45,200 | | | | 216,702 |
Unit Corporation 1 | | 116,000 | | | | 3,955,600 |
| | | | | | |
| | | | | | | 39,211,901 |
| | | | | | |
| OIL, GAS & CONSUMABLE FUELS - 0.4% | | | | | | |
Contango Oil & Gas 1 | | 7,000 | | | | 204,680 |
Green Plains | | 19,000 | | | | 470,820 |
Harvest Natural Resources 1 | | 13,000 | | | | 23,530 |
†Permian Basin Royalty Trust | | 276,000 | | | | 2,635,800 |
Resolute Energy 1,2,3 | | 273,134 | | | | 360,537 |
World Fuel Services | | 16,600 | | | | 779,038 |
WPX Energy 1 | | 110,000 | | | | 1,279,300 |
| | | | | | |
| | | | | | | 5,753,705 |
| |
| Total (Cost $58,282,707) | | | | | | 44,965,606 |
| |
| | | | | | | |
| FINANCIALS – 15.7% | | | | | | |
| BANKS - 2.2% | | | | | | |
Bank of N.T. Butterfield & Son | | 1,784,161 | | | | 3,550,480 |
BCB Holdings 1 | | 209,426 | | | | 39,169 |
Farmers & Merchants Bank of Long Beach 4 | | 1,200 | | | | 7,219,200 |
Fauquier Bankshares | | 160,800 | | | | 3,035,904 |
First Citizens BancShares Cl. A 2 | | 29,026 | | | | 7,337,483 |
Mechanics Bank 4 | | 200 | | | | 5,200,000 |
| | | | | | |
| | | | | | | 26,382,236 |
| | | | | | |
| CAPITAL MARKETS - 7.2% | | | | | | |
AllianceBernstein Holding L.P. | | 102,000 | | | | 2,634,660 |
Artisan Partners Asset Management Cl. A | | 86,960 | | | | 4,394,089 |
ASA Gold and Precious Metals | | 346,821 | | | | 3,506,360 |
Ashmore Group | | 899,800 | | | | 3,901,073 |
Aurelius | | 9,300 | | | | 354,084 |
†CETIP - Mercados Organizados | | 430,000 | | | | 5,207,767 |
Cowen Group 1 | | 731,158 | | | | 3,509,558 |
†Dundee Corporation Cl. A 1 | | 182,800 | | | | 2,015,552 |
Eaton Vance 2 | | 40,500 | | | | 1,657,665 |
Edmond de Rothschild (Suisse) | | 123 | | | | 1,889,786 |
Federated Investors Cl. B | | 308,400 | | | | 10,155,612 |
GAMCO Investors Cl. A | | 20,200 | | | | 1,796,588 |
Jupiter Fund Management | | 230,000 | | | | 1,291,266 |
Lazard Cl. A | | 105,775 | | | | 5,291,923 |
†Medley Management Cl. A | | 105,300 | | | | 1,547,910 |
MVC Capital | | 324,200 | | | | 3,186,886 |
†Newtek Business Services 1 | | 86,100 | | | | 1,270,836 |
Paris Orleans | | 346,893 | | | | 7,464,488 |
Qalaa Holdings 1 | | 11,799,921 | | | | 4,736,439 |
†RCS Capital Cl. A 2,3 | | 9,500 | | | | 116,280 |
RHJ International 1 | | 440,000 | | | | 2,457,848 |
SEI Investments | | 225,675 | | | | 9,036,027 |
Sprott | | 590,000 | | | | 1,239,112 |
U.S. Global Investors Cl. A | | 661,751 | | | | 2,051,428 |
Value Partners Group | | 6,703,000 | | | | 5,598,185 |
†Virtus Investment Partners | | 7,040 | | | | 1,200,250 |
Westwood Holdings Group | | 23,460 | | | | 1,450,297 |
| | | | | | |
| | | | | | | 88,961,969 |
| | | | | | |
| CONSUMER FINANCE - 0.2% | | | | | | |
EZCORP Cl. A 1 | | 211,000 | | | | 2,479,250 |
| | | | | | |
| DIVERSIFIED FINANCIAL SERVICES - 1.2% | | | | | | |
Banca Finnat Euramerica | | 1,060,000 | | | | 518,149 |
HF2 Financial Management Cl. A 1 | | 292,300 | | | | 3,031,151 |
MarketAxess Holdings | | 100,000 | | | | 7,171,000 |
PICO Holdings 1 | | 100,400 | | | | 1,892,540 |
Sofina | | 19,698 | | | | 2,070,466 |
| | | | | | |
| | | | | | | 14,683,306 |
| | | | | | |
| INSURANCE - 2.0% | | | | | | |
Alleghany Corporation 1 | | 6,149 | | | | 2,850,061 |
E-L Financial | | 16,500 | | | | 9,700,034 |
Erie Indemnity Cl. A | | 25,000 | | | | 2,269,250 |
Greenlight Capital Re Cl. A 1 | | 21,061 | | | | 687,642 |
Independence Holding Company | | 349,423 | | | | 4,874,451 |
Lancashire Holdings | | 115,000 | | | | 996,751 |
Primerica | | 53,000 | | | | 2,875,780 |
ProAssurance Corporation | | 17,139 | | | | 773,826 |
| | | | | | |
| | | | | | | 25,027,795 |
| | | | | | |
| INVESTMENT COMPANIES - 0.2% | | | | | | |
RIT Capital Partners | | 121,500 | | | | 2,645,335 |
| | | | | | |
| REAL ESTATE INVESTMENT TRUSTS (REITS) - 0.2% | | | | | | |
†OUTFRONT Media | | 95,339 | | | | 2,558,899 |
| | | | | | |
| REAL ESTATE MANAGEMENT & DEVELOPMENT - 1.9% | | | | | | |
Altisource Portfolio Solutions 1,2,3 | | 9,000 | | | | 304,110 |
Brasil Brokers Participacoes | | 91,400 | | | | 86,923 |
Consolidated-Tomoka Land | | 42,868 | | | | 2,392,034 |
E-House (China) Holdings ADR 2,3 | | 155,700 | | | | 1,127,268 |
Forestar Group 1 | | 102,000 | | | | 1,570,800 |
Hopefluent Group Holdings | | 850,000 | | | | 263,796 |
Kennedy-Wilson Holdings | | 101,300 | | | | 2,562,890 |
Midland Holdings 1 | | 2,500,000 | | | | 1,263,119 |
St. Joe Company (The) 1,2,3 | | 197,000 | | | | 3,622,830 |
Tejon Ranch 1 | | 342,600 | | | | 10,092,996 |
Tejon Ranch (Warrants) 1 | | 96,561 | | | | 168,982 |
| | | | | | |
| | | | | | | 23,455,748 |
| | | | | | |
| THRIFTS & MORTGAGE FINANCE - 0.6% | | | | | | |
†Genworth MI Canada | | 69,755 | | | | 2,220,296 |
Timberland Bancorp 5 | | 444,200 | | | | 4,708,520 |
Vestin Realty Mortgage II 1 | | 53,557 | | | | 200,839 |
| | | | | | |
| | | | | | | 7,129,655 |
| |
| Total (Cost $173,324,236) | | | | | | 193,324,193 |
| |
| | | | | | | |
| HEALTH CARE – 5.9% | | | | | | |
| BIOTECHNOLOGY - 0.5% | | | | | | |
ARIAD Pharmaceuticals 1,2,3 | | 185,250 | | | | 1,272,667 |
ArQule 1 | | 130,000 | | | | 158,600 |
Coronado Biosciences 1 | | 170,000 | | | | 414,800 |
| 16 | 2014 Annual Report to Stockholders | THE ACCOMPANYING NOTES ARE AN INTEGRAL PART OF THESE FINANCIAL STATEMENTS |
| |
| Schedule of Investments (continued) | | | | | | |
| | | SHARES | | | | VALUE |
| |
| | | | | | | |
| HEALTH CARE (continued) | | | | | | |
| BIOTECHNOLOGY (continued) | | | | | | |
Genomic Health 1 | | 33,000 | | | $ | 1,055,010 |
Green Cross | | 6,000 | | | | 745,925 |
†Kite Pharma 1,2,3 | | 800 | | | | 46,136 |
Myriad Genetics 1,2,3 | | 78,093 | | | | 2,659,848 |
Rigel Pharmaceuticals 1 | | 63,000 | | | | 143,010 |
| | | | | | |
| | | | | | | 6,495,996 |
| | | | | | |
| HEALTH CARE EQUIPMENT & SUPPLIES - 2.4% | | | | | | |
Allied Healthcare Products 1 | | 63,225 | | | | 116,334 |
Analogic Corporation | | 38,135 | | | | 3,226,602 |
AngioDynamics 1,2 | | 67,028 | | | | 1,274,202 |
Atrion Corporation 2,3 | | 17,079 | | | | 5,807,031 |
bioMerieux | | 7,000 | | | | 725,636 |
Cerus Corporation 1 | | 240,000 | | | | 1,497,600 |
CONMED Corporation | | 81,500 | | | | 3,664,240 |
DENTSPLY International | | 21,618 | | | | 1,151,591 |
Derma Sciences 1 | | 87,142 | | | | 811,292 |
DiaSorin | | 32,500 | | | | 1,310,641 |
IDEXX Laboratories 1,2,3 | | 57,411 | | | | 8,512,329 |
Invacare Corporation | | 61,200 | | | | 1,025,712 |
Synergetics USA 1,2 | | 123,565 | | | | 537,508 |
| | | | | | |
| | | | | | | 29,660,718 |
| | | | | | |
| HEALTH CARE PROVIDERS & SERVICES - 0.4% | | | | | | |
†Addus HomeCare 1 | | 49,000 | | | | 1,189,230 |
†Bio-Reference Laboratories 1,2 | | 12,000 | | | | 385,560 |
Landauer | | 50,000 | | | | 1,707,000 |
MWI Veterinary Supply 1 | | 10,000 | | | | 1,699,100 |
| | | | | | |
| | | | | | | 4,980,890 |
| | | | | | |
| HEALTH CARE TECHNOLOGY - 0.2% | | | | | | |
Medidata Solutions 1 | | 40,000 | | | | 1,910,000 |
| | | | | | |
| LIFE SCIENCES TOOLS & SERVICES - 1.4% | | | | | | |
Bio-Rad Laboratories Cl. A 1 | | 19,048 | | | | 2,296,427 |
Bio-Techne | | 37,843 | | | | 3,496,693 |
PAREXEL International 1 | | 165,800 | | | | 9,211,848 |
PerkinElmer | | 39,000 | | | | 1,705,470 |
| | | | | | |
| | | | | | | 16,710,438 |
| | | | | | |
| PHARMACEUTICALS - 1.0% | | | | | | |
Adcock Ingram Holdings 1 | | 28,300 | | | | 119,536 |
Boiron | | 10,000 | | | | 843,751 |
†Lannett Company 1 | | 46,050 | | | | 1,974,624 |
Medicines Company (The) 1 | | 147,518 | | | | 4,081,823 |
†Repros Therapeutics 1 | | 122,000 | | | | 1,216,340 |
Santen Pharmaceutical | | 20,000 | | | | 1,070,318 |
Stallergenes | | 18,000 | | | | 1,077,235 |
†Theravance Biopharma 1 | | 83,000 | | | | 1,238,360 |
Vetoquinol | | 25,000 | | | | 1,085,951 |
| | | | | | |
| | | | | | | 12,707,938 |
| |
| Total (Cost $44,198,051) | | | | | | 72,465,980 |
| |
| | | | | | | |
| INDUSTRIALS – 29.9% | | | | | | |
| AEROSPACE & DEFENSE - 2.3% | | | | | | |
Curtiss-Wright | | 6,550 | | | | 462,365 |
Ducommun 1 | | 117,200 | | | | 2,962,816 |
HEICO Corporation | | 236,638 | | | | 14,292,935 |
HEICO Corporation Cl. A | | 80,808 | | | | 3,827,067 |
Hexcel Corporation 1 | | 47,500 | | | | 1,970,775 |
Magellan Aerospace | | 117,700 | | | | 1,369,688 |
Moog Cl. A 1 | | 25,000 | | | | 1,850,750 |
Teledyne Technologies 1 | | 20,600 | | | | 2,116,444 |
| | | | | | |
| | | | | | | 28,852,840 |
| | | | | | |
| AIR FREIGHT & LOGISTICS - 2.7% | | | | | | |
Expeditors International of Washington | | 158,900 | | | | 7,088,529 |
Forward Air | | 209,750 | | | | 10,565,108 |
Hub Group Cl. A 1,2 | | 149,400 | | | | 5,689,152 |
UTi Worldwide 1 | | 635,400 | | | | 7,669,278 |
†XPO Logistics 1 | | 50,000 | | | | 2,044,000 |
| | | | | | |
| | | | | | | 33,056,067 |
| | | | | | |
| BUILDING PRODUCTS - 1.2% | | | | | | |
American Woodmark 1 | | 117,135 | | | | 4,736,939 |
Burnham Holdings Cl. B 4 | | 36,000 | | | | 720,000 |
Simpson Manufacturing | | 275,300 | | | | 9,525,380 |
| | | | | | |
| | | | | | | 14,982,319 |
| | | | | | |
| COMMERCIAL SERVICES & SUPPLIES - 2.3% | | | | | | |
Brady Corporation Cl. A | | 45,900 | | | | 1,254,906 |
CompX International Cl. A | | 211,100 | | | | 2,490,980 |
Copart 1 | | 178,360 | | | | 6,508,356 |
Heritage-Crystal Clean 1 | | 102,527 | | | | 1,264,158 |
Intersections 2,3 | | 71,100 | | | | 278,001 |
Kaba Holding | | 2,400 | | | | 1,210,160 |
Kimball International Cl. B | | 376,880 | | | | 3,437,146 |
Ritchie Bros. Auctioneers | | 438,324 | | | | 11,786,532 |
Societe BIC | | 1,500 | | | | 199,071 |
| | | | | | |
| | | | | | | 28,429,310 |
| | | | | | |
| CONSTRUCTION & ENGINEERING - 2.4% | | | | | | |
EMCOR Group 2,3 | | 149,400 | | | | 6,646,806 |
Integrated Electrical Services 1 | | 677,482 | | | | 5,284,360 |
Jacobs Engineering Group 1,2,3 | | 174,900 | | | | 7,816,281 |
KBR | | 438,192 | | | | 7,427,354 |
†Sterling Construction 1 | | 326,671 | | | | 2,087,428 |
| | | | | | |
| | | | | | | 29,262,229 |
| | | | | | |
| ELECTRICAL EQUIPMENT - 2.5% | | | | | | |
Elektrobudowa | | 20,000 | | | | 416,901 |
EnerSys | | 40,155 | | | | 2,478,366 |
Franklin Electric | | 209,200 | | | | 7,851,276 |
Global Power Equipment Group | | 253,389 | | | | 3,499,302 |
GrafTech International 1 | | 1,046,603 | | | | 5,295,811 |
Powell Industries | | 94,500 | | | | 4,637,115 |
Preformed Line Products | | 91,600 | | | | 5,004,108 |
Vicor 1 | | 104,808 | | | | 1,268,177 |
| | | | | | |
| | | | | | | 30,451,056 |
| | | | | | |
| INDUSTRIAL CONGLOMERATES - 1.0% | | | | | | |
Carlisle Companies 2 | | 28,615 | | | | 2,582,218 |
†Dogan Sirketler Grubu Holding 1 | | 4,727,500 | | | | 1,536,889 |
†Hopewell Holdings | | 1,040,000 | | | | 3,793,030 |
Raven Industries | | 192,400 | | | | 4,810,000 |
| | | | | | |
| | | | | | | 12,722,137 |
| | | | | | |
| MACHINERY - 9.3% | | | | | | |
Astec Industries | | 20,000 | | | | 786,200 |
Burckhardt Compression Holding | | 8,400 | | | | 3,216,128 |
CB Industrial Product Holding | | 136,800 | | | | 78,559 |
Chen Hsong Holdings | | 1,159,000 | | | | 304,273 |
CIRCOR International | | 50,262 | | | | 3,029,793 |
CLARCOR | | 92,500 | | | | 6,164,200 |
Columbus McKinnon | | 56,535 | | | | 1,585,241 |
Donaldson Company | | 193,559 | | | | 7,477,184 |
Eastern Company (The) | | 22,000 | | | | 377,300 |
| THE ACCOMPANYING NOTES ARE AN INTEGRAL PART OF THESE FINANCIAL STATEMENTS | 2014 Annual Report to Stockholders | 17 |
| |
| Schedule of Investments (continued) | | | | | | |
| | | SHARES | | | | VALUE |
| |
| | | | | | | |
| INDUSTRIALS (continued) | | | | | | |
| MACHINERY (continued) | | | | | | |
Graco | | 104,776 | | | $ | 8,400,940 |
Hurco Companies | | 45,952 | | | | 1,566,504 |
Hyster-Yale Materials Handling Cl. A | | 11,335 | | | | 829,722 |
IDEX Corporation | | 67,400 | | | | 5,246,416 |
John Bean Technologies | | 162,866 | | | | 5,351,777 |
Kennametal | | 191,100 | | | | 6,839,469 |
Lincoln Electric Holdings | | 46,360 | | | | 3,203,012 |
Lindsay Corporation 2,3 | | 45,000 | | | | 3,858,300 |
Lydall 1 | | 27,730 | | | | 910,099 |
Mueller Water Products Cl. A | | 33,600 | | | | 344,064 |
NN | | 197,100 | | | | 4,052,376 |
Nordson Corporation | | 24,296 | | | | 1,894,116 |
Pfeiffer Vacuum Technology | | 14,000 | | | | 1,162,111 |
PMFG 1 | | 378,352 | | | | 1,978,781 |
Rational | | 2,000 | | | | 628,589 |
RBC Bearings | | 53,200 | | | | 3,432,996 |
Rotork | | 18,000 | | | | 647,735 |
Semperit AG Holding | | 25,640 | | | | 1,240,722 |
Spirax-Sarco Engineering | | 19,500 | | | | 866,591 |
Sun Hydraulics | | 71,018 | | | | 2,796,689 |
Tecumseh Products 1 | | 46,700 | | | | 144,303 |
†Tennant Company | | 41,900 | | | | 3,023,923 |
Timken Company (The) | | 29,795 | | | | 1,271,651 |
Valmont Industries 2 | | 68,795 | | | | 8,736,965 |
Wabash National 1 | | 99,100 | | | | 1,224,876 |
WABCO Holdings 1 | | 43,400 | | | | 4,547,452 |
Wabtec Corporation | | 83,050 | | | | 7,216,214 |
Woodward | | 208,400 | | | | 10,259,532 |
| | | | | | |
| | | | | | | 114,694,803 |
| | | | | | |
| MARINE - 0.1% | | | | | | |
Kirby Corporation 1,2 | | 10,100 | | | | 815,474 |
| | | | | | |
| PROFESSIONAL SERVICES - 3.7% | | | | | | |
Acacia Research 2 | | 47,300 | | | | 801,262 |
Advisory Board (The) 1,2,3 | | 150,277 | | | | 7,360,568 |
CRA International 1 | | 3,910 | | | | 118,551 |
Exponent | | 12,700 | | | | 1,047,750 |
†Franklin Covey 1 | | 65,500 | | | | 1,268,080 |
Heidrick & Struggles International | | 76,480 | | | | 1,762,864 |
ICF International 1 | | 66,696 | | | | 2,733,202 |
†Insperity | | 105,000 | | | | 3,558,450 |
ManpowerGroup | | 98,658 | | | | 6,725,516 |
On Assignment 1 | | 334,995 | | | | 11,118,484 |
Robert Half International | | 16,942 | | | | 989,074 |
RPX Corporation 1 | | 30,500 | | | | 420,290 |
Towers Watson & Co. Cl. A | | 69,200 | | | | 7,831,364 |
Volt Information Sciences 1 | | 19,000 | | | | 203,870 |
| | | | | | |
| | | | | | | 45,939,325 |
| | | | | | |
| ROAD & RAIL - 1.6% | | | | | | |
FRP Holdings 1 | | 212,958 | | | | 8,350,084 |
†Genesee & Wyoming Cl. A 1 | | 20,000 | | | | 1,798,400 |
Landstar System | | 99,400 | | | | 7,209,482 |
Trancom | | 8,000 | | | | 322,258 |
Universal Truckload Services | | 78,916 | | | | 2,249,895 |
| | | | | | |
| | | | | | | 19,930,119 |
| | | | | | |
| TRADING COMPANIES & DISTRIBUTORS - 0.7% | | | | | | |
Aceto Corporation | | 61,475 | | | | 1,334,008 |
Kloeckner & Co 1 | | 31,300 | | | | 337,317 |
MISUMI Group | | 36,200 | | | | 1,189,075 |
MSC Industrial Direct Cl. A 2 | | 65,833 | | | $ | 5,348,931 |
| | | | | | |
| | | | | | | 8,209,331 |
| | | | | | |
| TRANSPORTATION INFRASTRUCTURE - 0.1% | | | | | | |
Wesco Aircraft Holdings 1 | | 68,400 | | | | 956,232 |
| |
| Total (Cost $216,941,192) | | | | | | 368,301,242 |
| |
| | | | | | | |
| INFORMATION TECHNOLOGY – 20.6% | | | | | | |
| COMMUNICATIONS EQUIPMENT - 0.9% | | | | | | |
ADTRAN | | 345,428 | | | | 7,530,330 |
Bel Fuse Cl. B | | 30,238 | | | | 826,707 |
Comba Telecom Systems Holdings | | 1,035,290 | | | | 366,306 |
Comtech Telecommunications | | 44,200 | | | | 1,393,184 |
Ellies Holdings 1 | | 643,300 | | | | 72,099 |
EVS Broadcast Equipment | | 15,000 | | | | 541,946 |
UTStarcom Holdings 1 | | 59,900 | | | | 169,517 |
| | | | | | |
| | | | | | | 10,900,089 |
| | | | | | |
| ELECTRONIC EQUIPMENT, INSTRUMENTS & COMPONENTS - 9.7% | | | | | | |
Agilysys 1 | | 165,125 | | | | 2,078,924 |
Anixter International 1,2 | | 70,895 | | | | 6,271,372 |
Avnet | | 16,400 | | | | 705,528 |
AVX Corporation | | 44,600 | | | | 624,400 |
Benchmark Electronics 1 | | 221,900 | | | | 5,645,136 |
Cognex Corporation 1 | | 69,800 | | | | 2,884,834 |
Coherent 1 | | 164,376 | | | | 9,980,911 |
Dolby Laboratories Cl. A | | 80,200 | | | | 3,458,224 |
Domino Printing Sciences | | 95,000 | | | | 971,017 |
DTS 1 | | 207,000 | | | | 6,365,250 |
FEI Company | | 82,100 | | | | 7,417,735 |
FLIR Systems | | 262,600 | | | | 8,484,606 |
GSI Group 1 | | 51,000 | | | | 750,720 |
Hollysys Automation Technologies 1 | | 44,582 | | | | 1,089,138 |
IPG Photonics 1,2,3 | | 68,380 | | | | 5,123,030 |
†Kimball Electronics 1 | | 214,635 | | | | 2,579,913 |
†LRAD Corporation 1 | | 548,244 | | | | 1,480,259 |
National Instruments | | 251,850 | | | | 7,830,016 |
Newport Corporation 1 | | 570,200 | | | | 10,896,522 |
Oxford Instruments | | 8,000 | | | | 158,026 |
PC Connection | | 16,301 | | | | 400,189 |
Perceptron | | 357,700 | | | | 3,559,115 |
Plexus Corporation 1 | | 176,100 | | | | 7,257,081 |
Richardson Electronics | | 573,732 | | | | 5,737,320 |
Rofin-Sinar Technologies 1 | | 252,281 | | | | 7,258,124 |
Rogers Corporation 1 | | 57,066 | | | | 4,647,455 |
TTM Technologies 1,2 | | 496,400 | | | | 3,737,892 |
Vaisala Cl. A | | 30,320 | | | | 804,129 |
Vishay Precision Group 1 | | 74,826 | | | | 1,284,014 |
| | | | | | |
| | | | | | | 119,480,880 |
| | | | | | |
| INTERNET SOFTWARE & SERVICES - 1.6% | | | | | | |
†Care.com 1 | | 298,900 | | | | 2,474,892 |
Cimpress 1,2 | | 24,000 | | | | 1,796,160 |
†Frontier Services Group 1 | | 8,147,000 | | | | 1,164,194 |
j2 Global | | 42,960 | | | | 2,663,520 |
QuinStreet 1 | | 508,132 | | | | 3,084,361 |
RealNetworks 1 | | 376,750 | | | | 2,652,320 |
Spark Networks 1,2,3 | | 107,000 | | | | 384,130 |
Support.com 1 | | 1,452,099 | | | | 3,063,929 |
†Textura Corporation 1,2,3 | | 55,800 | | | | 1,588,626 |
| 18 | 2014 Annual Report to Stockholders | THE ACCOMPANYING NOTES ARE AN INTEGRAL PART OF THESE FINANCIAL STATEMENTS |
| |
| Schedule of Investments (continued) | | | | | | |
| | | SHARES | | | | VALUE |
| |
| | | | | | | |
| INFORMATION TECHNOLOGY (continued) | | | | | | |
| INTERNET SOFTWARE & SERVICES (continued) | | | | | | |
United Online 1 | | 59,771 | | | $ | 869,668 |
| | | | | | |
| | | | | | | 19,741,800 |
| | | | | | |
| IT SERVICES - 2.8% | | | | | | |
Computer Task Group | | 105,000 | | | | 1,000,650 |
Convergys Corporation | | 121,000 | | | | 2,464,770 |
eClerx Services | | 35,000 | | | | 723,647 |
Hackett Group (The) | | 1,270,596 | | | | 11,168,539 |
Innodata 1 | | 314,314 | | | | 917,797 |
MAXIMUS | | 179,000 | | | | 9,816,360 |
Metrofile Holdings | | 2,311,228 | | | | 998,290 |
MoneyGram International 1 | | 75,000 | | | | 681,750 |
NeuStar Cl. A 1 | | 29,287 | | | | 814,179 |
Sykes Enterprises 1 | | 142,584 | | | | 3,346,446 |
Unisys Corporation 1 | | 94,000 | | | | 2,771,120 |
| | | | | | |
| | | | | | | 34,703,548 |
| | | | | | |
| SEMICONDUCTORS & SEMICONDUCTOR EQUIPMENT - 3.0% | | | | | | |
Advanced Energy Industries 1 | | 35,000 | | | | 829,500 |
†Amtech Systems 1 | | 142,571 | | | | 1,447,096 |
Brooks Automation | | 128,000 | | | | 1,632,000 |
Cabot Microelectronics 1 | | 13,734 | | | | 649,893 |
CEVA 1 | | 58,000 | | | | 1,052,120 |
Cirrus Logic 1 | | 20,201 | | | | 476,138 |
Diodes 1 | | 260,850 | | | | 7,191,634 |
Entropic Communications 1 | | 105,000 | | | | 265,650 |
Exar Corporation 1 | | 157,576 | | | | 1,607,275 |
Fairchild Semiconductor International 1 | | 124,000 | | | | 2,093,120 |
Integrated Silicon Solution | | 148,955 | | | | 2,468,184 |
Kopin Corporation 1 | | 282,200 | | | | 1,021,564 |
Microsemi Corporation 1 | | 25,000 | | | | 709,500 |
MKS Instruments | | 103,620 | | | | 3,792,492 |
†MoSys 1,2 | | 337,000 | | | | 630,190 |
Nanometrics 1 | | 142,590 | | | | 2,398,364 |
Photronics 1 | | 143,700 | | | | 1,194,147 |
Silicon Image 1 | | 115,000 | | | | 634,800 |
STR Holdings 1 | | 90,000 | | | | 123,300 |
Teradyne | | 228,000 | | | | 4,512,120 |
Tessera Technologies | | 22,235 | | | | 795,124 |
Veeco Instruments 1,2 | | 42,000 | | | | 1,464,960 |
| | | | | | |
| | | | | | | 36,989,171 |
| | | | | | |
| SOFTWARE - 1.6% | | | | | | |
American Software Cl. A | | 165,990 | | | | 1,512,169 |
ANSYS 1,2,3 | | 95,000 | | | | 7,790,000 |
Aspen Technology 1 | | 42,100 | | | | 1,474,342 |
Blackbaud | | 31,400 | | | | 1,358,364 |
†BroadSoft 1 | | 40,000 | | | | 1,160,800 |
Computer Modelling Group | | 20,000 | | | | 205,543 |
Envivio 1 | | 292,532 | | | | 391,993 |
ePlus 1 | | 17,200 | | | | 1,301,868 |
Mentor Graphics | | 71,493 | | | | 1,567,127 |
SeaChange International 1 | | 353,369 | | | | 2,254,494 |
SimCorp | | 18,000 | | | | 475,204 |
TeleNav 1 | | 24,197 | | | | 161,394 |
| | | | | | |
| | | | | | | 19,653,298 |
| | | | | | |
| TECHNOLOGY HARDWARE, STORAGE & PERIPHERALS - 1.0% | | | | | | |
Avid Technology 1 | | 38,000 | | | | 539,980 |
BlackBerry 1,2,3 | | 10,000 | | | | 109,800 |
Diebold 2,3 | | 230,300 | | | | 7,977,592 |
Intevac 1 | | 188,800 | | | | 1,466,976 |
Silicon Graphics International 1 | | 133,500 | | | | 1,519,230 |
Western Digital 2 | | 7,290 | | | | 807,003 |
| | | | | | |
| | | | | | | 12,420,581 |
| |
| Total (Cost $184,774,817) | | | | | | 253,889,367 |
| |
| | | | | | | |
| MATERIALS – 7.5% | | | | | | |
| CHEMICALS - 2.2% | | | | | | |
Cabot Corporation | | 13,709 | | | | 601,277 |
†FutureFuel Corporation | | 94,000 | | | | 1,223,880 |
Hawkins | | 86,178 | | | | 3,734,093 |
Innospec | | 94,378 | | | | 4,029,941 |
KMG Chemicals | | 71,700 | | | | 1,434,000 |
Minerals Technologies | | 63,123 | | | | 4,383,892 |
OM Group | | 28,185 | | | | 839,913 |
Quaker Chemical | | 36,479 | | | | 3,357,527 |
†Umicore | | 176,000 | | | | 7,088,770 |
| | | | | | |
| | | | | | | 26,693,293 |
| | | | | | |
| CONSTRUCTION MATERIALS - 0.9% | | | | | | |
Ash Grove Cement Cl. B 4 | | 50,518 | | | | 10,179,377 |
Mardin Cimento Sanayii | | 491,700 | | | | 999,849 |
| | | | | | |
| | | | | | | 11,179,226 |
| | | | | | |
| CONTAINERS & PACKAGING - 0.8% | | | | | | |
Greif Cl. A | | 112,344 | | | | 5,306,007 |
Mayr-Melnhof Karton | | 44,000 | | | | 4,566,110 |
| | | | | | |
| | | | | | | 9,872,117 |
| | | | | | |
| METALS & MINING - 3.4% | | | | | | |
AuRico Gold | | 132,000 | | | | 432,960 |
Centerra Gold | | 160,000 | | | | 831,813 |
Central Steel & Wire 4 | | 4,862 | | | | 3,633,129 |
Exeter Resource 1 | | 475,000 | | | | 280,108 |
Fresnillo | | 22,500 | | | | 267,003 |
Gold Fields ADR | | 865,000 | | | | 3,918,450 |
Haynes International | | 23,000 | | | | 1,115,500 |
Hecla Mining | | 660,000 | | | | 1,841,400 |
IAMGOLD Corporation 1 | | 510,000 | | | | 1,377,000 |
Imdex 1 | | 1,591,766 | | | | 617,134 |
Kirkland Lake Gold 1 | | 90,000 | | | | 259,511 |
†Lundin Mining 1 | | 640,000 | | | | 3,150,973 |
Maharashtra Seamless | | 150,000 | | | | 567,216 |
Major Drilling Group International | | 380,973 | | | | 1,872,401 |
Medusa Mining 1 | | 75,600 | | | | 40,230 |
Pan American Silver | | 130,430 | | | | 1,199,956 |
Pretium Resources 1 | | 246,000 | | | | 1,420,778 |
Reliance Steel & Aluminum | | 158,760 | | | | 9,727,225 |
Saracen Mineral Holdings 1 | | 237,072 | | | | 49,468 |
†Seabridge Gold 1 | | 282,000 | | | | 2,129,100 |
Synalloy Corporation | | 178,800 | | | | 3,148,668 |
Victoria Gold 1 | | 550,000 | | | | 52,074 |
Vista Gold 1 | | 124,000 | | | | 35,352 |
Worthington Industries | | 148,000 | | | | 4,453,320 |
| | | | | | |
| | | | | | | 42,420,769 |
| | | | | | |
| PAPER & FOREST PRODUCTS - 0.2% | | | | | | |
Glatfelter | | 28,400 | | | | 726,188 |
Qunxing Paper Holdings 1,6 | | 3,296,000 | | | | 42,504 |
Schweitzer-Mauduit International | | 30,238 | | | | 1,279,067 |
| | | | | | |
| | | | | | | 2,047,759 |
| |
| Total (Cost $78,777,226) | | | | | | 92,213,164 |
| |
| THE ACCOMPANYING NOTES ARE AN INTEGRAL PART OF THESE FINANCIAL STATEMENTS | 2014 Annual Report to Stockholders | 19 |
| Royce Value Trust | December 31, 2014 |
| |
| Schedule of Investments (continued) | | | | | | |
| | | SHARES | | | | VALUE |
| |
| | | | | | | |
| TELECOMMUNICATION SERVICES – 0.7% | | | | | | |
| WIRELESS TELECOMMUNICATION SERVICES - 0.7% | | | | | | |
Spok Holdings | | 31,300 | | | $ | 543,368 |
Telephone and Data Systems | | 348,270 | | | | 8,793,818 |
| |
| Total (Cost $8,979,901) | | | | | | 9,337,186 |
| |
| | | | | | | |
| MISCELLANEOUS7 – 4.9% | | | | | | |
| |
| Total (Cost $59,802,486) | | | | | | 60,190,696 |
| |
| | | | | | | |
| TOTAL COMMON STOCKS | | | | | | |
| |
| (Cost $970,752,238) | | | | | | 1,266,956,771 |
| |
| | | | | | | |
| PREFERRED STOCK - 0.1% | | | | | | |
Seneca Foods Conv. 1,6 | | 50,000 | | | | 1,216,350 |
| |
(Cost $724,063) | | | | | | 1,216,350 |
| |
| | | | | | | |
| REPURCHASE AGREEMENT – 2.4% | | | | | | |
| Fixed Income Clearing Corporation, 0.00% dated 12/31/14, due 1/2/15, maturity value $29,555,000 (collateralized by obligations of various U.S. Government Agencies, 1.06% due 10/12/17, valued at $30,148,500) |
| |
| (Cost $29,555,000) | | | | | | 29,555,000 |
| |
| | | | | | | |
| TOTAL INVESTMENTS – 105.3% | | | | | | |
| |
| (Cost $1,001,031,301) | | | | | | 1,297,728,121 |
| |
| | | | | | | |
| LIABILITIES LESS CASH AND OTHER ASSETS – (5.3)% | | | | | | (65,773,483) |
| | | | | | |
| | | | | | | |
| |
| NET ASSETS – 100.0% | | | | | $ | 1,231,954,638 |
| |
| |
| † | New additions in 2014. |
| 1 | Non-income producing. |
| 2 | All or a portion of these securities were pledged as collateral in connection with the revolving credit agreement at December 31, 2014. Total market value of pledged securities at December 31, 2014, was $129,449,869. |
| 3 | At December 31, 2014, a portion of these securities were rehypothecated in connection with the Fund’s revolving credit agreement in the aggregate amount of $65,826,540. |
| 4 | These securities are defined as Level 2 securities due to fair value being based on quoted prices for similar securities. See Notes to Financial Statements. |
| 5 | At December 31, 2014, the Fund owned 5% or more of the Company’s outstanding voting securities thereby making the Company an Affiliated Company as that term is defined in the Investment Company Act of 1940. See Notes to Financial Statements. |
| 6 | Securities for which market quotations are not readily available represent 0.1% of net assets. These securities have been valued at their fair value under procedures approved by the Fund’s Board of Directors. These securities are defined as Level 3 securities due to the use of significant unobservable inputs in the determination of fair value. See Notes to Financial Statements. |
| 7 | Includes securities first acquired in 2014 and less than 1% of net assets. |
| | |
| | Bold indicates the Fund’s 20 largest equity holdings in terms of December 31, 2014, market value. |
| | |
| | TAX INFORMATION: The cost of total investments for Federal income tax purposes was $1,002,051,873. At December 31, 2014, net unrealized appreciation for all securities was $295,676,248, consisting of aggregate gross unrealized appreciation of $372,999,155 and aggregate gross unrealized depreciation of $77,322,907. The primary difference between book and tax basis cost is the timing of the recognition of losses on securities sold. |
| |
| 20 | 2014 Annual Report to Stockholders | THE ACCOMPANYING NOTES ARE AN INTEGRAL PART OF THESE FINANCIAL STATEMENTS |
| Royce Value Trust | | December 31, 2014 |
| | | |
| | | |
| |
| Statement of Assets and Liabilities | | |
ASSETS:
Investments at value | | | | |
| |
Non-Affiliated Companies (cost $963,292,576) | | $ | 1,260,691,077 | |
| |
Affiliated Companies (cost $8,183,725) | | | 7,482,044 | |
| |
| Total investments at value | | | 1,268,173,121 | |
| |
| Repurchase agreements (at cost and value) | | | 29,555,000 | |
| |
| Cash and foreign currency | | | 125,821 | |
| |
| Receivable for investments sold | | | 6,523,614 | |
| |
| Receivable for dividends and interest | | | 1,041,165 | |
| |
| Prepaid expenses and other assets | | | 497,204 | |
| |
| Total Assets | | | 1,305,915,925 | |
| |
LIABILITIES:
Revolving credit agreement | | | 70,000,000 | |
| |
| Payable for investments purchased | | | 2,955,646 | |
| |
| Payable for investment advisory fee | | | 482,515 | |
| |
| Payable for directors’ fees | | | 43,955 | |
| |
| Payable for interest expense | | | 4,623 | |
| |
| Accrued expenses | | | 233,712 | |
| |
| Deferred capital gains tax | | | 240,836 | |
| |
| Total Liabilities | | | 73,961,287 | |
| |
| Net Assets | | $ | 1,231,954,638 | |
| |
| ANALYSIS OF NET ASSETS: | | | | |
| |
| Paid-in capital - $0.001 par value per share; 75,868,548 shares outstanding (150,000,000 shares authorized) | | $ | 887,979,480 | |
| |
| Undistributed net investment income (loss) | | | 2,286,303 | |
| |
| Accumulated net realized gain (loss) on investments and foreign currency | | | 45,251,984 | |
| |
| Net unrealized appreciation (depreciation) on investments and foreign currency | | | 296,436,871 | |
| |
| Net Assets (net asset value per share - $16.24) | | $ | 1,231,954,638 | |
| |
| Investments at identified cost | | $ | 971,476,301 | |
| |
| THE ACCOMPANYING NOTES ARE AN INTEGRAL PART OF THESE FINANCIAL STATEMENTS | 2014 Annual Report to Stockholders | 21 |
| Royce Value Trust | | Year Ended December 31, 2014 |
| | | |
| | | |
| |
| Statement of Operations | | |
| INVESTMENT INCOME: | | | | |
| | | | | |
INCOME:
Dividends | | | | |
Non-Affiliated Companies | | $ | 16,916,493 | |
| |
Affiliated Companies | | | 79,956 | |
| |
| Foreign withholding tax | | | (486,916 | ) |
| |
| Interest | | | 34,754 | |
| |
| Rehypothecation income | | | 332,075 | |
| |
| Securities lending | | | 7,320 | |
| |
| Total income | | | 16,883,682 | |
| |
| EXPENSES: | | | | |
| |
| Investment advisory fees | | | 5,791,677 | |
| |
| Interest expense | | | 772,938 | |
| |
| Stockholder reports | | | 421,365 | |
| |
| Custody and transfer agent fees | | | 261,357 | |
| |
| Directors’ fees | | | 159,539 | |
| |
| Administrative and office facilities | | | 145,403 | |
| |
| Professional fees | | | 84,114 | |
| |
| Other expenses | | | 123,321 | |
| |
| Total expenses | | | 7,759,714 | |
| |
| Compensating balance credits | | | (9 | ) |
| |
| Net expenses | | | 7,759,705 | |
| |
| Net investment income (loss) | | | 9,123,977 | |
| |
REALIZED AND UNREALIZED GAIN (LOSS) ON INVESTMENTS AND FOREIGN CURRENCY:
| | | | |
| | | | | |
| NET REALIZED GAIN (LOSS): | | | | |
| |
| Investments | | | 131,095,322 | |
| |
| Foreign currency transactions | | | (140,661 | ) |
| |
| Net realized foreign capital gains tax | | | (99,135 | ) |
| |
| NET CHANGE IN UNREALIZED APPRECIATION (DEPRECIATION): | | | | |
| |
| Investments and foreign currency translations | | | (140,123,494 | ) |
| |
| Net change in deferred foreign capital gain taxes on unrealized appreciation | | | (240,836 | ) |
| |
| Other assets and liabilities denominated in foreign currency | | | (24,644 | ) |
| |
| Net realized and unrealized gain (loss) on investments and foreign currency | | | (9,533,448 | ) |
| |
| NET INCREASE (DECREASE) IN NET ASSETS FROM INVESTMENT OPERATIONS | | $ | (409,471 | ) |
| |
| 22 | 2014 Annual Report to Stockholders | THE ACCOMPANYING NOTES ARE AN INTEGRAL PART OF THESE FINANCIAL STATEMENTS |
| Royce Value Trust | | |
| | | |
| | | |
| |
| Statement of Changes in Net Assets | | |
| | | YEAR ENDED 12/31/14 | | | YEAR ENDED 12/31/13 | |
| |
| | | | | | | | | |
INVESTMENT OPERATIONS:
Net investment income (loss) | | $ | 9,123,977 | | | $ | 8,567,535 | |
| |
| Net realized gain (loss) on investments and foreign currency | | | 130,855,526 | | | | 171,436,021 | |
| |
| Net change in unrealized appreciation (depreciation) on investments and foreign currency | | | (140,388,974 | ) | | | 191,177,592 | |
| |
| Net increase (decrease) in net assets from investment operations | | | (409,471 | ) | | | 371,181,148 | |
| |
DISTRIBUTIONS:
Net investment income | | | (10,008,114 | ) | | | (7,723,525 | ) |
| |
| Net realized gain on investments and foreign currency | | | (123,263,927 | ) | | | (148,307,278 | ) |
| |
| Total distributions | | | (133,272,041 | ) | | | (156,030,803 | ) |
| |
CAPITAL STOCK TRANSACTIONS:
Reinvestment of distributions | | | 57,806,861 | | | | 26,224,892 | |
| |
| Depreciation of securities contributed to Royce Global Value Trust spinoff | | | – | | | | (15,972,444 | ) |
| |
| Total capital stock transactions | | | 57,806,861 | | | | 10,252,448 | |
| |
| Net Increase (Decrease) In Net Assets | | | (75,874,651 | ) | | | 225,402,793 | |
| |
| NET ASSETS: | | | | | | | | |
| |
| Beginning of year | | | 1,307,829,289 | | | | 1,082,426,496 | |
| |
| End of year (including undistributed net investment income (loss) of $2,286,303 at 12/31/14 and $6,453,789 at 12/31/13) | | $ | 1,231,954,638 | | | $ | 1,307,829,289 | |
| |
| THE ACCOMPANYING NOTES ARE AN INTEGRAL PART OF THESE FINANCIAL STATEMENTS | 2014 Annual Report to Stockholders | 23 |
| Royce Value Trust | | December 31, 2014 |
| | | |
| | | |
| |
| Statement of Cash Flows | | |
| CASH FLOWS FROM OPERATING ACTIVITIES: | | | | |
| Net increase (decrease) in net assets from investment operations | | $ | (409,471 | ) |
| |
| Adjustments to reconcile net increase (decrease) in net assets from investment operations to net cash provided by operating activities: | | | | |
| |
Purchases of long-term investments | | | (549,096,900 | ) |
| |
Proceeds from sales and maturities of long-term investments | | | 492,983,075 | |
| |
Net purchases, sales and maturities of short-term investments | | | 162,354,000 | |
| |
Net (increase) decrease in dividends and interest receivable and other assets | | | 566,854 | |
| |
Net increase (decrease) in interest expense payable, accrued expenses and other liabilities | | | (92,610 | ) |
| |
Net change in unrealized appreciation (depreciation) on investments | | | 140,123,494 | |
| |
Net realized gain on investments and foreign currency | | | (130,855,526 | ) |
| |
| Net cash provided by operating activities | | | 115,572,916 | |
| |
| CASH FLOWS FROM FINANCING ACTIVITIES: | | | | |
| Net increase (decrease) in revolving credit agreement | | | (40,000,000 | ) |
| |
| Distributions | | | (133,272,041 | ) |
| |
| Reinvestment of distributions | | | 57,806,861 | |
| |
| Net cash used for financing activities | | | (115,465,180 | ) |
| |
| INCREASE (DECREASE) IN CASH: | | | 107,736 | |
| |
| Cash and foreign currency at beginning of year | | | 18,085 | |
| |
| Cash and foreign currency at end of year | | $ | 125,821 | |
| |
| 24 | 2014 Annual Report to Stockholders | THE ACCOMPANYING NOTES ARE AN INTEGRAL PART OF THESE FINANCIAL STATEMENTS |
Royce Value Trust
| |
| Financial Highlights |
| This table is presented to show selected data for a share of Common Stock outstanding throughout each period, and to assist stockholders in evaluating the Fund’s performance for the periods presented. |
| | | YEARS ENDED |
| | | |
| | | 12/31/14 | | 12/31/13 | | 12/31/12 | | 12/31/11 | | 12/31/10 |
| |
| Net Asset Value, Beginning of Period | | $ | 18.17 | | | $ | 15.40 | | | $ | 14.18 | | | $ | 16.73 | | | $ | 12.87 | |
| |
| INVESTMENT OPERATIONS: | | | | | | | | | | | | | | | | | | | | |
| Net investment income (loss) | | | 0.12 | | | | 0.12 | | | | 0.23 | | | | 0.10 | | | | 0.24 | |
| |
Net realized and unrealized gain (loss) on investments and foreign currency | | | (0.13 | ) | | | 4.89 | | | | 2.02 | | | | (1.62 | ) | | | 3.85 | |
| |
| Total investment operations | | | (0.01 | ) | | | 5.01 | | | | 2.25 | | | | (1.52 | ) | | | 4.09 | |
| |
| DISTRIBUTIONS TO PREFERRED STOCKHOLDERS: | | | | | | | | | | | | | | | | | | | | |
| Net investment income | | | – | | | | – | | | | (0.04 | ) | | | (0.03 | ) | | | (0.20 | ) |
| |
| Net realized gain on investments and foreign currency | | | – | | | | – | | | | (0.13 | ) | | | (0.16 | ) | | | – | |
| |
| Total distributions to Preferred Stockholders | | | – | | | | – | | | | (0.17 | ) | | | (0.19 | ) | | | (0.20 | ) |
| |
Net Increase (Decrease) in Net Assets Applicable to Common Stockholders from Investment Operations | | | (0.01 | ) | | | 5.01 | | | | 2.08 | | | | (1.71 | ) | | | 3.89 | |
| |
| DISTRIBUTIONS TO COMMON STOCKHOLDERS: | | | | | | | | | | | | | | | | | | | | |
| Net investment income | | | (0.14 | ) | | | (0.11 | ) | | | (0.17 | ) | | | (0.08 | ) | | | (0.03 | ) |
| |
| Net realized gain on investments and foreign currency | | | (1.68 | ) | | | (2.08 | ) | | | (0.63 | ) | | | (0.43 | ) | | | – | |
| |
| Return of capital | | | – | | | | – | | | | – | | | | (0.27 | ) | | | – | |
| |
| Total distributions to Common Stockholders | | | (1.82 | ) | | | (2.19 | ) | | | (0.80 | ) | | | (0.78 | ) | | | (0.03 | ) |
| |
| CAPITAL STOCK TRANSACTIONS: | | | | | | | | | | | | | | | | | | | | |
| Effect of reinvestment of distributions by Common Stockholders | | | (0.10 | ) | | | (0.05 | ) | | | (0.06 | ) | | | (0.06 | ) | | | (0.00 | ) |
| |
| Total capital stock transactions | | | (0.10 | ) | | | (0.05 | ) | | | (0.06 | ) | | | (0.06 | ) | | | (0.00 | ) |
| |
| Net Asset Value, End of Period | | $ | 16.24 | | | $ | 18.17 | | | $ | 15.40 | | | $ | 14.18 | | | $ | 16.73 | |
| |
| Market Value, End of Period | | $ | 14.33 | | | $ | 16.01 | | | $ | 13.42 | | | $ | 12.27 | | | $ | 14.54 | |
| |
| TOTAL RETURN: 1 | | | | | | | | | | | | | | | | | | | | |
| Net Asset Value | | | 0.78 | % | | | 34.14 | % | | | 15.41 | % | | | (10.06 | )% | | | 30.27 | % |
| |
| Market Value | | | 0.93 | % | | | 35.63 | % | | | 16.22 | % | | | (10.46 | )% | | | 35.05 | % |
| |
| RATIOS BASED ON AVERAGE NET ASSETS APPLICABLE TO COMMON STOCKHOLDERS: | | | | | | | | | | | | | | | | | | | | |
| Investment advisory fee expense2 | | | 0.46 | % | | | 0.54 | % | | | 0.56 | % | | | 0.86 | % | | | 0.11 | % |
| |
| Other operating expenses | | | 0.15 | % | | | 0.25 | % | | | 0.15 | % | | | 0.12 | % | | | 0.12 | % |
| |
| Total expenses (net)3 | | | 0.61 | % | | | 0.79 | % | | | 0.71 | % | | | 0.98 | % | | | 0.23 | % |
| |
| Expenses net of fee waivers and excluding interest expense | | | 0.55 | % | | | 0.65 | % | | | 0.68 | % | | | 0.98 | % | | | 0.23 | % |
| |
| Expenses prior to fee waivers and balance credits | | | 0.61 | % | | | 0.79 | % | | | 0.71 | % | | | 0.98 | % | | | 0.23 | % |
| |
| Expenses prior to fee waivers | | | 0.61 | % | | | 0.79 | % | | | 0.71 | % | | | 0.98 | % | | | 0.23 | % |
| |
| Net investment income (loss) | | | 0.72 | % | | | 0.70 | % | | | 1.57 | % | | | 0.63 | % | | | 1.69 | % |
| |
| SUPPLEMENTAL DATA: | | | | | | | | | | | | | | | | | | | | |
| Net Assets Applicable to Common Stockholders, End of Period (in thousands) | | $ | 1,231,955 | | | $ | 1,307,829 | | | $ | 1,082,426 | | | $ | 966,640 | | | $ | 1,105,879 | |
| |
| Liquidation Value of Preferred Stock, End of Period (in thousands) | | | | | | | | | | | | | | $ | 220,000 | | | $ | 220,000 | |
| |
| Portfolio Turnover Rate | | | 40 | % | | | 33 | % | | | 25 | % | | | 26 | % | | | 30 | % |
| |
| PREFERRED STOCK: | | | | | | | | | | | | | | | | | | | | |
| Total shares outstanding | | | | | | | | | | | | | | | 8,800,000 | | | | 8,800,000 | |
| |
| Asset coverage per share | | | | | | | | | | | | | | $ | 134.88 | | | $ | 150.67 | |
| |
| Liquidation preference per share | | | | | | | | | | | | | | $ | 25.00 | | | $ | 25.00 | |
| |
| Average month-end market value per share | | | | | | | | | | | | | | $ | 25.37 | | | $ | 25.06 | |
| |
| REVOLVING CREDIT AGREEMENT: | | | | | | | | | | | | | | | | | | | | |
| Asset coverage | | | 1860 | % | | | 1289 | % | | | 822 | % | | | | | | | | |
| |
| Asset coverage per $1,000 | | $ | 18,599 | | | $ | 12,889 | | | $ | 8,216 | | | | | | | | | |
| |
| 1 | The Market Value Total Return is calculated assuming a purchase of Common Stock on the opening of the first business day and a sale on the closing of the last business day of each period. Dividends and distributions are assumed for the purposes of this calculation to be reinvested at prices obtained under the Fund’s Distribution Reinvestment and Cash Purchase Plan. Net Asset Value Total Return is calculated on the same basis, except that the Fund’s net asset value is used on the purchase and sale dates instead of market value. |
| 2 | The investment advisory fee is calculated based on average net assets over a rolling 60-month basis, while the above ratios of investment advisory fee expenses are based on the average net assets applicable to Common Stockholders over a 12-month basis. |
| 3 | Expense ratios based on total average net assets including liquidation value of Preferred Stock were 0.60%, 0.82% and 0.18% for the years ended December 31, 2012, 2011 and 2010, respectively. |
| THE ACCOMPANYING NOTES ARE AN INTEGRAL PART OF THESE FINANCIAL STATEMENTS | 2014 Annual Report to Stockholders | 25 |
Royce Value Trust
Notes to Financial Statements
Summary of Significant Accounting Policies:
Royce Value Trust, Inc. (the “Fund”), is a diversified closed-end investment company that was incorporated under the laws of the State of Maryland on July 1, 1986. The Fund commenced operations on November 26, 1986.
The preparation of financial statements in conformity with accounting principles generally accepted in the United States of America requires management to make estimates and assumptions that affect the reported amounts of assets and liabilities and the disclosure of contingent assets and liabilities at the date of the financial statements and the reported amounts of income and expenses during the reporting period. Actual results could differ from those estimates.
The Fund is an investment company and accordingly follows the investment company accounting and reporting guidance of the Financial Accounting Standards Board (FASB) Accounting Standard Codification Topic 946 “Financial Services-Investment Companies”.
VALUATION OF INVESTMENTS:
Securities are valued as of the close of trading on the New York Stock Exchange (NYSE) (generally 4:00 p.m. Eastern time) on the valuation date. Securities that trade on an exchange, and securities traded on Nasdaq’s Electronic Bulletin Board, are valued at their last reported sales price or Nasdaq official closing price taken from the primary market in which each security trades or, if no sale is reported for such day, at their highest bid price. Other over-the-counter securities for which market quotations are readily available are valued at their highest bid price, except in the case of some bonds and other fixed income securities which may be valued by reference to other securities with comparable ratings, interest rates and maturities, using established independent pricing services. The Fund values its non-U.S. dollar denominated securities in U.S. dollars daily at the prevailing foreign currency exchange rates as quoted by a major bank. Securities for which market quotations are not readily available are valued at their fair value in accordance with the provisions of the 1940 Act, under procedures approved by the Fund’s Board of Directors, and are reported as Level 3 securities. As a general principle, the fair value of a security is the amount which the Fund might reasonably expect to receive for the security upon its current sale. However, in light of the judgment involved in fair valuations, there can be no assurance that a fair value assigned to a particular security will be the amount which the Fund might be able to receive upon its current sale. In addition, if, between the time trading ends on a particular security and the close of the customary trading session on the NYSE, events occur that are significant and may make the closing price unreliable, the Fund may fair value the security. The Fund uses an independent pricing service to provide fair value estimates for relevant non-U.S. equity securities on days when the U.S. market volatility exceeds a certain threshold. This pricing service uses proprietary correlations it has developed between the movement of prices of non-U.S. equity securities and indices of U.S.-traded securities, futures contracts and other indications to estimate the fair value of relevant non-U.S. securities. When fair value pricing is employed, the prices of securities used by the Fund may differ from quoted or published prices for the same security. Investments in money market funds are valued at net asset value per share.
Various inputs are used in determining the value of the Fund’s investments, as noted above. These inputs are summarized in the three broad levels below:
| | Level 1 – | quoted prices in active markets for identical securities. |
| | Level 2 – | other significant observable inputs (including quoted prices for similar securities, foreign securities that may be fair valued and repurchase agreements). The table below includes all Level 2 securities. Level 2 securities with values based on quoted prices for similar securities are noted in the Schedule of Investments. |
| | Level 3 – | significant unobservable inputs (including last trade price before trading was suspended, or at a discount thereto for lack of marketability or otherwise, market price information regarding other securities, information received from the company and/or published documents, including SEC filings and financial statements, or other publicly available information). |
The inputs or methodology used for valuing securities are not necessarily an indication of the risk associated with investing in those securities.
The following is a summary of the inputs used to value the Fund’s investments as of December 31, 2014. For a detailed breakout of common stocks by sector classification, please refer to the Schedule of Investments.
| | | | LEVEL 1 | | | LEVEL 2 | | | LEVEL 3 | | | TOTAL | |
| |
| Common Stocks | | | $1,098,540,403 | | | $168,146,367 | | | $270,001 | | | $1,266,956,771 | |
| |
| Preferred Stocks | | | – | | | – | | | 1,216,350 | | | 1,216,350 | |
| |
| Cash Equivalents | | | – | | | 29,555,000 | | | – | | | 29,555,000 | |
| |
| For the year ended December 31, 2014, certain securities have transferred in and out of Level 1 and Level 2 measurements. The Fund recognizes transfers between levels as of the end of the reporting period. At December 31, 2014, securities valued at $85,574,953 were transferred from Level 1 to Level 2 within the fair value hierarchy. |
| 26 | 2014 Annual Report to Stockholders | |
Royce Value Trust
Notes to Financial Statements (continued)
VALUATION OF INVESTMENTS (continued):
Level 3 Reconciliation:
| | | | | | | | | | REALIZED AND UNREALIZED | | | | |
| | | | BALANCE AS OF 12/31/13 | | | SALES | | | GAIN (LOSS)1 | | | BALANCE AS OF 12/31/14 | |
| |
| Common Stocks | | | $ 131,709 | | | $ – | | | $ 138,292 | | | $ 270,001 | |
| |
| Preferred Stocks | | | 1,578,555 | | | 72,406 | | | (289,799) | | | 1,216,350 | |
| |
| 1 | The net change in unrealized appreciation (depreciation) is included in the accompanying Statement of Operations. Change in unrealized appreciation (depreciation) includes net unrealized appreciation (depreciation) resulting from changes in investment values during the reporting period and the reversal of previously recorded unrealized appreciation (depreciation) when gains or losses are realized. Net realized gain (loss) from investments and foreign currency transactions is included in the accompanying Statement of Operations. |
REPURCHASE AGREEMENTS:
The Fund may enter into repurchase agreements with institutions that the Fund’s investment adviser has determined are creditworthy. The Fund restricts repurchase agreements to maturities of no more than seven days. Securities pledged as collateral for repurchase agreements, which are held until maturity of the repurchase agreements, are marked-to-market daily and maintained at a value at least equal to the principal amount of the repurchase agreement (including accrued interest). Repurchase agreements could involve certain risks in the event of default or insolvency of the counter-party, including possible delays or restrictions upon the ability of the Fund to dispose of its underlying securities.
FOREIGN CURRENCY:
Net realized foreign exchange gains or losses arise from sales and maturities of short-term securities, sales of foreign currencies, expiration of currency forward contracts, currency gains or losses realized between the trade and settlement dates on securities transactions, and the difference between the amounts of dividends, interest, and foreign withholding taxes recorded on the Fund’s books and the U.S. dollar equivalent of the amounts actually received or paid. Net unrealized foreign exchange gains and losses arise from changes in the value of assets and liabilities, including investments in securities at the end of the reporting period, as a result of changes in foreign currency exchange rates.
SECURITIES LENDING:
The Fund loans securities through a lending agent to qualified institutional investors for the purpose of realizing additional income. Collateral for the Fund on all securities loaned is accepted in cash and cash equivalents and invested temporarily by the custodian. The collateral maintained is at least 100% of the current market value of the loaned securities. The market value of the loaned securities is determined at the close of business of the Fund and any additional required collateral is delivered to the Fund on the next business day. The Fund retains the risk of any loss on the securities on loan as well as incurring the potential loss on investments purchased with cash collateral received for securities lending. The Fund’s securities lending income consists of the income earned on investing cash collateral, income plus any premium payments received for lending certain securities, less any rebates paid to borrowers and lending agent fees associated with the loan. The lending agent is not affiliated with Royce.
TAXES:
As a qualified regulated investment company under Subchapter M of the Internal Revenue Code, the Fund is not subject to income taxes to the extent that it distributes substantially all of its taxable income for its fiscal year. The Schedule of Investments includes information regarding income taxes under the caption “Tax Information”.
CAPITAL GAINS TAXES:
The Fund is subject to a tax imposed on short-term capital gains on securities of issuers domiciled in certain countries. The Fund records an estimated deferred tax liability for these securities that have been held for less than one year. This amount, if any, is reported as deferred capital gains tax in the accompanying Statement of Assets and Liabilities, assuming those positions were disposed of at the end of the period, and accounted for as a reduction in the market value of the security.
DISTRIBUTIONS:
The Fund pays quarterly distributions on the Fund’s Common Stock at the annual rate of 7% of the rolling average of the prior four calendar quarter-end NAVs of the Fund’s Common Stock, with the fourth quarter distribution being the greater of 1.75% of the rolling average or the distribution required by IRS regulations. Prior to November 15, 2012, distributions to Preferred Stockholders were accrued daily and paid quarterly. Distributions to Common Stockholders are recorded on ex-dividend date. Distributable capital gains and/or net investment income were first allocated to Preferred Stockholder distributions, with any excess allocable to Common Stockholders. If capital gains and/or net investment income were allocated to both Preferred and Common Stockholders, the tax character of such allocations was proportional. To the extent that distributions are not paid from long-term capital gains, net investment income or net short-term capital gains, they will represent a return of capital. Distributions are determined in accordance with income tax regulations that may
| | 2014 Annual Report to Stockholders | 27 |
Royce Value Trust
Notes to Financial Statements (continued)
DISTRIBUTIONS (continued):
differ from accounting principles generally accepted in the United States of America. Permanent book and tax differences relating to stockholder distributions will result in reclassifications within the capital accounts. Undistributed net investment income may include temporary book and tax basis differences, which will reverse in a subsequent period. Any taxable income or gain remaining undistributed at fiscal year end is distributed in the following year.
On June 19, 2013, the Fund purchased 10,160 common shares of Royce Global Value Trust, Inc. (“RGT”) for $100,076. On October 18, 2013, the Fund contributed $99,899,924 in cash and securities in exchange for shares of RGT, and on the same date distributed all shares of RGT valued at $100,000,000 to Fund stockholders of record as of October 10, 2013, at the rate of one share of RGT for every seven shares of the Fund’s Common Stock outstanding. In connection with the spinoff of RGT, the securities contributed included $15,972,444 in unrealized depreciation.
INVESTMENT TRANSACTIONS AND RELATED INVESTMENT INCOME:
Investment transactions are accounted for on the trade date. Dividend income is recorded on the ex-dividend date. Non-cash dividend income is recorded at the fair market value of the securities received. Interest income is recorded on an accrual basis. Premium and discounts on debt securities are amortized using the effective yield-to-maturity method. Realized gains and losses from investment transactions are determined on the basis of identified cost for book and tax purposes.
EXPENSES:
The Fund incurs direct and indirect expenses. Expenses directly attributable to the Fund are charged to the Fund’s operations, while expenses applicable to more than one of the Royce Funds are allocated equitably. Certain personnel, occupancy costs and other administrative expenses related to the Funds are allocated by Royce & Associates, LLC (“Royce”) under an administration agreement and are included in administrative and office facilities and professional fees. The Fund has adopted a deferred fee agreement that allows the Directors to defer the receipt of all or a portion of directors’ fees otherwise payable. The deferred fees are invested in certain Royce Funds until distributed in accordance with the agreement.
COMPENSATING BALANCE CREDITS:
The Fund has an arrangement with its custodian bank, whereby a portion of the custodian’s fee is paid indirectly by credits earned on the Fund’s cash on deposit with the bank. This deposit arrangement is an alternative to purchasing overnight investments. Conversely, the Fund pays interest to the custodian on any cash overdrafts, to the extent they are not offset by credits earned on positive cash balances.
Capital Stock:
The Fund issued 3,894,284 and 1,699,025 shares of Common Stock as reinvestment of distributions for the years ended December 31, 2014 and December 31, 2013, respectively.
Borrowings:
The Fund has entered into a revolving credit agreement (the credit agreement) with BNP Paribas Prime Brokerage Inc. (BNPP). The Fund pays a commitment fee of 0.50% per annum on the unused portion of the credit agreement. The credit agreement has a 360-day rolling term that resets daily; however, if the Fund exceeds certain net asset value triggers, the credit agreement may convert to a 60-day rolling term that resets daily. The Fund is required to pledge portfolio securities as collateral in an amount up to two times the loan balance outstanding and has granted a security interest in the securities pledged to, and in favor of, BNPP as security for the loan balance outstanding. If the Fund fails to meet certain requirements, or maintain other financial covenants required under the credit agreement, the Fund may be required to repay immediately, in part or in full, the loan balance outstanding under the credit agreement necessitating the sale of portfolio securities at potentially inopportune times. The credit agreement also permits, subject to certain conditions, BNPP to rehypothecate portfolio securities pledged by the Fund up to the amount of the loan balance outstanding. The Fund continues to receive payments in lieu of dividends and interest on rehypothecated securities. The Fund also has the right under the credit agreement to recall the rehypothecated securities from BNPP on demand. If BNPP fails to deliver the recalled security in a timely manner, the Fund is compensated by BNPP for any fees or losses related to the failed delivery or, in the event a recalled security is not returned by BNPP, the Fund, upon notice to BNPP, may reduce the loan balance outstanding by the amount of the recalled security failed to be returned. The Fund receives a portion of the fees earned by BNPP in connection with the rehypothecation of portfolio securities.
As of December 31, 2014, the Fund has outstanding borrowings of $70,000,000. During the year ended December 31, 2014, the Fund borrowed an average daily balance of $64,397,260 at a weighted average borrowing cost of 1.18%. The maximum amount outstanding during the year ended December 31, 2014 was $110,000,000. As of December 31, 2014, the aggregate value of rehypothecated securities was $65,826,540. During the year ended December 31, 2014, the Fund earned $332,075 in fees from rehypothecated securities.
| 28 | 2014 Annual Report to Stockholders | |
Royce Value Trust
Notes to Financial Statements (continued)
Investment Advisory Agreement:
As compensation for its services under the Investment Advisory Agreement, Royce receives a fee comprised of a Basic Fee (“Basic Fee”) and an adjustment to the Basic Fee based on the investment performance of the Fund in relation to the investment record of the S&P SmallCap 600 Index (“S&P 600”).
The Basic Fee is a monthly fee equal to 1/12 of 1% (1% on an annualized basis) of the average of the Fund’s month-end net assets applicable to Common Stockholders, plus the liquidation value of outstanding Preferred Stock, for the rolling 60-month period ending with such month (the “performance period”). The Basic Fee for each month is increased or decreased at the rate of 1/12 of .05% for each percentage point that the investment performance of the Fund exceeds, or is exceeded by, the percentage change in the investment record of the S&P 600 for the performance period by more than two percentage points. The performance period for each such month is a rolling 60-month period ending with such month. The maximum increase or decrease in the Basic Fee for any month may not exceed 1/12 of .5%. Accordingly, for each month, the maximum monthly fee rate as adjusted for performance is 1/12 of 1.5% and is payable if the investment performance of the Fund exceeds the percentage change in the investment record of the S&P 600 by 12 or more percentage points for the performance period, and the minimum monthly fee rate as adjusted for performance is 1/12 of .5% and is payable if the percentage change in the investment record of the S&P 600 exceeds the investment performance of the Fund by 12 or more percentage points for the performance period.
Notwithstanding the foregoing, Royce is not entitled to receive any fee for any month when the investment performance of the Fund for the rolling 36-month period ending with such month is negative. In the event that the Fund’s investment performance for such a performance period is less than zero, Royce will not be required to refund to the Fund any fee earned in respect of any prior performance period.
For the twelve rolling 60-month periods in 2014, the Fund’s investment performance ranged from 8% to 46% below the investment performance of the S&P 600. Accordingly, the net investment advisory fee consisted of a Basic Fee of $11,225,376 and a net downward adjustment of $5,433,699 for the performance of the Fund relative to that of the S&P 600. For the year ended December 31, 2014, the Fund accrued and paid Royce investment advisory fees totaling $5,791,677.
Purchases and Sales of Investment Securities:
For the year ended December 31, 2014, the costs of purchases and proceeds from sales of investment securities, other than short-term securities, amounted to $548,967,546 and $491,321,593, respectively.
Distributions to Stockholders:
The tax character of distributions paid to common stockholders during 2014 and 2013 was as follows:
| DISTRIBUTIONS PAID FROM: | | 2014 | | 2013 |
| |
| Ordinary income | | $ | 29,761,905 | | | $ | 32,048,727 | |
| |
| Long-term capital gain | | | 103,510,136 | | | | 123,982,076 | |
| |
| | | $ | 133,272,041 | | | $ | 156,030,803 | |
| |
As of December 31, 2014, the tax basis components of distributable earnings included in stockholders’ equity were as follows:
| Net unrealized appreciation (depreciation) | | $ | 295,416,299 | |
| |
| Post October loss* | | | (22,786 | ) |
| |
| Undistributed ordinary income | | | 3,495,452 | |
| |
| Undistributed capital gains | | | 45,086,193 | |
| |
| | | $ | 343,975,158 | |
| |
| * | Under the current tax law, capital losses and foreign currency losses after October 31 may be deferred and treated as occurring on the first day of the following fiscal year. As of December 31, 2014, the Fund had $22,786 of post October currency losses. |
The difference between book and tax basis unrealized appreciation (depreciation) is attributable primarily to the tax deferral on wash sales, partnership investments and the unrealized gains on Passive Foreign Investment Companies.
For financial reporting purposes, capital accounts and distributions to stockholders are adjusted to reflect the tax character of permanent book/tax differences. These differences are primarily due to differing treatments of income and gains on various investment securities and foreign currency transactions held by the Fund, timing differences and different characterization of distributions made by the Fund. For the year ended December 31, 2014, the Fund recorded the following permanent reclassifications. Results of operations and net assets were not affected by these reclassifications.
| UNDISTRIBUTED NET | | | ACCUMULATED NET |
| INVESTMENT INCOME | | | REALIZED GAIN (LOSS) |
| |
| $(3,283,348) | | | $3,283,348 |
| |
Management has analyzed the Fund’s tax positions taken on federal income tax returns for all open tax years (2011-2014) and has concluded that as of December 31, 2014, no provision for income tax is required in the Fund’s financial statements.
| | 2014 Annual Report to Stockholders | 29 |
Royce Value Trust
Notes to Financial Statements (continued)
Transactions in Affiliated Companies:
An “Affiliated Company” as defined in the Investment Company Act of 1940, is a company in which a fund owns 5% or more of the company’s outstanding voting securities at any time during the period. The Fund effected the following transactions in shares of such companies for the year ended December 31, 2014:
| | | SHARES | | MARKET VALUE | | | COST OF | | | COST OF | | | REALIZED | | | DIVIDEND | | SHARES | | | MARKET VALUE |
| AFFILIATED COMPANY | | 12/31/13 | | | 12/31/13 | | | PURCHASES | | | SALES | | | GAIN (LOSS) | | | INCOME | | 12/31/14 | | | 12/31/14 |
| |
| Stanley Furniture | | 50,000 | | | $ 192,000 | | | $2,549,923 | | | – | | | – | | | – | | 1,012,235 | | | $2,773,524 |
| |
| Timberland Bancorp | | 444,200 | | | 4,273,204 | | | – | | | – | | | – | | | $79,956 | | 444,200 | | | 4,708,520 |
| |
| | | | | | $4,465,204 | | | | | | | | | | | | $79,956 | | | | | $7,482,044 |
| |
| 30 | 2014 Annual Report to Stockholders | |
Royce Value Trust
Report of Independent Registered Public Accounting Firm
To the Board of Directors and Stockholders of
Royce Value Trust, Inc.
New York, New York
We have audited the accompanying statement of assets and liabilities of Royce Value Trust, Inc., (“Fund”) including the schedule of investments, as of December 31, 2014, and the related statement of operations and statement of cash flows for the year then ended, the statements of changes in net assets for each of the two years in the period then ended and the financial highlights for each of the five years in the period then ended. These financial statements and financial highlights are the responsibility of the Fund’s management. Our responsibility is to express an opinion on these financial statements and financial highlights based on our audits.
We conducted our audits in accordance with the standards of the Public Company Accounting Oversight Board (United States). Those standards require that we plan and perform the audit to obtain reasonable assurance about whether the financial statements and financial highlights are free of material misstatement. The Fund is not required to have, nor were we engaged to perform, an audit of its internal control over financial reporting. Our audits included consideration of internal control over financial reporting as a basis for designing audit procedures that are appropriate in the circumstances, but not for the purpose of expressing an opinion on the effectiveness of the Fund’s internal control over financial reporting. Accordingly, we express no such opinion. An audit includes examining, on a test basis, evidence supporting the amounts and disclosures in the financial statements. Our procedures included confirmation of securities owned as of December 31, 2014, by correspondence with the custodian and brokers or by other appropriate auditing procedures where replies from brokers were not received. An audit also includes assessing the accounting principles used and significant estimates made by management, as well as evaluating the overall financial statement presentation. We believe that our audits provide a reasonable basis for our opinion.
In our opinion, the financial statements and financial highlights referred to above present fairly, in all material respects, the financial position of Royce Value Trust, Inc. at December 31, 2014, the results of its operations and its cash flows for the year then ended, the changes in its net assets for each of the two years in the period then ended and the financial highlights for each of the five years in the period then ended, in conformity with accounting principles generally accepted in the United States of America.
TAIT, WELLER, & BAKER LLP
Philadelphia, Pennsylvania
February 23, 2015
| 2014 Annual Report to Stockholders | 31 |
| |
| Schedule of Investments | | | | | | |
| Common Stocks – 109.4% | | | | | | |
| | | SHARES | | | | VALUE |
| |
| | | | | | | |
| CONSUMER DISCRETIONARY – 18.9% | | | | | | |
| AUTO COMPONENTS - 2.6% | | | | | | |
China Zenix Auto International ADR 1 | | 32,182 | | $ | | 46,020 |
Drew Industries 1,2 | | 68,300 | | | | 3,488,081 |
Fuel Systems Solutions 1 | | 171,000 | | | | 1,870,740 |
†Global & Yuasa Battery | | 53,800 | | | | 1,932,315 |
Motorcar Parts of America 1 | | 50,000 | | | | 1,554,500 |
Spartan Motors | | 55,500 | | | | 291,930 |
Standard Motor Products | | 26,000 | | | | 991,120 |
| | | | | |
| | | | | | | 10,174,706 |
| | | | | |
| DISTRIBUTORS - 0.9% | | | | | | |
Core-Mark Holding Company | | 25,200 | | | | 1,560,636 |
Weyco Group | | 59,600 | | | | 1,768,332 |
| | | | | |
| | | | | | | 3,328,968 |
| | | | | |
| DIVERSIFIED CONSUMER SERVICES - 1.8% | | | | | | |
American Public Education 1 | | 61,700 | | | | 2,274,879 |
Capella Education | | 2,700 | | | | 207,792 |
Collectors Universe | | 76,000 | | | | 1,585,360 |
†Liberty Tax 1 | | 45,100 | | | | 1,611,874 |
Lincoln Educational Services | | 476,300 | | | | 1,343,166 |
| | | | | |
| | | | | | | 7,023,071 |
| | | | | |
| HOTELS, RESTAURANTS & LEISURE - 0.5% | | | | | | |
Monarch Casino & Resort 1 | | 31,997 | | | | 530,830 |
†MTY Food Group | | 41,700 | | | | 1,209,939 |
| | | | | |
| | | | | | | 1,740,769 |
| | | | | |
| HOUSEHOLD DURABLES - 3.7% | | | | | | |
Cavco Industries 1 | | 3,091 | | | | 245,024 |
Ethan Allen Interiors 2 | | 73,400 | | | | 2,273,198 |
Flexsteel Industries 2 | | 90,600 | | | | 2,921,850 |
iRobot Corporation 1,2 | | 15,000 | | | | 520,800 |
Lifetime Brands | | 188,494 | | | | 3,242,097 |
Skullcandy 1 | | 78,200 | | | | 718,658 |
Skyline Corporation 1 | | 183,400 | | | | 742,770 |
Stanley Furniture 1 | | 93,468 | | | | 256,102 |
Turtle Beach 1,2,3 | | 235,218 | | | | 750,345 |
Universal Electronics 1 | | 39,900 | | | | 2,594,697 |
| | | | | |
| | | | | | | 14,265,541 |
| | | | | |
| INTERNET & CATALOG RETAIL - 1.0% | | | | | | |
†Blue Nile 1 | | 41,600 | | | | 1,498,016 |
FTD Companies 1 | | 69,700 | | | | 2,426,954 |
| | | | | |
| | | | | | | 3,924,970 |
| | | | | |
| LEISURE PRODUCTS - 1.9% | | | | | | |
Arctic Cat | | 31,500 | | | | 1,118,250 |
LeapFrog Enterprises Cl. A 1,2,3 | | 384,300 | | | | 1,813,896 |
Nautilus 1 | | 195,900 | | | | 2,973,762 |
Smith & Wesson Holding Corporation 1,2 | | 155,900 | | | | 1,476,373 |
| | | | | |
| | | | | | | 7,382,281 |
| | | | | |
| MEDIA - 1.4% | | | | | | |
Rentrak Corporation 1 | | 25,800 | | | | 1,878,756 |
Saga Communications Cl. A | | 12,100 | | | | 526,108 |
Value Line | | 169,000 | | | | 2,813,850 |
| | | | | |
| | | | | | | 5,218,714 |
| | | | | |
| MULTILINE RETAIL - 0.1% | | | | | | |
Tuesday Morning 1 | | 23,600 | | | | 512,120 |
| | | | | |
| SPECIALTY RETAIL - 2.9% | | | | | | |
Aeropostale 1 | | 165,000 | | | | 382,800 |
America’s Car-Mart 1,2,3 | | 33,500 | | | | 1,788,230 |
Destination Maternity | | 206,100 | | | | 3,287,295 |
Kirkland’s 1 | | 12,300 | | | | 290,772 |
Le Chateau Cl. A 1 | | 685,000 | | | | 471,682 |
Lewis Group | | 57,000 | | | | 364,723 |
Shoe Carnival 2 | | 31,628 | | | | 812,523 |
Stage Stores 2 | | 25,000 | | | | 517,500 |
Systemax 1,2 | | 44,000 | | | | 594,000 |
Tandy Leather Factory | | 44,233 | | | | 399,424 |
TravelCenters of America LLC 1 | | 106,363 | | | | 1,342,301 |
West Marine 1 | | 86,000 | | | | 1,111,120 |
| | | | | |
| | | | | | | 11,362,370 |
| | | | | |
| TEXTILES, APPAREL & LUXURY GOODS - 2.1% | | | | | | |
Crown Crafts | | 216,259 | | | | 1,665,194 |
Culp | | 70,500 | | | | 1,528,440 |
J.G. Boswell Company 4 | | 2,490 | | | | 2,345,605 |
Movado Group 2 | | 44,374 | | | | 1,258,891 |
†YGM Trading | | 781,000 | | | | 1,415,271 |
| | | | | |
| | | | | | | 8,213,401 |
| |
| Total (Cost $58,260,440) | | | | | | 73,146,911 |
| |
| | | | | | | |
| CONSUMER STAPLES – 1.8% | | | | | | |
| BEVERAGES - 0.1% | | | | | | |
Crimson Wine Group 1,4 | | 58,124 | | | | 546,365 |
| | | | | |
| FOOD PRODUCTS - 1.5% | | | | | | |
Alico | | 20,000 | | | | 1,000,600 |
Farmer Bros. 1 | | 40,500 | | | | 1,192,725 |
John B. Sanfilippo & Son | | 3,500 | | | | 159,250 |
Seneca Foods Cl. A 1 | | 51,400 | | | | 1,389,342 |
Seneca Foods Cl. B 1 | | 42,500 | | | | 1,368,500 |
SunOpta 1 | | 48,900 | | | | 579,465 |
Waterloo Investment Holdings 1,5 | | 806,207 | | | | 306,359 |
| | | | | |
| | | | | | | 5,996,241 |
| | | | | |
| PERSONAL PRODUCTS - 0.2% | | | | | | |
Inter Parfums 2 | | 24,800 | | | | 680,760 |
| |
| Total (Cost $4,272,416) | | | | | | 7,223,366 |
| |
| | | | | | | |
| ENERGY – 2.4% | | | | | | |
| ENERGY EQUIPMENT & SERVICES - 1.1% | | | | | | |
Dawson Geophysical | | 53,213 | | | | 650,795 |
Geospace Technologies 1,2 | | 9,500 | | | | 251,750 |
Gulf Island Fabrication | | 29,116 | | | | 564,559 |
Matrix Service 1,2 | | 38,100 | | | | 850,392 |
Newpark Resources 1 | | 63,400 | | | | 604,836 |
North American Energy Partners | | 50,000 | | | | 157,000 |
Pioneer Energy Services 1,2 | | 57,500 | | | | 318,550 |
Tesco Corporation 2 | | 58,000 | | | | 743,560 |
| | | | | |
| | | | | | | 4,141,442 |
| | | | | |
| OIL, GAS & CONSUMABLE FUELS - 1.3% | | | | | | |
Approach Resources 1,2,3 | | 12,000 | | | | 76,680 |
Harvest Natural Resources 1 | | 13,176 | | | | 23,849 |
†Permian Basin Royalty Trust | | 406,333 | | | | 3,880,480 |
Resolute Energy 1,2,3 | | 102,100 | | | | 134,772 |
Sprott Resource 1 | | 91,800 | | | | 148,549 |
StealthGas 1 | | 74,500 | | | | 470,095 |
VAALCO Energy 1,2 | | 79,100 | | | | 360,696 |
| | | | | |
| | | | | | | 5,095,121 |
| |
| Total (Cost $10,971,336) | | | | | | 9,236,563 |
| |
| | | | | | | |
| FINANCIALS – 18.0% | | | | | | |
| BANKS - 1.9% | | | | | | |
Bank of N.T. Butterfield & Son | | 438,100 | | | | 871,819 |
BCB Holdings 1 | | 906,207 | | | | 169,490 |
| 32 | 2014 Annual Report to Stockholders | | THE ACCOMPANYING NOTES ARE AN INTEGRAL PART OF THESE FINANCIAL STATEMENTS |
| |
| Schedule of Investments (continued) | | | | | | |
| | | | | | | |
| | | SHARES | | | | VALUE |
| |
| | | | | | | |
| FINANCIALS (continued) | | | | | | |
| BANKS (continued) | | | | | | |
Bryn Mawr Bank | | 25,000 | | $ | | 782,500 |
Chemung Financial | | 31,000 | | | | 858,390 |
Fauquier Bankshares 2 | | 140,200 | | | | 2,646,976 |
First Bancorp (The) | | 40,200 | | | | 727,218 |
First Internet Bancorp | | 28,500 | | | | 477,090 |
Peapack-Gladstone Financial | | 53,606 | | | | 994,927 |
| | | | | |
| | | | | | | 7,528,410 |
| | | | | |
| CAPITAL MARKETS - 8.6% | | | | | | |
ASA Gold and Precious Metals | | 206,150 | | | | 2,084,177 |
Cowen Group 1 | | 353,900 | | | | 1,698,720 |
Diamond Hill Investment Group | | 27,879 | | | | 3,848,417 |
Equity Trustees | | 42,229 | | | | 665,624 |
FBR & Co. 1 | | 51,684 | | | | 1,270,910 |
Fiera Capital Cl. A | | 78,000 | | | | 852,642 |
†FXCM Cl. A 2 | | 60,980 | | | | 1,010,439 |
INTL FCStone 1,2 | | 26,310 | | | | 541,197 |
JZ Capital Partners | | 253,999 | | | | 1,593,464 |
†Medley Management Cl. A | | 145,800 | | | | 2,143,260 |
MVC Capital 2 | | 387,400 | | | | 3,808,142 |
†Newtek Business Services 1 | | 78,100 | | | | 1,152,756 |
OHA Investment | | 230,820 | | | | 1,082,546 |
Queen City Investments 4 | | 948 | | | | 1,033,320 |
RHJ International 1 | | 230,000 | | | | 1,284,784 |
Silvercrest Asset Management Group Cl. A | | 228,600 | | | | 3,577,590 |
Sprott | | 622,200 | | | | 1,306,738 |
U.S. Global Investors Cl. A | | 651,254 | | | | 2,018,887 |
Urbana Corporation | | 237,600 | | | | 409,020 |
Westwood Holdings Group 2 | | 29,800 | | | | 1,842,236 |
| | | | | |
| | | | | | | 33,224,869 |
| | | | | |
| CONSUMER FINANCE - 1.3% | | | | | | |
EZCORP Cl. A 1,2 | | 234,400 | | | | 2,754,200 |
J.G. Wentworth Company Cl. A 1 | | 160,000 | | | | 1,705,600 |
Regional Management 1 | | 51,400 | | | | 812,634 |
| | | | | |
| | | | | | | 5,272,434 |
| | | | | |
| DIVERSIFIED FINANCIAL SERVICES - 1.4% | | | | | | |
Banca Finnat Euramerica | | 1,310,000 | | | | 640,355 |
GAIN Capital Holdings | | 25,000 | | | | 225,500 |
HF2 Financial Management Cl. A 1 | | 292,160 | | | | 3,029,699 |
PICO Holdings 1,2 | | 45,700 | | | | 861,445 |
Warsaw Stock Exchange | | 52,900 | | | | 681,632 |
| | | | | |
| | | | | | | 5,438,631 |
| | | | | |
| INSURANCE - 2.2% | | | | | | |
Hallmark Financial Services 1 | | 120,782 | | | | 1,460,255 |
Independence Holding Company | | 105,380 | | | | 1,470,051 |
National Western Life Insurance Cl. A 2 | | 7,033 | | | | 1,893,635 |
State Auto Financial 2,3 | | 109,264 | | | | 2,427,846 |
United Fire Group 2 | | 38,603 | | | | 1,147,667 |
| | | | | |
| | | | | | | 8,399,454 |
| | | | | |
| REAL ESTATE INVESTMENT TRUSTS (REITS) - 0.4% | | | | | | |
BRT Realty Trust 1 | | 230,331 | | | | 1,607,710 |
| | | | | |
| REAL ESTATE MANAGEMENT & DEVELOPMENT - 2.0% | | | | | | |
AV Homes 1 | | 36,400 | | | | 530,348 |
Consolidated-Tomoka Land | | 28,844 | | | | 1,609,495 |
Forestar Group 1,2,3 | | 53,000 | | | | 816,200 |
Griffin Land & Nurseries | | 47,746 | | | | 1,435,245 |
Tejon Ranch 1,2,3 | | 112,162 | | | | 3,304,293 |
Tejon Ranch (Warrants) 1 | | 13,146 | | | | 23,005 |
| | | | | |
| | | | | | | 7,718,586 |
| | | | | |
| THRIFTS & MORTGAGE FINANCE - 0.2% | | | | | | |
Alliance Bancorp, Inc. of Pennsylvania | | 40,162 | | | | 716,892 |
| |
| Total (Cost $62,464,037) | | | | | | 69,906,986 |
| |
| | | | | | | |
| HEALTH CARE – 10.4% | | | | | | |
| BIOTECHNOLOGY - 0.7% | | | | | | |
ARIAD Pharmaceuticals 1,2,3 | | 134,102 | | | | 921,281 |
ArQule 1 | | 70,000 | | | | 85,400 |
Celsion Corporation 1 | | 115,555 | | | | 269,243 |
ChemoCentryx 1 | | 70,000 | | | | 478,100 |
Coronado Biosciences 1 | | 297,400 | | | | 725,656 |
Rigel Pharmaceuticals 1 | | 152,392 | | | | 345,930 |
| | | | | |
| | | | | | | 2,825,610 |
| | | | | |
| HEALTH CARE EQUIPMENT & SUPPLIES - 5.1% | | | | | | |
Allied Healthcare Products 1 | | 61,772 | | | | 113,661 |
AngioDynamics 1,2,3 | | 70,163 | | | | 1,333,799 |
Atrion Corporation | | 12,132 | | | | 4,125,001 |
Cerus Corporation 1,2,3 | | 140,000 | | | | 873,600 |
CryoLife | | 54,473 | | | | 617,179 |
Cynosure Cl. A 1 | | 6,500 | | | | 178,230 |
Derma Sciences 1 | | 74,958 | | | | 697,859 |
Exactech 1,2 | | 137,200 | | | | 3,233,804 |
Invacare Corporation 2 | | 126,300 | | | | 2,116,788 |
†Meridian Bioscience | | 71,500 | | | | 1,176,890 |
RTI Surgical 1 | | 10,000 | | | | 52,000 |
STRATEC Biomedical | | 14,000 | | | | 774,800 |
Synergetics USA 1,2 | | 156,435 | | | | 680,492 |
Syneron Medical 1 | | 69,200 | | | | 645,636 |
Trinity Biotech ADR Cl. A | | 55,800 | | | | 977,058 |
Utah Medical Products | | 38,100 | | | | 2,287,905 |
| | | | | |
| | | | | | | 19,884,702 |
| | | | | |
| HEALTH CARE PROVIDERS & SERVICES - 2.7% | | | | | | |
Addus HomeCare 1 | | 66,000 | | | | 1,601,820 |
Bio-Reference Laboratories 1,2 | | 14,900 | | | | 478,737 |
CorVel Corporation 1,2 | | 40,000 | | | | 1,488,800 |
Cross Country Healthcare 1 | | 250,498 | | | | 3,126,215 |
PDI 1 | | 65,383 | | | | 117,035 |
PharMerica Corporation 1,2 | | 40,000 | | | | 828,400 |
Psychemedics Corporation | | 77,900 | | | | 1,173,953 |
U.S. Physical Therapy | | 33,257 | | | | 1,395,464 |
| | | | | |
| | | | | | | 10,210,424 |
| | | | | |
| HEALTH CARE TECHNOLOGY - 0.3% | | | | | | |
Computer Programs and Systems | | 5,000 | | | | 303,750 |
HealthStream 1 | | 24,227 | | | | 714,212 |
| | | | | |
| | | | | | | 1,017,962 |
| | | | | |
| PHARMACEUTICALS - 1.6% | | | | | | |
†Agile Therapeutics 1,2,3 | | 80,000 | | | | 491,200 |
†Relypsa 1 | | 87,000 | | | | 2,679,600 |
†Repros Therapeutics 1 | | 129,000 | | | | 1,286,130 |
†Theravance Biopharma 1 | | 124,000 | | | | 1,850,080 |
| | | | | |
| | | | | | | 6,307,010 |
| |
| Total (Cost $30,358,622) | | | | | | 40,245,708 |
| |
| | | | | | | |
| INDUSTRIALS – 23.1% | | | | | | |
| AEROSPACE & DEFENSE - 1.8% | | | | | | |
Astronics Corporation 1 | | 6,444 | | | | 356,418 |
Astronics Corporation Cl. B 1,4 | | 764 | | | | 41,997 |
Breeze-Eastern Corporation 1 | | 24,233 | | | | 245,965 |
CPI Aerostructures 1 | | 81,021 | | | | 849,910 |
| THE ACCOMPANYING NOTES ARE AN INTEGRAL PART OF THESE FINANCIAL STATEMENTS | | 2014 Annual Report to Stockholders | 33 |
| |
| Schedule of Investments (continued) | | | | | | |
| | | | | | | |
| | | SHARES | | | | VALUE |
| |
| | | | | | | |
| INDUSTRIALS (continued) | | | | | | |
| AEROSPACE & DEFENSE (continued) | | | | | | |
Ducommun 1 | | 93,800 | | $ | | 2,371,264 |
Innovative Solutions and Support 1 | | 142,828 | | | | 454,193 |
Kratos Defense & Security Solutions 1 | | 72,324 | | | | 363,066 |
SIFCO Industries | | 45,800 | | | | 1,335,070 |
Sparton Corporation 1,2 | | 35,700 | | | | 1,011,738 |
| | | | | |
| | | | | | | 7,029,621 |
| | | | | |
| AIR FREIGHT & LOGISTICS - 0.1% | | | | | | |
Echo Global Logistics 1 | | 16,100 | | | | 470,120 |
| | | | | |
| BUILDING PRODUCTS - 2.0% | | | | | | |
AAON 2 | | 30,300 | | | | 678,417 |
American Woodmark 1,2,3 | | 46,600 | | | | 1,884,504 |
Apogee Enterprises | | 31,900 | | | | 1,351,603 |
Burnham Holdings Cl. A 4 | | 117,000 | | | | 2,340,000 |
Griffon Corporation 2 | | 36,300 | | | | 482,790 |
Insteel Industries | | 39,000 | | | | 919,620 |
| | | | | |
| | | | | | | 7,656,934 |
| | | | | |
| COMMERCIAL SERVICES & SUPPLIES - 1.3% | | | | | | |
CompX International Cl. A | | 107,500 | | | | 1,268,500 |
Heritage-Crystal Clean 1 | | 226,377 | | | | 2,791,228 |
Intersections | | 88,900 | | | | 347,599 |
Team 1,2,3 | | 17,500 | | | | 708,050 |
| | | | | |
| | | | | | | 5,115,377 |
| | | | | |
| CONSTRUCTION & ENGINEERING - 3.0% | | | | | | |
Ameresco Cl. A 1 | | 295,700 | | | | 2,069,900 |
Integrated Electrical Services 1 | | 570,682 | | | | 4,451,320 |
Layne Christensen 1,2 | | 50,000 | | | | 477,000 |
MYR Group 1,2,3 | | 107,100 | | | | 2,934,540 |
Orbit Garant Drilling 1 | | 1,512,500 | | | | 1,809,584 |
| | | | | |
| | | | | | | 11,742,344 |
| | | | | |
| ELECTRICAL EQUIPMENT - 1.6% | | | | | | |
AZZ | | 16,494 | | | | 773,899 |
Encore Wire 2 | | 15,000 | | | | 559,950 |
Global Power Equipment Group | | 60,449 | | | | 834,801 |
LSI Industries | | 93,012 | | | | 631,551 |
Orion Energy Systems 1 | | 100,000 | | | | 550,000 |
Powell Industries | | 28,400 | | | | 1,393,588 |
Preformed Line Products | | 18,143 | | | | 991,152 |
Vicor 1 | | 30,000 | | | | 363,000 |
| | | | | |
| | | | | | | 6,097,941 |
| | | | | |
| INDUSTRIAL CONGLOMERATES - 0.6% | | | | | | |
Raven Industries 2 | | 93,400 | | | | 2,335,000 |
| | | | | |
| MACHINERY - 6.3% | | | | | | |
Alamo Group | | 14,200 | | | | 687,848 |
†ARC Group Worldwide 1,2,3 | | 39,250 | | | | 397,995 |
CIRCOR International 2 | | 1,100 | | | | 66,308 |
Columbus McKinnon | | 24,350 | | | | 682,774 |
Douglas Dynamics | | 50,000 | | | | 1,071,500 |
Eastern Company (The) | | 39,750 | | | | 681,712 |
†Energy Recovery 1,2,3 | | 21,200 | | | | 111,724 |
Foster (L.B.) Company 2,3 | | 59,200 | | | | 2,875,344 |
Graham Corporation 2 | | 107,050 | | | | 3,079,829 |
Hurco Companies | | 57,266 | | | | 1,952,198 |
Kadant | | 24,400 | | | | 1,041,636 |
Luxfer Holdings ADR | | 45,100 | | | | 673,343 |
NN | | 164,300 | | | | 3,378,008 |
†Pfeiffer Vacuum Technology | | 21,000 | | | | 1,743,167 |
PMFG 1 | | 223,245 | | | | 1,167,571 |
Sun Hydraulics | | 17,100 | | | | 673,398 |
Tennant Company 2,3 | | | | | 37,200 | | | | 2,684,724 |
†Wabash National 1 | | | | | 125,500 | | | | 1,551,180 |
| | | | | | | | |
| | | | | | | | | | 24,520,259 |
| | | | | | | | |
| MARINE - 0.3% | | | | | | | | | |
Clarkson | | | | | 32,700 | | | | 965,226 |
| | | | | | | | |
| PROFESSIONAL SERVICES - 2.3% | | | | | | | | | |
Acacia Research 2,3 | | | | | 58,800 | | | | 996,072 |
CBIZ 1 | | | | | 47,000 | | | | 402,320 |
Franklin Covey 1 | | | | | 84,100 | | | | 1,628,176 |
GP Strategies 1 | | | | | 2,000 | | | | 67,860 |
Heidrick & Struggles International | | | | | 73,468 | | | | 1,693,437 |
ICF International 1 | | | | | 15,700 | | | | 643,386 |
Kforce 2 | | | | | 71,000 | | | | 1,713,230 |
Mistras Group 1 | | | | | 4,100 | | | | 75,153 |
Resources Connection | | | | | 20,000 | | | | 329,000 |
RPX Corporation 1 | | | | | 104,900 | | | | 1,445,522 |
| | | | | | | | |
| | | | | | | | | | 8,994,156 |
| | | | | | | | |
| ROAD & RAIL - 2.1% | | | | | | | | | |
FRP Holdings 1,2 | | | | | 109,081 | | | | 4,277,066 |
Marten Transport | | | | | 5,200 | | | | 113,672 |
Universal Truckload Services 2 | | | | | 134,200 | | | | 3,826,042 |
| | | | | | | | |
| | | | | | | | | | 8,216,780 |
| | | | | | | | |
| TRADING COMPANIES & DISTRIBUTORS - 1.4% | | | | | | | | | |
Aceto Corporation | | | | | 72,219 | | | | 1,567,152 |
Houston Wire & Cable | | | | | 162,075 | | | | 1,936,796 |
Lawson Products 1 | | | | | 50,269 | | | | 1,335,648 |
MFC Industrial | | | | | 70,000 | | | | 495,600 |
| | | | | | | | |
| | | | | | | | | | 5,335,196 |
| | | | | | | | |
| TRANSPORTATION INFRASTRUCTURE - 0.3% | | | | | | | | | |
Touax | | | | | 53,197 | | | | 947,166 |
| |
| Total (Cost $62,550,925) | | | | | | | | | 89,426,120 |
| |
| | | | | | | | | | |
| INFORMATION TECHNOLOGY – 23.0% | | | | | | | | | |
| COMMUNICATIONS EQUIPMENT - 1.4% | | | | | | | | | |
†Applied Optoelectronics 1,2,3 | | | | | 7,500 | | | | 84,150 |
Bel Fuse Cl. A | | | | | 67,705 | | | | 1,641,169 |
CalAmp Corporation 1 | | | | | 60,200 | | | | 1,101,660 |
Ceragon Networks 1 | | | | | 29,700 | | | | 29,997 |
ClearOne | | | | | 25,000 | | | | 241,500 |
Comtech Telecommunications | | | | | 17,300 | | | | 545,296 |
Extreme Networks 1 | | | | | 320,000 | | | | 1,129,600 |
KVH Industries 1 | | | | | 8,900 | | | | 112,585 |
PCTEL | | | | | 44,100 | | | | 381,906 |
Sandvine Corporation 1 | | | | | 22,700 | | | | 63,892 |
UTStarcom Holdings 1 | | | | | 75,200 | | | | 212,816 |
| | | | | | | | |
| | | | | | | | | | 5,544,571 |
| | | | | | | | |
| ELECTRONIC EQUIPMENT, INSTRUMENTS & COMPONENTS - 7.7% | | | |
Agilysys 1 | | | | | 170,587 | | | | 2,147,690 |
Deswell Industries | | | | | 544,371 | | | | 979,868 |
DTS 1 | | | | | 66,500 | | | | 2,044,875 |
Identiv 1 | | | | | 39,900 | | | | 554,211 |
Inficon Holding | | | | | 3,600 | | | | 1,116,153 |
LRAD Corporation 1 | | | | | 401,756 | | | | 1,084,741 |
Mercury Systems 1 | | | | | 10,900 | | | | 151,728 |
Mesa Laboratories | | | | | 42,789 | | | | 3,308,018 |
Newport Corporation 1,2,3 | | | | | 236,623 | | | | 4,521,865 |
Orbotech 1 | | | | | 127,800 | | | | 1,891,440 |
PC Connection | | | | | 43,716 | | | | 1,073,228 |
| 34 | 2014 Annual Report to Stockholders | | THE ACCOMPANYING NOTES ARE AN INTEGRAL PART OF THESE FINANCIAL STATEMENTS |
| |
| Schedule of Investments (continued) | | | | | | |
| | | | | | | |
| | | SHARES | | | | VALUE |
| |
| | | | | | | |
| INFORMATION TECHNOLOGY (continued) | | | | | | |
| ELECTRONIC EQUIPMENT, INSTRUMENTS & COMPONENTS (continued) | | | | | | |
Pulse Electronics 1,4 | | 251,793 | | $ | | 276,972 |
Richardson Electronics | | 330,900 | | | | 3,309,000 |
Rofin-Sinar Technologies 1 | | 71,100 | | | | 2,045,547 |
Rogers Corporation 1,2,3 | | 14,700 | | | | 1,197,168 |
TTM Technologies 1,2 | | 179,400 | | | | 1,350,882 |
Vishay Precision Group 1 | | 154,000 | | | | 2,642,640 |
| | | | | |
| | | | | | | 29,696,026 |
| | | | | |
| INTERNET SOFTWARE & SERVICES - 4.5% | | | | | | |
†Care.com 1,2 | | 284,254 | | | | 2,353,623 |
†Frontier Services Group 1 | | 10,253,000 | | | | 1,465,138 |
GTT Communications 1,2 | | 177,960 | | | | 2,354,411 |
LivePerson 1 | | 3,700 | | | | 52,170 |
Marchex Cl. B | | 95,000 | | | | 436,050 |
QuinStreet 1 | | 387,700 | | | | 2,353,339 |
RealNetworks 1 | | 244,000 | | | | 1,717,760 |
Reis | | 25,000 | | | | 654,250 |
Stamps.com 1 | | 3,100 | | | | 148,769 |
Support.com 1 | | 1,212,763 | | | | 2,558,930 |
†Textura Corporation 1,2,3 | | 66,700 | | | | 1,898,949 |
United Online 1 | | 58,400 | | | | 849,720 |
World Energy Solutions 1 | | 100,000 | | | | 550,000 |
| | | | | |
| | | | | | | 17,393,109 |
| | | | | |
| IT SERVICES - 1.5% | | | | | | |
Cass Information Systems 2 | | 29,150 | | | | 1,552,238 |
Computer Task Group 2 | | 189,900 | | | | 1,809,747 |
Hackett Group (The) | | 103,500 | | | | 909,765 |
Higher One Holdings 1 | | 17,500 | | | | 73,675 |
Innodata 1 | | 437,275 | | | | 1,276,843 |
Sykes Enterprises 1 | | 6,300 | | | | 147,861 |
| | | | | |
| | | | | | | 5,770,129 |
| | | | | |
| SEMICONDUCTORS & SEMICONDUCTOR EQUIPMENT - 4.4% | | | | | | |
Advanced Energy Industries 1,2,3 | | 49,900 | | | | 1,182,630 |
Amtech Systems 1 | | 153,500 | | | | 1,558,025 |
Brooks Automation | | 153,600 | | | | 1,958,400 |
Cascade Microtech 1 | | 29,300 | | | | 428,073 |
CEVA 1 | | 98,122 | | | | 1,779,933 |
Entropic Communications 1 | | 235,247 | | | | 595,175 |
Exar Corporation 1 | | 233,208 | | | | 2,378,722 |
Integrated Silicon Solution | | 26,967 | | | | 446,843 |
IXYS Corporation | | 18,800 | | | | 236,880 |
Kulicke & Soffa Industries 1 | | 67,900 | | | | 981,834 |
MoSys 1,2,3 | | 402,275 | | | | 752,254 |
Nanometrics 1 | | 50,800 | | | | 854,456 |
PDF Solutions 1 | | 6,050 | | | | 89,903 |
Photronics 1 | | 177,000 | | | | 1,470,870 |
Rubicon Technology 1,2,3 | | 76,899 | | | | 351,428 |
Rudolph Technologies 1,2 | | 52,500 | | | | 537,075 |
Silicon Image 1 | | 60,600 | | | | 334,512 |
Silicon Motion Technology ADR 2 | | 18,200 | | | | 430,430 |
Ultra Clean Holdings 1 | | 68,800 | | | | 638,464 |
Xcerra Corporation 1 | | 22,400 | | | | 205,184 |
| | | | | |
| | | | | | | 17,211,091 |
| | | | | |
| SOFTWARE - 1.6% | | | | | | |
American Software Cl. A | | 170,252 | | | | 1,550,996 |
BSQUARE Corporation 1 | | 98,675 | | | | 448,971 |
Envivio 1 | | 489,376 | | | | 655,764 |
†ePlus 1 | | 31,299 | | | | 2,369,021 |
SeaChange International 1 | | 204,000 | | | | 1,301,520 |
| | | | | |
| | | | | | | 6,326,272 |
| | | | | |
| TECHNOLOGY HARDWARE, STORAGE & PERIPHERALS - 1.9% | | | | | | |
†Avid Technology 1 | | 51,900 | | | | 737,499 |
Intevac 1 | | 279,500 | | | | 2,171,715 |
†Kortek | | 135,007 | | | | 1,218,828 |
Qumu Corporation 1 | | 202,200 | | | | 2,764,074 |
TransAct Technologies | | 78,600 | | | | 422,082 |
| | | | | |
| | | | | | | 7,314,198 |
| |
| Total (Cost $78,794,174) | | | | | | 89,255,396 |
| |
| | | | | | | |
| MATERIALS – 6.9% | | | | | | |
| CHEMICALS - 2.3% | | | | | | |
Balchem Corporation 2 | | 11,775 | | | | 784,686 |
†FutureFuel Corporation | | 126,700 | | | | 1,649,634 |
Hawkins 2 | | 29,697 | | | | 1,286,771 |
KMG Chemicals | | 58,300 | | | | 1,166,000 |
Landec Corporation 1 | | 75,610 | | | | 1,044,174 |
Quaker Chemical | | 30,400 | | | | 2,798,016 |
| | | | | |
| | | | | | | 8,729,281 |
| | | | | |
| CONSTRUCTION MATERIALS - 0.6% | | | | | | |
Ash Grove Cement 4 | | 8,000 | | | | 1,612,000 |
Monarch Cement 4 | | 28,803 | | | | 792,082 |
| | | | | |
| | | | | | | 2,404,082 |
| | | | | |
| CONTAINERS & PACKAGING - 0.3% | | | | | | |
UFP Technologies 1 | | 44,336 | | | | 1,090,001 |
| | | | | |
| METALS & MINING - 3.7% | | | | | | |
AuRico Gold | | 91,250 | | | | 299,300 |
Central Steel & Wire 4 | | 788 | | | | 588,833 |
Comstock Mining 1 | | 565,000 | | | | 429,400 |
Exeter Resource 1 | | 196,500 | | | | 115,876 |
Geodrill 1 | | 252,300 | | | | 125,955 |
Haynes International 2 | | 48,801 | | | | 2,366,848 |
Hecla Mining | | 44,518 | | | | 124,205 |
Horsehead Holding Corporation 1,2,3 | | 11,900 | | | | 188,377 |
Imdex 1 | | 633,900 | | | | 245,766 |
MAG Silver 1 | | 96,050 | | | | 782,808 |
Major Drilling Group International | | 460,857 | | | | 2,265,014 |
Materion Corporation | | 50,000 | | | | 1,761,500 |
Midway Gold 1 | | 345,000 | | | | 255,300 |
Olympic Steel | | 103,100 | | | | 1,833,118 |
Pretium Resources 1 | | 90,000 | | | | 519,797 |
RTI International Metals 1,2,3 | | 25,000 | | | | 631,500 |
Universal Stainless & Alloy Products 1 | | 74,800 | | | | 1,881,220 |
| | | | | |
| | | | | | | 14,414,817 |
| | | | | |
| PAPER & FOREST PRODUCTS - 0.0% | | | | | | |
Qunxing Paper Holdings 1,5 | | 1,500,000 | | | | 19,343 |
| |
| Total (Cost $25,330,529) | | | | | | 26,657,524 |
| |
| | | | | | | |
| UTILITIES – 0.0% | | | | | | |
| INDEPENDENT POWER & RENEWABLE ELECTRICITY PRODUCER - 0.0% | | | | | | |
Alterra Power 1 | | 450,000 | | | | 125,882 |
| |
| Total (Cost $200,516) | | | | | | 125,882 |
| |
| | | | | | | |
| MISCELLANEOUS6 – 4.9% | | | | | | |
| |
| Total (Cost $19,329,253) | | | | | | 18,888,585 |
| |
| | | | | | | |
| TOTAL COMMON STOCKS | | | | | | |
| |
| (Cost $352,532,248) | | | | | | 424,113,041 |
| |
| THE ACCOMPANYING NOTES ARE AN INTEGRAL PART OF THESE FINANCIAL STATEMENTS | | 2014 Annual Report to Stockholders | 35 |
| Royce Micro-Cap Trust | | December 31, 2014 |
| | | | | | | |
| |
| Schedule of Investments (continued) | | | | | | |
| | | | | | | |
| | | SHARES | | | VALUE | |
| |
| | | | | | | |
| PREFERRED STOCK – 0.3% | | | | | | |
Seneca Foods Conv.1,4 | | 45,409 | | $ | 1,181,996 | |
| |
(Cost $578,719) | | | | | 1,181,996 | |
| |
| | | | | | | |
| REPURCHASE AGREEMENT – 0.7% | | | | | | |
| Fixed Income Clearing Corporation, 0.00% dated 12/31/14, due 1/2/15, maturity value $2,656,000 (collateralized by obligations of various U.S. Government Agencies, 0.75% due 10/31/17, valued at $2,709,563) |
| | | | | | | |
| |
| (Cost $2,656,000) | | | | | 2,656,000 | |
| |
| | | | | | | |
| TOTAL INVESTMENTS – 110.4% | | | | | | |
| |
| (Cost $355,766,967) | | | | | 427,951,037 | |
| |
| | | | | | | |
| | | | | | | |
| LIABILITIES LESS CASH AND OTHER ASSETS – (10.4)% | | | | | (40,463,062 | ) |
| | | | | |
| | | | | | | |
| |
| NET ASSETS – 100.0% | | | | $ | 387,487,975 | |
| |
| † | New additions in 2014. |
| 1 | Non-income producing. |
| 2 | All or a portion of these securities were pledged as collateral in connection with the revolving credit agreement at December 31, 2014. Total market value of pledged securities at December 31, 2014, was $96,173,597. |
| 3 | At December 31, 2014, a portion of these securities were rehypothecated in connection with the Fund’s revolving credit agreement in the aggregate amount of $27,492,842. |
| 4 | These securities are defined as Level 2 securities due to fair value being based on quoted prices for similar securities. See Notes to Financial Statements. |
| 5 | Securities for which market quotations are not readily available represent 0.1% of net assets. These securities have been valued at their fair value under procedures approved by the Fund’s Board of Directors. These securities are defined as Level 3 securities due to the use of significant unobservable inputs in the determination of fair value. See Notes to Financial Statements. |
| 6 | Includes securities first acquired in 2014 and less than 1% of net assets. |
| | |
| | Bold indicates the Fund’s 20 largest equity holdings in terms of December 31, 2014, market value. |
| | |
| | TAX INFORMATION: The cost of total investments for Federal income tax purposes was $358,198,776. At December 31, 2014, net unrealized appreciation for all securities was $69,752,261, consisting of aggregate gross unrealized appreciation of $104,023,303 and aggregate gross unrealized depreciation of $34,271,042. The primary difference between book and tax basis cost is the timing of the recognition of losses on securities sold. |
| 36 | 2014 Annual Report to Stockholders | | THE ACCOMPANYING NOTES ARE AN INTEGRAL PART OF THESE FINANCIAL STATEMENTS |
| Royce Micro-Cap Trust | | December 31, 2014 |
| | | | | |
| |
| Statement of Assets and Liabilities | | | | |
| | | | | |
| ASSETS: | | | | |
| Total investments at value | | $ | 425,295,037 | |
| |
| Repurchase agreements (at cost and value) | | | 2,656,000 | |
| |
| Cash and foreign currency | | | 186 | |
| |
| Receivable for investments sold | | | 20,320,036 | |
| |
| Receivable for dividends and interest | | | 340,072 | |
| |
| Prepaid expenses and other assets | | | 25,699 | |
| |
| Total Assets | | | 448,637,030 | |
| |
| LIABILITIES: | | | | |
| Revolving credit agreement | | | 60,000,000 | |
| |
| Payable for investments purchased | | | 665,684 | |
| |
| Payable for investment advisory fee | | | 351,353 | |
| |
| Payable for directors’ fees | | | 23,147 | |
| |
| Payable for interest expense | | | 3,962 | |
| |
| Accrued expenses | | | 104,909 | |
| |
| Total Liabilities | | | 61,149,055 | |
| |
| Net Assets | | $ | 387,487,975 | |
| |
| ANALYSIS OF NET ASSETS: | | | | |
| Paid-in capital - $0.001 par value per share; 34,185,464 shares outstanding (150,000,000 shares authorized) | | $ | 289,687,913 | |
| |
| Undistributed net investment income (loss) | | | (1,763,387 | ) |
| |
| Accumulated net realized gain (loss) on investments and foreign currency | | | 27,385,489 | |
| |
| Net unrealized appreciation (depreciation) on investments and foreign currency | | | 72,177,960 | |
| |
| Net Assets (net asset value per share - $11.33) | | $ | 387,487,975 | |
| |
| Investments at identified cost | | $ | 353,110,967 | |
| |
| THE ACCOMPANYING NOTES ARE AN INTEGRAL PART OF THESE FINANCIAL STATEMENTS | | 2014 Annual Report to Stockholders | 37 |
| Royce Micro-Cap Trust | | Year Ended December 31, 2014 |
| |
| Statement of Operations | | | | |
| | | | | |
| INVESTMENT INCOME: | | | | |
| INCOME: | | | | |
| Dividends | | $ | 4,549,037 | |
| |
| Foreign withholding tax | | | (91,626 | ) |
| |
| Rehypothecation income | | | 116,882 | |
| |
| Total income | | | 4,574,293 | |
| |
| EXPENSES: | | | | |
| |
| Investment advisory fees | | | 3,921,649 | |
| |
| Interest expense | | | 541,552 | |
| |
| Stockholder reports | | | 150,861 | |
| |
| Custody and transfer agent fees | | | 98,826 | |
| |
| Directors’ fees | | | 83,171 | |
| |
| Professional fees | | | 53,558 | |
| |
| Administrative and office facilities | | | 48,144 | |
| |
| Other expenses | | | 59,471 | |
| |
| Total expenses | | | 4,957,232 | |
| |
| Compensating balance credits | | | (7 | ) |
| |
| Net expenses | | | 4,957,225 | |
| |
| Net investment income (loss) | | | (382,932 | ) |
| |
| REALIZED AND UNREALIZED GAIN (LOSS) ON INVESTMENTS AND FOREIGN CURRENCY: | | | | |
| NET REALIZED GAIN (LOSS): | | | | |
| |
| Investments in Non-Affiliated Companies | | | 92,315,444 | |
| |
| Investments in Affiliated Companies | | | 2,201,756 | |
| |
| Foreign currency transactions | | | (13,142 | ) |
| |
| NET CHANGE IN UNREALIZED APPRECIATION (DEPRECIATION): | | | | |
| |
| Investments and foreign currency translations | | | (85,893,164 | ) |
| |
| Other assets and liabilities denominated in foreign currency | | | (9,910 | ) |
| |
| Net realized and unrealized gain (loss) on investments and foreign currency | | | 8,600,984 | |
| |
| NET INCREASE (DECREASE) IN NET ASSETS FROM INVESTMENT OPERATIONS | | $ | 8,218,052 | |
| |
| 38 | 2014 Annual Report to Stockholders | | THE ACCOMPANYING NOTES ARE AN INTEGRAL PART OF THESE FINANCIAL STATEMENTS |
Royce Micro-Cap Trust
| |
| Statement of Changes in Net Assets | | | | | | | | |
| | | | | | | | | |
| | | | | | | | | |
| | | | YEAR ENDED 12/31/14 | | | YEAR ENDED 12/31/13 |
| |
| | | | | | | | | |
| INVESTMENT OPERATIONS: | | | | | | | | |
| Net investment income (loss) | | $ | (382,932 | ) | | $ | 290,965 | |
| |
| Net realized gain (loss) on investments and foreign currency | | | 94,504,058 | | | | 56,051,091 | |
| |
| Net change in unrealized appreciation (depreciation) on investments and foreign currency | | | (85,903,074 | ) | | | 80,679,878 | |
| |
| Net increase (decrease) in net assets from investment operations | | | 8,218,052 | | | | 137,021,934 | |
| |
| DISTRIBUTIONS: | | | | | | | | |
| Net investment income | | | (1,343,094 | ) | | | (933,371 | ) |
| |
| Net realized gain on investments and foreign currency | | | (89,530,419 | ) | | | (39,825,192 | ) |
| |
| Total distributions | | | (90,873,513 | ) | | | (40,758,563 | ) |
| |
| CAPITAL STOCK TRANSACTIONS: | | | | | | | | |
| Reinvestment of distributions | | | 37,022,256 | | | | 18,312,849 | |
| |
| Total capital stock transactions | | | 37,022,256 | | | | 18,312,849 | |
| |
| Net Increase (Decrease) In Net Assets | | | (45,633,205 | ) | | | 114,576,220 | |
| |
| NET ASSETS: | | | | | | | | |
| |
| Beginning of year | | | 433,121,180 | | | | 318,544,960 | |
| |
End of year (including undistributed net investment income (loss) of $(1,763,387) at 12/31/14 and $(612,327) at 12/31/13) | | $ | 387,487,975 | | | $ | 433,121,180 | |
| |
| THE ACCOMPANYING NOTES ARE AN INTEGRAL PART OF THESE FINANCIAL STATEMENTS | | 2014 Annual Report to Stockholders | 39 |
| Royce Micro-Cap Trust | | December 31, 2014 |
| |
| Statement of Cash Flows | | | | |
| | | | | |
| CASH FLOWS FROM OPERATING ACTIVITIES: | | | | |
| Net increase (decrease) in net assets from investment operations | | $ | 8,218,052 | |
| |
| Adjustments to reconcile net increase (decrease) in net assets from investment operations to net cash provided by operating activities: | | | | |
| |
Purchases of long-term investments | | | (177,191,465 | ) |
| |
Proceeds from sales and maturities of long-term investments | | | 202,364,759 | |
| |
Net purchases, sales and maturities of short-term investments | | | 13,745,000 | |
| |
Net (increase) decrease in dividends and interest receivable and other assets | | | 258,460 | |
| |
Net increase (decrease) in interest expense payable, accrued expenses and other liabilities | | | 58,681 | |
| |
Net change in unrealized appreciation (depreciation) on investments | | | 85,893,164 | |
| |
Net realized gain on investments and foreign currency | | | (94,504,058 | ) |
| |
| Net cash provided by operating activities | | | 38,842,593 | |
| |
| CASH FLOWS FROM FINANCING ACTIVITIES: | | | | |
| Net increase (decrease) in revolving credit agreement | | | 15,000,000 | |
| |
| Distributions | | | (90,873,513 | ) |
| |
| Reinvestment of distributions | | | 37,022,256 | |
| |
| Net cash used for financing activities | | | (38,851,257 | ) |
| |
| INCREASE (DECREASE) IN CASH: | | | (8,664 | ) |
| |
| Cash and foreign currency at beginning of year | | | 8,850 | |
| |
| Cash and foreign currency at end of year | | $ | 186 | |
| |
| 40 | 2014 Annual Report to Stockholders | | THE ACCOMPANYING NOTES ARE AN INTEGRAL PART OF THESE FINANCIAL STATEMENTS |
Royce Micro-Cap Trust
| |
| Financial Highlights |
| This table is presented to show selected data for a share of Common Stock outstanding throughout each period, and to assist stockholders in evaluating the Fund’s performance for the periods presented. |
| | | YEARS ENDED |
| | | |
| | | 12/31/14 | | 12/31/13 | | 12/31/12 | | 12/31/11 | | 12/31/10 |
| |
| Net Asset Value, Beginning of Period | | $ | 14.12 | | | $ | 10.93 | | | $ | 9.86 | | | $ | 11.34 | | | $ | 8.90 | |
| |
| INVESTMENT OPERATIONS: | | | | | | | | | | | | | | | | | | | | |
| Net investment income (loss) | | | (0.01 | ) | | | 0.01 | | | | 0.15 | | | | 0.04 | | | | 0.08 | |
| |
| Net realized and unrealized gain (loss) on investments and foreign currency | | | 0.25 | | | | 4.64 | | | | 1.58 | | | | (0.82 | ) | | | 2.58 | |
| |
| Total investment operations | | | 0.24 | | | | 4.65 | | | | 1.73 | | | | (0.78 | ) | | | 2.66 | |
| |
| DISTRIBUTIONS TO PREFERRED STOCKHOLDERS: | | | | | | | | | | | | | | | | | | | | |
| Net investment income | | | – | | | | – | | | | (0.02 | ) | | | (0.02 | ) | | | (0.10 | ) |
| |
| Net realized gain on investments and foreign currency | | | – | | | | – | | | | (0.09 | ) | | | (0.11 | ) | | | (0.03 | ) |
| |
| Total distributions to Preferred Stockholders | | | – | | | | – | | | | (0.11 | ) | | | (0.13 | ) | | | (0.13 | ) |
| |
Net Increase (Decrease) in Net Assets Applicable to Common Stockholders from Investment Operations | | | 0.24 | | | | 4.65 | | | | 1.62 | | | | (0.91 | ) | | | 2.53 | |
| |
| DISTRIBUTIONS TO COMMON STOCKHOLDERS: | | | | | | | | | | | | | | | | | | | | |
| Net investment income | | | (0.04 | ) | | | (0.03 | ) | | | (0.08 | ) | | | (0.05 | ) | | | (0.06 | ) |
| |
| Net realized gain on investments and foreign currency | | | (2.86 | ) | | | (1.35 | ) | | | (0.43 | ) | | | (0.24 | ) | | | (0.02 | ) |
| |
| Return of capital | | | – | | | | – | | | | – | | | | (0.24 | ) | | | – | |
| |
| Total distributions to Common Stockholders | | | (2.90 | ) | | | (1.38 | ) | | | (0.51 | ) | | | (0.53 | ) | | | (0.08 | ) |
| |
| CAPITAL STOCK TRANSACTIONS: | | | | | | | | | | | | | | | | | | | | |
| Effect of reinvestment of distributions by Common Stockholders | | | (0.13 | ) | | | (0.08 | ) | | | (0.04 | ) | | | (0.04 | ) | | | (0.01 | ) |
| |
| Total capital stock transactions | | | (0.13 | ) | | | (0.08 | ) | | | (0.04 | ) | | | (0.04 | ) | | | (0.01 | ) |
| |
| Net Asset Value, End of Period | | $ | 11.33 | | | $ | 14.12 | | | $ | 10.93 | | | $ | 9.86 | | | $ | 11.34 | |
| |
| Market Value, End of Period | | $ | 10.08 | | | $ | 12.61 | | | $ | 9.45 | | | $ | 8.77 | | | $ | 9.80 | |
| |
| TOTAL RETURN:1 | | | | | | | | | | | | | | | | | | | | |
| Net Asset Value | | | 3.46 | % | | | 44.66 | % | | | 17.23 | % | | | (7.69 | )% | | | 28.50 | % |
| |
| Market Value | | | 3.06 | % | | | 49.42 | % | | | 13.95 | % | | | (4.99 | )% | | | 34.10 | % |
| |
RATIOS BASED ON AVERAGE NET ASSETS APPLICABLE TO COMMON STOCKHOLDERS: | | | | | | | | | | | | | | | | |
| Investment advisory fee expense2 | | | 0.93 | % | | | 0.82 | % | | | 1.12 | % | | | 0.97 | % | | | 0.97 | % |
| |
| Other operating expenses | | | 0.25 | % | | | 0.29 | % | | | 0.18 | % | | | 0.15 | % | | | 0.15 | % |
| |
| Total expenses (net)3 | | | 1.18 | % | | | 1.11 | % | | | 1.30 | % | | | 1.12 | % | | | 1.12 | % |
| |
| Expenses net of fee waivers and excluding interest expense | | | 1.05 | % | | | 0.96 | % | | | 1.27 | % | | | 1.12 | % | | | 1.12 | % |
| |
| Expenses prior to fee waivers and balance credits | | | 1.18 | % | | | 1.11 | % | | | 1.32 | % | | | 1.15 | % | | | 1.17 | % |
| |
| Expenses prior to fee waivers | | | 1.18 | % | | | 1.11 | % | | | 1.32 | % | | | 1.15 | % | | | 1.17 | % |
| |
| Net investment income (loss) | | | (0.09 | )% | | | 0.08 | % | | | 1.46 | % | | | 0.40 | % | | | 0.84 | % |
| |
| SUPPLEMENTAL DATA: | | | | | | | | | | | | | | | | | | | | |
| |
| Net Assets Applicable to Common Stockholders, End of Period (in thousands) | | $ | 387,488 | | | $ | 433,121 | | | $ | 318,545 | | | $ | 279,292 | | | $ | 311,279 | |
| |
| Liquidation Value of Preferred Stock, End of Period (in thousands) | | | | | | | | | | | | | | $ | 60,000 | | | $ | 60,000 | |
| |
| Portfolio Turnover Rate | | | 41 | % | | | 29 | % | | | 28 | % | | | 30 | % | | | 27 | % |
| |
| PREFERRED STOCK: | | | | | | | | | | | | | | | | | | | | |
| Total shares outstanding | | | | | | | | | | | | | | | 2,400,000 | | | | 2,400,000 | |
| |
| Asset coverage per share | | | | | | | | | | | | | | $ | 141.37 | | | $ | 154.70 | |
| |
| Liquidation preference per share | | | | | | | | | | | | | | $ | 25.00 | | | $ | 25.00 | |
| |
| Average month-end market value per share | | | | | | | | | | | | | | $ | 25.41 | | | $ | 25.11 | |
| |
| REVOLVING CREDIT AGREEMENT: | | | | | | | | | | | | | | | | | | | | |
| |
| Asset coverage | | | 746 | % | | | 1062 | % | | | 808 | % | | | | | | | | |
| |
| Asset coverage per $1,000 | | $ | 7,458 | | | $ | 10,625 | | | $ | 8,079 | | | | | | | | | |
| |
| 1 | The Market Value Total Return is calculated assuming a purchase of Common Stock on the opening of the first business day and a sale on the closing of the last business day of each period. Dividends and distributions are assumed for the purposes of this calculation to be reinvested at prices obtained under the Fund’s Distribution Reinvestment and Cash Purchase Plan. Net Asset Value Total Return is calculated on the same basis, except that the Fund’s net asset value is used on the purchase and sale dates instead of market value. |
| 2 | The investment advisory fee is calculated based on average net assets over a rolling 36-month basis, while the above ratios of investment advisory fee expenses are based on the average net assets applicable to Common Stockholders over a 12-month basis. |
| 3 | Expense ratios based on total average net assets including liquidation value of Preferred Stock were 1.10%, 0.93% and 0.91% for the years ended December 31, 2012, 2011 and 2010, respectively. |
| THE ACCOMPANYING NOTES ARE AN INTEGRAL PART OF THESE FINANCIAL STATEMENTS | | 2014 Annual Report to Stockholders | 41 |
Royce Micro-Cap Trust
Notes to Financial Statements
Summary of Significant Accounting Policies
Royce Micro-Cap Trust, Inc. (the "Fund"), is a diversified closed-end investment company that was incorporated under the laws of the State of Maryland on September 9, 1993. The Fund commenced operations on December 14, 1993.
The preparation of financial statements in conformity with accounting principles generally accepted in the United States of America requires management to make estimates and assumptions that affect the reported amounts of assets and liabilities and the disclosure of contingent assets and liabilities at the date of the financial statements and the reported amounts of income and expenses during the reporting period. Actual results could differ from those estimates.
The Fund is an investment company and accordingly follows the investment company accounting and reporting guidance of the Financial Accounting Standards Board (FASB) Accounting Standard Codification Topic 946 “Financial Services-Investment Companies”.
VALUATION OF INVESTMENTS:
Securities are valued as of the close of trading on the New York Stock Exchange (NYSE) (generally 4:00 p.m. Eastern time) on the valuation date. Securities that trade on an exchange, and securities traded on Nasdaq’s Electronic Bulletin Board, are valued at their last reported sales price or Nasdaq official closing price taken from the primary market in which each security trades or, if no sale is reported for such day, at their highest bid price. Other over-the-counter securities for which market quotations are readily available are valued at their highest bid price, except in the case of some bonds and other fixed income securities which may be valued by reference to other securities with comparable ratings, interest rates and maturities, using established independent pricing services. The Fund values its non-U.S. dollar denominated securities in U.S. dollars daily at the prevailing foreign currency exchange rates as quoted by a major bank. Securities for which market quotations are not readily available are valued at their fair value in accordance with the provisions of the 1940 Act, under procedures approved by the Fund’s Board of Directors, and are reported as Level 3 securities. As a general principle, the fair value of a security is the amount which the Fund might reasonably expect to receive for the security upon its current sale. However, in light of the judgment involved in fair valuations, there can be no assurance that a fair value assigned to a particular security will be the amount which the Fund might be able to receive upon its current sale. In addition, if, between the time trading ends on a particular security and the close of the customary trading session on the NYSE, events occur that are significant and may make the closing price unreliable, the Fund may fair value the security. The Fund uses an independent pricing service to provide fair value estimates for relevant non-U.S. equity securities on days when the U.S. market volatility exceeds a certain threshold. This pricing service uses proprietary correlations it has developed between the movement of prices of non-U.S. equity securities and indices of U.S.-traded securities, futures contracts and other indications to estimate the fair value of relevant non-U.S. securities. When fair value pricing is employed, the prices of securities used by the Fund may differ from quoted or published prices for the same security. Investments in money market funds are valued at net asset value per share.
Various inputs are used in determining the value of the Fund’s investments, as noted above. These inputs are summarized in the three broad levels below:
| | Level 1 | – | quoted prices in active markets for identical securities. |
| | Level 2 | – | other significant observable inputs (including quoted prices for similar securities, foreign securities that may be fair valued and repurchase agreements). The table below includes all Level 2 securities. Level 2 securities with values based on quoted prices for similar securities are noted in the Schedule of Investments. |
| | Level 3 | – | significant unobservable inputs (including last trade price before trading was suspended, or at a discount thereto for lack of marketability or otherwise, market price information regarding other securities, information received from the company and/or published documents, including SEC filings and financial statements, or other publicly available information). |
The inputs or methodology used for valuing securities are not necessarily an indication of the risk associated with investing in those securities.
The following is a summary of the inputs used to value the Fund’s investments as of December 31, 2014. For a detailed breakout of common stocks by sector classification, please refer to the Schedule of Investments.
| | | | LEVEL 1 | | | LEVEL 2 | | | | LEVEL 3 | | | TOTAL |
| |
| Common Stocks | | $ | 396,037,385 | | $ | 27,749,954 | | | $ | 325,702 | | $ | 424,113,041 |
| |
| Preferred Stocks | | | – | | | 1,181,996 | | | | – | | | 1,181,996 |
| |
| Cash Equivalents | | | – | | | 2,656,000 | | | | – | | | 2,656,000 |
| |
For the year ended December 31, 2014, certain securities have transferred in and out of Level 1 and Level 2 measurements. The Fund recognizes transfers between levels as of the end of the reporting period. At December 31, 2014, securities valued at $9,556,664 were transferred from Level 1 to Level 2 within the fair value hierarchy.
| 42 | 2014 Annual Report to Stockholders |
Royce Micro-Cap Trust
Notes to Financial Statements (continued)
VALUATION OF INVESTMENTS (continued):
| Level 3 Reconciliation: | | | | | | | | | |
| | | | BALANCE AS OF 12/31/13 | | | UNREALIZED GAIN (LOSS)1 | | | BALANCE AS OF 12/31/14 |
| |
| Common Stocks | | | $139,469 | | | $186,233 | | | $325,702 |
| |
| 1 | The net change in unrealized appreciation (depreciation) is included in the accompanying Statement of Operations. Change in unrealized appreciation (depreciation) includes net unrealized appreciation (depreciation) resulting from changes in investment values during the reporting period and the reversal of previously recorded unrealized appreciation (depreciation) when gains or losses are realized. Net realized gain (loss) from investments and foreign currency transactions is included in the accompanying Statement of Operations. |
REPURCHASE AGREEMENTS:
The Fund may enter into repurchase agreements with institutions that the Fund’s investment adviser has determined are creditworthy. The Fund restricts repurchase agreements to maturities of no more than seven days. Securities pledged as collateral for repurchase agreements, which are held until maturity of the repurchase agreements, are marked-to-market daily and maintained at a value at least equal to the principal amount of the repurchase agreement (including accrued interest). Repurchase agreements could involve certain risks in the event of default or insolvency of the counter-party, including possible delays or restrictions upon the ability of the Fund to dispose of its underlying securities.
FOREIGN CURRENCY:
Net realized foreign exchange gains or losses arise from sales and maturities of short-term securities, sales of foreign currencies, expiration of currency forward contracts, currency gains or losses realized between the trade and settlement dates on securities transactions, and the difference between the amounts of dividends, interest, and foreign withholding taxes recorded on the Fund’s books and the U.S. dollar equivalent of the amounts actually received or paid. Net unrealized foreign exchange gains and losses arise from changes in the value of assets and liabilities, including investments in securities at the end of the reporting period, as a result of changes in foreign currency exchange rates.
TAXES:
As a qualified regulated investment company under Subchapter M of the Internal Revenue Code, the Fund is not subject to income taxes to the extent that it distributes substantially all of its taxable income for its fiscal year. The Schedule of Investments includes information regarding income taxes under the caption “Tax Information”.
DISTRIBUTIONS:
The Fund pays quarterly distributions on the Fund’s Common Stock at the annual rate of 7% of the rolling average of the prior four calendar quarter-end NAVs of the Fund’s Common Stock, with the fourth quarter distribution being the greater of 1.75% of the rolling average or the distribution required by IRS regulations. Prior to November 15, 2012, distributions to Preferred Stockholders were accrued daily and paid quarterly. Distributions to Common Stockholders are recorded on ex-dividend date. Distributable capital gains and/or net investment income were first allocated to Preferred Stockholder distributions, with any excess allocable to Common Stockholders. If capital gains and/or net investment income were allocated to both Preferred and Common Stockholders, the tax character of such allocations was proportional. To the extent that distributions are not paid from long-term capital gains, net investment income or net short-term capital gains, they will represent a return of capital. Distributions are determined in accordance with income tax regulations that may differ from accounting principles generally accepted in the United States of America. Permanent book and tax differences relating to stockholder distributions will result in reclassifications within the capital accounts. Undistributed net investment income may include temporary book and tax basis differences, which will reverse in a subsequent period. Any taxable income or gain remaining undistributed at fiscal year end is distributed in the following year.
INVESTMENT TRANSACTIONS AND RELATED INVESTMENT INCOME:
Investment transactions are accounted for on the trade date. Dividend income is recorded on the ex-dividend date. Non-cash dividend income is recorded at the fair market value of the securities received. Interest income is recorded on an accrual basis. Premium and discounts on debt securities are amortized using the effective yield-to-maturity method. Realized gains and losses from investment transactions are determined on the basis of identified cost for book and tax purposes.
EXPENSES:
The Fund incurs direct and indirect expenses. Expenses directly attributable to the Fund are charged to the Fund’s operations, while expenses applicable to more than one of the Royce Funds are allocated equitably. Certain personnel, occupancy costs and other administrative expenses related to the Funds are allocated by Royce & Associates, LLC (“Royce”) under an administration agreement and are included in administrative and office facilities and professional fees. The Fund has adopted a deferred fee agreement that allows the Directors to defer the receipt of all or a portion of directors’ fees otherwise payable. The deferred fees are invested in certain Royce Funds until distributed in accordance with the agreement.
| 2014 Annual Report to Stockholders | 43 |
Royce Micro-Cap Trust
Notes to Financial Statements (continued)
COMPENSATING BALANCE CREDITS:
The Fund has an arrangement with its custodian bank, whereby a portion of the custodian’s fee is paid indirectly by credits earned on the Fund’s cash on deposit with the bank. This deposit arrangement is an alternative to purchasing overnight investments. Conversely, the Fund pays interest to the custodian on any cash overdrafts, to the extent they are not offset by credits earned on positive cash balances.
Capital Stock:
The Fund issued 3,505,620 and 1,542,544 shares of Common Stock as reinvestment of distributions for the years ended December 31, 2014 and December 31, 2013, respectively.
Borrowings:
The Fund has entered into a revolving credit agreement (the credit agreement) with BNP Paribas Prime Brokerage Inc. (BNPP). The Fund pays a commitment fee of 0.50% per annum on the unused portion of the credit agreement. The credit agreement has a 360-day rolling term that resets daily; however, if the Fund exceeds certain net asset value triggers, the credit agreement may convert to a 60-day rolling term that resets daily. The Fund is required to pledge portfolio securities as collateral in an amount up to two times the loan balance outstanding and has granted a security interest in the securities pledged to, and in favor of, BNPP as security for the loan balance outstanding. If the Fund fails to meet certain requirements, or maintain other financial covenants required under the credit agreement, the Fund may be required to repay immediately, in part or in full, the loan balance outstanding under the credit agreement necessitating the sale of portfolio securities at potentially inopportune times. The credit agreement also permits, subject to certain conditions, BNPP to rehypothecate portfolio securities pledged by the Fund up to the amount of the loan balance outstanding. The Fund continues to receive payments in lieu of dividends and interest on rehypothecated securities. The Fund also has the right under the credit agreement to recall the rehypothecated securities from BNPP on demand. If BNPP fails to deliver the recalled security in a timely manner, the Fund is compensated by BNPP for any fees or losses related to the failed delivery or, in the event a recalled security is not returned by BNPP, the Fund, upon notice to BNPP, may reduce the loan balance outstanding by the amount of the recalled security failed to be returned. The Fund receives a portion of the fees earned by BNPP in connection with the rehypothecation of portfolio securities.
As of December 31, 2014, the Fund has outstanding borrowings of $60,000,000. During the year ended December 31, 2014, the Fund borrowed an average daily balance of $45,123,288 at a weighted average borrowing cost of 1.18%. The maximum amount outstanding during the year ended December 31, 2014 was $60,000,000. As of December 31, 2014, the aggregate value of rehypothecated securities was $27,492,842. During the year ended December 31, 2014, the Fund earned $116,882 in fees from rehypothecated securities.
Investment Advisory Agreement:
As compensation for its services under the Investment Advisory Agreement, Royce receives a fee comprised of a Basic Fee (“Basic Fee”) and an adjustment to the Basic Fee based on the investment performance of the Fund in relation to the investment record of the Russell 2000.
The Basic Fee is a monthly fee equal to 1/12 of 1% (1% on an annualized basis) of the average of the Fund’s month-end net assets applicable to Common Stockholders, plus the liquidation value of outstanding Preferred Stock, for the rolling 36-month period ending with such month (the "performance period"). The Basic Fee for each month is increased or decreased at the rate of 1/12 of .05% for each percentage point that the investment performance of the Fund exceeds, or is exceeded by, the percentage change in the investment record of the Russell 2000 for the performance period by more than two percentage points. The performance period for each such month is a rolling 36-month period ending with such month. The maximum increase or decrease in the Basic Fee for any month may not exceed 1/12 of .5%. Accordingly, for each month, the maximum monthly fee rate as adjusted for performance is 1/12 of 1.5% and is payable if the investment performance of the Fund exceeds the percentage change in the investment record of the Russell 2000 by 12 or more percentage points for the performance period, and the minimum monthly fee rate as adjusted for performance is 1/12 of .5% and is payable if the percentage change in the investment record of the Russell 2000 exceeds the investment performance of the Fund by 12 or more percentage points for the performance period.
For the twelve rolling 36-month periods in 2014, the Fund’s investment performance ranged from 0% to 5% above the investment performance of the Russell 2000. Accordingly, the net investment advisory fee consisted of a Basic Fee of $3,734,812 and a net upward adjustment of $186,837 for the performance of the Fund relative to that of the Russell 2000. For year ended December 31, 2014, the Fund accrued and paid Royce investment advisory fees totaling $3,921,649.
Purchases and Sales of Investment Securities:
For the year ended December 31, 2014, the costs of purchases and proceeds from sales of investment securities, other than short-term securities, amounted to $176,970,496 and $208,456,342, respectively.
| 44 | 2014 Annual Report to Stockholders |
Royce Micro-Cap Trust
Notes to Financial Statements (continued)
Distributions to Stockholders:
The tax character of distributions paid to common stockholders during 2014 and 2013 was as follows:
| DISTRIBUTIONS PAID FROM: | | | 2014 | | | 2013 |
| |
| Ordinary income | | | $15,250,124 | | | $ 8,388,113 |
| |
| Long-term capital gain | | | 75,623,389 | | | 32,370,450 |
| |
| | | | $90,873,513 | | | $40,758,563 |
| |
As of December 31, 2014, the tax basis components of distributable earnings included in stockholders’ equity were as follows:
| Net unrealized appreciation (depreciation) | | | $69,746,151 |
| |
| Undistributed ordinary income | | | 3,465,207 |
| |
| Undistributed capital gains | | | 24,588,704 |
| |
| | | | $97,800,062 |
| |
The difference between book and tax basis unrealized appreciation (depreciation) is attributable primarily to the tax deferral on wash sales, partnership investments and the unrealized gains on Passive Foreign Investment Companies.
For financial reporting purposes, capital accounts and distributions to stockholders are adjusted to reflect the tax character of permanent book/tax differences. These differences are primarily due to differing treatments of income and gains on various investment securities and foreign currency transactions held by the Fund, timing differences and different characterization of distributions made by the Fund. For the year ended December 31, 2014, the Fund recorded the following permanent reclassifications. Results of operations and net assets were not affected by these reclassifications.
| | | | | | |
| UNDISTRIBUTED NET | | ACCUMULATED NET | | | PAID-IN |
| INVESTMENT INCOME | | REALIZED GAIN (LOSS) | | | CAPITAL |
| |
| $574,967 | | $(793,139) | | | $218,172 |
| |
Management has analyzed the Fund’s tax positions taken on federal income tax returns for all open tax years (2011-2014) and has concluded that as of December 31, 2014, no provision for income tax is required in the Fund’s financial statements.
Transactions in Affiliated Companies:
An “Affiliated Company” as defined in the Investment Company Act of 1940, is a company in which a fund owns 5% or more of the company’s outstanding voting securities at any time during the period. The Fund effected the following transactions in shares of such companies for the year ended December 31, 2014:
| | | SHARES | | MARKET VALUE | | COST OF | | COST OF | | REALIZED | | DIVIDEND | | SHARES | | MARKET VALUE |
| AFFILIATED COMPANY | | 12/31/13 | | 12/31/13 | | PURCHASES | | SALES | | GAIN (LOSS) | | INCOME | | 12/31/14 | | 12/31/14 |
| |
| Integrated Electrical Services1 | | 934,200 | | $5,035,338 | | $1,038,268 | | $1,738,234 | | $2,201,756 | | – | | | | |
| |
| | | | | $5,035,338 | | | | | | $2,201,756 | | | | | | |
| |
| 1 Not an Affiliated Company at December 31, 2014. |
| 2014 Annual Report to Stockholders | 45 |
Royce Micro-Cap Trust
Report of Independent Registered Public Accounting Firm
To the Board of Directors and Stockholders of
Royce Micro-Cap Trust, Inc.
New York, New York
We have audited the accompanying statement of assets and liabilities of Royce Micro-Cap Trust, Inc., (“Fund”) including the schedule of investments, as of December 31, 2014, and the related statement of operations and statement of cash flows for the year then ended, the statements of changes in net assets for each of the two years in the period then ended and the financial highlights for each of the five years in the period then ended. These financial statements and financial highlights are the responsibility of the Fund’s management. Our responsibility is to express an opinion on these financial statements and financial highlights based on our audits.
We conducted our audits in accordance with the standards of the Public Company Accounting Oversight Board (United States). Those standards require that we plan and perform the audit to obtain reasonable assurance about whether the financial statements and financial highlights are free of material misstatement. The Fund is not required to have, nor were we engaged to perform, an audit of its internal control over financial reporting. Our audits included consideration of internal control over financial reporting as a basis for designing audit procedures that are appropriate in the circumstances, but not for the purpose of expressing an opinion on the effectiveness of the Fund’s internal control over financial reporting. Accordingly, we express no such opinion. An audit includes examining, on a test basis, evidence supporting the amounts and disclosures in the financial statements. Our procedures included confirmation of securities owned as of December 31, 2014, by correspondence with the custodian and brokers. An audit also includes assessing the accounting principles used and significant estimates made by management, as well as evaluating the overall financial statement presentation. We believe that our audits provide a reasonable basis for our opinion.
In our opinion, the financial statements and financial highlights referred to above present fairly, in all material respects, the financial position of Royce Micro-Cap Trust, Inc. at December 31, 2014, the results of its operations and its cash flows for the year then ended, the changes in its net assets for each of the two years in the period then ended and the financial highlights for each of the five years in the period then ended, in conformity with accounting principles generally accepted in the United States of America.
TAIT, WELLER, & BAKER LLP
Philadelphia, Pennsylvania
February 23, 2015
| 46 | 2014 Annual Report to Stockholders |
| Royce Global Value Trust | | December 31, 2014 |
| |
| Schedule of Investments | | | | | | |
| Common Stocks – 100.3% | | | | | | |
| | | SHARES | | | | VALUE |
| |
| | | | | | | |
| ARGENTINA – 0.6% | | | | | | |
†BBVA Banco Frances ADR | | 44,000 | | | $ | 606,760 |
| |
| Total (Cost $277,917) | | | | | | 606,760 |
| |
| | | | | | | |
| AUSTRALIA – 1.3% | | | | | | |
†ALS | | 45,300 | | | | 196,017 |
†Collection House | | 137,821 | | | | 232,936 |
Imdex 1 | | 1,174,100 | | | | 455,204 |
†Medusa Mining 1 | | 82,600 | | | | 43,955 |
†Programmed Maintenance Services | | 71,600 | | | | 149,673 |
†TFS Corporation | | 85,000 | | | | 106,704 |
†Webjet | | 31,300 | | | | 73,482 |
| |
| Total (Cost $1,916,986) | | | | | | 1,257,971 |
| |
| | | | | | | |
| AUSTRIA – 2.0% | | | | | | |
Mayr-Melnhof Karton | | 7,500 | | | | 778,314 |
Semperit AG Holding | | 19,300 | | | | 933,929 |
†Zumtobel Group | | 8,200 | | | | 184,695 |
| |
| Total (Cost $1,911,857) | | | | | | 1,896,938 |
| |
| | | | | | | |
| BELGIUM – 1.9% | | | | | | |
†Ion Beam Applications 1 | | 20,300 | | | | 352,161 |
†Picanol Group 1 | | 1,400 | | | | 44,963 |
RHJ International 1 | | 153,000 | | | | 854,661 |
Van de Velde | | 10,936 | | | | 515,218 |
| |
| Total (Cost $3,492,887) | | | | | | 1,767,003 |
| |
| | | | | | | |
| BERMUDA – 1.6% | | | | | | |
†GP Investments BDR1 | | 47,500 | | | | 103,116 |
Lazard Cl. A | | 29,000 | | | | 1,450,870 |
| |
| Total (Cost $1,301,527) | | | | | | 1,553,986 |
| |
| | | | | | | |
| BRAZIL – 3.8% | | | | | | |
†Brasil Brokers Participacoes | | 292,500 | | | | 278,172 |
†Brasil Insurance Participacoes e Administracao | | 26,100 | | | | 33,060 |
CETIP - Mercados Organizados | | 102,000 | | | | 1,235,331 |
LPS Brasil Consultoria de Imoveis | | 152,000 | | | | 367,402 |
†MAHLE Metal Leve | | 25,000 | | | | 197,078 |
†Mills Estruturas e Servicos de Engenharia | | 12,800 | | | | 45,963 |
†T4F Entretenimento 1 | | 190,500 | | | | 206,421 |
Totvs | | 63,000 | | | | 828,932 |
†Valid Solucoes | | 25,000 | | | | 396,321 |
| |
| Total (Cost $4,863,695) | | | | | | 3,588,680 |
| |
| | | | | | | |
| CANADA – 7.9% | | | | | | |
Agnico Eagle Mines | | 20,000 | | | | 497,800 |
†AirBoss of America | | 10,300 | | | | 108,337 |
Alamos Gold | | 38,000 | | | | 271,475 |
†Canyon Services Group | | 10,900 | | | | 84,344 |
†COM DEV International | | 27,000 | | | | 92,727 |
†Computer Modelling Group | | 43,300 | | | | 445,001 |
E-L Financial | | 900 | | | | 529,093 |
†FLYHT Aerospace Solutions 1 | | 140,000 | | | | 44,586 |
Franco-Nevada Corporation | | 16,000 | | | | 787,040 |
†HNZ Group | | 5,700 | | | | 101,460 |
†Horizon North Logistics | | 41,100 | | | | 93,393 |
†Magellan Aerospace | | 34,000 | | | | 395,662 |
Major Drilling Group International | | 155,500 | | | | 764,249 |
†MTY Food Group | | 6,800 | | | | 197,304 |
†Pan American Silver | | 63,700 | | | | 586,040 |
Ritchie Bros. Auctioneers | | 54,300 | | | | 1,460,127 |
Sprott | | 430,600 | | | | 904,341 |
†Total Energy Services | | 5,200 | | | | 58,096 |
†Western Forest Products | | 39,100 | | | | 90,868 |
| |
| Total (Cost $9,723,869) | | | | | | 7,511,943 |
| |
| | | | | | | |
| CHILE – 0.1% | | | | | | |
†Forus | | 23,000 | | | | 95,760 |
| |
| Total (Cost $100,215) | | | | | | 95,760 |
| |
| | | | | | | |
| CHINA – 1.4% | | | | | | |
Daphne International Holdings | | 1,696,500 | | | | 615,429 |
†Daqo New Energy ADR 1 | | 1,800 | | | | 47,412 |
†Hopefluent Group Holdings | | 280,000 | | | | 86,898 |
†Noah Holdings ADR 1 | | 16,700 | | | | 349,030 |
†Pacific Online | | 402,700 | | | | 187,632 |
†Xtep International Holdings | | 213,000 | | | | 85,796 |
| |
| Total (Cost $2,059,730) | | | | | | 1,372,197 |
| |
| | | | | | | |
| CYPRUS – 0.2% | | | | | | |
†Globaltrans Investment GDR | | 42,000 | | | | 213,259 |
| |
| Total (Cost $480,518) | | | | | | 213,259 |
| |
| | | | | | | |
| DENMARK – 0.7% | | | | | | |
Chr Hansen | | 12,500 | | | | 556,186 |
†Zealand Pharma 1 | | 6,200 | | | | 83,613 |
| |
| Total (Cost $530,284) | | | | | | 639,799 |
| |
| | | | | | | |
| FINLAND – 1.3% | | | | | | |
†BasWare | | 1,100 | | | | 54,637 |
†Nokian Renkaat | | 9,000 | | | | 220,444 |
Vaisala Cl. A | | 35,000 | | | | 928,249 |
| |
| Total (Cost $1,721,960) | | | | | | 1,203,330 |
| |
| | | | | | | |
| FRANCE – 6.8% | | | | | | |
†aufeminin 1 | | 3,000 | | | | 92,307 |
Gaztransport Et Technigaz | | 16,000 | | | | 944,939 |
†Lectra | | 8,700 | | | | 96,230 |
Manutan International | | 12,700 | | | | 629,697 |
†Neurones | | 6,200 | | | | 103,964 |
†Nexity | | 18,500 | | | | 699,871 |
Paris Orleans | | 30,755 | | | | 661,790 |
†Prodware 1 | | 13,600 | | | | 115,177 |
†Societe Internationale de Plantations d’Heveas | | 6,500 | | | | 259,125 |
Stallergenes | | 17,800 | | | | 1,065,266 |
Vetoquinol | | 27,200 | | | | 1,181,514 |
Virbac | | 3,000 | | | | 629,432 |
| |
| Total (Cost $7,253,276) | | | | | | 6,479,312 |
| |
| | | | | | | |
| GERMANY – 2.7% | | | | | | |
Aixtron ADR 1 | | 53,300 | | | | 597,493 |
†Amadeus Fire | | 2,000 | | | | 150,443 |
†GFT Technologies | | 6,300 | | | | 93,893 |
†Hawesko Holding | | 1,500 | | | | 75,334 |
†KUKA | | 9,000 | | | | 638,565 |
LPKF Laser & Electronics | | 50,500 | | | | 661,649 |
†mutares | | 900 | | | | 77,206 |
†Schaltbau Holding | | 1,400 | | | | 71,248 |
†Tomorrow Focus | | 39,600 | | | | 180,967 |
†XING | | 406 | | | | 45,591 |
| |
| Total (Cost $3,585,984) | | | | | | 2,592,389 |
| |
| THE ACCOMPANYING NOTES ARE AN INTEGRAL PART OF THESE FINANCIAL STATEMENTS | | 2014 Annual Report to Stockholders | 47 |
Royce Global Value Trust
| |
| Schedule of Investments (continued) | | | | | | |
| | | | | | | |
| | | SHARES | | | | VALUE |
| |
| | | | | | | |
| GREECE – 0.4% | | | | | | |
Hellenic Exchanges - Athens Stock Exchange | | 48,000 | | | $ | 269,807 |
†StealthGas 1 | | 12,800 | | | | 80,768 |
| |
| Total (Cost $624,880) | | | | | | 350,575 |
| |
| | | | | | | |
| HONG KONG – 10.0% | | | | | | |
†Anxin-China Holdings | | 2,500,000 | | | | 158,646 |
†China Metal International Holdings | | 430,000 | | | | 148,561 |
†Comba Telecom Systems Holdings | | 332,540 | | | | 117,659 |
†First Pacific | | 180,000 | | | | 177,448 |
†Great Eagle Holdings | | 240,000 | | | | 776,985 |
†I.T | | 500,000 | | | | 144,124 |
†Le Saunda Holdings | | 268,600 | | | | 100,936 |
†Luen Thai Holdings | | 475,000 | | | | 86,865 |
Luk Fook Holdings (International) | | 120,100 | | | | 449,756 |
Midland Holdings 1 | | 2,150,000 | | | | 1,086,282 |
New World Department Store China | | 3,319,700 | | | | 1,061,273 |
Oriental Watch Holdings | | 2,223,000 | | | | 429,241 |
Pico Far East Holdings | | 6,396,400 | | | | 1,465,724 |
†Sitoy Group Holdings | | 425,000 | | | | 343,951 |
Television Broadcasts | | 161,000 | | | | 934,553 |
Texwinca Holdings | | 1,052,000 | | | | 908,457 |
†Tse Sui Luen Jewellery (International) | | 215,000 | | | | 80,320 |
Value Partners Group | | 896,700 | | | | 748,902 |
†YGM Trading | | 169,400 | | | | 306,974 |
| |
| Total (Cost $11,941,500) | | | | | | 9,526,657 |
| |
| | | | | | | |
| INDONESIA – 1.0% | | | | | | |
†Ramayana Lestari Sentosa | | 3,500,000 | | | | 223,449 |
| Selamat Sempurna | | 591,800 | | | | 225,719 |
| | 13,945,000 | | | | 500,833 |
| |
| Total (Cost $1,167,542) | | | | | | 950,001 |
| |
| | | | | | | |
| ISRAEL – 0.1% | | | | | | |
†Fox Wizel | | 2,900 | | | | 68,560 |
| |
| Total (Cost $63,203) | | | | | | 68,560 |
| |
| | | | | | | |
| ITALY – 0.7% | | | | | | |
De’Longhi | | 37,000 | | | | 670,105 |
| |
| Total (Cost $565,971) | | | | | | 670,105 |
| |
| | | | | | | |
| JAPAN – 11.0% | | | | | | |
EPS Corporation | | 112,500 | | | | 1,332,578 |
FamilyMart | | 8,200 | | | | 306,119 |
Freund Corporation | | 72,200 | | | | 626,153 |
†Fujimori Kogyo | | 3,300 | | | | 92,234 |
†GCA Savvian | | 8,300 | | | | 78,921 |
†G-Tekt Corporation | | 11,000 | | | | 104,290 |
†Itoki Corporation | | 34,300 | | | | 175,712 |
†Mandom Corporation | | 2,000 | | | | 65,691 |
†Milbon | | 3,100 | | | | 84,389 |
Miraial | | 20,000 | | | | 280,382 |
MISUMI Group | | 11,600 | | | | 381,030 |
Moshi Moshi Hotline | | 100,000 | | | | 912,096 |
†Namura Shipbuilding | | 9,600 | | | | 102,892 |
†Nishikawa Rubber | | 28,200 | | | | 480,254 |
†Nitto Kohki | | 26,600 | | | | 480,245 |
†Obara Group | | 3,900 | | | | 173,149 |
Relo Holdings | | 20,000 | | | | 1,419,988 |
†Ryobi | | 36,000 | | | | 97,546 |
Santen Pharmaceutical | | 10,000 | | | | 535,159 |
Shimano | | 5,600 | | | | 724,361 |
†SPARX Group | | 66,400 | | | | 111,750 |
†Sun Frontier Fudousan | | 8,000 | | | | 73,393 |
†T Hasegawa | | 7,000 | | | | 98,303 |
†Tokai Corporation/Gifu | | 14,400 | | | | 429,420 |
†Trancom | | 22,200 | | | | 894,266 |
†YAMADA Consulting Group | | 6,400 | | | | 164,642 |
†Zuiko Corporation | | 5,500 | | | | 238,054 |
| |
| Total (Cost $10,487,292) | | | | | | 10,463,017 |
| |
| | | | | | | |
| LUXEMBOURG – 0.1% | | | | | | |
†Atento1 | | 12,000 | | | | 125,400 |
| |
| Total (Cost $180,000) | | | | | | 125,400 |
| |
| | | | | | | |
| MALAYSIA – 1.6% | | | | | | |
†Asia Brands | | 82,000 | | | | 69,789 |
CB Industrial Product Holding | | 1,000,000 | | | | 574,263 |
†CB Industrial Product Holding (Warrants) 1 | | 166,666 | | | | 22,642 |
Media Chinese International | | 2,000,000 | | | | 428,932 |
†Media Prima | | 199,500 | | | | 99,725 |
†NTPM Holdings | | 1,742,300 | | | | 308,334 |
| |
| Total (Cost $1,689,993) | | | | | | 1,503,685 |
| |
| | | | | | | |
| MEXICO – 1.9% | | | | | | |
Bolsa Mexicana de Valores | | 650,000 | | | | 1,177,192 |
Fresnillo | | 55,000 | | | | 652,673 |
| |
| Total (Cost $2,160,619) | | | | | | 1,829,865 |
| |
| | | | | | | |
| NEW ZEALAND – 0.2% | | | | | | |
†Trade Me | | 83,000 | | | | 231,662 |
| |
| Total (Cost $280,441) | | | | | | 231,662 |
| |
| | | | | | | |
| NORWAY – 2.1% | | | | | | |
†Borregaard | | 15,200 | | | | 112,982 |
Ekornes | | 45,000 | | | | 573,636 |
†Oslo Bors VPS Holding | | 10,200 | | | | 104,012 |
TGS-NOPEC Geophysical | | 55,000 | | | | 1,189,999 |
| |
| Total (Cost $2,516,422) | | | | | | 1,980,629 |
| |
| | | | | | | |
| PHILIPPINES – 1.5% | | | | | | |
†Asian Terminals | | 375,000 | | | | 96,574 |
†GMA Holdings PDR | | 775,000 | | | | 116,110 |
Universal Robina | | 270,000 | | | | 1,175,997 |
| |
| Total (Cost $1,025,229) | | | | | | 1,388,681 |
| |
| | | | | | | |
| SINGAPORE – 2.8% | | | | | | |
Hour Glass (The) | | 1,458,000 | | | | 703,232 |
Pan-United Corporation | | 800,000 | | | | 507,251 |
†Parkson Retail Asia | | 277,700 | | | | 167,712 |
Silverlake Axis | | 1,360,000 | | | | 1,286,587 |
| |
| Total (Cost $2,509,157) | | | | | | 2,664,782 |
| |
| | | | | | | |
| SOUTH AFRICA – 5.1% | | | | | | |
Blue Label Telecoms | | 690,000 | | | | 524,650 |
†Cashbuild | | 30,000 | | | | 425,131 |
†Coronation Fund Managers | | 59,000 | | | | 582,147 |
JSE | | 67,500 | | | | 705,037 |
Lewis Group | | 100,000 | | | | 639,865 |
†Metrofile Holdings | | 321,700 | | | | 138,952 |
Nampak | | 200,000 | | | | 752,541 |
| 48 | 2014 Annual Report to Stockholders | | THE ACCOMPANYING NOTES ARE AN INTEGRAL PART OF THESE FINANCIAL STATEMENTS |
| |
| Schedule of Investments (continued) | | | | | | |
| | | | | | | |
| | | SHARES | | | | VALUE |
| |
| | | | | | | |
| SOUTH AFRICA (continued) | | | | | | |
†PSG Group | | 36,500 | | | $ | 402,585 |
Raubex Group | | 375,000 | | | | 711,594 |
| |
| Total (Cost $4,926,311) | | | | | | 4,882,502 |
| |
| | | | | | | |
| SOUTH KOREA – 1.5% | | | | | | |
†Eugene Technology | | 11,536 | | | | 169,077 |
†Handsome | | 11,400 | | | | 337,847 |
†Hankuk Carbon | | 10,000 | | | | 52,484 |
†Huvis Corporation 1 | | 22,100 | | | | 223,822 |
†Koh Young Technology | | 5,400 | | | | 209,731 |
†Sung Kwang Bend | | 30,000 | | | | 374,247 |
†Suprema 1 | | 2,800 | | | | 64,185 |
| |
| Total (Cost $1,567,275) | | | | | | 1,431,393 |
| |
| | | | | | | |
| SRI LANKA – 0.1% | | | | | | |
†Distilleries Company of Sri Lanka | | 65,700 | | | | 105,411 |
| |
| Total (Cost $108,837) | | | | | | 105,411 |
| |
| | | | | | | |
| SWEDEN – 0.4% | | | | | | |
†Bufab Holding 1 | | 18,800 | | | | 141,245 |
†Nolato Cl. B | | 4,400 | | | | 99,419 |
†Recipharm 1 | | 5,800 | | | | 99,601 |
| |
| Total (Cost $350,620) | | | | | | 340,265 |
| |
| | | | | | | |
| SWITZERLAND – 0.8% | | | | | | |
Forbo Holding | | 675 | | | | 675,152 |
†Zehnder Group | | 3,100 | | | | 128,770 |
| |
| Total (Cost $655,051) | | | | | | 803,922 |
| |
| | | | | | | |
| TAIWAN – 0.6% | | | | | | |
†Kinik Company | | 31,500 | | | | 64,712 |
†Lumax International | | 45,000 | | | | 92,152 |
†Makalot Industrial | | 21,759 | | | | 116,240 |
†Shih Her Technologies | | 50,000 | | | | 92,314 |
†Taiwan Paiho | | 91,900 | | | | 123,827 |
†UDE Corporation | | 41,400 | | | | 102,201 |
| |
| Total (Cost $598,625) | | | | | | 591,446 |
| |
| | | | | | | |
| TURKEY – 1.0% | | | | | | |
Mardin Cimento Sanayii | | 475,000 | | | | 965,890 |
| |
| Total (Cost $1,478,000) | | | | | | 965,890 |
| |
| | | | | | | |
| UNITED ARAB EMIRATES – 0.7% | | | | | | |
†Aramex | | 750,000 | | | | 629,723 |
| |
| Total (Cost $652,528) | | | | | | 629,723 |
| |
| | | | | | | |
| UNITED KINGDOM – 9.6% | | | | | | |
Ashmore Group | | 232,500 | | | | 1,008,001 |
†Brammer | | 14,000 | | | | 74,159 |
Clarkson | | 44,000 | | | | 1,298,775 |
Consort Medical | | 95,000 | | | | 1,278,399 |
E2V Technologies | | 274,500 | | | | 738,509 |
Elementis | | 134,000 | | | | 542,293 |
†Fenner | | 50,000 | | | | 166,825 |
†Globo 1 | | 140,000 | | | | 87,101 |
†Hargreaves Services | | 7,500 | | | | 75,257 |
†HellermannTyton Group | | 50,000 | | | | 244,473 |
†Jupiter Fund Management | | 93,600 | | | | 525,489 |
†Kennedy Wilson Europe Real Estate | | 54,956 | | | | 902,788 |
†Luxfer Holdings ADR | | 4,500 | | | | 67,185 |
†Mattioli Woods | | 10,600 | | | | 74,269 |
†Norcros | | 492,900 | | | | 138,060 |
†Pendragon | | 135,700 | | | | 69,455 |
Polypipe Group | | 57,000 | | | | 218,434 |
Rotork | | 8,900 | | | | 320,269 |
†Senior | | 95,000 | | | | 444,614 |
Spirax-Sarco Engineering | | 17,100 | | | | 759,933 |
†Trifast | | 82,700 | | | | 138,698 |
| |
| Total (Cost $10,192,875) | | | | | | 9,172,986 |
| |
| | | | | | | |
| UNITED STATES – 14.8% | | | | | | |
†Artisan Partners Asset Management Cl. A | | 5,000 | | | | 252,650 |
Bel Fuse Cl. A | | 26,672 | | | | 646,529 |
†Brooks Automation | | 18,100 | | | | 230,775 |
Cabot Corporation | | 10,200 | | | | 447,372 |
Commercial Metals | | 42,000 | | | | 684,180 |
Diebold | | 21,100 | | | | 730,904 |
Diodes 1 | | 20,500 | | | | 565,185 |
EnerSys | | 11,000 | | | | 678,920 |
Expeditors International of Washington | | 19,300 | | | | 860,973 |
Fairchild Semiconductor International1 | | 49,200 | | | | 830,496 |
†Globe Specialty Metals | | 42,900 | | | | 739,167 |
GrafTech International1 | | 48,600 | | | | 245,916 |
Greif Cl. A | | 13,400 | | | | 632,882 |
†Hallador Energy | | 18,600 | | | | 204,786 |
†Innospec | | 12,457 | | | | 531,914 |
KBR | | 37,000 | | | | 627,150 |
Nanometrics 1 | | 44,500 | | | | 748,490 |
†Quaker Chemical | | 8,400 | | | | 773,136 |
†Rogers Corporation 1 | | 12,000 | | | | 977,280 |
Schnitzer Steel Industries Cl. A | | 19,100 | | | | 430,896 |
†SEACOR Holdings 1 | | 5,000 | | | | 369,050 |
†Sensient Technologies | | 12,100 | | | | 730,114 |
Sun Hydraulics | | 15,139 | | | | 596,174 |
†Tecumseh Products 1 | | 84,900 | | | | 262,341 |
†Tennant Company | | 4,700 | | | | 339,199 |
| |
| Total (Cost $15,199,376) | | | | | | 14,136,479 |
| |
| | | | | | | |
| TOTAL COMMON STOCKS | | | | | | |
| |
| (Cost $110,162,452) | | | | | | 95,592,963 |
| |
| TOTAL INVESTMENTS – 100.3% | | | | | | |
| |
| (Cost $110,162,452) | | | | | | 95,592,963 |
| |
| | | | | | | |
| LIABILITIES LESS CASH AND OTHER ASSETS – (0.3)% | | | | | | (308,225) |
| | | | | | |
| | | | | | | |
| |
| NET ASSETS – 100.0% | | | | | $ | 95,284,738 |
| |
| THE ACCOMPANYING NOTES ARE AN INTEGRAL PART OF THESE FINANCIAL STATEMENTS | | 2014 Annual Report to Stockholders | 49 |
| Royce Global Value Trust | December 31, 2014 |
| |
| † | New additions in 2014. |
| 1 | Non-income producing. |
| | |
| | Securities of Global/International Funds are categorized by the country of their headquarters, with the exception of exchange-traded funds. |
| | |
| | Bold indicates the Fund’s 20 largest equity holdings in terms of December 31, 2014 market value. |
| | |
| | TAX INFORMATION: The cost of total investments for Federal income tax purposes was $111,040,259. At December 31, 2014, net unrealized depreciation for all securities was $15,447,296, consisting of aggregate gross unrealized appreciation of $5,411,678 and aggregate gross unrealized depreciation of $20,858,974. The primary difference between book and tax basis cost is the timing of the recognition of losses on securities sold. |
| | |
| |
| 50 | 2014 Annual Report to Stockholders | | THE ACCOMPANYING NOTES ARE AN INTEGRAL PART OF THESE FINANCIAL STATEMENTS |
| Royce Global Value Trust | | December 31, 2014 |
| |
| Statement of Assets and Liabilities | | | | |
| | | | | |
| ASSETS: | | | | |
| Total investments at value | | $ | 95,592,963 | |
| |
| Receivable for investments sold | | | 21,169 | |
| |
| Receivable for dividends and interest | | | 106,911 | |
| |
| Prepaid expenses and other assets | | | 48,933 | |
| |
| Total Assets | | | 95,769,976 | |
| |
| LIABILITIES: | | | | |
| Payable to custodian for cash overdrawn and foreign currency | | | 315,505 | |
| |
| Payable for investment advisory fee | | | 100,899 | |
| |
| Payable for directors’ fees | | | 7,102 | |
| |
| Accrued expenses | | | 61,732 | |
| |
| Total Liabilities | | | 485,238 | |
| |
| Net Assets | | $ | 95,284,738 | |
| |
| ANALYSIS OF NET ASSETS: | | | | |
| |
| Paid-in capital - $0.001 par value per share; 10,295,972 shares outstanding (150,000,000 shares authorized) | | $ | 116,575,937 | |
| |
| Undistributed net investment income (loss) | | | (199,302 | ) |
| |
| Accumulated net realized gain (loss) on investments and foreign currency | | | (6,520,094 | ) |
| |
| Net unrealized appreciation (depreciation) on investments and foreign currency | | | (14,571,803 | ) |
| |
| Net Assets (net asset value per share - $9.25) | | $ | 95,284,738 | |
| |
| Investments at identified cost | | $ | 110,162,452 | |
| |
| THE ACCOMPANYING NOTES ARE AN INTEGRAL PART OF THESE FINANCIAL STATEMENTS | 2014 Annual Report to Stockholders | 51 |
| Royce Global Value Trust | | Year Ended December 31, 2014 |
| |
| Statement of Operations | | | | |
| | | | | |
| INVESTMENT INCOME: | | | | |
| INCOME: | | | | |
| Dividends | | $ | 3,092,530 | |
| |
| Foreign withholding tax | | | (248,298 | ) |
| |
| Securities lending | | | 21,376 | |
| |
| Total income | | | 2,865,608 | |
| |
| EXPENSES: | | | | |
| |
| Investment advisory fees | | | 1,283,193 | |
| |
| Custody and transfer agent fees | | | 109,583 | |
| |
| Stockholder reports | | | 39,358 | |
| |
| Professional fees | | | 28,004 | |
| |
| Directors’ fees | | | 26,158 | |
| |
| Administrative and office facilities | | | 11,622 | |
| |
| Other expenses | | | 32,630 | |
| |
| Total expenses | | | 1,530,548 | |
| |
| Net investment income (loss) | | | 1,335,060 | |
| |
| REALIZED AND UNREALIZED GAIN (LOSS) ON INVESTMENTS AND FOREIGN CURRENCY: | | | | |
| NET REALIZED GAIN (LOSS): | | | | |
| |
| Investments | | | (6,171,852 | ) |
| |
| Foreign currency transactions | | | (54,989 | ) |
| |
| Net realized foreign capital gains tax | | | (3,700 | ) |
| |
| NET CHANGE IN UNREALIZED APPRECIATION (DEPRECIATION): | | | | |
| |
| Investments and foreign currency translations | | | (1,573,195 | ) |
| |
| Other assets and liabilities denominated in foreign currency | | | (738 | ) |
| |
| Net realized and unrealized gain (loss) on investments and foreign currency | | | (7,804,474 | ) |
| |
| NET INCREASE (DECREASE) IN NET ASSETS FROM INVESTMENT OPERATIONS | | $ | (6,469,414 | ) |
| |
| 52 | 2014 Annual Report to Stockholders | | THE ACCOMPANYING NOTES ARE AN INTEGRAL PART OF THESE FINANCIAL STATEMENTS |
Royce Global Value Trust
| |
| Statement of Changes in Net Assets | | | | | | | | | |
| | | | | | | | | | |
| | | YEAR ENDED 12/31/14 | | PERIOD ENDED 12/31/131 | |
| |
| INVESTMENT OPERATIONS: | | | | | | | | | |
| |
| Net investment income (loss) | | $ | 1,335,060 | | | $ | (26,704 | ) | |
| |
| Net realized gain (loss) on investments and foreign currency | | | (6,230,541 | ) | | | (264,173 | ) | |
| |
Net change in unrealized appreciation (depreciation) on investments and foreign currency | | | (1,573,933 | ) | | | 2,974,575 | | |
| |
| Net increase (decrease) in net assets from investment operations | | | (6,469,414 | ) | | | 2,683,698 | | |
| |
| DISTRIBUTIONS: | | | | | | | | | |
| Net investment income | | | (1,533,038 | ) | | | – | | |
| |
| Net realized gain on investments and foreign currency | | | – | | | | – | | |
| |
| Total distributions | | | (1,533,038 | ) | | | – | | |
| |
| CAPITAL STOCK TRANSACTIONS: | | | | | | | | | |
| Reinvestment of distributions | | | 603,492 | | | | – | | |
| |
| Common shares issued in spinoff from Royce Value Trust | | | – | | | | 100,000,000 | | |
| |
| Total capital stock transactions | | | 603,492 | | | | 100,000,000 | | |
| |
| Net Increase (Decrease) In Net Assets | | | (7,398,960 | ) | | | 102,683,698 | | |
| |
| NET ASSETS: | | | | | | | | | |
| |
| Beginning of year | | | 102,683,698 | | | | – | | |
| |
End of year (including undistributed net investment income (loss) of $(199,302) at 12/31/14 and $(16,988) at 12/31/13) | | $ | 95,284,738 | | | $ | 102,683,698 | | |
| |
| 1 | The Fund commenced operations on October 18, 2013. |
| THE ACCOMPANYING NOTES ARE AN INTEGRAL PART OF THESE FINANCIAL STATEMENTS | 2014 Annual Report to Stockholders | 53 |
| Royce Global Value Trust |
| |
| |
| Financial Highlights |
| This table is presented to show selected data for a share outstanding throughout each period, and to assist stockholders in evaluating the Fund’s performance for the periods presented. |
| | | YEAR ENDED | | PERIOD ENDED | |
| | | 12/31/2014 | | 12/31/20131 | |
| |
| Net Asset Value, Beginning of Period | | $ | 10.05 | | | $ | 9.78 | | |
| |
| INVESTMENT OPERATIONS: | | | | | | | | | |
| Net investment income (loss) | | | 0.13 | | | | (0.00 | ) | |
| |
| Net realized and unrealized gain (loss) on investments and foreign currency | | | (0.77 | ) | | | 0.27 | | |
| |
| Net increase (decrease) in net assets from investment operations | | | (0.64 | ) | | | 0.27 | | |
| |
| DISTRIBUTIONS: | | | | | | | | | |
| Net investment income | | | (0.15 | ) | | | – | | |
| |
| Net realized gain on investments and foreign currency | | | – | | | | – | | |
| |
| Total distributions | | | (0.15 | ) | | | – | | |
| |
| CAPITAL STOCK TRANSACTIONS: | | | | | | | | | |
| Effect of reinvestment of distributions by Common Stockholders | | | (0.01 | ) | | | – | | |
| |
| Total capital stock transactions | | | (0.01 | ) | | | – | | |
| |
| Net Asset Value, End of Period | | $ | 9.25 | | | $ | 10.05 | | |
| |
| Market Value, End of Period | | $ | 8.04 | | | $ | 8.89 | | |
| |
| TOTAL RETURN:2 | | | | | | | | | |
| Net Asset Value | | | (6.23 | )% | | | 2.76 | %3 | |
| |
| Market Value | | | (7.86 | )% | | | (0.95 | )%3 | |
| |
| RATIOS BASED ON AVERAGE NET ASSETS: | | | | | | | | | |
| Investment advisory fee expense | | | 1.25 | % | | | 1.25 | %4 | |
| |
| Other operating expenses | | | 0.24 | % | | | 0.37 | %4 | |
| |
| Total expenses (net) | | | 1.49 | % | | | 1.62 | %4 | |
| |
| Expenses prior to balance credits | | | 1.49 | % | | | 1.62 | %4 | |
| |
| Net investment income (loss) | | | 1.30 | % | | | (0.13 | )%4 | |
| |
| SUPPLEMENTAL DATA: | | | | | | | | | |
| |
| Net Assets End of Period (in thousands) | | $ | 95,285 | | | $ | 102,684 | | |
| |
| Portfolio Turnover Rate | | | 43 | % | | | 7 | % | |
| |
| 1 | The Fund commenced operations on October 18, 2013. |
| 2 | The Market Value Total Return is calculated assuming a purchase of Common Stock on the opening of the first business day and a sale on the closing of the last business day of each period. Dividends and distributions are assumed for the purposes of this calculation to be reinvested at prices obtained under the Fund’s Distribution Reinvestment and Cash Purchase Plan. Net Asset Value Total Return is calculated on the same basis, except that the Fund’s net asset value is used on the purchase and sale dates instead of market value. |
| 3 | Not annualized |
| 4 | Annualized |
| 54 | 2014 Annual Report to Stockholders | THE ACCOMPANYING NOTES ARE AN INTEGRAL PART OF THESE FINANCIAL STATEMENTS |
Royce Global Value Trust
Notes to Financial Statements
Summary of Significant Accounting Policies
Royce Global Value Trust, Inc. (the “Fund”), is a diversified closed-end investment company incorporated under the laws of the State of Maryland. The Fund commenced operations on October 18, 2013. The Fund had no operations prior to October 18, 2013, other than the sale of 10,160 common shares for $100,076 to Royce Value Trust, Inc. (“RVT”). On October 18, 2013, RVT contributed $99,899,924 in cash and securities in exchange for shares of the Fund, and on the same date distributed such shares to RVT holders of record as of October 10, 2013 at the rate of one share of the Fund for every seven shares of RVT Common Stock outstanding.
The preparation of financial statements in conformity with accounting principles generally accepted in the United States of America requires management to make estimates and assumptions that affect the reported amounts of assets and liabilities and the disclosure of contingent assets and liabilities at the date of the financial statements and the reported amounts of income and expenses during the reporting period. Actual results could differ from those estimates.
The Fund is an investment company and accordingly follows the investment company accounting and reporting guidance of the Financial Accounting Standards Board (FASB) Accounting Standard Codification Topic 946 “Financial Services-Investment Companies”.
VALUATION OF INVESTMENTS:
Securities are valued as of the close of trading on the New York Stock Exchange (NYSE) (generally 4:00 p.m. Eastern time) on the valuation date. Securities that trade on an exchange, and securities traded on Nasdaq’s Electronic Bulletin Board, are valued at their last reported sales price or Nasdaq official closing price taken from the primary market in which each security trades or, if no sale is reported for such day, at their highest bid price. Other over-the-counter securities for which market quotations are readily available are valued at their highest bid price, except in the case of some bonds and other fixed income securities which may be valued by reference to other securities with comparable ratings, interest rates and maturities, using established independent pricing services. The Fund values its non-U.S. dollar denominated securities in U.S. dollars daily at the prevailing foreign currency exchange rates as quoted by a major bank. Securities for which market quotations are not readily available are valued at their fair value in accordance with the provisions of the 1940 Act, under procedures approved by the Fund’s Board of Directors, and are reported as Level 3 securities. As a general principle, the fair value of a security is the amount which the Fund might reasonably expect to receive for the security upon its current sale. However, in light of the judgment involved in fair valuations, there can be no assurance that a fair value assigned to a particular security will be the amount which the Fund might be able to receive upon its current sale. In addition, if, between the time trading ends on a particular security and the close of the customary trading session on the NYSE, events occur that are significant and may make the closing price unreliable, the Fund may fair value the security. The Fund uses an independent pricing service to provide fair value estimates for relevant non-U.S. equity securities on days when the U.S. market volatility exceeds a certain threshold. This pricing service uses proprietary correlations it has developed between the movement of prices of non-U.S. equity securities and indices of U.S.-traded securities, futures contracts and other indications to estimate the fair value of relevant non-U.S. securities. When fair value pricing is employed, the prices of securities used by the Fund may differ from quoted or published prices for the same security. Investments in money market funds are valued at net asset value per share.
Various inputs are used in determining the value of the Fund’s investments, as noted above. These inputs are summarized in the three broad levels below:
| | Level 1 | – | quoted prices in active markets for identical securities. |
| | Level 2 | – | other significant observable inputs (including quoted prices for similar securities, foreign securities that may be fair valued and repurchase agreements). The table below includes all Level 2 securities. Level 2 securities with values based on quoted prices for similar securities would be noted in the Schedule of Investments. |
| | Level 3 | – | significant unobservable inputs (including last trade price before trading was suspended, or at a discount thereto for lack of marketability or otherwise, market price information regarding other securities, information received from the company and/or published documents, including SEC filings and financial statements, or other publicly available information). |
The inputs or methodology used for valuing securities are not necessarily an indication of the risk associated with investing in those securities.
The following is a summary of the inputs used to value the Fund’s investments as of December 31, 2014. For a detailed breakout of common stocks by country, please refer to the Schedule of Investments.
| | | | LEVEL 1 | | | LEVEL 2 | | | LEVEL 3 | | | TOTAL | |
| |
| Common Stocks | | $ | 26,518,831 | | $ | 69,074,132 | | $ | – | | $ | 95,592,963 | |
| |
For the year ended December 31, 2014, certain securities have transferred in and out of Level 1 and Level 2 measurements. The Fund recognizes transfers between levels as of the end of the reporting period. At December 31, 2014, securities valued at $45,476,963 were transferred from Level 1 to Level 2 within the fair value hierarchy.
2014 Annual Report to Stockholders | 55
Royce Global Value Trust
Notes to Financial Statements (continued)
REPURCHASE AGREEMENTS:
The Fund may enter into repurchase agreements with institutions that the Fund’s investment adviser has determined are creditworthy. The Fund restricts repurchase agreements to maturities of no more than seven days. Securities pledged as collateral for repurchase agreements, which are held until maturity of the repurchase agreements, are marked-to-market daily and maintained at a value at least equal to the principal amount of the repurchase agreement (including accrued interest). Repurchase agreements could involve certain risks in the event of default or insolvency of the counter-party, including possible delays or restrictions upon the ability of the Fund to dispose of its underlying securities.
FOREIGN CURRENCY:
Net realized foreign exchange gains or losses arise from sales and maturities of short-term securities, sales of foreign currencies, expiration of currency forward contracts, currency gains or losses realized between the trade and settlement dates on securities transactions, and the difference between the amounts of dividends, interest, and foreign withholding taxes recorded on the Fund’s books and the U.S. dollar equivalent of the amounts actually received or paid. Net unrealized foreign exchange gains and losses arise from changes in the value of assets and liabilities, including investments in securities at the end of the reporting period, as a result of changes in foreign currency exchange rates.
SECURITIES LENDING:
The Fund loans securities through a lending agent to qualified institutional investors for the purpose of realizing additional income. Collateral for the Fund on all securities loaned is accepted in cash and cash equivalents and invested temporarily by the custodian. The collateral maintained is at least 100% of the current market value of the loaned securities. The market value of the loaned securities is determined at the close of business of the Fund and any additional required collateral is delivered to the Fund on the next business day. The Fund retains the risk of any loss on the securities on loan as well as incurring the potential loss on investments purchased with cash collateral received for securities lending. The Fund’s securities lending income consists of the income earned on investing cash collateral, plus any premium payments received for lending certain securities, less any rebates paid to borrowers and lending agent fees associated with the loan. The lending agent is not affiliated with Royce.
DISTRIBUTIONS AND TAXES:
As a qualified regulated investment company under Subchapter M of the Internal Revenue Code, the Fund is not subject to income taxes to the extent that it distributes substantially all of its taxable income for its fiscal year. The Schedule of Investments includes information regarding income taxes under the caption “Tax Information”.
The Fund pays any dividends and capital gain distributions annually in December. Because federal income tax regulations differ from generally accepted accounting principles, income and capital gain distributions determined in accordance with tax regulations may differ from net investment income and realized gains recognized for financial reporting purposes. Accordingly, the character of distributions and composition of net assets for tax purposes differ from those reflected in the accompanying financial statements.
INVESTMENT TRANSACTIONS AND RELATED INVESTMENT INCOME:
Investment transactions are accounted for on the trade date. Dividend income is recorded on the ex-dividend date. Non-cash dividend income is recorded at the fair market value of the securities received. Interest income is recorded on an accrual basis. Premium and discounts on debt securities are amortized using the effective yield-to-maturity method. Realized gains and losses from investment transactions are determined on the basis of identified cost for book and tax purposes.
EXPENSES:
The Fund incurs direct and indirect expenses. Expenses directly attributable to the Fund are charged to the Fund’s operations, while expenses applicable to more than one of the Royce Funds are allocated equitably. Certain personnel, occupancy costs and other administrative expenses related to the Funds are allocated by Royce & Associates, LLC (“Royce”) under an administration agreement and are included in administrative and office facilities and professional fees.
COMPENSATING BALANCE CREDITS:
The Fund has an arrangement with its custodian bank, whereby a portion of the custodian’s fee is paid indirectly by credits earned on the Fund’s cash on deposit with the bank. This deposit arrangement is an alternative to purchasing overnight investments. Conversely, the Fund pays interest to the custodian on any cash overdrafts, to the extent they are not offset by credits earned on positive cash balances.
56 | 2014 Annual Report to Stockholders
Royce Global Value Trust
Notes to Financial Statements (continued)
Capital Stock:
The Fund issued 75,721 shares of Common Stock as reinvestment of distributions for the year ended December 31, 2014. The Fund issued 10,221,251 shares of Common Stock in spinoff from RVT for the period ended December 31, 2013. Securities contributed by RVT included $15,972,444 in unrealized depreciation.
Investment Advisory Agreement:
The Investment Advisory Agreement between Royce and the Fund provides for fees to be paid at an annual rate of 1.25% of the Fund’s average daily net assets. For the year ended December 31, 2014, the Fund accrued and paid Royce investment advisory fees totaling $1,283,193.
Purchases and Sales of Investment Securities:
For the year ended December 31, 2014, the costs of purchases and proceeds from sales of investment securities, other than short-term securities, amounted to $61,662,756 and $43,379,619, respectively.
Distributions to Stockholders:
The tax character of distributions paid to common stockholders during 2014 was as follows:
| DISTRIBUTIONS PAID FROM: | | | 2014 | |
| |
| Ordinary income | | $ | 1,533,038 | |
| |
| Long-term capital gain | | | – | |
| |
| | | $ | 1,533,038 | |
| |
As of December 31, 2014, the tax basis components of distributable earnings included in stockholders’ equity were as follows:
| Net unrealized appreciation (depreciation) | | $(15,449,610 | ) | |
| |
| Post October loss* | | (2,014,245 | ) | |
| |
| Capital loss carryforward** | | (3,827,344 | ) | |
| |
| | | $(21,291,199 | ) | |
| |
*Under the current tax law, capital losses and foreign currency losses after October 31 may be deferred and treated as occurring on the first day of the following fiscal year. As of December 31, 2014, the Fund had $2,014,245 of post October currency losses. **Under the Regulated Investment Company Modernization Act of 2010, net capital losses may be carried forward indefinitely, and the character is retained as short term (32,952) and long term (3,794,392) losses. The difference between book and tax basis unrealized appreciation (depreciation) is attributable primarily to the tax deferral on wash sales, partnership investments and the unrealized gains on Passive Foreign Investment Companies.
For financial reporting purposes, capital accounts and distributions to stockholders are adjusted to reflect the tax character of permanent book/tax differences. These differences are primarily due to differing treatments of income and gains on various investment securities and foreign currency transactions held by the Fund, timing differences and different characterization of distributions made by the Fund. For the year ended December 31, 2014, the Fund recorded the following permanent reclassifications. Results of operations and net assets were not affected by these reclassifications.
| UNDISTRIBUTED NET | | | ACCUMULATED NET | |
| INVESTMENT INCOME | | | REALIZED GAIN (LOSS) | |
| |
| $15,664 | | | $(15,664) | |
| |
Management has analyzed the Fund’s tax positions taken on federal income tax returns for all open tax years (2013-2014) and has concluded that as of December 31, 2014, no provision for income tax is required in the Fund’s financial statements.
2014 Annual Report to Stockholders | 57
Royce Global Value Trust
Report of Independent Registered Public Accounting Firm
To the Board of Directors and Stockholders of
Royce Global Value Trust, Inc.
New York, New York
We have audited the accompanying statement of assets and liabilities of Royce Global Value Trust, Inc., (“Fund”) including the schedule of investments, as of December 31, 2014, and the related statement of operations for the year then ended, the statements of changes in net assets and the financial highlights for the year then ended and for the period October 18, 2013 (commencement of operations) through December 31, 2013. These financial statements and financial highlights are the responsibility of the Fund’s management. Our responsibility is to express an opinion on these financial statements and financial highlights based on our audit.
We conducted our audits in accordance with the standards of the Public Company Accounting Oversight Board (United States). Those standards require that we plan and perform the audit to obtain reasonable assurance about whether the financial statements and financial highlights are free of material misstatement. The Fund is not required to have, nor were we engaged to perform, an audit of its internal control over financial reporting. Our audit included consideration of internal control over financial reporting as a basis for designing audit procedures that are appropriate in the circumstances, but not for the purpose of expressing an opinion on the effectiveness of the Fund’s internal control over financial reporting. Accordingly, we express no such opinion. An audit includes examining, on a test basis, evidence supporting the amounts and disclosures in the financial statements. Our procedures included confirmation of securities owned as of December 31, 2014, by correspondence with the custodian. An audit also includes assessing the accounting principles used and significant estimates made by management, as well as evaluating the overall financial statement presentation. We believe that our audits provide a reasonable basis for our opinion.
In our opinion, the financial statements and financial highlights referred to above present fairly, in all material respects, the financial position of Royce Global Value Trust, Inc. at December 31, 2014, the results of its operations for the year then ended, the changes in its net assets and the financial highlights for the year then ended and for the period October 18, 2013 (commencement of operations) through December 31, 2013, in conformity with accounting principles generally accepted in the United States of America.
TAIT, WELLER, & BAKER LLP
Philadelphia, Pennsylvania
February 23, 2015
58 | 2014 Annual Report to Stockholders
All Directors and Officers may be reached c/o The Royce Funds, 745 Fifth Avenue, New York, NY 10151
| Charles M. Royce, Director1, President |
| Age: 75 | Number of Funds Overseen: 33 | Tenure: Since 1982 |
| Non-Royce Directorships: Director of TICC Capital Corp. |
| Principal Occupation(s) During Past Five Years: Chief Executive Officer and Chairman of Board of Managers of Royce & Associates, LLC (“Royce”), the Trust’s investment adviser. |
| |
| Christopher D. Clark, Director1, Vice President |
| Age: 49 | Number of Funds Overseen: 32 | Tenure: Since 2014 |
| Principal Occupation(s) During Past Five Years: President (since July 2014), Co-Chief Investment Officer (Since January 2014) and Managing Director of Royce, having been employed by Royce since May 2007. |
|
| Patricia W. Chadwick, Director |
| Age: 66 | Number of Funds Overseen: 33 | Tenure: Since 2009 |
Non-Royce Directorships: Trustee of ING Mutual Funds and Director of Wisconsin Energy Corp.
Principal Occupation(s) During Past 5 Years: Consultant and President of Ravengate Partners LLC (since 2000). |
| |
| Richard M. Galkin, Director |
| Age: 76 | Number of Funds Overseen: 33 | Tenure: Since 1982 |
| Non-Royce Directorships: None |
| Principal Occupation(s) During Past Five Years: Private investor. Mr. Galkin’s prior business experience includes having served as President of Richard M. Galkin Associates, Inc., telecommunications consultants, President of Manhattan Cable Television (a subsidiary of Time, Inc.), President of Haverhills Inc. (another Time, Inc. subsidiary), President of Rhode Island Cable Television, and Senior Vice President of Satellite Television Corp. (a subsidiary of Comsat). |
| |
| Stephen L. Isaacs, Director |
| Age: 75 | Number of Funds Overseen: 33 | Tenure: Since 1989 |
| Non-Royce Directorships: None |
| Principal Occupation(s) During Past Five Years: Attorney and President of Health Policy Associates, Inc., consultants. Mr. Isaacs’s prior business experience includes having served as President of the Center for Health and Social Policy (from 1996 to 2012); Director of Columbia University Development Law and Policy Program and Professor at Columbia University (until August 1996). |
| |
| Arthur S. Mehlman, Director |
| Age: 72 | Number of Funds Overseen: 51 | Tenure: Since 2004 |
| Non-Royce Directorships: Director/Trustee of registered investment companies constituting the 18 Legg Mason Funds. |
| Principal Occupation(s) During Past Five Years: Director of The League for People with Disabilities, Inc.; Director of University of Maryland Foundation (non-profits). Formerly: Director of Municipal Mortgage & Equity, LLC (from October 2004 to April 1, 2011); Director of University of Maryland College Park Foundation (non-profit) (from 1998 to 2005); Partner, KPMG LLP (international accounting firm) (from 1972 to 2002); Director of Maryland Business Roundtable for Education (from July 1984 to June 2002). |
| |
| David L. Meister, Director |
| Age: 75 | Number of Funds Overseen: 33 | Tenure: Since 1982 |
| Non-Royce Directorships: None |
| Principal Occupation(s) During Past Five Years: Consultant. Chairman and Chief Executive Officer of The Tennis Channel (from June 2000 to March 2005). Mr. Meister’s prior business experience includes having served as Chief Executive Officer of Seniorlife.com, a consultant to the communications industry, President of Financial News Network, Senior Vice President of HBO, President of Time-Life Films, and Head of Broadcasting for Major League Baseball. |
| |
| G. Peter O’Brien, Director |
| Age: 69 | Number of Funds Overseen: 51 | Tenure: Since 2001 |
| Non-Royce Directorships: Director/Trustee of registered investment companies constituting the 18 Legg Mason Funds; Director of TICC Capital Corp. |
| Principal Occupation(s) During Past Five Years: Trustee Emeritus of Colgate University (since 2005); Board Member of Hill House, Inc. (since 1999); Formerly: Trustee of Colgate University (from 1996 to 2005), President of Hill House, Inc. (from 2001 to 2005) and Managing Director/Equity Capital Markets Group of Merrill Lynch & Co. (from 1971 to 1999). |
|
| John D. Diederich, Vice President and Treasurer |
| Age: 63 | Tenure: Since 2001 |
| Principal Occupation(s) During Past Five Years: Chief Operating Officer, Managing Director and member of the Board of Managers of Royce; Chief Financial Officer of Royce; Director of Administration of the Trust; and President of RFS, having been employed by Royce since April 1993. |
| |
| Jack E. Fockler, Jr., Vice President |
| Age: 56 | Tenure: Since 1995 |
| Principal Occupation(s) During Past Five Years: Managing Director and Vice President of Royce, and Vice President of RFS, having been employed by Royce since October 1989. |
| |
| Daniel A. O’Byrne, Vice President and Assistant Secretary |
| Age: 52 | Tenure: Since 1994 |
| Principal Occupation(s) During Past Five Years: Principal and Vice President of Royce, having been employed by Royce since October 1986. |
| |
| Francis D. Gannon, Vice President |
| Age: 47 | Tenure: Since 2014 |
| Principal Occupation(s) During Past Five Years: Co-Chief Investment Officer (Since January 2014) and Managing Director of Royce, having been employed by Royce since September 2006. |
| |
| John E. Denneen, Secretary and Chief Legal Officer |
| Age: 47 | Tenure: 1996-2001 and Since April 2002 |
| Principal Occupation(s) During Past Five Years: General Counsel, Chief Legal and Compliance Officer, and Secretary of Royce; Secretary and Chief Legal Officer of The Royce Funds. |
| |
| Lisa Curcio, Chief Compliance Officer |
| Age: 55 | Tenure: Since 2004 |
| Principal Occupation(s) During Past Five Years: Chief Compliance Officer of The Royce Funds (since October 2004) and Compliance Officer of Royce (since June 2004). |
| 1 | Interested Director. |
| | Director will hold office until their successors have been duly elected and qualified or until their earlier resignation or removal. |
| 2014 Annual Report to Stockholders | 59 |
Notes to Performance and Other Important Information
| The thoughts expressed in this Review and Report concerning recent market movements and future prospects for small company stocks are solely the opinion of Royce at December 31, 2014, and, of course, historical market trends are not necessarily indicative of future market movements. Statements regarding the future prospects for particular securities held in the Funds’ portfolios and Royce’s investment intentions with respect to those securities reflect Royce’s opinions as of December 31, 2014 and are subject to change at any time without notice. There can be no assurance that securities mentioned in this Review and Report will be included in any Royce-managed portfolio in the future. Investments in securities of micro-cap, small-cap and/or mid-cap companies may involve considerably more risk than investments in securities of larger-cap companies. All publicly released material information is always disclosed by the Funds on the website at www.roycefunds.com. |
| |
Sector weightings are determined using the Global Industry Classification Standard (“GICS”). GICS was developed by, and is the exclusive property of, Standard & Poor’s Financial Services LLC (“S&P”) and MSCI Inc. (“MSCI”). GICS is the trademark of S&P and MSCI. “Global Industry Classification Standard (GICS)” and “GICS Direct” are service marks of S&P and MSCI. |
| |
All indexes referred to are unmanaged and capitalization weighted. Each index’s returns include net reinvested dividends and/or interest income. Russell Investment Group is the source and owner of the trademarks, service marks, and copyrights related to the Russell Indexes. Russell® is a trademark of Russell Investment Group. The Russell 2000 Index is an index of domestic small-cap stocks. It measures the performance of the 2,000 smallest publicly traded U.S. companies in the Russell 3000 Index. The Russell Microcap Index includes 1,000 of the smallest securities in the Russell 2000 Index along with the next smallest eligible securities as determined by Russell. The Russell 1000 Index is an index of domestic large-cap stocks. It measures the performance of the 1,000 largest publicly traded companies in the Russell 3000 Index. The Russell Midcap Index measures the performance of the mid-cap segment of the U.S. equity universe. It includes approximately 800 of the smallest securities in the Russell 1000 Index. The Russell Global Small Cap Index is an unmanaged, capitalization-weighted index of global small-cap stocks. The Russell Global ex-U.S. Large Cap Index is an index of global large-cap stocks, excluding the United States. The Russell Global ex-U.S. Small Cap Index is an index of global small-cap stocks, excluding the United States. The S&P 500 and SmallCap 600 are indexes of U.S. large- and small-cap stocks, respectively, selected by Standard & Poor’s based on market size, liquidity, and industry grouping, among other factors. The Nasdaq Composite is an index of the more than 3,000 common equities listed on the Nasdaq stock exchange. The performance of an index does not represent exactly any particular investment, as you cannot invest directly in an index. Returns for the market indexes used in this report were based on information supplied to Royce by Russell Investments. |
| |
The Price-Earnings, or P/E, Ratio is calculated by dividing a company’s share price by its trailing 12-month earnings-per share (EPS). The Price- to- Book, or P/B, Ratio is calculated by dividing a company’s share price by its book value per share. The Morningstar Style Map uses proprietary scores of a stock’s value and growth characteristics to determine its placement in one of the five categories listed on the horizontal axis. These characteristics are then compared to those of other stocks within the same market capitalization band. Each is scored from zero to 100 for both value and growth attributes. The value score is subtracted from the growth score to determine the overall style score. For the vertical, market cap axis, Morningstar subdivides into size groups. Giant-cap stocks are defined as those that account for the top 40% of the capitalization of each style zone; large-cap stocks represent the next 30%; mid-cap stocks the next 20%; small-cap stocks the next 7%; micro-cap stocks the smallest 3%. The Royce Funds is a service mark of The Royce Funds. Distributor: Royce Fund Services, Inc. |
| |
| Forward-Looking Statements |
| This material contains forward-looking statements within the meaning of the Securities Exchange Act of 1934, as amended (the “Exchange Act”), that involve risks and uncertainties, including, among others, statements as to: |
| • the Funds’ future operating results |
| • the prospects of the Funds’ portfolio companies |
| • the impact of investments that the Funds have made or may make |
| • the dependence of the Funds’ future success on the general economy and its impact on the companies and industries in which the Funds invest, and |
| • the ability of the Funds’ portfolio companies to achieve their objectives. |
| |
This Review and Report uses words such as “anticipates,” “believes,” “expects,” “future,” “intends,” and similar expressions to identify forward-looking statements. Actual results may differ materially from those projected in the forward-looking statements for any reason. |
| |
The Royce Funds have based the forward-looking statements included in this Review and Report on information available to us on the date of the report, and we assume no obligation to update any such forward-looking statements. Although The Royce Funds undertake no obligation to revise or update any forward-looking statements, whether as a result of new information, future events or otherwise, you are advised to consult any additional disclosures that we may make through future stockholder communications or reports. |
| |
| Authorized Share Transactions |
| Royce Value Trust, Royce Micro-Cap Trust, and Royce Global Value Trust may each repurchase up to 5% of the issued and outstanding shares of its respective common stock during the year ending December 31, 2015. Any such repurchases would take place at then prevailing prices in the open market or in other transactions. Common stock repurchases would be effected at a price per share that is less than the share’s then current net asset value. |
| |
Royce Value Trust, Royce Micro-Cap Trust, and Royce Global Value Trust are also authorized to offer their common stockholders an opportunity to subscribe for additional shares of their common stock through rights offerings at a price per share that may be less than the share’s then current net asset value. The timing and terms of any such offerings are within each Board’s discretion. |
| |
| Annual Certifications |
| As required, the Funds have submitted to the New York Stock Exchange (“NYSE”) for Royce Value Trust, Royce Micro-Cap Trust, and Royce Global Value Trust the annual certification of the Funds’ Chief Executive Officer that he is not aware of any violation of the NYSE’s listing standards. The Funds also have included the certification of the Funds’ Chief Executive Officer and Chief Financial Officer required by section 302 of the Sarbanes-Oxley Act of 2002 as exhibits to the Funds’ form N-CSR for the period ended December 31, 2014, filed with the Securities and Exchange Commission. |
| |
| Proxy Voting |
| A copy of the policies and procedures that The Royce Funds use to determine how to vote proxies relating to portfolio securities and information regarding how each of The Royce Funds voted proxies relating to portfolio securities during the most recent 12-month period ended June 30 is available, without charge, on The Royce Funds’ website at www.roycefunds.com, by calling (800) 221-4268 (toll-free) and on the website of the Securities and Exchange Commission (“SEC”), at www.sec.gov. |
| |
| Form N-Q Filing |
| The Funds file their complete schedules of investments with the SEC for the first and third quarters of each fiscal year on Form N-Q. The Funds’ Forms N-Q are available on the SEC’s website at www.sec.gov. The Royce Funds’ holdings are also on the Funds’ website approximately 15 to 20 days after each calendar quarter end and remain available until the next quarter’s holdings are posted. The Funds’ Forms N-Q may also be reviewed and copied at the SEC’s Public Reference Room in Washington, D.C. To find out more about this public service, call the SEC at (800) 732-0330. The Funds’ complete schedules of investments are updated quarterly, and are available at www.roycefunds.com. |
| 60 | 2014 Annual Report to Stockholders |
Results of Stockholders Meeting
Royce Value Trust, Inc.
At the 2014 Annual Meeting of Stockholders held on September 24, 2014, the Fund’s stockholders elected two Directors, consisting of:
| | VOTES FOR | VOTES WITHHELD |
| |
| Richard M. Galkin | 57,579,578 | 1,907,416 |
| |
| Stephen L. Isaacs | 57,521,207 | 1,965,788 |
| |
Royce Micro-Cap Trust, Inc.
At the 2014 Annual Meeting of Stockholders held on September 24, 2014, the Fund’s stockholders elected two Directors, consisting of:
| | VOTES FOR | VOTES WITHHELD |
| |
| Richard M. Galkin | 24,533,941 | 553,234 |
| |
| Stephen L. Isaacs | 24,495,075 | 592,101 |
| |
Royce Global Value Trust, Inc.
At the 2014 Annual Meeting of Stockholders held on September 24, 2014, the Fund’s stockholders elected two Directors, consisting of:
| | VOTES FOR | VOTES WITHHELD |
| |
| Richard M. Galkin | 8,706,251 | 200,627 |
| |
| Stephen L. Isaacs | 8,713,552 | 193,327 |
| |
| 2014 Annual Report to Stockholders |
| | | | | | |
| | | | | | |
| | | | | | |
| |
 | |
| | | | | | |
| | | | | | |
| | | | | | |
| | About The Royce Funds | | | Contact Us | |
| | | | | | |
| | | | | | |
| | Wealth of Experience
With approximately $32 billion in total assets under management, Royce & Associates is committed to the same investment principles that have served us well for more than 40 years. Chuck Royce, our Chief Executive Officer, enjoys one of the longest tenures of any active mutual fund manager. Royce’s investment staff also includes 24 portfolio managers and analysts and nine traders. | | | GENERAL INFORMATION
General Royce Funds information including
an overview of our firm and Funds
(800) 221-4268 | |
| |
| | | | | | |
| | Multiple Funds, Common Focus
Our goal is to offer both individual and institutional investors the best available micro-cap, small-cap, and/or mid-cap portfolios. We have chosen to concentrate on smaller-company investing by providing investors with a range of funds that take full advantage of this large and diverse sector. | | | COMPUTERSHARE
Transfer Agent and Registrar
Speak with a representative about:
• Your account, transactions, and forms
(800) 426-5523 | |
| |
| | | | | | |
| | Consistent Discipline
Our approach emphasizes paying close attention to risk and maintaining the same discipline, regardless of market movements and trends. The price we pay for a security must be below our appraisal of its current worth. This requires a thorough analysis of the financial and business dynamics of an enterprise, as though we were purchasing the entire company. | | | FINANCIAL ADVISORS AND BROKER-DEALERS
Speak with your regional Royce contact regarding:
• Information about our firm, strategies, and Funds
• Fund Materials
(800) 337-6923 | |
| |
| |
| | Co-Ownership of Funds
It is important that our employees and shareholders share a common financial goal. Our officers, employees, and their families currently have more than $185 million invested in The Royce Funds and are often among the largest individual shareholders. | | | | |
| | | | | roycefunds.com | |
| | | | | | |
| | | | | | |
| |  | | | |  |
| | | | | | |
| | | | | | |
Item 2. Code(s) of Ethics. As of the end of the period covered by this report, the Registrant had adopted a code of ethics, as defined in Item 2 of Form N-CSR, applicable to its principal executive officer, principal financial officer, principal accounting officer or controller, or persons performing similar functions. A copy of this code of ethics is filed as an exhibit to this Form N-CSR. No substantive amendments were approved or waivers were granted to this code of ethics during the period covered by this report.
Item 3. Audit Committee Financial Expert.
| (a)(1) | | The Board of Directors of the Registrant has determined that it has an audit committee financial expert. |
| | | |
| (a)(2) | | Arthur S. Mehlman and Patricia W. Chadwick were designated by the Board of Directors as the |
| | | Registrant’s Audit Committee Financial Experts, effective April 15, 2004 and April 8, 2010, respectively. |
| | | Mr. Mehlman and Ms. Chadwick are “independent” as defined under Item 3 of Form N-CSR. |
Item 4. Principal Accountant Fees and Services.
| (a) | | Audit Fees: |
| | | Year ended December 31, 2014 -$43,500 |
| | | Year ended December 31, 2013 -$42,500 |
| | | |
| (b) | | Audit-Related Fees: |
| | | Year ended December 31, 2014 -$0 |
| | | Year ended December 31, 2013 -$0 |
| | | |
| (c) | | Tax Fees: |
| | | Year ended December 31, 2014 -$7,200 - Preparation of tax returns |
| | | Year ended December 31, 2013 -$7,100 - Preparation of tax returns |
| | | |
| (d) | | All Other Fees: |
| | | Year ended December 31, 2014 -$0 |
| | | Year ended December 31, 2013 -$0 |
(e)(1) Annual Pre-Approval: On an annual basis, the Registrant’s independent auditor submits to the Audit Committee a schedule of proposed audit, audit-related, tax and other non-audit services to be rendered to the Registrant and/or investment adviser(s) for the following year that require pre-approval by the Audit Committee. This schedule provides a description of each type of service that is expected to require pre-approval and the maximum fees that can be paid for each such service without further Audit Committee approval. The Audit Committee then reviews and determines whether to approve the types of scheduled services and the projected fees for them. Any subsequent revision to already pre-approved services or fees (including fee increases) are presented for consideration at the next regularly scheduled Audit Committee meeting, as needed.
If subsequent to the annual pre-approval of services and fees by the Audit Committee, the Registrant or one of its affiliates determines that it would like to engage the Registrant’s independent auditor to perform a service not already pre-approved, the request is to be submitted to the Registrant’s Chief Financial Officer, and if he or she determines that the service fits within the independence guidelines (e.g., it is not a prohibited service), he or she will then arrange for a discussion of the proposed service and fee to be included on the agenda for the next regularly scheduled Audit Committee meeting so that pre-approval can be considered.
Interim Pre-Approval: If, in the judgment of the Registrant’s Chief Financial Officer, a proposed engagement needs to commence before the next regularly scheduled Audit Committee meeting, he or she shall submit a written summary of the proposed engagement to all members of the Audit Committee, outlining the services, the estimated maximum cost, the category of the services (e.g., audit, audit-related, tax or other) and the rationale for engaging the Registrant’s independent auditor to perform the services. To the extent the proposed engagement involves audit, audit-related or tax services, any individual member of the Audit Committee who is an independent Board member is authorized to pre-approve the engagement. To the extent the proposed engagement involves non-audit services other than audit-related or tax, the Chairman of the Audit Committee is authorized to pre-approve the engagement. The Registrant’s Chief Financial Officer will arrange for this interim review and
coordinate with the appropriate member(s) of the Committee. The independent auditor may not commence the engagement under consideration until the Registrant’s Chief Financial Officer has informed the auditor in writing that pre-approval has been obtained from the Audit Committee or an individual member who is an independent Board member. The member of the Audit Committee who pre-approves any engagements in between regularly scheduled Audit Committee meetings is to report, for informational purposes only, any pre-approval decisions to the Audit Committee at its next regularly scheduled meeting.
| (e)(2) | | | Not Applicable |
| | | | |
| (f) | | | Not Applicable |
| | | | |
| (g) | | | Year ended December 31, 2014 -$7,200 |
| | | | Year ended December 31, 2013 -$7,100 |
| | | | |
| (h) | | | No such services were rendered during 2014 or 2013. |
Item 5. Audit Committee of Listed Registrants. The Registrant has a separately designated standing audit committee established in accordance with Section 3(a)(58)(A) of the Securities Exchange Act of 1934. Patricia W. Chadwick, Richard M. Galkin, Stephen L. Isaacs, Arthur S. Mehlman, David L. Meister and G. Peter O’Brien are members of the Registrant’s audit committee.
Item 6. Investments.
(a) See Item 1.
(b) Not applicable.
Item 7. Disclosure of Proxy Voting Policies and Procedures for Closed-End Management Investment Companies.
June 5, 2003, as amended
through October 22, 2009
Royce & Associates Proxy Voting Guidelines and Procedures
These procedures apply to Royce & Associates, LLC (“Royce”) and all funds and other client accounts for which it is responsible for voting proxies, including all open and closed-end registered investment companies (“The Royce Funds”), limited partnerships, limited liability companies, separate accounts, other accounts for which it acts as investment adviser and any accounts for which it acts as sub-adviser that have delegated proxy voting authority to Royce. Such authority is determined at the inception of each client account and generally: (i) is specifically authorized in the applicable investment management agreement or other written instrument or (ii) where not specifically authorized, is granted to Royce where general investment discretion is given to it in the applicable investment management agreement. The Boards of Trustees/Directors of The Royce Funds (the “Boards”) have delegated all proxy voting decisions to Royce subject to these policies and procedures. Notwithstanding the above, from time to time the Boards may reserve voting authority for specific securities.
Receipt of Proxy Material. Under the continuous oversight of the Head of Administration, an Administrative Assistant designated by him is responsible for monitoring receipt of all proxies and ensuring that proxies are received for all securities for which Royce has proxy voting responsibility. All proxy materials are logged in upon receipt by Royce’s Librarian.
Voting of Proxies. Once proxy material has been logged in by Royce’s Librarian, it is then promptly reviewed by the designated Administrative Assistant to evaluate the issues presented. Regularly recurring matters are usually voted as recommended by the issuer’s board of directors or “management.” The Head of Administration or his designee, in consultation with the Chief Investment Officer, develops and updates a list of matters Royce treats as “regularly recurring” and is responsible for ensuring that the designated Administrative Assistant has an up-to-date list of these matters at all times, including instructions from Royce’s Chief Investment Officer on how to vote on
those matters on behalf of Royce clients. Examples of “regularly recurring” matters include non-contested elections of directors and non-contested approval of independent auditors. Non-“regularly recurring” matters are brought to the attention of the portfolio manager(s) for the account(s) involved by the designated Administrative Assistant, and, after giving some consideration to advisories from Glass Lewis & Co., an independent third party research firm, the portfolio manager directs that such matters be voted in a way that he or she believes should better protect or enhance the value of the investment. If the portfolio manager determines that information concerning any proxy requires analysis, is missing or incomplete, he or she then gives the proxy to an analyst or another portfolio manager for review and analysis.
| | a. | | From time to time, it is possible that one Royce portfolio manager will decide (i) to vote shares held in client accounts he or she manages differently from the vote of another Royce portfolio manager whose client accounts hold the same security or (ii) to abstain from voting on behalf of client accounts he or she manages when another Royce portfolio manager is casting votes on behalf of other Royce client accounts. |
| | | | |
| | | | The designated Administrative Assistant reviews all proxy votes collected from Royce’s portfolio managers prior to such votes being cast. If any difference exists among the voting instructions given by Royce’s portfolio managers, as described above, the designated Administrative Assistant then presents these proposed votes to the Head of Administration, or his designee, and the Chief Investment Officer. The Chief Investment Officer, after consulting with the relevant portfolio managers, either reconciles the votes or authorizes the casting of differing votes by different portfolio managers. The Head of Administration, or his designee, maintains a log of all votes for which different portfolio managers have cast differing votes, that describes the rationale for allowing such differing votes and contains the initials of both the Chief Investment Officer and Head of Administration, or his designee, allowing such differing votes. The Head of Administration, or his designee, performs a weekly review of all votes cast by Royce to confirm that any conflicting votes were properly handled in accordance with the above-described procedures. |
| | | | |
| | b. | | There are many circumstances that might cause Royce to vote against an issuer’s board of directors or “management” proposal. These would include, among others, excessive compensation, unusual management stock options, preferential voting and poison pills. The portfolio managers decide these issues on a case-by-case basis as described above. |
| | | | |
| | c. | | A portfolio manager may, on occasion, determine to abstain from voting a proxy or a specific proxy item when he or she concludes that the potential benefit of voting is outweighed by the cost, when it is not in the client account’s best interest to vote. |
| | | | |
| | d. | | When a client has authorized Royce to vote proxies on its behalf, Royce will generally not accept instructions from the clients regarding how to vote proxies. |
| | | | |
| | e. | | If a security is on loan under The Royce Funds’ Securities Lending Program with State Street Bank and Trust Company (“Loaned Securities”), the Head of Administration, or his designee, will recall the Loaned Securities and request that they be delivered within the customary settlement period after the notice, to permit the exercise of their voting rights if the number of shares of the security on loan would have a material effect on The Royce Funds’ voting power at the up-coming stockholder meeting. A material effect is defined as any case where the Loaned Securities are 1% or more of a class of a company’s outstanding equity securities. Monthly, the Head of Administration or his designee will review the summary of this activity by State Street. A quarterly report detailing any exceptions that occur in recalling Loaned Securities will be given to the Boards. |
Custodian banks are authorized to release all proxy ballots held for Royce client account portfolios to Glass Lewis & Co. for voting, utilizing the Viewpoint proxy voting platform. Substantially all portfolio companies utilize Broadridge to collect their proxy votes.
Under the continuous oversight of the Head of Administration, or his designee, the designated Administrative Assistant is responsible for voting all proxies in a timely manner. Votes are returned to Broadridge using Viewpoint
as ballots are received, generally two weeks before the scheduled meeting date. The issuer can thus see that the shares were voted, but the actual vote cast is not released to the company until 4:00 pm on the day before the meeting. If proxies must be mailed, they go out at least ten business days before the meeting date.
Conflicts of Interest. The designated Administrative Assistant reviews reports generated by Royce’s portfolio management system (“Quest PMS”) that set forth by record date, any security held in a Royce client account which is issued by a (i) public company that is, or a known affiliate of which is, a separate account client of Royce (including sub-advisory relationships), (ii) public company, or a known affiliate of a public company, that has invested in a privately-offered pooled vehicle managed by Royce or (iii) public company, or a known affiliate of a public company, by which the spouse of a Royce employee or an immediate family member of a Royce employee living in the household of such employee is employed, for the purpose of identifying any potential proxy votes that could present a conflict of interest for Royce. The Head of Administration, or his designee, develops and updates the list of such public companies or their known affiliates which is used by Quest PMS to generate these daily reports. This list also contains information regarding the source of any potential conflict relating to such companies. Potential conflicts identified on the “conflicts reports” are brought to the attention of the Head of Administration or his designee by the designated Administrative Assistant. An R&A Compliance Officer then reviews them to determine if business or personal relationships exist between Royce, its officers, managers or employees and the company that could present a material conflict of interest. Any such identified material conflicts are voted by Royce in accordance with the recommendation given by an independent third party research firm (Glass Lewis & Co.). The Head of Administration or his designee maintains a log of all such conflicts identified, the analysis of the conflict and the vote ultimately cast. Each entry in this log is signed by the Chief Investment Officer before the relevant votes are cast.
Recordkeeping. A record of the issues and how they are voted is stored in the Viewpoint system. Copies of all physically executed proxy cards, all proxy statements (with it being permissible to rely on proxy statements filed and available on Edgar) and any other documents created or reviewed that are material to making a decision on how to vote proxies are retained in the Company File maintained by Royce’s Librarian in an easily accessible place for a period of not less than six years from the end of the fiscal year during which the last entry was made on such record, the first two years at Royce’s office. In addition, copies of each written client request for information on how Royce voted proxies on behalf of that client, and a copy of any written response by Royce to any (written or oral) client request for information on how Royce voted proxies on behalf of that client will be maintained by Royce’s Head of Administration and/or Royce’s Director of Alternative Investments, or their designee (depending on who received such request) for a period of not less than six years from the end of the fiscal year during which the last entry was made on such record, the first two years at Royce’s office. Royce’s Compliance Department shall maintain a copy of any proxy voting policies and procedures in effect at any time within the last five years.
Disclosure. Royce’s proxy voting procedures will be disclosed to clients upon commencement of a client account. Thereafter, proxy voting records and procedures are generally disclosed to those clients for which Royce has authority to vote proxies as set forth below:
| | - | | The Royce Funds – proxy voting records are disclosed annually on Form N-PX (with such voting records also available at www.roycefunds.com). Proxy voting procedures are available in the Statement of Additional Information for the open-end funds, in the annual report on Form N-CSR for the closed-end funds and at www.roycefunds.com. |
| | - | | Limited Liability Company and Limited Partnership Accounts – proxy voting records are disclosed to members/partners upon request and proxy voting procedures (along with a summary thereof) are provided to members/partners annually (and are available at www.roycefunds.com). |
| | - | | Separate Accounts – proxy voting records and procedures are disclosed to separate account clients annually. |
Item 8. Portfolio Managers of Closed-End Management Investment Companies.
(a)(1) Portfolio Managers of Closed-End Management Investment Companies (information as of December 31, 2014)
| Name | Title | Length of Service | Principal Occupation(s) During Past 5 Years |
| Charles M. Royce | President and member
of the Board of
Directors of the
Registrant | Since 1986 | Chief Executive Officer and member of the Board of Managers of Royce & Associates, LLC (“Royce”), investment adviser to the Registrant, President and member of the boards of directors/trustees of the Registrant, Royce Focus Trust, Inc., Royce Micro-Cap Trust, Inc. ("RMT"), Royce Global Value Trust, Inc. ,The Royce Fund , and Royce Capital Fund (collectively, "The Royce Funds"). |
| Chris E. Flynn | Assistant Portfolio
Manager* | Since April 1, 2007 | Assistant Portfolio Manager of the Registrant (since April 1, 2007); and Principal, Portfolio Manager and Senior Analyst at Royce (since 1993). |
| David A. Nadel | Assistant Portfolio
Manager* | Since April 1, 2007 | Assistant Portfolio Manager of the Registrant (since April 1, 2007); Director of International Research at Royce (since 2010); Portfolio Manager and Senior Analyst at Royce( since 2006); Senior Portfolio Manager at Neuberger Berman Inc. (2004-2006); and Senior Analyst at Pequot Capital Management, Inc. (2001-2003). |
| Lauren A. Romeo | Assistant Portfolio
Manager* | Since May 1, 2009 | Assistant Portfolio of the Registrant (since May 1, 2009); Portfolio Manager and Analyst at Royce (since 2004); Portfolio Manager at Dalton, Grenier, Hartman & Maher (since 2001); an Analyst with Legg Mason Funds Management (2000-2001); and an Analyst with T. Rowe Price Group (1996-2000). |
* Assistant Portfolio Managers may have investment discretion over a portion of the Registrant’s portfolio subject to the supervision of Registrant’s Portfolio Manager.
(a)(2) Other Accounts Managed by Portfolio Manager and Potential Conflicts of Interest (information as of December 31, 2014)
Other Accounts
Name of
Portfolio
Manager | Type of Account | Number of
Accounts
Managed | Total
Assets
Managed | Number of
Accounts
Managed for which
Advisory Fee is
Performance-Based | Value of
Managed
Accounts for
which
Advisory Fee is
Performance
Based |
| Charles M. Royce | | | | | |
| | Registered
investment
companies | 16 | $18,713,665,670 | 2 | $1,619,442,612 |
| | Private pooled
investment vehicles | 1 | $26,347,186 | 1 | $26,347,186 |
| | Other accounts* | 12 | $62,833,243 | - | - |
| | | | | | |
| Chris E. Flynn | | | | | |
| | Registered
investment
companies | 5 | $6,427,192,932 | 2 | $1,619,442,612 |
| | Private pooled
investment vehicles | - | - | - | - |
| | Other accounts* | - | - | - | - |
| | | | | | |
| David A. Nadel | | | | | |
| | Registered
investment
companies | 8 | $1,499,239,064 | 1 | $1,231,954,638 |
| | Private pooled
investment vehicles | - | - | - | - |
| | Other accounts* | - | - | - | - |
| Lauren A. Romeo | | | | | |
| | Registered
investment
companies | 6 | $13,505,769,408 | 1 | $1,231,954,638 |
| | Private pooled
investment vehicles | 3 | $819,156,888 | - | - |
| | Other accounts* | - | - | - | - |
| *Other accounts include all other accounts managed by the Portfolio Manager in either a professional or personal capacity except for personal accounts subject to pre-approval and reporting requirements under the Registrant’s Rule 17j-1 Code of Ethics. |
Conflicts of Interest
The fact that a Portfolio Manager has day-to-day management responsibility for more than one client account may create actual, potential or only apparent conflicts of interest. For example, the Portfolio Manager may have an opportunity to purchase securities of limited availability. In this circumstance, the Portfolio Manager is expected to review each account’s investment guidelines, restrictions, tax considerations, cash balances, liquidity needs and other factors to determine the suitability of the investment for each account and to ensure that his or her managed accounts are treated equitably. The Portfolio Manager may also decide to purchase or sell the same security for multiple managed accounts at approximately the same time. To address any conflicts that this situation may create, the Portfolio Manager will generally combine managed account orders (i.e., enter a "bunched" order) in an effort to obtain best execution or a more favorable commission rate. In addition, if orders to buy or sell a security for multiple accounts managed by common Portfolio Managers on the same day are executed at different prices or commission rates, the transactions will generally be allocated by Royce & Associates, LLC (“Royce”) to each of such managed accounts at the weighted average execution price and commission. In circumstances where a pre-allocated bunched order is not completely filled, each account will normally receive a pro-rated portion of the securities based upon the account’s level of participation in the order. Royce may under certain circumstances allocate securities in a manner other than pro-rata if it determines that the allocation is fair and equitable under the circumstances and does not discriminate against any account.
As described below, there is a revenue-based component of each Portfolio Manager’s Performance-Related Variable Compensation and the Portfolio Managers also receive Firm-Related Variable Compensation based on revenues (adjusted for certain imputed expenses) generated by Royce. In addition, Charles M. Royce receives variable compensation based on Royce’s retained pre-tax profits from operations. As a result, the Portfolio Managers may receive a greater relative benefit from activities that increase the value to Royce of The Royce Funds and/or other Royce client accounts, including, but not limited to, increases in sales of Registrant’s shares and assets under management.
Also, as described above, the Portfolio Managers generally manage more than one client account, including, among others, registered investment company accounts, separate accounts and private pooled accounts managed on behalf of institutions (e.g., pension funds, endowments and foundations) and for high-net-worth individuals. The appearance of a conflict of interest may arise where Royce has an incentive, such as a performance-based management fee (or any other variation in the level of fees payable by the Registrant or other Royce client accounts to Royce), which relates to the management of one or more of The Royce Funds or accounts with respect to which the same Portfolio Manager has day-to-day management responsibilities. Except as described below, no Royce Portfolio Manager’s compensation is tied to performance fees earned by Royce for the management of any one client account. Although variable and other compensation derived from Royce revenues or profits is impacted to some extent, the impact is relatively minor given the small percentage of Royce firm assets under management for which Royce receives performance-measured revenue. Notwithstanding the above, the Performance-Related Variable Compensation paid to Charles M. Royce as Portfolio Manager of two registered investment company accounts (the Registrant and RMT) is based, in part, on performance-based fee revenues. The Registrant and RMT pay Royce a fulcrum fee that is adjusted up or down depending on the performance of the Fund relative to its benchmark index.
Finally, conflicts of interest may arise when a Portfolio Manager personally buys, holds or sells securities held or to be purchased or sold for the Registrant or other Royce client account or personally buys, holds or sells the shares of one or more of The Royce Funds. To address this, Royce has adopted a written Code of Ethics designed to prevent and detect personal trading activities that may interfere or conflict with client interests (including Registrant’s stockholders’ interests). Royce generally does not permit its Portfolio Managers to purchase small- or micro-cap securities for their personal investment portfolios.
Royce and The Royce Funds have adopted certain compliance procedures which are designed to address the above-described types of conflicts. However, there is no guarantee that such procedures will detect each and every situation in which a conflict arises.
| (a)(3) Description of Portfolio Manager Compensation Structure (information as of December 31, 2014) | |
Royce seeks to maintain a compensation program that is competitively positioned to attract and retain high-caliber investment professionals. All Portfolio Managers, receive from Royce a base salary, Performance-Related Variable Compensation (generally the largest element of each Portfolio Manager’s compensation with the exception of Charles M. Royce), Firm-Related Variable Compensation based primarily on registered investment company and other client account revenues generated by Royce and a benefits package. Portfolio Manager compensation is reviewed and may be modified from time to time as appropriate to reflect changes in the market, as well as to adjust the factors used to determine variable compensation. Except as described below, each Portfolio Manager’s compensation consists of the following elements:
| | - | | BASE SALARY. Each Portfolio Manager is paid a base salary. In setting the base salary, Royce seeks to be competitive in light of the particular Portfolio Manager’s experience and responsibilities. |
| | | | |
| | - | | PERFORMANCE-RELATED VARIABLE COMPENSATION. Each Portfolio Manager receives quarterly Performance-Related Variable Compensation that is either asset-based, or revenue-based and therefore in part based on the value of the net assets of the account for which he or she is being compensated, determined with reference to each of the registered investment company and other client accounts they are managing. The revenue used to determine the quarterly Performance-Related Variable Compensation received by Charles M. Royce that relates to each of the Registrant and RMT is performance-based fee revenue. For all Portfolio Managers, the Performance-Related Variable Compensation applicable to the registered investment company accounts managed by the Portfolio Manager is subject to downward adjustment or elimination based on a combination of 3-year, 5-year risk and 10-year risk-adjusted pre-tax returns of such accounts relative to all small-cap objective funds with three years of history tracked by Morningstar (as of December 31, 2014 there were 395 such Funds tracked by Morningstar), the 5-year absolute returns of such accounts relative to 5-year U.S. Treasury Notes and absolute returns over the prior full market cycle and current cycle to date vs. the accounts’ benchmark. The Performance-Related Variable Compensation applicable to non-registered investment company accounts managed by a Portfolio Manager is not subject to performance-related adjustment. |
Payment of the Performance-Related Variable Compensation may be deferred, and any amounts deferred are forfeitable, if the Portfolio Manager is terminated by Royce with or without cause or resigns. The amount of the deferred Performance-Related Variable Compensation will appreciate or depreciate during the deferral period, based on the total return performance of one or more Royce-managed registered investment company accounts selected by the Portfolio Manager at the beginning of the deferral period. The amount deferred will depend on the Portfolio Manager’s total direct, indirect beneficial and deferred unvested investments in the Royce registered investment company account for which he or she is receiving portfolio management compensation.
| | - | | FIRM-RELATED VARIABLE COMPENSATION. Each Portfolio Manager receives quarterly variable compensation based on Royce’s net revenues. |
| | | | |
| | - | | BENEFIT PACKAGE. Each Portfolio Manager also receives benefits standard for all Royce employees, including health care and other insurance benefits, and participation in Royce’s 401(k) Plan and Money Purchase Pension Plan. From time to time, on a purely discretionary basis, Portfolio Managers may also receive options to acquire stock in Royce’s parent company, Legg Mason, Inc. Those options typically represent a relatively small portion of a Portfolio Managers’ overall compensation. |
Charles M. Royce, in addition to the above-described compensation, also receive variable compensation based on Royce’s retained pre-tax operating profit. This variable compensation, along with the Performance-Related Variable Compensation and Firm-Related Variable Compensation, generally represents the most significant element of Mr. Royce’s compensation. A portion of the above-described compensation payable to Mr. Royce relates to his responsibilities as Royce’s Chief Executive Officer and President of The Royce Funds.
(a)(4) Dollar Range of Equity Securities in Registrant Beneficially Owned by Portfolio Manager (information as of December 31, 2014)
The following table shows the dollar range of the Registrant’s shares owned beneficially and of record by the Portfolio Managers, including investments by his immediate family members sharing the same household and amounts invested through retirement and deferred compensation plans.
Portfolio Manager | Dollar Range of Registrant’s Shares Beneficially Owned |
| Charles M. Royce | Over $1,000,000 |
| Chris E. Flynn | $100,001 to $500,000 |
| David A. Nadel | None |
| Lauren A. Romeo | $100,001 to $500,000 |
(b) Not Applicable
Item 9. Purchases of Equity Securities by Closed-End Management Investment Company and Affiliated Purchasers. Not Applicable
Item 10. Submission of Matters to a Vote of Security Holders. Not Applicable.
Item 11. Controls and Procedures.
(a) Disclosure Controls and Procedures. The Principal Executive and Financial Officers concluded that the Registrant’s Disclosure Controls and Procedures are effective based on their evaluation of the Disclosure Controls and Procedures as of a date within 90 days of the filing date of this report.
(b) Internal Control over Financial Reporting. There were no significant changes in Registrant’s internal control over financial reporting or in other factors that could significantly affect this control subsequent to the date of the evaluation, including any corrective actions with regard to significant deficiencies and material weaknesses during the second fiscal quarter of the period covered by this report.
Item 12. Exhibits. Attached hereto.
(a)(1) The Registrant’s code of ethics pursuant to Item 2 of Form N-CSR.
(a)(2) Separate certifications by the Registrant’s Principal Executive Officer and Principal Financial Officer as required by Rule 30a-2(a) under the Investment Company Act of 1940.
(a)(3) Not Applicable
(b) Separate certifications by the Registrant’s Principal Executive Officer and Principal Financial Officer, pursuant to Section 906 of the Sarbanes-Oxley Act of 2002 and required by Rule 30a-2(b) under the Investment Company Act of 1940.
Pursuant to the requirements of the Securities Exchange Act of 1934 and the Investment Company Act of 1940, the registrant has duly caused this report to be signed on its behalf by the undersigned, thereunto duly authorized.
ROYCE VALUE TRUST, INC.
| BY: | /s/ Charles M. Royce |
| | Charles M. Royce |
| | President |
Date: March 5, 2015
Pursuant to the requirements of the Securities Exchange Act of 1934 and the Investment Company Act of 1940, this report has been signed below by the following persons on behalf of the registrant and in the capacities and on the dates indicated.
| ROYCE VALUE TRUST, INC. | ROYCE VALUE TRUST, INC. |
| | | | |
| BY: | /s/ Charles M. Royce | BY: | /s/ John D. Diederich |
| | Charles M. Royce | | John D. Diederich |
| | President | | Chief Financial Officer |
| | | | |
| Date: | March 5, 2015 | | Date: March 5, 2015 |
