| UNITED STATES |
| SECURITIES AND EXCHANGE COMMISSION |
| Washington, D.C. 20549 |
| | FORM N-CSR |
| | CERTIFIED SHAREHOLDER REPORT |
| OF |
| REGISTERED MANAGEMENT INVESTMENT COMPANIES |
| | Investment Company Act File Number: 811-04875 |
| | Name of Registrant: Royce Value Trust, Inc. |
| | Address of Registrant: 745 Fifth Avenue |
| New York, NY 10151 |
| Name and address of agent for service: | | John E. Denneen, Esquire |
| | | 745 Fifth Avenue |
| | | New York, NY 10151 |
| Registrant’s telephone number, including area code: (212) 508-4500 |
| Date of fiscal year end: December 31 |
| Date of reporting period: January 1, 2016 – December 31, 2016 |
Item 1. Reports to Shareholders.
| | | DECEMBER 31, 2016 |
| | | |
| | | |
| | | |
| | | 2016 Annual |
| | | Review and Report to Stockholders |
| | | |
| | | |
| | | |
| | | |
| | | |
| | | |
| | | |
| | | Royce Global Value Trust |
| | | | |
| | | Royce Micro-Cap Trust |
| | | | |
| | | Royce Value Trust |
| | | | |
| | | | |
| | | | |
| | | | |
| | | | |
| | | | |
| | | | |
| | | | |
| | | | |
| | | | |
| | | | |
| | | | |
| | | | |
| | | | |
| | | | |
| | | | |
| | | | |
| | | | |
| | | | |
| | | | |
| | | | |
| | | | |
| | | | |
| | | roycefunds.com |  |
| | | | |
| | | | |
| | | | |
A Few Words on Closed-End Funds
Royce & Associates, LP manages three closed-end funds: Royce Global Value Trust, which invests primarily in companies with headquarters outside of the United States, Royce Micro-Cap Trust, which invests primarily in micro-cap securities; and Royce Value Trust, which invests primarily in small-cap securities. A closed-end fund is an investment company whose shares are listed and traded on a stock exchange. Like all investment companies, including open-end mutual funds, the assets of a closed-end fund are professionally managed in accordance with the investment objectives and policies approved by the fund’s Board of Directors. A closed-end fund raises cash for investment by issuing a fixed number of shares through initial and other public offerings that may include shelf offerings and periodic rights offerings. Proceeds from the offerings are invested in an actively managed portfolio of securities. Investors wanting to buy or sell shares of a publicly traded closed-end fund after the offerings must do so on a stock exchange, as with any publicly traded stock. Shares of closed-end funds frequently trade at a discount to their net asset value. This is in contrast to open-end mutual funds, which sell and redeem their shares at net asset value on a continuous basis.
A Closed-End Fund Can Offer Several Distinct Advantages
| • | A closed-end fund does not issue redeemable securities or offer its securities on a continuous basis, so it does not need to liquidate securities or hold uninvested assets to meet investor demands for cash redemptions. |
| | |
| • | In a closed-end fund, not having to meet investor redemption requests or invest at inopportune times can be effective for value managers who attempt to buy stocks when prices are depressed and sell securities when prices are high. |
| | |
| • | A closed-end fund may invest in less liquid portfolio securities because it is not subject to potential stockholder redemption demands. This is potentially beneficial for Royce-managed closed-end funds, with significant investments in small- and micro-cap securities. |
| | |
| • | The fixed capital structure allows permanent leverage to be employed as a means to enhance capital appreciation potential. |
| | |
| • | Royce Micro-Cap Trust and Royce Value Trust distribute capital gains, if any, on a quarterly basis. Each of these Funds has adopted a quarterly distribution policy for its common stock. |
We believe that the closed-end fund structure can be an appropriate investment for a long-term investor who understands the benefits of a more stable pool of capital.
Why Dividend Reinvestment Is Important
A very important component of an investor’s total return comes from the reinvestment of distributions. By reinvesting distributions, our investors can maintain an undiluted investment in a Fund. To get a fair idea of the impact of reinvested distributions, please see the charts on pages 12 and 13. For additional information on the Funds’ Distribution Reinvestment and Cash Purchase Options and the benefits for stockholders, please see page 14 or visit our website at www.roycefunds.com.
Managed Distribution Policy
The Board of Directors of each of Royce Micro-Cap Trust and Royce Value Trust has authorized a managed distribution policy (“MDP”). Under the MDP, Royce Micro-Cap Trust and Royce Value Trust pay quarterly distributions at an annual rate of 7% of the average of the prior four quarter-end net asset values, with the fourth quarter being the greater of these annualized rates or the distribution required by IRS regulations. With each distribution, the Fund will issue a notice to its stockholders and an accompanying press release that provides detailed information regarding the amount and composition of the distribution (including whether any portion of the distribution represents a return of capital) and other information required by a Fund’s MDP. You should not draw any conclusions about a Fund’s investment performance from the amount of distributions or from the terms of a Fund’s MDP. A Fund’s Board of Directors may amend or terminate the MDP at any time without prior notice to stockholders; however, at this time there are no reasonably foreseeable circumstances that might cause the termination of any of the MDPs.
| This page is not part of the 2016 Annual Report to Stockholders |
| Table of Contents | | | |
| | | | |
| | | | |
| Annual Review | | | |
| | | | |
| Letter to Our Stockholders | | 2 | |
| | | | |
| Performance | | 5 | |
| | | | |
| | | | |
| Annual Report to Stockholders | | | |
| | | | |
| Managers’ Discussions of Fund Performance | | | |
| | | | |
Royce Global Value Trust | | 6 | |
| | | | |
Royce Micro-Cap Trust | | 8 | |
| | | | |
Royce Value Trust | | 10 | |
| | | | |
| History Since Inception | | 12 | |
| | | | |
| Distribution Reinvestment and Cash Purchase Options | | 14 | |
| | | | |
| Schedules of Investments and Other Financial Statements | | | |
| | | | |
Royce Global Value Trust | | 15 | |
| | | | |
Royce Micro-Cap Trust | | 29 | |
| | | | |
Royce Value Trust | | 44 | |
| | | | |
| Directors and Officers | | 60 | |
| | | | |
| Notes to Performance and Other Important Information | | 61 | |
| | | | |
| Results of Stockholders Meetings | | 62 | |

| This page is not part of the 2016 Annual Report to Stockholders |
Letter to Our Stockholders

A MOST WONDERFUL YEAR FOR SMALL-CAPS,
VALUE, AND CYCLICALS
By any measure, 2016 was a terrific year for domestic small-cap stocks, one that featured a double-digit positive return for the Russell 2000 Index, which advanced 21.3%, and a solid advantage over their large-cap counterparts. It was an even better year for small-cap value stocks and a highly rewarding one for cyclical sectors. These last two factors were critical in boosting results for certain active management approaches within the asset class, including a number of our own. Arguably even more important was what these developments may be telling us about the subsequent direction of small-cap equity returns. We flesh out the details later in this letter, but these three reversals—positive results for small-caps, leadership for value over growth, and outperformance for cyclicals—should be key in setting the tone for the direction of small-caps going forward. They coalesced around the central, normalizing force of rising interest rates.
The major impact of these reversals was both highly welcome and long overdue. We saw 2015—a year in which large-cap beat small-cap, the Russell 2000 had a negative return, and market leadership was extremely narrow—as a hinge year. It marked the transition out of the period that began in 2011, when an unprecedented amount of monetary intervention into the global economy had the unintended effect of stoking an intense appetite for yield and safety at one extreme of the U.S. equity markets and a hunger for high risk at the other. The bottom of a commodity super cycle, with the attendant slowdowns in the world’s largest developing markets, only exacerbated the challenges then faced by value stocks and active management approaches. |
As has usually been the case historically, the longer market trends last, the more regularly they are mistaken for permanent realignments. In this most recent instance, the consensus lined up around the perpetuation of near-zero rates, growth stock dominance, and the futility of active management. Whether in good times or bad for our own approaches, however, we have always stayed mindful of the fact that trends do not last forever—they persist, then, more often than not, they reverse. This investment truism should serve as a corrective for those who would take the example of a highly anomalous period for the markets and economy to validate an implacable bias against active management.
THE POWER OF RATES AND THE IMPACT
OF THE PARADIGM SHIFT
Even as small-cap specialists, we recognize that few forces act as powerfully on the value of investments as interest rates. The effects can be as obvious as they are subtle. We think three conditions matter most: the level of rates, the spread between short- and long-term rates, and the disparity in borrowing rates between better-run companies and worse ones. Capitalism tends to best foster economic growth when short rates hover a bit above inflation; when long rates are high enough to encourage lenders but not so high as to discourage borrowers; and when there is a premium for fiscal prudence and a commensurate penalty for profligate debtors. During the era of zero (or near-zero) rates—roughly 2011-2015—these historically “normal” conditions were largely absent. Yet we believe they began to manifest themselves again in 2016, marking a paradigm shift to a period of higher rates and a consequent reassessment of the relative values of financial assets. More normalized rates have historically been better for stocks than |
| 2 | This page is not part of the 2016 Annual Report to Stockholders |
LETTER TO OUR STOCKHOLDERS
bonds. More important for our purposes, they have also supported small-caps over large, value over growth stocks, and cyclicals over defensive areas. In many ways, 2016’s results exemplified exactly this shift—and we think it is just the beginning of what could be a steady, though not linear, multi-year run.
With 2016’s stellar results fresh in the mind, it may be difficult to recall just how poorly the year started and how fatalistic the expectations were for equities. Small-cap stocks plunged from the first peal of 2016’s opening bell. The downdraft exacerbated a trend that had begun the previous summer following the small-cap peak on June 23, 2015. By the time it was all over with the small-cap bottom on February 11, 2016, the Russell 2000 had fallen 25.7%. The last leg of the downdraft included many of the signs of a classic bottoming-out process—panic selling in a number of sectors (most notably within the biopharma complex), small-caps losing more than large-caps, and more resilience from value stocks—to us, the most significant development in the down phase. As unpleasant as any bear market is, we noted that the leadership shift, because it was nearly concomitant with the rate hike, was likely to last.
Moreover, these signs also gave us some assurance that this was a historically conventional decline, making us confident that the small-cap market was undergoing its own important and familiar shift. The depths plumbed by this bear market were comparable to previous downturns—and that encouraged our belief that the worst was over just before the Russell 2000 rebounded sharply from its February low through the end of the year. These small-cap bear and bull markets received so little comment beyond our own and that of fellow small-cap specialists that we refer to them as “stealth” markets. They also reinforced our contention that this small-cap rally has room to run. Despite its strong showing in 2016, the Russell 2000 finished the year only 7.2% above its June 2015 peak. For additional context, it is worth noting that small-cap upswings usually extend well beyond the |
| |
| Equity Indexes as of December 31, 2016 (%) | | | | | | | | | | |
| | | 1-YR | | 3-YR | | 5-YR | | 10-YR |
| |
| Russell 2000 | | | 21.31 | | | | 6.74 | | | | 14.46 | | | | 7.07 | |
| |
| Russell 2000 Value | | | 31.74 | | | | 8.31 | | | | 15.07 | | | | 6.26 | |
| |
| Russell 2000 Growth | | | 11.32 | | | | 5.05 | | | | 13.74 | | | | 7.76 | |
| |
| S&P 500 | | | 11.96 | | | | 8.87 | | | | 14.66 | | | | 6.95 | |
| |
| Russell 1000 | | | 12.05 | | | | 8.59 | | | | 14.69 | | | | 7.08 | |
| |
| Nasdaq Composite | | | 7.50 | | | | 8.83 | | | | 15.62 | | | | 8.34 | |
| |
| Russell Midcap | | | 13.80 | | | | 7.92 | | | | 14.72 | | | | 7.86 | |
| |
| Russell Microcap | | | 20.37 | | | | 5.77 | | | | 15.59 | | | | 5.47 | |
| |
| Russell Global ex-U.S. Small Cap | | | 5.04 | | | | 0.57 | | | | 7.22 | | | | 2.65 | |
| |
| Russell Global ex-U.S. Large Cap | | | 4.30 | | | | -1.51 | | | | 5.35 | | | | 1.24 | |
| |
| For details on The Royce Funds’ performance in the period, please turn to the Managers’ Discussions that begin on page 8. |
47.4% advance the small-cap index made from its February bottom through the end of 2016. There have been 12 declines of 15% or more for the Russell 2000 since its 1979 inception. The median return for the subsequent recovery period was 98.8%. So both history and the currently hospitable economic environment suggest to us that there may well be plenty of life left in the small-cap rally.
VALUE’S TURN?
The recent extended run of small-cap growth leadership makes it worth recalling that it is actually small-cap value stocks that own the pronounced long-term historical edge in relative performance. Of course, it makes sense that many investors were not conscious of this history at the beginning of the year. Prior to resuming leadership, the Russell 2000 Value Index trailed the Russell 2000 Growth Index in six out of seven years between 2009 and 2015. Based on their long-term performance and leadership history, this was an inordinately lengthy span. Is it now value’s turn, then? We think so. Prolonged periods of leadership for small-cap growth have historically been followed by long tenures at the helm for value. Multi-year trends typically do not have brief reversals before reappearing. Based on this pattern, we think the current leadership status of small-cap value is likely to last. Further, value stocks have historically outpaced growth issues when the economy is expanding—growth companies generally being most highly valued when growth is scarce in the economy. Rising interest rates have also historically provided a relative headwind for growth stocks because their valuations typically have a long-duration bond aspect to them that is highly sensitive to changes in rates.
We saw the post-election rally and the sudden shift in investor perspective that came with it as more symptom than cause of an overall improved environment for both the economy and stocks. After all, some had forecast the pickup in GDP growth prior to any votes being cast just as many investors realized that the era of “lower forever” interest rates had reached its conclusion before the Fed officially announced the hike in December. There were also encouraging pickups in employment and incremental growth in wages. Along with the added certainty that comes after nearly every election, especially a contentious one, all of this stoked bullishness. So while the election was undoubtedly an accelerant, it seemed to us that many investors—and management teams—simply needed the experience of a tangible event before they felt comfortable enough to embrace the good news that had been accumulating prior to November. |
| This page is not part of the 2016 Annual Report to Stockholders | 3 |
LETTER TO OUR STOCKHOLDERS
The aftermath of the election has set the stage for changes that could benefit small-cap companies, beginning with a lower corporate tax rate. With the bulk of their money coming from domestic sources, many small-cap businesses would receive a disproportionate benefit from any rate reduction. Also encouraging are the prospects for repatriation. It was not surprising, then, that the postelection period also witnessed a dramatic rotation away from safety—bonds and defensive stocks most notably. Investors are bullish on the potential for accelerated economic growth and the policy shift from monetary to fiscal—chiefly in the form of tax cuts and projected spending increases on infrastructure and defense. The critical question going forward is, how much of this has already been priced in?
TURN THE PAGE
All of this has convinced us that we have turned the page on that 2011-2015 period in which financial markets behaved in such odd and unprecedented ways. We firmly believe that we are back on the road to a more historically normal market environment. We expect a multi-year run for the current environment of increased return dispersion, declining correlation, and a steepening yield curve, such as we saw in 2016, and think this will also lead to more historically normal relative return patterns for equity asset classes.
Only time will tell, of course. However, we do not think a significant correction—that is, a decline of 15% or more—is in the offing. We see no signs of a recession or financial crisis. Still, a downdraft of anywhere from 8-10% would not be at all unexpected, and arguably healthy, given the strength of small-cap’s 2016 run. When one does occur, we are prepared to act opportunistically by trying to turn any volatility to our investors’ long-term advantage. In any event, we see ongoing leadership not only for small-cap value but for many cyclical sectors as well. Cyclicals lagged for so long that, as with value stocks (with which there is substantial overlap), we were anticipating a shift, which is precisely what we are seeing in the current cycle. Financials are benefiting from the steepening yield curve, which should help to lift bank profits, while the |
potential for accelerated economic growth is boosting Industrials and many Materials stocks. The latter are also benefiting from rebounding commodity prices that ignited energy stocks as well. In addition, the U.S. consumer continues to spend. We see all of these as potentially ongoing trends. And although the global outlook is admittedly less certain, any rebound in worldwide industrial activity would be an additional, and significant, positive.
A NEW DAY FOR ACTIVE MANAGEMENT
Ongoing leadership for value and the related strength of cyclicals could produce distinct advantages for small-cap active management. As rates continue to rise and access to capital begins to contract more consistently, the number of bankruptcies should escalate, restoring the healthy, Darwinian force that generally ensures survival for the best-run, most prudently managed enterprises while putting others at potentially greater risk. It creates challenges for more debt-dependent, long-duration growth while offering potential benefits for companies that are conservatively capitalized. If we are correct in our argument that a multi-year period of value leadership is just beginning, then we also expect it to be a strong period for thoughtful and disciplined small-cap active management.
To be sure, this was the case for domestic small-caps in 2016. Royce Micro-Cap Trust and Royce Value Trust increased more than 20% (and bested their respective benchmarks in the process). These performances were largely rooted in our dogged commitment to disciplined approaches to small-cap stock investing. They support the confidence we have going forward, which is also bolstered by the fact that our analysis of the dynamics in our asset class was sound. We felt validated not only by the high returns for our two domestically oriented portfolios but also that performance took place against the backdrop of a gradually growing economy. Historically, value-led periods have been good for many Royce Funds, and we remain committed to the effort of delivering strong results for our investors in the years to come.
You have our great thanks and deep appreciation for the commitment you have shown to us and our approaches over the years. |
 | |  | |  |
| Charles M. Royce | | Christopher D. Clark | | Francis D. Gannon |
| Chairman, | | Chief Executive Officer and | | Co-Chief Investment Officer, |
| Royce & Associates, LP | | Co-Chief Investment Officer,
Royce & Associates, LP | | Royce & Associates, LP |
| | | | | |
| January 31, 2017 | | | | |
| 4 | This page is not part of the 2016 Annual Report to Stockholders |
Performance
| |
| |
NAV Average Annual Total Returns
As of December 31, 2016 (%) |
| | | | | | | | | | | |
| | | | | | | | | | | | | | | | | | | | | | |
| | | | 1-YR | | 3-YR | | 5-YR | | 10-YR | | 15-YR | | 20-YR | | 25-YR | | 30-YR | | SINCE
INCEPTION | | INCEPTION
DATE |
| |
| Royce Global Value Trust | | 11.12 | | 0.20 | | N/A | | N/A | | N/A | | N/A | | N/A | | N/A | | 1.05 | | 10/17/13 |
| |
| Royce Micro-Cap Trust | | 21.98 | | 3.70 | | 13.59 | | 6.07 | | 9.22 | | 10.26 | | N/A | | N/A | | 10.81 | | 12/14/93 |
| |
| Royce Value Trust | | 26.79 | | 5.50 | | 12.70 | | 5.81 | | 8.26 | | 9.81 | | 10.73 | | 10.58 | | 10.55 | | 11/26/86 |
| |
INDEX | | | | | | | | | | | | | | | | | | | | |
| |
| Russell 2000 Index | | 21.31 | | 6.74 | | 14.46 | | 7.07 | | 8.49 | | 8.25 | | 9.69 | | 9.62 | | N/A | | N/A |
| |
| Russell Microcap Index | | 20.37 | | 5.77 | | 15.59 | | 5.47 | | 8.16 | | N/A | | N/A | | N/A | | N/A | | N/A |
| |
| Russell Global Small Cap Index | | 11.50 | | 2.98 | | 9.92 | | 4.17 | | 8.87 | | 6.82 | | N/A | | N/A | | N/A | | N/A |
| |
1 Not Annualized
Important Performance and Risk Information
All performance information in this Review and Report reflects past performance, is presented on a total return basis, net of the Fund’s investment advisory fee, and reflects the reinvestment of distributions. Past performance is no guarantee of future results. Investment return and principal value of an investment will fluctuate, so that shares may be worth more or less than their original cost when sold. Current performance may be higher or lower than performance quoted. Current month-end performance may be obtained at www.roycefunds.com. The Funds are closed-end registered investment companies whose respective shares of common stock may trade at a discount to the net asset value. Shares of each Fund’s common stock are also subject to the market risk of investing in the underlying portfolio securities held by each Fund. Certain immaterial adjustments were made to the net assets of Royce Micro-Cap Trust at 12/31/12, as well as 12/31/14 and of Royce Value Trust at 12/31/16, for financial reporting purposes, and as a result the net asset value originally calculated on that date and the total return based on that net asset value differs from the adjusted net asset value and total return reported in the Financial Highlights. All indexes referenced are unmanaged and capitalization-weighted. Each index’s returns include net reinvested dividends and/or interest income. Russell Investment Group is the source and owner of the trademarks, service marks and copyrights related to the Russell Indexes. Russell® is a trademark of Russell Investment Group. The Russell 2000 Index is an index of domestic small-cap stocks that measures the performance of the 2,000 smallest publicly traded U.S. companies in the Russell 3000 Index. The Russell Microcap Index includes 1,000 of the smallest securities in the small-cap Russell 2000 Index, along with the next smallest eligible securities as determined by Russell. The Russell Global Small Cap Index is an unmanaged, capitalization-weighted index of global small-cap stocks. The performance of an index does not represent exactly any particular investment, as you cannot invest directly in an index. Index returns include net reinvested dividends and/or interest income. Royce Value, Micro-Cap and Global Value Trust shares of common stock trade on the NYSE. Royce Fund Services, Inc (“RFS”) is a member of FINRA and files certain material with FINRA on behalf of each Fund. RFS is not an underwriter or distributor of any of the Funds.
This page is not part of the 2016 Annual Report to Stockholders | 5
| MANAGER’S DISCUSSION |
| Royce Global Value Trust (RGT) |
 |
| Chuck Royce |
| |
FUND PERFORMANCE
Royce Global Value Trust advanced 11.1% on a net asset value (“NAV”) basis and 9.8% on a market price basis compared to a gain of 11.5% for its unleveraged benchmark, the Russell Global Small Cap Index, for the same period. This was a solid absolute result, though it disappointed on a relative basis. U.S. small-caps were very strong in 2016, in contrast to their international cousins. The Fund’s lower exposure to U.S. companies than the index, therefore, was a factor in its slight relative disadvantage for the calendar year. Investors in non-U.S. small-caps generally showed more favor to commodity-based international small-cap companies—oil & gas as well as metals & mining were among the top performers—than they did to the kind of businesses that we seek: small- and mid-cap stocks (those with market caps up to $10 billion) with high returns on invested capital or those with strong fundamentals and/or prospects trading at what Royce believes are attractive valuations.
During the first half of 2016, the Fund was up 3.9% on an NAV basis and 2.0% based on market price versus a 1.4% gain for the global small-cap index. Both the Fund and its benchmark showed even more life in the third quarter as many stocks bounced back or stabilized following Brexit-bred volatility. RGT was up 6.3% in the third quarter (while increasing 6.9% based on its market price) compared to a gain of 8.3% for the Russell Global Small Cap Index. During the fourth quarter, however, many international small-caps declined, which had a larger impact on RGT. The Fund increased 0.6% based on its NAV (and 0.7% based on market price) in the year’s final quarter compared to a 1.5% advance for the benchmark. A portion of RGT’s second-half lag can be traced to currency effects. The rising U.S. dollar was particularly strong against the British pound, which declined significantly in the wake of the Brexit vote, making things difficult for the Fund’s sizable investments in the U.K. |
| WHAT WORKED... AND WHAT DIDN’T |
Eight of the portfolio’s 10 equity sectors finished 2016 in the black. The most significant contributions came from Materials, Financials, Information Technology, and Industrials, which made a much larger impact than the remaining four contributing sectors. Health Care detracted—it was the only sector in the Russell Global Small Cap with a negative return in 2016—while Telecommunication Services was basically flat. Four industries had a substantial positive impact in 2016: metals & mining (Materials), electronic equipment, instruments & components (Information Technology), capital markets (Financials), and machinery (Industrials). The effect of detracting industries was comparatively modest. Pharmaceuticals (Health Care) detracted most by a sizable margin, followed by technology hardware, storage & peripherals (Information Technology), and oil, gas & consumable fuels (Energy).
The Fund’s top contributor at the position level was Genworth MI Canada, one of that country’s leading residential mortgage insurance providers. Its stock first began to rebound with consecutive quarters of improved operating results. The recovery of energy prices also helped as about 20% of Genworth’s policies are written in resource-rich Alberta. The company then announced solid results for its fiscal third quarter in November. We reduced our position in 2016. Pan American Silver was part of a group of both precious and industrial metals companies that came back strong in 2016 as commodity prices rose. |
| |
The portfolio’s top detractor at the position level was Virbac, a French firm that makes vaccines, antibiotics, and other veterinary medications. Its shares suffered mostly from the negative results of a 2014 FDA investigation of its U.S. plant in St. Louis that were released earlier this year. In December 2016, however, the FDA rescinded the warning letter, leaving the status of Virbac’s U.S. operations where they were at the beginning of the year, which allowed its shares to begin to recover. It was a top-40 holding in the Fund at the end of 2016. Value Partners Group is a Hong Kong-based asset manager that emphasizes value approaches. Subpar short-term performance, net outflows, and a CEO resignation all contributed to investors’ concerns. Because we remain confident in its long-term prospects, particularly in China, as well as in its Chairman, who has assumed CEO responsibilities, we were comfortable holding our stake.
Relative to the Russell Global Small Cap, the Fund was hurt most by ineffective stock picking in the Industrials sector, most meaningfully in the machinery and commercial services & supplies industries. Stock selection was also an issue in Financials. Conversely, both our overweight and savvy stock picking gave us a relative edge in Materials while stock selection also helped in Information Technology. |
| | | | | |
| | Top Contributors to Performance
For 2016 (%)1 | | | |
| | | | | |
| | Genworth MI Canada | | 0.65 | |
| | | |
| | Pan American Silver | | 0.63 | |
| | | |
| | CETIP - Mercados Organizados | | 0.50 | |
| | | |
| | Quaker Chemical | | 0.46 | |
| | | |
| | Nanometrics | | 0.44 | |
| | | |
| | 1 Includes dividends | | | |
| | | | | |
| | | | | |
| | Top Detractors from Performance
For 2016 (%)2 | | | |
| | | | | |
| | Virbac | | -0.54 | |
| | | |
| | Value Partners Group | | -0.46 | |
| | | |
| | Santen Pharmaceutical | | -0.40 | |
| | | |
| | Consort Medical | | -0.35 | |
| | | |
| | Clarkson | | -0.31 | |
| | | |
| | 2 Net of dividends | | | |
| | | | | |
| CURRENT POSITIONING AND OUTLOOK |
| At the end of 2016, the Fund’s largest country weights were the U.S., the U.K., Japan, and Canada. We think the global markets continue to offer terrific potential in a number of sectors and regions to find the kind of underappreciated, fundamentally solid companies that have long been our focus here at Royce. In our view cyclicals both in and outside the U.S. look well-positioned for ongoing leadership. In addition to our usual cyclical tilt, we are looking in some defensive areas such as healthcare. It is very much on a stock-by-stock basis, with a focus on individual companies that combine attractive valuations with strong fundamentals. |
| 6 | 2016 Annual Report to Stockholders |
| PERFORMANCE AND PORTFOLIO REVIEW | | SYMBOLS MARKET PRICE RGT NAV XRGTX |
| Performance |
| Average Annual Total Return (%) Through 12/31/16 |
| | | JUL-DEC 20161 | | 1-YR | | 3-YR | | SINCE INCEPTION (10/17/13) |
| |
| RGT (NAV) | | 6.99 | | 11.12 | | 0.20 | | 1.05 |
| |
| 1 Not Annualized | | | | | | | | |
Market Price Performance History Since Inception (10/17/13)Cumulative Performance of Investment1
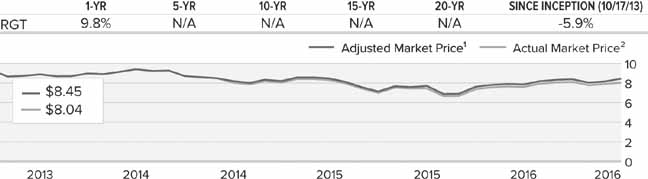
| 1 | Reflects the cumulative performance experience of a continuous common stockholder who purchased one share at inception ($8.975 IPO) and
reinvested all distributions. |
| 2 | Reflects the actual month-end market price movement of one share as it has traded on NYSE and, prior to 12/1/03, on the Nasdaq. |
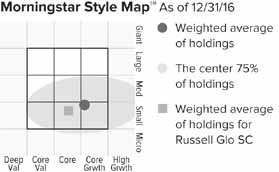
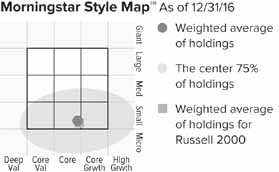
The Morningstar Style Map is the Morningstar Style Box™ with the center 75% of fund holdings plotted as the Morningstar Ownership Zone™. The Morningstar Style Box is designed to reveal a fund’s investment strategy. The Morningstar Ownership Zone provides detail about a portfolio’s investment style by showing the range of stock sizes and styles. The Ownership Zone is derived by plotting each stock in the portfolio within the proprietary Morningstar Style Box. Over time, the shape and location of a fund’s ownership zone may vary. See page 61 for additional information. |
|
| Top 10 Positions | | |
| % of Net Assets | | |
| | | |
|
| Kirby Corporation | | 2.2 |
| |
| SEI Investments | | 2.0 |
| |
| SEACOR Holdings | | 1.4 |
| |
| Meitec Corporation | | 1.4 |
| |
| Lazard Cl. A | | 1.3 |
| |
| VZ Holding | | 1.3 |
| |
| Raven Industries | | 1.3 |
| |
| KBR | | 1.2 |
| |
| Virtu Financial Cl. A | | 1.2 |
| |
| Nanometrics | | 1.1 |
| |
|
| Portfolio Sector Breakdown | | |
| % of Net Assets | | |
| | | |
| Industrials | | 28.8 |
| |
| Financials | | 18.1 |
| |
| Information Technology | | 17.3 |
| |
| Materials | | 11.4 |
| |
| Health Care | | 10.0 |
| |
| Consumer Discretionary | | 7.2 |
| |
| Energy | | 3.4 |
| |
| Consumer Staples | | 2.8 |
| |
| Real Estate | | 2.5 |
| |
| Telecommunication Services | | 0.2 |
| |
| Outstanding Line of Credit, Net of Cash and Cash Equivalents | | -1.7 |
| |
|
| Calendar Year Total Returns (%) | | |
| | | |
| YEAR | | RGT |
| |
| 2016 | | 11.1 |
| |
| 2015 | | -3.4 |
| |
| 2014 | | -6.2 |
| |
|
Portfolio Country Breakdown 1,2
% of Net Assets | | |
| | | |
| |
| United States | | 32.7 |
| |
| United Kingdom | | 13.0 |
| |
| Japan | | 9.7 |
| |
| Canada | | 8.4 |
| |
| Germany | | 4.6 |
| |
| France | | 4.3 |
| |
| Switzerland | | 4.3 |
| |
| 1 Represents countries that are 3% or more of net assets. |
| 2 Securities are categorized by the country of their headquarters. |
|
| Portfolio Diagnostics | | |
| | | |
| Fund Net Assets | | $100 million |
| |
| Number of Holdings | | 274 |
| |
| Turnover Rate | | 59% |
| |
| Net Asset Value | | $9.62 |
| |
| Market Price | | $8.04 |
| |
| Net Leverage1 | | 1.7% |
| |
| Average Market Capitalization2 | | $1,558 million |
| |
| Weighted Average P/E Ratio3, 4 | | 20.5x |
| |
| Weighted Average P/B Ratio3 | | 2.6x |
| |
| Active Share5 | | 97% |
| |
| 1 | Net leverage is the percentage, in excess of 100%, of the total value of equity type investments, divided by net assets. |
| 2 | Geometric Average. This weighted calculation uses each portfolio holding’s market cap in a way designed to not skew the effect of very large or small holdings; instead, it aims to better identify the portfolio’s center, which Royce believes offers a more accurate measure of average market cap than a simple mean or median. |
| 3 | Harmonic Average. This weighted calculation evaluates a portfolio as if it were a single stock and measures it overall. It compares the total market value of the portfolio to the portfolio’s share in the earnings or book value, as the case may be, of its underlying stocks. |
| 4 | The Fund’s P/E ratio calculation excludes companies with zero or negative earnings (10% of portfolio holdings as of 12/31/16). |
| 5 | Active Share is the sum of the absolute values of the different weightings of each holding in the Fund versus each holding in the benchmark, divided by two. |
| Important Performance and Risk Information
All performance information reflects past performance, is presented on a total return basis, net of the Fund’s investment advisory fee, and reflects the reinvestment of distributions. Past performance is no guarantee of future results. Current performance may be higher or lower than performance quoted. Returns as of the most recent month-end may be obtained at www.roycefunds.com. The market price of the Fund’s shares will fluctuate, so that shares may be worth more or less than their original cost when sold. The Fund invests primarily in securities of small- and mid-cap companies, which may involve considerably more risk than investments in securities of larger-cap companies. The Fund’s broadly diversified portfolio does not ensure a profit or guarantee against loss. From time to time, the Fund may invest a significant portion of its net assets in foreign securities, which may involve political, economic, currency and other risks not encountered in U.S. investments. Regarding the “Top Contributors” and “Top Detractors” tables shown on page 6, the sum of all contributors to, and all detractors from, performance for all securities in the portfolio would approximate the Fund’s year-to-date performance for 2016.
|
| 2016 Annual Report to Stockholders | 7 |
| | | MANAGER’S DISCUSSION |
| Royce Micro-Cap Trust (RMT) | | |
 |
| Chuck Royce |
FUND PERFORMANCE
Royce Micro-Cap Trust (“RMT”) advanced 22.0% on a net asset value (“NAV”) basis and 22.3% on a market price basis in 2016, ahead of both of its unleveraged benchmarks: the small-cap Russell 2000 Index was up 21.3% while the Russell Microcap Index increased 20.4% for the same period. We were very pleased with the Fund’s results on both an absolute and relative basis, particularly in a year in which small-cap stocks held a slight edge over their micro-cap siblings. RMT’s multi-strategy core approach was well-positioned for a market that rewarded factors such as low valuation, liquidity, low volatility, and quality, all of which outperformed within the Russell 2000 and provided some validation for our approach.
The two halves of 2016 were mirror images of one another. The first was stronger on a relative basis while the second was better on an absolute scale. During the first half of 2016, the Fund was up 5.4% on an NAV basis (and 5.8% on a relative basis) versus a gain of 2.2% for the Russell 2000 and a decline of 1.7% for the Russell Microcap for the same period. In the second half, RMT increased 15.7% on an NAV basis and 15.6% based on market price basis. This compared to respective gains of 18.7% and 22.4% for the small-cap and micro-cap indexes. On an NAV basis, RMT outpaced the Russell Microcap for the one-, 10-, and 15-year periods ended December 31, 2016 while also beating the Russell 2000 for the one-, 15-, 20-year, and since inception (12/14/93) periods. (Returns for the Russell Microcap Index only go back to 2000.) RMT’s average annual NAV total return for the since inception period ended December 31, 2016 was 10.8%. |
| |
| WHAT WORKED... AND WHAT DIDN’T |
Each of the portfolio’s 11 equity sectors made a contribution to calendar-year results. The largest positive impact by far came from Information Technology and Industrials, RMT’s two largest sectors, followed by noteworthy net gains from Materials and Financials. Some of the smallest contributions came from those sectors with the smallest weightings: Real Estate, Consumer Staples, Telecommunication Services, and Utilities. At the industry level, the top-contributors by a sizable margin were electronic equipment, instruments & components (Information Technology), metals & mining (Materials), and machinery (Industrials). Detractors made a very modest negative impact, led by software (Information Technology), distributors (Consumer Discretionary), and IT services (Information Technology).
RMT’s top-contributing position was IES Holdings, which provides electrical contracting and maintenance services to the commercial, industrial, residential, and power line markets. The firm also engages in data communication services, including the installation of fiber optic telecommunications systems. Very healthy earnings and a strong outlook, both of which were boosted by five acquisitions the firm made between mid-2015 and the end of 2016, attracted investors. Top-five position Major Drilling Group International performs contract drilling for companies involved in mining and mineral exploration. In a challenging environment for miners early in 2016, the company was able to increase revenues and margins. Revenue growth continued throughout the year as business conditions, while remaining competitive, began to improve. Newport Corporation is a photonics technology specialist whose shares climbed in February after the company agreed to be acquired by MKS Instruments. |
| |
| As for those holdings that detracted from performance, we held the bulk of our position in ZAIS Group Holdings, an investment manager focused on specialized credit strategies—an asset management segment with what we think is ample long-term potential. Its shares fell with a quarterly loss reported in March and were mostly down through the end of June. A falling stock price in the first half and our confidence in its long-term prospects led us to add shares of Fenix Parts, which recycles and resells original equipment manufacturer automotive parts and products. Consecutive quarterly losses drove investors away before its shares rallied a bit only to fall again when accounting and regulatory issues surfaced. However, we like its core business and were hopeful that the company could resolve these issues in 2017. |
| |
| Relative to the Russell 2000, the Fund derived the bulk of its advantage from savvy stock selection in Health Care, the only sector in the Russell 2000 with a negative return in 2016. Stock picking offered a more modest advantage in Information Technology. Conversely, our underweight in banks and ineffective stock picks caused Financials to lag, as did poor stock selection in Consumer Discretionary. |
| | Top Contributors to Performance
For 2016 (%)1 | | | |
| | | |
| IES Holdings | | 0.88 |
| |
| Major Drilling Group International | | 0.68 |
| |
| Newport Corporation | | 0.57 |
| |
| Era Group | | 0.47 |
| |
| Surmodics | | 0.47 |
| |
| 1 Includes dividends | | |
| | Top Detractors from Performance
For 2016 (%)2 | | | |
| | | |
| ZAIS Group Holdings Cl. A | | -0.71 |
| |
| Fenix Parts | | -0.52 |
| |
| SeaChange International | | -0.43 |
| |
| Sangamo BioSciences | | -0.39 |
| |
| Zealand Pharma | | -0.37 |
| |
| 2 Net of dividends | | |
| CURRENT POSITIONING AND OUTLOOK |
| We are grateful to have been able to deliver such strong absolute and relative results for our investors and firmly believe that we have turned the page on the anomalous 2011-2015 period, in which extraordinary monetary accommodations caused financial markets to behave in odd and unprecedented ways. In our view, we are on the road back to a more historically normal market environment. We think this bodes well for micro-cap and small-cap stocks. In our view cyclicals look well-positioned for ongoing leadership. In addition to our usual cyclical tilt, we are looking in some defensive areas such as healthcare. It is very much on a stock-by-stock basis, with a focus on individual companies that combine attractive valuations with strong fundamentals. |
| 8 | 2016 Annual Report to Stockholders | |
| PERFORMANCE AND PORTFOLIO REVIEW | SYMBOLS MARKET PRICE RMT NAV XOTCX |
|
| Performance | | | | | | | | | | | | | | | | |
| Average Annual Total Return (%) Through 12/31/16 | | | | | | | | | | | | |
| | | JUL-DEC 20161 | | 1-YR | | 3-YR | | 5-YR | | 10-YR | | 15-YR | | 20-YR | | SINCE INCEPTION (12/14/93) |
|
| RMT (NAV) | | 15.74 | | 21.98 | | 3.70 | | 13.59 | | 6.07 | | 9.22 | | 10.26 | | 10.81 |
| |
| 1 Not Annualized | | | | | | | | | | | | | | | | |
|
| Market Price Performance History Since Inception (12/14/93) |
| Cumulative Performance of Investment1 | | | | | | | | |

| 1 | Reflects the cumulative performance experience of a continuous common stockholder who purchased one share at inception ($7.50 IPO), reinvested all distributions and fully participated in the primary subscription of the Fund’s 1994 rights offering. |
| 2 | Reflects the actual month-end market price movement of one share as it has traded on NYSE and, prior to 12/1/03, on the Nasdaq. |
| | |
| |

The Morningstar Style Map is the Morningstar Style Box™ with the center 75% of fund holdings plotted as the Morningstar Ownership Zone™. The Morningstar Style Box is designed to reveal a fund’s investment strategy. The Morningstar Ownership Zone provides detail about a portfolio’s investment style by showing the range of stock sizes and styles. The Ownership Zone is derived by plotting each stock in the portfolio within the proprietary Morningstar Style Box. Over time, the shape and location of a fund’s ownership zone may vary. See page 61 for additional information. |
|
| Top 10 Positions | | |
| % of Net Assets | | |
| | | |
| Era Group | | 1.4 |
| |
| IES Holdings | | 1.2 |
| |
| Seneca Foods | | 1.1 |
| |
| Heritage-Crystal Clean | | 1.0 |
| |
| Major Drilling Group International | | 1.0 |
| |
| Atrion Corporation | | 1.0 |
| |
| Sun Hydraulics | | 1.0 |
| |
| Orbotech | | 0.9 |
| |
| Kadant | | 0.9 |
| |
| Quaker Chemical | | 0.9 |
| |
|
| Portfolio Sector Breakdown | | |
| % of Net Assets | | |
| | | |
| Information Technology | | 19.0 |
| |
| Industrials | | 18.4 |
| |
| Consumer Discretionary | | 14.2 |
| |
| Health Care | | 13.4 |
| |
| Financials | | 11.9 |
| |
| Materials | | 6.2 |
| |
| Energy | | 5.7 |
| |
| Real Estate | | 3.7 |
| |
| Consumer Staples | | 2.7 |
| |
| Telecommunication Services | | 0.1 |
| |
| Utilities | | 0.1 |
| |
| Miscellaneous | | 4.7 |
| |
| Preferred Stock | | 0.3 |
| |
| Outstanding Line of Credit, Net of Cash and Cash Equivalents | | -0.4 |
| |
|
| Calendar Year Total Returns (%) | |
| | | |
| YEAR | | RMT |
| |
| 2016 | | 22.0 |
| |
| 2015 | | -11.7 |
| |
| 2014 | | 3.5 |
| |
| 2013 | | 44.5 |
| |
| 2012 | | 17.3 |
| |
| 2011 | | -7.7 |
| |
| 2010 | | 28.5 |
| |
| 2009 | | 46.5 |
| |
| 2008 | | -45.5 |
| |
| 2007 | | 0.6 |
| |
| 2006 | | 22.5 |
| |
| 2005 | | 6.8 |
| |
| 2004 | | 18.7 |
| |
| 2003 | | 55.5 |
| |
| 2002 | | -13.8 |
| |
|
| Portfolio Diagnostics | | |
| | | |
| Fund Net Assets | | $364 million |
| |
| Number of Holdings | | 338 |
| |
| Turnover Rate | | 26% |
| |
| Net Asset Value | | $9.63 |
| |
| Market Price | | $8.16 |
| |
| Net Leverage1 | | 0.4% |
| |
| Average Market Capitalization2 | | $384 million |
| |
| Weighted Average P/B Ratio3 | | 1.7x |
| |
| Active Share4 | | 95% |
| |
| U.S. Investments (% of Net Assets) | | 81.2% |
| |
| Non-U.S. Investments (% of Net Assets) | | 19.2% |
| |
| |
| 1 | Net leverage is the percentage, in excess of 100%, of the total value of equity type investments, divided by net assets. |
| 2 | Geometric Average. This weighted calculation uses each portfolio holding’s market cap in a way designed to not skew the effect of very large or small holdings; instead, it aims to better identify the portfolio’s center, which Royce believes offers a more accurate measure of average market cap than a simple mean or median. |
| 3 | Harmonic Average. This weighted calculation evaluates a portfolio as if it were a single stock and measures it overall. It compares the total market value of the portfolio to the portfolio’s share in the earnings or book value, as the case may be, of its underlying stocks. |
| 4 | Active Share is the sum of the absolute values of the different weightings of each holding in the Fund versus each holding in the benchmark, divided by two. |
Important Performance and Risk Information
All performance information reflects past performance, is presented on a total return basis, net of the Fund’s investment advisory fee, and reflects the reinvestment of distributions. Past performance is no guarantee of future results. Current performance may be higher or lower than performance quoted. Returns as of the most recent month-end may be obtained at www.roycefunds.com. Certain immaterial adjustments were made to the net assets of Royce Micro-Cap Trust at 12/31/12 and 12/31/14 for financial reporting purposes, and as a result the net asset value originally calculated on that date and the total return based on that net asset value differs from the adjusted net asset value and total return reported in the Financial Highlights. The market price of the Fund’s shares will fluctuate, so that shares may be worth more or less than their original cost when sold. The Fund normally invests in micro-cap companies, which may involve considerably more risk than investments in securities of larger-cap companies. The Fund’s broadly diversified portfolio does not ensure a profit or guarantee against loss. From time to time, the Fund may invest a significant portion of its net assets in foreign securities, which may involve political, economic, currency and other risks not encountered in U.S. investments. Regarding the “Top Contributors” and “Top Detractors” tables shown on page 8, the sum of all contributors to, and all detractors from, performance for all securities in the portfolio would approximate the Fund’s year-to-date performance for 2016. |
| | | 2016 Annual Report to Stockholders | 9 |
| | | MANAGER’S DISCUSSION |
| Royce Value Trust (RVT) | | |
 |
| Chuck Royce |
FUND PERFORMANCE
Royce Value Trust Fund advanced 26.8% on a net asset value (“NAV”) basis and 23.5% on a market price basis in 2016, compared to respective increases of 21.3% and 26.5% for its unleveraged small-cap benchmarks, the Russell 2000 and S&P SmallCap 600 Indexes, for the same period. In such a strong year for small-cap stocks, we were pleased with the Fund’s terrific absolute and relative NAV showing. RVT’s multi-themed core approach served investors well during a year in which factors such as low valuation, liquidity, low volatility, and quality all outperformed within the Russell 2000. Calendar-year performance was even more gratifying in light of the questions both active management and value-oriented approaches were facing between 2011 and 2015, which made the year feel very much like a validation for our approach.
The Fund outperformed during the first half of 2016, gaining 8.2% on an NAV basis and 4.4% based on market price versus respective gains of 2.2% and 6.2% for the Russell 2000 and S&P SmallCap 600. The second half was stronger on an absolute basis but less so on a relative scale. During this period, RVT rose 17.3% based on NAV and 18.3% based on its market price compared to 18.7% for the Russell 2000 and 19.1% for the S&P SmallCap 600. Looking at longer-term periods, we were pleased that RVT outpaced the Russell 2000 for the one-, 20-, 25-, 30-year, and since inception (11/26/86) periods ended December 31, 2016. The Fund’s average annual NAV total return since inception was 10.6%, all under the management of Chuck Royce. |
| |
| WHAT WORKED... AND WHAT DIDN’T |
All of the portfolio’s 11 equity sectors finished 2016 with net gains. Industrials led by a considerable margin, followed by a strong contribution from Information Technology that was considerably higher than the meaningfully positive impact of Materials, the Fund’s third-highest contributor. Notable net gains also came from the Consumer Discretionary and Financials sectors. This widespread cyclical strength was consistent with trends in the overall small-cap market. Within Industrials, the best-performing industries were machinery (our largest industry weighting in the sector), commercial services & supplies, and construction & engineering. The portfolio’s top-performing industry, however, came from the Information Technology sector—electronic equipment, instruments & components. Coherent, which manufactures laser diodes and equipment, owned the top spot by position. Its shares skyrocketed in 2016, lifted by a combination of strong profits, a record backlog, and a robust order pipeline. Cognex Corporation is the market leader in machine vision technology that captures and analyzes visual information to automate tasks that previously relied on human eyesight. This technology is a major driver of industrial and process automation. Sales to the auto industry accelerated, its consumer electronics segment proved better than expected, and it gained share among logistics services providers. All of these factors produced an impressive performance for the stock.
Even in a good year there are a few disappointments. ZAIS Group Holdings is an investment manager focused primarily on structured credits. Recent credit market turmoil has caused investment performance to fall below various “high-water” marks, meaningfully dampening profitability and future growth opportunities. We chose to hold our shares in 2016 in light of its highly discounted valuation. We also chose to hold our position in The Advisory Board. Its shares fell most precipitously during the fall as this specialist in performance improvement software and solutions to the health care and higher education industries reported disappointing fiscal third-quarter revenues. We like its niche business and think its long-term prospects remain promising. We also held on to most of our shares of Zealand Pharma, a Danish firm whose share price decline was mostly driven by the sell-off in its industry. We remain optimistic about its long-term growth potential. |
| |
| Relative results in 2016 were driven by our underweight in the lagging Health Care sector, as well as positive stock selection in the sector. Also aiding relative performance was savvy stock selection in Information Technology. The two largest relative detractors had a similar theme—our underweight in banks caused the Fund to lag in Financials and our underweighting in REITs led to underperformance in the Real Estate sector. The Fund is typically underweight in these interest rate sensitive areas. |
| | Top Contributors to Performance
For 2016 (%)1 | | | |
| | | |
| Coherent | | 0.95 |
| |
| Cognex Corporation | | 0.60 |
| |
| Thor Industries | | 0.53 |
| |
| Quaker Chemical | | 0.53 |
| |
| Newport Corporation | | 0.50 |
| |
| 1 Includes dividends | | |
| | Top Detractors from Performance
For 2016 (%)2 | | | |
| | | |
| ZAIS Group Holdings Cl. A | | -0.42 |
| |
| Advisory Board (The) | | -0.32 |
| |
| Zealand Pharma | | -0.29 |
| |
| Value Partners Group | | -0.22 |
| |
| Citadel Capital | | -0.18 |
| |
| 2 Net of dividends | | |
| CURRENT POSITIONING AND OUTLOOK |
| We are grateful to have been able to deliver such strong absolute and relative NAV results for our investors and firmly believe that we have turned the page on the anomalous 2011-2015 period, in which extraordinary monetary accommodations caused financial markets to behave in odd and unprecedented ways. In our view, we are on the road back to a more historically normal market environment. We think this bodes well for small-cap stocks. In our view cyclicals look well-positioned for ongoing leadership. In addition to our usual cyclical tilt, we are looking in some defensive areas such as healthcare. It is very much on a stock-by-stock basis, with a focus on individual companies that combine attractive valuations with strong fundamentals. |
| 10 | 2016 Annual Report to Stockholders | |
| PERFORMANCE AND PORTFOLIO REVIEW | SYMBOLS MARKET PRICE RVT NAV XRVTX |
|
| Performance | | | | | | | | | | | | | | | | | |
| Average Annual Total Return (%) Through 12/31/16 | | | | | | | | | |
| | | JUL-DEC 20161 | | 1-YR | | 3-YR | | 5-YR | | 10-YR | | 15-YR | | 20-YR | | 25-YR | | 30-YR | | SINCE INCEPTION (11/26/86) |
|
| RVT (NAV) | | 17.21 | | 26.79 | | 5.50 | | 12.70 | | 5.81 | | 8.26 | | 9.81 | | 10.73 | | 10.58 | | 10.55 |
| |
| 1 Not Annualized | | | | | | | | | | | | | | | |
|
| Market Price Performance History Since Inception (11/26/86) |
| Cumulative Performance of Investment through 12/31/161 | | | | | | | | |

| 1 | Reflects the cumulative performance of an investment made by a stockholder who purchased one share at inception ($10.00 IPO), reinvested all distributions and fully participated in primary subscriptions of the Fund’s rights offerings. |
| 2 | Reflects the actual month-end market price movement of one share as it has traded on the NYSE. |
| | |
| |
The Morningstar Style Map is the Morningstar Style Box™ with the center 75% of fund holdings plotted as the Morningstar Ownership Zone™. The Morningstar Style Box is designed to reveal a fund’s investment strategy. The Morningstar Ownership Zone provides detail about a portfolio’s investment style by showing the range of stock sizes and styles. The Ownership Zone is derived by plotting each stock in the portfolio within the proprietary Morningstar Style Box. Over time, the shape and location of a fund’s ownership zone may vary. See page 61 for additional information. |
|
| Top 10 Positions | | |
| % of Net Assets | | |
| | | |
| HEICO Corporation | | 1.3 |
| |
| Coherent | | 1.2 |
| |
| Quaker Chemical | | 1.1 |
| |
| Cognex Corporation | | 1.0 |
| |
| Ash Grove Cement Cl. B | | 1.0 |
| |
| Copart | | 0.9 |
| |
| E-L Financial | | 0.9 |
| |
| RBC Bearings | | 0.9 |
| |
| FLIR Systems | | 0.9 |
| |
| Sun Hydraulics | | 0.9 |
| |
|
| Portfolio Sector Breakdown | | |
| % of Net Assets | | |
| | | |
| Industrials | | 29.2 |
| |
| Information Technology | | 16.8 |
| |
| Financials | | 14.9 |
| |
| Consumer Discretionary | | 10.3 |
| |
| Materials | | 7.3 |
| |
| Energy | | 5.2 |
| |
| Health Care | | 4.2 |
| |
| Real Estate | | 2.8 |
| |
| Consumer Staples | | 2.2 |
| |
| Telecommunication Services | | 0.5 |
| |
| Utilities | | 0.1 |
| |
| Miscellaneous | | 4.3 |
| |
| Cash and Cash Equivalents, Net of Outstanding Line of Credit | | 2.2 |
| |
|
| Calendar Year Total Returns (%) | |
| | | |
| YEAR | | RVT |
| |
| 2016 | | 26.8 |
| |
| 2015 | | -8.1 |
| |
| 2014 | | 0.8 |
| |
| 2013 | | 34.1 |
| |
| 2012 | | 15.4 |
| |
| 2011 | | -10.1 |
| |
| 2010 | | 30.3 |
| |
| 2009 | | 44.6 |
| |
| 2008 | | -45.6 |
| |
| 2007 | | 5.0 |
| |
| 2006 | | 19.5 |
| |
| 2005 | | 8.4 |
| |
| 2004 | | 21.4 |
| |
| 2003 | | 40.8 |
| |
| 2002 | | -15.6 |
| |
|
| Portfolio Diagnostics | | |
| | | |
| Fund Net Assets | | $1,296 million |
| |
| Number of Holdings | | 424 |
| |
| Turnover Rate | | 28% |
| |
| Net Asset Value | | $15.84 |
| |
| Market Price | | $13.39 |
| |
| Average Market Capitalization1 | | $1,477 million |
| |
| Weighted Average P/E Ratio2,3 | | 20.3x |
| |
| Weighted Average P/B Ratio2 | | 2.1x |
| |
| Active Share4 | | 89% |
| |
| U.S. Investments (% of Net Assets) | | 82.6% |
| |
| Non-U.S. Investments (% of Net Assets) | | 15.2% |
| |
| |
| 1 | Geometric Average. This weighted calculation uses each portfolio holding’s market cap in a way designed to not skew the effect of very large or small holdings; instead, it aims to better identify the portfolio’s center, which Royce believes offers a more accurate measure of average market cap than a simple mean or median. |
| 2 | Harmonic Average. This weighted calculation evaluates a portfolio as if it were a single stock and measures it overall. It compares the total market value of the portfolio to the portfolio’s share in the earnings or book value, as the case may be, of its underlying stocks. |
| 3 | The Fund’s P/E ratio calculation excludes companies with zero or negative earnings (17% of portfolio holdings as of 12/31/16). |
| 4 | Active Share is the sum of the absolute values of the different weightings of each holding in the Fund versus each holding in the benchmark, divided by two. |
Important Performance and Risk Information
All performance information reflects past performance, is presented on a total return basis, net of the Fund’s investment advisory fee, and reflects the reinvestment of distributions. Past performance is no guarantee of future results. Current performance may be higher or lower than performance quoted. Returns as of the most recent month-end may be obtained at www.roycefunds.com. Certain immaterial adjustments were made to the net assets of Royce Value Trust at 12/31/16 for financial reporting purposes, and as a result the net asset value originally calculated on that date and the total return based on that net asset value differs from the adjusted net asset value and total return reported in the Financial Highlights. The market price of the Fund’s shares will fluctuate, so that shares may be worth more or less than their original cost when sold. The Fund invests primarily in securities of small- and micro-cap companies, which may involve considerably more risk than investing in larger-cap companies. The Fund’s broadly diversified portfolio does not ensure a profit or guarantee against loss. Regarding the “Top Contributors” and “Top Detractors” tables shown on page 10, the sum of all contributors to, and all detractors from, performance for all securities in the portfolio would approximate the Fund’s year-to date performance for 2015. |
| | | 2016 Annual Report to Stockholders | 11 |
History Since Inception
The following table details the share accumulations by an initial investor in the Funds who reinvested all distributions and participated fully in primary subscriptions for each of the rights offerings. Full participation in distribution reinvestments and rights offerings can maximize the returns available to a long-term investor. This table should be read in conjunction with the Performance and Portfolio Reviews of the Funds.
| HISTORY | | | | | AMOUNT INVESTED | | | PURCHASE PRICE1 | | | | SHARES | | | | NAV VALUE2 | | | | MARKET VALUE2 |
| |
| Royce Global Value Trust | | | | | | | | | | | | | | | | | | |
| 10/17/13 | | Initial Purchase | | $ | 8,975 | | $ | 8.975 | | | | 1,000 | | | $ | 9,780 | | | $ | 8,975 |
| |
| 12/11/14 | | Distribution $0.15 | | | | | | 7.970 | | | | 19 | | | | 9,426 | | | | 8,193 |
| |
| 12/10/15 | | Distribution $0.10 | | | | | | 7.230 | | | | 14 | | | | 9,101 | | | | 7,696 |
| |
| 12/9/16 | | Distribution $0.14 | | | | | | 7.940 | | | | 18 | | | | | | | | |
| |
| 12/31/16 | | | | $ | 8,975 | | | | | | | 1,051 | | | $ | 10,111 | | | $ | 8,446 |
| |
| | | | | | | | | | | | | | | | | | | | | |
| Royce Micro-Cap Trust | | | | | | | | | | | | | | | | | | |
| 12/14/93 | | Initial Purchase | | $ | 7,500 | | $ | 7.500 | | | | 1,000 | | | $ | 7,250 | | | $ | 7,500 |
| |
| 10/28/94 | | Rights Offering | | | 1,400 | | | 7.000 | | | | 200 | | | | | | | | |
| |
| 12/19/94 | | Distribution $0.05 | | | | | | 6.750 | | | | 9 | | | | 9,163 | | | | 8,462 |
| |
| 12/7/95 | | Distribution $0.36 | | | | | | 7.500 | | | | 58 | | | | 11,264 | | | | 10,136 |
| |
| 12/6/96 | | Distribution $0.80 | | | | | | 7.625 | | | | 133 | | | | 13,132 | | | | 11,550 |
| |
| 12/5/97 | | Distribution $1.00 | | | | | | 10.000 | | | | 140 | | | | 16,694 | | | | 15,593 |
| |
| 12/7/98 | | Distribution $0.29 | | | | | | 8.625 | | | | 52 | | | | 16,016 | | | | 14,129 |
| |
| 12/6/99 | | Distribution $0.27 | | | | | | 8.781 | | | | 49 | | | | 18,051 | | | | 14,769 |
| |
| 12/6/00 | | Distribution $1.72 | | | | | | 8.469 | | | | 333 | | | | 20,016 | | | | 17,026 |
| |
| 12/6/01 | | Distribution $0.57 | | | | | | 9.880 | | | | 114 | | | | 24,701 | | | | 21,924 |
| |
| 2002 | | Annual distribution total $0.80 | | | | | | 9.518 | | | | 180 | | | | 21,297 | | | | 19,142 |
| |
| 2003 | | Annual distribution total $0.92 | | | | | | 10.004 | | | | 217 | | | | 33,125 | | | | 31,311 |
| |
| 2004 | | Annual distribution total $1.33 | | | | | | 13.350 | | | | 257 | | | | 39,320 | | | | 41,788 |
| |
| 2005 | | Annual distribution total $1.85 | | | | | | 13.848 | | | | 383 | | | | 41,969 | | | | 45,500 |
| |
| 2006 | | Annual distribution total $1.55 | | | | | | 14.246 | | | | 354 | | | | 51,385 | | | | 57,647 |
| |
| 2007 | | Annual distribution total $1.35 | | | | | | 13.584 | | | | 357 | | | | 51,709 | | | | 45,802 |
| |
| 2008 | | Annual distribution total $1.193 | | | | | | 8.237 | | | | 578 | | | | 28,205 | | | | 24,807 |
| |
| 3/11/09 | | Distribution $0.223 | | | | | | 4.260 | | | | 228 | | | | 41,314 | | | | 34,212 |
| |
| 12/2/10 | | Distribution $0.08 | | | | | | 9.400 | | | | 40 | | | | 53,094 | | | | 45,884 |
| |
| 2011 | | Annual distribution total $0.533 | | | | | | 8.773 | | | | 289 | | | | 49,014 | | | | 43,596 |
| |
| 2012 | | Annual distribution total $0.51 | | | | | | 9.084 | | | | 285 | | | | 57,501 | | | | 49,669 |
| |
| 2013 | | Annual distribution total $1.38 | | | | | | 11.864 | | | | 630 | | | | 83,110 | | | | 74,222 |
| |
| 2014 | | Annual distribution total $2.90 | | | | | | 10.513 | | | | 1,704 | | | | 86,071 | | | | 76,507 |
| |
| 2015 | | Annual distribution total $1.26 | | | | | | 7.974 | | | | 1,256 | | | | 75,987 | | | | 64,222 |
| |
| 2016 | | Annual distribution total $0.64 | | | | | | 7.513 | | | | 779 | | | | | | | | |
| |
| 12/31/16 | | | | $ | 8,900 | | | | | | | 9,625 | | | $ | 92,689 | | | $ | 78,540 |
| |
| 1 The purchase price used for annual distribution totals is a weighted average of the distribution reinvestment prices for the year. |
| 2 Values are stated as of December 31 of the year indicated, after reinvestment of distributions, other than for initial purchase. |
| 3 Includes a return of capital. |
12 | 2016 Annual Report to Stockholders
| HISTORY | | | | | | AMOUNT INVESTED | | | | PURCHASE PRICE1 | | | | SHARES | | | | NAV VALUE2 | | | | MARKET VALUE2 |
| |
| Royce Value Trust | | | | | | | | | | | | | | | | | | | |
| 11/26/86 | | | Initial Purchase | | $ | 10,000 | | | $ | 10.000 | | | | 1,000 | | | $ | 9,280 | | | $ | 10,000 |
| |
| 10/15/87 | | | Distribution $0.30 | | | | | | | 7.000 | | | | 42 | | | | | | | | |
| |
| 12/31/87 | | | Distribution $0.22 | | | | | | | 7.125 | | | | 32 | | | | 8,578 | | | | 7,250 |
| |
| 12/27/88 | | | Distribution $0.51 | | | | | | | 8.625 | | | | 63 | | | | 10,529 | | | | 9,238 |
| |
| 9/22/89 | | | Rights Offering | | | 405 | | | | 9.000 | | | | 45 | | | | | | | | |
| |
| 12/29/89 | | | Distribution $0.52 | | | | | | | 9.125 | | | | 67 | | | | 12,942 | | | | 11,866 |
| |
| 9/24/90 | | | Rights Offering | | | 457 | | | | 7.375 | | | | 62 | | | | | | | | |
| |
| 12/31/90 | | | Distribution $0.32 | | | | | | | 8.000 | | | | 52 | | | | 11,713 | | | | 11,074 |
| |
| 9/23/91 | | | Rights Offering | | | 638 | | | | 9.375 | | | | 68 | | | | | | | | |
| |
| 12/31/91 | | | Distribution $0.61 | | | | | | | 10.625 | | | | 82 | | | | 17,919 | | | | 15,697 |
| |
| 9/25/92 | | | Rights Offering | | | 825 | | | | 11.000 | | | | 75 | | | | | | | | |
| |
| 12/31/92 | | | Distribution $0.90 | | | | | | | 12.500 | | | | 114 | | | | 21,999 | | | | 20,874 |
| |
| 9/27/93 | | | Rights Offering | | | 1,469 | | | | 13.000 | | | | 113 | | | | | | | | |
| |
| 12/31/93 | | | Distribution $1.15 | | | | | | | 13.000 | | | | 160 | | | | 26,603 | | | | 25,428 |
| |
| 10/28/94 | | | Rights Offering | | | 1,103 | | | | 11.250 | | | | 98 | | | | | | | | |
| |
| 12/19/94 | | | Distribution $1.05 | | | | | | | 11.375 | | | | 191 | | | | 27,939 | | | | 24,905 |
| |
| 11/3/95 | | | Rights Offering | | | 1,425 | | | | 12.500 | | | | 114 | | | | | | | | |
| |
| 12/7/95 | | | Distribution $1.29 | | | | | | | 12.125 | | | | 253 | | | | 35,676 | | | | 31,243 |
| |
| 12/6/96 | | | Distribution $1.15 | | | | | | | 12.250 | | | | 247 | | | | 41,213 | | | | 36,335 |
| |
| 1997 | | | Annual distribution total $1.21 | | | | | | | 15.374 | | | | 230 | | | | 52,556 | | | | 46,814 |
| |
| 1998 | | | Annual distribution total $1.54 | | | | | | | 14.311 | | | | 347 | | | �� | 54,313 | | | | 47,506 |
| |
| 1999 | | | Annual distribution total $1.37 | | | | | | | 12.616 | | | | 391 | | | | 60,653 | | | | 50,239 |
| |
| 2000 | | | Annual distribution total $1.48 | | | | | | | 13.972 | | | | 424 | | | | 70,711 | | | | 61,648 |
| |
| 2001 | | | Annual distribution total $1.49 | | | | | | | 15.072 | | | | 437 | | | | 81,478 | | | | 73,994 |
| |
| 2002 | | | Annual distribution total $1.51 | | | | | | | 14.903 | | | | 494 | | | | 68,770 | | | | 68,927 |
| |
| 1/28/03 | | | Rights Offering | | | 5,600 | | | | 10.770 | | | | 520 | | | | | | | | |
| |
| 2003 | | | Annual distribution total $1.30 | | | | | | | 14.582 | | | | 516 | | | | 106,216 | | | | 107,339 |
| |
| 2004 | | | Annual distribution total $1.55 | | | | | | | 17.604 | | | | 568 | | | | 128,955 | | | | 139,094 |
| |
| 2005 | | | Annual distribution total $1.61 | | | | | | | 18.739 | | | | 604 | | | | 139,808 | | | | 148,773 |
| |
| 2006 | | | Annual distribution total $1.78 | | | | | | | 19.696 | | | | 693 | | | | 167,063 | | | | 179,945 |
| |
| 2007 | | | Annual distribution total $1.85 | | | | | | | 19.687 | | | | 787 | | | | 175,469 | | | | 165,158 |
| |
| 2008 | | | Annual distribution total $1.723 | | | | | | | 12.307 | | | | 1,294 | | | | 95,415 | | | | 85,435 |
| |
| 3/11/09 | | | Distribution $0.323 | | | | | | | 6.071 | | | | 537 | | | | 137,966 | | | | 115,669 |
| |
| 12/2/10 | | | Distribution $0.03 | | | | | | | 13.850 | | | | 23 | | | | 179,730 | | | | 156,203 |
| |
| 2011 | | | Annual distribution total $0.783 | | | | | | | 13.043 | | | | 656 | | | | 161,638 | | | | 139,866 |
| |
| 2012 | | | Annual distribution total $0.80 | | | | | | | 13.063 | | | | 714 | | | | 186,540 | | | | 162,556 |
| |
| 2013 | | | Annual distribution total $2.194 | | | | | | | 16.647 | | | | 1,658 | | | | 250,219 | | | | 220,474 |
| |
| 2014 | | | Annual distribution total $1.82 | | | | | | | 14.840 | | | | 1,757 | | | | 252,175 | | | | 222,516 |
| |
| 2015 | | | Annual distribution total $1.24 | | | | | | | 12.725 | | | | 1,565 | | | | 231,781 | | | | 201,185 |
| |
| 2016 | | | Annual distribution total $1.02 | | | | | | | 12.334 | | | | 1,460 | | | | | | | | |
| |
| 12/31/16 | | | | | $ | 21,922 | | | | | | | | 18,533 | | | $ | 293,880 | | | $ | 248,425 |
| |
| 1 The purchase price used for annual distribution totals is a weighted average of the distribution reinvestment prices for the year. |
| 2 Values are stated as of December 31 of the year indicated, after reinvestment of distributions, other than for initial purchase. |
| 3 Includes a return of capital. |
| 4 Includes Royce Global Value Trust spin-off of $1.40 per share. |
2016 Annual Report to Stockholders | 13
| Distribution Reinvestment and Cash Purchase Options |
| Why should I reinvest my distributions? |
| By reinvesting distributions, a stockholder can maintain an undiluted investment in the Fund. The regular reinvestment of distributions has a significant impact on stockholder returns. In contrast, the stockholder who takes distributions in cash is penalized when shares are issued below net asset value to other stockholders. |
| |
| How does the reinvestment of distributions from the Royce closed-end funds work? |
| The Funds automatically issue shares in payment of distributions unless you indicate otherwise. The shares are generally issued at the lower of the market price or net asset value on the valuation date. |
| |
| How does this apply to registered stockholders? |
| If your shares are registered directly with a Fund, your distributions are automatically reinvested unless you have otherwise instructed the Funds’ transfer agent, Computershare, in writing, in which case you will receive your distribution in cash. A registered stockholder also may have the option to receive the distribution in the form of a stock certificate. |
| |
| What if my shares are held by a brokerage firm or a bank? |
| If your shares are held by a brokerage firm, bank, or other intermediary as the stockholder of record, you should contact your brokerage firm or bank to be certain that it is automatically reinvesting distributions on your behalf. If they are unable to reinvest distributions on your behalf, you should have your shares registered in your name in order to participate. |
| |
| What other features are available for registered stockholders? |
| The Distribution Reinvestment and Cash Purchase Plans also allow registered stockholders to make optional cash purchases of shares of a Fund’s common stock directly through Computershare on a monthly basis, and to deposit certificates representing your RVT and RMT shares with Computershare for safekeeping. (RGT does not issue shares in certificated form). Plan participants are subject to a $0.75 service fee for each voluntary cash purchase under the Plans. The Funds’ investment adviser absorbed all commissions on optional cash purchases under the Plans through December 31, 2016. |
| |
| How do the Plans work for registered stockholders? |
| Computershare maintains the accounts for registered stockholders in the Plans and sends written confirmation of all transactions in the account. Shares in the account of each participant will be held by Computershare in non-certificated form in the name of the participant, and each participant will be able to vote those shares at a stockholder meeting or by proxy. A participant may also send stock certificates for RVT and RMT held by them to Computershare to be held in non-certificated form. RGT does not issue shares in certificated form. There is no service fee charged to participants for reinvesting distributions. If a participant elects to sell shares from a Plan account, Computershare will deduct a $2.50 service fee from the sale transaction. The Funds’ investment adviser absorbed all commissions on optional sales under the Plans through December 31, 2016. If a nominee is the registered owner of your shares, the nominee will maintain the accounts on your behalf. |
| |
| How can I get more information on the Plans? |
You can call an Investor Services Representative at (800) 221-4268 or you can request a copy of the Plan for your Fund from Computershare. All correspondence (including notifications) should be directed to: [Name of Fund] Distribution Reinvestment and Cash Purchase Plan, c/o Computershare, PO Box 43078, Providence, RI 02940-3078, telephone (800) 426-5523 (from 9:00 A.M. to 5:00 P.M.). |
| 14 | 2016 Annual Report to Stockholders |
| Royce Global Value Trust | | December 31, 2016 |
| |
| Schedule of Investments |
| Common Stocks – 101.7% |
| | | | | | | |
| | | SHARES | | | | VALUE |
| |
| |
| AUSTRALIA – 2.2% | | | | | | |
ALS | | 88,176 | | | $ | 383,315 |
Austal | | 95,500 | | | | 119,804 |
†Cochlear | | 5,000 | | | | 441,394 |
Imdex 1 | | 130,600 | | | | 54,101 |
†IPH | | 140,000 | | | | 516,390 |
†NetComm Wireless 1 | | 26,700 | | | | 41,279 |
†Seeing Machines 1 | | 1,676,800 | | | | 87,782 |
†Spotless Group Holdings | | 500,000 | | | | 356,515 |
TFS Corporation | | 137,045 | | | | 164,100 |
| |
| Total (Cost $2,157,377) | | | | | | 2,164,680 |
| |
| |
| AUSTRIA – 0.9% | | | | | | |
Mayr-Melnhof Karton | | 8,000 | | | | 847,939 |
UBM Development | | 1,800 | | | | 58,731 |
| |
| Total (Cost $994,664) | | | | | | 906,670 |
| |
| |
| BELGIUM – 0.1% | | | | | | |
†Barco | | 1,100 | | | | 92,599 |
| |
| Total (Cost $91,797) | | | | | | 92,599 |
| |
| |
| BERMUDA – 1.3% | | | | | | |
Lazard Cl. A | | 32,600 | | | | 1,339,534 |
| |
| Total (Cost $1,010,334) | | | | | | 1,339,534 |
| |
| |
| BRAZIL – 1.8% | | | | | | |
Brasil Brokers Participacoes 1 | | 205,000 | | | | 100,087 |
CETIP - Mercados Organizados | | 35,000 | | | | 478,665 |
†Minerva 1 | | 52,500 | | | | 195,952 |
†OdontoPrev | | 200,000 | | | | 774,704 |
T4F Entretenimento | | 61,100 | | | | 105,090 |
TOTVS | | 23,000 | | | | 169,042 |
| |
| Total (Cost $1,884,557) | | | | | | 1,823,540 |
| |
| |
| CANADA – 8.4% | | | | | | |
Agnico Eagle Mines 2 | | 5,000 | | | | 210,000 |
†AGT Food and Ingredients | | 5,200 | | | | 141,904 |
Altus Group | | 5,900 | | | | 136,047 |
Cameco Corporation 2 | | 24,500 | | | | 256,515 |
†Canaccord Genuity Group 1 | | 92,000 | | | | 326,846 |
†Canfor Corporation 1 | | 18,900 | | | | 214,950 |
Computer Modelling Group | | 108,000 | | | | 732,790 |
Dream Global Real Estate Investment Trust | | 14,700 | | | | 103,463 |
Dundee Corporation Cl. A 1 | | 80,000 | | | | 354,523 |
E-L Financial | | 1,200 | | | | 652,441 |
Exco Technologies | | 23,500 | | | | 188,679 |
†FirstService Corporation | | 10,300 | | | | 489,044 |
Franco-Nevada Corporation 2,3 | | 10,200 | | | | 609,552 |
Genworth MI Canada | | 13,000 | | | | 325,908 |
Gluskin Sheff + Associates | | 23,000 | | | | 298,752 |
Magellan Aerospace | | 19,400 | | | | 259,794 |
Major Drilling Group International 1 | | 110,500 | | | | 577,746 |
Morneau Shepell | | 35,000 | | | | 500,242 |
Pan American Silver 2 | | 31,800 | | | | 479,226 |
†Questor Technology 1 | | 90,600 | | | | 47,910 |
RDM Corporation | | 30,400 | | | | 108,681 |
†Sandstorm Gold 1 | | 29,400 | | | | 114,660 |
Solium Capital 1 | | 24,800 | | | | 155,895 |
Sprott | | 280,600 | | | | 524,564 |
Western Forest Products | | 123,100 | | | | 173,283 |
†Winpak | | 13,500 | | | | 456,686 |
| |
| Total (Cost $10,238,840) | | | | | | 8,440,101 |
| |
| |
| CHINA – 0.9% | | | | | | |
†China Communications Services | | 134,500 | | | | 85,598 |
†Haichang Ocean Park Holdings 1 | | 321,000 | | | | 75,586 |
TravelSky Technology | | 310,000 | | | | 649,062 |
Xtep International Holdings | | 191,600 | | | | 80,093 |
| |
| Total (Cost $655,485) | | | | | | 890,339 |
| |
| |
| CYPRUS – 0.3% | | | | | | |
Globaltrans Investment GDR | | 42,000 | | | | 265,818 |
| |
| Total (Cost $212,014) | | | | | | 265,818 |
| |
| |
| DENMARK – 2.0% | | | | | | |
Chr. Hansen Holding | | 9,000 | | | | 497,840 |
Coloplast Cl. B | | 7,000 | | | | 471,046 |
SimCorp | | 14,000 | | | | 681,612 |
Zealand Pharma 1 | | 24,000 | | | | 361,360 |
| |
| Total (Cost $1,846,468) | | | | | | 2,011,858 |
| |
| |
| FINLAND – 0.1% | | | | | | |
BasWare 1 | | 1,600 | | | | 61,114 |
| |
| Total (Cost $80,466) | | | | | | 61,114 |
| |
| |
| FRANCE – 4.3% | | | | | | |
Chargeurs | | 4,400 | | | | 73,894 |
†Groupe Crit | | 700 | | | | 50,095 |
HighCo | | 16,200 | | | | 109,621 |
†Interparfums | | 15,000 | | | | 432,539 |
Manutan International | | 900 | | | | 66,025 |
Neurones | | 22,250 | | | | 524,266 |
Rothschild & Co | | 33,000 | | | | 892,439 |
Thermador Groupe | | 10,500 | | | | 922,863 |
Vetoquinol | | 10,000 | | | | 479,013 |
Virbac 1 | | 4,500 | | | | 790,977 |
| |
| Total (Cost $3,996,446) | | | | | | 4,341,732 |
| |
| |
| GEORGIA – 0.1% | | | | | | |
†BGEO Group | | 2,200 | | | | 81,052 |
| |
| Total (Cost $63,649) | | | | | | 81,052 |
| |
| |
| GERMANY – 4.6% | | | | | | |
ADLER Real Estate 1 | | 9,400 | | | | 143,323 |
Allgeier | | 3,700 | | | | 67,090 |
Bertrandt | | 2,500 | | | | 254,107 |
†CANCOM | | 3,700 | | | | 174,573 |
Carl Zeiss Meditec | | 17,500 | | | | 644,746 |
CompuGroup Medical | | 12,500 | | | | 512,412 |
Fielmann | | 10,000 | | | | 659,347 |
HolidayCheck Group 1 | | 25,100 | | | | 62,009 |
KWS Saat | | 2,500 | | | | 741,903 |
†MorphoSys 1 | | 6,000 | | | | 307,301 |
msg life 1 | | 22,100 | | | | 67,409 |
mutares | | 5,000 | | | | 60,074 |
†PNE Wind | | 56,600 | | | | 129,909 |
STRATEC Biomedical | | 15,000 | | | | 722,193 |
VIB Vermoegen | | 4,900 | | | | 101,329 |
| |
| Total (Cost $4,609,813) | | | | | | 4,647,725 |
| |
| THE ACCOMPANYING NOTES ARE AN INTEGRAL PART OF THESE FINANCIAL STATEMENTS | | 2016 Annual Report to Stockholders | 15 |
| |
| Schedule of Investments (continued) |
| | | | | | | | |
| | | | SHARES | | | | VALUE |
| |
| | | | | | | | |
| GREECE – 0.2% | | | | | | | |
Aegean Marine Petroleum Network | | | 5,000 | | | $ | 50,750 |
Hellenic Exchanges - Athens Stock Exchange | | | 28,000 | | | | 144,119 |
| |
| Total (Cost $184,327) | | | | | | | 194,869 |
| |
| |
| HONG KONG – 2.1% | | | | | | | |
Anxin-China Holdings 1,4 | | | 2,500,000 | | | | 9,349 |
China Metal International Holdings | | | 430,000 | | | | 135,545 |
First Pacific | | | 180,000 | | | | 125,721 |
†HKBN | | | 126,000 | | | | 137,857 |
I.T | | | 365,800 | | | | 145,323 |
Oriental Watch Holdings | | | 465,900 | | | | 89,778 |
Pico Far East Holdings | | | 470,500 | | | | 144,244 |
Television Broadcasts | | | 54,000 | | | | 177,557 |
Value Partners Group | | | 1,325,000 | | | | 1,054,025 |
VST Holdings | | | 232,400 | | | | 81,231 |
| |
| Total (Cost $2,646,499) | | | | | | | 2,100,630 |
| |
| |
| INDIA – 1.6% | | | | | | | |
Bajaj Finance | | | 77,500 | | | | 963,017 |
†IIFL Holdings | | | 18,500 | | | | 70,558 |
Kewal Kiran Clothing | | | 6,500 | | | | 170,393 |
†Quess Corporation 1 | | | 7,200 | | | | 69,481 |
†SH Kelkar & Company | | | 72,000 | | | | 326,883 |
| |
| Total (Cost $1,290,842) | | | | | | | 1,600,332 |
| |
| |
| INDONESIA – 0.6% | | | | | | | |
Selamat Sempurna | | | 8,000,000 | | | | 580,455 |
| |
| Total (Cost $716,411) | | | | | | | 580,455 |
| |
| |
| IRELAND – 0.7% | | | | | | | |
Ardmore Shipping 2 | | | 12,300 | | | | 91,020 |
†Irish Continental Group | | | 43,700 | | | | 206,824 |
†Irish Residential Properties REIT | | | 148,481 | | | | 182,800 |
Keywords Studios | | | 37,500 | | | | 244,408 |
| |
| Total (Cost $629,762) | | | | | | | 725,052 |
| |
| |
| ISRAEL – 0.3% | | | | | | | |
Nova Measuring Instruments 1,2 | | | 12,400 | | | | 162,936 |
†Sapiens International | | | 5,300 | | | | 76,002 |
Sarine Technologies | | | 86,800 | | | | 107,821 |
| |
| Total (Cost $304,789) | | | | | | | 346,759 |
| |
| |
| ITALY – 0.8% | | | | | | | |
Banca Sistema | | | 72,800 | | | | 168,493 |
DiaSorin | | | 11,000 | | | | 651,183 |
| |
| Total (Cost $697,808) | | | | | | | 819,676 |
| |
| |
| JAPAN – 9.7% | | | | | | | |
†Ai Holdings | | | 27,500 | | | | 546,017 |
BML | | | 2,600 | | | | 61,867 |
C. Uyemura & Co. | | | 1,300 | | | | 56,632 |
†EM Systems | | | 4,500 | | | | 61,855 |
†en-japan | | | 3,100 | | | | 55,247 |
GCA | | | 8,900 | | | | 62,487 |
G-Tekt | | | 3,100 | | | | 59,979 |
Horiba | | | 16,000 | | | | 738,921 |
†Inabata & Co. | | | 6,500 | | | | 71,471 |
†Itochu Techno-Solutions | | | 2,300 | | | | 59,738 |
†Kakaku.com | | | 3,200 | | | | 52,907 |
†Kenedix | | | 16,900 | | | | 59,954 |
†Kenko Mayonnaise | | | 2,300 | | | | 64,891 |
†Kintetsu World Express | | | 4,000 | | | | 55,339 |
Leopalace21 | | | 10,600 | | | | 58,496 |
Mandom Corporation | | | 1,600 | | | | 68,892 |
†Maruwa Unyu Kikan | | | 1,900 | | | | 46,949 |
Meitec Corporation | | | 36,600 | | | | 1,398,814 |
†Miraca Holdings | | | 1,400 | | | | 62,703 |
MISUMI Group | | | 50,800 | | | | 833,715 |
†Nabtesco | | | 2,400 | | | | 55,717 |
†Nifco | | | 1,300 | | | | 68,427 |
Nihon Kohden | | | 27,500 | | | | 606,863 |
†NS Solutions | | | 3,800 | | | | 68,173 |
Obara Group | | | 1,300 | | | | 57,888 |
†Open House | | | 2,900 | | | | 68,882 |
Outsourcing | | | 2,200 | | | | 68,404 |
Pressance | | | 3,700 | | | | 45,881 |
Relo Group | | | 5,900 | | | | 842,512 |
Ryobi | | | 16,100 | | | | 63,085 |
†Sangetsu | | | 3,600 | | | | 62,299 |
Santen Pharmaceutical | | | 80,000 | | | | 976,999 |
Shimano | | | 3,500 | | | | 547,831 |
SPARX Group | | | 55,100 | | | | 106,752 |
†Sugi Holdings | | | 6,000 | | | | 284,313 |
Sun Frontier Fudousan | | | 7,300 | | | | 64,216 |
Takara Leben | | | 9,400 | | | | 54,679 |
Tokai Corporation | | | 1,800 | | | | 61,251 |
†Tokai Tokyo Financial Holdings | | | 11,000 | | | | 58,355 |
Trancom | | | 1,200 | | | | 58,641 |
USS | | | 62,500 | | | | 993,607 |
| |
| Total (Cost $8,526,307) | | | | | | | 9,691,649 |
| |
| |
| MEXICO – 0.4% | | | | | | | |
Bolsa Mexicana de Valores | | | 250,000 | | | | 328,756 |
†Rassini | | | 23,400 | | | | 88,037 |
| |
| Total (Cost $559,325) | | | | | | | 416,793 |
| |
| |
| NETHERLANDS – 0.1% | | | | | | | |
†Constellium Cl. A 1 | | | 15,600 | | | | 92,040 |
| |
| Total (Cost $77,927) | | | | | | | 92,040 |
| |
| |
| NEW ZEALAND – 0.7% | | | | | | | |
Fisher & Paykel Healthcare | | | 100,891 | | | | 595,472 |
†New Zealand Refining | | | 43,100 | | | | 77,809 |
| |
| Total (Cost $643,367) | | | | | | | 673,281 |
| |
| |
| NORWAY – 1.1% | | | | | | | |
†Nordic Semiconductor 1 | | | 28,300 | | | | 115,044 |
†NRC Group 1 | | | 8,800 | | | | 69,307 |
TGS-NOPEC Geophysical | | | 42,200 | | | | 935,894 |
| |
| Total (Cost $968,480) | | | | | | | 1,120,245 |
| |
| |
| PHILIPPINES – 0.2% | | | | | | | |
†Integrated Micro-Electronics | | | 756,900 | | | | 92,331 |
Universal Robina | | | 22,500 | | | | 73,884 |
| |
| Total (Cost $155,675) | | | | | | | 166,215 |
| |
| |
| POLAND – 0.3% | | | | | | | |
Warsaw Stock Exchange | | | 33,000 | | | | 314,873 |
| |
| Total (Cost $459,764) | | | | | | | 314,873 |
| |
| 16 | 2016 Annual Report to Stockholders | | THE ACCOMPANYING NOTES ARE AN INTEGRAL PART OF THESE FINANCIAL STATEMENTS |
| |
| Schedule of Investments (continued) | | | | | | |
| | | | | | | |
| | | SHARES | | | | VALUE |
| |
| | | | | | | |
| SINGAPORE – 1.3% | | | | | | |
ARA Asset Management | | 600,000 | | | $ | 705,639 |
CSE Global | | 379,000 | | | | 119,085 |
XP Power | | 25,000 | | | | 535,298 |
| |
| Total (Cost $1,166,436) | | | | | | 1,360,022 |
| |
| |
| SOUTH AFRICA – 0.7% | | | | | | |
Coronation Fund Managers | | 59,000 | | | | 301,383 |
JSE | | 15,000 | | | | 179,366 |
Net 1 UEPS Technologies 1 | | 10,500 | | | | 120,540 |
Raubex Group | | 49,000 | | | | 87,671 |
| |
| Total (Cost $799,668) | | | | | | 688,960 |
| |
| |
| SOUTH KOREA – 0.5% | | | | | | |
Handsome 1 | | 4,400 | | | | 126,996 |
Koh Young Technology | | 4,200 | | | | 156,970 |
†KT Skylife | | 6,800 | | | | 96,910 |
†Modetour Network 1 | | 6,300 | | | | 150,919 |
| |
| Total (Cost $558,478) | | | | | | 531,795 |
| |
| |
| SPAIN – 0.1% | | | | | | |
Atento 1,2 | | 16,400 | | | | 124,640 |
| |
| Total (Cost $181,133) | | | | | | 124,640 |
| |
| |
| SWEDEN – 2.1% | | | | | | |
†AcadeMedia 1 | | 18,200 | | | | 99,657 |
Addtech Cl. B | | 53,960 | | | | 843,812 |
†Bravida Holding | | 100,000 | | | | 605,362 |
†Byggmax Group | | 16,600 | | | | 114,630 |
Dustin Group | | 27,500 | | | | 192,951 |
Hoist Finance | | 8,000 | | | | 74,317 |
†Knowit | | 6,200 | | | | 61,069 |
Proact IT Group | | 7,600 | | | | 121,784 |
| |
| Total (Cost $2,060,081) | | | | | | 2,113,582 |
| |
| |
| SWITZERLAND – 4.3% | | | | | | |
Burckhardt Compression Holding | | 4,000 | | | | 1,051,796 |
dormakaba Holding | | 800 | | | | 594,793 |
LEM Holding | | 700 | | | | 654,463 |
Partners Group Holding | | 1,600 | | | | 748,809 |
VZ Holding | | 4,300 | | | | 1,290,092 |
| |
| Total (Cost $3,696,122) | | | | | | 4,339,953 |
| |
| |
| TAIWAN – 1.1% | | | | | | |
†Chipbond Technology | | 50,700 | | | | 71,996 |
†Egis Technology 1 | | 11,600 | | | | 94,978 |
Flytech Technology | | 32,780 | | | | 95,483 |
†Gourmet Master | | 8,500 | | | | 64,445 |
†Posiflex Technology | | 12,804 | | | | 70,133 |
†Realtek Semiconductor | | 28,800 | | | | 90,559 |
Shih Her Technologies | | 85,600 | | | | 79,131 |
†Sitronix Technology | | 32,100 | | | | 101,724 |
Sporton International | | 26,997 | | | | 142,744 |
Taiwan Paiho | | 38,700 | | | | 113,931 |
†TCI | | 26,800 | | | | 136,103 |
| |
Total (Cost $1,162,767) | | | | | | 1,061,227 |
| |
| | | | | | | |
| TURKEY – 0.1% | | | | | | |
†Tat Gida Sanayi | | 74,700 | | | | 121,245 |
| |
| Total (Cost $148,678) | | | | | | 121,245 |
| |
| |
| UNITED KINGDOM – 13.0% | | | | | | |
Abcam | | 30,000 | | | | 283,379 |
Ashmore Group | | 274,000 | | | | 956,076 |
AVEVA Group | | 17,500 | | | | 403,291 |
†Avon Rubber | | 8,700 | | | | 111,454 |
Berendsen | | 50,000 | | | | 534,116 |
BrainJuicer Group | | 9,400 | | | | 63,686 |
Character Group | | 11,400 | | | | 71,657 |
Clarkson | | 41,300 | | | | 1,105,920 |
Computacenter | | 15,600 | | | | 152,921 |
†Connect Group | | 68,500 | | | | 128,828 |
Consort Medical | | 64,800 | | | | 845,439 |
Conviviality | | 75,500 | | | | 200,051 |
Diploma | | 30,000 | | | | 384,035 |
†dotdigital group | | 206,200 | | | | 146,117 |
Elementis | | 175,000 | | | | 596,748 |
†Epwin Group | | 47,500 | | | | 59,794 |
†Equiniti Group | | 200,000 | | | | 481,047 |
Exova Group | | 175,000 | | | | 410,624 |
†FDM Group Holdings | | 30,000 | | | | 208,818 |
Ferroglobe | | 41,100 | | | | 445,113 |
†Ferroglobe (Warranty Insurance Trust) 1,4 | | 41,100 | | | | 0 |
Finsbury Food Group | | 76,000 | | | | 112,377 |
†Hilton Food Group | | 24,800 | | | | 189,943 |
†Inspired Energy | | 515,300 | | | | 87,341 |
ITE Group | | 325,000 | | | | 616,567 |
Jupiter Fund Management | | 36,000 | | | | 196,172 |
†Micro Focus International | | 6,100 | | | | 163,644 |
Norcros | | 64,360 | | | | 142,304 |
Pendragon | | 258,000 | | | | 99,053 |
Polypipe Group | | 60,000 | | | | 239,163 |
†Rank Group | | 31,500 | | | | 75,673 |
Real Estate Investors | | 99,300 | | | | 68,005 |
Rotork | | 160,000 | | | | 473,134 |
Spirax-Sarco Engineering | | 18,000 | | | | 924,418 |
Stallergenes Greer 1 | | 10,800 | | | | 351,022 |
Trifast | | 29,000 | | | | 73,303 |
Vertu Motors | | 164,300 | | | | 88,059 |
Victrex | | 40,000 | | | | 948,070 |
Xaar | | 115,000 | | | | 564,789 |
| |
| Total (Cost $15,103,056) | | | | | | 13,002,151 |
| |
| |
| UNITED STATES– 32.7% | | | | | | |
†Air Lease Cl. A | | 30,700 | | | | 1,053,931 |
Brooks Automation 2 | | 18,100 | | | | 308,967 |
Century Casinos 1 | | 21,400 | | | | 176,122 |
†CIRCOR International | | 12,800 | | | | 830,464 |
†Cognex Corporation | | 17,100 | | | | 1,087,902 |
†Coherent 1 | | 5,000 | | | | 686,925 |
Commercial Metals | | 42,000 | | | | 914,760 |
†Copart 1 | | 18,600 | | | | 1,030,626 |
Diebold Nixdorf 2 | | 28,800 | | | | 724,320 |
Diodes 1 | | 20,500 | | | | 526,235 |
†DST Systems | | 5,800 | | | | 621,470 |
EnerSys 2,3 | | 11,000 | | | | 859,100 |
| THE ACCOMPANYING NOTES ARE AN INTEGRAL PART OF THESE FINANCIAL STATEMENTS | | 2016 Annual Report to Stockholders | 17 |
| Royce Global Value Trust | | December 31, 2016 |
| |
| Schedule of Investments (continued) | | | | | | | |
| | | | | | | | |
| | | SHARES | | | | VALUE | |
| |
| | | | | | | | |
| UNITED STATES (continued) | | | | | | | |
Expeditors International of Washington 2 | | 13,300 | | | $ | 704,368 | |
FLIR Systems 2 | | 14,100 | | | | 510,279 | |
Greif Cl. A 2 | | 8,700 | | | | 446,397 | |
Innospec 2,3 | | 12,457 | | | | 853,304 | |
†Kadant | | 7,800 | | | | 477,360 | |
KBR 2,3 | | 73,400 | | | | 1,225,046 | |
Kirby Corporation 1,2,3 | | 32,900 | | | | 2,187,850 | |
†Lindsay Corporation | | 13,700 | | | | 1,022,157 | |
†Littelfuse | | 5,000 | | | | 758,850 | |
†ManpowerGroup | | 11,000 | | | | 977,570 | |
†MBIA 1 | | 80,300 | | | | 859,210 | |
Nanometrics 1,2,3 | | 44,500 | | | | 1,115,170 | |
National Instruments 2 | | 19,000 | | | | 585,580 | |
†Oaktree Capital Group LLC Cl. A | | 10,400 | | | | 390,000 | |
†Popular | | 13,100 | | | | 574,042 | |
Quaker Chemical 2 | | 8,400 | | | | 1,074,696 | |
†Raven Industries | | 50,000 | | | | 1,260,000 | |
Rogers Corporation 1,2 | | 6,000 | | | | 460,860 | |
Schnitzer Steel Industries Cl. A 2 | | 19,100 | | | | 490,870 | |
SEACOR Holdings 1 | | 20,200 | | | | 1,439,856 | |
SEI Investments 2 | | 40,600 | | | | 2,004,016 | |
Sensient Technologies 2,3 | | 9,500 | | | | 746,510 | |
Standard Motor Products | | 11,200 | | | | 596,064 | |
Sun Hydraulics 2 | | 15,139 | | | | 605,106 | |
Tennant Company 2 | | 11,600 | | | | 825,920 | |
†Virtu Financial Cl. A | | 74,300 | | | | 1,185,085 | |
†World Fuel Services | | 12,000 | | | | 550,920 | |
| |
| Total (Cost $27,774,093) | | | | | | 32,747,908 | |
| |
| |
| TOTAL COMMON STOCKS | | | | | | | |
| |
| (Cost $98,353,705) | | | | | | 102,001,114 | |
| |
| |
| REPURCHASE AGREEMENT– 6.8% | | | | | | | |
| Fixed Income Clearing Corporation, 0.03% dated 12/30/16, due 1/3/17, maturity value $6,790,023 (collateralized by obligations of various U.S. Government Agencies, 2.25% due 11/15/24, valued at $6,927,235) |
| |
| (Cost $6,790,000) | | | | | | 6,790,000 | |
| |
| |
| TOTAL INVESTMENTS – 108.5% | | | | | | | |
| |
| (Cost $105,143,705) | | | | | | 108,791,114 | |
| |
| | | | | | | | |
| LIABILITIES LESS CASH AND OTHER ASSETS – (8.5)% | | | | | | (8,563,327 | ) |
| | | | | | | |
| | | | | | | | |
| |
| NET ASSETS – 100.0% | | | | | $ | 100,227,787 | |
| |
| | | | | | | | |
| |
| † | New additions in 2016. |
| 1 | Non-income producing. |
| 2 | All or a portion of these securities were pledged as collateral in connection with the revolving credit agreement at December 31, 2016. Total market value of pledged securities at December 31, 2016, was $13,345,249. |
| 3 | At December 31, 2016, a portion of these securities were rehypothecated in connection with the Fund’s revolving credit agreement in the aggregate amount of $5,535,180. |
| 4 | Securities for which market quotations are not readily available represent 0.0% of net assets. These securities have been valued at their fair value under procedures approved by the Fund’s Board of Directors. These securities are defined as Level 3 securities due to the use of significant unobservable inputs in the determination of fair value. See Notes to Financial Statements. |
| | |
| | Securities of Global/International Funds are categorized by the country of their headquarters, with the exception of exchange-traded funds. |
| | |
| | Bold indicates the Fund’s 20 largest equity holdings in terms of December 31, 2016, market value. |
| | |
| | TAX INFORMATION: The cost of total investments for Federal income tax purposes was $105,661,885. At December 31, 2016, net unrealized appreciation for all securities was $3,129,229, consisting of aggregate gross unrealized appreciation of $12,156,709 and aggregate gross unrealized depreciation of $9,027,480. The primary causes of the differences between book and tax basis cost are the timing of the recognition of losses on securities sold, investments in publicly traded partnerships and mark-to-market of Passive Foreign Investment Companies. |
| |
| 18 | 2016 Annual Report to Stockholders | | THE ACCOMPANYING NOTES ARE AN INTEGRAL PART OF THESE FINANCIAL STATEMENTS |
| Royce Global Value Trust | | December 31, 2016 |
| | | |
| |
| Statement of Assets and Liabilities |
| ASSETS: | | | | | |
| Investments at value | | | $ | 102,001,114 | |
| |
| Repurchase agreements (at cost and value) | | | | 6,790,000 | |
| |
| Cash and foreign currency | | | | 199,158 | |
| |
| Receivable for investments sold | | | | 191,757 | |
| |
| Receivable for dividends and interest | | | | 182,620 | |
| |
| Prepaid expenses and other assets | | | | 32,564 | |
| |
| Total Assets | | | | 109,397,213 | |
| |
| LIABILITIES: | | | | | |
| Revolving credit agreement | | | | 8,000,000 | |
| |
| Payable for investments purchased | | | | 920,079 | |
| |
| Payable for investment advisory fee | | | | 105,686 | |
| |
| Payable for directors’ fees | | | | 7,170 | |
| |
| Payable for interest expense | | | | 1,299 | |
| |
| Accrued expenses | | | | 65,575 | |
| |
| Deferred capital gains tax | | | | 69,617 | |
| |
| Total Liabilities | | | | 9,169,426 | |
| |
| Net Assets | | | $ | 100,227,787 | |
| |
| ANALYSIS OF NET ASSETS: | | | | | |
| Paid-in capital - $0.001 par value per share; 10,415,421 shares outstanding (150,000,000 shares authorized) | | | $ | 117,477,118 | |
| |
| Undistributed net investment income (loss) | | | | (672,740 | ) |
| |
| Accumulated net realized gain (loss) on investments and foreign currency | | | | (20,145,698 | ) |
| |
| Net unrealized appreciation (depreciation) on investments and foreign currency | | | | 3,569,107 | |
| |
| Net Assets (net asset value per share - $9.62) | | | $ | 100,227,787 | |
| |
| Investments at identified cost | | | $ | 98,353,705 | |
| |
| THE ACCOMPANYING NOTES ARE AN INTEGRAL PART OF THESE FINANCIAL STATEMENTS | | 2016 Annual Report to Stockholders | 19 |
| Royce Global Value Trust |
| | |
| Statement of Changes in Net Assets |
| | | | YEAR ENDED 12/31/16 | | | YEAR ENDED 12/31/15 |
| |
| | | | | | | | | | | |
| INVESTMENT OPERATIONS: | | | | | | | | | | |
| Net investment income (loss) | | | $ | 651,129 | | | | $ | 985,324 | |
| |
| Net realized gain (loss) on investments and foreign currency | | | | (1,449,508 | ) | | | | (11,820,601 | ) |
| |
| Net change in unrealized appreciation (depreciation) on investments and foreign currency | | | | 10,740,946 | | | | | 7,399,963 | |
| |
| Net increase (decrease) in net assets from investment operations | | | | 9,942,567 | | | | | (3,435,314 | ) |
| |
| DISTRIBUTIONS: | | | | | | | | | | |
| Net investment income | | | | (1,435,789 | ) | | | | (1,029,597 | ) |
| |
| Net realized gain on investments and foreign currency | | | | – | | | | | – | |
| |
| Return of capital | | | | (12,497 | ) | | | | – | |
| |
| Total distributions | | | | (1,448,286 | ) | | | | (1,029,597 | ) |
| |
| CAPITAL STOCK TRANSACTIONS: | | | | | | | | | | |
| Reinvestment of distributions | | | | 559,946 | | | | | 353,733 | |
| |
| Total capital stock transactions | | | | 559,946 | | | | | 353,733 | |
| |
| Net Increase (Decrease) In Net Assets | | | | 9,054,227 | | | | | (4,111,178 | ) |
| |
| NET ASSETS: | | | | | | | | | | |
| |
| Beginning of year | | | | 91,173,560 | | | | | 95,284,738 | |
| |
| End of year (including undistributed net investment income (loss) of $(672,740) at 12/31/16 and $(224,615) at 12/31/15) | | | $ | 100,227,787 | | | | $ | 91,173,560 | |
| |
| 20 | 2016 Annual Report to Stockholders | | THE ACCOMPANYING NOTES ARE AN INTEGRAL PART OF THESE FINANCIAL STATEMENTS |
| Royce Global Value Trust | | Year Ended December 31, 2016 |
| | | |
| |
| Statement of Operations |
| | | |
| INVESTMENT INCOME: | | | | | |
| INCOME: | | | | | |
| Dividends | | | $ | 2,444,670 | |
| |
| Foreign withholding tax | | | | (180,561 | ) |
| |
| Interest | | | | 1,406 | |
| |
| Rehypothecation income | | | | 2,462 | |
| |
| Total income | | | | 2,267,977 | |
| |
| EXPENSES: | | | | | |
| |
| Investment advisory fees | | | | 1,180,559 | |
| |
| Interest expense | | | | 137,802 | |
| |
| Custody and transfer agent fees | | | | 101,314 | |
| |
| Stockholder reports | | | | 68,472 | |
| |
| Professional fees | | | | 37,193 | |
| |
| Directors’ fees | | | | 27,769 | |
| |
| Administrative and office facilities | | | | 23,307 | |
| |
| Other expenses | | | | 40,473 | |
| |
| Total expenses | | | | 1,616,889 | |
| |
| Compensating balance credits | | | | (41 | ) |
| |
| Net expenses | | | | 1,616,848 | |
| |
| Net investment income (loss) | | | | 651,129 | |
| |
| REALIZED AND UNREALIZED GAIN (LOSS) ON INVESTMENTS AND FOREIGN CURRENCY: | | | | | |
| NET REALIZED GAIN (LOSS): | | | | | |
| |
| Investments | | | | (1,409,168 | ) |
| |
| Foreign currency transactions | | | | (40,340 | ) |
| |
| NET CHANGE IN UNREALIZED APPRECIATION (DEPRECIATION): | | | | | |
| |
| Investments and foreign currency translations | | | | 10,791,065 | |
| |
| Other assets and liabilities denominated in foreign currency | | | | (50,119 | ) |
| |
| Net realized and unrealized gain (loss) on investments and foreign currency | | | | 9,291,438 | |
| |
| NET INCREASE (DECREASE) IN NET ASSETS FROM INVESTMENT OPERATIONS | | | $ | 9,942,567 | |
| |
| THE ACCOMPANYING NOTES ARE AN INTEGRAL PART OF THESE FINANCIAL STATEMENTS | | 2016 Annual Report to Stockholders | 21 |
| Royce Global Value Trust | | Year Ended December 31, 2016 |
| | | |
| |
| Statement of Cash Flows |
| CASH FLOWS FROM OPERATING ACTIVITIES: | | | | | |
| Net increase (decrease) in net assets from investment operations | | | $ | 9,942,567 | |
| |
| Adjustments to reconcile net increase (decrease) in net assets from investment operations to net cash provided by operating activities: | | | | | |
| |
Purchases of long-term investments | | | | (57,799,439 | ) |
| |
Proceeds from sales and maturities of long-term investments | | | | 63,325,760 | |
| |
Net purchases, sales and maturities of short-term investments | | | | (5,087,000 | ) |
| |
Net (increase) decrease in dividends and interest receivable and other assets | | | | (11,777 | ) |
| |
Net increase (decrease) in interest expense payable, accrued expenses and other liabilities | | | | 54,782 | |
| |
Net change in unrealized appreciation (depreciation) on investments | | | | (10,791,065 | ) |
| |
Net realized gain (loss) on investments and foreign currency | | | | 1,449,508 | |
| |
| Net cash provided by operating activities | | | | 1,083,336 | |
| |
| CASH FLOWS FROM FINANCING ACTIVITIES: | | | | | |
| Net increase (decrease) in revolving credit agreement | | | | - | |
| |
| Distributions | | | | (1,448,286 | ) |
| |
| Reinvestment of distributions | | | | 559,946 | |
| |
| Net cash used for financing activities | | | | (888,340 | ) |
| |
| INCREASE (DECREASE) IN CASH: | | | | 194,996 | |
| |
| Cash and foreign currency at beginning of year | | | | 4,162 | |
| |
| Cash and foreign currency at end of year | | | $ | 199,158 | |
| |
| 22 | 2016 Annual Report to Stockholders | | THE ACCOMPANYING NOTES ARE AN INTEGRAL PART OF THESE FINANCIAL STATEMENTS |
| Royce Global Value Trust |
| | |
| Financial Highlights |
| This table is presented to show selected data for a share outstanding throughout each period, and to assist stockholders in evaluating the Fund’s performance for the periods presented. |
| | YEARS ENDED | | | PERIOD ENDED |
| | | | | | | |
| | | 12/31/16 | | | 12/31/15 | | | 12/31/14 | | | 12/31/131 |
| |
| Net Asset Value, Beginning of Period | | $ | 8.81 | | | | $ | 9.25 | | | | $ | 10.05 | | | | $ | 9.78 | |
| |
| INVESTMENT OPERATIONS: | | | | | | | | | | | | | | | | | | | |
| Net investment income (loss) | | | 0.06 | | | | | 0.10 | | | | | 0.13 | | | | | (0.00 | ) |
| |
| Net realized and unrealized gain (loss) on investments and foreign currency | | | 0.90 | | | | | (0.43 | ) | | | | (0.77 | ) | | | | 0.27 | |
| |
| Net increase (decrease) in net assets from investment operations | | | 0.96 | | | | | (0.33 | ) | �� | | | (0.64 | ) | | | | 0.27 | |
| |
| DISTRIBUTIONS: | | | | | | | | | | | | | | | | | | | |
| Net investment income | | | (0.14 | ) | | | | (0.10 | ) | | | | (0.15 | ) | | | | – | |
| |
| Net realized gain on investments and foreign currency | | | – | | | | | – | | | | | – | | | | | – | |
| |
| Total distributions | | | (0.14 | ) | | | | (0.10 | ) | | | | (0.15 | ) | | | | – | |
| |
| CAPITAL STOCK TRANSACTIONS: | | | | | | | | | | | | | | | | | | | |
| Effect of reinvestment of distributions by Common Stockholders | | | (0.01 | ) | | | | (0.01 | ) | | | | (0.01 | ) | | | | – | |
| |
| Total capital stock transactions | | | (0.01 | ) | | | | (0.01 | ) | | | | (0.01 | ) | | | | – | |
| |
| Net Asset Value, End of Period | | $ | 9.62 | | | | $ | 8.81 | | | | $ | 9.25 | | | | $ | 10.05 | |
| |
| Market Value, End of Period | | $ | 8.04 | | | | $ | 7.45 | | | | $ | 8.04 | | | | $ | 8.89 | |
| |
| TOTAL RETURN:2 | | | | | | | | | | | | | | | | | | | |
| Net Asset Value | | | 11.12 | % | | | | (3.44 | )% | | | | (6.23 | )% | | | | 2.76 | %3 |
| Market Value | | | 9.77 | % | | | | (6.06 | )% | | | | (7.86 | )% | | | | (0.95 | )%3 |
| |
| RATIOS BASED ON AVERAGE NET ASSETS: | | | | | | | | | | | | | | | | | | | |
| Investment advisory fee expense | | | 1.25 | % | | | | 1.25 | % | | | | 1.25 | % | | | | 1.25 | %4 |
| |
| Other operating expenses | | | 0.46 | % | | | | 0.43 | % | | | | 0.24 | % | | | | 0.37 | %4 |
| |
| Total expenses (net) | | | 1.71 | % | | | | 1.68 | % | | | | 1.49 | % | | | | 1.62 | %4 |
| |
| Expenses excluding interest expense | | | 1.57 | % | | | | 1.58 | % | | | | 1.49 | % | | | | 1.62 | %4 |
| |
| Expenses prior to balance credits | | | 1.71 | % | | | | 1.68 | % | | | | 1.49 | % | | | | 1.62 | %4 |
| |
| Net investment income (loss) | | | 0.69 | % | | | | 1.03 | % | | | | 1.30 | % | | | | (0.13 | )%4 |
| |
| SUPPLEMENTAL DATA: | | | | | | | | | | | | | | | | | | | |
| Net Assets End of Period (in thousands) | | $ | 100,228 | | | | $ | 91,174 | | | | $ | 95,285 | | | | $ | 102,684 | |
| |
| Portfolio Turnover Rate | | | 59 | % | | | | 65 | % | | | | 43 | % | | | | 7 | % |
| |
| REVOLVING CREDIT AGREEMENT: | | | | | | | | | | | | | | | | | | | |
| Asset coverage | | | 1353 | % | | | | 1240 | % | | | | | | | | | | |
| |
| Asset coverage per $1,000 | | | 13,528 | | | | | 12,397 | | | | | | | | | | | |
| |
| 1 | The Fund commenced operations on October 18, 2013. |
| 2 | The Market Value Total Return is calculated assuming a purchase of Common Stock on the opening of the first business day and a sale on the closing of the last business day of each period. Dividends and distributions are assumed for the purposes of this calculation to be reinvested at prices obtained under the Fund’s Distribution Reinvestment and Cash Purchase Plan. Net Asset Value Total Return is calculated on the same basis, except that the Fund’s net asset value is used on the purchase and sale dates instead of market value. |
| 3 | Not annualized |
| 4 | Annualized |
| THE ACCOMPANYING NOTES ARE AN INTEGRAL PART OF THESE FINANCIAL STATEMENTS | | 2016 Annual Report to Stockholders | 23 |
| Royce Global Value Trust |
| | Notes to Financial Statements |
| Summary of Significant Accounting Policies |
Royce Global Value Trust, Inc. (the “Fund”), is a diversified closed-end investment company that was incorporated under the laws of the State of Maryland on February 14, 2011. The Fund commenced operations on October 18, 2013. |
The preparation of financial statements in conformity with accounting principles generally accepted in the United States of America requires management to make estimates and assumptions that affect the reported amounts of assets and liabilities and the disclosure of contingent assets and liabilities at the date of the financial statements and the reported amounts of income and expenses during the reporting period. Actual results could differ from those estimates. |
The Fund is an investment company and accordingly follows the investment company accounting and reporting guidance of the Financial Accounting Standards Board (FASB) Accounting Standard Codification Topic 946 “Financial Services-Investment Companies”. |
| VALUATION OF INVESTMENTS: |
Securities are valued as of the close of trading on the New York Stock Exchange (NYSE) (generally 4:00 p.m. Eastern time) on the valuation date. Securities that trade on an exchange, and securities traded on Nasdaq’s Electronic Bulletin Board, are valued at their last reported sales price or Nasdaq official closing price taken from the primary market in which each security trades or, if no sale is reported for such day, at their highest bid price. Other over-the-counter securities for which market quotations are readily available are valued at their highest bid price, except in the case of some bonds and other fixed income securities which may be valued by reference to other securities with comparable ratings, interest rates and maturities, using established independent pricing services. The Fund values its non-U.S. dollar denominated securities in U.S. dollars daily at the prevailing foreign currency exchange rates as quoted by a major bank. Securities for which market quotations are not readily available are valued at their fair value in accordance with the provisions of the 1940 Act, under procedures approved by the Fund’s Board of Directors, and are reported as Level 3 securities. As a general principle, the fair value of a security is the amount which the Fund might reasonably expect to receive for the security upon its current sale. However, in light of the judgment involved in fair valuations, there can be no assurance that a fair value assigned to a particular security will be the amount which the Fund might be able to receive upon its current sale. In addition, if, between the time trading ends on a particular security and the close of the customary trading session on the NYSE, events occur that are significant and may make the closing price unreliable, the Fund may fair value the security. The Fund uses an independent pricing service to provide fair value estimates for relevant non-U.S. equity securities on days when the U.S. market volatility exceeds a certain threshold. This pricing service uses proprietary correlations it has developed between the movement of prices of non-U.S. equity securities and indices of U.S.-traded securities, futures contracts and other indications to estimate the fair value of relevant non-U.S. securities. When fair value pricing is employed, the prices of securities used by the Fund may differ from quoted or published prices for the same security. Investments in money market funds are valued at net asset value per share. |
Various inputs are used in determining the value of the Fund’s investments, as noted above. These inputs are summarized in the three broad levels below: |
| | | Level 1 | – | quoted prices in active markets for identical securities. |
| | | Level 2 | – | other significant observable inputs (including quoted prices for similar securities, foreign securities that may be fair valued and repurchase agreements). The table below includes all Level 2 securities. Any Level 2 securities with values based on quoted prices for similar securities would be noted in the Schedule of Investments. |
| | | Level 3 | – | significant unobservable inputs (including last trade price before trading was suspended, or at a discount thereto for lack of marketability or otherwise, market price information regarding other securities, information received from the company and/or published documents, including SEC filings and financial statements, or other publicly available information). |
The inputs or methodology used for valuing securities are not necessarily an indication of the risk associated with investing in those securities. |
The following is a summary of the inputs used to value the Fund’s investments as of December 31, 2016. For a detailed breakout of common stocks by country, please refer to the Schedule of Investments. |
| | | | | | | | | | | | | | | | |
| | | LEVEL 1 | | LEVEL 2 | | LEVEL 3 | | TOTAL |
| |
| Common Stocks | | $ | 44,107,378 | | | $ | 57,884,387 | | | $ | 9,349 | | | $ | 102,001,114 |
| |
| Cash Equivalents | | | – | | | | 6,790,000 | | | | – | | | | 6,790,000 |
| |
| Level 3 Reconciliation: | | | | | | | | | | | | | | | | |
| | | | | | | | | | | | | REALIZED AND UNREALIZED | | | | |
| | | | | BALANCE AS OF 12/31/15 | | | | PURCHASES | | | | GAIN (LOSS)1 | | | | BALANCE AS OF 12/31/16 |
| |
| Common Stocks | | | | $18,710 | | | | $0 | | | | $(9,361) | | | | $9,349 |
| |
| 1 | The net change in unrealized appreciation (depreciation) is included in the accompanying Statement of Operations. Change in unrealized appreciation (depreciation) includes net unrealized appreciation (depreciation) resulting from changes in investment values during the reporting period and the reversal of previously recorded unrealized appreciation (depreciation) when gains or losses are realized. Net realized gain (loss) from investments and foreign currency transactions is included in the accompanying Statement of Operations. |
| 24 | 2016 Annual Report to Stockholders |
| Royce Global Value Trust |
| | Notes to Financial Statements (continued) |
| REPURCHASE AGREEMENTS: |
The Fund may enter into repurchase agreements with institutions that the Fund’s investment adviser has determined are creditworthy The Fund restricts repurchase agreements to maturities of no more than seven days. Securities pledged as collateral for repurchase agreements, which are held until maturity of the repurchase agreements, are marked-to-market daily and maintained at a value at least equal to the principal amount of the repurchase agreement (including accrued interest). Repurchase agreements could involve certain risks in the event of default or insolvency of the counter-party, including possible delays or restrictions upon the ability of the Fund to dispose of its underlying securities. The remaining contractual maturity of the repurchase agreement held by the Fund at December 31, 2016 is overnight and continuous. |
| FOREIGN CURRENCY: |
Net realized foreign exchange gains or losses arise from sales and maturities of short-term securities, sales of foreign currencies, expiration of currency forward contracts, currency gains or losses realized between the trade and settlement dates on securities transactions, and the difference between the amounts of dividends, interest, and foreign withholding taxes recorded on the Fund’s books and the U.S. dollar equivalent of the amounts actually received or paid. Net unrealized foreign exchange gains and losses arise from changes in the value of assets and liabilities, including investments in securities at the end of the reporting period, as a result of changes in foreign currency exchange rates. |
| DISTRIBUTIONS AND TAXES: |
As a qualified regulated investment company under Subchapter M of the Internal Revenue Code, the Fund is not subject to income taxes to the extent that it distributes substantially all of its taxable income for its fiscal year. The Schedule of Investments includes information regarding income taxes under the caption “Tax Information”. |
The Fund pays any dividends and capital gain distributions annually in December. Because federal income tax regulations differ from generally accepted accounting principles, income and capital gain distributions determined in accordance with tax regulations may differ from net investment income and realized gains recognized for financial reporting purposes. Accordingly, the character of distributions and composition of net assets for tax purposes differ from those reflected in the accompanying financial statements. |
| CAPITAL GAINS TAXES: |
The Fund is subject to a tax imposed on short-term capital gains on securities of issuers domiciled in certain countries. The Fund records an estimated deferred tax liability for these securities that have been held for less than one year. This amount, if any, is reported as deferred capital gains tax in the accompanying Statement of Assets and Liabilities, assuming those positions were disposed of at the end of the period, and accounted for as a reduction in the market value of the security. |
| INVESTMENT TRANSACTIONS AND RELATED INVESTMENT INCOME: |
Investment transactions are accounted for on the trade date. Dividend income is recorded on the ex-dividend date. Non-cash dividend income is recorded at the fair market value of the securities received. Interest income is recorded on an accrual basis. Premiums and discounts on debt securities are amortized using the effective yield-to-maturity method. Realized gains and losses from investment transactions are determined on the basis of identified cost for book and tax purposes. |
| EXPENSES: |
The Fund incurs direct and indirect expenses. Expenses directly attributable to the Fund are charged to the Fund’s operations, while expenses applicable to more than one of the Royce Funds are allocated equitably. Certain personnel, occupancy costs and other administrative expenses related to the Funds are allocated by Royce & Associates (“Royce”) under an administration agreement and are included in administrative and office facilities and professional fees. |
| COMPENSATING BALANCE CREDITS: |
The Fund has an arrangement with its custodian bank, whereby a portion of the custodian’s fee is paid indirectly by credits earned on the Fund’s cash on deposit with the bank. This deposit arrangement is an alternative to purchasing overnight investments. Conversely, the Fund pays interest to the custodian on any cash overdrafts, to the extent they are not offset by credits earned on positive cash balances. |
| Capital Stock: |
The Fund issued 70,522 and 48,927 shares of Common Stock as reinvestment of distributions for the years ended December 31, 2016 and December 31, 2015, respectively. |
| 2016 Annual Report to Stockholders | 25 |
| Royce Global Value Trust |
| | Notes to Financial Statements (continued) |
| Borrowings: |
The Fund is party to a revolving credit agreement (the credit agreement) with BNP Paribas Prime Brokerage International, Limited (BNPPI). The Fund pays a commitment fee of 0.50% per annum on the unused portion of the credit agreement. The credit agreement has a 360-day rolling term that resets daily; however, if the Fund exceeds certain net asset value triggers, the credit agreement may convert to a 60-day rolling term that resets daily. The Fund is required to pledge portfolio securities as collateral in an amount up to two times the loan balance outstanding or as otherwise required by applicable regulatory standards and has granted a security interest in the securities pledged to, and in favor of, BNPPI as security for the loan balance outstanding. If the Fund fails to meet certain requirements, or maintain other financial covenants required under the credit agreement, the Fund may be required to repay immediately, in part or in full, the loan balance outstanding under the credit agreement which may necessitate the sale of portfolio securities at potentially inopportune times. BNPPI may terminate the credit agreement upon certain ratings downgrades of its corporate parent, which would result in the Fund’s entire loan balance becoming immediately due and payable. The occurrence of such ratings downgrades may necessitate the sale of portfolio securities at potentially inopportune times. The credit agreement also permits, subject to certain conditions, BNPPI to rehypothecate portfolio securities pledged by the Fund up to the amount of the loan balance outstanding. The Fund continues to receive payments in lieu of dividends and interest on rehypothecated securities. The Fund also has the right under the credit agreement to recall the rehypothecated securities from BNPPI on demand. If BNPPI fails to deliver the recalled security in a timely manner, the Fund is compensated by BNPPI for any fees or losses related to the failed delivery or, in the event a recalled security is not returned by BNPPI, the Fund, upon notice to BNPPI, may reduce the loan balance outstanding by the value of the recalled security failed to be returned. The Fund receives a portion of the fees earned by BNPPI in connection with the rehypothecation of portfolio securities. |
As of December 31, 2016, the Fund has outstanding borrowings of $8,000,000. During the year ended December 31, 2016, the Fund borrowed an average daily balance of $8,000,000 at a weighted average borrowing cost of 1.69%. The maximum amount outstanding during the year ended December 31, 2016 was $8,000,000. As of December 31, 2016, the aggregate value of rehypothecated securities was $5,535,180. During the year ended December 31, 2016, the Fund earned $2,462 in fees from rehypothecated securities. |
| Investment Advisory Agreement: |
The Investment Advisory Agreement between Royce and the Fund provides for fees to be paid at an annual rate of 1.25% of the Fund’s average daily net assets. For the year ended December 31, 2016, the Fund expensed Royce investment advisory fees totaling $1,180,559. |
| Purchases and Sales of Investment Securities: |
For the year ended December 31, 2016, the costs of purchases and proceeds from sales of investment securities, other than short-term securities, amounted to $57,964,353 and $62,888,734, respectively. |
Cross trades were executed by the Fund pursuant to Rule 17a-7 under the 1940 Act. Cross trading is the buying or selling of portfolio securities between funds to which Royce serves as investment adviser. At its regularly scheduled quarterly meetings, the Board reviews such transactions as of the most recent calendar quarter for compliance with the requirements and restrictions set forth by Rule 17a-7. Cross trades for the year ended December 31, 2016, were as follows: |
| COST OF PURCHASES | | | PROCEEDS FROM SALES | | | REALIZED GAIN (LOSS) |
| |
| $5,938,615 | | | $314,870 | | | $131,420 |
| |
| Tax Information: |
Distributions during the years ended December 31, 2016 and 2015, were characterized as follows for tax purposes: |
| ORDINARY INCOME | | LONG-TERM CAPITAL GAINS | | RETURN OF CAPITAL |
| |
| 2016 | 2015 | | 2016 | 2015 | | 2016 | 2015 |
| |
| $1,435,789 | $1,029,597 | | $ – | $ – | | $12,497 | $ – |
| |
The tax basis components of distributable earnings at December 31, 2016, were as follows: |
| | | | | | | | | | | | | | | | | | | |
| | | | | | | | | | | QUALIFIED LATE YEAR | | | | | | | | |
| UNDISTRIBUTED | | | UNDISTRIBUTED LONG-TERM | | | | NET UNREALIZED | | | ORDINARY AND | | | | TOTAL | | | | CAPITAL LOSS |
| ORDINARY | | | CAPITAL GAINS OR | | | | APPRECIATION | | | POST-OCTOBER LOSS | | | | DISTRIBUTABLE | | | | CARRYFORWARD |
| INCOME | | | (CAPITAL LOSS CARRYFORWARD) | | | | (DEPRECIATION)1 | | | DEFERRALS2 | | | | EARNINGS | | | | UTILIZED |
| |
| $ – | | | $(19,718,673) | | | | $3,050,927 | | | $(581,585) | | | | $(17,249,331) | | | | $941,067 |
| |
| 1 | Includes timing differences on foreign currency, investments in publicly traded parternships, recognition of losses on securities sold and mark-to-market of Passive Foreign Investment Companies. |
| 2 | Under the current tax law, capital losses and qualified late year ordinary losses incurred after October 31 may be deferred and treated as occurring on the first day of the following fiscal year. |
| 26 | 2016 Annual Report to Stockholders |
| Royce Global Value Trust |
| | Notes to Financial Statements (continued) |
| Tax Information (continued): |
| |
For financial reporting purposes, capital accounts and distributions to stockholders are adjusted to reflect the tax character of permanent book/tax differences. For the year ended December 31, 2016, the Fund recorded the following permanent reclassifications, which relate primarily to current investments in publicly traded partnerships, foreign currency transactions, foreign capital gains tax and gains from the sale of Passive Foreign Investment Companies. Results of operations and net assets were not affected by these reclassifications. |
| UNDISTRIBUTED NET | | | ACCUMULATED NET | | | |
| INVESTMENT INCOME | | | REALIZED GAIN (LOSS) | | | PAID-IN CAPITAL |
| |
| $336,535 | | | $(336,535) | | | $ – |
| |
Management has analyzed the Fund’s tax positions taken on federal income tax returns for all open tax years (2013-2016) and has concluded that as of December 31, 2016, no provision for income tax is required in the Fund’s financial statements. |
| 2016 Annual Report to Stockholders | 27 |
| Royce Global Value Trust |
| | Report of Independent Registered Public Accounting Firm |
| To the Board of Directors and the Stockholders of Royce Global Value Trust, Inc.: |
| In our opinion, the accompanying statement of assets and liabilities, including the schedule of investments, and the related statement of operations, of changes in net assets and of cash flows and the financial highlights present fairly, in all material respects, the financial position of Royce Global Value Trust, Inc. (the “Fund”) as of December 31, 2016, the results of its operations, the changes in its net assets, its cash flows and the financial highlights for each of the periods presented, in conformity with accounting principles generally accepted in the United States of America. These financial statements and financial highlights (hereafter referred to as “financial statements”) are the responsibility of the Fund’s management. Our responsibility is to express an opinion on these financial statements based on our audits. We conducted our audits of these financial statements in accordance with the standards of the Public Company Accounting Oversight Board (United States). Those standards require that we plan and perform the audit to obtain reasonable assurance about whether the financial statements are free of material misstatement. An audit includes examining, on a test basis, evidence supporting the amounts and disclosures in the financial statements, assessing the accounting principles used and significant estimates made by management, and evaluating the overall financial statement presentation. We believe that our audits, which included confirmation of securities as of December 31, 2016 by correspondence with the custodian and brokers, provide a reasonable basis for our opinion. The financial highlights for each of the periods presented in the period ended December 31, 2014 were audited by other independent accountants whose report dated February 23, 2015 expressed an unqualified opinion on those statements. |
| PricewaterhouseCoopers LLP |
| Baltimore, Maryland |
| February 22, 2017 |
| 28 | 2016 Annual Report to Stockholders |
| Royce Micro-Cap Trust | | December 31, 2016 |
| | |
| Schedule of Investments | | | | | | |
| Common Stocks – 100.1% | | | | | | |
| | | | | | | |
| | | SHARES | | | VALUE | |
| | |
| | | | | | | |
| CONSUMER DISCRETIONARY – 14.2% | | | | | | |
| AUTO COMPONENTS - 2.6% | | | | | | |
Fox Factory Holding 1 | | 5,300 | | $ | 147,075 | |
LCI Industries 2, 3 | | 17,700 | | | 1,907,175 | |
Motorcar Parts of America 1 | | 88,700 | | | 2,387,804 | |
Sebang Global Battery | | 50,500 | | | 1,563,010 | |
Standard Motor Products | | 60,160 | | | 3,201,715 | |
Unique Fabricating | | 6,800 | | | 99,280 | |
| | | | | | |
| | | | | | 9,306,059 | |
| | | | | | |
| DISTRIBUTORS - 0.8% | | | | | | |
Fenix Parts 1 | | 422,300 | | | 1,190,886 | |
Weyco Group | | 56,600 | | | 1,771,580 | |
| | | | | | |
| | | | | | 2,962,466 | |
| | | | | | |
| DIVERSIFIED CONSUMER SERVICES - 1.9% | | | | | | |
American Public Education 1 | | 73,200 | | | 1,797,060 | |
Collectors Universe | | 116,100 | | | 2,464,803 | |
Liberty Tax Cl. A | | 148,900 | | | 1,995,260 | |
Universal Technical Institute | | 270,000 | | | 785,700 | |
| | | | | | |
| | | | | | 7,042,823 | |
| | | | | | |
| HOTELS, RESTAURANTS & LEISURE - 1.1% | | | | | | |
Century Casinos 1 | | 222,500 | | | 1,831,175 | |
Lindblad Expeditions Holdings 1 | | 234,000 | | | 2,211,300 | |
| | | | | | |
| | | | | | 4,042,475 | |
| | | | | | |
| HOUSEHOLD DURABLES - 2.6% | | | | | | |
Cavco Industries 1, 2, 3 | | 19,291 | | | 1,926,206 | |
Ethan Allen Interiors 2 | | 45,200 | | | 1,665,620 | |
Flexsteel Industries 2 | | 14,400 | | | 888,048 | |
iRobot Corporation 1, 2 | | 15,000 | | | 876,750 | |
Lifetime Brands 2, 3 | | 124,294 | | | 2,206,219 | |
Stanley Furniture | | 193,468 | | | 174,160 | |
Universal Electronics 1 | | 15,100 | | | 974,705 | |
ZAGG 1 | | 119,700 | | | 849,870 | |
| | | | | | |
| | | | | | 9,561,578 | |
| | | | | | |
| INTERNET & DIRECT MARKETING RETAIL - 0.7% | | | | | | |
FTD Companies 1 | | 67,200 | | | 1,602,048 | |
†Gaia Cl. A 1, 2 | | 100,000 | | | 865,000 | |
| | | | | | |
| | | | | | 2,467,048 | |
| | | | | | |
| LEISURE PRODUCTS - 1.0% | | | | | | |
American Outdoor Brands 2 | | 22,400 | | | 472,192 | |
Black Diamond 1 | | 194,926 | | | 1,042,854 | |
Nautilus 1 | | 111,200 | | | 2,057,200 | |
| | | | | | |
| | | | | | 3,572,246 | |
| | | | | | |
| MEDIA - 0.5% | | | | | | |
McClatchy Company (The) Cl. A 1 | | 69,313 | | | 913,545 | |
New Media Investment Group | | 66,200 | | | 1,058,538 | |
| | | | | | |
| | | | | | 1,972,083 | |
| | | | | | |
| SPECIALTY RETAIL - 1.6% | | | | | | |
†AutoCanada | | 115,200 | | | 1,983,707 | |
Destination Maternity | | 212,000 | | | 1,096,040 | |
Haverty Furniture | | 30,000 | | | 711,000 | |
Kirkland’s 1 | | 11,000 | | | 170,610 | |
MarineMax 1 | | 7,600 | | | 147,060 | |
Shoe Carnival 2 | | 21,028 | | | 567,335 | |
Stage Stores 2 | | 15,000 | | | 65,550 | |
TravelCenters of America LLC 1 | | 5,400 | | | 38,340 | |
West Marine 1 | | 86,000 | | | 900,420 | |
| | | | | | |
| | | | | | 5,680,062 | |
| | | | | | |
| TEXTILES, APPAREL & LUXURY GOODS - 1.4% | | | | | | |
Crown Crafts | | 104,059 | | | 806,457 | |
Culp | | 32,900 | | | 1,222,235 | |
|
J.G. Boswell Company 4 | | 2,490 | | | 1,523,880 | |
YGM Trading | | 1,482,000 | | | 1,398,790 | |
| | | | | | |
| | | | | | 4,951,362 | |
| | |
| Total (Cost $48,324,100) | | | | | 51,558,202 | |
| | |
| |
| CONSUMER STAPLES – 2.7% | | | | | | |
| BEVERAGES - 0.2% | | | | | | |
Crimson Wine Group 1, 4 | | 58,124 | | | 543,460 | |
| | | | | | |
| FOOD PRODUCTS - 2.5% | | | | | | |
Farmer Bros. 1, 2 | | 61,000 | | | 2,238,700 | |
John B. Sanfilippo & Son 2 | | 17,800 | | | 1,252,942 | |
Landec Corporation 1 | | 75,610 | | | 1,043,418 | |
Seneca Foods Cl. A 1 | | 29,701 | | | 1,189,525 | |
Seneca Foods Cl. B 1 | | 40,400 | | | 1,696,800 | |
SunOpta 1 | | 207,981 | | | 1,466,266 | |
Waterloo Investment Holdings 1, 5 | | 806,207 | | | 241,862 | |
| | | | | | |
| | | | | | 9,129,513 | |
| | |
| Total (Cost $5,670,338) | | | | | 9,672,973 | |
| | |
| |
| ENERGY – 5.7% | | | | | | |
| ENERGY EQUIPMENT & SERVICES - 2.7% | | | | | | |
Aspen Aerogels 1 | | 94,985 | | | 392,288 | |
Canadian Energy Services & Technology | | 25,000 | | | 142,629 | |
CARBO Ceramics 1 | | 34,000 | | | 355,640 | |
Dawson Geophysical 1 | | 73,654 | | | 592,178 | |
Era Group 1 | | 307,409 | | | 5,216,731 | |
Geospace Technologies 1, 2 | | 9,500 | | | 193,420 | |
Matrix Service 1, 2 | | 53,700 | | | 1,218,990 | |
Newpark Resources 1 | | 11,200 | | | 84,000 | |
North American Energy Partners | | 50,000 | | | 192,500 | |
Pioneer Energy Services 1, 2 | | 57,500 | | | 393,875 | |
TerraVest Capital | | 84,000 | | | 556,809 | |
Tesco Corporation 1, 2, 3 | | 58,000 | | | 478,500 | |
| | | | | | |
| | | | | | 9,817,560 | |
| | | | | | |
| OIL, GAS & CONSUMABLE FUELS - 3.0% | | | | | | |
Ardmore Shipping | | 182,700 | | | 1,351,980 | |
Cross Timbers Royalty Trust | | 67,631 | | | 1,215,329 | |
Dorchester Minerals L.P. | | 106,127 | | | 1,862,529 | |
Dorian LPG 1 | | 50,000 | | | 410,500 | |
Hugoton Royalty Trust | | 287,574 | | | 611,095 | |
Panhandle Oil and Gas Cl. A | | 5,500 | | | 129,525 | |
Permian Basin Royalty Trust | | 176,333 | | | 1,359,528 | |
Sabine Royalty Trust | | 59,548 | | | 2,093,112 | |
San Juan Basin Royalty Trust | | 143,407 | | | 949,354 | |
StealthGas 1 | | 229,664 | | | 776,264 | |
| | | | | | |
| | | | | | 10,759,216 | |
| | |
| Total (Cost $20,040,644) | | | | | 20,576,776 | |
| | |
| |
| FINANCIALS – 11.9% | | | | | | |
| BANKS - 2.2% | | | | | | |
Bank of N.T. Butterfield & Son | | 43,810 | | | 1,377,387 | |
Blue Hills Bancorp | | 50,000 | | | 937,500 | |
Bryn Mawr Bank | | 25,000 | | | 1,053,750 | |
Caribbean Investment Holdings 1 | | 735,647 | | | 86,128 | |
Chemung Financial | | 31,000 | | | 1,126,850 | |
Fauquier Bankshares | | 133,200 | | | 2,151,180 | |
Live Oak Bancshares | | 30,900 | | | 571,650 | |
Peapack-Gladstone Financial | | 20,606 | | | 636,313 | |
| | | | | | |
| | | | | | 7,940,758 | |
| | | | | | |
| THE ACCOMPANYING NOTES ARE AN INTEGRAL PART OF THESE FINANCIAL STATEMENTS | | 2016 Annual Report to Stockholders | 29 |
| Royce Micro-Cap Trust |
| | |
| Schedule of Investments (continued) |
| | | SHARES | | | VALUE | |
| |
| | | | | | | |
| FINANCIALS (continued) | | | | | | |
| CAPITAL MARKETS - 7.6% | | | | | | |
ASA Gold and Precious Metals | | 171,150 | | $ | 1,889,496 | |
Cowen Group 1 | | 25,000 | | | 387,500 | |
Diamond Hill Investment Group 2 | | 4,479 | | | 942,292 | |
Dundee Corporation Cl. A 1 | | 413,200 | | | 1,831,110 | |
EQT Holdings | | 43,150 | | | 544,826 | |
Fiera Capital Cl. A | | 78,000 | | | 742,442 | |
GAIN Capital Holdings | | 25,000 | | | 164,500 | |
INTL FCStone 1, 2 | | 41,727 | | | 1,652,389 | |
JZ Capital Partners | | 209,999 | | | 1,311,854 | |
Manning & Napier Cl. A | | 136,600 | | | 1,031,330 | |
Medley Management Cl. A | | 153,400 | | | 1,518,660 | |
MVC Capital 2 | | 360,300 | | | 3,091,374 | |
OHA Investment | | 154,620 | | | 267,493 | |
Queen City Investments 4 | | 948 | | | 1,232,400 | |
Silvercrest Asset Management Group Cl. A | | 203,300 | | | 2,673,395 | |
Sprott | | 1,414,533 | | | 2,644,381 | |
U.S. Global Investors Cl. A | | 646,254 | | | 878,905 | |
Urbana Corporation | | 237,600 | | | 504,346 | |
Value Line | | 144,774 | | | 2,823,093 | |
Warsaw Stock Exchange | | 52,900 | | | 504,752 | |
Westwood Holdings Group 2 | | 12,400 | | | 743,876 | |
ZAIS Group Holdings Cl. A 1, 2 | | 262,960 | | | 386,551 | |
| | | | | | |
| | | | | | 27,766,965 | |
| | | | | | |
| CONSUMER FINANCE - 0.6% | | | | | | |
EZCORP Cl. A 1, 2, 3 | | 201,000 | | | 2,140,650 | |
J.G. Wentworth Company Cl. A 1, 4 | | 135,000 | | | 49,950 | |
| | | | | | |
| | | | | | 2,190,600 | |
| | | | | | |
| DIVERSIFIED FINANCIAL SERVICES - 0.7% | | | | | | |
Banca Finnat Euramerica | | 568,000 | | | 222,196 | |
PICO Holdings 1, 2, 3 | | 147,100 | | | 2,228,565 | |
| | | | | | |
| | | | | | 2,450,761 | |
| | | | | | |
| INSURANCE - 0.8% | | | | | | |
Hallmark Financial Services 1, 2 | | 114,000 | | | 1,325,820 | |
State Auto Financial | | 59,264 | | | 1,588,868 | |
| | | | | | |
| | | | | | 2,914,688 | |
| | |
| Total (Cost $47,276,681) | | | | | 43,263,772 | |
| | |
| |
| HEALTH CARE– 13.4% | | | | | | |
| BIOTECHNOLOGY - 4.1% | | | | | | |
Abeona Therapeutics 1 | | 312,221 | | | 1,514,272 | |
Aquinox Pharmaceuticals 1, 2 | | 159,497 | | | 2,633,295 | |
ARIAD Pharmaceuticals 1, 2 | | 25,802 | | | 320,977 | |
BioCryst Pharmaceuticals 1 | | 144,000 | | | 911,520 | |
Invitae Corporation 1 | | 156,412 | | | 1,241,911 | |
Keryx Biopharmaceuticals 1 | | 117,725 | | | 689,868 | |
Kindred Biosciences 1 | | 148,000 | | | 629,000 | |
†Knight Therapeutics 1 | | 187,000 | | | 1,495,833 | |
Progenics Pharmaceuticals 1 | | 6,500 | | | 56,160 | |
Sangamo BioSciences 1 | | 281,785 | | | 859,444 | |
†Zafgen 1 | | 504,075 | | | 1,602,959 | |
Zealand Pharma 1 | | 199,700 | | | 3,006,813 | |
| | | | | | |
| | | | | | 14,962,052 | |
| | | | | | |
| HEALTH CARE EQUIPMENT & SUPPLIES - 4.9% | | | | | | |
Analogic Corporation | | 18,200 | | | 1,509,690 | |
Atrion Corporation 2, 3 | | 6,914 | | | 3,506,781 | |
Cerus Corporation 1, 2, 3 | | 140,000 | | | 609,000 | |
Derma Sciences 1 | | 177,100 | | | 920,920 | |
Exactech 1, 2, 3 | | 112,300 | | | 3,065,790 | |
Inogen 1 | | 5,400 | | | 362,718 | |
Invacare Corporation 2 | | 44,300 | | | 578,115 | |
STRATEC Biomedical | | 14,000 | | | 674,047 | |
Surmodics 1 | | 130,492 | | | 3,314,497 | |
Syneron Medical 1 | | 69,200 | | | 581,280 | |
TearLab Corporation 1 | | 85,000 | | | 43,358 | |
Trinity Biotech ADR Cl. A 1 | | 6,200 | | | 42,904 | |
Utah Medical Products | | 36,200 | | | 2,633,550 | |
| | | | | | |
| | | | | | 17,842,650 | |
| | | | | | |
| HEALTH CARE PROVIDERS & SERVICES - 2.8% | | | | | | |
Aceto Corporation | | 79,600 | | | 1,748,812 | |
BioTelemetry 1 | | 49,700 | | | 1,110,795 | |
Cross Country Healthcare 1 | | 157,100 | | | 2,452,331 | |
Landauer | | 30,400 | | | 1,462,240 | |
National Research Cl. A | | 40,033 | | | 760,627 | |
PharMerica Corporation 1 | | 40,000 | | | 1,006,000 | |
Psychemedics Corporation | | 37,500 | | | 925,500 | |
U.S. Physical Therapy | | 10,000 | | | 702,000 | |
| | | | | | |
| | | | | | 10,168,305 | |
| | | | | | |
| HEALTH CARE TECHNOLOGY - 0.2% | | | | | | |
Connecture 1 | | 20,000 | | | 33,600 | |
Vocera Communications 1 | | 33,100 | | | 612,019 | |
| | | | | | |
| | | | | | 645,619 | |
| | | | | | |
| PHARMACEUTICALS - 1.4% | | | | | | |
Agile Therapeutics 1, 2 | | 80,000 | | | 456,000 | |
†Alcobra 1 | | 645,055 | | | 1,354,615 | |
Lipocine 1 | | 355,404 | | | 1,307,887 | |
Theravance Biopharma 1 | | 66,009 | | | 2,104,367 | |
| | | | | | |
| | | | | | 5,222,869 | |
| | |
| Total (Cost $36,000,489) | | | | | 48,841,495 | |
| | |
| |
| INDUSTRIALS – 18.4% | | | | | | |
| AEROSPACE & DEFENSE - 0.6% | | | | | | |
Astronics Corporation 1 | | 4,400 | | | 148,896 | |
Astronics Corporation Cl. B 1, 4 | | 660 | | | 22,209 | |
CPI Aerostructures 1 | | 9,500 | | | 87,875 | |
FLYHT Aerospace Solutions 1 | | 1,916,800 | | | 321,216 | |
Innovative Solutions and Support 1 | | 142,828 | | | 475,617 | |
Mercury Systems 1 | | 29,700 | | | 897,534 | |
SIFCO Industries 1 | | 45,800 | | | 350,370 | |
| | | | | | |
| | | | | | 2,303,717 | |
| | | | | | |
| BUILDING PRODUCTS - 1.4% | | | | | | |
Burnham Holdings Cl. A 4 | | 117,000 | | | 1,842,750 | |
DIRTT Environmental Solutions 1 | | 171,000 | | | 798,548 | |
Insteel Industries | | 44,200 | | | 1,575,288 | |
Patrick Industries 1 | | 11,500 | | | 877,450 | |
| | | | | | |
| | | | | | 5,094,036 | |
| | | | | | |
| COMMERCIAL SERVICES & SUPPLIES - 2.2% | | | | | | |
Atento 1 | | 246,001 | | | 1,869,607 | |
CompX International Cl. A | | 107,500 | | | 1,730,750 | |
Heritage-Crystal Clean 1, 2, 3 | | 241,677 | | | 3,794,329 | |
Team 1, 2 | | 17,500 | | | 686,875 | |
| | | | | | |
| | | | | | 8,081,561 | |
| | | | | | |
| CONSTRUCTION & ENGINEERING - 2.3% | | | | | | |
Ameresco Cl. A 1 | | 261,900 | | | 1,440,450 | |
IES Holdings 1 | | 234,000 | | | 4,481,100 | |
Layne Christensen 1, 2 | | 50,000 | | | 543,500 | |
Northwest Pipe 1 | | 58,400 | | | 1,005,648 | |
| 30 | 2016 Annual Report to Stockholders | | THE ACCOMPANYING NOTES ARE AN INTEGRAL PART OF THESE FINANCIAL STATEMENTS |
| |
| Schedule of Investments (continued) |
| | | SHARES | | | | VALUE |
| |
| | | | | | | |
| INDUSTRIALS (continued) | | | | | | |
| CONSTRUCTION & ENGINEERING (continued) |
NV5 Global 1 | | 27,400 | | | $ | 915,160 |
| | | | | | |
| | | | | | | 8,385,858 |
| | | | | | |
| ELECTRICAL EQUIPMENT - 1.1% | | | | | | |
Encore Wire 2 | | 4,100 | | | | 177,735 |
LSI Industries | | 144,212 | | | | 1,404,625 |
Orion Energy Systems 1 | | 170,000 | | | | 368,900 |
Powell Industries | | 21,400 | | | | 834,600 |
Power Solutions International 1, 2 | | 7,100 | | | | 53,250 |
Preformed Line Products | | 20,743 | | | | 1,205,583 |
| | | | | | |
| | | | | | | 4,044,693 |
| | | | | | |
| INDUSTRIAL CONGLOMERATES - 0.8% | | | | | | |
Raven Industries 2 | | 117,159 | | | | 2,952,407 |
| | | | | | |
| MACHINERY - 6.8% | | | | | | |
Chart Industries 1 | | 1,100 | | | | 39,622 |
CIRCOR International 2 | | 26,100 | | | | 1,693,368 |
Columbus McKinnon | | 1,500 | | | | 40,560 |
Eastern Company (The) | | 39,750 | | | | 830,775 |
Foster (L.B.) Company 2 | | 99,300 | | | | 1,350,480 |
FreightCar America | | 81,000 | | | | 1,209,330 |
Graham Corporation 2, 3 | | 78,050 | | | | 1,728,807 |
Hurco Companies | | 36,866 | | | | 1,220,264 |
Kadant | | 54,600 | | | | 3,341,520 |
Lindsay Corporation | | 29,400 | | | | 2,193,534 |
Luxfer Holdings ADR | | 59,712 | | | | 650,264 |
Lydall 1 | | 1,800 | | | | 111,330 |
NN | | 50,300 | | | | 958,215 |
Pfeiffer Vacuum Technology | | 6,000 | | | | 560,622 |
Sun Hydraulics | | 86,900 | | | | 3,473,393 |
Tennant Company | | 36,600 | | | | 2,605,920 |
Titan International | | 237,600 | | | | 2,663,496 |
Twin Disc 1 | | 5,300 | | | | 77,380 |
| | | | | | |
| | | | | | | 24,748,880 |
| | | | | | |
| MARINE - 0.6% | | | | | | |
Clarkson | | 74,500 | | | | 1,994,940 |
| | | | | | |
| PROFESSIONAL SERVICES - 1.5% | | | | | | |
Acacia Research 1, 2 | | 190,000 | | | | 1,235,000 |
CBIZ 1 | | 47,000 | | | | 643,900 |
Franklin Covey 1 | | 40,100 | | | | 808,015 |
GP Strategies 1 | | 7,600 | | | | 217,360 |
Heidrick & Struggles International | | 46,300 | | | | 1,118,145 |
Kforce 2 | | 4,700 | | | | 108,570 |
Resources Connection | | 8,800 | | | | 169,400 |
RPX Corporation 1 | | 100,000 | | | | 1,080,000 |
| | | | | | |
| | | | | | | 5,380,390 |
| | | | | | |
| ROAD & RAIL - 0.6% | | | | | | |
Marten Transport | | 3,300 | | | | 76,890 |
Patriot Transportation Holding 1, 2 | | 29,460 | | | | 686,418 |
Universal Logistics Holdings 2 | | 77,600 | | | | 1,268,760 |
| | | | | | |
| | | | | | | 2,032,068 |
| | | | | | |
| TRADING COMPANIES & DISTRIBUTORS - 0.5% | | | | | | |
Central Steel & Wire 4 | | 788 | | | | 346,523 |
Houston Wire & Cable | | 249,918 | | | | 1,624,467 |
| | | | | | |
| | | | | | | 1,970,990 |
| |
| Total (Cost $53,738,212) | | | | | | 66,989,540 |
| |
| | | | | | | |
| INFORMATION TECHNOLOGY – 19.0% |
| COMMUNICATIONS EQUIPMENT - 1.6% | | | | | | |
ADTRAN | | 23,300 | | | | 520,755 |
Applied Optoelectronics 1, 2 | | 7,000 | | | | 164,080 |
Bel Fuse Cl. A | | 67,705 | | | | 1,713,614 |
CalAmp Corporation 1 | | 3,100 | | | | 44,950 |
Clearfield 1 | | 61,300 | | | | 1,268,910 |
Harmonic 1 | | 147,000 | | | | 735,000 |
Oclaro 1 | | 123,600 | | | | 1,106,220 |
PCTEL | | 34,100 | | | | 183,458 |
Sandvine Corporation | | 35,200 | | | | 73,669 |
| | | | | | |
| | | | | | | 5,810,656 |
| | | | | | |
| ELECTRONIC EQUIPMENT, INSTRUMENTS & COMPONENTS - 5.4% |
Agilysys 1 | | 170,587 | | | | 1,767,281 |
ePlus 1 | | 2,100 | | | | 241,920 |
Fabrinet 1 | | 2,200 | | | | 88,660 |
FARO Technologies 1, 2, 3 | | 81,700 | | | | 2,941,200 |
HollySys Automation Technologies | | 62,900 | | | | 1,152,328 |
Inficon Holding | | 3,420 | | | | 1,232,788 |
LRAD Corporation | | 853,456 | | | | 1,459,410 |
Mesa Laboratories 2, 3 | | 22,700 | | | | 2,786,425 |
Netlist 1 | | 63,600 | | | | 64,872 |
Novanta 1 | | 37,600 | | | | 789,600 |
Orbotech 1, 2, 3 | | 102,800 | | | | 3,434,548 |
PC Connection | | 43,716 | | | | 1,227,983 |
Perceptron 1 | | 8,500 | | | | 56,440 |
Richardson Electronics | | 316,900 | | | | 1,996,470 |
Rogers Corporation 1, 2 | | 600 | | | | 46,086 |
Vishay Precision Group 1 | | 10,000 | | | | 189,000 |
| | | | | | |
| | | | | | | 19,475,011 |
| | | | | | |
| INTERNET SOFTWARE & SERVICES - 3.3% |
Actua Corporation 1 | | 46,876 | | | | 656,264 |
Care.com 1, 2, 3 | | 207,587 | | | | 1,779,020 |
comScore 1 | | 81,905 | | | | 2,586,560 |
IZEA 1 | | 81,770 | | | | 368,783 |
QuinStreet 1 | | 525,550 | | | | 1,976,068 |
RealNetworks 1 | | 135,362 | | | | 657,859 |
Reis | | 25,000 | | | | 556,250 |
Solium Capital 1 | | 215,400 | | | | 1,354,021 |
Stamps.com 1 | | 14,500 | | | | 1,662,425 |
Support.com 1 | | 316,800 | | | | 272,448 |
| | | | | | |
| | | | | | | 11,869,698 |
| | | | | | |
| IT SERVICES - 1.1% | | | | | | |
Computer Task Group 2 | | 140,838 | | | | 592,928 |
Hackett Group (The) | | 55,500 | | | | 980,130 |
Innodata 1 | | 437,275 | | | | 1,071,324 |
MoneyGram International 1 | | 102,003 | | | | 1,204,655 |
Virtusa Corporation 1 | | 8,100 | | | | 203,472 |
| | | | | | |
| | | | | | | 4,052,509 |
| | | | | | |
| SEMICONDUCTORS & SEMICONDUCTOR EQUIPMENT - 4.2% |
Amtech Systems 1, 2 | | 160,284 | | | | 681,207 |
Brooks Automation | | 129,100 | | | | 2,203,737 |
CyberOptics Corporation 1 | | 16,200 | | | | 422,820 |
Daqo New Energy ADR 1 | | 20,000 | | | | 386,000 |
FormFactor 1 | | 22,869 | | | | 256,133 |
Intermolecular 1 | | 240,000 | | | | 227,520 |
IXYS Corporation | | 18,800 | | | | 223,720 |
Kopin Corporation 1 | | 242,200 | | | | 687,848 |
Kulicke & Soffa Industries 1 | | 88,000 | | | | 1,403,600 |
MoSys 1, 2 | | 684,275 | | | | 157,452 |
Nanometrics 1 | | 67,300 | | | | 1,686,538 |
| THE ACCOMPANYING NOTES ARE AN INTEGRAL PART OF THESE FINANCIAL STATEMENTS | | 2016 Annual Report to Stockholders | 31 |
Royce Micro-Cap Trust
| |
| Schedule of Investments (continued) |
| | | SHARES | | | | VALUE | |
| |
| | | | | | | | |
| INFORMATION TECHNOLOGY (continued) | | | | | | | |
| SEMICONDUCTORS & SEMICONDUCTOR EQUIPMENT (continued) |
Nova Measuring Instruments 1 | | 128,400 | | | $ | 1,687,176 | |
PDF Solutions 1 | | 25,000 | | | | 563,750 | |
Photronics 1 | | 189,700 | | | | 2,143,610 | |
Sigma Designs 1 | | 89,000 | | | | 534,000 | |
Silicon Motion Technology ADR | | 34,100 | | | | 1,448,568 | |
Ultra Clean Holdings 1 | | 49,900 | | | | 484,030 | |
Xcerra Corporation 1 | | 20,900 | | | | 159,676 | |
| | | | | | | |
| | | | | | | 15,357,385 | |
| | | | | | | |
| SOFTWARE - 2.1% | | | | | | | |
American Software Cl. A | | 120,352 | | | | 1,243,236 | |
BSQUARE Corporation 1 | | 83,675 | | | | 489,499 | |
Computer Modelling Group | | 337,700 | | | | 2,291,325 | |
Model N 1 | | 166,693 | | | | 1,475,233 | |
Monotype Imaging Holdings | | 15,000 | | | | 297,750 | |
PSI | | 34,000 | | | | 436,258 | |
Rubicon Project 1 | | 92,200 | | | | 684,124 | |
SeaChange International 1 | | 284,200 | | | | 653,660 | |
| | | | | | | |
| | | | | | | 7,571,085 | |
| | | | | | | |
| TECHNOLOGY HARDWARE, STORAGE & PERIPHERALS - 1.3% |
Intevac 1 | | 379,300 | | | | 3,243,015 | |
Kortek | | 135,007 | | | | 1,555,879 | |
| | | | | | | |
| | | | | | | 4,798,894 | |
| |
| Total (Cost $62,002,414) | | | | | | 68,935,238 | |
| |
| | | | | | | | |
| MATERIALS – 6.2% | | | | | | | |
| CHEMICALS - 1.8% | | | | | | | |
Balchem Corporation | | 11,775 | | | | 988,158 | |
FutureFuel Corporation | | 85,262 | | | | 1,185,142 | |
Quaker Chemical 2 | | 26,000 | | | | 3,326,440 | |
Trecora Resources 1 | | 89,600 | | | | 1,240,960 | |
| | | | | | | |
| | | | | | | 6,740,700 | |
| | | | | | | |
| CONSTRUCTION MATERIALS - 0.8% | | | | | | | |
Ash Grove Cement 4 | | 7,900 | | | | 2,054,000 | |
Monarch Cement 4 | | 16,303 | | | | 745,862 | |
U.S. Concrete 1 | | 3,400 | | | | 222,700 | |
| | | | | | | |
| | | | | | | 3,022,562 | |
| | | | | | | |
| CONTAINERS & PACKAGING - 0.3% | | | | | | | |
UFP Technologies 1 | | 36,445 | | | | 927,525 | |
| | | | | | | |
| METALS & MINING - 3.3% | | | | | | | |
Alamos Gold Cl. A | | 186,044 | | | | 1,283,110 | |
Ampco-Pittsburgh | | 79,002 | | | | 1,323,283 | |
Comstock Mining 1 | | 1,875,000 | | | | 493,125 | |
Exeter Resource 1 | | 1,195,400 | | | | 895,235 | |
Haynes International 2 | | 25,000 | | | | 1,074,750 | |
Imdex 1 | | 525,666 | | | | 217,758 | |
MAG Silver 1 | | 74,050 | | | | 816,772 | |
Major Drilling Group International 1 | | 706,757 | | | | 3,695,255 | |
Olympic Steel | | 35,000 | | | | 848,050 | |
Pretium Resources 1 | | 80,000 | | | | 662,570 | |
Universal Stainless & Alloy Products 1 | | 11,600 | | | | 156,716 | |
Victoria Gold 1 | | 890,000 | | | | 371,206 | |
| | | | | | | |
| | | | | | | 11,837,830 | |
| |
| Total (Cost $16,417,272) | | | | | | 22,528,617 | |
| |
| | | | | | | | |
| REAL ESTATE – 3.7% | | | | | | | |
| EQUITY REAL ESTATE INVESTMENT TRUSTS (REITS) - 0.5% |
BRT Realty Trust 1 | | 230,331 | | | | 1,886,411 | |
| | | | | | | |
| REAL ESTATE MANAGEMENT & DEVELOPMENT - 3.2% |
AV Homes 1 | | 82,000 | | | | 1,295,600 | |
Forestar Group 1, 2 | | 53,000 | | | | 704,900 | |
FRP Holdings 1, 2, 3 | | 58,300 | | | | 2,197,910 | |
Griffin Industrial Realty | | 43,384 | | | | 1,376,574 | |
Hopefluent Group Holdings | | 1,400,000 | | | | 387,169 | |
Marcus & Millichap 1 | | 49,567 | | | | 1,324,430 | |
†RMR Group Cl. A | | 37,100 | | | | 1,465,450 | |
Tejon Ranch 1, 2, 3 | | 115,162 | | | | 2,928,570 | |
| | | | | | | |
| | | | | | | 11,680,603 | |
| |
| Total (Cost $11,153,885) | | | | | | 13,567,014 | |
| |
| | | | | | | | |
| TELECOMMUNICATION SERVICES – 0.1% | | | | | | | |
| DIVERSIFIED TELECOMMUNICATION SERVICES - 0.1% | | | | | | | |
ORBCOMM 1 | | 67,100 | | | | 554,917 | |
| |
| Total (Cost $570,215) | | | | | | 554,917 | |
| |
| | | | | | | | |
| UTILITIES – 0.1% | | | | | | | |
| GAS UTILITIES - 0.1% | | | | | | | |
Shizuoka Gas | | 40,000 | | | | 281,180 | |
| | | | | | | |
| INDEPENDENT POWER & RENEWABLE ELECTRICITY PRODUCER - 0.0% |
Alterra Power | | 45,000 | | | | 174,617 | |
| |
| Total (Cost $467,214) | | | | | | 455,797 | |
| |
| | | | | | | | |
| MISCELLANEOUS 6 – 4.7% | | | | | | | |
| |
| Total (Cost $15,686,815) | | | | | | 17,027,717 | |
| |
| | | | | | | | |
| TOTAL COMMON STOCKS | | | | | | | |
| |
| (Cost $317,348,279) | | | | | | 363,972,058 | |
| |
| | | | | | | | |
| PREFERRED STOCK – 0.3% | | | | | | | |
Seneca Foods Conv. 1, 4 | | 45,409 | | | | 1,089,816 | |
| |
| (Cost $578,719) | | | | | | 1,089,816 | |
| |
| | | | | | | | |
| REPURCHASE AGREEMENT– 11.9% | | | | | | | |
Fixed Income Clearing Corporation, 0.03% dated 12/30/16, due 1/3/17, maturity value
$43,472,145 (collateralized by obligations of various U.S. Government Agencies, 2.25%
due 11/15/24, valued at $44,344,237) |
| |
| (Cost $43,472,000) | | | | | | 43,472,000 | |
| |
| | | | | | | | |
| TOTAL INVESTMENTS – 112.3% | | | | | | | |
| |
| (Cost $361,398,998) | | | | | | 408,533,874 | |
| |
| | | | | | | | |
| LIABILITIES LESS CASH AND OTHER ASSETS – (12.3)% | | | | | | (44,833,121 | ) |
| | | | | | | |
| | | | | | | | |
| |
| NET ASSETS – 100.0% | | | | | $ | 363,700,753 | |
| |
| 32 | 2016 Annual Report to Stockholders | | THE ACCOMPANYING NOTES ARE AN INTEGRAL PART OF THESE FINANCIAL STATEMENTS |
| |
| † | New additions in 2016. |
| 1 | Non-income producing. |
| 2 | All or a portion of these securities were pledged as collateral in connection with the revolving credit agreement at December 31, 2016. Total market value of pledged securities at December 31, 2016, was $71,014,926. |
| 3 | At December 31, 2016, a portion of these securities were rehypothecated in connection with the Fund’s revolving credit agreement in the aggregate amount of $39,021,909. |
| 4 | These securities are defined as Level 2 securities due to fair value being based on quoted prices for similar securities. See Notes to Financial Statements. |
| 5 | A security for which market quotations are not readily available represents 0.1% of net assets. This security has been valued at its fair value under procedures approved by the Fund’s Board of Directors. This security is defined as a Level 3 security due to the use of significant unobservable inputs in the determination of fair value. See Notes to Financial Statements. |
| 6 | Includes securities first acquired in 2016 and less than 1% of net assets. |
| |
Bold indicates the Fund’s 20 largest equity holdings in terms of December 31, 2016, market value.
|
| |
TAX INFORMATION: The cost of total investments for Federal income tax purposes was $364,689,765. At December 31, 2016, net unrealized appreciation for all securities was $43,844,109, consisting of aggregate gross unrealized appreciation of $90,607,363 and aggregate gross unrealized depreciation of $46,763,254. The primary causes of the differences between book and tax basis cost are the timing of the recognition of losses on securities sold, investments in publicly traded partnerships and Trusts and mark-to-market of Passive Foreign Investment Companies.
|
| |
| THE ACCOMPANYING NOTES ARE AN INTEGRAL PART OF THESE FINANCIAL STATEMENTS | | 2016 Annual Report to Stockholders | 33 |
| Royce Micro-Cap Trust | | December 31, 2016 |
| |
| Statement of Assets and Liabilities |
| ASSETS: | | | | |
| Investments at value | | $ | 365,061,874 | |
| |
| Repurchase agreements (at cost and value) | | | 43,472,000 | |
| |
| Cash and foreign currency | | | 639 | |
| |
| Receivable for investments sold | | | 177,818 | |
| |
| Receivable for dividends and interest | | | 519,587 | |
| |
| Prepaid expenses and other assets | | | 22,771 | |
| |
| Total Assets | | | 409,254,689 | |
| |
| LIABILITIES: | | | | |
| Revolving credit agreement | | | 45,000,000 | |
| |
| Payable for investments purchased | | | 274,464 | |
| |
| Payable for investment advisory fee | | | 152,896 | |
| |
| Payable for directors’ fees | | | 23,341 | |
| |
| Payable for interest expense | | | 7,305 | |
| |
| Accrued expenses | | | 95,930 | |
| |
| Total Liabilities | | | 45,553,936 | |
| |
| Net Assets | | $ | 363,700,753 | |
| |
| ANALYSIS OF NET ASSETS: | | | | |
| Paid-in capital -$0.001 par value per share; 37,780,330 shares outstanding (150,000,000 shares authorized) | | $ | 317,416,636 | |
| |
| Undistributed net investment income (loss) | | | (1,987,430 | ) |
| |
| Accumulated net realized gain (loss) on investments and foreign currency | | | 1,138,148 | |
| |
| Net unrealized appreciation (depreciation) on investments and foreign currency | | | 47,133,399 | |
| |
| Net Assets (net asset value per share - $9.63) | | $ | 363,700,753 | |
| |
| Investments at identified cost | | $ | 317,926,998 | |
| |
| | | | | |
| 34 | 2016 Annual Report to Stockholders | | THE ACCOMPANYING NOTES ARE AN INTEGRAL PART OF THESE FINANCIAL STATEMENTS |
Royce Micro-Cap Trust
| |
| Statement of Changes in Net Assets |
| | | YEAR ENDED 12/31/16 | | | YEAR ENDED 12/31/15 | |
| |
| | | | | | | | | |
| INVESTMENT OPERATIONS: | | | | | | | | |
| Net investment income (loss) | | $ | 1,040,381 | | | $ | 917,928 | |
| |
| Net realized gain (loss) on investments and foreign currency | | | 17,298,523 | | | | 21,372,239 | |
| |
| Net change in unrealized appreciation (depreciation) on investments and foreign currency | | | 46,017,634 | | | | (71,062,194 | ) |
| |
| Net increase (decrease) in net assets from investment operations | | | 64,356,538 | | | | (48,772,027 | ) |
| |
| DISTRIBUTIONS: | | | | | | | | |
| Net investment income | | | (2,974,373 | ) | | | (399,672 | ) |
| |
| Net realized gain on investments and foreign currency | | | (20,650,513 | ) | | | (43,520,307 | ) |
| |
| Total distributions | | | (23,624,886 | ) | | | (43,919,979 | ) |
| |
| CAPITAL STOCK TRANSACTIONS: | | | | | | | | |
| Reinvestment of distributions | | | 10,562,009 | | | | 17,611,123 | |
| |
| Total capital stock transactions | | | 10,562,009 | | | | 17,611,123 | |
| |
| Net Increase (Decrease) In Net Assets | | | 51,293,661 | | | | (75,080,883 | ) |
| |
| NET ASSETS: | | | | | | | | |
| |
| Beginning of year | | | 312,407,092 | | | | 387,487,975 | |
| |
End of year (including undistributed net investment income (loss) of $(1,987,430) at 12/31/16 and $(116,177) at 12/31/15) | | $ | 363,700,753 | | | $ | 312,407,092 | |
| |
| THE ACCOMPANYING NOTES ARE AN INTEGRAL PART OF THESE FINANCIAL STATEMENTS | | 2016 Annual Report to Stockholders | 35 |
| Royce Micro-Cap Trust | | Year Ended December 31, 2016 |
| INVESTMENT INCOME: | | | | |
| INCOME: | | | | |
| Dividends | | $ | 5,148,607 | |
| |
| Foreign withholding tax | | | (90,286 | ) |
| |
| Interest | | | 9,197 | |
| |
| Rehypothecation income | | | 52,529 | |
| |
| Total income | | | 5,120,047 | |
| |
| EXPENSES: | | | | |
| |
| Investment advisory fees | | | 2,811,209 | |
| |
| Interest expense | | | 775,138 | |
| |
| Stockholder reports | | | 125,590 | |
| |
| Directors’ fees | | | 87,305 | |
| |
| Administrative and office facilities | | | 78,686 | |
| |
| Custody and transfer agent fees | | | 78,184 | |
| |
| Professional fees | | | 56,507 | |
| |
| Other expenses | | | 67,125 | |
| |
| Total expenses | | | 4,079,744 | |
| |
| Compensating balance credits | | | (78 | ) |
| |
| Net expenses | | | 4,079,666 | |
| |
| Net investment income (loss) | | | 1,040,381 | |
| |
| REALIZED AND UNREALIZED GAIN (LOSS) ON INVESTMENTS AND FOREIGN CURRENCY: | | | | |
| NET REALIZED GAIN (LOSS): | | | | |
| |
| Investments | | | 17,310,170 | |
| |
| Foreign currency transactions | | | (11,647 | ) |
| |
| NET CHANGE IN UNREALIZED APPRECIATION (DEPRECIATION): | | | | |
| |
| Investments and foreign currency translations | | | 46,016,376 | |
| |
| Other assets and liabilities denominated in foreign currency | | | 1,258 | |
| |
| Net realized and unrealized gain (loss) on investments and foreign currency | | | 63,316,157 | |
| |
| NET INCREASE (DECREASE) IN NET ASSETS FROM INVESTMENT OPERATIONS | | $ | 64,356,538 | |
| |
| 36 | 2016 Annual Report to Stockholders | | THE ACCOMPANYING NOTES ARE AN INTEGRAL PART OF THESE FINANCIAL STATEMENTS |
| Royce Micro-Cap Trust | | Year Ended December 31, 2016 |
| CASH FLOWS FROM OPERATING ACTIVITIES: | | | | |
| Net increase (decrease) in net assets from investment operations | | $ | 64,356,538 | |
| |
| Adjustments to reconcile net increase (decrease) in net assets from investment operations to net cash provided by operating activities: | | | | |
| |
Purchases of long-term investments | | | (89,262,035 | ) |
| |
Proceeds from sales and maturities of long-term investments | | | 130,287,242 | |
| |
Net purchases, sales and maturities of short-term investments | | | (29,054,000 | ) |
| |
Net (increase) decrease in dividends and interest receivable and other assets | | | 55,414 | |
| |
Net increase (decrease) in interest expense payable, accrued expenses and other liabilities | | | (54,868 | ) |
| |
Net change in unrealized appreciation (depreciation) on investments | | | (46,016,376 | ) |
| |
Net realized gain (loss) on investments and foreign currency | | | (17,298,523 | ) |
| |
| Net cash provided by operating activities | | | 13,013,392 | |
| |
| CASH FLOWS FROM FINANCING ACTIVITIES: | | | | |
| Net increase (decrease) in revolving credit agreement | | | – | |
| |
| Distributions | | | (23,624,886 | ) |
| |
| Reinvestment of distributions | | | 10,562,009 | |
| |
| Net cash used for financing activities | | | (13,062,877 | ) |
| |
| INCREASE (DECREASE) IN CASH: | | | (49,485 | ) |
| |
| Cash and foreign currency at beginning of year | | | 50,124 | |
| |
| Cash and foreign currency at end of year | | $ | 639 | |
| |
| THE ACCOMPANYING NOTES ARE AN INTEGRAL PART OF THESE FINANCIAL STATEMENTS | | 2016 Annual Report to Stockholders | 37 |
Royce Micro-Cap Trust
| |
| Financial Highlights |
| This table is presented to show selected data for a share of Common Stock outstanding throughout each period, and to assist stockholders in evaluating the Fund’s performance for the periods presented. |
| | | YEARS ENDED |
| | | |
| | | | 12/31/16 | | | 12/31/15 | | | 12/31/14 | | | 12/31/13 | | | 12/31/12 | |
| |
| Net Asset Value, Beginning of Period | | | $ | 8.59 | | | $ | 11.33 | | | $ | 14.12 | | | $ | 10.93 | | | $ | 9.86 | |
| |
| INVESTMENT OPERATIONS: | | | | | | | | | | | | | | | | | | | | | |
| Net investment income (loss) | | | | 0.03 | | | | 0.03 | | | | (0.01 | ) | | | 0.01 | | | | 0.15 | |
| |
Net realized and unrealized gain (loss) on investments and foreign currency | | | | 1.70 | | | | (1.42 | ) | | | 0.25 | | | | 4.64 | | | | 1.58 | |
| |
| Total investment operations | | | | 1.73 | | | | (1.39 | ) | | | 0.24 | | | | 4.65 | | | | 1.73 | |
| |
| DISTRIBUTIONS TO PREFERRED STOCKHOLDERS: | | | | | | | | | | | | | | | | | | | | | |
| Net investment income | | | | – | | | | – | | | | – | | | | – | | | | (0.02 | ) |
| |
| Net realized gain on investments and foreign currency | | | | – | | | | – | | | | – | | | | – | | | | (0.09 | ) |
| |
| Total distributions to Preferred Stockholders | | | | – | | | | – | | | | – | | | | – | | | | (0.11 | ) |
| |
Net Increase (Decrease) in Net Assets Applicable to Common Stockholders from Investment Operations | | | | 1.73 | | | | (1.39 | ) | | | 0.24 | | | | 4.65 | | | | 1.62 | |
| |
| DISTRIBUTIONS TO COMMON STOCKHOLDERS: | | | | | | | | | | | | | | | | | | | | | |
| Net investment income | | | | (0.08 | ) | | | (0.01 | ) | | | (0.04 | ) | | | (0.03 | ) | | | (0.08 | ) |
| |
| Net realized gain on investments and foreign currency | | | | (0.56 | ) | | | (1.25 | ) | | | (2.86 | ) | | | (1.35 | ) | | | (0.43 | ) |
| |
| Total distributions to Common Stockholders | | | | (0.64 | ) | | | (1.26 | ) | | | (2.90 | ) | | | (1.38 | ) | | | (0.51 | ) |
| |
| CAPITAL STOCK TRANSACTIONS: | | | | | | | | | | | | | | | | | | | | | |
| Effect of reinvestment of distributions by Common Stockholders | | | | (0.05 | ) | | | (0.09 | ) | | | (0.13 | ) | | | (0.08 | ) | | | (0.04 | ) |
| |
| Total capital stock transactions | | | | (0.05 | ) | | | (0.09 | ) | | | (0.13 | ) | | | (0.08 | ) | | | (0.04 | ) |
| |
| Net Asset Value, End of Period | | | $ | 9.63 | | | $ | 8.59 | | | $ | 11.33 | | | $ | 14.12 | | | $ | 10.93 | |
| |
| Market Value, End of Period | | | $ | 8.16 | | | $ | 7.26 | | | $ | 10.08 | | | $ | 12.61 | | | $ | 9.45 | |
| |
| TOTAL RETURN:1 | | | | | | | | | | | | | | | | | | | | | |
| Net Asset Value | | | | 21.98 | % | | | (11.64 | )% | | | 3.46 | % | | | 44.66 | % | | | 17.23 | % |
| Market Value | | | | 22.30 | % | | | (16.06 | )% | | | 3.06 | % | | | 49.42 | % | | | 13.95 | % |
| |
RATIOS BASED ON AVERAGE NET ASSETS APPLICABLE TO COMMON STOCKHOLDERS: | | | | | | | | | | | | | | | | | | | | | |
| Investment advisory fee expense2 | | | | 0.87 | % | | | 0.93 | % | | | 0.93 | % | | | 0.82 | % | | | 1.12 | % |
| |
| Other operating expenses | | | | 0.39 | % | | | 0.35 | % | | | 0.25 | % | | | 0.29 | % | | | 0.18 | % |
| |
| Total expenses (net)3 | | | | 1.26 | % | | | 1.28 | % | | | 1.18 | % | | | 1.11 | % | | | 1.30 | % |
| |
| Expenses net of fee waivers and excluding interest expense | | | | 1.02 | % | | | 1.08 | % | | | 1.05 | % | | | 0.96 | % | | | 1.27 | % |
| |
| Expenses prior to fee waivers and balance credits | | | | 1.26 | % | | | 1.28 | % | | | 1.18 | % | | | 1.11 | % | | | 1.32 | % |
| |
| Expenses prior to fee waivers | | | | 1.26 | % | | | 1.28 | % | | | 1.18 | % | | | 1.11 | % | | | 1.32 | % |
| |
| Net investment income (loss) | | | | 0.32 | % | | | 0.26 | % | | | (0.09 | )% | | | 0.08 | % | | | 1.46 | % |
| |
| SUPPLEMENTAL DATA: | | | | | | | | | | | | | | | | | | | | | |
Net Assets Applicable to Common Stockholders, End of Period
(in thousands) | | | $ | 363,701 | | | $ | 312,407 | | | $ | 387,488 | | | $ | 433,121 | | | $ | 318,545 | |
| |
| Portfolio Turnover Rate | | | | 26 | % | | | 39 | % | | | 41 | % | | | 29 | % | | | 28 | % |
| |
| REVOLVING CREDIT AGREEMENT: | | | | | | | | | | | | | | | | | | | | | |
| Asset coverage | | | | 908 | % | | | 794 | % | | | 746 | % | | | 1062 | % | | | 808 | % |
| |
| Asset coverage per $1,000 | | | $ | 9,082 | | | $ | 7,942 | | | $ | 7,458 | | | $ | 10,625 | | | $ | 8,079 | |
| |
| 1 | The Market Value Total Return is calculated assuming a purchase of Common Stock on the opening of the first business day and a sale on the closing of the last business day of each period. Dividends and distributions are assumed for the purposes of this calculation to be reinvested at prices obtained under the Fund’s Distribution Reinvestment and Cash Purchase Plan. Net Asset Value Total Return is calculated on the same basis, except that the Fund’s net asset value is used on the purchase and sale dates instead of market value. |
| 2 | The investment advisory fee is calculated based on average net assets over a rolling 36-month basis, while the above ratios of investment advisory fee expenses are based on the average net assets applicable to Common Stockholders over a 12-month basis. |
| 3 | Expense ratio based on total average net assets including liquidation value of Preferred Stock was 1.10% for the year ended December 31, 2012. |
| 38 | 2016 Annual Report to Stockholders | | THE ACCOMPANYING NOTES ARE AN INTEGRAL PART OF THESE FINANCIAL STATEMENTS |
Royce Micro-Cap Trust
Notes to Financial Statements
| Summary of Significant Accounting Policies |
Royce Micro-Cap Trust, Inc. (the “Fund”), is a diversified closed-end investment company that was incorporated under the laws of the State of Maryland on September 9, 1993. The Fund commenced operations on December 14, 1993. |
The preparation of financial statements in conformity with accounting principles generally accepted in the United States of America requires management to make estimates and assumptions that affect the reported amounts of assets and liabilities and the disclosure of contingent assets and liabilities at the date of the financial statements and the reported amounts of income and expenses during the reporting period. Actual results could differ from those estimates. |
The Fund is an investment company and accordingly follows the investment company accounting and reporting guidance of the Financial Accounting Standards Board (FASB) Accounting Standard Codification Topic 946 “Financial Services-Investment Companies”. |
| |
| VALUATION OF INVESTMENTS: |
Securities are valued as of the close of trading on the New York Stock Exchange (NYSE) (generally 4:00 p.m. Eastern time) on the valuation date. Securities that trade on an exchange, and securities traded on Nasdaq’s Electronic Bulletin Board, are valued at their last reported sales price or Nasdaq official closing price taken from the primary market in which each security trades or, if no sale is reported for such day, at their highest bid price. Other over-the-counter securities for which market quotations are readily available are valued at their highest bid price, except in the case of some bonds and other fixed income securities which may be valued by reference to other securities with comparable ratings, interest rates and maturities, using established independent pricing services. The Fund values its non-U.S. dollar denominated securities in U.S. dollars daily at the prevailing foreign currency exchange rates as quoted by a major bank. Securities for which market quotations are not readily available are valued at their fair value in accordance with the provisions of the 1940 Act, under procedures approved by the Fund’s Board of Directors, and are reported as Level 3 securities. As a general principle, the fair value of a security is the amount which the Fund might reasonably expect to receive for the security upon its current sale. However, in light of the judgment involved in fair valuations, there can be no assurance that a fair value assigned to a particular security will be the amount which the Fund might be able to receive upon its current sale. In addition, if, between the time trading ends on a particular security and the close of the customary trading session on the NYSE, events occur that are significant and may make the closing price unreliable, the Fund may fair value the security. The Fund uses an independent pricing service to provide fair value estimates for relevant non-U.S. equity securities on days when the U.S. market volatility exceeds a certain threshold. This pricing service uses proprietary correlations it has developed between the movement of prices of non-U.S. equity securities and indices of U.S.-traded securities, futures contracts and other indications to estimate the fair value of relevant non-U.S. securities. When fair value pricing is employed, the prices of securities used by the Fund may differ from quoted or published prices for the same security. Investments in money market funds are valued at net asset value per share. |
Various inputs are used in determining the value of the Fund’s investments, as noted above. These inputs are summarized in the three broad levels below: |
| | | Level 1 | – | quoted prices in active markets for identical securities. |
| | | Level 2 | – | other significant observable inputs (including quoted prices for similar securities, foreign securities that may be fair valued and repurchase agreements). The table below includes all Level 2 securities. Level 2 securities with values based on quoted prices for similar securities are noted in the Schedule of Investments. |
| | | Level 3 | – | significant unobservable inputs (including last trade price before trading was suspended, or at a discount thereto for lack of marketability or otherwise, market price information regarding other securities, information received from the company and/or published documents, including SEC filings and financial statements, or other publicly available information). |
The inputs or methodology used for valuing securities are not necessarily an indication of the risk associated with investing in those securities. |
The following is a summary of the inputs used to value the Fund’s investments as of December 31, 2016. For a detailed breakout of common stocks by sector classification, please refer to the Schedule of Investments. |
| | | | | | | | | | | | | | | | | |
| | | LEVEL 1 | | LEVEL 2 | | LEVEL 3 | | TOTAL | |
| |
| Common Stocks | | | $339,476,282 | | | | $24,253,914 | | | | $241,862 | | | | $363,972,058 | |
| |
| Preferred Stocks | | | – | | | | 1,089,816 | | | | – | | | | 1,089,816 | |
| |
| Cash Equivalents | | | – | | | | 43,472,000 | | | | – | | | | 43,472,000 | |
| |
Certain securities have transferred in and out of Level 1 and Level 2 measurements during the reporting period. The Fund recognizes transfers between levels as of the end of the reporting period. For the year ended December 31, 2016, securities valued at $594,776 were transferred from Level 1 to Level 2 within the fair value hierarchy. |
2016 Annual Report to Stockholders | 39
Royce Micro-Cap Trust
Notes to Financial Statements (continued)
VALUATION OF INVESTMENTS (continued):
| Level 3 Reconciliation: |
| | | | | | | | | | |
| | | | | | | REALIZED AND UNREALIZED | | | |
| | | | BALANCE AS OF 12/31/15 | | | GAIN (LOSS)1 | | | BALANCE AS OF 12/31/16 |
| |
| Common Stocks | | | $225,738 | | | $16,124 | | | $241,862 |
| |
| 1 | The net change in unrealized appreciation (depreciation) is included in the accompanying Statement of Operations. Change in unrealized appreciation (depreciation) includes net unrealized appreciation (depreciation) resulting from changes in investment values during the reporting period and the reversal of previously recorded unrealized appreciation (depreciation) when gains or losses are realized. Net realized gain (loss) from investments and foreign currency transactions is included in the accompanying Statement of Operations. |
The following table summarizes the valuation techniques used and unobservable inputs approved by the Valuation Committee to determine the fair value of certain, material Level 3 investments. The table does not include Level 3 investments with values derived utilizing prices from prior transactions or third party pricing information with adjustments (e.g. broker quotes, pricing services, net asset values).
| | | | FAIR VALUE AT | | | | | | | | | | | | IMPACT TO VALUATION FROM |
| | | | 12/31/16 | | | VALUATION TECHNIQUE(S) | | | UNOBSERVABLE INPUT(S) | | | RANGE AVERAGE | | | AN INCREASE IN INPUT1 |
| |
| Common Stocks | | | $241,862 | | | Discounted Present Value
Balance Sheet Analysis | | | Liquidity Discount | | | 30%-40% | | | Decrease |
| |
| 1 | This column represents the directional change in the fair value of the Level 3 investments that would result in an increase from the corresponding unobservable input. A decrease to the unobservable input would have the opposite effect. Significant increases and decreases in these unobservable inputs in isolation could result in significantly higher or lower fair value measurements. |
| REPURCHASE AGREEMENTS: |
The Fund may enter into repurchase agreements with institutions that the Fund’s investment adviser has determined are creditworthy. The Fund restricts repurchase agreements to maturities of no more than seven days. Securities pledged as collateral for repurchase agreements, which are held until maturity of the repurchase agreements, are marked-to-market daily and maintained at a value at least equal to the principal amount of the repurchase agreement (including accrued interest). Repurchase agreements could involve certain risks in the event of default or insolvency of the counter-party, including possible delays or restrictions upon the ability of the Fund to dispose of its underlying securities. The remaining contractual maturity of the repurchase agreement held by the Fund at December 31, 2016 is overnight and continuous. |
| | FOREIGN CURRENCY: |
Net realized foreign exchange gains or losses arise from sales and maturities of short-term securities, sales of foreign currencies, expiration of currency forward contracts, currency gains or losses realized between the trade and settlement dates on securities transactions, and the difference between the amounts of dividends, interest, and foreign withholding taxes recorded on the Fund’s books and the U.S. dollar equivalent of the amounts actually received or paid. Net unrealized foreign exchange gains and losses arise from changes in the value of assets and liabilities, including investments in securities at the end of the reporting period, as a result of changes in foreign currency exchange rates. |
| | TAXES: |
As a qualified regulated investment company under Subchapter M of the Internal Revenue Code, the Fund is not subject to income taxes to the extent that it distributes substantially all of its taxable income for its fiscal year. The Schedule of Investments includes information regarding income taxes under the caption “Tax Information”. |
| | DISTRIBUTIONS: |
The Fund pays quarterly distributions on the Fund’s Common Stock at the annual rate of 7% of the rolling average of the prior four calendar quarter-end NAVs of the Fund’s Common Stock, with the fourth quarter distribution being the greater of 1.75% of the rolling average or the distribution required by IRS regulations. Prior to November 15, 2012, distributions to Preferred Stockholders were accrued daily and paid quarterly. Distributions to Common Stockholders are recorded on ex-dividend date. Distributable capital gains and/or net investment income were first allocated to Preferred Stockholder distributions, with any excess allocable to Common Stockholders. If capital gains and/or net investment income were allocated to both Preferred and Common Stockholders, the tax character of such allocations was proportional. To the extent that distributions are not paid from long-term capital gains, net investment income or net short-term capital gains, they will represent a return of capital. Distributions are determined in accordance with income tax regulations that may differ from accounting principles generally accepted in the United States of America. Permanent book and tax differences relating to stockholder distributions will result in reclassifications within the capital accounts. Undistributed net investment income may include temporary book and tax basis differences, which will reverse in a subsequent period. Any taxable income or gain remaining undistributed at fiscal year end is distributed in the following year. |
40 | 2016 Annual Report to Stockholders
Royce Micro-Cap Trust
Notes to Financial Statements (continued)
| INVESTMENT TRANSACTIONS AND RELATED INVESTMENT INCOME: |
Investment transactions are accounted for on the trade date. Dividend income is recorded on the ex-dividend date. Non-cash dividend income is recorded at the fair market value of the securities received. Interest income is recorded on an accrual basis. Premiums and discounts on debt securities are amortized using the effective yield-to-maturity method. Realized gains and losses from investment transactions are determined on the basis of identified cost for book and tax purposes. |
| |
| EXPENSES: |
The Fund incurs direct and indirect expenses. Expenses directly attributable to the Fund are charged to the Fund’s operations, while expenses applicable to more than one of the Royce Funds are allocated equitably. Certain personnel, occupancy costs and other administrative expenses related to the Funds are allocated by Royce & Associates (“Royce”) under an administration agreement and are included in administrative and office facilities and professional fees. The Fund has adopted a deferred fee agreement that allows the Directors to defer the receipt of all or a portion of directors’ fees otherwise payable. The deferred fees are invested in certain Royce Funds until distributed in accordance with the agreement. |
| |
| COMPENSATING BALANCE CREDITS: |
The Fund has an arrangement with its custodian bank, whereby a portion of the custodian’s fee is paid indirectly by credits earned on the Fund’s cash on deposit with the bank. This deposit arrangement is an alternative to purchasing overnight investments. Conversely, the Fund pays interest to the custodian on any cash overdrafts, to the extent they are not offset by credits earned on positive cash balances. |
| |
| Capital Stock: |
The Fund issued 1,405,544 and 2,189,322 shares of Common Stock as reinvestment of distributions for the years ended December 31, 2016 and December 31, 2015, respectively. |
| |
| Borrowings: |
The Fund is party to a revolving credit agreement (the credit agreement) with BNP Paribas Prime Brokerage International, Limited (BNPPI). The Fund pays a commitment fee of 0.50% per annum on the unused portion of the credit agreement. The credit agreement has a 360-day rolling term that resets daily; however, if the Fund exceeds certain net asset value triggers, the credit agreement may convert to a 60-day rolling term that resets daily. The Fund is required to pledge portfolio securities as collateral in an amount up to two times the loan balance outstanding or as otherwise required by applicable regulatory standards and has granted a security interest in the securities pledged to, and in favor of, BNPPI as security for the loan balance outstanding. If the Fund fails to meet certain requirements, or maintain other financial covenants required under the credit agreement, the Fund may be required to repay immediately, in part or in full, the loan balance outstanding under the credit agreement which may necessitate the sale of portfolio securities at potentially inopportune times. BNPPI may terminate the credit agreement upon certain ratings downgrades of its corporate parent, which would result in the Fund’s entire loan balance becoming immediately due and payable. The occurrence of such ratings downgrades may necessitate the sale of portfolio securities at potentially inopportune times. The credit agreement also permits, subject to certain conditions, BNPPI to rehypothecate portfolio securities pledged by the Fund up to the amount of the loan balance outstanding. The Fund continues to receive payments in lieu of dividends and interest on rehypothecated securities. The Fund also has the right under the credit agreement to recall the rehypothecated securities from BNPPI on demand. If BNPPI fails to deliver the recalled security in a timely manner, the Fund is compensated by BNPPI for any fees or losses related to the failed delivery or, in the event a recalled security is not returned by BNPPI, the Fund, upon notice to BNPPI, may reduce the loan balance outstanding by the value of the recalled security failed to be returned. The Fund receives a portion of the fees earned by BNPPI in connection with the rehypothecation of portfolio securities. |
As of December 31, 2016, the Fund has outstanding borrowings of $45,000,000. During the year ended December 31, 2016, the Fund borrowed an average daily balance of $45,000,000 at a weighted average borrowing cost of 1.69%. The maximum amount outstanding during the year ended December 31, 2016 was $45,000,000. As of December 31, 2016, the aggregate value of rehypothecated securities was $39,021,909. During the year ended December 31, 2016, the Fund earned $52,529 in fees from rehypothecated securities. |
| |
| Investment Advisory Agreement: |
As compensation for its services under the Investment Advisory Agreement, Royce receives a fee comprised of a Basic Fee (“Basic Fee”) and an adjustment to the Basic Fee based on the investment performance of the Fund in relation to the investment record of the Russell 2000. |
2016 Annual Report to Stockholders | 41
Royce Micro-Cap Trust
Notes to Financial Statements (continued)
| Investment Advisory Agreement (continued): |
The Basic Fee is a monthly fee equal to 1/12 of 1% (1% on an annualized basis) of the average of the Fund’s month-end net assets applicable to Common Stockholders, plus the liquidation value of outstanding Preferred Stock through October 31, 2015, for the rolling 36-month period ending with such month (the “performance period”). The Basic Fee for each month is increased or decreased at the rate of 1/12 of .05% for each percentage point that the investment performance of the Fund exceeds, or is exceeded by, the percentage change in the investment record of the Russell 2000 for the performance period by more than two percentage points. The performance period for each such month is a rolling 36-month period ending with such month. The maximum increase or decrease in the Basic Fee for any month may not exceed 1/12 of .5%. Accordingly, for each month, the maximum monthly fee rate as adjusted for performance is 1/12 of 1.5% and is payable if the investment performance of the Fund exceeds the percentage change in the investment record of the Russell 2000 by 12 or more percentage points for the performance period, and the minimum monthly fee rate as adjusted for performance is 1/12 of .5% and is payable if the percentage change in the investment record of the Russell 2000 exceeds the investment performance of the Fund by 12 or more percentage points for the performance period. |
For the twelve rolling 36-month periods in 2016, the Fund’s investment performance ranged from 2% to 14% below the investment performance of the Russell 2000. Accordingly, the net investment advisory fee consisted of a Basic Fee of $3,761,473 and a net downward adjustment of $950,264 for the performance of the Fund relative to that of the Russell 2000. For the year ended December 31, 2016, the Fund expensed Royce investment advisory fees totaling $2,811,209. |
| |
| Purchases and Sales of Investment Securities: |
For the year ended December 31, 2016, the costs of purchases and proceeds from sales of investment securities, other than short-term securities, amounted to $87,234,808 and $125,680,183, respectively. |
Cross trades were executed by the Fund pursuant to Rule 17a-7 under the 1940 Act. Cross trading is the buying or selling of portfolio securities between funds to which Royce serves as investment adviser. At its regularly scheduled quarterly meetings, the Board reviews such transactions as of the most recent calendar quarter for compliance with the requirements and restrictions set forth by Rule 17a-7. Cross trades for the year ended December 31, 2016, were as follows: |
| COST OF PURCHASES | | | PROCEEDS FROM SALES | | | REALIZED GAIN (LOSS) |
| |
| $6,527,654 | | | $1,716,500 | | | $683,950 |
| |
| Tax Information: |
Distributions during the years ended December 31, 2016 and 2015, were characterized as follows for tax purposes: |
| ORDINARY INCOME | | | | LONG-TERM CAPITAL GAINS |
| |
| 2016 | | | 2015 | | | | 2016 | | | 2015 |
| |
| $5,291,974 | | | $7,501,533 | | | | $18,332,912 | | | $36,418,446 |
| |
The tax basis components of distributable earnings at December 31, 2016, were as follows:
| | | | | | | | | | QUALIFIED LATE YEAR | | | |
| UNDISTRIBUTED | | | UNDISTRIBUTED LONG-TERM | | | NET UNREALIZED | | | ORDINARY AND | | | TOTAL |
| ORDINARY | | | CAPITAL GAINS OR | | | APPRECIATION | | | POST-OCTOBER LOSS | | | DISTRIBUTABLE |
| INCOME | | | (CAPITAL LOSS CARRYFORWARD) | | | (DEPRECIATION) 1 | | | DEFERRALS 2 | | | EARNINGS |
| |
| $2,106,421 | | | $981,595 | | | $43,842,633 | | | $(646,532) | | | $46,284,117 |
| |
| 1 | Includes timing differences on foreign currency, recognition of losses on securities sold, investments in publicly traded partnerships and Trusts, investments in Real Estate Investment Trusts and mark-to-market of Passive Foreign Investment Companies. |
| 2 | Under the current tax law, capital losses and qualified late year ordinary losses incurred after October 31 may be deferred and treated as occurring on the first day of the following fiscal year. |
For financial reporting purposes, capital accounts and distributions to stockholders are adjusted to reflect the tax character of permanent book/tax differences. For the year ended December 31, 2016, the Fund recorded the following permanent reclassifications, which relate primarily to current investments in publicly traded partnerships and Trusts, foreign currency transactions, investments in Real Estate Investment Trusts and gains from the sale of Passive Foreign Investment Companies. Results of operations and net assets were not affected by these reclassifications.
| UNDISTRIBUTED NET | | | ACCUMULATED NET | | | |
| INVESTMENT INCOME | | | REALIZED GAIN (LOSS) | | | PAID-IN CAPITAL |
| |
| $62,740 | | | $(62,740) | | | $– |
| |
Management has analyzed the Fund’s tax positions taken on federal income tax returns for all open tax years (2013-2016) and has concluded that as of December 31, 2016, no provision for income tax is required in the Fund’s financial statements.
42 | 2016 Annual Report to Stockholders
Royce Micro-Cap Trust
Report of Independent Registered Public Accounting Firm
To the Board of Directors and the Stockholders of Royce Micro-Cap Trust, Inc.:
In our opinion, the accompanying statement of assets and liabilities, including the schedule of investments, and the related statement of operations, of changes in net assets and of cash flows and the financial highlights present fairly, in all material respects, the financial position of Royce Micro-Cap Trust, Inc. (the “Fund”) as of December 31, 2016, the results of its operations, the changes in its net assets, its cash flows and the financial highlights for each of the periods presented, in conformity with accounting principles generally accepted in the United States of America. These financial statements and financial highlights (hereafter referred to as “financial statements”) are the responsibility of the Fund’s management. Our responsibility is to express an opinion on these financial statements based on our audits. We conducted our audits of these financial statements in accordance with the standards of the Public Company Accounting Oversight Board (United States). Those standards require that we plan and perform the audit to obtain reasonable assurance about whether the financial statements are free of material misstatement. An audit includes examining, on a test basis, evidence supporting the amounts and disclosures in the financial statements, assessing the accounting principles used and significant estimates made by management, and evaluating the overall financial statement presentation. We believe that our audits, which included confirmation of securities as of December 31, 2016 by correspondence with the custodian and brokers, provide a reasonable basis for our opinion. The financial highlights for each of the periods presented in the period ended December 31, 2014 were audited by other independent accountants whose report dated February 23, 2015 expressed an unqualified opinion on those statements.
PricewaterhouseCoopers LLP
Baltimore, Maryland
February 22, 2017
2016 Annual Report to Stockholders | 43
Royce Value Trust
| Common Stocks – 97.8% | | | | | | |
| | | SHARES | | | | VALUE |
| |
| | | | | | | |
| CONSUMER DISCRETIONARY – 10.3% | | | | | | |
| AUTO COMPONENTS - 1.5% | | | | | | |
Cooper Tire & Rubber | | 64,500 | | | $ | 2,505,825 |
Gentex Corporation | | 290,470 | | | | 5,719,354 |
LCI Industries | | 61,616 | | | | 6,639,124 |
Motorcar Parts of America 1 | | 27,100 | | | | 729,532 |
Sebang Global Battery | | 28,500 | | | | 882,095 |
Standard Motor Products | | 50,391 | | | | 2,681,809 |
| | | | | | |
| | | | | | | 19,157,739 |
| | | | | | |
| AUTOMOBILES - 0.8% | | | | | | |
Thor Industries 2 | | 106,410 | | | | 10,646,320 |
| | | | | | |
| DISTRIBUTORS - 1.1% | | | | | | |
Core-Mark Holding Company | | 245,400 | | | | 10,569,378 |
Fenix Parts 1 | | 255,000 | | | | 719,100 |
Weyco Group | | 97,992 | | | | 3,067,150 |
| | | | | | |
| | | | | | | 14,355,628 |
| | | | | | |
| DIVERSIFIED CONSUMER SERVICES - 0.6% | | | | | | |
American Public Education 1 | | 42,400 | | | | 1,040,920 |
Collectors Universe | | 50,000 | | | | 1,061,500 |
DeVry Education Group | | 52,054 | | | | 1,624,085 |
H&R Block | | 8,000 | | | | 183,920 |
Liberty Tax Cl. A | | 141,573 | | | | 1,897,078 |
Lincoln Educational Services 1 | | 430,600 | | | | 826,752 |
Universal Technical Institute | | 504,032 | | | | 1,466,733 |
| | | | | | |
| | | | | | | 8,100,988 |
| | | | | | |
| HOTELS, RESTAURANTS & LEISURE - 0.3% | | | | | | |
Century Casinos 1 | | 222,360 | | | | 1,830,023 |
Lindblad Expeditions Holdings 1 | | 178,300 | | | | 1,684,935 |
| | | | | | |
| | | | | | | 3,514,958 |
| | | | | | |
| HOUSEHOLD DURABLES - 1.6% | | | | | | |
Cavco Industries 1 | | 14,700 | | | | 1,467,795 |
Ethan Allen Interiors | | 231,000 | | | | 8,512,350 |
Flexsteel Industries | | 12,400 | | | | 764,708 |
Mohawk Industries 1, 2 | | 22,400 | | | | 4,472,832 |
Natuzzi ADR 1 | | 2,096,300 | | | | 4,737,638 |
Samson Holding | | 2,500,000 | | | | 180,527 |
Stanley Furniture 3 | | 912,235 | | | | 821,194 |
| | | | | | |
| | | | | | | 20,957,044 |
| | | | | | |
| LEISURE PRODUCTS - 0.7% | | | | | | |
Nautilus 1 | | 488,700 | | | | 9,040,950 |
| | | | | | |
| MEDIA - 0.5% | | | | | | |
E.W. Scripps Company Cl. A 1 | | 67,660 | | | | 1,307,868 |
Global Eagle Entertainment 1 | | 7,700 | | | | 49,742 |
New Media Investment Group | | 60,100 | | | | 960,999 |
Pico Far East Holdings | | 3,484,400 | | | | 1,068,233 |
T4F Entretenimento | | 200,000 | | | | 343,995 |
Technicolor | | 120,000 | | | | 649,107 |
Wiley (John) & Sons Cl. A | | 46,500 | | | | 2,534,250 |
| | | | | | |
| | | | | | | 6,914,194 |
| | | | | | |
| MULTILINE RETAIL - 0.0% | | | | | | |
New World Department Store China 1 | | 1,447,500 | | | | 186,343 |
| | | | | | |
| SPECIALTY RETAIL - 1.9% | | | | | | |
Barnes & Noble | | 26,000 | | | | 289,900 |
Buckle (The) 2 | | 122,415 | | | | 2,791,062 |
Byggmax Group | | 70,000 | | | | 483,381 |
Caleres | | 107,800 | | | | 3,537,996 |
Container Store Group (The) 1 | | 158,200 | | | | 1,004,570 |
Destination Maternity | | 557,967 | | | | 2,884,689 |
Genesco 1 | | 26,155 | | | | 1,624,226 |
Haverty Furniture | | 23,700 | | | | 561,690 |
I.T | | 827,000 | | | | 328,545 |
Monro Muffler Brake | | 161,500 | | | | 9,237,800 |
Oriental Watch Holdings | | 967,900 | | | | 186,513 |
TravelCenters of America LLC 1 | | 62,500 | | | | 443,750 |
West Marine 1 | | 131,100 | | | | 1,372,617 |
| | | | | | |
| | | | | | | 24,746,739 |
| | | | | | |
| TEXTILES, APPAREL & LUXURY GOODS - 1.3% | | | | | | |
Crown Crafts | | 94,441 | | | | 731,918 |
Culp | | 29,400 | | | | 1,092,210 |
Deckers Outdoor 1 | | 20,820 | | | | 1,153,220 |
J.G. Boswell Company 4 | | 3,940 | | | | 2,411,280 |
Movado Group | | 74,061 | | | | 2,129,254 |
Wolverine World Wide | | 360,200 | | | | 7,906,390 |
YGM Trading | | 1,082,600 | | | | 1,021,814 |
| | | | | | |
| | | | | | | 16,446,086 |
| |
| Total (Cost $114,690,819) | | | | | | 134,066,989 |
| |
| | | | | | | |
| CONSUMER STAPLES – 2.2% | | | | | | |
| BEVERAGES - 0.2% | | | | | | |
Compania Cervecerias Unidas ADR | | 134,000 | | | | 2,811,320 |
| | | | | | |
| FOOD PRODUCTS - 1.9% | | | | | | |
Cal-Maine Foods | | 56,016 | | | | 2,474,507 |
Farmer Bros. 1 | | 52,300 | | | | 1,919,410 |
Industrias Bachoco ADR | | 59,095 | | | | 2,896,837 |
John B. Sanfilippo & Son | | 17,200 | | | | 1,210,708 |
Sanderson Farms | | 15,400 | | | | 1,451,296 |
Seneca Foods Cl. A 1 | | 152,325 | | | | 6,100,616 |
Seneca Foods Cl. B 1 | | 13,840 | | | | 581,280 |
SunOpta 1 | | 187,459 | | | | 1,321,586 |
Tootsie Roll Industries 2 | | 135,847 | | | | 5,399,918 |
Waterloo Investment Holdings 1, 5 | | 2,973,544 | | | | 892,063 |
| | | | | | |
| | | | | | | 24,248,221 |
| | | | | | |
| PERSONAL PRODUCTS - 0.1% | | | | | | |
Inter Parfums | | 43,530 | | | | 1,425,608 |
| |
| Total (Cost $21,361,098) | | | | | | 28,485,149 |
| |
| | | | | | | |
| ENERGY – 5.2% | | | | | | |
| ENERGY EQUIPMENT & SERVICES - 4.3% | | | | | | |
CARBO Ceramics 1, 2 | | 48,000 | | | | 502,080 |
Diamond Offshore Drilling 1 | | 189,000 | | | | 3,345,300 |
Era Group 1 | | 559,771 | | | | 9,499,314 |
Forum Energy Technologies 1 | | 129,654 | | | | 2,852,388 |
Frank’s International | | 108,600 | | | | 1,336,866 |
Helmerich & Payne | | 99,930 | | | | 7,734,582 |
ION Geophysical 1 | | 71,880 | | | | 431,280 |
Oil States International 1 | | 46,833 | | | | 1,826,487 |
Pason Systems | | 532,180 | | | | 7,784,616 |
SEACOR Holdings 1 | | 150,469 | | | | 10,725,430 |
TGS-NOPEC Geophysical | | 309,170 | | | | 6,856,643 |
Trican Well Service 1 | | 897,300 | | | | 3,074,204 |
| | | | | | |
| | | | | | | 55,969,190 |
| | | | | | |
| OIL, GAS & CONSUMABLE FUELS - 0.9% | | | | | | |
Dorchester Minerals L.P. | | 177,172 | | | | 3,109,369 |
Dorian LPG 1 | | 184,034 | | | | 1,510,919 |
Hargreaves Services | | 57,683 | | | | 193,339 |
San Juan Basin Royalty Trust | | 320,352 | | | | 2,120,730 |
World Fuel Services | | 66,600 | | | | 3,057,606 |
| 44 | 2016 Annual Report to Stockholders | | THE ACCOMPANYING NOTES ARE AN INTEGRAL PART OF THESE FINANCIAL STATEMENTS |
| |
| Schedule of Investments (continued) |
| | | SHARES | | | | VALUE |
| |
| | | | | | | |
| ENERGY (continued) | | | | | | |
| OIL, GAS & CONSUMABLE FUELS (continued) | | | | | | |
WPX Energy 1 | | 110,000 | | | $ | 1,602,700 |
| | | | | | |
| | | | | | | 11,594,663 |
| |
| Total (Cost $66,444,110) | | | | | | 67,563,853 |
| |
| | | | | | | |
| FINANCIALS – 14.9% | | | | | | |
| BANKS - 2.3% | | | | | | |
Bank of N.T. Butterfield & Son | | 178,416 | | | | 5,609,399 |
Blue Hills Bancorp | | 82,680 | | | | 1,550,250 |
Canadian Western Bank | | 279,500 | | | | 6,315,890 |
Farmers & Merchants Bank of Long Beach 4 | | 1,080 | | | | 7,344,000 |
Fauquier Bankshares | | 160,800 | | | | 2,596,920 |
First Citizens BancShares Cl. A | | 17,026 | | | | 6,044,230 |
| | | | | | |
| | | | | | | 29,460,689 |
| | | | | | |
| CAPITAL MARKETS - 7.9% | | | | | | |
Ares Management L.P. | | 375,900 | | | | 7,217,280 |
Artisan Partners Asset Management Cl. A | | 246,600 | | | | 7,336,350 |
ASA Gold and Precious Metals | | 199,821 | | | | 2,206,024 |
Ashmore Group | | 1,354,000 | | | | 4,724,550 |
Associated Capital Group Cl. A | | 20,200 | | | | 663,570 |
Citadel Capital 1 | | 8,549,921 | | | | 476,306 |
Cowen Group 1 | | 62,706 | | | | 971,943 |
Dundee Corporation Cl. A 1 | | 1,079,900 | | | | 4,785,614 |
Edmond de Rothschild (Suisse) | | 153 | | | | 2,102,675 |
Federated Investors Cl. B | | 162,840 | | | | 4,605,115 |
Jupiter Fund Management | | 230,000 | | | | 1,253,319 |
KKR & Co. L.P. | | 24,100 | | | | 370,899 |
Lazard Cl. A | | 117,335 | | | | 4,821,295 |
Manning & Napier Cl. A | | 395,692 | | | | 2,987,475 |
MarketAxess Holdings | | 70,800 | | | | 10,401,936 |
Medley Management Cl. A | | 109,500 | | | | 1,084,050 |
Morningstar | | 84,600 | | | | 6,223,176 |
mutares | | 39,266 | | | | 471,775 |
MVC Capital | | 324,200 | | | | 2,781,636 |
Oaktree Capital Group LLC Cl. A | | 101,100 | | | | 3,791,250 |
Rothschild & Co | | 216,893 | | | | 5,865,566 |
SEI Investments | | 185,600 | | | | 9,161,216 |
Sprott | | 1,590,000 | | | | 2,972,405 |
TMX Group | | 46,600 | | | | 2,482,279 |
U.S. Global Investors Cl. A | | 520,551 | | | | 707,949 |
Value Partners Group | | 5,453,000 | | | | 4,337,809 |
Virtus Investment Partners | | 32,330 | | | | 3,816,557 |
Westwood Holdings Group | | 49,073 | | | | 2,943,889 |
ZAIS Group Holdings Cl. A 1, 2 | | 492,300 | | | | 723,681 |
| | | | | | |
| | | | | | | 102,287,589 |
| | | | | | |
| CONSUMER FINANCE - 0.1% | | | | | | |
Bajaj Finance | | 55,000 | | | | 683,431 |
| | | | | | |
| DIVERSIFIED FINANCIAL SERVICES - 0.5% | | | | | | |
First Pacific | | 1,020,000 | | | | 712,419 |
PICO Holdings 1 | | 409,400 | | | | 6,202,410 |
| | | | | | |
| | | | | | | 6,914,829 |
| | | | | | |
| INSURANCE - 2.7% | | | | | | |
Alleghany Corporation 1 | | 2,109 | | | | 1,282,525 |
Atlas Financial Holdings 1 | | 30,000 | | | | 541,500 |
eHealth 1 | | 65,000 | | | | 692,250 |
E-L Financial | | 21,500 | | | | 11,689,569 |
Erie Indemnity Cl. A | | 25,000 | | | | 2,811,250 |
Independence Holding Company | | 314,523 | | | | 6,148,925 |
MBIA 1 | | 942,400 | | | | 10,083,680 |
ProAssurance Corporation | | 17,139 | | | | 963,212 |
WMIH 1 | | 77,742 | | | | 120,500 |
| | | | | | |
| | | | | | | 34,333,411 |
| | | | | | |
| INVESTMENT COMPANIES - 0.2% | | | | | | |
RIT Capital Partners | | 130,500 | | | | 3,025,860 |
| | | | | | |
| THRIFTS & MORTGAGE FINANCE - 1.2% | | | | | | |
Genworth MI Canada | | 258,195 | | | | 6,472,903 |
Timberland Bancorp 3 | | 444,200 | | | | 9,177,172 |
Vestin Realty Mortgage II 1 | | 53,557 | | | | 125,324 |
| | | | | | |
| | | | | | | 15,775,399 |
| |
| Total (Cost $174,396,958) | | | | | | 192,481,208 |
| |
| | | | | | | |
| HEALTH CARE – 4.2% | | | | | | |
| BIOTECHNOLOGY - 0.7% | | | | | | |
ARIAD Pharmaceuticals 1, 2 | | 29,700 | | | | 369,468 |
Keryx Biopharmaceuticals 1 | | 139,000 | | | | 814,540 |
Sangamo BioSciences 1 | | 469,315 | | | | 1,431,411 |
Zealand Pharma 1 | | 464,707 | | | | 6,996,930 |
| | | | | | |
| | | | | | | 9,612,349 |
| | | | | | |
| HEALTH CARE EQUIPMENT & SUPPLIES - 1.3% | | | | | | |
Analogic Corporation | | 53,735 | | | | 4,457,318 |
Atrion Corporation 2,6 | | 15,750 | | | | 7,988,400 |
Cerus Corporation 1 | | 108,000 | | | | 469,800 |
Invacare Corporation | | 38,900 | | | | 507,645 |
Masimo Corporation 1 | | 50,000 | | | | 3,370,000 |
Neogen Corporation 1 | | 6,800 | | | | 448,800 |
| | | | | | |
| | | | | | | 17,241,963 |
| | | | | | |
| HEALTH CARE PROVIDERS & SERVICES - 0.7% | | | | | | |
Aceto Corporation | | 76,655 | | | | 1,684,111 |
AMN Healthcare Services 1 | | 15,900 | | | | 611,355 |
Community Health Systems 1 | | 790,000 | | | | 4,416,100 |
Landauer | | 50,000 | | | | 2,405,000 |
| | | | | | |
| | | | | | | 9,116,566 |
| | | | | | |
| HEALTH CARE TECHNOLOGY - 0.2% | | | | | | |
Cegedim 1 | | 10,000 | | | | 276,057 |
Medidata Solutions 1 | | 40,000 | | | | 1,986,800 |
| | | | | | |
| | | | | | | 2,262,857 |
| | | | | | |
| LIFE SCIENCES TOOLS & SERVICES - 1.2% | | | | | | |
Bio-Rad Laboratories Cl. A 1 | | 33,498 | | | | 6,106,015 |
Bio-Techne | | 50,343 | | | | 5,176,771 |
PAREXEL International 1 | | 56,600 | | | | 3,719,752 |
| | | | | | |
| | | | | | | 15,002,538 |
| | | | | | |
| PHARMACEUTICALS - 0.1% | | | | | | |
Theravance Biopharma 1 | | 37,291 | | | | 1,188,837 |
| |
| Total (Cost $38,859,309) | | | | | | 54,425,110 |
| |
| | | | | | | |
| INDUSTRIALS – 29.2% | | | | | | |
| AEROSPACE & DEFENSE - 2.7% | | | | | | |
†Austal | | 688,670 | | | | 863,930 |
Ducommun 1 | | 117,200 | | | | 2,995,632 |
HEICO Corporation | | 140,338 | | | | 10,827,077 |
HEICO Corporation Cl. A | | 80,808 | | | | 5,486,863 |
Magellan Aerospace | | 182,779 | | | | 2,447,672 |
Mercury Systems 1 | | 25,400 | | | | 767,588 |
Teledyne Technologies 1 | | 20,600 | | | | 2,533,800 |
Wesco Aircraft Holdings 1 | | 588,000 | | | | 8,790,600 |
| | | | | | |
| | | | | | | 34,713,162 |
| | | | | | |
| THE ACCOMPANYING NOTES ARE AN INTEGRAL PART OF THESE FINANCIAL STATEMENTS | | 2016 Annual Report to Stockholders | 45 |
Royce Value Trust
| |
| Schedule of Investments (continued) |
| | | SHARES | | | | VALUE |
| |
| | | | | | | |
| INDUSTRIALS (continued) | | | | | | |
| AIR FREIGHT & LOGISTICS - 1.8% | | | | | | |
Expeditors International of Washington | | 158,900 | | | $ | 8,415,344 |
Forward Air | | 179,750 | | | | 8,516,555 |
Hub Group Cl. A 1, 2, 6 | | 149,400 | | | | 6,536,250 |
| | | | | | |
| | | | | | | 23,468,149 |
| | | | | | |
| BUILDING PRODUCTS - 0.5% | | | | | | |
Apogee Enterprises | | 68,900 | | | | 3,690,284 |
Burnham Holdings Cl. B 4 | | 36,000 | | | | 567,000 |
Insteel Industries | | 55,780 | | | | 1,987,999 |
Patrick Industries 1 | | 9,850 | | | | 751,555 |
| | | | | | |
| | | | | | | 6,996,838 |
| | | | | | |
| COMMERCIAL SERVICES & SUPPLIES - 2.4% | | | | | | |
Atento 1 | | 234,500 | | | | 1,782,200 |
CECO Environmental | | 99,028 | | | | 1,381,440 |
CompX International Cl. A | | 211,100 | | | | 3,398,710 |
Copart 1 | | 219,960 | | | | 12,187,984 |
Heritage-Crystal Clean 1 | | 152,527 | | | | 2,394,674 |
Kimball International Cl. B | | 286,180 | | | | 5,025,321 |
Ritchie Bros. Auctioneers | | 17,510 | | | | 595,340 |
Steelcase Cl. A | | 219,560 | | | | 3,930,124 |
UniFirst Corporation | | 6,470 | | | | 929,415 |
| | | | | | |
| | | | | | | 31,625,208 |
| | | | | | |
| CONSTRUCTION & ENGINEERING - 3.5% | | | | | | |
EMCOR Group 2, 6 | | 121,300 | | | | 8,583,188 |
IES Holdings 1 | | 539,482 | | | | 10,331,080 |
Jacobs Engineering Group 1 | | 164,900 | | | | 9,399,300 |
KBR | | 325,300 | | | | 5,429,257 |
Northwest Pipe 1 | | 20,000 | | | | 344,400 |
NV5 Global 1 | | 23,500 | | | | 784,900 |
Sterling Construction 1 | | 122,300 | | | | 1,034,658 |
Valmont Industries 2 | | 62,845 | | | | 8,854,861 |
| | | | | | |
| | | | | | | 44,761,644 |
| | | | | | |
| ELECTRICAL EQUIPMENT - 0.9% | | | | | | |
Global Power Equipment Group 1, 4 | | 631,820 | | | | 2,988,508 |
Powell Industries | | 94,500 | | | | 3,685,500 |
Preformed Line Products | | 91,600 | | | | 5,323,792 |
| | | | | | |
| | | | | | | 11,997,800 |
| | | | | | |
| INDUSTRIAL CONGLOMERATES - 0.5% | | | | | | |
A. Soriano | | 2,791,000 | | | | 336,770 |
Raven Industries | | 251,725 | | | | 6,343,470 |
| | | | | | |
| | | | | | | 6,680,240 |
| | | | | | |
| MACHINERY - 10.6% | | | | | | |
Chen Hsong Holdings | | 1,159,000 | | | | 289,620 |
China Metal International Holdings | | 554,524 | | | | 174,797 |
CIRCOR International | | 85,384 | | | | 5,539,714 |
CLARCOR | | 74,000 | | | | 6,102,780 |
Colfax Corporation 1 | | 77,242 | | | | 2,775,305 |
Columbus McKinnon | | 20,975 | | | | 567,164 |
Deutz | | 115,000 | | | | 646,157 |
Donaldson Company | | 193,559 | | | | 8,144,963 |
Exco Technologies | | 216,600 | | | | 1,739,059 |
Federal Signal | | 56,280 | | | | 878,531 |
Franklin Electric | | 104,600 | | | | 4,068,940 |
Graco | | 89,276 | | | | 7,417,943 |
Greenbrier Companies (The) | | 47,800 | | | | 1,986,090 |
Hurco Companies | | 25,952 | | | | 859,011 |
Hyster-Yale Materials Handling Cl. A | | 10,000 | | | | 637,700 |
IDEX Corporation | | 67,400 | | | | 6,070,044 |
John Bean Technologies | | 70,326 | | | | 6,044,520 |
Kadant | | 42,200 | | | | 2,582,640 |
Kennametal | | 160,100 | | | | 5,004,726 |
Lincoln Electric Holdings | | 61,360 | | | | 4,704,471 |
Lindsay Corporation 2 | | 80,000 | | | | 5,968,800 |
Luxfer Holdings ADR | | 28,100 | | | | 306,009 |
Lydall 1 | | 30,580 | | | | 1,891,373 |
NN | | 308,700 | | | | 5,880,735 |
Nordson Corporation | | 24,296 | | | | 2,722,367 |
RBC Bearings 1 | | 125,000 | | | | 11,601,250 |
Sarine Technologies | | 327,500 | | | | 406,813 |
Sun Hydraulics | | 286,318 | | | | 11,444,131 |
Tennant Company | | 111,900 | | | | 7,967,280 |
Watts Water Technologies Cl. A | | 61,000 | | | | 3,977,200 |
Westinghouse Air Brake Technologies | | 91,070 | | | | 7,560,631 |
Westport Fuel Systems 1 | | 327,100 | | | | 369,623 |
Woodward | | 154,600 | | | | 10,675,130 |
| | | | | | |
| | | | | | | 137,005,517 |
| | | | | | |
| MARINE - 1.4% | | | | | | |
Clarkson | | 291,000 | | | | 7,792,316 |
Kirby Corporation 1 | | 144,500 | | | | 9,609,250 |
| | | | | | |
| | | | | | | 17,401,566 |
| | | | | | |
| PROFESSIONAL SERVICES - 2.7% | | | | | | |
Advisory Board (The) 1 | | 190,277 | | | | 6,326,710 |
Franklin Covey 1 | | 40,800 | | | | 822,120 |
Heidrick & Struggles International | | 66,480 | | | | 1,605,492 |
ICF International 1 | | 20,836 | | | | 1,150,147 |
ManpowerGroup | | 112,858 | | | | 10,029,691 |
On Assignment 1, 2, 6 | | 179,295 | | | | 7,917,667 |
Robert Half International | | 75,532 | | | | 3,684,451 |
TrueBlue 1 | | 128,920 | | | | 3,177,878 |
Volt Information Sciences 1 | | 65,000 | | | | 445,250 |
| | | | | | |
| | | | | | | 35,159,406 |
| | | | | | |
| ROAD & RAIL - 1.7% | | | | | | |
Genesee & Wyoming Cl. A 1 | | 15,000 | | | | 1,041,150 |
Knight Transportation | | 122,400 | | | | 4,045,320 |
Landstar System | | 123,260 | | | | 10,514,078 |
Patriot Transportation Holding 1 | | 63,900 | | | | 1,488,870 |
Saia 1, 2 | | 64,130 | | | | 2,831,339 |
Trancom | | 4,932 | | | | 241,015 |
Universal Logistics Holdings | | 78,916 | | | | 1,290,277 |
| | | | | | |
| | | | | | | 21,452,049 |
| | | | | | |
| TRADING COMPANIES & DISTRIBUTORS - 0.5% | | | | | | |
Central Steel & Wire 4 | | 4,862 | | | | 2,138,064 |
Houston Wire & Cable | | 509,200 | | | | 3,309,800 |
MSC Industrial Direct Cl. A 2 | | 11,963 | | | | 1,105,262 |
| | | | | | |
| | | | | | | 6,553,126 |
| | | | | | |
| TRANSPORTATION INFRASTRUCTURE - 0.0% | | | | | | |
Hopewell Highway Infrastructure | | 1,012,000 | | | | 529,453 |
| |
| Total (Cost $224,439,887) | | | | | | 378,344,158 |
| |
| | | | | | | |
| INFORMATION TECHNOLOGY – 16.8% | | | | | | |
| COMMUNICATIONS EQUIPMENT - 0.8% | | | | | | |
ADTRAN 2 | | 234,973 | | | | 5,251,647 |
Bel Fuse Cl. B | | 30,238 | | | | 934,354 |
Clearfield 1 | | 55,600 | | | | 1,150,920 |
NetScout Systems 1 | | 58,500 | | | | 1,842,750 |
Oclaro 1 | | 87,500 | | | | 783,125 |
| | | | | | |
| | | | | | | 9,962,796 |
| | | | | | |
| 46 | 2016 Annual Report to Stockholders | | THE ACCOMPANYING NOTES ARE AN INTEGRAL PART OF THESE FINANCIAL STATEMENTS |
| |
| Schedule of Investments (continued) |
| | | SHARES | | | | VALUE |
| |
| | | | | | | |
| INFORMATION TECHNOLOGY (continued) | | | | | | |
| ELECTRONIC EQUIPMENT, INSTRUMENTS & COMPONENTS - 7.8% | | | | | | |
Anixter International 1, 2, 6 | | 70,895 | | | $ | 5,746,040 |
Broadway Industrial Group 1 | | 2,000,000 | | | | 261,197 |
Cognex Corporation 2,6 | | 210,970 | | | | 13,421,911 |
Coherent 1 | | 111,734 | | | | 15,350,576 |
Dolby Laboratories Cl. A | | 21,250 | | | | 960,287 |
FARO Technologies 1 | | 157,067 | | | | 5,654,412 |
FLIR Systems | | 317,000 | | | | 11,472,230 |
HollySys Automation Technologies | | 53,882 | | | | 987,118 |
Horiba | | 12,000 | | | | 554,191 |
IPG Photonics 1, 2, 6 | | 72,070 | | | | 7,114,030 |
LRAD Corporation | | 776,544 | | | | 1,327,890 |
Methode Electronics | | 54,030 | | | | 2,234,141 |
National Instruments | | 261,850 | | | | 8,070,217 |
Orbotech 1 | | 61,600 | | | | 2,058,056 |
Perceptron 1 | | 357,700 | | | | 2,375,128 |
Plexus Corporation 1 | | 150,600 | | | | 8,138,424 |
Richardson Electronics | | 573,732 | | | | 3,614,512 |
Rogers Corporation 1 | | 57,066 | | | | 4,383,239 |
Systemax | | 58,520 | | | | 513,220 |
TTM Technologies 1, 2 | | 496,400 | | | | 6,765,932 |
VST Holdings | | 979,000 | | | | 342,190 |
| | | | | | |
| | | | | | | 101,344,941 |
| | | | | | |
| INTERNET SOFTWARE & SERVICES - 2.1% | | | | | | |
Actua Corporation 1 | | 83,815 | | | | 1,173,410 |
Care.com 1 | | 235,900 | | | | 2,021,663 |
comScore 1 | | 227,236 | | | | 7,176,113 |
HolidayCheck Group 1 | | 44,900 | | | | 110,924 |
IZEA 1 | | 70,106 | | | | 316,178 |
j2 Global | | 85,120 | | | | 6,962,816 |
MiX Telematics ADR | | 2,641 | | | | 16,348 |
QuinStreet 1 | | 526,082 | | | | 1,978,068 |
RealNetworks 1 | | 224,670 | | | | 1,091,896 |
Solium Capital 1 | | 167,700 | | | | 1,054,175 |
Spark Networks 1, 2 | | 263,000 | | | | 220,894 |
Stamps.com 1 | | 37,500 | | | | 4,299,375 |
Support.com 1 | | 650,300 | | | | 559,258 |
| | | | | | |
| | | | | | | 26,981,118 |
| | | | | | |
| IT SERVICES - 1.1% | | | | | | |
Acxiom Corporation 1 | | 48,000 | | | | 1,286,400 |
Convergys Corporation 2 | | 121,000 | | | | 2,971,760 |
DST Systems 2 | | 10,000 | | | | 1,071,500 |
Hackett Group (The) | | 417,266 | | | | 7,368,918 |
Innodata 1 | | 274,314 | | | | 672,069 |
MoneyGram International 1 | | 59,400 | | | | 701,514 |
Unisys Corporation 1 | | 40,000 | | | | 598,000 |
| | | | | | |
| | | | | | | 14,670,161 |
| | | | | | |
| SEMICONDUCTORS & SEMICONDUCTOR EQUIPMENT - 2.7% | | | | | | |
Amtech Systems 1 | | 141,471 | | | | 601,252 |
Brooks Automation | | 140,700 | | | | 2,401,749 |
Cabot Microelectronics | | 15,300 | | | | 966,501 |
CyberOptics Corporation 1 | | 13,800 | | | | 360,180 |
Daqo New Energy ADR 1 | | 17,200 | | | | 331,960 |
Diodes 1 | | 270,850 | | | | 6,952,719 |
Exar Corporation 1 | | 157,576 | | | | 1,698,669 |
Intermolecular 1 | | 40,000 | | | | 37,920 |
Kulicke & Soffa Industries 1 | | 77,400 | | | | 1,234,530 |
MKS Instruments | | 27,010 | | | | 1,604,394 |
Nanometrics 1 | | 109,400 | | | | 2,741,564 |
Nova Measuring Instruments 1 | | 82,300 | | | | 1,081,422 |
Photronics 1 | | 159,900 | | | | 1,806,870 |
Sigma Designs 1 | | 78,900 | | | | 473,400 |
Silicon Motion Technology ADR | | 51,900 | | | | 2,204,712 |
Teradyne | | 130,000 | | | | 3,302,000 |
Tessera Holding Corporation | | 153,530 | | | | 6,786,026 |
Ultra Clean Holdings 1 | | 42,800 | | | | 415,160 |
Veeco Instruments 1 | | 17,500 | | | | 510,125 |
| | | | | | |
| | | | | | | 35,511,153 |
| | | | | | |
| SOFTWARE - 1.6% | | | | | | |
American Software Cl. A | | 108,690 | | | | 1,122,768 |
ANSYS 1, 2, 6 | | 95,000 | | | | 8,786,550 |
Computer Modelling Group | | 316,300 | | | | 2,146,124 |
Mentor Graphics | | 89,523 | | | | 3,302,503 |
Model N 1 | | 300,387 | | | | 2,658,425 |
Monotype Imaging Holdings | | 117,700 | | | | 2,336,345 |
PSI | | 18,194 | | | | 233,449 |
SeaChange International 1 | | 247,069 | | | | 568,259 |
| | | | | | |
| | | | | | | 21,154,423 |
| | | | | | |
| TECHNOLOGY HARDWARE, STORAGE & PERIPHERALS - 0.7% | | | | | | |
Diebold Nixdorf | | 266,600 | | | | 6,704,990 |
Intevac 1 | | 214,500 | | | | 1,833,975 |
| | | | | | |
| | | | | | | 8,538,965 |
| |
| Total (Cost $156,696,296) | | | | | | 218,163,557 |
| |
| | | | | | | |
| MATERIALS – 7.3% | | | | | | |
| CHEMICALS - 2.3% | | | | | | |
Dyadic International 1, 4 | | 75,000 | | | | 123,000 |
FutureFuel Corporation | | 48,500 | | | | 674,150 |
Hawkins | | 86,178 | | | | 4,649,303 |
Innospec | | 36,883 | | | | 2,526,486 |
Minerals Technologies | | 91,893 | | | | 7,098,734 |
Quaker Chemical | | 109,669 | | | | 14,031,052 |
| | | | | | |
| | | | | | | 29,102,725 |
| | | | | | |
| CONSTRUCTION MATERIALS - 1.0% | | | | | | |
Ash Grove Cement Cl. B 4 | | 50,518 | | | | 13,134,680 |
| | | | | | |
| CONTAINERS & PACKAGING - 0.3% | | | | | | |
Mayr-Melnhof Karton | | 34,000 | | | | 3,603,744 |
| | | | | | |
| METALS & MINING - 3.7% | | | | | | |
Alamos Gold Cl. A | | 263,300 | | | | 1,815,930 |
Ampco-Pittsburgh | | 36,966 | | | | 619,180 |
Constellium Cl. A 1 | | 90,000 | | | | 531,000 |
Exeter Resource 1 | | 240,000 | | | | 179,736 |
†Ferroglobe (Warranty Insurance Trust) 1, 5 | | 49,300 | | | | 0 |
Franco-Nevada Corporation | | 127,300 | | | | 7,607,448 |
Gold Fields ADR | | 370,000 | | | | 1,113,700 |
Haynes International | | 113,900 | | | | 4,896,561 |
Hecla Mining | | 321,300 | | | | 1,683,612 |
Imdex 1 | | 350,000 | | | | 144,988 |
Lundin Mining 1 | | 640,000 | | | | 3,050,683 |
Major Drilling Group International 1 | | 739,243 | | | | 3,865,107 |
Pretium Resources 1 | | 165,000 | | | | 1,366,551 |
Reliance Steel & Aluminum | | 139,940 | | | | 11,130,828 |
Royal Gold | | 16,600 | | | | 1,051,610 |
Synalloy Corporation 1 | | 178,800 | | | | 1,957,860 |
Worthington Industries | | 148,000 | | | | 7,021,120 |
| | | | | | |
| | | | | | | 48,035,914 |
| | | | | | |
| THE ACCOMPANYING NOTES ARE AN INTEGRAL PART OF THESE FINANCIAL STATEMENTS | | 2016 Annual Report to Stockholders | 47 |
| Royce Value Trust | | December 31, 2016 |
| |
| Schedule of Investments (continued) |
| | | SHARES | | | | VALUE | |
| |
| | | | | | | | |
| MATERIALS (continued) | | | | | | | |
| PAPER & FOREST PRODUCTS - 0.0% | | | | | | | |
TFS Corporation | | 453,967 | | | $ | 543,587 | |
| |
| Total (Cost $57,328,240) | | | | | | 94,420,650 | |
| |
| | | | | | | | |
| REAL ESTATE – 2.8% | | | | | | | |
| REAL ESTATE MANAGEMENT & DEVELOPMENT - 2.8% | | | | | | | |
AV Homes 1 | | 66,100 | | | | 1,044,380 | |
FirstService Corporation | | 135,100 | | | | 6,414,548 | |
Forestar Group 1 | | 102,000 | | | | 1,356,600 | |
FRP Holdings 1 | | 173,558 | | | | 6,543,137 | |
Kennedy-Wilson Holdings | | 101,300 | | | | 2,076,650 | |
Marcus & Millichap 1 | | 246,113 | | | | 6,576,139 | |
St. Joe Company (The) 1 | | 177,000 | | | | 3,363,000 | |
Tejon Ranch 1 | | 360,035 | | | | 9,155,690 | |
| |
| Total (Cost $28,248,857) | | | | | | 36,530,144 | |
| |
| | | | | | | | |
| TELECOMMUNICATION SERVICES– 0.5% | | | | | | | |
| WIRELESS TELECOMMUNICATION SERVICES - 0.5% | | | | | | | |
Telephone and Data Systems | | 208,270 | | | | 6,012,755 | |
| |
| Total (Cost $5,433,816) | | | | | | 6,012,755 | |
| |
| | | | | | | | | |
| UTILITIES – 0.1% | | | | | | | |
| GAS UTILITIES - 0.1% | | | | | | | |
Shizuoka Gas | | 110,000 | | | | 773,244 | |
Toho Gas | | 60,000 | | | | 487,291 | |
| | | | | | | |
| | | | | | | 1,260,535 | |
| | | | | | | |
| MULTI-UTILITIES - 0.0% | | | | | | | |
Just Energy Group 2 | | 18,520 | | | | 101,119 | |
| |
| Total (Cost $1,218,976) | | | | | | 1,361,654 | |
| |
| | | | | | | | |
| | | | | | | | |
| MISCELLANEOUS 7– 4.3% | | | | | | | |
| |
| Total (Cost $53,213,601) | | | | | | 56,034,275 | |
| |
| | | | | | | | |
| TOTAL COMMON STOCKS | | | | | | | |
| |
| (Cost $942,331,967) | | | | | | 1,267,889,502 | |
| |
| |
| REPURCHASE AGREEMENT– 6.3% | | | | | | | |
Fixed Income Clearing Corporation, 0.03% dated 12/30/16, due 1/3/17, maturity value
$80,912,270 (collateralized by obligations of various U.S. Government Agencies, 2.50%-
3.375% due 8/15/23-5/15/44, valued at $82,531,094) |
| |
| (Cost $80,912,000) | | | | | | 80,912,000 | |
| |
| | | | | | | | |
| TOTAL INVESTMENTS – 104.1% | | | | | | | |
| |
| (Cost $1,023,243,967) | | | | | | 1,348,801,502 | |
| |
| | | | | | | | |
| LIABILITIES LESS CASH AND OTHER ASSETS – (4.1)% | | | | | | (52,789,790 | ) |
| | | | | | | |
| | | | | | | | |
| |
| NET ASSETS – 100.0% | | | | | $ | 1,296,011,712 | |
| |
| |
| † | New additions in 2016. |
| 1 | Non-income producing. |
| 2 | All or a portion of these securities were pledged as collateral in connection with the revolving credit agreement at December 31, 2016. Total market value of pledged securities at December 31, 2016, was $110,266,950. |
| 3 | At December 31, 2016, the Fund owned 5% or more of the Company’s outstanding voting securities thereby making the Company an Affiliated Company as that term is defined in the Investment Company Act of 1940. See Notes to Financial Statements. |
| 4 | These securities are defined as Level 2 securities due to fair value being based on quoted prices for similar securities. See Notes to Financial Statements. |
| 5 | Securities for which market quotations are not readily available represent 0.1% of net assets. These securities have been valued at their fair value under procedures approved by the Fund’s Board of Directors. These securities are defined as Level 3 securities due to the use of significant unobservable inputs in the determination of fair value. See Notes to Financial Statements. |
| 6 | At December 31, 2016, a portion of these securities were rehypothecated in connection with the Fund’s revolving credit agreement in the aggregate amount of $64,652,459. |
| 7 | Includes securities first acquired in 2016 and less than 1% of net assets. |
| | |
| | Bold indicates the Fund’s 20 largest equity holdings in terms of December 31, 2016, market value. |
| | |
| | TAX INFORMATION: The cost of total investments for Federal income tax purposes was $1,025,881,370. At December 31, 2016, net unrealized appreciation for all securities was $322,920,132 consisting of aggregate gross unrealized appreciation of $405,405,905 and aggregate gross unrealized depreciation of $82,485,773. The primary causes of the differences between book and tax basis cost are the timing of the recognition of losses on securities sold, investments in publicly traded partnerships and Trusts and mark-to-market of Passive Foreign Investment Companies. |
| |
| 48 | 2016 Annual Report to Stockholders | | THE ACCOMPANYING NOTES ARE AN INTEGRAL PART OF THESE FINANCIAL STATEMENTS |
| Royce Value Trust | | December 31, 2016 |
| |
| Statement of Assets and Liabilities |
| ASSETS: | | | | |
| Investments at value | | | | |
| |
Non-Affiliated Companies | | $ | 1,257,891,136 | |
| |
Affiliated Companies | | | 9,998,366 | |
| |
| Repurchase agreements (at cost and value) | | | 80,912,000 | |
| |
| Cash and foreign currency | | | 65,248 | |
| |
| Receivable for investments sold | | | 18,100,968 | |
| |
| Receivable for dividends and interest | | | 1,351,828 | |
| |
| Prepaid expenses and other assets | | | 527,870 | |
| |
| Total Assets | | | 1,368,847,416 | |
| |
| LIABILITIES: | | | | |
| Revolving credit agreement | | | 70,000,000 | |
| |
| Payable for investments purchased | | | 1,973,762 | |
| |
| Payable for investment advisory fee | | | 489,564 | |
| |
| Payable for directors’ fees | | | 44,757 | |
| |
| Payable for interest expense | | | 11,363 | |
| |
| Accrued expenses | | | 242,350 | |
| |
| Deferred capital gains tax | | | 73,908 | |
| |
| Total Liabilities | | | 72,835,704 | |
| |
| Net Assets | | $ | 1,296,011,712 | |
| |
| ANALYSIS OF NET ASSETS: | | | | |
| Paid-in capital - $0.001 par value per share; 81,791,924 shares outstanding (150,000,000 shares authorized) | | $ | 962,812,872 | |
| |
| Undistributed net investment income (loss) | | | (1,959,371 | ) |
| |
| Accumulated net realized gain (loss) on investments and foreign currency | | | 9,653,806 | |
| |
| Net unrealized appreciation (depreciation) on investments and foreign currency | | | 325,504,405 | |
| |
| Net Assets (net asset value per share - $15.85) | | $ | 1,296,011,712 | |
| |
| Investments at identified cost | | $ | 942,331,967 | |
| |
| THE ACCOMPANYING NOTES ARE AN INTEGRAL PART OF THESE FINANCIAL STATEMENTS | | 2016 Annual Report to Stockholders | 49 |
Royce Value Trust
| |
| Statement of Changes in Net Assets |
| | | YEAR ENDED 12/31/16 | | | | YEAR ENDED 12/31/15 | |
| |
| | | | | | | | | | |
| INVESTMENT OPERATIONS: | | | | | | | | | |
| Net investment income (loss) | | $ | 9,680,260 | | | | $ | 9,193,108 | |
| |
| Net realized gain (loss) on investments and foreign currency | | | 75,719,009 | | | | | 43,117,817 | |
| |
| Net change in unrealized appreciation (depreciation) on investments and foreign currency | | | 186,502,762 | | | | | (157,435,228 | ) |
| |
| Net increase (decrease) in net assets from investment operations | | | 271,902,031 | | | | | (105,124,303 | ) |
| |
| DISTRIBUTIONS: | | | | | | | | | |
| Net investment income | | | (10,786,801 | ) | | | | (12,151,910 | ) |
| |
| Net realized gain on investments and foreign currency | | | (70,931,388 | ) | | | | (83,306,926 | ) |
| |
| Total distributions | | | (81,718,189 | ) | | | | (95,458,836 | ) |
| |
| CAPITAL STOCK TRANSACTIONS: | | | | | | | | | |
| Reinvestment of distributions | | | 33,793,124 | | | | | 40,663,247 | |
| |
| Total capital stock transactions | | | 33,793,124 | | | | | 40,663,247 | |
| |
| Net Increase (Decrease) In Net Assets | | | 223,976,966 | | | | | (159,919,892 | ) |
| |
| NET ASSETS: | | | | | | | | | |
| |
| Beginning of year | | | 1,072,034,746 | | | | | 1,231,954,638 | |
| |
| End of year (including undistributed net investment income (loss) of $(1,959,371) at 12/31/16 and $(1,047,919) at 12/31/15) | | $ | 1,296,011,712 | | | | $ | 1,072,034,746 | |
| |
| 50 | 2016 Annual Report to Stockholders | | THE ACCOMPANYING NOTES ARE AN INTEGRAL PART OF THESE FINANCIAL STATEMENTS |
| Royce Value Trust | | Year Ended December 31, 2016 |
| INVESTMENT INCOME: | | | | |
| | | | | |
| INCOME: | | | | |
| Dividends | | | | |
| |
Non-Affiliated Companies | | $ | 16,827,595 | |
| |
Affiliated Companies | | | 1,519,381 | |
| |
| Foreign withholding tax | | | (433,390 | ) |
| |
| Interest | | | 50,925 | |
| |
| Rehypothecation income | | | 60,170 | |
| |
| Total income | | | 18,024,681 | |
| |
| EXPENSES: | | | | |
| |
| Investment advisory fees | | | 5,849,115 | |
| |
| Interest expense | | | 1,205,769 | |
| |
| Stockholder reports | | | 404,144 | |
| |
| Administrative and office facilities | | | 276,617 | |
| |
| Custody and transfer agent fees | | | 194,234 | |
| |
| Directors’ fees | | | 171,715 | |
| |
| Professional fees | | | 95,084 | |
| |
| Other expenses | | | 147,845 | |
| |
| Total expenses | | | 8,344,523 | |
| |
| Compensating balance credits | | | (102 | ) |
| |
| Net expenses | | | 8,344,421 | |
| |
| Net investment income (loss) | | | 9,680,260 | |
| |
| REALIZED AND UNREALIZED GAIN (LOSS) ON INVESTMENTS AND FOREIGN CURRENCY: | | | | |
| NET REALIZED GAIN (LOSS): | | | | |
| |
| Investments in Non-Affiliated Companies | | | 75,894,203 | |
| |
| Investments in Affiliated Companies | | | 10,000 | |
| |
| Foreign currency transactions | | | (185,194 | ) |
| |
| NET CHANGE IN UNREALIZED APPRECIATION (DEPRECIATION): | | | | |
| |
| Investments and foreign currency translations | | | 186,470,163 | |
| |
| Other assets and liabilities denominated in foreign currency | | | 32,599 | |
| |
| Net realized and unrealized gain (loss) on investments and foreign currency | | | 262,221,771 | |
| |
| NET INCREASE (DECREASE) IN NET ASSETS FROM INVESTMENT OPERATIONS | | $ | 271,902,031 | |
| |
| THE ACCOMPANYING NOTES ARE AN INTEGRAL PART OF THESE FINANCIAL STATEMENTS | | 2016 Annual Report to Stockholders | 51 |
| Royce Value Trust | | Year Ended December 31, 2016 |
| CASH FLOWS FROM OPERATING ACTIVITIES: | | | | |
| Net increase (decrease) in net assets from investment operations | | $ | 271,902,031 | |
| |
| Adjustments to reconcile net increase (decrease) in net assets from investment operations to net cash provided by operating activities: | | | | |
| |
Purchases of long-term investments | | | (326,628,705 | ) |
| |
Proceeds from sales and maturities of long-term investments | | | 434,894,498 | |
| |
Net purchases, sales and maturities of short-term investments | | | (70,185,000 | ) |
| |
Net (increase) decrease in dividends and interest receivable and other assets | | | (19,414 | ) |
| |
Net increase (decrease) in interest expense payable, accrued expenses and other liabilities | | | 1,808 | |
| |
Net change in unrealized appreciation (depreciation) on investments | | | (186,470,163 | ) |
| |
Net realized gain (loss) on investments and foreign currency | | | (75,719,009 | ) |
| |
| Net cash provided by operating activities | | | 47,776,046 | |
| |
| CASH FLOWS FROM FINANCING ACTIVITIES: | | | | |
| Net increase (decrease) in revolving credit agreement | | | – | |
| |
| Distributions | | | (81,718,189 | ) |
| |
| Reinvestment of distributions | | | 33,793,124 | |
| |
| Net cash used for financing activities | | | (47,925,065 | ) |
| |
| INCREASE (DECREASE) IN CASH: | | | (149,019 | ) |
| |
| Cash and foreign currency at beginning of year | | | 214,267 | |
| |
| Cash and foreign currency at end of year | | $ | 65,248 | |
| |
| 52 | 2016 Annual Report to Stockholders | | THE ACCOMPANYING NOTES ARE AN INTEGRAL PART OF THESE FINANCIAL STATEMENTS |
Royce Value Trust
| |
| Financial Highlights |
| This table is presented to show selected data for a share of Common Stock outstanding throughout each period, and to assist stockholders in evaluating the Fund’s performance for the periods presented. |
| | | YEARS ENDED |
| | | |
| | | 12/31/16 | | | 12/31/15 | | | 12/31/14 | | | 12/31/13 | | | 12/31/12 | |
| |
| Net Asset Value, Beginning of Period | | $ | 13.56 | | | $ | 16.24 | | | $ | 18.17 | | | $ | 15.40 | | | $ | 14.18 | |
| |
| INVESTMENT OPERATIONS: | | | | | | | | | | | | | | | | | | | | |
| Net investment income (loss) | | | 0.12 | | | | 0.12 | | | | 0.12 | | | | 0.12 | | | | 0.23 | |
| |
| Net realized and unrealized gain (loss) on investments and foreign currency | | | 3.27 | | | | (1.48 | ) | | | (0.13 | ) | | | 4.89 | | | | 2.02 | |
| |
| Total investment operations | | | 3.39 | | | | (1.36 | ) | | | (0.01 | ) | | | 5.01 | | | | 2.25 | |
| |
| DISTRIBUTIONS TO PREFERRED STOCKHOLDERS: | | | | | | | | | | | | | | | | | | | | |
| Net investment income | | | – | | | | – | | | | – | | | | – | | | | (0.04 | ) |
| |
| Net realized gain on investments and foreign currency | | | – | | | | – | | | | – | | | | – | | | | (0.13 | ) |
| |
| Total distributions to Preferred Stockholders | | | – | | | | – | | | | – | | | | – | | | | (0.17 | ) |
| |
Net Increase (Decrease) in Net Assets Applicable to Common Stockholders from Investment Operations | | | 3.39 | | | | (1.36 | ) | | | (0.01 | ) | | | 5.01 | | | | 2.08 | |
| |
| DISTRIBUTIONS TO COMMON STOCKHOLDERS: | | | | | | | | | | | | | | | | | | | | |
| Net investment income | | | (0.13 | ) | | | (0.16 | ) | | | (0.14 | ) | | | (0.11 | ) | | | (0.17 | ) |
| |
| Net realized gain on investments and foreign currency | | | (0.89 | ) | | | (1.08 | ) | | | (1.68 | ) | | | (2.08 | ) | | | (0.63 | ) |
| |
| Total distributions to Common Stockholders | | | (1.02 | ) | | | (1.24 | ) | | | (1.82 | ) | | | (2.19 | ) | | | (0.80 | ) |
| |
| CAPITAL STOCK TRANSACTIONS: | | | | | | | | | | | | | | | | | | | | |
| Effect of reinvestment of distributions by Common Stockholders | | | (0.08 | ) | | | (0.08 | ) | | | (0.10 | ) | | | (0.05 | ) | | | (0.06 | ) |
| |
| Total capital stock transactions | | | (0.08 | ) | | | (0.08 | ) | | | (0.10 | ) | | | (0.05 | ) | | | (0.06 | ) |
| |
| Net Asset Value, End of Period | | $ | 15.85 | | | $ | 13.56 | | | $ | 16.24 | | | $ | 18.17 | | | $ | 15.40 | |
| |
| Market Value, End of Period | | $ | 13.39 | | | $ | 11.77 | | | $ | 14.33 | | | $ | 16.01 | | | $ | 13.42 | |
| |
| TOTAL RETURN:1 | | | | | | | | | | | | | | | | | | | | |
| Net Asset Value | | | 26.87 | % | | | (8.09 | )% | | | 0.78 | % | | | 34.14 | % | | | 15.41 | % |
| |
| Market Value | | | 23.48 | % | | | (9.59 | )% | | | 0.93 | % | | | 35.63 | % | | | 16.22 | % |
| |
RATIOS BASED ON AVERAGE NET ASSETS APPLICABLE TO
COMMON STOCKHOLDERS: | | | | | | | | | | | | | | | | | | | | |
| Investment advisory fee expense2 | | | 0.51 | % | | | 0.50 | % | | | 0.46 | % | | | 0.54 | % | | | 0.56 | % |
| |
| Other operating expenses | | | 0.22 | % | | | 0.18 | % | | | 0.15 | % | | | 0.25 | % | | | 0.15 | % |
| |
| Total expenses (net)3 | | | 0.73 | % | | | 0.68 | % | | | 0.61 | % | | | 0.79 | % | | | 0.71 | % |
| |
| Expenses net of fee waivers and excluding interest expense | | | 0.62 | % | | | 0.61 | % | | | 0.55 | % | | | 0.65 | % | | | 0.68 | % |
| |
| Expenses prior to fee waivers and balance credits | | | 0.73 | % | | | 0.68 | % | | | 0.61 | % | | | 0.79 | % | | | 0.71 | % |
| |
| Expenses prior to fee waivers | | | 0.73 | % | | | 0.68 | % | | | 0.61 | % | | | 0.79 | % | | | 0.71 | % |
| |
| Net investment income (loss) | | | 0.85 | % | | | 0.78 | % | | | 0.72 | % | | | 0.70 | % | | | 1.57 | % |
| |
| SUPPLEMENTAL DATA: | | | | | | | | | | | | | | | | | | | | |
Net Assets Applicable to Common Stockholders, End of Period
(in thousands) | | $ | 1,296,012 | | | $ | 1,072,035 | | | $ | 1,231,955 | | | $ | 1,307,829 | | | $ | 1,082,426 | |
| |
| Portfolio Turnover Rate | | | 28 | % | | | 35 | % | | | 40 | % | | | 33 | % | | | 25 | % |
| |
| REVOLVING CREDIT AGREEMENT: | | | | | | | | | | | | | | | | | | | | |
| Asset coverage | | | 1951 | % | | | 1631 | % | | | 1860 | % | | | 1289 | % | | | 822 | % |
| |
| Asset coverage per $1,000 | | $ | 19,514 | | | $ | 16,315 | | | $ | 18,599 | | | $ | 12,889 | | | $ | 8,216 | |
| |
| 1 | The Market Value Total Return is calculated assuming a purchase of Common Stock on the opening of the first business day and a sale on the closing of the last business day of each period. Dividends and distributions are assumed for the purposes of this calculation to be reinvested at prices obtained under the Fund’s Distribution Reinvestment and Cash Purchase Plan. Net Asset Value Total Return is calculated on the same basis, except that the Fund’s net asset value is used on the purchase and sale dates instead of market value. |
| 2 | The investment advisory fee is calculated based on average net assets over a rolling 60-month basis, while the above ratios of investment advisory fee expenses are based on the average net assets applicable to Common Stockholders over a 12-month basis. |
| 3 | Expense ratio based on total average net assets including liquidation value of Preferred Stock was 0.60% for the year ended December 31, 2012. |
| THE ACCOMPANYING NOTES ARE AN INTEGRAL PART OF THESE FINANCIAL STATEMENTS | | 2016 Annual Report to Stockholders | 53 |
Royce Value Trust
Notes to Financial Statements
| Summary of Significant Accounting Policies: |
| Royce Value Trust, Inc. (the “Fund”), is a diversified closed-end investment company that was incorporated under the laws of the State of Maryland on July 1, 1986. The Fund commenced operations on November 26, 1986. |
| The preparation of financial statements in conformity with accounting principles generally accepted in the United States of America requires management to make estimates and assumptions that affect the reported amounts of assets and liabilities and the disclosure of contingent assets and liabilities at the date of the financial statements and the reported amounts of income and expenses during the reporting period. Actual results could differ from those estimates. |
| The Fund is an investment company and accordingly follows the investment company accounting and reporting guidance of the Financial Accounting Standards Board (FASB) Accounting Standard Codification Topic 946 “Financial Services-Investment Companies”. |
| |
| VALUATION OF INVESTMENTS: |
| Securities are valued as of the close of trading on the New York Stock Exchange (NYSE) (generally 4:00 p.m. Eastern time) on the valuation date. Securities that trade on an exchange, and securities traded on Nasdaq’s Electronic Bulletin Board, are valued at their last reported sales price or Nasdaq official closing price taken from the primary market in which each security trades or, if no sale is reported for such day, at their highest bid price. Other over-the-counter securities for which market quotations are readily available are valued at their highest bid price, except in the case of some bonds and other fixed income securities which may be valued by reference to other securities with comparable ratings, interest rates and maturities, using established independent pricing services. The Fund values its non-U.S. dollar denominated securities in U.S. dollars daily at the prevailing foreign currency exchange rates as quoted by a major bank. Securities for which market quotations are not readily available are valued at their fair value in accordance with the provisions of the 1940 Act, under procedures approved by the Fund’s Board of Directors, and are reported as Level 3 securities. As a general principle, the fair value of a security is the amount which the Fund might reasonably expect to receive for the security upon its current sale. However, in light of the judgment involved in fair valuations, there can be no assurance that a fair value assigned to a particular security will be the amount which the Fund might be able to receive upon its current sale. In addition, if, between the time trading ends on a particular security and the close of the customary trading session on the NYSE, events occur that are significant and may make the closing price unreliable, the Fund may fair value the security. The Fund uses an independent pricing service to provide fair value estimates for relevant non-U.S. equity securities on days when the U.S. market volatility exceeds a certain threshold. This pricing service uses proprietary correlations it has developed between the movement of prices of non-U.S. equity securities and indices of U.S.-traded securities, futures contracts and other indications to estimate the fair value of relevant non-U.S. securities. When fair value pricing is employed, the prices of securities used by the Fund may differ from quoted or published prices for the same security. Investments in money market funds are valued at net asset value per share. |
| Various inputs are used in determining the value of the Fund’s investments, as noted above. These inputs are summarized in the three broad levels below: |
| | | Level 1 | – | quoted prices in active markets for identical securities. |
| | | Level 2 | – | other significant observable inputs (including quoted prices for similar securities, foreign securities that may be fair valued and repurchase agreements). The table below includes all Level 2 securities. Level 2 securities with values based on quoted prices for similar securities are noted in the Schedule of Investments. |
| | | Level 3 | – | significant unobservable inputs (including last trade price before trading was suspended, or at a discount thereto for lack of marketability or otherwise, market price information regarding other securities, information received from the company and/or published documents, including SEC filings and financial statements, or other publicly available information). |
| The inputs or methodology used for valuing securities are not necessarily an indication of the risk associated with investing in those securities. |
| The following is a summary of the inputs used to value the Fund’s investments as of December 31, 2016. For a detailed breakout of common stocks by sector classification, please refer to the Schedule of Investments. |
| | | LEVEL 1 | | LEVEL 2 | | LEVEL 3 | | TOTAL |
| |
| Common Stocks | | $1,165,257,510 | | $101,739,929 | | $892,063 | | $1,267,889,502 |
| |
| Cash Equivalents | | – | | 80,912,000 | | – | | 80,912,000 |
| |
Certain securities have transferred in and out of Level 1 and Level 2 measurements during the reporting period. The Fund recognizes transfers between levels as of the end of the reporting period. For the year ended December 31, 2016, securities valued at $5,380,804 were transferred from Level 1 to Level 2 within the fair value hierarchy.
54 | 2016 Annual Report to Stockholders
Royce Value Trust
Notes to Financial Statements (continued)
VALUATION OF INVESTMENTS (continued):
Level 3 Reconciliation:
| | | | | | | REALIZED AND UNREALIZED | | |
| | | BALANCE AS OF 12/31/15 | | PURCHASES | | GAIN (LOSS)1 | | BALANCE AS OF 12/31/16 |
| |
| Common Stocks | | $167,629 | | $1,187,434 | | $(463,000) | | $892,063 |
| |
| 1 | The net change in unrealized appreciation (depreciation) is included in the accompanying Statement of Operations. Change in unrealized appreciation (depreciation) includes net unrealized appreciation (depreciation) resulting from changes in investment values during the reporting period and the reversal of previously recorded unrealized appreciation (depreciation) when gains or losses are realized. Net realized gain (loss) from investments and foreign currency transactions is included in the accompanying Statement of Operations. |
| REPURCHASE AGREEMENTS: |
| The Fund may enter into repurchase agreements with institutions that the Fund’s investment adviser has determined are creditworthy. The Fund restricts repurchase agreements to maturities of no more than seven days. Securities pledged as collateral for repurchase agreements, which are held until maturity of the repurchase agreements, are marked-to-market daily and maintained at a value at least equal to the principal amount of the repurchase agreement (including accrued interest). Repurchase agreements could involve certain risks in the event of default or insolvency of the counter-party, including possible delays or restrictions upon the ability of the Fund to dispose of its underlying securities. The remaining contractual maturity of the repurchase agreement held by the Fund at December 31, 2016 is overnight and continuous. |
| |
| FOREIGN CURRENCY: |
| Net realized foreign exchange gains or losses arise from sales and maturities of short-term securities, sales of foreign currencies, expiration of currency forward contracts, currency gains or losses realized between the trade and settlement dates on securities transactions, and the difference between the amounts of dividends, interest, and foreign withholding taxes recorded on the Fund’s books and the U.S. dollar equivalent of the amounts actually received or paid. Net unrealized foreign exchange gains and losses arise from changes in the value of assets and liabilities, including investments in securities at the end of the reporting period, as a result of changes in foreign currency exchange rates. |
| |
| TAXES: |
| As a qualified regulated investment company under Subchapter M of the Internal Revenue Code, the Fund is not subject to income taxes to the extent that it distributes substantially all of its taxable income for its fiscal year. The Schedule of Investments includes information regarding income taxes under the caption “Tax Information”. |
| |
| CAPITAL GAINS TAXES: |
| The Fund is subject to a tax imposed on short-term capital gains on securities of issuers domiciled in certain countries. The Fund records an estimated deferred tax liability for these securities that have been held for less than one year. This amount, if any, is reported as deferred capital gains tax in the accompanying Statement of Assets and Liabilities, assuming those positions were disposed of at the end of the period, and accounted for as a reduction in the market value of the security. |
| |
| DISTRIBUTIONS: |
| The Fund pays quarterly distributions on the Fund’s Common Stock at the annual rate of 7% of the rolling average of the prior four calendar quarter-end NAVs of the Fund’s Common Stock, with the fourth quarter distribution being the greater of 1.75% of the rolling average or the distribution required by IRS regulations. Prior to November 15, 2012, distributions to Preferred Stockholders were accrued daily and paid quarterly. Distributions to Common Stockholders are recorded on ex-dividend date. Distributable capital gains and/or net investment income were first allocated to Preferred Stockholder distributions, with any excess allocable to Common Stockholders. If capital gains and/or net investment income were allocated to both Preferred and Common Stockholders, the tax character of such allocations was proportional. To the extent that distributions are not paid from long-term capital gains, net investment income or net short-term capital gains, they will represent a return of capital. Distributions are determined in accordance with income tax regulations that may differ from accounting principles generally accepted in the United States of America. Permanent book and tax differences relating to stockholder distributions will result in reclassifications within the capital accounts. Undistributed net investment income may include temporary book and tax basis differences, which will reverse in a subsequent period. Any taxable income or gain remaining undistributed at fiscal year end is distributed in the following year. |
| |
| INVESTMENT TRANSACTIONS AND RELATED INVESTMENT INCOME: |
| Investment transactions are accounted for on the trade date. Dividend income is recorded on the ex-dividend date. Non-cash dividend income is recorded at the fair market value of the securities received. Interest income is recorded on an accrual basis. Premiums and discounts on debt securities are amortized using the effective yield-to-maturity method. Realized gains and losses from investment transactions are determined on the basis of identified cost for book and tax purposes. |
2016 Annual Report to Stockholders | 55
Royce Value Trust
Notes to Financial Statements (continued)
| EXPENSES: |
| The Fund incurs direct and indirect expenses. Expenses directly attributable to the Fund are charged to the Fund’s operations, while expenses applicable to more than one of the Royce Funds are allocated equitably. Certain personnel, occupancy costs and other administrative expenses related to the Funds are allocated by Royce & Associates (“Royce”) under an administration agreement and are included in administrative and office facilities and professional fees. The Fund has adopted a deferred fee agreement that allows the Directors to defer the receipt of all or a portion of directors’ fees otherwise payable. The deferred fees are invested in certain Royce Funds until distributed in accordance with the agreement. |
| |
| COMPENSATING BALANCE CREDITS: |
| The Fund has an arrangement with its custodian bank, whereby a portion of the custodian’s fee is paid indirectly by credits earned on the Fund’s cash on deposit with the bank. This deposit arrangement is an alternative to purchasing overnight investments. Conversely, the Fund pays interest to the custodian on any cash overdrafts, to the extent they are not offset by credits earned on positive cash balances. |
| |
| Capital Stock: |
| The Fund issued 2,740,162 and 3,183,214 shares of Common Stock as reinvestment of distributions for the years ended December 31, 2016 and December 31, 2015, respectively. |
| |
| Borrowings: |
| The Fund is party to a revolving credit agreement (the credit agreement) with BNP Paribas Prime Brokerage International, Limited (BNPPI). The Fund pays a commitment fee of 0.50% per annum on the unused portion of the credit agreement. The credit agreement has a 360-day rolling term that resets daily; however, if the Fund exceeds certain net asset value triggers, the credit agreement may convert to a 60-day rolling term that resets daily. The Fund is required to pledge portfolio securities as collateral in an amount up to two times the loan balance outstanding or as otherwise required by applicable regulatory standards and has granted a security interest in the securities pledged to, and in favor of, BNPPI as security for the loan balance outstanding. If the Fund fails to meet certain requirements, or maintain other financial covenants required under the credit agreement, the Fund may be required to repay immediately, in part or in full, the loan balance outstanding under the credit agreement which may necessitate the sale of portfolio securities at potentially inopportune times. BNPPI may terminate the credit agreement upon certain ratings downgrades of its corporate parent, which would result in the Fund’s entire loan balance becoming immediately due and payable. The occurrence of such ratings downgrades may necessitate the sale of portfolio securities at potentially inopportune times. The credit agreement also permits, subject to certain conditions, BNPPI to rehypothecate portfolio securities pledged by the Fund up to the amount of the loan balance outstanding. The Fund continues to receive payments in lieu of dividends and interest on rehypothecated securities. The Fund also has the right under the credit agreement to recall the rehypothecated securities from BNPPI on demand. If BNPPI fails to deliver the recalled security in a timely manner, the Fund is compensated by BNPPI for any fees or losses related to the failed delivery or, in the event a recalled security is not returned by BNPPI, the Fund, upon notice to BNPPI, may reduce the loan balance outstanding by the value of the recalled security failed to be returned. The Fund receives a portion of the fees earned by BNPPI in connection with the rehypothecation of portfolio securities. |
| As of December 31, 2016, the Fund has outstanding borrowings of $70,000,000. During the year ended December 31, 2016, the Fund borrowed an average daily balance of $70,000,000 at a weighted average borrowing cost of 1.69%. The maximum amount outstanding during the year ended December 31, 2016 was $70,000,000. As of December 31, 2016, the aggregate value of rehypothecated securities was $64,652,459. During the year ended December 31, 2016, the Fund earned $60,170 in fees from rehypothecated securities. |
| |
| Investment Advisory Agreement: |
| As compensation for its services under the Investment Advisory Agreement, Royce receives a fee comprised of a Basic Fee (“Basic Fee”) and an adjustment to the Basic Fee based on the investment performance of the Fund in relation to the investment record of the S&P SmallCap 600 Index (“S&P 600”). |
| The Basic Fee is a monthly fee equal to 1/12 of 1% (1% on an annualized basis) of the average of the Fund’s month-end net assets applicable to Common Stockholders, plus the liquidation value of outstanding Preferred Stock, for the rolling 60-month period ending with such month (the “performance period“). The Basic Fee for each month is increased or decreased at the rate of 1/12 of .05% for each percentage point that the investment performance of the Fund exceeds, or is exceeded by, the percentage change in the investment record of the S&P 600 for the performance period by more than two percentage points. The performance period for each such month is a rolling 60-month period ending with such month. The maximum increase or decrease in the Basic Fee for any month may not exceed 1/12 of .5%. Accordingly, for each month, the maximum monthly fee rate as adjusted for performance is 1/12 of 1.5% and is payable if the investment performance of the Fund exceeds the percentage change in the investment record of the S&P 600 by 12 or more percentage points for the performance period, and the minimum monthly fee rate as adjusted for performance is 1/12 of .5% and is payable if the |
56 | 2016 Annual Report to Stockholders
Royce Value Trust
| Notes to Financial Statements (continued) |
| |
| Investment Advisory Agreement (continued): |
| percentage change in the investment record of the S&P 600 exceeds the investment performance of the Fund by 12 or more percentage points for the performance period. |
| Notwithstanding the foregoing, Royce is not entitled to receive any fee for any month when the investment performance of the Fund for the rolling 36-month period ending with such month is negative. In the event that the Fund’s investment performance for such a performance period is less than zero, Royce will not be required to refund to the Fund any fee earned in respect of any prior performance period. |
| For the twelve rolling 60-month periods in 2016, the Fund’s investment performance ranged from 36% to 46% below the investment performance of the S&P 600. Accordingly, the net investment advisory fee consisted of a Basic Fee of $11,698,230 and a net downward adjustment of $5,849,115 for the performance of the Fund relative to that of the S&P 600. For the year ended December 31, 2016, the Fund expensed Royce investment advisory fees totaling $5,849,115. |
| |
| Purchases and Sales of Investment Securities: |
| For the year ended December 31, 2016, the costs of purchases and proceeds from sales of investment securities, other than short-term securities, amounted to $328,040,160 and $448,878,574, respectively. |
| Cross trades were executed by the Fund pursuant to Rule 17a-7 under the 1940 Act. Cross trading is the buying or selling of portfolio securities between funds to which Royce serves as investment adviser. At its regularly scheduled quarterly meetings, the Board reviews such transactions as of the most recent calendar quarter for compliance with the requirements and restrictions set forth by Rule 17a-7. Cross trades for the year ended December 31, 2016, were as follows: |
| COST OF PURCHASES | | PROCEEDS FROM SALES | | REALIZED GAIN (LOSS) |
| |
| $56,862,131 | | $10,176,642 | | $(3,646,946) |
| |
| Tax Information: |
| Distributions during the years ended December 31, 2016 and 2015, were characterized as follows for tax purposes: |
| ORDINARY INCOME | | LONG-TERM CAPITAL GAINS |
| |
| 2016 | | 2015 | | 2016 | | 2015 |
| |
| $12,241,385 | | $16,352,099 | | $69,476,804 | | $79,106,737 |
| |
The tax basis components of distributable earnings at December 31, 2016, were as follows:
| | | | | | | QUALIFIED LATE YEAR | | |
| UNDISTRIBUTED | | UNDISTRIBUTED LONG-TERM | | NET UNREALIZED | | ORDINARY AND | | TOTAL |
| ORDINARY | | CAPITAL GAINS OR | | APPRECIATION | | POST-OCTOBER LOSS | | DISTRIBUTABLE |
| INCOME | | (CAPITAL LOSS CARRYFORWARD) | | (DEPRECIATION)1 | | DEFERRALS2 | | EARNINGS |
| |
| $3,266,059 | | $8,454,032 | | $322,867,003 | | $(1,388,254) | | $333,198,840 |
| |
| 1 | Includes timing differences on foreign currency, recognition of losses on securities sold, investments in publicly traded partnerships and Trusts and mark-to-market of Passive Foreign Investment Companies. |
| 2 | Under the current tax law, capital losses and qualified late year ordinary losses incurred after October 31 may be deferred and treated as occurring on the first day of the following fiscal year. |
For financial reporting purposes, capital accounts and distributions to stockholders are adjusted to reflect the tax character of permanent book/tax differences. For the year ended December 31, 2016, the Fund recorded the following permanent reclassifications, which relate primarily to current investments in Real Estate Investment Trusts, publicly traded partnerships and Trusts, foreign currency transactions, foreign capital gains tax, dividend redesignations and gains from the sale of Passive Foreign Investment Companies. Results of operations and net assets were not affected by these reclassifications.
| UNDISTRIBUTED NET | | ACCUMULATED NET | | |
| INVESTMENT INCOME | | REALIZED GAIN (LOSS) | | PAID-IN CAPITAL |
| |
| $195,089 | | $(178,002) | | $(17,087) |
| |
Management has analyzed the Fund’s tax positions taken on federal income tax returns for all open tax years (2013-2016) and has concluded that as of December 31, 2016, no provision for income tax is required in the Fund’s financial statements.
2016 Annual Report to Stockholders | 57
Royce Value Trust
Notes to Financial Statements (continued)
| Transactions in Affiliated Companies: |
| An “Affiliated Company” as defined in the Investment Company Act of 1940, is a company in which a fund owns 5% or more of the company’s outstanding voting securities at any time during the period. The Fund effected the following transactions in shares of such companies for the year ended December 31, 2016: |
| | | SHARES | MARKET VALUE | COST OF | PROCEEDS | REALIZED | DIVIDEND | SHARES | MARKET VALUE |
| AFFILIATED COMPANY | | 12/31/15 | 12/31/15 | PURCHASES | FROM SALES | GAIN (LOSS) | INCOME | 12/31/16 | 12/31/16 |
| |
| Stanley Furniture | | 1,012,235 | | $2,824,136 | | – | | $275,000 | | $10,000 | | $1,368,353 | | 912,235 | | $ 821,194 | |
| |
| Timberland Bancorp | | 444,200 | | 5,512,522 | | – | | – | | – | | 151,028 | | 444,200 | | 9,177,172 | |
| |
| | | | | $8,336,658 | | | | | | $10,000 | | $1,519,381 | | | | $9,998,366 | |
| |
58 | 2016 Annual Report to Stockholders
Royce Value Trust
Report of Independent Registered Public Accounting Firm
To the Board of Directors and the Stockholders of Royce Value Trust, Inc.:
In our opinion, the accompanying statement of assets and liabilities, including the schedule of investments, and the related statement of operations, of changes in net assets and of cash flows and the financial highlights present fairly, in all material respects, the financial position of Royce Value Trust, Inc. (the “Fund”) as of December 31, 2016, the results of its operations, the changes in its net assets, its cash flows and the financial highlights for each of the periods presented, in conformity with accounting principles generally accepted in the United States of America. These financial statements and financial highlights (hereafter referred to as “financial statements”) are the responsibility of the Fund’s management. Our responsibility is to express an opinion on these financial statements based on our audits. We conducted our audits of these financial statements in accordance with the standards of the Public Company Accounting Oversight Board (United States). Those standards require that we plan and perform the audit to obtain reasonable assurance about whether the financial statements are free of material misstatement. An audit includes examining, on a test basis, evidence supporting the amounts and disclosures in the financial statements, assessing the accounting principles used and significant estimates made by management, and evaluating the overall financial statement presentation. We believe that our audits, which included confirmation of securities as of December 31, 2016 by correspondence with the custodian and brokers, provide a reasonable basis for our opinion. The financial highlights for each of the periods presented in the period ended December 31, 2014 were audited by other independent accountants whose report dated February 23, 2015 expressed an unqualified opinion on those statements.
PricewaterhouseCoopers LLP
Baltimore, Maryland
February 22, 2017
2016 Annual Report to Stockholders | 59
Directors and Officers
All Directors and Officers may be reached c/o The Royce Funds, 745 Fifth Avenue, New York, NY 10151
Charles M. Royce, Trustee1
Age: 77 | Number of Funds Overseen: 23 | Tenure: Since 1982
Non-Royce Directorships: Director of TICC Capital Corp.
Principal Occupation(s) During Past Five Years: Chairman of the Board of Managers of Royce & Associates (“Royce”), the Trust’s investment adviser; Chief Executive Officer (1972–June 2016), President (1972-July 2014) of Royce.
Christopher D. Clark, Trustee1, President
Age: 51 | Number of Funds Overseen: 23 | Tenure: Since 2014
Principal Occupation(s) During Past Five Years: Chief Executive Officer (since July 2016), President (since July 2014), Co-Chief Investment Officer (Since January 2014), Managing Director and, since June 2015, a Member of the Board of Managers of Royce, having been employed by Royce since May 2007.
Patricia W. Chadwick, Trustee
Age: 68 | Number of Funds Overseen: 23 | Tenure: Since 2009
Non-Royce Directorships: Trustee of ING Mutual Funds and Director of Wisconsin Energy Corp.
Principal Occupation(s) During Past 5 Years: Consultant and President of Ravengate Partners LLC (since 2000).
Stephen L. Isaacs, Trustee
Age: 77 | Number of Funds Overseen: 23 | Tenure: Since 1989
Non-Royce Directorships: None
Principal Occupation(s) During Past Five Years: Attorney and President of Health Policy Associates, Inc., consultants. Mr. Isaacs’s prior business experience includes having served as President of the Center for Health and Social Policy (from 1996 to 2012); Director of Columbia University Development Law and Policy Program and Professor at Columbia University (until August 1996).
Arthur S. Mehlman, Trustee
Age: 74 | Number of Funds Overseen: 43 | Tenure: Since 2004
Non-Royce Directorships: Director/Trustee of registered investment companies constituting the 18 Legg Mason Funds.
Principal Occupation(s) During Past Five Years: Director of The League for People with Disabilities, Inc.; Director of University of Maryland Foundation (non-profits). Formerly: Director of Municipal Mortgage & Equity, LLC (from October 2004 to April 1, 2011); Director of University of Maryland College Park Foundation (non-profit) (from 1998 to 2005); Partner, KPMG LLP (international accounting firm) (from 1972 to 2002); Director of Maryland Business Roundtable for Education (from July 1984 to June 2002).
David L. Meister, Trustee
Age: 77 | Number of Funds Overseen: 23 | Tenure: Since 1982
Non-Royce Directorships: None
Principal Occupation(s) During Past Five Years: Consultant. Chairman and Chief Executive Officer of The Tennis Channel (from June 2000 to March 2005). Mr. Meister’s prior business experience includes having served as Chief Executive Officer of Seniorlife.com, a consultant to the communications industry, President of Financial News Network, Senior Vice President of HBO, President of Time-Life Films, and Head of Broadcasting for Major League Baseball.
G. Peter O’Brien, Trustee
Age: 71 | Number of Funds Overseen: 43 | Tenure: Since 2001
Non-Royce Directorships: Director/Trustee of registered investment companies constituting the 18 Legg Mason Funds; Director of TICC Capital Corp.
Principal Occupation(s) During Past Five Years: Trustee Emeritus of Colgate University (since 2005); Board Member of Hill House, Inc. (since 1999); Formerly: Trustee of Colgate University (from 1996 to 2005), President of Hill House, Inc. (from 2001 to 2005) and Managing Director/Equity Capital Markets Group of Merrill Lynch & Co. (from 1971 to 1999).
Michael K. Shields, Trustee
Age: 58 | Number of Funds Overseen: 23 | Tenure: Since 2015
Principal Occupation(s) During Past Five Years: President and Chief Executive Officer of Piedmont Trust Company, a private North Carolina trust company (since May 2012). Mr. Shields’s prior business experience includes owning Shields Advisors, an investment consulting firm (from April 2010 to June 2012).
Francis D. Gannon, Vice President
Age: 49 | Tenure: Since 2014
Principal Occupation(s) During Past Five Years: Co-Chief Investment Officer (since January 2014) and Managing Director of Royce, having been employed by Royce since September 2006.
Daniel A. O’Byrne, Vice President
Age: 54 | Tenure: Since 1994
Principal Occupation(s) During Past Five Years: Principal and Vice President of Royce, having been employed by Royce since October 1986.
Peter K. Hoglund, Treasurer
Age: 50 | Tenure: Since 2015
Principal Occupation(s) During Past Five Years: Chief Financial Officer, Chief Administrative Officer, and Managing Director of Royce, having been employed by Royce since December 2014. Prior to joining Royce, Mr. Hoglund spent more than 20 years with Munder Capital Management in Birmingham, MI, serving as Managing Director and Chief Financial Officer and overseeing all financial aspects of the firm. He began his career at Munder as a portfolio manager.
John E. Denneen, Secretary and Chief Legal Officer
Age: 49 | Tenure: 1996-2001 and Since 2002
Principal Occupation(s) During Past Five Years: General Counsel, Managing Director, and, since June 2015, a Member of the Board of Managers of Royce; Chief Legal and Compliance Officer and Secretary of Royce.
Lisa Curcio, Chief Compliance Officer
Age: 57 | Tenure: Since 2004
Principal Occupation(s) During Past Five Years: Chief Compliance Officer of The Royce Funds (since October 2004) and Compliance Officer of Royce (since June 2004).
| 1 | | Interested Director. |
| | | Director will hold office until their successors have been duly elected and qualified or until their earlier resignation or removal. |
60 | 2016 Annual Report to Stockholders
Notes to Performance and Other Important Information
The thoughts expressed in this Review and Report concerning recent market movements and future prospects for small company stocks are solely the opinion of Royce at December 31, 2016, and, of course, historical market trends are not necessarily indicative of future market movements. Statements regarding the future prospects for particular securities held in the Funds’ portfolios and Royce’s investment intentions with respect to those securities reflect Royce’s opinions as of December 31, 2016 and are subject to change at any time without notice. There can be no assurance that securities mentioned in this Review and Report will be included in any Royce-managed portfolio in the future. Investments in securities of micro-cap, small-cap and/or mid-cap companies may involve considerably more risk than investments in securities of larger-cap companies. All publicly released material information is always disclosed by the Funds on the website at www.roycefunds.com.
Sector weightings are determined using the Global Industry Classification Standard (“GICS”). GICS was developed by, and is the exclusive property of, Standard & Poor’s Financial Services LLC (“S&P”) and MSCI Inc. (“MSCI”). GICS is the trademark of S&P and MSCI. “Global Industry Classification Standard (GICS)” and “GICS Direct” are service marks of S&P and MSCI.
All indexes referred to are unmanaged and capitalization weighted. Each index’s returns include net reinvested dividends and/or interest income. Russell Investment Group is the source and owner of the trademarks, service marks, and copyrights related to the Russell Indexes. Russell® is a trademark of Russell Investment Group. The Russell 2000 Index is an index of domestic small-cap stocks. It measures the performance of the 2,000 smallest publicly traded U.S. companies in the Russell 3000 Index. The Russell 2000 Value and Growth Indexes consist of the respective value and growth stocks within the Russell 2000 as determined by Russell Investments. The Russell Microcap Index includes 1,000 of the smallest securities in the Russell 2000 Index along with the next smallest eligible securities as determined by Russell. The Russell 1000 Index is an index of domestic large-cap stocks. It measures the performance of the 1,000 largest publicly traded companies in the Russell 3000 Index. The Russell Midcap Index measures the performance of the mid-cap segment of the U.S. equity universe. It includes approximately 800 of the smallest securities in the Russell 1000 Index. The Russell Global Small Cap Index is an unmanaged, capitalization-weighted index of global small-cap stocks. The Russell Global ex-U.S. Large Cap Index is an index of global large-cap stocks, excluding the United States. The Russell Global ex-U.S. Small Cap Index is an index of global small-cap stocks, excluding the United States. The S&P 500 and SmallCap 600 are indexes of U.S. large- and small-cap stocks, respectively, selected by Standard & Poor’s based on market size, liquidity, and industry grouping, among other factors. The Nasdaq Composite is an index of the more than 3,000 common equities listed on the Nasdaq stock exchange. The performance of an index does not represent exactly any particular investment, as you cannot invest directly in an index. Returns for the market indexes used in this report were based on information supplied to Royce by Russell Investments.
The Price-Earnings, or P/E, Ratio is calculated by dividing a company’s share price by its trailing 12-month earnings-per share (EPS). The Price-to-Book, or P/B, Ratio is calculated by dividing a company’s share price by its book value per share. The Morningstar Style Map uses proprietary scores of a stock’s value and growth characteristics to determine its placement in one of the five categories listed on the horizontal axis. These characteristics are then compared to those of other stocks within the same market capitalization band. Each is scored from zero to 100 for both value and growth attributes. The value score is subtracted from the growth score to determine the overall style score. For the vertical, market cap axis, Morningstar subdivides into size groups. Giant-cap stocks are defined as those that account for the top 40% of the capitalization of each style zone; large-cap stocks represent the next 30%; mid-cap stocks the next 20%; small-cap stocks the next 7%; micro-cap stocks the smallest 3%. The Royce Funds is a service mark of The Royce Funds. Distributor: Royce Fund Services, Inc.
Forward-Looking Statements
This material contains forward-looking statements within the meaning of the Securities Exchange Act of 1934, as amended (the “Exchange Act”), that involve risks and uncertainties, including, among others, statements as to:
| • | the Funds’ future operating results |
| • | the prospects of the Funds’ portfolio companies |
| • | the impact of investments that the Funds have made or may make |
| • | the dependence of the Funds’ future success on the general economy and its impact on the companies and industries in which the Funds invest, and |
| • | the ability of the Funds’ portfolio companies to achieve their objectives. |
This Review and Report uses words such as “anticipates,” “believes,” “expects,” “future,” “intends,” and similar expressions to identify forward-looking statements. Actual results may differ materially from those projected in the forward-looking statements for any reason.
The Royce Funds have based the forward-looking statements included in this Review and Report on information available to us on the date of the report, and we assume no obligation to update any such forward-looking statements. Although The Royce Funds undertake no obligation to revise or update any forward-looking statements, whether as a result of new information, future events or otherwise, you are advised to consult any additional disclosures that we may make through future stockholder communications or reports.
Authorized Share Transactions
Royce Global Value Trust, Royce Micro-Cap Trust, and Royce Value Trust may each repurchase up to 5% of the issued and outstanding shares of its respective common stock during the year ending December 31, 2017. Any such repurchases would take place at then prevailing prices in the open market or in other transactions. Common stock repurchases would be effected at a price per share that is less than the share’s then current net asset value.
Royce Global Value Trust, Royce Micro-Cap Trust, and Royce Value Trust are also authorized to offer their common stockholders an opportunity to subscribe for additional shares of their common stock through rights offerings at a price per share that may be less than the share’s then current net asset value. The timing and terms of any such offerings are within each Board’s discretion.
Annual Certifications
As required, the Funds have submitted to the New York Stock Exchange (“NYSE”) for the annual certification of the Funds’ Chief Executive Officer that he is not aware of any violation of the NYSE’s listing standards. The Funds also have included the certification of the Funds’ Chief Executive Officer and Chief Financial Officer required by section 302 of the Sarbanes-Oxley Act of 2002 as exhibits to the Funds’ form N-CSR for the period ended December 31, 2016, filed with the Securities and Exchange Commission.
Proxy Voting
A copy of the policies and procedures that The Royce Funds use to determine how to vote proxies relating to portfolio securities and information regarding how each of The Royce Funds voted proxies relating to portfolio securities during the most recent 12-month period ended June 30 is available, without charge, on The Royce Funds’ website at www. roycefunds.com, by calling (800) 221-4268 (toll-free) and on the website of the Securities and Exchange Commission (“SEC”), at www.sec.gov.
Form N-Q Filing
The Funds file their complete schedules of investments with the SEC for the first and third quarters of each fiscal year on Form N-Q. The Funds’ Forms N-Q are available on the SEC’s website at www.sec.gov. The Royce Funds’ holdings are also on the Funds’ website approximately 15 to 20 days after each calendar quarter end and remain available until the next quarter’s holdings are posted. The Funds’ Forms N-Q may also be reviewed and copied at the SEC’s Public Reference Room in Washington, D.C. To find out more about this public service, call the SEC at (800) 732-0330. The Funds’ complete schedules of investments are updated quarterly, and are available at www.roycefunds.com.
2016 Annual Report to Stockholders | 61
Results of Stockholders Meetings
Royce Value Trust, Inc.
At the 2016 Annual Meeting of Stockholders held on September 19, 2016, the Fund’s stockholders elected three Directors, consisting of:
| | | VOTES FOR | | VOTES WITHHELD |
| |
| Patricia W. Chadwick | | 65,092,387 | | 1,661,512 |
| |
| Arthur S. Mehlman | | 65,433,776 | | 1,320,123 |
| |
| Michael K. Shields | | 65,333,268 | | 1,420,631 |
| |
Royce Micro-Cap Trust, Inc.
At the 2016 Annual Meeting of Stockholders held on September 19, 2016, the Fund’s stockholders elected three Directors, consisting of
| | | VOTES FOR | | VOTES WITHHELD |
| |
| Patricia W. Chadwick | | 31,664,949 | | 618,088 |
| |
| Arthur S. Mehlman | | 31,852,719 | | 430,318 |
| |
| Michael K. Shields | | 31,716,628 | | 566,409 |
| |
Royce Global Value Trust, Inc.
At the 2016 Annual Meeting of Stockholders held on September 19, 2016, the Fund’s stockholders elected three Directors, consisting of:
| | | VOTES FOR | | VOTES WITHHELD |
| |
| Patricia W. Chadwick | | 8,891,002 | | 230,341 |
| |
| Arthur S. Mehlman | | 8,891,058 | | 230,284 |
| |
| Michael K. Shields | | 8,875,042 | | 246,301 |
| |
62 | 2016 Annual Report to Stockholders
This page is intentionally left blank.
This page is intentionally left blank.
| GET THE LATEST INSIGHTS AND NEWS ON THE ROYCE FUNDS |
 | | MARKET PERSPECTIVE
Our talented group of
investment professionals
share their views of the
small-cap market. |
| |  | SMALLTALK BLOG
Co-CIO Francis Gannon
shares timely insights on
the small-cap market. | |
INNOVATIVE RESEARCH
Actionable, educational
intelligence on small-cap
investing. |  |  |
| | | | |
| | | | |
| | eDELIVERY SAVES! SIGN UP NOW. | STAY INFORMED | |
| | | | |
| | eDelivery saves paper, time, and fund expenses. Sign up now to view statements, prospectuses, financial reports, and tax forms online. roycefunds.com/edelivery | Connect with us on LinkedIn, follow us on Twitter, watch us on YouTube and subscribe to our RSS feed. Visit roycefunds.com/subscribe to sign up for our monthly eWord newsletter to stay up to date on the latest from Royce. | |
| | | | |
| |  www.twitter.com/roycefunds www.twitter.com/roycefunds | |  www.linkedin.com/roycefunds www.linkedin.com/roycefunds | |  www.youtube.com/roycefunds www.youtube.com/roycefunds | | www.roycefunds.com/subscribe | |
| This page is not part of the 2016 Annual Report to Shareholders |
| | | | | | |
| |
 | |
| | | | | | |
| | | | | | |
| | | | | | |
| | About The Royce Funds | | | Contact Us | |
| | | | | | |
| | | | | | |
| | Unparalleled Knowledge + Experience
Pioneers in small-cap investing, with 40+ years of experience, depth of knowledge, and focus.
Independent Thinking
The confidence to go against consensus, the insight to uncover opportunities others might miss, and the tenacity to stay the course through market cycles. | | | GENERAL INFORMATION
General Royce Funds information including an overview of our firm and Funds
(800) 221-4268 | |
| | | | | | |
| | Specialized Approaches
Strategies that use value, core, or growth investment approaches to select micro-cap, small-cap, and mid-cap companies.
| | | COMPUTERSHARE
Transfer Agent and Registrar
Speak with a representative about:
• Your account, transactions, and forms
(800) 426-5523 | |
| | Unwavering Commitment | | | | |
| | Our team of 16 portfolio managers have significant personal investments in the strategies they manage. | | | FINANCIAL ADVISORS AND BROKER-DEALERS
Speak with your regional Royce contact regarding:
• Information about our firm, strategies, and Funds
• Fund Materials
(800) 337-6923 | |
| |
| | | | | | |
| | | | | | |
| | | | | | |
| |  | | |  |  |
| | | | | | |
| | | | | | |
Item 2. Code(s) of Ethics. As of the end of the period covered by this report, the Registrant had adopted a code of ethics, as defined in Item 2 of Form N-CSR, applicable to its principal executive officer, principal financial officer, principal accounting officer or controller, or persons performing similar functions. A copy of this code of ethics is filed as an exhibit to this Form N-CSR. No substantive amendments were approved or waivers were granted to this code of ethics during the period covered by this report.
Item 3. Audit Committee Financial Expert.
| (a)(1) | | The Board of Directors of the Registrant has determined that it has an audit committee financial expert. |
| | | |
| (a)(2) | | Arthur S. Mehlman and Patricia W. Chadwick were designated by the Board of Directors as the Registrant’s Audit Committee Financial Experts, effective April 15, 2004 and April 8, 2010, respectively. Mr. Mehlman and Ms. Chadwick are “independent” as defined under Item 3 of Form N-CSR. |
Item 4. Principal Accountant Fees and Services.
| (a) | | Audit Fees: |
| | | Year ended December 31, 2016 - $43,935 |
| | | Year ended December 31, 2016 - $43,500 |
| | | |
| (b) | | Audit-Related Fees: |
| | | Year ended December 31, 2016 - $0 |
| | | Year ended December 31, 2015 - $0 |
| | | |
| (c) | | Tax Fees: |
| | | Year ended December 31, 2016 - $9,360 - Preparation of tax returns |
| | | Year ended December 31, 2015 - $7,200 - Preparation of tax returns |
| | | |
| (d) | | All Other Fees: |
| | | Year ended December 31, 2016 - $0 |
| | | Year ended December 31, 2015 - $0 |
(e)(1) Annual Pre-Approval: On an annual basis, the Registrant’s independent auditor submits to the Audit Committee a schedule of proposed audit, audit-related, tax and other non-audit services to be rendered to the Registrant and/or investment adviser(s) for the following year that require pre-approval by the Audit Committee. This schedule provides a description of each type of service that is expected to require pre-approval and the maximum fees that can be paid for each such service without further Audit Committee approval. The Audit Committee then reviews and determines whether to approve the types of scheduled services and the projected fees for them. Any subsequent revision to already pre-approved services or fees (including fee increases) are presented for consideration at the next regularly scheduled Audit Committee meeting, as needed.
If subsequent to the annual pre-approval of services and fees by the Audit Committee, the Registrant or one of its affiliates determines that it would like to engage the Registrant’s independent auditor to perform a service not already pre-approved, the request is to be submitted to the Registrant’s Chief Financial Officer, and if he or she determines that the service fits within the independence guidelines (e.g., it is not a prohibited service), he or she will then arrange for a discussion of the proposed service and fee to be included on the agenda for the next regularly scheduled Audit Committee meeting so that pre-approval can be considered.
Interim Pre-Approval: If, in the judgment of the Registrant’s Chief Financial Officer, a proposed engagement needs to commence before the next regularly scheduled Audit Committee meeting, he or she shall submit a written summary of the proposed engagement to all members of the Audit Committee, outlining the services, the estimated maximum cost, the category of the services (e.g., audit, audit-related, tax or other) and the rationale for engaging the Registrant’s independent auditor to perform the services. To the extent the proposed engagement involves audit, audit-related or tax services, any individual member of the Audit Committee who is an independent Board member is authorized to pre-approve the engagement. To the extent the proposed engagement involves non-audit services other than audit-related or tax, the Chairman of the Audit Committee is authorized to pre-approve the engagement. The Registrant’s Chief Financial Officer will arrange for this interim review and
coordinate with the appropriate member(s) of the Committee. The independent auditor may not commence the engagement under consideration until the Registrant’s Chief Financial Officer has informed the auditor in writing that pre-approval has been obtained from the Audit Committee or an individual member who is an independent Board member. The member of the Audit Committee who pre-approves any engagements in between regularly scheduled Audit Committee meetings is to report, for informational purposes only, any pre-approval decisions to the Audit Committee at its next regularly scheduled meeting.
| (e)(2) | | Not Applicable |
| | | |
| (f) | | Not Applicable |
| | | |
| (g) | | Year ended December 31, 2016 - $9,360 |
| | | Year ended December 31, 2015 - $7,200 |
| | | |
| (h) | | No such services were rendered during 2016 or 2015. |
Item 5. Audit Committee of Listed Registrants. The Registrant has a separately designated standing audit committee established in accordance with Section 3(a)(58)(A) of the Securities Exchange Act of 1934. Patricia W. Chadwick, Richard M. Galkin, Stephen L. Isaacs, Arthur S. Mehlman, David L. Meister and G. Peter O’Brien are members of the Registrant’s audit committee.
Item 6. Investments.
(a) See Item 1.
(b) Not applicable.
Item 7. Disclosure of Proxy Voting Policies and Procedures for Closed-End Management Investment Companies.
Royce & Associates, LP (“Royce”) has adopted written proxy voting policies and procedures (the “Proxy Voting Procedures”) for itself and client accounts for which Royce is responsible for voting proxies. Royce is generally granted proxy voting authority at the inception of its management of each client account. Proxy voting authority is generally either (i) specifically authorized in the applicable investment management agreement or other instrument; or (ii) where not specifically authorized, is granted to Royce where general investment discretion is given to Royce in the applicable investment management agreement. In voting proxies, Royce is guided by general fiduciary principles. Royce’s goal is to act prudently, solely in the best interest of the beneficial owners of the accounts it manages. Royce attempts to consider all factors of its vote that could affect the value of the investment and will vote proxies in the manner it believes will be consistent with efforts to enhance and/or protect stockholder value.
Royce’s personnel are responsible for monitoring receipt of all proxies and seeking to ensure that proxies are received for all securities for which Royce has proxy voting authority. Royce is not responsible for voting proxies it does not receive. Royce divides proxies into “regularly recurring” and “non-regularly recurring” matters. Examples of regularly recurring matters include non-contested elections of directors and non-contested approvals of independent auditors. Royce’s personnel are responsible for developing and maintaining a list of matters Royce treats as “regularly recurring” and for ensuring that instructions from a Royce Co-Chief Investment Officer are followed when voting those matters on behalf of Royce clients. Non-regularly recurring matters are all other proxy matters and are brought to the attention of the relevant portfolio manager(s) for the applicable account(s). After giving consideration to advisories provided by an independent third party research firm with respect to such non-regularly recurring matters, the portfolio manager(s) directs that such matters be voted in a way that he or she believes should better protect or enhance the value of the investment.
Certain Royce portfolio managers may provide instructions that they do not want regularly recurring matters to be voted in accordance with the standing instructions for their accounts and individual voting instructions on all matters, both regularly recurring and non-regularly recurring, will be obtained from such portfolio managers. Under certain circumstances, Royce may also vote against a proposal from the issuer’s board of directors or management. Royce’s portfolio managers decide these issues on a case-by-case basis. A portfolio manager of Royce
may, on occasion, decide to abstain from voting a proxy or a specific proxy item when such person concludes that the potential benefit of voting is outweighed by the cost or when it is not in the client’s best interest to vote.
There may be circumstances where Royce may not be able to vote proxies in a timely manner, including, but not limited to, (i) when certain securities are out on loan at the time of a record date; (ii) when administrative or operational constraints impede Royce’s ability to cast a timely vote, such as late receipt of proxy voting information; and/or (iii) when systems, administrative or processing errors occur (including errors by Royce or third party vendors).
To further Royce’s goal to vote proxies in the best interests of its client, Royce follows specific procedures outlined in the Proxy Voting Procedures to identify, assess and address material conflicts that may arise between Royce’s interests and those of its clients before voting proxies on behalf of such clients. In the event such a material conflict of interest is identified, the proxy will be voted by Royce in accordance with the recommendation given by an independent third party research firm.
You may obtain a copy of the Proxy Voting Procedures at www.roycefunds.com or by calling 212-508-4500. Additionally, you can obtain information on how your securities were voted by calling 212-508-4500.
Item 8. Portfolio Managers of Closed-End Management Investment Companies.
(a)(1) Portfolio Managers of Closed-End Management Investment Companies (information as of December 31, 2016)
Name |
Title |
Length of Service |
Principal Occupation(s) During Past 5 Years |
| Charles M. Royce | Portfolio Manager and Member of the Board of Directors of the Registrant | Since 1986 | Chairman of the Board of Managers of Royce & Associates, LP (“Royce”), Member of the boards of directors/trustees of the Registrant, Royce Micro-Cap Trust, Inc. (“RMT”), Royce Global Value Trust, Inc. ,The Royce Fund , and Royce Capital Fund (collectively, “The Royce Funds”). |
| Chris E. Flynn | Assistant Portfolio Manager* | Since April 1, 2007 | Assistant Portfolio Manager of the Registrant (since April 1, 2007); and Principal, Portfolio Manager and Senior Analyst at Royce (since 1993). |
| David A. Nadel | Assistant Portfolio Manager* | Since April 1, 2007 | Assistant Portfolio Manager of the Registrant (since April 1, 2007); Director of International Research at Royce (since 2010); Portfolio Manager and Senior Analyst at Royce( since 2006); Senior Portfolio Manager at Neuberger Berman Inc. (2004-2006); and Senior Analyst at Pequot Capital Management, Inc. (2001-2003). |
| Lauren A. Romeo | Assistant Portfolio Manager* | Since May 1, 2009 | Assistant Portfolio of the Registrant (since May 1, 2009); Portfolio Manager and Analyst at Royce (since 2004); Portfolio Manager at Dalton, Grenier, Hartman & Maher (since 2001); an Analyst with Legg Mason Funds Management (2000-2001); and an Analyst with T. Rowe Price Group (1996-2000). |
| | * Assistant Portfolio Managers may have investment discretion over a portion of the Registrant’s portfolio subject to the supervision of Registrant’s Portfolio Manager. |
(a)(2) Other Accounts Managed by Portfolio Manager and Potential Conflicts of Interest (information as of December 31, 2016)
Other Accounts
Name of
Portfolio
Manager
|
Type of Account |
Number
of
Accounts
Managed
|
Total
Assets
Managed
|
Number of
Accounts
Managed for which
Advisory Fee is
Performance-Based
| Value of
Managed
Accounts for
which
Advisory Fee is
Performance
Based
|
| Charles M. Royce | | | | | |
| | Registered investment companies | 8 | 9,566,952,204 | 2 | 1,659,712,465 |
| | Private pooled investment vehicles | 1 | 13,281,378 | 1 | 13,281,378 |
| | Other accounts* | 12 | 50,618,847 | - | - |
| | | | | | |
| Chris E. Flynn | | | | | |
| | Registered investment companies | 5 | 4,650,584,448 | 2 | 1,659,712,465 |
| | Private pooled investment vehicles | - | - | - | - |
| | Other accounts* | - | - | - | - |
| | | | | | |
| David A. Nadel | | | | | |
| | Registered investment companies | 3 | 1,459,839,636 | 1 | 1,296,011,712 |
| | Private pooled investment vehicles | - | - | - | - |
| | Other accounts* | - | - | - | - |
| | | | | | |
| Lauren A. Romeo | | | | | |
| | Registered investment companies | 3 | 6,095,999,143 | 1 | 1,296,011,712 |
| | Private pooled investment vehicles | 2 | 507,901,029 | - | - |
| | Other accounts* | - | - | - | - |
| | *Other accounts include all other accounts managed by the Portfolio Manager in either a professional or personal capacity except for personal accounts subject to pre-approval and reporting requirements under the Registrant’s Rule 17j-1 Code of Ethics. |
Conflicts of Interest
The fact that a Portfolio Manager has day-to-day management responsibility for more than one client account may create actual, potential or only apparent conflicts of interest. For example, the Portfolio Manager may have an opportunity to purchase securities of limited availability. In this circumstance, the Portfolio Manager is expected to review each account’s investment guidelines, restrictions, tax considerations, cash balances, liquidity needs and other factors to determine the suitability of the investment for each account and to ensure that his or her managed accounts are treated equitably. The Portfolio Manager may also decide to purchase or sell the same security for multiple managed accounts at approximately the same time. To address any conflicts that this situation may create, the Portfolio Manager will generally combine managed account orders (i.e., enter a “bunched” order) in an effort to obtain best execution or a more favorable commission rate. In addition, if orders to buy or sell a security for multiple accounts managed by common Portfolio Managers on the same day are executed at different prices or commission rates, the transactions will generally be allocated by Royce to each of such managed accounts at the weighted average execution price and commission. In circumstances where a pre-allocated bunched order is not completely filled, each account will normally receive a pro-rated portion of the securities based upon the account’s level of participation in the order. Royce may under certain circumstances allocate securities in a manner other than pro-rata if it determines that the allocation is fair and equitable under the circumstances and does not discriminate against any account.
As described below, there is a revenue-based component of each Portfolio Manager’s Performance-Related Variable Compensation and the Portfolio Managers also receive Firm-Related Variable Compensation based on revenues (adjusted for certain imputed expenses) generated by Royce. In addition, Charles M. Royce receives variable compensation based on Royce’s retained pre-tax profits from operations. As a result, the Portfolio Managers may receive a greater relative benefit from activities that increase the value to Royce of The Royce Funds and/or other Royce client accounts, including, but not limited to, increases in sales of Registrant’s shares and assets under management.
Also, as described above, the Portfolio Managers generally manage more than one client account, including, among others, registered investment company accounts, separate accounts and private pooled accounts managed on behalf of institutions (e.g., pension funds, endowments and foundations) and for high-net-worth individuals. The appearance of a conflict of interest may arise where Royce has an incentive, such as a performance-based management fee (or any other variation in the level of fees payable by the Registrant or other Royce client accounts to Royce), which relates to the management of one or more of The Royce Funds or accounts with respect to which the same Portfolio Manager has day-to-day management responsibilities. Except as described below, no Royce Portfolio Manager’s compensation is tied to performance fees earned by Royce for the management of any one client account. Although variable and other compensation derived from Royce revenues or profits is impacted to some extent, the impact is relatively minor given the small percentage of Royce firm assets under management for which Royce receives performance-measured revenue. Notwithstanding the above, the Performance-Related Variable Compensation paid to Charles M. Royce as Portfolio Manager of two registered investment company accounts (the Registrant and RMT) is based, in part, on performance-based fee revenues. The Registrant and RMT pay Royce a fulcrum fee that is adjusted up or down depending on the performance of the Fund relative to its benchmark index.
Finally, conflicts of interest may arise when a Portfolio Manager personally buys, holds or sells securities held or to be purchased or sold for the Registrant or other Royce client account or personally buys, holds or sells the shares of one or more of The Royce Funds. To address this, Royce has adopted a written Code of Ethics designed to prevent and detect personal trading activities that may interfere or conflict with client interests (including Registrant’s stockholders’ interests). Royce generally does not permit its Portfolio Managers to purchase small- or micro-cap securities for their personal investment portfolios.
Royce and The Royce Funds have adopted certain compliance procedures which are designed to address the above-described types of conflicts. However, there is no guarantee that such procedures will detect each and every situation in which a conflict arises.
(a)(3) Description of Portfolio Manager Compensation Structure (information as of December 31, 2016)
Royce seeks to maintain a compensation program that is competitively positioned to attract and retain high-caliber investment professionals. All Portfolio Managers, receive from Royce a base salary, Portfolio-Related Variable Compensation (generally the largest element of each Portfolio Manager’s compensation with the exception of Charles M. Royce), Firm-Related Variable Compensation based primarily on registered investment company and other client account revenues generated by Royce and a benefits package. Portfolio Manager compensation is reviewed and may be modified from time to time as appropriate to reflect changes in the market, as well as to adjust the factors used to determine variable compensation. Except as described below, each Portfolio Manager’s compensation consists of the following elements:
| - | | BASE SALARY. Each Portfolio Manager is paid a base salary. In setting the base salary, Royce seeks to be competitive in light of the particular Portfolio Manager’s experience and responsibilities. |
| | | |
| - | | PORTFOLIO-RELATED VARIABLE COMPENSATION. Each Portfolio Manager receives quarterly Portfolio-Related Variable Compensation that is either asset-based, or revenue-based and therefore in part based on the value of the net assets of the account for which he or she is being compensated, determined with reference to each of the registered investment company and other client accounts they are managing. The revenue used to determine the quarterly Portfolio-Related Variable Compensation received by Charles M. Royce that relates to each of RMT and RVT is performance-based fee revenue. |
Payment of the Portfolio-Related Variable Compensation may be deferred, and any amounts deferred are forfeitable, if the Portfolio Manager is terminated by Royce with or without cause or resigns. The amount of the deferred Portfolio-Related Variable Compensation will appreciate or depreciate during the deferral period, based on the total return performance of one or more Royce-managed registered investment company accounts selected by the Portfolio Manager at the beginning of the deferral period. The amount deferred will depend on the Portfolio Manager’s total direct, indirect beneficial and deferred unvested investments in the Royce registered investment company accounts for which he or she is receiving portfolio management compensation.
| - | | FIRM-RELATED VARIABLE COMPENSATION. Portfolio Managers receive quarterly variable compensation based on Royce’s net revenues. |
| | | |
| - | | BENEFIT PACKAGE. Portfolio Managers also receive benefits standard for all Royce employees, including health care and other insurance benefits, and participation in Royce’s 401(k) Plan and Money Purchase Pension Plan. From time to time, on a purely discretionary basis, Portfolio Managers may also receive options to acquire stock in Royce’s parent company, Legg Mason, Inc. Those options typically represent a relatively small portion of a Portfolio Manager’s overall compensation. |
(a)(4) Dollar Range of Equity Securities in Registrant Beneficially Owned by Portfolio Manager (information as of December 31, 2016)
The following table shows the dollar range of the Registrant’s shares owned beneficially and of record by the Portfolio Managers, including investments by his immediate family members sharing the same household and amounts invested through retirement and deferred compensation plans.
| Portfolio Manager | Dollar Range of Registrant’s Shares Beneficially Owned |
| Charles M. Royce | Over$1,000,000 |
| Chris E. Flynn | $100,001 to$500,000 |
| David A. Nadel | None |
| Lauren A. Romeo | $100,001 to$500,000 |
(b) Not Applicable
Item 9. Purchases of Equity Securities by Closed-End Management Investment Company and Affiliated Purchasers. Not Applicable
Item 10. Submission of Matters to a Vote of Security Holders. Not Applicable.
Item 11. Controls and Procedures.
(a) Disclosure Controls and Procedures. The Principal Executive and Financial Officers concluded that the Registrant’s Disclosure Controls and Procedures are effective based on their evaluation of the Disclosure Controls and Procedures as of a date within 90 days of the filing date of this report.
(b) Internal Control over Financial Reporting. There were no significant changes in Registrant’s internal control over financial reporting or in other factors that could significantly affect this control subsequent to the date of the evaluation, including any corrective actions with regard to significant deficiencies and material weaknesses during the second fiscal quarter of the period covered by this report.
Item 12. Exhibits. Attached hereto.
(a)(1) The Registrant’s code of ethics pursuant to Item 2 of Form N-CSR.
(a)(2) Separate certifications by the Registrant’s Principal Executive Officer and Principal Financial Officer as required by Rule 30a-2(a) under the Investment Company Act of 1940.
(a)(3) Not Applicable
(b) Separate certifications by the Registrant’s Principal Executive Officer and Principal Financial Officer, pursuant to Section 906 of the Sarbanes-Oxley Act of 2002 and required by Rule 30a-2(b) under the Investment Company Act of 1940.
Pursuant to the requirements of the Securities Exchange Act of 1934 and the Investment Company Act of 1940, the registrant has duly caused this report to be signed on its behalf by the undersigned, thereunto duly authorized.
ROYCE VALUE TRUST, INC.
| BY: /s/ Christopher D. Clark |
| Christopher D. Clark |
| President |
Date: March 3, 2017
Pursuant to the requirements of the Securities Exchange Act of 1934 and the Investment Company Act of 1940, this report has been signed below by the following persons on behalf of the registrant and in the capacities and on the dates indicated.
| ROYCE VALUE TRUST, INC. | | ROYCE VALUE TRUST, INC. |
| | | |
| BY: /s/ Christopher D. Clark | | BY: /s/ Peter K. Hoglund |
| Christopher D. Clark | | Peter K. Hoglund |
| President | | Treasurer |
| | | |
| Date: March 3, 2017 | | Date: March 3, 2017 |