UNITED STATES
SECURITIES AND EXCHANGE COMMISSION
Washington, D.C. 20549
FORM N-CSR
CERTIFIED SHAREHOLDER REPORT
OF
REGISTERED MANAGEMENT INVESTMENT COMPANIES
Investment Company Act File Number: 811-04875
Name of Registrant: Royce Value Trust, Inc.
Address of Registrant: 745 Fifth Avenue
New York, NY 10151
| Name and address of agent for service: | | John E. Denneen, Esquire
745 Fifth Avenue
New York, NY 10151 |
Registrant’s telephone number, including area code: (212) 508-4500
Date of fiscal year end: December 31
Date of reporting period: January 1, 2018 – December 31, 2018
Item 1. Reports to Shareholders.
| | | DECEMBER 31, 2018 |
| | | |
| | | |
| | | |
| | | 2018 Annual |
| | | Review and Report to Stockholders |
| | | |
| | | |
| | | |
| | | |
| | | | |
| | | | |
| | | | |
| | | Royce Global Value Trust | |
| | | | | |
| | | Royce Micro-Cap Trust | |
| | | | | |
| | | Royce Value Trust | |
| | | | | |
| | | | |
| | | | | |
| | | | |
| | | | | |
| | | | |
| | | | | |
| | | | |
| | | | | |
| | | | |
| | | | | |
| | | | |
| | | | | |
| | | | |
| | | | | |
| | | | |
| | | | | |
| | | | |
| | | | | |
| | | | |
| | | | | |
| | | | |
| | | | | |
| | | | |
| | | | | |
| | | | |
| | | | | |
| | | Beginning on January 1, 2021, as permitted by regulations adopted by the U.S. Securities and Exchange Commission, paper copies of the Funds’ shareholder reports like this one will no longer be sent by mail, unless you specifically request paper copies of the reports from the Funds or from your financial intermediary (such as a broker-dealer or bank). Instead, the reports will be made available on the Funds’ website (www.roycefunds.com), and you will be notified by mail each time a report is posted and provided with a website link to access the report. If you already elected to receive shareholder reports electronically, you will not be affected by this change and you need not take any action. You may elect to receive shareholder reports and other communications from the Funds electronically anytime by contacting your financial intermediary or, if you are a direct investor with the Funds, by calling 1-800-841-1180. Beginning on January 1, 2019, you may elect to receive all future reports in paper free of charge. If you invest through a financial intermediary, you can contact your financial intermediary to request that you continue to receive paper copies of your shareholder reports. If you invest directly with the Funds, you can call 1-800-841-1180 to let the Funds know you wish to continue receiving paper copies of your shareholder reports. Your election to receive reports in paper will apply to all Funds held in your account if you invest through your financial intermediary or all Funds held with our fund complex if you invest directly with the Funds. | |
| | | | | |
| | | | | |
| | | | | |
| | | roycefunds.com |  |
| | | | | |
| | | | | |
| | | | | |
| | | | | |
| | | | | |
| |
| |
| A Few Words on Closed-End Funds |
| |
Royce & Associates, LP manages three closed-end funds: Royce Global Value Trust, which invests primarily in companies with headquarters outside of the United States, Royce Micro-Cap Trust, which invests primarily in micro-cap securities; and Royce Value Trust, which invests primarily in small-cap securities. A closed-end fund is an investment company whose shares are listed and traded on a stock exchange. Like all investment companies, including open-end mutual funds, the assets of a closed-end fund are professionally managed in accordance with the investment objectives and policies approved by the fund’s Board of Directors. A closed-end fund raises cash for investment by issuing a fixed number of shares through initial and other public offerings that may include shelf offerings and periodic rights offerings. Proceeds from the offerings are invested in an actively managed portfolio of securities. Investors wanting to buy or sell shares of a publicly traded closed-end fund after the offerings must do so on a stock exchange, as with any publicly traded stock. Shares of closed-end funds frequently trade at a discount to their net asset value. This is in contrast to open-end mutual funds, which sell and redeem their shares at net asset value on a continuous basis. |
| |
| |
| A Closed-End Fund Can Offer Several Distinct Advantages | | Why Dividend Reinvestment Is Important |
| • | A closed-end fund does not issue redeemable securities or offer its securities on a continuous basis, so it does not need to liquidate securities or hold uninvested assets to meet investor demands for cash redemptions. | | A very important component of an investor’s total return comes from the reinvestment of distributions. By reinvesting distributions, our investors can maintain an undiluted investment in a Fund. To get a fair idea of the impact of reinvested distributions, please see the charts on pages 54 and 55. For additional information on the Funds’ Distribution Reinvestment and Cash Purchase Options and the benefits for stockholders, please see page 64 or visit our website at www.roycefunds.com.
Managed Distribution Policy
The Board of Directors of each of Royce Micro-Cap Trust and Royce Value Trust has authorized a managed distribution policy (“MDP”). Under the MDP, Royce Micro-Cap Trust and Royce Value Trust pay quarterly distributions at an annual rate of 7% of the average of the prior four quarter-end net asset values, with the fourth quarter being the greater of these annualized rates or the distribution required by IRS regulations. With each distribution, the Fund will issue a notice to its stockholders and an accompanying press release that provides detailed information regarding the amount and composition of the distribution (including whether any portion of the distribution represents a return of capital) and other information required by a Fund’s MDP. You should not draw any conclusions about a Fund’s investment performance from the amount of distributions or from the terms of a Fund’s MDP. A Fund’s Board of Directors may amend or terminate the MDP at any time without prior notice to stockholders; however, at this time there are no reasonably foreseeable circumstances that might cause the termination of any of the MDPs. |
| |
| • | In a closed-end fund, not having to meet investor redemption requests or invest at inopportune times can be effective for value managers who attempt to buy stocks when prices are depressed and sell securities when prices are high. | | |
| |
| • | A closed-end fund may invest in less liquid portfolio securities because it is not subject to potential stockholder redemption demands. This is potentially beneficial for Royce-managed closed-end funds, with significant investments in small- and micro-cap securities. | | |
| |
| • | The fixed capital structure allows permanent leverage to be employed as a means to enhance capital appreciation potential. | | |
| |
| • | Royce Micro-Cap Trust and Royce Value Trust distribute capital gains, if any, on a quarterly basis. Each of these Funds has adopted a quarterly distribution policy for its common stock. | | |
| |
| We believe that the closed-end fund structure can be an appropriate investment for a long-term investor who understands the benefits of a more stable pool of capital. | | |
| |
| |
| |
| |
| |
| This page is not part of the 2018 Annual Report to Stockholders | | |
| |
| Table of Contents | | | |
| | | | |
| | | | |
| Annual Review | | | |
| | | | |
| Letter to Our Stockholders | | 2 | |
| | | | |
| Performance | | 7 | |
| | | | |
| Annual Report to Stockholders | | | |
| | | | |
| Royce Global Value Trust | | | |
| | | | |
Manager’s Discussion of Fund Performance | | 8 | |
| | | | |
Schedule of Investments | | 10 | |
| | | | |
Other Financial Statements | | 14 | |
| | | | |
| Royce Micro-Cap Trust | | | |
| | | | |
Manager’s Discussion of Fund Performance | | 24 | |
| | | | |
Schedule of Investments | | 26 | |
| | | | |
Other Financial Statements | | 31 | |
| | | | |
| Royce Value Trust | | | |
| | | | |
Manager’s Discussion of Fund Performance | | 42 | |
| | | | |
Schedule of Investments | | 44 | |
| | | | |
Other Financial Statements | | 49 | |
| | | | |
| History Since Inception | | 60 | |
| | | | |
| Distribution Reinvestment and Cash Purchase Options | | 62 | |
| | | | |
| Directors and Officers | | 63 | |
| | | | |
| Notes to Performance and Other Important Information | | 64 | |
| | | | |
| Board Approval of Investment Advisory Agreement | | 65 | |
| | | | |
| Results of Stockholders Meeting | | 66 | |

| This page is not part of the 2018 Annual Report to Stockholders |
Letter to Our Stockholders
2018: ANNUS HORRIBILIS
This was quite a memorable year for the equity markets—for reasons most investors would prefer to forget. A bull market ended with a bang that left many investors whimpering. Of course, the end of any upswing for share prices is bound to be disappointing—what made this pullback so jarring was its speed and severity. Back in the summer, everyone seemed to agree that valuations were stretched to the point where an adjustment to prices was all but inevitable, yet the force of the decline felt more like the engine of a precision-engineered sports car suddenly seizing than the anticipated tapping of the brakes. So while 2018’s downturn initially looked as if it would assume a place among the most predicted in history, no one, including us, was expecting a fall as steep and fast as this one has been. It has also, however, performed the role down markets do—which is to provide active managers with an ample supply of potential long-term opportunities.
Part of the reason the jolt was so unexpected may be due to the placid nature of the bull market it wrenched to a stop. For much of 2018, the U.S. market cruised confidently ahead, with very little |
congestion and few potholes. Through the first three quarters of the year, volatility barely registered in the small-cap market, with only 22% of the trading days having intraday moves of at least 1% in the small-cap Russell 2000 Index (and our chosen asset class has historically been the most volatile precinct of the equity world). Of course, this all changed dramatically later in the year. For small-caps, it began after the Russell 2000 reached an all-time high on August 31, following which a wave of volatility hit. In the fourth quarter, 54% of the trading days for the Russell 2000 had intraday moves of at least 1%.
The volatility itself would have perhaps been more bearable if it had not also taken returns in the year’s last three months from ‘bad’ to ‘historically awful’—the Russell 2000 fell 20.2% for the fourth quarter. Its worst month by far was December. In fact, the first few months of the corrective phase had enough push and pull that the year-to-date return at the end of November for the Russell 2000 was 1.0%. From our perspective, then, the downturn had |
| 2 | This page is not part of the 2018 Annual Report to Stockholders |
LETTER TO OUR STOCKHOLDERS
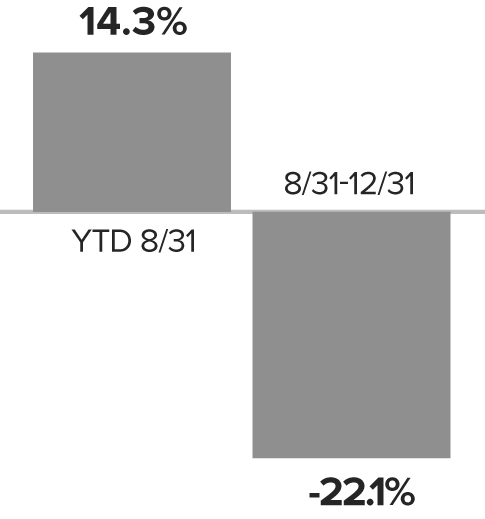
| two phases—the first was the widely expected recalibration from late August through mid-December. The second was a blur of panic selling between December 12th and 24th. Losses mounted as the gentler descent of the initial stage gave way to a wild downhill. The markets careened down the slope at breakneck speed as the calendar approached year-end, with small-caps reaching a 2018 bottom on Christmas Eve before stabilizing over the next week, giving the Russell 2000 a loss of 11.9% for December. In the context of its 11.0% decline for calendar 2018, it may be easy to forget that year-to-date through August 31, the Russell 2000 was up 14.3%. |
| |
A Tale of Two Markets
Russell 2000 2018 |
| So 2018 was truly A Tale of Two Markets, and offered yet another lesson from history that the market can—and often does—turn in a hurry. For an additional sense of the tumult and—we want to stress again—the opportunities the correction created, consider that the average stock in the Russell 2000 declined 37.2% from its previous 52-week high through year-end. Many declined more than that: energy stocks in the Russell 2000 fell more than 50%, materials slid 42.5%, and transportation was down 42.3% from their respective highs. |
Retrospect offers the opportunity to look at the contour of the correction and at the confluence of factors that may have led to and exacerbated it. In spite of its historic awfulness, the downturn displayed some familiar traits: small-caps lost more than large-caps, for example, which is consistent with most bear markets, as is the fact that small-caps entered ‘classic’ bear market territory before their larger counterparts. (By a ‘classic’ bear, we mean a decline of 20% or more from a previous peak—the Russell 2000 lost 22.1% from 8/31/18-12/31/18.) Within small-cap, we also saw value beat
| |
| A Familiar Pattern in 4Q18 Decline |
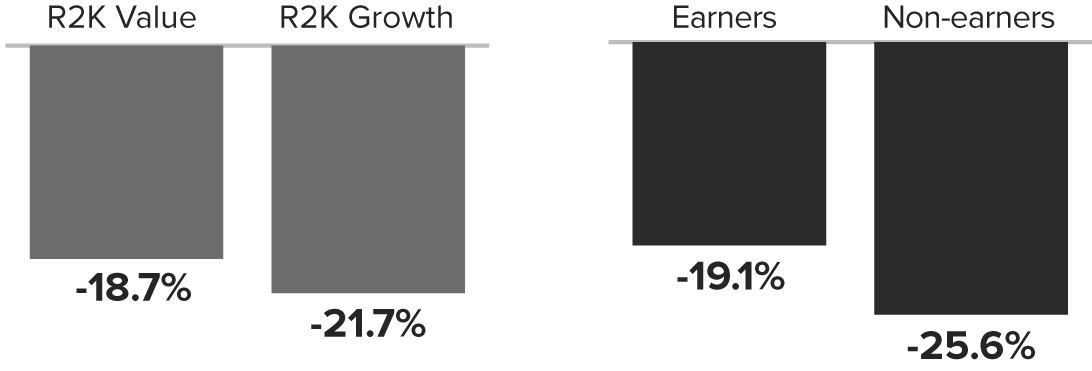
growth, dividend payers lose less than non-payers, earners hold up better than non-earners, and defensives outpace cyclicals. All of this is also essentially consistent with history, which was reassuring (though painful in the short run).
Identifying this mix of the familiar and the unexpected helps to shed light on the question of what drove shares down in such precipitous fashion, turning what at first looked like a historically typical bull market detour into the bear market ditch. First, there was the by-now familiar cloud of tariffs and trade wars looming over the market, arguably the major factor in underperformance for economically sensitive cyclical stocks in 2018. Oil prices began to collapse in October, while shortly afterward slowdowns were reported in both housing and auto sales. Consumer confidence began to dip, and Europe and China continued to weaken. Yet all of this was, if not old news, then at least well established news by the end of November. Moreover, much of the economic news in the U.S. remained positive. Job and wage gain growth remained robust (as they continue to do as of this writing) as did corporate profits.
In mid-December, however, other factors came into play that helped to bring the witches’ brew to a boil. Investors looked at the coincidence of a flattening yield curve and the abrupt drop in oil prices as a surefire recession warning. Ratcheting up the already high level of anxiety, the December Fed meeting announcement and subsequent press conference were widely seen as conveying an unhealthy detachment from current financial conditions, which exacerbated the downward spiral. This is how ‘bad’ became ‘worse.’ |
| This page is not part of the 2018 Annual Report to Stockholders | 3 |
LETTER TO OUR STOCKHOLDERS
| A SENSE OF WHERE WE ARE |
| A month into 2019, which featured a welcome rally that recovered most of December’s losses, the signals remain decidedly mixed. The PMI (Purchasing Managers’ Index) report for December issued in early January perhaps best distills the mixed, if not confusing, state of play in the U.S. economy. The report is designed to show the health of the manufacturing and service sectors. The index hit a 15-month low in December, which is admittedly concerning, especially given the marked fall-off from November. However, of its 18 manufacturing sectors, 11 showed growth in December. Additionally, the 54.1% number reported for that month was comfortably in the range of a growing economy because any number north of 50% typically indicates growth. Even with the uncertain course of U.S. growth, it seems clear to us that in 2018 many investors reacted as if the economy has only two gears—forward and reverse. |
| We see a more nuanced picture that’s closer to the midpoint of these extremes. The economy looks essentially healthy and |
| capable of expansion to us, though probably at a slower pace than we saw over the last two years. There are undoubtedly risks on the horizon—political, financial, and economic. Yet we believe that these have already been reflected, in some cases excessively so, in current small-cap valuations. The market shifted in short order from a period when small-cap’s extended valuations seemed out of sync in light of the index’s high levels of debt and low profitability, to one at the end of the year when valuations reflected more pessimism than we think is warranted—at least in select instances. |
THE LESSONS OF HISTORY |
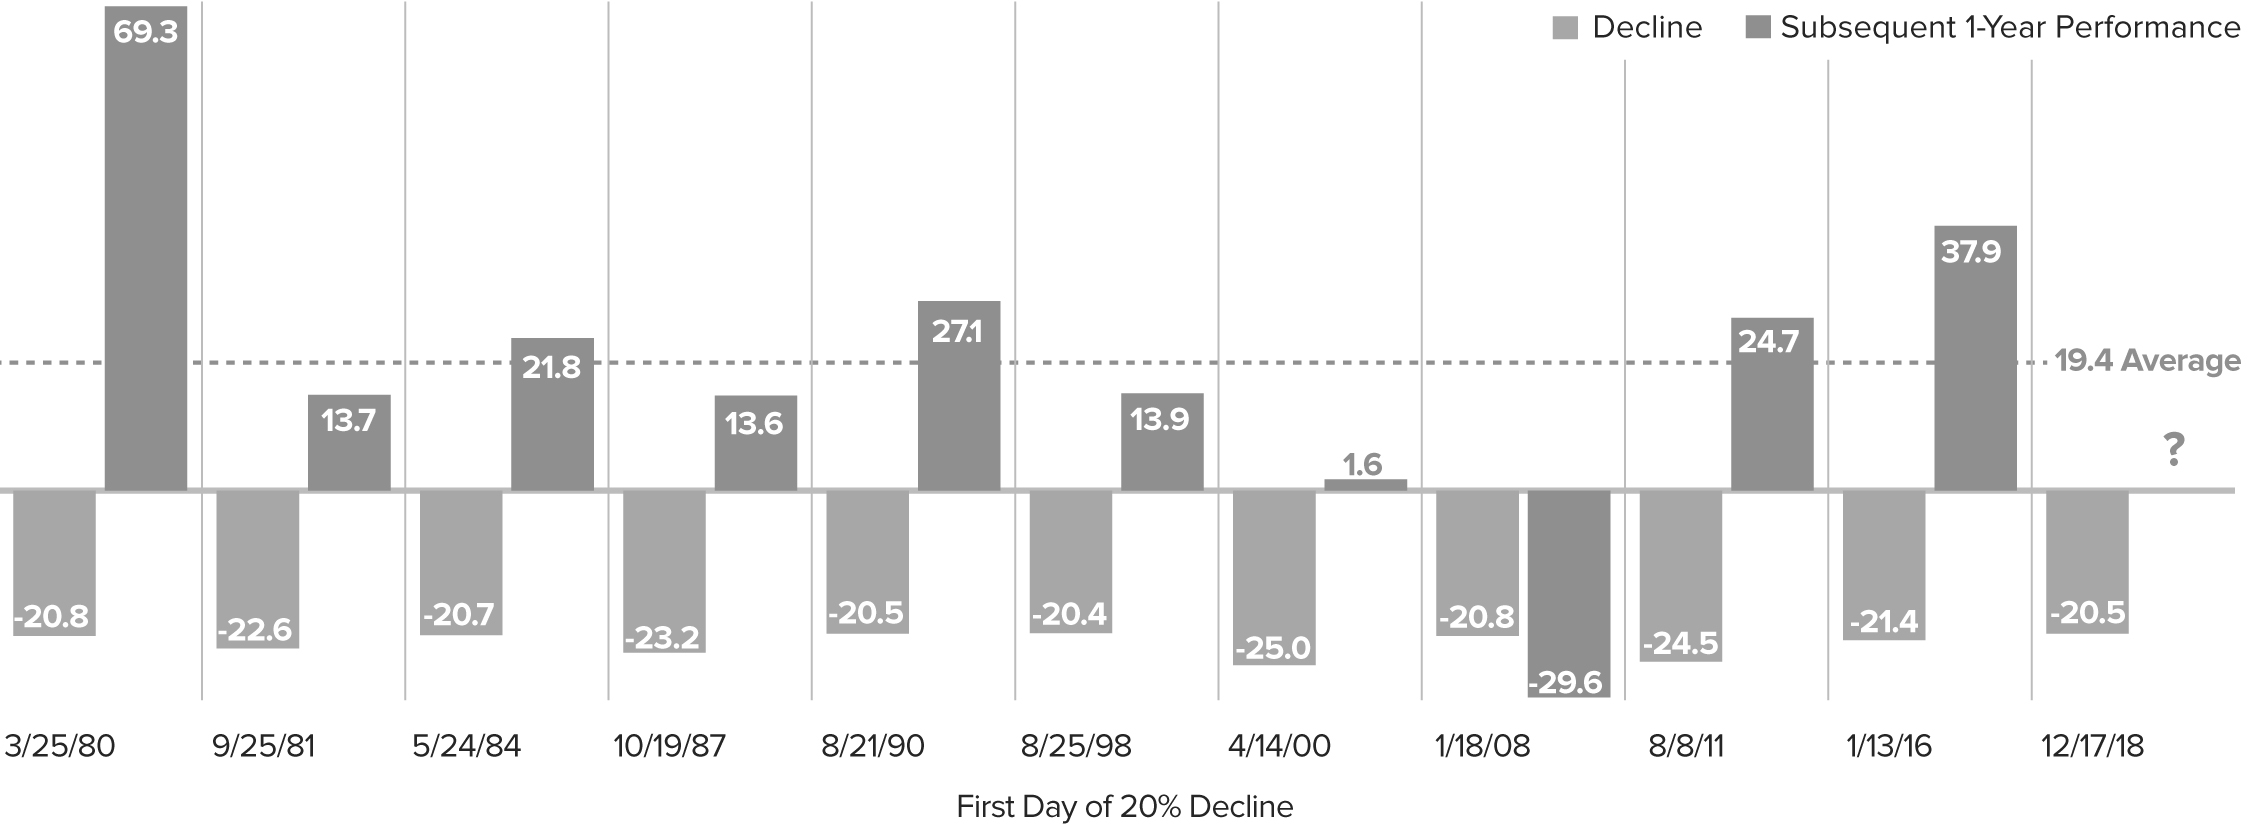
| We examined the recent bear phase from a calendar-year and market cycle perspective and uncovered encouraging data. First, 2018 was the twelfth negative calendar year in the 40-year history of the Russell 2000. In 10 of the previous 11 years, a positive calendar-year return followed—with an average one-year return of 21.1%. (Unsurprisingly, the lone exception was 2007-08.) Turning to market cycles also shows compelling positive news. 2018 saw the |
| |
After the Bear Market, Then What?
Subsequent 1-Year Performance of Russell 2000 after a 20% Decline as of 12/31/18 |
| 4 | This page is not part of the 2018 Annual Report to Stockholders |
LETTER TO OUR STOCKHOLDERS
There are undoubtedly risks on the horizon—political, financial, and economic. Yet we believe that these have already been reflected, in some cases excessively so, in current small-cap valuations.
eleventh decline of 20% or more from a previous small-cap peak. In nine of the previous 10 periods, the subsequent average one-year return from the first day on which the index declined 20% from its peak was a positive 19.4%. (The exception, again unsurprisingly, came in 2008-09.) These historical examples certainly suggest the possibility of a solid 2019.
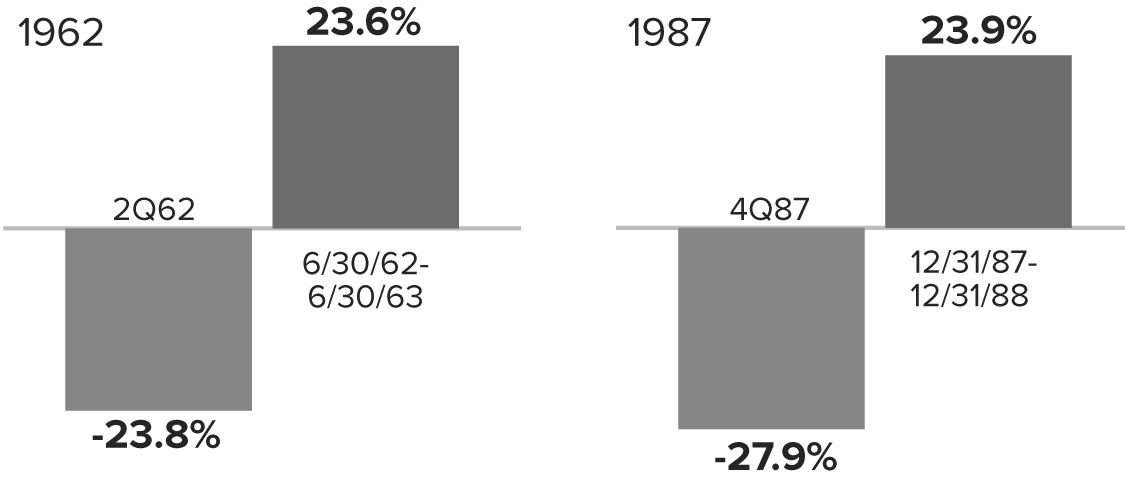
To be sure, our belief is that we are a long way from the crisis era of a decade ago. We are also in a stronger position economically than we were in the two prior bear markets in 2011-12 or 2015-16. In fact, we see the closest historical parallels farther back. In our view, 1987 or 1962 are the more relevant comparisons—two cases in which the markets experienced a deep decline before recovering in the midst of a still growing economy. |
| |
Historical Comparison
CRSP 6-10 Declines and Subsequent 12-Month Performance |
| Moreover, we also see little resemblance between the present and prior bearish periods such as 1998, 2001-02, or 2008-09, when there were more than enough reasons for investors to sell in the form of financial crises and/or recessions (while contrarians like us were casting about for opportunities). It’s worth emphasizing that the only decline over the last 10-plus years that featured both a recession and a financial crisis was 2008-09. Unless investors are expecting something in the way of a repeat performance—and we |
| are obviously not—history suggests this may be a good time to consider committing more money to small-caps. |
A DELIBERATE PACE ON THE ROAD TO NORMAL
We would, however, add a note or two mixing intermediate-term caution for the small-cap market with long-term optimism for small-cap active management. 2019 may well be a terrific year for small-cap performance, particularly if January is any kind of bellwether. However, we suspect that annualized small-cap returns over the next three to five years may be in the mid to high single digits. From our perspective as disciplined small-cap specialists, this is not necessarily bad news. Lower-than-average returns for the Russell 2000 have historically benefited active management approaches, including a number of our own strategies, especially coming out of periods of deep pessimism such as we saw late in 2018, when investors often miss the long-term opportunities falling markets create.
We also believe that the long and winding road back to more normal terrain for the capital markets will be marked by three occurrences: a normalizing rate structure, with rates moving higher, resulting in a steepening yield curve; more historically average levels of volatility (which was higher in 2018 than it was over the previous two years); and the more historically typical returns that we mentioned above. All three of these market conditions have been supportive for small-cap active management in the past.
The overall state of small-cap, however, still has several unresolved issues. Of the three that worried us most about the Russell 2000 over the summer—lofty valuations, many companies with barely manageable debt, and too many with no earnings—only the first is no longer a pressing matter. We think that the fundamentals we value most—such as high returns on invested |
| This page is not part of the 2018 Annual Report to Stockholders | 5 |
LETTER TO OUR STOCKHOLDERS
Across each of our small-cap strategies, we are confident in our holdings, which generally possess some combination of solid cash flows, modest valuations, effective managements, and encouraging prospects. These are the businesses that look most likely to weather or even thrive in a period with even more volatility and uncertainty than usual.
| capital, positive cash flow, and an identifiable catalyst (or two) for earnings growth or recovery—should be rewarded in the coming market environment, as they have often been over the long term. |
IDENTIFYING OPPORTUNITIES IN A VOLATILE CLIMATE
In all of our strategies, we’ve been working to take advantage of long-term buying opportunities across a broad spectrum of sectors and industries. This includes companies involved in energy services, RV parts, infrastructure, laser-based photonics, shipping, trucking, banking, outpatient healthcare facilities that bend the cost curve, and semiconductor capital equipment, to name just a few. Within our high-quality strategies, we’ve also been buying more of the companies that we know best, those in which we have the highest confidence, because of their demonstrated ability to deal effectively with adversity in previous down markets.
Within these cyclical sectors, especially in the broad industrial and technology spaces, there are diverse industry groups with distinct business cycle dynamics. Each responds to multiple company- or industry-specific factors that help to determine performance as a |
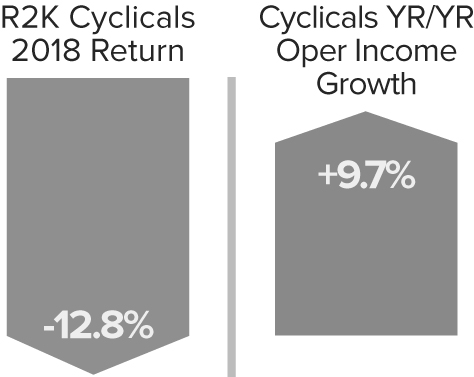
| business—they seldom march in lockstep. That diversity is very attractive to us as selective active managers. So while there’s no question that we were incorrect in thinking that investors would more readily recognize and then close the gap between operating income and stock prices, we think that many small-cap cyclical companies were disproportionately punished in the downturn to the point where many look as if a recession has already been priced in—which makes them even more attractive to us. |
| |
| Cyclical Market Disconnect |
| Across each of our small-cap strategies, we are confident in our holdings, which generally possess some combination of solid cash flows, modest valuations, effective managements, and encouraging prospects. These are the businesses that look most likely to weather or even thrive in a period with even more volatility and uncertainty than usual. |
 | |  | |  |
| Charles M. Royce | | Christopher D. Clark | | Francis D. Gannon |
| Chairman, | | Chief Executive Officer, and | | Co-Chief Investment Officer, |
| Royce & Associates, LP | | Co-Chief Investment Officer, | | Royce & Associates, LP |
| | | Royce & Associates, LP | | |
| | | | | |
| January 31, 2018 | | | | |
| 6 | This page is not part of the 2018 Annual Report to Stockholders |
Performance
| |
| NAV Average Annual Total Returns |
| As of December 31, 2018 (%) |
| | | 1-YR | | 3-YR | | 5-YR | | 10-YR | | 15-YR | | 20-YR | | 25-YR | | 30-YR | | SINCE
INCEPTION | | INCEPTION
DATE |
| |
| Royce Global Value Trust1 | | -16.11 | | 6.91 | | 2.04 | | N/A | | N/A | | N/A | | N/A | | N/A | | 2.49 | | 10/17/13 |
| |
| Royce Micro-Cap Trust | | -11.62 | | 8.25 | | 3.01 | | 13.07 | | 7.38 | | 9.39 | | 10.09 | | N/A | | 10.08 | | 12/14/93 |
| |
| Royce Value Trust | | -14.45 | | 9.00 | | 3.70 | | 12.14 | | 7.17 | | 8.42 | | 9.34 | | 10.20 | | 9.94 | | 11/26/86 |
| |
| INDEX | | | | | | | | | | | | | | | | | | | | |
| |
| MSCI ACWI Small Cap Index | | -14.39 | | 5.75 | | 3.56 | | 11.81 | | 8.01 | | 7.92 | | N/A | | N/A | | N/A | | N/A |
| |
| Russell Global Small Cap Index | | -15.30 | | 5.21 | | 2.67 | | 10.30 | | 7.00 | | 7.14 | | N/A | | N/A | | N/A | | N/A |
| |
| Russell Microcap Index | | -13.08 | | 5.79 | | 3.08 | | 11.71 | | 5.67 | | N/A | | N/A | | N/A | | N/A | | N/A |
| |
| Russell 2000 Index | | -11.01 | | 7.36 | | 4.41 | | 11.97 | | 7.50 | | 7.40 | | 8.28 | | 9.21 | | N/A | | N/A |
| |
1 The Fund’s previous benchmark index, the Russell Global Small Cap Index, was discontinued by FTSE Russell effective December 31, 2018. As of this same date, the MSCI ACWI Small Cap Index is the Fund’s new benchmark. Important Performance and Risk Information
All performance information in this Review and Report reflects past performance, is presented on a total return basis, net of the Fund’s investment advisory fee, and reflects the reinvestment of distributions. Past performance is no guarantee of future results. Investment return and principal value of an investment will fluctuate, so that shares may be worth more or less than their original cost when sold. Current performance may be higher or lower than performance quoted. Current month-end performance may be obtained at www.roycefunds.com. The Funds are closed-end registered investment companies whose respective shares of common stock may trade at a discount to the net asset value. Shares of each Fund’s common stock are also subject to the market risk of investing in the underlying portfolio securities held by each Fund. Certain immaterial adjustments were made to the net assets of Royce Value Trust at 6/30/18, for financial reporting purposes, and as a result the total return based on that net asset value differs from the adjusted net asset value and total return reported in the Financial Highlights. All indexes referenced are unmanaged and capitalization-weighted. Each index’s returns include net reinvested dividends and/or interest income. Source: MSCI. MSCI makes no express or implied warranties or representations and shall have no liability whatsoever with respect to any MSCI data contained herein. The MSCI data may not be further redistributed or used as a basis for other indexes or any securities or financial products. This report is not approved, endorsed, reviewed or produced by MSCI. None of the MSCI data is intended to constitute investment advice or a recommendation to make (or refrain from making) any kind of investment decision and may not be relied on as such. Russell Investment Group is the source and owner of the trademarks, service marks and copyrights related to the Russell Indexes. Russell® is a trademark of Russell Investment Group. The Russell 2000 Index is an index of domestic small-cap stocks that measures the performance of the 2,000 smallest publicly traded U.S. companies in the Russell 3000 Index. The Russell Microcap Index includes 1,000 of the smallest securities in the small-cap Russell 2000 Index, along with the next smallest eligible securities as determined by Russell. The Russell Global Small Cap Index is an unmanaged, capitalization-weighted index of global small-cap stocks. The MSCI ACWI Small Cap Index is an unmanaged, capitalization-weighted index of global small-cap stocks. The performance of an index does not represent exactly any particular investment, as you cannot invest directly in an index. Index returns include net reinvested dividends and/or interest income. Royce Value, Micro-Cap and Global Value Trust shares of common stock trade on the NYSE. Royce Fund Services, LLC (“RFS”) is a member of FINRA and files certain material with FINRA on behalf of each Fund. RFS is not an underwriter or distributor of any of the Funds.
| This page is not part of the 2018 Annual Report to Stockholders | 7 |
| MANAGERS’ DISCUSSION |
| Royce Global Value Trust (RGT) |
 |
Chuck Royce
David Nadel |
| |
| FUND PERFORMANCE |
| In a challenging year for small-caps all over the world, Royce Global Value Trust fell 16.1% on an NAV (net asset value) basis and 17.5% based on market price for 2018, trailing both its new benchmark, the MSCI ACWI Small Cap Index, which declined 14.4%, and the Russell Global Small Cap Index (which Russell Investments has discontinued), which fell 15.3% for the same period. However, the Fund was ahead of both benchmarks on an NAV and market price basis for the three-year period ended December 31, 2018. |
| |
| WHAT WORKED... AND WHAT DIDN’T |
| All of the Fund’s 11 equity sectors detracted from 2018’s results. Industrials had by far the largest negative impact, followed by Financials, Information Technology, and Materials. At the industry level, capital markets (Financials) detracted most, with machinery (Industrials) and electronic equipment, instruments & components also having sizable negative effects. |
| At the position level, CIRCOR International, which makes valves for fluid control systems, detracted most. Its shares fell in the fourth quarter amid concerns that slowing global growth, U.S.-China trade tensions, and the significant drop in oil prices—energy companies being among its larger end markets—would put a damper on CIRCOR’s positive order trends, pushing out a long-awaited improvement in profit margins and free cash flow earmarked for debt reduction. Computer Modelling Group is a Canadian software company whose products help oil companies maximize extractions. Its shares slumped in the second half due to its exposure to the energy industry, which was hurt by falling oil prices, and some slight disappointments in revenues and earnings. Based on its lack of debt, relatively high annual dividend, and strong position in a highly specialized niche, we liked its long-term prospects at year-end. |
| SEI Investments runs a diverse business that provides investment processing, investment management, and investment operations solutions to clients around the globe. With products and services knit into the operations of several customers, SEI has what we think is a strong niche that’s built for the long term. Concerns about future spending levels from its primary client base as well as a second-quarter earnings disappointment led investors to mostly avoid its stock through the first three quarters of 2018, before its shares slumped further during the downturn, along with most other companies associated with asset management. Air Lease is a leading aircraft leasing business that saw its shares lose altitude throughout the year, particularly in December, when the airline industry came under considerable pressure throughout the eurozone, which resulted in the shuttering of a number of poorly capitalized carriers. Though Air Lease was less exposed to this dynamic, there were concerns among investors that a similar trend would materialize in other geographies. Confident in the potential for its shares to rise when tailwinds return to its business, we increased our stake in 2018. |
| The portfolio’s top positive contributor was Australia’s Bravura Solutions, which makes software that focuses on the wealth management and investment fund administration markets. It has what we like in its industry—a market and product application we can readily understand that also delivers mission-critical customer benefits. The company offers a market-leading product, developed after a multi-year period of substantial R&D, and was able to take market share in a growing market. Based in New York City, Virtu Financial uses its technology to act as a market maker and liquidity provider to the global financial markets. Virtu announced impressive first-quarter results in profits and earnings, thanks to increased volatility, high trading volumes, and better-than-expected progress integrating a large acquisition. Its shares then advanced in the fourth quarter as its business model again benefited from increased volatility. |
| Relative to the MSCI ACWI Small Cap, RGT suffered most from sector allocation as stock selection was additive in 2018. The portfolio’s biggest source of underperformance on the sector level came from our underweight and ineffective stock picking in Real Estate while stock selection also hurt in Communication Services and Health Care. Conversely, the Fund benefited from savvy stock selection, most impactfully in Industrials, Energy, Financials, and Consumer Discretionary. |
| | | | | |
| | Top Contributors to Performance | | | |
| | For 2018 (%)1 | | | |
| | | | | |
| | Bravura Solutions | | 0.44 | |
| | | |
| | Virtu Financial Cl. A | | 0.44 | |
| | | |
| | Sartorius Stedim Biotech | | 0.28 | |
| | | |
| | Trade Me Group | | 0.26 | |
| | | |
| | Radisson Hospitality | | 0.23 | |
| | | |
| | 1 Includes dividends | | | |
| | Top Detractors from Performance | | | |
| | For 2018 (%)2 | | | |
| | | | | |
| | CIRCOR International | | -0.57 | |
| | | |
| | Computer Modelling Group | | -0.50 | |
| | | |
| | SEI Investments | | -0.50 | |
| | | |
| | Air Lease Cl. A | | -0.43 | |
| | | |
| | Ferroglobe | | -0.39 | |
| | | |
| | 2 Net of dividends | | | |
| | | | | |
| CURRENT POSITIONING AND OUTLOOK |
| While we acknowledge the many potential of risk on the horizon—economic, geopolitical, and financial—we also think that these concerns have already been reflected, perhaps even excessively so, in current valuations. In relatively short order, we transitioned from a period this summer when domestic small-cap’s extended valuations seemed out of sync given the index’s high levels of debt and low profitability, to one at the end of the year where valuations seemed more pessimistic than we think is warranted—at least in select instances. As a result, we put cash to work as we identified what we thought were terrific opportunities to the point where the Fund was fully invested at year-end. Down years for small-caps have often been followed by strong ones. We believe that the portfolio’s cyclical approach to global small-caps will be rewarded as recessionary concerns dissipate during the year. |
| 8 | 2018 Annual Report to Stockholders |
| PERFORMANCE AND PORTFOLIO REVIEW | | SYMBOLS MARKET PRICE RGT NAV XRGTX |
| Performance |
| Average Annual Total Return (%) Through 12/31/18 |
| | | JUL-DEC 20181 | | 1-YR | | 3-YR | | 5-YR | | SINCE INCEPTION (10/17/13) |
| |
| RGT (NAV) | | -15.37 | | -16.11 | | 6.91 | | 2.04 | | 2.49 |
| |
| 1 Not annualized | | | | | | | | | | |
Market Price Performance History Since Inception (10/17/13)
Cumulative Performance of Investment1

1 Reflects the cumulative performance experience of a continuous common stockholder who purchased one share at inception ($8.975 IPO) and reinvested all distributions.
2 Reflects the actual month-end market price movement of one share as it has traded on NYSE and, prior to 12/1/03, on the Nasdaq. |
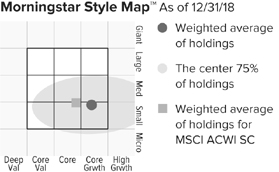
The Morningstar Style Map is the Morningstar Style BoxTM with the center 75% of fund holdings plotted as the Morningstar Ownership ZoneTM. The Morningstar Style Box is designed to reveal a fund’s investment strategy. The Morningstar Ownership Zone provides detail about a portfolio’s investment style by showing the range of stock sizes and styles. The Ownership Zone is derived by plotting each stock in the portfolio within the proprietary Morningstar Style Box. Over time, the shape and location of a fund’s ownership zone may vary. See page 64 for additional information. |
| |
| Top 10 Positions | | |
| % of Net Assets | | |
| | | |
| FLIR Systems | | 2.3 |
| |
| Kirby Corporation | | 2.0 |
| |
| Ashmore Group | | 1.8 |
| |
| Virtu Financial Cl. A | | 1.8 |
| |
| Raven Industries | | 1.3 |
| |
| Spirax-Sarco Engineering | | 1.3 |
| |
| STRATEC Biomedical | | 1.3 |
| |
| TGS-NOPEC Geophysical | | 1.2 |
| |
| Lindsay Corporation | | 1.2 |
| |
| TOTVS | | 1.2 |
| |
| |
| Portfolio Sector Breakdown | | |
| % of Net Assets | | |
| | | |
| Industrials | | 32.3 |
| |
| Financials | | 20.9 |
| |
| Information Technology | | 18.4 |
| |
| Health Care | | 9.1 |
| |
| Materials | | 9.4 |
| |
| Consumer Discretionary | | 5.8 |
| |
| Energy | | 3.8 |
| |
| Consumer Staples | | 3.4 |
| |
| Real Estate | | 2.7 |
| |
| Communication Services | | 0.8 |
| |
Outstanding Line of Credit, Net of Cash
and Cash Equivalents | | -6.6 |
| |
| |
| Calendar Year Total Returns (%) | | |
| | | |
| YEAR | | RGT |
| |
| 2018 | | -16.1 |
| |
| 2017 | | 31.1 |
| |
| 2016 | | 11.1 |
| |
| 2015 | | -3.4 |
| |
| 2014 | | -6.2 |
| |
| |
| Portfolio Country Breakdown1,2 | | |
| % of Net Assets | | |
| | | |
| United States | | 30.5 |
| |
| Japan | | 10.4 |
| |
| United Kingdom | | 9.9 |
| |
| Canada | | 9.6 |
| |
| Switzerland | | 5.7 |
| |
| Germany | | 5.5 |
| |
| Australia | | 4.8 |
| |
| France | | 3.8 |
| |
| Sweden | | 3.7 |
| |
| Brazil | | 3.3 |
| |
1 Represents countries that are 3% or more of net assets.
2 Securities are categorized by the country of their headquarters.
| |
| Portfolio Diagnostics | | |
| | | |
| Fund Net Assets | | $109 million |
| |
| Number of Holdings | | 206 |
| |
| Turnover Rate | | 57% |
| |
| Net Asset Value | | $10.42 |
| |
| Market Price | | $8.88 |
| |
| Net Leverage1 | | 6.6% |
| |
| Average Market Capitalization2 | | $1,702 million |
| |
| Weighted Average P/E Ratio3,4 | | 16.4x |
| |
| Weighted Average P/B Ratio3 | | 2.4x |
| |
| Active Share5 | | 97% |
| |
| 1 | Net leverage is the percentage, in excess of 100%, of the total value of equity type investments, divided by net assets. |
| 2 | Geometric Average. This weighted calculation uses each portfolio holding’s market cap in a way designed to not skew the effect of very large or small holdings; instead, it aims to better identify the portfolio’s center, which Royce believes offers a more accurate measure of average market cap than a simple mean or median. |
| 3 | Harmonic Average. This weighted calculation evaluates a portfolio as if it were a single stock and measures it overall. It compares the total market value of the portfolio to the portfolio’s share in the earnings or book value, as the case may be, of its underlying stocks. |
| 4 | The Fund’s P/E ratio calculation excludes companies with zero or negative earnings (4% of portfolio holdings as of 12/31/18). |
| 5 | Active Share is the sum of the absolute values of the different weightings of each holding in the Fund versus each holding in the benchmark, divided by two. |
| Important Performance and Risk Information
All performance information reflects past performance, is presented on a total return basis, net of the Fund’s investment advisory fee, and reflects the reinvestment of distributions. Past performance is no guarantee of future results. Current performance may be higher or lower than performance quoted. Returns as of the most recent month-end may be obtained at www.roycefunds.com. The market price of the Fund’s shares will fluctuate, so that shares may be worth more or less than their original cost when sold. The Fund invests primarily in securities of small- and mid-cap companies, which may involve considerably more risk than investments in securities of larger-cap companies. The Fund’s broadly diversified portfolio does not ensure a profit or guarantee against loss. From time to time, the Fund may invest a significant portion of its net assets in foreign securities, which may involve political, economic, currency and other risks not encountered in U.S. investments. Regarding the “Top Contributors” and “Top Detractors” tables shown above, the sum of all contributors to, and all detractors from, performance for all securities in the portfolio would approximate the Fund’s year-to-date performance for 2018.
|
| 2018 Annual Report to Stockholders | 9 |
Royce Global Value Trust
| |
| Schedule of Investments |
| Common Stocks – 105.9% |
| | | SHARES | | | VALUE | |
| |
| | | | | | | | |
| AUSTRALIA – 4.8% | | | | | | | |
ALS | | 140,000 | | | $ | 668,569 | |
Bravura Solutions | | 300,000 | | | | 781,829 | |
Cochlear | | 7,000 | | | | 855,778 | |
Hansen Technologies | | 360,000 | | | | 884,945 | |
IPH | | 175,000 | | | | 666,843 | |
†Steadfast Group | | 273,500 | | | | 529,759 | |
†Technology One | | 200,000 | | | | 867,759 | |
| |
| Total (Cost $4,610,181) | | | | | | 5,255,482 | |
| |
| | | | | | | | |
| AUSTRIA – 0.8% | | | | | | | |
Mayr-Melnhof Karton | | 6,500 | | | | 819,211 | |
| |
| Total (Cost $776,898) | | | | | | 819,211 | |
| |
| | | | | | | | |
| BELGIUM – 0.8% | | | | | | | |
†Radisson Hospitality 1 | | 180,000 | | | | 832,680 | |
| |
| Total (Cost $505,978) | | | | | | 832,680 | |
| |
| | | | | | | | |
| BRAZIL – 3.3% | | | | | | | |
B3-Brasil, Bolsa, Balcao | | 32,847 | | | | 227,215 | |
Construtora Tenda | | 18,400 | | | | 152,346 | |
†CVC Brasil Operadora e Agencia de Viagens | | 7,800 | | | | 123,126 | |
International Meal Company Alimentacao | | 132,300 | | | | 242,019 | |
†M Dias Branco | | 22,500 | | | | 248,468 | |
OdontoPrev | | 300,000 | | | | 1,064,310 | |
†Tegma Gestao Logistica | | 30,000 | | | | 212,862 | |
TOTVS | | 183,000 | | | | 1,281,933 | |
| |
| Total (Cost $3,469,614) | | | | | | 3,552,279 | |
| |
| | | | | | | | |
| CANADA – 9.6% | | | | | | | |
Agnico Eagle Mines 2 | | 10,000 | | | | 404,000 | |
Altus Group | | 62,200 | | | | 1,078,431 | |
†ATS Automation Tooling Systems 1 | | 16,900 | | | | 178,136 | |
†AutoCanada | | 55,000 | | | | 457,259 | |
Canaccord Genuity Group | | 92,000 | | | | 388,837 | |
Computer Modelling Group | | 283,000 | | | | 1,262,430 | |
E-L Financial | | 1,300 | | | | 700,850 | |
FirstService Corporation | | 10,300 | | | | 705,344 | |
Franco-Nevada Corporation 2,3 | | 14,100 | | | | 989,397 | |
Genworth MI Canada | | 13,000 | | | | 382,801 | |
Gluskin Sheff + Associates | | 23,000 | | | | 175,718 | |
Major Drilling Group International 1 | | 184,600 | | | | 622,004 | |
Morneau Shepell | | 50,000 | | | | 917,082 | |
Pan American Silver 2 | | 31,800 | | | | 464,280 | |
†Parex Resources 1 | | 6,800 | | | | 81,438 | |
Solium Capital 1 | | 50,000 | | | | 431,805 | |
Sprott | | 520,600 | | | | 980,034 | |
Western Forest Products | | 190,050 | | | | 263,107 | |
| |
| Total (Cost $12,766,644) | | | | | | 10,482,953 | |
| |
| | | | | | | | |
| CHINA – 1.0% | | | | | | | |
†Haitian International Holdings | | 79,600 | | | | 153,497 | |
Hua Hong Semiconductor | | 114,000 | | | | 211,098 | |
TravelSky Technology | | 300,000 | | | | 768,150 | |
| |
| Total (Cost $825,140) | | | | | | 1,132,745 | |
| |
| | | | | | | | |
| DENMARK – 0.4% | | | | | | | |
SimCorp | | 6,000 | | | | 410,282 | |
| |
| Total (Cost $386,884) | | | | | | 410,282 | |
| |
| | | | | | | | |
| FRANCE – 3.8% | | | | | | | |
Gaztransport Et Technigaz | | 3,500 | | | | 269,280 | |
Interparfums | | 14,850 | | | | 574,235 | |
Lectra | | 12,500 | | | | 260,372 | |
Neurones | | 32,500 | | | | 703,777 | |
†Robertet | | 400 | | | | 241,066 | |
Rothschild & Co | | 33,000 | | | | 1,166,430 | |
Thermador Groupe | | 19,000 | | | | 968,731 | |
| |
| Total (Cost $3,368,882) | | | | | | 4,183,891 | |
| |
| | | | | | | | |
| GERMANY – 4.8% | | | | | | | |
Amadeus Fire | | 10,000 | | | | 933,786 | |
†AURELIUS Equity Opportunities | | 7,400 | | | | 268,940 | |
Carl Zeiss Meditec | | 7,500 | | | | 586,910 | |
CompuGroup Medical | | 10,000 | | | | 463,341 | |
†CTS Eventim AG & Co. | | 6,100 | | | | 227,704 | |
MorphoSys 1 | | 6,000 | | | | 611,487 | |
†Norma Group | | 5,000 | | | | 247,367 | |
†PATRIZIA Immobilien | | 24,700 | | | | 471,195 | |
STRATEC | | 24,413 | | | | 1,406,951 | |
| |
| Total (Cost $4,785,168) | | | | | | 5,217,681 | |
| |
| | | | | | | | |
| GREECE – 0.3% | | | | | | | |
Sarantis | | 44,100 | | | | 352,682 | |
| |
| Total (Cost $379,711) | | | | | | 352,682 | |
| |
| | | | | | | | |
| HONG KONG – 1.2% | | | | | | | |
HKBN | | 171,500 | | | | 260,190 | |
Texhong Textile Group | | 33,100 | | | | 37,832 | |
Value Partners Group | | 1,281,800 | | | | 888,855 | |
†Valuetronics Holdings | | 355,100 | | | | 171,955 | |
| |
| Total (Cost $1,455,082) | | | | | | 1,358,832 | |
| |
| | | | | | | | |
| INDIA – 1.4% | | | | | | | |
†AIA Engineering | | 30,000 | | | | 713,314 | |
Edelweiss Financial Services | | 65,700 | | | | 171,602 | |
SH Kelkar & Company | | 200,000 | | | | 492,731 | |
†Sterlite Technologies | | 37,800 | | | | 158,991 | |
| |
| Total (Cost $1,961,638) | | | | | | 1,536,638 | |
| |
| | | | | | | | |
| INDONESIA – 0.4% | | | | | | | |
Selamat Sempurna | | 5,000,000 | | | | 486,787 | |
| |
| Total (Cost $455,966) | | | | | | 486,787 | |
| |
| | | | | | | | |
| IRELAND – 0.4% | | | | | | | |
†Datalex | | 28,500 | | | | 77,716 | |
Keywords Studios | | 25,000 | | | | 340,956 | |
| |
| Total (Cost $139,096) | | | | | | 418,672 | |
| |
| | | | | | | | |
| ISRAEL – 0.2% | | | | | | | |
Nova Measuring Instruments 1,2 | | 8,700 | | | | 198,186 | |
| |
| Total (Cost $222,334) | | | | | | 198,186 | |
| |
| | | | | | | | |
| ITALY – 1.1% | | | | | | | |
†Biesse | | 8,700 | | | | 171,151 | |
DiaSorin | | 9,000 | | | | 729,041 | |
†Interpump Group | | 10,900 | | | | 324,705 | |
| |
| Total (Cost $969,645) | | | | | | 1,224,897 | |
| |
| | | | | | | | |
| JAPAN – 10.4% | | | | | | | |
†Advantest Corporation | | 13,600 | | | | 278,440 | |
†Ain Holdings | | 4,100 | | | | 294,394 | |
| 10 | 2018 Annual Report to Stockholders | | THE ACCOMPANYING NOTES ARE AN INTEGRAL PART OF THESE FINANCIAL STATEMENTS |
| |
| Schedule of Investments (continued) |
| | | SHARES | | | VALUE | |
| |
| | | | | | | | |
| JAPAN (continued) | | | | | | | |
As One | | 15,000 | | | $ | 1,029,150 | |
†Benefit One | | 25,000 | | | | 769,810 | |
†Cosel | | 50,000 | | | | 423,795 | |
Daifuku | | 20,000 | | | | 916,017 | |
en-japan | | 6,600 | | | | 205,638 | |
EPS Holdings | | 40,000 | | | | 610,191 | |
Financial Products Group | | 27,400 | | | | 280,487 | |
†Fujitec | | 50,000 | | | | 538,753 | |
Information Services International-Dentsu | | 4,900 | | | | 122,897 | |
†KOMEDA Holdings | | 14,200 | | | | 280,359 | |
Kyowa Exeo | | 11,400 | | | | 268,137 | |
Meitec Corporation | | 25,000 | | | | 1,018,430 | |
†Morningstar Japan KK | | 80,000 | | | | 218,238 | |
†Nishimoto | | 6,500 | | | | 264,792 | |
NSD | | 47,900 | | | | 927,365 | |
Relo Group | | 30,000 | | | | 704,256 | |
†TKC Corporation | | 23,000 | | | | 820,492 | |
TOTO | | 4,500 | | | | 156,425 | |
USS | | 50,000 | | | | 843,483 | |
Yumeshin Holdings | | 48,050 | | | | 347,207 | |
| |
| Total (Cost $11,499,978) | | | | | | 11,318,756 | |
| |
| | | | | | | | |
| LUXEMBOURG – 0.8% | | | | | | | |
†Reinet Investments | | 65,000 | | | | 849,001 | |
| |
| Total (Cost $958,103) | | | | | | 849,001 | |
| |
| | | | | | | | |
| MALAYSIA – 0.2% | | | | | | | |
†AEON Credit Service | | 44,200 | | | | 163,644 | |
| |
| Total (Cost $164,029) | | | | | | 163,644 | |
| |
| | | | | | | | |
| MEXICO – 0.6% | | | | | | | |
Becle | | 200,000 | | | | 268,576 | |
Bolsa Mexicana de Valores | | 250,000 | | | | 426,171 | |
| |
| Total (Cost $789,517) | | | | | | 694,747 | |
| |
| | | | | | | | |
| NETHERLANDS – 2.2% | | | | | | | |
†Basic-Fit 1 | | 2,700 | | | | 80,277 | |
†Euronext | | 4,300 | | | | 247,814 | |
†IMCD | | 13,000 | | | | 834,106 | |
†Intertrust | | 75,000 | | | | 1,262,330 | |
| |
| Total (Cost $2,666,388) | | | | | | 2,424,527 | |
| |
| | | | | | | | |
| NEW ZEALAND – 0.6% | | | | | | | |
Fisher & Paykel Healthcare | | 70,654 | | | | 616,499 | |
| |
| Total (Cost $382,216) | | | | | | 616,499 | |
| |
| | | | | | | | |
| NORWAY – 1.5% | | | | | | | |
†Atea | | 24,700 | | | | 317,088 | |
TGS-NOPEC Geophysical | | 55,000 | | | | 1,328,167 | |
| |
| Total (Cost $1,404,136) | | | | | | 1,645,255 | |
| |
| | | | | | | | |
| PERU – 0.3% | | | | | | | |
†Alicorp | | 123,400 | | | | 364,504 | |
| |
| Total (Cost $365,981) | | | | | | 364,504 | |
| |
| | | | | | | | |
| POLAND – 0.3% | | | | | | | |
Warsaw Stock Exchange | | 33,000 | | | | 323,179 | |
| |
| Total (Cost $459,764) | | | | | | 323,179 | |
| |
| | | | | | | | |
| PORTUGAL – 0.5% | | | | | | | |
Sonae | | 612,400 | | | | 568,342 | |
| |
| Total (Cost $760,078) | | | | | | 568,342 | |
| |
| | | | | | | | |
| RUSSIA – 0.4% | | | | | | | |
Globaltrans Investment GDR | | 42,000 | | | | 380,520 | |
| |
| Total (Cost $228,732) | | | | | | 380,520 | |
| |
| | | | | | | | |
| SINGAPORE – 0.8% | | | | | | | |
†Midas Holdings 1,4 | | 400,000 | | | | 42,261 | |
XP Power | | 30,000 | | | | 804,910 | |
| |
| Total (Cost $817,261) | | | | | | 847,171 | |
| |
| | | | | | | | |
| SOUTH AFRICA – 1.5% | | | | | | | |
Coronation Fund Managers | | 70,800 | | | | 203,481 | |
†Hudaco Industries | | 61,557 | | | | 600,189 | |
JSE | | 15,000 | | | | 172,608 | |
PSG Group | | 25,000 | | | | 425,369 | |
†Transaction Capital | | 244,100 | | | | 288,594 | |
| |
| Total (Cost $1,971,790) | | | | | | 1,690,241 | |
| |
| | | | | | | | |
| SOUTH KOREA – 0.4% | | | | | | | |
Hansol Chemical | | 2,800 | | | | 194,479 | |
Koh Young Technology | | 1,200 | | | | 88,726 | |
Samjin Pharmaceutical | | 4,300 | | | | 154,727 | |
| |
| Total (Cost $433,537) | | | | | | 437,932 | |
| |
| | | | | | | | |
| SPAIN – 0.2% | | | | | | | |
†Applus Services | | 20,000 | | | | 222,046 | |
| |
| Total (Cost $242,032) | | | | | | 222,046 | |
| |
| | | | | | | | |
| SWEDEN – 3.7% | | | | | | | |
Addtech Cl. B | | 31,460 | | | | 561,548 | |
Bravida Holding | | 120,000 | | | | 829,972 | |
†Dometic Group | | 50,000 | | | | 310,280 | |
Hexpol | | 110,000 | | | | 869,406 | |
†Lagercrantz Group | | 60,000 | | | | 582,876 | |
†Loomis Cl. B | | 12,500 | | | | 403,364 | |
†Resurs Holding | | 38,500 | | | | 237,613 | |
†Scandi Standard | | 38,500 | | | | 268,889 | |
| |
| Total (Cost $4,246,817) | | | | | | 4,063,948 | |
| |
| | | | | | | | |
| SWITZERLAND – 5.7% | | | | | | | |
Burkhalter Holding | | 10,000 | | | | 793,570 | |
dormakaba Holding | | 600 | | | | 361,990 | |
Forbo Holding | | 200 | | | | 281,005 | |
Inficon Holding | | 1,500 | | | | 759,385 | |
†Kardex | | 10,000 | | | | 1,153,729 | |
LEM Holding | | 600 | | | | 639,740 | |
Partners Group Holding | | 1,600 | | | | 970,190 | |
VZ Holding | | 4,600 | | | | 1,240,208 | |
| |
| Total (Cost $6,074,421) | | | | | | 6,199,817 | |
| |
| | | | | | | | |
| TAIWAN – 0.4% | | | | | | | |
†Chailease Holding | | 23,266 | | | | 73,347 | |
†Chroma ATE | | 66,400 | | | | 254,911 | |
TCI | | 8,808 | | | | 148,725 | |
| |
| Total (Cost $494,164) | | | | | | 476,983 | |
| |
| | | | | | | | |
| THAILAND – 0.1% | | | | | | | |
†Muangthai Capital | | 94,100 | | | | 141,612 | |
| |
| Total (Cost $127,611) | | | | | | 141,612 | |
| |
| THE ACCOMPANYING NOTES ARE AN INTEGRAL PART OF THESE FINANCIAL STATEMENTS | | 2018 Annual Report to Stockholders | 11 |
Royce Global Value Trust
| |
| Schedule of Investments (continued) |
| | | SHARES | | | VALUE | |
| |
| | | | | | | | |
| UKRAINE – 0.3% | | | | | | | |
†MHP GDR | | 30,000 | | | $ | 310,500 | |
| |
| Total (Cost $411,612) | | | | | | 310,500 | |
| |
| | | | | | | | |
| UNITED KINGDOM – 9.9% | | | | | | | |
Abcam | | 40,000 | | | | 555,726 | |
†Advanced Medical Solutions Group | | 70,000 | | | | 245,360 | |
Ashmore Group | | 432,800 | | | | 2,016,821 | |
Avon Rubber | | 9,500 | | | | 151,359 | |
†BCA Marketplace | | 90,000 | | | | 252,371 | |
Clarkson | | 15,600 | | | | 377,791 | |
Consort Medical | | 57,500 | | | | 685,257 | |
†Croda International | | 15,000 | | | | 895,725 | |
Diploma | | 35,000 | | | | 539,793 | |
FDM Group Holdings | | 25,000 | | | | 236,757 | |
Ferroglobe 2 | | 41,100 | | | | 65,349 | |
Ferroglobe (Warranty Insurance Trust) 1,4 | | 41,100 | | | | 0 | |
Hilton Food Group | | 9,600 | | | | 110,370 | |
Jupiter Fund Management | | 36,000 | | | | 135,454 | |
†Kainos Group | | 31,400 | | | | 160,090 | |
†Metro Bank 1 | | 25,000 | | | | 539,474 | |
Polypipe Group | | 125,000 | | | | 521,630 | |
†Porvair | | 50,000 | | | | 264,161 | |
Rotork | | 82,500 | | | | 260,362 | |
Spirax-Sarco Engineering | | 18,000 | | | | 1,431,630 | |
Staffline Group | | 10,300 | | | | 162,792 | |
Stallergenes Greer 1 | | 10,800 | | | | 350,187 | |
†Taylor Wimpey | | 72,700 | | | | 126,254 | |
Victrex | | 25,500 | | | | 743,652 | |
| |
| Total (Cost $11,515,860) | | | | | | 10,828,365 | |
| |
| | | | | | | | |
| UNITED STATES – 30.5% | | | | | | | |
Air Lease Cl. A 2 | | 40,060 | | | | 1,210,213 | |
Brooks Automation 2 | | 21,700 | | | | 568,106 | |
†Burford Capital | | 20,000 | | | | 422,148 | |
†Camping World Holdings Cl. A 2,3 | | 62,800 | | | | 720,316 | |
†Chase Corporation | | 5,600 | | | | 560,280 | |
CIRCOR International 1,2 | | 32,200 | | | | 685,860 | |
Cognex Corporation 2 | | 10,748 | | | | 415,625 | |
Coherent 1,2 | | 3,600 | | | | 380,556 | |
†comScore 1 | | 24,000 | | | | 346,320 | |
Diodes 1,2 | | 20,500 | | | | 661,330 | |
Dorian LPG 1 | | 4,475 | | | | 26,089 | |
EnerSys 2 | | 11,000 | | | | 853,710 | |
Expeditors International of Washington 2 | | 13,300 | | | | 905,597 | |
FLIR Systems 2,3 | | 56,700 | | | | 2,468,718 | |
Innospec 2,3 | | 12,457 | | | | 769,344 | |
Kadant 2 | | 7,800 | | | | 635,388 | |
KBR 2 | | 64,600 | | | | 980,628 | |
Kirby Corporation 1,2,3 | | 32,900 | | | | 2,216,144 | |
†KKR & Co. Cl. A 2 | | 50,000 | | | | 981,500 | |
Lazard Cl. A | | 34,200 | | | | 1,262,322 | |
Lindsay Corporation 2 | | 13,700 | | | | 1,318,625 | |
Littelfuse | | 4,000 | | | | 685,920 | |
ManpowerGroup 2 | | 8,800 | | | | 570,240 | |
MBIA 1,2,3 | | 80,300 | | | | 716,276 | |
†Morningstar | | 7,200 | | | | 790,848 | |
Nanometrics 1,2,3 | | 35,600 | | | | 972,948 | |
National Instruments 2 | | 15,200 | | | | 689,776 | |
Popular 2 | | 13,100 | | | | 618,582 | |
Quaker Chemical 2,3 | | 6,069 | | | | 1,078,522 | |
Raven Industries | | 40,000 | | | | 1,447,600 | |
Rogers Corporation 1,2,3 | | 4,800 | | | | 475,488 | |
SEACOR Holdings 1,2,3 | | 20,200 | | | | 747,400 | |
SEACOR Marine Holdings 1 | | 20,309 | | | | 238,834 | |
SEI Investments 2 | | 27,600 | | | | 1,275,120 | |
Signet Jewelers | | 5,500 | | | | 174,735 | |
Standard Motor Products | | 11,200 | | | | 542,416 | |
Sun Hydraulics 2 | | 15,139 | | | | 502,463 | |
Tennant Company 2 | | 11,600 | | | | 604,476 | |
Valmont Industries 2 | | 5,400 | | | | 599,130 | |
Virtu Financial Cl. A 2,3 | | 74,300 | | | | 1,913,968 | |
World Fuel Services 2 | | 12,000 | | | | 256,920 | |
| |
| Total (Cost $30,346,527) | | | | | | 33,290,481 | |
| |
| | | | | | | | |
| URUGUAY – 0.3% | | | | | | | |
Arcos Dorados Holdings Cl. A 2 | | 46,800 | | | | 369,720 | |
| |
| Total (Cost $351,426) | | | | | | 369,720 | |
| |
| | | | | | | | |
| TOTAL COMMON STOCKS | | | | | | | |
| |
| (Cost $113,790,841) | | | | | | 115,691,688 | |
| |
| | | | | | | | |
| PREFERRED STOCK – 0.7% | | | | | | | |
| GERMANY – 0.7% | | | | | | | |
†FUCHS PETROLUB | | 18,500 | | | | 762,645 | |
| |
| (Cost $802,646) | | | | | | 762,645 | |
| |
| | | | | | | | |
| REPURCHASE AGREEMENT– 0.6% | | | | | | | |
Fixed Income Clearing Corporation, 0.50% dated 12/31/18, due 1/2/19, maturity value
$642,018 (collateralized by obligations of various U.S. Government Agencies, 0.125% due
07/15/24, valued at $657,561) |
| |
| (Cost $642,000) | | | | | | 642,000 | |
| |
| | | | | | | | |
| TOTAL INVESTMENTS – 107.2% | | | | | | | |
| |
| (Cost $115,235,487) | | | | | | 117,096,333 | |
| |
| | | | | | | | |
| LIABILITIES LESS CASH AND OTHER ASSETS – (7.2)% | | | | | | (7,842,702 | ) |
| | | | | | | |
| | | | | | | | |
| |
| NET ASSETS – 100.0% | | | | | $ | 109,253,631 | |
| |
| 12 | 2018 Annual Report to Stockholders | | THE ACCOMPANYING NOTES ARE AN INTEGRAL PART OF THESE FINANCIAL STATEMENTS |
| | ADR – American Depository Receipt |
| | |
| † | New additions in 2018. |
| 1 | Non-income producing. |
| 2 | All or a portion of these securities were pledged as collateral in connection with the Fund’s revolving credit agreement at December 31, 2018. Total market value of pledged securities at December 31, 2018, was $17,212,324. |
| 3 | At December 31, 2018, a portion of these securities were rehypothecated in connection with the Fund’s revolving credit agreement in the aggregate amount of $6,408,273. |
| 4 | Securities for which market quotations are not readily available represent 0.0% of net assets. These securities have been valued at their fair value under procedures approved by the Fund’s Board of Directors. These securities are defined as Level 3 securities due to the use of significant unobservable inputs in the determination of fair value. See Notes to Financial Statements. |
| | |
| | Securities of Global/International Funds are categorized by the country of their headquarters, with the exception of exchange-traded funds. |
| | |
| | Bold indicates the Fund’s 20 largest equity holdings in terms of December 31, 2018, market value. |
| | |
| | TAX INFORMATION: The cost of total investments for Federal income tax purposes was $115,563,766. At December 31, 2018, net unrealized appreciation for all securities was $1,532,567 consisting of aggregate gross unrealized appreciation of $14,885,535 and aggregate gross unrealized depreciation of $13,352,968. The primary causes of the difference between book and tax basis cost are the timing of the recognition of losses on securities sold, investments in publicly traded partnerships and Trusts and mark-to-market of Passive Foreign Investment Companies. |
| THE ACCOMPANYING NOTES ARE AN INTEGRAL PART OF THESE FINANCIAL STATEMENTS | | 2018 Annual Report to Stockholders | 13 |
| Royce Global Value Trust | | December 31, 2018 |
| |
| Statement of Assets and Liabilities |
| ASSETS: | | | | |
| Investments at value | | $ | 116,454,333 | |
| |
| Repurchase agreements (at cost and value) | | | 642,000 | |
| |
| Cash | | | 512 | |
| |
| Foreign currency (cost $15,804) | | | 15,822 | |
| |
| Receivable for investments sold | | | 320,954 | |
| |
| Receivable for dividends and interest | | | 253,066 | |
| |
| Prepaid expenses and other assets | | | 42,594 | |
| |
| Total Assets | | | 117,729,281 | |
| |
| LIABILITIES: | | | | |
| Revolving credit agreement | | | 8,000,000 | |
| |
| Payable for investments purchased | | | 286,436 | |
| |
| Payable for investment advisory fee | | | 118,151 | |
| |
| Payable for directors’ fees | | | 8,385 | |
| |
| Payable for interest expense | | | 3,331 | |
| |
| Accrued expenses | | | 57,053 | |
| |
| Deferred capital gains tax | | | 2,294 | |
| |
| Total Liabilities | | | 8,475,650 | |
| |
| Net Assets | | $ | 109,253,631 | |
| |
| ANALYSIS OF NET ASSETS: | | | | |
| Paid-in capital - $0.001 par value per share; 10,482,026 shares outstanding (150,000,000 shares authorized) | | $ | 118,153,404 | |
| |
| Total distributable earnings (loss) | | | (8,899,773 | ) |
| |
| Net Assets (net asset value per share - $10.42) | | $ | 109,253,631 | |
| |
| Investments at identified cost | | $ | 114,593,487 | |
| |
| 14 | 2018 Annual Report to Stockholders | | THE ACCOMPANYING NOTES ARE AN INTEGRAL PART OF THESE FINANCIAL STATEMENTS |
Royce Global Value Trust
| |
| Statement of Changes in Net Assets |
| | | YEAR ENDED 12/31/18 | | YEAR ENDED 12/31/17 |
| |
| | | | | | | | | |
| INVESTMENT OPERATIONS: | | | | | | | | |
| Net investment income (loss) | | $ | 386,440 | | | $ | 241,105 | |
| |
| Net realized gain (loss) on investments and foreign currency | | | 4,457,193 | | | | 6,555,345 | |
| |
| Net change in unrealized appreciation (depreciation) on investments and foreign currency | | | (25,870,375 | ) | | | 24,156,512 | |
| |
| Net increase (decrease) in net assets from investment operations | | | (21,026,742 | ) | | | 30,952,962 | |
| |
| DISTRIBUTIONS: | | | | | | | | |
| Total distributable earnings 1 | | | (418,468 | ) | | | | |
| |
| Net investment income | | | | | | | (1,145,697 | ) |
| |
| Net realized gain on investments and foreign currency | | | | | | | – | |
| |
| Total distributions | | | (418,468 | ) | | | (1,145,697 | ) |
| |
| CAPITAL STOCK TRANSACTIONS: | | | | | | | | |
| Reinvestment of distributions | | | 172,659 | | | | 491,130 | |
| |
| Total capital stock transactions | | | 172,659 | | | | 491,130 | |
| |
| Net Increase (Decrease) In Net Assets | | | (21,272,551 | ) | | | 30,298,395 | |
| |
| NET ASSETS: | | | | | | | | |
| |
| Beginning of year | | | 130,526,182 | | | | 100,227,787 | |
| |
| End of year (including undistributed net investment income (loss) of $(1,199,309) at 12/31/172) | | $ | 109,253,631 | | | $ | 130,526,182 | |
| |
| 1 | Distributions from net investment income and from realized gains are no longer required to be separately disclosed. See Notes to Financial Statements. |
| 2 | Parenthetical disclosure of undistributed net investment income is no longer required. See Notes to Financial Statements. |
| THE ACCOMPANYING NOTES ARE AN INTEGRAL PART OF THESE FINANCIAL STATEMENTS | | 2018 Annual Report to Stockholders | 15 |
| Royce Global Value Trust | | Year Ended December 31, 2018 |
| INVESTMENT INCOME: | | | | |
| INCOME: | | | | |
| Dividends | | $ | 2,757,921 | |
| |
| Foreign withholding tax | | | (205,281 | ) |
| |
| Interest | | | 34,033 | |
| |
| Rehypothecation income | | | 39,372 | |
| |
| Total income | | | 2,626,045 | |
| |
| EXPENSES: | | | | |
| |
| Investment advisory fees | | | 1,608,852 | |
| |
| Interest expense | | | 264,494 | |
| |
| Custody and transfer agent fees | | | 124,984 | |
| |
| Professional fees | | | 76,428 | |
| |
| Stockholder reports | | | 57,993 | |
| |
| Administrative and office facilities | | | 44,889 | |
| |
| Directors’ fees | | | 31,824 | |
| |
| Other expenses | | | 30,191 | |
| |
| Total expenses | | | 2,239,655 | |
| |
| Compensating balance credits | | | (50 | ) |
| |
| Net expenses | | | 2,239,605 | |
| |
| Net investment income (loss) | | | 386,440 | |
| |
| REALIZED AND UNREALIZED GAIN (LOSS) ON INVESTMENTS AND FOREIGN CURRENCY: | | | | |
| NET REALIZED GAIN (LOSS): | | | | |
| |
| Investments | | | 4,512,055 | |
| |
| Foreign currency transactions | | | (54,862 | ) |
| |
| NET CHANGE IN UNREALIZED APPRECIATION (DEPRECIATION): | | | | |
| |
| Investments | | | (26,021,074 | ) |
| |
| Other assets and liabilities denominated in foreign currency | | | 150,699 | |
| |
| Net realized and unrealized gain (loss) on investments and foreign currency | | | (21,413,182 | ) |
| |
| NET INCREASE (DECREASE) IN NET ASSETS FROM INVESTMENT OPERATIONS | | $ | (21,026,742 | ) |
| |
| 16 | 2018 Annual Report to Stockholders | | THE ACCOMPANYING NOTES ARE AN INTEGRAL PART OF THESE FINANCIAL STATEMENTS |
| Royce Global Value Trust | | Year Ended December 31, 2018 |
| CASH FLOWS FROM OPERATING ACTIVITIES: | | | | |
| Net increase (decrease) in net assets from investment operations | | $ | (21,026,742 | ) |
| |
| Adjustments to reconcile net increase (decrease) in net assets from investment operations to net cash provided by operating activities: | | | | |
| |
Purchases of long-term investments | | | (81,113,028 | ) |
| |
Proceeds from sales and maturities of long-term investments | | | 72,448,684 | |
| |
Net purchases, sales and maturities of short-term investments | | | 8,689,000 | |
| |
Net (increase) decrease in dividends and interest receivable and other assets | | | (50,869 | ) |
| |
Net increase (decrease) in interest expense payable, accrued expenses and other liabilities | | | (194,518 | ) |
| |
Net change in unrealized appreciation (depreciation) on investments | | | 26,021,074 | |
| |
Net realized gain (loss) on investments | | | (4,512,055 | ) |
| |
| Net cash provided by operating activities | | | 261,546 | |
| |
| CASH FLOWS FROM FINANCING ACTIVITIES: | | | | |
| Distributions | | | (418,468 | ) |
| |
| Reinvestment of distributions | | | 172,659 | |
| |
| Net cash used for financing activities | | | (245,809 | ) |
| |
| INCREASE (DECREASE) IN CASH: | | | 15,737 | |
| |
| Cash and foreign currency at beginning of year | | | 597 | |
| |
| Cash and foreign currency at end of year | | $ | 16,334 | |
| |
| Supplemental disclosure of cash flow information: |
| For the year ended December 31, 2018, the Fund paid $263,514 in interest expense. |
| THE ACCOMPANYING NOTES ARE AN INTEGRAL PART OF THESE FINANCIAL STATEMENTS | | 2018 Annual Report to Stockholders | 17 |
Royce Global Value Trust
| |
| Financial Highlights |
| This table is presented to show selected data for a share outstanding throughout each period, and to assist stockholders in evaluating the Fund’s performance for the periods presented. |
| | | YEARS ENDED |
| | | |
| | | 12/31/18 | | | 12/31/17 | | | 12/31/16 | | | 12/31/15 | | | 12/31/14 | |
| |
| Net Asset Value, Beginning of Period | | $ | 12.48 | | | $ | 9.62 | | | $ | 8.81 | | | $ | 9.25 | | | $ | 10.05 | |
| |
| INVESTMENT OPERATIONS: | | | | | | | | | | | | | | | | | | | | |
| Net investment income (loss) | | | 0.04 | | | | 0.02 | | | | 0.06 | | | | 0.10 | | | | 0.13 | |
| |
| Net realized and unrealized gain (loss) on investments and foreign currency | | | (2.06 | ) | | | 2.96 | | | | 0.90 | | | | (0.43 | ) | | | (0.77 | ) |
| |
| Net increase (decrease) in net assets from investment operations | | | (2.02 | ) | | | 2.98 | | | | 0.96 | | | | (0.33 | ) | | | (0.64 | ) |
| |
| DISTRIBUTIONS: | | | | | | | | | | | | | | | | | | | | |
| Net investment income | | | (0.04 | ) | | | (0.11 | ) | | | (0.14 | ) | | | (0.10 | ) | | | (0.15 | ) |
| |
| Net realized gain on investments and foreign currency | | | – | | | | – | | | | – | | | | – | | | | – | |
| |
| Total distributions | | | (0.04 | ) | | | (0.11 | ) | | | (0.14 | ) | | | (0.10 | ) | | | (0.15 | ) |
| |
| CAPITAL STOCK TRANSACTIONS: | | | | | | | | | | | | | | | | | | | | |
| Effect of reinvestment of distributions by Common Stockholders | | | (0.00 | ) | | | (0.01 | ) | | | (0.01 | ) | | | (0.01 | ) | | | (0.01 | ) |
| |
| Total capital stock transactions | | | (0.00 | ) | | | (0.01 | ) | | | (0.01 | ) | | | (0.01 | ) | | | (0.01 | ) |
| |
| Net Asset Value, End of Period | | $ | 10.42 | | | $ | 12.48 | | | $ | 9.62 | | | $ | 8.81 | | | $ | 9.25 | |
| |
| Market Value, End of Period | | $ | 8.88 | | | $ | 10.81 | | | $ | 8.04 | | | $ | 7.45 | | | $ | 8.04 | |
| |
| TOTAL RETURN: 1 | | | | | | | | | | | | | | | | | | | | |
| Net Asset Value | | | (16.11 | )% | | | 31.07 | % | | | 11.12 | % | | | (3.44 | )% | | | (6.23 | )% |
| |
| Market Value | | | (17.50 | )% | | | 35.96 | % | | | 9.77 | % | | | (6.06 | )% | | | (7.86 | )% |
| |
| RATIOS BASED ON AVERAGE NET ASSETS: | | | | | | | | | | | | | | | | | | | | |
| Investment advisory fee expense | | | 1.25 | % | | | 1.25 | % | | | 1.25 | % | | | 1.25 | % | | | 1.25 | % |
| |
| Other operating expenses | | | 0.49 | % | | | 0.42 | % | | | 0.46 | % | | | 0.43 | % | | | 0.24 | % |
| |
| Total expenses (net) | | | 1.74 | % | | | 1.67 | % | | | 1.71 | % | | | 1.68 | % | | | 1.49 | % |
| |
| Expenses excluding interest expense | | | 1.53 | % | | | 1.52 | % | | | 1.57 | % | | | 1.58 | % | | | 1.49 | % |
| |
| Expenses prior to balance credits | | | 1.74 | % | | | 1.67 | % | | | 1.71 | % | | | 1.68 | % | | | 1.49 | % |
| |
| Net investment income (loss) | | | 0.30 | % | | | 0.21 | % | | | 0.69 | % | | | 1.03 | % | | | 1.30 | % |
| |
| SUPPLEMENTAL DATA: | | | | | | | | | | | | | | | | | | | | |
| Net Assets, End of Period (in thousands) | | $ | 109,254 | | | $ | 130,526 | | | $ | 100,228 | | | $ | 91,174 | | | $ | 95,285 | |
| |
| Portfolio Turnover Rate | | | 57 | % | | | 34 | % | | | 59 | % | | | 65 | % | | | 43 | % |
| |
| REVOLVING CREDIT AGREEMENT: | | | | | | | | | | | | | | | | | | | | |
| Asset coverage | | | 1466 | % | | | 1732 | % | | | 1353 | % | | | 1240 | % | | | | |
| |
| Asset coverage per $1,000 | | | 14,657 | | | | 17,316 | | | | 13,528 | | | | 12,397 | | | | | |
| |
| 1 | The Market Value Total Return is calculated assuming a purchase of Common Stock on the opening of the first business day and a sale on the closing of the last business day of each period. Dividends and distributions are assumed for the purposes of this calculation to be reinvested at prices obtained under the Fund’s Distribution Reinvestment and Cash Purchase Plan. Net Asset Value Total Return is calculated on the same basis, except that the Fund’s net asset value is used on the purchase and sale dates instead of market value. |
| 18 | 2018 Annual Report to Stockholders | | THE ACCOMPANYING NOTES ARE AN INTEGRAL PART OF THESE FINANCIAL STATEMENTS |
Royce Global Value Trust
Notes to Financial Statements
| Summary of Significant Accounting Policies |
| Royce Global Value Trust, Inc. (the “Fund”), is a diversified closed-end investment company that was incorporated under the laws of the State of Maryland on February 14, 2011. The Fund commenced operations on October 18, 2013. |
| The preparation of financial statements in conformity with accounting principles generally accepted in the United States of America requires management to make estimates and assumptions that affect the reported amounts of assets and liabilities and the disclosure of contingent assets and liabilities at the date of the financial statements and the reported amounts of income and expenses during the reporting period. Actual results could differ from those estimates. |
| The Fund is an investment company and accordingly follows the investment company accounting and reporting guidance of the Financial Accounting Standards Board (FASB) Accounting Standard Codification Topic 946 “Financial Services-Investment Companies”. |
| |
| VALUATION OF INVESTMENTS: |
| Securities are valued as of the close of trading on the New York Stock Exchange (NYSE) (generally 4:00 p.m. Eastern time) on the valuation date. Securities that trade on an exchange, and securities traded on Nasdaq’s Electronic Bulletin Board, are valued at their last reported sales price or Nasdaq official closing price taken from the primary market in which each security trades or, if no sale is reported for such day, at their highest bid price. Other over-the-counter securities for which market quotations are readily available are valued at their highest bid price, except in the case of some bonds and other fixed income securities which may be valued by reference to other securities with comparable ratings, interest rates and maturities, using established independent pricing services. The Fund values its non-U.S. dollar denominated securities in U.S. dollars daily at the prevailing foreign currency exchange rates as quoted by a major bank. Securities for which market quotations are not readily available are valued at their fair value in accordance with the provisions of the 1940 Act, under procedures approved by the Fund's Board of Directors, and are reported as Level 3 securities. As a general principle, the fair value of a security is the amount which the Fund might reasonably expect to receive for the security upon its current sale. However, in light of the judgment involved in fair valuations, there can be no assurance that a fair value assigned to a particular security will be the amount which the Fund might be able to receive upon its current sale. In addition, if, between the time trading ends on a particular security and the close of the customary trading session on the NYSE, events occur that are significant and may make the closing price unreliable, the Fund may fair value the security. The Fund uses an independent pricing service to provide fair value estimates for relevant non-U.S. equity securities on days when the U.S. market volatility exceeds a certain threshold. This pricing service uses proprietary correlations it has developed between the movement of prices of non-U.S. equity securities and indices of U.S.-traded securities, futures contracts and other indications to estimate the fair value of relevant non-U.S. securities. When fair value pricing is employed, the prices of securities used by the Fund may differ from quoted or published prices for the same security. Investments in money market funds are valued at net asset value per share. |
| Various inputs are used in determining the value of the Fund’s investments, as noted above. These inputs are summarized in the three broad levels below: |
| | | Level 1 | – | quoted prices in active markets for identical securities. |
| | | Level 2 | – | other significant observable inputs (including quoted prices for similar securities, foreign securities that may be fair valued and repurchase agreements). The table below includes all Level 2 securities. Any Level 2 securities with values based on quoted prices for similar securities would be noted in the Schedule of Investments. |
| | | Level 3 | – | significant unobservable inputs (including last trade price before trading was suspended, or at a discount thereto for lack of marketability or otherwise, market price information regarding other securities, information received from the company and/or published documents, including SEC filings and financial statements, or other publicly available information). |
| The inputs or methodology used for valuing securities are not necessarily an indication of the risk associated with investing in those securities. |
| The following is a summary of the inputs used to value the Fund’s investments as of December 31, 2018. For a detailed breakout of common stocks by country, please refer to the Schedule of Investments. |
| | | LEVEL 1 | | LEVEL 2 | | LEVEL 3 | | TOTAL |
| |
| Common Stocks | | $ | 115,649,427 | | | $ | – | | | $ | 42,261 | | | $ | 115,691,688 |
| |
| Preferred Stocks | | | 762,645 | | | | – | | | | – | | | | 762,645 |
| |
| Repurchase Agreement | | | – | | | | 642,000 | | | | – | | | | 642,000 |
| |
| Certain securities have transferred in and out of Level 1 and Level 2 measurements during the reporting period. This is generally due to whether fair value factors have been applied. The Fund recognizes transfers between levels as of the end of the reporting period. For the year ended December 31, 2018, securities valued at $42,631,365 were transferred from Level 2 to Level 1 within the fair value hierarchy. |
| 2018 Annual Report to Stockholders | 19 |
Royce Global Value Trust
Notes to Financial Statements (continued)
VALUATION OF INVESTMENTS (continued):
Level 3 Reconciliation:
| | | | BALANCE AS OF 12/31/17 | | | | PURCHASES | | | | SALES | | | | REALIZED GAIN (LOSS) | | | UNREALIZED GAIN (LOSS)1 | | BALANCE AS OF 12/31/18 |
| |
| Common Stocks | | | $0 | | | | $126,098 | | | | $84,433 | | | | $8,774 | | | | $(8,178) | | | | $42,261 |
| |
| 1 | The net change in unrealized appreciation (depreciation) is included in the accompanying Statement of Operations. Change in unrealized appreciation (depreciation) includes net unrealized appreciation (depreciation) resulting from changes in investment values during the reporting period and the reversal of previously recorded unrealized appreciation (depreciation) when gains or losses are realized. Net realized gain (loss) from investments and foreign currency transactions is included in the accompanying Statement of Operations. |
| REPURCHASE AGREEMENTS: |
| The Fund may enter into repurchase agreements with institutions that the Fund’s investment adviser has determined are creditworthy. The Fund restricts repurchase agreements to maturities of no more than seven days. Securities pledged as collateral for repurchase agreements, which are held until maturity of the repurchase agreements, are marked-to-market daily and maintained at a value at least equal to the principal amount of the repurchase agreement (including accrued interest). Repurchase agreements could involve certain risks in the event of default or insolvency of the counter-party, including possible delays or restrictions upon the ability of the Fund to dispose of its underlying securities. The remaining contractual maturity of the repurchase agreement held by the Fund at December 31, 2018 is overnight and continuous. |
| |
| FOREIGN CURRENCY: |
| Net realized foreign exchange gains or losses arise from sales and maturities of short-term securities, sales of foreign currencies, expiration of currency forward contracts, currency gains or losses realized between the trade and settlement dates on securities transactions, and the difference between the amounts of dividends, interest, and foreign withholding taxes recorded on the Fund’s books and the U.S. dollar equivalent of the amounts actually received or paid. Net unrealized foreign exchange gains and losses arise from changes in the value of assets and liabilities, other than investments in securities at the end of the reporting period, as a result of changes in foreign currency exchange rates. |
| The Fund does not isolate that portion of the results of operations resulting from fluctuations in foreign exchange rates on investments from the fluctuations arising from changes in market prices of securities held. Such fluctuations are included with the net realized and unrealized gain or loss on investments. |
| |
| DISTRIBUTIONS AND TAXES: |
| As a qualified regulated investment company under Subchapter M of the Internal Revenue Code, the Fund is not subject to income taxes to the extent that it distributes substantially all of its taxable income for its fiscal year. The Schedule of Investments includes information regarding income taxes under the caption “Tax Information”. |
| The Fund pays any dividends and capital gain distributions annually in December. Because federal income tax regulations differ from generally accepted accounting principles, income and capital gain distributions determined in accordance with tax regulations may differ from net investment income and realized gains recognized for financial reporting purposes. Accordingly, the character of distributions and composition of net assets for tax purposes differ from those reflected in the accompanying financial statements. |
| |
| CAPITAL GAINS TAXES: |
| The Fund is subject to a tax imposed on short-term capital gains on securities of issuers domiciled in certain countries. The Fund records an estimated deferred tax liability for gains in these securities that have been held for less than one year. This amount, if any, is reported as deferred capital gains tax in the accompanying Statement of Assets and Liabilities, assuming those positions were disposed of at the end of the period, and accounted for as a reduction in the market value of the security. |
| |
| INVESTMENT TRANSACTIONS AND RELATED INVESTMENT INCOME: |
| Investment transactions are accounted for on the trade date. Dividend income is recorded on the ex-dividend date. Non-cash dividend income is recorded at the fair market value of the securities received. Interest income is recorded on an accrual basis. Premiums and discounts on debt securities are amortized using the effective yield-to-maturity method. Realized gains and losses from investment transactions are determined on the basis of identified cost for book and tax purposes. |
| |
| EXPENSES: |
| The Fund incurs direct and indirect expenses. Expenses directly attributable to the Fund are charged to the Fund’s operations, while expenses applicable to more than one of the Royce Funds are allocated equitably. Certain personnel, occupancy costs and other administrative expenses related to the Funds are allocated by Royce & Associates (“Royce”) under an administration agreement and are included in administrative and office facilities and professional fees. |
| 20 | 2018 Annual Report to Stockholders |
Royce Global Value Trust
Notes to Financial Statements (continued)
| COMPENSATING BALANCE CREDITS: |
| The Fund has an arrangement with its custodian bank, whereby a portion of the custodian’s fee is paid indirectly by credits earned on the Fund’s cash on deposit with the bank. This deposit arrangement is an alternative to purchasing overnight investments. Conversely, the Fund pays interest to the custodian on any cash overdrafts, to the extent they are not offset by credits earned on positive cash balances. |
| |
| Capital Stock: |
| The Fund issued 20,315 and 46,290 shares of Common Stock as reinvestment of distributions for the years ended December 31, 2018 and December 31, 2017, respectively. |
| |
| Borrowings: |
| The Fund is party to a revolving credit agreement (the credit agreement) with BNP Paribas Prime Brokerage International, Limited (BNPPI). The Fund pays a commitment fee of 0.50% per annum on the unused portion of the credit agreement. The credit agreement has a 179-day rolling term that resets daily; however, if the Fund exceeds certain net asset value triggers, the credit agreement may convert to a 60-day rolling term that resets daily. The Fund is required to pledge portfolio securities as collateral in an amount up to two times the loan balance outstanding or as otherwise required by applicable regulatory standards and has granted a security interest in the securities pledged to, and in favor of, BNPPI as security for the loan balance outstanding. If the Fund fails to meet certain requirements, or maintain other financial covenants required under the credit agreement, the Fund may be required to repay immediately, in part or in full, the loan balance outstanding under the credit agreement which may necessitate the sale of portfolio securities at potentially inopportune times. BNPPI may terminate the credit agreement upon certain ratings downgrades of its corporate parent, which would result in the Fund’s entire loan balance becoming immediately due and payable. The occurrence of such ratings downgrades may necessitate the sale of portfolio securities at potentially inopportune times. The credit agreement also permits, subject to certain conditions, BNPPI to rehypothecate portfolio securities pledged by the Fund up to the amount of the loan balance outstanding. The Fund continues to receive payments in lieu of dividends and interest on rehypothecated securities. The Fund also has the right under the credit agreement to recall the rehypothecated securities from BNPPI on demand. If BNPPI fails to deliver the recalled security in a timely manner, the Fund is compensated by BNPPI for any fees or losses related to the failed delivery or, in the event a recalled security is not returned by BNPPI, the Fund, upon notice to BNPPI, may reduce the loan balance outstanding by the value of the recalled security failed to be returned. The Fund receives a portion of the fees earned by BNPPI in connection with the rehypothecation of portfolio securities. |
| As of December 31, 2018, the Fund has outstanding borrowings of $8,000,000. During the year ended December 31, 2018, the Fund borrowed an average daily balance of $8,000,000 at a weighted average borrowing cost of 3.26%. The maximum amount outstanding during the year ended December 31, 2018 was $8,000,000. As of December 31, 2018, the aggregate value of rehypothecated securities was $6,408,273. During the year ended December 31, 2018, the Fund earned $39,372 in fees from rehypothecated securities. |
| |
| Investment Advisory Agreement: |
| The investment advisory agreement between Royce and the Fund provides for fees to be paid at an annual rate of 1.25% of the Fund’s average daily net assets. For the year ended December 31, 2018, the Fund expensed Royce investment advisory fees totaling $1,608,852. |
| |
| Purchases and Sales of Investment Securities: |
| For the year ended December 31, 2018, the costs of purchases and proceeds from sales of investment securities, other than short-term securities, amounted to $81,154,786 and $72,159,317, respectively. |
| Cross trades were executed by the Fund pursuant to Rule 17a-7 under the 1940 Act. Cross trading is the buying or selling of portfolio securities between funds to which Royce serves as investment adviser. At its regularly scheduled quarterly meetings, the Board reviews such transactions as of the most recent calendar quarter for compliance with the requirements and restrictions set forth by Rule 17a-7. Cross trades for the year ended December 31, 2018, were as follows: |
| COSTS OF PURCHASES | | PROCEEDS FROM SALES | | | REALIZED GAIN (LOSS) |
| |
| | $4,658,327 | | | | $425,880 | | | | | $(22,161) | |
| |
| Tax Information: |
| Distributions during the years ended December 31, 2018 and 2017, were characterized as follows for tax purposes: |
| ORDINARY INCOME | LONG-TERM CAPITAL GAINS |
| |
| 2018 | 2017 | 2018 | 2017 |
| |
| $418,468 | $1,145,697 | $ – | $ – |
| |
| 2018 Annual Report to Stockholders | 21 |
Royce Global Value Trust
Notes to Financial Statements (continued)
| Tax Information (continued): |
| The tax basis components of distributable earnings at December 31, 2018, were as follows: |
UNDISTRIBUTED
ORDINARY INCOME | UNDISTRIBUTED LONG-TERM
CAPITAL GAINS OR
(CAPITAL LOSS CARRYFORWARD) | NET UNREALIZED
APPRECIATION
(DEPRECIATION)1 | QUALIFIED LATE YEAR
ORDINARY AND
POST-OCTOBER LOSS
DEFERRALS2 | TOTAL
DISTRIBUTABLE
EARNINGS | CAPITAL LOSS
CARRYFORWARD
UTILIZED |
| |
| $68,089 | $(9,630,651) | $1,527,381 | $(864,592) | $(8,899,773) | $5,022,047 |
| |
| 1 | Includes timing differences on foreign currency, investments in publicly traded partnerships, recognition of losses on securities sold and mark-to-market of Passive Foreign Investment Companies. |
| 2 | Under the current tax law, capital losses and qualified late year ordinary losses incurred after October 31 may be deferred and treated as occurring on the first day of the following fiscal year. |
| For financial reporting purposes, capital accounts and distributions to stockholders are adjusted to reflect the tax character of permanent book/tax differences. For the year ended December 31, 2018, the Fund had no reclassifications. |
| Management has analyzed the Fund’s tax positions taken on federal income tax returns for all open tax years (2015-2018) and has concluded that as of December 31, 2018, no provision for income tax is required in the Fund’s financial statements. |
| Recent Accounting Pronouncement: |
| In August 2018, the Securities and Exchange Commission released its Final Rule on Disclosure Update and Simplification (the “Final Rule”) which is intended to simplify an issuer’s disclosure compliance efforts by removing redundant or outdated disclosure requirements without significantly altering the mix of information provided to investors. Effective with the current reporting period, the Fund adopted the Final Rule with the most notable impacts being that the Fund is no longer required to present the components of distributable earnings on the Statement of Assets and Liabilities or the sources of distributions to stockholders and the amount of undistributed net investment income on the Statement of Changes in Net Assets. |
| |
| Subsequent Events: |
| Effective January 1, 2019, the investment advisory fee was reduced from 1.25% to 1.00%. |
| 22 | 2018 Annual Report to Stockholders |
Report of Independent Registered Public Accounting Firm
To the Board of Directors and the Stockholders of Royce Global Value Trust, Inc.:
Opinion on the Financial Statements
We have audited the accompanying statement of assets and liabilities, including the schedule of investments, of Royce Global Value Trust, Inc. (the “Fund”) as of December 31, 2018, the related statements of operations and cash flows for the year ended December 31, 2018, the statement of changes in net assets for each of the two years in the period ended December 31, 2018, including the related notes, and the financial highlights for each of the four years in the period ended December 31, 2018 (collectively referred to as the “financial statements”). In our opinion, the financial statements present fairly, in all material respects, the financial position of the Fund as of December 31, 2018, the results of its operations and its cash flows for the year then ended, the changes in its net assets for each of the two years in the period ended December 31, 2018 and the financial highlights for each of the four years in the period ended December 31, 2018 in conformity with accounting principles generally accepted in the United States of America.
The financial statements of the Fund as of and for the year ended December 31, 2014 and the financial highlights for each of the periods ended on or prior to December 31, 2014 (not presented herein, other than the financial highlights) were audited by other auditors whose report dated February 23, 2015 expressed an unqualified opinion on those financial statements and financial highlights.
Basis for Opinion
These financial statements are the responsibility of the Fund’s management. Our responsibility is to express an opinion on the Fund’s financial statements based on our audits. We are a public accounting firm registered with the Public Company Accounting Oversight Board (United States) (PCAOB) and are required to be independent with respect to the Fund in accordance with the U.S. federal securities laws and the applicable rules and regulations of the Securities and Exchange Commission and the PCAOB.
We conducted our audits of these financial statements in accordance with the standards of the PCAOB. Those standards require that we plan and perform the audit to obtain reasonable assurance about whether the financial statements are free of material misstatement, whether due to error or fraud.
Our audits included performing procedures to assess the risks of material misstatement of the financial statements, whether due to error or fraud, and performing procedures that respond to those risks. Such procedures included examining, on a test basis, evidence regarding the amounts and disclosures in the financial statements. Our audits also included evaluating the accounting principles used and significant estimates made by management, as well as evaluating the overall presentation of the financial statements. Our procedures included confirmation of securities owned as of December 31, 2018 by correspondence with the custodian and brokers; when replies were not received from brokers, we performed other auditing procedures. We believe that our audits provide a reasonable basis for our opinion.
/s/PricewaterhouseCoopers LLP
New York, New York
February 21, 2019
We have served as the auditor of one or more investment companies in the Royce investment company group since at least 1967. We have not been able to determine the specific year we began serving as auditor.
| 2018 Annual Report to Stockholders | 23 |
| MANAGERS’ DISCUSSION |
| Royce Micro-Cap Trust (RMT) |
 |
Chuck Royce
Brendan Hartmann, Chris Flynn,
Jim Stoeffel |
| |
| FUND PERFORMANCE |
| In 2018’s difficult market, Royce Micro-Cap Trust stayed ahead of its micro-cap benchmark for the third consecutive year while slipping only narrowly behind the small-cap index, which it beat in the previous two. The Fund fell 11.6% on an NAV (net asset value) basis and 14.7% on a market price basis in 2018, losing less on an NAV basis than the Russell Microcap Index, which declined 13.1%, while slightly trailing the Russell 2000 Index, which fell 11.0%, for the same period. RMT beat the Russell 2000 on both an NAV and market price basis for the three-, 10-, 20-, 25-year, and since inception (12/14/93) periods ended December 31, 2018. It also outpaced the micro-cap index on both an NAV and market price basis for the three-, 10-, and 15-year periods ended December 31, 2018. (Data for the Russell Microcap Index goes back only to 6/30/00). |
| |
| WHAT WORKED... AND WHAT DIDN’T |
| Eight of the Fund’s 11 equity sectors finished 2018 in the red. Industrials detracted most by a wide margin, followed by Energy and Financials. Health Care made a small positive contribution, followed by Utilities and Communication Services. The six industry groups with the largest net losses for the Fund came from five different sectors, which gives a sense of how broad declines were for micro-cap stocks in 2018. By sizable margins, the machinery group was both our heaviest weighting at year-end and the biggest detractor in Industrials, accounting for more than 60% of the sector’s loss in the portfolio. Fourth-quarter difficulties for two machinery stocks—CIRCOR International and Sun Hydraulics (which does business as Helios Technologies)—had negative impacts on performance. CIRCOR makes valves for fluid control systems. Its shares fell in the fourth quarter amid concerns that slowing global growth, U.S.-China trade tensions, and the significant drop in oil prices—energy companies being among its larger end markets—would put a damper on CIRCOR’s positive order trends, pushing out a long-awaited improvement in profit margins and free cash flow earmarked for debt reduction. Sun Hydraulics manufactures hydraulic and electronic controls systems for a variety of industrial and recreational equipment makers. The company continued to book solid incoming orders, but labor and materials cost pressures, as well as a series of operational miscues stemming from a rush to meet growing demand, brought margins and earnings below expectations. We held shares in each company at year-end. |
| The energy equipment & services industry followed in second place. Slumping oil prices resulted in Energy suffering by far the steepest losses of any sector in the Russell 2000 for the calendar year, our holdings as a group fared better by comparison. Net losses came from several companies, including Era Group, Computer Modelling Group, SEACOR Marine Holdings, and Carbo Ceramics. We added shares of each of these energy services companies in 2018. |
| Mesa Laboratories, the portfolio’s top-contributing (and biggest) position, hails from Information Technology’s electronic equipment, instruments & components group although it does most of its business with hospitals, pharmaceutical and medical device manufacturers, and research laboratories by offering quality control and calibration products and services. Mesa reported record revenues for its fiscal fourth quarter and 2018 in the year’s first half, driven in part by strong results in its four divisions and greater efficiencies from the firm’s proprietary operating system that helped it to better manage inventories and speed up deliveries. The firm then reported record fiscal second-quarter revenues in October, geared by strong growth in its sterilization and disinfection control division. Performance-based marketing company QuinStreet has been reaping the benefits of its strategic shift away from for profit education to financial services marketing, with a current focus on the insurance industry. We trimmed our position as its price rose, but see further potential for growth as management begins to apply its marketing algorithms to other areas within financial services. |
| The Fund’s narrow underperformance versus the Russell 2000 in 2018 was the result of sector allocation—stock selection was additive. Both ineffective stock selection and our overweight hurt in Industrials, while stock picking hindered results in Financials. Conversely, savvy stock selection gave the portfolio an edge in Health Care as well as smaller advantages in Consumer Discretionary and Materials. |
| | | | | |
| | Top Contributors to Performance | | | |
| | For 2018 (%)1 | | | |
| | | | | |
| | Mesa Laboratories | | 0.75 | |
| | | |
| | QuinStreet | | 0.49 | |
| | | |
| | Mirati Therapeutics | | 0.45 | |
| | | |
| | Surmodics | | 0.40 | |
| | | |
| | Etsy | | 0.31 | |
| | | |
| | 1 Includes dividends | | | |
| | Top Detractors from Performance | | | |
| | For 2018 (%)2 | | | |
| | | | | |
| | CIRCOR International | | -0.82 | |
| | | |
| | Sun Hydraulics | | -0.49 | |
| | | |
| | Collectors Universe | | -0.37 | |
| | | |
| | Major Drilling Group International | | -0.37 | |
| | | |
| | Titan International | | -0.34 | |
| | | |
| | 2 Net of dividends | | | |
| | | | | |
| CURRENT POSITIONING AND OUTLOOK |
| While we acknowledge the many potential sources of risk on the horizon—economic, geopolitical, and financial—we also think that these concerns have already been reflected, perhaps even excessively so, in current valuations. In relatively short order, we transitioned from a period this summer when small- and micro-cap’s extended valuations seemed out of sync given the each asset class’s high levels of debt and low profitability, to one at the end of the year where valuations seemed more pessimistic than we think is warranted—at least in select instances. Down years for small- and micro-cap stocks have often been followed by strong ones. We believe that the portfolio’s cyclical tilt will be rewarded as recessionary concerns dissipate during the year. |
| 24 | 2018 Annual Report to Stockholders |
| PERFORMANCE AND PORTFOLIO REVIEW | | SYMBOLS MARKET PRICE RMT NAV XOTCX |
| Performance |
| Average Annual Total Return (%) Through 12/31/18 |
| | | JUL-DEC 20181 | | 1-YR | | 3-YR | | 5-YR | | 10-YR | | 15-YR | | 20-YR | | 25-YR | | SINCE INCEPTION (12/14/93) |
| |
| RMT (NAV) | | -18.04 | | -11.62 | | 8.25 | | 3.01 | | 13.07 | | 7.38 | | 9.39 | | 10.09 | | 10.08 |
| |
| 1 Not annualized |
Market Price Performance History Since Inception (12/14/93)
Cumulative Performance of Investment1
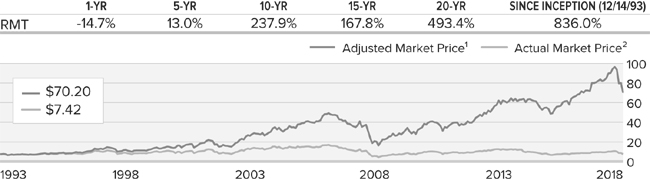
| 1 | Reflects the cumulative performance experience of a continuous common stockholder who purchased one share at inception ($7.50 IPO), reinvested all distributions and fully participated in the primary subscription of the Fund’s 1994 rights offering. |
| 2 | Reflects the actual month-end market price movement of one share as it has traded on NYSE and, prior to 12/1/03, on the Nasdaq. |
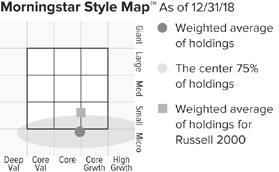
The Morningstar Style Map is the Morningstar Style Box™ with the center 75% of fund holdings plotted as the Morningstar Ownership Zone™. The Morningstar Style Box is designed to reveal a fund’s investment strategy. The Morningstar Ownership Zone provides detail about a portfolio’s investment style by showing the range of stock sizes and styles. The Ownership Zone is derived by plotting each stock in the portfolio within the proprietary Morningstar Style Box. Over time, the shape and location of a fund’s ownership zone may vary. See page 64 for additional information. |
| |
| Top 10 Positions | | |
| % of Net Assets | | |
| | | |
| Mesa Laboratories | | 3.1 |
| |
| Atrion Corporation | | 1.3 |
| |
| Surmodics | | 1.3 |
| |
| Social Capital Hedosophia Holdings Cl. A | | 1.3 |
| |
| Quaker Chemical | | 1.3 |
| |
| Heritage-Crystal Clean | | 1.2 |
| |
| nLIGHT | | 1.2 |
| |
| Kadant | | 1.2 |
| |
| CIRCOR International | | 1.0 |
| |
| Chicken Soup For The Soul Entertainment | | 1.0 |
| |
| |
| Portfolio Sector Breakdown | | |
| % of Net Assets | | |
| | | |
| Industrials | | 20.0 |
| |
| Information Technology | | 18.9 |
| |
| Financials | | 13.4 |
| |
| Health Care | | 13.3 |
| |
| Consumer Discretionary | | 12.1 |
| |
| Energy | | 7.5 |
| |
| Materials | | 6.3 |
| |
| Communication Services | | 4.4 |
| |
| Consumer Staples | | 2.7 |
| |
| Real Estate | | 2.0 |
| |
| Utilities | | 0.6 |
| |
| Outstanding Line of Credit, Net of Cash and Cash Equivalents | | -1.2 |
| |
| |
| Calendar Year Total Returns (%) | | |
| | | |
| YEAR | | RMT |
| |
| 2018 | | -11.6 |
| |
| 2017 | | 17.7 |
| |
| 2016 | | 22.0 |
| |
| 2015 | | -11.7 |
| |
| 2014 | | 3.5 |
| |
| 2013 | | 44.5 |
| |
| 2012 | | 17.3 |
| |
| 2011 | | -7.7 |
| |
| 2010 | | 28.5 |
| |
| 2009 | | 46.5 |
| |
| 2008 | | -45.5 |
| |
| 2007 | | 0.6 |
| |
| 2006 | | 22.5 |
| |
| 2005 | | 6.8 |
| |
| 2004 | | 18.7 |
| |
| |
| Portfolio Diagnostics | | |
| | | |
| Fund Net Assets | | $345 million |
| |
| Number of Holdings | | 340 |
| |
| Turnover Rate | | 21% |
| |
| Net Asset Value | | $8.53 |
| |
| Market Price | | $7.42 |
| |
| Net Leverage1 | | 1.2% |
| |
| Average Market Capitalization2 | | $418 million |
| |
| Weighted Average P/B Ratio3 | | 1.7x |
| |
| Active Share4 | | 95% |
| |
| U.S. Investments (% of Net Assets) | | 81.1% |
| |
| Non-U.S. Investments (% of Net Assets) | | 20.1% |
| |
| 1 | Net leverage is the percentage, in excess of 100%, of the total value of equity type investments, divided by net assets. |
| 2 | Geometric Average. This weighted calculation uses each portfolio holding’s market cap in a way designed to not skew the effect of very large or small holdings; instead, it aims to better identify the portfolio’s center, which Royce believes offers a more accurate measure of average market cap than a simple mean or median. |
| 3 | Harmonic Average. This weighted calculation evaluates a portfolio as if it were a single stock and measures it overall. It compares the total market value of the portfolio to the portfolio’s share in the earnings or book value, as the case may be, of its underlying stocks. |
| 4 | Active Share is the sum of the absolute values of the different weightings of each holding in the Fund versus each holding in the benchmark, divided by two. |
| Important Performance and Risk Information
All performance information reflects past performance, is presented on a total return basis, net of the Fund’s investment advisory fee, and reflects the reinvestment of distributions. Past performance is no guarantee of future results. Current performance may be higher or lower than performance quoted. Returns as of the most recent month-end may be obtained at www.roycefunds.com. Certain immaterial adjustments were made to the net assets of Royce Micro-Cap Trust at 12/31/12 and 12/31/14 for financial reporting purposes, and as a result the net asset value originally calculated on that date and the total return based on that net asset value differs from the adjusted net asset value and total return reported in the Financial Highlights. The market price of the Fund’s shares will fluctuate, so that shares may be worth more or less than their original cost when sold. The Fund normally invests in micro-cap companies, which may involve considerably more risk than investments in securities of larger-cap companies. The Fund’s broadly diversified portfolio does not ensure a profit or guarantee against loss. From time to time, the Fund may invest a significant portion of its net assets in foreign securities, which may involve political, economic, currency and other risks not encountered in U.S. investments. Regarding the “Top Contributors” and “Top Detractors” tables shown above, the sum of all contributors to, and all detractors from, performance for all securities in the portfolio would approximate the Fund’s year-to-date performance for 2018.
|
| 2018 Annual Report to Stockholders | 25 |
| |
| Schedule of Investments |
| Common Stocks – 100.6% |
| | | | SHARES | | | VALUE | |
| |
| | | | | | | | | |
| COMMUNICATION SERVICES – 3.8% | | | | | | | | |
| DIVERSIFIED TELECOMMUNICATION SERVICES - 0.2% | | | | | | | | |
ORBCOMM 1 | | | 87,100 | | | $ | 719,446 | |
| | | | | | | | |
| ENTERTAINMENT - 0.4% | | | | | | | | |
†Chicken Soup For The Soul Entertainment | | | 214,500 | | | | 1,613,040 | |
| | | | | | | | |
| INTERACTIVE MEDIA & SERVICES - 1.9% | | | | | | | | �� |
Care.com 1,2,3 | | | 171,787 | | | | 3,317,207 | |
QuinStreet 1 | | | 196,400 | | | | 3,187,572 | |
| | | | | | | | |
| | | | | | | | 6,504,779 | |
| | | | | | | | |
| MEDIA - 1.3% | | | | | | | | |
comScore 1 | | | 214,195 | | | | 3,090,834 | |
McClatchy Company (The) Cl. A 1 | | | 69,313 | | | | 530,244 | |
New Media Investment Group | | | 66,200 | | | | 765,934 | |
| | | | | | | | |
| | | | | | | | 4,387,012 | |
| | |
| Total (Cost $10,553,856) | | | | | | | 13,224,277 | |
| | |
| | | | | | | | | |
| CONSUMER DISCRETIONARY – 12.1% | | | | | | | | |
| AUTO COMPONENTS - 1.8% | | | | | | | | |
Fox Factory Holding 1 | | | 5,300 | | | | 312,011 | |
Motorcar Parts of America 1 | | | 54,800 | | | | 911,872 | |
Sebang Global Battery | | | 50,500 | | | | 1,627,061 | |
Standard Motor Products | | | 50,860 | | | | 2,463,150 | |
Stoneridge 1,2 | | | 41,400 | | | | 1,020,510 | |
Unique Fabricating | | | 12,200 | | | | 51,484 | |
| | | | | | | | |
| | | | | | | | 6,386,088 | |
| | | | | | | | |
| DISTRIBUTORS - 0.6% | | | | | | | | |
Uni-Select | | | 33,800 | | | | 480,558 | |
Weyco Group 2 | | | 54,300 | | | | 1,583,931 | |
| | | | | | | | |
| | | | | | | | 2,064,489 | |
| | | | | | | | |
| DIVERSIFIED CONSUMER SERVICES - 1.4% | | | | | | | | |
Aspen Group 1 | | | 141,520 | | | | 775,530 | |
Collectors Universe 2 | | | 108,200 | | | | 1,229,152 | |
Liberty Tax Cl. A 4 | | | 142,900 | | | | 1,671,930 | |
Universal Technical Institute 1 | | | 270,000 | | | | 985,500 | |
| | | | | | | | |
| | | | | | | | 4,662,112 | |
| | | | | | | | |
| HOTELS, RESTAURANTS & LEISURE - 2.0% | | | | | | | | |
Century Casinos 1 | | | 222,500 | | | | 1,644,275 | |
Del Taco Restaurants 1 | | | 8,200 | | | | 81,918 | |
†Inspired Entertainment 1 | | | 50,000 | | | | 240,000 | |
Lindblad Expeditions Holdings 1 | | | 254,000 | | | | 3,418,840 | |
Red Lion Hotels 1 | | | 167,600 | | | | 1,374,320 | |
| | | | | | | | |
| | | | | | | | 6,759,353 | |
| | | | | | | | |
| HOUSEHOLD DURABLES - 0.8% | | | | | | | | |
Cavco Industries 1,2,3 | | | 8,600 | | | | 1,121,268 | |
Flexsteel Industries 2 | | | 16,100 | | | | 355,488 | |
Lifetime Brands 2,3 | | | 119,294 | | | | 1,196,519 | |
Universal Electronics 1 | | | 6,100 | | | | 154,208 | |
ZAGG 1 | | | 3,700 | | | | 36,186 | |
| | | | | | | | |
| | | | | | | | 2,863,669 | |
| | | | | | | | |
| INTERNET & DIRECT MARKETING RETAIL - 1.3% | | | | | | | | |
FTD Companies 1 | | | 67,200 | | | | 99,456 | |
Gaia Cl. A 1,2,3 | | | 100,000 | | | | 1,036,000 | |
†Leaf Group 1 | | | 64,500 | | | | 441,825 | |
Real Matters 1 | | | 255,000 | | | | 616,393 | |
Stamps.com 1 | | | 11,700 | | | | 1,820,988 | |
Yatra Online 1 | | | 105,000 | | | | 422,100 | |
| | | | | | | | |
| | | | | | | | 4,436,762 | |
| | | | | | | | |
| LEISURE PRODUCTS - 0.9% | | | | | | | | |
Clarus Corporation | | | 174,926 | | | | 1,770,251 | |
†MasterCraft Boat Holdings 1 | | | 2,800 | | | | 52,360 | |
Nautilus 1 | | | 121,000 | | | | 1,318,900 | |
| | | | | | | | |
| | | | | | | | 3,141,511 | |
| | | | | | | | |
| MULTILINE RETAIL - 0.0% | | | | | | | | |
Tuesday Morning 1,2 | | | 36,700 | | | | 62,390 | |
| | | | | | | | |
| SPECIALTY RETAIL - 1.9% | | | | | | | | |
AutoCanada | | | 385,601 | | | | 3,205,810 | |
Barnes & Noble Education 1 | | | 80,000 | | | | 320,800 | |
Destination Maternity 1 | | | 212,000 | | | | 602,080 | |
Destination XL Group 1 | | | 50,000 | | | | 108,500 | |
Haverty Furniture 2 | | | 38,400 | | | | 721,152 | |
†Lazydays Holdings 1 | | | 30,000 | | | | 162,000 | |
MarineMax 1 | | | 7,600 | | | | 139,156 | |
Sears Hometown and Outlet Stores 1,2,3 | | | 269,700 | | | | 574,461 | |
Shoe Carnival 2 | | | 17,016 | | | | 570,206 | |
Stage Stores 2 | | | 15,000 | | | | 11,100 | |
| | | | | | | | |
| | | | | | | | 6,415,265 | |
| | | | | | | | |
| TEXTILES, APPAREL & LUXURY GOODS - 1.4% | | | | | | | | |
Crown Crafts | | | 112,159 | | | | 605,659 | |
Culp 2 | | | 32,900 | | | | 621,810 | |
J.G. Boswell Company 4 | | | 2,490 | | | | 1,369,500 | |
YGM Trading | | | 2,564,600 | | | | 2,292,599 | |
| | | | | | | | |
| | | | | | | | 4,889,568 | |
| | |
| Total (Cost $49,682,218) | | | | | | | 41,681,207 | |
| | |
| | | | | | | | | |
| CONSUMER STAPLES – 2.7% | | | | | | | | |
| BEVERAGES - 0.3% | | | | | | | | |
Crimson Wine Group 1,4 | | | 58,124 | | | | 453,367 | |
Primo Water 1 | | | 40,400 | | | | 566,004 | |
| | | | | | | | |
| | | | | | | | 1,019,371 | |
| | | | | | | | |
| FOOD PRODUCTS - 2.3% | | | | | | | | |
AGT Food and Ingredients | | | 25,800 | | | | 314,468 | |
Farmer Bros. 1,2,3 | | | 62,600 | | | | 1,460,458 | |
John B. Sanfilippo & Son 2,3 | | | 17,800 | | | | 990,748 | |
Landec Corporation 1,2 | | | 75,610 | | | | 895,222 | |
†RiceBran Technologies 1 | | | 50,000 | | | | 150,000 | |
Seneca Foods Cl. A 1,2,3 | | | 81,087 | | | | 2,288,275 | |
Seneca Foods Cl. B 1 | | | 40,400 | | | | 1,139,684 | |
SunOpta 1 | | | 164,481 | | | | 636,542 | |
| | | | | | | | |
| | | | | | | | 7,875,397 | |
| | | | | | | | |
| HOUSEHOLD PRODUCTS - 0.1% | | | | | | | | |
Central Garden & Pet 1 | | | 12,000 | | | | 413,400 | |
| |
| Total (Cost $7,431,817) | | | | | | | 9,308,168 | |
| |
| | | | | | | | | |
| ENERGY – 7.5% | | | | | | | | |
| ENERGY EQUIPMENT & SERVICES - 4.2% | | | | | | | | |
Aspen Aerogels 1 | | | 94,985 | | | | 202,318 | |
CARBO Ceramics 1,2,3 | | | 169,038 | | | | 588,252 | |
CES Energy Solutions | | | 25,000 | | | | 57,684 | |
Computer Modelling Group | | | 526,800 | | | | 2,349,994 | |
Dawson Geophysical 1 | | | 77,336 | | | | 261,396 | |
Era Group 1,2,3 | | | 383,700 | | | | 3,353,538 | |
†Forum Energy Technologies 1 | | | 50,000 | | | | 206,500 | |
Geospace Technologies 1,2 | | | 9,500 | | | | 97,945 | |
Hornbeck Offshore Services 1,2,3 | | | 460,000 | | | | 662,400 | |
Independence Contract Drilling 1 | | | 134,400 | | | | 419,328 | |
Mammoth Energy Services | | | 4,500 | | | | 80,910 | |
Matrix Service 1,2 | | | 28,700 | | | | 514,878 | |
Nabors Industries | | | 34,000 | | | | 68,000 | |
| 26 | 2018 Annual Report to Stockholders | | THE ACCOMPANYING NOTES ARE AN INTEGRAL PART OF THESE FINANCIAL STATEMENTS |
| |
| Schedule of Investments (continued) |
| | | | SHARES | | | VALUE | |
| |
| | | | | | | | | |
| ENERGY (continued) | | | | | | | | |
| ENERGY EQUIPMENT & SERVICES (continued) | | | | | | | | |
Newpark Resources 1 | | | 11,200 | | | $ | 76,944 | |
North American Construction Group | | | 50,000 | | | | 445,000 | |
Pioneer Energy Services 1,2,3 | | | 245,600 | | | | 302,088 | |
Profire Energy 1 | | | 175,000 | | | | 253,750 | |
SEACOR Marine Holdings 1,2 | | | 216,957 | | | | 2,551,414 | |
TerraVest Industries | | | 209,000 | | | | 1,555,406 | |
Total Energy Services | | | 42,800 | | | | 306,297 | |
| | | | | | | | |
| | | | | | | | 14,354,042 | |
| | | | | | | | |
| OIL, GAS & CONSUMABLE FUELS - 3.3% | | | | | | | | |
Ardmore Shipping 1 | | | 161,300 | | | | 753,271 | |
Cross Timbers Royalty Trust | | | 67,631 | | | | 754,762 | |
Dorchester Minerals L.P. | | | 153,963 | | | | 2,254,018 | |
Dorian LPG 1 | | | 163,138 | | | | 951,095 | |
GeoPark 1 | | | 86,971 | | | | 1,201,939 | |
Leucrotta Exploration 1 | | | 489,800 | | | | 344,424 | |
†Navigator Holdings 1 | | | 100,000 | | | | 940,000 | |
Panhandle Oil and Gas Cl. A | | | 5,500 | | | | 85,250 | |
Permian Basin Royalty Trust | | | 176,333 | | | | 1,040,365 | |
Ring Energy 1 | | | 50,000 | | | | 254,000 | |
Sabine Royalty Trust 2 | | | 59,548 | | | | 2,219,949 | |
StealthGas 1 | | | 229,664 | | | | 633,873 | |
†Teekay Offshore Partners L.P. | | | 56,000 | | | | 67,760 | |
| | | | | | | | |
| | | | | | | | 11,500,706 | |
| | |
| Total (Cost $36,358,707) | | | | | | | 25,854,748 | |
| | |
| | | | | | | | | |
| FINANCIALS – 13.4% | | | | | | | | |
| BANKS - 1.9% | | | | | | | | |
Bank of N.T. Butterfield & Son | | | 39,410 | | | | 1,235,503 | |
Bryn Mawr Bank | | | 25,000 | | | | 860,000 | |
Caribbean Investment Holdings 1 | | | 735,635 | | | | 159,399 | |
Chemung Financial | | | 31,000 | | | | 1,280,610 | |
Fauquier Bankshares 2 | | | 133,200 | | | | 2,432,232 | |
Live Oak Bancshares 2 | | | 30,900 | | | | 457,629 | |
Midway Investments 1,5 | | | 735,647 | | | | 0 | |
| | | | | | | | |
| | | | | | | | 6,425,373 | |
| | | | | | | | |
| CAPITAL MARKETS - 8.1% | | | | | | | | |
ASA Gold and Precious Metals | | | 171,150 | | | | 1,619,079 | |
†Ashford 1 | | | 10,000 | | | | 519,000 | |
†B. Riley Financial | | | 7,600 | | | | 107,920 | |
Bolsa Mexicana de Valores | | | 1,068,000 | | | | 1,820,601 | |
Canaccord Genuity Group | | | 203,300 | | | | 859,245 | |
†Donnelley Financial Solutions 1 | | | 50,000 | | | | 701,500 | |
Dundee Corporation Cl. A 1 | | | 413,200 | | | | 387,413 | |
Fiera Capital Cl. A | | | 78,000 | | | | 645,048 | |
GAIN Capital Holdings 2 | | | 25,000 | | | | 154,000 | |
GMP Capital | | | 332,800 | | | | 458,295 | |
Great Elm Capital Group 1 | | | 566,700 | | | | 1,915,446 | |
Hamilton Lane Cl. A 2 | | | 20,300 | | | | 751,100 | |
INTL FCStone 1,2 | | | 60,527 | | | | 2,214,078 | |
JZ Capital Partners 1 | | | 50,000 | | | | 283,598 | |
Manning & Napier Cl. A | | | 136,600 | | | | 240,416 | |
MVC Capital | | | 219,900 | | | | 1,805,379 | |
OHA Investment | | | 59,761 | | | | 60,359 | |
Pzena Investment Management Cl. A | | | 6,100 | | | | 52,765 | |
Queen City Investments 4 | | | 948 | | | | 1,071,335 | |
Silvercrest Asset Management Group Cl. A | | | 203,300 | | | | 2,689,659 | |
Sprott | | | 1,414,533 | | | | 2,662,870 | |
U.S. Global Investors Cl. A 2 | | | 439,454 | | | | 483,399 | |
Urbana Corporation | | | 237,600 | | | | 435,101 | |
Value Line 2 | | | 131,974 | | | | 3,432,644 | |
†Vostok New Ventures SDR 1 | | | 100,000 | | | | 680,360 | |
Warsaw Stock Exchange | | | 52,900 | | | | 518,066 | |
Westaim Corporation 1 | | | 500,000 | | | | 944,917 | |
Westwood Holdings Group 2 | | | 12,400 | | | | 421,600 | |
| | | | | | | | |
| | | | | | | | 27,935,193 | |
| | | | | | | | |
| CONSUMER FINANCE - 0.5% | | | | | | | | |
Currency Exchange International 1 | | | 7,000 | | | | 137,159 | |
EZCORP Cl. A 1,2,3 | | | 201,000 | | | | 1,553,730 | |
| | | | | | | | |
| | | | | | | | 1,690,889 | |
| | | | | | | | |
| DIVERSIFIED FINANCIAL SERVICES - 0.1% | | | | | | | | |
Waterloo Investment Holdings 1,5 | | | 806,000 | | | | 241,800 | |
| | | | | | | | |
| INSURANCE - 1.0% | | | | | | | | |
Hallmark Financial Services 1,2,3 | | | 114,000 | | | | 1,218,660 | |
†Health Insurance Innovations Cl. A 1 | | | 7,200 | | | | 192,456 | |
Heritage Insurance Holdings | | | 6,600 | | | | 97,152 | |
Trupanion 1,2,3 | | | 82,300 | | | | 2,095,358 | |
| | | | | | | | |
| | | | | | | | 3,603,626 | |
| | | | | | | | |
| INVESTMENT COMPANIES - 1.8% | | | | | | | | |
†GS Acquisition Holdings Cl. A 1 | | | 200,000 | | | | 1,960,000 | |
†Social Capital Hedosophia Holdings Cl. A 1,2 | | | 438,850 | | | | 4,388,500 | |
| | | | | | | | |
| | | | | | | | 6,348,500 | |
| | |
| Total (Cost $52,153,648) | | | | | | | 46,245,381 | |
| | |
| | | | | | | | | |
| HEALTH CARE – 13.3% | | | | | | | | |
| BIOTECHNOLOGY - 3.2% | | | | | | | | |
Abeona Therapeutics 1,2,3 | | | 142,221 | | | | 1,015,458 | |
†AMAG Pharmaceuticals 1 | | | 17,800 | | | | 270,382 | |
Aquinox Pharmaceuticals 1,2 | | | 145,397 | | | | 314,058 | |
Arcturus Therapeutics 1 | | | 106,436 | | | | 482,155 | |
BioCryst Pharmaceuticals 1 | | | 84,855 | | | | 684,780 | |
CareDx 1,2,3 | | | 56,000 | | | | 1,407,840 | |
Idera Pharmaceuticals 1 | | | 58,061 | | | | 160,829 | |
Knight Therapeutics 1 | | | 187,000 | | | | 1,053,347 | |
Mirati Therapeutics 1 | | | 31,100 | | | | 1,319,262 | |
Theratechnologies 1 | | | 10,000 | | | | 60,943 | |
Zafgen 1,2,3 | | | 336,781 | | | | 1,667,066 | |
Zealand Pharma 1 | | | 187,900 | | | | 2,375,963 | |
Zealand Pharma ADR 1 | | | 10,000 | | | | 116,100 | |
| | | | | | | | |
| | | | | | | | 10,928,183 | |
| | | | | | | | |
| HEALTH CARE EQUIPMENT & SUPPLIES - 4.7% | | | | | | | | |
AtriCure 1,2 | | | 15,000 | | | | 459,000 | |
Atrion Corporation 2 | | | 6,169 | | | | 4,571,723 | |
Chembio Diagnostics 1 | | | 185,500 | | | | 1,049,930 | |
CryoLife 1 | | | 4,600 | | | | 130,548 | |
GenMark Diagnostics 1 | | | 31,100 | | | | 151,146 | |
Invacare Corporation 2 | | | 43,300 | | | | 186,190 | |
LeMaitre Vascular | | | 5,000 | | | | 118,200 | |
OraSure Technologies 1,2,3 | | | 50,000 | | | | 584,000 | |
OrthoPediatrics Corporation 1 | | | 33,300 | | | | 1,161,504 | |
STRATEC | | | 14,000 | | | | 806,837 | |
Surmodics 1,2 | | | 94,500 | | | | 4,466,070 | |
TearLab Corporation 1,4 | | | 8,500 | | | | 765 | |
Utah Medical Products | | | 33,000 | | | | 2,741,640 | |
| | | | | | | | |
| | | | | | | | 16,427,553 | |
| | | | | | | | |
| HEALTH CARE PROVIDERS & SERVICES - 2.4% | | | | | | | | |
AAC Holdings 1 | | | 89,400 | | | | 125,160 | |
| THE ACCOMPANYING NOTES ARE AN INTEGRAL PART OF THESE FINANCIAL STATEMENTS | | 2018 Annual Report to Stockholders | 27 |
| |
| Schedule of Investments (continued) |
| | | | SHARES | | | VALUE | |
| |
| | | | | | | | | |
| HEALTH CARE (continued) | | | | | | | | |
| HEALTH CARE PROVIDERS & SERVICES (continued) | | | | | | | | |
Aceto Corporation | | | 58,300 | | | $ | 48,972 | |
BioTelemetry 1 | | | 34,300 | | | | 2,048,396 | |
CRH Medical 1 | | | 133,000 | | | | 407,222 | |
Cross Country Healthcare 1 | | | 150,800 | | | | 1,105,364 | |
National Research 2 | | | 89,529 | | | | 3,414,636 | |
†PetIQ Cl. A 1,2 | | | 25,000 | | | | 586,750 | |
Psychemedics Corporation 2 | | | 37,500 | | | | 595,125 | |
| | | | | | | | |
| | | | | | | | 8,331,625 | |
| | | | | | | | |
| HEALTH CARE TECHNOLOGY - 1.4% | | | | | | | | |
Simulations Plus 2 | | | 50,000 | | | | 995,000 | |
Tabula Rasa HealthCare 1,2 | | | 38,400 | | | | 2,448,384 | |
Vocera Communications 1 | | | 33,100 | | | | 1,302,485 | |
| | | | | | | | |
| | | | | | | | 4,745,869 | |
| | | | | | | | |
| LIFE SCIENCES TOOLS & SERVICES - 1.1% | | | | | | | | |
NeoGenomics 1 | | | 125,000 | | | | 1,576,250 | |
Quanterix Corporation 1 | | | 115,500 | | | | 2,114,805 | |
| | | | | | | | |
| | | | | | | | 3,691,055 | |
| | | | | | | | |
| PHARMACEUTICALS - 0.5% | | | | | | | | |
Agile Therapeutics 1,2 | | | 80,000 | | | | 46,072 | |
†Aratana Therapeutics 1 | | | 9,200 | | | | 56,396 | |
Correvio Pharma 1 | | | 83,200 | | | | 207,168 | |
Theravance Biopharma 1,2 | | | 59,009 | | | | 1,510,040 | |
| | | | | | | | |
| | | | | | | | 1,819,676 | |
| | |
| Total (Cost $32,597,463) | | | | | | | 45,943,961 | |
| | |
| | | | | | | | | |
| INDUSTRIALS – 20.0% | | | | | | | | |
| AEROSPACE & DEFENSE - 0.5% | | | | | | | | |
Astronics Corporation 1 | | | 6,429 | | | | 195,763 | |
CPI Aerostructures 1 | | | 171,800 | | | | 1,094,366 | |
Innovative Solutions and Support 1 | | | 78,828 | | | | 173,816 | |
SIFCO Industries 1 | | | 45,800 | | | | 158,010 | |
| | | | | | | | |
| | | | | | | | 1,621,955 | |
| | | | | | | | |
| BUILDING PRODUCTS - 1.3% | | | | | | | | |
Burnham Holdings Cl. A 4 | | | 117,000 | | | | 1,626,300 | |
CSW Industrials 1 | | | 20,000 | | | | 967,000 | |
DIRTT Environmental Solutions 1 | | | 96,000 | | | | 429,651 | |
Insteel Industries 2 | | | 44,200 | | | | 1,073,176 | |
Patrick Industries 1 | | | 17,250 | | | | 510,773 | |
| | | | | | | | |
| | | | | | | | 4,606,900 | |
| | | | | | | | |
| COMMERCIAL SERVICES & SUPPLIES - 2.6% | | | | | | | | |
†Acme United | | | 25,000 | | | | 356,250 | |
Atento 1 | | | 218,701 | | | | 876,991 | |
Civeo Corporation 1 | | | 150,000 | | | | 214,500 | |
CompX International Cl. A | | | 78,200 | | | | 1,064,302 | |
Heritage-Crystal Clean 1,2,3 | | | 185,277 | | | | 4,263,224 | |
Hudson Technologies 1 | | | 50,000 | | | | 44,500 | |
Interface | | | 10,600 | | | | 151,050 | |
PICO Holdings 1,2,3 | | | 121,200 | | | | 1,107,768 | |
Team 1,2,3 | | | 57,500 | | | | 842,375 | |
| | | | | | | | |
| | | | | | | | 8,920,960 | |
| | | | | | | | |
| CONSTRUCTION & ENGINEERING - 3.2% | | | | | | | | |
Ameresco Cl. A 1 | | | 251,400 | | | | 3,544,740 | |
†Construction Partners Cl. A 1 | | | 9,900 | | | | 87,417 | |
†Granite Construction | | | 13,500 | | | | 543,780 | |
IES Holdings 1,2 | | | 206,800 | | | | 3,215,740 | |
†Infrastructure and Energy Alternatives 1 | | | 275,100 | | | | 2,253,069 | |
Northwest Pipe 1,2,3 | | | 60,100 | | | | 1,399,729 | |
| | | | | | | | |
| | | | | | | | 11,044,475 | |
| | | | | | | | |
| ELECTRICAL EQUIPMENT - 0.8% | | | | | | | | |
American Superconducter 1 | | | 30,625 | | | | 341,469 | |
Encore Wire 2 | | | 4,100 | | | | 205,738 | |
LSI Industries | | | 423,340 | | | | 1,341,988 | |
Powell Industries 2 | | | 21,400 | | | | 535,214 | |
Power Solutions International 1,2,3,4 | | | 21,100 | | | | 194,120 | |
Revolution Lighting Technologies 1,2,3 | | | 81,200 | | | | 31,976 | |
| | | | | | | | |
| | | | | | | | 2,650,505 | |
| | | | | | | | |
| INDUSTRIAL CONGLOMERATES - 0.9% | | | | | | | | |
Raven Industries 2 | | | 83,600 | | | | 3,025,484 | |
| | | | | | | | |
| MACHINERY - 6.6% | | | | | | | | |
CIRCOR International 1,2,3 | | | 170,200 | | | | 3,625,260 | |
Exco Technologies | | | 85,400 | | | | 564,871 | |
Foster (L.B.) Company 1,2,3 | | | 95,300 | | | | 1,515,270 | |
FreightCar America 1 | | | 5,500 | | | | 36,795 | |
Global Brass and Copper Holdings | | | 5,000 | | | | 125,750 | |
Graham Corporation 2,3 | | | 75,150 | | | | 1,716,426 | |
Hurco Companies 2 | | | 36,866 | | | | 1,316,116 | |
Kadant 2 | | | 48,800 | | | | 3,975,248 | |
Kornit Digital 1 | | | 53,900 | | | | 1,009,008 | |
Lindsay Corporation 2 | | | 32,600 | | | | 3,137,750 | |
Luxfer Holdings 2 | | | 64,012 | | | | 1,128,532 | |
Lydall 1 | | | 12,800 | | | | 259,968 | |
NN | | | 45,300 | | | | 303,963 | |
Spartan Motors | | | 16,100 | | | | 116,403 | |
Sun Hydraulics 2 | | | 74,000 | | | | 2,456,060 | |
Titan International | | | 212,200 | | | | 988,852 | |
Twin Disc 1 | | | 4,300 | | | | 63,425 | |
Westport Fuel Systems 1 | | | 488,700 | | | | 649,971 | |
| | | | | | | | |
| | | | | | | | 22,989,668 | |
| | | | | | | | |
| MARINE - 1.6% | | | | | | | | |
†Algoma Central | | | 17,800 | | | | 165,327 | |
Clarkson | | | 109,900 | | | | 2,661,492 | |
†Eagle Bulk Shipping 1 | | | 570,000 | | | | 2,627,700 | |
| | | | | | | | |
| | | | | | | | 5,454,519 | |
| | | | | | | | |
| PROFESSIONAL SERVICES - 0.7% | | | | | | | | |
Acacia Research 1,2 | | | 190,000 | | | | 566,200 | |
Franklin Covey 1,2 | | | 40,100 | | | | 895,433 | |
GP Strategies 1 | | | 16,600 | | | | 209,326 | |
IBI Group 1 | | | 84,500 | | | | 269,865 | |
InnerWorkings 1 | | | 30,400 | | | | 113,696 | |
Kforce 2 | | | 2,800 | | | | 86,576 | |
Resources Connection | | | 11,200 | | | | 159,040 | |
| | | | | | | | |
| | | | | | | | 2,300,136 | |
| | | | | | | | |
| ROAD & RAIL - 0.7% | | | | | | | | |
Marten Transport | | | 5,500 | | | | 89,045 | |
Patriot Transportation Holding 1,2 | | | 55,764 | | | | 1,086,840 | |
Universal Logistics Holdings 2 | | | 75,200 | | | | 1,360,368 | |
| | | | | | | | |
| | | | | | | | 2,536,253 | |
| | | | | | | | |
| TRADING COMPANIES & DISTRIBUTORS - 1.1% | | | | | | | | |
EVI Industries 2 | | | 64,300 | | | | 2,144,405 | |
Houston Wire & Cable 1 | | | 331,418 | | | | 1,676,975 | |
| | | | | | | | |
| | | | | | | | 3,821,380 | |
| | |
| Total (Cost $69,319,307) | | | | | | | 68,972,235 | |
| | |
| | | | | | | | | |
| INFORMATION TECHNOLOGY – 18.9% | | | | | | | | |
| COMMUNICATIONS EQUIPMENT - 0.4% | | | | | | | | |
Clearfield 1 | | | 85,200 | | | | 845,184 | |
Digi International 1 | | | 31,400 | | | | 316,826 | |
| 28 | 2018 Annual Report to Stockholders | | THE ACCOMPANYING NOTES ARE AN INTEGRAL PART OF THESE FINANCIAL STATEMENTS |
| |
| Schedule of Investments (continued) |
| | | | SHARES | | | VALUE | |
| |
| | | | | | | | | |
| INFORMATION TECHNOLOGY (continued) | | | | | | | | |
| COMMUNICATIONS EQUIPMENT (continued) | | | | | | | | |
EMCORE Corporation 1 | | | 8,300 | | | $ | 34,860 | |
PCTEL | | | 34,100 | | | | 146,289 | |
| | | | | | | | |
| | | | | | | | 1,343,159 | |
| | | | | | | | |
| ELECTRONIC EQUIPMENT, INSTRUMENTS & COMPONENTS - 8.9% | | | | | | | | |
Airgain 1,2 | | | 1,200 | | | | 11,892 | |
Bel Fuse Cl. A | | | 67,705 | | | | 930,944 | |
ePlus 1 | | | 2,100 | | | | 149,457 | |
Fabrinet 1 | | | 2,200 | | | | 112,882 | |
FARO Technologies 1,2,3 | | | 82,800 | | | | 3,364,992 | |
Firan Technology Group 1 | | | 25,000 | | | | 38,639 | |
HollySys Automation Technologies | | | 51,900 | | | | 908,769 | |
Inficon Holding | | | 3,220 | | | | 1,630,147 | |
LightPath Technologies Cl. A 1 | | | 100,000 | | | | 149,000 | |
Mesa Laboratories 2 | | | 52,000 | | | | 10,836,280 | |
†nLIGHT 1,2,3 | | | 226,100 | | | | 4,020,058 | |
Novanta 1 | | | 3,400 | | | | 214,200 | |
Orbotech 1,2,3 | | | 47,800 | | | | 2,702,612 | |
†PAR Technology 1,2,3 | | | 60,268 | | | | 1,310,829 | |
PC Connection 2 | | | 43,716 | | | | 1,299,677 | |
Perceptron 1 | | | 8,500 | | | | 68,510 | |
Richardson Electronics | | | 316,900 | | | | 2,753,861 | |
Vishay Precision Group 1 | | | 10,000 | | | | 302,300 | |
| | | | | | | | |
| | | | | | | | 30,805,049 | |
| | | | | | | | |
| IT SERVICES - 0.2% | | | | | | | | |
Computer Task Group 1 | | | 84,800 | | | | 345,984 | |
Hackett Group (The) 2 | | | 27,700 | | | | 443,477 | |
| | | | | | | | |
| | | | | | | | 789,461 | |
| | | | | | | | |
| SEMICONDUCTORS & SEMICONDUCTOR EQUIPMENT - 5.2% | | | | | | | | |
†Adesto Technologies 1 | | | 172,600 | | | | 759,440 | |
Alpha & Omega Semiconductor 1 | | | 17,900 | | | | 182,401 | |
Amtech Systems 1,2 | | | 92,184 | | | | 417,594 | |
AXT 1 | | | 100,000 | | | | 435,000 | |
Brooks Automation 2 | | | 87,700 | | | | 2,295,986 | |
Cohu | | | 18,490 | | | | 297,134 | |
CyberOptics Corporation 1 | | | 47,600 | | | | 839,188 | |
†Everspin Technologies 1 | | | 5,900 | | | | 33,099 | |
FormFactor 1 | | | 22,869 | | | | 322,224 | |
Kulicke & Soffa Industries 2 | | | 77,200 | | | | 1,564,844 | |
Nanometrics 1,2 | | | 64,600 | | | | 1,765,518 | |
NeoPhotonics Corporation 1,2,3 | | | 82,200 | | | | 532,656 | |
Nova Measuring Instruments 1,2 | | | 75,300 | | | | 1,715,334 | |
PDF Solutions 1 | | | 189,700 | | | | 1,599,171 | |
Photronics 1 | | | 223,800 | | | | 2,166,384 | |
Rudolph Technologies 1 | | | 67,300 | | | | 1,377,631 | |
Silicon Motion Technology ADR | | | 34,100 | | | | 1,176,450 | |
Ultra Clean Holdings 1,2,3 | | | 61,900 | | | | 524,293 | |
Veeco Instruments 1,2,3 | | | 17,500 | | | | 129,675 | |
| | | | | | | | |
| | | | | | | | 18,134,022 | |
| | | | | | | | |
| SOFTWARE - 3.0% | | | | | | | | |
Agilysys 1 | | | 90,000 | | | | 1,290,600 | |
Amber Road 1 | | | 62,800 | | | | 516,844 | |
American Software Cl. A | | | 120,352 | | | | 1,257,678 | |
Attunity 1 | | | 4,400 | | | | 86,592 | |
MINDBODY Cl. A 1,2 | | | 38,900 | | | | 1,415,960 | |
Model N 1 | | | 50,000 | | | | 661,500 | |
Monotype Imaging Holdings | | | 15,000 | | | | 232,800 | |
OneSpan 1 | | | 5,600 | | | | 72,520 | |
Optiva 1 | | | 3,000 | | | | 103,128 | |
QAD Cl. A | | | 9,387 | | | | 369,191 | |
RealNetworks 1 | | | 100,171 | | | | 231,395 | |
Rubicon Project 1 | | | 75,000 | | | | 279,750 | |
SeaChange International 1 | | | 50,000 | | | | 63,000 | |
†SharpSpring 1 | | | 50,000 | | | | 636,500 | |
Solium Capital 1 | | | 342,500 | | | | 2,957,863 | |
Support.com 1 | | | 105,600 | | | | 259,776 | |
| | | | | | | | |
| | | | | | | | 10,435,097 | |
| | | | | | | | |
| TECHNOLOGY HARDWARE, STORAGE & PERIPHERALS - 1.2% | | | | | | | | |
AstroNova | | | 5,300 | | | | 99,375 | |
†Cray 1,2 | | | 19,700 | | | | 425,323 | |
Intevac 1 | | | 547,800 | | | | 2,864,994 | |
TransAct Technologies | | | 28,600 | | | | 256,828 | |
USA Technologies 1 | | | 90,500 | | | | 352,045 | |
| | | | | | | | |
| | | | | | | | 3,998,565 | |
| | |
| Total (Cost $56,495,410) | | | | | | | 65,505,353 | |
| | |
| | | | | | | | | |
| MATERIALS – 6.3% | | | | | | | | |
| CHEMICALS - 2.1% | | | | | | | | |
Balchem Corporation | | | 8,575 | | | | 671,852 | |
LSB Industries 1 | | | 135,800 | | | | 749,616 | |
OMNOVA Solutions 1 | | | 25,000 | | | | 183,250 | |
Quaker Chemical 2,3 | | | 24,400 | | | | 4,336,124 | |
Rayonier Advanced Materials | | | 50,000 | | | | 532,500 | |
Trecora Resources 1 | | | 89,600 | | | | 698,880 | |
| | | | | | | | |
| | | | | | | | 7,172,222 | |
| | | | | | | | |
| CONSTRUCTION MATERIALS - 0.3% | | | | | | | | |
Monarch Cement 4 | | | 16,303 | | | | 1,028,230 | |
U.S. Concrete 1 | | | 4,900 | | | | 172,872 | |
| | | | | | | | |
| | | | | | | | 1,201,102 | |
| | | | | | | | |
| CONTAINERS & PACKAGING - 0.3% | | | | | | | | |
UFP Technologies 1 | | | 36,445 | | | | 1,094,808 | |
| | | | | | | | |
| METALS & MINING - 3.6% | | | | | | | | |
Alamos Gold Cl. A | | | 186,044 | | | | 669,115 | |
Ampco-Pittsburgh 1 | | | 79,002 | | | | 244,906 | |
Haynes International 2 | | | 32,400 | | | | 855,360 | |
Hudbay Minerals | | | 62,200 | | | | 293,584 | |
Imdex 1 | | | 750,666 | | | | 565,743 | |
†Impala Platinum Holdings 1 | | | 500,000 | | | | 1,274,718 | |
MAG Silver 1 | | | 154,050 | | | | 1,124,565 | |
Major Drilling Group International 1 | | | 921,657 | | | | 3,105,495 | |
Olympic Steel | | | 35,000 | | | | 499,450 | |
Pretium Resources 1 | | | 80,000 | | | | 677,996 | |
†Sandstorm Gold 1 | | | 510,000 | | | | 2,351,100 | |
Universal Stainless & Alloy Products 1,2,3 | | | 24,620 | | | | 399,090 | |
Victoria Gold 1 | | | 890,000 | | | | 241,210 | |
| | | | | | | | |
| | | | | | | | 12,302,332 | |
| | |
| Total (Cost $21,750,881) | | | | | | | 21,770,464 | |
| | |
| | | | | | | | | |
| REAL ESTATE – 2.0% | | | | | | | | |
| REAL ESTATE MANAGEMENT & DEVELOPMENT - 2.0% | | | | | | | | |
Altus Group | | | 87,000 | | | | 1,508,416 | |
Marcus & Millichap 1,2 | | | 4,900 | | | | 168,217 | |
RMR Group Cl. A | | | 49,900 | | | | 2,648,692 | |
Tejon Ranch 1,2,3 | | | 154,994 | | | | 2,569,801 | |
| | |
| Total (Cost $7,281,785) | | | | | | | 6,895,126 | |
| | |
| THE ACCOMPANYING NOTES ARE AN INTEGRAL PART OF THESE FINANCIAL STATEMENTS | | 2018 Annual Report to Stockholders | 29 |
| Royce Micro-Cap Trust | | December 31, 2018 |
| |
| Schedule of Investments (continued) |
| | | | SHARES | | | VALUE | |
| |
| | | | | | | | | |
| UTILITIES – 0.6% | | | | | | | | |
| INDEPENDENT POWER & RENEWABLE ELECTRICITY PRODUCER - 0.0% | | | | | | | | |
†Innergex Renewable Energy | | | 15,573 | | | $ | 143,045 | |
| | | | | | | | |
| WATER UTILITIES - 0.6% | | | | | | | | |
†AquaVenture Holdings 1 | | | 50,000 | | | | 944,500 | |
Global Water Resources | | | 106,000 | | | | 1,074,840 | |
| | | | | | | | |
| | | | | | | | 2,019,340 | |
| | |
| Total (Cost $1,514,639) | | | | | | | 2,162,385 | |
| | |
| | | | | | | | | |
| TOTAL COMMON STOCKS | | | | | | | | |
| | |
| (Cost $345,139,731) | | | | | | | 347,563,305 | |
| | |
| | | | | | | | | |
| PREFERRED STOCK - 0.6% | | | | | | | | |
| | | | | | | | | |
| COMMUNICATION SERVICES – 0.6% | | | | | | | | |
| ENTERTAINMENT - 0.6% | | | | | | | | |
Chicken Soup For The Soul Entertainment | | | | | | | | |
†9.75 % Ser. A | | | 80,000 | | | | 1,960,000 | |
| | |
| (Cost $2,000,000) | | | | | | | 1,960,000 | |
| | |
| | | | | | | | | |
| WARRANTS – 0.0% | | | | | | | | |
| | | | | | | | | |
| CONSUMER DISCRETIONARY – 0.0% | | | | | | | | |
| HOTELS, RESTAURANTS & LEISURE - 0.0% | | | | | | | | |
Lindblad Expeditions Holdings (Warrants) 1 | | | 18,100 | | | | 56,472 | |
| | |
| Total (Cost $45,644) | | | | | | | 56,472 | |
| | |
| | | | | | | | | |
| INDUSTRIALS – 0.0% | | | | | | | | |
| CONSTRUCTION & ENGINEERING - 0.0% | | | | | | | | |
†Infrastructure and Energy Alternatives | | | | | | | | |
(Warrants) 1 | | | 100,000 | | | | 91,000 | |
| | |
| Total (Cost $106,385) | | | | | | | 91,000 | |
| | |
| | | | | | | | | |
| | | | | | | | | |
| INFORMATION TECHNOLOGY – 0.0% | | | | | | | | |
| ELECTRONIC EQUIPMENT, INSTRUMENTS & COMPONENTS - 0.0% | | | | | | | | |
†eMagin Corporation (Warrants) 1,5 | | | 50,000 | | | | 0 | |
| | |
| Total (Cost $0) | | | | | | | 0 | |
| | |
| | | | | | | | | |
| TOTAL WARRANTS | | | | | | | | |
| | |
| (Cost $152,029) | | | | | | | 147,472 | |
| | |
| | | | | | | | | |
| REPURCHASE AGREEMENT – 5.1% | | | | | | | | |
| Fixed Income Clearing Corporation, 0.50% dated 12/31/18, due 1/2/19, maturity value |
| $17,550,488 (collateralized by obligations of various U.S. Government Agencies, 2.125% |
| due 07/31/24, valued at $17,903,789) |
| | |
| (Cost $17,550,000) | | | | | | | 17,550,000 | |
| | |
| | | | | | | | | |
| TOTAL INVESTMENTS – 106.3% | | | | | | | | |
| | |
| (Cost $364,841,760) | | | | | | | 367,220,777 | |
| | |
| | | | | | | | | |
| LIABILITIES LESS CASH AND OTHER ASSETS – (6.3)% | | | | | | | (21,721,632 | ) |
| | | | | | | | |
| | | | | | | | | |
| | |
| NET ASSETS – 100.0% | | | | | | $ | 345,499,145 | |
| | |
| | ADR – American Depository Receipt |
| | |
| † | New additions in 2018. |
| 1 | Non-income producing. |
| 2 | All or a portion of these securities were pledged as collateral in connection with the Fund’s revolving credit agreement at December 31, 2018. Total market value of pledged securities at December 31, 2018, was $46,950,192. |
| 3 | At December 31, 2018, a portion of these securities were rehypothecated in connection with the Fund’s revolving credit agreement in the aggregate amount of $19,128,492. |
| 4 | These securities are defined as Level 2 securities due to fair value being based on quoted prices for similar securities. See Notes to Financial Statements. |
| 5 | Securities for which market quotations are not readily available represent 0.1% of net assets. These securities have been valued at their fair value under procedures approved by the Fund’s Board of Directors. These securities are defined as Level 3 securities due to the use of significant unobservable inputs in the determination of fair value. See Notes to Financial Statements. |
| | |
| | Bold indicates the Fund’s 20 largest equity holdings in terms of December 31, 2018, market value. |
| | |
| | TAX INFORMATION: The cost of total investments for Federal income tax purposes was $364,059,965. At December 31, 2018, net unrealized appreciation for all securities was $3,160,812 consisting of aggregate gross unrealized appreciation of $85,194,553 and aggregate gross unrealized depreciation of $82,033,741. The primary causes of the difference between book and tax basis cost are the timing of the recognition of losses on securities sold, investments in publicly traded partnerships and Trusts, investments in Real Estate Investment Trusts and mark-to-market of Passive Foreign Investment Companies. |
| 30 | 2018 Annual Report to Stockholders | | THE ACCOMPANYING NOTES ARE AN INTEGRAL PART OF THESE FINANCIAL STATEMENTS |
| Royce Micro-Cap Trust | | December 31, 2018 |
| |
| Statement of Assets and Liabilities |
| ASSETS: | | | | | |
| Investments at value | | | $ | 349,670,777 | |
| |
| Repurchase agreements (at cost and value) | | | | 17,550,000 | |
| |
| Cash and foreign currency | | | | 425 | |
| |
| Receivable for investments sold | | | | 348,661 | |
| |
| Receivable for dividends and interest | | | | 346,805 | |
| |
| Prepaid expenses and other assets | | | | 41,848 | |
| |
| Total Assets | | | | 367,958,516 | |
| |
| LIABILITIES: | | | | | |
| Revolving credit agreement | | | | 22,000,000 | |
| |
| Payable for investments purchased | | | | 14,687 | |
| |
| Payable for investment advisory fee | | | | 312,232 | |
| |
| Payable for directors’ fees | | | | 27,249 | |
| |
| Payable for interest expense | | | | 9,159 | |
| |
| Accrued expenses | | | | 96,044 | |
| |
| Total Liabilities | | | | 22,459,371 | |
| |
| Net Assets | | | $ | 345,499,145 | |
| |
| ANALYSIS OF NET ASSETS: | | | | | |
| Paid-in capital - $0.001 par value per share; 40,500,079 shares outstanding (150,000,000 shares authorized) | | | $ | 341,549,243 | |
| |
| Total distributable earnings (loss) | | | | 3,949,902 | |
| |
| Net Assets (net asset value per share - $8.53) | | | $ | 345,499,145 | |
| |
| Investments at identified cost | | | $ | 347,291,760 | |
| |
| THE ACCOMPANYING NOTES ARE AN INTEGRAL PART OF THESE FINANCIAL STATEMENTS | | 2018 Annual Report to Stockholders | 31 |
| |
| Statement of Changes in Net Assets |
| | | | YEAR ENDED 12/31/18 | | | | YEAR ENDED 12/31/17 |
| |
| | | | | | | | | | | | |
| INVESTMENT OPERATIONS: | | | | | | | | | | | |
| Net investment income (loss) | | | $ | 429,883 | | | | | $ | 2,126,051 | |
| |
| Net realized gain (loss) on investments and foreign currency | | | | 30,311,057 | | | | | | 25,657,103 | |
| |
| Net change in unrealized appreciation (depreciation) on investments and foreign currency | | | | (77,891,540 | ) | | | | | 33,136,932 | |
| |
| Net increase (decrease) in net assets from investment operations | | | | (47,150,600 | ) | | | | | 60,920,086 | |
| |
| DISTRIBUTIONS: | | | | | | | | | | | |
| Total distributable earnings1 | | | | (29,685,741 | ) | | | | | | |
| |
| Net investment income | | | | | | | | | | (2,282,512 | ) |
| |
| Net realized gain on investments and foreign currency | | | | | | | | | | (24,135,451 | ) |
| |
| Total distributions | | | | (29,685,741 | ) | | | | | (26,417,963 | ) |
| |
| CAPITAL STOCK TRANSACTIONS: | | | | | | | | | | | |
| Reinvestment of distributions | | | | 12,430,570 | | | | | | 11,702,040 | |
| |
| Total capital stock transactions | | | | 12,430,570 | | | | | | 11,702,040 | |
| |
| Net Increase (Decrease) In Net Assets | | | | (64,405,771 | ) | | | | | 46,204,163 | |
| |
| NET ASSETS: | | | | | | | | | | | |
| |
| Beginning of year | | | | 409,904,916 | | | | | | 363,700,753 | |
| |
| End of year (including undistributed net investment income (loss) of $(1,002,531) at 12/31/17 2) | | | $ | 345,499,145 | | | | | $ | 409,904,916 | |
| |
1 Distributions from net investment income and from realized gains are no longer required to be separately disclosed. See Notes to Financial Statements.
2 Parenthetical disclosure of undistributed net investment income is no longer required. See Notes to Financial Statements.
| 32 | 2018 Annual Report to Stockholders | | THE ACCOMPANYING NOTES ARE AN INTEGRAL PART OF THESE FINANCIAL STATEMENTS |
| Royce Micro-Cap Trust | | Year Ended December 31, 2018 |
| INVESTMENT INCOME: | | | | | |
| INCOME: | | | | | |
| Dividends | | | $ | 5,767,854 | |
| |
| Foreign withholding tax | | | | (113,975 | ) |
| |
| Interest | | | | 104,775 | |
| Rehypothecation income | | | | 296,080 | |
| |
| Total income | | | | 6,054,734 | |
| |
| EXPENSES: | | | | | |
| |
| Investment advisory fees | | | | 3,817,577 | |
| |
| Interest expense | | | | 1,239,044 | |
| |
| Stockholder reports | | | | 135,184 | |
| |
| Administrative and office facilities | | | | 127,067 | |
| |
| Directors’ fees | | | | 99,931 | |
| |
| Custody and transfer agent fees | | | | 92,657 | |
| |
| Professional fees | | | | 61,330 | |
| |
| Other expenses | | | | 53,502 | |
| |
| Total expenses | | | | 5,626,292 | |
| |
| Compensating balance credits | | | | (1,441 | ) |
| |
| Net expenses | | | | 5,624,851 | |
| |
| Net investment income (loss) | | | | 429,883 | |
| |
| REALIZED AND UNREALIZED GAIN (LOSS) ON INVESTMENTS AND FOREIGN CURRENCY: | | | | | |
| NET REALIZED GAIN (LOSS): | | | | | |
| |
| Investments | | | | 30,324,947 | |
| |
| Foreign currency transactions | | | | (13,890 | ) |
| |
| NET CHANGE IN UNREALIZED APPRECIATION (DEPRECIATION): | | | | | |
| |
| Investments | | | | (77,891,159 | ) |
| |
| Other assets and liabilities denominated in foreign currency | | | | (381 | ) |
| |
| Net realized and unrealized gain (loss) on investments and foreign currency | | | | (47,580,483 | ) |
| |
| NET INCREASE (DECREASE) IN NET ASSETS FROM INVESTMENT OPERATIONS | | | $ | (47,150,600 | ) |
| |
| THE ACCOMPANYING NOTES ARE AN INTEGRAL PART OF THESE FINANCIAL STATEMENTS | | 2018 Annual Report to Stockholders | 33 |
| Royce Micro-Cap Trust | | Year Ended December 31, 2018 |
| CASH FLOWS FROM OPERATING ACTIVITIES: | | | | | |
| Net increase (decrease) in net assets from investment operations | | | $ | (47,150,600 | ) |
| |
| Adjustments to reconcile net increase (decrease) in net assets from investment operations to net cash provided by operating activities: | | | | | |
| |
Purchases of long-term investments | | | | (88,755,815 | ) |
| |
Proceeds from sales and maturities of long-term investments | | | | 114,606,335 | |
| |
Net purchases, sales and maturities of short-term investments | | | | 13,880,000 | |
| |
Net (increase) decrease in dividends and interest receivable and other assets | | | | (35,578 | ) |
| |
Net increase (decrease) in interest expense payable, accrued expenses and other liabilities | | | | 145,345 | |
| |
Net change in unrealized appreciation (depreciation) on investments | | | | 77,891,159 | |
| |
Net realized gain (loss) on investments | | | | (30,324,947 | ) |
| |
| Net cash provided by operating activities | | | | 40,255,899 | |
| |
| CASH FLOWS FROM FINANCING ACTIVITIES: | | | | | |
| Decrease in revolving credit agreement | | | | (23,000,000 | ) |
| |
| Distributions | | | | (29,685,741 | ) |
| |
| Reinvestment of distributions | | | | 12,430,570 | |
| |
| Net cash used for financing activities | | | | (40,255,171 | ) |
| |
| INCREASE (DECREASE) IN CASH: | | | | 728 | |
| |
| Cash and foreign currency at beginning of year | | | | (303 | ) |
| |
| Cash and foreign currency at end of year | | | $ | 425 | |
| |
| Supplemental disclosure of cash flow information: |
| For the year ended December 31, 2018, the Fund paid $1,243,108 in interest expense. |
| 34 | 2018 Annual Report to Stockholders | | THE ACCOMPANYING NOTES ARE AN INTEGRAL PART OF THESE FINANCIAL STATEMENTS |
| |
| Financial Highlights |
| This table is presented to show selected data for a share of Common Stock outstanding throughout each period, and to assist stockholders in evaluating the Fund’s performance for the periods presented. |
| | | | YEARS ENDED |
| | | | |
| | | | 12/31/18 | | 12/31/17 | | 12/31/16 | | 12/31/15 | | 12/31/14 |
| |
| Net Asset Value, Beginning of Period | | | $ | 10.48 | | | $ | 9.63 | | | $ | 8.59 | | | $ | 11.33 | | | $ | 14.12 | |
| |
| INVESTMENT OPERATIONS: | | | | | | | | | | | | | | | | | | | | | |
| Net investment income (loss) | | | | 0.01 | | | | 0.06 | | | | 0.03 | | | | 0.03 | | | | (0.01 | ) |
| |
| Net realized and unrealized gain (loss) on investments and foreign currency | | | | (1.18 | ) | | | 1.52 | | | | 1.70 | | | | (1.42 | ) | | | 0.25 | |
| |
| Net increase (decrease) in net assets from investment operations | | | | (1.17 | ) | | | 1.58 | | | | 1.73 | | | | (1.39 | ) | | | 0.24 | |
| |
| DISTRIBUTIONS: | | | | | | | | | | | | | | | | | | | | | |
| Net investment income | | | | (0.00 | ) | | | (0.06 | ) | | | (0.08 | ) | | | (0.01 | ) | | | (0.04 | ) |
| |
| Net realized gain on investments and foreign currency | | | | (0.75 | ) | | | (0.63 | ) | | | (0.56 | ) | | | (1.25 | ) | | | (2.86 | ) |
| |
| Total distributions | | | | (0.75 | ) | | | (0.69 | ) | | | (0.64 | ) | | | (1.26 | ) | | | (2.90 | ) |
| |
| CAPITAL STOCK TRANSACTIONS: | | | | | | | | | | | | | | | | | | | | | |
| Effect of reinvestment of distributions by Common Stockholders | | | | (0.03 | ) | | | (0.04 | ) | | | (0.05 | ) | | | (0.09 | ) | | | (0.13 | ) |
| |
| Total capital stock transactions | | | | (0.03 | ) | | | (0.04 | ) | | | (0.05 | ) | | | (0.09 | ) | | | (0.13 | ) |
| |
| Net Asset Value, End of Period | | | $ | 8.53 | | | $ | 10.48 | | | $ | 9.63 | | | $ | 8.59 | | | $ | 11.33 | |
| |
| Market Value, End of Period | | | $ | 7.42 | | | $ | 9.44 | | | $ | 8.16 | | | $ | 7.26 | | | $ | 10.08 | |
| |
| TOTAL RETURN:1 | | | | | | | | | | | | | | | | | | | | | |
| Net Asset Value | | | | (11.62 | )% | | | 17.67 | % | | | 21.98 | % | | | (11.64 | )% | | | 3.46 | % |
| |
| Market Value | | | | (14.65 | )% | | | 25.09 | % | | | 22.30 | % | | | (16.06 | )% | | | 3.06 | % |
| |
| RATIOS BASED ON AVERAGE NET ASSETS: | | | | | | | | | | | | | | | | | | | | | |
| Investment advisory fee expense2 | | | | 0.92 | %3 | | | 0.49 | % | | | 0.87 | % | | | 0.93 | % | | | 0.93 | % |
| |
| Other operating expenses | | | | 0.43 | % | | | 0.40 | % | | | 0.39 | % | | | 0.35 | % | | | 0.25 | % |
| |
| Total expenses (net) | | | | 1.35 | % | | | 0.89 | % | | | 1.26 | % | | | 1.28 | % | | | 1.18 | % |
| |
| Expenses excluding interest expense | | | | 1.05 | % | | | 0.62 | % | | | 1.02 | % | | | 1.08 | % | | | 1.05 | % |
| |
| Expenses prior to balance credits | | | | 1.35 | % | | | 0.89 | % | | | 1.26 | % | | | 1.28 | % | | | 1.18 | % |
| |
| Net investment income (loss) | | | | 0.10 | % | | | 0.56 | % | | | 0.32 | % | | | 0.26 | % | | | (0.09 | )% |
| |
| SUPPLEMENTAL DATA: | | | | | | | | | | | | | | | | | | | | | |
| Net Assets, End of Period (in thousands) | | | $ | 345,499 | | | $ | 409,905 | | | $ | 363,701 | | | $ | 312,407 | | | $ | 387,488 | |
| |
| Portfolio Turnover Rate | | | | 21 | % | | | 15 | % | | | 26 | % | | | 39 | % | | | 41 | % |
| |
| REVOLVING CREDIT AGREEMENT: | | | | | | | | | | | | | | | | | | | | | |
| Asset coverage | | | | 1670 | % | | | 1011 | % | | | 908 | % | | | 794 | % | | | 746 | % |
| |
| Asset coverage per $1,000 | | | $ | 16,705 | | | $ | 10,109 | | | $ | 9,082 | | | $ | 7,942 | | | $ | 7,458 | |
| |
| 1 | The Market Value Total Return is calculated assuming a purchase of Common Stock on the opening of the first business day and a sale on the closing of the last business day of each period. Dividends and distributions are assumed for the purposes of this calculation to be reinvested at prices obtained under the Fund’s Distribution Reinvestment and Cash Purchase Plan. Net Asset Value Total Return is calculated on the same basis, except that the Fund’s net asset value is used on the purchase and sale dates instead of market value. |
| 2 | The investment advisory fee is calculated based on average net assets over a rolling 36-month basis, while the above ratios of investment advisory fee expenses are based on the average net assets over a 12-month basis. |
| 3 | This reflects the impact of the adjustment of prior period’s performance fees of 0.06%. |
| THE ACCOMPANYING NOTES ARE AN INTEGRAL PART OF THESE FINANCIAL STATEMENTS | | 2018 Annual Report to Stockholders | 35 |
Notes to Financial Statements
| Summary of Significant Accounting Policies |
Royce Micro-Cap Trust, Inc. (the “Fund”), is a diversified closed-end investment company that was incorporated under the laws of the State of Maryland on September 9, 1993. The Fund commenced operations on December 14, 1993. |
The preparation of financial statements in conformity with accounting principles generally accepted in the United States of America requires management to make estimates and assumptions that affect the reported amounts of assets and liabilities and the disclosure of contingent assets and liabilities at the date of the financial statements and the reported amounts of income and expenses during the reporting period. Actual results could differ from those estimates. |
The Fund is an investment company and accordingly follows the investment company accounting and reporting guidance of the Financial Accounting Standards Board (FASB) Accounting Standard Codification Topic 946 “Financial Services-Investment Companies”. |
| |
| VALUATION OF INVESTMENTS: |
Securities are valued as of the close of trading on the New York Stock Exchange (NYSE) (generally 4:00 p.m. Eastern time) on the valuation date. Securities that trade on an exchange, and securities traded on Nasdaq’s Electronic Bulletin Board, are valued at their last reported sales price or Nasdaq official closing price taken from the primary market in which each security trades or, if no sale is reported for such day, at their highest bid price. Other over-the-counter securities for which market quotations are readily available are valued at their highest bid price, except in the case of some bonds and other fixed income securities which may be valued by reference to other securities with comparable ratings, interest rates and maturities, using established independent pricing services. The Fund values its non-U.S. dollar denominated securities in U.S. dollars daily at the prevailing foreign currency exchange rates as quoted by a major bank. Securities for which market quotations are not readily available are valued at their fair value in accordance with the provisions of the 1940 Act, under procedures approved by the Fund’s Board of Directors, and are reported as Level 3 securities. As a general principle, the fair value of a security is the amount which the Fund might reasonably expect to receive for the security upon its current sale. However, in light of the judgment involved in fair valuations, there can be no assurance that a fair value assigned to a particular security will be the amount which the Fund might be able to receive upon its current sale. In addition, if, between the time trading ends on a particular security and the close of the customary trading session on the NYSE, events occur that are significant and may make the closing price unreliable, the Fund may fair value the security. The Fund uses an independent pricing service to provide fair value estimates for relevant non-U.S. equity securities on days when the U.S. market volatility exceeds a certain threshold. This pricing service uses proprietary correlations it has developed between the movement of prices of non-U.S. equity securities and indices of U.S.-traded securities, futures contracts and other indications to estimate the fair value of relevant non-U.S. securities. When fair value pricing is employed, the prices of securities used by the Fund may differ from quoted or published prices for the same security. Investments in money market funds are valued at net asset value per share. |
| Various inputs are used in determining the value of the Fund’s investments, as noted above. These inputs are summarized in the three broad levels below: |
| | | Level 1 | – | quoted prices in active markets for identical securities. |
| | | Level 2 | – | other significant observable inputs (including quoted prices for similar securities, foreign securities that may be fair valued and repurchase agreements). The table below includes all Level 2 securities. Level 2 securities with values based on quoted prices for similar securities are noted in the Schedule of Investments. |
| | | Level 3 | – | significant unobservable inputs (including last trade price before trading was suspended, or at a discount thereto for lack of marketability or otherwise, market price information regarding other securities, information received from the company and/or published documents, including SEC filings and financial statements, or other publicly available information). |
The inputs or methodology used for valuing securities are not necessarily an indication of the risk associated with investing in those securities. |
The following is a summary of the inputs used to value the Fund’s investments as of December 31, 2018. For a detailed breakout of common stocks by sector classification, please refer to the Schedule of Investments. |
| | | LEVEL 1 | | LEVEL 2 | | LEVEL 3 | | TOTAL |
| |
| Common Stocks | | | $339,905,958 | | | | $7,415,547 | | | | $241,800 | | | | $347,563,305 | |
| |
| Preferred Stocks | | | 1,960,000 | | | | – | | | | – | | | | 1,960,000 | |
| |
| Warrants | | | 147,472 | | | | – | | | | 0 | | | | 147,472 | |
| |
| Repurchase Agreement | | | – | | | | 17,550,000 | | | | – | | | | 17,550,000 | |
| |
Certain securities have transferred in and out of Level 1 and Level 2 measurements during the reporting period. This is generally due to whether fair value factors have been applied. The Fund recognizes transfers between levels as of the end of the reporting period. For the year ended December 31, 2018, securities valued at $1,671,930 were transferred from Level 1 to Level 2 and securities valued at $13,559,741 were transferred from Level 2 to Level 1 within the fair value hierarchy.
| 36 | 2018 Annual Report to Stockholders |
| Notes to Financial Statements (continued) |
| |
| VALUATION OF INVESTMENTS (continued): |
| |
| Level 3 Reconciliation: |
| | | BALANCE AS OF 12/31/17 | | PURCHASES | | REALIZED GAIN (LOSS) | | UNREALIZED GAIN (LOSS)1 | | BALANCE AS OF 12/31/18 |
| |
| Common Stocks | | $241,800 | | $0 | | $– | | $– | | $241,800 |
| |
| Warrants | | – | | 0 | | – | | – | | 0 |
| |
| 1 | The net change in unrealized appreciation (depreciation) is included in the accompanying Statement of Operations. Change in unrealized appreciation (depreciation) includes net unrealized appreciation (depreciation) resulting from changes in investment values during the reporting period and the reversal of previously recorded unrealized appreciation (depreciation) when gains or losses are realized. Net realized gain (loss) from investments and foreign currency transactions is included in the accompanying Statement of Operations. |
The following table summarizes the valuation techniques used and unobservable inputs approved by the Valuation Committee to determine the fair value of certain Level 3 investments. The table does not include Level 3 investments with values derived utilizing prices from prior transactions or third party pricing information with adjustments (e.g. broker quotes, pricing services, net asset values).
| | | | FAIR VALUE AT | | | | | | | | IMPACT TO VALUATION FROM |
| | | | 12/31/18 | | VALUATION TECHNIQUE(S) | | UNOBSERVABLE INPUT(S) | | RANGE AVERAGE | | AN INCREASE IN INPUT1 |
| |
| | | | | | Discounted Present Value | | | | | | |
| Common Stocks | | | $241,800 | | Balance Sheet Analysis | | Liquidity Discount | | 30%-40% | | Decrease |
| |
| 1 | This column represents the directional change in the fair value of the Level 3 investments that would result in an increase from the corresponding unobservable input. A decrease to the unobservable input would have the opposite effect. Significant increases and decreases in these unobservable inputs in isolation could result in significantly higher or lower fair value measurements. |
| REPURCHASE AGREEMENTS: |
The Fund may enter into repurchase agreements with institutions that the Fund’s investment adviser has determined are creditworthy. The Fund restricts repurchase agreements to maturities of no more than seven days. Securities pledged as collateral for repurchase agreements, which are held until maturity of the repurchase agreements, are marked-to-market daily and maintained at a value at least equal to the principal amount of the repurchase agreement (including accrued interest). Repurchase agreements could involve certain risks in the event of default or insolvency of the counter-party, including possible delays or restrictions upon the ability of the Fund to dispose of its underlying securities. The remaining contractual maturity of the repurchase agreement held by the Fund at December 31, 2018 is overnight and continuous. |
| |
| FOREIGN CURRENCY: |
Net realized foreign exchange gains or losses arise from sales and maturities of short-term securities, sales of foreign currencies, expiration of currency forward contracts, currency gains or losses realized between the trade and settlement dates on securities transactions, and the difference between the amounts of dividends, interest, and foreign withholding taxes recorded on the Fund’s books and the U.S. dollar equivalent of the amounts actually received or paid. Net unrealized foreign exchange gains and losses arise from changes in the value of assets and liabilities, other than investments in securities at the end of the reporting period, as a result of changes in foreign currency exchange rates. |
The Fund does not isolate that portion of the results of operations resulting from fluctuations in foreign exchange rates on investments from the fluctuations arising from changes in market prices of securities held. Such fluctuations are included with the net realized and unrealized gain or loss on investments. |
| |
| TAXES: |
As a qualified regulated investment company under Subchapter M of the Internal Revenue Code, the Fund is not subject to income taxes to the extent that it distributes substantially all of its taxable income for its fiscal year. The Schedule of Investments includes information regarding income taxes under the caption “Tax Information”. |
| |
| DISTRIBUTIONS: |
The Fund pays quarterly distributions on the Fund’s Common Stock at the annual rate of 7% of the rolling average of the prior four calendar quarter-end NAVs of the Fund’s Common Stock, with the fourth quarter distribution being the greater of 1.75% of the rolling average or the distribution required by IRS regulations. Distributions to Common Stockholders are recorded on ex-dividend date. To the extent that distributions in any year are not paid from long-term capital gains, net investment income or net short-term capital gains, they will represent a return of capital. Distributions are determined in accordance with income tax regulations that may differ from accounting principles generally accepted in the United States of America. Permanent book and tax differences relating to stockholder distributions will result in reclassifications within the capital accounts. Undistributed net investment income may include temporary book and tax basis differences, which will reverse in a subsequent period. Any taxable income or gain remaining undistributed at fiscal year end is distributed in the following year. |
| 2018 Annual Report to Stockholders | 37 |
| Royce Micro-Cap Trust |
| |
| Notes to Financial Statements (continued) |
| INVESTMENT TRANSACTIONS AND RELATED INVESTMENT INCOME: |
Investment transactions are accounted for on the trade date. Dividend income is recorded on the ex-dividend date. Non-cash dividend income is recorded at the fair market value of the securities received. Interest income is recorded on an accrual basis. Premiums and discounts on debt securities are amortized using the effective yield-to-maturity method. Realized gains and losses from investment transactions are determined on the basis of identified cost for book and tax purposes. |
| |
| EXPENSES: |
The Fund incurs direct and indirect expenses. Expenses directly attributable to the Fund are charged to the Fund’s operations, while expenses applicable to more than one of the Royce Funds are allocated equitably. Certain personnel, occupancy costs and other administrative expenses related to the Funds are allocated by Royce & Associates (“Royce”) under an administration agreement and are included in administrative and office facilities and professional fees. The Fund has adopted a deferred fee agreement that allows the Directors to defer the receipt of all or a portion of directors’ fees otherwise payable. The deferred fees are invested in certain Royce Funds until distributed in accordance with the agreement. |
| |
| COMPENSATING BALANCE CREDITS: |
The Fund has an arrangement with its custodian bank, whereby a portion of the custodian’s fee is paid indirectly by credits earned on the Fund’s cash on deposit with the bank. This deposit arrangement is an alternative to purchasing overnight investments. Conversely, the Fund pays interest to the custodian on any cash overdrafts, to the extent they are not offset by credits earned on positive cash balances. |
| |
| Capital Stock: |
The Fund issued 1,383,439 and 1,336,310 shares of Common Stock as reinvestment of distributions for the years ended December 31, 2018 and December 31, 2017, respectively. |
| |
| Borrowings: |
The Fund is party to a revolving credit agreement (the credit agreement) with BNP Paribas Prime Brokerage International, Limited (BNPPI). The Fund pays a commitment fee of 0.50% per annum on the unused portion of the credit agreement. The credit agreement has a 179-day rolling term that resets daily; however, if the Fund exceeds certain net asset value triggers, the credit agreement may convert to a 60-day rolling term that resets daily. The Fund is required to pledge portfolio securities as collateral in an amount up to two times the loan balance outstanding or as otherwise required by applicable regulatory standards and has granted a security interest in the securities pledged to, and in favor of, BNPPI as security for the loan balance outstanding. If the Fund fails to meet certain requirements, or maintain other financial covenants required under the credit agreement, the Fund may be required to repay immediately, in part or in full, the loan balance outstanding under the credit agreement which may necessitate the sale of portfolio securities at potentially inopportune times. BNPPI may terminate the credit agreement upon certain ratings downgrades of its corporate parent, which would result in the Fund’s entire loan balance becoming immediately due and payable. The occurrence of such ratings downgrades may necessitate the sale of portfolio securities at potentially inopportune times. The credit agreement also permits, subject to certain conditions, BNPPI to rehypothecate portfolio securities pledged by the Fund up to the amount of the loan balance outstanding. The Fund continues to receive payments in lieu of dividends and interest on rehypothecated securities. The Fund also has the right under the credit agreement to recall the rehypothecated securities from BNPPI on demand. If BNPPI fails to deliver the recalled security in a timely manner, the Fund is compensated by BNPPI for any fees or losses related to the failed delivery or, in the event a recalled security is not returned by BNPPI, the Fund, upon notice to BNPPI, may reduce the loan balance outstanding by the value of the recalled security failed to be returned. The Fund receives a portion of the fees earned by BNPPI in connection with the rehypothecation of portfolio securities. |
As of December 31, 2018, the Fund has outstanding borrowings of $22,000,000. During the year ended December 31, 2018, the Fund borrowed an average daily balance of $38,065,753 at a weighted average borrowing cost of 3.26%. The maximum amount outstanding during the year ended December 31, 2018 was $45,000,000. As of December 31, 2018, the aggregate value of rehypothecated securities was $19,128,492. During the year ended December 31, 2018, the Fund earned $296,080 in fees from rehypothecated securities. |
| |
| Investment Advisory Agreement: |
As compensation for its services under the investment advisory agreement, Royce receives a fee comprised of a Basic Fee (“Basic Fee”) and an adjustment to the Basic Fee based on the investment performance of the Fund in relation to the investment record of the Russell 2000. |
The Basic Fee is a monthly fee equal to 1/12 of 1% (1% on an annualized basis) of the average of the Fund’s month-end net assets for the rolling 36-month period ending with such month (the “performance period”). The Basic Fee for each month is increased or decreased at the rate of 1/12 of .05% for each percentage point that the investment performance of the Fund exceeds, or is exceeded by, the |
| 38 | 2018 Annual Report to Stockholders |
| Royce Micro-Cap Trust |
| |
| Notes to Financial Statements (continued) |
| Investment Advisory Agreement (continued): |
percentage change in the investment record of the Russell 2000 for the performance period by more than two percentage points. The performance period for each such month is a rolling 36-month period ending with such month. The maximum increase or decrease in the Basic Fee for any month may not exceed 1/12 of .5%. Accordingly, for each month, the maximum monthly fee rate as adjusted for performance is 1/12 of 1.5% and is payable if the investment performance of the Fund exceeds the percentage change in the investment record of the Russell 2000 by 12 or more percentage points for the performance period, and the minimum monthly fee rate as adjusted for performance is 1/12 of .5% and is payable if the percentage change in the investment record of the Russell 2000 exceeds the investment performance of the Fund by 12 or more percentage points for the performance period. |
For the twelve rolling 36-month periods in 2018, the Fund’s investment performance ranged from 4% above to 5% below the investment performance of the Russell 2000. Accordingly, the net investment advisory fee consisted of a Basic Fee of $3,646,272 and a net downward adjustment of $73,831 for the performance of the Fund relative to that of the Russell 2000. Additionally, investment advisory fees for 2018 include $245,136 relating to an adjustment of prior periods’ performance fees. For the year ended December 31, 2018, the Fund expensed Royce investment advisory fees totaling $3,817,577. |
| |
| Purchases and Sales of Investment Securities: |
For the year ended December 31, 2018, the costs of purchases and proceeds from sales of investment securities, other than short-term securities, amounted to $88,074,520 and $108,402,436, respectively. |
Cross trades were executed by the Fund pursuant to Rule 17a-7 under the 1940 Act. Cross trading is the buying or selling of portfolio securities between funds to which Royce serves as investment adviser. At its regularly scheduled quarterly meetings, the Board reviews such transactions as of the most recent calendar quarter for compliance with the requirements and restrictions set forth by Rule 17a-7. Cross trades for the year ended December 31, 2018, were as follows: |
| COSTS OF PURCHASES | | | PROCEEDS FROM SALES | | | REALIZED GAIN (LOSS) |
| |
| $10,494,930 | | | $842,672 | | | $393,874 |
| |
| Tax Information: |
| Distributions during the years ended December 31, 2018 and 2017, were characterized as follows for tax purposes: |
| ORDINARY INCOME | | | LONG-TERM CAPITAL GAINS |
| |
| 2018 | | | 2017 | | | 2018 | | | 2017 |
| |
| $1,668,339 | | | $5,516,070 | | | $28,017,402 | | | $20,901,893 |
| |
| The tax basis components of distributable earnings at December 31, 2018, were as follows: |
| | | | | | | | | | QUALIFIED LATE YEAR | | | | |
| | | | UNDISTRIBUTED LONG-TERM | | | NET UNREALIZED | | | ORDINARY AND | | | | TOTAL |
| UNDISTRIBUTED | | | CAPITAL GAINS OR | | | APPRECIATION | | �� | POST-OCTOBER LOSS | | | | DISTRIBUTABLE |
| ORDINARY INCOME | | | (CAPITAL LOSS CARRYFORWARD) | | | (DEPRECIATION)1 | | | DEFERRALS2 | | | | EARNINGS |
| |
| $894,213 | | | $421,579 | | | $3,160,591 | | | $(526,481) | | | | $3,949,902 |
| |
| 1 | Includes timing differences on foreign currency, recognition of losses on securities sold, investments in publicly traded partnerships and Trusts and mark-to-market of Passive Foreign Investment Companies. |
| 2 | Under the current tax law, capital losses and qualified late year ordinary losses incurred after October 31 may be deferred and treated as occurring on the first day of the following fiscal year. This column also includes passive activity losses. |
For financial reporting purposes, capital accounts and distributions to stockholders are adjusted to reflect the tax character of permanent book/tax differences. For the year ended December 31, 2018, the Fund had no reclassifications. |
Management has analyzed the Fund’s tax positions taken on federal income tax returns for all open tax years (2015-2018) and has concluded that as of December 31, 2018, no provision for income tax is required in the Fund’s financial statements. |
| |
| Recent Accounting Pronouncement: |
In August 2018, the Securities and Exchange Commission released its Final Rule on Disclosure Update and Simplification (the “Final Rule”) which is intended to simplify an issuer’s disclosure compliance efforts by removing redundant or outdated disclosure requirements without significantly altering the mix of information provided to investors. Effective with the current reporting period, the Fund adopted the Final Rule with the most notable impacts being that the Fund is no longer required to present the components of distributable earnings on the Statement of Assets and Liabilities or the sources of distributions to stockholders and the amount of undistributed net investment income on the Statement of Changes in Net Assets. |
| |
| Subsequent Events: |
Subsequent events have been evaluated through the date the financial statements were issued. |
| 2018 Annual Report to Stockholders | 39 |
| Report of Independent Registered Public Accounting Firm |
| |
| To the Board of Directors and the Stockholders of Royce Micro-Cap Trust, Inc.: |
| |
| Opinion on the Financial Statements |
We have audited the accompanying statement of assets and liabilities, including the schedule of investments, of Royce Micro-Cap Trust, Inc. (the “Fund”) as of December 31, 2018, the related statements of operations and cash flows for the year ended December 31, 2018, the statement of changes in net assets for each of the two years in the period ended December 31, 2018, including the related notes, and the financial highlights for each of the four years in the period ended December 31, 2018 (collectively referred to as the “financial statements”). In our opinion, the financial statements present fairly, in all material respects, the financial position of the Fund as of December 31, 2018, the results of its operations and its cash flows for the year then ended, the changes in its net assets for each of the two years in the period ended December 31, 2018 and the financial highlights for each of the four years in the period ended December 31, 2018 in conformity with accounting principles generally accepted in the United States of America. |
| |
The financial statements of the Fund as of and for the year ended December 31, 2014 and the financial highlights for each of the periods ended on or prior to December 31, 2014 (not presented herein, other than the financial highlights) were audited by other auditors whose report dated February 23, 2015 expressed an unqualified opinion on those financial statements and financial highlights. |
| |
| Basis for Opinion |
| |
These financial statements are the responsibility of the Fund’s management. Our responsibility is to express an opinion on the Fund’s financial statements based on our audits. We are a public accounting firm registered with the Public Company Accounting Oversight Board (United States) (PCAOB) and are required to be independent with respect to the Fund in accordance with the U.S. federal securities laws and the applicable rules and regulations of the Securities and Exchange Commission and the PCAOB. |
| |
We conducted our audits of these financial statements in accordance with the standards of the PCAOB. Those standards require that we plan and perform the audit to obtain reasonable assurance about whether the financial statements are free of material misstatement, whether due to error or fraud. |
| |
Our audits included performing procedures to assess the risks of material misstatement of the financial statements, whether due to error or fraud, and performing procedures that respond to those risks. Such procedures included examining, on a test basis, evidence regarding the amounts and disclosures in the financial statements. Our audits also included evaluating the accounting principles used and significant estimates made by management, as well as evaluating the overall presentation of the financial statements. Our procedures included confirmation of securities owned as of December 31, 2018 by correspondence with the custodian and brokers; when replies were not received from brokers, we performed other auditing procedures. We believe that our audits provide a reasonable basis for our opinion. |
| |
| |
| /s/PricewaterhouseCoopers LLP |
| New York, New York |
| February 21, 2019 |
| |
We have served as the auditor of one or more investment companies in the Royce investment company group since at least 1967. We have not been able to determine the specific year we began serving as auditor. |
| 40 | 2018 Annual Report to Stockholders |
This page is intentionally left blank.
| 2018 Annual Report to Stockholders | 41 |
| MANAGERS’ DISCUSSION |
| |
| Royce Value Trust (RVT) |
 |
| Chuck Royce |
| FUND PERFORMANCE |
| Following two consecutive years of strong absolute and relative performance, Royce Value Trust pulled back in 2018 compared to its unleveraged small-cap benchmarks—though it maintained its longer-term relative advantages. The Fund was down 14.4% on an NAV (net asset value) basis and 20.4% based on market price in 2018, compared to respective declines of 11.0% and 8.5% for the Russell 2000 and S&P SmallCap 600 Indexes for the same period. Still, we were pleased that on an NAV basis, RVT outpaced the Russell 2000 for the three-, 10-, 20-, 25-, 30-year, and since inception (11/26/86) periods ended December 31, 2018. On a market price basis, the Fund outperformed for all of these periods except the 10-year span. |
| |
| WHAT WORKED... AND WHAT DIDN’T |
Eight of the Fund’s 11 equity sectors declined in 2018. Industrials detracted most by a sizable margin, followed by Information Technology and Consumer Discretionary while Health Care, Utilities, and Consumer Staples made modest positive contributions.
The five industry groups with the most significant net losses for the Fund came from five different sectors, which gives a sense of how broad declines were for small-caps in 2018. By sizable margins, the machinery group was both the biggest detractor and our heaviest weighting in Industrials at year-end. Fourth-quarter difficulties for two machinery stocks—Sun Hydraulics (which does business as Helios Technologies) and CIRCOR International—had appreciable negative impacts on performance. Sun Hydraulics manufactures hydraulic and electronic controls systems for a variety of industrial and recreational equipment makers. The company continued to book solid incoming orders, but labor and materials cost pressures, as well as a series of operational miscues stemming from a rush to meet growing demand, brought margins and earnings below expectations. CIRCOR makes valves for fluid control systems. Its shares fell precipitously in the fourth quarter amid concerns that slowing global growth, U.S.-China trade tensions, and the significant drop in oil prices—energy companies being among its larger end markets—would put a damper on CIRCOR’s positive order trends, pushing out a long-awaited improvement in profit margins and free cash flow earmarked for debt reduction. We held shares in each company at year-end, confident in their respective abilities to recover.
Information Technology’s electronic equipment, instruments & components group had the second-largest negative impact at the industry level and was home to RVT’s top-detracting position. Coherent is a laser diode and equipment maker that made the journey from first to worst between 2017 and 2018 as the company faced something of a perfect storm in the latter year. First, the materials processing market in China slowed. Although the slowdown was somewhat expected, the steep rate of change was not. Coherent also faced some early struggles with its acquisition of Rofin-Sinar. Perhaps most important, the firm saw appreciably slower demand for its laser systems, where it effectively holds a monopoly position for OLED (organic light-emitting diode) manufacturing for smartphones. Our analysis indicated that these challenges had been more than priced in, so we added shares in 2018. Our confidence was rooted in Coherent’s highly profitable and growing OLED service segment and OLED penetration into the television and automotive industries. Coherent also stands to benefit from Apple’s possible switch from LCD phones to exclusively OLED.
The portfolio’s top-contributing positions also hailed from the electronic equipment, instruments & components group. Fabrinet is a contract manufacturer that offers specialized products and services to original equipment manufacturers in the technology space. The merger of two large customers appeared to drive investors away in 2017 over concerns that the consolidation would contract Fabrinet’s business. The company then went ahead and executed successfully, and profitably, in 2018, which led its stock to recover. An industrial company that’s a leading provider of auctions for salvaged vehicles, Copart saw increases in volume and revenue per car in 2018.
Relative to the Russell 2000 in 2018, sector allocation was a much larger source of underperformance than stock selection. Ineffective stock picks did hurt significantly, however, in Information Technology and Consumer Discretionary while our overweight in Industrials also hampered performance versus the index. Conversely, the portfolio benefited from savvy stock selection in the Materials and Energy sectors. |
| Top Contributors to Performance | | | |
| For 2018 (%)1 | | | |
| | | | |
| Fabrinet | | 0.33 | |
| |
| Copart | | 0.20 | |
| |
| HEICO Corporation | | 0.18 | |
| |
| Seeing Machines | | 0.14 | |
| |
| Quaker Chemical | | 0.13 | |
| |
| 1 Includes dividends | | | |
| Top Detractors from Performance | | | |
| For 2018 (%)2 | | | |
| | | | |
| Coherent | | -0.76 | |
| |
| Sun Hydraulics | | -0.60 | |
| |
| CIRCOR International | | -0.58 | |
| |
| Thor Industries | | -0.55 | |
| |
| Cognex Corporation | | -0.47 | |
| |
| 2 Net of dividends | | | |
| CURRENT POSITIONING AND OUTLOOK |
| While we acknowledge the many potential sources of risk on the horizon—economic, geopolitical, and financial—we also think that these concerns have already been reflected, perhaps even excessively so, in current valuations. In short order, we shifted from a period when small-cap’s extended valuations seemed out of sync given the index’s high levels of debt and low profitability to one at the end of the year where valuations seemed more pessimistic than we think is warranted—at least in select instances. As a result, we put cash to work as we identified what we thought were terrific opportunities —the Fund was fully invested at year-end. Down years for small-caps have often been followed by strong ones. We believe that the portfolio’s cyclical tilt will be rewarded as recessionary concerns dissipate during the year. |
| 42 | 2018 Annual Report to Stockholders |
| PERFORMANCE AND PORTFOLIO REVIEW | | SYMBOLS MARKET PRICE RVT NAV XRVTX |
| Performance |
| Average Annual Total Return (%) Through 12/31/18 |
| | | JUL-DEC 20181 | | 1-YR | | 3-YR | | 5-YR | | 10-YR | | 15-YR | | 20-YR | | 25-YR | | 30-YR | | SINCE INCEPTION (11/26/86) |
| |
| RVT (NAV) | | -16.77 | | -14.45 | | 9.00 | | 3.70 | | 12.14 | | 7.17 | | 8.42 | | 9.34 | | 10.20 | | 9.94 |
| |
| 1 Not Annualized | | | | | | | | | | | | |
| Market Price Performance History Since Inception (11/26/86) |
| Cumulative Performance of Investment through 12/31/181 |
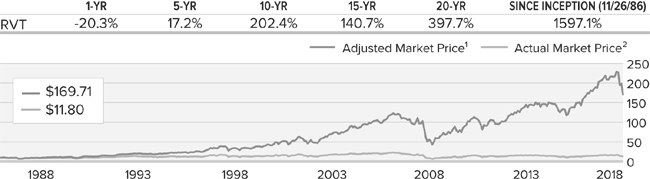
| 1 | Reflects the cumulative performance of an investment made by a stockholder who purchased one share at inception ($10.00 IPO), reinvested all distributions and fully participated in primary subscriptions of the Fund’s rights offerings. |
| 2 | Reflects the actual month-end market price movement of one share as it has traded on the NYSE. |
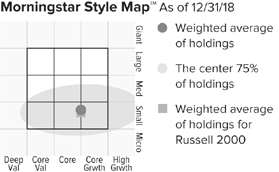
The Morningstar Style Map is the Morningstar Style Box™ with the center 75% of fund holdings plotted as the Morningstar Ownership Zone™. The Morningstar Style Box is designed to reveal a fund’s investment strategy. The Morningstar Ownership Zone provides detail about a portfolio’s investment style by showing the range of stock sizes and styles. The Ownership Zone is derived by plotting each stock in the portfolio within the proprietary Morningstar Style Box. Over time, the shape and location of a fund’s ownership zone may vary. |
|
| Top 10 Positions | | |
| % of Net Assets | | |
| | | |
| HEICO Corporation | | 2.3 |
| |
| FLIR Systems | | 2.1 |
| |
| Quaker Chemical | | 1.8 |
| |
| Minerals Technologies | | 1.4 |
| |
| ProAssurance Corporation | | 1.2 |
| |
| RBC Bearings | | 1.1 |
| |
| Franklin Electric | | 1.1 |
| |
| Reliance Steel & Aluminum | | 1.1 |
| |
| Cognex Corporation | | 1.0 |
| |
| Kirby Corporation | | 1.0 |
| |
|
| Portfolio Sector Breakdown | | |
| % of Net Assets | | |
| | | |
| Industrials | | 29.0 |
| |
| Financials | | 18.0 |
| |
| Information Technology | | 17.8 |
| |
| Materials | | 11.3 |
| |
| Consumer Discretionary | | 9.6 |
| |
| Energy | | 5.6 |
| |
| Health Care | | 5.3 |
| |
| Real Estate | | 3.9 |
| |
| Consumer Staples | | 1.9 |
| |
| Communication Services | | 1.8 |
| |
| Utilities | | 0.3 |
| |
| Outstanding Line of Credit, Net of Cash and Cash Equivalents | | -4.5 |
| |
|
| Calendar Year Total Returns (%) | | |
| | | |
| YEAR | | RVT |
| |
| 2018 | | -14.4 |
| |
| 2017 | | 19.4 |
| |
| 2016 | | 26.8 |
| |
| 2015 | | -8.1 |
| |
| 2014 | | 0.8 |
| |
| 2013 | | 34.1 |
| |
| 2012 | | 15.4 |
| |
| 2011 | | -10.1 |
| |
| 2010 | | 30.3 |
| |
| 2009 | | 44.6 |
| |
| 2008 | | -45.6 |
| |
| 2007 | | 5.0 |
| |
| 2006 | | 19.5 |
| |
| 2005 | | 8.4 |
| |
| 2004 | | 21.4 |
| |
|
| Portfolio Diagnostics | | |
| | | |
| Fund Net Assets | | $1,304 million |
| |
| Number of Holdings | | 315 |
| |
| Turnover Rate | | 28% |
| |
| Net Asset Value | | $13.73 |
| |
| Market Price | | $11.80 |
| |
| Net Leverage1 | | 4.5% |
| |
| Average Market Capitalization2 | | $1,693 million |
| |
| Weighted Average P/E Ratio3,4 | | 15.3x |
| |
| Weighted Average P/B Ratio3 | | 1.9x |
| |
| Active Share5 | | 90% |
| |
| U.S. Investments (% of Net Assets) | | 89.2% |
| |
| Non-U.S. Investments (% of Net Assets) | | 15.3% |
| |
| 1 | Net leverage is the percentage, in excess of 100%, of the total value of equity type investments, divided by net assets. |
| 2 | Geometric Average. This weighted calculation uses each portfolio holding’s market cap in a way designed to not skew the effect of very large or small holdings; instead, it aims to better identify the portfolio’s center, which Royce believes offers a more accurate measure of average market cap than a simple mean or median. |
| 3 | Harmonic Average. This weighted calculation evaluates a portfolio as if it were a single stock and measures it overall. It compares the total market value of the portfolio to the portfolio’s share in the earnings or book value, as the case may be, of its underlying stocks. |
| 4 | The Fund’s P/E ratio calculation excludes companies with zero or negative earnings (14% of portfolio holdings as of 12/31/18). |
| 5 | Active Share is the sum of the absolute values of the different weightings of each holding in the Fund versus each holding in the benchmark, divided by two. |
| Important Performance and Risk Information
All performance information reflects past performance, is presented on a total return basis, net of the Fund’s investment advisory fee, and reflects the reinvestment of distributions. Past performance is no guarantee of future results. Current performance may be higher or lower than performance quoted. Returns as of the most recent month-end may be obtained at www.roycefunds.com. Certain immaterial adjustments were made to the net assets of Royce Value Trust at 12/31/16 and 6/30/18 for financial reporting purposes, and as a result the net asset value originally calculated on that date and the total return based on that net asset value differs from the adjusted net asset value and total return reported in the Financial Highlights. The market price of the Fund’s shares will fluctuate, so that shares may be worth more or less than their original cost when sold. The Fund invests primarily in securities of small- and micro-cap companies, which may involve considerably more risk than investing in larger-cap companies. The Fund’s broadly diversified portfolio does not ensure a profit or guarantee against loss. Regarding the “Top Contributors” and “Top Detractors” tables shown above, the sum of all contributors to, and all detractors from, performance for all securities in the portfolio would approximate the Fund’s year-to date performance for 2018.
|
| 2018 Annual Report to Stockholders | 43 |
Royce Value Trust
| |
| Schedule of Investments | | | | | | | |
| Common Stocks – 104.4% | | | | | | | |
| | | SHARES | | | VALUE | |
| |
| |
| COMMUNICATION SERVICES – 1.8% | | | | | | | |
| ENTERTAINMENT - 0.1% | | | | | | | |
Global Eagle Entertainment 1 | | 110,000 | | | $ | 245,300 | |
Rosetta Stone 1,2 | | 40,000 | | | | 656,000 | |
| | | | | | | |
| | | | | | | 901,300 | |
| | | | | | | |
| INTERACTIVE MEDIA & SERVICES - 0.4% | | | | | | | |
QuinStreet 1,2,3 | | 180,254 | | | | 2,925,522 | |
TripAdvisor 1,2,3 | | 50,000 | | | | 2,697,000 | |
| | | | | | | |
| | | | | | | 5,622,522 | |
| | | | | | | |
| MEDIA - 1.2% | | | | | | | |
†Cable One | | 3,885 | | | | 3,186,089 | |
comScore 1,2,3 | | 440,836 | | | | 6,361,263 | |
Gray Television 1,2 | | 50,000 | | | | 737,000 | |
Liberty Latin America Cl. C 1,2 | | 246,300 | | | | 3,588,591 | |
Meredith Corporation 2 | | 29,900 | | | | 1,553,006 | |
Pico Far East Holdings | | 2,612,400 | | | | 944,141 | |
| | | | | | | |
| | | | | | | 16,370,090 | |
| | | | | | | |
| WIRELESS TELECOMMUNICATION SERVICES - 0.1% | | | | | | | |
Boingo Wireless 1,2 | | 50,000 | | | | 1,028,500 | |
| | |
| Total (Cost $26,324,237) | | | | | | 23,922,412 | |
| | |
| | | | | | | | |
| CONSUMER DISCRETIONARY – 9.6% | | | | | | | |
| AUTO COMPONENTS - 1.5% | | | | | | | |
Dorman Products 1,2,3 | | 103,000 | | | | 9,272,060 | |
Gentex Corporation 2 | | 62,500 | | | | 1,263,125 | |
LCI Industries 2,3 | | 127,416 | | | | 8,511,389 | |
Standard Motor Products 2 | | 13,391 | | | | 648,526 | |
| | | | | | | |
| | | | | | | 19,695,100 | |
| | | | | | | |
| AUTOMOBILES - 0.4% | | | | | | | |
Thor Industries 2 | | 100,430 | | | | 5,222,360 | |
| | | | | | | |
| DISTRIBUTORS - 0.9% | | | | | | | |
Core-Mark Holding Company 2 | | 220,900 | | | | 5,135,925 | |
LKQ Corporation 1,2 | | 171,200 | | | | 4,062,576 | |
Weyco Group 2,3 | | 97,992 | | | | 2,858,426 | |
| | | | | | | |
| | | | | | | 12,056,927 | |
| | | | | | | |
| DIVERSIFIED CONSUMER SERVICES - 0.4% | | | | | | | |
Collectors Universe | | 71,100 | | | | 807,696 | |
Houghton Mifflin Harcourt 1 | | 100,000 | | | | 886,000 | |
Liberty Tax Cl. A 4 | | 151,573 | | | | 1,773,404 | |
Universal Technical Institute 1 | | 504,032 | | | | 1,839,717 | |
| | | | | | | |
| | | | | | | 5,306,817 | |
| | | | | | | |
| HOTELS, RESTAURANTS & LEISURE - 0.2% | | | | | | | |
Lindblad Expeditions Holdings 1,2,3 | | 207,600 | | | | 2,794,296 | |
| | | | | | | |
| HOUSEHOLD DURABLES - 0.8% | | | | | | | |
Cavco Industries 1,2 | | 14,700 | | | | 1,916,586 | |
Ethan Allen Interiors 2 | | 200,000 | | | | 3,518,000 | |
HG Holdings 1,4,5 | | 912,235 | | | | 392,261 | |
Natuzzi ADR 1 | | 2,096,300 | | | | 1,656,077 | |
†Purple Innovation 1 | | 275,000 | | | | 1,619,750 | |
Skyline Champion | | 70,400 | | | | 1,034,176 | |
| | | | | | | |
| | | | | | | 10,136,850 | |
| | | | | | | |
| INTERNET & DIRECT MARKETING RETAIL - 0.9% | | | | | | | |
†Etsy 1,2,3 | | 57,600 | | | | 2,740,032 | |
FTD Companies 1 | | 298,014 | | | | 441,061 | |
Stamps.com 1 | | 35,700 | | | | 5,556,348 | |
†Waitr Holdings Cl. A 1 | | 94,850 | | | | 1,057,577 | |
†zooplus 1 | | 9,200 | | | | 1,253,313 | |
| | | | | | | |
| | | | | | | 11,048,331 | |
| | | | | | | |
| LEISURE PRODUCTS - 0.5% | | | | | | | |
Nautilus 1,2,3 | | 574,500 | | | | 6,262,050 | |
| | | | | | | |
| | | | | | | | |
| SPECIALTY RETAIL - 2.9% | | | | | | | |
America’s Car-Mart 1,2 | | 120,000 | | | | 8,694,000 | |
AutoCanada | | 993,000 | | | | 8,255,604 | |
Barnes & Noble | | 67,000 | | | | 475,030 | |
Camping World Holdings Cl. A 2,3 | | 618,613 | | | | 7,095,491 | |
Container Store Group (The) 1 | | 158,200 | | | | 754,614 | |
Destination Maternity 1 | | 557,967 | | | | 1,584,626 | |
Monro 2 | | 146,000 | | | | 10,037,500 | |
Signet Jewelers 2 | | 35,000 | | | | 1,111,950 | |
TravelCenters of America LLC 1 | | 62,500 | | | | 235,000 | |
| | | | | | | |
| | | | | | | 38,243,815 | |
| | | | | | | |
| TEXTILES, APPAREL & LUXURY GOODS - 1.1% | | | | | | | |
Culp 2 | | 29,400 | | | | 555,660 | |
J.G. Boswell Company 4 | | 3,940 | | | | 2,167,000 | |
Wolverine World Wide 2 | | 358,900 | | | | 11,445,321 | |
| | | | | | | |
| | | | | | | 14,167,981 | |
| | |
| Total (Cost $145,341,423) | | | | | | 124,934,527 | |
| | |
| | | | | | | | |
| CONSUMER STAPLES – 1.9% | | | | | | | |
| BEVERAGES - 0.1% | | | | | | | |
Compania Cervecerias Unidas ADR 2 | | 64,500 | | | | 1,620,885 | |
| | | | | | | |
| FOOD PRODUCTS - 1.4% | | | | | | | |
Cal-Maine Foods 2,3 | | 44,016 | | | | 1,861,877 | |
Farmer Bros. 1,2 | | 54,700 | | | | 1,276,151 | |
Nomad Foods 1,2 | | 125,000 | | | | 2,090,000 | |
Seneca Foods Cl. A 1,2,3 | | 226,560 | | | | 6,393,523 | |
Seneca Foods Cl. B 1 | | 13,840 | | | | 390,426 | |
SunOpta 1 | | 50,000 | | | | 193,500 | |
Tootsie Roll Industries 2,3 | | 165,529 | | | | 5,528,669 | |
| | | | | | | |
| | | | | | | 17,734,146 | |
| | | | | | | |
| PERSONAL PRODUCTS - 0.4% | | | | | | | |
Inter Parfums 2 | | 80,993 | | | | 5,310,711 | |
| | |
| Total (Cost $18,769,417) | | | | | | 24,665,742 | |
| | |
| | | | | | | | |
| ENERGY – 5.6% | | | | | | | |
| ENERGY EQUIPMENT & SERVICES - 4.5% | | | | | | | |
CARBO Ceramics 1 | | 78,000 | | | | 271,440 | |
Computer Modelling Group | | 1,220,650 | | | | 5,445,179 | |
Diamond Offshore Drilling 1,2,3 | | 214,000 | | | | 2,020,160 | |
Era Group 1 | | 660,693 | | | | 5,774,457 | |
Forum Energy Technologies 1 | | 249,431 | | | | 1,030,150 | |
Frank’s International 1 | | 108,600 | | | | 566,892 | |
Helmerich & Payne 2 | | 94,000 | | | | 4,506,360 | |
ION Geophysical 1 | | 71,880 | | | | 372,338 | |
Oil States International 1,2,3 | | 211,365 | | | | 3,018,292 | |
Pason Systems | | 607,080 | | | | 8,133,236 | |
Precision Drilling 1 | | 93,900 | | | | 163,386 | |
SEACOR Holdings 1,2,3 | | 261,469 | | | | 9,674,353 | |
SEACOR Marine Holdings 1,2 | | 638,834 | | | | 7,512,688 | |
TGS-NOPEC Geophysical | | 358,670 | | | | 8,661,342 | |
Trican Well Service 1 | | 897,300 | | | | 782,147 | |
Unit Corporation 1 | | 15,000 | | | | 214,200 | |
| | | | | | | |
| | | | | | | 58,146,620 | |
| | | | | | | |
| OIL, GAS & CONSUMABLE FUELS - 1.1% | | | | | | | |
Dorchester Minerals L.P. 2 | | 279,148 | | | | 4,086,727 | |
Dorian LPG 1 | | 394,936 | | | | 2,302,477 | |
GeoPark 1 | | 53,200 | | | | 735,224 | |
†International Petroleum 1 | | 100,000 | | | | 329,461 | |
Pryce Corporation | | 2,523,300 | | | | 278,314 | |
| 44 | 2018 Annual Report to Stockholders | | THE ACCOMPANYING NOTES ARE AN INTEGRAL PART OF THESE FINANCIAL STATEMENTS |
| |
| Schedule of Investments (continued) | | | | | | | |
| | | SHARES | | | VALUE | |
| |
| |
| ENERGY (continued) | | | | | | | |
| OIL, GAS & CONSUMABLE FUELS (continued) | | | | | | | |
San Juan Basin Royalty Trust | | 212,272 | | | $ | 1,018,906 | |
World Fuel Services 2 | | 224,227 | | | | 4,800,700 | |
WPX Energy 1,2 | | 110,000 | | | | 1,248,500 | |
| | | | | | | | |
| | | | | | | 14,800,309 | |
| | |
| Total (Cost $101,200,211) | | | | | | 72,946,929 | |
| | |
| | | | | | | | |
| FINANCIALS – 18.0% | | | | | | | |
| BANKS - 2.9% | | | | | | | |
Bank of N.T. Butterfield & Son 2 | | 228,416 | | | | 7,160,842 | |
Canadian Western Bank | | 279,500 | | | | 5,331,219 | |
Farmers & Merchants Bank of Long Beach 4 | | 1,080 | | | | 8,100,000 | |
Fauquier Bankshares 2 | | 160,800 | | | | 2,936,208 | |
First Citizens BancShares Cl. A | | 14,676 | | | | 5,533,586 | |
†Metro Bank 1 | | 20,000 | | | | 431,579 | |
Webster Financial 2,3 | | 161,900 | | | | 7,980,051 | |
| | | | | | | |
| | | | | | | 37,473,485 | |
| | | | | | | |
| CAPITAL MARKETS - 8.8% | | | | | | | |
Ares Management 2 | | 611,100 | | | | 10,865,358 | |
Artisan Partners Asset Management Cl. A 2 | | 272,700 | | | | 6,029,397 | |
ASA Gold and Precious Metals | | 199,821 | | | | 1,890,307 | |
Ashmore Group | | 1,354,000 | | | | 6,309,554 | |
Associated Capital Group Cl. A 2 | | 20,200 | | | | 711,646 | |
†Bolsa Mexicana de Valores | | 1,723,106 | | | | 2,937,349 | |
Cowen 1 | | 62,706 | | | | 836,498 | |
Dundee Corporation Cl. A 1 | | 1,079,900 | | | | 1,012,505 | |
Edmond de Rothschild (Suisse) | | 153 | | | | 2,334,927 | |
†Focus Financial Partners Cl. A 1,2 | | 50,000 | | | | 1,316,500 | |
GMP Capital | | 287,100 | | | | 395,362 | |
Hamilton Lane Cl. A 2 | | 13,800 | | | | 510,600 | |
Houlihan Lokey Cl. A 2,3 | | 50,300 | | | | 1,851,040 | |
Jupiter Fund Management | | 230,000 | | | | 865,402 | |
Lazard Cl. A 2 | | 162,535 | | | | 5,999,167 | |
Manning & Napier Cl. A | | 395,692 | | | | 696,418 | |
MarketAxess Holdings | | 51,600 | | | | 10,903,596 | |
Morningstar 2 | | 84,600 | | | | 9,292,464 | |
MVC Capital | | 195,688 | | | | 1,606,599 | |
Oaktree Capital Group LLC Cl. A 2,3 | | 326,300 | | | | 12,970,425 | |
Qalaa Holdings 1 | | 7,749,921 | | | | 1,531,810 | |
Rothschild & Co | | 88,293 | | | | 3,120,838 | |
SEI Investments 2 | | 148,500 | | | | 6,860,700 | |
Sprott | | 2,564,800 | | | | 4,828,257 | |
TMX Group | | 40,700 | | | | 2,108,637 | |
U.S. Global Investors Cl. A | | 520,551 | | | | 572,606 | |
Value Partners Group | | 5,453,000 | | | | 3,781,341 | |
Virtu Financial Cl. A 2,3 | | 455,500 | | | | 11,733,680 | |
Westwood Holdings Group 2 | | 38,850 | | | | 1,320,900 | |
| | | | | | | |
| | | | | | | 115,193,883 | |
| | | | | | | |
| DIVERSIFIED FINANCIAL SERVICES - 0.1% | | | | | | | |
First Pacific | | 1,020,000 | | | | 393,385 | |
Waterloo Investment Holdings 1,6 | | 2,972,000 | | | | 891,600 | |
| | | | | | | |
| | | | | | | 1,284,985 | |
| | | | | | | |
| INSURANCE - 4.2% | | | | | | | |
E-L Financial | | 22,500 | | | | 12,130,091 | |
Erie Indemnity Cl. A | | 25,000 | | | | 3,332,750 | |
Independence Holding Company 2 | | 259,223 | | | | 9,124,649 | |
MBIA 1 | | 942,400 | | | | 8,406,208 | |
ProAssurance Corporation 2 | | 398,657 | | | | 16,169,528 | |
RLI Corp. 2,3 | | 45,500 | | | | 3,139,045 | |
Trupanion 1,2 | | 106,500 | | | | 2,711,490 | |
| | | | | | | |
| | | | | | | 55,013,761 | |
| | | | | | | |
| INVESTMENT COMPANIES - 0.7% | | | | | | | |
RIT Capital Partners | | 41,000 | | | | 998,139 | |
†Social Capital Hedosophia Holdings Cl. A 1 | | 819,918 | | | | 8,199,180 | |
| | | | | | | |
| | | | | | | 9,197,319 | |
| | | | | | | |
| THRIFTS & MORTGAGE FINANCE - 1.3% | | | | | | | |
Axos Financial 1,2 | | 176,280 | | | | 4,438,730 | |
Genworth MI Canada | | 206,895 | | | | 6,092,279 | |
Timberland Bancorp 2,3 | | 288,857 | | | | 6,441,511 | |
Vestin Realty Mortgage II 1,4 | | 34 | | | | 34,000 | |
| | | | | | | |
| | | | | | | 17,006,520 | |
| | |
| Total (Cost $221,704,330) | | | | | | 235,169,953 | |
| | |
| | | | | | | | |
| HEALTH CARE – 5.3% | | | | | | | |
| BIOTECHNOLOGY - 0.5% | | | | | | | |
AMAG Pharmaceuticals 1,2 | | 61,300 | | | | 931,147 | |
Sangamo Therapeutics 1 | | 65,815 | | | | 755,556 | |
Zealand Pharma 1 | | 408,857 | | | | 5,169,925 | |
| | | | | | | |
| | | | | | | 6,856,628 | |
| | | | | | | |
| HEALTH CARE EQUIPMENT & SUPPLIES - 2.4% | | | | | | | |
Atrion Corporation | | 15,750 | | | | 11,672,010 | |
DENTSPLY SIRONA | | 5,000 | | | | 186,050 | |
Hill-Rom Holdings | | 5,000 | | | | 442,750 | |
Integer Holdings 1,2,3 | | 42,400 | | | | 3,233,424 | |
Masimo Corporation 1,2 | | 50,000 | | | | 5,368,500 | |
†Merit Medical Systems 1,2,3 | | 33,000 | | | | 1,841,730 | |
Neogen Corporation 1,2 | | 22,400 | | | | 1,276,800 | |
Surmodics 1,2 | | 138,500 | | | | 6,545,510 | |
| | | | | | | |
| | | | | | | 30,566,774 | |
| | | | | | | |
| HEALTH CARE PROVIDERS & SERVICES - 0.2% | | | | | | | |
Community Health Systems 1 | | 790,000 | | | | 2,227,800 | |
| | | | | | | |
| HEALTH CARE TECHNOLOGY - 1.3% | | | | | | | |
athenahealth 1 | | 32,500 | | | | 4,287,725 | |
Medidata Solutions 1,2,3 | | 186,750 | | | | 12,590,685 | |
| | | | | | | |
| | | | | | | 16,878,410 | |
| | | | | | | |
| LIFE SCIENCES TOOLS & SERVICES - 0.8% | | | | | | | |
Bio-Rad Laboratories Cl. A 1 | | 34,198 | | | | 7,941,460 | |
Bio-Techne 2 | | 21,143 | | | | 3,059,815 | |
| | | | | | | |
| | | | | | | 11,001,275 | |
| | | | | | | |
| PHARMACEUTICALS - 0.1% | | | | | | | |
†Alimera Sciences 1 | | 319,186 | | | | 229,207 | |
†TherapeuticsMD 1 | | 50,000 | | | | 190,500 | |
Theravance Biopharma 1,2 | | 34,291 | | | | 877,507 | |
| | | | | | | |
| | | | | | | 1,297,214 | |
| | |
| Total (Cost $50,132,978) | | | | | | 68,828,101 | |
| | |
| | | | | | | | |
| INDUSTRIALS – 28.9% | | | | | | | |
| AEROSPACE & DEFENSE - 3.6% | | | | | | | |
Ducommun 1,2 | | 117,200 | | | | 4,256,704 | |
HEICO Corporation 2 | | 260,346 | | | | 20,171,608 | |
HEICO Corporation Cl. A 2,3 | | 157,827 | | | | 9,943,101 | |
Hexcel Corporation 2 | | 53,400 | | | | 3,061,956 | |
Magellan Aerospace | | 96,800 | | | | 1,062,162 | |
Teledyne Technologies 1 | | 5,900 | | | | 1,221,713 | |
Wesco Aircraft Holdings 1 | | 935,364 | | | | 7,389,376 | |
| | | | | | | |
| | | | | | | 47,106,620 | |
| | | | | | | |
| THE ACCOMPANYING NOTES ARE AN INTEGRAL PART OF THESE FINANCIAL STATEMENTS | | 2018 Annual Report to Stockholders | 45 |
Royce Value Trust
| |
| Schedule of Investments (continued) | | | | | | | |
| | | SHARES | | | VALUE | |
| |
| |
| INDUSTRIALS (continued) | | | | | | | |
| AIR FREIGHT & LOGISTICS - 1.5% | | | | | | | |
Expeditors International of Washington 2 | | 143,000 | | | $ | 9,736,870 | |
Forward Air 2 | | 170,750 | | | | 9,365,637 | |
| | | | | | | |
| | | | | | | 19,102,507 | |
| | | | | | | |
| BUILDING PRODUCTS - 0.4% | | | | | | | |
Burnham Holdings Cl. B 4 | | 36,000 | | | | 500,400 | |
Patrick Industries 1,2 | | 15,775 | | | | 467,098 | |
Simpson Manufacturing 2 | | 66,700 | | | | 3,610,471 | |
| | | | | | | |
| | | | | | | 4,577,969 | |
| | | | | | | |
| COMMERCIAL SERVICES & SUPPLIES - 1.8% | | | | | | | |
Atento 1 | | 188,700 | | | | 756,687 | |
CECO Environmental 1 | | 99,028 | | | | 668,439 | |
CompX International Cl. A 2,3 | | 211,100 | | | | 2,873,071 | |
Heritage-Crystal Clean 1,2 | | 100,106 | | | | 2,303,439 | |
Kimball International Cl. B 2 | | 286,180 | | | | 4,060,894 | |
Mobile Mini 2 | | 105,000 | | | | 3,333,750 | |
PICO Holdings 1 | | 409,400 | | | | 3,741,916 | |
Ritchie Bros. Auctioneers 2 | | 54,900 | | | | 1,796,328 | |
Steelcase Cl. A 2 | | 40,000 | | | | 593,200 | |
UniFirst Corporation | | 26,270 | | | | 3,758,449 | |
| | | | | | | |
| | | | | | | 23,886,173 | |
| | | | | | | |
| CONSTRUCTION & ENGINEERING - 3.4% | | | | | | | |
†Arcosa 1,2 | | 50,000 | | | | 1,384,500 | |
EMCOR Group 2 | | 65,800 | | | | 3,927,602 | |
IES Holdings 1,2,3 | | 594,244 | | | | 9,240,494 | |
†Infrastructure and Energy Alternatives 1 | | 600,000 | | | | 4,914,000 | |
Jacobs Engineering Group 2 | | 169,900 | | | | 9,932,354 | |
KBR 2 | | 337,400 | | | | 5,121,732 | |
Sterling Construction 1 | | 122,300 | | | | 1,331,847 | |
Valmont Industries 2 | | 62,745 | | | | 6,961,558 | |
Williams Industrial Services Group 1,4 | | 631,820 | | | | 1,453,186 | |
| | | | | | | |
| | | | | | | 44,267,273 | |
| | | | | | | |
| ELECTRICAL EQUIPMENT - 0.8% | | | | | | | |
AZZ | | 5,000 | | | | 201,800 | |
LSI Industries | | 814,857 | | | | 2,583,097 | |
†nVent Electric 2 | | 25,000 | | | | 561,500 | |
Powell Industries 2 | | 94,500 | | | | 2,363,445 | |
Preformed Line Products 2 | | 91,600 | | | | 4,969,300 | |
| | | | | | | |
| | | | | | | 10,679,142 | |
| | | | | | | |
| INDUSTRIAL CONGLOMERATES - 0.7% | | | | | | | |
Raven Industries 2 | | 251,725 | | | | 9,109,928 | |
| | | | | | | |
| MACHINERY - 10.5% | | | | | | | |
CIRCOR International 1,2 | | 433,309 | | | | 9,229,482 | |
Colfax Corporation 1,2,3 | | 232,242 | | | | 4,853,858 | |
Franklin Electric 2 | | 322,800 | | | | 13,841,664 | |
Graco 2 | | 241,028 | | | | 10,087,022 | |
Hyster-Yale Materials Handling Cl. A 2 | | 10,000 | | | | 619,600 | |
John Bean Technologies 2 | | 113,226 | | | | 8,130,759 | |
Kadant 2 | | 114,159 | | | | 9,299,392 | |
Kennametal 2,3 | | 160,100 | | | | 5,328,128 | |
Lincoln Electric Holdings 2 | | 136,160 | | | | 10,736,216 | |
Lindsay Corporation 2,3 | | 110,000 | | | | 10,587,500 | |
NN | | 308,700 | | | | 2,071,377 | |
Nordson Corporation 2 | | 24,296 | | | | 2,899,727 | |
Proto Labs 1 | | 10,000 | | | | 1,127,900 | |
RBC Bearings 1 | | 109,600 | | | | 14,368,560 | |
Sun Hydraulics 2 | | 314,418 | | | | 10,435,533 | |
Tennant Company 2,3 | | 111,900 | | | | 5,831,109 | |
Titan International | | 173,100 | | | | 806,646 | |
Watts Water Technologies Cl. A 2 | | 61,000 | | | | 3,936,330 | |
Westinghouse Air Brake Technologies 2 | | 73,100 | | | | 5,135,275 | |
Woodward 2 | | 104,600 | | | | 7,770,734 | |
| | | | | | | |
| | | | | | | 137,096,812 | |
| | | | | | | |
| MARINE - 2.0% | | | | | | | |
Clarkson | | 471,100 | | | | 11,408,815 | |
Eagle Bulk Shipping 1 | | 320,478 | | | | 1,477,404 | |
Kirby Corporation 1,2,3 | | 199,400 | | | | 13,431,584 | |
| | | | | | | |
| | | | | | | 26,317,803 | |
| | | | | | | |
| PROFESSIONAL SERVICES - 1.0% | | | | | | | |
Exponent 2,3 | | 100,000 | | | | 5,071,000 | |
ManpowerGroup 2 | | 107,200 | | | | 6,946,560 | |
Quess Corporation 1 | | 15,720 | | | | 148,171 | |
TrueBlue 1,2 | | 56,245 | | | | 1,251,451 | |
| | | | | | | |
| | | | | | | 13,417,182 | |
| | | | | | | |
| ROAD & RAIL - 1.7% | | | | | | | |
Genesee & Wyoming Cl. A 1,2 | | 15,000 | | | | 1,110,300 | |
Knight-Swift Transportation Holdings Cl. A 2 | | 122,400 | | | | 3,068,568 | |
Landstar System 2,3 | | 120,060 | | | | 11,486,140 | |
Patriot Transportation Holding 1,2,3 | | 139,100 | | | | 2,711,059 | |
Saia 1,2,3 | | 40,000 | | | | 2,232,800 | |
Universal Logistics Holdings 2,3 | | 78,916 | | | | 1,427,590 | |
| | | | | | | |
| | | | | | | 22,036,457 | |
| | | | | | | |
| TRADING COMPANIES & DISTRIBUTORS - 1.5% | | | | | | | |
Air Lease Cl. A 2 | | 364,700 | | | | 11,017,587 | |
Houston Wire & Cable 1,5 | | 877,363 | | | | 4,439,457 | |
†SiteOne Landscape Supply 1,2,3 | | 25,000 | | | | 1,381,750 | |
Watsco 2 | | 17,700 | | | | 2,462,778 | |
| | | | | | | |
| | | | | | | 19,301,572 | |
| | |
| Total (Cost $304,165,139) | | | | | | 376,899,438 | |
| | |
| | | | | | | | |
| INFORMATION TECHNOLOGY – 17.8% | | | | | | | |
| COMMUNICATIONS EQUIPMENT - 0.2% | | | | | | | |
ADTRAN 2 | | 214,973 | | | | 2,308,810 | |
| | | | | | | |
| ELECTRONIC EQUIPMENT, INSTRUMENTS & COMPONENTS - 9.3% | | | | | | | |
Anixter International 1,2 | | 63,795 | | | | 3,464,706 | |
Cognex Corporation 2 | | 350,600 | | | | 13,557,702 | |
Coherent 1 | | 85,800 | | | | 9,069,918 | |
Fabrinet 1,2 | | 163,100 | | | | 8,368,661 | |
FARO Technologies 1,2 | | 179,437 | | | | 7,292,320 | |
FLIR Systems 2 | | 636,637 | | | | 27,719,175 | |
Horiba | | 12,000 | | | | 491,583 | |
IPG Photonics 1 | | 51,100 | | | | 5,789,119 | |
Littelfuse | | 30,800 | | | | 5,281,584 | |
National Instruments 2 | | 261,850 | | | | 11,882,753 | |
†nLIGHT 1,2,3 | | 282,200 | | | | 5,017,516 | |
Perceptron 1 | | 357,700 | | | | 2,883,062 | |
Plexus Corporation 1,2 | | 150,600 | | | | 7,692,648 | |
Richardson Electronics | | 573,732 | | | | 4,985,731 | |
Rogers Corporation 1,2 | | 32,366 | | | | 3,206,176 | |
TTM Technologies 1,2,3 | | 496,400 | | | | 4,829,972 | |
| | | | | | | |
| | | | | | | 121,532,626 | |
| | | | | | | |
| IT SERVICES - 0.7% | | | | | | | |
Conduent 1 | | 20,000 | | | | 212,600 | |
Hackett Group (The) 2 | | 417,266 | | | | 6,680,429 | |
Innodata 1 | | 8,498 | | | | 12,747 | |
Unisys Corporation 1,2,3 | | 160,000 | | | | 1,860,800 | |
| | | | | | | |
| | | | | | | 8,766,576 | |
| | | | | | | |
| 46 | 2018 Annual Report to Stockholders | | THE ACCOMPANYING NOTES ARE AN INTEGRAL PART OF THESE FINANCIAL STATEMENTS |
| |
| Schedule of Investments (continued) | | | | | | | |
| | | SHARES | | | VALUE | |
| |
| |
| INFORMATION TECHNOLOGY (continued) | | | | | | | |
| SEMICONDUCTORS & SEMICONDUCTOR EQUIPMENT - 5.2% | | | | | | | |
Advanced Energy Industries 1,2 | | 63,100 | | | $ | 2,708,883 | |
Brooks Automation 2 | | 440,700 | | | | 11,537,526 | |
Cabot Microelectronics 2 | | 46,800 | | | | 4,462,380 | |
Cirrus Logic 1,2,3 | | 125,000 | | | | 4,147,500 | |
Cohu 2 | | 63,750 | | | | 1,024,462 | |
Diodes 1,2,3 | | 270,850 | | | | 8,737,621 | |
Entegris 2,3 | | 258,300 | | | | 7,205,279 | |
Kulicke & Soffa Industries 2 | | 66,200 | | | | 1,341,874 | |
MKS Instruments 2 | | 188,439 | | | | 12,175,044 | |
Nova Measuring Instruments 1,2 | | 39,500 | | | | 899,810 | |
Photronics 1 | | 183,700 | | | | 1,778,216 | |
Rudolph Technologies 1,2,3 | | 39,600 | | | | 810,612 | |
Silicon Motion Technology ADR 2 | | 25,000 | | | | 862,500 | |
Teradyne 2,3 | | 130,000 | | | | 4,079,400 | |
Veeco Instruments 1 | | 17,500 | | | | 129,675 | |
Versum Materials 2 | | 197,100 | | | | 5,463,612 | |
Xperi 2 | | 60,000 | | | | 1,103,400 | |
| | | | | | | |
| | | | | | | 68,467,794 | |
| | | | | | | |
| SOFTWARE - 2.2% | | | | | | | |
†Alarm.com Holdings 1,2 | | 10,000 | | | | 518,700 | |
†Altair Engineering Cl. A 1 | | 5,000 | | | | 137,900 | |
ANSYS 1 | | 54,100 | | | | 7,733,054 | |
†Descartes Systems Group (The) 1,2 | | 58,300 | | | | 1,542,618 | |
j2 Global 2,3 | | 58,520 | | | | 4,060,118 | |
Manhattan Associates 1,2,3 | | 125,000 | | | | 5,296,250 | |
Monotype Imaging Holdings 2 | | 117,700 | | | | 1,826,704 | |
RealNetworks 1 | | 109,950 | | | | 253,984 | |
Solium Capital 1 | | 187,400 | | | | 1,618,405 | |
Support.com 1 | | 216,766 | | | | 533,244 | |
TiVo | | 152,900 | | | | 1,438,789 | |
†Workiva Cl. A 1,2,3 | | 100,000 | | | | 3,589,000 | |
| | | | | | | |
| | | | | | | 28,548,766 | |
| | | | | | | |
| TECHNOLOGY HARDWARE, STORAGE & PERIPHERALS - 0.2% | | | | | | | |
| Cray 1,2,3 | | 126,000 | | | | 2,720,340 | |
| | |
| Total (Cost $187,767,783) | | | | | | 232,344,912 | |
| | |
| | | | | | | | |
| MATERIALS – 11.3% | | | | | | | |
| CHEMICALS - 5.6% | | | | | | | |
Chase Corporation 2 | | 116,059 | | | | 11,611,703 | |
Hawkins 2,3 | | 86,178 | | | | 3,528,989 | |
†Ingevity Corporation 1,2 | | 23,900 | | | | 2,000,191 | |
Innospec 2,3 | | 84,083 | | | | 5,192,966 | |
Minerals Technologies 2 | | 350,132 | | | | 17,975,777 | |
NewMarket Corporation | | 8,600 | | | | 3,543,974 | |
Platform Specialty Products 1,2 | | 530,000 | | | | 5,474,900 | |
Quaker Chemical | | 132,669 | | | | 23,576,608 | |
| | | | | | | |
| | | | | | | 72,905,108 | |
| | | | | | | |
| CONSTRUCTION MATERIALS - 0.3% | | | | | | | |
†Imerys | | 90,000 | | | | 4,328,871 | |
| | | | | | | |
| CONTAINERS & PACKAGING - 0.3% | | | | | | | |
Mayr-Melnhof Karton | | 34,000 | | | | 4,285,104 | |
| | | | | | | |
| METALS & MINING - 4.4% | | | | | | | |
Agnico Eagle Mines 2 | | 15,000 | | | | 606,000 | |
Alamos Gold Cl. A | | 1,703,300 | | | | 6,125,991 | |
Ferroglobe | | 50,000 | | | | 79,500 | |
Ferroglobe (Warranty Insurance Trust) 1,6 | | 49,300 | | | | 0 | |
Franco-Nevada Corporation 2,3 | | 107,300 | | | | 7,529,241 | |
Gold Fields ADR | | 370,000 | | | | 1,302,400 | |
Haynes International 2 | | 113,900 | | | | 3,006,960 | |
Hecla Mining | | 321,300 | | | | 758,268 | |
IAMGOLD Corporation 1 | | 600,000 | | | | 2,208,000 | |
Lundin Mining | | 640,000 | | | | 2,644,008 | |
MAG Silver 1 | | 198,900 | | | | 1,451,970 | |
Major Drilling Group International 1 | | 1,382,357 | | | | 4,657,810 | |
Pretium Resources 1 | | 101,000 | | | | 855,970 | |
Reliance Steel & Aluminum 2 | | 193,720 | | | | 13,787,053 | |
Royal Gold 2 | | 16,600 | | | | 1,421,790 | |
Synalloy Corporation 2,3 | | 178,800 | | | | 2,966,292 | |
Tahoe Resources 1 | | 646,000 | | | | 2,357,900 | |
VanEck Vectors Junior Gold Miners ETF | | 8,000 | | | | 241,760 | |
Worthington Industries 2 | | 148,000 | | | | 5,156,320 | |
| | | | | | | |
| | | | | | | 57,157,233 | |
| | | | | | | |
| PAPER & FOREST PRODUCTS - 0.7% | | | | | | | |
Neenah 2 | | 16,700 | | | | 983,964 | |
Stella-Jones | | 267,138 | | | | 7,750,759 | |
| | | | | | | 8,734,723 | |
| | |
| Total (Cost $137,291,568) | | | | | | 147,411,039 | |
| | |
| | | | | | | | |
| REAL ESTATE – 3.9% | | | | | | | |
| EQUITY REAL ESTATE INVESTMENT TRUSTS (REITS) - 0.0% | | | | | | | |
New York REIT 1,6 | | 15,000 | | | | 208,650 | |
| | | | | | | |
| REAL ESTATE MANAGEMENT & DEVELOPMENT - 3.9% | | | | | | | |
Altus Group | | 24,200 | | | | 419,582 | |
FirstService Corporation | | 184,600 | | | | 12,641,408 | |
FRP Holdings 1,2,3 | | 188,558 | | | | 8,675,554 | |
Kennedy-Wilson Holdings 2 | | 515,500 | | | | 9,366,635 | |
Marcus & Millichap 1,2,3 | | 232,513 | | | | 7,982,171 | |
RMR Group Cl. A 2 | | 27,200 | | | | 1,443,776 | |
St. Joe Company (The) 1,2,3 | | 197,000 | | | | 2,594,490 | |
Tejon Ranch 1,2,3 | | 478,479 | | | | 7,933,182 | |
| | | | | | | |
| | | | | | | 51,056,798 | |
| | |
| Total (Cost $41,435,097) | | | | | | 51,265,448 | |
| | |
| | | | | | | | |
| UTILITIES – 0.3% | | | | | | | |
| GAS UTILITIES - 0.3% | | | | | | | |
UGI Corporation 2 | | 69,500 | | | | 3,707,825 | |
| | |
| Total (Cost $3,013,160) | | | | | | 3,707,825 | |
| | |
| | | | | | | | |
| TOTAL COMMON STOCKS | | | | | | | |
| | |
| (Cost $1,237,145,343) | | | | | | 1,362,096,326 | |
| | |
| | | | | | | | |
| WARRANTS – 0.1% | | | | | | | |
| | | | | | | | |
| CONSUMER DISCRETIONARY – 0.0% | | | | | | | |
| HOUSEHOLD DURABLES - 0.0% | | | | | | | |
† Purple Innovation (Warrants) 1,4 | | 750,000 | | | | 105,000 | |
| | |
| Total (Cost $461,843) | | | | | | 105,000 | |
| | |
| | | | | | | | |
| INDUSTRIALS – 0.1% | | | | | | | |
| CONSTRUCTION & ENGINEERING - 0.1% | | | | | | | |
† Infrastructure and Energy Alternatives | | | | | | | |
(Warrants) 1 | | 625,000 | | | | 568,750 | |
| | |
| Total (Cost $470,283) | | | | | | 568,750 | |
| | |
| THE ACCOMPANYING NOTES ARE AN INTEGRAL PART OF THESE FINANCIAL STATEMENTS | | 2018 Annual Report to Stockholders | 47 |
| Royce Value Trust | | December 31, 2018 |
| |
| Schedule of Investments (continued) | | | | | | | |
| | | | | | | | |
| | | SHARES | | | VALUE | |
| |
| | | | | | | | |
| INFORMATION TECHNOLOGY – 0.0% | | | | | | | |
| ELECTRONIC EQUIPMENT, INSTRUMENTS & COMPONENTS - 0.0% | | | | | | | |
† eMagin Corporation (Warrants) 1,6 | | 50,000 | | | $ | 0 | |
| | |
| Total (Cost $0) | | | | | | 0 | |
| | |
| | | | | | | | |
| TOTAL WARRANTS | | | | | | | |
| | |
| (Cost $932,126) | | | | | | 673,750 | |
| | |
| | | | | | | | |
| TOTAL INVESTMENTS – 104.5% | | | | | | | |
| | |
| (Cost $1,238,077,469) | | | | | | 1,362,770,076 | |
| | |
| | | | | | | | |
| LIABILITIES LESS CASH AND OTHER ASSETS – (4.5)% | | | | | | (58,663,191 | ) |
| | | | | | | |
| | | | | | | | |
| | |
| NET ASSETS – 100.0% | | | | | $ | 1,304,106,885 | |
| | |
| | ADR – American Depository Receipt |
| | |
| † | New additions in 2018. |
| 1 | Non-income producing. |
| 2 | All or a portion of these securities were pledged as collateral in connection with the Fund’s revolving credit agreement at December 31, 2018. Total market value of pledged securities at December 31, 2018, was $139,988,955. |
| 3 | At December 31, 2018, a portion of these securities were rehypothecated in connection with the Fund’s revolving credit agreement in the aggregate amount of $40,175,871. |
| 4 | These securities are defined as Level 2 securities due to fair value being based on quoted prices for similar securities. See Notes to Financial Statements. |
| 5 | At December 31, 2018, the Fund owned 5% or more of the Company’s outstanding voting securities thereby making the Company an Affiliated Company as that term is defined in the Investment Company Act of 1940. See Notes to Financial Statements. |
| 6 | Securities for which market quotations are not readily available represent 0.1% of net assets. These securities have been valued at their fair value under procedures approved by the Fund’s Board of Directors. These securities are defined as Level 3 securities due to the use of significant unobservable inputs in the determination of fair value. See Notes to Financial Statements. |
| | |
| | Bold indicates the Fund’s 20 largest equity holdings in terms of December 31, 2018, market value. |
| | |
| | TAX INFORMATION:The cost of total investments for Federal income tax purposes was $1,238,208,056. At December 31, 2018, net unrealized appreciation for all securities was $124,562,020 consisting of aggregate gross unrealized appreciation of $323,293,119 and aggregate gross unrealized depreciation of $198,731,099. The primary causes of the difference between book and tax basis cost are the timing of the recognition of losses on securities sold, investments in publicly traded partnerships and Trusts, investments in Real Estate Investment Trusts and mark-to-market of Passive Foreign Investment Companies. |
| 48 | 2018 Annual Report to Stockholders | | THE ACCOMPANYING NOTES ARE AN INTEGRAL PART OF THESE FINANCIAL STATEMENTS |
| Royce Value Trust | | December 31, 2018 |
| |
| Statement of Assets and Liabilities |
| ASSETS: | | | | | |
| Investments at value | | | | | |
| |
Non-Affiliated Companies | | | $ | 1,357,938,358 | |
| |
Affiliated Companies | | | | 4,831,718 | |
| |
| Receivable for dividends and interest | | | | 1,312,973 | |
| |
| Prepaid expenses and other assets | | | | 683,846 | |
| |
| Total Assets | | | | 1,364,766,895 | |
| |
| LIABILITIES: | | | | | |
| Revolving credit agreement | | | | 45,000,000 | |
| |
| Payable to custodian for cash and foreign currency overdrawn | | | | 14,492,164 | |
| |
| Payable for investments purchased | | | | 325,429 | |
| |
| Payable for investment advisory fee | | | | 541,254 | |
| |
| Payable for directors’ fees | | | | 53,324 | |
| |
| Payable for interest expense | | | | 18,735 | |
| |
| Accrued expenses | | | | 229,104 | |
| |
| Total Liabilities | | | | 60,660,010 | |
| |
| Net Assets | | | $ | 1,304,106,885 | |
| |
| ANALYSIS OF NET ASSETS: | | | | | |
| Paid-in capital - $0.001 par value per share; 95,010,024 shares outstanding (150,000,000 shares authorized) | | | $ | 1,161,772,428 | |
| |
| Total distributable earnings (loss) | | | | 142,334,457 | |
| |
| Net Assets (net asset value per share - $13.73) | | | $ | 1,304,106,885 | |
| |
| Investments at identified cost | | | $ | 1,238,077,469 | |
| |
| THE ACCOMPANYING NOTES ARE AN INTEGRAL PART OF THESE FINANCIAL STATEMENTS | | 2018 Annual Report to Stockholders | 49 |
Royce Value Trust
| |
| Statement of Changes in Net Assets |
| | | | YEAR ENDED 12/31/18 | | | YEAR ENDED 12/31/17 | |
| |
| | | | | | | | | | |
| INVESTMENT OPERATIONS: | | | | | | | | | |
| Net investment income (loss) | | | $ | 16,192,591 | | | $ | 10,969,682 | |
| |
| Net realized gain (loss) on investments and foreign currency | | | | 111,658,737 | | | | 81,750,067 | |
| |
| Net change in unrealized appreciation (depreciation) on investments and foreign currency | | | | (347,149,860 | ) | | | 146,329,916 | |
| |
| Net increase (decrease) in net assets from investment operations | | | | (219,298,532 | ) | | | 239,049,665 | |
| |
| DISTRIBUTIONS: | | | | | | | | | |
| Total distributable earnings1 | | | | (112,695,474 | ) | | | | |
| |
| Net investment income | | | | | | | | (10,679,021 | ) |
| |
| Net realized gain on investments and foreign currency | | | | | | | | (85,441,777 | ) |
| |
| Total distributions | | | | (112,695,474 | ) | | | (96,120,798 | ) |
| |
| CAPITAL STOCK TRANSACTIONS: | | | | | | | | | |
| Net proceeds from rights offering | | | | 108,466,176 | | | | | |
| |
| Reinvestment of distributions | | | | 47,185,262 | | | | 41,508,874 | |
| |
| Total capital stock transactions | | | | 155,651,438 | | | | 41,508,874 | |
| |
| Net Increase (Decrease) In Net Assets | | | | (176,342,568 | ) | | | 184,437,741 | |
| |
| NET ASSETS: | | | | | | | | | |
| |
| Beginning of year | | | | 1,480,449,453 | | | | 1,296,011,712 | |
| |
| End of year (including undistributed net investment income (loss) of $(1,725,122) at 12/31/172) | | | $ | 1,304,106,885 | | | $ | 1,480,449,453 | |
| |
1 Distributions from net investment income and from realized gains are no longer required to be separately disclosed. See Notes to Financial Statements.
2 Parenthetical disclosure of undistributed net investment income is no longer required. See Notes to Financial Statements.
| 50 | 2018 Annual Report to Stockholders | | THE ACCOMPANYING NOTES ARE AN INTEGRAL PART OF THESE FINANCIAL STATEMENTS |
| Royce Value Trust | | Year Ended December 31, 2018 |
| INVESTMENT INCOME: | | | | |
| INCOME: | | | | |
| Dividends | | $ | 25,763,236 | |
| |
| Foreign withholding tax | | | (503,383 | ) |
| |
| Interest | | | 256,906 | |
| |
| Rehypothecation income | | | 232,957 | |
| |
| Total income | | | 25,749,716 | |
| |
| EXPENSES: | | | | |
| |
| Investment advisory fees | | | 6,356,364 | |
| |
| Interest expense | | | 1,678,886 | |
| |
| Administrative and office facilities | | | 439,851 | |
| |
| Stockholder reports | | | 423,025 | |
| |
| Custody and transfer agent fees | | | 215,508 | |
| |
| Directors’ fees | | | 198,038 | |
| |
| Professional fees | | | 114,083 | |
| |
| Other expenses | | | 135,996 | |
| |
| Total expenses | | | 9,561,751 | |
| |
| Compensating balance credits | | | (4,626 | ) |
| |
| Net expenses | | | 9,557,125 | |
| |
| Net investment income (loss) | | | 16,192,591 | |
| |
| REALIZED AND UNREALIZED GAIN (LOSS) ON INVESTMENTS AND FOREIGN CURRENCY: | | | | |
| | | | | |
| NET REALIZED GAIN (LOSS): | | | | |
| |
| Investments | | | 111,651,979 | |
| |
| Foreign currency transactions | | | 6,758 | |
| |
| NET CHANGE IN UNREALIZED APPRECIATION (DEPRECIATION): | | | | |
| |
| Investments in Non-Affiliated Companies | | | (344,862,243 | ) |
| |
| Investments in Affiliated Companies | | | (2,278,941 | ) |
| |
| Other assets and liabilities denominated in foreign currency | | | (8,676 | ) |
| |
| Net realized and unrealized gain (loss) on investments and foreign currency | | | (235,491,123 | ) |
| |
| NET INCREASE (DECREASE) IN NET ASSETS FROM INVESTMENT OPERATIONS | | $ | (219,298,532 | ) |
| |
| THE ACCOMPANYING NOTES ARE AN INTEGRAL PART OF THESE FINANCIAL STATEMENTS | | 2018 Annual Report to Stockholders | 51 |
| Royce Value Trust | | Year Ended December 31, 2018 |
| CASH FLOWS FROM OPERATING ACTIVITIES: | | | | |
| Net increase (decrease) in net assets from investment operations | | $ | (219,298,532 | ) |
| |
| Adjustments to reconcile net increase (decrease) in net assets from investment operations to net cash used for operating activities: | | | | |
| |
Purchases of long-term investments | | | (565,452,939 | ) |
| |
Proceeds from sales and maturities of long-term investments | | | 468,285,661 | |
| |
Net purchases, sales and maturities of short-term investments | | | 48,667,000 | |
| |
Net (increase) decrease in dividends and interest receivable and other assets | | | (230,537 | ) |
| |
Net increase (decrease) in interest expense payable, accrued expenses and other liabilities | | | 18,118 | |
| |
Net change in unrealized appreciation (depreciation) on investments | | | 347,141,184 | |
| |
Net realized gain (loss) on investments | | | (111,651,979 | ) |
| |
| Net cash used for operating activities | | | (32,522,024 | ) |
| |
| CASH FLOWS FROM FINANCING ACTIVITIES: | | | | |
| Decrease in revolving credit agreement | | | (25,000,000 | ) |
| |
| Distributions | | | (112,695,474 | ) |
| |
| Increase in payable to custodian for cash and foreign currency overdrawn | | | 14,492,164 | |
| |
| Net proceeds from rights offering | | | 108,466,176 | |
| |
| Reinvestment of distributions | | | 47,185,262 | |
| |
| Net cash provided by financing activities | | | 32,448,128 | |
| |
| INCREASE (DECREASE) IN CASH: | | | (73,896 | ) |
| |
| Cash and foreign currency at beginning of year | | | 73,896 | |
| |
| Cash and foreign currency at end of year | | $ | – | |
| |
Supplemental disclosure of cash flow information:
For the year ended December 31, 2018, the Fund paid $1,680,721 in interest expense.
| 52 | 2018 Annual Report to Stockholders | | THE ACCOMPANYING NOTES ARE AN INTEGRAL PART OF THESE FINANCIAL STATEMENTS |
Royce Value Trust
| |
| Financial Highlights |
| This table is presented to show selected data for a share of Common Stock outstanding throughout each period, and to assist stockholders in evaluating the Fund’s performance for the periods presented. |
| | | YEARS ENDED |
| | | |
| | | 12/31/18 | | | 12/31/17 | | | 12/31/16 | | | 12/31/15 | | | 12/31/14 | |
| |
| Net Asset Value, Beginning of Period | | $ | 17.50 | | | $ | 15.85 | | | $ | 13.56 | | | $ | 16.24 | | | $ | 18.17 | |
| |
| INVESTMENT OPERATIONS: | | | | | | | | | | | | | | | | | | | | |
| Net investment income (loss) | | | 0.18 | | | | 0.13 | | | | 0.12 | | | | 0.12 | | | | 0.12 | |
| |
| Net realized and unrealized gain (loss) on investments and foreign currency | | | (2.46 | ) | | | 2.74 | | | | 3.27 | | | | (1.48 | ) | | | (0.13 | ) |
| |
| Net increase (decrease) in net assets from investment operations | | | (2.28 | ) | | | 2.87 | | | | 3.39 | | | | (1.36 | ) | | | (0.01 | ) |
| |
| DISTRIBUTIONS: | | | | | | | | | | | | | | | | | | | | |
| Net investment income | | | (0.19 | ) | | | (0.13 | ) | | | (0.13 | ) | | | (0.16 | ) | | | (0.14 | ) |
| |
| Net realized gain on investments and foreign currency | | | (1.07 | ) | | | (1.03 | ) | | | (0.89 | ) | | | (1.08 | ) | | | (1.68 | ) |
| |
| Total distributions | | | (1.26 | ) | | | (1.16 | ) | | | (1.02 | ) | | | (1.24 | ) | | | (1.82 | ) |
| |
| CAPITAL STOCK TRANSACTIONS: | | | | | | | | | | | | | | | | | | | | |
| |
| Effect of reinvestment of distributions by Common Stockholders | | | (0.06 | ) | | | (0.06 | ) | | | (0.08 | ) | | | (0.08 | ) | | | (0.10 | ) |
| |
| Effect of rights offering | | | (0.17 | ) | | | | | | | | | | | | | | | | |
| |
| Total capital stock transactions | | | (0.23 | ) | | | (0.06 | ) | | | (0.08 | ) | | | (0.08 | ) | | | (0.10 | ) |
| |
| Net Asset Value, End of Period | | $ | 13.73 | | | $ | 17.50 | | | $ | 15.85 | | | $ | 13.56 | | | $ | 16.24 | |
| |
| Market Value, End of Period | | $ | 11.80 | | | $ | 16.17 | | | $ | 13.39 | | | $ | 11.77 | | | $ | 14.33 | |
| |
| TOTAL RETURN: 1 | | | | | | | | | | | | | | | | | | | | |
| Net Asset Value | | | (14.45 | )% | | | 19.31 | % | | | 26.87 | % | | | (8.09 | )% | | | 0.78 | % |
| |
| Market Value | | | (20.43 | )% | | | 30.49 | % | | | 23.48 | % | | | (9.59 | )% | | | 0.93 | % |
| |
| RATIOS BASED ON AVERAGE NET ASSETS: | | | | | | | | | | | | | | | | | | | | |
| Investment advisory fee expense2 | | | 0.42 | % | | | 0.43 | % | | | 0.51 | % | | | 0.50 | % | | | 0.46 | % |
| |
| Other operating expenses | | | 0.21 | % | | | 0.22 | % | | | 0.22 | % | | | 0.18 | % | | | 0.15 | % |
| |
| Total expenses (net) | | | 0.63 | % | | | 0.65 | % | | | 0.73 | % | | | 0.68 | % | | | 0.61 | % |
| |
| Expenses excluding interest expense | | | 0.52 | % | | | 0.54 | % | | | 0.62 | % | | | 0.61 | % | | | 0.55 | % |
| |
| Expenses prior to balance credits | | | 0.63 | % | | | 0.65 | % | | | 0.73 | % | | | 0.68 | % | | | 0.61 | % |
| |
| Net investment income (loss) | | | 1.06 | % | | | 0.80 | % | | | 0.85 | % | | | 0.78 | % | | | 0.72 | % |
| |
| SUPPLEMENTAL DATA: | | | | | | | | | | | | | | | | | | | | |
| Net Assets, End of Period (in thousands) | | $ | 1,304,107 | | | $ | 1,480,449 | | | $ | 1,296,012 | | | $ | 1,072,035 | | | $ | 1,231,955 | |
| |
| Portfolio Turnover Rate | | | 28 | % | | | 19 | % | | | 28 | % | | | 35 | % | | | 40 | % |
| |
| REVOLVING CREDIT AGREEMENT: | | | | | | | | | | | | | | | | | | | | |
| Asset coverage | | | 2998 | % | | | 2215 | % | | | 1951 | % | | | 1631 | % | | | 1860 | % |
| |
| Asset coverage per $1,000 | | $ | 29,980 | | | $ | 22,149 | | | $ | 19,514 | | | $ | 16,315 | | | $ | 18,599 | |
| |
| 1 | The Market Value Total Return is calculated assuming a purchase of Common Stock on the opening of the first business day and a sale on the closing of the last business day of each period. Dividends and distributions are assumed for the purposes of this calculation to be reinvested at prices obtained under the Fund’s Distribution Reinvestment and Cash Purchase Plan. Net Asset Value Total Return is calculated on the same basis, except that the Fund’s net asset value is used on the purchase and sale dates instead of market value. |
| 2 | The investment advisory fee is calculated based on average net assets over a rolling 60-month basis, while the above ratios of investment advisory fee expenses are based on the average net assets over a 12-month basis. |
| THE ACCOMPANYING NOTES ARE AN INTEGRAL PART OF THESE FINANCIAL STATEMENTS | | 2018 Annual Report to Stockholders | 53 |
Royce Value Trust
Notes to Financial Statements
Summary of Significant Accounting Policies:
Royce Value Trust, Inc. (the "Fund"), is a diversified closed-end investment company that was incorporated under the laws of the State of Maryland on July 1, 1986. The Fund commenced operations on November 26, 1986.
The preparation of financial statements in conformity with accounting principles generally accepted in the United States of America requires management to make estimates and assumptions that affect the reported amounts of assets and liabilities and the disclosure of contingent assets and liabilities at the date of the financial statements and the reported amounts of income and expenses during the reporting period. Actual results could differ from those estimates.
The Fund is an investment company and accordingly follows the investment company accounting and reporting guidance of the Financial Accounting Standards Board (FASB) Accounting Standard Codification Topic 946 “Financial Services-Investment Companies”.
VALUATION OF INVESTMENTS:
Securities are valued as of the close of trading on the New York Stock Exchange (NYSE) (generally 4:00 p.m. Eastern time) on the valuation date. Securities that trade on an exchange, and securities traded on Nasdaq’s Electronic Bulletin Board, are valued at their last reported sales price or Nasdaq official closing price taken from the primary market in which each security trades or, if no sale is reported for such day, at their highest bid price. Other over-the-counter securities for which market quotations are readily available are valued at their highest bid price, except in the case of some bonds and other fixed income securities which may be valued by reference to other securities with comparable ratings, interest rates and maturities, using established independent pricing services. The Fund values its non-U.S. dollar denominated securities in U.S. dollars daily at the prevailing foreign currency exchange rates as quoted by a major bank. Securities for which market quotations are not readily available are valued at their fair value in accordance with the provisions of the 1940 Act, under procedures approved by the Fund’s Board of Directors, and are reported as Level 3 securities. As a general principle, the fair value of a security is the amount which the Fund might reasonably expect to receive for the security upon its current sale. However, in light of the judgment involved in fair valuations, there can be no assurance that a fair value assigned to a particular security will be the amount which the Fund might be able to receive upon its current sale. In addition, if, between the time trading ends on a particular security and the close of the customary trading session on the NYSE, events occur that are significant and may make the closing price unreliable, the Fund may fair value the security. The Fund uses an independent pricing service to provide fair value estimates for relevant non-U.S. equity securities on days when the U.S. market volatility exceeds a certain threshold. This pricing service uses proprietary correlations it has developed between the movement of prices of non-U.S. equity securities and indices of U.S.-traded securities, futures contracts and other indications to estimate the fair value of relevant non-U.S. securities. When fair value pricing is employed, the prices of securities used by the Fund may differ from quoted or published prices for the same security. Investments in money market funds are valued at net asset value per share.
Various inputs are used in determining the value of the Fund’s investments, as noted above. These inputs are summarized in the three broad levels below:
| | Level 1 | – | quoted prices in active markets for identical securities. |
| | Level 2 | – | other significant observable inputs (including quoted prices for similar securities, foreign securities that may be fair valued and repurchase agreements). The table below includes all Level 2 securities. Level 2 securities with values based on quoted prices for similar securities are noted in the Schedule of Investments. |
| | Level 3 | – | significant unobservable inputs (including last trade price before trading was suspended, or at a discount thereto for lack of marketability or otherwise, market price information regarding other securities, information received from the company and/or published documents, including SEC filings and financial statements, or other publicly available information). |
The inputs or methodology used for valuing securities are not necessarily an indication of the risk associated with investing in those securities.
The following is a summary of the inputs used to value the Fund’s investments as of December 31, 2018. For a detailed breakout of common stocks by sector classification, please refer to the Schedule of Investments.
| | | | | LEVEL 1 | | | | LEVEL 2 | | | | LEVEL 3 | | | | TOTAL |
| |
| Common Stocks | | | | $1,346,575,825 | | | | $14,420,251 | | | | $1,100,250 | | | | $1,362,096,326 |
| |
| Warrants | | | | 568,750 | | | | 105,000 | | | | 0 | | | | 673,750 |
| |
Certain securities have transferred in and out of Level 1 and Level 2 measurements during the reporting period. This is generally due to whether fair value factors have been applied. The Fund recognizes transfers between levels as of the end of the reporting period. For the year ended December 31, 2018, securities valued at $2,165,665 were transferred from Level 1 to Level 2 and securities valued at $57,084,055 were transferred from Level 2 to Level 1 within the fair value hierarchy.
54 | 2018 Annual Report to Stockholders
Royce Value Trust
Notes to Financial Statements (continued)
VALUATION OF INVESTMENTS (continued):
Level 3 Reconciliation:
| | | | | BALANCE AS OF 12/31/17 | | | | PURCHASES | | | | REALIZED GAIN (LOSS) | | | | UNREALIZED GAIN (LOSS)1 | | | | BALANCE AS OF 12/31/18 |
| |
| Common Stocks | | | | $891,600 | | | | $544,065 | | | | $ – | | | | $(335,415) | | | | $1,100,250 |
| |
| Warrants | | | | – | | | | 0 | | | | – | | | | – | | | | 0 |
| |
| 1 | The net change in unrealized appreciation (depreciation) is included in the accompanying Statement of Operations. Change in unrealized appreciation (depreciation) includes net unrealized appreciation (depreciation) resulting from changes in investment values during the reporting period and the reversal of previously recorded unrealized appreciation (depreciation) when gains or losses are realized. Net realized gain (loss) from investments and foreign currency transactions is included in the accompanying Statement of Operations. |
The following table summarizes the valuation techniques used and unobservable inputs approved by the Valuation Committee to determine the fair value of certain Level 3 investments. The table does not include Level 3 investments with values derived utilizing prices from prior transactions or third party pricing information with adjustments (e.g. broker quotes, pricing services, net asset values).
| | | FAIR VALUE AT | | | | | | | | | | | | | | | | IMPACT TO VALUATION FROM |
| | | 12/31/18 | | | | VALUATION TECHNIQUE(S) | | | | UNOBSERVABLE INPUT(S) | | | | RANGE AVERAGE | | | | AN INCREASE IN INPUT1 |
| |
| | | | | | | Discounted Present Value | | | | | | | | | | | | |
| Waterloo Investment Holdings | | $891,600 | | | | Balance Sheet Analysis | | | | Liquidity Discount | | | | 30%-40% | | | | Decrease |
| |
| | | | | | | Guidance from Options Clearing Authorities | | | | | | | | | | | | |
| New York REIT | | 208,650 | | | | Balance Sheet Analysis | | | | Liquidity Discount | | | | 20%-30% | | | | Decrease |
| |
| 1 | This column represents the directional change in the fair value of the Level 3 investments that would result in an increase from the corresponding unobservable input. A decrease to the unobservable input would have the opposite effect. Significant increases and decreases in these unobservable inputs in isolation could result in significantly higher or lower fair value measurements. |
REPURCHASE AGREEMENTS:
The Fund may enter into repurchase agreements with institutions that the Fund’s investment adviser has determined are creditworthy. The Fund restricts repurchase agreements to maturities of no more than seven days. Securities pledged as collateral for repurchase agreements, which are held until maturity of the repurchase agreements, are marked-to-market daily and maintained at a value at least equal to the principal amount of the repurchase agreement (including accrued interest). Repurchase agreements could involve certain risks in the event of default or insolvency of the counter-party, including possible delays or restrictions upon the ability of the Fund to dispose of its underlying securities.
FOREIGN CURRENCY:
Net realized foreign exchange gains or losses arise from sales and maturities of short-term securities, sales of foreign currencies, expiration of currency forward contracts, currency gains or losses realized between the trade and settlement dates on securities transactions, and the difference between the amounts of dividends, interest, and foreign withholding taxes recorded on the Fund’s books and the U.S. dollar equivalent of the amounts actually received or paid. Net unrealized foreign exchange gains and losses arise from changes in the value of assets and liabilities, other than investments in securities at the end of the reporting period, as a result of changes in foreign currency exchange rates.
The Fund does not isolate that portion of the results of operations resulting from fluctuations in foreign exchange rates on investments from the fluctuations arising from changes in market prices of securities held. Such fluctuations are included with the net realized and unrealized gain or loss on investments.
TAXES:
As a qualified regulated investment company under Subchapter M of the Internal Revenue Code, the Fund is not subject to income taxes to the extent that it distributes substantially all of its taxable income for its fiscal year. The Schedule of Investments includes information regarding income taxes under the caption “Tax Information”.
CAPITAL GAINS TAXES:
The Fund is subject to a tax imposed on short-term capital gains on securities of issuers domiciled in certain countries. The Fund records an estimated deferred tax liability for gains in these securities that have been held for less than one year. This amount, if any, is reported as deferred capital gains tax in the accompanying Statement of Assets and Liabilities, assuming those positions were disposed of at the end of the period, and accounted for as a reduction in the market value of the security.
DISTRIBUTIONS:
The Fund pays quarterly distributions on the Fund’s Common Stock at the annual rate of 7% of the rolling average of the prior four calendar quarter-end NAVs of the Fund’s Common Stock, with the fourth quarter distribution being the greater of 1.75% of the rolling average or the distribution required by IRS regulations. Distributions to Common Stockholders are recorded on ex-dividend date. To the extent that distributions in any year are not paid from long-term capital gains, net investment income or net short-term capital gains, they
2018 Annual Report to Stockholders | 55
Royce Value Trust
Notes to Financial Statements (continued)
DISTRIBUTIONS (continued):
will result in reclassifications within the capital accounts. Undistributed net investment income may include temporary book and tax basis differences, which will reverse in a subsequent period. Any taxable income or gain remaining undistributed at fiscal year end is distributed in the following year.
INVESTMENT TRANSACTIONS AND RELATED INVESTMENT INCOME:
Investment transactions are accounted for on the trade date. Dividend income is recorded on the ex-dividend date. Non-cash dividend income is recorded at the fair market value of the securities received. Interest income is recorded on an accrual basis. Premiums and discounts on debt securities are amortized using the effective yield-to-maturity method. Realized gains and losses from investment transactions are determined on the basis of identified cost for book and tax purposes.
EXPENSES:
The Fund incurs direct and indirect expenses. Expenses directly attributable to the Fund are charged to the Fund’s operations, while expenses applicable to more than one of the Royce Funds are allocated equitably. Certain personnel, occupancy costs and other administrative expenses related to the Funds are allocated by Royce & Associates (“Royce”) under an administration agreement and are included in administrative and office facilities and professional fees. The Fund has adopted a deferred fee agreement that allows the Directors to defer the receipt of all or a portion of directors’ fees otherwise payable. The deferred fees are invested in certain Royce Funds until distributed in accordance with the agreement.
COMPENSATING BALANCE CREDITS:
The Fund has an arrangement with its custodian bank, whereby a portion of the custodian’s fee is paid indirectly by credits earned on the Fund’s cash on deposit with the bank. This deposit arrangement is an alternative to purchasing overnight investments. Conversely, the Fund pays interest to the custodian on any cash overdrafts, to the extent they are not offset by credits earned on positive cash balances.
Capital Stock:
The Fund issued 3,301,756 and 2,795,800 shares of Common Stock as reinvestment of distributions for the years ended December 31, 2018 and December 31, 2017, respectively.
On July 5, 2018, the Fund completed a rights offering of Common Stock to its stockholders at the rate of one common share for each 10 rights held by stockholders of record on May 30, 2018. The rights offering resulted in the issuance of 7,120,544 common shares at a price of $15.33, and proceeds of $109,157,940 to the Fund prior to the deduction of expenses of $691,764. The net asset value per share of the Fund’s Common Stock was reduced by approximately $0.17 per share as a result of the issuance.
Borrowings:
The Fund is party to a revolving credit agreement (the credit agreement) with BNP Paribas Prime Brokerage International, Limited (BNPPI). The Fund pays a commitment fee of 0.50% per annum on the unused portion of the credit agreement. The credit agreement has a 179-day rolling term that resets daily; however, if the Fund exceeds certain net asset value triggers, the credit agreement may convert to a 60-day rolling term that resets daily. The Fund is required to pledge portfolio securities as collateral in an amount up to two times the loan balance outstanding or as otherwise required by applicable regulatory standards and has granted a security interest in the securities pledged to, and in favor of, BNPPI as security for the loan balance outstanding. If the Fund fails to meet certain requirements, or maintain other financial covenants required under the credit agreement, the Fund may be required to repay immediately, in part or in full, the loan balance outstanding under the credit agreement which may necessitate the sale of portfolio securities at potentially inopportune times. BNPPI may terminate the credit agreement upon certain ratings downgrades of its corporate parent, which would result in the Fund’s entire loan balance becoming immediately due and payable. The occurrence of such ratings downgrades may necessitate the sale of portfolio securities at potentially inopportune times. The credit agreement also permits, subject to certain conditions, BNPPI to rehypothecate portfolio securities pledged by the Fund up to the amount of the loan balance outstanding. The Fund continues to receive payments in lieu of dividends and interest on rehypothecated securities. The Fund also has the right under the credit agreement to recall the rehypothecated securities from BNPPI on demand. If BNPPI fails to deliver the recalled security in a timely manner, the Fund is compensated by BNPPI for any fees or losses related to the failed delivery or, in the event a recalled security is not returned by BNPPI, the Fund, upon notice to BNPPI, may reduce the loan balance outstanding by the value of the recalled security failed to be returned. The Fund receives a portion of the fees earned by BNPPI in connection with the rehypothecation of portfolio securities.
As of December 31, 2018, the Fund has outstanding borrowings of $45,000,000. During the year ended December 31, 2018, the Fund borrowed an average daily balance of $52,095,890 at a weighted average borrowing cost of 3.26%. The maximum amount outstanding during the year ended December 31, 2018 was $70,000,000. As of December 31, 2018, the aggregate value of rehypothecated securities was $40,175,871. During the year ended December 31, 2018, the Fund earned $232,957 in fees from rehypothecated securities.
56 | 2018 Annual Report to Stockholders
Royce Value Trust
Notes to Financial Statements (continued)
Investment Advisory Agreement:
As compensation for its services under the investment advisory agreement, Royce receives a fee comprised of a Basic Fee (“Basic Fee”) and an adjustment to the Basic Fee based on the investment performance of the Fund in relation to the investment record of the S&P SmallCap 600 Index (“S&P 600”).
The Basic Fee is a monthly fee equal to 1/12 of 1% (1% on an annualized basis) of the average of the Fund’s month-end net assets for the rolling 60-month period ending with such month (the "performance period"). The Basic Fee for each month is increased or decreased at the rate of 1/12 of .05% for each percentage point that the investment performance of the Fund exceeds, or is exceeded by, the percentage change in the investment record of the S&P 600 for the performance period by more than two percentage points. The performance period for each such month is a rolling 60-month period ending with such month. The maximum increase or decrease in the Basic Fee for any month may not exceed 1/12 of .5%. Accordingly, for each month, the maximum monthly fee rate as adjusted for performance is 1/12 of 1.5% and is payable if the investment performance of the Fund exceeds the percentage change in the investment record of the S&P 600 by 12 or more percentage points for the performance period, and the minimum monthly fee rate as adjusted for performance is 1/12 of .5% and is payable if the percentage change in the investment record of the S&P 600 exceeds the investment performance of the Fund by 12 or more percentage points for the performance period.
Notwithstanding the foregoing, Royce is not entitled to receive any fee for any month when the investment performance of the Fund for the rolling 36-month period ending with such month is negative. In the event that the Fund’s investment performance for such a performance period is less than zero, Royce will not be required to refund to the Fund any fee earned in respect of any prior performance period.
For the twelve rolling 60-month periods in 2018, the Fund’s investment performance ranged from 18% to 34% below the investment performance of the S&P 600. Accordingly, the net investment advisory fee consisted of a Basic Fee of $12,712,728 and a net downward adjustment of $6,356,364 for the performance of the Fund relative to that of the S&P 600. For the year ended December 31, 2018, the Fund expensed Royce investment advisory fees totaling $6,356,364.
Purchases and Sales of Investment Securities:
For the year ended December 31, 2018, the costs of purchases and proceeds from sales of investment securities, other than short-term securities, amounted to $561,104,999 and $423,040,162, respectively.
Cross trades were executed by the Fund pursuant to Rule 17a-7 under the 1940 Act. Cross trading is the buying or selling of portfolio securities between funds to which Royce serves as investment adviser. At its regularly scheduled quarterly meetings, the Board reviews such transactions as of the most recent calendar quarter for compliance with the requirements and restrictions set forth by Rule 17a-7. Cross trades for the year ended December 31, 2018, were as follows:
| COSTS OF PURCHASES | | | | PROCEEDS FROM SALES | | | | REALIZED GAIN (LOSS) | |
| |
| $126,247,517 | | | | $2,097,170 | | | | $(1,320,858) | |
| |
Tax Information:
Distributions during the years ended December 31, 2018 and 2017, were characterized as follows for tax purposes:
| ORDINARY INCOME | | | | LONG-TERM CAPITAL GAINS |
| |
| 2018 | | | | 2017 | | | | 2018 | | | | 2017 |
| |
| $30,738,849 | | | | $19,301,057 | | | | $81,956,625 | | | | $76,819,741 |
| |
The tax basis components of distributable earnings at December 31, 2018, were as follows:
| | | | | | | | | | | | | QUALIFIED LATE YEAR | | | | |
| | | | | UNDISTRIBUTED LONG-TERM | | | | NET UNREALIZED | | | | ORDINARY AND | | | | TOTAL |
| UNDISTRIBUTED | | | | CAPITAL GAINS OR | | | | APPRECIATION | | | | POST-OCTOBER LOSS | | | | DISTRIBUTABLE |
| ORDINARY INCOME | | | | (CAPITAL LOSS CARRYFORWARD) | | | | (DEPRECIATION)1 | | | | DEFERRALS2 | | | | EARNINGS |
| |
| $ – | | | | $19,153,127 | | | | $124,553,874 | | | | $(1,372,544) | | | | $142,334,457 |
| |
| 1 | Includes timing differences on foreign currency, recognition of losses on securities sold, investments in publicly traded partnerships and Trusts and mark-to-market of Passive Foreign Investment Companies. |
| 2 | Under the current tax law, capital losses and qualified late year ordinary losses incurred after October 31 may be deferred and treated as occurring on the first day of the following fiscal year. This column also includes passive activity losses. |
2018 Annual Report to Stockholders | 57
Royce Value Trust
Notes to Financial Statements (continued)
Tax Information (continued):
For financial reporting purposes, capital accounts and distributions to stockholders are adjusted to reflect the tax character of permanent book/tax differences. For the year ended December 31, 2018, the Fund had no reclassifications.
Management has analyzed the Fund’s tax positions taken on federal income tax returns for all open tax years (2015-2018) and has concluded that as of December 31, 2018, no provision for income tax is required in the Fund’s financial statements.
Transactions in Affiliated Companies:
An “Affiliated Company” as defined in the Investment Company Act of 1940, is a company in which a fund owns 5% or more of the company’s outstanding voting securities at any time during the period. The Fund held the following positions in shares of such companies at December 31, 2018:
| | | | | | | | | | | | | CHANGE IN NET | | | | | | |
| | | | | | | | | | | | | UNREALIZED | | | | | | |
| | | SHARES | | MARKET VALUE | | COSTS OF | | PROCEEDS | | REALIZED | | APPRECIATION | | DIVIDEND | | SHARES | | MARKET VALUE |
| AFFILIATED COMPANY | | 12/31/17 | | 12/31/17 | | PURCHASES | | FROM SALES | | GAIN (LOSS) | | (DEPRECIATION) | | INCOME | | 12/31/18 | | 12/31/18 |
| |
| HG Holdings | | 912,235 | | $ 793,645 | | $– | | $– | | $– | | $ (401,384) | | $– | | 912,235 | | $ 392,261 |
| |
| Houston Wire & Cable | | 877,363 | | 6,317,014 | | – | | – | | – | | (1,877,557) | | – | | 877,363 | | 4,439,457 |
| |
| | | | | $7,110,659 | | | | | | $– | | $(2,278,941) | | $– | | | | $4,831,718 |
| |
Recent Accounting Pronouncement:
In August 2018, the Securities and Exchange Commission released its Final Rule on Disclosure Update and Simplification (the “Final Rule”) which is intended to simplify an issuer’s disclosure compliance efforts by removing redundant or outdated disclosure requirements without significantly altering the mix of information provided to investors. Effective with the current reporting period, the Fund adopted the Final Rule with the most notable impacts being that the Fund is no longer required to present the components of distributable earnings on the Statement of Assets and Liabilities or the sources of distributions to stockholders and the amount of undistributed net investment income on the Statement of Changes in Net Assets.
Subsequent Events:
Subsequent events have been evaluated through the date the financial statements were issued.
58 | 2018 Annual Report to Stockholders
Report of Independent Registered Public Accounting Firm
To the Board of Directors and the Stockholders of Royce Value Trust, Inc.:
Opinion on the Financial Statements
We have audited the accompanying statement of assets and liabilities, including the schedule of investments, of Royce Value Trust, Inc. (the "Fund") as of December 31, 2018, the related statements of operations and cash flows for the year ended December 31, 2018, the statement of changes in net assets for each of the two years in the period ended December 31, 2018, including the related notes, and the financial highlights for each of the four years in the period ended December 31, 2018 (collectively referred to as the “financial statements”). In our opinion, the financial statements present fairly, in all material respects, the financial position of the Fund as of December 31, 2018, the results of its operations and its cash flows for the year then ended, the changes in its net assets for each of the two years in the period ended December 31, 2018 and the financial highlights for each of the four years in the period ended December 31, 2018 in conformity with accounting principles generally accepted in the United States of America.
The financial statements of the Fund as of and for the year ended December 31, 2014 and the financial highlights for each of the periods ended on or prior to December 31, 2014 (not presented herein, other than the financial highlights) were audited by other auditors whose report dated February 23, 2015 expressed an unqualified opinion on those financial statements and financial highlights.
Basis for Opinion
These financial statements are the responsibility of the Fund’s management. Our responsibility is to express an opinion on the Fund’s financial statements based on our audits. We are a public accounting firm registered with the Public Company Accounting Oversight Board (United States) (PCAOB) and are required to be independent with respect to the Fund in accordance with the U.S. federal securities laws and the applicable rules and regulations of the Securities and Exchange Commission and the PCAOB.
We conducted our audits of these financial statements in accordance with the standards of the PCAOB. Those standards require that we plan and perform the audit to obtain reasonable assurance about whether the financial statements are free of material misstatement, whether due to error or fraud.
Our audits included performing procedures to assess the risks of material misstatement of the financial statements, whether due to error or fraud, and performing procedures that respond to those risks. Such procedures included examining, on a test basis, evidence regarding the amounts and disclosures in the financial statements. Our audits also included evaluating the accounting principles used and significant estimates made by management, as well as evaluating the overall presentation of the financial statements. Our procedures included confirmation of securities owned as of December 31, 2018 by correspondence with the custodian and brokers; when replies were not received from brokers, we performed other auditing procedures. We believe that our audits provide a reasonable basis for our opinion.
/s/PricewaterhouseCoopers LLP
New York, New York
February 21, 2019
We have served as the auditor of one or more investment companies in the Royce investment company group since at least 1967. We have not been able to determine the specific year we began serving as auditor.
2018 Annual Report to Stockholders | 59
History Since Inception
The following table details the share accumulations by an initial investor in the Funds who reinvested all distributions and participated fully in primary subscriptions for each of the rights offerings. Full participation in distribution reinvestments and rights offerings can maximize the returns available to a long-term investor. This table should be read in conjunction with the Performance and Portfolio Reviews of the Funds.
| HISTORY | | | | AMOUNT INVESTED | | PURCHASE PRICE1 | | SHARES | | NAV VALUE2 | | MARKET VALUE2 |
| |
| Royce Global Value Trust | | | | | | | | | | | | | | |
| 10/17/13 | | Initial Purchase | | $ | 8,975 | | $ | 8.975 | | 1,000 | | $ | 9,780 | | $ | 8,975 |
| |
| 12/11/14 | | Distribution $0.15 | | | | | | 7.970 | | 19 | | | 9,426 | | | 8,193 |
| |
| 12/10/15 | | Distribution $0.10 | | | | | | 7.230 | | 14 | | | 9,101 | | | 7,696 |
| |
| 12/9/16 | | Distribution $0.14 | | | | | | 7.940 | | 18 | | | 10,111 | | | 8,446 |
| |
| 12/12/17 | | Distribution $0.11 | | | | | | 10.610 | | 11 | | | 13,254 | | | 11,484 |
| |
| 12/12/18 | | Distribution $0.04 | | | | | | 8.500 | | 5 | | | | | | |
| |
| 12/31/18 | | | | $ | 8,975 | | | | | 1,067 | | $ | 11,118 | | $ | 9,475 |
| |
| | | | | | | | | | | | | | | | | |
| Royce Micro-Cap Trust | | | | | | | | | | | | | | |
| 12/14/93 | | Initial Purchase | | $ | 7,500 | | $ | 7.500 | | 1,000 | | $ | 7,250 | | $ | 7,500 |
| |
| 10/28/94 | | Rights Offering | | | 1,400 | | | 7.000 | | 200 | | | | | | |
| |
| 12/19/94 | | Distribution $0.05 | | | | | | 6.750 | | 9 | | | 9,163 | | | 8,462 |
| |
| 12/7/95 | | Distribution $0.36 | | | | | | 7.500 | | 58 | | | 11,264 | | | 10,136 |
| |
| 12/6/96 | | Distribution $0.80 | | | | | | 7.625 | | 133 | | | 13,132 | | | 11,550 |
| |
| 12/5/97 | | Distribution $1.00 | | | | | | 10.000 | | 140 | | | 16,694 | | | 15,593 |
| |
| 12/7/98 | | Distribution $0.29 | | | | | | 8.625 | | 52 | | | 16,016 | | | 14,129 |
| |
| 12/6/99 | | Distribution $0.27 | | | | | | 8.781 | | 49 | | | 18,051 | | | 14,769 |
| |
| 12/6/00 | | Distribution $1.72 | | | | | | 8.469 | | 333 | | | 20,016 | | | 17,026 |
| |
| 12/6/01 | | Distribution $0.57 | | | | | | 9.880 | | 114 | | | 24,701 | | | 21,924 |
| |
| 2002 | | Annual distribution total $0.80 | | | | | | 9.518 | | 180 | | | 21,297 | | | 19,142 |
| |
| 2003 | | Annual distribution total $0.92 | | | | | | 10.004 | | 217 | | | 33,125 | | | 31,311 |
| |
| 2004 | | Annual distribution total $1.33 | | | | | | 13.350 | | 257 | | | 39,320 | | | 41,788 |
| |
| 2005 | | Annual distribution total $1.85 | | | | | | 13.848 | | 383 | | | 41,969 | | | 45,500 |
| |
| 2006 | | Annual distribution total $1.55 | | | | | | 14.246 | | 354 | | | 51,385 | | | 57,647 |
| |
| 2007 | | Annual distribution total $1.35 | | | | | | 13.584 | | 357 | | | 51,709 | | | 45,802 |
| |
| 2008 | | Annual distribution total $1.193 | | | | | | 8.237 | | 578 | | | 28,205 | | | 24,807 |
| |
| 3/11/09 | | Distribution $0.223 | | | | | | 4.260 | | 228 | | | 41,314 | | | 34,212 |
| |
| 12/2/10 | | Distribution $0.08 | | | | | | 9.400 | | 40 | | | 53,094 | | | 45,884 |
| |
| 2011 | | Annual distribution total $0.533 | | | | | | 8.773 | | 289 | | | 49,014 | | | 43,596 |
| |
| 2012 | | Annual distribution total $0.51 | | | | | | 9.084 | | 285 | | | 57,501 | | | 49,669 |
| |
| 2013 | | Annual distribution total $1.38 | | | | | | 11.864 | | 630 | | | 83,110 | | | 74,222 |
| |
| 2014 | | Annual distribution total $2.90 | | | | | | 10.513 | | 1,704 | | | 86,071 | | | 76,507 |
| |
| 2015 | | Annual distribution total $1.26 | | | | | | 7.974 | | 1,256 | | | 75,987 | | | 64,222 |
| |
| 2016 | | Annual distribution total $0.64 | | | | | | 7.513 | | 779 | | | 92,689 | | | 78,540 |
| |
| 2017 | | Annual distribution total $0.69 | | | | | | 8.746 | | 783 | | | 109,076 | | | 98,254 |
| |
| 2018 | | Annual distribution total $0.75 | | | | | | 8.993 | | 893 | | | | | | |
| |
| 12/31/18 | | | | $ | 8,900 | | | | | 11,301 | | $ | 96,398 | | $ | 83,853 |
| |
| 1 | The purchase price used for annual distribution totals is a weighted average of the distribution reinvestment prices for the year. |
| 2 | Values are stated as of December 31 of the year indicated, after reinvestment of distributions, other than for initial purchase. |
| 3 | Includes a return of capital. |
60 | 2018 Annual Report to Stockholders
History Since Inception (continued)
| HISTORY | | | | AMOUNT INVESTED | | PURCHASE PRICE1 | | SHARES | | NAV VALUE2 | | MARKET VALUE2 |
| |
| Royce Value Trust | | | | | | | | | | | | | | |
| 11/26/86 | | Initial Purchase | | $ | 10,000 | | $ | 10.000 | | 1,000 | | $ | 9,280 | | $ | 10,000 |
| |
| 10/15/87 | | Distribution $0.30 | | | | | | 7.000 | | 42 | | | | | | |
| |
| 12/31/87 | | Distribution $0.22 | | | | | | 7.125 | | 32 | | | 8,578 | | | 7,250 |
| |
| 12/27/88 | | Distribution $0.51 | | | | | | 8.625 | | 63 | | | 10,529 | | | 9,238 |
| |
| 9/22/89 | | Rights Offering | | | 405 | | | 9.000 | | 45 | | | | | | |
| |
| 12/29/89 | | Distribution $0.52 | | | | | | 9.125 | | 67 | | | 12,942 | | | 11,866 |
| 9/24/90 | | Rights Offering | | | 457 | | | 7.375 | | 62 | | | | | | |
| |
| 12/31/90 | | Distribution $0.32 | | | | | | 8.000 | | 52 | | | 11,713 | | | 11,074 |
| |
| 9/23/91 | | Rights Offering | | | 638 | | | 9.375 | | 68 | | | | | | |
| |
| 12/31/91 | | Distribution $0.61 | | | | | | 10.625 | | 82 | | | 17,919 | | | 15,697 |
| |
| 9/25/92 | | Rights Offering | | | 825 | | | 11.000 | | 75 | | | | | | |
| |
| 12/31/92 | | Distribution $0.90 | | | | | | 12.500 | | 114 | | | 21,999 | | | 20,874 |
| |
| 9/27/93 | | Rights Offering | | | 1,469 | | | 13.000 | | 113 | | | | | | |
| |
| 12/31/93 | | Distribution $1.15 | | | | | | 13.000 | | 160 | | | 26,603 | | | 25,428 |
| |
| 10/28/94 | | Rights Offering | | | 1,103 | | | 11.250 | | 98 | | | | | | |
| |
| 12/19/94 | | Distribution $1.05 | | | | | | 11.375 | | 191 | | | 27,939 | | | 24,905 |
| |
| 11/3/95 | | Rights Offering | | | 1,425 | | | 12.500 | | 114 | | | | | | |
| |
| 12/7/95 | | Distribution $1.29 | | | | | | 12.125 | | 253 | | | 35,676 | | | 31,243 |
| |
| 12/6/96 | | Distribution $1.15 | | | | | | 12.250 | | 247 | | | 41,213 | | | 36,335 |
| |
| 1997 | | Annual distribution total $1.21 | | | | | | 15.374 | | 230 | | | 52,556 | | | 46,814 |
| |
| 1998 | | Annual distribution total $1.54 | | | | | | 14.311 | | 347 | | | 54,313 | | | 47,506 |
| 1999 | | Annual distribution total $1.37 | | | | | | 12.616 | | 391 | | | 60,653 | | | 50,239 |
| |
| 2000 | | Annual distribution total $1.48 | | | | | | 13.972 | | 424 | | | 70,711 | | | 61,648 |
| |
| 2001 | | Annual distribution total $1.49 | | | | | | 15.072 | | 437 | | | 81,478 | | | 73,994 |
| |
| 2002 | | Annual distribution total $1.51 | | | | | | 14.903 | | 494 | | | 68,770 | | | 68,927 |
| |
| 1/28/03 | | Rights Offering | | | 5,600 | | | 10.770 | | 520 | | | | | | |
| |
| 2003 | | Annual distribution total $1.30 | | | | | | 14.582 | | 516 | | | 106,216 | | | 107,339 |
| |
| 2004 | | Annual distribution total $1.55 | | | | | | 17.604 | | 568 | | | 128,955 | | | 139,094 |
| |
| 2005 | | Annual distribution total $1.61 | | | | | | 18.739 | | 604 | | | 139,808 | | | 148,773 |
| 2006 | | Annual distribution total $1.78 | | | | | | 19.696 | | 693 | | | 167,063 | | | 179,945 |
| |
| 2007 | | Annual distribution total $1.85 | | | | | | 19.687 | | 787 | | | 175,469 | | | 165,158 |
| |
| 2008 | | Annual distribution total $1.723 | | | | | | 12.307 | | 1,294 | | | 95,415 | | | 85,435 |
| |
| 3/11/09 | | Distribution $0.323 | | | | | | 6.071 | | 537 | | | 137,966 | | | 115,669 |
| |
| 12/2/10 | | Distribution $0.03 | | | | | | 13.850 | | 23 | | | 179,730 | | | 156,203 |
| |
| 2011 | | Annual distribution total $0.783 | | | | | | 13.043 | | 656 | | | 161,638 | | | 139,866 |
| |
| 2012 | | Annual distribution total $0.80 | | | | | | 13.063 | | 714 | | | 186,540 | | | 162,556 |
| |
| 2013 | | Annual distribution total $2.194 | | | | | | 16.647 | | 1,658 | | | 250,219 | | | 220,474 |
| |
| 2014 | | Annual distribution total $1.82 | | | | | | 14.840 | | 1,757 | | | 252,175 | | | 222,516 |
| |
| 2015 | | Annual distribution total $1.24 | | | | | | 12.725 | | 1,565 | | | 231,781 | | | 201,185 |
| |
| 2016 | | Annual distribution total $1.02 | | | | | | 12.334 | | 1,460 | | | 293,880 | | | 248,425 |
| |
| 2017 | | Annual distribution total $1.16 | | | | | | 14.841 | | 1,495 | | | 350,840 | | | 324,176 |
| |
| 2018 | | Distribution through 6/30/18 $0.59 | | | | | | 15.962 | | 748 | | | | | | |
| |
| 2018 | | Rights Offering | | | 31,289 | | | 15.330 | | 2,041 | | | | | | |
| |
| 2018 | | Distribution after 6/30/18 $0.67 | | | | | | 12.706 | | 1,168 | | | | | | |
| |
| 12/31/18 | | | | $ | 53,211 | | | | | 24,005 | | $ | 329,589 | | $ | 283,259 |
| |
| 1 | The purchase price used for annual distribution totals is a weighted average of the distribution reinvestment prices for the year. |
| 2 | Values are stated as of December 31 of the year indicated, after reinvestment of distributions, other than for initial purchase. |
| 3 | Includes a return of capital. |
| 4 | Includes Royce Global Value Trust spin-off of $1.40 per share. |
2018 Annual Report to Stockholders | 61
Distribution Reinvestment and Cash Purchase Options
Why should I reinvest my distributions?
By reinvesting distributions, a stockholder can maintain an undiluted investment in the Fund. The regular reinvestment of distributions has a significant impact on stockholder returns. In contrast, the stockholder who takes distributions in cash is penalized when shares are issued below net asset value to other stockholders.
How does the reinvestment of distributions from the Royce closed-end funds work?
The Funds automatically issue shares in payment of distributions unless you indicate otherwise. The shares are generally issued at the lower of the market price or net asset value on the valuation date.
How does this apply to registered stockholders?
If your shares are registered directly with a Fund, your distributions are automatically reinvested unless you have otherwise instructed the Funds’ transfer agent, Computershare, in writing, in which case you will receive your distribution in cash. A registered stockholder also may have the option to receive the distribution in the form of a stock certificate.
What if my shares are held by a brokerage firm or a bank?
If your shares are held by a brokerage firm, bank, or other intermediary as the stockholder of record, you should contact your brokerage firm or bank to be certain that it is automatically reinvesting distributions on your behalf. If they are unable to reinvest distributions on your behalf, you should have your shares registered in your name in order to participate.
What other features are available for registered stockholders?
The Distribution Reinvestment and Cash Purchase Plans also allow registered stockholders to make optional cash purchases of shares of a Fund’s common stock directly through Computershare on a monthly basis, and to deposit certificates representing your RVT and RMT shares with Computershare for safekeeping. (RGT does not issue shares in certificated form). Plan participants are subject to a $0.75 service fee for each voluntary cash purchase under the Plans. The Funds’ investment adviser absorbed all commissions on optional cash purchases under the Plans through December 31, 2018.
How do the Plans work for registered stockholders?
Computershare maintains the accounts for registered stockholders in the Plans and sends written confirmation of all transactions in the account. Shares in the account of each participant will be held by Computershare in non-certificated form in the name of the participant, and each participant will be able to vote those shares at a stockholder meeting or by proxy. A participant may also send stock certificates for RVT and RMT held by them to Computershare to be held in non-certificated form. RGT does not issue shares in certificated form. There is no service fee charged to participants for reinvesting distributions. If a participant elects to sell shares from a Plan account, Computershare will deduct a $2.50 service fee from the sale transaction. The Funds’ investment adviser absorbed all commissions on optional sales under the Plans through December 31, 2018. If a nominee is the registered owner of your shares, the nominee will maintain the accounts on your behalf.
How can I get more information on the Plans?
You can call an Investor Services Representative at (800) 221-4268 or you can request a copy of the Plan for your Fund from Computershare. All correspondence (including notifications) should be directed to: [Name of Fund] Distribution Reinvestment and Cash Purchase Plan, c/o Computershare, PO Box 43078, Providence, RI 02940-3078, telephone (800) 426-5523 (from 9:00 A.M. to 5:00 P.M.).
62 | 2018 Annual Report to Stockholders
Directors and Officers
All Directors and Officers may be reached c/o The Royce Funds, 745 Fifth Avenue, New York, NY 10151
Charles M. Royce, Director1
Age: 79 | Number of Funds Overseen: 21 | Tenure: Since 1982
Non-Royce Directorships: Director of Oxford Square Capital Corp.
Principal Occupation(s) During Past Five Years: Chairman of the Board of Managers of Royce & Associates, LP (“Royce”), the Trust’s investment adviser; Chief Executive Officer (1972–June 2016), President (1972-June 2014) of Royce.
Christopher D. Clark, Director1, President
Age: 53 | Number of Funds Overseen: 21 | Tenure: Since 2014
Principal Occupation(s) During Past Five Years: Chief Executive Officer (since July 2016), President (since July 2014), Co-Chief Investment Officer (Since January 2014), Managing Director of Royce, a Member of the Board of Managers of Royce, having been employed by Royce since May 2007.
Patricia W. Chadwick, Director
Age: 70 | Number of Funds Overseen: 21 | Tenure: Since 2009
Non-Royce Directorships: Trustee of Voya Mutual Funds and Director of Wisconsin Energy Corp.
Principal Occupation(s) During Past 5 Years: Consultant and President of Ravengate Partners LLC (since 2000).
Christopher C. Grisanti, Director
Age: 57 | Number of Funds Overseen: 21 | Tenure: Since 2017
Non-Royce Directorships: None
Principal Occupation(s) During Past Five Years: Co-Founder and Chief Executive Officer of Grisanti Capital Management LLC, an investment advisory firm (since 1999). Mr. Grisanti’s prior business experience includes serving as Director of Research and Portfolio Manager at Spears Benzak, Salomon & Farrell (from 1994 to 1999) and a senior associate at the law firm of Simpson, Thacher & Bartlett (from 1988 to 1994).
Stephen L. Isaacs, Director
Age: 79 | Number of Funds Overseen: 21 | Tenure: Since 1989
Non-Royce Directorships: None
Principal Occupation(s) During Past Five Years: Attorney and President of Health Policy Associates, Inc., consultants. Mr. Isaacs’s prior business experience includes having served as President of the Center for Health and Social Policy (from 1996 to 2012); Director of Columbia University Development Law and Policy Program and Professor at Columbia University (until August 1996).
Arthur S. Mehlman, Director
Age: 76 | Number of Funds Overseen: 40 | Tenure: Since 2004
Non-Royce Directorships: Director/Trustee of registered investment companies constituting the 19 Legg Mason Funds.
Principal Occupation(s) During Past Five Years: Director of The League for People with Disabilities, Inc.; Director of University of Maryland Foundation (non-profits). Formerly: Director of Municipal Mortgage & Equity, LLC (from October 2004 to April 1, 2011); Director of University of Maryland College Park Foundation (non-profit) (from 1998 to 2005); Partner, KPMG LLP (international accounting firm) (from 1972 to 2002); Director of Maryland Business Roundtable for Education (from July 1984 to June 2002).
David L. Meister, Director
Age: 79 | Number of Funds Overseen: 21 | Tenure: Since 1982
Non-Royce Directorships: None
Principal Occupation(s) During Past Five Years: Consultant. Chairman and Chief Executive Officer of The Tennis Channel (from June 2000 to March 2005). Mr. Meister’s prior business experience includes having served as Chief Executive Officer of Seniorlife.com, a consultant to the communications industry, President of Financial News Network, Senior Vice President of HBO, President of Time-Life Films, and Head of Broadcasting for Major League Baseball.
G. Peter O’Brien, Director
Age: 73 | Number of Funds Overseen: 40 | Tenure: Since 2001
Non-Royce Directorships: Director/Trustee of registered investment companies constituting the 19 Legg Mason Funds.
Principal Occupation(s) During Past Five Years: Trustee Emeritus of Colgate University (since 2005); Board Member of Hill House, Inc. (since 1999); Formerly Director of TICC Capital Corp (from 2003-2017): Trustee of Colgate University (from 1996 to 2005), President of Hill House, Inc. (from 2001 to 2005) and Managing Director/Equity Capital Markets Group of Merrill Lynch & Co. (from 1971 to 1999).
Michael K. Shields, Director
Age: 60 | Number of Funds Overseen: 21 | Tenure: Since 2015
Principal Occupation(s) During Past Five Years: President and Chief Executive Officer of Piedmont Trust Company, a private North Carolina trust company (since May 2012). Mr. Shields’s prior business experience includes owning Shields Advisors, an investment consulting firm (from April 2010 to June 2012).
Francis D. Gannon, Vice President
Age: 51 | Tenure: Since 2014
Principal Occupation(s) During Past Five Years: Co-Chief Investment Officer (since January 2014) and Managing Director of Royce, having been employed by Royce since September 2006.
Daniel A. O’Byrne, Vice President
Age: 56 | Tenure: Since 1994
Principal Occupation(s) During Past Five Years: Principal and Vice President of Royce, having been employed by Royce since October 1986.
Peter K. Hoglund, Treasurer
Age: 52 | Tenure: Since 2015
Principal Occupation(s) During Past Five Years: Chief Financial Officer, Chief Administrative Officer, and Managing Director of Royce, having been employed by Royce since December 2014. Prior to joining Royce, Mr. Hoglund spent more than 20 years with Munder Capital Management in Birmingham, MI, serving as Managing Director and Chief Financial Officer and overseeing all financial aspects of the firm. He began his career at Munder as a portfolio manager.
John E. Denneen, Secretary and Chief Legal Officer
Age: 51 | Tenure: 1996-2001 and Since 2002
Principal Occupation(s) During Past Five Years: General Counsel, Managing Director, and, since June 2015, a Member of the Board of Managers of Royce. Chief Legal and Compliance Officer and Secretary of Royce.
Lisa Curcio, Chief Compliance Officer
Age: 59 | Tenure: Since 2004
Principal Occupation(s) During Past Five Years: Chief Compliance Officer of The Royce Funds (since October 2004) and Compliance Officer of Royce (since June 2004).
| 1 | Interested Director.
Director will hold office until their successors have been duly elected and qualified or until their earlier resignation or removal. |
2018 Annual Report to Stockholders | 63
Notes to Performance and Other Important Information
The thoughts expressed in this Review and Report concerning recent market movements and future prospects for small company stocks are solely the opinion of Royce at December 31, 2018, and, of course, historical market trends are not necessarily indicative of future market movements. Statements regarding the future prospects for particular securities held in the Funds’ portfolios and Royce’s investment intentions with respect to those securities reflect Royce’s opinions as of December 31, 2018 and are subject to change at any time without notice. There can be no assurance that securities mentioned in this Review and Report will be included in any Royce-managed portfolio in the future. Investments in securities of micro-cap, small-cap and/or mid-cap companies may involve considerably more risk than investments in securities of larger-cap companies. All publicly released material information is always disclosed by the Funds on the website at www.roycefunds.com.
Sector weightings are determined using the Global Industry Classification Standard (“GICS”). GICS was developed by, and is the exclusive property of, Standard & Poor’s Financial Services LLC (“S&P”) and MSCI Inc. (“MSCI”). GICS is the trademark of S&P and MSCI. “Global Industry Classification Standard (GICS)” and “GICS Direct” are service marks of S&P and MSCI.
All indexes referred to are unmanaged and capitalization weighted. Each index’s returns include net reinvested dividends and/or interest income. Frank Russell Company (“Russell”) is the source and owner of the trademarks, service marks and copyrights related to the Russell Indexes. Russell® is a trademark of Frank Russell Company. Neither Russell nor its licensors accept any liability for any errors or omissions in the Russell Indexes and / or Russell ratings or underlying data and no party may rely on any Russell Indexes and / or Russell ratings and / or underlying data contained in this communication. No further distribution of Russell Data is permitted without Russell’s express written consent. Russell does not promote, sponsor or endorse the content of this communication. The Russell 2000 Index is an index of domestic small-cap stocks. It measures the performance of the 2,000 smallest publicly traded U.S. companies in the Russell 3000 Index. The Russell 2000 Value and Growth Indexes consist of the respective value and growth stocks within the Russell 2000 as determined by Russell Investments. The Russell Microcap Index includes 1,000 of the smallest securities in the Russell 2000 Index along with the next smallest eligible securities as determined by Russell. The Russell 1000 Index is an index of domestic large-cap stocks. It measures the performance of the 1,000 largest publicly traded companies in the Russell 3000 Index. The Russell Midcap Index measures the performance of the mid-cap segment of the U.S. equity universe. It includes approximately 800 of the smallest securities in the Russell 1000 Index. The Russell Global Small Cap Index is an unmanaged, capitalization-weighted index of global small-cap stocks. The Russell Global ex-U.S. Small Cap Index is an index of global small-cap stocks, excluding the United States. The S&P SmallCap 500 and 600 are indexes of U.S. large-cap and small-cap stocks, respectively, selected by Standard & Poor’s based on market size, liquidity, and industry grouping, among other factors. The CBOE Russell 2000 Volatility Index (RVX) measures market expectations of near-term volatility conveyed by Russell 2000 stock index option prices. The performance of an index does not represent exactly any particular investment, as you cannot invest directly in an index. Returns for the market indexes used in this report were based on information supplied to Royce by Russell Investments.
The Price-Earnings, or P/E, Ratio is calculated by dividing a company’s share price by its trailing 12-month earnings-per share (EPS). The Price-to-Book, or P/B, Ratio is calculated by dividing a company’s share price by its book value per share. For the Morningstar Small Blend Category: © 2017 Morningstar. All Rights Reserved. The information regarding the category in this piece is: (1) is proprietary to Morningstar and/or its content providers; (2) may not be copied or distributed; and (3) is not warranted to be accurate, complete or timely. Neither Morningstar nor its content providers are responsible for any damages or losses arising from any use of this information. The Morningstar Style Map uses proprietary scores of a stock’s value and growth characteristics to determine its placement in one of the five categories listed on the horizontal axis. These characteristics are then compared to those of other stocks within the same market capitalization band. Each is scored from zero to 100 for both value and growth attributes. The value score is subtracted from the growth score to determine the overall style score. For the vertical, market cap axis, Morningstar subdivides into size groups. Giant-cap stocks are defined as those that account for the top 40% of the capitalization of each style zone; large-cap stocks represent the next 30%; mid-cap stocks the next 20%; small-cap stocks the next 7%; micro-cap stocks the smallest 3%. The Royce Funds is a service mark of The Royce Funds. Distributor: Royce Fund Services, LLC.
Forward-Looking Statements
This material contains forward-looking statements within the meaning of the Securities Exchange Act of 1934, as amended (the “Exchange Act”), that involve risks and uncertainties, including, among others, statements as to:
| • | | the Funds’ future operating results |
| • | | the prospects of the Funds’ portfolio companies |
| • | | the impact of investments that the Funds have made or may make |
| • | | the dependence of the Funds’ future success on the general economy and its impact on the companies and industries in which the Funds invest, and |
| • | | the ability of the Funds’ portfolio companies to achieve their objectives. |
This Review and Report uses words such as “anticipates,” “believes,” “expects,” “future,” “intends,” and similar expressions to identify forward-looking statements. Actual results may differ materially from those projected in the forward-looking statements for any reason.
The Royce Funds have based the forward-looking statements included in this Review and Report on information available to us on the date of the report, and we assume no obligation to update any such forward-looking statements. Although The Royce Funds undertake no obligation to revise or update any forward-looking statements, whether as a result of new information, future events or otherwise, you are advised to consult any additional disclosures that we may make through future stockholder communications or reports.
Authorized Share Transactions
Royce Global Value Trust, Royce Micro-Cap Trust, and Royce Value Trust may each repurchase up to 5% of the issued and outstanding shares of its respective common stock during the year ending December 31, 2019. Any such repurchases would take place at then prevailing prices in the open market or in other transactions. Common stock repurchases would be effected at a price per share that is less than the share’s then current net asset value.
Royce Global Value Trust, Royce Micro-Cap Trust, and Royce Value Trust are also authorized to offer their common stockholders an opportunity to subscribe for additional shares of their common stock through rights offerings at a price per share that may be less than the share’s then current net asset value. The timing and terms of any such offerings are within each Board’s discretion.
Annual Certifications
As required, the Funds have submitted to the New York Stock Exchange (“NYSE”) for the annual certification of the Funds’ Chief Executive Officer that he is not aware of any violation of the NYSE’s listing standards. The Funds also have included the certification of the Funds’ Chief Executive Officer and Chief Financial Officer required by section 302 of the Sarbanes-Oxley Act of 2002 as exhibits to the Funds’ form N-CSR for the period ended December 31, 2016, filed with the Securities and Exchange Commission.
Proxy Voting
A copy of the policies and procedures that The Royce Funds use to determine how to vote proxies relating to portfolio securities and information regarding how each of The Royce Funds voted proxies relating to portfolio securities during the most recent 12-month period ended June 30 is available, without charge, on The Royce Funds’ website at www.roycefunds.com, by calling (800) 221-4268 (toll-free) and on the website of the Securities and Exchange Commission (“SEC”), at www.sec.gov.
Form N-Q Filing
The Funds file their complete schedules of investments with the SEC for the first and third quarters of each fiscal year on Form N-Q. The Funds’ Forms N-Q are available on the SEC’s website at www.sec.gov. The Royce Funds’ holdings are also on the Funds’ website approximately 15 to 20 days after each calendar quarter end and remain available until the next quarter’s holdings are posted. The Funds’ Forms N-Q may also be reviewed and copied at the SEC’s Public Reference Room in Washington, D.C. To find out more about this public service, call the SEC at (800) 732-0330. The Funds’ complete schedules of investments are updated quarterly, and are available at www.roycefunds.com.
64 | 2018 Annual Report to Stockholders
Board Approval of Investment Advisory Agreement
At meetings held on September 25-26, 2018, the Board of Directors (the “Board”) of Royce Global Value Trust, Inc. (“RGT”), including all of the non-interested directors, approved an amended and restated investment advisory agreement (the “Amended and Restated Agreement”) between Royce & Associates, LP (“R&A”) and RGT. The Amended and Restated Agreement is identical in all respects to the investment advisory agreement (the “Original Agreement”) between R&A and RGT that was approved by the Board at meetings held on June 4-5, 2018 except that the Amended and Restated Agreement contains a lower investment advisory fee rate than the Original Agreement. A description of the material factors and the conclusions with respect thereto that formed the basis for the Board’s approval of the Original Agreement is included in RGT’s Semiannual Report to the Shareholders for the six-month period ended June 30, 2018.
2018 Annual Report to Stockholders | 65
Results of Stockholders Meeting
Royce Value Trust, Inc.
At the 2018 Annual Meeting of Stockholders held on September 24, 2018, the Fund’s stockholders elected three Directors, consisting of:
| | | VOTES FOR | | VOTES WITHHELD |
| |
| Charles M. Royce | | 82,337,951 | | 2,012,841 |
| |
| G. Peter O’Brien | | 81,691,931 | | 2,658,860 |
| |
| David L. Meister | | 81,382,762 | | 2,968,030 |
| |
| | | | | |
| Royce Micro-Cap Trust, Inc. | | | | |
| At the 2018 Annual Meeting of Stockholders held on September 24, 2018, the Fund’s stockholders elected three Directors, consisting of: |
| | | | | |
| | | VOTES FOR | | VOTES WITHHELD |
| |
| Charles M. Royce | | 35,311,634 | | 352,959 |
| |
| G. Peter O’Brien | | 35,169,450 | | 495,143 |
| |
| David L. Meister | | 35,067,865 | | 596,729 |
| |
| | | | | |
| Royce Global Value Trust, Inc. | | | | |
| At the 2018 Annual Meeting of Stockholders held on September 24, 2018, the Fund’s stockholders elected three Directors, consisting of: |
| | | | | |
| | | VOTES FOR | | VOTES WITHHELD |
| |
| Charles M. Royce | | 8,122,013 | | 1,061,328 |
| |
| G. Peter O’Brien | | 8,107,392 | | 1,075,949 |
| |
| David L. Meister | | 8,062,305 | | 1,121,036 |
| |
66 | 2018 Annual Report to Stockholders
This page is intentionally left blank.
This page is intentionally left blank.
68 | This page is not part of the 2018 Annual Report to Stockholders
| | | | | | |
| |
 | |
| | | | | | |
| | | | | | |
| | | | | | |
| | About The Royce Funds | | | Contact Us | |
| | | | | | |
| | | | | | |
| | Unparalleled Knowledge + Experience
Pioneers in small-cap investing, with 40+ years of experience, depth of knowledge, and focus.
Independent Thinking
The confidence to go against consensus, the insight to uncover opportunities others might miss, and the tenacity to stay the course through market cycles.
Specialized Approaches
Strategies that use value, core, or growth investment approaches to select micro-cap, small-cap, and mid-cap companies.
Unwavering Commitment
Our team of 18 portfolio managers have significant personal investments in the strategies they manage. | | | GENERAL INFORMATION
General Royce Funds information including an overview of our firm and Funds
(800) 221-4268
COMPUTERSHARE
Transfer Agent and Registrar
Speak with a representative about:
• Your account, transactions, and forms
(800) 426-5523
FINANCIAL ADVISORS AND BROKER-DEALERS
Speak with your regional Royce contact regarding:
• Information about our firm, strategies, and Funds
• Fund Materials
(800) 337-6923 | |
| | | | | |
| | | | | |
| | | | | | |
| | | | | | |
| |
| | | | | | |
| | | | | | |
| | | | | | |
| | | | | | |
| | | | | | |
| |  | | |  |  |
| | | | | | |
| | | | | | |
Item 2. Code(s) of Ethics. As of the end of the period covered by this report, the Registrant had adopted a code of ethics, as defined in Item 2 of Form N-CSR, applicable to its principal executive officer, principal financial officer, principal accounting officer or controller, or persons performing similar functions. A copy of this code of ethics is filed as an exhibit to this Form N-CSR. No substantive amendments were approved or waivers were granted to this code of ethics during the period covered by this report.
Item 3. Audit Committee Financial Expert.
| (a)(1) | | | The Board of Directors of the Registrant has determined that it has an audit committee financial expert. |
| | | | |
| (a)(2) | | | Arthur S. Mehlman and Patricia W. Chadwick were designated by the Board of Directors as the Registrant’s Audit Committee Financial Experts, effective April 15, 2004 and April 8, 2010, respectively. Mr. Mehlman and Ms. Chadwick are “independent” as defined under Item 3 of Form N-CSR. |
| Item 4. | | Principal Accountant Fees and Services. |
| | | |
| (a) | | Audit Fees: |
| | | Year ended December 31, 2018 - $45,710 |
| | | Year ended December 31, 2017 - $44,814 |
| | | |
| (b) | | Audit-Related Fees: |
| | | Year ended December 31, 2018 - $0 |
| | | Year ended December 31, 2017 - $0 |
| | | |
| (c) | | Tax Fees: |
| | | Year ended December 31, 2018 - $9,738 - Preparation of tax returns |
| | | Year ended December 31, 2017 - $9,550 - Preparation of tax returns |
| | | |
| (d) | | All Other Fees: |
| | | Year ended December 31, 2018 - $0 |
| | | Year ended December 31, 2017 - $0 |
(e)(1) Annual Pre-Approval: On an annual basis, the Registrant’s independent auditor submits to the Audit Committee a schedule of proposed audit, audit-related, tax and other non-audit services to be rendered to the Registrant and/or investment adviser(s) for the following year that require pre-approval by the Audit Committee. This schedule provides a description of each type of service that is expected to require pre-approval and the maximum fees that can be paid for each such service without further Audit Committee approval. The Audit Committee then reviews and determines whether to approve the types of scheduled services and the projected fees for them. Any subsequent revision to already pre-approved services or fees (including fee increases) are presented for consideration at the next regularly scheduled Audit Committee meeting, as needed.
If subsequent to the annual pre-approval of services and fees by the Audit Committee, the Registrant or one of its affiliates determines that it would like to engage the Registrant’s independent auditor to perform a service not already pre-approved, the request is to be submitted to the Registrant’s Chief Financial Officer, and if he or she determines that the service fits within the independence guidelines (e.g., it is not a prohibited service), he or she will then arrange for a discussion of the proposed service and fee to be included on the agenda for the next regularly scheduled Audit Committee meeting so that pre-approval can be considered.
Interim Pre-Approval: If, in the judgment of the Registrant’s Chief Financial Officer, a proposed engagement needs to commence before the next regularly scheduled Audit Committee meeting, he or she shall submit a written summary of the proposed engagement to all members of the Audit Committee, outlining the services, the estimated maximum cost, the category of the services (e.g., audit, audit-related, tax or other) and the rationale for engaging the Registrant’s independent auditor to perform the services. To the extent the proposed engagement involves audit, audit-related or tax services, any individual member of the Audit Committee who is an independent Board member is authorized to pre-approve the engagement. To the extent the proposed engagement involves non-audit services other than audit-related or tax, the Chairman of the Audit Committee is authorized to pre-approve the engagement. The Registrant’s Chief Financial Officer will arrange for this interim review and
coordinate with the appropriate member(s) of the Committee. The independent auditor may not commence the engagement under consideration until the Registrant’s Chief Financial Officer has informed the auditor in writing that pre-approval has been obtained from the Audit Committee or an individual member who is an independent Board member. The member of the Audit Committee who pre-approves any engagements in between regularly scheduled Audit Committee meetings is to report, for informational purposes only, any pre-approval decisions to the Audit Committee at its next regularly scheduled meeting.
| (e)(2) | | Not Applicable |
| | | |
| (f) | | Not Applicable |
| | | |
| (g) | | Year ended December 31, 2018 - $9,738 |
| | | Year ended December 31, 2017 - $9,550 |
| | | |
| (h) | | No such services were rendered during 2018 or 2017. |
Item 5. Audit Committee of Listed Registrants. The Registrant has a separately designated standing audit committee established in accordance with Section 3(a)(58)(A) of the Securities Exchange Act of 1934. Patricia W. Chadwick, Christopher C. Grisanti, Stephen L. Isaacs, Arthur S. Mehlman, David L. Meister, G. Peter O’Brien, and Michael K. Shields are members of the Registrant’s audit committee.
Item 6. Investments.
(a) See Item 1.
(b) Not applicable.
Item 7. Disclosure of Proxy Voting Policies and Procedures for Closed-End Management Investment Companies.
Royce & Associates, LP (“Royce”) has adopted written proxy voting policies and procedures (the “Proxy Voting Procedures”) for itself and client accounts for which Royce is responsible for voting proxies. Royce is generally granted proxy voting authority at the inception of its management of each client account. Proxy voting authority is generally either (i) specifically authorized in the applicable investment management agreement or other instrument; or (ii) where not specifically authorized, is granted to Royce where general investment discretion is given to Royce in the applicable investment management agreement. In voting proxies, Royce is guided by general fiduciary principles. Royce’s goal is to act prudently, solely in the best interest of the beneficial owners of the accounts it manages. Royce attempts to consider all factors of its vote that could affect the value of the investment and will vote proxies in the manner it believes will be consistent with efforts to enhance and/or protect stockholder value.
Royce’s personnel are responsible for monitoring receipt of all proxies and seeking to ensure that proxies are received for all securities for which Royce has proxy voting authority. Royce is not responsible for voting proxies it does not receive. Royce divides proxies into “regularly recurring” and “non-regularly recurring” matters. Examples of regularly recurring matters include non-contested elections of directors and non-contested approvals of independent auditors. Royce’s personnel are responsible for developing and maintaining a list of matters Royce treats as “regularly recurring” and for ensuring that instructions from a Royce Co-Chief Investment Officer are followed when voting those matters on behalf of Royce clients. Non-regularly recurring matters are all other proxy matters and are brought to the attention of the relevant portfolio manager(s) for the applicable account(s). After giving consideration to advisories provided by an independent third party research firm with respect to such non-regularly recurring matters, the portfolio manager(s) directs that such matters be voted in a way that he or she believes should better protect or enhance the value of the investment.
Certain Royce portfolio managers may provide instructions that they do not want regularly recurring matters to be voted in accordance with the standing instructions for their accounts and individual voting instructions on all matters, both regularly recurring and non-regularly recurring, will be obtained from such portfolio managers. Under certain circumstances, Royce may also vote against a proposal from the issuer’s board of directors or management. Royce’s portfolio managers decide these issues on a case-by-case basis. A portfolio manager of Royce
may, on occasion, decide to abstain from voting a proxy or a specific proxy item when such person concludes that the potential benefit of voting is outweighed by the cost or when it is not in the client’s best interest to vote.
There may be circumstances where Royce may not be able to vote proxies in a timely manner, including, but not limited to, (i) when certain securities are out on loan at the time of a record date; (ii) when administrative or operational constraints impede Royce’s ability to cast a timely vote, such as late receipt of proxy voting information; and/or (iii) when systems, administrative or processing errors occur (including errors by Royce or third party vendors).
To further Royce’s goal to vote proxies in the best interests of its client, Royce follows specific procedures outlined in the Proxy Voting Procedures to identify, assess and address material conflicts that may arise between Royce’s interests and those of its clients before voting proxies on behalf of such clients. In the event such a material conflict of interest is identified, the proxy will be voted by Royce in accordance with the recommendation given by an independent third party research firm.
You may obtain a copy of the Proxy Voting Procedures at www.roycefunds.com or by calling 212-508-4500. Additionally, you can obtain information on how your securities were voted by calling 212-508-4500.
Item 8. Portfolio Managers of Closed-End Management Investment Companies.
(a)(1) Portfolio Managers of Closed-End Management Investment Companies (information as of December 31, 2018)
| Name | Title | Length of Service | Principal Occupation(s) During Past 5 Years |
| Charles M. Royce | Portfolio Manager and
Member of the Board
of Directors of the
Registrant | Since 1986 | Chairman of the Board of Managers of Royce & Associates, LP (“Royce”), Member of the boards of directors/trustees of the Registrant, Royce Micro-Cap Trust, Inc. (“RMT”), Royce Global Value Trust, Inc. ,The Royce Fund , and Royce Capital Fund (collectively, “The Royce Funds”). |
| Chris E. Flynn | Assistant Portfolio Manager* | Since April 1, 2007 | Assistant Portfolio Manager of the Registrant (since April 1, 2007); and Principal, Portfolio Manager and Senior Analyst at Royce (since 1993). |
| Lauren A. Romeo | Assistant Portfolio Manager* | Since May 1, 2009 | Assistant Portfolio of the Registrant (since May 1, 2009); and Portfolio Manager and Analyst at Royce (since 2004). |
| Steven G. McBoyle | Assistant Portfolio Manager* | Since
September 1, 2018 | Assistant Portfolio Manager of the Registrant (since September 1, 2018); and Portfolio Manager at Royce (since 2007). |
| Andrew S. Palen | Assistant Portfolio Manager* | Since
September 1, 2018 | Assistant Portfolio Manager of the Registrant (since September 1, 2018); Portfolio Manager and Analyst at Royce (since 2015); Senior Analyst at Armistice Capital (2013-2015); Summer Associate at UBS Global Management (2012); and Associate at Comvest Partners (2008-2011). |
* Assistant Portfolio Managers may have investment discretion over a portion of the Registrant’s portfolio subject to the supervision of Registrant’s Portfolio Manager.
(a)(2) Other Accounts Managed by Portfolio Manager and Potential Conflicts of Interest (information as of December 31, 2018)
Other Accounts
Name of Portfolio
Manager | Type of Account | Number of
Accounts
Managed | Total
Assets
Managed | Number of
Accounts
Managed for which
Advisory Fee is
Performance-Based | Value of
Managed
Accounts for
which
Advisory Fee is
Performance
Based |
| Charles M. Royce | | | | | |
| | Registered investment companies | 8 | $6,710,543,729 | 2 | 1,649,606,030 |
| | Private pooled investment vehicles | 2 | 69,218,296 | - | - |
| | Other accounts* | 12 | 46,156,691 | - | - |
| | | | | | |
| Chris E. Flynn | | | | | |
| | Registered investment companies | 5 | 4,811,285,789 | 2 | 1,649,606,030 |
| | Private pooled investment vehicles | 1 | 69,036,808 | - | - |
| | Other accounts* | - | - | - | - |
| | | | | | |
| Lauren A. Romeo | | | | | |
| | Registered investment companies | 4 | 4,607,909,924 | 1 | 1,304,106,885 |
| | Private pooled investment vehicles | 4 | 310,093,004 | - | - |
| | Other accounts* | - | - | - | - |
| | | | | | |
| Steven G. McBoyle | | | | | |
| | Registered investment companies | 5 | 4,374,739,904 | 1 | 1,304,106,885 |
| | Private pooled investment vehicles | 10 | 455,238,258 | - | - |
| | Other accounts* | | | | |
| Andrew S. Palen | | | | | |
| | Registered investment companies | 2 | 2,883,191,052 | 1 | 1,304,106,885 |
| | Private pooled investment vehicles | - | - | - | - |
| | Other accounts* | | | | |
*Other accounts include all other accounts managed by the Portfolio Manager in either a professional or personal capacity except for personal accounts subject to pre-approval and reporting requirements under the Registrant’s Rule 17j-1 Code of Ethics.
Conflicts of Interest
The fact that a Portfolio Manager has day-to-day management responsibility for more than one client account may create actual, potential or only apparent conflicts of interest. For example, the Portfolio Manager may have an opportunity to purchase securities of limited availability. In this circumstance, the Portfolio Manager is expected to review each account’s investment guidelines, restrictions, tax considerations, cash balances, liquidity needs and other factors to determine the suitability of the investment for each account and to ensure that his or her managed accounts are treated equitably. The Portfolio Manager may also decide to purchase or sell the same security for multiple managed accounts at approximately the same time. To address any conflicts that this situation may create, the Portfolio Manager will generally combine managed account orders (i.e., enter a “bunched” order) in an effort to obtain best execution or a more favorable commission rate. In addition, if orders to buy or sell a security for multiple accounts managed by common Portfolio Managers on the same day are executed at different prices or commission rates, the transactions will generally be allocated by Royce to each of such managed accounts at the weighted average execution price and commission. In circumstances where a pre-allocated bunched order is not completely filled, each account will normally receive a pro-rated portion of the securities based upon the account’s level of participation in the order. Royce may under certain circumstances allocate securities in a manner other than pro-rata if it determines that the allocation is fair and equitable under the circumstances and does not discriminate against any account.
As described below, there is a revenue-based component of each Portfolio Manager’s Performance-Related Variable Compensation and the Portfolio Managers also receive Firm-Related Variable Compensation based on revenues (adjusted for certain imputed expenses) generated by Royce. In addition, Charles M. Royce receives variable compensation based on Royce’s retained pre-tax profits from operations. As a result, the Portfolio Managers may receive a greater relative benefit from activities that increase the value to Royce of The Royce Funds and/or other Royce client accounts, including, but not limited to, increases in sales of Registrant’s shares and assets under management.
Also, as described above, the Portfolio Managers generally manage more than one client account, including, among others, registered investment company accounts, separate accounts and private pooled accounts managed on behalf of institutions (e.g., pension funds, endowments and foundations) and for high-net-worth individuals. The appearance of a conflict of interest may arise where Royce has an incentive, such as a performance-based management fee (or any other variation in the level of fees payable by the Registrant or other Royce client accounts to Royce), which relates to the management of one or more of The Royce Funds or accounts with respect to which the same Portfolio Manager has day-to-day management responsibilities. Except as described below, no Royce Portfolio Manager’s compensation is tied to performance fees earned by Royce for the management of any one client account. Although variable and other compensation derived from Royce revenues or profits is impacted to some extent, the impact is relatively minor given the small percentage of Royce firm assets under management for which Royce receives performance-measured revenue. Notwithstanding the above, the Performance-Related Variable Compensation paid to Charles M. Royce as Portfolio Manager of two registered investment company accounts (the Registrant and RMT) is based, in part, on performance-based fee revenues. The Registrant and RMT pay Royce a fulcrum fee that is adjusted up or down depending on the performance of the Fund relative to its benchmark index.
Finally, conflicts of interest may arise when a Portfolio Manager personally buys, holds or sells securities held or to be purchased or sold for the Registrant or other Royce client account or personally buys, holds or sells the shares of one or more of The Royce Funds. To address this, Royce has adopted a written Code of Ethics designed to prevent and detect personal trading activities that may interfere or conflict with client interests (including Registrant’s stockholders’ interests). Royce generally does not permit its Portfolio Managers to purchase small- or micro-cap securities for their personal investment portfolios.
Royce and The Royce Funds have adopted certain compliance procedures which are designed to address the above-described types of conflicts. However, there is no guarantee that such procedures will detect each and every situation in which a conflict arises.
(a)(3) Description of Portfolio Manager Compensation Structure (information as of December 31, 2018)
Royce seeks to maintain a compensation program that is competitively positioned to attract and retain high-caliber investment professionals. All Portfolio Managers, receive from Royce a base salary, Portfolio-Related Variable Compensation (generally the largest element of each Portfolio Manager’s compensation with the exception of Charles M. Royce), Firm-Related Variable Compensation based primarily on registered investment company and other client account revenues generated by Royce and a benefits package. Portfolio Manager compensation is reviewed and may be modified from time to time as appropriate to reflect changes in the market, as well as to adjust the factors used to determine variable compensation. Except as described below, each Portfolio Manager’s compensation consists of the following elements:
| - | | BASE SALARY. Each Portfolio Manager is paid a base salary. In setting the base salary, Royce seeks to be competitive in light of the particular Portfolio Manager’s experience and responsibilities. |
| | | |
| - | | PORTFOLIO-RELATED VARIABLE COMPENSATION. Each Portfolio Manager receives quarterly Portfolio-Related Variable Compensation that is either asset-based, or revenue-based and therefore in part based on the value of the net assets of the account for which he or she is being compensated, determined with reference to each of the registered investment company and other client accounts they are managing. The revenue used to determine the quarterly Portfolio-Related Variable Compensation received by Charles M. Royce that relates to each of RMT and RVT is performance-based fee revenue. |
Payment of the Portfolio-Related Variable Compensation may be deferred, and any amounts deferred are forfeitable, if the Portfolio Manager is terminated by Royce with or without cause or resigns. The amount of the deferred Portfolio-Related Variable Compensation will appreciate or depreciate during the deferral period, based on the total return performance of one or more Royce-managed registered investment company accounts selected by the Portfolio Manager at the beginning of the deferral period. The amount deferred will depend on the Portfolio Manager’s total direct, indirect beneficial and deferred unvested investments in the Royce registered investment company accounts for which he or she is receiving portfolio management compensation.
| - | | FIRM-RELATED VARIABLE COMPENSATION. Portfolio Managers receive quarterly variable compensation based on Royce’s net revenues. |
| | | |
| - | | BENEFIT PACKAGE. Portfolio Managers also receive benefits standard for all Royce employees, including health care and other insurance benefits, and participation in Royce’s 401(k) Plan and Money Purchase Pension Plan. From time to time, on a purely discretionary basis, Portfolio Managers may also receive options to acquire stock in Royce’s parent company, Legg Mason, Inc. Those options typically represent a relatively small portion of a Portfolio Manager’s overall compensation. |
(a)(4) Dollar Range of Equity Securities in Registrant Beneficially Owned by Portfolio Manager (information as of December 31, 2018)
The following table shows the dollar range of the Registrant’s shares owned beneficially and of record by the Portfolio Managers, including investments by his immediate family members sharing the same household and amounts invested through retirement and deferred compensation plans.
| Portfolio Manager | Dollar Range of Registrant’s Shares Beneficially Owned |
| Charles M. Royce | Over $1,000,000 |
| Chris E. Flynn | $100,001 to $500,000 |
| Lauren A. Romeo | $100,001 to $500,000 |
| Steven G. McBoyle | $0 |
| Andrew S. Palen | $0 |
(b) Not Applicable
Item 9. Purchases of Equity Securities by Closed-End Management Investment Company and Affiliated Purchasers. Not Applicable
Item 10. Submission of Matters to a Vote of Security Holders. Not Applicable.
Item 11. Controls and Procedures.
(a) Disclosure Controls and Procedures. The Principal Executive and Financial Officers concluded that the Registrant’s Disclosure Controls and Procedures are effective based on their evaluation of the Disclosure Controls and Procedures as of a date within 90 days of the filing date of this report.
(b) Internal Control over Financial Reporting. There were no significant changes in Registrant’s internal control over financial reporting or in other factors that could significantly affect this control subsequent to the date of the evaluation, including any corrective actions with regard to significant deficiencies and material weaknesses during the second fiscal quarter of the period covered by this report.
Item 12. Exhibits. Attached hereto.
(a)(1) The Registrant’s code of ethics pursuant to Item 2 of Form N-CSR.
(a)(2) Separate certifications by the Registrant’s Principal Executive Officer and Principal Financial Officer as required by Rule 30a-2(a) under the Investment Company Act of 1940.
(a)(3) Not Applicable
(b) Separate certifications by the Registrant’s Principal Executive Officer and Principal Financial Officer, pursuant to Section 906 of the Sarbanes-Oxley Act of 2002 and required by Rule 30a-2(b) under the Investment Company Act of 1940.
Pursuant to the requirements of the Securities Exchange Act of 1934 and the Investment Company Act of 1940, the registrant has duly caused this report to be signed on its behalf by the undersigned, thereunto duly authorized.
ROYCE VALUE TRUST, INC.
| BY: | /s/ Christopher D. Clark |
| | Christopher D. Clark |
| | President |
| | |
| Date: | March 4, 2019 |
Pursuant to the requirements of the Securities Exchange Act of 1934 and the Investment Company Act of 1940, this report has been signed below by the following persons on behalf of the registrant and in the capacities and on the dates indicated.
| ROYCE VALUE TRUST, INC. | | ROYCE VALUE TRUST, INC. |
| | | | | | | |
| BY: | | /s/ Christopher D. Clark | | BY: | | /s/ Peter K. Hoglund |
| | | Christopher D. Clark | | | | Peter K. Hoglund |
| | | President | | | | Treasurer |
| | | | | | | |
| Date: | | March 4, 2019 | | Date: | | March 4, 2019 |