UNITED STATES
SECURITIES AND EXCHANGE COMMISSION
Washington, D.C. 20549
FORM N-CSRS
CERTIFIED SHAREHOLDER REPORT OF REGISTERED
MANAGEMENT INVESTMENT COMPANIES
Investment Company Act File Number 811-04878
SEI Institutional Managed Trust
SEI Investments
One Freedom Valley Drive
Oaks, PA 19456
(Address of principal executive offices) (Zip code)
c/o CT Corporation
155 Federal Street
Boston, MA 02110
(Name and address of agent for service)
Registrant’s telephone number, including area code: 1-800-342-5734
Date of fiscal year end: September 30, 2015
Date of reporting period: March 31, 2015
| Item 1. | Reports to Stockholders. |

March 31, 2015
SEMI-ANNUAL REPORT
SEI Institutional Managed Trust
† Large Cap Fund
† Large Cap Value Fund
† Large Cap Growth Fund
† Tax-Managed Large Cap Fund
† S&P 500 Index Fund
† Small Cap Fund
† Small Cap Value Fund
† Small Cap Growth Fund
† Tax-Managed Small/Mid Cap Fund
† Mid-Cap Fund
† U.S. Managed Volatility Fund
† Global Managed Volatility Fund
† Tax-Managed Managed Volatility Fund
† Real Estate Fund
† Enhanced Income Fund
† Core Fixed Income Fund
† U.S. Fixed Income Fund
† High Yield Bond Fund
† Real Return Fund
† Multi-Strategy Alternative Fund
† Multi-Asset Accumulation Fund
† Multi-Asset Income Fund
† Multi-Asset Inflation Managed Fund
† Multi-Asset Capital Stability Fund
† Long/Short Alternative Fund

The Trust files its complete schedule of portfolio holdings with the Securities and Exchange Commission (“Commission”) for the first and third quarters of each fiscal year on Form N-Q within sixty days after period end. The Trust’s Form N-Q is available on the Commission’s website at http://www.sec.gov, and may be reviewed and copied at the Commission’s Public Reference Room in Washington, DC. Information on the operation of the Public Reference Room may be obtained by calling 1-800-SEC-0330.
A description of the policies and procedures that the Trust uses to determine how to vote proxies relating to portfolio securities, as well as information relating to how a Fund voted proxies relating to portfolio securities during the most recent 12-month period ended June 30, is available (i) without charge, upon request, by calling 1-800-DIAL-SEI; and (ii) on the Commission’s website at http://www.sec.gov.
SUMMARY SCHEDULE OF INVESTMENTS (Unaudited)
Large Cap Fund
March 31, 2015
| Description | Percentage of Net Assets (%) | Shares | Market Value ($ Thousands) | |||||||||
COMMON STOCK (A) — 94.8% |
| |||||||||||
Consumer Discretionary — 13.1% |
| |||||||||||
Amazon.com, Cl A* | 0.7 | % | 52,857 | $ | 19,668 | |||||||
Home Depot | 0.6 | 139,340 | 15,830 | |||||||||
Liberty Media - Interactive, | 0.7 | 644,500 | 18,813 | |||||||||
Starbucks | 0.8 | 227,516 | 21,546 | |||||||||
TripAdvisor* | 0.8 | 265,941 | 22,118 | |||||||||
Whirlpool | 0.6 | 86,360 | 17,450 | |||||||||
Other Securities | 8.9 | 252,023 | ||||||||||
|
| |||||||||||
| 367,448 | ||||||||||||
|
| |||||||||||
Consumer Staples — 8.3% |
| |||||||||||
Costco Wholesale | 0.8 | 139,058 | 21,067 | |||||||||
Kroger | 0.5 | 198,900 | 15,248 | |||||||||
Walgreens Boots Alliance (A) | 0.7 | 234,796 | 19,882 | |||||||||
Other Securities | 6.3 | 178,515 | ||||||||||
|
| |||||||||||
| 234,712 | ||||||||||||
|
| |||||||||||
Energy — 6.8% |
| |||||||||||
Exxon Mobil | 1.0 | 328,900 | 27,956 | |||||||||
Valero Energy | 0.8 | 335,400 | 21,338 | |||||||||
Other Securities | 5.0 | 143,054 | ||||||||||
|
| |||||||||||
| 192,348 | ||||||||||||
|
| |||||||||||
Financials — 14.3% |
| |||||||||||
American International Group | 0.6 | 319,460 | 17,503 | |||||||||
Capital One Financial | 0.6 | 227,370 | 17,921 | |||||||||
Charles Schwab | 0.6 | 595,840 | 18,137 | |||||||||
Citigroup | 1.4 | 736,780 | 37,959 | |||||||||
Crown Castle International† | 0.6 | 193,775 | 15,994 | |||||||||
JPMorgan Chase | 1.1 | 520,600 | 31,538 | |||||||||
Travelers | 0.7 | 183,380 | 19,829 | |||||||||
Wells Fargo | 0.6 | 326,000 | 17,734 | |||||||||
Other Securities | 8.1 | 225,953 | ||||||||||
|
| |||||||||||
| 402,568 | ||||||||||||
|
| |||||||||||
| Description | Percentage of Net Assets (%) | Shares | Market Value ($ Thousands) | |||||||||
Health Care — 16.8% |
| |||||||||||
Actavis* | 1.1 | % | 102,560 | $ | 30,524 | |||||||
Anthem | 0.8 | 141,580 | 21,861 | |||||||||
Biogen* | 0.9 | 63,530 | 26,825 | |||||||||
Bristol-Myers Squibb | 0.8 | 333,013 | 21,479 | |||||||||
Celgene, Cl A* | 1.1 | 261,250 | 30,117 | |||||||||
Express Scripts Holding* | 1.0 | 308,304 | 26,751 | |||||||||
Gilead Sciences* | 0.6 | 186,778 | 18,328 | |||||||||
Humana | 0.9 | 138,990 | 24,743 | |||||||||
Intuitive Surgical* | 0.6 | 30,487 | 15,397 | |||||||||
Pfizer | 0.6 | 499,357 | 17,373 | |||||||||
United Therapeutics* | 0.6 | 92,080 | 15,878 | |||||||||
Valeant Pharmaceuticals International* | 0.5 | 77,012 | 15,296 | |||||||||
Other Securities | 7.3 | 209,285 | ||||||||||
|
| |||||||||||
| 473,857 | ||||||||||||
|
| |||||||||||
Industrials — 7.4% |
| |||||||||||
Northrop Grumman | 0.8 | 131,500 | 21,166 | |||||||||
Southwest Airlines, Cl A | 0.5 | 341,060 | 15,109 | |||||||||
Stericycle, Cl A* | 0.5 | 109,828 | 15,423 | |||||||||
Other Securities | 5.6 | 157,137 | ||||||||||
|
| |||||||||||
| 208,835 | ||||||||||||
|
| |||||||||||
Information Technology — 21.7% |
| |||||||||||
Adobe Systems* | 0.7 | 258,530 | 19,116 | |||||||||
Apple | 1.3 | 297,116 | 36,970 | |||||||||
Applied Materials | 0.7 | 811,160 | 18,300 | |||||||||
Cisco Systems | 0.7 | 668,800 | 18,409 | |||||||||
Cognizant Technology Solutions, Cl A* | 0.8 | 343,635 | 21,440 | |||||||||
eBay* | 0.7 | 356,725 | 20,576 | |||||||||
Equinix | 0.6 | 75,842 | 17,660 | |||||||||
Google, Cl A* | 0.8 | 40,773 | 22,617 | |||||||||
Google, Cl C* | 0.7 | 33,660 | 18,446 | |||||||||
Intel | 0.6 | 566,500 | 17,714 | |||||||||
MasterCard, Cl A | 1.1 | 360,810 | 31,170 | |||||||||
Microsoft | 1.2 | 836,220 | 33,996 | |||||||||
Qualcomm | 0.9 | 363,117 | 25,178 | |||||||||
Visa, Cl A | 1.4 | 612,352 | 40,054 | |||||||||
Western Digital | 0.6 | 179,700 | 16,354 | |||||||||
Other Securities | 8.9 | 251,543 | ||||||||||
|
| |||||||||||
| 609,543 | ||||||||||||
|
| |||||||||||
Materials — 2.7% |
| |||||||||||
Other Securities | 2.7 | 76,634 | ||||||||||
|
| |||||||||||
Telecommunication Services — 1.1% |
| |||||||||||
AT&T | 0.6 | 489,040 | 15,967 | |||||||||
Other Securities | 0.5 | 14,261 | ||||||||||
|
| |||||||||||
| 30,228 | ||||||||||||
|
| |||||||||||
| SEI Institutional Managed Trust / Semi-Annual Report / March 31, 2015 | 1 |
SUMMARY SCHEDULE OF INVESTMENTS (Unaudited)
Large Cap Fund (Concluded)
March 31, 2015
| Description | Percentage of Net Assets (%) | Shares | Market Value ($ Thousands) | |||||||||
Utilities — 2.6% |
| |||||||||||
Other Securities | 2.6 | % | $ | 74,121 | ||||||||
|
| |||||||||||
Total Common Stock |
| 2,670,294 | ||||||||||
|
| |||||||||||
AFFILIATED PARTNERSHIP — 1.0% |
| |||||||||||
SEI Liquidity Fund, L.P. | 1.0 | 27,906,646 | 27,907 | |||||||||
|
| |||||||||||
Total Affiliated Partnership |
| 27,907 | ||||||||||
|
| |||||||||||
CASH EQUIVALENTS — 4.8% |
| |||||||||||
SEI Daily Income Trust, | 4.6 | 128,624,068 | 128,624 | |||||||||
Other Securities | 0.2 | 6,300 | ||||||||||
|
| |||||||||||
Total Cash Equivalents |
| 134,924 | ||||||||||
|
| |||||||||||
U.S. TREASURY OBLIGATIONS (C) — 0.2% |
| |||||||||||
Other Securities | 0.2 | 6,607 | ||||||||||
|
| |||||||||||
Total U.S. Treasury Obligations |
| 6,607 | ||||||||||
|
| |||||||||||
Total Investments — 100.8% |
| $ | 2,839,732 | |||||||||
|
| |||||||||||
A list of the open futures contracts held by the Fund at March 31, 2015, is as follows:
| Type of Contract | Number of Contracts Long | Expiration Date | Unrealized Appreciation ($ Thousands) | |||||||||
S&P 500 Index EMINI | 549 | Jun-2015 | $ | 621 | ||||||||
S&P Mid 400 Index EMINI | 50 | Jun-2015 | 179 | |||||||||
|
| |||||||||||
| $ | 800 | |||||||||||
|
| |||||||||||
For the period ended March 31, 2015, the total amount of all open futures contracts, as presented in the table above, are representative of the volume of activity for this derivative type during the period.
Percentages are based on Net Assets of $2,817,376 ($Thousands)
| * | Non-income producing security. |
| ** | Rate shown is the 7-day effective yield as of March 31, 2015. |
| † | Real Estate Investment Trust. |
| †† | Investment in Affiliated Security (see Note 6). |
| (A) | Certain securities or partial positions of certain securities are on loan at March 31, 2015 (see note 10). The total market value of such securities on loan at March 31, 2015 was $26,772 ($Thousands). |
| (B) | This security was purchased with cash collateral held from securities on loan (see note 10). The total market value of such securities as of March 31, 2015 was $27,907 ($Thousands). |
| (C) | Security, or portion thereof, as been pledged as collateral on open future contracts. |
Cl — Class
L.P. — Limited Partnership
S&P — Standard and Poor’s
The Summary Schedule of Investments does not reflect the complete portfolio holdings. It includes the Fund’s 50 largest holdings and each investment of any issuer that exceeds 1% of the Fund’s net assets. “Other Securities” represent all issues not required to be disclosed under the rules adopted by the U.S. Securities and Exchange Commission (“SEC”). In certain instances, securities for which footnotes listed above may otherwise apply are included in the Other Securities caption. The complete schedule of portfolio holdings is available (i) without charge, upon request, by calling (800) 342-5734; and (ii) on the SEC’s website at http://www.sec.gov.
The following is a summary of the inputs used as of March 31, 2015, in valuing the Fund’s investments carried at value ($ Thousands):
| Investments in Securities | Level 1 | Level 2 | Level 3 | Total | ||||||||||||
Common Stock | $ | 2,670,294 | $ | — | $ | — | $ | 2,670,294 | ||||||||
Affiliated Partnership | — | 27,907 | — | 27,907 | ||||||||||||
Cash Equivalents | 134,924 | — | — | 134,924 | ||||||||||||
U.S. Treasury Obligations | — | 6,607 | — | 6,607 | ||||||||||||
|
|
|
|
|
|
|
| |||||||||
Total Investments in Securities | $ | 2,805,218 | $ | 34,514 | $ | — | $ | 2,839,732 | ||||||||
|
|
|
|
|
|
|
| |||||||||
| Other Financial Instruments | Level 1 | Level 2 | Level 3 | Total | ||||||||||||
Futures Contracts* | ||||||||||||||||
Unrealized Appreciation | $ | 800 | $ | — | $ | — | $ | 800 | ||||||||
|
|
|
|
|
|
|
| |||||||||
Total Other Financial Instruments | $ | 800 | $ | — | $ | — | $ | 800 | ||||||||
|
|
|
|
|
|
|
| |||||||||
| * | Futures contracts are valued at unrealized appreciation on the instrument. |
For the period ended March 31, 2015, there were no transfers between Level 1 and Level 2 assets and liabilities.
For the period ended March 31, 2015, there were no transfers between Level 2 and Level 3 assets and liabilities.
For the period ended March 31, 2015, there were no Level 3 Investments.
For more information on valuation inputs, see Note 2 — Significant Accounting Policies in Notes to Financial Statements.
Amounts designated as “—” are $0 or have been rounded to $0.
The accompanying notes are an integral part of the financial statements.
| 2 | SEI Institutional Managed Trust / Semi-Annual Report / March 31, 2015 |
SUMMARY SCHEDULE OF INVESTMENTS (Unaudited)
Large Cap Value Fund
March 31, 2015
| Description | Percentage of Net Assets (%) | Shares | Market Value ($ Thousands) | |||||||||
COMMON STOCK (A) — 96.0%‡ |
| |||||||||||
Consumer Discretionary — 10.3% |
| |||||||||||
DIRECTV* | 0.6 | % | 114,800 | $ | 9,769 | |||||||
General Motors | 1.2 | 481,784 | 18,067 | |||||||||
Macy’s | 0.7 | 166,370 | 10,799 | |||||||||
Toyota Motor ADR (A) | 1.2 | 133,100 | 18,620 | |||||||||
Viacom, Cl B | 0.7 | 147,350 | 10,064 | |||||||||
Whirlpool | 0.6 | 45,380 | 9,170 | |||||||||
Other Securities | 5.3 | 80,377 | ||||||||||
|
| |||||||||||
| 156,866 | ||||||||||||
|
| |||||||||||
Consumer Staples — 4.5% |
| |||||||||||
Kroger | 0.6 | 115,360 | 8,843 | |||||||||
Other Securities | 3.9 | 60,469 | ||||||||||
|
| |||||||||||
| 69,312 | ||||||||||||
|
| |||||||||||
Energy — 11.4% |
| |||||||||||
BP ADR | 0.6 | 247,400 | 9,676 | |||||||||
Chevron | 1.2 | 179,010 | 18,792 | |||||||||
Cimarex Energy | 0.5 | 72,100 | 8,298 | |||||||||
Exxon Mobil | 1.7 | 306,770 | 26,075 | |||||||||
Halliburton | 0.7 | 255,600 | 11,216 | |||||||||
Marathon Petroleum | 0.8 | 116,875 | 11,967 | |||||||||
Tesoro | 0.5 | 91,030 | 8,310 | |||||||||
Valero Energy | 0.7 | 158,670 | 10,095 | |||||||||
Other Securities | 4.7 | 69,141 | ||||||||||
|
| |||||||||||
| 173,570 | ||||||||||||
|
| |||||||||||
Financials — 26.5% |
| |||||||||||
Allstate | 1.0 | 210,540 | 14,984 | |||||||||
American International Group | 0.7 | 201,010 | 11,013 | |||||||||
Bank of America | 1.0 | 1,018,900 | 15,681 | |||||||||
Berkshire Hathaway, | 0.6 | 61,928 | 8,937 | |||||||||
Capital One Financial | 0.6 | 112,950 | 8,903 | |||||||||
Citigroup | 2.8 | 821,160 | 42,306 | |||||||||
Everest Re Group | 0.7 | 61,090 | 10,630 | |||||||||
| Description | Percentage of Net Assets (%) | Shares | Market Value ($ Thousands) | |||||||||
Hartford Financial Services Group | 0.8 | % | 277,950 | $ | 11,624 | |||||||
JPMorgan Chase | 3.4 | 844,320 | 51,149 | |||||||||
KKR (A) | 0.6 | 378,100 | 8,624 | |||||||||
Lincoln National | 0.7 | 181,230 | 10,414 | |||||||||
MetLife | 1.4 | 413,500 | 20,902 | |||||||||
PNC Financial Services Group | 0.9 | 141,900 | 13,231 | |||||||||
Travelers | 0.6 | 92,110 | 9,960 | |||||||||
Wells Fargo | 1.7 | 464,100 | 25,247 | |||||||||
Other Securities | 9.0 | 140,835 | ||||||||||
|
| |||||||||||
| 404,440 | ||||||||||||
|
| |||||||||||
Health Care — 12.4% |
| |||||||||||
Aetna, Cl A | 0.8 | 111,970 | 11,928 | |||||||||
Anthem | 1.1 | 106,390 | 16,428 | |||||||||
Cigna | 0.6 | 65,360 | 8,460 | |||||||||
Merck | 0.7 | 180,200 | 10,358 | |||||||||
Pfizer | 2.3 | 1,013,800 | 35,270 | |||||||||
United Therapeutics* | 0.5 | 46,770 | 8,065 | |||||||||
Other Securities | 6.4 | 98,033 | ||||||||||
|
| |||||||||||
| 188,542 | ||||||||||||
|
| |||||||||||
Industrials — 10.1% |
| |||||||||||
American Airlines Group | 0.9 | 255,330 | 13,476 | |||||||||
Delta Air Lines, Cl A | 0.9 | 311,330 | 13,997 | |||||||||
Eaton | 0.6 | 147,500 | 10,021 | |||||||||
General Electric | 1.1 | 669,100 | 16,600 | |||||||||
Northrop Grumman | 0.7 | 66,380 | 10,684 | |||||||||
Other Securities | 5.9 | 89,254 | ||||||||||
|
| |||||||||||
| 154,032 | ||||||||||||
|
| |||||||||||
Information Technology — 10.0% |
| |||||||||||
Cisco Systems | 1.6 | 883,400 | 24,316 | |||||||||
Hewlett-Packard | 0.5 | 261,900 | 8,161 | |||||||||
Intel | 1.2 | 562,100 | 17,577 | |||||||||
Western Digital | 0.5 | 90,860 | 8,269 | |||||||||
Other Securities | 6.2 | 94,184 | ||||||||||
|
| |||||||||||
| 152,507 | ||||||||||||
|
| |||||||||||
Materials — 4.2% |
| |||||||||||
Eastman Chemical | 0.9 | 189,700 | 13,138 | |||||||||
Other Securities | 3.3 | 50,882 | ||||||||||
|
| |||||||||||
| 64,020 | ||||||||||||
|
| |||||||||||
Telecommunication Services — 3.1% |
| |||||||||||
AT&T | 1.1 | 510,900 | 16,681 | |||||||||
China Mobile ADR | 0.7 | 152,700 | 9,930 | |||||||||
Verizon Communications | 1.1 | 340,800 | 16,573 | |||||||||
Other Securities | 0.2 | 3,485 | ||||||||||
|
| |||||||||||
| 46,669 | ||||||||||||
|
| |||||||||||
| SEI Institutional Managed Trust / Semi-Annual Report / March 31, 2015 | 3 |
SUMMARY SCHEDULE OF INVESTMENTS (Unaudited)
Large Cap Value Fund (Concluded)
March 31, 2015
| Description | Percentage of Net Assets (%) | Shares | Market Value ($ Thousands) | |||||||||
Utilities — 3.5% | ||||||||||||
American Electric Power | 0.7 | % | 183,280 | $ | 10,310 | |||||||
Other Securities | 2.8 | 42,489 | ||||||||||
|
| |||||||||||
| 52,799 | ||||||||||||
|
| |||||||||||
Total Common Stock |
| 1,462,757 | ||||||||||
|
| |||||||||||
AFFILIATED PARTNERSHIP — 3.6% |
| |||||||||||
SEI Liquidity Fund, L.P. | 3.6 | 55,746,954 | 55,747 | |||||||||
|
| |||||||||||
Total Affiliated Partnership |
| 55,747 | ||||||||||
|
| |||||||||||
CASH EQUIVALENT — 3.9% |
| |||||||||||
SEI Daily Income Trust, Prime Obligation Fund, Cl A | 3.9 | 58,893,833 | 58,894 | |||||||||
|
| |||||||||||
Total Cash Equivalent |
| 58,894 | ||||||||||
|
| |||||||||||
U.S. TREASURY OBLIGATIONS (C) — 0.2% |
| |||||||||||
Other Securities | 0.2 | 2,500 | ||||||||||
|
| |||||||||||
Total U.S. Treasury Obligations |
| 2,500 | ||||||||||
|
| |||||||||||
Total Investments — 103.7% |
| $ | 1,579,898 | |||||||||
|
| |||||||||||
A list of the open futures contracts held by the Fund at March 31, 2015, is as follows:
| Type of Contract | Number of Contracts Long | Expiration Date | Unrealized Appreciation ($ Thousands) | |||||||||
Russell 2000 Index EMINI | 1 | Jun-2015 | $ | — | ||||||||
S&P 500 Index EMINI | 86 | Jun-2015 | 122 | |||||||||
|
| |||||||||||
| $ | 122 | |||||||||||
|
| |||||||||||
For the period ended March 31, 2015, the total number of all open futures contracts, as presented in the table above, are representative of the volume of activity for this derivative type during the period.
Percentages are based on Net Assets of $1,523,133 ($Thousands)
| * | Non-income producing security. |
| ‡ | Narrow Industries are utilized for compliance purposes, whereas broad sectors are utilized for reporting. |
| ** | Rate shown is the 7-day effective yield as of March 31, 2015. |
| †† | Investment in Affiliated Security (see Note 6). |
| (A) | This Security or a partial position of this security is on loan at March 31, 2015 (see Note 10). The total market value of securities on loan at March 31, 2015 was $53,753 ($ Thousands) |
| (B) | This security was purchased with cash collateral held from securities on loan (see note 10). The total market value of such securities as of March 31, 2015 was $55,747 ($Thousands). |
| (C) | Security, or portion thereof, as been pledged as collateral on open future contracts. |
ADR — American Depository Receipt
Cl — Class
L.P. — Limited Partnership
S&P — Standard and Poor’s
The Summary Schedule of Investments does not reflect the complete portfolio holdings. It includes the Fund’s 50 largest holdings and each investment of any issuer that exceeds 1% of the Fund’s net assets. “Other Securities” represent all issues not required to be disclosed under the rules adopted by the U.S. Securities and Exchange Commission (“SEC”). In certain instances, securities for which footnotes listed above may otherwise apply are included in the Other Securities caption. The complete schedule of portfolio holdings is available (i) without charge, upon request, by calling (800) 342-5734; and (ii) on the SEC’s website at http://www.sec.gov.
The following is a summary of the inputs used as of March 31, 2015, in valuing the Fund’s investments carried at value ($ Thousands):
| Investments in Securities | Level 1 | Level 2 | Level 3 | Total | ||||||||||||
Common Stock | $ | 1,462,757 | $ | — | $ | — | $ | 1,462,757 | ||||||||
Affiliated Partnership | — | 55,747 | — | 55,747 | ||||||||||||
U.S. Treasury Obligations | — | 2,500 | — | 2,500 | ||||||||||||
Cash Equivalent | 58,894 | — | — | 58,894 | ||||||||||||
|
|
|
|
|
|
|
| |||||||||
Total Investments in Securities | $ | 1,521,651 | $ | 58,247 | $ | — | $ | 1,579,898 | ||||||||
|
|
|
|
|
|
|
| |||||||||
| Other Financial Instruments | Level 1 | Level 2 | Level 3 | Total | ||||||||||||
Futures Contracts* | ||||||||||||||||
Unrealized Appreciation | $ | 122 | $ | — | $ | — | $ | 122 | ||||||||
|
|
|
|
|
|
|
| |||||||||
Total Other Financial Instruments | $ | 122 | $ | — | $ | — | $ | 122 | ||||||||
|
|
|
|
|
|
|
| |||||||||
| * | Futures contracts are valued at the unrealized appreciation on the instrument. |
For the period ended March 31, 2015, there were no transfers between Level 1 and Level 2 assets and liabilities.
For the period ended March 31, 2015, there were no transfers between Level 2 and Level 3 assets and liabilities.
For the period ended March 31, 2015, there were no Level 3 investments.
For more information on valuation inputs, see Note 2 — Significant Accounting Policies in Notes to Financial Statements.
Amounts designated as “—” are $0 or have been rounded to $0.
The accompanying notes are an integral part of the financial statements.
| 4 | SEI Institutional Managed Trust / Semi-Annual Report / March 31, 2015 |
SUMMARY SCHEDULE OF INVESTMENTS (Unaudited)
Large Cap Growth Fund
March 31, 2015
| Description | Percentage of Net Assets (%) | Shares | Market Value ($ Thousands) | |||||||||
COMMON STOCK (A) — 97.4%‡ |
| |||||||||||
Consumer Discretionary — 14.5% |
| |||||||||||
Amazon.com, Cl A* | 1.1 | % | 48,067 | $ | 17,886 | |||||||
L Brands | 1.2 | 207,375 | 19,553 | |||||||||
Liberty Media - Interactive, Cl A* | 1.4 | 743,060 | 21,690 | |||||||||
Liberty Ventures, Ser A* | 0.0 | 12,600 | 529 | |||||||||
Nike, Cl B | 0.9 | 142,350 | 14,282 | |||||||||
priceline.com* | 0.9 | 11,689 | 13,608 | |||||||||
Starbucks | 1.3 | 221,029 | 20,931 | |||||||||
TripAdvisor* | 1.7 | 337,010 | 28,029 | |||||||||
Other Securities | 6.0 | 97,720 | ||||||||||
|
| |||||||||||
| 234,228 | ||||||||||||
|
| |||||||||||
Consumer Staples — 9.4% |
| |||||||||||
Costco Wholesale | 0.9 | 92,040 | 13,943 | |||||||||
Estee Lauder, Cl A | 1.1 | 217,144 | 18,058 | |||||||||
Mead Johnson Nutrition, Cl A | 1.2 | 185,398 | 18,638 | |||||||||
Walgreens Boots Alliance | 1.5 | 286,593 | 24,269 | |||||||||
Whole Foods Market | 1.2 | 366,743 | 19,100 | |||||||||
Other Securities | 3.5 | 57,128 | ||||||||||
|
| |||||||||||
| 151,136 | ||||||||||||
|
| |||||||||||
Energy — 4.1% |
| |||||||||||
Kinder Morgan | 0.8 | 297,800 | 12,525 | |||||||||
Schlumberger, Cl A | 0.8 | 153,538 | 12,811 | |||||||||
Williams | 0.9 | 280,075 | 14,169 | |||||||||
Other Securities | 1.6 | 26,203 | ||||||||||
|
| |||||||||||
| 65,708 | ||||||||||||
|
| |||||||||||
Financials — 6.5% |
| |||||||||||
Charles Schwab | 1.5 | 798,160 | 24,296 | |||||||||
Crown Castle International† | 1.2 | 236,550 | 19,525 | |||||||||
IntercontinentalExchange Group | 0.8 | 57,450 | 13,401 | |||||||||
Other Securities | 3.0 | 48,371 | ||||||||||
|
| |||||||||||
| 105,593 | ||||||||||||
|
| |||||||||||
| Description | Percentage of Net Assets (%) | Shares | Market Value ($ Thousands) | |||||||||
Health Care — 16.7% |
| |||||||||||
Actavis* | 1.4 | % | 77,177 | $ | 22,969 | |||||||
Bristol-Myers Squibb | 0.8 | 204,583 | 13,196 | |||||||||
Celgene, Cl A* | 1.9 | 261,400 | 30,134 | |||||||||
DaVita HealthCare Partners* | 1.0 | 201,930 | 16,413 | |||||||||
Express Scripts Holding* | 1.7 | 321,572 | 27,903 | |||||||||
Gilead Sciences* | 0.9 | 142,921 | 14,025 | |||||||||
Intuitive Surgical* | 1.3 | 39,775 | 20,088 | |||||||||
Novo Nordisk ADR | 1.1 | 326,385 | 17,426 | |||||||||
Valeant Pharmaceuticals International* | 1.2 | 94,019 | 18,674 | |||||||||
Other Securities | 5.4 | 88,743 | ||||||||||
|
| |||||||||||
| 269,571 | ||||||||||||
|
| |||||||||||
Industrials — 11.2% |
| |||||||||||
3M | 0.9 | 89,400 | 14,746 | |||||||||
Danaher, Cl A | 1.3 | 242,925 | 20,624 | |||||||||
Fastenal, Cl A (A) | 0.8 | 324,380 | 13,441 | |||||||||
Stericycle, Cl A* | 1.5 | 172,387 | 24,208 | |||||||||
Other Securities | 6.7 | 106,960 | ||||||||||
|
| |||||||||||
| 179,979 | ||||||||||||
|
| |||||||||||
Information Technology — 31.5% |
| |||||||||||
Amphenol, Cl A | 1.5 | 410,047 | 24,164 | |||||||||
Apple | 2.6 | 336,738 | 41,900 | |||||||||
Baidu ADR* | 0.8 | 62,225 | 12,968 | |||||||||
Cognizant Technology Solutions, Cl A* | 1.0 | 252,853 | 15,775 | |||||||||
eBay* | 1.6 | 435,475 | 25,118 | |||||||||
Electronic Arts* | 1.0 | 273,250 | 16,071 | |||||||||
Equinix† | 1.4 | 93,680 | 21,813 | |||||||||
Facebook, Cl A* | 1.1 | 218,960 | 18,002 | |||||||||
Genpact* | 0.8 | 572,976 | 13,322 | |||||||||
Google, Cl A* | 1.2 | 36,045 | 19,994 | |||||||||
Google, Cl C* | 1.2 | 36,341 | 19,915 | |||||||||
Intuit | 0.9 | 155,305 | 15,058 | |||||||||
MasterCard, Cl A | 1.4 | 266,350 | 23,010 | |||||||||
Microsoft | 1.0 | 390,250 | 15,866 | |||||||||
NXP Semiconductors* | 0.9 | 150,360 | 15,090 | |||||||||
Qualcomm | 1.9 | 449,219 | 31,149 | |||||||||
Salesforce.com* | 1.0 | 250,049 | 16,706 | |||||||||
Visa, Cl A | 3.1 | 770,948 | 50,428 | |||||||||
Other Securities | 7.1 | �� | 111,669 | |||||||||
|
| |||||||||||
| 508,018 | ||||||||||||
|
| |||||||||||
Materials — 3.1% |
| |||||||||||
Ecolab | 1.5 | 206,208 | 23,586 | |||||||||
Other Securities | 1.6 | 27,163 | ||||||||||
|
| |||||||||||
| 50,749 | ||||||||||||
|
| |||||||||||
Telecommunication Services — 0.3% |
| |||||||||||
Other Securities | 0.3 | 4,722 | ||||||||||
|
| |||||||||||
| SEI Institutional Managed Trust / Semi-Annual Report / March 31, 2015 | 5 |
SUMMARY SCHEDULE OF INVESTMENTS (Unaudited)
Large Cap Growth Fund (Concluded)
March 31, 2015
| Description | Percentage of Net Assets (%) | Shares | Market Value ($ Thousands) | |||||||||
Utilities — 0.1% |
| |||||||||||
Other Securities | 0.1 | % | $ | 2,083 | ||||||||
|
| |||||||||||
Total Common Stock |
| 1,571,787 | ||||||||||
|
| |||||||||||
AFFILIATED PARTNERSHIP — 1.5% |
| |||||||||||
SEI Liquidity Fund, L.P. | 1.5 | 24,314,603 | 24,315 | |||||||||
|
| |||||||||||
Total Affiliated Partnership |
| 24,315 | ||||||||||
|
| |||||||||||
CASH EQUIVALENTS — 2.5% |
| |||||||||||
SEI Daily Income Trust, | 1.8 | 28,667,372 | 28,667 | |||||||||
Other Securities | 0.7 | 11,232 | ||||||||||
|
| |||||||||||
Total Cash Equivalents |
| 39,899 | ||||||||||
|
| |||||||||||
U.S. TREASURY OBLIGATIONS (C) — 0.2% |
| |||||||||||
Other Securities | 0.2 | 2,849 | ||||||||||
|
| |||||||||||
Total U.S. Treasury Obligations |
| 2,849 | ||||||||||
|
| |||||||||||
Total Investments — 101.6% |
| $ | 1,638,850 | |||||||||
|
| |||||||||||
A list of the open futures contracts held by the Fund at March 31, 2015, is as follows:
| Type of Contract | Number of Contracts Long | Expiration Date | Unrealized Appreciation ($ Thousands) | |||||||||
Russell 2000 Index EMINI | 26 | Jun-2015 | $ | 97 | ||||||||
S&P 500 Index EMINI | 202 | Jun-2015 | 285 | |||||||||
|
| |||||||||||
| $ | 382 | |||||||||||
|
| |||||||||||
For the period ended March 31, 2015, the total amount of all open futures contracts, as presented in the table above, are representative of the volume of activity for this derivative type during the period.
Percentages are based on Net Assets of $1,613,479 ($Thousands)
| * | Non-income producing security. |
| ** | Rate shown is the 7-day effective yield as of March 31, 2015. |
| ‡ | Narrow Industries are utilized for compliance purposes, whereas broad sectors are utilized for reporting. |
| † | Real Estate Investment Trust. |
| †† | Investment in Affiliated Security (see Note 6). |
| (A) | Certain securities or partial positions of certain securities are on loan at March 31, 2015 (see Note 10). The total market value of such securities on loan at March 31, 2015 was $23,659 ($ Thousands) |
| (B) | This security was purchased with cash collateral held from securities on loan (see Note 10). The total market value of such securities as of March 31, 2015 was $24,315 ($Thousands). |
| (C) | Security, or a portion thereof, has been pledged as collateral on open future contracts. |
ADR — American Depositary Receipt
Cl — Class
L.P. — Limited Partnership
S&P — Standard and Poor’s
Ser — Series
The Summary Schedule of Investments does not reflect the complete portfolio holdings. It includes the Fund’s 50 largest holdings and each investment of any issuer that exceeds 1% of the Fund’s net assets. “Other Securities” represent all issues not required to be disclosed under the rules adopted by the U.S. Securities and Exchange Commission (“SEC”). In certain instances, securities for which footnotes listed above may otherwise apply are included in the Other Securities caption. The complete schedule of portfolio holdings is available (i) without charge, upon request, by calling (800) 342-5734; and (ii) on the SEC’s website at http://www.sec.gov.
The following is a summary of inputs used as if March 31, 2015, in valuing the Fund’s investments carried at value ($ Thousands):
| Investments in Securities | Level 1 | Level 2 | Level 3 | Total | ||||||||||||
Common Stock | $ | 1,571,787 | $ | — | $ | — | $ | 1,571,787 | ||||||||
Affiliated Partnership | — | 24,315 | — | 24,315 | ||||||||||||
Cash Equivalents | 39,899 | — | — | 39,899 | ||||||||||||
U.S. Treasury Obligations | — | 2,849 | — | 2,849 | ||||||||||||
|
|
|
|
|
|
|
| |||||||||
Total Investments in Securities | $ | 1,611,686 | $ | 27,164 | $ | — | $ | 1,638,850 | ||||||||
|
|
|
|
|
|
|
| |||||||||
| Other Financial Instruments | Level 1 | Level 2 | Level 3 | Total | ||||||||||||
Futures Contracts* | ||||||||||||||||
Unrealized Appreciation | $ | 382 | $ | — | $ | — | $ | 382 | ||||||||
|
|
|
|
|
|
|
| |||||||||
Total Other Financial Instruments | $ | 382 | $ | — | $ | — | $ | 382 | ||||||||
|
|
|
|
|
|
|
| |||||||||
| * | Futures contracts are valued at unrealized appreciation on the instrument. |
For the period ended March 31, 2015, there were no transfers between Level 1 and Level 2 assets and liabilities.
For the period ended March 31, 2015, there were no transfers between Level 2 and Level 3 assets and liabilities.
For the period ended March 31, 2015, there were no Level 3 Investments.
For more information on valuation inputs, see Note 2 — Significant Accounting Policies in Notes to Financial Statements.
Amounts designated as “—” are $0 or have been rounded to $0.
The accompanying notes are an integral part of the financial statements.
| 6 | SEI Institutional Managed Trust / Semi-Annual Report / March 31, 2015 |
SUMMARY SCHEDULE OF INVESTMENTS (Unaudited)
Tax-Managed Large Cap Fund
March 31, 2015
| Description | Percentage of Net Assets (%) | Shares | Market Value ($ Thousands) | |||||||||
COMMON STOCK (A) — 93.8% |
| |||||||||||
Consumer Discretionary — 13.1% |
| |||||||||||
Amazon.com, Cl A* | 0.6 | % | 53,407 | $ | 19,873 | |||||||
Home Depot | 0.5 | 160,728 | 18,260 | |||||||||
L Brands | 0.5 | 177,912 | 16,775 | |||||||||
Liberty Media - Interactive, Cl A* | 0.5 | 569,028 | 16,610 | |||||||||
Nike, Cl B | 0.7 | 236,598 | 23,738 | |||||||||
TripAdvisor* | 0.7 | 288,776 | 24,017 | |||||||||
Other Securities | 9.6 | 318,413 | ||||||||||
|
| |||||||||||
| 437,686 | ||||||||||||
|
| |||||||||||
Consumer Staples — 8.6% |
| |||||||||||
Anheuser-Busch InBev ADR (A) | 0.5 | 132,920 | 16,204 | |||||||||
Costco Wholesale | 0.9 | 190,219 | 28,817 | |||||||||
CVS Health | 0.8 | 260,343 | 26,870 | |||||||||
Kroger | 0.6 | 265,496 | 20,353 | |||||||||
Mead Johnson Nutrition, Cl A | 0.6 | 211,348 | 21,247 | |||||||||
Walgreens Boots Alliance (A) | 0.7 | 299,929 | 25,398 | |||||||||
Other Securities | 4.5 | 148,931 | ||||||||||
|
| |||||||||||
| 287,820 | ||||||||||||
|
| |||||||||||
Energy — 7.0% |
| |||||||||||
Chevron | 0.7 | 232,209 | 24,377 | |||||||||
EOG Resources | 0.6 | 220,434 | 20,212 | |||||||||
Exxon Mobil | 0.7 | 284,425 | 24,176 | |||||||||
Valero Energy | 0.5 | 277,986 | 17,686 | |||||||||
Other Securities | 4.5 | 147,030 | ||||||||||
|
| |||||||||||
| 233,481 | ||||||||||||
|
| |||||||||||
Financials — 14.5% |
| |||||||||||
American International Group (A) | 0.9 | 531,198 | 29,104 | |||||||||
Citigroup | 0.9 | 607,013 | 31,273 | |||||||||
Crown Castle International† | 0.8 | 321,932 | 26,572 | |||||||||
Discover Financial Services | 0.5 | 300,119 | 16,912 | |||||||||
JPMorgan Chase | 1.0 | 544,019 | 32,957 | |||||||||
Wells Fargo | 0.9 | 525,725 | 28,599 | |||||||||
Other Securities | 9.5 | 321,826 | ||||||||||
|
| |||||||||||
| 487,243 | ||||||||||||
|
| |||||||||||
| Description | Percentage of Net Assets (%) | Shares | Market Value ($ Thousands) | |||||||||
Health Care — 16.4% |
| |||||||||||
Actavis* | 1.0 | % | 109,461 | $ | 32,578 | |||||||
Amgen, Cl A | 0.6 | 120,417 | 19,249 | |||||||||
Anthem | 0.7 | 143,581 | 22,170 | |||||||||
Biogen* | 0.8 | 64,586 | 27,271 | |||||||||
Bristol-Myers Squibb | 0.7 | 348,022 | 22,447 | |||||||||
Celgene, Cl A* | 1.2 | 336,014 | 38,736 | |||||||||
Express Scripts Holding* | 0.9 | 351,850 | 30,530 | |||||||||
Gilead Sciences* | 0.6 | 190,489 | 18,693 | |||||||||
Humana | 0.9 | 172,261 | 30,666 | |||||||||
Johnson & Johnson | 0.5 | 181,443 | 18,253 | |||||||||
Pfizer | 0.8 | 803,311 | 27,947 | |||||||||
Shire ADR | 0.6 | 84,071 | 20,117 | |||||||||
Other Securities | 7.1 | 241,843 | ||||||||||
|
| |||||||||||
| 550,500 | ||||||||||||
|
| |||||||||||
Industrials — 8.0% |
| |||||||||||
Canadian Pacific Railway | 0.6 | 116,068 | 21,206 | |||||||||
Northrop Grumman | 0.8 | 156,994 | 25,270 | |||||||||
Other Securities | 6.6 | 221,096 | ||||||||||
|
| |||||||||||
| 267,572 | ||||||||||||
|
| |||||||||||
Information Technology — 20.7% |
| |||||||||||
Adobe Systems* | 1.1 | 506,682 | 37,464 | |||||||||
Apple | 1.4 | 371,259 | 46,196 | |||||||||
Applied Materials | 0.7 | 1,075,100 | 24,254 | |||||||||
Cognizant Technology Solutions, Cl A* | 0.5 | 266,853 | 16,649 | |||||||||
eBay* | 0.7 | 379,498 | 21,889 | |||||||||
Facebook, Cl A* | 0.5 | 209,203 | 17,200 | |||||||||
Google, Cl A* | 0.7 | 43,087 | 23,900 | |||||||||
Google, Cl C* | 0.5 | 30,812 | 16,885 | |||||||||
MasterCard, Cl A | 1.3 | 505,598 | 43,679 | |||||||||
Microsoft | 1.1 | 933,147 | 37,937 | |||||||||
Oracle, Cl B | 0.5 | 382,668 | 16,512 | |||||||||
Qualcomm | 1.1 | 534,150 | 37,038 | |||||||||
Visa, Cl A (A) | 1.1 | 556,476 | 36,399 | |||||||||
Western Digital | 0.6 | 230,097 | 20,941 | |||||||||
Other Securities | 8.9 | 298,494 | ||||||||||
|
| |||||||||||
| 695,437 | ||||||||||||
|
| |||||||||||
Materials — 2.6% |
| |||||||||||
Other Securities | 2.6 | 88,774 | ||||||||||
|
| |||||||||||
Telecommunication Services — 0.6% |
| |||||||||||
Other Securities | 0.6 | 20,212 | ||||||||||
|
| |||||||||||
Utilities — 2.3% |
| |||||||||||
Other Securities | 2.3 | 75,413 | ||||||||||
|
| |||||||||||
Total Common Stock |
| 3,144,138 | ||||||||||
|
| |||||||||||
| SEI Institutional Managed Trust / Semi-Annual Report / March 31, 2015 | 7 |
SUMMARY SCHEDULE OF INVESTMENTS (Unaudited)
Tax-Managed Large Cap Fund (Concluded)
March 31, 2015
| Description | Percentage of Net Assets (%) | Shares | Market Value ($ Thousands) | |||||||||
RIGHTS — 0.0% | ||||||||||||
Other Securities | 0.0 | % | $ | 115 | ||||||||
|
| |||||||||||
Total Rights |
| 115 | ||||||||||
|
| |||||||||||
AFFILIATED PARTNERSHIP — 1.5% |
| |||||||||||
SEI Liquidity Fund, L.P. | 1.5 | 49,579,515 | 49,580 | |||||||||
|
| |||||||||||
Total Affiliated Partnership |
| 49,580 | ||||||||||
|
| |||||||||||
CASH EQUIVALENT — 5.8% |
| |||||||||||
SEI Daily Income Trust, Prime Obligation Fund, Cl A | 5.8 | 194,469,779 | 194,470 | |||||||||
|
| |||||||||||
Total Cash Equivalent |
| 194,470 | ||||||||||
|
| |||||||||||
U.S. TREASURY OBLIGATIONS (C) — 0.2% |
| |||||||||||
Other Securities | 0.2 | 7,801 | ||||||||||
|
| |||||||||||
Total U.S. Treasury Obligations |
| 7,801 | ||||||||||
|
| |||||||||||
Total Investments — 101.3% |
| $ | 3,396,104 | |||||||||
|
| |||||||||||
A list of the open futures contracts held by the Fund at March 31, 2015, is as follows:
| Type of Contract | Number of Contracts Long | Expiration Date | Unrealized Appreciation ($ Thousands) | |||||||||
S&P 500 Index EMINI | 882 | Jun-2015 | $ | 1,082 | ||||||||
S&P Mid 400 Index EMINI | 80 | Jun-2015 | 298 | |||||||||
|
| |||||||||||
| $ | 1,380 | |||||||||||
|
| |||||||||||
For the period ended March 31, 2015, the total amount of all open futures contracts, as presented in the table above, are representative of the volume of activity for this derivative type during the period.
Percentages are based on Net Assets of $3,353,844 ($ Thousands).
| * | Non-income producing security. |
| ** | Rate shown is the 7-day effective yield as of March 31, 2015. |
| † | Real Estate Investment Trust. |
| †† | Investment in Affiliated Security (see Note 6). |
| (A) | Certain securities or partial positions of certain securities are on loan at March 31, 2015 (see Note 10). The total market value of securities on loan at March 31, 2015 was $48,147 ($ Thousands). |
| (B) | This security was purchased with cash collateral held from securities on loan (see Note 10). The total market value of such securities as of March 31, 2015 was $49,580 ($ Thousands). |
| (C) | Security, or portion thereof, has been pledged as collateral on open futures contracts. |
ADR — American Depositary Receipt
Cl — Class
L.P. — Limited Partnership
S&P — Standard & Poor’s
The Summary Schedule of Investments does not reflect the complete portfolio holdings. It includes the Fund’s 50 largest holdings and each investment of any issuer that exceeds 1% of the Fund’s net assets. “Other Securities” represent all issues not required to be disclosed under the rules adopted by the U.S. Securities and Exchange Commission (“SEC”). In certain instances, securities for which footnotes listed above may otherwise apply are included in the Other Securities caption. The complete schedule of portfolio holdings is available (i) without charge, upon request, by calling (800) 342-5734; and (ii) on the SEC’s website at http://www.sec.gov.
The following is a summary of the inputs used as of March 31, 2015, in valuing the Fund’s investments carried at value ($ Thousands):
| Investments in Securities | Level 1 | Level 2 | Level 3 | Total | ||||||||||||
Common Stock | $ | 3,144,138 | $ | — | $ | — | $ | 3,144,138 | ||||||||
Rights | — | 115 | — | 115 | ||||||||||||
Affiliated Partnership | — | 49,580 | — | 49,580 | ||||||||||||
Cash Equivalent | 194,470 | — | — | 194,470 | ||||||||||||
U.S. Treasury Obligations | — | 7,801 | — | 7,801 | ||||||||||||
|
|
|
|
|
|
|
| |||||||||
Total Investments in Securities | $ | 3,338,608 | $ | 57,496 | $ | — | $ | 3,396,104 | ||||||||
|
|
|
|
|
|
|
| |||||||||
| Other Financial Instruments | Level 1 | Level 2 | Level 3 | Total | ||||||||||||
Futures Contracts* | $ | 1,380 | $ | — | $ | — | $ | 1,380 | ||||||||
|
|
|
|
|
|
|
| |||||||||
Total Other Financial Instruments | $ | 1,380 | $ | — | $ | — | $ | 1,380 | ||||||||
|
|
|
|
|
|
|
| |||||||||
| * | Futures contracts are valued at the unrealized appreciation on the instrument. |
For the period ended March 31, 2015, there were no transfers between Level 1 and Level 2 assets and liabilities.
For the period ended March 31, 2015, there were no transfers between Level 2 and Level 3 assets and liabilities.
For the period March 31, 2015, there were no level 3 investments.
For more information on valuation inputs, see Note 2 — Significant Accounting Policies in Notes to Financial Statements.
Amounts designated as “—” are $0 or have been rounded to $0.
The accompanying notes are an integral part of the financial statements.
| 8 | SEI Institutional Managed Trust / Semi-Annual Report / March 31, 2015 |
SUMMARY SCHEDULE OF INVESTMENTS (Unaudited)
S&P 500 Index Fund
March 31, 2015
| Description | Percentage of Net Assets (%) | Shares | Market Value ($ Thousands) | |||||||||
COMMON STOCK (A) — 99.0% |
| |||||||||||
Consumer Discretionary — 12.5% |
| |||||||||||
Amazon.com, Cl A* | 0.8 | % | 14,304 | $ | 5,322 | |||||||
Comcast, Cl A | 0.8 | 95,448 | 5,390 | |||||||||
Home Depot | 0.8 | 49,509 | 5,625 | |||||||||
McDonald’s | 0.5 | 36,083 | 3,516 | |||||||||
Walt Disney | 0.9 | 58,744 | 6,162 | |||||||||
Other Securities | 8.7 | 60,505 | ||||||||||
|
| |||||||||||
| 86,520 | ||||||||||||
|
| |||||||||||
Consumer Staples — 9.6% |
| |||||||||||
Altria Group | 0.6 | 73,973 | 3,700 | |||||||||
Coca-Cola | 0.8 | 147,649 | 5,987 | |||||||||
CVS Health | 0.6 | 42,252 | 4,361 | |||||||||
PepsiCo | 0.8 | 55,707 | 5,327 | |||||||||
Philip Morris International | 0.6 | 58,187 | 4,383 | |||||||||
Procter & Gamble | 1.2 | 101,431 | 8,311 | |||||||||
Wal-Mart Stores | 0.7 | 59,361 | 4,883 | |||||||||
Other Securities | 4.3 | 29,659 | ||||||||||
|
| |||||||||||
| 66,611 | ||||||||||||
|
| |||||||||||
Energy — 7.9% |
| |||||||||||
Chevron | 1.1 | 70,600 | 7,412 | |||||||||
Exxon Mobil | 1.9 | 157,546 | 13,391 | |||||||||
Schlumberger, Cl A | 0.6 | 47,960 | 4,002 | |||||||||
Other Securities | 4.3 | 30,460 | ||||||||||
|
| |||||||||||
| 55,265 | ||||||||||||
|
| |||||||||||
Financials — 16.0% |
| |||||||||||
Bank of America | 0.9 | 395,245 | 6,083 | |||||||||
Berkshire Hathaway, Cl B* | 1.4 | 68,469 | 9,881 | |||||||||
Citigroup | 0.9 | 113,951 | 5,871 | |||||||||
JPMorgan Chase | 1.2 | 140,100 | 8,487 | |||||||||
Wells Fargo | 1.4 | 176,115 | 9,581 | |||||||||
Other Securities | 10.2 | 71,510 | ||||||||||
|
| |||||||||||
| 111,413 | ||||||||||||
|
| |||||||||||
| Description | Percentage of Net Assets (%) | Shares | Market Value ($ Thousands) | |||||||||
Health Care — 14.8% |
| |||||||||||
AbbVie | 0.5 | % | 59,868 | $ | 3,505 | |||||||
Actavis* | 0.6 | 14,653 | 4,361 | |||||||||
Amgen, Cl A | 0.7 | 28,564 | 4,566 | |||||||||
Biogen* | 0.5 | 8,800 | 3,716 | |||||||||
Bristol-Myers Squibb | 0.6 | 62,492 | 4,031 | |||||||||
Celgene, Cl A* | 0.5 | 30,113 | 3,471 | |||||||||
Gilead Sciences* | 0.8 | 55,966 | 5,492 | |||||||||
Johnson & Johnson | 1.5 | 104,412 | 10,504 | |||||||||
Medtronic | 0.6 | 53,572 | 4,178 | |||||||||
Merck | 0.9 | 106,674 | 6,132 | |||||||||
Pfizer | 1.1 | 230,256 | 8,010 | |||||||||
UnitedHealth Group | 0.6 | 35,860 | 4,242 | |||||||||
Other Securities | 5.9 | 40,489 | ||||||||||
|
| |||||||||||
| 102,697 | ||||||||||||
|
| |||||||||||
Industrials — 10.3% |
| |||||||||||
3M | 0.6 | 23,891 | 3,941 | |||||||||
Boeing | 0.5 | 24,641 | 3,698 | |||||||||
General Electric | 1.3 | 378,104 | 9,381 | |||||||||
Union Pacific | 0.5 | 33,101 | 3,585 | |||||||||
United Technologies | 0.5 | 31,041 | 3,638 | |||||||||
Other Securities | 6.9 | 47,016 | ||||||||||
|
| |||||||||||
| 71,259 | ||||||||||||
|
| |||||||||||
Information Technology — 19.5% |
| |||||||||||
Apple | 3.9 | 218,782 | 27,223 | |||||||||
Cisco Systems | 0.8 | 191,761 | 5,278 | |||||||||
Facebook, Cl A* | 0.9 | 78,822 | 6,480 | |||||||||
Google, Cl A* | 0.9 | 10,767 | 5,973 | |||||||||
Google, Cl C* | 0.9 | 10,767 | 5,900 | |||||||||
Intel | 0.8 | 177,963 | 5,565 | |||||||||
International Business Machines | 0.8 | 34,546 | 5,545 | |||||||||
Microsoft | 1.8 | 308,189 | 12,529 | |||||||||
Oracle, Cl B | 0.7 | 120,423 | 5,196 | |||||||||
Qualcomm | 0.6 | 61,954 | 4,296 | |||||||||
Visa, Cl A | 0.7 | 72,918 | 4,770 | |||||||||
Other Securities | 6.7 | 46,500 | ||||||||||
|
| |||||||||||
| 135,255 | ||||||||||||
|
| |||||||||||
Materials — 3.1% |
| |||||||||||
Other Securities | 3.1 | 21,674 | ||||||||||
|
| |||||||||||
Telecommunication Services — 2.3% |
| |||||||||||
AT&T | 0.9 | 194,997 | 6,367 | |||||||||
Verizon Communications | 1.1 | 156,096 | 7,591 | |||||||||
Other Securities | 0.3 | 1,751 | ||||||||||
|
| |||||||||||
| 15,709 | ||||||||||||
|
| |||||||||||
| SEI Institutional Managed Trust / Semi-Annual Report / March 31, 2015 | 9 |
SUMMARY SCHEDULE OF INVESTMENTS (Unaudited)
S&P 500 Index Fund (Concluded)
March 31, 2015
| Description | Percentage of Net Assets (%) | Shares | Market Value ($ Thousands) | |||||||||
Utilities — 3.0% |
| |||||||||||
Other Securities | 3.0 | % | $ | 20,891 | ||||||||
|
| |||||||||||
Total Common Stock |
| 687,294 | ||||||||||
|
| |||||||||||
AFFILIATED PARTNERSHIP — 0.7% |
| |||||||||||
SEI Liquidity Fund, L.P. | 0.7 | 4,859,159 | 4,859 | |||||||||
|
| |||||||||||
Total Affiliated Partnership |
| 4,859 | ||||||||||
|
| |||||||||||
CASH EQUIVALENT — 1.6% |
| |||||||||||
SEI Daily Income Trust, Prime Obligation Fund, Cl A 0.010%**† | 1.6 | 11,414,893 | 11,415 | |||||||||
|
| |||||||||||
Total Cash Equivalent |
| 11,415 | ||||||||||
|
| |||||||||||
U.S. TREASURY OBLIGATIONS (C) — 0.5% |
| |||||||||||
Other Securities | 0.5 | 3,310 | ||||||||||
|
| |||||||||||
Total U.S. Treasury Obligations |
| 3,310 | ||||||||||
|
| |||||||||||
Total Investments — 101.8% |
| $ | 706,878 | |||||||||
|
| |||||||||||
A list of the open futures contracts held by the Fund at March 31, 2015, is as follows:
| Type of Contract | Number of Contracts Long | Expiration Date | Unrealized (Depreciation) ($ Thousands) | |||||||||
S&P 500 Index EMINI | 76 | Jun-2015 | $ | (25 | ) | |||||||
|
| |||||||||||
For the period ended March 31, 2015, the total amount of all open futures contracts, as presented in the table above, are representative of the volume of activity for this derivative type during the period.
Percentages are based on Net Assets of $694,212 ($Thousands)
| * | Non-income producing security. |
| ** | Rate shown is the 7-day effective yield as of March 30, 2015. |
| † | Investment in Affiliated Security (see Note 6). |
| (A) | Certain securities or partial positions of certain securities are on loan at March 31, 2015 (see Note 10). The total market value of securities on loan at March 31, 2015 was $4,677 ($ Thousands). |
| (B) | This security was purchased with cash collateral held from securities on loan (see note 10). The total market value of such securities as of March 31, 2015 was $4,859 ($Thousands). |
| (C) | Security, or portion thereof, has been pledged as collateral on open futures contracts. |
Cl — Class
L.P. — Limited Partnership
S&P — Standard & Poor’s
The Summary Schedule of Investments does not reflect the complete portfolio holdings. It includes the Fund’s 50 largest holdings and each investment of any issuer that exceeds 1% of the Fund’s net assets. “Other Securities” represent all issues not required to be disclosed under the rules adopted by the U.S. Securities and Exchange Commission (“SEC”). In certain instances, securities for which footnotes listed above may otherwise apply are included in the Other Securities caption. The complete schedule of portfolio holdings is available (i) without charge, upon request, by calling (800) 342-5734; and (ii) on the SEC’s website at http://www.sec.gov.
The following is a summary of the inputs used as of March 31, 2015, in valuing the Fund’s investments carried at value ($ Thousands):
| Investments in Securities | Level 1 | Level 2 | Level 3 | Total | ||||||||||||
Common Stock | $ | 687,294 | $ | — | $ | — | $ | 687,294 | ||||||||
Affiliated Partnership | — | 4,859 | — | 4,859 | ||||||||||||
Cash Equivalent | 11,415 | — | — | 11,415 | ||||||||||||
U.S. Treasury Obligations | — | 3,310 | — | 3,310 | ||||||||||||
|
|
|
|
|
|
|
| |||||||||
Total Investments in Securities | $ | 698,709 | $ | 8,196 | $ | — | $ | 706,878 | ||||||||
|
|
|
|
|
|
|
| |||||||||
| Other Financial Instruments | Level 1 | Level 2 | Level 3 | Total | ||||||||||||
Futures Contracts* | ||||||||||||||||
Unrealized Depreciation | $ | (25 | ) | $ | — | $ | — | $ | (25 | ) | ||||||
|
|
|
|
|
|
|
| |||||||||
Total Other Financial Instruments | $ | (25 | ) | $ | — | $ | — | $ | (25 | ) | ||||||
|
|
|
|
|
|
|
| |||||||||
| * | Futures contracts are valued at unrealized depreciation on the instrument. |
For the period ended March 31, 2015, there were no transfers between Level 1 and Level 2 assets and liabilities.
For the period ended March 31, 2015, there were no transfers between Level 2 and Level 3 assets and liabilities.
For the period ended March 31, 2015, there were no level 3 investments.
For more information on valuation inputs, see Note 2 — Significant Accounting Policies in Notes to Financial Statements.
Amounts designated as “—” are $0 or have been rounded to $0.
The accompanying notes are an integral part of the financial statements.
| 10 | SEI Institutional Managed Trust / Semi-Annual Report / March 31, 2015 |
SUMMARY SCHEDULE OF INVESTMENTS (Unaudited)
Small Cap Fund
March 31, 2015

| Description | Percentage of Net Assets (%) | Shares | Market Value ($ Thousands) | |||||||||
COMMON STOCK (A) — 94.3% |
| |||||||||||
Consumer Discretionary — 14.6% |
| |||||||||||
Abercrombie & Fitch, Cl A (A) | 0.4 | % | 90,800 | $ | 2,001 | |||||||
Big Lots | 0.4 | 47,168 | 2,265 | |||||||||
Bright Horizons Family Solutions* | 0.4 | 38,163 | 1,957 | |||||||||
Burlington Stores* | 0.3 | 30,928 | 1,838 | |||||||||
Fiesta Restaurant Group* | 0.3 | 30,270 | 1,846 | |||||||||
Five Below* | 0.4 | 55,678 | 1,980 | |||||||||
Jack in the Box | 0.4 | 24,994 | 2,397 | |||||||||
La-Z-Boy, Cl Z | 0.3 | 62,141 | 1,747 | |||||||||
Marriott Vacations Worldwide | 0.4 | 25,839 | 2,094 | |||||||||
Pool | 0.4 | 32,139 | 2,242 | |||||||||
Vail Resorts | 0.3 | 16,911 | 1,749 | |||||||||
Other Securities | 10.6 | 61,622 | ||||||||||
|
| |||||||||||
| 83,738 | ||||||||||||
|
| |||||||||||
Consumer Staples — 2.1% |
| |||||||||||
Other Securities | 2.1 | 12,304 | ||||||||||
|
| |||||||||||
Energy — 3.6% |
| |||||||||||
PBF Energy, Cl A | 0.3 | 50,500 | 1,713 | |||||||||
Tidewater, Cl A (A) | 0.3 | 100,200 | 1,918 | |||||||||
Other Securities | 3.0 | 16,994 | ||||||||||
|
| |||||||||||
| 20,625 | ||||||||||||
|
| |||||||||||
Financials — 18.0% |
| |||||||||||
First Niagara Financial Group | 0.4 | 232,200 | 2,053 | |||||||||
Geo Group† | 0.3 | 41,557 | 1,818 | |||||||||
Highwoods Properties† | 0.3 | 40,200 | 1,840 | |||||||||
OFG Bancorp (A) | 0.5 | 165,866 | 2,707 | |||||||||
TCF Financial | 0.3 | 120,585 | 1,896 | |||||||||
Western Alliance Bancorp* | 0.4 | 67,573 | 2,003 | |||||||||
Other Securities | 15.8 | 90,381 | ||||||||||
|
| |||||||||||
| 102,698 | ||||||||||||
�� |
| |||||||||||
| Description | Percentage of Net Assets (%) | Shares | Market Value ($ Thousands) | |||||||||
Health Care — 17.3% |
| |||||||||||
Acadia Healthcare, Cl A* (A) | 0.6 | % | 47,273 | $ | 3,385 | |||||||
Akorn* | 0.4 | 48,609 | 2,309 | |||||||||
Amsurg* | 0.4 | 38,795 | 2,387 | |||||||||
DexCom* | 0.4 | 36,931 | 2,302 | |||||||||
Greatbatch* | 0.3 | 30,260 | 1,751 | |||||||||
HealthSouth | 0.4 | 53,624 | 2,379 | |||||||||
Integra LifeSciences Holdings* | 0.4 | 34,900 | 2,152 | |||||||||
LDR Holding* | 0.4 | 56,360 | 2,065 | |||||||||
Other Securities | 14.0 | 80,230 | ||||||||||
|
| |||||||||||
| 98,960 | ||||||||||||
|
| |||||||||||
Industrials — 14.4% |
| |||||||||||
Atlas Air Worldwide Holdings* | 0.3 | 42,796 | 1,841 | |||||||||
Dycom Industries* | 0.5 | 53,897 | 2,632 | |||||||||
Hexcel, Cl A | 0.3 | 37,374 | 1,922 | |||||||||
Triumph Group | 0.4 | 33,300 | 1,989 | |||||||||
Other Securities | 12.9 | 73,950 | ||||||||||
|
| |||||||||||
| 82,334 | ||||||||||||
|
| |||||||||||
Information Technology — 19.4% |
| |||||||||||
Aspen Technology* | 0.4 | 55,548 | 2,138 | |||||||||
Blackbaud, Cl A | 0.3 | 40,747 | 1,931 | |||||||||
Cavium* | 0.5 | 42,960 | 3,043 | |||||||||
Dealertrack Technologies* | 0.4 | 58,528 | 2,255 | |||||||||
Entegris* | 0.3 | 138,471 | 1,896 | |||||||||
Envestnet* | 0.4 | 39,182 | 2,197 | |||||||||
Guidewire Software, Cl Z* (A) | 0.3 | 33,353 | 1,755 | |||||||||
Infoblox* | 0.5 | 119,587 | 2,855 | |||||||||
Intersil, Cl A | 0.4 | 144,842 | 2,074 | |||||||||
MAXIMUS | 0.3 | 29,541 | 1,972 | |||||||||
Mentor Graphics | 0.3 | 74,002 | 1,778 | |||||||||
OmniVision Technologies* | 0.4 | 87,800 | 2,315 | |||||||||
Proofpoint* | 0.3 | 32,376 | 1,917 | |||||||||
SPS Commerce* | 0.3 | 27,256 | 1,829 | |||||||||
Ultimate Software Group* | 0.3 | 11,171 | 1,899 | |||||||||
Other Securities | 14.0 | 78,932 | ||||||||||
|
| |||||||||||
| 110,786 | ||||||||||||
|
| |||||||||||
Materials — 2.5% |
| |||||||||||
Berry Plastics Group* | 0.3 | 54,311 | 1,965 | |||||||||
Other Securities | 2.2 | 12,162 | ||||||||||
|
| |||||||||||
| 14,127 | ||||||||||||
|
| |||||||||||
Telecommunication Services — 0.5% |
| |||||||||||
Other Securities | 0.5 | 2,602 | ||||||||||
|
| |||||||||||
| SEI Institutional Managed Trust / Semi-Annual Report / March 31, 2015 | 11 |
SUMMARY SCHEDULE OF INVESTMENTS (Unaudited)
Small Cap Fund (Concluded)
March 31, 2015
| Description | Percentage of Net Assets (%) | Shares | Market Value ($ Thousands) | |||||||||
Utilities — 1.9% |
| |||||||||||
ALLETE | 0.3 | % | 34,003 | $ | 1,794 | |||||||
PNM Resources | 0.3 | 61,861 | 1,806 | |||||||||
Other Securities | 1.3 | 7,380 | ||||||||||
|
| |||||||||||
| 10,980 | ||||||||||||
|
| |||||||||||
Total Common Stock |
| 539,154 | ||||||||||
|
| |||||||||||
EXCHANGE TRADED FUNDS — 0.4% |
| |||||||||||
Other Securities | 0.4 | 2,185 | ||||||||||
|
| |||||||||||
Total Exchange Traded Funds |
| 2,185 | ||||||||||
|
| |||||||||||
RIGHTS — 0.0% | ||||||||||||
Other Securities | 0.0 | — | ||||||||||
|
| |||||||||||
Total Rights |
| — | ||||||||||
|
| |||||||||||
AFFILIATED PARTNERSHIP — 6.9% |
| |||||||||||
SEI Liquidity Fund, L.P. | 6.9 | 39,269,182 | 39,269 | |||||||||
|
| |||||||||||
Total Affiliated Partnership |
| 39,269 | ||||||||||
|
| |||||||||||
CASH EQUIVALENT — 5.3% |
| |||||||||||
SEI Daily Income Trust, | 5.3 | 30,029,177 | 30,029 | |||||||||
|
| |||||||||||
Total Cash Equivalent |
| 30,029 | ||||||||||
|
| |||||||||||
U.S. TREASURY OBLIGATIONS (C) — 0.3% |
| |||||||||||
Other Securities | 0.3 | 1,836 | ||||||||||
|
| |||||||||||
Total U.S. Treasury Obligations |
| 1,836 | ||||||||||
|
| |||||||||||
Total Investments — 107.2% |
| $ | 612,473 | |||||||||
|
| |||||||||||
A list of the open futures contracts held by the Fund at March 31, 2015, is as follows:
| Type of Contract | Number of Contracts Long | Expiration Date | Unrealized Appreciation ($ Thousands) | |||||||||
Russell 2000 Index E-MINI | 143 | Jun-2015 | $ | 483 | ||||||||
|
| |||||||||||
For the period ended March 31, 2015, the total amount of all open futures contracts, as presented in the table above, are representative of the volume of activity for this derivative type during the period.
Percentages are based on Net Assets of $571,449 ($Thousands)
| * | Non-income producing security. |
| ** | Rate shown is the 7-day effective yield as of March 31, 2015. |
| † | Real Estate Investment Trust. |
| †† | Investment in Affiliated Security (see Note 6). |
| (A) | Certain securities or partial positions of certain securities are on loan at March 31, 2015 (see Note 7). The total market value of securities on loan at March 31, 2015 was $37,842 ($ Thousands) |
| (B) | This security was purchased with cash collateral held from securities on loan (see Note 7). The total market value of such securities as of March 31, 2015 was $39,269 ($Thousands). |
| (C) | Security, or portion thereof, has been pledged as collateral on open futures contracts. |
Cl — Class
L.P. — Limited Partnership
The Summary Schedule of Investments does not reflect the complete portfolio holdings. It includes the Fund’s 50 largest holdings and each investment of any issuer that exceeds 1% of the Fund’s net assets. “Other Securities” represent all issues not required to be disclosed under the rules adopted by the U.S. Securities and Exchange Commission (“SEC”). In certain instances, securities for which footnotes listed above may otherwise apply are included in the Other Securities caption. The complete schedule of portfolio holdings is available (i) without charge, upon request, by calling (800) 342-5734; and (ii) on the SEC’s website at http://www.sec.gov.
The following is a summary of the inputs used as of March 31, 2015, in valuing the Fund’s investments carried at value ($ Thousands):
| Investments in Securities | Level 1 | Level 2 | Level 3 | Total | ||||||||||||
Common Stock | $ | 539,154 | $ | — | $ | — | $ | 539,154 | ||||||||
Exchange Traded Funds | 2,185 | — | — | 2,185 | ||||||||||||
Rights | — | — | — | — | ||||||||||||
Affiliated Partnership | — | 39,269 | — | 39,269 | ||||||||||||
Cash Equivalent | 30,029 | — | — | 30,029 | ||||||||||||
U.S. Treasury Obligations | — | 1,836 | — | 1,836 | ||||||||||||
|
|
|
|
|
|
|
| |||||||||
Total Investments in Securities | $ | 571,368 | $ | 41,105 | $ | — | $ | 612,473 | ||||||||
|
|
|
|
|
|
|
| |||||||||
| Other Financial Instruments | Level 1 | Level 2 | Level 3 | Total | ||||||||||||
Futures Contracts* | ||||||||||||||||
Unrealized Appreciation | $ | 483 | $ | — | $ | — | $ | 483 | ||||||||
|
|
|
|
|
|
|
| |||||||||
Total Other Financial Instruments | $ | 483 | $ | — | $ | — | $ | 483 | ||||||||
|
|
|
|
|
|
|
| |||||||||
| * | Futures contracts are valued at unrealized appreciation on the instrument. |
For the period ended March 31, 2015, there were no transfers between Level 1 and Level 2 assets and liabilities.
For the period ended March 31, 2015, there were no transfers between Level 2 and Level 3 assets and liabilities.
For the period ended March 31, 2015, there were no level 3 investments.
For more information on valuation inputs, see Note 2 — Significant Accounting Policies in Notes to Financial Statements.
Amounts designated as “—” are $0 or have been rounded to $0.
The accompanying notes are an integral part of the financial statements.
| 12 | SEI Institutional Managed Trust / Semi-Annual Report / March 31, 2015 |
SUMMARY SCHEDULE OF INVESTMENTS (Unaudited)
Small Cap Value Fund
March 31, 2015
| Description | Percentage of Net Assets (%) | Shares | Market Value ($ Thousands) | |||||||||
COMMON STOCK — 95.3%‡ |
| |||||||||||
Consumer Discretionary — 11.2% |
| |||||||||||
Big Lots | 0.4 | % | 31,745 | $ | 1,525 | |||||||
Matthews International, Cl A | 0.4 | 33,320 | 1,716 | |||||||||
MDC Partners, Cl A | 0.4 | 53,800 | 1,525 | |||||||||
Vail Resorts | 0.4 | 15,889 | 1,643 | |||||||||
Wolverine World Wide | 0.4 | 45,155 | 1,510 | |||||||||
Other Securities | 9.2 | 36,140 | ||||||||||
|
| |||||||||||
| 44,059 | ||||||||||||
|
| |||||||||||
Consumer Staples — 2.6% |
| |||||||||||
SpartanNash | 0.5 | 58,865 | 1,858 | |||||||||
Other Securities | 2.1 | 8,274 | ||||||||||
|
| |||||||||||
| 10,132 | ||||||||||||
|
| |||||||||||
Energy — 4.0% |
| |||||||||||
Scorpio Tankers (A) | 0.4 | 183,900 | 1,732 | |||||||||
Superior Energy Services | 0.4 | 64,235 | 1,435 | |||||||||
Other Securities | 3.2 | 12,638 | ||||||||||
|
| |||||||||||
| 15,805 | ||||||||||||
|
| |||||||||||
Financials — 35.8% |
| |||||||||||
Brandywine Realty Trust† | 0.5 | 110,005 | 1,758 | |||||||||
Central Pacific Financial | 0.4 | 69,700 | 1,601 | |||||||||
CNO Financial Group | 0.7 | 168,120 | 2,895 | |||||||||
Eagle Bancorp* | 0.5 | 50,306 | 1,932 | |||||||||
Education Realty Trust† | 0.4 | 42,699 | 1,511 | |||||||||
Employers Holdings | 0.5 | 74,420 | 2,009 | |||||||||
Fulton Financial | 0.5 | 144,560 | 1,784 | |||||||||
GEO Group† | 0.4 | 36,800 | 1,610 | |||||||||
Hanover Insurance Group, Cl A | 1.1 | 61,828 | 4,488 | |||||||||
Highwoods Properties† | 0.4 | 33,110 | 1,516 | |||||||||
IBERIABANK | 0.6 | 34,968 | 2,204 | |||||||||
Investors Bancorp | 0.5 | 178,684 | 2,094 | |||||||||
PacWest Bancorp | 0.5 | 38,016 | 1,783 | |||||||||
Popular* | 0.5 | 61,700 | 2,122 | |||||||||
StanCorp Financial Group | 0.4 | 21,625 | 1,483 | |||||||||
| Description | Percentage of Net Assets (%) | Shares | Market Value ($ Thousands) | |||||||||
TCF Financial | 0.5 | % | 122,010 | $ | 1,918 | |||||||
Webster Financial | 0.5 | 57,130 | 2,117 | |||||||||
Western Alliance Bancorp* | 0.5 | 67,705 | 2,007 | |||||||||
Wintrust Financial | 0.4 | 31,605 | 1,507 | |||||||||
Other Securities | 26.0 | 102,919 | ||||||||||
|
| |||||||||||
| 141,258 | ||||||||||||
|
| |||||||||||
Health Care — 5.9% |
| |||||||||||
Accuray* (A) | 0.4 | 170,500 | 1,586 | |||||||||
Amsurg* | 0.6 | 37,987 | 2,337 | |||||||||
Greatbatch* | 0.4 | 24,770 | 1,433 | |||||||||
HealthSouth | 0.4 | 36,300 | 1,610 | |||||||||
Prestige Brands Holdings, Cl A* | 0.4 | 36,778 | 1,577 | |||||||||
Other Securities | 3.7 | 14,715 | ||||||||||
|
| |||||||||||
| 23,258 | ||||||||||||
|
| |||||||||||
Industrials — 15.8% |
| |||||||||||
Barnes Group | 0.5 | 48,340 | 1,957 | |||||||||
Curtiss-Wright | 0.7 | 38,929 | 2,878 | |||||||||
EMCOR Group | 0.4 | 33,291 | 1,547 | |||||||||
G&K Services | 0.4 | 22,171 | 1,608 | |||||||||
Great Lakes Dredge & Dock* | 0.4 | 279,800 | 1,682 | |||||||||
Huron Consulting Group* | 0.4 | 24,998 | 1,654 | |||||||||
Kadant | 0.4 | 33,737 | 1,775 | |||||||||
Tutor Perini* | 0.5 | 86,500 | 2,020 | |||||||||
Other Securities | 12.1 | 47,358 | ||||||||||
|
| |||||||||||
| 62,479 | ||||||||||||
|
| |||||||||||
Information Technology — 11.6% |
| |||||||||||
Belden | 0.4 | 15,566 | 1,456 | |||||||||
Cadence Design Systems* | 0.4 | 81,651 | 1,506 | |||||||||
Mentor Graphics | 0.4 | 59,540 | 1,431 | |||||||||
Other Securities | 10.4 | 41,422 | ||||||||||
|
| |||||||||||
| 45,815 | ||||||||||||
|
| |||||||||||
Materials — 3.8% | ||||||||||||
Berry Plastics Group* | 0.4 | 46,399 | 1,679 | |||||||||
Sensient Technologies | 0.6 | 34,146 | 2,352 | |||||||||
Other Securities | 2.8 | 11,082 | ||||||||||
|
| |||||||||||
| 15,113 | ||||||||||||
|
| |||||||||||
Telecommunication Services — 0.5% |
| |||||||||||
Other Securities | 0.5 | 2,089 | ||||||||||
|
| |||||||||||
Utilities — 4.1% |
| |||||||||||
ALLETE | 0.5 | 36,960 | 1,950 | |||||||||
PNM Resources | 0.6 | 78,110 | 2,281 | |||||||||
Portland General Electric (A) | 0.9 | 91,532 | 3,395 | |||||||||
UIL Holdings | 0.5 | 35,885 | 1,845 | |||||||||
Other Securities | 1.6 | 6,828 | ||||||||||
|
| |||||||||||
| 16,299 | ||||||||||||
|
| |||||||||||
Total Common Stock |
| 376,307 | ||||||||||
|
| |||||||||||
| SEI Institutional Managed Trust / Semi-Annual Report / March 31, 2015 | 13 |
SUMMARY SCHEDULE OF INVESTMENTS (Unaudited)
Small Cap Value Fund (Concluded)
March 31, 2015
| Description | Percentage of Net Assets (%) | Shares | Market Value ($ Thousands) | |||||||||
EXCHANGE TRADED FUNDS — 0.8% |
| |||||||||||
iShares Russell 2000 ETF (A) | 0.4 | % | 12,748 | $ | 1,585 | |||||||
Other Securities | 0.4 | 1,424 | ||||||||||
|
| |||||||||||
Total Exchange Traded Funds |
| 3,009 | ||||||||||
|
| |||||||||||
AFFILIATED PARTNERSHIP — 5.7% |
| |||||||||||
SEI Liquidity Fund, L.P. | 5.7 | 22,692,422 | 22,692 | |||||||||
|
| |||||||||||
Total Affiliated Partnership |
| 22,692 | ||||||||||
|
| |||||||||||
CASH EQUIVALENT — 3.8% |
| |||||||||||
SEI Daily Income Trust, | 3.8 | 15,188,549 | 15,189 | |||||||||
|
| |||||||||||
Total Cash Equivalent |
| 15,189 | ||||||||||
|
| |||||||||||
U.S. TREASURY OBLIGATIONS (C) — 0.3% |
| |||||||||||
Other Securities | 0.3 | 1,100 | ||||||||||
|
| |||||||||||
Total U.S. Treasury Obligations |
| 1,100 | ||||||||||
|
| |||||||||||
Total Investments — 105.9% |
| $ | 418,297 | |||||||||
|
| |||||||||||
The open futures contracts held by the Fund at March 31, 2015, are as follows:
| Type of Contract | Number of Contracts Long (Short) | Expiration Date | Unrealized ($ Thousands) | |||||||||
Russell 2000 Index E-MINI | 80 | Jun-2015 | $ | 309 | ||||||||
|
| |||||||||||
For the period ended March 31, 2015, the total amount of all open futures contracts, as presented in the table above, are representative of the volume of activity for this derivative type during the period.
Percentages are based on Net Assets of $394,920 ($Thousands).
| * | Non-income producing security. |
| ** | Rate shown is the 7-day effective yield as of March 31, 2015. |
| † | Real Estate Investment Trust. |
| †† | Investment in Affiliated Security (see Note 3). |
| ‡ | Narrow Industries are utilized for compliance purposes, whereas broad sectors are utilized for reporting. |
| (A) | This Security or a partial position of this security is on loan at March 31, 2015 (see Note 10). The total market value of securities on loan at March 31, 2015 was $21,791 ($ Thousands) |
| (B) | This security was purchased with cash collateral held from securities on loan (see note 10). The total market value of such securities as of March 31, 2015 was $22,692 ($Thousands). |
| (C) | Security, or portion thereof, has been pledged as collateral on open futures contracts. |
Cl — Class
ETF — Exchange Traded Fund
L.P. — Limited Partnership
The Summary Schedule of Investments does not reflect the complete portfolio holdings. It includes the Fund’s 50 largest holdings and each investment of any issuer that exceeds 1% of the Fund’s net assets. “Other Securities” represent all issues not required to be
disclosed under the rules adopted by the U.S. Securities and Exchange Commission (“SEC”). In certain instances, securities for which footnotes listed above may otherwise apply are included in the Other Securities caption. The complete schedule of portfolio holdings is available (i) without charge, upon request, by calling (800) 342-5734; and (ii) on the SEC’s website at http://www.sec.gov.
The following is a summary of the inputs used as of March 31, 2015, in valuing the Fund’s investments carried at value ($ Thousands):
| Investments in Securities | Level 1 | Level 2 | Level 3 | Total | ||||||||||||
Common Stock | $ | 376,307 | $ | — | $ | — | $ | 376,307 | ||||||||
Exchange Traded Funds | 3,009 | — | — | 3,009 | ||||||||||||
Affiliated Partnership | — | 22,692 | — | 22,692 | ||||||||||||
Cash Equivalent | 15,189 | — | — | 15,189 | ||||||||||||
U.S. Treasury Obligations | — | 1,100 | — | 1,100 | ||||||||||||
|
|
|
|
|
|
|
| |||||||||
Total Investments in Securities | $ | 394,505 | $ | 23,792 | $ | — | $ | 418,297 | ||||||||
|
|
|
|
|
|
|
| |||||||||
| Other Financial Instruments | Level 1 | Level 2 | Level 3 | Total | ||||||||||||
Futures Contracts* | ||||||||||||||||
Unrealized Appreciation | $ | 309 | $ | — | $ | — | $ | 309 | ||||||||
|
|
|
|
|
|
|
| |||||||||
Total Other Financial Instruments | $ | 309 | $ | — | $ | — | $ | 309 | ||||||||
|
|
|
|
|
|
|
| |||||||||
| * | Futures contracts are valued at unrealized appreciation on the instrument. |
For the period ended March 31, 2015, there were no transfers between Level 1 and Level 2 assets and liabilities.
For the period ended March 31, 2015, there were no transfers between Level 2 and Level 3 assets and liabilities.
For the period ended March 31, 2015, there were no Level 3 investments.
For more information on valuation inputs, see Note 2 — Significant Accounting Policies in Notes to Financial Statements.
Amounts designated as “—” are $0 or have been rounded to $0.
The accompanying notes are an integral part of the financial statements.
| 14 | SEI Institutional Managed Trust / Semi-Annual Report / March 31, 2015 |
SUMMARY SCHEDULE OF INVESTMENTS (Unaudited)
Small Cap Growth Fund
March 31, 2015
| Description | Percentage of Net Assets (%) | Shares | Market Value ($ Thousands) | |||||||||
COMMON STOCK — 97.1%‡ |
| |||||||||||
Consumer Discretionary — 16.3% |
| |||||||||||
2U* | 0.6 | % | 88,881 | $ | 2,274 | |||||||
Carter’s | 0.4 | 14,722 | 1,361 | |||||||||
Fiesta Restaurant Group* | 0.4 | 23,493 | 1,433 | |||||||||
Five Below* | 0.6 | 64,243 | 2,285 | |||||||||
Jack in the Box | 0.5 | 20,130 | 1,931 | |||||||||
National CineMedia | 0.5 | 120,060 | 1,813 | |||||||||
Pool | 0.4 | 21,581 | 1,506 | |||||||||
Wolverine World Wide (A) | 0.6 | 63,803 | 2,134 | |||||||||
Other Securities | 12.3 | 45,626 | ||||||||||
|
| |||||||||||
| 60,363 | ||||||||||||
|
| |||||||||||
Consumer Staples — 2.1% |
| |||||||||||
Other Securities | 2.1 | 7,751 | ||||||||||
|
| |||||||||||
Energy — 3.0% |
| |||||||||||
Other Securities | 3.0 | 10,862 | ||||||||||
|
| |||||||||||
Financials — 6.0% |
| |||||||||||
Bank of the Ozarks (A) | 0.4 | 40,523 | 1,496 | |||||||||
Financial Engines (A) | 0.4 | 34,123 | 1,427 | |||||||||
Other Securities | 5.2 | 18,950 | ||||||||||
|
| |||||||||||
| 21,873 | ||||||||||||
|
| |||||||||||
Health Care — 25.2%‡ |
| |||||||||||
Acadia Healthcare, Cl A* (A) | 1.0 | 51,789 | 3,708 | |||||||||
Akorn* (A) | 0.5 | 36,926 | 1,754 | |||||||||
Cambrex* | 0.4 | 34,533 | 1,369 | |||||||||
DexCom* | 0.6 | 35,086 | 2,187 | |||||||||
HealthSouth | 0.4 | 31,729 | 1,407 | |||||||||
Isis Pharmaceuticals* (A) | 0.5 | 28,936 | 1,842 | |||||||||
LDR Holding* | 0.5 | 53,626 | 1,965 | |||||||||
Nevro* | 0.4 | 26,821 | 1,286 | |||||||||
Puma Biotechnology* | 0.5 | 7,340 | 1,733 | |||||||||
Receptos* | 0.5 | 11,233 | 1,852 | |||||||||
Other Securities | 19.9 | 73,714 | ||||||||||
|
| |||||||||||
| 92,817 | ||||||||||||
|
| |||||||||||
| Description | Percentage of Net Assets (%) | Shares | Market Value ($ Thousands) | |||||||||
Industrials — 16.3% |
| |||||||||||
Acuity Brands | 0.4 | % | 8,778 | $ | 1,476 | |||||||
Carlisle | 0.4 | 16,790 | 1,555 | |||||||||
Clean Harbors* (A) | 0.5 | 35,520 | 2,017 | |||||||||
Corporate Executive Board | 0.6 | 26,167 | 2,090 | |||||||||
Dycom Industries* | 0.4 | 30,720 | 1,500 | |||||||||
H&E Equipment Services | 0.3 | 52,297 | 1,307 | |||||||||
Heico, Cl A | 0.4 | 28,385 | 1,406 | |||||||||
Heritage-Crystal Clean* | 0.4 | 127,334 | 1,490 | |||||||||
Hexcel, Cl A | 0.6 | 39,107 | 2,011 | |||||||||
Middleby* | 0.4 | 14,907 | 1,530 | |||||||||
Trex* | 0.4 | 27,404 | 1,494 | |||||||||
Other Securities | 11.5 | 42,448 | ||||||||||
|
| |||||||||||
| 60,324 | ||||||||||||
|
| |||||||||||
Information Technology — 25.2% |
| |||||||||||
Aspen Technology* | 0.5 | 49,867 | 1,919 | |||||||||
Cavium* | 0.8 | 43,473 | 3,079 | |||||||||
CoStar Group* | 0.4 | 7,809 | 1,545 | |||||||||
Dealertrack Technologies* | 0.6 | 53,780 | 2,072 | |||||||||
Demandware* (A) | 0.4 | 22,690 | 1,382 | |||||||||
Envestnet* | 0.6 | 42,154 | 2,364 | |||||||||
Euronet Worldwide* | 0.5 | 31,905 | 1,874 | |||||||||
Fortinet* | 0.4 | 43,957 | 1,536 | |||||||||
Guidewire Software, Cl Z* (A) | 0.6 | 40,463 | 2,129 | |||||||||
Infoblox* | 0.6 | 90,773 | 2,167 | |||||||||
MAXIMUS | 0.5 | 25,781 | 1,721 | |||||||||
Monolithic Power Systems | 0.4 | 29,147 | 1,535 | |||||||||
Proofpoint* | 0.6 | 36,553 | 2,165 | |||||||||
Qorvo* | 0.6 | 29,424 | 2,345 | |||||||||
SolarWinds* | 0.6 | 45,446 | 2,329 | |||||||||
SPS Commerce* | 0.5 | 28,242 | 1,895 | |||||||||
Tableau Software, Cl A* | 0.5 | 18,371 | 1,700 | |||||||||
Ultimate Software Group* | 0.4 | 8,426 | 1,432 | |||||||||
Other Securities | 15.7 | 57,793 | ||||||||||
|
| |||||||||||
| 92,982 | ||||||||||||
|
| |||||||||||
Materials — 2.3% |
| |||||||||||
Other Securities | 2.3 | 8,199 | ||||||||||
|
| |||||||||||
Telecommunication Services — 0.6% |
| |||||||||||
RingCentral, Cl A* (A) | 0.4 | 99,135 | 1,520 | |||||||||
Other Securities | 0.2 | 857 | ||||||||||
|
| |||||||||||
| 2,377 | ||||||||||||
|
| |||||||||||
Utilities — 0.1% |
| |||||||||||
Other Securities | 0.1 | 404 | ||||||||||
|
| |||||||||||
Total Common Stock |
| 357,952 | ||||||||||
|
| |||||||||||
| SEI Institutional Managed Trust / Semi-Annual Report / March 31, 2015 | 15 |
SUMMARY SCHEDULE OF INVESTMENTS (Unaudited)
Small Cap Growth Fund (Concluded)
March 31, 2015
| Description | Percentage of Net Assets (%) | Shares | Market Value ($ Thousands) | |||||||||
EXCHANGE TRADED FUND — 0.2% |
| |||||||||||
Other Securities | 0.2 | % | $ | 915 | ||||||||
|
| |||||||||||
Total Exchange Traded Fund |
| 915 | ||||||||||
|
| |||||||||||
PREFERRED STOCK — 0.0% |
| |||||||||||
Other Securities | 0.0 | 65 | ||||||||||
|
| |||||||||||
Total Preferred Stock |
| 65 | ||||||||||
|
| |||||||||||
RIGHTS — 0.0% | ||||||||||||
Other Securities | 0.0 | — | ||||||||||
|
| |||||||||||
Total Rights |
| — | ||||||||||
|
| |||||||||||
AFFILIATED PARTNERSHIP — 11.6% |
| |||||||||||
SEI Liquidity Fund, L.P. 0.070%**†† (B) | 11.6 | 42,956,281 | 42,956 | |||||||||
|
| |||||||||||
Total Affiliated Partnership |
| 42,956 | ||||||||||
|
| |||||||||||
CASH EQUIVALENT — 2.8% |
| |||||||||||
SEI Daily Income Trust, Prime Obligation Fund, Cl A | ||||||||||||
0.010%**†† | 2.8 | 10,240,255 | 10,240 | |||||||||
|
| |||||||||||
Total Cash Equivalent |
| 10,240 | ||||||||||
|
| |||||||||||
U.S. TREASURY OBLIGATIONS (C) — 0.3% |
| |||||||||||
Other Securities | 0.3 | 950 | ||||||||||
|
| |||||||||||
Total U.S. Treasury Obligations |
| 950 | ||||||||||
|
| |||||||||||
Total Investments — 112.0% |
| $ | 413,078 | |||||||||
|
| |||||||||||
The open futures contracts held by the Fund at March 31, 2015, are as follows:
| Type of Contract | Number of Contracts Long (Short) | Expiration Date | Unrealized Appreciation ($ Thousands) | |||||||||
Russell 2000 Index E-M INI | 10 | Jun-2015 | $ | 35 | ||||||||
|
| |||||||||||
For the period ended March 31, 2015, the total amount of all open futures contracts, as presented in the table above, are representative of the volume of activity for this derivative type during the period.
Percentages are based on Net Assets of $368,828 ($Thousands).
| * | Non-income producing security. |
| ** | Rate shown is the 7-day effective yield as of March 31, 2015. |
| ‡ | Narrow Industries are utilized for compliance purposes, whereas broad sectors are utilized for reporting. |
| †† | Investment in Affiliated Security (see Note 3). |
| (A) | This Security or a partial position of this security is on loan at March 31, 2015 (see Note 7). The total market value of securities on loan at March 31, 2015 was $40,093 ($ Thousands) |
| (B) | This security was purchased with cash collateral held from securities on loan (see note 7). The total market value of such securities as of March 31, 2015 was $42,956 ($Thousands). |
| (C) | Security, or a portion thereof, has been pledged as collateral on open futures contracts. |
ADR — American Depositary Receipt
Cl — Class
ETF — Exchange-Traded Fund
L.P. — Limited Partnership
The Summary Schedule of Investments does not reflect the complete portfolio holdings. It includes the Fund’s 50 largest holdings and each investment of any issuer that exceeds 1% of the Fund’s net assets. “Other Securities” represent all issues not required to be disclosed under the rules adopted by the U.S. Securities and Exchange Commission (“SEC”). In certain instances, securities for which footnotes listed above may otherwise apply are included in the Other Securities caption. The complete schedule of portfolio holdings is available (i) without charge, upon request, by calling (800) 342-5734; and (ii) on the SEC’s website at http://www.sec.gov.
The following is a summary of the inputs used as of March 31, 2015, in valuing the Fund’s investments carried at value ($ Thousands):
| Investments in Securities | Level 1 | Level 2 | Level 3(1) | Total | ||||||||||||
Common Stock | $ | 357,891 | $ | — | $ | 61 | $ | 357,952 | ||||||||
Exchange Traded Fund | 915 | — | — | 915 | ||||||||||||
Preferred Stock | — | 65 | — | 65 | ||||||||||||
Rights | — | — | — | — | ||||||||||||
Affiliated Partnership | — | 42,956 | — | 42,956 | ||||||||||||
Cash Equivalent | 10,240 | — | — | 10,240 | ||||||||||||
U.S. Treasury Obligations | — | 950 | — | 950 | ||||||||||||
|
|
|
|
|
|
|
| |||||||||
Total Investments in Securities | $ | 369,046 | $ | 43,971 | $ | 61 | $ | 413,078 | ||||||||
|
|
|
|
|
|
|
| |||||||||
| Other Financial Instruments | Level 1 | Level 2 | Level 3 | Total | ||||||||||||
Futures Contracts* | ||||||||||||||||
Unrealized appreciation | $ | 35 | $ | — | $ | — | $ | 35 | ||||||||
|
|
|
|
|
|
|
| |||||||||
Total Other Financial Instruments | $ | 35 | $ | — | $ | — | $ | 35 | ||||||||
|
|
|
|
|
|
|
| |||||||||
| * | Futures contracts are valued at unrealized appreciation on the instrument. |
| (1) | A reconciliation of Level 3 investments is presented when the Fund has a significant amount of Level 3 investments at the beginning and/or end of the period in relation to the net assets. |
For the period ended March 31, 2015, there were no transfers between Level 1 and Level 2 assets and liabilities.
For the period ended March 31, 2015, there were no transfers between Level 2 and Level 3 assets and liabilities.
For the period ended March 31, 2015, there were no Level 3 investments.
For more information on valuation inputs, see Note 2 — Significant Accounting Policies in Notes to Financial Statements.
Amounts designated as “—” are $0 or have been rounded to $0.
The accompanying notes are an integral part of the financial statements.
| 16 | SEI Institutional Managed Trust / Semi-Annual Report / March 31, 2015 |
SUMMARY SCHEDULE OF INVESTMENTS (Unaudited)
Tax-Managed Small/Mid Cap Fund
March 31, 2015
| Description | Percentage of Net Assets (%) | Shares | Market Value ($ Thousands) | |||||||||
COMMON STOCK — 93.9% |
| |||||||||||
Consumer Discretionary — 13.3% |
| |||||||||||
Big Lots | 0.3 | % | 35,551 | $ | 1,707 | |||||||
Brunswick | 0.3 | 43,408 | 2,233 | |||||||||
Penn National Gaming* | 0.4 | 148,358 | 2,323 | |||||||||
Sally Beauty Holdings* | 0.3 | 62,468 | 2,147 | |||||||||
Other Securities | 12.0 | 80,041 | ||||||||||
|
| |||||||||||
| 88,451 | ||||||||||||
|
| |||||||||||
Consumer Staples — 3.1% |
| |||||||||||
Other Securities | 3.1 | 20,686 | ||||||||||
|
| |||||||||||
Energy — 3.2% |
| |||||||||||
PBF Energy, Cl A | 0.3 | 56,660 | 1,922 | |||||||||
Other Securities | 2.9 | 19,252 | ||||||||||
|
| |||||||||||
| 21,174 | ||||||||||||
|
| |||||||||||
Financials — 19.1% |
| |||||||||||
CNO Financial Group | 0.3 | 105,066 | 1,809 | |||||||||
East West Bancorp | 0.3 | 49,395 | 1,999 | |||||||||
First Niagara Financial Group | 0.3 | 193,795 | 1,713 | |||||||||
Hanover Insurance Group, Cl A | 0.5 | 40,984 | 2,975 | |||||||||
PacWest Bancorp | 0.5 | 74,451 | 3,491 | |||||||||
Pebblebrook Hotel Trust† | 0.3 | 47,337 | 2,205 | |||||||||
TCF Financial | 0.3 | 132,731 | 2,087 | |||||||||
Western Alliance Bancorp* | 0.3 | 70,979 | 2,104 | |||||||||
Other Securities | 16.3 | 107,889 | ||||||||||
|
| |||||||||||
| 126,272 | ||||||||||||
|
| |||||||||||
Health Care — 15.5% |
| |||||||||||
Acadia Healthcare, Cl A* | 0.6 | 54,196 | 3,880 | |||||||||
Akorn* | 0.6 | 82,788 | 3,933 | |||||||||
Amsurg* | 0.3 | 34,469 | 2,121 | |||||||||
Charles River Laboratories International* | 0.4 | 29,906 | 2,371 | |||||||||
Greatbatch* | 0.3 | 31,203 | 1,805 | |||||||||
| Description | Percentage of Net Assets (%) | Shares | Market Value ($ Thousands) | |||||||||
Health Net, Cl A* | 0.3 | % | 28,410 | $ | 1,719 | |||||||
Humana | 0.3 | 11,175 | 1,989 | |||||||||
Isis Pharmaceuticals* (A) | 0.3 | 26,940 | 1,715 | |||||||||
Jazz Pharmaceuticals* | 0.4 | 13,364 | 2,309 | |||||||||
MEDNAX* | 0.3 | 27,690 | 2,008 | |||||||||
Team Health Holdings* | 0.4 | 46,665 | 2,730 | |||||||||
TESARO* | 0.3 | 29,683 | 1,704 | |||||||||
United Therapeutics* | 0.3 | 10,414 | 1,796 | |||||||||
Other Securities | 10.7 | 72,435 | ||||||||||
|
| |||||||||||
| 102,515 | ||||||||||||
|
| |||||||||||
Industrials — 14.1% |
| |||||||||||
Acuity Brands | 0.3 | 11,976 | 2,014 | |||||||||
Carlisle | 0.3 | 24,197 | 2,241 | |||||||||
Curtiss-Wright | 0.3 | 29,201 | 2,159 | |||||||||
EMCOR Group | 0.3 | 42,960 | 1,996 | |||||||||
G&K Services | 0.3 | 26,335 | 1,910 | |||||||||
Hexcel, Cl A (A) | 0.3 | 38,441 | 1,977 | |||||||||
Middleby* | 0.3 | 18,565 | 1,906 | |||||||||
Moog, Cl A* | 0.3 | 23,071 | 1,732 | |||||||||
Regal-Beloit | 0.3 | 22,673 | 1,812 | |||||||||
Other Securities | 11.4 | 75,951 | ||||||||||
|
| |||||||||||
| 93,698 | ||||||||||||
|
| |||||||||||
Information Technology — 17.1% |
| |||||||||||
Belden | 0.3 | 20,653 | 1,932 | |||||||||
Cadence Design Systems* | 0.6 | 196,641 | 3,626 | |||||||||
CoStar Group* | 0.4 | 13,719 | 2,714 | |||||||||
Electronic Arts* | 0.3 | 30,159 | 1,774 | |||||||||
j2 Global | 0.3 | 32,545 | 2,137 | |||||||||
LogMeIn* | 0.3 | 35,792 | 2,004 | |||||||||
Palo Alto Networks* | 0.3 | 13,214 | 1,930 | |||||||||
PTC* | 0.4 | 74,811 | 2,706 | |||||||||
SolarWinds* | 0.3 | 38,985 | 1,998 | |||||||||
Ultimate Software Group* | 0.3 | 10,428 | 1,772 | |||||||||
Zebra Technologies, Cl A* | 0.3 | 19,739 | 1,791 | |||||||||
Other Securities | 13.3 | 88,587 | ||||||||||
|
| |||||||||||
| 112,971 | ||||||||||||
|
| |||||||||||
Materials — 4.7% | ||||||||||||
PolyOne | 0.5 | 78,604 | 2,936 | |||||||||
Sensient Technologies | 0.3 | 30,569 | 2,106 | |||||||||
Silgan Holdings | 0.4 | 46,881 | 2,725 | |||||||||
Other Securities | 3.5 | 23,476 | ||||||||||
|
| |||||||||||
| 31,243 | ||||||||||||
|
| |||||||||||
Telecommunication Services — 0.5% |
| |||||||||||
Other Securities | 0.5 | 3,200 | ||||||||||
|
| |||||||||||
| SEI Institutional Managed Trust / Semi-Annual Report / March 31, 2015 | 17 |
SUMMARY SCHEDULE OF INVESTMENTS (Unaudited)
Tax-Managed Small/Mid Cap Fund (Concluded)
March 31, 2015
| Description | Percentage of Net Assets (%) | Shares | Market Value ($ Thousands) | |||||||||
Utilities — 3.3% |
| |||||||||||
Portland General Electric | 0.6 | % | 100,050 | $ | 3,711 | |||||||
Other Securities | 2.7 | 18,113 | ||||||||||
|
| |||||||||||
| 21,824 | ||||||||||||
|
| |||||||||||
Total Common Stock |
| 622,034 | ||||||||||
|
| |||||||||||
EXCHANGE TRADED FUND — 0.2% |
| |||||||||||
Other Securities | 0.2 | 1,009 | ||||||||||
|
| |||||||||||
Total Exchange Traded Fund |
| 1,009 | ||||||||||
|
| |||||||||||
RIGHTS — 0.0% | ||||||||||||
Other Securities | 0.0 | 12 | ||||||||||
|
| |||||||||||
Total Rights | 12 | |||||||||||
|
| |||||||||||
WARRANT — 0.0% |
| |||||||||||
Other Securities | 0.0 | — | ||||||||||
|
| |||||||||||
Total Warrant |
| — | ||||||||||
|
| |||||||||||
AFFILIATED PARTNERSHIP — 8.1% |
| |||||||||||
SEI Liquidity Fund, L.P. | 8.1 | 53,582,303 | 53,582 | |||||||||
|
| |||||||||||
Total Affiliated Partnership |
| 53,582 | ||||||||||
|
| |||||||||||
CASH EQUIVALENT — 5.7% |
| |||||||||||
SEI Daily Income Trust, | 5.7 | 37,844,702 | 37,845 | |||||||||
|
| |||||||||||
Total Cash Equivalent |
| 37,845 | ||||||||||
|
| |||||||||||
U.S. TREASURY OBLIGATIONS (C) — 0.2% |
| |||||||||||
Other Securities | 0.2 | 1,400 | ||||||||||
|
| |||||||||||
Total U.S. Treasury Obligations |
| 1,400 | ||||||||||
|
| |||||||||||
Total Investments — 108.1% |
| $ | 715,882 | |||||||||
|
| |||||||||||
The open futures contracts held by the Fund at March 31, 2015, are as follows:
| Type of Contract | Number of Contracts Long (Short) | Expiration Date | Unrealized Appreciation ($ Thousands) | |||||||||
Russell 2000 Index E-MINI | 92 | Jun-2015 | $ | 323 | ||||||||
S&P M id 400 Index E-MINI | 80 | Jun-2015 | 303 | |||||||||
|
| |||||||||||
| $ | 626 | |||||||||||
|
| |||||||||||
For the period ended March 31, 2015, the total amount of all open futures contracts, as presented in the table above, are representative of the volume of activity for this derivative type during the period.
Percentages are based on Net Assets of $662,429 ($Thousands).
| * | Non-income producing security. |
| ** | Rate shown is the 7-day effective yield as of March 31, 2015. |
| † | Real Estate Investment Trust. |
| †† | Investment in Affiliated Security (see Note 3). |
| (A) | This Security or a partial position of this security is on loan at March 31, 2015 (see Note 7). The total market value of securities on loan at March 31, 2015 was $52,082 ($ Thousands) |
| (B) | This security was purchased with cash collateral held from securities on loan (see note 7). The total market value of such securities as of March 31, 2015 was $53,582 ($Thousands). |
| (C) | Security, or portion thereof, has been pledged as collateral on open futures contracts. |
Cl — Class
L.P. — Limited Partnership
S&P — Standard & Poor’s
The Summary Schedule of Investments does not reflect the complete portfolio holdings. It includes the Fund’s 50 largest holdings and each investment of any issuer that exceeds 1% of the Fund’s net assets. “Other Securities” represent all issues not required to be disclosed under the rules adopted by the U.S. Securities and Exchange Commission (“SEC”). In certain instances, securities for which footnotes listed above may otherwise apply are included in the Other Securities caption. The complete schedule of portfolio holdings is available (i) without charge, upon request, by calling (800) 342-5734; and (ii) on the SEC’s website at http://www.sec.gov.
The following is a summary of the inputs used as of March 31, 2015, in valuing the Fund’s investments carried at value ($ Thousands):
| Investments in Securities | Level 1 | Level 2 | Level 3 | Total | ||||||||||||
Common Stock | $ | 621,118 | $ | 916 | $ | — | $ | 622,034 | ||||||||
Exchange Traded Fund | 1,009 | — | — | 1,009 | ||||||||||||
Rights | 12 | — | — | 12 | ||||||||||||
Warrant | — | — | — | — | ||||||||||||
Affiliated Partnership | — | 53,582 | — | 53,582 | ||||||||||||
Cash Equivalent | 37,845 | — | — | 37,845 | ||||||||||||
U.S. Treasury Obligations | — | 1,400 | — | 1,400 | ||||||||||||
|
|
|
|
|
|
|
| |||||||||
Total Investments in Securities | $ | 659,984 | $ | 55,898 | $ | — | $ | 715,882 | ||||||||
|
|
|
|
|
|
|
| |||||||||
| Other Financial Instruments | Level 1 | Level 2 | Level 3 | Total | ||||||||||||
Futures Contracts* | ||||||||||||||||
Unrealized appreciation | $ | 626 | $ | — | $ | — | $ | 626 | ||||||||
|
|
|
|
|
|
|
| |||||||||
Total Other Financial Instruments | $ | 626 | $ | — | $ | — | $ | 626 | ||||||||
|
|
|
|
|
|
|
| |||||||||
| * | Futures contracts are valued at unrealized appreciation on the instrument. |
For the period ended March 31, 2015, there were no transfers between Level 1 and Level 2 assets and liabilities.
For the period ended March 31, 2015, there were no transfers between Level 2 and Level 3 assets and liabilities.
For the period ended March 31, 2015, there were no Level 3 investments.
For more information on valuation inputs, see Note 2 — Significant Accounting Policies in Notes to Financial Statements.
Amounts designated as “—” are $0 or have been rounded to $0.
The accompanying notes are an integral part of the financial statements.
| 18 | SEI Institutional Managed Trust / Semi-Annual Report / March 31, 2015 |
SUMMARY SCHEDULE OF INVESTMENTS (Unaudited)
Mid-Cap Fund
March 31, 2015
| Description | Percentage of Net Assets (%) | Shares | Market Value ($ Thousands) | |||||||||
COMMON STOCK (A) — 94.0% |
| |||||||||||
Consumer Discretionary — 15.1% |
| |||||||||||
Bed Bath & Beyond* | 0.7 | % | 7,800 | $ | 599 | |||||||
Chipotle Mexican Grill, Cl A* | 0.7 | 1,010 | 657 | |||||||||
Darden Restaurants | 0.7 | 8,900 | 617 | |||||||||
Foot Locker, Cl A | 0.7 | 10,000 | 630 | |||||||||
Gap | 0.7 | 13,900 | 602 | |||||||||
Kohl’s | 0.7 | 8,483 | 664 | |||||||||
Michael Kors Holdings* | 0.7 | 9,300 | 611 | |||||||||
Ross Stores | 0.9 | 7,500 | 790 | |||||||||
Ulta Salon Cosmetics & Fragrance* | 0.7 | 4,100 | 619 | |||||||||
Other Securities | 8.6 | 7,585 | ||||||||||
|
| |||||||||||
| 13,374 | ||||||||||||
|
| |||||||||||
Consumer Staples — 4.7% |
| |||||||||||
ConAgra Foods | 0.7 | 18,200 | 665 | |||||||||
Kroger | 0.9 | 11,000 | 843 | |||||||||
Monster Beverage* | 0.9 | 5,600 | 775 | |||||||||
Other Securities | 2.2 | 1,905 | ||||||||||
|
| |||||||||||
| 4,188 | ||||||||||||
|
| |||||||||||
Energy — 5.0% |
| |||||||||||
EQT | 0.7 | 7,400 | 613 | |||||||||
HollyFrontier | 0.7 | 15,400 | 620 | |||||||||
Oneok | 0.7 | 12,400 | 598 | |||||||||
Other Securities | 2.9 | 2,624 | ||||||||||
|
| |||||||||||
| 4,455 | ||||||||||||
|
| |||||||||||
Financials — 18.2% |
| |||||||||||
CBRE Group, Cl A* | 0.7 | 16,600 | 643 | |||||||||
Crown Castle International† | 0.9 | 9,500 | 784 | |||||||||
Fifth Third Bancorp | 0.7 | 35,100 | 662 | |||||||||
HCP† | 0.8 | 15,600 | 674 | |||||||||
Host Hotels & Resorts† | 0.7 | 29,000 | 585 | |||||||||
Invesco | 0.8 | 17,200 | 683 | |||||||||
Jones Lang LaSalle | 0.7 | 3,460 | 589 | |||||||||
KeyCorp | 0.7 | 43,800 | 620 | |||||||||
ProLogis† | 0.7 | 15,100 | 658 | |||||||||
| Description | Percentage of Net Assets (%) | Shares | Market Value ($ Thousands) | |||||||||
Regions Financial | 0.7 | % | 64,500 | $ | 609 | |||||||
Other Securities | 10.8 | 9,666 | ||||||||||
|
| |||||||||||
| 16,173 | ||||||||||||
|
| |||||||||||
Health Care — 12.9% |
| |||||||||||
AmerisourceBergen | 0.9 | 7,300 | 830 | |||||||||
Boston Scientific* | 0.9 | 46,700 | 829 | |||||||||
C.R. Bard | 0.7 | 3,500 | 586 | |||||||||
Cardinal Health | 0.9 | 9,200 | 831 | |||||||||
Cerner* | 0.8 | 10,300 | 755 | |||||||||
Edwards Lifesciences, Cl A* | 0.8 | 4,800 | 684 | |||||||||
Illumina* | 0.8 | 4,010 | 745 | |||||||||
Intuitive Surgical* | 0.7 | 1,240 | 626 | |||||||||
Mylan* | 0.9 | 13,200 | 783 | |||||||||
Quest Diagnostics | 0.7 | 7,800 | 600 | |||||||||
Other Securities | 4.8 | 4,217 | ||||||||||
|
| |||||||||||
| 11,486 | ||||||||||||
|
| |||||||||||
Industrials — 10.6% |
| |||||||||||
Acuity Brands | 0.6 | 3,500 | 588 | |||||||||
Alaska Air Group | 0.6 | 8,700 | 576 | |||||||||
Parker-Hannifin, Cl A | 0.7 | 5,600 | 665 | |||||||||
Southwest Airlines, Cl A | 1.0 | 19,500 | 864 | |||||||||
Other Securities | 7.7 | 6,743 | ||||||||||
|
| |||||||||||
| 9,436 | ||||||||||||
|
| |||||||||||
Information Technology — 15.3% |
| |||||||||||
Avago Technologies, Cl A | 1.1 | 7,400 | 940 | |||||||||
Broadcom, Cl A | 0.8 | 17,200 | 745 | |||||||||
Citrix Systems* | 0.7 | 9,200 | 588 | |||||||||
Intuit | 0.7 | 6,300 | 611 | |||||||||
Skyworks Solutions | 0.9 | 8,000 | 786 | |||||||||
Other Securities | 11.1 | 9,896 | ||||||||||
|
| |||||||||||
| 13,566 | ||||||||||||
|
| |||||||||||
Materials — 5.8% |
| |||||||||||
Sherwin-Williams, Cl A | 0.9 | 2,630 | 748 | |||||||||
Vulcan Materials | 0.7 | 6,900 | 582 | |||||||||
Other Securities | 4.2 | 3,803 | ||||||||||
|
| |||||||||||
| 5,133 | ||||||||||||
|
| |||||||||||
Utilities — 6.4% |
| |||||||||||
Consolidated Edison | 0.6 | 9,600 | 586 | |||||||||
Entergy | 0.7 | 8,100 | 628 | |||||||||
PPL | 0.8 | 22,200 | 747 | |||||||||
Public Service Enterprise Group | 0.8 | 16,300 | 683 | |||||||||
Other Securities | 3.5 | 3,046 | ||||||||||
|
| |||||||||||
| 5,690 | ||||||||||||
|
| |||||||||||
Total Common Stock |
| 83,501 | ||||||||||
|
| |||||||||||
| SEI Institutional Managed Trust / Semi-Annual Report / March 31, 2015 | 19 |
SUMMARY SCHEDULE OF INVESTMENTS (Unaudited)
Mid-Cap Fund (Concluded)
March 31, 2015
| Description | Percentage of Net Assets (%) | Shares | Market Value ($ Thousands) | |||||||||
AFFILIATED PARTNERSHIP — 0.8% |
| |||||||||||
SEI Liquidity Fund, L.P. | 0.8 | % | 694,257 | $ | 694 | |||||||
|
| |||||||||||
Total Affiliated Partnership |
| 694 | ||||||||||
|
| |||||||||||
CASH EQUIVALENT — 0.9% |
| |||||||||||
SEI Daily Income Trust, Prime Obligation Fund, Cl A | 0.9 | 782,954 | 783 | |||||||||
|
| |||||||||||
Total Cash Equivalent |
| 783 | ||||||||||
|
| |||||||||||
U.S. TREASURY OBLIGATIONS (C) — 0.5% |
| |||||||||||
Other Securities | 0.5 | 494 | ||||||||||
|
| |||||||||||
Total U.S. Treasury Obligations |
| 494 | ||||||||||
|
| |||||||||||
Total Investments — 96.2% |
| $ | 85,472 | |||||||||
|
| |||||||||||
The open futures contracts held by the Fund at March 31, 2015, are as follows:
| Type of Contract | Number of Contracts Long | Expiration Date | Unrealized Appreciation ($ Thousands) | |||||||||
S&P M id 400 Index E-M INI | 16 | Jun-2015 | $ | 21 | ||||||||
|
| |||||||||||
For the period ended March 31, 2015, the total amount of all open futures contracts, as presented in the table above, are representative of the volume of activity for this derivative type during the period.
Percentages are based on Net Assets of $88,841 ($Thousands).
| * | Non-income producing security. |
| ** | Rate shown is the 7-day effective yield as of March 31, 2015. |
| † | Real Estate Investment Trust. |
| †† | Investment in Affiliated Security (see Note 6). |
| (A) | Certain securities or partial positions of certain securities are on loan at March 31, 2015 (see Note 10). The total market value of such securities on loan at March 31, 2015 was $676 ($ Thousands). |
| (B) | This security was purchased with cash collateral held from securities on loan (see note 10). The total market value of such securities as of March 31, 2015 was $694 ($Thousands). |
| (C) | Security, or portion thereof, has been pledged as collateral on open futures contracts. |
Cl — Class
L.P. — Limited Partnership
Ser — Series
The Summary Schedule of Investments does not reflect the complete portfolio holdings. It includes the Fund’s 50 largest holdings and each investment of any issuer that exceeds 1% of the Fund’s net assets. “Other Securities” represent all issues not required to be disclosed under the rules adopted by the U.S. Securities and Exchange Commission (“SEC”). In certain instances, securities for which footnotes listed above may otherwise apply are included in the Other Securities caption. The complete schedule of portfolio holdings is available (i) without charge, upon request, by calling (800) 342-5734; and (ii) on the SEC’s website at http://www.sec.gov.
The following is a summary of the inputs used as of March 31, 2015, in valuing the Fund’s investments carried at value ($ Thousands):
| Investments in Securities | Level 1 | Level 2 | Level 3 | Total | ||||||||||||
Common Stock | $ | 83,501 | $ | — | $ | — | $ | 83,501 | ||||||||
Affiliated Partnership | — | 694 | — | 694 | ||||||||||||
Cash Equivalent | 783 | — | — | 783 | ||||||||||||
U.S. Treasury Obligations | — | 494 | — | 494 | ||||||||||||
|
|
|
|
|
|
|
| |||||||||
Total Investments in Securities | $ | 84,284 | $ | 1,188 | $ | — | $ | 85,472 | ||||||||
|
|
|
|
|
|
|
| |||||||||
| Other Financial Instruments | Level 1 | Level 2 | Level 3 | Total | ||||||||||||
Futures Contracts* | ||||||||||||||||
Unrealized Appreciation | $ | 21 | $ | — | $ | — | $ | 21 | ||||||||
|
|
|
|
|
|
|
| |||||||||
Total Other Financial Instruments | $ | 21 | $ | — | $ | — | $ | 21 | ||||||||
|
|
|
|
|
|
|
| |||||||||
| * | Futures contracts are valued at unrealized appreciation on the instrument. |
For the period ended March 31, 2015, there were no transfers between Level 1 and Level 2 assets and liabilities.
For the period ended March 31, 2015, there were no transfers between Level 2 and Level 3 assets and liabilities.
For the period ended March 31, 2015, there were no Level 3 investments.
For more information on valuation inputs, see Note 2 — Significant Accounting Policies in Notes to Financial Statements.
Amounts designated as “—” are $0 or have been rounded to $0.
The accompanying notes are an integral part of the financial statements.
| 20 | SEI Institutional Managed Trust / Semi-Annual Report / March 31, 2015 |
SUMMARY SCHEDULE OF INVESTMENTS (Unaudited)
U.S. Managed Volatility Fund
March 31, 2015
| Description | Percentage of Net Assets (%) | Shares | Market Value ($ Thousands) | |||||||||
COMMON STOCK — 95.7% |
| |||||||||||
Consumer Discretionary — 11.1% |
| |||||||||||
Aramark | 0.7 | % | 299,386 | $ | 9,470 | |||||||
DIRECTV* | 0.6 | 101,200 | 8,612 | |||||||||
Kohl’s | 1.0 | 178,977 | 14,005 | |||||||||
Panera Bread, Cl A* | 0.7 | 62,811 | 10,050 | |||||||||
Target, Cl A | 0.9 | 153,869 | 12,628 | |||||||||
Other Securities | 7.2 | 102,010 | ||||||||||
|
| |||||||||||
| 156,775 | ||||||||||||
|
| |||||||||||
Consumer Staples — 19.4% |
| |||||||||||
Altria Group | 1.4 | 388,202 | 19,418 | |||||||||
Bunge | 0.9 | 159,981 | 13,176 | |||||||||
Clorox | 1.1 | 141,248 | 15,592 | |||||||||
Coca-Cola | 0.8 | 287,382 | 11,653 | |||||||||
Costco Wholesale | 1.0 | 92,621 | 14,032 | |||||||||
Dr Pepper Snapple Group | 0.7 | 125,513 | 9,850 | |||||||||
General Mills, Cl A | 1.1 | 263,699 | 14,925 | |||||||||
Kimberly-Clark | 0.6 | 76,573 | 8,202 | |||||||||
Kroger | 1.5 | 284,817 | 21,834 | |||||||||
PepsiCo | 1.1 | 156,279 | 14,943 | |||||||||
Procter & Gamble | 0.8 | 140,927 | 11,548 | |||||||||
Tyson Foods, Cl A | 0.6 | 239,244 | 9,163 | |||||||||
Wal-Mart Stores | 1.5 | 262,395 | 21,582 | |||||||||
Other Securities | 6.3 | 87,726 | ||||||||||
|
| |||||||||||
| 273,644 | ||||||||||||
|
| |||||||||||
Energy — 1.4% |
| |||||||||||
Other Securities | 1.4 | 19,538 | ||||||||||
|
| |||||||||||
Financials — 18.3% |
| |||||||||||
Allstate | 0.6 | 109,500 | 7,793 | |||||||||
Annaly Capital Management† | 0.6 | 776,721 | 8,078 | |||||||||
Axis Capital Holdings | 0.7 | 180,840 | 9,328 | |||||||||
Everest Re Group | 1.2 | 96,343 | 16,764 | |||||||||
PartnerRe | 1.1 | 140,344 | 16,046 | |||||||||
RenaissanceRe Holdings | 0.8 | 111,395 | 11,109 | |||||||||
| Description | Percentage of Net Assets (%) | Shares | Market Value ($ Thousands) | |||||||||
Travelers | 1.0 | % | 135,767 | $ | 14,680 | |||||||
Two Harbors Investment† | 0.6 | 798,165 | 8,476 | |||||||||
Validus Holdings | 0.8 | 264,792 | 11,148 | |||||||||
Other Securities | 10.9 | 153,752 | ||||||||||
|
| |||||||||||
| 257,174 | ||||||||||||
|
| |||||||||||
Health Care — 16.2% |
| |||||||||||
AmerisourceBergen | 0.9 | 110,067 | 12,511 | |||||||||
Anthem | 0.6 | 52,330 | 8,080 | |||||||||
Baxter International | 0.6 | 118,800 | 8,138 | |||||||||
Cardinal Health | 1.1 | 172,723 | 15,592 | |||||||||
Eli Lilly | 0.8 | 165,489 | 12,023 | |||||||||
Express Scripts Holding* | 0.7 | 109,703 | 9,519 | |||||||||
Humana | 0.6 | 46,261 | 8,235 | |||||||||
Johnson & Johnson | 1.7 | 235,684 | 23,710 | |||||||||
Merck | 1.0 | 254,088 | 14,605 | |||||||||
Pfizer | 0.9 | 374,200 | 13,018 | |||||||||
Quest Diagnostics | 0.9 | 167,754 | 12,892 | |||||||||
Other Securities | 6.4 | 89,563 | ||||||||||
|
| |||||||||||
| 227,886 | ||||||||||||
|
| |||||||||||
Industrials — 3.5% |
| |||||||||||
Lockheed Martin | 1.1 | 75,693 | 15,363 | |||||||||
Other Securities | 2.4 | 34,295 | ||||||||||
|
| |||||||||||
| 49,658 | ||||||||||||
|
| |||||||||||
Information Technology — 10.0% |
| |||||||||||
Amdocs | 1.3 | 329,640 | 17,932 | |||||||||
International Business Machines | 1.6 | 142,637 | 22,893 | |||||||||
Other Securities | 7.1 | 100,396 | ||||||||||
|
| |||||||||||
| 141,221 | ||||||||||||
|
| |||||||||||
Materials — 1.5% |
| |||||||||||
Other Securities | 1.5 | 21,313 | ||||||||||
|
| |||||||||||
Telecommunication Services — 5.2% |
| |||||||||||
AT&T | 1.4 | 596,909 | 19,489 | |||||||||
Verizon Communications | 1.5 | 437,680 | 21,284 | |||||||||
Other Securities | 2.3 | 31,730 | ||||||||||
|
| |||||||||||
| 72,503 | ||||||||||||
|
| |||||||||||
Utilities — 9.1% |
| |||||||||||
American Electric Power | 0.6 | 158,080 | 8,892 | |||||||||
Consolidated Edison | 0.8 | 192,764 | 11,759 | |||||||||
Edison International | 0.9 | 204,256 | 12,760 | |||||||||
Entergy | 1.2 | 218,497 | 16,931 | |||||||||
PG&E | 0.9 | 225,940 | 11,991 | |||||||||
Portland General Electric | 0.6 | 242,718 | 9,002 | |||||||||
Southern | 0.9 | 282,299 | 12,500 | |||||||||
Other Securities | 3.2 | 44,129 | ||||||||||
|
| |||||||||||
| 127,964 | ||||||||||||
|
| |||||||||||
Total Common Stock |
| 1,347,676 | ||||||||||
|
| |||||||||||
| SEI Institutional Managed Trust / Semi-Annual Report / March 31, 2015 | 21 |
SUMMARY SCHEDULE OF INVESTMENTS (Unaudited)
U.S. Managed Volatility Fund (Concluded)
March 31, 2015
| Description | Percentage of Net Assets (%) | Shares | Market Value ($ Thousands) | |||||||||
CASH EQUIVALENT — 4.0% |
| |||||||||||
SEI Daily Income Trust, Prime Obligation Fund, Cl A | 4.0 | % | 56,094,361 | $ | 56,094 | |||||||
|
| |||||||||||
Total Cash Equivalent |
| 56,094 | ||||||||||
|
| |||||||||||
U.S. TREASURY OBLIGATIONS (A) — 0.1% |
| |||||||||||
Other Securities | 0.1 | 2,069 | ||||||||||
|
| |||||||||||
Total U.S. Treasury Obligations |
| 2,069 | ||||||||||
|
| |||||||||||
Total Investments — 99.8% |
| $ | 1,405,839 | |||||||||
|
| |||||||||||
The open futures contracts held by the Fund at March 31, 2015, are as follows:
| Type of Contract | Number of Contracts Long | Expiration Date | Unrealized Appreciation ($ Thousands) | |||||||||
S&P 500 Index EM INI | 385 | Jun-2015 | $ | 463 | ||||||||
|
| |||||||||||
For the period ended March 31, 2015, the total amount of all open futures contracts, as presented in the table above, are representative of the volume of activity for this derivative type during the period.
Percentages are based on Net Assets of $1,408,413 ($ Thousands).
| * | Non-income producing security. |
| † | Real Estate Investment Trust. |
| †† | Investment in Affiliated Security (see Note 6). |
| (A) | Security, or portion thereof, has been pledged as collateral on open futures contracts. |
Cl — Class
S&P — Standard & Poor’s
The Summary Schedule of Investments does not reflect the complete portfolio holdings. It includes the Fund’s 50 largest holdings and each investment of any issuer that exceeds 1% of the Fund’s net assets. “Other Securities” represent all issues not required to be disclosed under the rules adopted by the U.S. Securities and Exchange Commission (“SEC”). In certain instances, securities for which footnotes listed above may otherwise apply are included in the Other Securities caption. The complete schedule of portfolio holdings is available (i) without charge, upon request, by calling (800) 342-5734; and (ii) on the SEC’s website at http://www.sec.gov.
The following is a list of the level of inputs used as of March 31, 2015 in valuing the Fund’s investments and other financial instruments carried at value ($ Thousands):
| Investments in Securities | Level 1 | Level 2 | Level 3 | Total | ||||||||||||
Common Stock | $ | 1,347,676 | $ | — | $ | — | $ | 1,347,676 | ||||||||
U.S. Treasury Obligations | — | 2,069 | — | 2,069 | ||||||||||||
Cash Equivalent | 56,094 | — | — | 56,094 | ||||||||||||
|
|
|
|
|
|
|
| |||||||||
Total Investments in Securities | $ | 1,403,770 | $ | 2,069 | $ | — | $ | 1,405,839 | ||||||||
|
|
|
|
|
|
|
| |||||||||
| Other Financial Instruments | Level 1 | Level 2 | Level 3 | Total | ||||||||||||
Futures Contracts* | ||||||||||||||||
Unrealized Appreciation | $ | 463 | $ | — | $ | — | $ | 463 | ||||||||
|
|
|
|
|
|
|
| |||||||||
Total Other Financial Instruments | $ | 463 | $ | — | $ | — | $ | 463 | ||||||||
|
|
|
|
|
|
|
| |||||||||
| * | Futures contracts are valued at the unrealized appreciation on the instrument. |
For the period ended March 31, 2015, there were no transfers between Level 1 and Level 2 assets and liabilities.
For the period ended March 31, 2015, there were no transfers between Level 2 and Level 3 assets and liabilities.
For the period ended March 31, 2015, there were no Level 3 investments.
For more information on valuation inputs, see Note 2 — Significant Accounting Policies in Notes to Financial Statements.
Amounts designated as “—” are $0 or have been rounded to $0.
The accompanying notes are an integral part of the financial statements.
| 22 | SEI Institutional Managed Trust / Semi-Annual Report / March 31, 2015 |
SUMMARY SCHEDULE OF INVESTMENTS (Unaudited)
Global Managed Volatility Fund
March 31, 2015
| Description | Percentage of Net Assets (%) | Shares | Market Value ($ Thousands) | |||||||||
COMMON STOCK — 92.2% |
| |||||||||||
Australia — 6.3% |
| |||||||||||
Amcor | 0.6 | % | 1,192,139 | $ | 12,787 | |||||||
Wesfarmers | 0.7 | 446,439 | 14,993 | |||||||||
Other Securities | 5.0 | 99,260 | ||||||||||
|
| |||||||||||
| 127,040 | ||||||||||||
|
| |||||||||||
Austria — 0.3% |
| |||||||||||
Other Securities | 0.3 | 6,968 | ||||||||||
|
| |||||||||||
| 6,968 | ||||||||||||
|
| |||||||||||
Belgium — 0.7% |
| |||||||||||
Other Securities | 0.7 | 13,478 | ||||||||||
|
| |||||||||||
| 13,478 | ||||||||||||
|
| |||||||||||
Canada — 11.7% |
| |||||||||||
Canadian Imperial Bank of Commerce | 0.9 | 246,500 | 17,871 | |||||||||
Canadian Tire, Cl A | 1.0 | 206,800 | 21,069 | |||||||||
Fortis | 0.7 | 453,700 | 13,821 | |||||||||
Metro, Cl A | 0.7 | 542,900 | 14,712 | |||||||||
Other Securities | 8.4 | 170,316 | ||||||||||
|
| |||||||||||
| 237,789 | ||||||||||||
|
| |||||||||||
China — 0.1% |
| |||||||||||
Other Securities | 0.1 | 2,049 | ||||||||||
|
| |||||||||||
| 2,049 | ||||||||||||
|
| |||||||||||
Denmark — 0.9% |
| |||||||||||
Other Securities | 0.9 | 18,777 | ||||||||||
|
| |||||||||||
| 18,777 | ||||||||||||
|
| |||||||||||
Finland — 0.1% |
| |||||||||||
Other Securities | 0.1 | 1,970 | ||||||||||
|
| |||||||||||
| 1,970 | ||||||||||||
|
| |||||||||||
| Description | Percentage of Net Assets (%) | Shares | Market Value ($ Thousands) | |||||||||
France — 0.3% |
| |||||||||||
Other Securities | 0.3 | % | $ | 5,577 | ||||||||
|
| |||||||||||
| 5,577 | ||||||||||||
|
| |||||||||||
Germany — 1.4% |
| |||||||||||
Other Securities | 1.4 | 29,212 | ||||||||||
|
| |||||||||||
| 29,212 | ||||||||||||
|
| |||||||||||
Guernsey — 0.6% |
| |||||||||||
Amdocs | 0.6 | 238,188 | 12,957 | |||||||||
|
| |||||||||||
| 12,957 | ||||||||||||
|
| |||||||||||
Hong Kong — 3.8% |
| |||||||||||
CLP Holdings, Cl B | 0.9 | 2,129,000 | 18,604 | |||||||||
Other Securities | 2.9 | 57,774 | ||||||||||
|
| |||||||||||
| 76,378 | ||||||||||||
|
| |||||||||||
Ireland — 0.1% |
| |||||||||||
Other Securities | 0.1 | 1,489 | ||||||||||
|
| |||||||||||
| 1,489 | ||||||||||||
|
| |||||||||||
Israel — 1.2% |
| |||||||||||
Teva Pharmaceutical Industries | 0.7 | 222,091 | 13,940 | |||||||||
Other Securities | 0.5 | 10,973 | ||||||||||
|
| |||||||||||
| 24,913 | ||||||||||||
|
| |||||||||||
Italy — 0.2% |
| |||||||||||
Other Securities | 0.2 | 3,036 | ||||||||||
|
| |||||||||||
| 3,036 | ||||||||||||
|
| |||||||||||
Japan — 6.9% |
| |||||||||||
Canon | 0.6 | 352,000 | 12,469 | |||||||||
Kewpie | 0.7 | 577,000 | 14,068 | |||||||||
Other Securities | 5.6 | 112,693 | ||||||||||
|
| |||||||||||
| 139,230 | ||||||||||||
|
| |||||||||||
Jersey — 0.1% |
| |||||||||||
Other Securities | 0.1 | 1,434 | ||||||||||
|
| |||||||||||
| 1,434 | ||||||||||||
|
| |||||||||||
Luxembourg — 0.1% |
| |||||||||||
Other Securities | 0.1 | 2,509 | ||||||||||
|
| |||||||||||
| 2,509 | ||||||||||||
|
| |||||||||||
Netherlands — 1.2% |
| |||||||||||
Koninklijke Ahold | 0.6 | 572,160 | 11,276 | |||||||||
Other Securities | 0.6 | 13,603 | ||||||||||
|
| |||||||||||
| 24,879 | ||||||||||||
|
| |||||||||||
| SEI Institutional Managed Trust / Semi-Annual Report / March 31, 2015 | 23 |
SUMMARY SCHEDULE OF INVESTMENTS (Unaudited)
Global Managed Volatility Fund (Continued)
March 31, 2015
| Description | Percentage of Net Assets (%) | Shares | Market Value ($ Thousands) | |||||||||
New Zealand — 1.4% |
| |||||||||||
Other Securities | 1.4 | % | $ | 27,728 | ||||||||
|
| |||||||||||
| 27,728 | ||||||||||||
|
| |||||||||||
Norway — 1.8% |
| |||||||||||
Telenor | 0.6 | 559,444 | 11,308 | |||||||||
Other Securities | 1.2 | 25,104 | ||||||||||
|
| |||||||||||
| 36,412 | ||||||||||||
|
| |||||||||||
Portugal — 0.5% |
| |||||||||||
Other Securities | 0.5 | 10,502 | ||||||||||
|
| |||||||||||
| 10,502 | ||||||||||||
|
| |||||||||||
Singapore — 2.4% |
| |||||||||||
Other Securities | 2.4 | 49,030 | ||||||||||
|
| |||||||||||
| 49,030 | ||||||||||||
|
| |||||||||||
Spain — 1.7% |
| |||||||||||
Cia de Distribucion Integral Logista Holdings | 0.0 | 12,719 | 274 | |||||||||
Other Securities | 1.7 | 34,429 | ||||||||||
|
| |||||||||||
| 34,703 | ||||||||||||
|
| |||||||||||
Sweden — 2.0% |
| |||||||||||
Hennes & Mauritz, Cl B | 0.6 | 281,375 | 11,403 | |||||||||
Other Securities | 1.4 | 28,439 | ||||||||||
|
| |||||||||||
| 39,842 | ||||||||||||
|
| |||||||||||
Switzerland — 2.8% |
| |||||||||||
Galenica | 0.6 | 13,925 | 12,186 | |||||||||
Swisscom | 0.8 | 26,047 | 15,138 | |||||||||
Other Securities | 1.4 | 29,963 | ||||||||||
|
| |||||||||||
| 57,287 | ||||||||||||
|
| |||||||||||
United Kingdom — 7.5% |
| |||||||||||
GlaxoSmithKline | 0.6 | 514,922 | 11,817 | |||||||||
Imperial Tobacco Group | 1.1 | 515,896 | 22,692 | |||||||||
Next, Cl A | 1.0 | 201,118 | 20,974 | |||||||||
SSE | 1.0 | 913,694 | 20,319 | |||||||||
Unilever | 0.7 | 355,232 | 14,845 | |||||||||
Other Securities | 3.1 | 61,145 | ||||||||||
|
| |||||||||||
| 151,792 | ||||||||||||
|
| |||||||||||
United States — 36.1% |
| |||||||||||
Altria Group | 1.0 | 386,421 | 19,329 | |||||||||
AmerisourceBergen | 0.7 | 121,295 | 13,788 | |||||||||
Annaly Capital Management† | 0.6 | 1,129,672 | 11,749 | |||||||||
AT&T | 1.3 | 805,486 | 26,299 | |||||||||
Autozone* | 0.7 | 22,267 | 15,190 | |||||||||
| Description | Percentage of Net Assets (%) | Shares | Market Value ($ Thousands) | |||||||||
Bunge | 0.9 | % | 213,467 | $ | 17,581 | |||||||
CACI International, Cl A* | 0.6 | 125,490 | 11,284 | |||||||||
Church & Dwight | 0.6 | 150,767 | 12,879 | |||||||||
Cigna | 0.6 | 101,128 | 13,090 | |||||||||
Clorox | 1.5 | 283,763 | 31,325 | |||||||||
Colgate-Palmolive | 0.6 | 162,349 | 11,257 | |||||||||
Dollar General | 0.7 | 176,048 | 13,270 | |||||||||
DST Systems | 0.6 | 102,790 | 11,380 | |||||||||
Edwards Lifesciences, Cl A* | 0.8 | 112,589 | 16,039 | |||||||||
Energizer Holdings | 0.6 | 85,056 | 11,742 | |||||||||
Entergy | 0.8 | 201,782 | 15,636 | |||||||||
General Mills, Cl A | 0.6 | 208,668 | 11,810 | |||||||||
Harris | 0.6 | 157,286 | 12,388 | |||||||||
Henry Schein* | 0.6 | 87,585 | 12,229 | |||||||||
Hill-Rom Holdings | 0.6 | 240,790 | 11,799 | |||||||||
Jack Henry & Associates | 0.6 | 179,197 | 12,524 | |||||||||
Johnson & Johnson | 1.3 | 270,527 | 27,215 | |||||||||
Kimberly-Clark | 0.8 | 146,468 | 15,688 | |||||||||
McDonald’s | 0.8 | 174,110 | 16,965 | |||||||||
Omnicare | 0.7 | 192,463 | 14,831 | |||||||||
PepsiCo | 0.6 | 130,025 | 12,433 | |||||||||
Procter & Gamble | 1.2 | 300,745 | 24,643 | |||||||||
Southern | 0.6 | 291,089 | 12,890 | |||||||||
Other Securities | 14.5 | 295,646 | ||||||||||
|
| |||||||||||
| 732,899 | ||||||||||||
|
| |||||||||||
Total Common Stock |
| 1,869,880 | ||||||||||
|
| |||||||||||
PREFERRED STOCK — 0.6% |
| |||||||||||
Germany — 0.6% |
| |||||||||||
Henkel & KGaA | 0.6 | 107,952 | 12,701 | |||||||||
|
| |||||||||||
Total Preferred Stock |
| 12,701 | ||||||||||
|
| |||||||||||
RIGHT — 0.0% |
| |||||||||||
Other Securities | 0.0 | 124 | ||||||||||
|
| |||||||||||
Total Right |
| 124 | ||||||||||
|
| |||||||||||
CASH EQUIVALENT — 5.8% |
| |||||||||||
SEI Daily Income Trust, | 5.8 | % | 116,759,583 | 116,760 | ||||||||
|
| |||||||||||
Total Cash Equivalent |
| 116,760 | ||||||||||
|
| |||||||||||
| 24 | SEI Institutional Managed Trust / Semi-Annual Report / March 31, 2015 |
| Description | Percentage of Net Assets (%) | Face Amount (1) | Market Value ($ Thousands) | |||||||||
TIME DEPOSITS — 0.5% |
| |||||||||||
Brown Brothers Harriman |
| |||||||||||
2.950%, 4/01/2015 | 0.0 | % | NZD | 45 | $ | 33 | ||||||
1.462%, 4/01/2015 | 0.0 | AUD | 337 | 258 | ||||||||
0.350%, 4/01/2015 | 0.0 | NOK | 289 | 36 | ||||||||
0.100%, 4/01/2015 | 0.0 | CAD | 139 | 110 | ||||||||
0.030%, 4/01/2015 | 0.5 | 9,030 | 9,030 | |||||||||
0.005%, 4/01/2015 | 0.0 | SGD | 1,016 | 741 | ||||||||
0.005%, 4/01/2015 | 0.0 | JPY | 30,672 | 256 | ||||||||
0.005%, 4/01/2015 | 0.0 | HKD | 1,973 | 255 | ||||||||
(0.100)%, 4/01/2015 | 0.0 | DKK | 458 | 66 | ||||||||
|
| |||||||||||
Total Time Deposits |
| 10,785 | ||||||||||
|
| |||||||||||
U.S. TREASURY OBLIGATIONS (A) — 0.4% |
| |||||||||||
Other Securities | 0.4 | 7,082 | ||||||||||
|
| |||||||||||
Total U.S. Treasury Obligations |
| 7,082 | ||||||||||
|
| |||||||||||
Total Investments — 99.5% |
| $ | 2,017,332 | |||||||||
|
| |||||||||||
A list of the open futures contracts held by the Fund at March 31, 2015, is as follows:
| Type of Contract | Number of Contracts Long | Expiration Date | Unrealized Appreciation (Depreciation) ($ Thousands) | |||||||||
DJ Euro Stoxx 50 Index | 308 | Jun-2015 | $ | 152 | ||||||||
FTSE 100 Index | 91 | Jun-2015 | (191 | ) | ||||||||
Hang Seng Index | 12 | Apr-2015 | 41 | |||||||||
S&P 500 Index EMINI | 487 | Jun-2015 | 626 | |||||||||
SPI 200 Index | 35 | Jun-2015 | 37 | |||||||||
Topix Index | 59 | Jun-2015 | 64 | |||||||||
|
| |||||||||||
| $ | 729 | |||||||||||
|
| |||||||||||
For the period ended March 31, 2015, the total amount of all open futures contracts, as presented in the table above, are representative of the volume of activity for the derivative type during the period.
A list of the open forward foreign currency contracts held by the Fund at March 31, 2015, is as follows:
| Maturity Date | Currency to Deliver (Thousands) | Currency to Receive (Thousands) | Unrealized Appreciation (Depreciation) ($ Thousands) | |||||||||||||||||
4/28/15 | AUD | 94,046 | USD | 73,725 | $ | 2,005 | ||||||||||||||
4/28/15 | CAD | 157,320 | USD | 125,656 | 1,461 | |||||||||||||||
4/28/15 | CHF | 26,470 | USD | 27,647 | 353 | |||||||||||||||
4/28/15 | DKK | 73,793 | USD | 10,859 | 239 | |||||||||||||||
4/28/15 | EUR | 72,515 | USD | 79,672 | 1,770 | |||||||||||||||
4/28/15 | GBP | 62,285 | USD | 92,894 | 461 | |||||||||||||||
4/28/15 | HKD | 337,228 | USD | 43,478 | (17 | ) | ||||||||||||||
4/28/15 | JPY | 8,238,656 | USD | 69,030 | 295 | |||||||||||||||
4/28/15 | NOK | 165,904 | USD | 21,153 | 577 | |||||||||||||||
4/28/15 | NZD | 21,179 | USD | 16,121 | 285 | |||||||||||||||
4/28/15 | SEK | 211,894 | USD | 25,008 | 422 | |||||||||||||||
4/28/15 | SGD | 52,206 | USD | 38,141 | 97 | |||||||||||||||
4/28/15 | USD | 625 | AUD | 799 | (16 | ) | ||||||||||||||
4/28/15 | USD | 1,709 | CAD | 2,132 | (26 | ) | ||||||||||||||
4/28/15 | USD | 257 | CHF | 247 | (3 | ) | ||||||||||||||
4/28/15 | USD | 118 | DKK | 804 | (2 | ) | ||||||||||||||
4/28/15 | USD | 915 | EUR | 836 | (17 | ) | ||||||||||||||
| Maturity Date | Currency to Deliver (Thousands) | Currency to Receive (Thousands) | Unrealized Appreciation (Depreciation) ($ Thousands) | |||||||||||||||||
4/28/15 | USD | 1,324 | GBP | 891 | $ | (1 | ) | |||||||||||||
4/28/15 | USD | 566 | HKD | 4,386 | — | |||||||||||||||
4/28/15 | USD | 1,217 | JPY | 144,845 | (8 | ) | ||||||||||||||
4/28/15 | USD | 215 | NOK | 1,694 | (5 | ) | ||||||||||||||
4/28/15 | USD | 86 | NZD | 113 | (1 | ) | ||||||||||||||
4/28/15 | USD | 167 | SEK | 1,429 | (2 | ) | ||||||||||||||
4/28/15 | USD | 484 | SGD | 663 | (1 | ) | ||||||||||||||
|
| |||||||||||||||||||
| $ | 7,866 | |||||||||||||||||||
|
| |||||||||||||||||||
A list of the counterparties for the outstanding forward foreign currency contracts held by the Fund at March 31, 2015, is as follows:
| Counterparty | Currency to Deliver ($ Thousands) | Currency to Receive ($ Thousands) | Unrealized Appreciation ($ Thousands) | |||||||||
Brown Brothers Harriman | (623,119 | ) | 630,985 | $ | 7,866 | |||||||
|
| |||||||||||
For the period ended March 31, 2015, the total amount of all open forward foreign currency contracts, as presented in the table above, are representative of the volume of activity for the derivative type during the period.
Percentages are based on Net Assets of $2,028,271 ($Thousands)
| (1) | In U.S. Dollars unless otherwise indicated. |
| * | Non-income producing security. |
| ** | Rate shown is the 7-day effective yield as of March 31, 2015. |
| † | Real Estate Investment Trust. |
| †† | Investment in Affiliated security (see Note 6). |
| (A) | Security, or portion thereof, has been pledged as collateral on open futures contracts. |
AUD — Australia Dollar
CAD — Canadian Dollar
CHF — Swiss Franc
Cl — Class
DJ — Dow Jones
DKK — Denmark Krone
EUR — Euro
FTSE — Financial Times and the London Stock Exchange
GBP — British Pound
HKD — Hong Kong Dollar
JPY — Japanese Yen
NOK — Norwegian Krone
NZD — New Zealand Dollar
S&P — Standard & Poor’s
SEK — Sweden Krone
SGD — Singapore Dollar
SPI — Swiss Performance Index
USD — U.S. Dollar
The Summary Schedule of Investments does not reflect the complete portfolio holdings. It includes the Fund’s 50 largest holdings and each investment of any issuer that exceeds 1% of the Fund’s net assets. “Other Securities” represent all issues not required to be disclosed under the rules adopted by the U.S. Securities and Exchange Commission (“SEC”). In certain instances, securities for which footnotes listed above may otherwise apply are included in the Other Securities caption. The complete schedule of portfolio holdings is available (i) without charge, upon request, by calling (800) 342-5734; and (ii) on the SEC’s website at http://www.sec.gov.
| SEI Institutional Managed Trust / Semi-Annual Report / March 31, 2015 | 25 |
SUMMARY SCHEDULE OF INVESTMENTS (Unaudited)
Global Managed Volatility Fund (Concluded)
March 31, 2015
The following is a summary of the inputs used as of March 31, 2015, in valuing the Fund’s investments carried at value ($ Thousands):
| Investments in Securities | Level 1 | Level 2 | Level 3 | Total | ||||||||||||
Common Stock | $ | 1,858,198 | $ | 11,682 | $ | — | $ | 1,869,880 | ||||||||
Preferred Stock | 12,701 | — | — | 12,701 | ||||||||||||
Right | 124 | — | — | 124 | ||||||||||||
Cash Equivalent | 116,760 | — | — | 116,760 | ||||||||||||
Time Deposits | — | 10,785 | — | 10,785 | ||||||||||||
U.S. Treasury Obligations | — | 7,082 | — | 7,082 | ||||||||||||
|
|
|
|
|
|
|
| |||||||||
Total Investments in Securities | $ | 1,987,783 | $ | 29,549 | $ | — | $ | 2,017,332 | ||||||||
|
|
|
|
|
|
|
| |||||||||
| Other Financial Instruments | Level 1 | Level 2 | Level 3 | Total | ||||||||||||
Futures Contracts* | ||||||||||||||||
Unrealized Appreciation | $ | 920 | $ | — | $ | — | $ | 920 | ||||||||
Unrealized Depreciation | (191 | ) | — | — | (191 | ) | ||||||||||
Forwards Contracts* | ||||||||||||||||
Unrealized Appreciation | — | 7,965 | — | 7,965 | ||||||||||||
Unrealized Depreciation | — | (99 | ) | — | (99 | ) | ||||||||||
|
|
|
|
|
|
|
| |||||||||
Total Other Financial Instruments | $ | 729 | $ | 7,866 | $ | — | $ | 8,595 | ||||||||
|
|
|
|
|
|
|
| |||||||||
| * | Futures and forwards contracts are valued at the unrealized appreciation (depreciation) on the instrument. |
For the period ended March 31, 2015, there were no transfers between Level 1 and Level 2 assets and liabilities.
For the period ended March 31, 2015, there were no transfers between Level 2 and Level 3 assets and liabilities.
For the period ended March 31, 2015, there were no Level 3 investments.
For more information on valuation inputs, see Note 2 — Significant Accounting Policies in Notes to Financial Statements.
Amounts designated as “—” are $0 or have been rounded to $0.
The accompanying notes are an integral part of the financial statements.
| 26 | SEI Institutional Managed Trust / Semi-Annual Report / March 31, 2015 |
SUMMARY SCHEDULE OF INVESTMENTS (Unaudited)
Tax-Managed Managed Volatility Fund
March 31, 2015
| Description | Percentage of Net Assets (%) | Shares | Market Value ($ Thousands) | |||||||||
COMMON STOCK — 93.9% |
| |||||||||||
Consumer Discretionary — 7.8% |
| |||||||||||
DIRECTV* | 0.7 | % | 70,300 | $ | 5,982 | |||||||
Kohl’s | 0.6 | 69,100 | 5,407 | |||||||||
McDonald’s | 0.6 | 53,138 | 5,178 | |||||||||
Target, Cl A | 0.7 | 82,101 | 6,738 | |||||||||
Other Securities | 5.2 | 45,824 | ||||||||||
|
| |||||||||||
| 69,129 | ||||||||||||
|
| |||||||||||
Consumer Staples — 18.9% |
| |||||||||||
Altria Group | 1.3 | 229,214 | 11,465 | |||||||||
Church & Dwight | 0.8 | 80,204 | 6,851 | |||||||||
Clorox | 0.7 | 58,347 | 6,441 | |||||||||
Coca-Cola | 0.6 | 128,546 | 5,212 | |||||||||
Costco Wholesale | 1.0 | 58,129 | 8,806 | |||||||||
Hershey | 0.8 | 68,589 | 6,921 | |||||||||
Hormel Foods | 0.7 | 107,711 | 6,123 | |||||||||
Kellogg | 0.7 | 97,347 | 6,420 | |||||||||
Kroger | 1.1 | 122,716 | 9,407 | |||||||||
Lorillard | 0.8 | 108,303 | 7,078 | |||||||||
PepsiCo | 0.9 | 78,237 | 7,481 | |||||||||
Wal-Mart Stores | 1.5 | 159,636 | 13,130 | |||||||||
Other Securities | 8.0 | 71,093 | ||||||||||
|
| |||||||||||
| 166,428 | ||||||||||||
|
| |||||||||||
Energy — 1.9% | ||||||||||||
Exxon Mobil | 0.7 | 68,500 | 5,822 | |||||||||
Other Securities | 1.2 | 10,835 | ||||||||||
|
| |||||||||||
| 16,657 | ||||||||||||
|
| |||||||||||
Financials — 20.4% | ||||||||||||
Allstate | 0.6 | 74,100 | 5,274 | |||||||||
Axis Capital Holdings | 0.7 | 114,210 | 5,891 | |||||||||
Everest Re Group | 0.9 | 46,153 | 8,031 | |||||||||
PartnerRe | 1.0 | 77,869 | 8,903 | |||||||||
Post Properties† | 0.6 | 92,395 | 5,260 | |||||||||
RenaissanceRe Holdings | 1.1 | 100,858 | 10,058 | |||||||||
| Description | Percentage of Net Assets (%) | Shares | Market Value ($ Thousands) | |||||||||
Travelers | 0.8 | % | 68,500 | $ | 7,407 | |||||||
Validus Holdings | 0.9 | 177,529 | 7,474 | |||||||||
Other Securities | 13.8 | 121,958 | ||||||||||
|
| |||||||||||
| 180,256 | ||||||||||||
|
| |||||||||||
Health Care — 14.6% | ||||||||||||
Aetna, Cl A | 0.8 | 63,300 | 6,743 | |||||||||
AmerisourceBergen | 1.0 | 75,737 | 8,609 | |||||||||
Anthem | 1.0 | 56,500 | 8,724 | |||||||||
Humana | 0.8 | 40,115 | 7,141 | |||||||||
Johnson & Johnson | 1.5 | 135,917 | 13,673 | |||||||||
Pfizer | 1.1 | 285,000 | 9,915 | |||||||||
Quest Diagnostics | 0.6 | 73,671 | 5,662 | |||||||||
UnitedHealth Group | 0.8 | 63,200 | 7,476 | |||||||||
Other Securities | 7.0 | 60,975 | ||||||||||
|
| |||||||||||
| 128,918 | ||||||||||||
|
| |||||||||||
Industrials — 4.9% | ||||||||||||
Northrop Grumman | 0.9 | 49,100 | 7,903 | |||||||||
Raytheon | 0.8 | 66,100 | 7,221 | |||||||||
Stericycle, Cl A* | 0.6 | 38,292 | 5,377 | |||||||||
Other Securities | 2.6 | 22,741 | ||||||||||
|
| |||||||||||
| 43,242 | ||||||||||||
|
| |||||||||||
Information Technology — 7.7% |
| |||||||||||
Amdocs | 0.8 | 137,440 | 7,477 | |||||||||
Apple | 0.8 | 58,849 | 7,323 | |||||||||
International Business Machines | 1.0 | 53,479 | 8,583 | |||||||||
Other Securities | 5.1 | 44,446 | ||||||||||
|
| |||||||||||
| 67,829 | ||||||||||||
|
| |||||||||||
Materials — 1.3% | ||||||||||||
Sigma-Aldrich | 0.6 | 37,321 | 5,160 | |||||||||
Other Securities | 0.7 | 6,524 | ||||||||||
|
| |||||||||||
| 11,684 | ||||||||||||
|
| |||||||||||
Telecommunication Services — 3.8% |
| |||||||||||
AT&T | 1.1 | 290,000 | 9,469 | |||||||||
Verizon Communications | 0.8 | 142,649 | 6,937 | |||||||||
Other Securities | 1.9 | 16,649 | ||||||||||
|
| |||||||||||
| 33,055 | ||||||||||||
|
| |||||||||||
Utilities — 12.6% |
| |||||||||||
Consolidated Edison | 1.2 | 173,742 | 10,598 | |||||||||
Edison International | 0.8 | 109,300 | 6,828 | |||||||||
Entergy | 0.9 | 100,000 | 7,749 | |||||||||
Exelon | 0.7 | 178,300 | 5,993 | |||||||||
PG&E | 0.7 | 121,000 | 6,421 | |||||||||
Public Service Enterprise Group | 1.3 | 278,391 | 11,670 | |||||||||
Southern | 0.8 | 166,583 | 7,376 | |||||||||
| SEI Institutional Managed Trust / Semi-Annual Report / March 31, 2015 | 27 |
SUMMARY SCHEDULE OF INVESTMENTS (Unaudited)
Tax-Managed Managed Volatility Fund (Concluded)
March 31, 2015
| Description | Percentage of Net Assets (%) | Shares | Market Value ($ Thousands) | |||||||||
Wisconsin Energy | 0.6 | % | 110,404 | $ | 5,465 | |||||||
Other Securities | 5.6 | 48,795 | ||||||||||
|
| |||||||||||
| 110,895 | ||||||||||||
|
| |||||||||||
Total Common Stock |
| 828,093 | ||||||||||
|
| |||||||||||
RIGHTS — 0.0% | ||||||||||||
Other Securities | 0.0 | 91 | ||||||||||
|
| |||||||||||
Total Rights |
| 91 | ||||||||||
|
| |||||||||||
CASH EQUIVALENT — 5.7% |
| |||||||||||
SEI Daily Income Trust, Prime Obligation Fund, Cl A | 5.7 | 50,205,162 | 50,205 | |||||||||
|
| |||||||||||
Total Cash Equivalent |
| 50,205 | ||||||||||
|
| |||||||||||
U.S. TREASURY OBLIGATIONS (A) — 0.3% |
| |||||||||||
Other Securities | 0.3 | 2,256 | ||||||||||
|
| |||||||||||
Total U.S. Treasury Obligations (Cost $2,256) ($ Thousands) |
| 2,256 | ||||||||||
|
| |||||||||||
Total Investments — 99.9% |
| $ | 880,645 | |||||||||
|
| |||||||||||
A list of the open futures contracts held by the Fund at March 31, 2015, is as follows:
| Type of Contract | Number of Contracts Long | Expiration Date | Unrealized Appreciation ($ Thousands) | |||||||||
S&P 500 Index EMINI | 335 | Jun-2015 | $ | 427 | ||||||||
|
| |||||||||||
For the period ended March 31, 2015, the total amount of all open futures contracts, as presented in the table above, are representative of the volume of activity for this derivative type during the period.
Percentages are based on Net Assets of $881,533 ($Thousands).
| * | Non-income producing security. |
| ** | Rate shown is the 7-day effective yield as of March 31, 2015. |
| † | Real Estate Investment Trust. |
| †† | Investment in Affiliated Security (see Note 6). |
| (A) | Security, or a portion thereof, has been pledged as collateral on open futures contracts. |
Cl — Class
S&P — Standard and Poor’s
The Summary Schedule of Investments does not reflect the complete portfolio holdings. It includes the Fund’s 50 largest holdings and each investment of any issuer that exceeds 1% of the Fund’s net assets. “Other Securities” represent all issues not required to be disclosed under the rules adopted by the U.S. Securities and Exchange Commission (“SEC”). In certain instances, securities for which footnotes listed above may otherwise apply are included in the Other Securities caption. The complete schedule of portfolio holdings is available (i) without charge, upon request, by calling (800) 342-5734; and (ii) on the SEC’s website at http://www.sec.gov.
The following is a summary of the inputs used as of March 31, 2015, in valuing the Fund’s investments carried at value ($ Thousands):
| Investments in Securities | Level 1 | Level 2 | Level 3 | Total | ||||||||||||
Common Stock | $ | 828,093 | $ | — | $ | — | $ | 828,093 | ||||||||
Rights | 91 | — | — | 91 | ||||||||||||
Cash Equivalent | 50,205 | — | — | 50,205 | ||||||||||||
U.S. Treasury Obligations | — | 2,256 | — | 2,256 | ||||||||||||
|
|
|
|
|
|
|
| |||||||||
Total Investments in Securities | $ | 878,389 | $ | 2,256 | $ | — | $ | 880,645 | ||||||||
|
|
|
|
|
|
|
| |||||||||
| Other Financial Instruments | Level 1 | Level 2 | Level 3 | Total | ||||||||||||
Futures Contracts* | ||||||||||||||||
Unrealized Appreciation | $ | 427 | $ | — | $ | — | $ | 427 | ||||||||
|
|
|
|
|
|
|
| |||||||||
Total Other Financial Instruments | $ | 427 | $ | — | $ | — | $ | 427 | ||||||||
|
|
|
|
|
|
|
| |||||||||
| * | Futures contracts are valued at the unrealized appreciation on the instrument. |
For the period ended March 31, 2015, there were no transfers between Level 1 and Level 2 assets and liabilities.
For the period ended March 31, 2015, there were no transfers between Level 2 and Level 3 assets and liabilities.
For the period ended March 31, 2015, there were no Level 3 investments.
For more information on valuation inputs, see Note 2 — Significant Accounting Policies in Notes to Financial Statements.
Amounts designated as “—” are $0 or have been rounded to $0.
The accompanying notes are an integral part of the financial statements.
| 28 | SEI Institutional Managed Trust / Semi-Annual Report / March 31, 2015 |
SCHEDULE OF INVESTMENTS (Unaudited)
Real Estate Fund
March 31, 2015
| Description | Shares | Market Value ($ Thousands) | ||||||
COMMON STOCK — 97.4%‡ | ||||||||
Consumer Discretionary — 1.2% | ||||||||
Hyatt Hotels, Cl A* | 30,000 | $ | 1,777 | |||||
Starwood Hotels & Resorts Worldwide | 18,550 | 1,549 | ||||||
|
| |||||||
| 3,326 | ||||||||
|
| |||||||
Financials — 95.8%‡ | ||||||||
Alexandria Real Estate Equities† | 43,350 | 4,250 | ||||||
American Tower, Cl A† | 8,300 | 781 | ||||||
Apartment Investment & Management, Cl A† | 124,416 | 4,897 | ||||||
AvalonBay Communities† | 61,491 | 10,715 | ||||||
BioMed Realty Trust† | 224,600 | 5,089 | ||||||
Boston Properties† | 61,380 | 8,623 | ||||||
Brandywine Realty Trust† | 234,340 | 3,745 | ||||||
Brixmor Property Group† | 130,300 | 3,459 | ||||||
Camden Property Trust† | 11,260 | 880 | ||||||
CBL & Associates Properties† | 50,170 | 993 | ||||||
Chesapeake Lodging Trust† | 30,360 | 1,027 | ||||||
Columbia Property Trust† | 56,350 | 1,523 | ||||||
CubeSmart† | 219,790 | 5,308 | ||||||
CyrusOne† | 31,820 | 990 | ||||||
DCT Industrial Trust† | 42,850 | 1,485 | ||||||
DDR† | 243,880 | 4,541 | ||||||
Digital Realty Trust, Cl A† | 13,380 | 883 | ||||||
Douglas Emmett† | 79,900 | 2,382 | ||||||
Duke Realty† | 237,715 | 5,175 | ||||||
Empire State Realty Trust, Cl A† | 44,610 | 839 | ||||||
Equity Commonwealth*† | 29,780 | 791 | ||||||
Equity Lifestyle Properties† | 48,300 | 2,654 | ||||||
Equity Residential† | 134,770 | 10,493 | ||||||
Essex Property Trust† | 31,009 | 7,129 | ||||||
Excel Trust† | 36,200 | 508 | ||||||
Extra Space Storage† | 25,550 | 1,726 | ||||||
Federal Realty Investment Trust† | 4,220 | 621 | ||||||
General Growth Properties† | 260,719 | 7,704 | ||||||
HCP† | 139,580 | 6,031 | ||||||
Health Care† | 145,420 | 11,250 | ||||||
Highwoods Properties† | 26,770 | 1,226 | ||||||
Host Hotels & Resorts† | 345,434 | 6,971 | ||||||
Hudson Pacific Properties† | 84,120 | 2,792 | ||||||
Kilroy Realty† | 41,150 | 3,134 | ||||||
| Description | Shares | Market Value ($ Thousands) | ||||||
Kimco Realty† | 172,750 | $ | 4,638 | |||||
Kite Realty Group Trust† | 115,250 | 3,247 | ||||||
LaSalle Hotel Properties† | 56,350 | 2,190 | ||||||
Liberty Property Trust† | 114,410 | 4,084 | ||||||
Macerich† | 49,459 | 4,171 | ||||||
Mack-Cali Realty† | 11,600 | 224 | ||||||
Mid-America Apartment Communities† | 20,100 | 1,553 | ||||||
Paramount Group† | 19,480 | 376 | ||||||
Parkway Properties† | 17,650 | 306 | ||||||
Pebblebrook Hotel Trust† | 9,620 | 448 | ||||||
Physicians Realty Trust† | 24,930 | 439 | ||||||
Post Properties† | 15,250 | 868 | ||||||
ProLogis† | 264,017 | 11,501 | ||||||
PS Business Parks† | 17,270 | 1,434 | ||||||
Public Storage† | 58,981 | 11,628 | ||||||
QTS Realty Trust* | 16,050 | 584 | ||||||
Ramco-Gershenson Properties† | 52,500 | 976 | ||||||
Regency Centers† | 48,660 | 3,311 | ||||||
Retail Opportunity Investments† | 169,710 | 3,106 | ||||||
Rexford Industrial Realty† | 42,200 | 667 | ||||||
RLJ Lodging Trust† | 81,890 | 2,564 | ||||||
Senior Housing Properties Trust† | 132,700 | 2,945 | ||||||
Simon Property Group† | 112,138 | 21,939 | ||||||
SL Green Realty† (A) | 33,810 | 4,341 | ||||||
Sovran Self Storage† | 14,510 | 1,363 | ||||||
Strategic Hotels & Resorts*† | 98,940 | 1,230 | ||||||
Sunstone Hotel Investors† | 82,741 | 1,379 | ||||||
Tanger Factory Outlet Centers† | 12,840 | 452 | ||||||
Taubman Centers† | 48,660 | 3,753 | ||||||
UDR† | 205,150 | 6,981 | ||||||
Urban Edge Properties† | 17,180 | 407 | ||||||
Ventas† | 125,450 | 9,160 | ||||||
Vornado Realty Trust† | 75,590 | 8,466 | ||||||
Washington† | 40,950 | 1,131 | ||||||
|
| |||||||
| 252,477 | ||||||||
|
| |||||||
Information Technology — 0.4% | ||||||||
Equinix | 4,300 | 1,001 | ||||||
|
| |||||||
Total Common Stock |
| 256,804 | ||||||
|
| |||||||
AFFILIATED PARTNERSHIP — 1.6% |
| |||||||
SEI Liquidity Fund, L.P. | 4,218,979 | $ | 4,219 | |||||
|
| |||||||
Total Affiliated Partnership | 4,219 | |||||||
|
| |||||||
| SEI Institutional Managed Trust / Semi-Annual Report / March 31, 2015 | 29 |
SCHEDULE OF INVESTMENTS (Unaudited)
Real Estate Fund (Concluded)
March 31, 2015
| Description | Shares | Market Value ($ Thousands) | ||||||
CASH EQUIVALENT — 1.6% |
| |||||||
SEI Daily Income Trust, | 4,334,816 | 4,335 | ||||||
|
| |||||||
Total Cash Equivalent | 4,335 | |||||||
|
| |||||||
Total Investments — 100.6% | $ | 265,358 | ||||||
|
| |||||||
Percentages are based on Net Assets of $263,649 ($Thousands).
| * | Non-income producing security. |
| ** | The rate reported is the 7-day effective yield as of March 31, 2015. |
| † | Real Estate Investment Trust. |
| †† | Investment in Affiliated Security. |
| ‡ | Narrow Industries are utilized for compliance purposes, whereas broad sectors are utilized for reporting. |
| (A) | This security or a partial position of this security is on loan at March 31, 2015 (See Note 10). The total market value of securities on loan at March 31, 2015 was $4,096 ($ Thousands) |
| (B) | This security was purchased with cash collateral held from securities on loan (See Note 10). The total value of such securities as of March 31, 2015 was $4,219 ($ Thousands). |
Cl — Class
L.P. — Limited Partnership
The following is a summary of the inputs used as of March 31, 2015, in valuing the Fund’s investments carried at value ($ Thousands):
| Investments in Securities | Level 1 | Level 2 | Level 3 | Total | ||||||||||||
Common Stock | $ | 256,804 | $ | — | $ | — | $ | 256,804 | ||||||||
Affiliated Partnership | — | 4,219 | — | 4,219 | ||||||||||||
Cash Equivalent | 4,335 | — | — | 4,335 | ||||||||||||
|
|
|
|
|
|
|
| |||||||||
Total Investments in Securities | $ | 261,139 | $ | 4,219 | $ | — | $ | 265,358 | ||||||||
|
|
|
|
|
|
|
| |||||||||
For the period ended March 31, 2015, there have been no transfers between Level 1 and Level 2 assets and liabilities.
For the period ended March 31, 2015, there have been no transfers between Level 2 and Level 3 assets and liabilities.
For more information on valuation inputs, see note 2 — Significant Accounting Policies in Notes to Financial Statements.
The accompanying notes are an integral part of the financial statements.
| 30 | SEI Institutional Managed Trust / Semi-Annual Report / March 31, 2015 |
SCHEDULE OF INVESTMENTS (Unaudited)
Enhanced Income Fund
March 31, 2015
| Description | Face Amount ($ Thousands) | Market Value ($ Thousands) | ||||||
CORPORATE OBLIGATIONS — 38.6% |
| |||||||
Consumer Discretionary — 5.1% |
| |||||||
American Honda Finance | ||||||||
0.636%, 05/26/2016 (A) (B) | $ | 750 | $ | 753 | ||||
AutoZone | ||||||||
1.300%, 01/13/2017 | 500 | 501 | ||||||
CCO Holdings LLC | ||||||||
5.250%, 09/30/2022 | 250 | 256 | ||||||
Comcast | ||||||||
5.850%, 11/15/2015 | 400 | 413 | ||||||
CSC Holdings | ||||||||
8.625%, 02/15/2019 | 875 | 1,013 | ||||||
Daimler Finance North America LLC | ||||||||
1.375%, 08/01/2017 (B) | 535 | 535 | ||||||
1.115%, 08/01/2018 (A) (B) | 250 | 251 | ||||||
ERAC USA Finance LLC | ||||||||
1.400%, 4/15/2016 (B) | 115 | 115 | ||||||
Family Tree Escrow | ||||||||
5.750%, 03/01/2023 (B) | 125 | 131 | ||||||
5.250%, 03/01/2020 (B) | 80 | 84 | ||||||
Ford Motor Credit LLC | ||||||||
1.724%, 12/06/2017 | 350 | 349 | ||||||
1.098%, 03/12/2019 (A) | 400 | 399 | ||||||
Graton Economic Development Authority | ||||||||
9.625%, 09/01/2019 (B) | 300 | 329 | ||||||
Hyundai Capital America | ||||||||
2.000%, 03/19/2018 (B) | 235 | 239 | ||||||
1.625%, 10/02/2015 (B) | 150 | 151 | ||||||
NBCUniversal Enterprise | ||||||||
0.938%, 04/15/2018 (A) (B) | 550 | 554 | ||||||
Nissan Motor Acceptance | ||||||||
0.969%, 09/26/2016 (A) (B) | 350 | 352 | ||||||
0.812%, 03/03/2017 (A) (B) | 310 | 311 | ||||||
| Description | Face Amount ($ Thousands) | Market Value ($ Thousands) | ||||||
President and Fellows of Harvard College | ||||||||
6.300%, 10/01/2037 | $ | 380 | $ | 401 | ||||
Sinclair Television Group | ||||||||
5.625%, 08/01/2024 (B) | 500 | 509 | ||||||
Sirius XM Radio | ||||||||
5.875%, 10/01/2020 (B) | 700 | 730 | ||||||
5.375%, 04/15/2025 (B) | 100 | 100 | ||||||
Thomson Reuters | ||||||||
1.650%, 09/29/2017 | 345 | 346 | ||||||
0.875%, 05/23/2016 | 250 | 250 | ||||||
Time Warner Cable | ||||||||
5.850%, 05/01/2017 | 450 | 489 | ||||||
TRW Automotive | ||||||||
7.250%, 03/15/2017 (B) | 315 | 344 | ||||||
Volkswagen Group of America Finance | ||||||||
1.250%, 05/23/2017 (B) | 300 | 300 | ||||||
0.701%, 11/20/2017 (A) (B) | 800 | 800 | ||||||
Volkswagen International Finance | ||||||||
0.696%, 11/18/2016 (A) (B) | 300 | 301 | ||||||
Whirlpool | ||||||||
1.350%, 03/01/2017 | 440 | 441 | ||||||
|
| |||||||
| 11,747 | ||||||||
|
| |||||||
Consumer Staples — 2.1% | ||||||||
Anheuser-Busch InBev Finance | ||||||||
0.655%, 02/01/2019 (A) | 650 | 650 | ||||||
Anheuser-Busch InBev | ||||||||
0.800%, 07/15/2015 | 350 | 350 | ||||||
BAT International Finance | ||||||||
1.400%, 06/05/2015 (B) | 500 | 501 | ||||||
CVS Health | ||||||||
1.200%, 12/05/2016 | 330 | 332 | ||||||
Elizabeth Arden | ||||||||
7.375%, 03/15/2021 | 240 | 211 | ||||||
Heineken | ||||||||
0.800%, 10/1/2015 (B) | 325 | 325 | ||||||
JM Smucker | ||||||||
1.750%, 03/15/2018 (B) | 180 | 181 | ||||||
Kraft Foods Group | ||||||||
1.625%, 06/04/2015 | 500 | 501 | ||||||
Kroger | ||||||||
0.787%, 10/17/2016 (A) | 450 | 451 | ||||||
Mondelez International | ||||||||
0.775%, 02/01/2019 (A) | 450 | 446 | ||||||
Reynolds American | ||||||||
1.050%, 10/30/2015 | 240 | 240 | ||||||
SABMiller Holdings | ||||||||
0.945%, 08/01/2018 (A) (B) | 500 | 502 | ||||||
Sysco | ||||||||
1.450%, 10/02/2017 | 105 | 106 | ||||||
|
| |||||||
| 4,796 | ||||||||
|
| |||||||
| SEI Institutional Managed Trust / Semi-Annual Report / March 31, 2015 | 31 |
SCHEDULE OF INVESTMENTS (Unaudited)
Enhanced Income Fund (Continued)
March 31, 2015
| Description | Face Amount ($ Thousands) | Market Value ($ Thousands) | ||||||
Energy — 2.4% | ||||||||
Atwood Oceanics | ||||||||
6.500%, 02/01/2020 | $ | 700 | $ | 672 | ||||
BP Capital Markets PLC | ||||||||
0.899%, 09/26/2018 (A) | 700 | 700 | ||||||
0.683%, 02/13/2018 (A) | 400 | 400 | ||||||
Devon Energy | ||||||||
0.811%, 12/15/2016 (A) | 600 | 593 | ||||||
Enbridge | ||||||||
0.712%, 06/02/2017 (A) | 675 | 667 | ||||||
Enterprise Products | ||||||||
1.250%, 08/13/2015 | 40 | 40 | ||||||
Gibson Energy | ||||||||
6.750%, 07/15/2021 (B) | 207 | 211 | ||||||
Hess | ||||||||
1.300%, 06/15/2017 | 365 | 362 | ||||||
Kinder Morgan | ||||||||
2.000%, 12/01/2017 | 270 | 269 | ||||||
Regency Energy Partners | ||||||||
5.000%, 10/01/2022 | 200 | 208 | ||||||
Statoil | ||||||||
0.716%, 11/08/2018 (A) | 300 | 300 | ||||||
Total Capital Canada Ltd. | ||||||||
0.633%, 01/15/2016 (A) | 170 | 170 | ||||||
Total Capital International | ||||||||
0.826%, 08/10/2018 (A) | 450 | 452 | ||||||
TransCanada PipeLines Ltd. | ||||||||
0.750%, 01/15/2016 | 325 | 325 | ||||||
|
| |||||||
| 5,369 | ||||||||
|
| |||||||
Financials — 18.8% | ||||||||
Abbey National Treasury Services | ||||||||
0.780%, 03/13/2017 (A) | 600 | 600 | ||||||
0.683%, 09/29/2017 (A) | 350 | 349 | ||||||
ABN AMRO Bank | ||||||||
1.056%, 10/28/2016 (A) (B) | 450 | 453 | ||||||
American Express Credit MTN | ||||||||
1.125%, 06/05/2017 | 1,000 | 1,000 | ||||||
Australia & New Zealand Banking Group | ||||||||
0.817%, 05/15/2018 (A) | 300 | 301 | ||||||
0.632%, 01/10/2017 (A) (B) | 300 | 300 | ||||||
Bank of America MTN | ||||||||
5.650%, 05/01/2018 | 110 | 122 | ||||||
2.000%, 01/11/2018 | 190 | 191 | ||||||
1.700%, 08/25/2017 | 500 | 502 | ||||||
1.031%, 09/15/2036 (A) | 700 | 630 | ||||||
Bank of Montreal MTN | ||||||||
0.852%, 04/09/2018 (A) | 650 | 654 | ||||||
Bank of New York Mellon MTN | ||||||||
0.704%, 03/06/2018 (A) | 650 | 650 | ||||||
Bank of Nova Scotia | ||||||||
1.300%, 07/21/2017 | 400 | 401 | ||||||
| Description | Face Amount ($ Thousands) | Market Value ($ Thousands) | ||||||
0.950%, 03/15/2016 | $ | 400 | $ | 402 | ||||
0.707%, 9/11/2015 (A) | 375 | 376 | ||||||
Bank of Tokyo-Mitsubishi UFJ | ||||||||
1.450%, 09/08/2017 (B) | 400 | 400 | ||||||
0.574%, 09/08/2017 (A) (B) | 400 | 399 | ||||||
Barclays Bank PLC MTN | ||||||||
6.050%, 12/04/2017 (B) | 600 | 660 | ||||||
BB&T MTN | ||||||||
1.131%, 06/15/2018 (A) | 535 | 540 | ||||||
0.915%, 02/01/2019 (A) | 325 | 326 | ||||||
BNP Paribas MTN | ||||||||
0.858%, 12/12/2016 (A) | 600 | 602 | ||||||
BPCE MTN | ||||||||
1.106%, 02/10/2017 (A) | 700 | 705 | ||||||
Capital One Bank USA | ||||||||
1.300%, 06/05/2017 | 550 | 547 | ||||||
Citigroup | ||||||||
0.812%, 08/25/2036 (A) | 1,500 | 1,168 | ||||||
Citizens Bank MTN | ||||||||
1.600%, 12/04/2017 | 800 | 803 | ||||||
Commonwealth Bank of Australia MTN | ||||||||
0.668%, 03/12/2018 (A) (B) | 650 | 650 | ||||||
Cooperatieve Centrale Raiffeisen-Boerenleenbank | ||||||||
0.750%, 03/18/2016 (A) | 550 | 552 | ||||||
Credit Suisse NY MTN | ||||||||
1.375%, 05/26/2017 | 510 | 511 | ||||||
0.943%, 01/29/2018 (A) | 500 | 502 | ||||||
Deutsche Bank | ||||||||
1.350%, 05/30/2017 | 700 | 699 | ||||||
0.938%, 02/13/2018 (A) | 475 | 476 | ||||||
Fifth Third Bank | ||||||||
1.350%, 06/01/2017 | 1,000 | 1,002 | ||||||
Goldman Sachs Group | ||||||||
1.455%, 04/30/2018 (A) | 500 | 507 | ||||||
1.357%, 11/15/2018 (A) | 400 | 404 | ||||||
HSBC Bank PLC | ||||||||
0.897%, 05/15/2018 (A) (B) | 600 | 603 | ||||||
HSBC USA | ||||||||
1.300%, 06/23/2017 | 700 | 702 | ||||||
Huntington National Bank | ||||||||
1.375%, 04/24/2017 | 350 | 350 | ||||||
0.681%, 04/24/2017 (A) | 350 | 349 | ||||||
ING Bank | ||||||||
0.964%, 10/01/2019 (A) (B) | 400 | 401 | ||||||
Intesa Sanpaolo | ||||||||
3.125%, 01/15/2016 | 300 | 304 | ||||||
JPMorgan Chase | ||||||||
0.886%, 01/28/2019 (A) | 300 | 301 | ||||||
JPMorgan Chase Capital XXI | ||||||||
1.205%, 02/02/2037 (A) | 1,300 | 1,072 | ||||||
Lloyds Bank | ||||||||
0.791%, 03/16/2018 (A) | 600 | 601 | ||||||
| 32 | SEI Institutional Managed Trust / Semi-Annual Report / March 31, 2015 |
| Description | Face Amount ($ Thousands) | Market Value ($ Thousands) | ||||||
Macquarie Group | ||||||||
1.255%, 01/31/2017 (A) (B) | $ | 400 | $ | 402 | ||||
Manufacturers & Traders Trust | ||||||||
1.400%, 07/25/2017 | 475 | 476 | ||||||
0.630%, 01/30/2017 (A) | 400 | 399 | ||||||
Metropolitan Life Global Funding I | ||||||||
1.500%, 01/10/2018 (B) | 220 | 221 | ||||||
0.632%, 04/10/2017 (A) (B) | 500 | 501 | ||||||
Mizuho Bank | ||||||||
0.909%, 03/26/2018 (A) (B) | 550 | 550 | ||||||
Morgan Stanley | ||||||||
5.950%, 12/28/2017 | 140 | 155 | ||||||
1.512%, 02/25/2016 (A) | 250 | 252 | ||||||
1.106%, 01/24/2019 (A) | 450 | 452 | ||||||
MSCI | ||||||||
5.250%, 11/15/2024 (B) | 160 | 166 | ||||||
New York Life Global Funding | ||||||||
1.125%, 03/01/2017 (B) | 500 | 502 | ||||||
0.607%, 05/23/2016 (A) (B) | 400 | 401 | ||||||
Nordea Bank | ||||||||
1.250%, 04/04/2017 (B) | 600 | 600 | ||||||
Pricoa Global Funding I MTN | ||||||||
0.407%, 05/16/2016 (A) (B) | 650 | 650 | ||||||
Principal Life Global Funding II | ||||||||
1.200%, 05/19/2017 (B) | 400 | 400 | ||||||
1.125%, 02/24/2017 (B) | 300 | 301 | ||||||
Prudential Financial MTN | ||||||||
1.037%, 08/15/2018 (A) | 500 | 503 | ||||||
RHP Hotel Properties | ||||||||
5.000%, 04/15/2021‡ | 217 | 222 | ||||||
Royal Bank of Canada MTN | ||||||||
0.587%, 01/23/2017 (A) | 900 | 902 | ||||||
Royal Bank of Scotland Group | ||||||||
1.875%, 03/31/2017 | 400 | 399 | ||||||
Santander Bank | ||||||||
1.182%, 01/12/2018 (A) | 800 | 800 | ||||||
Societe Generale | ||||||||
1.335%, 10/01/2018 (A) | 550 | 559 | ||||||
Standard Chartered PLC | ||||||||
0.604%, 09/08/2017 (A) (B) | 800 | 796 | ||||||
State Street Capital Trust IV | ||||||||
1.271%, 06/15/2037 (A) | 375 | 317 | ||||||
Sumitomo Mitsui Banking | ||||||||
0.684%, 01/10/2017 (A) | 400 | 400 | ||||||
SunTrust Bank | ||||||||
0.697%, 02/15/2017 (A) | 650 | 649 | ||||||
Svenska Handelsbanken | ||||||||
0.735%, 09/23/2016 (A) | 800 | 804 | ||||||
Synchrony Financial | ||||||||
1.875%, 08/15/2017 | 325 | 325 | ||||||
1.485%, 02/03/2020 (A) | 750 | 751 | ||||||
Toronto-Dominion Bank MTN | ||||||||
0.724%, 09/09/2016 (A) | 200 | 201 | ||||||
0.495%, 05/02/2017 (A) | 600 | 600 | ||||||
| Description | Face Amount ($ Thousands) | Market Value ($ Thousands) | ||||||
UBS MTN | ||||||||
5.875%, 12/20/2017 | $ | 400 | $ | 444 | ||||
0.897%, 08/14/2019 (A) | 700 | 704 | ||||||
Unitrin | ||||||||
6.000%, 05/15/2017 | 670 | 724 | ||||||
US Bancorp MTN | ||||||||
0.656%, 04/25/2019 (A) | 550 | 549 | ||||||
Ventas Realty‡ | ||||||||
1.550%, 09/26/2016 | 500 | 503 | ||||||
1.250%, 04/17/2017 | 130 | 130 | ||||||
WEA Finance | ||||||||
1.750%, 09/15/2017 (B) | 280 | 282 | ||||||
Wells Fargo MTN | ||||||||
1.150%, 06/02/2017 | 700 | 700 | ||||||
0.935%, 01/30/2020 (A) | 500 | 503 | ||||||
Westpac Banking | ||||||||
1.200%, 05/19/2017 | 300 | 300 | ||||||
0.867%, 01/17/2019 (A) | 400 | 402 | ||||||
|
| |||||||
| 42,964 | ||||||||
|
| |||||||
Health Care — 3.3% | ||||||||
AbbVie | ||||||||
1.200%, 11/06/2015 | 550 | 551 | ||||||
Actavis Funding SCS | ||||||||
1.348%, 03/12/2018 (A) | 850 | 855 | ||||||
1.300%, 06/15/2017 | 550 | 545 | ||||||
Amgen | ||||||||
2.125%, 05/15/2017 | 600 | 611 | ||||||
Anthem | ||||||||
1.250%, 09/10/2015 | 210 | 211 | ||||||
Bayer US Finance | ||||||||
0.551%, 10/06/2017 (A) (B) | 550 | 550 | ||||||
Becton Dickinson | ||||||||
1.800%, 12/15/2017 | 625 | 630 | ||||||
Express Scripts Holding | ||||||||
1.250%, 06/02/2017 | 550 | 549 | ||||||
McKesson | ||||||||
1.292%, 03/10/2017 | 370 | 370 | ||||||
0.950%, 12/4/2015 | 235 | 236 | ||||||
Medtronic | ||||||||
1.500%, 03/15/2018 (B) | 340 | 341 | ||||||
Mylan | ||||||||
1.350%, 11/29/2016 | 450 | 450 | ||||||
Providence Health & Services Obligated Group | ||||||||
1.055%, 10/01/2016 (A) | 800 | 804 | ||||||
Thermo Fisher Scientific | ||||||||
1.300%, 02/01/2017 | 145 | 145 | ||||||
Zimmer Holdings | ||||||||
1.450%, 04/01/2017 | 625 | 626 | ||||||
|
| |||||||
| 7,474 | ||||||||
|
| |||||||
| SEI Institutional Managed Trust / Semi-Annual Report / March 31, 2015 | 33 |
SCHEDULE OF INVESTMENTS (Unaudited)
Enhanced Income Fund (Continued)
March 31, 2015
| Description | Face Amount ($ Thousands) | Market Value ($ Thousands) | ||||||
Industrials — 3.1% | ||||||||
Air Lease | ||||||||
4.500%, 01/15/2016 | $ | 350 | $ | 357 | ||||
2.125%, 01/15/2018 | 310 | 309 | ||||||
Boart Longyear Management Properties | ||||||||
10.000%, 10/01/2018 (B) | 190 | 194 | ||||||
Bombardier | ||||||||
7.500%, 03/15/2025 (B) | 145 | 143 | ||||||
6.000%, 10/15/2022 (B) | 400 | 376 | ||||||
Clean Harbors | ||||||||
5.250%, 08/01/2020 | 350 | 358 | ||||||
Continental | ||||||||
4.500%, 09/15/2019 | 450 | 464 | ||||||
GATX | ||||||||
1.250%, 03/04/2017 | 245 | 244 | ||||||
General Electric Capital MTN | ||||||||
1.250%, 05/15/2017 | 600 | 603 | ||||||
Glencore Funding LLC | ||||||||
1.421%, 05/27/2016 (A) (B) | 675 | 677 | ||||||
Hutchison Whampoa International 14 | ||||||||
1.625%, 10/31/2017 (B) | 500 | 498 | ||||||
ILFC E-Capital Trust I | ||||||||
4.090%, 12/21/2065 (A) (B) | 500 | 471 | ||||||
John Deere Capital MTN | ||||||||
0.391%, 06/15/2015 (A) | 450 | 450 | ||||||
Nielsen Finance | ||||||||
5.000%, 04/15/2022 (B) | 700 | 704 | ||||||
PACCAR Financial MTN | ||||||||
1.100%, 06/06/2017 | 360 | 360 | ||||||
Pentair Finance | ||||||||
1.350%, 12/01/2015 | 285 | 286 | ||||||
Precision Castparts | ||||||||
0.700%, 12/20/2015 | 135 | 135 | ||||||
Sensata Technologies BV | ||||||||
5.000%, 10/01/2025 (B) | 207 | 210 | ||||||
United Rentals North America | ||||||||
4.625%, 07/15/2023 | 325 | 329 | ||||||
|
| |||||||
| 7,168 | ||||||||
|
| |||||||
Information Technology — 1.6% | ||||||||
Audatex North America | ||||||||
6.125%, 11/01/2023 (B) | 475 | 503 | ||||||
6.000%, 06/15/2021 (B) | 300 | 317 | ||||||
Bankrate | ||||||||
6.125%, 08/15/2018 (B) | 300 | 296 | ||||||
CommScope | ||||||||
5.500%, 06/15/2024 (B) | 500 | 500 | ||||||
Equinix | ||||||||
5.750%, 01/01/2025 | 505 | 527 | ||||||
Fidelity National Information Services | ||||||||
1.450%, 06/05/2017 | 210 | 210 | ||||||
| Description | Face Amount ($ Thousands) | Market Value ($ Thousands) | ||||||
Hewlett-Packard | ||||||||
1.193%, 01/14/2019 (A) | $ | 600 | $ | 594 | ||||
TSMC Global | ||||||||
0.950%, 04/03/2016 (B) | 250 | 249 | ||||||
Western Union | ||||||||
2.375%, 12/10/2015 | 85 | 86 | ||||||
1.262%, 08/21/2015 (A) | 325 | 325 | ||||||
|
| |||||||
| 3,607 | ||||||||
|
| |||||||
Materials — 0.6% | ||||||||
Monsanto | ||||||||
1.150%, 06/30/2017 | 625 | 628 | ||||||
Rio Tinto Finance USA PLC | ||||||||
1.111%, 06/17/2016 (A) | 625 | 626 | ||||||
|
| |||||||
| 1,254 | ||||||||
|
| |||||||
Telecommunication Services — 0.9% |
| |||||||
AT&T | ||||||||
0.800%, 12/1/2015 | 450 | 450 | ||||||
British Telecommunications PLC | ||||||||
1.250%, 02/14/2017 | 295 | 295 | ||||||
Verizon Communications | ||||||||
2.021%, 09/14/2018 (A) | 515 | 537 | ||||||
1.350%, 06/09/2017 | 750 | 751 | ||||||
|
| |||||||
| 2,033 | ||||||||
|
| |||||||
Utilities — 0.7% | ||||||||
Dominion Gas Holdings | ||||||||
1.050%, 11/01/2016 | 600 | 601 | ||||||
Exelon | ||||||||
4.900%, 06/15/2015 | 425 | 428 | ||||||
RJS Power Holdings | ||||||||
5.125%, 07/15/2019 (B) | 270 | 266 | ||||||
Southern | ||||||||
1.300%, 08/15/2017 | 390 | 390 | ||||||
|
| |||||||
| 1,685 | ||||||||
|
| |||||||
Total Corporate Obligations | 88,097 | |||||||
|
| |||||||
LOAN PARTICIPATIONS — 27.3% |
| |||||||
Acadia Healthcare Company, 1st Lien | ||||||||
4.250%, 02/11/2022 | 200 | 202 | ||||||
Acosta Holdco, 1st Lien | ||||||||
5.000%, 08/13/2021 | 894 | 903 | ||||||
Advantage Sales, 2nd Lien | ||||||||
7.500%, 07/25/2022 | 300 | 300 | ||||||
Advantage Sales and Marketing, 1st Lien | ||||||||
4.250%, 07/23/2021 | 599 | 598 | ||||||
Affinion Group Holdings | ||||||||
6.750%, 10/08/2016 | 693 | 656 | ||||||
| 34 | SEI Institutional Managed Trust / Semi-Annual Report / March 31, 2015 |
| Description | Face Amount ($ Thousands) | Market Value ($ Thousands) | ||||||
Air Medical Group Holdings, Term Loan B1 | ||||||||
5.000%, 06/30/2018 | $ | 588 | $ | 588 | ||||
Alinta Energy Finance, Draw Term Loan | ||||||||
6.375%, 08/13/2018 | 7 | 7 | ||||||
Alinta, Cov-Lite, 1st Lien Term Loan | ||||||||
6.375%, 08/13/2019 | 420 | 420 | ||||||
Alinta, Delayed Term Loan Unfunded | ||||||||
1.000%, 08/13/2018 (C) | 21 | — | ||||||
Alliance Holdings, Term Loan | ||||||||
5.000%, 12/07/2019 | 727 | 729 | ||||||
Alliance Laundry System, Term Loan B | ||||||||
4.250%, 12/07/2018 | 519 | 520 | ||||||
Allison Transmission | ||||||||
3.500%, 08/23/2019 | 616 | 615 | ||||||
American Builders & Contract Supply, Term Loan B | ||||||||
3.500%, 04/16/2020 | 493 | 491 | ||||||
American Renal Holdings | ||||||||
4.500%, 08/14/2019 | 528 | 527 | ||||||
American Tire Distributors, 1st Lien | ||||||||
0.000%, 09/24/2021 (C) | 250 | 251 | ||||||
Applied Systems, 1st Lien Term Loan | ||||||||
4.250%, 01/25/2021 | 489 | 489 | ||||||
Applied Systems, 2nd Lien Term Loan | ||||||||
7.500%, 01/24/2022 | 175 | 174 | ||||||
Aramark, 1st Lien | ||||||||
3.250%, 02/24/2021 | 691 | 689 | ||||||
Aramark, 1st Lien Term Loan | ||||||||
0.025%, 07/26/2016 | 32 | 32 | ||||||
Ardagh Holdings USA, 1st Lien | ||||||||
4.000%, 12/17/2019 | 447 | 448 | ||||||
Aricent Technologies, 1st Lien | ||||||||
5.500%, 04/14/2021 | 696 | 697 | ||||||
Asurion LLC | ||||||||
5.000%, 05/24/2019 | 341 | 342 | ||||||
Asurion, 2nd Lien Term Loan | ||||||||
8.500%, 03/03/2021 | 650 | 652 | ||||||
Avaya, Term Loan B3 | ||||||||
4.672%, 10/26/2017 | 319 | 314 | ||||||
BE Aerospace | ||||||||
4.000%, 11/19/2021 | 204 | 204 | ||||||
BE Aerospace, 1st Lien | ||||||||
4.000%, 11/19/2021 | 67 | 68 | ||||||
Booz Allen Hamilton, 1st Lien Term Loan B1 | ||||||||
3.750%, 07/31/2019 | 246 | 247 | ||||||
| Description | Face Amount ($ Thousands) | Market Value ($ Thousands) | ||||||
Brickman Group Holdings, 1st Lien Term Loan | ||||||||
4.000%, 12/18/2020 | $ | 494 | $ | 491 | ||||
Burger King, Cov-Lite, 1st Lien Term Loan B | ||||||||
4.500%, 12/12/2021 | 88 | 89 | ||||||
Calpine, Term Loan | ||||||||
4.000%, 04/01/2018 | 693 | 694 | ||||||
Catalent Pharma Solutions, 1st Lien Term Loan B | ||||||||
4.250%, 05/20/2021 | 496 | 498 | ||||||
CCM Merger | ||||||||
4.500%, 08/06/2021 | 404 | 405 | ||||||
CDW, Term Loan | ||||||||
3.250%, 04/29/2020 | 490 | 485 | ||||||
Ceramtec Acquisition | ||||||||
4.250%, 08/30/2020 | 84 | 84 | ||||||
CeramTec GmbH, Term Loan B | ||||||||
4.250%, 08/30/2020 | 210 | 210 | ||||||
Charter Communications Operating | ||||||||
4.250%, 09/12/2021 | 369 | 372 | ||||||
Charter Communications Operating LLC, Term Loan E | ||||||||
3.000%, 04/10/2020 | 314 | 313 | ||||||
Chief Exploration | ||||||||
7.500%, 05/16/2021 | 500 | 460 | ||||||
Community Health Services, 1st Lien Term Loan D | ||||||||
4.250%, 01/27/2021 | 593 | 595 | ||||||
Community Health Systems, 1st Lien | ||||||||
3.425%, 01/25/2018 | 30 | 30 | ||||||
Constantia Flexibles, 1st Lien | ||||||||
0.000%, 02/25/2022 (C) | 200 | 200 | ||||||
ConvaTec, Dollar Term Loan | ||||||||
4.000%, 12/30/2016 | 631 | 631 | ||||||
Cumulus Media, 1st Lien | ||||||||
4.250%, 12/23/2020 | 564 | 553 | ||||||
DAE Aviation Holdings, 1st Lien Term Loan | ||||||||
7.750%, 08/05/2019 | 200 | 200 | ||||||
5.000%, 11/02/2018 | 585 | 585 | ||||||
Dex Media West | ||||||||
8.000%, 10/24/2014 | 412 | 338 | ||||||
Dollar Tree, 1st Lien | ||||||||
4.250%, 02/06/2022 | 300 | 303 | ||||||
EFS Cogen Holdings, 1st Lien Term Loan | ||||||||
3.750%, 12/17/2020 | 220 | 220 | ||||||
Emergency Medical Services, Cov-Lite, Term Loan | ||||||||
4.000%, 05/25/2018 | 20 | 20 | ||||||
| SEI Institutional Managed Trust / Semi-Annual Report / March 31, 2015 | 35 |
SCHEDULE OF INVESTMENTS (Unaudited)
Enhanced Income Fund (Continued)
March 31, 2015
| Description | Face Amount ($ Thousands) | Market Value ($ Thousands) | ||||||
Emergency Medical Services, Initial Term Loan | ||||||||
4.000%, 04/27/2018 | $ | 217 | $ | 217 | ||||
4.000%, 05/25/2018 | 107 | 107 | ||||||
Endurance International, 1st Lien | ||||||||
5.000%, 11/09/2019 | 355 | 357 | ||||||
Energy & Exploration Partners, 1st Lien Term Loan B | ||||||||
7.750%, 01/22/2019 | 882 | 727 | ||||||
Energy Transfer Equity LP, 1st Lien | ||||||||
4.000%, 12/02/2019 | 250 | 249 | ||||||
Entegris, 1st Lien Term Loan B | ||||||||
3.500%, 04/30/2021 | 417 | 416 | ||||||
Epicor, Cov-Lite, 1st Lien | ||||||||
4.000%, 05/16/2018 | 563 | 563 | ||||||
Equinox Fitness Club, Term Loan B | ||||||||
5.000%, 01/31/2020 | 737 | 739 | ||||||
Evergreen Skillsoft, 1st Lien | ||||||||
5.750%, 04/28/2021 | 643 | 635 | ||||||
Fibertech Networks LLC, Term Loan B | ||||||||
4.000%, 11/30/2016 | 474 | 474 | ||||||
First Data, 1st Lien Term Loan | ||||||||
3.672%, 03/23/2018 | 624 | 624 | ||||||
Freescale Semiconductor, Term Loan | ||||||||
4.250%, 02/13/2020 | 796 | 797 | ||||||
Generac Power Systems, Term Loan B | ||||||||
3.250%, 06/22/2018 | 661 | 659 | ||||||
Genpact International, Term Loan B | ||||||||
3.500%, 08/30/2019 | 490 | 490 | ||||||
Gray Television, Cov-Lite, 1st Lien Term Loan | ||||||||
3.750%, 06/13/2021 | 151 | 151 | ||||||
Greeneden U.S. Holding II LLC | ||||||||
4.000%, 01/31/2020 | 895 | 889 | ||||||
Harbor Freight Tools | ||||||||
4.750%, 07/26/2019 | 236 | 238 | ||||||
Harron Communications L.P., Term Loan B | ||||||||
3.500%, 10/05/2017 | 175 | 173 | ||||||
Headwaters, 1st Lien Term Loan B | ||||||||
4.500%, 03/11/2022 | 80 | 80 | ||||||
Hilton Hotels, Cov-Lite, 1st Lien Term Loan B | ||||||||
3.500%, 10/26/2020 | 134 | 134 | ||||||
Hilton Worldwide Finance | ||||||||
3.500%, 10/26/2020 | 276 | 277 | ||||||
Hilton Worldwide Holdings, 1st Lien Term Loan B | ||||||||
3.500%, 10/26/2020 | 37 | 37 | ||||||
| Description | Face Amount ($ Thousands) | Market Value ($ Thousands) | ||||||
Hub International, 1st Lien Term Loan B | ||||||||
4.250%, 10/02/2020 | $ | 1,088 | $ | 1,078 | ||||
Hyperion Insurance Group | ||||||||
0.000%, 03/26/2022 (C) | 270 | 271 | ||||||
Ikaria, Cov-Lite, 1st Lien | ||||||||
5.000%, 02/12/2021 | 122 | 122 | ||||||
Ikaria, 2nd Lien | ||||||||
8.750%, 02/14/2022 | 80 | 81 | ||||||
IMS Health | ||||||||
3.500%, 03/17/2021 | 577 | 574 | ||||||
Ina Beteiligungs, 1st Lien Term Loan B | ||||||||
4.250%, 05/15/2020 | 425 | 428 | ||||||
Ineos Holdings Limited, Cov-Lite | ||||||||
3.750%, 04/27/2018 | 602 | 597 | ||||||
Ineos US Finance, 1st Lien | ||||||||
0.000%, 03/11/2022 (C) | 60 | 60 | ||||||
Intelsat Jackson Holdings | ||||||||
3.750%, 06/30/2019 | 288 | 287 | ||||||
Interactive Date, Cov-Lite, 1st Lien Term Loan | ||||||||
4.750%, 05/02/2021 | 530 | 532 | ||||||
ION Trading Technologies, 1st Lien Term Loan | ||||||||
4.250%, 06/10/2021 | 49 | 48 | ||||||
ION Trading Technologies, 2nd Lien Term Loan | ||||||||
7.250%, 06/10/2022 | 350 | 343 | ||||||
Jeld-Wen, Term Loan B, 1st Lien | ||||||||
5.250%, 09/24/2021 | 208 | 209 | ||||||
JHT Holding, 2nd Lien Term Loan | ||||||||
12.500%, 05/30/2015 (D) (E) (F) | 53 | 18 | ||||||
Kronos, Incremental Term Loan | ||||||||
4.500%, 10/30/2019 | 971 | 972 | ||||||
Language Line LLC, Term Loan B | ||||||||
6.250%, 06/20/2016 | 413 | 412 | ||||||
Lee Enterprises | ||||||||
7.250%, 03/31/2019 | 43 | 43 | ||||||
Lee Enterprises, Term Loan B | ||||||||
7.250%, 03/31/2019 | 272 | 273 | ||||||
Leslie’s Poolmart, Cov-Lite, 1st Lien | ||||||||
4.250%, 10/16/2019 | 586 | 582 | ||||||
Level 3 Communications | ||||||||
4.000%, 08/01/2019 | 750 | 751 | ||||||
Light Tower Fiber LLC, Term Loan | ||||||||
4.000%, 04/13/2020 | 197 | 196 | ||||||
Light Tower Fiber, Term Loan | ||||||||
8.000%, 04/12/2021 | 63 | 63 | ||||||
Media General, Term Loan | ||||||||
4.250%, 07/31/2020 | 223 | 224 | ||||||
MEG Energy | ||||||||
3.750%, 03/21/2020 | 629 | 602 | ||||||
| 36 | SEI Institutional Managed Trust / Semi-Annual Report / March 31, 2015 |
| Description | Face Amount ($ Thousands) | Market Value ($ Thousands) | ||||||
MGM Resorts, Term Loan B | ||||||||
3.500%, 12/20/2019 | $ | 392 | $ | 391 | ||||
Millennium Labortories, | ||||||||
5.250%, 04/16/2021 | 702 | 706 | ||||||
Mohegan Tribal Gaming Authority, 1st Lien Term Loan B | ||||||||
5.500%, 11/19/2019 | 249 | 247 | ||||||
MTL Publishing LLC, Term Loan B | ||||||||
3.750%, 03/05/2018 | 426 | 426 | ||||||
Mueller Water Products, | ||||||||
4.000%, 11/19/2021 | 98 | 98 | ||||||
Navistar International | ||||||||
5.750%, 08/17/2017 | 155 | 156 | ||||||
Nelson Education Limited, Term Loan B1 | ||||||||
6.750%, 07/05/2014 (G) | 206 | 165 | ||||||
Numericable US, 1st Lien Term Loan B1 | ||||||||
4.500%, 05/21/2020 | 70 | 70 | ||||||
Numericable US, 1st Lien Term Loan B2 | ||||||||
4.500%, 05/21/2020 | 60 | 60 | ||||||
Ocwen Financial | ||||||||
5.000%, 02/15/2018 | 96 | 94 | ||||||
One Call Medical, 1st Lien Term Loan | ||||||||
5.000%, 11/27/2020 | 958 | 958 | ||||||
Par Pharmaceutical Incremental Term Loan B3 | ||||||||
4.250%, 09/30/2019 | 200 | 200 | ||||||
Peabody Energy, Cov-Lite 1st Lien Term Loan B | ||||||||
4.250%, 09/24/2020 | 599 | 537 | ||||||
Pilot Travel Centers LLC, 1st Lien Term Loan B | ||||||||
4.250%, 09/17/2021 | 995 | 1,003 | ||||||
Post Holdings, 1st Lien Term Loan B | ||||||||
3.750%, 06/02/2021 | 240 | 240 | ||||||
Quintiles Transnational, 1st Lien Term Loan B3 | ||||||||
3.750%, 06/08/2018 | 422 | 423 | ||||||
Realogy | ||||||||
3.750%, 03/05/2020 | 28 | 28 | ||||||
Redtop Acquisitions, 1st Lien | ||||||||
4.500%, 12/03/2020 | 99 | 99 | ||||||
Redtop Acquisitions, 2nd Lien | ||||||||
8.250%, 06/03/2021 | 104 | 104 | ||||||
Regal Cinemas, 1st Lien | ||||||||
0.000%, 03/25/2022 (C) | 274 | 275 | ||||||
Rexnord LLC, Term Loan B | ||||||||
4.000%, 08/21/2020 | 829 | 828 | ||||||
| Description | Face Amount ($ Thousands) | Market Value ($ Thousands) | ||||||
Seadrill Partners LLC, 1st Lien Term Loan B | ||||||||
4.000%, 02/21/2021 | $ | 656 | $ | 519 | ||||
Seaworld | ||||||||
3.000%, 05/30/2020 | 313 | 305 | ||||||
Seminole Hard Rock Entertainment, Term Loan B | ||||||||
3.500%, 05/08/2020 | 499 | 496 | ||||||
Serta Simmons Holdings, Term Loan B | ||||||||
4.250%, 09/19/2019 | 504 | 505 | ||||||
Shields Finance, 1st Lien Term Loan B | ||||||||
5.000%, 01/29/2021 | 396 | 397 | ||||||
Skillsoft, Cov-Lite, 2nd Lien | ||||||||
9.250%, 04/28/2022 | 251 | 235 | ||||||
Smart & Final, Cov-Lite 1st Lien Term Loan, | ||||||||
4.750%, 11/15/2019 | 412 | 414 | ||||||
Starwood Property Trust, Term Loan B | ||||||||
3.500%, 04/17/2020 | 863 | 854 | ||||||
STHI Holding, 1st Lien Term Loan | ||||||||
4.500%, 08/06/2021 | 517 | 516 | ||||||
Surgical Care Affiliates, 1st Lien | ||||||||
4.250%, 03/11/2022 | 375 | 376 | ||||||
Syncreon Holdings, 1st Lien Term Loan B | ||||||||
5.250%, 10/28/2020 | 990 | 948 | ||||||
TASC, 1st Lien Term Loan | ||||||||
7.000%, 05/23/2020 | 499 | 504 | ||||||
TASC, 2nd Lien Term Loan | ||||||||
12.000%, 05/23/2021 | 300 | 316 | ||||||
Telesat Canada, Term Loan B | ||||||||
3.500%, 03/26/2019 | 391 | 390 | ||||||
Templar Energy, Cov-Lite, 2nd Lien Term Loan | ||||||||
8.500%, 11/25/2020 | 790 | 534 | ||||||
Texas Competitive Electric Holdings, Extending Term Loan | ||||||||
4.662%, 10/10/2017 (G) | 654 | 392 | ||||||
The Nieman Marcus Group, 1st Lien Term Loan | ||||||||
4.250%, 10/25/2020 | 593 | 590 | ||||||
TI Group Automotive Systems, 1st Lien | ||||||||
4.250%, 07/02/2021 | 859 | 858 | ||||||
Townsquare Media, 1st Lien | ||||||||
0.000%, 03/25/2022 (C) | 100 | 100 | ||||||
Trans Union LLC, 1st Lien Term Loan | ||||||||
4.000%, 04/09/2021 | 990 | 989 | ||||||
| SEI Institutional Managed Trust / Semi-Annual Report / March 31, 2015 | 37 |
SCHEDULE OF INVESTMENTS (Unaudited)
Enhanced Income Fund (Continued)
March 31, 2015
| Description | Face Amount ($ Thousands) | Market Value ($ Thousands) | ||||||
TransDigm, Cov-Lite, 1st Lien, | ||||||||
3.750%, 06/04/2021 | $ | 508 | $ | 506 | ||||
Tribune Company, 1st Lien | ||||||||
4.000%, 12/27/2020 | 645 | 646 | ||||||
True Religion Apparel, 1st Lien | ||||||||
5.875%, 07/30/2019 | 302 | 270 | ||||||
True Religion Apparel, Term Loan | ||||||||
5.875%, 07/30/2019 | 325 | 290 | ||||||
Univision Communications, Term Loan C3 | ||||||||
4.000%, 03/01/2020 | 543 | 541 | ||||||
Valeant Pharmaceuticals | ||||||||
3.750%, 02/13/2019 | 95 | 96 | ||||||
Valeant Pharmaceuticals International, Term Loan E | ||||||||
3.500%, 08/05/2020 | 398 | 398 | ||||||
Valeant Pharmaceuticals, | ||||||||
0.000%, 03/11/2022 (C) | 250 | 251 | ||||||
Vanity LLC, | ||||||||
3.750%, 06/13/2021 | 247 | 248 | ||||||
Verint Systems, | ||||||||
3.500%, 09/06/2019 | 390 | 390 | ||||||
Warner Music Group, Term Loan | ||||||||
3.750%, 07/01/2020 | 496 | 483 | ||||||
Waste Industries, | ||||||||
4.250%, 02/20/2020 | 400 | 401 | ||||||
WCA Waste Systems, | ||||||||
4.000%, 03/23/2018 | 243 | 241 | ||||||
Weight Watchers International | ||||||||
4.000%, 04/02/2020 | 358 | 191 | ||||||
Weight Watchers International, | ||||||||
4.000%, 04/02/2020 | — | — | ||||||
West | ||||||||
3.250%, 06/30/2018 | 293 | 292 | ||||||
WideOpenWest Finance | ||||||||
4.750%, 03/26/2019 | 146 | 146 | ||||||
Wilsonart International Holdings LLC, 1st Lien | ||||||||
4.000%, 10/31/2019 | 693 | 691 | ||||||
York Risk Services Holding, | ||||||||
4.750%, 09/18/2021 | 687 | 685 | ||||||
Zayo Group LLC, Term Loan B | ||||||||
4.000%, 07/02/2019 | 778 | 778 | ||||||
| Description | Face Amount ($ Thousands) | Market Value ($ Thousands) | ||||||
Ziggo, 1st Lien Term Loan B1 | ||||||||
3.250%, 01/15/2022 | $ | 307 | $ | 305 | ||||
Ziggo, 1st Lien Term Loan B2 | ||||||||
3.250%, 01/15/2022 | 173 | 172 | ||||||
Ziggo, 1st Lien Term Loan B3 | ||||||||
3.500%, 01/15/2022 | 309 | 307 | ||||||
|
| |||||||
Total Loan Participations |
| 62,412 | ||||||
|
| |||||||
ASSET-BACKED SECURITIES — 17.6% |
| |||||||
Automotive — 6.3% | ||||||||
Ally Auto Receivables Trust, | ||||||||
0.720%, 05/20/2016 | 168 | 168 | ||||||
Ally Auto Receivables Trust, | ||||||||
0.750%, 02/21/2017 | 285 | 285 | ||||||
American Credit Acceptance Receivables Trust, | ||||||||
1.640%, 11/15/2016 (B) | 12 | 13 | ||||||
American Credit Acceptance Receivables Trust, | ||||||||
1.450%, 04/16/2018 (B) | 93 | 93 | ||||||
American Credit Acceptance Receivables Trust, | ||||||||
1.320%, 02/15/2017 (B) | 43 | 43 | ||||||
American Credit Acceptance Receivables Trust, | ||||||||
1.140%, 03/12/2018 (B) | 65 | 65 | ||||||
American Credit Acceptance Receivables Trust, | ||||||||
1.330%, 07/10/2018 (B) | 166 | 167 | ||||||
Americredit Automobile Receivables Trust, Ser 2011-2, Cl C | ||||||||
3.190%, 10/12/2016 | 181 | 181 | ||||||
AmeriCredit Automobile Receivables Trust, Ser 2012-5, Cl A3 | ||||||||
0.620%, 06/08/2017 | 158 | 158 | ||||||
AmeriCredit Automobile Receivables Trust, Ser 2013-2, Cl A3 | ||||||||
0.650%, 12/08/2017 | 391 | 391 | ||||||
AmeriCredit Automobile Receivables Trust, Ser 2013-5, Cl A2B | ||||||||
0.555%, 03/08/2017 (A) | 51 | 51 | ||||||
| 38 | SEI Institutional Managed Trust / Semi-Annual Report / March 31, 2015 |
| Description | Face Amount ($ Thousands) | Market Value ($ Thousands) | ||||||
ARI Fleet Lease Trust, | ||||||||
0.725%, 03/15/2020 (A) (B) | $ | 188 | $ | 188 | ||||
ARI Fleet Lease Trust, | ||||||||
0.475%, 01/15/2021 (A) (B) | 154 | 153 | ||||||
Capital Auto Receivables Asset Trust, Ser 2014-1, Cl A1A | ||||||||
0.680%, 05/20/2016 | 200 | 200 | ||||||
Carfinance Capital Auto Trust, Ser 2013-1A, Cl A | ||||||||
1.650%, 07/17/2017 (B) | 9 | 9 | ||||||
CarMax Auto Owner Trust, | ||||||||
2.170%, 07/17/2017 | 550 | 555 | ||||||
CarMax Auto Owner Trust, | ||||||||
0.890%, 09/15/2016 | 18 | 18 | ||||||
CarMax Auto Owner Trust, | ||||||||
1.500%, 08/15/2018 | 115 | 116 | ||||||
Carnow Auto Receivables Trust, Ser 2014-1A, Cl A | ||||||||
0.960%, 01/17/2017 (B) | 344 | 344 | ||||||
Chesapeake Funding LLC, | ||||||||
0.925%, 11/07/2023 (A) (B) | 108 | 108 | ||||||
Chesapeake Funding LLC, | ||||||||
0.625%, 01/07/2025 (A) (B) | 608 | 608 | ||||||
Chesapeake Funding LLC, | ||||||||
0.595%, 03/07/2026 (A) (B) | 490 | 490 | ||||||
Chesapeake Funding, Ser 2015-1A, Cl A | ||||||||
0.675%, 02/07/2027 (A) (B) | 755 | 755 | ||||||
Chrysler Capital Auto Receivables Trust, Ser 2013-AA, Cl A2 | ||||||||
0.610%, 11/15/2016 (B) | 19 | 19 | ||||||
CPS Auto Receivables Trust, Ser 2013-D, Cl A | ||||||||
1.540%, 07/16/2018 (B) | 167 | 167 | ||||||
CPS Auto Receivables Trust, Ser 2014-A, Cl A | ||||||||
1.210%, 08/15/2018 (B) | 172 | 171 | ||||||
Credit Acceptance Auto Loan Trust, Ser 2013-1A, Cl A | ||||||||
1.210%, 10/15/2020 (B) | 270 | 270 | ||||||
Credit Acceptance Auto Loan Trust, Ser 2013-2A, Cl A | ||||||||
1.500%, 04/15/2021 (B) | 400 | 401 | ||||||
Credit Acceptance Auto Loan Trust, Ser 2014-1A, Cl A | ||||||||
1.550%, 10/15/2021 (B) | 345 | 345 | ||||||
| Description | Face Amount ($ Thousands) | Market Value ($ Thousands) | ||||||
DT Auto Owner Trust, Ser 2014-1A, Cl A | ||||||||
0.660%, 07/17/2017 (B) | $ | 61 | $ | 61 | ||||
Enterprise Fleet Financing LLC, Ser 2013-1, Cl A2 | ||||||||
0.680%, 09/20/2018 (B) | 197 | 197 | ||||||
Enterprise Fleet Financing, Ser 2014-1, Cl A2 | ||||||||
0.870%, 09/20/2019 (B) | 184 | 184 | ||||||
First Investors Auto Owner Trust, Ser 2012-2A, Cl A2 | ||||||||
1.470%, 05/15/2018 (B) | 112 | 113 | ||||||
First Investors Auto Owner Trust, Ser 2013-1A, Cl A2 | ||||||||
0.900%, 10/15/2018 (B) | 61 | 61 | ||||||
First Investors Auto Owner Trust, Ser 2013-2A, Cl A2 | ||||||||
1.230%, 03/15/2019 (B) | 290 | 291 | ||||||
First Investors Auto Owner Trust, Ser 2013-3A, Cl A2 | ||||||||
0.890%, 09/15/2017 (B) | 54 | 54 | ||||||
First Investors Auto Owner Trust, Ser 2014-1A, Cl A2 | ||||||||
0.800%, 02/15/2018 (B) | 155 | 155 | ||||||
Ford Credit Auto Owner Trust, Ser 2011-A, Cl D | ||||||||
3.210%, 07/15/2017 | 650 | 652 | ||||||
Ford Credit Auto Owner Trust, Ser 2012-A, Cl B | ||||||||
1.880%, 08/15/2017 | 475 | 480 | ||||||
Ford Credit Auto Owner Trust, Ser 2012-B, Cl D | ||||||||
2.930%, 10/15/2018 | 700 | 717 | ||||||
Harley-Davidson Motorcycle Trust, Ser 2012-1, Cl A3 | ||||||||
0.680%, 04/15/2017 | 26 | 26 | ||||||
M&T Bank Auto Receivables Trust, Ser 2013-1A, Cl A3 | ||||||||
1.060%, 11/15/2017 (B) | 730 | 732 | ||||||
Mercedes Benz Auto Lease Trust, Ser 2013-B, Cl A3 | ||||||||
0.620%, 07/15/2016 | 129 | 129 | ||||||
Motor PLC, Ser 2013-1A, Cl A1 | ||||||||
0.674%, 02/15/2021 (A) (B) | 59 | 59 | ||||||
Porsche Innovative Lease Owner Trust, Ser 2013-1, Cl A4 | ||||||||
0.880%, 10/22/2019 (B) | 335 | 335 | ||||||
Prestige Auto Receivables Trust, Ser 2013-1A, Cl A2 | ||||||||
1.090%, 02/15/2018 (B) | 139 | 139 | ||||||
Prestige Auto Receivables Trust, Ser 2014-1A, Cl A2 | ||||||||
0.970%, 03/15/2018 (B) | 208 | 208 | ||||||
| SEI Institutional Managed Trust / Semi-Annual Report / March 31, 2015 | 39 |
SCHEDULE OF INVESTMENTS (Unaudited)
Enhanced Income Fund (Continued)
March 31, 2015
| Description | Face Amount ($ Thousands) | Market Value ($ Thousands) | ||||||
Prestige Auto Receivables Trust, Ser 2015-1, Cl A2 | ||||||||
1.090%, 02/15/2019 (B) | $ | 270 | $ | 270 | ||||
Santander Drive Auto Receivables Trust, Ser 2012-3, Cl D | ||||||||
3.640%, 05/15/2018 | 545 | 561 | ||||||
Santander Drive Auto Receivables Trust, Ser 2012-4, Cl B | ||||||||
1.830%, 03/15/2017 | 230 | 230 | ||||||
Santander Drive Auto Receivables Trust, Ser 2013-3, Cl A3 | ||||||||
0.700%, 10/16/2017 | 318 | 317 | ||||||
Santander Drive Auto Receivables Trust, Ser 2014-1, Cl A2A | ||||||||
0.660%, 06/15/2017 | 46 | 46 | ||||||
Santander Drive Auto Receivables Trust, Ser 2014-2, Cl A2A | ||||||||
0.540%, 07/17/2017 | 178 | 178 | ||||||
SNAAC Auto Receivables Trust, Ser 2013-1A, Cl A | ||||||||
1.140%, 07/16/2018 (B) | 6 | 6 | ||||||
Westlake Automobile Receivables Trust, Ser 2013-1A, Cl A2 | ||||||||
1.120%, 01/15/2018 (B) | 127 | 127 | ||||||
Westlake Automobile Receivables Trust, Ser 2014-1A, Cl A2 | ||||||||
0.700%, 05/15/2017 (B) | 375 | 374 | ||||||
Westlake Automobile Receivables Trust, Ser 2014-2A, Cl A2 | ||||||||
0.970%, 10/16/2017 (B) | 410 | 410 | ||||||
Wheels SPV 2 LLC, Ser 2014-1A, Cl A2 | ||||||||
0.840%, 03/20/2023 (B) | 489 | 489 | ||||||
World Omni Auto Receivables Trust, Ser 2012-A, Cl A3 | ||||||||
0.640%, 02/15/2017 | 42 | 42 | ||||||
World Omni Master Owner Trust, Ser 2013-1, Cl A | ||||||||
0.523%, 02/15/2018 (A) (B) | 235 | 235 | ||||||
|
| |||||||
| 14,410 | ||||||||
|
| |||||||
Credit Cards — 4.2% | ||||||||
Barclays Dryrock Issuance Trust, Ser 2012-2, Cl A | ||||||||
0.640%, 08/15/2018 | 440 | 440 | ||||||
Barclays Dryrock Issuance Trust, Ser 2013-1, Cl A | ||||||||
0.512%, 07/16/2018 (A) | 240 | 240 | ||||||
Barclays Dryrock Issuance Trust, Ser 2014-1, Cl A | ||||||||
0.533%, 12/16/2019 (A) | 365 | 365 | ||||||
Cabela’s Credit Card Master Note Trust, Ser 2014-1, Cl A | ||||||||
0.523%, 03/16/2020 (A) | 190 | 190 | ||||||
| Description | Face Amount ($ Thousands) | Market Value ($ Thousands) | ||||||
Chase Issuance Trust, Ser 2007-B1, Cl B1 | ||||||||
0.425%, 04/15/2019 (A) | $ | 750 | $ | 746 | ||||
Chase Issuance Trust, Ser 2012-A3, Cl A3 | ||||||||
0.790%, 06/15/2017 | 495 | 495 | ||||||
Chase Issuance Trust, Ser 2012-A5, Cl A5 | ||||||||
0.590%, 08/15/2017 | 675 | 675 | ||||||
Chase Issuance Trust, Ser 2013-A6, Cl A6 | ||||||||
0.595%, 07/15/2020 (A) | 650 | 652 | ||||||
Chase Issuance Trust, Ser 2014-A1, Cl A1 | ||||||||
1.150%, 01/15/2019 | 490 | 492 | ||||||
Citibank Credit Card Issuance Trust, Ser 2013-A3, Cl A3 | ||||||||
1.110%, 07/23/2018 | 600 | 602 | ||||||
Citibank Credit Card Issuance Trust, Ser 2014-A2, Cl A2 | ||||||||
1.020%, 02/22/2019 | 485 | 485 | ||||||
Citibank Credit Card Issuance Trust, Ser 2014-A4, Cl A4 | ||||||||
1.230%, 04/24/2019 | 1,000 | 1,004 | ||||||
Discover Card Execution Note Trust, Ser 2014-A3, Cl A3 | ||||||||
1.220%, 10/15/2019 | 525 | 527 | ||||||
GE Capital Credit Card Master Note Trust, Ser 2012-5, Cl A | ||||||||
0.950%, 06/15/2018 | 475 | 475 | ||||||
Golden Credit Card Trust, Ser 2012-5A, Cl A | ||||||||
0.790%, 09/15/2017 (B) | 525 | 525 | ||||||
Golden Credit Card Trust, Ser 2014-1A, Cl A | ||||||||
0.511%, 03/15/2019 (A) (B) | 435 | 435 | ||||||
Master Credit Card Trust, Ser 2012-2A, Cl A | ||||||||
0.780%, 04/21/2017 (B) | 330 | 330 | ||||||
Synchrony Credit Card Master Note Trust, Ser 2014-1, Cl A | ||||||||
1.610%, 11/15/2020 | 800 | 802 | ||||||
|
| |||||||
| 9,480 | ||||||||
|
| |||||||
Other Asset-Backed Securities — 7.1% |
| |||||||
Accredited Mortgage Loan Trust, Ser 2004-4, Cl A1A | ||||||||
0.854%, 01/25/2035 (A) | 237 | 233 | ||||||
Aegis Asset-Backed Securities Trust Mortgage Pass-Through Certificates, Ser 2004-3, Cl A2B | ||||||||
1.271%, 09/25/2034 (A) | 238 | 235 | ||||||
Ally Master Owner Trust, Ser 2012-3, Cl A1 | ||||||||
0.875%, 06/15/2017 (A) | 500 | 500 | ||||||
| 40 | SEI Institutional Managed Trust / Semi-Annual Report / March 31, 2015 |
| Description | Face Amount ($ Thousands) | Market Value ($ Thousands) | ||||||
Ally Master Owner Trust, Ser 2013-1, Cl A1 | ||||||||
0.625%, 02/15/2018 (A) | $ | 280 | $ | 280 | ||||
Ally Master Owner Trust, Ser 2013-2, Cl A | ||||||||
0.625%, 04/15/2018 (A) | 675 | 676 | ||||||
Ally Master Owner Trust, Ser 2014-1, Cl A1 | ||||||||
0.645%, 01/15/2019 (A) | 570 | 572 | ||||||
Ally Master Owner Trust, Ser 2014-2, Cl A | ||||||||
0.545%, 01/16/2018 (A) | 660 | 660 | ||||||
Ally Master Owner Trust, Ser 2014-4, Cl A2 | ||||||||
1.430%, 06/17/2019 | 830 | 834 | ||||||
Ally Master Owner Trust, Ser 2014-5, Cl A2 | ||||||||
1.600%, 10/15/2019 | 800 | 803 | ||||||
Bear Stearns Asset-Backed Securities Trust, Ser 2005-SD2, Cl 2A1 | ||||||||
0.834%, 12/25/2044 (A) | 154 | 154 | ||||||
CIFC Funding Ltd., Ser 2013-1A, Cl A1 | ||||||||
1.404%, 04/16/2025 (A) (B) | 485 | 479 | ||||||
CNH Equipment Trust, Ser 2012-B, Cl A3 | ||||||||
0.860%, 09/15/2017 | 52 | 53 | ||||||
CNH Equipment Trust, Ser 2013-D, Cl A2 | ||||||||
0.490%, 03/15/2017 | 45 | 45 | ||||||
First Franklin Mortgage Loan Trust, Ser 2006-FF1, Cl 2A3 | ||||||||
0.414%, 01/25/2036 (A) | 518 | 511 | ||||||
Ford Credit Floorplan Master Owner Trust, Ser 2013-1, Cl A2 | ||||||||
0.555%, 01/15/2018 (A) | 330 | 330 | ||||||
Ford Credit Floorplan Master Owner Trust, Ser 2013-5, Cl A2 | ||||||||
0.643%, 09/15/2018 (A) | 505 | 506 | ||||||
Ford Credit Floorplan Master Owner Trust, Ser 2014-1, Cl A2 | ||||||||
0.573%, 02/15/2019 (A) | 490 | 491 | ||||||
Ford Credit Floorplan Master Owner Trust, Ser 2014-1, Cl B | ||||||||
1.400%, 02/15/2019 | 90 | 90 | ||||||
Ford Credit Floorplan Master Owner Trust, Ser 2015-1, Cl A2 | ||||||||
0.575%, 01/15/2020 (A) | 800 | 800 | ||||||
GE Dealer Floorplan Master Note Trust, Ser 2012-3, Cl A | ||||||||
0.666%, 06/20/2017 (A) | 455 | 455 | ||||||
GE Dealer Floorplan Master Note Trust, Ser 2015-1, Cl A | ||||||||
0.676%, 01/20/2020 (A) | 745 | 745 | ||||||
| Description | Face Amount ($ Thousands) | Market Value ($ Thousands) | ||||||
GE Equipment Midticket LLC, Ser 2012-1, Cl A3 | ||||||||
0.600%, 05/23/2016 | $ | 52 | $ | 52 | ||||
GE Equipment Midticket LLC, Ser 2013-1, Cl A2 | ||||||||
0.640%, 03/22/2016 | 18 | 18 | ||||||
GE Equipment Small Ticket LLC, Ser 2013-1A, Cl A2 | ||||||||
0.730%, 01/25/2016 (B) | 22 | 22 | ||||||
GE Equipment Small Ticket LLC, | ||||||||
0.950%, 09/25/2017 (B) | 800 | 800 | ||||||
Golden Credit Card Trust, | ||||||||
0.603%, 09/15/2018 (A) (B) | 625 | 626 | ||||||
John Deere Owner Trust, | ||||||||
0.530%, 07/15/2016 | 143 | 143 | ||||||
John Deere Owner Trust, | ||||||||
0.600%, 03/15/2017 | 480 | 481 | ||||||
JPMorgan Mortgage Acquisition Trust, Ser 2007-CH1, Cl AV4 | ||||||||
0.301%, 11/25/2036 (A) | 145 | 144 | ||||||
Kubota Credit Owner Trust, | ||||||||
0.580%, 02/15/2017 (B) | 183 | 183 | ||||||
Kubota Credit Owner Trust, | ||||||||
0.940%, 12/15/2017 (B) | 515 | 515 | ||||||
Mercedes-Benz Master Owner Trust, Ser 2012-AA, Cl A | ||||||||
0.790%, 11/15/2017 (B) | 310 | 310 | ||||||
MMAF Equipment Finance, | ||||||||
0.870%, 01/08/2019 (B) | 745 | 741 | ||||||
NYCTL Trust, Ser 2013-A, Cl A | ||||||||
1.190%, 11/10/2026 (B) | 13 | 13 | ||||||
NYCTL Trust, Ser 2014-A, Cl A | ||||||||
1.030%, 11/10/2027 (B) | 147 | 147 | ||||||
SLM Student Loan Trust, | ||||||||
0.694%, 03/25/2026 (A) | 296 | 297 | ||||||
SLM Student Loan Trust, | ||||||||
1.025%, 12/16/2024 (A) (B) | 110 | 110 | ||||||
Springleaf Funding Trust, | ||||||||
2.410%, 12/15/2022 (B) | 510 | 510 | ||||||
Structured Asset Securities Mortgage Loan Trust, | ||||||||
0.404%, 07/25/2036 (A) (B) | 889 | 884 | ||||||
| SEI Institutional Managed Trust / Semi-Annual Report / March 31, 2015 | 41 |
SCHEDULE OF INVESTMENTS (Unaudited)
Enhanced Income Fund (Continued)
March 31, 2015
| Description | Face Amount ($ Thousands) | Market Value ($ Thousands) | ||||||
Structured Asset Securities Mortgage Loan Trust, | ||||||||
0.324%, 02/25/2036 (A) | $ | 248 | $ | 244 | ||||
Volvo Financial Equipment LLC, Ser 2013-1A, Cl A3 | ||||||||
0.740%, 03/15/2017 (B) | 256 | 256 | ||||||
Volvo Financial Equipment LLC, Ser 2014-1A, Cl A3 | ||||||||
0.820%, 04/16/2018 (B) | 285 | 285 | ||||||
|
| |||||||
| 16,233 | ||||||||
|
| |||||||
Total Asset-Backed Securities | 40,123 | |||||||
|
| |||||||
MORTGAGE-BACKED SECURITIES — 12.4% |
| |||||||
Agency Mortgage-Backed Obligations — 3.4% |
| |||||||
FHLMC | ||||||||
6.000%, 09/01/2026 | 95 | 108 | ||||||
FNMA | ||||||||
6.500%, 09/01/2026 | 71 | 83 | ||||||
6.000%, 11/01/2026 to 04/01/2040 | 532 | 606 | ||||||
5.000%, 02/01/2023 to 03/01/2025 | 157 | 171 | ||||||
FNMA TBA | ||||||||
3.500%, 04/01/2041 | 900 | 955 | ||||||
3.000%, 04/25/2026 to 05/25/2026 | 4,700 | 4,854 | ||||||
NCUA Guaranteed Notes, | ||||||||
0.618%, 10/07/2020 (A) | 353 | 355 | ||||||
NCUA Guaranteed Notes, | ||||||||
0.621%, 01/08/2020 (A) | 458 | 461 | ||||||
NCUA Guaranteed Notes, | ||||||||
0.572%, 03/11/2020 (A) | 152 | 152 | ||||||
NCUA Guaranteed Notes, | ||||||||
0.551%, 03/06/2020 (A) | 118 | 119 | ||||||
NCUA Guaranteed Notes, | ||||||||
0.551%, 05/07/2020 (A) | 33 | 33 | ||||||
|
| |||||||
| 7,897 | ||||||||
|
| |||||||
Non-Agency Mortgage-Backed Obligations — 9.0% |
| |||||||
Adjustable Rate Mortgage Trust, | ||||||||
0.634%, 08/25/2035 (A) (B) | 262 | 259 | ||||||
Banc of America Mortgage Securities, | ||||||||
2.694%, 11/25/2034 (A) (B) | 98 | 99 | ||||||
| Description | Face Amount ($ Thousands) | Market Value ($ Thousands) | ||||||
Banc of America Mortgage Securities, | ||||||||
2.610%, 04/25/2035 (A) (B) | $ | 283 | $ | 261 | ||||
Banc of America Mortgage Securities, | ||||||||
2.698%, 10/25/2035 (A) (B) | 219 | 192 | ||||||
Bear Stearns Commercial Mortgage Securities, | ||||||||
5.405%, 12/11/2040 (A) | 366 | 372 | ||||||
Bear Stearns Commercial Mortgage Securities, | ||||||||
4.871%, 09/11/2042 | 72 | 72 | ||||||
Bear Stearns Commercial Mortgage Securities, | ||||||||
5.140%, 10/12/2042 (A) | 295 | 298 | ||||||
Bear Stearns Commercial Mortgage Securities, | ||||||||
5.438%, 03/11/2039 (A) | 423 | 433 | ||||||
Bear Stearns Commercial Mortgage Securities, | ||||||||
5.540%, 09/11/2041 | 318 | 332 | ||||||
CD Commercial Mortgage Trust, | ||||||||
5.226%, 07/15/2044 (A) | 655 | 658 | ||||||
Citigroup Commercial Mortgage Trust, Ser 2008-C7, Cl A4 | ||||||||
6.134%, 12/10/2049 (A) | 484 | 529 | ||||||
Citigroup Commercial Mortgage Trust, Ser 2012-GC8, Cl A1 | ||||||||
0.685%, 09/10/2045 | 240 | 240 | ||||||
Citigroup Deutsche Bank Commercial Mortgage, | ||||||||
5.322%, 12/11/2049 | 725 | 763 | ||||||
Citigroup Mortgage Loan Trust, | ||||||||
2.577%, 09/25/2034 (A) (B) | 65 | 65 | ||||||
Citigroup/Deutsche Bank Commercial Mortgage Trust, | ||||||||
5.298%, 01/15/2046 (A) | 347 | 354 | ||||||
Citigroup/Deutsche Bank Commercial Mortgage Trust, | ||||||||
5.886%, 11/15/2044 (A) | 566 | 615 | ||||||
COMM Mortgage Trust, | ||||||||
5.751%, 06/10/2046 (A) | 552 | 572 | ||||||
| 42 | SEI Institutional Managed Trust / Semi-Annual Report / March 31, 2015 |
| Description | Face Amount ($ Thousands) | Market Value ($ Thousands) | ||||||
COMM Mortgage Trust, | ||||||||
0.704%, 10/15/2045 | $ | 195 | $ | 194 | ||||
COMM Mortgage Trust, | ||||||||
1.278%, 08/10/2046 | 230 | 230 | ||||||
COMM Mortgage Trust, | ||||||||
1.344%, 07/10/2045 | 193 | 194 | ||||||
Comm Mortgage Trust, | ||||||||
0.975%, 03/15/2029 (A) (B) | 340 | 334 | ||||||
Commercial Mortgage Pass-Through Certificates, | ||||||||
3.156%, 07/10/2046 (B) | 286 | 288 | ||||||
Commercial Mortgage Pass-Through Certificates, | ||||||||
0.824%, 08/15/2045 | 172 | 172 | ||||||
Commercial Mortgage Pass-Through Certificates, | ||||||||
0.666%, 11/15/2045 | 154 | 154 | ||||||
Connecticut Avenue Securities, | ||||||||
1.374%, 07/25/2024 (A) (B) | 687 | 687 | ||||||
DBUBS Mortgage Trust, | ||||||||
3.742%, 11/10/2046 (B) | 442 | 450 | ||||||
FNMA Connecticut Avenue Securities, | ||||||||
1.124%, 05/25/2024 (A) (B) | 313 | 311 | ||||||
FNMA Connecticut Avenue Securities, | ||||||||
1.124%, 05/25/2024 (A) (B) | 245 | 244 | ||||||
GE Business Loan Trust, | ||||||||
1.175%, 11/15/2031 (A) (B) | 20 | 19 | ||||||
GE Business Loan Trust, | ||||||||
0.395%, 12/15/2032 (A) (B) | 27 | 26 | ||||||
GE Business Loan Trust, | ||||||||
0.655%, 12/15/2032 (A) (B) | 20 | 19 | ||||||
GE Capital Commercial Mortgage, | ||||||||
5.322%, 11/10/2045 (A) | 1,100 | 1,112 | ||||||
Granite Master Issuer PLC, | ||||||||
0.256%, 12/20/2054 (A) (B) | 607 | 603 | ||||||
| Description | Face Amount ($ Thousands) | Market Value ($ Thousands) | ||||||
Granite Master Issuer PLC, | ||||||||
0.256%, 12/20/2054 (A) (B) | $ | 625 | $ | 622 | ||||
Granite Master Issuer PLC, | ||||||||
0.356%, 12/20/2054 (A) (B) | 93 | 92 | ||||||
Granite Master Issuer PLC, | ||||||||
0.316%, 12/20/2054 (A) (B) | 355 | 352 | ||||||
Granite Master Issuer PLC, | ||||||||
0.376%, 12/20/2054 (A) (B) | 109 | 109 | ||||||
GS Mortgage Securities II, | ||||||||
0.662%, 11/10/2045 | 164 | 164 | ||||||
GS Mortgage Securities, | ||||||||
3.849%, 12/10/2043 (B) | 442 | 451 | ||||||
GS Mortgage Securities, | ||||||||
1.206%, 07/10/2046 | 143 | 144 | ||||||
Hilton USA, | ||||||||
1.173%, 11/05/2030 (A) (B) | 241 | 241 | ||||||
Impac CMB Trust, | ||||||||
0.694%, 04/25/2035 (A) (B) | 214 | 195 | ||||||
JPMorgan Chase Commercial Mortgage Securities Trust, | ||||||||
0.909%, 07/25/2035 (A) | 173 | 172 | ||||||
JPMorgan Chase Commercial Mortgage Securities Trust, | ||||||||
4.918%, 10/15/2042 (A) | 483 | 485 | ||||||
JPMorgan Chase Commercial Mortgage Securities Trust, | ||||||||
5.841%, 04/15/2045 (A) | 215 | 222 | ||||||
JPMorgan Chase Commercial Mortgage Securities Trust, | ||||||||
3.853%, 06/15/2043 (B) | 53 | 53 | ||||||
JPMorgan Chase Commercial Mortgage Securities Trust, | ||||||||
0.705%, 10/15/2045 | 71 | 71 | ||||||
JPMorgan Chase Commercial Mortgage Securities Trust, | ||||||||
1.303%, 01/15/2046 | 253 | 254 | ||||||
JPMorgan Chase Commercial Mortgage Securities, | ||||||||
0.670%, 12/15/2047 | 44 | 44 | ||||||
| SEI Institutional Managed Trust / Semi-Annual Report / March 31, 2015 | 43 |
SCHEDULE OF INVESTMENTS (Unaudited)
Enhanced Income Fund (Continued)
March 31, 2015
| Description | Face Amount ($ Thousands) | Market Value ($ Thousands) | ||||||
JPMorgan Mortgage Trust, | ||||||||
2.660%, 10/25/2036 (A) (B) | $ | 454 | $ | 427 | ||||
LB-UBS Commercial Mortgage Trust, Ser C6, Cl A4 | ||||||||
5.858%, 07/15/2040 (A) | 553 | 580 | ||||||
Merrill Lynch Mortgage Investors, | ||||||||
2.770%, 12/25/2034 (A) (B) | 153 | 152 | ||||||
Merrill Lynch/Countrywide Commercial Mortgage Trust, | ||||||||
5.378%, 08/12/2048 | 140 | 148 | ||||||
Morgan Stanley Bank of America Merrill Lynch Trust, | ||||||||
0.664%, 11/15/2045 | 96 | 96 | ||||||
Morgan Stanley Re-REMIC Trust, | ||||||||
1.000%, 03/27/2051 (B) | 291 | 291 | ||||||
MortgageIT Trust, | ||||||||
0.434%, 12/25/2035 (A) (B) | 676 | 615 | ||||||
Opteum Mortgage Acceptance Asset-Backed Pass-Through Certificates, Ser 2005-2, Cl AII1 | ||||||||
0.434%, 04/25/2035 (A) (B) | 450 | 451 | ||||||
Option One Mortgage Loan Trust, | ||||||||
0.674%, 02/25/2035 (A) | 245 | 241 | ||||||
Sequoia Mortgage Trust, | ||||||||
0.814%, 11/20/2034 (A) (B) | 162 | 152 | ||||||
Sequoia Mortgage Trust, | ||||||||
0.474%, 12/20/2034 (A) (B) | 122 | 119 | ||||||
Sequoia Mortgage Trust, | ||||||||
0.394%, 03/20/2035 (A) (B) | 74 | 68 | ||||||
Springleaf Mortgage Loan Trust, | ||||||||
1.270%, 06/25/2058 (A) (B) | 210 | 210 | ||||||
UBS-Barclays Commercial | ||||||||
0.726%, 08/10/2049 | 276 | 274 | ||||||
Wachovia Bank Commercial | ||||||||
5.272%, 10/15/2044 (A) | 228 | 230 | ||||||
| Description | Face Amount ($ Thousands) | Market Value ($ Thousands) | ||||||
Wachovia Bank Commercial | ||||||||
5.271%, 12/15/2044 (A) | $ | 266 | $ | 269 | ||||
Washington Mutual Mortgage Pass-Through Certificates, | ||||||||
2.324%, 03/25/2036 (A) (B) | 280 | 259 | ||||||
Wells Fargo Commercial | ||||||||
0.687%, 10/15/2045 | 273 | 273 | ||||||
Wells Fargo Mortgage-Backed Securities Trust, | ||||||||
2.618%, 01/25/2035 (A) (B) | 220 | 218 | ||||||
WFRBS Commercial Mortgage Trust, Ser 2011-C6, Cl A1 | ||||||||
1.081%, 04/15/2045 | 117 | 118 | ||||||
WFRBS Commercial Mortgage Trust, Ser 2012-C9, Cl A1 | ||||||||
0.673%, 11/15/2045 | 287 | 286 | ||||||
WFRBS Commercial Mortgage Trust, Ser 2013-C15, Cl A1 | ||||||||
1.264%, 08/15/2046 | 165 | 166 | ||||||
|
| |||||||
| 20,465 | ||||||||
|
| |||||||
Total Mortgage-Backed Securities |
| 28,362 | ||||||
|
| |||||||
COLLATERALIZED DEBT OBLIGATIONS — 3.5% |
| |||||||
Other Asset-Backed Securities — 3.5% |
| |||||||
Apidos CLO XII, | ||||||||
1.353%, 04/15/2025 (A) (B) | 550 | 541 | ||||||
Apidos CLO XVII, | ||||||||
1.757%, 04/17/2026 (A) (B) | 350 | 350 | ||||||
Cent CLO 16 L.P., | ||||||||
1.505%, 08/01/2024 (A) (B) | 500 | 500 | ||||||
Cent CLO 20, | ||||||||
1.736%, 01/25/2026 (A) (B) | 625 | 622 | ||||||
Dryden XXXI Senior Loan Fund, | ||||||||
1.607%, 04/18/2026 (A) (B) | 510 | 507 | ||||||
Gramercy Park CLO, | ||||||||
1.557%, 07/17/2023 (A) (B) | 400 | 400 | ||||||
| 44 | SEI Institutional Managed Trust / Semi-Annual Report / March 31, 2015 |
| Description | Face Amount ($ Thousands) | Market Value ($ Thousands) | ||||||
ING Investment Management CLO, | ||||||||
1.757%, 04/18/2026 (A) (B) | $ | 510 | $ | 508 | ||||
ING Investment Management CLO, | ||||||||
2.091%, 03/14/2022 (A) (B) | 500 | 498 | ||||||
ING Investment Management CLO, | ||||||||
1.471%, 03/14/2022 (A) (B) | 600 | 600 | ||||||
Limerock CLO II, | ||||||||
1.757%, 04/18/2026 (A) (B) | 600 | 599 | ||||||
Neuberger Berman CLO XVI, | ||||||||
1.723%, 04/15/2026 (A) (B) | 440 | 440 | ||||||
Octagon Investment Partners XVI Ltd., Ser 2013-1A, Cl A | ||||||||
1.377%, 07/17/2025 (A) (B) | 550 | 542 | ||||||
OHA Credit Partners VIII Ltd., | ||||||||
1.351%, 04/20/2025 (A) (B) | 330 | 325 | ||||||
OHA Intrepid Leveraged Loan Fund, Ser 2013-1AR, Cl AR | ||||||||
1.177%, 04/20/2021 (A) (B) | 252 | 252 | ||||||
Race Point VI CLO Ltd., | ||||||||
2.413%, 05/24/2023 (A) (B) | 525 | 525 | ||||||
Symphony CLO Ltd., Ser 2014-8AR, Cl BR | ||||||||
2.002%, 01/09/2023 (A) (B) | 805 | 805 | ||||||
|
| |||||||
Total Collateralized Debt Obligations (Cost $8,040) ($ Thousands) | 8,014 | |||||||
|
| |||||||
MUNICIPAL BONDS — 1.4% |
| |||||||
Florida State, Board of Administration Finance, Ser A, RB | ||||||||
1.298%, 07/01/2016 | 570 | 574 | ||||||
New Jersey State, Economic Development Authority, Ser 00, RB | ||||||||
1.059%, 03/01/2016 | 455 | 454 | ||||||
New Jersey State, Economic Development Authority, Ser Q, RB | ||||||||
1.096%, 06/15/2016 | 1,000 | 997 | ||||||
New Jersey State, Turnpike Authority, Ser B, RB, AMBAC | ||||||||
4.252%, 01/01/2016 | 65 | 67 | ||||||
State of Illinois, Ser B, GO | ||||||||
1.780%, 04/01/2016 | 400 | 403 | ||||||
| Description | Face Amount ($ Thousands)/Shares | Market Value ($ Thousands) | ||||||
University of California, | ||||||||
0.679%, 07/01/2041 (A) | $ | 565 | $ | 565 | ||||
|
| |||||||
Total Municipal Bonds (Cost $3,058) ($ Thousands) | 3,060 | |||||||
|
| |||||||
U.S. GOVERNMENT AGENCY OBLIGATIONS — 0.6% |
| |||||||
FFCB | ||||||||
0.190%, 06/04/2015 | 400 | 400 | ||||||
FNMA | ||||||||
2.375%, 07/28/2015 | 1,000 | 1,007 | ||||||
|
| |||||||
Total U.S. Government Agency Obligations (Cost $1,407) ($ Thousands) |
| 1,407 | ||||||
|
| |||||||
COMMON STOCK — 0.0% |
| |||||||
JHT Holding* | 4,002 | — | ||||||
|
| |||||||
Total Common Stock |
| — | ||||||
|
| |||||||
CASH EQUIVALENT — 1.0% |
| |||||||
SEI Daily Income Trust, Prime Obligation Fund, Cl A | 2,294,648 | 2,295 | ||||||
|
| |||||||
Total Cash Equivalent (Cost $2,295) ($ Thousands) | 2,295 | |||||||
|
| |||||||
REPURCHASE AGREEMENT (H) — 0.5% |
| |||||||
Goldman Sachs | 1,100 | 1,100 | ||||||
|
| |||||||
Total Repurchase Agreement | 1,100 | |||||||
|
| |||||||
Total Investments — 102.9% | $ | 234,870 | ||||||
|
| |||||||
The open futures contracts held by the Fund at March 31, 2015, are as follows:
| Type of Contract | Number of Contracts Long (Short) | Expiration Date | Unrealized Appreciation (Depreciation) ($ Thousands) | |||||||||
U.S. 10-Year Treasury Note | (14 | ) | Jun-2015 | $ | (14 | ) | ||||||
U.S. 2-Year Treasury Note | (6 | ) | Jun-2015 | (3 | ) | |||||||
U.S. 5-Year Treasury Note | 6 | Jun-2015 | 5 | |||||||||
|
| |||||||||||
| $ | (12 | ) | ||||||||||
|
| |||||||||||
| SEI Institutional Managed Trust / Semi-Annual Report / March 31, 2015 | 45 |
SCHEDULE OF INVESTMENTS (Unaudited)
Enhanced Income Fund (Concluded)
March 31, 2015
For the period ended March 31, 2015, the total amount of all open futures contracts, as presented in the table above, are representative of the volume of activity for the derivative type during the period.
Percentages are based on a Net Assets of $228,345 ($ Thousands).
| * | Non-income producing security. |
| ** | The rate reported is the 7-day effective yield as of March 31, 2015. |
| ‡ | Real Estate Investment Trust. |
| † | Investment in Affiliated Security (see Note 6). |
| (A) | Variable Rate Security — The rate reported on the Schedule of Investments is the rate in effect as of March 31, 2015. |
| (B) | Securities sold within terms of a private placement memorandum, exempt from registration under Section 144A of the Securities Act of 1933, as amended, and may be sold only to dealers in that program or other “accredited investors.” These securities have been determined to be liquid under guidelines established by the Board of Trustees. |
| (C) | Unsettled bank loan. Interest rate may not be available. |
| (D) | Securities considered illiquid. The total market value of such securities as of March 31, 2015 was $18 ($ Thousands) and represented 0.0% of Net Assets. |
| (E) | Security fair valued using methods determined in good faith by the Valuation Committee of the Board of Trustees. The total market value of such securities as of March 31, 2015 was $18 ($ Thousands) and represented 0.0% of Net Assets. |
| (F) | Securities considered restricted. The total value of such securities as of March 31, 2015 was $18 and represented 18% of Net Assets. |
| (G) | Security in default on interest payments. |
| (H) | Tri-party repurchase agreement. |
AMBAC — American Municipal Bond Assurance Corporation
Cl — Class
CLO — Collateralized Loan Obligation
FFCB — Federal Farm Credit Bank
FHLMC — Federal Home Loan Mortgage Corporation
FNMA — Federal National Mortgage Association
GO — General Obligation
Ltd. — Limited
LLC — Limited Liability Company
L.P. — Limited Partnership
MTN — Medium Term Note
NCUA — National Credit Union Administration
PLC — Public Limited Company
Re-REMIC — Resecuritization of Real Estate Mortgage Investment Conduit
RB — Revenue Bond
Ser — Series
TBA — To Be Announced
The following is a list of the level of inputs used as of March 31, 2015, in valuing the Fund’s investments and other financial instruments carried at value ($ Thousands):
| Investments in Securities | Level 1 | Level 2 | Level 3 | Total | ||||||||||||
Corporate Obligations | $ | — | $ | 88,097 | $ | — | $ | 88,097 | ||||||||
Loan Participations | — | 62,394 | 18 | 62,412 | ||||||||||||
Asset-Backed Securities | — | 40,123 | — | 40,123 | ||||||||||||
Mortgage-Backed Securities | — | 28,362 | — | 28,362 | ||||||||||||
Collateralized Debt Obligations | — | 8,014 | — | 8,014 | ||||||||||||
U.S. Government Agency Obligations | — | 1,407 | — | 1,407 | ||||||||||||
Common Stock | — | — | — | — | ||||||||||||
Municipal Bonds | — | 3,060 | — | 3,060 | ||||||||||||
Cash Equivalent | 2,295 | — | — | 2,295 | ||||||||||||
Repurchase Agreement | — | 1,100 | — | 1,100 | ||||||||||||
|
|
|
|
|
|
|
| |||||||||
Total Investments in Securities | $ | 2,295 | $ | 232,557 | $ | 18 | $ | 234,870 | ||||||||
|
|
|
|
|
|
|
| |||||||||
| Other Financial Instruments | Level 1 | Level 2 | Level 3 | Total | ||||||||||||
Futures Contracts* | ||||||||||||||||
Unrealized Appreciation | $ | 5 | $ | — | $ | — | $ | 5 | ||||||||
Unrealized Depreciation | (17 | ) | — | — | (17 | ) | ||||||||||
|
|
|
|
|
|
|
| |||||||||
Total Other Financial Instruments | $ | (12 | ) | $ | — | $ | — | $ | (12 | ) | ||||||
|
|
|
|
|
|
|
| |||||||||
| * | Futures contracts are valued at the unrealized appreciation (depreciation) on the instrument. |
For the period ended March 31, 2015, there were no transfers between Level 1 and Level 2 assets and liabilities.
For the period ended March 31, 2015, there were no transfers between Level 2 and Level 3 assets and liabilities.
For the period ended March 31, 2015, there were no level 3 investments.
For more information on valuation inputs, see Note 2 — Significant Accounting Policies in Notes to Financial Statements.
Amounts designated as “—” are $0 or have been rounded to $0.
The accompanying notes are an integral part of the financial statements.
| 46 | SEI Institutional Managed Trust / Semi-Annual Report / March 31, 2015 |
SCHEDULE OF INVESTMENTS (Unaudited)
Core Fixed Income Fund
March 31, 2015
| Description | Face Amount ($ Thousands) | Market Value ($ Thousands) | ||||||
MORTGAGE-BACKED SECURITIES — 32.6% |
| |||||||
Agency Mortgage-Backed Obligations — 25.1% |
| |||||||
FHLMC | ||||||||
7.500%, 05/01/2031 to 09/01/2032 | $ | 579 | $ | 683 | ||||
7.000%, 06/01/2015 to 03/01/2039 | 538 | 630 | ||||||
6.500%, 06/01/2017 to 09/01/2039 | 650 | 706 | ||||||
6.000%, 03/01/2020 to 07/01/2037 | 2,067 | 2,266 | ||||||
5.500%, 02/01/2017 to 01/01/2039 | 7,821 | 8,683 | ||||||
5.000%, 10/01/2018 to 08/01/2039 | 10,594 | 11,726 | ||||||
4.500%, 07/01/2026 to 05/01/2044 | 4,397 | 4,888 | ||||||
4.000%, 04/01/2019 to 02/01/2045 | 11,463 | 12,373 | ||||||
3.500%, 12/01/2028 to 01/01/2045 | 22,780 | 24,080 | ||||||
1.620%, 11/21/2019 | 390 | 388 | ||||||
FHLMC ARM (A) | ||||||||
3.422%, 04/01/2044 | 1 | 1 | ||||||
2.896%, 08/01/2044 | 383 | 397 | ||||||
2.833%, 01/01/2045 | — | — | ||||||
2.699%, 02/01/2045 | 32 | 33 | ||||||
2.574%, 12/01/2042 | 215 | 221 | ||||||
FHLMC CMO, | ||||||||
9.300%, 04/15/2019 | 15 | 16 | ||||||
FHLMC CMO, | ||||||||
6.500%, 12/15/2023 | 669 | 743 | ||||||
FHLMC CMO, | ||||||||
7.500%, 01/15/2031 | 117 | 136 | ||||||
| Description | Face Amount ($ Thousands) | Market Value ($ Thousands) | ||||||
FHLMC CMO, | ||||||||
6.500%, 01/15/2032 | $ | 883 | $ | 996 | ||||
FHLMC CMO, | ||||||||
5.621%, 07/25/2033 (A) | 14 | 16 | ||||||
FHLMC CMO, | ||||||||
7.000%, 07/25/2043 | 185 | 216 | ||||||
FHLMC CMO, | ||||||||
7.500%, 07/25/2043 | 145 | 175 | ||||||
FHLMC CMO, | ||||||||
7.500%, 10/25/2043 | 204 | 250 | ||||||
FHLMC CMO, | ||||||||
7.500%, 03/25/2044 | 207 | 251 | ||||||
FHLMC CMO, | ||||||||
11.980%, 03/15/2020 (A) | 489 | 553 | ||||||
FHLMC CMO, | ||||||||
6.000%, 05/15/2035 | 568 | 627 | ||||||
FHLMC CMO, | ||||||||
6.000%, 05/15/2036 | 1,690 | 1,925 | ||||||
FHLMC CMO, | ||||||||
5.500%, 03/15/2037 | 509 | 550 | ||||||
FHLMC CMO, | ||||||||
5.856%, 05/15/2038 (A) | 155 | 18 | ||||||
FHLMC CMO, | ||||||||
6.056%, 01/15/2040 (A) | 135 | 25 | ||||||
FHLMC CMO, | ||||||||
4.000%, 11/15/2037 | 345 | 365 | ||||||
FHLMC CMO, | ||||||||
5.000%, 08/15/2038 | 493 | 534 | ||||||
FHLMC CMO, | ||||||||
5.776%, 10/15/2041 (A) | 1,015 | 180 | ||||||
FHLMC CMO, | ||||||||
3.000%, 08/15/2042 | 1,564 | 1,598 | ||||||
FHLMC CMO, | ||||||||
6.426%, 11/15/2041 (A) | 828 | 164 | ||||||
FHLMC CMO, | ||||||||
5.876%, 08/15/2039 (A) | 1,646 | 196 | ||||||
| SEI Institutional Managed Trust / Semi-Annual Report / March 31, 2015 | 47 |
SCHEDULE OF INVESTMENTS (Unaudited)
Core Fixed Income Fund (Continued)
March 31, 2015
| Description | Face Amount ($ Thousands) | Market Value ($ Thousands) | ||||||
FHLMC CMO, | ||||||||
5.876%, 07/15/2042 (A) | $ | 81 | $ | 16 | ||||
FHLMC CMO, | ||||||||
3.000%, 09/15/2031 | 1,603 | 196 | ||||||
FHLMC CMO, | ||||||||
5.876%, 08/15/2042 (A) | 159 | 30 | ||||||
FHLMC CMO, | ||||||||
5.976%, 11/15/2042 (A) | 160 | 36 | ||||||
FHLMC CMO, | ||||||||
5.976%, 11/15/2042 (A) | 172 | 40 | ||||||
FHLMC CMO, | ||||||||
5.976%, 11/15/2042 (A) | 247 | 53 | ||||||
FHLMC CMO, | ||||||||
3.000%, 01/15/2043 | 1,888 | 1,924 | ||||||
FHLMC CMO, | ||||||||
6.026%, 05/15/2039 (A) | 507 | 89 | ||||||
FHLMC CMO, | ||||||||
6.076%, 09/15/2042 (A) | 490 | 81 | ||||||
FHLMC CMO, | ||||||||
3.500%, 10/15/2037 | 1,048 | 1,102 | ||||||
FHLMC CMO, | ||||||||
3.000%, 07/15/2043 | 3,803 | 3,860 | ||||||
FHLMC CMO, | ||||||||
4.000%, 09/15/2040 | 1,036 | 1,087 | ||||||
FHLMC CMO, | ||||||||
4.000%, 04/15/2041 | 1,544 | 1,640 | ||||||
FHLMC Multifamily Structured Pass-Through Certificates, | ||||||||
0.521%, 09/25/2021 (A) | 4,238 | 4,238 | ||||||
FHLMC Multifamily Structured Pass-Through Certificates, | ||||||||
1.358%, 04/25/2020 (A) | 1,064 | — | ||||||
FHLMC Multifamily Structured Pass-Through Certificates, | ||||||||
1.652%, 06/25/2020 (A) | 2,941 | 190 | ||||||
FHLMC Multifamily Structured Pass-Through Certificates, | ||||||||
1.651%, 07/25/2021 (A) | 1,421 | 122 | ||||||
| Description | Face Amount ($ Thousands) | Market Value ($ Thousands) | ||||||
FHLMC Multifamily Structured Pass-Through Certificates, | ||||||||
1.563%, 10/25/2021 (A) | $ | 294 | $ | 25 | ||||
FHLMC Multifamily Structured Pass-Through Certificates, | ||||||||
4.285%, 01/25/2020 | 915 | 1,018 | ||||||
FHLMC Structured Agency Credit Risk Debt Notes, | ||||||||
1.824%, 08/25/2024 (A) (B) | 413 | 416 | ||||||
FHLMC TBA | ||||||||
3.500%, 05/01/2041 | 600 | 627 | ||||||
FNMA | ||||||||
7.000%, 09/01/2026 to 02/01/2039 | 1,812 | 2,143 | ||||||
6.500%, 05/01/2017 to 05/01/2040 | 542 | 590 | ||||||
6.000%, 10/01/2019 to 07/01/2037 | 5,812 | 6,656 | ||||||
5.500%, 09/01/2016 to 08/01/2041 | 3,690 | 4,163 | ||||||
5.000%, 01/01/2020 to 05/01/2042 | 15,531 | 17,534 | ||||||
4.500%, 04/01/2025 to 12/31/2049 | 34,876 | 38,397 | ||||||
4.000%, 08/01/2020 to 04/01/2045 | 59,853 | 65,046 | ||||||
3.840%, 08/01/2021 | 3,026 | 3,331 | ||||||
3.762%, 12/01/2020 | 2,981 | 3,253 | ||||||
3.665%, 10/01/2020 | 1,802 | 1,965 | ||||||
3.614%, 12/01/2020 | 1,951 | 2,122 | ||||||
3.500%, 12/01/2029 to 02/01/2045 | 19,713 | 20,901 | ||||||
3.000%, 08/01/2033 to 09/01/2042 | 7,565 | 7,821 | ||||||
2.830%, 06/01/2022 | 1,200 | 1,250 | ||||||
2.500%, 10/01/2042 | 941 | 932 | ||||||
FNMA - ACES, | ||||||||
0.533%, 09/25/2022 (A) | 18,569 | 556 | ||||||
FNMA - ACES, | ||||||||
0.451%, 10/25/2021 (A) | 2,964 | 2,969 | ||||||
FNMA ARM (A) | ||||||||
3.225%, 04/01/2044 | 2,299 | 2,412 | ||||||
2.726%, 01/01/2045 | 683 | 706 | ||||||
2.581%, 03/01/2045 | 192 | 198 | ||||||
2.142%, 10/01/2035 | 2,492 | 2,624 | ||||||
2.139%, 11/01/2035 | 309 | 325 | ||||||
2.133%, 11/01/2035 | 384 | 404 | ||||||
2.110%, 11/01/2035 | 303 | 319 | ||||||
2.107%, 11/01/2035 | 373 | 390 | ||||||
| 48 | SEI Institutional Managed Trust / Semi-Annual Report / March 31, 2015 |
| Description | Face Amount ($ Thousands) | Market Value ($ Thousands) | ||||||
2.102%, 11/01/2035 | $ | 1,394 | $ | 1,467 | ||||
2.099%, 11/01/2035 | 319 | 335 | ||||||
2.065%, 10/01/2035 | 1,681 | 1,768 | ||||||
2.030%, 10/01/2035 | 207 | 217 | ||||||
FNMA CMO STRIPS, | ||||||||
3.000%, 04/25/2027 | 1,222 | 135 | ||||||
FNMA CMO STRIPS, | ||||||||
3.500%, 11/25/2041 | 800 | 139 | ||||||
FNMA CMO STRIPS, | ||||||||
4.500%, 11/25/2039 | 1,105 | 208 | ||||||
FNMA CMO, Ser 1999-11, Cl Z | ||||||||
5.500%, 03/25/2029 | 391 | 437 | ||||||
FNMA CMO, Ser 2002-33, Cl A2 | ||||||||
7.500%, 06/25/2032 | 151 | 179 | ||||||
FNMA CMO, Ser 2002-95, Cl DB | ||||||||
6.000%, 01/25/2033 | 551 | 638 | ||||||
FNMA CMO, | ||||||||
5.500%, 11/25/2035 | 1,203 | 1,308 | ||||||
FNMA CMO, | ||||||||
5.000%, 08/01/2035 | 2,861 | 374 | ||||||
FNMA CMO, Ser 2005-5, Cl PA | ||||||||
5.000%, 01/25/2035 | 164 | 180 | ||||||
FNMA CMO, Ser 2006-112, Cl ST, IO | ||||||||
6.529%, 11/25/2036 (A) | 2,247 | 375 | ||||||
FNMA CMO, Ser 2006-56, Cl CA | ||||||||
6.000%, 07/25/2036 | 118 | 138 | ||||||
FNMA CMO, Ser 2008-22, Cl SI, IO | ||||||||
6.256%, 03/25/2037 (A) | 3,972 | 259 | ||||||
FNMA CMO, Ser 2009-20, Cl DT | ||||||||
4.500%, 04/25/2039 | 506 | 561 | ||||||
FNMA CMO, Ser 2009-86, Cl BO, PO | ||||||||
0.000%, 03/25/2037 (C) | 3,031 | 2,958 | ||||||
FNMA CMO, Ser 2010-142, Cl SM, IO | ||||||||
6.356%, 12/25/2040 (A) | 205 | 33 | ||||||
FNMA CMO, Ser 2010-150, Cl SK, IO | ||||||||
6.291%, 01/25/2041 (A) | 762 | 141 | ||||||
FNMA CMO, Ser 2011-117, Cl LS, IO | ||||||||
6.393%, 10/25/2040 (A) | 1,679 | 334 | ||||||
FNMA CMO, Ser 2011-53, Cl TN | ||||||||
4.000%, 06/25/2041 | 1,434 | 1,547 | ||||||
FNMA CMO, Ser 2011-59, Cl NZ | ||||||||
5.500%, 07/25/2041 | 2,060 | 2,468 | ||||||
| Description | Face Amount ($ Thousands) | Market Value ($ Thousands) | ||||||
FNMA CMO, | ||||||||
6.469%, 07/25/2041 (A) | $ | 1,463 | $ | 288 | ||||
FNMA CMO, | ||||||||
5.000%, 05/25/2034 | 1,276 | 159 | ||||||
FNMA CMO, Ser 2011-96, Cl SA, IO | ||||||||
6.376%, 10/25/2041 (A) | 2,418 | 432 | ||||||
FNMA CMO, Ser 2012-112, Cl DA | ||||||||
3.000%, 10/25/2042 | 2,402 | 2,451 | ||||||
FNMA CMO, Ser 2012-128, Cl SL, IO | ||||||||
5.976%, 11/25/2042 (A) | 347 | 83 | ||||||
FNMA CMO, Ser 2012-128, Cl SQ, IO | ||||||||
5.976%, 11/25/2042 (A) | 522 | 128 | ||||||
FNMA CMO, Ser 2012-133, Cl CS, IO | ||||||||
5.976%, 12/25/2042 (A) | 332 | 68 | ||||||
FNMA CMO, Ser 2012-133, Cl SA, IO | ||||||||
5.976%, 12/25/2042 (A) | 172 | 43 | ||||||
FNMA CMO, Ser 2012-134, Cl LC | ||||||||
3.000%, 12/25/2042 | 448 | 460 | ||||||
FNMA CMO, Ser 2012-28, Cl B | ||||||||
6.500%, 06/25/2039 | 184 | 207 | ||||||
FNMA CMO, Ser 2012-411, Cl A3 | ||||||||
3.000%, 08/25/2042 | 413 | 423 | ||||||
FNMA CMO, Ser 2012-46, Cl BA | ||||||||
6.000%, 05/25/2042 | 775 | 884 | ||||||
FNMA CMO, Ser 2012-70, Cl YS, IO | ||||||||
6.476%, 02/25/2041 (A) | 220 | 43 | ||||||
FNMA CMO, Ser 2012-74, Cl OA, PO | ||||||||
0.000%, 03/25/2042 (C) | 61 | 56 | ||||||
FNMA CMO, Ser 2012-74, Cl SA, IO | ||||||||
6.476%, 03/25/2042 (A) | 790 | 146 | ||||||
FNMA CMO, Ser 2012-75, Cl AO, PO | ||||||||
0.000%, 03/25/2042 (C) | 121 | 113 | ||||||
FNMA CMO, Ser 2012-93, Cl SG, IO | ||||||||
5.926%, 09/25/2042 (A) | 405 | 82 | ||||||
FNMA CMO, Ser 2012-M12, Cl 1A | ||||||||
2.840%, 08/25/2022 (A) | 3,246 | 3,393 | ||||||
FNMA CMO, Ser 2013-10, Cl JS, IO | ||||||||
5.979%, 02/25/2043 (A) | 1,172 | 271 | ||||||
| SEI Institutional Managed Trust / Semi-Annual Report / March 31, 2015 | 49 |
SCHEDULE OF INVESTMENTS (Unaudited)
Core Fixed Income Fund (Continued)
March 31, 2015
| Description | Face Amount ($ Thousands) | Market Value ($ Thousands) | ||||||
FNMA CMO, Ser 2013-10, Cl SJ, IO | ||||||||
5.979%, 02/25/2043 (A) | $ | 1,298 | $ | 302 | ||||
FNMA CMO, Ser 2013-133, Cl AB | ||||||||
4.000%, 06/25/2039 | 631 | 680 | ||||||
FNMA CMO, Ser 2013-35, Cl CL | ||||||||
3.000%, 02/25/2043 | 6,875 | 6,979 | ||||||
FNMA CMO, Ser 2013-67, Cl KS, IO | ||||||||
5.926%, 07/25/2043 (A) | 444 | 108 | ||||||
FNMA CMO, Ser 2013-9, Cl BC | ||||||||
6.500%, 07/25/2042 | 837 | 961 | ||||||
FNMA CMO, Ser 2013-9, Cl CB | ||||||||
5.500%, 04/25/2042 | 5,848 | 6,616 | ||||||
FNMA CMO, Ser 2013-9, Cl SA, IO | ||||||||
5.979%, 03/25/2042 (A) | 972 | 168 | ||||||
FNMA CMO, Ser 2013-94, Cl HA | ||||||||
4.000%, 01/25/2040 | 281 | 304 | ||||||
FNMA CMO, Ser 2014-9, Cl A | ||||||||
4.000%, 05/25/2037 | 536 | 581 | ||||||
FNMA CMO, Ser 2014-M2, Cl A2 | ||||||||
3.513%, 12/25/2023 (A) | 1,770 | 1,916 | ||||||
FNMA CMO, | ||||||||
3.346%, 03/25/2024 (A) | 2,795 | 2,989 | ||||||
FNMA CMO, | ||||||||
3.058%, 12/25/2024 (A) | 2,667 | 2,789 | ||||||
FNMA CMO, | ||||||||
2.966%, 12/31/2049 (A) | 3,335 | 3,437 | ||||||
FNMA TBA | ||||||||
5.000%, 05/01/2038 | 1,100 | 1,222 | ||||||
4.500%, 05/01/2038 | 15,750 | 17,139 | ||||||
4.000%, 04/01/2039 to 05/15/2045 | 27,990 | 29,898 | ||||||
3.500%, 05/15/2026 to 05/25/2045 | 41,350 | 43,407 | ||||||
3.000%, 05/25/2026 to 05/25/2045 | 28,050 | 28,962 | ||||||
2.500%, 05/01/2017 to 04/25/2030 | 6,690 | 6,868 | ||||||
FNMA Whole Loan CMO, | ||||||||
5.750%, 08/25/2033 | 251 | 274 | ||||||
FREMF Mortgage Trust, | ||||||||
0.200%, 05/25/2045 | 12,801 | 146 | ||||||
GNMA | ||||||||
8.000%, 11/15/2029 to 09/15/2030 | 63 | 71 | ||||||
7.500%, 03/15/2029 | 89 | 110 | ||||||
| Description | Face Amount ($ Thousands) | Market Value ($ Thousands) | ||||||
6.500%, 04/15/2026 to 09/15/2035 | $ | 2,967 | $ | 3,460 | ||||
6.000%, 10/15/2023 to 10/20/2040 | 5,549 | 6,422 | ||||||
5.000%, 07/20/2040 to 11/20/2040 | 1,487 | 1,668 | ||||||
4.500%, 04/20/2041 | 2,150 | 2,346 | ||||||
GNMA CMO, | ||||||||
6.074%, 04/20/2037 (A) | 1,007 | 189 | ||||||
GNMA CMO, | ||||||||
6.324%, 03/20/2039 (A) | 239 | 30 | ||||||
GNMA CMO, | ||||||||
6.216%, 01/16/2040 (A) | 8,233 | 1,193 | ||||||
GNMA CMO, | ||||||||
6.376%, 04/16/2034 (A) | 34 | 1 | ||||||
GNMA CMO, | ||||||||
6.474%, 01/20/2040 (A) | 198 | 33 | ||||||
GNMA CMO, | ||||||||
0.551%, 12/20/2060 (A) | 1,709 | 1,704 | ||||||
GNMA CMO, | ||||||||
0.571%, 12/20/2060 (A) | 1,015 | 1,013 | ||||||
GNMA CMO, | ||||||||
0.651%, 03/20/2061 (A) | 1,062 | 1,064 | ||||||
GNMA CMO, | ||||||||
0.671%, 03/20/2061 (A) | 718 | 720 | ||||||
GNMA CMO, | ||||||||
0.754%, 01/16/2054 (A) | 9,575 | 609 | ||||||
GNMA CMO, | ||||||||
3.500%, 02/20/2038 | 1,197 | 137 | ||||||
GNMA CMO, | ||||||||
2.002%, 04/16/2050 | 637 | 628 | ||||||
GNMA CMO, | ||||||||
5.893%, 08/16/2042 (A) | 618 | 104 | ||||||
GNMA CMO, | ||||||||
6.524%, 06/20/2043 (A) | 1,163 | 207 | ||||||
GNMA CMO, | ||||||||
1.039%, 09/16/2046 (A) | 8,502 | 557 | ||||||
| 50 | SEI Institutional Managed Trust / Semi-Annual Report / March 31, 2015 |
| Description | Face Amount ($ Thousands) | Market Value ($ Thousands) | ||||||
GNMA CMO, | ||||||||
2.250%, 03/16/2035 | $ | 158 | $ | 160 | ||||
GNMA CMO, | ||||||||
0.931%, 06/16/2055 (A) | 1,886 | 113 | ||||||
GNMA CMO, | ||||||||
2.700%, 11/16/2054 | 630 | 643 | ||||||
GNMA TBA | ||||||||
4.000%, 04/01/2040 to 05/01/2042 | 7,000 | 7,508 | ||||||
3.500%, 05/15/2041 to 04/15/2045 | 28,420 | 29,867 | ||||||
3.000%, 04/15/2043 to 04/20/2045 | 6,055 | 6,235 | ||||||
NCUA Guaranteed Notes, | ||||||||
2.650%, 10/29/2020 | 756 | 771 | ||||||
NCUA Guaranteed Notes, | ||||||||
0.541%, 11/06/2017 (A) | 1,433 | 1,436 | ||||||
|
| |||||||
| 531,080 | ||||||||
|
| |||||||
Non-Agency Mortgage-Backed Obligations — 7.4% |
| |||||||
Adjustable Rate Mortgage Trust, | ||||||||
2.343%, 02/25/2035 (A) (B) | 2,148 | 2,071 | ||||||
Adjustable Rate Mortgage Trust, | ||||||||
0.311%, 03/25/2037 (A) (B) | 3,009 | 2,228 | ||||||
Alternative Loan Trust, | ||||||||
2.516%, 08/25/2035 (A) (B) | 2,944 | 2,478 | ||||||
Alternative Loan Trust, | ||||||||
27.916%, 07/25/2036 (A) (B) | 500 | 840 | ||||||
Alternative Loan Trust, | ||||||||
0.361%, 09/25/2046 (A) (B) | 661 | 539 | ||||||
Alternative Loan Trust, | ||||||||
0.571%, 09/25/2037 (A) (B) | 3,596 | 2,339 | ||||||
American Home Mortgage Assets Trust, Ser 2006-6, Cl A1A | ||||||||
0.361%, 12/25/2046 (A) (B) | 2,113 | 1,482 | ||||||
American Home Mortgage Investment Trust, | ||||||||
2.358%, 06/25/2045 (A) (B) | 2,408 | 2,345 | ||||||
American Home Mortgage Investment Trust, | ||||||||
2.108%, 11/25/2045 (A) (B) | 2,209 | 1,766 | ||||||
| Description | Face Amount ($ Thousands) | Market Value ($ Thousands) | ||||||
Banc of America Commercial Mortgage Trust, | ||||||||
5.448%, 09/10/2047 | $ | 100 | $ | 105 | ||||
Banc of America Commercial Mortgage Trust, | ||||||||
5.577%, 06/10/2049 (A) | 968 | 970 | ||||||
Banc of America Funding Trust, | ||||||||
6.000%, 05/20/2033 (B) | 8 | 8 | ||||||
Banc of America Funding Trust, | ||||||||
0.346%, 07/20/2036 (A) (B) | 65 | 65 | ||||||
Banc of America Merrill Lynch Commercial Mortgage, | ||||||||
4.933%, 07/10/2045 | 105 | 105 | ||||||
BCAP 2015-RR2 Trust, | ||||||||
0.571%, 03/28/2037 (A) (B) | 1,710 | 1,569 | ||||||
Bear Stearns Adjustable Rate Mortgage Trust, | ||||||||
2.277%, 05/25/2034 (A) (B) | 217 | 211 | ||||||
Bear Stearns ALT-A Trust, | ||||||||
0.871%, 01/25/2035 (A) (B) | 1,034 | 1,005 | ||||||
Bear Stearns Asset-Backed Securities I Trust, | ||||||||
5.500%, 09/25/2035 (A) (B) | 2,306 | 2,330 | ||||||
Bear Stearns Asset-Backed Securities I Trust, | ||||||||
7.479%, 11/25/2035 (A) (B) | 6,358 | 1,986 | ||||||
Bear Stearns Commercial Mortgage Securities Trust, | ||||||||
5.896%, 06/11/2050 (A) | 200 | 207 | ||||||
CD Commercial Mortgage Trust, Ser 2006-CD2, Cl AJ | ||||||||
5.384%, 01/15/2046 (A) | 590 | 557 | ||||||
CD Commercial Mortgage Trust, Ser 2007-CD3, Cl AJ | ||||||||
5.688%, 10/15/2048 | 170 | 169 | ||||||
CD Commercial Mortgage Trust, Ser 2007-CD4, Cl AJ | ||||||||
5.398%, 12/11/2049 (A) | 310 | 262 | ||||||
CFCRE Commercial Mortgage Trust, Ser 2011-C1, Cl A4 | ||||||||
4.961%, 04/15/2044 (A) (B) | 729 | 821 | ||||||
CGBRAM Commerical Mortgage Trust, Ser 2014-HD, Cl E | ||||||||
3.175%, 02/15/2031 (A) (B) | 640 | 635 | ||||||
| SEI Institutional Managed Trust / Semi-Annual Report / March 31, 2015 | 51 |
SCHEDULE OF INVESTMENTS (Unaudited)
Core Fixed Income Fund (Continued)
March 31, 2015
| Description | Face Amount ($ Thousands) | Market Value ($ Thousands) | ||||||
CG-CCRE Commercial Mortgage Trust, Ser 2014-FL1, Cl A | ||||||||
1.125%, 06/15/2031 (A) (B) | $ | 630 | $ | 629 | ||||
Citigroup Commercial Mortgage Trust, Ser 2006-C5, Cl AJ | ||||||||
5.482%, 10/15/2049 | 270 | 268 | ||||||
Citigroup Commercial Mortgage Trust, Ser 20098-C7, Cl AJA | ||||||||
6.150%, 12/10/2049 (A) | 140 | 139 | ||||||
Citigroup Commercial Mortgage Trust, Ser 2013-GC17, Cl A4 | ||||||||
4.131%, 11/10/2046 | 175 | 194 | ||||||
Citigroup Commercial Mortgage Trust, Ser 2014-GC19, Cl AAB | ||||||||
3.552%, 03/10/2047 | 354 | 377 | ||||||
Citigroup Commercial Mortgage Trust, Ser 2014-GC19, Cl E | ||||||||
4.400%, 03/10/2047 (A) (B) | 780 | 642 | ||||||
Citigroup Commercial Mortgage Trust, Ser 2015-GC27, Cl A5 | ||||||||
3.137%, 02/10/2048 | 272 | 279 | ||||||
COBALT Commercial Mortgage Trust, Ser 2007-C2, Cl AMFX | ||||||||
5.526%, 04/15/2047 (A) | 130 | 139 | ||||||
COMM Mortgage Trust, | ||||||||
4.205%, 07/10/2046 (B) | 614 | 675 | ||||||
COMM Mortgage Trust, | ||||||||
0.692%, 07/10/2046 (A) (B) | 13,060 | 510 | ||||||
COMM Mortgage Trust, | ||||||||
1.801%, 10/15/2045 | 171 | 172 | ||||||
COMM Mortgage Trust, | ||||||||
4.259%, 07/10/2045 (A) (B) | 780 | 640 | ||||||
COMM Mortgage Trust, | ||||||||
4.046%, 10/10/2046 | 57 | 63 | ||||||
COMM Mortgage Trust, | ||||||||
4.300%, 10/10/2046 | 210 | 232 | ||||||
COMM Mortgage Trust, | ||||||||
4.762%, 10/10/2046 (A) | 90 | 100 | ||||||
COMM Mortgage Trust, | ||||||||
5.085%, 10/10/2046 (A) | 40 | 44 | ||||||
COMM Mortgage Trust, | ||||||||
3.282%, 01/10/2046 | 269 | 278 | ||||||
COMM Mortgage Trust, | ||||||||
3.452%, 07/15/2047 | 310 | 329 | ||||||
| Description | Face Amount ($ Thousands) | Market Value ($ Thousands) | ||||||
COMM Mortgage Trust, | ||||||||
3.796%, 08/10/2047 | $ | 539 | $ | 582 | ||||
COMM Mortgage Trust, | ||||||||
3.305%, 11/10/2047 | 235 | 247 | ||||||
COMM Mortgage Trust, | ||||||||
3.275%, 06/15/2034 (A) (B) | 870 | 871 | ||||||
COMM Mortgage Trust, Ser 2014-UBS3, Cl A4 | ||||||||
3.819%, 06/12/2047 | 354 | 383 | ||||||
COMM Mortgage Trust, | ||||||||
3.694%, 08/10/2047 | 1,406 | 1,501 | ||||||
COMM Mortgage Trust, | ||||||||
3.838%, 09/10/2047 | 283 | 306 | ||||||
COMM Mortgage Trust, | ||||||||
3.548%, 09/10/2047 | 191 | 203 | ||||||
COMM Mortgage Trust, | ||||||||
4.048%, 12/10/2047 (A) | 669 | 716 | ||||||
COMM Mortgage Trust, | ||||||||
3.387%, 08/10/2024 | 633 | 668 | ||||||
COMM Mortgage Trust, | ||||||||
3.309%, 03/10/2048 | 257 | 267 | ||||||
Commercial Mortgage Pass-Through Certificates, | ||||||||
2.822%, 11/15/2045 | 60 | 62 | ||||||
Commercial Mortgage Pass-Through Certificates, | ||||||||
3.424%, 03/10/2031 (B) | 100 | 105 | ||||||
Commercial Mortgage Pass-Through Certificates, | ||||||||
3.528%, 04/10/2047 | 553 | 587 | ||||||
Commercial Mortgage Trust, | ||||||||
5.224%, 04/10/2037 (A) | 278 | 280 | ||||||
Commercial Mortgage Trust, | ||||||||
5.785%, 07/10/2038 (A) | 400 | 419 | ||||||
Connecticut Avenue Securities, Ser 2014-C03, Cl 1M2 | ||||||||
3.174%, 07/25/2024 (A) (B) | 4,810 | 4,526 | ||||||
Countrywide Alternative Loan Trust, Ser 2003-20CB, Cl 1A1 | ||||||||
5.500%, 10/25/2033 (B) | 581 | 593 | ||||||
| 52 | SEI Institutional Managed Trust / Semi-Annual Report / March 31, 2015 |
| Description | Face Amount ($ Thousands) | Market Value ($ Thousands) | ||||||
Countrywide Alternative Loan Trust, Ser 2004-J1, Cl 1A1 | ||||||||
6.000%, 02/25/2034 (B) | $ | 111 | $ | 113 | ||||
Countrywide Alternative Loan Trust, Ser 2005-27, Cl 3A2 | ||||||||
1.221%, 08/25/2035 (A) (B) | 242 | 169 | ||||||
Countrywide Home Loan Mortgage Pass-Through Trust, | ||||||||
0.574%, 09/25/2035 (A) (B) | 1,703 | 1,529 | ||||||
Credit Suisse Commercial Mortgage Trust, | ||||||||
5.807%, 06/15/2038 (A) | 880 | 876 | ||||||
Credit Suisse Commercial Mortgage Trust, | ||||||||
5.615%, 01/15/2049 (A) | 582 | 624 | ||||||
Credit Suisse Commercial Mortgage Trust, | ||||||||
5.704%, 06/15/2039 (A) | 540 | 507 | ||||||
Credit Suisse First Boston Mortgage Securities, | ||||||||
2.550%, 10/25/2033 (A) (B) | 1,644 | 1,622 | ||||||
Credit Suisse First Boston Mortgage Securities, | ||||||||
5.100%, 08/15/2038 (A) | 194 | 195 | ||||||
Credit Suisse Mortgage Trust, Ser 2014-USA, Cl A2 | ||||||||
3.953%, 09/15/2037 (B) | 520 | 561 | ||||||
Credit Suisse Mortgage Trust, Ser 2014-USA, Cl E | ||||||||
4.373%, 09/15/2037 (B) | 590 | 558 | ||||||
Credit Suisse Mortgage Trust, Ser 2015-3R, Cl 1A1 | ||||||||
0.371%, 07/29/2037 | 1,110 | 1,045 | ||||||
Credit Suisse Mortgage Trust, Ser 2015-Town, Cl F | ||||||||
4.675%, 03/15/2017 | 650 | 637 | ||||||
CSAIL Commercial Mortgage Trust, Ser 2015-C1, Cl A4 | ||||||||
3.505%, 04/15/2050 | 572 | 606 | ||||||
CSAIL Commercial Mortgage Trust, Ser 2015-C1, Cl AS | ||||||||
3.791%, 04/15/2050 | 262 | 277 | ||||||
CSMC Trust, Ser 2014-TIKI, Cl F | ||||||||
4.003%, 09/15/2016 (A) (B) | 1,900 | 1,895 | ||||||
DBUBS Mortgage Trust, | ||||||||
3.742%, 11/10/2046 (B) | 804 | 818 | ||||||
DBUBS Mortgage Trust, | ||||||||
3.386%, 07/10/2044 (B) | 2,021 | 2,068 | ||||||
| Description | Face Amount ($ Thousands) | Market Value ($ Thousands) | ||||||
DBUBS Mortgage Trust, | ||||||||
4.537%, 07/10/2044 (B) | $ | 671 | $ | 753 | ||||
DBUBS Mortgage Trust, | ||||||||
3.642%, 08/10/2044 | 2,690 | 2,761 | ||||||
Downey Savings & Loan Association Mortgage Loan Trust, Ser 2004-AR2, Cl A2B | ||||||||
0.974%, 11/19/2044 (A) (B) | 1,372 | 1,190 | ||||||
Equity Mortgage Trust, | ||||||||
2.525%, 05/08/2019 (A) (B) | 420 | 419 | ||||||
FHLMC Structured Agency Credit Risk Debt Notes, | ||||||||
1.424%, 01/25/2025 (A) (B) | 295 | 296 | ||||||
Fund America Investors II, | ||||||||
3.578%, 06/25/2023 (A) (B) | 31 | 32 | ||||||
GE Capital Assurance, | ||||||||
5.254%, 05/12/2035 (A) (B) | 245 | 247 | ||||||
GS Mortgage Securities Trust, Ser 2007-GG10, Cl AM | ||||||||
5.796%, 08/10/2045 (A) | 2,180 | 2,235 | ||||||
GS Mortgage Securities Trust, Ser 2011-GC3, Cl A2 | ||||||||
3.645%, 03/10/2044 (B) | 434 | 441 | ||||||
GS Mortgage Securities Trust, Ser 2011-GC5, Cl XA, IO | ||||||||
1.668%, 08/10/2044 (A) (B) | 1,171 | 65 | ||||||
GS Mortgage Securities Trust, Ser 2012-GC6, Cl A1 | ||||||||
1.282%, 01/10/2045 | 19 | 19 | ||||||
GS Mortgage Securities Trust, Ser 2012-GCJ7, Cl A1 | ||||||||
1.144%, 05/10/2045 | 149 | 149 | ||||||
GS Mortgage Securities Trust, Ser 2012-GCJ7, Cl A2 | ||||||||
2.318%, 05/10/2045 | 222 | 226 | ||||||
GS Mortgage Securities Trust, Ser 2013-GC16, Cl B | ||||||||
5.161%, 11/10/2046 (A) | 340 | 387 | ||||||
GS Mortgage Securities Trust, Ser 2014-GC18, Cl AAB | ||||||||
3.648%, 01/10/2047 | 311 | 334 | ||||||
GS Mortgage Securities Trust, Ser 2014-GC20, Cl AAB | ||||||||
3.655%, 04/10/2047 | 717 | 770 | ||||||
GS Mortgage Securities Trust, Ser 2014-GC24, Cl AAB | ||||||||
3.650%, 09/10/2047 | 1,050 | 1,128 | ||||||
| SEI Institutional Managed Trust / Semi-Annual Report / March 31, 2015 | 53 |
SCHEDULE OF INVESTMENTS (Unaudited)
Core Fixed Income Fund (Continued)
March 31, 2015
| Description | Face Amount ($ Thousands) | Market Value ($ Thousands) | ||||||
GS Mortgage Securities Trust, Ser 2014-GC26, Cl AAB | ||||||||
3.365%, 11/10/2047 | $ | 394 | $ | 416 | ||||
GS Mortgage Securities Trust, Ser 2014-GC26, Cl B | ||||||||
4.215%, 11/10/2047 | 680 | 721 | ||||||
GS Mortgage Securities Trust, Ser 2015-GC28, Cl A5 | ||||||||
3.396%, 02/10/2048 | 524 | 548 | ||||||
GS Mortgage Securities Trust, Ser 2015-GC28, Cl AS | ||||||||
3.759%, 02/10/2048 | 572 | 600 | ||||||
GSMPS Mortgage Loan Trust, Ser 1998-1, Cl A | ||||||||
8.000%, 09/19/2027 (A) (B) | 33 | 33 | ||||||
GSR Mortgage Loan Trust, | ||||||||
2.582%, 10/25/2033 (A) (B) | 474 | 479 | ||||||
GSR Mortgage Loan Trust, | ||||||||
2.586%, 07/25/2035 (A) (B) | 5,907 | 5,713 | ||||||
HarborView Mortgage Loan, | ||||||||
2.580%, 05/19/2034 (A) (B) | 2,540 | 2,530 | ||||||
Impac Secured Assets Trust, Ser 2006-2, Cl 2A1 | ||||||||
0.521%, 08/25/2036 (A) (B) | 196 | 192 | ||||||
Impac Secured Assets Trust, Ser 2006-5, Cl 2A | ||||||||
0.374%, 12/25/2036 (A) (B) | 1,687 | 1,582 | ||||||
Impact Funding LLC, | ||||||||
5.314%, 01/25/2051 (B) | 1,766 | 2,060 | ||||||
IndyMac IMSC Mortgage Loan Trust, Ser 2007-HOA1, Cl A21 | ||||||||
0.264%, 07/25/2047 (A) (B) | 27 | 18 | ||||||
IndyMac IMSC Mortgage Loan Trust, Ser 2007-HOA1, Cl A22 | ||||||||
0.354%, 07/25/2047 (A) (B) | 2,109 | 1,385 | ||||||
JPMBB Commercial Mortgage Securities Trust, | ||||||||
5.081%, 11/15/2045 (A) | 190 | 211 | ||||||
JPMBB Commercial Mortgage Securities Trust, | ||||||||
4.888%, 01/15/2047 (A) | 100 | 113 | ||||||
JPMBB Commercial Mortgage Securities Trust, | ||||||||
3.914%, 11/15/2047 (A) | 610 | 651 | ||||||
JPMBB Commercial Mortgage Securities Trust, | ||||||||
3.407%, 11/15/2047 | 35 | 37 | ||||||
| Description | Face Amount ($ Thousands) | Market Value ($ Thousands) | ||||||
JPMorgan Alternative Loan Trust, Ser 2007-S1, Cl A1 | ||||||||
0.454%, 04/25/2047 (A) (B) | $ | 2,504 | $ | 2,256 | ||||
JPMorgan Chase Commercial Mortgage Securities Trust, Ser 2004-LN2, Cl A2 | ||||||||
5.115%, 07/15/2041 | 25 | 25 | ||||||
JPMorgan Chase Commercial Mortgage Securities Trust, Ser 2006-CB14, Cl A4 | ||||||||
5.481%, 12/12/2044 (A) | 190 | 194 | ||||||
JPMorgan Chase Commercial Mortgage Securities Trust, Ser 2007-CB18, Cl AJ | ||||||||
5.502%, 06/12/2047 (A) | 1,505 | 1,510 | ||||||
JPMorgan Chase Commercial Mortgage Securities Trust, Ser 2007-CB20, Cl AM | ||||||||
5.868%, 02/12/2051 (A) | 250 | 274 | ||||||
JPMorgan Chase Commercial Mortgage Securities Trust, Ser 2010-C2, Cl A3 | ||||||||
4.070%, 11/15/2043 (B) | 1,393 | 1,520 | ||||||
JPMorgan Chase Commercial Mortgage Securities Trust, Ser 2010-CNTR, Cl A1 | ||||||||
3.300%, 08/05/2032 (B) | 245 | 254 | ||||||
JPMorgan Chase Commercial Mortgage Securities Trust, Ser 2011-C3, Cl A2 | ||||||||
3.673%, 02/15/2046 (B) | 649 | 666 | ||||||
JPMorgan Chase Commercial Mortgage Securities Trust, Ser 2011-C3, Cl A3 | ||||||||
4.388%, 02/15/2046 (B) | 3,025 | 3,263 | ||||||
JPMorgan Chase Commercial Mortgage Securities Trust, Ser 2012-LC9, Cl A2 | ||||||||
1.677%, 12/15/2047 | 218 | 220 | ||||||
JPMorgan Chase Commercial Mortgage Securities Trust, Ser 2013-C10, Cl ASB | ||||||||
2.702%, 12/15/2047 | 445 | 456 | ||||||
JPMorgan Chase Commercial Mortgage Securities Trust, Ser 2014-C20, Cl C | ||||||||
4.572%, 07/15/2047 (A) | 610 | 649 | ||||||
JPMorgan Mortgage Trust, | ||||||||
2.773%, 03/25/2045 (A) (B) | 540 | 546 | ||||||
LB Commercial Conduit Mortgage Trust, Ser 2007-C3, Cl AM | ||||||||
5.906%, 07/15/2044 (A) | 280 | 305 | ||||||
| 54 | SEI Institutional Managed Trust / Semi-Annual Report / March 31, 2015 |
| Description | Face Amount ($ Thousands) | Market Value ($ Thousands) | ||||||
LB-UBS Commercial Mortgage Trust, Ser 2007-C6, Cl AJ | ||||||||
6.121%, 07/15/2040 (A) | $ | 170 | $ | 177 | ||||
LB-UBS Commercial Mortgage Trust, Ser 2007-C7, Cl AM | ||||||||
6.169%, 09/15/2045 (A) | 160 | 177 | ||||||
Lehman XS Trust, | ||||||||
0.471%, 11/25/2035 (A) (B) | 970 | 867 | ||||||
MASTR Reperforming Loan Trust, Ser 2005-1, Cl 1A1 | ||||||||
6.000%, 08/25/2034 (B) | 2,049 | 2,030 | ||||||
Merrill Lynch Mortgage Investors Trust, Ser 2004-A1, Cl 4A | ||||||||
2.602%, 02/25/2034 (A) (B) | 628 | 633 | ||||||
Merrill Lynch Mortgage Investors Trust, Ser 2004-B, Cl A3 | ||||||||
2.016%, 05/25/2029 (A) (B) | 421 | 422 | ||||||
Merrill Lynch Mortgage Trust, Ser 2005-CIP1, Cl A4 | ||||||||
5.047%, 07/12/2038 (A) | 104 | 104 | ||||||
Merrill Lynch Mortgage Trust, Ser 2006-C2, Cl AJ | ||||||||
5.802%, 08/12/2043 (A) | 560 | 568 | ||||||
ML-CFC Commercial Mortgage Trust, Ser 2007-5, Cl AJ | ||||||||
5.450%, 08/12/2048 (A) | 670 | 660 | ||||||
ML-CFC Commercial Mortgage Trust, Ser 2007-9, Cl AJ | ||||||||
6.193%, 09/12/2049 (A) | 1,200 | 1,161 | ||||||
Morgan Stanley Bank of America Merrill Lynch Trust, | ||||||||
1.394%, 07/15/2046 | 636 | 640 | ||||||
Morgan Stanley Bank of America Merrill Lynch Trust, | ||||||||
3.214%, 02/15/2046 | 83 | 85 | ||||||
Morgan Stanley Bank of America Merrill Lynch Trust, | ||||||||
1.970%, 05/15/2046 | 222 | 225 | ||||||
Morgan Stanley Bank of America Merrill Lynch Trust, | ||||||||
3.654%, 04/15/2047 | 253 | 271 | ||||||
Morgan Stanley Bank of America Merrill Lynch Trust, | ||||||||
3.477%, 06/15/2047 | 71 | 75 | ||||||
Morgan Stanley Bank of America Merrill Lynch Trust, | ||||||||
3.012%, 03/15/2048 (B) | 1,000 | 633 | ||||||
| Description | Face Amount ($ Thousands) | Market Value ($ Thousands) | ||||||
Morgan Stanley Capital I Trust, Ser 2006-IQ12, Cl AJ | ||||||||
5.399%, 12/15/2043 | $ | 790 | $ | 715 | ||||
Morgan Stanley Capital I Trust, Ser 2011-C2, Cl A2 | ||||||||
3.476%, 06/15/2044 (B) | 759 | 779 | ||||||
Morgan Stanley Capital I Trust, Ser 2011-C3, Cl A2 | ||||||||
3.224%, 07/15/2049 | 695 | 715 | ||||||
Motel 6 Trust, | ||||||||
5.000%, 02/05/2030 (B) | 1,660 | 1,620 | ||||||
PFP III, Ser 2014-1, Cl D | ||||||||
4.275%, 06/14/2031 (A) (B) | 260 | 260 | ||||||
Prime Mortgage Trust, | ||||||||
5.500%, 05/25/2035 (B) | 1,533 | 1,495 | ||||||
RALI Trust, | ||||||||
5.500%, 02/25/2035 (B) | 2,329 | 2,333 | ||||||
RAMP Trust, | ||||||||
6.500%, 11/25/2031 (B) | 164 | 169 | ||||||
Residential Asset Securitization Trust, Ser 2004-A6, Cl A1 | ||||||||
5.000%, 08/25/2019 (B) | 112 | 115 | ||||||
Residential Asset Securitization Trust, Ser 2004-IP2, Cl 2A1 | ||||||||
2.477%, 12/25/2034 (A) (B) | 485 | 487 | ||||||
Structured Adjustable Rate Mortgage Loan Trust, Ser 2004-10, Cl 2A | ||||||||
2.395%, 08/25/2034 (A) (B) | 990 | 980 | ||||||
Structured Adjustable Rate Mortgage Loan Trust, Ser 2007-7, Cl 2AS2 | ||||||||
2.583%, 08/25/2015 (A) (B) | 4,594 | 3,655 | ||||||
Structured Asset Securities, | ||||||||
5.500%, 10/25/2035 (B) | 1,362 | 1,192 | ||||||
UBS-Barclays Commercial Mortgage Trust, | ||||||||
4.500%, 12/10/2045 (A) (B) | 670 | 670 | ||||||
UBS-Barclays Commercial Mortgage Trust, | ||||||||
1.844%, 12/10/2045 (A) (B) | 1,838 | 183 | ||||||
UBS-Barclays Commercial Mortgage Trust, | ||||||||
3.185%, 03/10/2046 | 178 | 185 | ||||||
| SEI Institutional Managed Trust / Semi-Annual Report / March 31, 2015 | 55 |
SCHEDULE OF INVESTMENTS (Unaudited)
Core Fixed Income Fund (Continued)
March 31, 2015
| Description | Face Amount ($ Thousands) | Market Value ($ Thousands) | ||||||
UBS-Barclays Commercial Mortgage Trust, | ||||||||
3.244%, 04/10/2046 | $ | 30 | $ | 31 | ||||
UBS-Citigroup Commercial Mortgage Trust, | ||||||||
2.804%, 01/10/2045 | 3,200 | 3,277 | ||||||
VNDO Mortgage Trust, | ||||||||
2.996%, 11/15/2030 (B) | 110 | 113 | ||||||
Wachovia Bank Commercial Mortgage Trust, | ||||||||
5.418%, 01/15/2045 (A) | 12 | 12 | ||||||
Wachovia Bank Commercial Mortgage Trust, | ||||||||
5.413%, 12/15/2043 (A) | 1,204 | 1,232 | ||||||
Wachovia Bank Commercial Mortgage Trust, | ||||||||
5.383%, 12/15/2043 | 260 | 276 | ||||||
Wachovia Bank Commercial Mortgage Trust, | ||||||||
5.660%, 04/15/2047 (A) | 300 | 313 | ||||||
WaMu Mortgage Pass-Through Certificates Trust, | ||||||||
2.368%, 05/25/2035 (A) (B) | 8,881 | 8,862 | ||||||
WaMu Mortgage Pass-Through Certificates Trust, | ||||||||
1.001%, 10/25/2046 (A) (B) | 2,420 | 1,929 | ||||||
WaMu Mortgage Pass-Through Certificates Trust, | ||||||||
0.821%, 02/25/2047 (A) (B) | 3,631 | 2,910 | ||||||
WaMu Mortgage Pass-Through Certificates, | ||||||||
0.464%, 10/25/2047 (A) (B) | 2,312 | 2,120 | ||||||
Washington Mutual Mortgage Pass-Through Certificates Trust, | ||||||||
0.828%, 01/25/2047 (A) (B) | 2,070 | 1,466 | ||||||
Washington Mutual MSC Mortgage Pass-Through Certificates, | ||||||||
5.000%, 02/25/2018 (B) | 86 | 86 | ||||||
| Description | Face Amount ($ Thousands) | Market Value ($ Thousands) | ||||||
Wells Fargo Commercial Mortgage Trust, | ||||||||
4.301%, 07/15/2046 (A) | $ | 20 | $ | 22 | ||||
Wells Fargo Mortgage-Backed Securities Trust, | ||||||||
2.615%, 06/25/2034 (A) (B) | 1,015 | 1,021 | ||||||
WFRBS Commercial Mortgage Trust, Ser 2011-C2, Cl XA, IO | ||||||||
1.079%, 02/15/2044 (A) (B) | 3,419 | 94 | ||||||
WFRBS Commercial Mortgage Trust, Ser 2011-C3, Cl XA, IO | ||||||||
1.579%, 03/15/2044 (A) (B) | 10,778 | 554 | ||||||
WFRBS Commercial Mortgage Trust, Ser 2011-C4, Cl A3 | ||||||||
4.394%, 06/15/2044 (B) | 2,420 | 2,624 | ||||||
WFRBS Commercial Mortgage Trust, Ser 2011-C5, Cl A4 | ||||||||
3.667%, 11/15/2044 | 3,125 | 3,371 | ||||||
WFRBS Commercial Mortgage Trust, Ser 2012-C7, Cl XA, IO | ||||||||
1.569%, 06/15/2045 (A) (B) | 354 | 30 | ||||||
WFRBS Commercial Mortgage Trust, Ser 2012-C8, Cl A3 | ||||||||
3.001%, 08/15/2045 | 1,685 | 1,749 | ||||||
WFRBS Commercial Mortgage Trust, Ser 2014-C22, Cl D | ||||||||
3.909%, 09/15/2057 (A) (B) | 740 | 668 | ||||||
WFRBS Commercial Mortgage Trust, Ser 2014-C23, Cl D | ||||||||
3.993%, 10/14/2057 (A) (B) | 650 | 590 | ||||||
|
| |||||||
| 157,729 | ||||||||
|
| |||||||
Total Mortgage-Backed Securities | 688,809 | |||||||
|
| |||||||
CORPORATE OBLIGATIONS — 27.3% |
| |||||||
Consumer Discretionary — 2.1% |
| |||||||
1011778 BC ULC | ||||||||
6.000%, 04/01/2022 (B) | 390 | 404 | ||||||
21st Century Fox America | ||||||||
6.650%, 11/15/2037 | 180 | 243 | ||||||
6.200%, 12/15/2034 | 65 | 83 | ||||||
Amazon.com | ||||||||
4.950%, 12/05/2044 | 1,665 | 1,817 | ||||||
3.800%, 12/05/2024 | 695 | 730 | ||||||
Bed Bath & Beyond | ||||||||
5.165%, 08/01/2044 | 315 | 347 | ||||||
CCOH Safari | ||||||||
5.750%, 12/01/2024 | 170 | 175 | ||||||
Coach | ||||||||
4.250%, 04/01/2025 | 420 | 426 | ||||||
| 56 | SEI Institutional Managed Trust / Semi-Annual Report / March 31, 2015 |
| Description | Face Amount ($ Thousands) | Market Value ($ Thousands) | ||||||
Comcast | ||||||||
6.950%, 08/15/2037 | $ | 450 | $ | 641 | ||||
6.550%, 07/01/2039 | 270 | 369 | ||||||
6.500%, 01/15/2017 | 890 | 976 | ||||||
6.400%, 03/01/2040 | 150 | 204 | ||||||
4.250%, 01/15/2033 | 180 | 193 | ||||||
4.200%, 08/15/2034 (D) | 200 | 217 | ||||||
3.375%, 02/15/2025 | 310 | 324 | ||||||
Comcast Cable Communications Holdings | ||||||||
9.455%, 11/15/2022 | 560 | 815 | ||||||
Cox Communications (B) | ||||||||
6.950%, 06/01/2038 | 20 | 26 | ||||||
4.800%, 02/01/2035 | 410 | 431 | ||||||
4.700%, 12/15/2042 | 10 | 10 | ||||||
CSC Holdings | ||||||||
6.750%, 11/15/2021 | 270 | 300 | ||||||
Daimler Finance North America LLC (B) | ||||||||
2.375%, 08/01/2018 | 1,460 | 1,497 | ||||||
1.875%, 01/11/2018 | 502 | 508 | ||||||
1.300%, 07/31/2015 | 150 | 150 | ||||||
1.125%, 03/10/2017 | 975 | 976 | ||||||
DIRECTV Holdings | ||||||||
6.000%, 08/15/2040 | 845 | 958 | ||||||
4.450%, 04/01/2024 | 545 | 582 | ||||||
3.950%, 01/15/2025 | 745 | 768 | ||||||
3.800%, 03/15/2022 | 213 | 221 | ||||||
DISH DBS | ||||||||
5.875%, 07/15/2022 | 250 | 254 | ||||||
5.875%, 11/15/2024 | 1,010 | 1,011 | ||||||
5.125%, 05/01/2020 | 80 | 81 | ||||||
ERAC USA Finance (B) | ||||||||
5.625%, 03/15/2042 | 479 | 559 | ||||||
4.500%, 02/15/2045 | 150 | 152 | ||||||
Family Tree Escrow | ||||||||
5.250%, 03/01/2020 (B) | 280 | 293 | ||||||
Ford Motor | ||||||||
4.750%, 01/15/2043 (D) | 1,640 | 1,793 | ||||||
General Motors | ||||||||
6.250%, 10/02/2043 | 100 | 123 | ||||||
5.200%, 04/01/2045 | 85 | 92 | ||||||
5.000%, 04/01/2035 | 110 | 117 | ||||||
3.500%, 10/02/2018 | 660 | 676 | ||||||
General Motors Financial | ||||||||
4.750%, 08/15/2017 | 1,000 | 1,053 | ||||||
4.375%, 09/25/2021 | 180 | 191 | ||||||
4.250%, 05/15/2023 | 180 | 187 | ||||||
3.250%, 05/15/2018 | 150 | 153 | ||||||
2.750%, 05/15/2016 | 200 | 202 | ||||||
Grupo Televisa | ||||||||
5.000%, 05/13/2045 | 270 | 281 | ||||||
Hilton Worldwide Finance | ||||||||
5.625%, 10/15/2021 | 920 | 968 | ||||||
| Description | Face Amount ($ Thousands) | Market Value ($ Thousands) | ||||||
Hyundai Capital America (B) | ||||||||
2.600%, 03/19/2020 | $ | 585 | $ | 591 | ||||
2.125%, 10/02/2017 | 270 | 273 | ||||||
2.000%, 03/19/2018 | 235 | 239 | ||||||
Johnson Controls | ||||||||
4.950%, 07/02/2064 | 155 | 166 | ||||||
LVMH Moet Hennessy Louis Vuitton | ||||||||
1.625%, 06/29/2017 (B) | 854 | 863 | ||||||
NBCUniversal Media | ||||||||
4.375%, 04/01/2021 | 270 | 301 | ||||||
Numericable-SFR SAS | ||||||||
6.000%, 05/15/2022 (B) | 400 | 405 | ||||||
QVC | ||||||||
5.950%, 03/15/2043 | 20 | 20 | ||||||
Reynolds Group Issuer | ||||||||
6.875%, 02/15/2021 | 180 | 189 | ||||||
Schaeffler Holding Finance BV | ||||||||
6.750%, 11/15/2022 (B) | 370 | 400 | ||||||
Scripps Networks Interactive | ||||||||
3.900%, 11/15/2024 | 455 | 470 | ||||||
Sky PLC | ||||||||
3.750%, 09/16/2024 (B) | 570 | 589 | ||||||
Taylor Morrison Communities (B) | ||||||||
7.750%, 04/15/2020 | 120 | 127 | ||||||
5.250%, 04/15/2021 | 460 | 455 | ||||||
Thomson Reuters | ||||||||
3.850%, 09/29/2024 | 465 | 481 | ||||||
Time Warner | ||||||||
7.700%, 05/01/2032 | 1,010 | 1,436 | ||||||
6.250%, 03/29/2041 | 265 | 342 | ||||||
4.750%, 03/29/2021 | 730 | 815 | ||||||
3.550%, 06/01/2024 | 1,365 | 1,414 | ||||||
Time Warner Cable | ||||||||
8.250%, 04/01/2019 | 2,265 | 2,770 | ||||||
6.550%, 05/01/2037 | 775 | 973 | ||||||
5.500%, 09/01/2041 | 325 | 373 | ||||||
Time Warner Entertainment | ||||||||
8.375%, 07/15/2033 | 270 | 396 | ||||||
Toyota Motor Credit MTN | ||||||||
3.400%, 09/15/2021 | 580 | 617 | ||||||
2.750%, 05/17/2021 | 710 | 734 | ||||||
1.250%, 10/05/2017 | 1,150 | 1,153 | ||||||
1.125%, 05/16/2017 | 1,135 | 1,138 | ||||||
United Business Media | ||||||||
5.750%, 11/03/2020 (B) | 490 | 541 | ||||||
Univision Communications | ||||||||
6.750%, 09/15/2022 (B) | 310 | 332 | ||||||
Viacom | ||||||||
5.250%, 04/01/2044 | 205 | 220 | ||||||
4.850%, 12/15/2034 | 670 | 692 | ||||||
4.250%, 09/01/2023 | 200 | 211 | ||||||
| SEI Institutional Managed Trust / Semi-Annual Report / March 31, 2015 | 57 |
SCHEDULE OF INVESTMENTS (Unaudited)
Core Fixed Income Fund (Continued)
March 31, 2015
| Description | Face Amount ($ Thousands) | Market Value ($ Thousands) | ||||||
Volkswagen Group of America Finance (B) | ||||||||
2.450%, 11/20/2019 | $ | 490 | $ | 501 | ||||
2.125%, 05/23/2019 | 490 | 493 | ||||||
Volkswagen International Finance | ||||||||
1.125%, 11/18/2016 (B) | 1,115 | 1,119 | ||||||
Yum! Brands | ||||||||
5.350%, 11/01/2043 | 270 | 299 | ||||||
|
| |||||||
| 44,715 | ||||||||
|
| |||||||
Consumer Staples — 1.7% | ||||||||
Altria Group | ||||||||
9.950%, 11/10/2038 | 150 | 260 | ||||||
9.250%, 08/06/2019 | 1,250 | 1,604 | ||||||
5.375%, 01/31/2044 | 410 | 480 | ||||||
4.750%, 05/05/2021 | 720 | 804 | ||||||
4.500%, 05/02/2043 | 350 | 362 | ||||||
4.000%, 01/31/2024 | 260 | 279 | ||||||
2.625%, 01/14/2020 | 640 | 650 | ||||||
Anheuser-Busch InBev Finance | ||||||||
2.625%, 01/17/2023 | 405 | 399 | ||||||
2.150%, 02/01/2019 | 825 | 839 | ||||||
Anheuser-Busch InBev Worldwide | ||||||||
7.750%, 01/15/2019 | 2,570 | 3,110 | ||||||
5.375%, 01/15/2020 | 1,140 | 1,313 | ||||||
5.000%, 04/15/2020 | 430 | 490 | ||||||
2.500%, 07/15/2022 | 330 | 326 | ||||||
Anheuser-Busch LLC | ||||||||
5.050%, 10/15/2016 | 940 | 1,001 | ||||||
Coca-Cola Femsa | ||||||||
2.375%, 11/26/2018 | 680 | 694 | ||||||
ConAgra Foods | ||||||||
1.900%, 01/25/2018 | 480 | 481 | ||||||
CVS Health | ||||||||
5.750%, 05/15/2041 | 970 | 1,238 | ||||||
Diageo Capital PLC | ||||||||
4.828%, 07/15/2020 | 1,580 | 1,795 | ||||||
Heineken | ||||||||
1.400%, 10/01/2017 (B) | 320 | 322 | ||||||
HJ Heinz | ||||||||
4.875%, 02/15/2025 (B) | 630 | 683 | ||||||
JM Smucker | ||||||||
4.375%, 03/15/2045 (B) | 110 | 115 | ||||||
Kraft Foods Group | ||||||||
6.500%, 02/09/2040 | 225 | 291 | ||||||
5.375%, 02/10/2020 | 455 | 517 | ||||||
5.000%, 06/04/2042 | 215 | 238 | ||||||
3.500%, 06/06/2022 | 1,350 | 1,397 | ||||||
Kroger | ||||||||
6.900%, 04/15/2038 | 260 | 355 | ||||||
2.950%, 11/01/2021 | 375 | 382 | ||||||
| Description | Face Amount ($ Thousands) | Market Value ($ Thousands) | ||||||
Lorillard Tobacco | ||||||||
8.125%, 06/23/2019 | $ | 20 | $ | 24 | ||||
3.750%, 05/20/2023 | 840 | 855 | ||||||
Molson Coors Brewing | ||||||||
3.500%, 05/01/2022 (D) | 100 | 103 | ||||||
Mondelez International | ||||||||
4.000%, 02/01/2024 | 870 | 942 | ||||||
PepsiCo | ||||||||
4.250%, 10/22/2044 | 735 | 784 | ||||||
4.000%, 03/05/2042 | 110 | 113 | ||||||
Pernod Ricard (B) | ||||||||
5.750%, 04/07/2021 | 724 | 840 | ||||||
5.500%, 01/15/2042 (D) | 150 | 182 | ||||||
4.450%, 01/15/2022 | 1,050 | 1,138 | ||||||
2.950%, 01/15/2017 | 360 | 370 | ||||||
Philip Morris International | ||||||||
4.500%, 03/20/2042 | 390 | 423 | ||||||
2.900%, 11/15/2021 | 690 | 709 | ||||||
2.500%, 08/22/2022 | 340 | 338 | ||||||
Reynolds American | ||||||||
6.750%, 06/15/2017 | 1,260 | 1,398 | ||||||
3.250%, 11/01/2022 | 340 | 338 | ||||||
Sysco | ||||||||
3.000%, 10/02/2021 | 610 | 630 | ||||||
2.350%, 10/02/2019 | 855 | 875 | ||||||
Tyson Foods | ||||||||
5.150%, 08/15/2044 | 130 | 151 | ||||||
4.500%, 06/15/2022 | 300 | 331 | ||||||
Walgreens Boots Alliance | ||||||||
4.800%, 11/18/2044 | 220 | 237 | ||||||
3.300%, 11/18/2021 | 730 | 752 | ||||||
Wal-Mart Stores | ||||||||
4.300%, 04/22/2044 | 1,055 | 1,177 | ||||||
Wm Wrigley Jr (B) | ||||||||
3.375%, 10/21/2020 | 765 | 802 | ||||||
2.900%, 10/21/2019 | 1,089 | 1,123 | ||||||
2.400%, 10/21/2018 | 430 | 438 | ||||||
2.000%, 10/20/2017 | 205 | 207 | ||||||
|
| |||||||
| 35,705 | ||||||||
|
| |||||||
Energy — 3.7% | ||||||||
Anadarko Finance, Ser B | ||||||||
7.500%, 05/01/2031 | 810 | 1,074 | ||||||
Anadarko Petroleum | ||||||||
4.500%, 07/15/2044 | 400 | 409 | ||||||
Antero Resources | ||||||||
5.375%, 11/01/2021 | 210 | 204 | ||||||
Arch Coal | ||||||||
7.000%, 06/15/2019 (D) | 600 | 141 | ||||||
Atwood Oceanics | ||||||||
6.500%, 02/01/2020 | 240 | 230 | ||||||
Baker Hughes | ||||||||
7.500%, 11/15/2018 | 1,230 | 1,466 | ||||||
| 58 | SEI Institutional Managed Trust / Semi-Annual Report / March 31, 2015 |
| Description | Face Amount ($ Thousands) | Market Value ($ Thousands) | ||||||
BG Energy Capital PLC | ||||||||
4.000%, 10/15/2021 (B) | $ | 910 | $ | 948 | ||||
BP Capital Markets PLC | ||||||||
3.561%, 11/01/2021 | 50 | 53 | ||||||
3.506%, 03/17/2025 | 1,930 | 1,969 | ||||||
3.245%, 05/06/2022 | 160 | 165 | ||||||
California Resources | ||||||||
6.000%, 11/15/2024 (B) (D) | 450 | 395 | ||||||
Canadian Oil Sands | ||||||||
6.000%, 04/01/2042 (B) | 328 | 296 | ||||||
Chesapeake Energy | ||||||||
6.875%, 11/15/2020 | 450 | 470 | ||||||
6.500%, 08/15/2017 | 275 | 289 | ||||||
Chevron | ||||||||
2.411%, 03/03/2022 | 495 | 496 | ||||||
1.961%, 03/03/2020 | 935 | 941 | ||||||
1.365%, 03/02/2018 | 860 | 864 | ||||||
Concho Resources | ||||||||
5.500%, 10/01/2022 | 350 | 353 | ||||||
5.500%, 04/01/2023 | 80 | 81 | ||||||
Conoco Funding | ||||||||
7.250%, 10/15/2031 | 50 | 70 | ||||||
ConocoPhillips | ||||||||
5.900%, 10/15/2032 | 10 | 13 | ||||||
5.900%, 05/15/2038 | 420 | 536 | ||||||
4.150%, 11/15/2034 | 630 | 670 | ||||||
2.875%, 11/15/2021 | 415 | 426 | ||||||
Continental Resources | ||||||||
5.000%, 09/15/2022 | 90 | 89 | ||||||
4.900%, 06/01/2044 | 400 | 353 | ||||||
4.500%, 04/15/2023 | 450 | 437 | ||||||
Devon Energy | ||||||||
5.600%, 07/15/2041 | 655 | 763 | ||||||
3.250%, 05/15/2022 | 530 | 535 | ||||||
Devon Financing LLC | ||||||||
7.875%, 09/30/2031 | 260 | 354 | ||||||
Diamond Offshore Drilling | ||||||||
4.875%, 11/01/2043 (D) | 75 | 63 | ||||||
Ecopetrol | ||||||||
7.375%, 09/18/2043 | 245 | 267 | ||||||
5.875%, 05/28/2045 | 895 | 833 | ||||||
Encana | ||||||||
6.500%, 02/01/2038 | 230 | 263 | ||||||
Energy Transfer Partners | ||||||||
8.250%, 11/15/2029 | 1,315 | 1,816 | ||||||
5.150%, 03/15/2045 | 260 | 262 | ||||||
4.050%, 03/15/2025 | 425 | 429 | ||||||
EnLink Midstream Partners | ||||||||
5.050%, 04/01/2045 | 405 | 412 | ||||||
Ensco | ||||||||
5.200%, 03/15/2025 | 245 | 246 | ||||||
Enterprise Products Operating LLC | ||||||||
4.850%, 03/15/2044 | 175 | 189 | ||||||
3.750%, 02/15/2025 | 350 | 361 | ||||||
| Description | Face Amount ($ Thousands) | Market Value ($ Thousands) | ||||||
Exxon Mobil | ||||||||
3.567%, 03/06/2045 | $ | 895 | $ | 928 | ||||
2.709%, 03/06/2025 | 740 | 748 | ||||||
1.912%, 09/06/2015 | 735 | 742 | ||||||
1.305%, 03/06/2018 | 1,220 | 1,227 | ||||||
Florida Gas Transmission | ||||||||
7.900%, 05/15/2019 (B) | 1,000 | 1,195 | ||||||
Kerr-McGee | ||||||||
7.875%, 09/15/2031 | 430 | 586 | ||||||
6.950%, 07/01/2024 | 935 | 1,170 | ||||||
Key Energy Services | ||||||||
6.750%, 03/01/2021 | 1,120 | 722 | ||||||
Kinder Morgan | ||||||||
6.950%, 06/01/2028 | 6,750 | 7,705 | ||||||
5.550%, 06/01/2045 | 280 | 295 | ||||||
5.300%, 12/01/2034 | 160 | 165 | ||||||
4.300%, 06/01/2025 | 1,635 | 1,678 | ||||||
Kinder Morgan Energy Partners | ||||||||
4.300%, 05/01/2024 | 420 | 428 | ||||||
4.100%, 11/15/2015 | 580 | 590 | ||||||
Marathon Petroleum | ||||||||
5.000%, 09/15/2054 | 85 | 85 | ||||||
MarkWest Energy Partners | ||||||||
6.250%, 06/15/2022 | 38 | 40 | ||||||
5.500%, 02/15/2023 | 320 | 329 | ||||||
4.875%, 12/01/2024 | 540 | 552 | ||||||
MPLX | ||||||||
4.000%, 02/15/2025 | 155 | 156 | ||||||
Newfield Exploration | ||||||||
5.625%, 07/01/2024 | 450 | 468 | ||||||
Noble Energy | ||||||||
5.250%, 11/15/2043 | 180 | 188 | ||||||
4.150%, 12/15/2021 | 690 | 731 | ||||||
3.900%, 11/15/2024 | 500 | 509 | ||||||
Occidental Petroleum | ||||||||
3.125%, 02/15/2022 | 330 | 340 | ||||||
ONEOK Partners | ||||||||
6.200%, 09/15/2043 | 215 | 224 | ||||||
4.900%, 03/15/2025 | 250 | 253 | ||||||
3.800%, 03/15/2020 | 285 | 291 | ||||||
2.000%, 10/01/2017 | 450 | 449 | ||||||
Panhandle Eastern Pipeline | ||||||||
8.125%, 06/01/2019 | 2,500 | 3,039 | ||||||
Penn Virginia Resource Partners | ||||||||
8.375%, 06/01/2020 | 416 | 453 | ||||||
Petrobras Global Finance BV | ||||||||
6.250%, 03/17/2024 (D) | 720 | 679 | ||||||
5.750%, 01/20/2020 | 574 | 532 | ||||||
4.875%, 03/17/2020 | 540 | 485 | ||||||
3.000%, 01/15/2019 | 385 | 332 | ||||||
Petrobras International Finance | ||||||||
6.125%, 10/06/2016 | 655 | 653 | ||||||
5.375%, 01/27/2021 | 2,670 | 2,422 | ||||||
| SEI Institutional Managed Trust / Semi-Annual Report / March 31, 2015 | 59 |
SCHEDULE OF INVESTMENTS (Unaudited)
Core Fixed Income Fund (Continued)
March 31, 2015
| Description | Face Amount ($ Thousands) | Market Value ($ Thousands) | ||||||
Petro-Canada | ||||||||
6.800%, 05/15/2038 | $ | 1,665 | $ | 2,198 | ||||
Petroleos Mexicanos | ||||||||
6.625%, 06/15/2035 | 1,667 | 1,909 | ||||||
6.375%, 01/23/2045 | 1,080 | 1,207 | ||||||
5.625%, 01/23/2046 | 540 | 548 | ||||||
5.500%, 06/27/2044 (B) | 200 | 202 | ||||||
4.500%, 01/23/2026 (B) | 240 | 245 | ||||||
2.378%, 04/15/2025 | 660 | 672 | ||||||
Phillips 66 | ||||||||
4.875%, 11/15/2044 | 225 | 241 | ||||||
Plains All American Pipeline | ||||||||
4.900%, 02/15/2045 | 400 | 421 | ||||||
QEP Resources | ||||||||
6.875%, 03/01/2021 | 520 | 552 | ||||||
5.250%, 05/01/2023 | 290 | 284 | ||||||
Range Resources | ||||||||
5.000%, 08/15/2022 | 100 | 100 | ||||||
5.000%, 03/15/2023 | 520 | 517 | ||||||
Regency Energy Partners | ||||||||
4.500%, 11/01/2023 | 690 | 693 | ||||||
Rowan | ||||||||
5.850%, 01/15/2044 | 180 | 155 | ||||||
5.400%, 12/01/2042 | 291 | 239 | ||||||
Sabine Pass Liquefaction | ||||||||
5.750%, 05/15/2024 | 220 | 221 | ||||||
5.625%, 02/01/2021 | 140 | 141 | ||||||
Samson Investment | ||||||||
9.750%, 02/15/2020 | 650 | 176 | ||||||
SESI LLC | ||||||||
7.125%, 12/15/2021 | 180 | 182 | ||||||
Shelf Drilling Holdings | ||||||||
8.625%, 11/01/2018 (B) (D) | 140 | 114 | ||||||
Shell International Finance | ||||||||
4.375%, 03/25/2020 | 690 | 772 | ||||||
3.400%, 08/12/2023 | 595 | 629 | ||||||
Sinopec Group Overseas Development (B) | ||||||||
4.375%, 04/10/2024 | 1,150 | 1,248 | ||||||
2.750%, 05/17/2017 | 490 | 499 | ||||||
Southern Natural Gas LLC | ||||||||
8.000%, 03/01/2032 | 170 | 211 | ||||||
Spectra Energy Partners | ||||||||
4.500%, 03/15/2045 | 1,060 | 1,076 | ||||||
Statoil | ||||||||
2.900%, 11/08/2020 | 1,245 | 1,304 | ||||||
2.250%, 11/08/2019 | 460 | 468 | ||||||
Sunoco Logistics Partners Operations | ||||||||
5.350%, 05/15/2045 | 495 | 521 | ||||||
Talisman Energy | ||||||||
3.750%, 02/01/2021 | 360 | 354 | ||||||
| Description | Face Amount ($ Thousands) | Market Value ($ Thousands) | ||||||
TC PipeLines | ||||||||
4.650%, 06/15/2021 | $ | 160 | $ | 168 | ||||
4.375%, 03/13/2025 | 360 | 364 | ||||||
Tennessee Gas Pipeline LLC | ||||||||
8.375%, 06/15/2032 | 1,638 | 2,119 | ||||||
Total Capital International | ||||||||
2.875%, 02/17/2022 | 850 | 871 | ||||||
2.750%, 06/19/2021 | 290 | 297 | ||||||
2.100%, 06/19/2019 | 435 | 441 | ||||||
TransCanada PipeLines | ||||||||
4.625%, 03/01/2034 | 815 | 877 | ||||||
Valero Energy | ||||||||
4.900%, 03/15/2045 | 245 | 253 | ||||||
3.650%, 03/15/2025 | 370 | 378 | ||||||
Weatherford International | ||||||||
5.950%, 04/15/2042 | 335 | 294 | ||||||
4.500%, 04/15/2022 | 265 | 242 | ||||||
Western Gas Partners | ||||||||
5.375%, 06/01/2021 | 165 | 182 | ||||||
Williams | ||||||||
7.875%, 09/01/2021 | 505 | 586 | ||||||
7.750%, 06/15/2031 | 861 | 988 | ||||||
Williams Partners | ||||||||
6.125%, 07/15/2022 | 680 | 720 | ||||||
4.875%, 03/15/2024 | 100 | 100 | ||||||
4.000%, 09/15/2025 | 420 | 412 | ||||||
|
| |||||||
| 79,011 | ||||||||
|
| |||||||
Financials — 11.1% | ||||||||
Abbey National Treasury Services | ||||||||
2.375%, 03/16/2020 | 965 | 972 | ||||||
ACE INA Holdings | ||||||||
3.150%, 03/15/2025 | 605 | 619 | ||||||
AIA Group MTN | ||||||||
3.200%, 03/11/2025 (B) | 490 | 494 | ||||||
Allstate | ||||||||
3.150%, 06/15/2023 | 555 | 573 | ||||||
Ally Financial | ||||||||
7.500%, 09/15/2020 | 626 | 733 | ||||||
American Express | ||||||||
6.800%, 09/01/2066 (A) | 1,790 | 1,880 | ||||||
American Express Credit MTN | ||||||||
2.250%, 08/15/2019 | 1,025 | 1,040 | ||||||
1.750%, 06/12/2015 | 1,231 | 1,233 | ||||||
American Honda Finance MTN | ||||||||
3.875%, 09/21/2020 (B) | 1,065 | 1,155 | ||||||
American International Group | ||||||||
6.400%, 12/15/2020 | 359 | 435 | ||||||
6.250%, 03/15/2037 | 1,670 | 1,903 | ||||||
5.850%, 01/16/2018 | 860 | 961 | ||||||
4.500%, 07/16/2044 | 250 | 268 | ||||||
4.375%, 01/15/2055 | 215 | 217 | ||||||
| 60 | SEI Institutional Managed Trust / Semi-Annual Report / March 31, 2015 |
| Description | Face Amount ($ Thousands) | Market Value ($ Thousands) | ||||||
American Tower‡ | ||||||||
3.500%, 01/31/2023 | $ | 552 | $ | 547 | ||||
3.450%, 09/15/2021 | 565 | 577 | ||||||
ANZ National International | ||||||||
1.850%, 10/15/2015 (B) | 470 | 474 | ||||||
Assurant | ||||||||
2.500%, 03/15/2018 | 580 | 590 | ||||||
Australia & New Zealand Banking Group | ||||||||
4.500%, 03/19/2024 (B) | 575 | 601 | ||||||
Bank of America MTN | ||||||||
8.950%, 05/18/2017 (A) | 1,790 | 1,884 | ||||||
8.680%, 05/02/2017 (A) | 3,160 | 3,307 | ||||||
6.250%, 09/29/2049 (A) | 1,030 | 1,049 | ||||||
6.050%, 05/16/2016 | 350 | 367 | ||||||
6.000%, 09/01/2017 | 665 | 732 | ||||||
5.750%, 12/01/2017 | 305 | 336 | ||||||
5.700%, 05/02/2017 | 1,300 | 1,401 | ||||||
5.650%, 05/01/2018 | 270 | 299 | ||||||
5.625%, 10/14/2016 | 3,135 | 3,338 | ||||||
5.625%, 07/01/2020 | 110 | 127 | ||||||
5.420%, 03/15/2017 | 4,300 | 4,593 | ||||||
5.000%, 05/13/2021 | 90 | 102 | ||||||
5.000%, 01/21/2044 | 1,430 | 1,641 | ||||||
4.875%, 04/01/2044 | 780 | 878 | ||||||
4.500%, 04/01/2015 | 180 | 180 | ||||||
4.250%, 10/22/2026 | 450 | 464 | ||||||
4.200%, 08/26/2024 | 830 | 859 | ||||||
4.000%, 04/01/2024 | 1,500 | 1,596 | ||||||
4.000%, 01/22/2025 | 530 | 534 | ||||||
3.875%, 03/22/2017 | 280 | 293 | ||||||
3.625%, 03/17/2016 | 2,275 | 2,330 | ||||||
3.300%, 01/11/2023 | 160 | 162 | ||||||
2.600%, 01/15/2019 | 670 | 682 | ||||||
1.650%, 03/26/2018 | 665 | 667 | ||||||
1.500%, 10/09/2015 | 1,311 | 1,317 | ||||||
Bank of New York Mellon MTN | ||||||||
3.400%, 05/15/2024 | 1,865 | 1,952 | ||||||
2.200%, 03/04/2019 | 630 | 640 | ||||||
Barclays | ||||||||
3.650%, 03/16/2025 | 595 | 597 | ||||||
Barclays Bank | ||||||||
4.375%, 09/11/2024 | 285 | 289 | ||||||
Barclays Bank PLC MTN | ||||||||
6.050%, 12/04/2017 (B) | 420 | 462 | ||||||
BB&T MTN | ||||||||
2.450%, 01/15/2020 | 385 | 392 | ||||||
Bear Stearns | ||||||||
6.400%, 10/02/2017 | 70 | 78 | ||||||
4.650%, 07/02/2018 | 995 | 1,084 | ||||||
BNP Paribas MTN | ||||||||
2.375%, 09/14/2017 | 320 | 326 | ||||||
Boeing Capital | ||||||||
4.700%, 10/27/2019 | 490 | 552 | ||||||
| Description | Face Amount ($ Thousands) | Market Value ($ Thousands) | ||||||
BPCE | ||||||||
5.150%, 07/21/2024 (B) | $ | 210 | $ | 225 | ||||
Capital One Financial | ||||||||
3.200%, 02/05/2025 | 445 | 441 | ||||||
Chase Capital VI | ||||||||
0.880%, 08/01/2028 (A) | 1,750 | 1,487 | ||||||
CIT Group | ||||||||
5.000%, 08/01/2023 | 580 | 594 | ||||||
Citigroup | ||||||||
6.875%, 03/05/2038 | 370 | 512 | ||||||
6.675%, 09/13/2043 | 130 | 173 | ||||||
6.625%, 06/15/2032 | 100 | 125 | ||||||
6.300%, 12/29/2049 (A) | 520 | 531 | ||||||
5.950%, 12/29/2049 (A) | 360 | 364 | ||||||
5.900%, 12/29/2049 (A) (D) | 220 | 222 | ||||||
5.500%, 09/13/2025 | 750 | 850 | ||||||
5.350%, 05/29/2049 (A) | 390 | 377 | ||||||
5.300%, 05/06/2044 | 240 | 270 | ||||||
4.050%, 07/30/2022 | 70 | 73 | ||||||
3.500%, 05/15/2023 | 500 | 499 | ||||||
2.500%, 09/26/2018 | 3,330 | 3,395 | ||||||
2.400%, 02/18/2020 | 530 | 532 | ||||||
1.750%, 05/01/2018 | 1,835 | 1,832 | ||||||
1.700%, 07/25/2016 | 660 | 665 | ||||||
1.550%, 08/14/2017 | 940 | 941 | ||||||
0.534%, 06/09/2016 (A) | 3,650 | 3,628 | ||||||
Citigroup Capital III | ||||||||
7.625%, 12/01/2036 | 1,500 | 1,957 | ||||||
CME Group | ||||||||
3.000%, 03/15/2025 | 860 | 869 | ||||||
Commonwealth Bank of Australia MTN | ||||||||
5.000%, 10/15/2019 (B) | 10 | 11 | ||||||
Cooperatieve Centrale Raiffeisen-Boerenleenbank | ||||||||
11.000%, 12/31/2049 (A) (B) | 1,050 | 1,352 | ||||||
4.625%, 12/01/2023 | 1,100 | 1,189 | ||||||
Countrywide Financial | ||||||||
6.250%, 05/15/2016 | 1,080 | 1,136 | ||||||
Credit Agricole (B) | ||||||||
8.375%, 12/31/2049 (A) | 1,550 | 1,832 | ||||||
4.375%, 03/17/2025 | 515 | 521 | ||||||
Credit Suisse MTN | ||||||||
5.400%, 01/14/2020 | 1,350 | 1,522 | ||||||
Credit Suisse Group Funding Guernsey | ||||||||
3.750%, 03/26/2025 (B) | 870 | 880 | ||||||
Credit Suisse NY MTN | ||||||||
3.625%, 09/09/2024 | 785 | 811 | ||||||
0.583%, 08/24/2015 (A) | 1,500 | 1,500 | ||||||
DDR‡ | ||||||||
4.625%, 07/15/2022 | 695 | 748 | ||||||
3.375%, 05/15/2023 | 665 | 660 | ||||||
| SEI Institutional Managed Trust / Semi-Annual Report / March 31, 2015 | 61 |
SCHEDULE OF INVESTMENTS (Unaudited)
Core Fixed Income Fund (Continued)
March 31, 2015
| Description | Face Amount ($ Thousands) | Market Value ($ Thousands) | ||||||
Deutsche Bank | ||||||||
4.500%, 04/01/2025 | $ | 945 | $ | 946 | ||||
1.350%, 05/30/2017 | 800 | 799 | ||||||
Discover Financial Services | ||||||||
3.750%, 03/04/2025 | 295 | 297 | ||||||
Farmers Exchange Capital | ||||||||
7.050%, 07/15/2028 (B) | 1,000 | 1,255 | ||||||
Farmers Exchange Capital II | ||||||||
6.151%, 11/01/2053 (A) (B) | 2,150 | 2,522 | ||||||
Federal Realty Investment Trust‡ | ||||||||
3.950%, 01/15/2024 | 310 | 331 | ||||||
3.000%, 08/01/2022 | 230 | 232 | ||||||
First Industrial MTN | ||||||||
7.500%, 12/01/2017 | 970 | 1,093 | ||||||
FMS Wertmanagement AoeR | ||||||||
1.000%, 11/21/2017 | 640 | 641 | ||||||
Ford Motor Credit | ||||||||
3.664%, 09/08/2024 (D) | 580 | 599 | ||||||
Ford Motor Credit LLC | ||||||||
8.125%, 01/15/2020 | 660 | 825 | ||||||
5.875%, 08/02/2021 | 230 | 271 | ||||||
5.750%, 02/01/2021 | 220 | 256 | ||||||
3.219%, 01/09/2022 | 480 | 490 | ||||||
2.597%, 11/04/2019 | 775 | 785 | ||||||
2.459%, 03/27/2020 | 515 | 515 | ||||||
1.700%, 05/09/2016 | 2,000 | 2,009 | ||||||
General Electric Capital | ||||||||
6.875%, 01/10/2039 | 360 | 518 | ||||||
6.375%, 11/15/2019 (A) | 3,980 | 4,318 | ||||||
5.875%, 01/14/2038 | 540 | 698 | ||||||
5.550%, 05/04/2020 | 2,975 | 3,460 | ||||||
4.500%, 03/11/2044 | 220 | 247 | ||||||
4.375%, 09/16/2020 | 2,490 | 2,764 | ||||||
0.850%, 10/09/2015 | 460 | 461 | ||||||
0.737%, 08/15/2036 (A) | 1,550 | 1,346 | ||||||
0.635%, 05/05/2026 (A) | 1,950 | 1,829 | ||||||
Goldman Sachs Capital II | ||||||||
4.000%, 06/01/2043 (A) | 200 | 155 | ||||||
Goldman Sachs Group MTN | ||||||||
7.500%, 02/15/2019 | 950 | 1,134 | ||||||
6.750%, 10/01/2037 | 243 | 319 | ||||||
6.250%, 02/01/2041 | 1,785 | 2,327 | ||||||
6.150%, 04/01/2018 | 1,780 | 2,001 | ||||||
6.000%, 06/15/2020 | 170 | 199 | ||||||
5.950%, 01/18/2018 | 260 | 290 | ||||||
5.750%, 01/24/2022 | 110 | 128 | ||||||
5.375%, 03/15/2020 | 2,860 | 3,245 | ||||||
5.350%, 01/15/2016 | 660 | 683 | ||||||
5.250%, 07/27/2021 | 340 | 387 | ||||||
4.000%, 03/03/2024 | 490 | 518 | ||||||
3.850%, 07/08/2024 | 330 | 346 | ||||||
3.500%, 01/23/2025 | 1,315 | 1,340 | ||||||
2.375%, 01/22/2018 | 1,370 | 1,398 | ||||||
| Description | Face Amount ($ Thousands) | Market Value ($ Thousands) | ||||||
HBOS PLC MTN | ||||||||
6.750%, 05/21/2018 (B) | $ | 2,100 | $ | 2,349 | ||||
HCP MTN‡ | ||||||||
6.300%, 09/15/2016 | 1,075 | 1,153 | ||||||
6.000%, 01/30/2017 | 1,800 | 1,944 | ||||||
2.625%, 02/01/2020 | 1,000 | 1,002 | ||||||
Health Care‡ | ||||||||
6.500%, 03/15/2041 | 710 | 934 | ||||||
5.250%, 01/15/2022 | 900 | 1,014 | ||||||
4.950%, 01/15/2021 | 2,820 | 3,132 | ||||||
Healthcare Trust of America Holdings‡ | ||||||||
3.375%, 07/15/2021 | 370 | 376 | ||||||
Highwoods Properties‡ | ||||||||
7.500%, 04/15/2018 | 1,142 | 1,320 | ||||||
HSBC Bank PLC | ||||||||
4.750%, 01/19/2021 (B) | 1,760 | 1,977 | ||||||
HSBC Holdings PLC | ||||||||
6.800%, 06/01/2038 | 180 | 237 | ||||||
4.250%, 03/14/2024 | 2,725 | 2,859 | ||||||
4.000%, 03/30/2022 | 330 | 355 | ||||||
HSBC USA | ||||||||
2.375%, 11/13/2019 | 265 | 267 | ||||||
2.350%, 03/05/2020 | 1,230 | 1,236 | ||||||
1.700%, 03/05/2018 | 1,230 | 1,232 | ||||||
ILFC E-Capital Trust II | ||||||||
6.250%, 12/21/2065 (A) (B) | 400 | 376 | ||||||
ING Bank (B) | ||||||||
5.800%, 09/25/2023 | 1,385 | 1,568 | ||||||
2.450%, 03/16/2020 | 1,000 | 1,012 | ||||||
1.800%, 03/16/2018 | 640 | 643 | ||||||
Inter-American Development Bank | ||||||||
4.375%, 01/24/2044 | 190 | 245 | ||||||
International Lease Finance | ||||||||
7.125%, 09/01/2018 (B) | 1,080 | 1,212 | ||||||
Intesa Sanpaolo MTN | ||||||||
5.017%, 06/26/2024 (B) | 1,890 | 1,934 | ||||||
3.625%, 08/12/2015 (B) | 500 | 505 | ||||||
3.125%, 01/15/2016 | 390 | 395 | ||||||
2.375%, 01/13/2017 | 717 | 726 | ||||||
John Deere Capital | ||||||||
1.700%, 01/15/2020 | 160 | 159 | ||||||
JPMorgan Chase | ||||||||
6.000%, 01/15/2018 | 135 | 151 | ||||||
4.850%, 02/01/2044 | 245 | 280 | ||||||
4.500%, 01/24/2022 | 180 | 199 | ||||||
4.400%, 07/22/2020 | 210 | 231 | ||||||
4.350%, 08/15/2021 | 215 | 236 | ||||||
4.250%, 10/15/2020 | 330 | 360 | ||||||
4.125%, 12/15/2026 | 275 | 285 | ||||||
3.875%, 09/10/2024 | 990 | 1,016 | ||||||
3.625%, 05/13/2024 | 700 | 728 | ||||||
3.375%, 05/01/2023 | 600 | 604 | ||||||
| 62 | SEI Institutional Managed Trust / Semi-Annual Report / March 31, 2015 |
| Description | Face Amount ($ Thousands) | Market Value ($ Thousands) | ||||||
3.125%, 01/23/2025 | $ | 215 | $ | 216 | ||||
2.250%, 01/23/2020 | 2,530 | 2,535 | ||||||
JPMorgan Chase Bank | ||||||||
6.000%, 07/05/2017 | 2,250 | 2,476 | ||||||
6.000%, 10/01/2017 | 1,000 | 1,107 | ||||||
0.600%, 06/13/2016 (A) | 1,300 | 1,296 | ||||||
JPMorgan Chase Capital XIII | ||||||||
1.207%, 09/30/2034 (A) | 550 | 462 | ||||||
JPMorgan Chase Capital XXIII | ||||||||
1.257%, 05/15/2047 (A) | 1,900 | 1,491 | ||||||
Lazard Group LLC | ||||||||
6.850%, 06/15/2017 | 199 | 221 | ||||||
4.250%, 11/14/2020 | 570 | 609 | ||||||
3.750%, 02/13/2025 | 835 | 824 | ||||||
Lincoln National | ||||||||
3.350%, 03/09/2025 | 150 | 152 | ||||||
Lloyds Banking Group PLC | ||||||||
4.500%, 11/04/2024 | 1,065 | 1,106 | ||||||
2.400%, 03/17/2020 | 690 | 697 | ||||||
1.750%, 03/16/2018 | 930 | 935 | ||||||
M&T Bank | ||||||||
6.875%, 12/29/2049 | 1,740 | 1,777 | ||||||
Macquarie Bank MTN | ||||||||
0.886%, 10/27/2017 (A) (B) | 1,500 | 1,500 | ||||||
Massachusetts Mutual Life | ||||||||
8.875%, 06/01/2039 (B) | 605 | 993 | ||||||
MetLife | ||||||||
6.750%, 06/01/2016 | 375 | 400 | ||||||
6.400%, 12/15/2036 | 220 | 261 | ||||||
4.750%, 02/08/2021 | 540 | 610 | ||||||
4.050%, 03/01/2045 | 190 | 197 | ||||||
3.000%, 03/01/2025 | 425 | 426 | ||||||
1.903%, 12/15/2017 | 305 | 307 | ||||||
MetLife Capital Trust IV | ||||||||
7.875%, 12/15/2037 (B) | 800 | 1,060 | ||||||
Mid-America Apartments‡ | ||||||||
4.300%, 10/15/2023 | 445 | 475 | ||||||
3.750%, 06/15/2024 | 515 | 528 | ||||||
Morgan Stanley MTN | ||||||||
7.300%, 05/13/2019 | 545 | 652 | ||||||
6.625%, 04/01/2018 | 1,640 | 1,865 | ||||||
6.000%, 04/28/2015 | 630 | 632 | ||||||
5.375%, 10/15/2015 | 595 | 610 | ||||||
4.750%, 03/22/2017 | 140 | 149 | ||||||
4.350%, 09/08/2026 | 375 | 393 | ||||||
4.300%, 01/27/2045 | 780 | 808 | ||||||
3.700%, 10/23/2024 | 805 | 839 | ||||||
2.650%, 01/27/2020 | 1,300 | 1,318 | ||||||
0.707%, 10/18/2016 (A) | 5,965 | 5,958 | ||||||
Murray Street Investment Trust | ||||||||
4.647%, 03/09/2017 (E) | 1,031 | 1,093 | ||||||
Nationwide Mutual Insurance | ||||||||
2.561%, 12/15/2024 (A) (B) | 2,975 | 2,975 | ||||||
| Description | Face Amount ($ Thousands) | Market Value ($ Thousands) | ||||||
Navient MTN | ||||||||
5.625%, 08/01/2033 | $ | 145 | $ | 119 | ||||
New York Life Insurance (B) | ||||||||
6.750%, 11/15/2039 | 415 | 594 | ||||||
2.100%, 01/02/2019 | 575 | 584 | ||||||
Northwestern Mutual Life Insurance | ||||||||
6.063%, 03/30/2040 (B) | 690 | 914 | ||||||
PNC Bank | ||||||||
2.400%, 10/18/2019 | 625 | 637 | ||||||
2.250%, 07/02/2019 | 545 | 552 | ||||||
Prudential Financial MTN | ||||||||
4.600%, 05/15/2044 | 125 | 132 | ||||||
Royal Bank of Scotland | ||||||||
4.650%, 06/04/2018 | 270 | 284 | ||||||
2.550%, 09/18/2015 | 200 | 201 | ||||||
Royal Bank of Scotland Group PLC | ||||||||
7.648%, 08/31/2049 (A) | 110 | 139 | ||||||
7.640%, 09/29/2017 (A) | 100 | 109 | ||||||
6.400%, 10/21/2019 | 280 | 324 | ||||||
6.125%, 12/15/2022 | 390 | 439 | ||||||
6.100%, 06/10/2023 | 550 | 612 | ||||||
6.000%, 12/19/2023 | 860 | 957 | ||||||
5.125%, 05/28/2024 | 705 | 740 | ||||||
Santander US Debt Unipersonal | ||||||||
3.781%, 10/07/2015 (B) | 100 | 102 | ||||||
SL Green Realty‡ | ||||||||
7.750%, 03/15/2020 | 1,000 | 1,214 | ||||||
Standard Chartered | ||||||||
5.700%, 03/26/2044 (B) | 1,420 | 1,584 | ||||||
State Street | ||||||||
4.956%, 03/15/2018 | 1,380 | 1,493 | ||||||
Sumitomo Mitsui Banking MTN | ||||||||
3.100%, 01/14/2016 (B) | 200 | 204 | ||||||
1.350%, 07/11/2017 | 860 | 859 | ||||||
Swedbank MTN | ||||||||
2.200%, 03/04/2020 (B) | 250 | 251 | ||||||
Synchrony Financial | ||||||||
4.250%, 08/15/2024 | 420 | 439 | ||||||
2.700%, 02/03/2020 | 655 | 658 | ||||||
Tanger Properties‡ | ||||||||
3.875%, 12/01/2023 | 300 | 313 | ||||||
3.750%, 12/01/2024 | 260 | 267 | ||||||
Teachers Insurance & Annuity Association of America | ||||||||
6.850%, 12/16/2039 (B) | 1,300 | 1,812 | ||||||
Temasek Financial I MTN | ||||||||
2.375%, 01/23/2023 (B) | 690 | 685 | ||||||
US Bank/Cincinnati | ||||||||
2.125%, 10/28/2019 | 1,220 | 1,236 | ||||||
Ventas Realty L.P.‡ | ||||||||
2.700%, 04/01/2020 | 1,450 | 1,466 | ||||||
| SEI Institutional Managed Trust / Semi-Annual Report / March 31, 2015 | 63 |
SCHEDULE OF INVESTMENTS (Unaudited)
Core Fixed Income Fund (Continued)
March 31, 2015
| Description | Face Amount ($ Thousands) | Market Value ($ Thousands) | ||||||
Voya Financial | ||||||||
2.900%, 02/15/2018 | $ | 150 | $ | 155 | ||||
Wachovia Capital Trust III | ||||||||
5.570%, 05/31/2016 (A) | 2,630 | 2,597 | ||||||
WEA Finance (B) | ||||||||
3.750%, 09/17/2024 | 1,180 | 1,221 | ||||||
2.700%, 09/17/2019 | 290 | 294 | ||||||
Wells Fargo | ||||||||
6.000%, 11/15/2017 | 250 | 279 | ||||||
5.375%, 11/02/2043 | 410 | 483 | ||||||
4.650%, 11/04/2044 | 190 | 204 | ||||||
4.600%, 04/01/2021 | 160 | 180 | ||||||
4.480%, 01/16/2024 | 2,658 | 2,885 | ||||||
3.676%, 06/15/2016 (E) | 680 | 704 | ||||||
3.450%, 02/13/2023 | 430 | 440 | ||||||
3.000%, 01/22/2021 | 1,010 | 1,045 | ||||||
2.125%, 04/22/2019 | 420 | 425 | ||||||
1.500%, 01/16/2018 | 420 | 422 | ||||||
XLIT | ||||||||
5.500%, 03/31/2045 | 255 | 255 | ||||||
4.450%, 03/31/2025 | 215 | 216 | ||||||
ZFS Finance USA Trust II | ||||||||
6.450%, 12/15/2065 (A) (B) | 1,100 | 1,155 | ||||||
|
| |||||||
| 234,568 | ||||||||
|
| |||||||
Health Care — 2.1% | ||||||||
AbbVie | ||||||||
4.400%, 11/06/2042 | 980 | 1,009 | ||||||
2.900%, 11/06/2022 | 270 | 268 | ||||||
1.750%, 11/06/2017 | 780 | 783 | ||||||
Actavis Funding SCS | ||||||||
4.850%, 06/15/2044 | 130 | 138 | ||||||
4.750%, 03/15/2045 | 1,960 | 2,083 | ||||||
4.550%, 03/15/2035 | 210 | 219 | ||||||
3.800%, 03/15/2025 | 1,235 | 1,275 | ||||||
3.450%, 03/15/2022 | 1,915 | 1,961 | ||||||
3.000%, 03/12/2020 | 750 | 767 | ||||||
Aetna | ||||||||
2.200%, 03/15/2019 | 310 | 313 | ||||||
Amgen | ||||||||
5.650%, 06/15/2042 | 475 | 582 | ||||||
5.150%, 11/15/2041 | 1,125 | 1,296 | ||||||
3.625%, 05/22/2024 | 330 | 347 | ||||||
2.200%, 05/22/2019 | 435 | 441 | ||||||
Anthem | ||||||||
5.875%, 06/15/2017 | 1,155 | 1,263 | ||||||
5.100%, 01/15/2044 | 205 | 235 | ||||||
3.500%, 08/15/2024 | 375 | 384 | ||||||
3.125%, 05/15/2022 | 695 | 705 | ||||||
1.250%, 09/10/2015 | 240 | 241 | ||||||
Bayer US Finance | ||||||||
1.500%, 10/06/2017 (B) | 1,205 | 1,213 | ||||||
Becton Dickinson | ||||||||
2.675%, 12/15/2019 | 455 | 465 | ||||||
| Description | Face Amount ($ Thousands) | Market Value ($ Thousands) | ||||||
Celgene | ||||||||
5.250%, 08/15/2043 | $ | 250 | $ | 290 | ||||
3.625%, 05/15/2024 | 240 | 249 | ||||||
DaVita HealthCare Partners | ||||||||
5.125%, 07/15/2024 | 740 | 755 | ||||||
EMD Finance (B) | ||||||||
2.400%, 03/19/2020 | 695 | 703 | ||||||
1.700%, 03/19/2018 | 600 | 603 | ||||||
Fresenius Medical Care US Finance | ||||||||
5.750%, 02/15/2021 (B) | 160 | 175 | ||||||
Fresenius Medical Care US Finance II (B) | ||||||||
5.875%, 01/31/2022 | 190 | 209 | ||||||
5.625%, 07/31/2019 | 240 | 260 | ||||||
4.125%, 10/15/2020 | 100 | 102 | ||||||
Gilead Sciences | ||||||||
3.700%, 04/01/2024 | 1,555 | 1,660 | ||||||
GlaxoSmithKline Capital | ||||||||
5.650%, 05/15/2018 | 810 | 916 | ||||||
HCA | ||||||||
7.500%, 11/15/2095 | 3,800 | 3,743 | ||||||
Humana | ||||||||
7.200%, 06/15/2018 | 1,150 | 1,335 | ||||||
4.625%, 12/01/2042 | 130 | 135 | ||||||
3.850%, 10/01/2024 | 790 | 826 | ||||||
3.150%, 12/01/2022 | 170 | 171 | ||||||
Medtronic | ||||||||
4.450%, 03/15/2020 | 630 | 701 | ||||||
4.375%, 03/15/2035 (B) | 350 | 381 | ||||||
3.625%, 03/15/2024 | 940 | 998 | ||||||
3.500%, 03/15/2025 (B) | 870 | 909 | ||||||
3.150%, 03/15/2022 (B) | 435 | 452 | ||||||
2.500%, 03/15/2020 (B) | 830 | 848 | ||||||
Merck | ||||||||
3.700%, 02/10/2045 | 1,000 | 1,005 | ||||||
2.750%, 02/10/2025 | 400 | 400 | ||||||
2.350%, 02/10/2022 | 855 | 856 | ||||||
Mylan | ||||||||
5.400%, 11/29/2043 | 230 | 266 | ||||||
2.550%, 03/28/2019 | 660 | 663 | ||||||
Perrigo | ||||||||
4.000%, 11/15/2023 | 370 | 387 | ||||||
Perrigo Finance | ||||||||
3.900%, 12/15/2024 | 535 | 554 | ||||||
3.500%, 12/15/2021 | 235 | 243 | ||||||
Roche Holdings | ||||||||
6.000%, 03/01/2019 (B) | 253 | 293 | ||||||
Thermo Fisher Scientific | ||||||||
5.300%, 02/01/2044 | 50 | 60 | ||||||
3.600%, 08/15/2021 | 350 | 365 | ||||||
3.300%, 02/15/2022 | 395 | 405 | ||||||
3.200%, 03/01/2016 | 435 | 444 | ||||||
| 64 | SEI Institutional Managed Trust / Semi-Annual Report / March 31, 2015 |
| Description | Face Amount ($ Thousands) | Market Value ($ Thousands) | ||||||
UnitedHealth Group | ||||||||
6.875%, 02/15/2038 | $ | 510 | $ | 734 | ||||
6.000%, 06/15/2017 | 51 | 57 | ||||||
5.800%, 03/15/2036 | 280 | 361 | ||||||
3.875%, 10/15/2020 | 530 | 580 | ||||||
2.875%, 12/15/2021 | 735 | 755 | ||||||
VRX Escrow | ||||||||
5.375%, 03/15/2020 (B) | 950 | 958 | ||||||
Wyeth LLC | ||||||||
5.950%, 04/01/2037 | 960 | 1,229 | ||||||
Zimmer Holdings | ||||||||
3.550%, 04/01/2025 | 535 | 546 | ||||||
Zoetis | ||||||||
3.250%, 02/01/2023 | 150 | 149 | ||||||
|
| |||||||
| 43,719 | ||||||||
|
| |||||||
Industrials — 1.4% | ||||||||
ABB Finance USA | ||||||||
4.375%, 05/08/2042 | 80 | 90 | ||||||
AerCap Ireland Capital | ||||||||
3.750%, 05/15/2019 (B) | 520 | 522 | ||||||
American Airlines Pass-Through Trust, Ser 2013-2, Cl A | ||||||||
4.950%, 01/15/2023 | 2,290 | 2,481 | ||||||
BAE Systems | ||||||||
4.750%, 10/11/2021 (B) | 1,350 | 1,502 | ||||||
Burlington Northern Santa Fe | ||||||||
4.150%, 04/01/2045 | 1,570 | 1,633 | ||||||
Caterpillar Financial Services MTN | ||||||||
2.750%, 08/20/2021 | 620 | 637 | ||||||
Catholic Health Initiatives | ||||||||
4.350%, 11/01/2042 | 80 | 80 | ||||||
2.950%, 11/01/2022 | 800 | 796 | ||||||
Continental Airlines Pass-Through Trust, | ||||||||
7.256%, 03/15/2020 | 1,835 | 2,046 | ||||||
Continental Airlines Pass-Through Trust, | ||||||||
5.983%, 04/19/2022 | 1,404 | 1,581 | ||||||
Continental Airlines Pass-Through Trust, Ser 2009-1 | ||||||||
9.000%, 07/08/2016 | 2,144 | 2,321 | ||||||
Delta Air Lines Pass-Through Trust, Ser 2007-1, Cl A | ||||||||
6.821%, 08/10/2022 | 1,150 | 1,350 | ||||||
Eaton | ||||||||
4.150%, 11/02/2042 | 440 | 455 | ||||||
2.750%, 11/02/2022 | 950 | 953 | ||||||
1.500%, 11/02/2017 | 270 | 271 | ||||||
| Description | Face Amount ($ Thousands) | Market Value ($ Thousands) | ||||||
FedEx | ||||||||
4.100%, 02/01/2045 | $ | 375 | $ | 375 | ||||
3.200%, 02/01/2025 | 375 | 380 | ||||||
Florida East Coast Holdings | ||||||||
6.750%, 05/01/2019 (B) | 460 | 463 | ||||||
JetBlue Airways Pass-Through Trust, Ser 2004-2, Cl G1 | ||||||||
0.632%, 08/15/2016 (A) | 949 | 941 | ||||||
L-3 Communications | ||||||||
3.950%, 05/28/2024 | 450 | 462 | ||||||
Lockheed Martin | ||||||||
3.800%, 03/01/2045 | 290 | 288 | ||||||
3.350%, 09/15/2021 | 920 | 976 | ||||||
Northrop Grumman | ||||||||
3.850%, 04/15/2045 | 420 | 413 | ||||||
3.250%, 08/01/2023 | 3,135 | 3,232 | ||||||
Parker-Hannifin MTN | ||||||||
3.300%, 11/21/2024 | 425 | 446 | ||||||
Penske Truck Leasing LP (B) | ||||||||
3.375%, 02/01/2022 | 370 | 368 | ||||||
3.050%, 01/09/2020 | 880 | 895 | ||||||
2.500%, 06/15/2019 | 730 | 731 | ||||||
Raytheon | ||||||||
3.125%, 10/15/2020 | 430 | 454 | ||||||
Union Pacific | ||||||||
3.250%, 01/15/2025 | 435 | 456 | ||||||
United Air Lines Pass-Through Trust, Ser 2009-2A | ||||||||
9.750%, 01/15/2017 | 114 | 127 | ||||||
United Technologies | ||||||||
4.500%, 06/01/2042 | 540 | 599 | ||||||
US Airways Pass-Through Trust, Ser 2012-2, Cl A | ||||||||
4.625%, 06/03/2025 | 956 | 1,024 | ||||||
Valmont Industries | ||||||||
5.250%, 10/01/2054 | 300 | 296 | ||||||
Waste Management | ||||||||
7.375%, 05/15/2029 | 330 | 470 | ||||||
3.500%, 05/15/2024 | 310 | 323 | ||||||
West | ||||||||
5.375%, 07/15/2022 (B) | 430 | 420 | ||||||
|
| |||||||
| 30,857 | ||||||||
|
| |||||||
Information Technology — 0.5% | ||||||||
Activision Blizzard | ||||||||
5.625%, 09/15/2021 (B) | 300 | 320 | ||||||
Alibaba Group Holding | ||||||||
3.600%, 11/28/2024 (B) | 275 | 276 | ||||||
Apple | ||||||||
3.850%, 05/04/2043 | 640 | 650 | ||||||
3.450%, 02/09/2045 | 365 | 346 | ||||||
2.850%, 05/06/2021 | 540 | 563 | ||||||
2.500%, 02/09/2025 | 555 | 543 | ||||||
| SEI Institutional Managed Trust / Semi-Annual Report / March 31, 2015 | 65 |
SCHEDULE OF INVESTMENTS (Unaudited)
Core Fixed Income Fund (Continued)
March 31, 2015
| Description | Face Amount ($ Thousands) | Market Value ($ Thousands) | ||||||
Broadcom MTN | ||||||||
4.500%, 08/01/2034 | $ | 120 | $ | 130 | ||||
Keysight Technologies | ||||||||
4.550%, 10/30/2024 (B) | 295 | 297 | ||||||
MasterCard | ||||||||
3.375%, 04/01/2024 | 180 | 190 | ||||||
Microsoft | ||||||||
4.000%, 02/12/2055 | 455 | 454 | ||||||
3.750%, 02/12/2045 | 950 | 954 | ||||||
3.500%, 02/12/2035 | 885 | 883 | ||||||
National Semiconductor | ||||||||
6.600%, 06/15/2017 | 170 | 190 | ||||||
Oracle | ||||||||
2.250%, 10/08/2019 | 370 | 377 | ||||||
1.200%, 10/15/2017 | 1,050 | 1,053 | ||||||
Tencent Holdings MTN (B) | ||||||||
3.800%, 02/11/2025 | 385 | 394 | ||||||
2.875%, 02/11/2020 | 340 | 342 | ||||||
Texas Instruments | ||||||||
2.750%, 03/12/2021 | 470 | 483 | ||||||
TSMC Global | ||||||||
1.625%, 04/03/2018 (B) | 875 | 867 | ||||||
Xerox | ||||||||
4.800%, 03/01/2035 | 125 | 123 | ||||||
2.750%, 09/01/2020 | 370 | 369 | ||||||
|
| |||||||
| 9,804 | ||||||||
|
| |||||||
Materials — 1.1% | ||||||||
Albemarle | ||||||||
5.450%, 12/01/2044 | 380 | 410 | ||||||
Ardagh Packaging Finance | ||||||||
3.271%, 12/15/2019 (A) (B) | 640 | 624 | ||||||
Barrick Gold | ||||||||
4.100%, 05/01/2023 | 1,740 | 1,717 | ||||||
3.850%, 04/01/2022 | 270 | 264 | ||||||
Barrick North America Finance | ||||||||
4.400%, 05/30/2021 | 1,260 | 1,294 | ||||||
BHP Billiton Finance USA | ||||||||
5.000%, 09/30/2043 | 665 | 762 | ||||||
3.850%, 09/30/2023 | 400 | 428 | ||||||
3.250%, 11/21/2021 | 1,400 | 1,462 | ||||||
Celulosa Arauco y Constitucion | ||||||||
4.750%, 01/11/2022 | 520 | 547 | ||||||
Dow Chemical | ||||||||
3.000%, 11/15/2022 | 1,265 | 1,276 | ||||||
Eagle Spinco | ||||||||
4.625%, 02/15/2021 | 380 | 376 | ||||||
Eastman Chemical | ||||||||
4.650%, 10/15/2044 | 240 | 252 | ||||||
3.800%, 03/15/2025 | 520 | 540 | ||||||
2.700%, 01/15/2020 | 815 | 827 | ||||||
Ecolab | ||||||||
4.350%, 12/08/2021 | 220 | 242 | ||||||
| Description | Face Amount ($ Thousands) | Market Value ($ Thousands) | ||||||
FMG Resources August 2006 Pty (B) (D) | ||||||||
8.250%, 11/01/2019 | $ | 200 | $ | 172 | ||||
6.875%, 04/01/2022 | 110 | 81 | ||||||
Freeport-McMoRan | ||||||||
6.875%, 02/15/2023 | 165 | 175 | ||||||
6.500%, 11/15/2020 | 104 | 110 | ||||||
4.550%, 11/14/2024 | 375 | 360 | ||||||
Freeport-McMoRan Copper | ||||||||
3.100%, 03/15/2020 (D) | 470 | 458 | ||||||
Glencore Finance Canada (B) | ||||||||
2.700%, 10/25/2017 | 810 | 822 | ||||||
2.050%, 10/23/2015 | 1,318 | 1,324 | ||||||
Hexion US Finance | ||||||||
6.625%, 04/15/2020 | 360 | 329 | ||||||
LYB International Finance BV | ||||||||
4.875%, 03/15/2044 | 230 | 247 | ||||||
LyondellBasell Industries | ||||||||
5.750%, 04/15/2024 | 200 | 236 | ||||||
4.625%, 02/26/2055 | 225 | 224 | ||||||
Mosaic | ||||||||
5.625%, 11/15/2043 | 210 | 249 | ||||||
5.450%, 11/15/2033 | 170 | 196 | ||||||
Potash Corp of Saskatchewan | ||||||||
4.875%, 03/30/2020 (D) | 280 | 315 | ||||||
Rio Tinto Finance USA | ||||||||
6.500%, 07/15/2018 | 810 | 931 | ||||||
Rio Tinto Finance USA PLC | ||||||||
9.000%, 05/01/2019 | 300 | 380 | ||||||
2.875%, 08/21/2022 | 175 | 174 | ||||||
2.250%, 12/14/2018 | 200 | 203 | ||||||
Rock-Tenn | ||||||||
4.000%, 03/01/2023 | 70 | 74 | ||||||
3.500%, 03/01/2020 | 320 | 332 | ||||||
Southern Copper | ||||||||
5.250%, 11/08/2042 | 1,550 | 1,413 | ||||||
Steel Dynamics | ||||||||
6.375%, 08/15/2022 | 510 | 544 | ||||||
Teck Resources | ||||||||
3.750%, 02/01/2023 | 210 | 197 | ||||||
Vale Overseas | ||||||||
8.250%, 01/17/2034 | 140 | 156 | ||||||
6.875%, 11/21/2036 | 1,510 | 1,461 | ||||||
4.375%, 01/11/2022 (D) | 1,789 | 1,720 | ||||||
|
| |||||||
| 23,904 | ||||||||
|
| |||||||
Telecommunication Services — 1.4% |
| |||||||
Altice Financing | ||||||||
6.625%, 02/15/2023 (B) | 600 | 618 | ||||||
America Movil | ||||||||
5.625%, 11/15/2017 | 440 | 486 | ||||||
5.000%, 03/30/2020 | 750 | 850 | ||||||
3.125%, 07/16/2022 | 730 | 742 | ||||||
| 66 | SEI Institutional Managed Trust / Semi-Annual Report / March 31, 2015 |
| Description | Face Amount ($ Thousands) | Market Value ($ Thousands) | ||||||
AT&T | ||||||||
6.500%, 09/01/2037 | $ | 765 | $ | 937 | ||||
6.450%, 06/15/2034 | 625 | 771 | ||||||
5.550%, 08/15/2041 | 200 | 225 | ||||||
4.350%, 06/15/2045 | 400 | 383 | ||||||
4.300%, 12/15/2042 | 130 | 124 | ||||||
3.900%, 03/11/2024 (D) | 490 | 513 | ||||||
3.000%, 02/15/2022 | 470 | 472 | ||||||
Bharti Airtel International Netherlands BV | ||||||||
5.350%, 05/20/2024 (B) | 295 | 325 | ||||||
CenturyLink | ||||||||
5.625%, 04/01/2020 | 240 | 252 | ||||||
5.625%, 04/01/2025 (B) | 350 | 351 | ||||||
Deutsche Telekom International Finance | ||||||||
2.250%, 03/06/2017 (B) | 905 | 921 | ||||||
Intelsat Jackson Holdings | ||||||||
7.500%, 04/01/2021 | 380 | 391 | ||||||
Sprint | ||||||||
7.875%, 09/15/2023 | 320 | 326 | ||||||
7.625%, 02/15/2025 | 610 | 607 | ||||||
Sprint Capital | ||||||||
8.750%, 03/15/2032 | 910 | 940 | ||||||
Telecom Italia Capital | ||||||||
7.175%, 06/18/2019 | 40 | 46 | ||||||
Telefonica Chile | ||||||||
3.875%, 10/12/2022 (B) | 200 | 201 | ||||||
Telefonica Emisiones | ||||||||
5.134%, 04/27/2020 | 300 | 339 | ||||||
Telefonica Emisiones SAU | ||||||||
6.221%, 07/03/2017 | 100 | 110 | ||||||
5.877%, 07/15/2019 | 90 | 104 | ||||||
Telstra | ||||||||
3.125%, 04/07/2025 (B) | 115 | 115 | ||||||
Verizon Communications | ||||||||
6.550%, 09/15/2043 | 3,893 | 5,069 | ||||||
6.400%, 09/15/2033 | 1,234 | 1,540 | ||||||
5.150%, 09/15/2023 | 850 | 974 | ||||||
4.862%, 08/21/2046 (B) | 1,495 | 1,565 | ||||||
4.522%, 09/15/2048 (B) | 983 | 979 | ||||||
4.400%, 11/01/2034 | 2,530 | 2,577 | ||||||
4.272%, 01/15/2036 (B) | 335 | 333 | ||||||
4.150%, 03/15/2024 | 310 | 333 | ||||||
3.850%, 11/01/2042 | 130 | 118 | ||||||
3.500%, 11/01/2024 | 340 | 348 | ||||||
3.450%, 03/15/2021 | 450 | 471 | ||||||
3.000%, 11/01/2021 | 2,250 | 2,295 | ||||||
2.500%, 09/15/2016 | 575 | 587 | ||||||
Vodafone Group PLC | ||||||||
2.950%, 02/19/2023 | 905 | 890 | ||||||
|
| |||||||
| 29,228 | ||||||||
|
| |||||||
| Description | Face Amount ($ Thousands) | Market Value ($ Thousands) | ||||||
Utilities — 2.2% | ||||||||
AES | ||||||||
7.375%, 07/01/2021 | $ | 40 | $ | 44 | ||||
4.875%, 05/15/2023 | 920 | 897 | ||||||
Alabama Power | ||||||||
3.750%, 03/01/2045 | 280 | 285 | ||||||
Ameren Illinois | ||||||||
4.300%, 07/01/2044 | 255 | 287 | ||||||
American Electric Power | ||||||||
1.650%, 12/15/2017 | 715 | 719 | ||||||
Berkshire Hathaway Energy | ||||||||
6.500%, 09/15/2037 | 1,160 | 1,570 | ||||||
4.500%, 02/01/2045 | 1,345 | 1,464 | ||||||
Calpine | ||||||||
6.000%, 01/15/2022 (B) | 110 | 118 | ||||||
CenterPoint Energy Houston Electric LLC | ||||||||
4.500%, 04/01/2044 | 800 | 915 | ||||||
Commonwealth Edison | ||||||||
3.700%, 03/01/2045 | 115 | 117 | ||||||
Consolidated Edison of New York | ||||||||
4.625%, 12/01/2054 | 215 | 241 | ||||||
4.450%, 03/15/2044 | 810 | 901 | ||||||
Consumers Energy | ||||||||
4.350%, 08/31/2064 | 215 | 234 | ||||||
Dominion Resources | ||||||||
4.700%, 12/01/2044 | 345 | 384 | ||||||
2.500%, 12/01/2019 | 610 | 620 | ||||||
1.950%, 08/15/2016 | 265 | 268 | ||||||
Duke Energy Carolinas | ||||||||
4.000%, 09/30/2042 | 1,000 | 1,061 | ||||||
Duke Energy Florida | ||||||||
3.850%, 11/15/2042 | 165 | 171 | ||||||
Duquesne Light Holdings | ||||||||
6.400%, 09/15/2020 (B) | 1,450 | 1,720 | ||||||
Electricite de France | ||||||||
6.000%, 01/22/2114 (B) | 410 | 497 | ||||||
Exelon | ||||||||
5.625%, 06/15/2035 | 880 | 1,051 | ||||||
FirstEnergy | ||||||||
2.750%, 03/15/2018 | 280 | 287 | ||||||
FirstEnergy, Ser C | ||||||||
7.375%, 11/15/2031 | 2,965 | 3,765 | ||||||
Florida Gas Transmission LLC | ||||||||
3.875%, 07/15/2022 (B) | 1,000 | 1,034 | ||||||
IPALCO Enterprises | ||||||||
7.250%, 04/01/2016 (B) | 1,340 | 1,400 | ||||||
5.000%, 05/01/2018 | 1,200 | 1,272 | ||||||
KCP&L Greater Missouri Operations | ||||||||
8.270%, 11/15/2021 | 2,700 | 3,403 | ||||||
KeySpan Gas East | ||||||||
5.819%, 04/01/2041 (B) | 1,250 | 1,657 | ||||||
| SEI Institutional Managed Trust / Semi-Annual Report / March 31, 2015 | 67 |
SCHEDULE OF INVESTMENTS (Unaudited)
Core Fixed Income Fund (Continued)
March 31, 2015
| Description | Face Amount ($ Thousands) | Market Value ($ Thousands) | ||||||
Metropolitan Edison | ||||||||
3.500%, 03/15/2023 (B) | $ | 2,425 | $ | 2,471 | ||||
Niagara Mohawk Power | ||||||||
4.278%, 10/01/2034 (B) | 355 | 387 | ||||||
NiSource Finance | ||||||||
6.800%, 01/15/2019 | 2,261 | 2,661 | ||||||
Oncor Electric Delivery LLC | ||||||||
6.800%, 09/01/2018 | 1,075 | 1,255 | ||||||
4.550%, 12/01/2041 | 690 | 778 | ||||||
Pacific Gas & Electric | ||||||||
8.250%, 10/15/2018 | 280 | 342 | ||||||
6.050%, 03/01/2034 | 130 | 170 | ||||||
5.800%, 03/01/2037 | 710 | 901 | ||||||
4.450%, 04/15/2042 | 700 | 769 | ||||||
3.250%, 06/15/2023 | 270 | 279 | ||||||
PacifiCorp | ||||||||
3.600%, 04/01/2024 | 635 | 680 | ||||||
PECO Energy | ||||||||
4.150%, 10/01/2044 | 625 | 689 | ||||||
Potomac Electric Power | ||||||||
4.150%, 03/15/2043 | 300 | 324 | ||||||
3.600%, 03/15/2024 | 305 | 325 | ||||||
PSEG Power LLC | ||||||||
2.750%, 09/15/2016 | 320 | 328 | ||||||
Public Service Electric & Gas MTN | ||||||||
3.050%, 11/15/2024 | 280 | 288 | ||||||
Public Service of Colorado | ||||||||
4.300%, 03/15/2044 | 180 | 205 | ||||||
Public Service of New Hampshire | ||||||||
3.500%, 11/01/2023 | 310 | 330 | ||||||
Public Service of New Mexico | ||||||||
7.950%, 05/15/2018 | 1,265 | 1,485 | ||||||
Puget Energy | ||||||||
6.000%, 09/01/2021 | 790 | 933 | ||||||
PVNGS II Funding | ||||||||
8.000%, 12/30/2015 | 203 | 205 | ||||||
Southern | ||||||||
2.150%, 09/01/2019 | 615 | 619 | ||||||
Southern California Gas | ||||||||
4.450%, 03/15/2044 | 600 | 694 | ||||||
Southwestern Electric Power | ||||||||
3.900%, 04/01/2045 | 300 | 297 | ||||||
3.550%, 02/15/2022 | 230 | 243 | ||||||
Texas-New Mexico Power | ||||||||
6.950%, 04/01/2043 (B) | 880 | 1,346 | ||||||
Virginia Electric & Power | ||||||||
4.650%, 08/15/2043 | 405 | 472 | ||||||
4.450%, 02/15/2044 | 195 | 220 | ||||||
|
| |||||||
| 46,078 | ||||||||
|
| |||||||
Total Corporate Obligations | 577,589 | |||||||
|
| |||||||
| Description | Face Amount ($ Thousands) | Market Value ($ Thousands) | ||||||
ASSET-BACKED SECURITIES — 10.0% |
| |||||||
Automotive — 1.2% | ||||||||
Ally Auto Receivables Trust, | ||||||||
1.320%, 07/15/2016 | $ | 100 | $ | 100 | ||||
Ally Auto Receivables Trust, | ||||||||
0.630%, 05/15/2017 | 112 | 112 | ||||||
Ally Auto Receivables Trust, | ||||||||
0.480%, 02/15/2017 | 827 | 826 | ||||||
Ally Auto Receivables Trust, | ||||||||
1.530%, 04/15/2019 | 1,996 | 2,003 | ||||||
Ally Auto Receivables Trust, | ||||||||
1.840%, 01/15/2020 | 323 | 327 | ||||||
Avis Budget Rental Car Funding AESOP LLC, Ser 2012-3A, Cl A | ||||||||
2.100%, 03/20/2019 (B) | 560 | 567 | ||||||
Avis Budget Rental Car Funding AESOP LLC, Ser 2013-1A, Cl A | ||||||||
1.920%, 09/20/2019 (B) | 1,405 | 1,405 | ||||||
Avis Budget Rental Car Funding AESOP LLC, Ser 2013-2A, Cl A | ||||||||
2.970%, 02/20/2020 (B) | 350 | 362 | ||||||
Bank of The West Auto Trust, Ser 2014-1, Cl A3 | ||||||||
1.090%, 03/15/2019 (B) | 429 | 429 | ||||||
California Republic Auto Receivables Trust, Ser 2014-2, Cl A4 | ||||||||
1.570%, 12/16/2019 | 281 | 282 | ||||||
California Republic Auto Receivables Trust, Ser 2014-3, Cl A4 | ||||||||
1.790%, 03/16/2020 | 281 | 283 | ||||||
California Republic Auto Receivables Trust, Ser 2015-1, Cl A3 | ||||||||
1.330%, 04/15/2019 | 445 | 446 | ||||||
California Republic Auto Receivables Trust, Ser 2015-1, Cl A4 | ||||||||
1.820%, 09/15/2020 | 513 | 516 | ||||||
Capital Auto Receivables Asset Trust, Ser 2013-1, Cl A3 | ||||||||
0.790%, 06/20/2017 | 1,847 | 1,848 | ||||||
Capital Auto Receivables Asset Trust, Ser 2013-2, Cl A4 | ||||||||
1.560%, 07/20/2018 | 429 | 432 | ||||||
Capital Auto Receivables Asset Trust, Ser 2013-3, Cl A3 | ||||||||
1.310%, 12/20/2017 | 9 | 9 | ||||||
| 68 | SEI Institutional Managed Trust / Semi-Annual Report / March 31, 2015 |
| Description | Face Amount ($ Thousands) | Market Value ($ Thousands) | ||||||
Capital Auto Receivables Asset Trust, Ser 2013-3, Cl A4 | ||||||||
1.680%, 04/20/2018 | $ | 264 | $ | 266 | ||||
Capital Auto Receivables Asset Trust, Ser 2013-4, Cl A3 | ||||||||
1.090%, 03/20/2018 | 666 | 666 | ||||||
Capital Auto Receivables Asset Trust, Ser 2013-4, Cl A4 | ||||||||
1.470%, 07/20/2018 | 906 | 910 | ||||||
Capital Auto Receivables Asset Trust, Ser 2014-1, Cl A3 | ||||||||
1.320%, 06/20/2018 | 605 | 607 | ||||||
Capital Auto Receivables Asset Trust, Ser 2014-1, Cl A4 | ||||||||
1.690%, 10/22/2018 | 525 | 529 | ||||||
Capital Auto Receivables Asset Trust, Ser 2014-2, Cl A1 | ||||||||
0.476%, 06/20/2016 (A) | 1,048 | 1,048 | ||||||
Capital Auto Receivables Asset Trust, Ser 2014-2, Cl A3 | ||||||||
1.260%, 05/21/2018 | 933 | 934 | ||||||
Capital Auto Receivables Asset Trust, Ser 2014-2, Cl A4 | ||||||||
1.620%, 10/22/2018 | 266 | 268 | ||||||
Capital Auto Receivables Asset Trust, Ser 2014-3, Cl A3 | ||||||||
1.480%, 11/20/2018 | 1,188 | 1,192 | ||||||
Capital Auto Receivables Asset Trust, Ser 2014-3, Cl A4 | ||||||||
1.830%, 04/22/2019 | 243 | 245 | ||||||
Capital Auto Receivables Asset Trust, Ser 2015-1, Cl A2 | ||||||||
1.420%, 06/20/2018 | 1,272 | 1,271 | ||||||
Capital Auto Receivables Asset Trust, Ser 2015-1, Cl A3 | ||||||||
1.610%, 06/20/2019 | 678 | 678 | ||||||
Capital Auto Receivables Asset Trust, Ser 2015-1, Cl A4 | ||||||||
1.860%, 10/21/2019 | 394 | 394 | ||||||
Ford Credit Auto Owner Trust, Ser 2013-B, Cl A3 | ||||||||
0.570%, 10/15/2017 | 565 | 565 | ||||||
Ford Credit Auto Owner Trust, Ser 2014-1, Cl A | ||||||||
2.260%, 11/15/2025 (B) | 2,554 | 2,601 | ||||||
Ford Credit Auto Owner Trust, Ser 2014-2, Cl A | ||||||||
2.310%, 04/15/2026 (B) | 897 | 910 | ||||||
Ford Credit Auto Owner Trust, Ser 2015-1, Cl A | ||||||||
2.120%, 07/15/2026 (B) | 965 | 973 | ||||||
Ford Credit Auto Owner Trust, Ser 2015-A, Cl A4 | ||||||||
1.640%, 06/15/2020 | 269 | 270 | ||||||
| Description | Face Amount ($ Thousands) | Market Value ($ Thousands) | ||||||
Honda Auto Receivables Owner Trust, Ser 2013-3, Cl A3 | ||||||||
0.770%, 05/15/2017 | $ | 655 | $ | 656 | ||||
Honda Auto Receivables Owner Trust, Ser 2014-4, Cl A4 | ||||||||
1.460%, 10/15/2020 | 232 | 233 | ||||||
Hyundai Auto Receivables Trust, Ser 2011-C, Cl A4 | ||||||||
1.300%, 02/15/2018 | 291 | 292 | ||||||
MMCA Automobile Trust, | ||||||||
2.020%, 10/17/2016 (B) | 4 | 4 | ||||||
|
| |||||||
| 25,459 | ||||||||
|
| |||||||
Credit Cards — 0.9% | ||||||||
American Express Credit Account Secured Note Trust, | ||||||||
0.415%, 05/15/2020 (A) | 714 | 712 | ||||||
BA Credit Card Trust, | ||||||||
0.215%, 11/15/2019 (A) | 819 | 814 | ||||||
BA Credit Card Trust, | ||||||||
0.445%, 09/16/2019 (A) | 1,314 | 1,314 | ||||||
BA Credit Card Trust, | ||||||||
0.462%, 01/15/2020 (A) | 468 | 468 | ||||||
Capital One Multi-Asset Execution Trust, Ser 2005-A9, Cl A | ||||||||
0.265%, 08/15/2018 (A) | 3,306 | 3,305 | ||||||
Capital One Multi-Asset Execution Trust, Ser 2015-A1, Cl A | ||||||||
1.390%, 01/15/2021 | 1,668 | 1,669 | ||||||
Citibank Credit Card Issuance Trust, Ser 2014-A6, Cl A6 | ||||||||
2.150%, 07/15/2021 | 4,420 | 4,490 | ||||||
Discover Card Execution Note Trust, Ser 2014-A1, Cl A1 | ||||||||
0.605%, 07/15/2021 (A) | 825 | 827 | ||||||
Discover Card Execution Note Trust, Ser 2015-A1, Cl A1 | ||||||||
0.525%, 08/17/2020 (A) | 2,371 | 2,372 | ||||||
GE Capital Credit Card Master Note Trust, Ser 2012-5, Cl A | ||||||||
0.950%, 06/15/2018 | 1,670 | 1,671 | ||||||
MBNA Credit Card Master Note Trust, Ser 2004-A3, Cl A3 | ||||||||
0.435%, 08/16/2021 (A) | 1,283 | 1,277 | ||||||
World Financial Network Credit Card Master Trust, Ser 2014-B, Cl A | ||||||||
0.610%, 07/15/2019 | 551 | 551 | ||||||
|
| |||||||
| 19,470 | ||||||||
|
| |||||||
| SEI Institutional Managed Trust / Semi-Annual Report / March 31, 2015 | 69 |
SCHEDULE OF INVESTMENTS (Unaudited)
Core Fixed Income Fund (Continued)
March 31, 2015
| Description | Face Amount ($ Thousands) | Market Value ($ Thousands) | ||||||
Mortgage Related Securities — 1.3% |
| |||||||
AFC Home Equity Loan Trust, Ser 1998-1, Cl 1A2 | ||||||||
0.841%, 04/25/2028 (A) | $ | 13 | $ | 12 | ||||
AFC Home Equity Loan Trust, Ser 2000-1, Cl 2A | ||||||||
0.814%, 03/25/2030 (A) | 2,060 | 1,341 | ||||||
Bear Stearns Asset-Backed Securities Trust, Ser 2005-SD1, Cl 1A3 | ||||||||
0.571%, 08/25/2043 (A) | 1,112 | 1,096 | ||||||
Centex Home Equity, | ||||||||
0.421%, 06/25/2036 (A) | 4,917 | 4,429 | ||||||
Citigroup Mortgage Loan Trust, Ser 2006-HE2, Cl A2D | ||||||||
0.411%, 08/25/2036 (A) | 4,200 | 3,484 | ||||||
Contimortgage Home Equity Trust, Ser 1997-2, Cl A9 | ||||||||
7.090%, 04/15/2028 | — | — | ||||||
EMC Mortgage Loan Trust, | ||||||||
1.114%, 05/25/2039 (A) (B) | 588 | 561 | ||||||
Home Loan Trust, | ||||||||
8.290%, 02/25/2025 | 83 | 83 | ||||||
HSBC Home Equity Loan Trust, Ser 2006-4, Cl A4 | ||||||||
0.406%, 03/20/2036 (A) | 2,950 | 2,922 | ||||||
Master Asset-Backed Securities Trust, Ser 2005-WF1, Cl A2D | ||||||||
0.544%, 06/25/2035 (A) | 110 | 110 | ||||||
Master Asset-Backed Securities Trust, Ser 2007-HE1, Cl A4 | ||||||||
0.454%, 05/25/2037 (A) | 5,500 | 3,653 | ||||||
New Century Home Equity Loan Trust, Ser 2005-2, Cl M1 | ||||||||
0.601%, 06/25/2035 (A) | 3,058 | 3,049 | ||||||
New Century Home Equity Loan Trust, Ser 2005-3, Cl M2 | ||||||||
0.661%, 07/25/2035 (A) | 3,500 | 3,341 | ||||||
Soundview Home Equity Loan Trust, Ser 2006-EQ2, Cl A3 | ||||||||
0.331%, 01/25/2037 (A) | 5,445 | 3,742 | ||||||
|
| |||||||
| 27,823 | ||||||||
|
| |||||||
Other Asset-Backed Securities — 6.6% |
| |||||||
Academic Loan Funding Trust, Ser 2012-1A, Cl A2 | ||||||||
1.274%, 12/27/2044 (A) (B) | 2,100 | 2,122 | ||||||
Ally Master Owner Trust, | ||||||||
1.540%, 09/15/2019 | 1,952 | 1,959 | ||||||
| Description | Face Amount ($ Thousands) | Market Value ($ Thousands) | ||||||
Ally Master Owner Trust, | ||||||||
1.430%, 06/17/2019 | $ | 2,322 | $ | 2,334 | ||||
Ally Master Owner Trust, | ||||||||
0.665%, 10/15/2019 (A) | 1,521 | 1,521 | ||||||
Ally Master Owner Trust, | ||||||||
0.742%, 01/15/2021 (A) | 608 | 608 | ||||||
Brazos Higher Education Authority, Ser 2010-1, Cl A2 | ||||||||
1.433%, 02/25/2035 (A) | 2,200 | 2,281 | ||||||
Brazos Higher Education Authority, Ser 2011-2, Cl A3 | ||||||||
1.256%, 10/27/2036 (A) | 1,750 | 1,772 | ||||||
Carrington Mortgage Loan Trust, Ser 2005-NC4, Cl A3 | ||||||||
0.571%, 09/25/2035 (A) | 754 | 748 | ||||||
Centerpoint Energy Transition Bond III, Ser 2008-A, Cl A1 | ||||||||
4.192%, 02/01/2020 | 407 | 419 | ||||||
CIT Education Loan Trust, | ||||||||
0.357%, 03/25/2042 (A) (B) | 1,524 | 1,460 | ||||||
Citicorp Residential Mortgage Trust, Ser 2007-1, Cl A5 | ||||||||
5.953%, 03/25/2037 | 1,970 | 1,921 | ||||||
CNH Equipment Trust, | ||||||||
0.490%, 06/15/2017 | 142 | 142 | ||||||
Conseco Finance Home Improvement Loan Trust, Ser 2000-E, Cl M1 | ||||||||
8.130%, 08/15/2031 (A) | 22 | 22 | ||||||
Conseco Financial, Ser 1993-4, Cl A5 | ||||||||
7.050%, 01/15/2019 | 115 | 118 | ||||||
Consumer Credit Origination Loan Trust, Ser 2015-1, Cl A | ||||||||
2.820%, 03/15/2021 (B) | 620 | 623 | ||||||
Countrywide Asset-Backed Certificates, Ser 2003-BC2, Cl 2A1 | ||||||||
0.774%, 06/25/2033 (A) | 38 | 32 | ||||||
Countrywide Asset-Backed Certificates, Ser 2007-13, Cl 2A2 | ||||||||
0.971%, 10/25/2047 (A) | 3,771 | 3,392 | ||||||
Countrywide Home Equity Loan Trust, Ser 2006-HW, Cl 2A1B | ||||||||
0.305%, 11/15/2036 (A) | 137 | 119 | ||||||
Credit-Based Asset Servicing and Securities, Ser 2006-CB3, Cl AV4 | ||||||||
0.431%, 03/25/2036 (A) | 5,000 | 3,333 | ||||||
| 70 | SEI Institutional Managed Trust / Semi-Annual Report / March 31, 2015 |
| Description | Face Amount ($ Thousands) | Market Value ($ Thousands) | ||||||
CWABS Revolving Home Equity Loan Trust, Ser 2004-K, Cl 2A | ||||||||
0.475%, 02/15/2034 (A) | $ | 395 | $ | 353 | ||||
Educational Funding of the South, Ser 2011-1, Cl A2 | ||||||||
0.906%, 04/25/2035 (A) | 1,998 | 1,992 | ||||||
First Franklin Mortgage Loan Trust, Ser 2005-FF8, Cl M1 | ||||||||
0.664%, 09/25/2035 (A) | 3,700 | 3,578 | ||||||
Ford Credit Floorplan Master Owner Trust, Ser 2012-2, Cl A | ||||||||
1.920%, 01/15/2019 | 1,022 | 1,037 | ||||||
Ford Credit Floorplan Master Owner Trust, Ser 2013-5, Cl A1 | ||||||||
1.500%, 09/15/2018 | 270 | 272 | ||||||
Ford Credit Floorplan Master Owner Trust, Ser 2014-1, Cl A1 | ||||||||
1.200%, 02/15/2019 | 759 | 761 | ||||||
Ford Credit Floorplan Master Owner Trust, Ser 2014-1, Cl A2 | ||||||||
0.575%, 02/15/2019 (A) | 262 | 263 | ||||||
Ford Credit Floorplan Master Owner Trust, Ser 2014-4, Cl A1 | ||||||||
1.400%, 08/15/2019 | 1,220 | 1,223 | ||||||
Ford Credit Floorplan Master Owner Trust, Ser 2015-1, Cl A2 | ||||||||
0.575%, 01/15/2020 (A) | 210 | 210 | ||||||
Ford Credit Floorplan Master Owner Trust, Ser 2015-2, Cl A2 | ||||||||
0.745%, 01/15/2022 (A) | 1,600 | 1,602 | ||||||
Global SC Finance, | ||||||||
3.090%, 07/17/2029 (B) | 1,811 | 1,806 | ||||||
Green Tree, Ser 2008-MH1, Cl A2 | ||||||||
8.970%, 04/25/2038 (A) (B) | 931 | 974 | ||||||
Green Tree, Ser 2008-MH1, Cl A3 | ||||||||
8.970%, 04/25/2038 (A) (B) | 741 | 775 | ||||||
Greenpoint Manufactured Housing, Ser 1999-2, Cl A2 | ||||||||
2.902%, 03/18/2029 (A) | 500 | 436 | ||||||
Greenpoint Manufactured Housing, Ser 1999-3, Cl 1A7 | ||||||||
7.270%, 06/15/2029 | 1,024 | 1,032 | ||||||
Greenpoint Manufactured Housing, Ser 1999-3, Cl 2A2 | ||||||||
3.500%, 06/19/2029 (A) | 300 | 258 | ||||||
| Description | Face Amount ($ Thousands) | Market Value ($ Thousands) | ||||||
Greenpoint Manufactured Housing, Ser 1999-4, Cl A2 | ||||||||
3.674%, 02/20/2030 (A) | $ | 375 | $ | 323 | ||||
Greenpoint Manufactured Housing, Ser 2001-2, Cl IA2 | ||||||||
3.666%, 02/20/2032 (A) | 300 | 275 | ||||||
Greenpoint Manufactured Housing, Ser 2001-2, Cl IIA2 | ||||||||
3.667%, 03/13/2032 (A) | 450 | 407 | ||||||
GSAMP Trust, Ser 2003-SEA, Cl A1 | ||||||||
0.571%, 02/25/2033 (A) | 1,599 | 1,489 | ||||||
GSAMP Trust, Ser 2006-HE3, Cl A2D | ||||||||
0.421%, 05/25/2046 (A) | 3,300 | 2,325 | ||||||
GSAMP Trust, Ser 2006-SEA1, Cl A | ||||||||
0.468%, 05/25/2036 (A) (B) | 133 | 131 | ||||||
Higher Education Funding, | ||||||||
1.311%, 05/25/2034 (A) (B) | 1,579 | 1,596 | ||||||
HLSS Servicer Advance Receivables Trust, Ser 2013-T7, Cl AT7 | ||||||||
1.981%, 11/15/2046 (B) | 890 | 882 | ||||||
HSI Asset Securitization Trust, Ser 2006-OPT3, Cl 3A3 | ||||||||
0.354%, 02/25/2036 (A) | 556 | 518 | ||||||
ING Investment Management, Ser 2014-1A, Cl A1 | ||||||||
1.757%, 04/18/2026 (A) (B) | 1,780 | 1,774 | ||||||
JGWPT XXX LLC, Ser 2013-3A, Cl A | ||||||||
4.080%, 01/17/2073 (B) | 994 | 1,059 | ||||||
JGWPT XXXII, Ser 2014-2A, Cl A | ||||||||
3.610%, 01/17/2073 (B) | 1,319 | 1,382 | ||||||
Lehman ABS Manufactured Housing Contract Trust, Ser 2001-B, Cl A4 | ||||||||
5.270%, 09/15/2018 | 811 | 863 | ||||||
Mid-State Trust, Ser 2003-11, Cl A1 | ||||||||
4.864%, 07/15/2038 | 2,524 | 2,680 | ||||||
National Collegiate Student Loan Trust, Ser 2005-1, Cl A4 | ||||||||
0.414%, 11/27/2028 (A) | 654 | 642 | ||||||
National Collegiate Student Loan Trust, Ser 2005-3, Cl A4 | ||||||||
0.454%, 04/25/2029 (A) | 490 | 479 | ||||||
National Collegiate Student Loan Trust, Ser 2006-3, Cl A4 | ||||||||
0.444%, 03/26/2029 (A) | 1,750 | 1,593 | ||||||
National Collegiate Student Loan Trust, Ser 2007-4, Cl A3L | ||||||||
1.024%, 03/25/2038 (A) | 4,460 | 3,296 | ||||||
| SEI Institutional Managed Trust / Semi-Annual Report / March 31, 2015 | 71 |
SCHEDULE OF INVESTMENTS (Unaudited)
Core Fixed Income Fund (Continued)
March 31, 2015
| Description | Face Amount ($ Thousands) | Market Value ($ Thousands) | ||||||
Navient Private Education Loan Trust, Ser 2014-AA, Cl A2A | ||||||||
2.740%, 02/15/2029 (B) | $ | 1,542 | $ | 1,553 | ||||
Navient Private Education Loan Trust, Ser 2015-AA, Cl A2A | ||||||||
2.650%, 12/15/2028 (B) | 542 | 542 | ||||||
Navient Private Education Loan Trust, Ser 2015-AA, Cl A2B | ||||||||
1.403%, 12/15/2028 (A) (B) | 808 | 809 | ||||||
Navient Student Loan Trust, | ||||||||
0.484%, 03/27/2023 (A) | 529 | 528 | ||||||
Navient Student Loan Trust, | ||||||||
0.684%, 06/25/2031 (A) | 3,320 | 3,301 | ||||||
Navient Student Loan Trust, | ||||||||
0.814%, 03/25/2043 (A) | 3,177 | 3,162 | ||||||
Navient Student Loan Trust, | ||||||||
0.794%, 02/25/2043 (A) | 3,172 | 3,153 | ||||||
Navient Student Loan Trust, | ||||||||
0.794%, 03/25/2043 (A) | 2,391 | 2,376 | ||||||
Navient Student Loan Trust, | ||||||||
0.614%, 04/25/2023 (A) | 550 | 550 | ||||||
Nelnet Student Loan Trust, | ||||||||
0.436%, 10/27/2036 (A) | 807 | 798 | ||||||
Nelnet Student Loan Trust, | ||||||||
0.416%, 01/25/2037 (A) | 758 | 749 | ||||||
Nelnet Student Loan Trust, | ||||||||
0.366%, 10/25/2033 (A) | 746 | 729 | ||||||
Nelnet Student Loan Trust, | ||||||||
0.365%, 03/23/2037 (A) | 708 | 690 | ||||||
Nelnet Student Loan Trust, | ||||||||
0.385%, 12/24/2035 (A) | 768 | 753 | ||||||
Nelnet Student Loan Trust, | ||||||||
0.352%, 11/23/2022 (A) | 210 | 210 | ||||||
Nelnet Student Loan Trust, | ||||||||
0.336%, 10/26/2026 (A) | 723 | 722 | ||||||
Nelnet Student Loan Trust, | ||||||||
0.974%, 04/25/2046 (A) (B) | 327 | 331 | ||||||
Nelnet Student Loan Trust, | ||||||||
0.774%, 10/27/2036 (A) (B) | 2,138 | 2,147 | ||||||
| Description | Face Amount ($ Thousands) | Market Value ($ Thousands) | ||||||
Nelnet Student Loan Trust, | ||||||||
1.121%, 11/25/2043 (A) (B) | $ | 1,655 | $ | 1,661 | ||||
Nelnet Student Loan Trust, | ||||||||
0.821%, 09/25/2042 (A) (B) | 2,960 | 2,960 | ||||||
North Carolina State, Education Assistance Authority, | ||||||||
1.034%, 07/25/2025 (A) | 1,000 | 1,003 | ||||||
Octagon Investment Partners XI Ltd., Ser 2007-1A, Cl A1B | ||||||||
0.522%, 08/25/2021 (A) (B) | 1,508 | 1,487 | ||||||
OHA Credit Partners VII, | ||||||||
1.681%, 11/20/2023 (A) (B) | 1,750 | 1,745 | ||||||
Origen Manufactured Housing, Ser 2006-A, Cl A2 | ||||||||
2.465%, 10/15/2037 (A) | 3,208 | 2,865 | ||||||
Park Place Securities, | ||||||||
1.194%, 09/25/2034 (A) | 1,626 | 1,613 | ||||||
Residential Asset Mortgage Products Trust, Ser 2003-RS11, Cl MII1 | ||||||||
1.263%, 12/25/2033 (A) | 188 | 172 | ||||||
RSB Bondco LLC, | ||||||||
5.820%, 06/28/2019 | 775 | 831 | ||||||
Scholar Funding Trust, | ||||||||
1.156%, 10/28/2043 (A) (B) | 1,034 | 1,040 | ||||||
SLC Student Loan Trust, | ||||||||
0.657%, 05/15/2028 (A) | 270 | 270 | ||||||
SLM Private Education Loan Trust, Ser 2012-D, Cl A2 | ||||||||
2.950%, 02/15/2046 (B) | 1,032 | 1,064 | ||||||
SLM Private Education Loan Trust, Ser 2012-E, Cl A1 | ||||||||
0.925%, 10/16/2023 (A) (B) | 358 | 359 | ||||||
SLM Private Education Loan Trust, Ser 2012-E, Cl A2B | ||||||||
1.925%, 06/15/2045 (A) (B) | 1,227 | 1,261 | ||||||
SLM Private Education Loan Trust, Ser 2013-1, Cl B | ||||||||
1.974%, 11/25/2043 (A) | 245 | 246 | ||||||
SLM Private Education Loan Trust, Ser 2013-B, Cl A1 | ||||||||
0.825%, 07/15/2022 (A) (B) | 275 | 275 | ||||||
SLM Student Loan Trust, | ||||||||
0.551%, 09/15/2022 (A) (B) | 638 | 637 | ||||||
| 72 | SEI Institutional Managed Trust / Semi-Annual Report / March 31, 2015 |
| Description | Face Amount ($ Thousands) | Market Value ($ Thousands) | ||||||
SLM Student Loan Trust, | ||||||||
0.426%, 07/25/2023 (A) | $ | 1,129 | $ | 1,125 | ||||
SLM Student Loan Trust, | ||||||||
0.716%, 01/25/2040 (A) | 155 | 138 | ||||||
SLM Student Loan Trust, | ||||||||
0.756%, 04/25/2024 (A) (B) | 1,331 | 1,332 | ||||||
SLM Student Loan Trust, | ||||||||
0.356%, 04/25/2025 (A) | 93 | 93 | ||||||
SLM Student Loan Trust, | ||||||||
1.456%, 07/27/2026 (A) | 383 | 389 | ||||||
SLM Student Loan Trust, | ||||||||
0.396%, 10/27/2031 (A) | 673 | 654 | ||||||
SLM Student Loan Trust, | ||||||||
0.406%, 10/25/2029 (A) | 613 | 593 | ||||||
SLM Student Loan Trust, | ||||||||
0.376%, 01/27/2025 (A) | 688 | 686 | ||||||
SLM Student Loan Trust, | ||||||||
0.426%, 01/25/2041 (A) | 1,900 | 1,783 | ||||||
SLM Student Loan Trust, | ||||||||
0.356%, 01/25/2021 (A) | 989 | 975 | ||||||
SLM Student Loan Trust, | ||||||||
0.326%, 04/25/2022 (A) | 69 | 69 | ||||||
SLM Student Loan Trust, | ||||||||
0.416%, 01/25/2041 (A) | 1,900 | 1,775 | ||||||
SLM Student Loan Trust, | ||||||||
0.426%, 07/25/2025 (A) | 391 | 342 | ||||||
SLM Student Loan Trust, | ||||||||
1.106%, 04/27/2043 (A) | 480 | 435 | ||||||
SLM Student Loan Trust, | ||||||||
1.456%, 01/25/2029 (A) | 525 | 472 | ||||||
SLM Student Loan Trust, | ||||||||
1.456%, 04/25/2029 (A) | 525 | 489 | ||||||
SLM Student Loan Trust, | ||||||||
2.106%, 04/25/2029 (A) | 525 | 511 | ||||||
SLM Student Loan Trust, | ||||||||
1.556%, 01/25/2018 (A) | 190 | 190 | ||||||
| Description | Face Amount ($ Thousands) | Market Value ($ Thousands) | ||||||
SLM Student Loan Trust, | ||||||||
2.106%, 07/25/2029 (A) | $ | 525 | $ | 511 | ||||
SLM Student Loan Trust, | ||||||||
2.106%, 07/25/2029 (A) | 525 | 510 | ||||||
SLM Student Loan Trust, | ||||||||
2.106%, 07/25/2029 (A) | 525 | 527 | ||||||
SLM Student Loan Trust, | ||||||||
2.506%, 10/25/2029 (A) | 525 | 546 | ||||||
SLM Student Loan Trust, | ||||||||
1.756%, 04/25/2023 (A) | 2,659 | 2,727 | ||||||
SLM Student Loan Trust, | ||||||||
2.506%, 10/25/2029 (A) | 525 | 553 | ||||||
SLM Student Loan Trust, | ||||||||
0.574%, 03/25/2025 (A) | 672 | 671 | ||||||
SLM Student Loan Trust, | ||||||||
0.924%, 05/26/2026 (A) | 385 | 387 | ||||||
SLM Student Loan Trust, | ||||||||
1.174%, 04/27/2043 (A) | 564 | 528 | ||||||
SLM Student Loan Trust, | ||||||||
1.671%, 06/25/2043 (A) | 281 | 277 | ||||||
SLM Student Loan Trust, | ||||||||
0.474%, 05/26/2020 (A) | 551 | 550 | ||||||
SLM Student Loan Trust, | ||||||||
1.674%, 09/25/2043 (A) | 291 | 285 | ||||||
SLM Student Loan Trust, Ser 2013-4, Cl A | ||||||||
0.724%, 06/25/2027 (A) | 1,229 | 1,232 | ||||||
SLM Student Loan Trust, Ser 2013-5, Cl A2 | ||||||||
0.571%, 10/26/2020 (A) | 446 | 447 | ||||||
SLM Student Loan Trust, Ser 2013-6, Cl A2 | ||||||||
0.671%, 02/25/2021 (A) | 236 | 236 | ||||||
SLM Student Loan Trust, Ser 2013-C, Cl A2A | ||||||||
2.940%, 10/15/2031 (B) | 240 | 247 | ||||||
SLM Student Loan Trust, Ser 2013-M1, Cl M1 | ||||||||
3.500%, 10/28/2029 (B) | 1,469 | 1,455 | ||||||
SLM Student Loan Trust, Ser 2014-1, Cl A2 | ||||||||
0.554%, 07/26/2021 (A) | 737 | 736 | ||||||
| SEI Institutional Managed Trust / Semi-Annual Report / March 31, 2015 | 73 |
SCHEDULE OF INVESTMENTS (Unaudited)
Core Fixed Income Fund (Continued)
March 31, 2015
| Description | Face Amount ($ Thousands) | Market Value ($ Thousands) | ||||||
SLM Student Loan Trust, Ser 2014-2, Cl A3 | ||||||||
0.764%, 03/26/2029 (A) | $ | 851 | $ | 854 | ||||
SLM Student Loan Trust, Ser 2014-A, Cl A1 | ||||||||
0.775%, 07/15/2022 (A) (B) | 277 | 277 | ||||||
SLM Student Loan Trust, Ser 2014-A, Cl A2A | ||||||||
2.590%, 01/15/2026 (B) | 421 | 429 | ||||||
SpringCastle America Funding, Ser 2014-AA, Cl A | ||||||||
2.700%, 05/25/2023 (B) | 538 | 539 | ||||||
Structured Asset Securities Mortgage Loan Trust, Ser 2008-BC4, Cl A3 | ||||||||
0.418%, 11/25/2037 (A) | 862 | 847 | ||||||
TAL Advantage, Ser 2006-1A, Cl N | ||||||||
0.366%, 04/20/2021 (A) (B) | 314 | 312 | ||||||
Trade Maps, Ltd., Ser 2013-1A, Cl A | ||||||||
0.875%, 12/10/2018 (A) (B) | 1,400 | 1,399 | ||||||
Voya CLO, Ser 2015-1A, Cl A1 | ||||||||
1.742%, 04/18/2027 (A) (B) | 310 | 310 | ||||||
Wells Fargo Home Equity Asset-Backed SecuritiesTrust, Ser 2006-2, Cl A4 | ||||||||
0.424%, 07/25/2036 (A) | 4,000 | 3,719 | ||||||
|
| |||||||
| 138,966 | ||||||||
|
| |||||||
Total Asset-Backed Securities |
| 211,718 | ||||||
|
| |||||||
U.S. GOVERNMENT AGENCY OBLIGATIONS — 2.8% |
| |||||||
Farmer Mac Guaranteed Notes Trust | ||||||||
5.125%, 04/19/2017 (B) | 3,540 | 3,840 | ||||||
FHLB | ||||||||
0.875%, 05/24/2017 | 40 | 40 | ||||||
0.750%, 05/26/2015 (E) | 3,410 | 3,411 | ||||||
0.044%, 04/22/2015 (C) | 25,985 | 25,984 | ||||||
FICO STRIPS | ||||||||
9.800%, 04/06/2018 | 850 | 1,072 | ||||||
8.600%, 09/26/2019 | 2,490 | 3,251 | ||||||
0.092%, 11/02/2018 (C) | 1,800 | 1,710 | ||||||
0.091%, 08/03/2018 (C) | 1,820 | 1,736 | ||||||
0.090%, 04/06/2018 (C) | 1,270 | 1,229 | ||||||
0.050%, 02/08/2018 (C) | 510 | 492 | ||||||
0.040%, 08/03/2018 (C) | 780 | 749 | ||||||
0.030%, 08/03/2018 (C) | 820 | 784 | ||||||
0.020%, 08/03/2018 (C) | 1,470 | 1,402 | ||||||
0.010%, 05/11/2018 (C) | 3,295 | 3,186 | ||||||
0.000%, 09/26/2019 (C) | 100 | 93 | ||||||
| Description | Face Amount ($ Thousands) (1) | Market Value ($ Thousands) | ||||||
FNMA | ||||||||
4.664%, 10/09/2019 (C) | 2,925 | $ | 2,688 | |||||
2.625%, 09/06/2024 | 561 | 581 | ||||||
Resolution Funding STRIPS (C) | ||||||||
2.235%, 07/15/2020 | 2,630 | 2,397 | ||||||
2.167%, 10/15/2019 | 830 | 772 | ||||||
Tennessee Valley Authority | ||||||||
5.250%, 09/15/2039 | 590 | 773 | ||||||
3.875%, 02/15/2021 | 1,510 | 1,686 | ||||||
2.875%, 09/15/2024 | 1,540 | 1,612 | ||||||
|
| |||||||
Total U.S. Government Agency Obligations | 59,488 | |||||||
|
| |||||||
SOVEREIGN DEBT — 1.4% |
| |||||||
Brazil Notas do Tesouro Nacional, Ser B, BRL | ||||||||
6.000%, 08/15/2050 | BRL | 1,292 | 978 | |||||
Brazil Notas do Tesouro Nacional, Ser F | ||||||||
10.000%, 01/01/2017 | BRL | 12,230 | 3,629 | |||||
Brazilian Government International Bond | ||||||||
5.000%, 01/27/2045 | 235 | 217 | ||||||
Colombia Government International Bond | ||||||||
5.625%, 02/26/2044 | 1,110 | 1,240 | ||||||
5.000%, 06/15/2045 | 240 | 247 | ||||||
Cooperatieve Centrale Raiffeisen-Boerenleenbank | ||||||||
5.750%, 12/01/2043 | 250 | 311 | ||||||
Indonesia Government International Bond MTN | ||||||||
5.875%, 03/13/2020 | 240 | 272 | ||||||
5.875%, 01/15/2024 (B) | 840 | 971 | ||||||
5.125%, 01/15/2045 (B) | 310 | 326 | ||||||
4.875%, 05/05/2021 | 200 | 218 | ||||||
Japan Bank for International Cooperation | ||||||||
2.125%, 02/10/2025 | 350 | 348 | ||||||
Japan Finance Organization for Municipalities | ||||||||
4.000%, 01/13/2021 | 1,800 | 2,001 | ||||||
Mexico Government International Bond | ||||||||
5.750%, 10/12/2110 | 1,068 | 1,164 | ||||||
5.550%, 01/21/2045 | 2,610 | 3,060 | ||||||
4.750%, 03/08/2044 | 1,010 | 1,061 | ||||||
4.600%, 01/23/2046 | 375 | 384 | ||||||
Peruvian Government International Bond | ||||||||
5.625%, 11/18/2050 | 295 | 361 | ||||||
| 74 | SEI Institutional Managed Trust / Semi-Annual Report / March 31, 2015 |
| Description | Face Amount (1) ($ Thousands) | Market Value ($ Thousands) | ||||||
Poland Government International Bond | ||||||||
4.000%, 01/22/2024 | 1,790 | $ | 1,965 | |||||
Portugal Government International Bond MTN | ||||||||
5.125%, 10/15/2024 (B) | 1,350 | 1,493 | ||||||
Province of Manitoba Canada | ||||||||
3.050%, 05/14/2024 | 425 | 451 | ||||||
Republic of Paraguay | ||||||||
6.100%, 08/11/2044 (B) | 325 | 357 | ||||||
Russia Government International Bond | ||||||||
7.500%, 03/31/2030 (B) (D) | 360 | 413 | ||||||
Russian Foreign Bond - Eurobond | ||||||||
7.500%, 03/31/2030 | 833 | 956 | ||||||
4.500%, 04/04/2022 | 400 | 385 | ||||||
Slovakia Government International Bond | ||||||||
4.375%, 05/21/2022 (B) | 1,240 | 1,386 | ||||||
Slovenia Government International Bond (B) | ||||||||
5.850%, 05/10/2023 | 245 | 290 | ||||||
5.500%, 10/26/2022 | 528 | 608 | ||||||
5.250%, 02/18/2024 | 1,015 | 1,165 | ||||||
South Africa Government International Bond | ||||||||
5.875%, 09/16/2025 (D) | 1,380 | 1,580 | ||||||
Turkey Government International Bond | ||||||||
7.000%, 03/11/2019 | 430 | 488 | ||||||
6.250%, 09/26/2022 | 457 | 520 | ||||||
5.750%, 03/22/2024 (D) | 1,120 | 1,245 | ||||||
5.625%, 03/30/2021 | 161 | 176 | ||||||
United Mexican States MTN | ||||||||
6.050%, 01/11/2040 | 248 | 306 | ||||||
|
| |||||||
Total Sovereign Debt | 30,572 | |||||||
|
| |||||||
LOAN PARTICIPATIONS — 0.8% |
| |||||||
Advanced Disposal Service | ||||||||
3.750%, 10/09/2019 | 303 | 299 | ||||||
AMR | ||||||||
3.750%, 06/21/2019 | 640 | 639 | ||||||
Aramark, 1st Lien | ||||||||
3.250%, 02/24/2021 | 283 | 283 | ||||||
Burger King, Cov-Lite, 1st Lien Term Loan B | ||||||||
4.500%, 12/12/2021 | 596 | 602 | ||||||
Charter Communications Operating | ||||||||
4.250%, 09/12/2021 | 690 | 695 | ||||||
| Description | Face Amount (1) ($ Thousands) | Market Value ($ Thousands) | ||||||
CSC Holdings, Term Loan B | ||||||||
2.672%, 04/17/2020 | 409 | $ | 406 | |||||
Energy Future Immediate Holding, 1st Lien Term Loan | ||||||||
4.250%, 06/19/2016 | 2,200 | 2,207 | ||||||
First Data, 1st Lien Term Loan | ||||||||
3.672%, 03/23/2018 | 1,515 | 1,513 | ||||||
3.672%, 09/24/2018 | 1,000 | 999 | ||||||
FMG Resources Property, Cov-Lite, 1st Lien | ||||||||
3.750%, 06/30/2019 | 609 | 549 | ||||||
Gardner Denver, 1st Lien Term Loan | ||||||||
4.250%, 07/30/2020 | 514 | 487 | ||||||
H.J. Heinz | ||||||||
3.250%, 03/27/2019 | 108 | 108 | ||||||
H.J. Heinz, Term Loan B2 | ||||||||
3.500%, 03/27/2020 | 328 | 328 | ||||||
Hilton Hotels, Cov-Lite, 1st Lien Term Loan B | ||||||||
3.500%, 10/26/2020 | 160 | 160 | ||||||
3.500%, 10/26/2020 | 51 | 51 | ||||||
Intelsat Jackson Holdings | ||||||||
3.750%, 06/30/2019 | 671 | 669 | ||||||
Michaels Stores | ||||||||
3.750%, 01/28/2020 | 93 | 93 | ||||||
Michaels Stores, Term Loan B | ||||||||
3.750%, 01/28/2020 | 93 | 93 | ||||||
Michaels Stores, Term Loan, Tranche 1 | ||||||||
3.750%, 01/24/2020 | 285 | 285 | ||||||
MPH Acquisition Holdings | ||||||||
3.750%, 03/31/2021 (A) | 58 | 57 | ||||||
NRG Energy, Term Loan | ||||||||
2.750%, 07/01/2018 | 640 | 638 | ||||||
Par Pharmaceuticals | ||||||||
4.000%, 09/30/2019 | 652 | 651 | ||||||
Party City Holdings | ||||||||
4.000%, 07/27/2019 | 453 | 453 | ||||||
Schaeffler Finances, Term Loan E | ||||||||
4.250%, 05/15/2020 | 400 | 403 | ||||||
Silver II Acquisition, Term Loan | ||||||||
4.000%, 12/13/2019 | 330 | 312 | ||||||
Station Casinao’s, 1st Lien Term Loan | ||||||||
4.250%, 03/01/2020 | 57 | 58 | ||||||
SunGard Data Systems, Term Loan E | ||||||||
4.000%, 03/07/2020 | 713 | 714 | ||||||
Telesat Canada, Term Loan B | ||||||||
3.500%, 03/26/2019 | 488 | 486 | ||||||
Univision Communications | ||||||||
4.000%, 09/29/2014 | 1,716 | 1,712 | ||||||
| SEI Institutional Managed Trust / Semi-Annual Report / March 31, 2015 | 75 |
SCHEDULE OF INVESTMENTS (Unaudited)
Core Fixed Income Fund (Continued)
March 31, 2015
| Description | Face Amount ($ Thousands) | Market Value ($ Thousands) | ||||||
Virgin Media, Term Loan B | ||||||||
3.500%, 02/15/2020 | $ | 740 | $ | 739 | ||||
Wendy’s / Arby’s Group | ||||||||
3.250%, 05/15/2019 | 701 | 699 | ||||||
Windstream, Term Loan B4 | ||||||||
3.500%, 01/10/2020 | 197 | 197 | ||||||
|
| |||||||
Total Loan Participations | 17,585 | |||||||
|
| |||||||
MUNICIPAL BONDS — 0.8% | ||||||||
Brazos, Higher Education Authority, Ser 2006-2, RB | ||||||||
0.269%, 12/26/2024 (A) | 560 | 550 | ||||||
California State, GO | ||||||||
6.200%, 03/01/2019 | 1,775 | 2,050 | ||||||
California State, Build America Project, GO | ||||||||
7.600%, 11/01/2040 | 440 | 693 | ||||||
Clark County, Department of Aviation, Build America Project, Ser C, RB | ||||||||
6.820%, 07/01/2045 | 540 | 790 | ||||||
Houston, Ser A, GO | ||||||||
6.290%, 03/01/2032 | 725 | 919 | ||||||
Illinois State, GO | ||||||||
5.877%, 03/01/2019 | 2,000 | 2,231 | ||||||
5.100%, 06/01/2033 | 1,725 | 1,745 | ||||||
4.350%, 06/01/2018 | 1,000 | 1,045 | ||||||
Los Angeles, Community College District, Build America Project, GO | ||||||||
6.750%, 08/01/2049 | 500 | 753 | ||||||
New Jersey State, Turnpike Authority, Build America Project, Ser C, RB | ||||||||
7.102%, 01/01/2041 | 665 | 973 | ||||||
New York and New Jersey, Port Authority, RB | ||||||||
4.458%, 10/01/2062 | 685 | 749 | ||||||
New York City, GO | ||||||||
6.646%, 12/01/2031 | 900 | 1,076 | ||||||
New York City, Water & Sewer System, RB | ||||||||
5.952%, 06/15/2042 | 750 | 1,024 | ||||||
North Texas, Tollway Authority, Build America Project, Ser B, RB | ||||||||
6.718%, 01/01/2049 | 599 | 893 | ||||||
Ohio State University, Ser A, RB | ||||||||
4.800%, 06/01/2111 | 202 | 225 | ||||||
South Carolina, Student Loan, | ||||||||
0.382%, 12/01/2020 (A) | 528 | 527 | ||||||
|
| |||||||
Total Municipal Bonds | 16,243 | |||||||
|
| |||||||
| Description | Face Amount ($ Thousands)/Shares | Market Value ($ Thousands) | ||||||
COLLATERALIZED DEBT OBLIGATIONS (A) (B) — 0.4% |
| |||||||
Other Asset-Backed Securities — 0.4% |
| |||||||
AMMC CLO XIV Ltd., Ser 2014-14A, Cl A1L | ||||||||
1.706%, 07/27/2026 | $ | 1,650 | $ | 1,643 | ||||
Ballyrock CLO, | ||||||||
1.711%, 10/20/2026 | 450 | 450 | ||||||
Cent CLO, Ser 2013-18A, Cl A | ||||||||
1.377%, 07/23/2025 | 1,600 | 1,571 | ||||||
Eaton Vance CLO, | ||||||||
1.703%, 07/15/2026 | 550 | 548 | ||||||
Flatiron CLO, Ser 2014-1A, Cl A1 | ||||||||
1.637%, 07/17/2026 | 1,600 | 1,590 | ||||||
Latitude CLO II, | ||||||||
0.601%, 12/15/2018 | 494 | 491 | ||||||
Voya CLO, Ser 2014-2A, Cl A1 | ||||||||
1.707%, 07/17/2026 | 1,730 | 1,726 | ||||||
|
| |||||||
Total Collateralized Debt Obligations | 8,019 | |||||||
|
| |||||||
PREFERRED STOCK — 0.0% |
| |||||||
Citigroup Capital XIII, 7.875% (A) | 24,750 | 656 | ||||||
|
| |||||||
Total Preferred Stock | 656 | |||||||
|
| |||||||
U.S. TREASURY OBLIGATIONS — 25.7% |
| |||||||
U.S. Treasury Bills (C) | ||||||||
0.018%, 04/09/2015 | 20 | 20 | ||||||
0.010%, 05/07/2015 | 27 | 27 | ||||||
0.001%, 04/30/2015 | 427 | 427 | ||||||
U.S. Treasury Bonds | ||||||||
4.500%, 08/15/2039 | 742 | 1,016 | ||||||
3.750%, 11/15/2043 | 9,423 | 11,772 | ||||||
3.625%, 08/15/2043 | 2,899 | 3,543 | ||||||
3.125%, 02/15/2042 | 2,900 | 3,242 | ||||||
3.125%, 02/15/2043 | 1,524 | 1,702 | ||||||
3.125%, 08/15/2044 | 533 | 597 | ||||||
3.000%, 11/15/2044 | 6,047 | 6,626 | ||||||
2.875%, 05/15/2043 | 24,880 | 26,509 | ||||||
2.750%, 08/15/2042 | 8,600 | 8,951 | ||||||
2.750%, 11/15/2042 | 8,684 | 9,025 | ||||||
2.500%, 02/15/2045 | 21,534 | 21,335 | ||||||
2.000%, 10/31/2021 | 1,732 | 1,768 | ||||||
1.750%, 09/30/2019 | 30,639 | 31,223 | ||||||
1.625%, 06/30/2019 | 4,562 | 4,633 | ||||||
| 76 | SEI Institutional Managed Trust / Semi-Annual Report / March 31, 2015 |
| Description | Face Amount ($ Thousands) | Market Value ($ Thousands) | ||||||
U.S. Treasury Inflation Protected Securities | ||||||||
2.375%, 01/15/2025 | $ | 3,992 | $ | 4,839 | ||||
2.125%, 02/15/2040 | 919 | 1,227 | ||||||
1.875%, 07/15/2015 | 3,448 | 3,502 | ||||||
1.375%, 02/15/2044 | 15,320 | 18,007 | ||||||
0.750%, 02/15/2042 | 1,303 | 1,318 | ||||||
0.750%, 02/15/2045 | 5,017 | 5,101 | ||||||
0.625%, 01/15/2024 | 2,865 | 2,984 | ||||||
0.625%, 02/15/2043 | 1,901 | 1,862 | ||||||
0.500%, 04/15/2015 | 1,035 | 1,037 | ||||||
0.375%, 07/15/2023 | 7,411 | 7,600 | ||||||
0.250%, 01/15/2025 | 6,192 | 6,234 | ||||||
0.125%, 04/15/2016 | 6,564 | 6,631 | ||||||
0.125%, 04/15/2017 | 3,077 | 3,131 | ||||||
0.125%, 07/15/2024 | 7,219 | 7,216 | ||||||
U.S. Treasury Notes | ||||||||
3.625%, 02/15/2044 | 8,226 | 10,058 | ||||||
3.375%, 05/15/2044 | 486 | 569 | ||||||
3.125%, 04/30/2017 | 7,020 | 7,387 | ||||||
2.875%, 03/31/2018 | 12,800 | 13,166 | ||||||
2.500%, 05/15/2024 | 7,155 | 7,516 | ||||||
2.375%, 08/15/2024 | 4,750 | 4,938 | ||||||
2.250%, 07/31/2021 | 759 | 787 | ||||||
2.125%, 08/31/2020 | 963 | 996 | ||||||
2.125%, 01/31/2021 | 1,465 | 1,512 | ||||||
2.000%, 02/15/2025 | 30,623 | 30,817 | ||||||
1.750%, 02/28/2022 | 1,546 | 1,550 | ||||||
1.750%, 05/15/2023 | 535 | 532 | ||||||
1.625%, 03/31/2019 | 5,613 | 5,708 | ||||||
1.625%, 07/31/2019 | 1,151 | 1,168 | ||||||
1.625%, 08/31/2019 | 5,320 | 5,365 | ||||||
1.625%, 12/31/2019 | 7,020 | 7,109 | ||||||
1.500%, 07/31/2016 | 210 | 213 | ||||||
1.500%, 01/31/2019 | 3,722 | 3,770 | ||||||
1.500%, 05/31/2019 | 5,256 | 5,313 | ||||||
1.500%, 10/31/2019 | 4,637 | 4,674 | ||||||
1.500%, 11/30/2019 | 3,901 | 3,931 | ||||||
1.500%, 01/31/2022 | 6,543 | 6,459 | ||||||
1.375%, 02/29/2020 | 14,106 | 14,109 | ||||||
1.375%, 03/31/2020 | 16,732 | 16,732 | ||||||
1.250%, 01/31/2020 | 863 | 858 | ||||||
1.000%, 09/15/2017 | 4,060 | 4,088 | ||||||
1.000%, 02/15/2018 | 1,653 | 1,660 | ||||||
1.000%, 03/15/2018 | 5,987 | 6,009 | ||||||
0.875%, 09/15/2016 | 9,025 | 9,083 | ||||||
0.875%, 01/31/2017 (D) | 9,627 | 9,643 | ||||||
0.875%, 05/15/2017 | 11,491 | 11,556 | ||||||
0.875%, 07/15/2017 | 9,995 | 10,045 | ||||||
0.875%, 08/15/2017 | 12,706 | 12,764 | ||||||
0.875%, 10/15/2017 | 2,947 | 2,957 | ||||||
0.875%, 11/15/2017 | 16,719 | 16,763 | ||||||
0.625%, 10/15/2016 | 1,517 | 1,521 | ||||||
| Description | Face Amount ($ Thousands)/ | Market Value ($ Thousands) | ||||||
0.625%, 12/31/2016 | $ | 16,994 | $ | 17,035 | ||||
0.625%, 02/15/2017 | 1,372 | 1,374 | ||||||
0.625%, 08/31/2017 | 14,512 | 14,486 | ||||||
0.625%, 09/30/2017 | 10,255 | 10,228 | ||||||
0.625%, 11/30/2017 | 4,285 | 4,267 | ||||||
0.500%, 06/30/2016 | 496 | 497 | ||||||
0.500%, 09/30/2016 | 4,661 | 4,666 | ||||||
0.500%, 02/28/2017 | 16,965 | 16,954 | ||||||
0.500%, 03/31/2017 | 24,936 | 24,908 | ||||||
U.S. Treasury STRIPS (C) | ||||||||
2.818%, 11/15/2027 | 5,175 | 3,877 | ||||||
2.672%, 05/15/2044 | 2,060 | 963 | ||||||
|
| |||||||
Total U.S. Treasury Obligations | 543,686 | |||||||
|
| |||||||
AFFILIATED PARTNERSHIP — 0.8% |
| |||||||
SEI Liquidity Fund, L.P. 0.070%**† (F) | 15,886,973 | 15,887 | ||||||
|
| |||||||
Total Affiliated Partnership | 15,887 | |||||||
|
| |||||||
CASH EQUIVALENT — 6.4% |
| |||||||
SEI Daily Income Trust, Prime Obligation Fund, Cl A 0.010%**† | 135,113,533 | 135,114 | ||||||
|
| |||||||
Total Cash Equivalent | 135,114 | |||||||
|
| |||||||
Total Investments — 108.9% | 2,305,366 | |||||||
|
| |||||||
PURCHASED OPTIONS*†† — 0.0% |
| |||||||
December 2015, Eurodollar Future Option Call , | 78 | 6 | ||||||
December 2015, Eurodollar Future Option Put, | 78 | 6 | ||||||
May 2015, U.S. 5-Year Treasury Note Option Call, | 92 | 81 | ||||||
May 2015, U.S. 5-Year | 23 | 2 | ||||||
|
| |||||||
Total Purchased Options | 95 | |||||||
|
| |||||||
| SEI Institutional Managed Trust / Semi-Annual Report / March 31, 2015 | 77 |
SCHEDULE OF INVESTMENTS (Unaudited)
Core Fixed Income Fund (Continued)
March 31, 2015
| Description | Contracts | Market Value ($ Thousands) | ||||||
PURCHASED SWAPTION*†† — 0.0% |
| |||||||
January 2019, 5 year/30 year Put, Expires: 01/14/2019, | 3,685 | $ | 66 | |||||
|
| |||||||
Total Purchased Swaption | 66 | |||||||
|
| |||||||
WRITTEN OPTIONS*†† — 0.0% |
| |||||||
December 2015, Eurodollar Future Option Call, | (78 | ) | (20 | ) | ||||
December 2015, IMM Eurodollar Future Option Call, | (78 | ) | (38 | ) | ||||
June 2015, Eurodollar | (60 | ) | (7 | ) | ||||
June 2015, U.S. 10-Year | (25 | ) | (17 | ) | ||||
June 2015, U.S. 10-Year | (24 | ) | (13 | ) | ||||
June 2015, U.S. 10-Year | (126 | ) | (51 | ) | ||||
June 2015, U.S. 10-Year | (92 | ) | (22 | ) | ||||
June 2015, U.S. 10-Year | (126 | ) | (8 | ) | ||||
May 2015, U.S. 10-Year | (33 | ) | (41 | ) | ||||
May 2015, U.S. 10-Year | (155 | ) | (34 | ) | ||||
May 2015, U.S. 10-Year | (63 | ) | (1 | ) | ||||
| Description | Contracts | Market Value ($ Thousands) | ||||||
May 2015, U.S. 5-Year | (115 | ) | $ | (36 | ) | |||
|
| |||||||
Total Written Options |
| (288 | ) | |||||
|
| |||||||
WRITTEN SWAPTION — 0.0% |
| |||||||
United States — 0.0% | ||||||||
January 2019, 5 Year/30 Year Put, Expires: 01/19/2019, | (13,905 | ) | (87 | ) | ||||
|
| |||||||
Total Written Swaption |
| $ | (87 | ) | ||||
|
| |||||||
The open futures contracts held by the Fund at March 31, 2015, are as follows:
| Type of Contract | Number of Contracts Long (Short) | Expiration Date | Unrealized Appreciation (Depreciation) ($ Thousands) | |||||||||
90-Day Euro$ | 34 | Dec-2015 | $ | 4 | ||||||||
90-Day Euro$ | 206 | Dec-2016 | 163 | |||||||||
90-Day Euro$ | (30 | ) | Dec-2017 | (72 | ) | |||||||
90-Day Euro$ | 161 | Jun-2016 | 181 | |||||||||
90-Day Euro$ | 52 | Jun-2017 | 6 | |||||||||
90-Day Euro$ | (52 | ) | Jun-2018 | (6 | ) | |||||||
CBT T-Bonds | (43 | ) | Jun-2015 | (117 | ) | |||||||
Euro | (18 | ) | Jun-2015 | 27 | ||||||||
Euro-Bobl | (102 | ) | Jun-2015 | (20 | ) | |||||||
Euro-Bund | (37 | ) | Jun-2015 | (58 | ) | |||||||
U.S. 2-Year Treasury Note | (461 | ) | Jun-2015 | (300 | ) | |||||||
U.S. 5-Year Treasury Note | 1,046 | Jun-2015 | 1,310 | |||||||||
U.S. 10-Year Treasury Note | 47 | Jun-2015 | 115 | |||||||||
U.S. Ultra Long Treasury Bond | 5 | Jun-2015 | (5 | ) | ||||||||
|
| |||||||||||
| $ | 1,228 | |||||||||||
|
| |||||||||||
For the period ended March 31, 2015, the total amount of all open futures contracts, as presented in the table above, are representative of the volume of activity for this derivative type during the period.
| 78 | SEI Institutional Managed Trust / Semi-Annual Report / March 31, 2015 |
A list of the open forward foreign currency contracts held by the Fund at March 31, 2015, is as follows:
Settlement Date | Currency to Deliver (Thousands) | Currency to Receive (Thousands) | Unrealized Appreciation (Depreciation) ($ Thousands) | |||||||||||||||||
4/16/15 | BRL | 18,025 | USD | 5,710 | $ | 94 | ||||||||||||||
4/16/15 | USD | 6,191 | INR | 391,800 | 48 | |||||||||||||||
5/13/15 | EUR | 8,826 | USD | 10,088 | 605 | |||||||||||||||
5/13/15 | JPY | 519,835 | USD | 4,435 | 97 | |||||||||||||||
5/13/15 | USD | 5,592 | EUR | 4,923 | (302 | ) | ||||||||||||||
|
| |||||||||||||||||||
| $ | 542 | |||||||||||||||||||
|
| |||||||||||||||||||
A list of the counterparties for the outstanding forward foreign currency contracts held by the Fund at March 31, 2015, is as follows:
| Counterparty | Currency to Deliver | Currency to Receive ($ Thousands) | Unrealized Appreciation ($ Thousands) | |||||||||
Bank of America | (5,592 | ) | $ | 5,290 | $ | (302 | ) | |||||
Barclays PLC | (2,865 | ) | 2,929 | 64 | ||||||||
Brown Brothers Harriman | (11,808 | ) | 11,950 | 142 | ||||||||
Citigroup | (8,190 | ) | 8,650 | 459 | ||||||||
JPMorgan Chase Bank | (922 | ) | 983 | 61 | ||||||||
UBS | (1,845 | ) | 1,962 | 118 | ||||||||
|
| |||||||||||
| $ | 542 | |||||||||||
|
| |||||||||||
For the period ended March 31, 2015, the total amount of all forward foreign currency contracts, as presented in the table above, are representative of the volume of activity for this derivative type during the year.
A list of open OTC swap agreements held by the Fund at March 31, 2015, is as follows:
| Credit Default Swaps | ||||||||||||||||
| Counterparty | Reference Entity/Obligation | Buy/Sell Protection | (Pays)/ Receives Rate | Termination Date | Notional Amount (Thousands) | Net Unrealized (Depreciation) ($ Thousands) | ||||||||||
| Deutsche Bank | 08CAD7AD0 | SELL | 1.00 | 03/20/24 | $ | (1,490 | ) | $ | 24 | |||||||
| Goldman Sachs | Markit Cmbx.Na.Bbb-.8 | SELL | 3.00 | 12/31/49 | (100 | ) | 1 | |||||||||
| Goldman Sachs | Markit Cmbx.Na.Bbb-.8 | SELL | 3.00 | 10/17/49 | (100 | ) | — | |||||||||
| Goldman Sachs | Metlife Inc. | SELL | 1.00 | 06/20/21 | (750 | ) | (5 | ) | ||||||||
| Goldman Sachs | Metlife Inc. | SELL | 1.00 | 06/20/21 | (840 | ) | (6 | ) | ||||||||
|
| |||||||||||||||
| $ | 14 | |||||||||||||||
|
| |||||||||||||||
| Interest Rate Swaps | ||||||||||||
| Broker | Fund Pays | Fund Receives | Termination Date | Notional Amount (Thousands) | Net Unrealized Depreciation ($ Thousands) | |||||||
| Barclays Bank PLC | 2.42% | 3 Month USD - LIBOR | 11/15/27 | $1,620 | $ | (162 | ) | |||||
| Barclays Bank PLC | 2.48% | 3 Month USD - LIBOR | 11/15/27 | 1,620 | (147 | ) | ||||||
| Citigroup | 2.71% | 3 Month USD - LIBOR | 08/15/42 | 3,245 | (234 | ) | ||||||
|
| |||||||||||
| $ | (543 | ) | ||||||||||
|
| |||||||||||
A list of open centrally cleared swap agreements held by the Fund at March 31, 2015, is as follows:
| Credit Default Swaps | ||||||||||||||||
| Counterparty | Reference Entity/Obligation | Buy/Sell Protection | (Pays)/ Receives Rate | Termination Date | Notional Amount (Thousands) | Net Unrealized (Depreciation) ($ Thousands) | ||||||||||
| UBS Warburg | CDX.NA.HY.22 06/19 | SELL | 5.00 | 06/20/19 | $ | (10 | ) | — | ||||||||
|
| |||||||||||||||
| Interest Rate Swaps | ||||||||||||
| Broker | Fund Pays | Fund Receives | Termination Date | Notional Amount (Thousands) | Net Unrealized Appreciation (Depreciation) ($ Thousands) | |||||||
| Barclays | 0.04% | REC 3-Month USD LIBOR | 11/15/43 | $ 2,275 | $ | (634 | ) | |||||
| UBS | 0.02% | 3 Month USD - LIBOR | 05/15/30 | 23,077 | 388 | |||||||
|
| |||||||||||
| $ | (246 | ) | ||||||||||
|
| |||||||||||
For the period ended March 31, 2015, the total amount of all open OTC and centrally cleared swap agreements, as presented in the tables above, are representative of the volume of activity for this derivative type during the year.
| SEI Institutional Managed Trust / Semi-Annual Report / March 31, 2015 | 79 |
SCHEDULE OF INVESTMENTS (Unaudited)
Core Fixed Income Fund (Concluded)
March 31, 2015
Percentages are based on a Net Assets of $2,116,230 ($ Thousands).
| * | Non-income producing security. |
| ** | The rate reported is the 7-day effective yield as of March 31, 2015. |
| † | Investment in Affiliated Security (see Note 6). |
| †† | For the period ended March 31, 2015, the total amount of open purchased swaptions, written options and written swaptions, as presented in the Schedule of Investments, are representative of the volume of activity for these derivative types during the year. |
| ‡ | Real Estate Investment Trust. |
| (1) | In U.S. Dollars unless otherwise indicated. |
| (A) | Variable Rate Security — The rate reported on the Schedule of Investments is the rate in effect as of March 31, 2015. |
| (B) | Securities sold within terms of a private placement memorandum, exempt from registration under Section 144A of the Securities Act of 1933, as amended, and may be sold only to dealers in that program or other “accredited investors.” These securities have been determined to be liquid under guidelines established by the Board of Trustees. |
| (C) | The rate reported is the effective yield at time of purchase. |
| (D) | This security or a partial position of this security is on loan at March 31, 2015. The total market value of securities on loan at March 31, 2015 was $15,440 ($ Thousands). |
| (E) | Step Bonds — The rate reflected on the Schedule of Investments is the effective yield on March 31, 2015. The coupon on a step bond changes on a specified date. |
| (F) | This security was purchased with cash collateral held from securities on loan. The total value of such securities as of March 31, 2015 was $15,887 ($ Thousands). |
ABS — Asset-Backed Security
ARM — Adjustable Rate Mortgage
BRL — Brazilian Real
Cl — Class
CLO — Collateralized Loan Obligation
CMO — Collateralized Mortgage Obligation
DN — Discount Note
EUR — Euro
FHLB — Federal Home Loan Bank
FHLMC — Federal Home Loan Mortgage Corporation
FICO — Financing Corporation
FNMA — Federal National Mortgage Association
GNMA — Government National Mortgage Association
INR — Indian Rupee
IO — Interest Only — face amount represents notional amount
JPY — Japanese Yen
LIBOR — LondonInterbank Offered Rate
LLC — Limited Liability Company
L.P. — Limited Partnership
MTN — Medium Term Note
NCUA — National Credit Union Administration
OTC — Over the Counter
PLC — Public Limited Company
PO — Principal Only
RB — Revenue Bond
Ser — Series
STRIPS — Separately Traded Registered Interest and Principal Securities
TBA — To Be Announced
USD — United States Dollar
The following is a summary of the inputs used as of March 31, 2015, in valuing the Fund’s investments carried at value ($ Thousands):
| Investments in Securities | Level 1 | Level 2 | Level 3 | Total | ||||||||||||
Mortgage-Backed Securities | $ | — | $ | 688,809 | $ | — | $ | 688,809 | ||||||||
Corporate Obligations | — | 577,589 | — | 577,589 | ||||||||||||
U.S. Treasury Obligations | — | 543,686 | — | 543,686 | ||||||||||||
Asset-Backed Securities | — | 211,718 | — | 211,718 | ||||||||||||
U.S. Government Agency Obligations | — | 59,488 | — | 59,488 | ||||||||||||
Sovereign Debt | — | 30,572 | — | 30,572 | ||||||||||||
Affiliated Partnership | — | 15,887 | — | 15,887 | ||||||||||||
Collateralized Debt Obligations | — | 8,019 | — | 8,019 | ||||||||||||
Preferred Stock | 656 | — | — | 656 | ||||||||||||
Loan Participations | — | 17,585 | — | 17,585 | ||||||||||||
Municipal Bonds | — | 16,243 | — | 16,243 | ||||||||||||
Cash Equivalent | 135,114 | — | — | 135,114 | ||||||||||||
|
|
|
|
|
|
|
| |||||||||
Total Investments in Securities | $ | 135,770 | $ | 2,169,596 | $ | — | $ | 2,305,366 | ||||||||
|
|
|
|
|
|
|
| |||||||||
| Other Financial Instruments | Level 1 | Level 2 | Level 3 | Total | ||||||||||||
Written Options | $ | 288 | $ | — | $ | — | $ | 288 | ||||||||
Written Swaption | — | 87 | — | 87 | ||||||||||||
Purchased Swaption | — | 66 | — | 66 | ||||||||||||
Purchased Options | 95 | — | — | 95 | ||||||||||||
Futures Contracts* | ||||||||||||||||
Unrealized Appreciation | 1,806 | — | — | 1,806 | ||||||||||||
Unrealized Depreciation | (578 | ) | — | — | (578 | ) | ||||||||||
Forwards* | ||||||||||||||||
Unrealized Appreciation | — | 844 | — | 844 | ||||||||||||
Unrealized Depreciation | — | (302 | ) | — | (302 | ) | ||||||||||
OTC Swaps* | ||||||||||||||||
Credit Default Swaps | ||||||||||||||||
Unrealized Appreciation | — | 25 | — | 25 | ||||||||||||
Unrealized Depreciation | — | (11 | ) | — | (11 | ) | ||||||||||
Interest Rate Swaps | ||||||||||||||||
Unrealized Depreciation | — | (543 | ) | — | (543 | ) | ||||||||||
Centrally Cleared Swaps* | ||||||||||||||||
Interest Rate Swaps | ||||||||||||||||
Unrealized Appreciation | — | 388 | — | 388 | ||||||||||||
Unrealized Depreciation | — | (634 | ) | — | (634 | ) | ||||||||||
|
|
|
|
|
|
|
| |||||||||
Total Other Financial Instruments | $ | 1,611 | $ | (80 | ) | $ | — | $ | 1,531 | |||||||
|
|
|
|
|
|
|
| |||||||||
| * | Futures contracts, forwards contracts and swaps are valued at the unrealized appreciation (depreciation) on the instrument. |
For the period ended March 31, 2015, there were no transfers between Level 1 and Level 2 assets and liabilities.
For the period ended March 31, 2015, there were no transfers between Level 2 and Level 3 assets and liabilities.
For the period ended March 31, 2015, there were no Level 3 investments.
For more information on valuation inputs, see Note 2 — Significant Accounting Policies in Notes to Financial Statements.
Amounts designated as “—” are $0 or have been rounded to $0.
The accompanying notes are an integral part of the financial statements.
| 80 | SEI Institutional Managed Trust / Semi-Annual Report / March 31, 2015 |
SCHEDULE OF INVESTMENTS (Unaudited)
U.S. Fixed Income Fund
March 31, 2015
| Description | Face Amount ($ Thousands) | Market Value ($ Thousands) | ||||||
MORTGAGE-BACKED SECURITIES — 31.7% |
| |||||||
Agency Mortgage-Backed Obligations — 25.8% |
| |||||||
FHLMC | ||||||||
11.000%, 02/17/2021 | $ | 45 | $ | 50 | ||||
10.000%, 03/17/2026 to 10/01/2030 | 468 | 523 | ||||||
7.500%, 01/01/2032 to 09/01/2038 | 573 | 677 | ||||||
6.500%, 10/01/2031 to 09/01/2038 | 878 | 1,002 | ||||||
6.000%, 08/01/2015 to 09/01/2038 | 1,022 | 1,134 | ||||||
5.500%, 06/01/2020 to 01/01/2039 | 3,713 | 4,082 | ||||||
5.000%, 03/01/2034 to 08/01/2039 | 3,149 | 3,534 | ||||||
4.500%, 04/01/2035 to 05/01/2044 | 5,827 | 6,481 | ||||||
4.000%, 11/15/2029 to 02/01/2045 | 8,434 | 9,163 | ||||||
3.500%, 12/01/2028 to 01/01/2045 | 8,225 | 8,706 | ||||||
1.620%, 11/21/2019 | 130 | 129 | ||||||
FHLMC ARM (A) | ||||||||
6.493%, 10/01/2037 | 174 | 181 | ||||||
3.342%, 07/01/2036 | 69 | 72 | ||||||
3.026%, 03/01/2036 | 608 | 656 | ||||||
2.896%, 08/01/2044 | 296 | 307 | ||||||
2.727%, 03/01/2037 | 207 | 224 | ||||||
2.681%, 04/01/2037 | 92 | 99 | ||||||
2.680%, 05/01/203 | 468 | 507 | ||||||
2.631%, 05/01/2037 | 309 | 332 | ||||||
2.610%, 11/01/2036 | 40 | 43 | ||||||
2.574%, 12/01/2042 | 117 | 120 | ||||||
2.541%, 02/01/2036 | 223 | 239 | ||||||
2.489%, 04/01/2037 | 8 | 8 | ||||||
| Description | Face Amount ($ Thousands) | Market Value ($ Thousands) | ||||||
2.480%, 10/01/2037 | $ | 45 | $ | 48 | ||||
2.471%, 05/01/2038 | 161 | 173 | ||||||
2.375%, 01/01/2035 to 11/01/2036 | 110 | 117 | ||||||
2.278%, 06/01/2037 | 81 | 87 | ||||||
2.276%, 02/01/2037 | 53 | 56 | ||||||
1.937%, 05/01/2037 | 259 | 272 | ||||||
1.925%, 04/01/2037 | 45 | 48 | ||||||
FHLMC CMO, Ser 1591, Cl PV | ||||||||
6.250%, 10/15/2023 | 529 | 579 | ||||||
FHLMC CMO, Ser 2002-2399, Cl XG | ||||||||
6.500%, 01/15/2032 | 221 | 249 | ||||||
FHLMC CMO, Ser 2002-48, Cl 1A | ||||||||
5.621%, 07/25/2033 (A) | 6 | 7 | ||||||
FHLMC CMO, Ser 2003-57, Cl 1A3 | ||||||||
7.500%, 07/25/2043 | 61 | 74 | ||||||
FHLMC CMO, Ser 2004-59, Cl 1A3 | ||||||||
7.500%, 10/25/2043 | 86 | 105 | ||||||
FHLMC CMO, Ser 2004-60, Cl 1A3 | ||||||||
7.500%, 03/25/2044 | 87 | 106 | ||||||
FHLMC CMO, Ser 2005-2945, Cl SA | ||||||||
11.980%, 03/15/2020 (A) | 26 | 29 | ||||||
FHLMC CMO, Ser 2005-2967, Cl EA, PO | ||||||||
0.000%, 04/15/2020 (B) | 73 | 73 | ||||||
FHLMC CMO, Ser 2005-2980, Cl QA | ||||||||
6.000%, 05/15/2035 | 135 | 149 | ||||||
FHLMC CMO, Ser 2005-3077, Cl TO, PO | ||||||||
0.000%, 04/15/2035 (B) | 101 | 95 | ||||||
FHLMC CMO, Ser 2006-3117, Cl OG, PO | ||||||||
0.000%, 02/15/2036 (B) | 101 | 98 | ||||||
FHLMC CMO, Ser 2006-3153, Cl EO, PO | ||||||||
0.000%, 05/15/2036 (B) | 69 | 65 | ||||||
FHLMC CMO, Ser 2006-3200, Cl PO, PO | ||||||||
0.000%, 08/15/2036 (B) | 93 | 86 | ||||||
FHLMC CMO, Ser 2006-R007, Cl ZA | ||||||||
6.000%, 05/15/2036 | 211 | 241 | ||||||
FHLMC CMO, Ser 2007-3316, Cl JO, PO | ||||||||
0.000%, 05/15/2037 (B) | 18 | 17 | ||||||
FHLMC CMO, Ser 2007-3318, Cl DB | ||||||||
6.000%, 05/15/2027 | 229 | 259 | ||||||
| SEI Institutional Managed Trust / Semi-Annual Report / March 31, 2015 | 81 |
SCHEDULE OF INVESTMENTS (Unaudited)
U.S. Fixed Income Fund (Continued)
March 31, 2015
| Description | Face Amount ($ Thousands) | Market Value ($ Thousands) | ||||||
FHLMC CMO, Ser 2007-3385, | ||||||||
5.826%, 11/15/2037 (A) | $ | 71 | $ | 10 | ||||
FHLMC CMO, Ser 2008-3451, | ||||||||
5.876%, 05/15/2038 (A) | 68 | 9 | ||||||
FHLMC CMO, Ser 2008-3461, | ||||||||
6.000%, 06/15/2038 | 63 | 70 | ||||||
FHLMC CMO, Ser 2009-3510, | ||||||||
0.000%, 02/15/2037 (B) | 103 | 100 | ||||||
FHLMC CMO, Ser 2009-3604, | ||||||||
0.000%, 05/15/2036 (B) | 164 | 159 | ||||||
FHLMC CMO, Ser 2009-3607, | ||||||||
0.000%, 10/15/2039 (B) | 115 | 105 | ||||||
FHLMC CMO, Ser 2010-3621, | ||||||||
0.000%, 01/15/2040 (B) | 56 | 55 | ||||||
FHLMC CMO, Ser 2010-3664, Cl DA | ||||||||
4.000%, 11/15/2037 | 1,262 | 1,335 | ||||||
FHLMC CMO, Ser 2010-3704, Cl CT | ||||||||
7.000%, 12/15/2036 | 427 | 507 | ||||||
FHLMC CMO, Ser 2010-3714, | ||||||||
5.000%, 08/15/2040 | 231 | 28 | ||||||
FHLMC CMO, Ser 2010-3739, | ||||||||
4.000%, 03/15/2034 | 231 | 10 | ||||||
FHLMC CMO, Ser 2010-3747, | ||||||||
4.500%, 07/15/2037 | 338 | 22 | ||||||
FHLMC CMO, Ser 2010-3756, | ||||||||
4.000%, 08/15/2035 | 79 | 1 | ||||||
FHLMC CMO, Ser 2010-3759, | ||||||||
4.000%, 08/15/2037 | 331 | 29 | ||||||
FHLMC CMO, Ser 2010-3760, | ||||||||
4.000%, 10/15/2037 | 161 | 12 | ||||||
FHLMC CMO, Ser 2011-3793, Cl AB | ||||||||
3.500%, 01/15/2026 | 500 | 541 | ||||||
FHLMC CMO, Ser 2011-3800, | ||||||||
4.000%, 11/15/2029 | 281 | 23 | ||||||
FHLMC CMO, Ser 2011-3804, Cl FN | ||||||||
0.625%, 03/15/2039 (A) | 372 | 373 | ||||||
| Description | Face Amount ($ Thousands) | Market Value ($ Thousands) | ||||||
FHLMC CMO, Ser 2011-3819, Cl ZQ | ||||||||
6.000%, 04/15/2036 | $ | 621 | $ | 709 | ||||
FHLMC CMO, Ser 2011-3852, Cl QN | ||||||||
5.500%, 05/15/2041 (A) | 134 | 146 | ||||||
FHLMC CMO, Ser 2011-3876, Cl NB | ||||||||
5.000%, 08/15/2038 | 236 | 255 | ||||||
FHLMC CMO, Ser 2011-3925, Cl FL | ||||||||
0.625%, 01/15/2041 (A) | 656 | 663 | ||||||
FHLMC CMO, Ser 2011-3947, | ||||||||
5.776%, 10/15/2041 (A) | 870 | 154 | ||||||
FHLMC CMO, Ser 2011-3957, Cl B | ||||||||
4.000%, 11/15/2041 | 674 | 717 | ||||||
FHLMC CMO, Ser 2012-271, Cl 30 | ||||||||
3.000%, 08/15/2042 | 948 | 968 | ||||||
FHLMC CMO, Ser 2012-279, Cl F6 | ||||||||
0.625%, 09/15/2042 (A) | 419 | 421 | ||||||
FHLMC CMO, Ser 2012-281, Cl F1 | ||||||||
0.675%, 10/15/2042 (A) | 430 | 432 | ||||||
FHLMC CMO, Ser 2012-283, | ||||||||
3.500%, 10/15/2027 | 1,407 | 195 | ||||||
FHLMC CMO, Ser 2012-4146, | ||||||||
3.000%, 12/15/2031 | 1,481 | 176 | ||||||
FHLMC CMO, Ser 2013-299, Cl 300 | ||||||||
3.000%, 01/15/2043 | 885 | 896 | ||||||
FHLMC CMO, Ser 2013-300, Cl 300 | ||||||||
3.000%, 01/15/2043 | 1,120 | 1,142 | ||||||
FHLMC CMO, Ser 2013-310, | ||||||||
0.000%, 09/15/2043 (B) | 561 | 455 | ||||||
FHLMC CMO, Ser 2013-4194, Cl BI IO | ||||||||
3.500%, 04/15/2043 | �� | 665 | 102 | |||||
FHLMC CMO, Ser 2013-4203, | ||||||||
6.076%, 09/15/2042 (A) | 572 | 95 | ||||||
FHLMC CMO, Ser 2013-4206, Cl CZ | ||||||||
3.000%, 05/15/2043 | 106 | 104 | ||||||
FHLMC CMO, Ser 2013-4210, Cl Z | ||||||||
3.000%, 05/15/2043 | 207 | 204 | ||||||
| 82 | SEI Institutional Managed Trust / Semi-Annual Report / March 31, 2015 |
| Description | Face Amount ($ Thousands) | Market Value ($ Thousands) | ||||||
FHLMC CMO, Ser 2013-4219, Cl JA | ||||||||
3.500%, 08/15/2039 | $ | 878 | $ | 928 | ||||
FHLMC CMO, Ser 2013-4226, Cl GZ | ||||||||
3.000%, 07/15/2043 | 105 | 102 | ||||||
FHLMC CMO, Ser 2013-4227, Cl AB | ||||||||
3.500%, 10/15/2037 | 581 | 611 | ||||||
FHLMC CMO, Ser 2013-4239, | ||||||||
3.500%, 06/15/2027 | 1,055 | 128 | ||||||
FHLMC CMO, Ser 2014-4335, | ||||||||
5.826%, 05/15/2044 (A) | 96 | 22 | ||||||
FHLMC CMO, Ser 2015-342, Cl 300 | ||||||||
3.000%, 07/15/2043 | 2,082 | 2,112 | ||||||
FHLMC CMO, Ser 2015-4425, Cl A | ||||||||
4.000%, 09/15/2040 | 570 | 598 | ||||||
FHLMC CMO, Ser 2015-4430, Cl A | ||||||||
4.000%, 04/15/2041 | 850 | 902 | ||||||
FHLMC CMO, Ser 2033, Cl HC | ||||||||
6.500%, 02/15/2028 | 88 | 98 | ||||||
FHLMC CMO, Ser 2075, Cl D | ||||||||
6.500%, 08/15/2028 | 172 | 199 | ||||||
FHLMC CMO, Ser 239, Cl S30, IO | ||||||||
7.526%, 08/15/2036 (A) | 162 | 26 | ||||||
FHLMC CMO, Ser 2434, Cl ZA | ||||||||
6.500%, 04/15/2032 | 187 | 216 | ||||||
FHLMC CMO, Ser 2458, Cl ZM | ||||||||
6.500%, 06/15/2032 | 145 | 166 | ||||||
FHLMC CMO, Ser 2631, Cl SA | ||||||||
14.530%, 06/15/2033 (A) | 63 | 85 | ||||||
FHLMC CMO, Ser 2725, Cl SC | ||||||||
8.819%, 11/15/2033 (A) | 33 | 37 | ||||||
FHLMC CMO, Ser 2950, Cl JO, PO | ||||||||
0.000%, 03/15/2020 (B) | 26 | 26 | ||||||
FHLMC CMO, Ser 3001, Cl HP | ||||||||
21.302%, 05/15/2035 (A) | 69 | 98 | ||||||
FHLMC CMO, Ser 3006, Cl QS | ||||||||
19.697%, 07/15/2035 (A) | 134 | 172 | ||||||
FHLMC CMO, Ser 3012, Cl GK | ||||||||
23.965%, 06/15/2035 (A) | 103 | 156 | ||||||
FHLMC CMO, Ser 3217, Cl CX, IO | ||||||||
6.416%, 09/15/2036 (A) | 219 | 32 | ||||||
FHLMC CMO, Ser 3225, Cl EO, PO | ||||||||
0.000%, 10/15/2036 (B) | 131 | 119 | ||||||
| Description | Face Amount ($ Thousands) | Market Value ($ Thousands) | ||||||
FHLMC CMO, Ser 3262, Cl SG, IO | ||||||||
6.226%, 01/15/2037 (A) | $ | 150 | $ | 17 | ||||
FHLMC CMO, Ser 3373, Cl TO, PO | ||||||||
0.000%, 04/15/2037 (B) | 34 | 33 | ||||||
FHLMC CMO, Ser 3383, Cl SA, IO | ||||||||
6.276%, 11/15/2037 (A) | 212 | 22 | ||||||
FHLMC CMO, Ser 3422, Cl SE | ||||||||
17.014%, 02/15/2038 (A) | 23 | 30 | ||||||
FHLMC CMO, Ser 3515, Cl PI, IO | ||||||||
5.500%, 07/15/2037 | 9 | — | ||||||
FHLMC CMO, Ser 3607, Cl BO, PO | ||||||||
0.000%, 04/15/2036 (B) | 35 | 33 | ||||||
FHLMC CMO, Ser 3611, Cl PO, PO | ||||||||
0.000%, 07/15/2034 (B) | 49 | 43 | ||||||
FHLMC CMO, Ser 3626, Cl MA | ||||||||
5.000%, 02/15/2030 | 32 | 32 | ||||||
FHLMC CMO, Ser 3632, Cl BS | ||||||||
16.918%, 02/15/2040 (A) | 100 | 151 | ||||||
FHLMC CMO, Ser 3688, Cl NI, IO | ||||||||
5.000%, 04/15/2032 | 346 | 24 | ||||||
FHLMC CMO, Ser T-42, Cl A5 | ||||||||
7.500%, 02/25/2042 | 616 | 722 | ||||||
FHLMC CMO, Ser T-51, Cl 1A | ||||||||
6.500%, 09/25/2043 (A) | 153 | 178 | ||||||
FHLMC CMO, Ser T-54, Cl 2A | ||||||||
6.500%, 02/25/2043 | 100 | 119 | ||||||
FHLMC CMO, Ser T-54, Cl 3A | ||||||||
7.000%, 02/25/2043 | 322 | 397 | ||||||
FHLMC CMO, Ser T-57, Cl 1A2 | ||||||||
7.000%, 07/25/2043 | 417 | 489 | ||||||
FHLMC CMO, Ser T-58, Cl 4A | ||||||||
7.500%, 09/25/2043 | 477 | 574 | ||||||
FHLMC CMO, Ser T-60, Cl 1A2 | ||||||||
7.000%, 03/25/2044 | 163 | 207 | ||||||
FHLMC CMO, Ser T-76, Cl 2A | ||||||||
3.010%, 10/25/2037 (A) | 231 | 226 | ||||||
FHLMC Multifamily Structured Pass-Through Certificates, Ser 2014-K038, Cl A2 | ||||||||
3.389%, 03/25/2024 | 286 | 309 | ||||||
FHLMC Multifamily Structured Pass-Through Certificates, Ser 2014-KF05, Cl A | ||||||||
0.521%, 09/25/2021 (A) | 1,329 | 1,329 | ||||||
| SEI Institutional Managed Trust / Semi-Annual Report / March 31, 2015 | 83 |
SCHEDULE OF INVESTMENTS (Unaudited)
U.S. Fixed Income Fund (Continued)
March 31, 2015
| Description | Face Amount ($ Thousands) | Market Value ($ Thousands) | ||||||
FHLMC Multifamily Structured Pass-Through Certificates, Ser 2014-KSMC, Cl A2 | ||||||||
2.615%, 01/25/2023 | $ | 500 | $ | 512 | ||||
FHLMC Multifamily Structured Pass-Through Certificates, Ser KSCT, Cl A2 | ||||||||
4.285%, 01/25/2020 | 295 | 328 | ||||||
FHLMC Structured Agency Credit Risk Debt Notes, Ser 2014-DN1, Cl M2 | ||||||||
2.374%, 02/25/2024 (A) (C) | 250 | 253 | ||||||
FHLMC Structured Agency Credit Risk Debt Notes, Ser 2014-DN2, Cl M2 | ||||||||
1.824%, 04/25/2024 (A) (C) | 1,490 | 1,475 | ||||||
FHLMC Structured Agency Credit Risk Debt Notes, Ser 2014-DN3, Cl M2 | ||||||||
2.574%, 08/25/2024 (A) (C) | 290 | 294 | ||||||
FHLMC Structured Agency Credit Risk Debt Notes, Ser 2014-HQ1, Cl M1 | ||||||||
1.824%, 08/25/2024 (A) (C) | 388 | 391 | ||||||
FHLMC Structured Agency Credit Risk Debt Notes, Ser 2014-HQ3, Cl M2 | ||||||||
2.824%, 10/25/2024 (A) (C) | 520 | 525 | ||||||
FHLMC-GNMA CMO, Ser 1993-21, Cl L | ||||||||
6.250%, 10/25/2023 | 209 | 232 | ||||||
FNMA | ||||||||
7.500%, 10/01/2037 to 04/01/2039 | 383 | 468 | ||||||
7.000%, 04/01/2032 to 01/01/2039 | 256 | 308 | ||||||
6.500%, 05/01/2027 to 10/01/2038 | 1,056 | 1,241 | ||||||
6.000%, 10/01/2019 to 10/01/2040 | 3,747 | 4,262 | ||||||
5.500%, 02/01/2021 to 08/01/2041 | 2,887 | 3,276 | ||||||
5.000%, 01/01/2020 to 08/01/2041 | 5,100 | 5,744 | ||||||
4.685%, 02/01/2020 | 705 | 789 | ||||||
4.640%, 01/01/2021 | 476 | 540 | ||||||
4.540%, 01/01/2020 | 465 | 517 | ||||||
4.513%, 12/01/2019 | 449 | 501 | ||||||
4.500%, 08/01/2021 to 12/31/2049 | 9,910 | 10,961 | ||||||
4.410%, 05/01/2021 | 370 | 420 | ||||||
4.390%, 05/01/2021 | 246 | 277 | ||||||
4.380%, 01/01/2021 to 04/01/2021 | 1,435 | 1,610 | ||||||
| Description | Face Amount ($ Thousands) | Market Value ($ Thousands) | ||||||
4.369%, 02/01/2020 | $ | 468 | $ | 520 | ||||
4.360%, 05/01/2021 | 989 | 1,114 | ||||||
4.300%, 04/01/2021 to 07/01/2021 | 1,008 | 1,132 | ||||||
4.297%, 01/01/2021 | 267 | 299 | ||||||
4.271%, 06/01/2021 | 421 | 467 | ||||||
4.250%, 04/01/2021 to 04/01/2021 | 750 | 842 | ||||||
4.240%, 06/01/2021 | 977 | 1,095 | ||||||
4.230%, 03/01/2020 | 387 | 425 | ||||||
4.130%, 08/01/2021 | 949 | 1,057 | ||||||
4.066%, 07/01/2020 | 384 | 424 | ||||||
4.060%, 07/01/2021 | 1,000 | 1,112 | ||||||
4.000%, 03/01/2025 to 04/01/2045 | 21,817 | 23,734 | ||||||
3.840%, 08/01/2021 | 926 | 1,020 | ||||||
3.670%, 07/01/2023 | 1,000 | 1,099 | ||||||
3.614%, 12/01/2020 | 1,126 | 1,225 | ||||||
3.590%, 12/01/2020 | 465 | 504 | ||||||
3.505%, 09/01/2020 | 925 | 996 | ||||||
3.500%, 12/01/2029 to 02/01/2045 | 19,257 | 20,407 | ||||||
3.430%, 10/01/2020 | 936 | 1,005 | ||||||
3.290%, 10/01/2020 to 08/01/2026 | 1,342 | 1,430 | ||||||
3.235%, 10/01/2026 | 497 | 526 | ||||||
3.230%, 11/01/2020 | 336 | 359 | ||||||
3.000%, 08/01/2033 to 01/01/2043 | 2,341 | 2,417 | ||||||
2.810%, 06/01/2023 | 1,000 | 1,035 | ||||||
2.770%, 05/01/2022 | 1,000 | 1,038 | ||||||
2.747%, 08/01/2022 | 1,031 | 1,061 | ||||||
2.703%, 04/01/2023 | 485 | 500 | ||||||
2.680%, 07/01/2022 | 1,943 | 2,005 | ||||||
2.510%, 06/01/2023 | 484 | 492 | ||||||
2.500%, 10/01/2042 | 342 | 339 | ||||||
2.480%, 06/01/2019 | 981 | 1,012 | ||||||
2.460%, 04/01/2023 | 905 | 920 | ||||||
2.420%, 06/01/2023 | 485 | 490 | ||||||
FNMA - ACES, Ser 2014-M12, Cl FA | ||||||||
0.451%, 10/25/2021 (A) | 928 | 929 | ||||||
FNMA - ACES, Ser 2014-M6, Cl FA | ||||||||
0.442%, 12/25/2017 (A) | 105 | 105 | ||||||
FNMA - ACES, Ser 2014-M8, Cl FA | ||||||||
0.390%, 05/25/2018 (A) | 810 | 811 | ||||||
FNMA - ACES, Ser 2014-M8, Cl X2, IO | ||||||||
0.434%, 06/25/2024 (A) | 8,928 | 278 | ||||||
FNMA ARM (A) | ||||||||
6.230%, 08/01/2036 | 39 | 42 | ||||||
3.225%, 04/01/2044 | 1,172 | 1,230 | ||||||
| 84 | SEI Institutional Managed Trust / Semi-Annual Report / March 31, 2015 |
| Description | Face Amount ($ Thousands) | Market Value ($ Thousands) | ||||||
2.928%, 03/01/2036 | $ | 155 | $ | 166 | ||||
2.726%, 01/01/2045 | 395 | 408 | ||||||
2.667%, 11/01/2036 | 142 | 151 | ||||||
2.581%, 03/01/2045 | 107 | 110 | ||||||
2.553%, 12/01/2036 | 436 | 466 | ||||||
2.498%, 09/01/2037 | 4 | 4 | ||||||
2.461%, 11/01/2036 | 128 | 136 | ||||||
2.445%, 09/01/2036 | 51 | 55 | ||||||
2.411%, 12/01/2036 | 117 | 125 | ||||||
2.346%, 04/01/2037 | 87 | 93 | ||||||
2.330%, 04/01/2036 | 98 | 105 | ||||||
2.325%, 07/01/2037 | 250 | 268 | ||||||
2.257%, 11/01/2037 | 249 | 267 | ||||||
2.247%, 07/01/2037 | 125 | 133 | ||||||
1.978%, 11/01/2037 | 130 | 138 | ||||||
1.961%, 09/01/2037 | 59 | 64 | ||||||
1.712%, 07/01/2037 | 294 | 309 | ||||||
0.633%, 11/01/2023 | 975 | 983 | ||||||
0.531%, 01/01/2023 | 191 | 193 | ||||||
0.521%, 01/01/2023 | 478 | 477 | ||||||
0.511%, 01/01/2023 | 500 | 500 | ||||||
FNMA CMO, Ser 1998-300, Cl 1, PO | ||||||||
0.000%, 09/01/2024 (B) | 76 | 74 | ||||||
FNMA CMO, Ser 1999-11, Cl Z | ||||||||
5.500%, 03/25/2029 | 98 | 109 | ||||||
FNMA CMO, Ser 2000-18, Cl EC, PO | ||||||||
0.000%, 10/25/2023 (B) | 57 | 56 | ||||||
FNMA CMO, Ser 2001-79, Cl BA | ||||||||
7.000%, 03/25/2045 | 137 | 161 | ||||||
FNMA CMO, Ser 2002-33, Cl A2 | ||||||||
7.500%, 06/25/2032 | 64 | 75 | ||||||
FNMA CMO, Ser 2002-95, Cl DB | ||||||||
6.000%, 01/25/2033 | 234 | 271 | ||||||
FNMA CMO, Ser 2003-131, Cl SK | ||||||||
15.853%, 01/25/2034 (A) | 71 | 94 | ||||||
FNMA CMO, Ser 2003-23, Cl EQ | ||||||||
5.500%, 04/25/2023 | 832 | 912 | ||||||
FNMA CMO, Ser 2003-35, Cl EA, PO | ||||||||
0.000%, 05/25/2033 (B) | 33 | 30 | ||||||
FNMA CMO, Ser 2004-46, Cl EP, PO | ||||||||
0.000%, 03/25/2034 (B) | 76 | 74 | ||||||
FNMA CMO, Ser 2004-52, Cl PX, PO | ||||||||
0.000%, 09/25/2032 (B) | 6 | 6 | ||||||
| Description | Face Amount ($ Thousands) | Market Value ($ Thousands) | ||||||
FNMA CMO, Ser 2004-61, Cl BO, PO | ||||||||
0.000%, 10/25/2032 (B) | $ | 11 | $ | 11 | ||||
FNMA CMO, Ser 2004-89, Cl SM | ||||||||
17.397%, 09/25/2024 (A) | 263 | 352 | ||||||
FNMA CMO, Ser 2005-106, Cl US | ||||||||
23.930%, 11/25/2035 (A) | 383 | 585 | ||||||
FNMA CMO, Ser 2005-117, Cl LC | ||||||||
5.500%, 11/25/2035 | 468 | 508 | ||||||
FNMA CMO, Ser 2005-29, Cl ZA | ||||||||
5.500%, 04/25/2035 | 506 | 522 | ||||||
FNMA CMO, Ser 2005-360, Cl 2, IO | ||||||||
5.000%, 08/01/2035 | 318 | 42 | ||||||
FNMA CMO, Ser 2005-5, Cl PA | ||||||||
5.000%, 01/25/2035 | 67 | 74 | ||||||
FNMA CMO, Ser 2005-72, Cl SB | ||||||||
16.441%, 08/25/2035 (A) | 63 | 85 | ||||||
FNMA CMO, Ser 2005-90, Cl ES | ||||||||
16.441%, 10/25/2035 (A) | 91 | 118 | ||||||
FNMA CMO, Ser 2006-117, Cl GS, IO | ||||||||
6.476%, 12/25/2036 (A) | 64 | 12 | ||||||
FNMA CMO, Ser 2006-118, Cl A2 | ||||||||
0.236%, 12/25/2036 (A) | 122 | 122 | ||||||
FNMA CMO, Ser 2006-15, Cl OP, PO | ||||||||
0.000%, 03/25/2036 (B) | 68 | 64 | ||||||
FNMA CMO, Ser 2006-27, Cl OH, PO | ||||||||
0.000%, 04/25/2036 (B) | 61 | 57 | ||||||
FNMA CMO, Ser 2006-59, Cl QO, PO | ||||||||
0.000%, 01/25/2033 (B) | 24 | 24 | ||||||
FNMA CMO, Ser 2006-60, Cl DO, PO | ||||||||
0.000%, 04/25/2035 (B) | 51 | 51 | ||||||
FNMA CMO, Ser 2006-63, Cl ZH | ||||||||
6.500%, 07/25/2036 | 321 | 385 | ||||||
FNMA CMO, Ser 2006-78, Cl BZ | ||||||||
6.500%, 08/25/2036 | 54 | 62 | ||||||
FNMA CMO, Ser 2007-100, Cl SM, IO | ||||||||
6.276%, 10/25/2037 (A) | 173 | 23 | ||||||
| SEI Institutional Managed Trust / Semi-Annual Report / March 31, 2015 | 85 |
SCHEDULE OF INVESTMENTS (Unaudited)
U.S. Fixed Income Fund (Continued)
March 31, 2015
| Description | Face Amount ($ Thousands) | Market Value ($ Thousands) | ||||||
FNMA CMO, Ser 2007-101, Cl A2 | ||||||||
0.424%, 06/27/2036 (A) | $ | 87 | $ | 86 | ||||
FNMA CMO, Ser 2007-112, Cl SA, IO | ||||||||
6.276%, 12/25/2037 (A) | 208 | 35 | ||||||
FNMA CMO, Ser 2007-114, Cl A6 | ||||||||
0.374%, 10/27/2037 (A) | 348 | 344 | ||||||
FNMA CMO, Ser 2007-116, Cl HI, IO | ||||||||
1.529%, 01/25/2038 (A) | 193 | 13 | ||||||
FNMA CMO, Ser 2007-29, Cl SG | ||||||||
22.087%, 04/25/2037 (A) | 30 | 43 | ||||||
FNMA CMO, Ser 2007-65, Cl KI, IO | ||||||||
6.446%, 07/25/2037 (A) | 118 | 19 | ||||||
FNMA CMO, Ser 2007-72, Cl EK, IO | ||||||||
6.226%, 07/25/2037 (A) | 150 | 22 | ||||||
FNMA CMO, Ser 2007-77, Cl PD | ||||||||
6.000%, 10/25/2036 | 623 | 646 | ||||||
FNMA CMO, Ser 2007-85, Cl SG | ||||||||
15.816%, 09/25/2037 (A) | 33 | 42 | ||||||
FNMA CMO, Ser 2008-35, Cl IM, IO | ||||||||
0.642%, 10/25/2016 (A) | 177 | 1 | ||||||
FNMA CMO, Ser 2008-4, Cl SD, IO | ||||||||
5.826%, 02/25/2038 (A) | 420 | 54 | ||||||
FNMA CMO, Ser 2008-95, Cl BA | ||||||||
5.000%, 01/25/2024 | 250 | 273 | ||||||
FNMA CMO, Ser 2009-103, Cl MB | ||||||||
2.316%, 12/25/2039 (A) | 193 | 201 | ||||||
FNMA CMO, Ser 2009-20, Cl DT | ||||||||
4.500%, 04/25/2039 | 262 | 290 | ||||||
FNMA CMO, Ser 2009-52, Cl PI, IO | ||||||||
5.000%, 07/25/2039 | 149 | 19 | ||||||
FNMA CMO, Ser 2009-70, Cl CO, PO | ||||||||
0.000%, 01/25/2037 (B) | 138 | 126 | ||||||
FNMA CMO, Ser 2009-84, Cl WS, IO | ||||||||
5.726%, 10/25/2039 (A) | 77 | 9 | ||||||
FNMA CMO, Ser 2009-86, Cl BO, PO | ||||||||
0.000%, 03/25/2037 (B) | 1,064 | 1,038 | ||||||
| Description | Face Amount ($ Thousands) | Market Value ($ Thousands) | ||||||
FNMA CMO, Ser 2009-86, Cl IP, IO | ||||||||
5.500%, 10/25/2039 | $ | 58 | $ | 10 | ||||
FNMA CMO, Ser 2009-86, Cl OT, PO | ||||||||
0.000%, 10/25/2037 (B) | 126 | 116 | ||||||
FNMA CMO, Ser 2009-99, Cl SC, IO | ||||||||
6.006%, 12/25/2039 (A) | 104 | 13 | ||||||
FNMA CMO, Ser 2009-99, Cl WA | ||||||||
6.300%, 12/25/2039 (A) | 242 | 274 | ||||||
FNMA CMO, Ser 2010-1, Cl WA | ||||||||
6.188%, 02/25/2040 (A) | 94 | 102 | ||||||
FNMA CMO, Ser 2010-16, Cl WA | ||||||||
6.441%, 03/25/2040 (A) | 116 | 131 | ||||||
FNMA CMO, Ser 2010-23, Cl KS, IO | ||||||||
6.926%, 02/25/2040 (A) | 185 | 21 | ||||||
FNMA CMO, Ser 2010-35, Cl SB, IO | ||||||||
6.246%, 04/25/2040 (A) | 122 | 20 | ||||||
FNMA CMO, Ser 2010-39, Cl OT, PO | ||||||||
0.000%, 10/25/2035 (B) | 58 | 54 | ||||||
FNMA CMO, Ser 2010-68, Cl SA, IO | ||||||||
4.826%, 07/25/2040 (A) | 794 | 113 | ||||||
FNMA CMO, Ser 2011-118, Cl MT | ||||||||
7.000%, 11/25/2041 | 511 | 593 | ||||||
FNMA CMO, Ser 2011-53, Cl TN | ||||||||
4.000%, 06/25/2041 | 781 | 843 | ||||||
FNMA CMO, Ser 2011-87, Cl SG, IO | ||||||||
6.376%, 04/25/2040 (A) | 594 | 108 | ||||||
FNMA CMO, Ser 2011-90, Cl AS, IO | ||||||||
6.226%, 09/25/2041 (A) | 471 | 88 | ||||||
FNMA CMO, Ser 2011-M3, Cl A1 | ||||||||
2.072%, 07/25/2021 | 198 | 199 | ||||||
FNMA CMO, Ser 2011-M4, Cl A2 | ||||||||
3.726%, 06/25/2021 | 845 | 925 | ||||||
FNMA CMO, Ser 2012-101, Cl AI, IO | ||||||||
3.000%, 06/25/2027 | 972 | 102 | ||||||
FNMA CMO, Ser 2012-108, Cl F | ||||||||
0.674%, 10/25/2042 (A) | 416 | 417 | ||||||
| 86 | SEI Institutional Managed Trust / Semi-Annual Report / March 31, 2015 |
| Description | Face Amount ($ Thousands) | Market Value ($ Thousands) | ||||||
FNMA CMO, Ser 2012-112, Cl DA | ||||||||
3.000%, 10/25/2042 | $ | 1,318 | $ | 1,345 | ||||
FNMA CMO, Ser 2012-112, Cl FD | ||||||||
0.674%, 10/25/2042 (A) | 431 | 435 | ||||||
FNMA CMO, Ser 2012-118, Cl CI, IO | ||||||||
3.500%, 12/25/2039 | 1,063 | 161 | ||||||
FNMA CMO, Ser 2012-134, Cl LC | ||||||||
3.000%, 12/25/2042 | 186 | 191 | ||||||
FNMA CMO, Ser 2012-14, Cl FG | ||||||||
0.574%, 07/25/2040 (A) | 670 | 672 | ||||||
FNMA CMO, Ser 2012-411, Cl A3 | ||||||||
3.000%, 08/25/2042 | 223 | 228 | ||||||
FNMA CMO, Ser 2012-M15, Cl A | ||||||||
2.655%, 10/25/2022 (A) | 912 | 942 | ||||||
FNMA CMO, Ser 2013-101, Cl DO, PO | ||||||||
0.000%, 10/25/2043 (B) | 368 | 298 | ||||||
FNMA CMO, Ser 2013-126, Cl CS, IO | ||||||||
5.976%, 09/25/2041 (A) | 922 | 145 | ||||||
FNMA CMO, Ser 2013-128, Cl PO, PO | ||||||||
0.000%, 12/25/2043 (B) | 365 | 299 | ||||||
FNMA CMO, Ser 2013-133, Cl AB | ||||||||
4.000%, 06/25/2039 | 340 | 366 | ||||||
FNMA CMO, Ser 2013-4, Cl AJ | ||||||||
3.500%, 02/25/2043 | 858 | 908 | ||||||
FNMA CMO, Ser 2013-73, Cl IA, IO | ||||||||
3.000%, 09/25/2032 | 1,034 | 123 | ||||||
FNMA CMO, Ser 2013-9, Cl CB | ||||||||
5.500%, 04/25/2042 | 22 | 24 | ||||||
FNMA CMO, Ser 2013-94, Cl HA | ||||||||
4.000%, 01/25/2040 | 65 | 70 | ||||||
FNMA CMO, Ser 2014-47, Cl AI, IO | ||||||||
1.816%, 08/25/2044 (A) | 1,540 | 113 | ||||||
FNMA CMO, Ser 2014-9, Cl A | ||||||||
4.000%, 05/25/2037 | 112 | 121 | ||||||
FNMA Connecticut Avenue Securities, | ||||||||
1.374%, 07/25/2024 (A) (C) | 223 | 223 | ||||||
| Description | Face Amount ($ Thousands) | Market Value ($ Thousands) | ||||||
FNMA Grantor Trust CMO, Ser 2001-T10, Cl A1 | ||||||||
7.000%, 12/25/2041 | $ | 409 | $ | 484 | ||||
FNMA Grantor Trust CMO, Ser 2002-T1, Cl A1 | ||||||||
6.500%, 11/25/2031 | 281 | 330 | ||||||
FNMA Grantor Trust CMO, Ser 2002-T19, Cl A2 | ||||||||
7.000%, 07/25/2042 | 321 | 370 | ||||||
FNMA Grantor Trust CMO, Ser 2004-T3, Cl 1A3 | ||||||||
7.000%, 02/25/2044 | 268 | 311 | ||||||
FNMA TBA | ||||||||
5.000%, 05/01/2038 | 3,000 | 3,331 | ||||||
4.500%, 05/01/2038 to 05/25/2045 | 6,385 | 6,948 | ||||||
4.000%, 04/01/2039 to 05/15/2045 | 12,715 | 13,578 | ||||||
3.500%, 05/15/2026 to 05/25/2045 | 19,245 | 20,189 | ||||||
3.000%, 05/25/2026 to 05/25/2045 | 14,785 | 15,268 | ||||||
2.500%, 05/01/2017 to 04/25/2030 | 2,020 | 2,073 | ||||||
FNMA Whole Loan CMO, Ser 2002-W6, Cl 2SI, IO | ||||||||
7.926%, 06/25/2042 (A) | 359 | 67 | ||||||
FNMA Whole Loan CMO, Ser 2003-W1, Cl 2A | ||||||||
6.529%, 12/25/2042 (A) | 204 | 239 | ||||||
FNMA Whole Loan CMO, Ser 2003-W12, Cl 1A8 | ||||||||
4.550%, 06/25/2043 | 168 | 184 | ||||||
FNMA Whole Loan CMO, Ser 2003-W17, Cl 1A7 | ||||||||
5.750%, 08/25/2033 | 83 | 91 | ||||||
FNMA Whole Loan CMO, Ser 2003-W8, Cl 2A | ||||||||
7.000%, 10/25/2042 | 179 | 209 | ||||||
FNMA Whole Loan CMO, Ser 2004-W1, Cl 2A2 | ||||||||
7.000%, 12/25/2033 | 340 | 402 | ||||||
FNMA Whole Loan CMO, Ser 2004-W2, Cl 2A2 | ||||||||
7.000%, 02/25/2044 | 345 | 400 | ||||||
FNMA Whole Loan CMO, Ser 2005-W3, Cl 2AF | ||||||||
0.394%, 03/25/2045 (A) | 366 | 366 | ||||||
FNMA Whole Loan CMO, Ser 2006-W1, Cl 1A3 | ||||||||
7.500%, 12/25/2045 | 205 | 240 | ||||||
FNMA Whole Loan CMO, Ser 2006-W2, Cl 1AF1 | ||||||||
0.394%, 02/25/2036 (A) | 162 | 162 | ||||||
| SEI Institutional Managed Trust / Semi-Annual Report / March 31, 2015 | 87 |
SCHEDULE OF INVESTMENTS (Unaudited)
U.S. Fixed Income Fund (Continued)
March 31, 2015
| Description | Face Amount ($ Thousands) | Market Value ($ Thousands) | ||||||
FNMA Whole Loan CMO, Ser 2007-W1, Cl 1AF1 | ||||||||
0.434%, 11/25/2046 (A) | $ | 211 | $ | 211 | ||||
FNMA, Ser 2014-M5, Cl FA | ||||||||
0.484%, 01/25/2017 (A) | 107 | 107 | ||||||
FREMF Mortgage Trust, Ser 2014-K36, Cl C | ||||||||
4.362%, 12/25/2046 (A) (C) | 120 | 126 | ||||||
FREMF Mortgage Trust, Ser 2014-K503, Cl C | ||||||||
3.009%, 10/25/2047 (A) (C) | 10 | 10 | ||||||
FREMF Mortgage Trust, Ser 2014-K714, Cl C | ||||||||
3.856%, 01/25/2047 (A) (C) | 60 | 62 | ||||||
GNMA | ||||||||
7.500%, 10/15/2037 | 94 | 112 | ||||||
7.000%, 09/15/2031 | 59 | 72 | ||||||
6.500%, 12/15/2035 | 573 | 688 | ||||||
6.000%, 09/20/2038 | 158 | 179 | ||||||
1.625%, 02/20/2034 (A) | 414 | 430 | ||||||
GNMA CMO, Ser 2001-61, Cl Z | ||||||||
6.500%, 12/20/2031 | 475 | 561 | ||||||
GNMA CMO, Ser 2003-97, Cl SA, IO | ||||||||
6.376%, 11/16/2033 (A) | 320 | 65 | ||||||
GNMA CMO, Ser 2004-11, Cl SX | ||||||||
16.990%, 02/20/2034 (A) | 37 | 54 | ||||||
GNMA CMO, Ser 2004-28, Cl SV | ||||||||
8.824%, 04/20/2034 (A) | 106 | 113 | ||||||
GNMA CMO, Ser 2004-71, Cl ST | ||||||||
7.000%, 09/20/2034 (A) | 72 | 81 | ||||||
GNMA CMO, Ser 2004-85, Cl PO, PO | ||||||||
0.000%, 01/17/2033 (B) | 6 | 6 | ||||||
GNMA CMO, Ser 2004-87, Cl SB | ||||||||
7.474%, 03/17/2033 (A) | 87 | 95 | ||||||
GNMA CMO, Ser 2005-28, Cl YO, PO | ||||||||
0.000%, 02/17/2033 (B) | 173 | 170 | ||||||
GNMA CMO, Ser 2005-92, Cl PB | ||||||||
6.000%, 12/20/2035 | 400 | 468 | ||||||
GNMA CMO, Ser 2006-34, Cl PO, PO | ||||||||
0.000%, 07/20/2036 (B) | 30 | 28 | ||||||
GNMA CMO, Ser 2006-38, Cl SG, IO | ||||||||
6.474%, 09/20/2033 (A) | 29 | — | ||||||
| Description | Face Amount ($ Thousands) | Market Value ($ Thousands) | ||||||
GNMA CMO, Ser 2007-26, Cl SW, IO | ||||||||
6.024%, 05/20/2037 (A) | $ | 272 | $ | 36 | ||||
GNMA CMO, Ser 2007-27, Cl SD, IO | ||||||||
6.024%, 05/20/2037 (A) | 183 | 23 | ||||||
GNMA CMO, Ser 2007-72, Cl US, IO | ||||||||
6.374%, 11/20/2037 (A) | 103 | 16 | ||||||
GNMA CMO, Ser 2007-78, Cl SA, IO | ||||||||
6.356%, 12/16/2037 (A) | 1,212 | 212 | ||||||
GNMA CMO, Ser 2007-82, Cl SA, IO | ||||||||
6.354%, 12/20/2037 (A) | 143 | 20 | ||||||
GNMA CMO, Ser 2007-9, | ||||||||
6.024%, 03/20/2037 (A) | 253 | 29 | ||||||
GNMA CMO, Ser 2008-1, | ||||||||
0.000%, 01/20/2038 (B) | 54 | 52 | ||||||
GNMA CMO, Ser 2008-10, | ||||||||
5.654%, 02/20/2038 (A) | 230 | 31 | ||||||
GNMA CMO, Ser 2008-29, | ||||||||
0.000%, 02/17/2033 (B) | 39 | 38 | ||||||
GNMA CMO, Ser 2008-33, | ||||||||
7.526%, 04/16/2038 (A) | 109 | 21 | ||||||
GNMA CMO, Ser 2008-55, | ||||||||
6.024%, 06/20/2038 (A) | 234 | 29 | ||||||
GNMA CMO, Ser 2009-106, | ||||||||
6.226%, 11/16/2039 (A) | 296 | 40 | ||||||
GNMA CMO, Ser 2009-14, Cl KI, IO | ||||||||
6.500%, 03/20/2039 | 140 | 24 | ||||||
GNMA CMO, Ser 2009-24, Cl DS, IO | ||||||||
6.124%, 03/20/2039 (A) | 225 | 15 | ||||||
GNMA CMO, Ser 2009-25, Cl SE, IO | ||||||||
7.424%, 09/20/2038 (A) | 168 | 27 | ||||||
GNMA CMO, Ser 2009-43, Cl SA, IO | ||||||||
5.774%, 06/20/2039 (A) | 176 | 22 | ||||||
GNMA CMO, Ser 2009-6, Cl SH, IO | ||||||||
5.864%, 02/20/2039 (A) | 151 | 18 | ||||||
GNMA CMO, Ser 2009-65, Cl IQ, IO | ||||||||
6.000%, 12/20/2038 | 73 | 7 | ||||||
| 88 | SEI Institutional Managed Trust / Semi-Annual Report / March 31, 2015 |
| Description | Face Amount ($ Thousands) | Market Value ($ Thousands) | ||||||
GNMA CMO, Ser 2009-65, Cl TS, IO | ||||||||
6.224%, 12/20/2038 (A) | $ | 291 | $ | 23 | ||||
GNMA CMO, Ser 2009-66, Cl XS, IO | ||||||||
6.626%, 07/16/2039 (A) | 1,829 | 270 | ||||||
GNMA CMO, Ser 2009-67, Cl SA, IO | ||||||||
5.876%, 08/16/2039 (A) | 112 | 14 | ||||||
GNMA CMO, Ser 2009-75, Cl MN | ||||||||
5.500%, 09/20/2039 | 500 | 602 | ||||||
GNMA CMO, Ser 2009-79, Cl OK, PO | ||||||||
0.000%, 11/16/2037 (B) | 216 | 195 | ||||||
GNMA CMO, Ser 2009-83, Cl TS, IO | ||||||||
5.924%, 08/20/2039 (A) | 218 | 24 | ||||||
GNMA CMO, Ser 2010-14, Cl CO, PO | ||||||||
0.000%, 08/20/2035 (B) | 108 | 102 | ||||||
GNMA CMO, Ser 2010-157, Cl OP, PO | ||||||||
0.000%, 12/20/2040 (B) | 333 | 290 | ||||||
GNMA CMO, Ser 2010-4, | ||||||||
6.216%, 01/16/2040 (A) | 2,676 | 388 | ||||||
GNMA CMO, Ser 2010-47, Cl PX, IO | ||||||||
6.524%, 06/20/2037 (A) | 378 | 65 | ||||||
GNMA CMO, Ser 2010-H11, Cl FA | ||||||||
1.172%, 06/20/2060 (A) | 644 | 658 | ||||||
GNMA CMO, Ser 2011-142, Cl IO, IO | ||||||||
0.924%, 09/16/2046 (A) | 6,289 | 297 | ||||||
GNMA CMO, Ser 2011-H08, Cl FD | ||||||||
0.671%, 02/20/2061 (A) | 477 | 477 | ||||||
GNMA CMO, Ser 2012-112, Cl IO, IO | ||||||||
0.837%, 02/16/2053 (A) | 4,403 | 277 | ||||||
GNMA CMO, Ser 2012-125, Cl IO, IO | ||||||||
0.857%, 02/16/2053 (A) | 1,198 | 76 | ||||||
GNMA CMO, Ser 2012-H25, Cl FA | ||||||||
0.871%, 12/20/2061 (A) | 908 | 921 | ||||||
GNMA CMO, Ser 2013-147, Cl QS, IO | ||||||||
6.574%, 12/20/2039 (A) | 830 | 157 | ||||||
GNMA CMO, Ser 2013-178, Cl A | ||||||||
2.250%, 03/16/2035 | 214 | 217 | ||||||
| Description | Face Amount ($ Thousands) | Market Value ($ Thousands) | ||||||
GNMA CMO, Ser 2013-178, | ||||||||
0.931%, 06/16/2055 (A) | $ | 1,155 | $ | 69 | ||||
GNMA CMO, Ser 2013-63, Cl IO, IO | ||||||||
0.774%, 09/16/2051 (A) | 5,243 | 328 | ||||||
GNMA CMO, Ser 2013-69, | ||||||||
3.500%, 05/20/2043 | 885 | 161 | ||||||
GNMA CMO, Ser 2013-H04, Cl BA | ||||||||
1.650%, 02/20/2063 | 494 | 495 | ||||||
GNMA CMO, Ser 2013-H21, Cl FB | ||||||||
0.871%, 09/20/2063 (A) | 942 | 950 | ||||||
GNMA CMO, Ser 2014-117, Cl SJ, IO | ||||||||
5.424%, 08/20/2044 (A) | 370 | 63 | ||||||
GNMA CMO, Ser 2014-5, | ||||||||
5.976%, 06/16/2043 (A) | 1,190 | 177 | ||||||
GNMA CMO, Ser 2014-H10, Cl TA | ||||||||
0.771%, 04/20/2064 (A) | 942 | 948 | ||||||
GNMA TBA | ||||||||
4.000%, 04/01/2040 to 04/20/2045 | 5,830 | 6,245 | ||||||
3.500%, 05/15/2041 to 05/20/2045 | 11,460 | 12,043 | ||||||
3.000%, 04/15/2043 to 04/20/2045 | 3,730 | 3,841 | ||||||
GNMA, Ser 2012-27, Cl IO, IO | ||||||||
1.236%, 04/16/2053 (A) | 1,971 | 115 | ||||||
GNMA, Ser 2012-44, Cl A | ||||||||
2.170%, 04/16/2041 | 207 | 207 | ||||||
GNMA, Ser 2013-145, Cl IO, IO | ||||||||
1.122%, 09/16/2044 (A) | 1,734 | 124 | ||||||
GNMA, Ser 2013-163, Cl IO, IO | ||||||||
1.216%, 02/16/2046 (A) | 1,739 | 133 | ||||||
GNMA, Ser 2013-96, Cl IO, IO | ||||||||
0.553%, 10/16/2054 (A) | 2,216 | 96 | ||||||
GNMA, Ser 2014-47, Cl IA, IO | ||||||||
1.379%, 02/16/2048 (A) | 1,900 | 146 | ||||||
GNMA, Ser 2014-50, Cl IO, IO | ||||||||
1.035%, 09/16/2055 (A) | 1,867 | 131 | ||||||
GNMA, Ser 2014-89, Cl IO, IO | ||||||||
1.037%, 01/16/2057 (A) | 3 | — | ||||||
GNMA, Ser 2014-92, Cl IX, IO | ||||||||
0.842%, 05/16/2054 (A) | 9,453 | 543 | ||||||
GNMA, Ser 2015-5, Cl IK, IO | ||||||||
0.879%, 11/16/2054 (A) | 7,983 | 540 | ||||||
NCUA Guaranteed Notes, Ser 2010-C1, Cl A2 | ||||||||
2.900%, 10/29/2020 | 300 | 307 | ||||||
| SEI Institutional Managed Trust / Semi-Annual Report / March 31, 2015 | 89 |
SCHEDULE OF INVESTMENTS (Unaudited)
U.S. Fixed Income Fund (Continued)
March 31, 2015
| Description | Face Amount ($ Thousands) | Market Value ($ Thousands) | ||||||
NCUA Guaranteed Notes, Ser 2010-C1, Cl APT | ||||||||
2.650%, 10/29/2020 | $ | 355 | $ | 362 | ||||
|
| |||||||
| 301,494 | ||||||||
|
| |||||||
Non-Agency Mortgage-Backed Obligations — 5.9% |
| |||||||
A10 Term Asset Financing, Ser 2013-2, Cl A | ||||||||
2.620%, 11/15/2027 (C) | 255 | 258 | ||||||
AAM ACE Resecuritization Trust, Ser 2011-1, Cl A20 | ||||||||
0.387%, 02/02/2037 (A) (C) | 3 | 3 | ||||||
American General Mortgage Loan Trust, | ||||||||
5.650%, 03/25/2058 (A) (C) | 190 | 194 | ||||||
American Home Mortgage Investment Trust, | ||||||||
2.358%, 02/25/2045 (A) (C) | 758 | 756 | ||||||
ASG Resecuritization Trust, | ||||||||
4.714%, 05/24/2036 (A) (C) | 88 | 88 | ||||||
ASG Resecuritization Trust, | ||||||||
2.045%, 03/26/2037 (A) (C) | 344 | 342 | ||||||
Banc of America Alternative Loan Trust, | ||||||||
6.000%, 01/25/2034 (C) | 91 | 96 | ||||||
Banc of America Alternative Loan Trust, | ||||||||
6.000%, 01/25/2034 (C) | 210 | 219 | ||||||
Banc of America Alternative Loan Trust, | ||||||||
5.000%, 09/25/2018 (C) | 48 | 48 | ||||||
Banc of America Alternative Loan Trust, | ||||||||
5.500%, 11/25/2033 (C) | 4 | 4 | ||||||
Banc of America Alternative Loan Trust, | ||||||||
5.500%, 02/25/2019 (C) | 28 | 29 | ||||||
Banc of America Alternative Loan Trust, | ||||||||
5.500%, 09/25/2019 (C) | 48 | 50 | ||||||
Banc of America Commercial Mortgage Trust, | ||||||||
5.372%, 09/10/2045 (A) | 200 | 203 | ||||||
| Description | Face Amount ($ Thousands) | Market Value ($ Thousands) | ||||||
Banc of America Commercial Mortgage Trust, | ||||||||
5.448%, 09/10/2047 | $ | 340 | $ | 357 | ||||
Banc of America Commercial Mortgage Trust, | ||||||||
5.587%, 04/10/2049 (A) | 1,000 | 1,059 | ||||||
Banc of America Funding Trust, Ser 2004-C, Cl 1A1 | ||||||||
2.802%, 12/20/2034 (A) (C) | 26 | 26 | ||||||
Banc of America Funding Trust, Ser 2006-G, Cl 2A3 | ||||||||
0.346%, 07/20/2036 (A) (C) | 26 | 26 | ||||||
Banc of America Funding Trust, Ser 2010-R11A, Cl 1A6 | ||||||||
5.179%, 08/26/2035 (A) (C) | 61 | 62 | ||||||
Banc of America Funding Trust, Ser 2010-R5, Cl 1A1 | ||||||||
5.500%, 10/26/2037 (C) | 31 | 31 | ||||||
Banc of America Funding Trust, Ser 2012-R6, Cl 1A1 | ||||||||
3.000%, 10/26/2039 (C) | 157 | 156 | ||||||
Banc of America Merrill Lynch Commercial Mortgage, Ser 2005-3, Cl AM | ||||||||
4.727%, 07/10/2043 | 300 | 302 | ||||||
Banc of America Merrill Lynch Commercial Mortgage, Ser 2005-4, Cl A5A | ||||||||
4.933%, 07/10/2045 | 56 | 57 | ||||||
Banc of America Merrill Lynch Commercial Mortgage, Ser 2005-5, Cl A4 | ||||||||
5.115%, 10/10/2045 (A) | 135 | 136 | ||||||
Banc of America Merrill Lynch Commercial Mortgage, Ser 2006-3, Cl A4 | ||||||||
5.889%, 07/10/2044 (A) | 200 | 208 | ||||||
Banc of America Mortgage Securities, Ser 2003-3, Cl 2A1 | ||||||||
0.724%, 05/25/2018 (A) (C) | 35 | 34 | ||||||
Banc of America Mortgage Securities, Ser 2003-6, Cl 2A1 | ||||||||
0.624%, 08/25/2018 (A) (C) | 9 | 9 | ||||||
Banc of America Mortgage Securities, Ser 2004-3, Cl 1A26 | ||||||||
5.500%, 04/25/2034 (C) | 42 | 43 | ||||||
| 90 | SEI Institutional Managed Trust / Semi-Annual Report / March 31, 2015 |
| Description | Face Amount ($ Thousands) | Market Value ($ Thousands) | ||||||
Banc of America Mortgage Securities, Ser 2004-3, Cl 3A1 | ||||||||
5.000%, 04/25/2019 (C) | $ | 19 | $ | 19 | ||||
Banc of America Mortgage Securities, Ser 2004-5, Cl 4A1 | ||||||||
4.750%, 06/25/2019 (C) | 22 | 22 | ||||||
BB-UBS Trust, Ser 2012-SHOW, Cl A | ||||||||
3.430%, 11/05/2036 (C) | 600 | 624 | ||||||
BB-UBS Trust, Ser 2012-TFT, Cl A | ||||||||
2.892%, 06/05/2030 (C) | 150 | 149 | ||||||
BCAP LLC Trust, Ser 2009-RR10, Cl 17A1 | ||||||||
5.750%, 06/26/2037 (C) | 17 | 18 | ||||||
BCAP LLC Trust, | ||||||||
5.500%, 04/26/2037 (A) (C) | 46 | 47 | ||||||
BCAP LLC Trust, | ||||||||
5.500%, 11/26/2034 (C) | 178 | 185 | ||||||
BCAP LLC Trust, Ser 2010-RR12, Cl 2A5 | ||||||||
4.500%, 01/26/2036 (A) (C) | 96 | 96 | ||||||
BCAP LLC Trust, Ser 2010-RR5, Cl 2A5 | ||||||||
5.462%, 04/26/2037 (A) (C) | 152 | 155 | ||||||
BCAP LLC Trust, | ||||||||
3.660%, 04/26/2035 (A) (C) | 16 | 16 | ||||||
BCAP LLC Trust, | ||||||||
2.072%, 07/26/2045 (A) (C) | 161 | 161 | ||||||
BCAP LLC Trust, | ||||||||
0.814%, 02/26/2047 (A) (C) | 14 | 14 | ||||||
BCAP LLC Trust, | ||||||||
0.988%, 09/26/2037 (A) (C) | 280 | 258 | ||||||
BCAP LLC Trust, | ||||||||
5.000%, 08/26/2037 (A) (C) | 141 | 143 | ||||||
BCAP LLC Trust, | ||||||||
0.318%, 05/28/2036 (A) (C) | 91 | 90 | ||||||
BCAP LLC Trust, | ||||||||
3.681%, 07/26/2036 (A) (C) | 7 | 7 | ||||||
BCAP LLC Trust, | ||||||||
0.358%, 05/26/2036 (A) (C) | 249 | 237 | ||||||
| Description | Face Amount ($ Thousands) | Market Value ($ Thousands) | ||||||
BCAP LLC Trust, | ||||||||
0.338%, 08/26/2036 (A) (C) | $ | 142 | $ | 139 | ||||
Bear Stearns Adjustable Rate Mortgage Trust, Ser 2004-2, Cl 14A | ||||||||
3.062%, 05/25/2034 (A) (C) | 28 | 27 | ||||||
Bear Stearns Adjustable Rate Mortgage Trust, Ser 2005-5, Cl A1 | ||||||||
2.220%, 08/25/2035 (A) (C) | 98 | 99 | ||||||
Bear Stearns ALT-A Trust, Ser 2004-12, Cl 1A3 | ||||||||
0.871%, 01/25/2035 (A) (C) | 304 | 296 | ||||||
Bear Stearns ALT-A Trust, Ser 2004-6, Cl 1A | ||||||||
0.814%, 07/25/2034 (A) (C) | 202 | 193 | ||||||
Bear Stearns ARM Trust, | ||||||||
2.524%, 10/25/2033 (A) (C) | 842 | 835 | ||||||
Bear Stearns Commercial Mortgage Securities, | ||||||||
0.736%, 06/11/2041 (A) (C) | 1,124 | 1 | ||||||
Bear Stearns Commercial Mortgage Securities, | ||||||||
5.140%, 10/12/2042 (A) | 234 | 236 | ||||||
Bear Stearns Commercial Mortgage Securities, | ||||||||
5.438%, 03/11/2039 (A) | 94 | 96 | ||||||
Bear Stearns Commercial Mortgage Securities, | ||||||||
6.084%, 06/11/2050 (A) | 150 | 165 | ||||||
CAM Mortgage Trust, | ||||||||
2.600%, 05/15/2048 (C) | 14 | 14 | ||||||
CD Commercial Mortgage Trust, Ser 2005-CD1, Cl AJ | ||||||||
5.226%, 07/15/2044 (A) | 100 | 102 | ||||||
CD Commercial Mortgage Trust, Ser 2006-CD2, Cl AM | ||||||||
5.351%, 01/15/2046 (A) | 120 | 124 | ||||||
CFCRE Commercial Mortgage Trust, Ser 2011-C1, Cl A4 | ||||||||
4.961%, 04/15/2044 (A) (C) | 359 | 404 | ||||||
Chase Mortgage Finance, | ||||||||
2.466%, 02/25/2037 (A) (C) | 62 | 62 | ||||||
| SEI Institutional Managed Trust / Semi-Annual Report / March 31, 2015 | 91 |
SCHEDULE OF INVESTMENTS (Unaudited)
U.S. Fixed Income Fund (Continued)
March 31, 2015
| Description | Face Amount ($ Thousands) | Market Value ($ Thousands) | ||||||
Chase Mortgage Finance, | ||||||||
2.498%, 02/25/2037 (A) (C) | $ | 36 | $ | 36 | ||||
Chase Mortgage Finance, | ||||||||
2.603%, 07/25/2037 (A) (C) | 78 | 78 | ||||||
Chase Mortgage Finance, | ||||||||
2.507%, 07/25/2037 (A) (C) | 82 | 83 | ||||||
Citigroup Commercial Mortgage Trust, Ser 2013-GC17, Cl A4 | ||||||||
4.131%, 11/10/2046 | 96 | 106 | ||||||
Citigroup Commercial Mortgage Trust, Ser 2013-SMP, Cl A | ||||||||
2.110%, 01/12/2030 (C) | 563 | 571 | ||||||
Citigroup Commercial Mortgage Trust, Ser 2014-GC19, Cl AAB | ||||||||
3.552%, 03/10/2047 | 189 | 201 | ||||||
Citigroup Commercial Mortgage Trust, Ser 2014-GC25, Cl AS | ||||||||
4.017%, 10/10/2047 | 140 | 150 | ||||||
Citigroup Commercial Mortgage Trust, Ser 2015-GC27, Cl A5 | ||||||||
3.137%, 02/10/2048 | 151 | 155 | ||||||
Citigroup Mortgage Loan Trust, Ser 2005-2, Cl 2A11 | ||||||||
5.500%, 05/25/2035 (C) | 71 | 74 | ||||||
Citigroup Mortgage Loan Trust, Ser 2008-AR4, Cl 1A1A | ||||||||
2.720%, 11/25/2038 (A) (C) | 133 | 134 | ||||||
Citigroup Mortgage Loan Trust, Ser 2010-7, Cl 10A1 | ||||||||
2.610%, 02/25/2035 (A) (C) | 30 | 30 | ||||||
Citigroup Mortgage Loan Trust, Ser 2010-8, Cl 5A6 | ||||||||
4.000%, 11/25/2036 (C) | 345 | 351 | ||||||
Citigroup Mortgage Loan Trust, Ser 2010-8, Cl 6A6 | ||||||||
4.500%, 12/25/2036 (C) | 174 | 178 | ||||||
Citigroup/Deutsche Bank Commercial Mortgage Trust, Ser 2006-CD2, Cl X, IO | ||||||||
0.086%, 01/15/2046 (A) (C) | 11,874 | 4 | ||||||
Citigroup/Deutsche Bank Commercial Mortgage Trust, Ser 2007-CD4, Cl XC, IO | ||||||||
0.373%, 12/11/2049 (A) (C) | 10,114 | 59 | ||||||
COBALT Commercial Mortgage Trust, Ser 2007-C2, Cl AMFX | ||||||||
5.526%, 04/15/2047 (A) | 125 | 134 | ||||||
| Description | Face Amount ($ Thousands) | Market Value ($ Thousands) | ||||||
COMM Mortgage Trust, | ||||||||
5.116%, 06/10/2044 (A) | $ | 308 | $ | 309 | ||||
COMM Mortgage Trust, | ||||||||
4.205%, 07/10/2046 (C) | 338 | 372 | ||||||
COMM Mortgage Trust, | ||||||||
1.901%, 08/15/2045 (A) | 741 | 72 | ||||||
COMM Mortgage Trust, | ||||||||
1.801%, 10/15/2045 | 94 | 95 | ||||||
COMM Mortgage Trust, | ||||||||
1.678%, 12/10/2045 | 980 | 987 | ||||||
COMM Mortgage Trust, | ||||||||
3.288%, 12/10/2044 | 79 | 84 | ||||||
COMM Mortgage Trust, Ser 2013-CR12, Cl A4 | ||||||||
4.046%, 10/10/2046 | 32 | 35 | ||||||
COMM Mortgage Trust, Ser 2013-CR12, Cl AM | ||||||||
4.300%, 10/10/2046 | 70 | 77 | ||||||
COMM Mortgage Trust, Ser 2013-CR12, Cl B | ||||||||
4.762%, 10/10/2046 (A) | 30 | 33 | ||||||
COMM Mortgage Trust, Ser 2013-CR12, Cl C | ||||||||
5.085%, 10/10/2046 (A) | 10 | 11 | ||||||
COMM Mortgage Trust, Ser 2013-CR13, Cl XA, IO | ||||||||
1.008%, 12/10/2023 (A) | 4,049 | 228 | ||||||
COMM Mortgage Trust, | ||||||||
3.282%, 01/10/2046 | 149 | 154 | ||||||
COMM Mortgage Trust, Ser 2014-CR18, Cl ASB | ||||||||
3.452%, 07/15/2047 | 165 | 175 | ||||||
COMM Mortgage Trust, Ser 2014-CR18, Cl XA, IO | ||||||||
1.300%, 07/15/2047 (A) | 2,336 | 180 | ||||||
COMM Mortgage Trust, Ser 2014-CR19, Cl A5 | ||||||||
3.796%, 08/10/2047 | 699 | 755 | ||||||
COMM Mortgage Trust, Ser 2014-CR20, Cl ASB | ||||||||
3.305%, 11/10/2047 | 64 | 67 | ||||||
COMM Mortgage Trust, | ||||||||
0.976%, 08/13/2027 (A) (C) | 100 | 100 | ||||||
COMM Mortgage Trust, Ser 2014-SAVA, Cl D | ||||||||
3.275%, 06/15/2034 (A) (C) | 320 | 320 | ||||||
| 92 | SEI Institutional Managed Trust / Semi-Annual Report / March 31, 2015 |
| Description | Face Amount ($ Thousands) | Market Value ($ Thousands) | ||||||
COMM Mortgage Trust, Ser 2014-TWC, Cl A | ||||||||
1.022%, 02/13/2032 (A) (C) | $ | 125 | $ | 125 | ||||
COMM Mortgage Trust, Ser 2014-UBS3, Cl A4 | ||||||||
3.819%, 06/12/2047 | 197 | 213 | ||||||
COMM Mortgage Trust, Ser 2014-UBS4, Cl A5 | ||||||||
3.694%, 08/10/2047 | 750 | 801 | ||||||
COMM Mortgage Trust, Ser 2014-UBS5, Cl A4 | ||||||||
3.838%, 09/10/2047 | 157 | 170 | ||||||
COMM Mortgage Trust, Ser 2014-UBS5, Cl ASB | ||||||||
3.548%, 09/10/2047 | 103 | 109 | ||||||
COMM Mortgage Trust, Ser 2015-CR22, Cl A5 | ||||||||
3.309%, 03/10/2048 | 144 | 150 | ||||||
Commercial Mortgage Pass-Through Certificates, | ||||||||
1.077%, 06/11/2027 (A) (C) | 423 | 421 | ||||||
Commercial Mortgage Pass-Through Certificates, | ||||||||
3.528%, 04/10/2047 | 296 | 314 | ||||||
Commercial Mortgage Pass-Through Certificates, | ||||||||
1.325%, 06/15/2034 (A) (C) | 490 | 489 | ||||||
Commercial Mortgage Pass-Through Certificates, | ||||||||
1.428%, 03/10/2047 (A) | 2,264 | 195 | ||||||
Commercial Mortgage Pass-Through Certificates, | ||||||||
4.048%, 12/10/2047 (A) | 372 | 398 | ||||||
Commercial Mortgage Pass-Through Certificates, | ||||||||
3.387%, 08/10/2024 | 342 | 361 | ||||||
Commercial Mortgage Trust, Ser 2005-GG5, Cl A5 | ||||||||
5.224%, 04/10/2037 (A) | 147 | 148 | ||||||
Countrywide Home Loan Mortgage Pass-Through Trust, | ||||||||
5.000%, 10/25/2033 (C) | 127 | 132 | ||||||
Countrywide Home Loan Mortgage Pass-Through Trust, | ||||||||
5.250%, 01/25/2034 (C) | 202 | 211 | ||||||
| Description | Face Amount ($ Thousands) | Market Value ($ Thousands) | ||||||
Countrywide Home Loan Mortgage Pass-Through Trust, | ||||||||
9.548%, 08/25/2018 (A) (C) | $ | 8 | $ | 9 | ||||
Countrywide Home Loan Mortgage Pass-Through Trust, | ||||||||
4.500%, 06/25/2019 (C) | 35 | 36 | ||||||
Credit Suisse First Boston Mortgage Securities, Ser 2003-27, Cl 5A3 | ||||||||
5.250%, 11/25/2033 (C) | 152 | 155 | ||||||
Credit Suisse First Boston Mortgage Securities, Ser 2003-29, Cl 5A1 | ||||||||
7.000%, 12/25/2033 (C) | 85 | 90 | ||||||
Credit Suisse First Boston Mortgage Securities, Ser 2003-29, Cl 8A1 | ||||||||
6.000%, 11/25/2018 (C) | 77 | 81 | ||||||
Credit Suisse First Boston Mortgage Securities, Ser 2003-AR24, Cl 2A4 | ||||||||
2.550%, 10/25/2033 (A) (C) | 705 | 695 | ||||||
Credit Suisse First Boston Mortgage Securities, Ser 2005-C5, Cl A4 | ||||||||
5.100%, 08/15/2038 (A) | 100 | 100 | ||||||
Credit Suisse Mortgage Capital Certificates, | ||||||||
5.648%, 03/15/2039 (A) | 205 | 211 | ||||||
Credit Suisse Mortgage Capital Certificates, | ||||||||
3.500%, 12/27/2036 (A) (C) | 87 | 88 | ||||||
Credit Suisse Mortgage Capital Certificates, | ||||||||
1.814%, 07/28/2036 (A) (C) | 73 | 73 | ||||||
Credit Suisse Mortgage Capital Certificates, | ||||||||
2.176%, 03/27/2046 (A) (C) | 84 | 84 | ||||||
CSAIL Commercial Mortgage Trust, Ser 2015-C1, Cl A4 | ||||||||
3.505%, 04/15/2050 | 318 | 337 | ||||||
CSAIL Commercial Mortgage Trust, Ser 2015-C1, Cl AS | ||||||||
3.791%, 04/15/2050 | 141 | 149 | ||||||
CSMC, Ser 2009-2R, Cl 1A14 | ||||||||
2.619%, 09/26/2034 (A) (C) | 503 | 497 | ||||||
CSMC, Ser 2009-2R, Cl 1A16 | ||||||||
2.619%, 09/26/2034 (A) (C) | 1,000 | 1,000 | ||||||
| SEI Institutional Managed Trust / Semi-Annual Report / March 31, 2015 | 93 |
SCHEDULE OF INVESTMENTS (Unaudited)
U.S. Fixed Income Fund (Continued)
March 31, 2015
| Description | Face Amount ($ Thousands) | Market Value ($ Thousands) | ||||||
CSMC, Ser 2010-16, Cl A3 | ||||||||
3.151%, 06/25/2050 (A) (C) | $ | 99 | $ | 100 | ||||
CSMC, Ser 2010-3R, Cl 2A3 | ||||||||
4.500%, 12/26/2036 (A) (C) | 770 | 775 | ||||||
CSMC, Ser 2012-11R, Cl A6 | ||||||||
1.172%, 06/28/2047 (A) (C) | 326 | 314 | ||||||
CSMC, Ser 2014-7R, Cl 8A1 | ||||||||
2.253%, 07/27/2037 (A) (C) | 1,049 | 1,051 | ||||||
CSMC, Ser 2014-ICE, Cl A | ||||||||
1.050%, 04/15/2027 (A) (C) | 168 | 167 | ||||||
CW Capital Cobalt, Ser 2006-C1, Cl A4 | ||||||||
5.223%, 08/15/2048 | 187 | 196 | ||||||
DBRR Trust, Ser 2011-LC2, Cl A4A | ||||||||
4.537%, 07/12/2044 (A) (C) | 500 | 557 | ||||||
DBRR Trust, Ser 2013-EZ2, Cl A | ||||||||
0.853%, 02/25/2045 (A) (C) | 19 | 19 | ||||||
DBRR Trust, Ser 2013-EZ3, Cl A | ||||||||
1.636%, 12/18/2049 (A) (C) | 215 | 216 | ||||||
DBUBS Mortgage Trust, Ser 2011-LC1A, Cl A1 | ||||||||
3.742%, 11/10/2046 (C) | 430 | 437 | ||||||
DBUBS Mortgage Trust, Ser 2011-LC2A, Cl A4 | ||||||||
4.537%, 07/10/2044 (C) | 509 | 571 | ||||||
Deutsche ALT-A Securities Alternate Loan Trust, | ||||||||
5.752%, 02/25/2020 (A) (C) | 49 | 51 | ||||||
FDIC Trust, Ser 2013-N1, Cl A | ||||||||
4.500%, 10/25/2018 (C) | 41 | 41 | ||||||
GE Business Loan Trust, | ||||||||
0.345%, 04/16/2035 (A) (C) | 225 | 213 | ||||||
GE Capital Assurance, Ser 2003-1, Cl A4 | ||||||||
5.254%, 05/12/2035 (A) (C) | 50 | 51 | ||||||
GMAC Commercial Mortgage Securities, Ser 2006-C1, Cl AM | ||||||||
5.290%, 11/10/2045 (A) | 380 | 389 | ||||||
GMAC Mortgage Loan Trust, Ser 2003-AR1, Cl A4 | ||||||||
2.881%, 10/19/2033 (A) (C) | 102 | 101 | ||||||
GMAC Mortgage Loan Trust, Ser 2003-GH2, Cl A4 | ||||||||
5.000%, 10/25/2033 (C) | 84 | 83 | ||||||
GMAC Mortgage Loan Trust, Ser 2003-J7, Cl A7 | ||||||||
5.000%, 11/25/2033 (C) | 112 | 113 | ||||||
| Description | Face Amount ($ Thousands) | Market Value ($ Thousands) | ||||||
GMAC Mortgage Loan Trust, Ser 2004-J5, Cl A7 | ||||||||
6.500%, 01/25/2035 (C) | $ | 98 | $ | 102 | ||||
GMAC Mortgage Loan Trust, Ser 2004-J6, Cl 1A1 | ||||||||
5.000%, 01/25/2020 (C) | 35 | 36 | ||||||
Greenwich Capital Commercial Funding, | ||||||||
5.736%, 12/10/2049 | 40 | 43 | ||||||
GS Mortgage Securities Trust, Ser 2006-GG6, Cl A4 | ||||||||
5.553%, 04/10/2038 (A) | 170 | 173 | ||||||
GS Mortgage Securities Trust, Ser 2006-GG8, Cl X, IO | ||||||||
0.546%, 11/10/2039 (A) (C) | 2,473 | 17 | ||||||
GS Mortgage Securities Trust, Ser 2011-GC3, Cl A2 | ||||||||
3.645%, 03/10/2044 (C) | 233 | 237 | ||||||
GS Mortgage Securities Trust, Ser 2012-GC6, Cl A1 | ||||||||
1.282%, 01/10/2045 | 11 | 11 | ||||||
GS Mortgage Securities Trust, Ser 2012-GCJ7, Cl A1 | ||||||||
1.144%, 05/10/2045 | 80 | 80 | ||||||
GS Mortgage Securities Trust, Ser 2012-GCJ7, Cl A2 | ||||||||
2.318%, 05/10/2045 | 122 | 124 | ||||||
GS Mortgage Securities Trust, Ser 2013-GC16, Cl B | ||||||||
5.161%, 11/10/2046 (A) | 110 | 125 | ||||||
GS Mortgage Securities Trust, Ser 2013-KING, Cl A | ||||||||
2.706%, 12/10/2027 (C) | 114 | 116 | ||||||
GS Mortgage Securities Trust, Ser 2013-NYC5, Cl A | ||||||||
2.318%, 01/10/2030 (C) | 122 | 124 | ||||||
GS Mortgage Securities Trust, Ser 2014-GC18, Cl AAB | ||||||||
3.648%, 01/10/2047 | 153 | 164 | ||||||
GS Mortgage Securities Trust, Ser 2014-GC20, Cl AAB | ||||||||
3.655%, 04/10/2047 | 383 | 411 | ||||||
GS Mortgage Securities Trust, Ser 2014-GC24, Cl AAB | ||||||||
3.650%, 09/10/2047 | 584 | 627 | ||||||
GS Mortgage Securities Trust, Ser 2014-GC26, Cl AAB | ||||||||
3.365%, 11/10/2047 | 212 | 224 | ||||||
GS Mortgage Securities Trust, Ser 2015-GC28, Cl A5 | ||||||||
3.396%, 02/10/2048 | 291 | 304 | ||||||
| 94 | SEI Institutional Managed Trust / Semi-Annual Report / March 31, 2015 |
| Description | Face Amount ($ Thousands) | Market Value ($ Thousands) | ||||||
GS Mortgage Securities Trust, Ser 2015-GC28, Cl AS | ||||||||
3.759%, 02/10/2048 | $ | 317 | $ | 333 | ||||
GSMPS Mortgage Loan Trust, Ser 2005-RP3, Cl 1AF | ||||||||
0.521%, 09/25/2035 (A) (C) | 143 | 122 | ||||||
GSR Mortgage Loan Trust, Ser 2003-13, Cl 1A1 | ||||||||
2.582%, 10/25/2033 (A) (C) | 158 | 160 | ||||||
GSR Mortgage Loan Trust, Ser 2004-8F, Cl 2A3 | ||||||||
6.000%, 09/25/2034 (C) | 89 | 93 | ||||||
GSR Mortgage Loan Trust, Ser 2005-5F, Cl 8A3 | ||||||||
0.674%, 06/25/2035 (A) (C) | 14 | 14 | ||||||
GSR Mortgage Loan Trust, Ser 2007-1F, Cl 2A4 | ||||||||
5.500%, 01/25/2037 (C) | 25 | 25 | ||||||
HILT Mortgage Trust, | ||||||||
1.072%, 07/15/2029 (A) (C) | 305 | 304 | ||||||
Homestar Mortgage Acceptance, | ||||||||
0.624%, 10/25/2034 (A) (C) | 826 | 827 | ||||||
Homestar Mortgage Acceptance, | ||||||||
1.274%, 01/25/2035 (A) (C) | 1,640 | 1,599 | ||||||
Impac Secured Assets Trust, Ser 2003-2, Cl A1 | ||||||||
5.500%, 08/25/2033 (C) | 86 | 89 | ||||||
Impac Secured Assets Trust, Ser 2004-3, Cl M1 | ||||||||
1.074%, 11/25/2034 (A) (C) | 720 | 625 | ||||||
Impac Secured Assets Trust, Ser 2006-1, Cl 2A1 | ||||||||
0.524%, 05/25/2036 (A) (C) | 74 | 71 | ||||||
Impac Secured Assets Trust, Ser 2006-2, Cl 2A1 | ||||||||
0.521%, 08/25/2036 (A) (C) | 59 | 58 | ||||||
Impac Secured Assets Trust, Ser 2007-2, Cl 2A | ||||||||
0.424%, 04/25/2037 (A) (C) | 229 | 211 | ||||||
Impac Secured Assets Trust, Ser 2007-A, Cl M1 | ||||||||
0.574%, 05/25/2037 (A) (C) | 537 | 505 | ||||||
Impact Funding LLC, | ||||||||
5.314%, 01/25/2051 (C) | 942 | 1,100 | ||||||
JPMBB Commercial Mortgage Securities Trust, | ||||||||
5.081%, 11/15/2045 (A) | 60 | 67 | ||||||
| Description | Face Amount ($ Thousands) | Market Value ($ Thousands) | ||||||
JPMBB Commercial Mortgage Securities Trust, | ||||||||
4.888%, 01/15/2047 (A) | $ | 30 | $ | 34 | ||||
JPMBB Commercial Mortgage Securities Trust, | ||||||||
4.562%, 09/15/2047 (A) | 160 | 168 | ||||||
JPMBB Commercial Mortgage Securities Trust, | ||||||||
4.065%, 11/15/2047 | 130 | 140 | ||||||
JPMBB Commercial Mortgage Securities Trust, | ||||||||
3.407%, 11/15/2047 | 33 | 35 | ||||||
JPMorgan Chase Commercial Mortgage Securities Trust, Ser 2004-LN2, Cl A2 | ||||||||
5.115%, 07/15/2041 | 13 | 13 | ||||||
JPMorgan Chase Commercial Mortgage Securities Trust, Ser 2005-CB13, Cl A4 | ||||||||
5.260%, 01/12/2043 (A) | 1,100 | 1,113 | ||||||
JPMorgan Chase Commercial Mortgage Securities Trust, Ser 2005-LDP4, Cl A4 | ||||||||
4.918%, 10/15/2042 (A) | 483 | 485 | ||||||
JPMorgan Chase Commercial Mortgage Securities Trust, Ser 2005-LDP5, Cl A4 | ||||||||
5.228%, 12/15/2044 (A) | 135 | 136 | ||||||
JPMorgan Chase Commercial Mortgage Securities Trust, Ser 2006-CB14, Cl A4 | ||||||||
5.481%, 12/12/2044 (A) | 102 | 104 | ||||||
JPMorgan Chase Commercial Mortgage Securities Trust, Ser 2006-CB15, Cl X1, IO | ||||||||
0.213%, 06/12/2043 (A) | 10,007 | 31 | ||||||
JPMorgan Chase Commercial Mortgage Securities Trust, Ser 2006-LDP8, Cl A4 | ||||||||
5.399%, 05/15/2045 | 308 | 321 | ||||||
JPMorgan Chase Commercial Mortgage Securities Trust, Ser 2006-LDP9, Cl A3SF | ||||||||
0.330%, 05/15/2047 (A) | 56 | 56 | ||||||
JPMorgan Chase Commercial Mortgage Securities Trust, Ser 2007-CB20, Cl AM | ||||||||
5.868%, 02/12/2051 (A) | 90 | 99 | ||||||
| SEI Institutional Managed Trust / Semi-Annual Report / March 31, 2015 | 95 |
SCHEDULE OF INVESTMENTS (Unaudited)
U.S. Fixed Income Fund (Continued)
March 31, 2015
| Description | Face Amount ($ Thousands) | Market Value ($ Thousands) | ||||||
JPMorgan Chase Commercial Mortgage Securities Trust, Ser 2010-C2, Cl A3 | ||||||||
4.070%, 11/15/2043 (C) | $ | 733 | $ | 800 | ||||
JPMorgan Chase Commercial Mortgage Securities Trust, Ser 2010-CNTR, Cl A1 | ||||||||
3.300%, 08/05/2032 (C) | 93 | 96 | ||||||
JPMorgan Chase Commercial Mortgage Securities Trust, Ser 2011-C3, Cl A2 | ||||||||
3.673%, 02/15/2046 (C) | 214 | 220 | ||||||
JPMorgan Chase Commercial Mortgage Securities Trust, Ser 2011-C4, Cl A3 | ||||||||
4.106%, 07/15/2046 (C) | 785 | 841 | ||||||
JPMorgan Chase Commercial Mortgage Securities Trust, Ser 2011-C5, Cl A2 | ||||||||
3.149%, 08/15/2046 | 1,044 | 1,072 | ||||||
JPMorgan Chase Commercial Mortgage Securities Trust, Ser 2012-LC9, Cl A2 | ||||||||
1.677%, 12/15/2047 | 121 | 122 | ||||||
JPMorgan Chase Commercial Mortgage Securities Trust, Ser 2013-C10, Cl ASB | ||||||||
2.702%, 12/15/2047 | 244 | 250 | ||||||
JPMorgan Chase Commercial Mortgage Securities Trust, Ser 2013-JWRZ, Cl A | ||||||||
0.955%, 04/15/2030 (A) (C) | 350 | 350 | ||||||
JPMorgan Mortgage Trust, Ser 2004-A3, Cl 4A1 | ||||||||
2.506%, 07/25/2034 (A) (C) | 30 | 31 | ||||||
JPMorgan Mortgage Trust, Ser 2004-A4, Cl 1A1 | ||||||||
2.550%, 09/25/2034 (A) (C) | 31 | 32 | ||||||
JPMorgan Mortgage Trust, Ser 2006-A2, Cl 4A1 | ||||||||
2.503%, 08/25/2034 (A) (C) | 251 | 251 | ||||||
JPMorgan Mortgage Trust, Ser 2006-A2, Cl 5A3 | ||||||||
2.431%, 11/25/2033 (A) (C) | 128 | 128 | ||||||
JPMorgan Mortgage Trust, Ser 2006-A3, Cl 6A1 | ||||||||
2.540%, 08/25/2034 (A) (C) | 121 | 122 | ||||||
JPMorgan Mortgage Trust, Ser 2015-IVR2, Cl A2 | ||||||||
2.773%, 03/25/2045 (A) (C) | 301 | 304 | ||||||
JPMorgan Resecuritization Trust, Ser 2010-4, Cl 7A1 | ||||||||
1.865%, 08/26/2035 (A) (C) | 35 | 35 | ||||||
| Description | Face Amount ($ Thousands) | Market Value ($ Thousands) | ||||||
LB Commercial Conduit Mortgage Trust, | ||||||||
5.906%, 07/15/2044 (A) | $ | 60 | $ | 65 | ||||
LB-UBS Commercial Mortgage Trust, Ser 2006-C1, Cl A4 | ||||||||
5.156%, 02/15/2031 | 193 | 196 | ||||||
LB-UBS Commercial Mortgage Trust, | ||||||||
0.356%, 02/15/2041 (A) (C) | 6,960 | 19 | ||||||
LB-UBS Commercial Mortgage Trust, Ser 2006-C3, Cl A4 | ||||||||
5.661%, 03/15/2039 (A) | 312 | 320 | ||||||
LB-UBS Commercial Mortgage Trust, Ser 2006-C4, Cl A4 | ||||||||
5.822%, 06/15/2038 (A) | 119 | 124 | ||||||
LB-UBS Commercial Mortgage Trust, Ser 2007-C7, Cl AM | ||||||||
6.169%, 09/15/2045 (A) | 40 | 44 | ||||||
Master Alternative Loans Trust, | ||||||||
6.000%, 12/25/2033 (C) | 71 | 71 | ||||||
Master Resecuritization Trust, | ||||||||
0.000%, 05/28/2035 (B) (C) | 32 | 26 | ||||||
MASTR Asset Securitization Trust, Ser 2003-11, Cl 9A6 | ||||||||
5.250%, 12/25/2033 (C) | 164 | 172 | ||||||
MASTR Asset Securitization Trust, Ser 2003-2, Cl 1A1 | ||||||||
5.000%, 03/25/2018 (C) | 10 | 10 | ||||||
MASTR Asset Securitization Trust, Ser 2003-3, Cl 3A18 | ||||||||
5.500%, 04/25/2033 (C) | 37 | 37 | ||||||
Merrill Lynch Mortgage Investors Trust, | ||||||||
2.582%, 07/25/2033 (A) (C) | 32 | 29 | ||||||
Merrill Lynch Mortgage Investors Trust, | ||||||||
2.602%, 02/25/2034 (A) (C) | 209 | 211 | ||||||
Merrill Lynch Mortgage Trust, | ||||||||
5.047%, 07/12/2038 (A) | 293 | 294 | ||||||
Merrill Lynch Mortgage Trust, | ||||||||
5.367%, 01/12/2044 (A) | 120 | 123 | ||||||
Merrill Lynch/Countrywide Commercial Mortgage Trust, | ||||||||
0.633%, 12/12/2049 (A) (C) | 2,711 | 25 | ||||||
| 96 | SEI Institutional Managed Trust / Semi-Annual Report / March 31, 2015 |
| Description | Face Amount ($ Thousands) | Market Value ($ Thousands) | ||||||
MLCC Mortgage Investors, | ||||||||
0.895%, 04/25/2029 (A) (C) | $ | 60 | $ | 56 | ||||
Morgan Stanley Bank of America Merrill Lynch Trust, | ||||||||
3.930%, 11/15/2045 | 390 | 412 | ||||||
Morgan Stanley Bank of America Merrill Lynch Trust, | ||||||||
1.394%, 07/15/2046 | 322 | 324 | ||||||
Morgan Stanley Bank of America Merrill Lynch Trust, | ||||||||
2.918%, 02/15/2046 | 50 | 51 | ||||||
Morgan Stanley Bank of America Merrill Lynch Trust, | ||||||||
3.214%, 02/15/2046 | 21 | 21 | ||||||
Morgan Stanley Bank of America Merrill Lynch Trust, | ||||||||
1.970%, 05/15/2046 | 122 | 124 | ||||||
Morgan Stanley Bank of America Merrill Lynch Trust, | ||||||||
3.456%, 05/15/2046 | 80 | 83 | ||||||
Morgan Stanley Bank of America Merrill Lynch Trust, | ||||||||
3.654%, 04/15/2047 | 139 | 149 | ||||||
Morgan Stanley Bank of America Merrill Lynch Trust, | ||||||||
3.477%, 06/15/2047 | 63 | 67 | ||||||
Morgan Stanley Capital I Trust, Ser 2005-IQ10, Cl A4A | ||||||||
5.230%, 09/15/2042 (A) | 137 | 137 | ||||||
Morgan Stanley Capital I Trust, Ser 2006-T23, Cl A4 | ||||||||
5.877%, 08/12/2041 (A) | 540 | 565 | ||||||
Morgan Stanley Capital I Trust, Ser 2007-HQ11, Cl A4FL | ||||||||
0.311%, 02/12/2044 (A) | 990 | 976 | ||||||
Morgan Stanley Capital I Trust, Ser 2007-HQ11, Cl X, IO | ||||||||
0.213%, 02/12/2044 (A) (C) | 6,455 | 22 | ||||||
Morgan Stanley Capital I Trust, Ser 2007-T27, Cl A4 | ||||||||
5.650%, 06/11/2042 (A) | 100 | 108 | ||||||
Morgan Stanley Capital I Trust, Ser 2011-C2, Cl A2 | ||||||||
3.476%, 06/15/2044 (C) | 403 | 414 | ||||||
| Description | Face Amount ($ Thousands) | Market Value ($ Thousands) | ||||||
Morgan Stanley Capital I Trust, Ser 2011-C3, Cl A2 | ||||||||
3.224%, 07/15/2049 | $ | 264 | $ | 271 | ||||
Morgan Stanley Capital I Trust, Ser 2011-C3, Cl A3 | ||||||||
4.054%, 07/15/2049 | 100 | 108 | ||||||
Morgan Stanley Capital I Trust, Ser 2011-C3, Cl A4 | ||||||||
4.118%, 07/15/2049 | 170 | 187 | ||||||
Morgan Stanley Capital I Trust, Ser 2014-CPT, Cl AM | ||||||||
3.402%, 07/13/2029 (A) (C) | 770 | 810 | ||||||
Morgan Stanley Capital I Trust, Ser 2014-CPT, Cl B | ||||||||
3.446%, 07/13/2029 (A) (C) | 650 | 680 | ||||||
Morgan Stanley Re-REMIC Trust, Ser 2010-R4, Cl 2A | ||||||||
0.418%, 07/26/2036 (A) (C) | 50 | 50 | ||||||
Morgan Stanley Re-REMIC Trust, Ser 2012-IO, Cl AXA | ||||||||
1.000%, 03/27/2051 (C) | 96 | 96 | ||||||
Morgan Stanley Re-REMIC Trust, Ser 2012-XA, Cl A | ||||||||
2.000%, 07/27/2049 (C) | 310 | 310 | ||||||
Morgan Stanley Re-REMIC Trust, Ser 2012-XA, Cl B | ||||||||
0.250%, 07/27/2049 (C) | 130 | 113 | ||||||
Nomura Asset Acceptance Alternative Loan Trust, Ser 2007-1, Cl 1A3 | ||||||||
5.957%, 03/25/2047 (C) | 180 | 182 | ||||||
Nomura Asset Acceptance Alternative Loan Trust, Ser 2007-1, Cl 1A4 | ||||||||
6.138%, 03/25/2047 (C) | 148 | 150 | ||||||
Nomura Resecuritization Trust, Ser 2015-4R, Cl 3A1 | ||||||||
2.475%, 01/26/2036 | 1,050 | 1,072 | ||||||
Ores NPL LLC, | ||||||||
3.081%, 09/25/2025 (C) | 87 | 87 | ||||||
Prime Mortgage Trust, Ser 2004-CL1, Cl 1A1 | ||||||||
6.000%, 02/25/2034 (C) | 51 | 54 | ||||||
Prime Mortgage Trust, Ser 2004-CL1, Cl 1PO, PO | ||||||||
0.000%, 02/25/2034 (B) (C) | 18 | 15 | ||||||
RAIT Trust, Ser 2014-FL3, Cl A | ||||||||
1.421%, 12/15/2031 (A) (C) | 245 | 247 | ||||||
RAMP Trust, | ||||||||
6.500%, 11/25/2031 (C) | 305 | 313 | ||||||
| SEI Institutional Managed Trust / Semi-Annual Report / March 31, 2015 | 97 |
SCHEDULE OF INVESTMENTS (Unaudited)
U.S. Fixed Income Fund (Continued)
March 31, 2015
| Description | Face Amount ($ Thousands) | Market Value ($ Thousands) | ||||||
RBSSP Resecuritization Trust, Ser 2010-9, Cl 7A5 | ||||||||
4.000%, 05/26/2037 (A) (C) | $ | 85 | $ | 86 | ||||
Residential Accredit Loans, Ser 2003-QS15, Cl A7 | ||||||||
5.500%, 08/25/2033 (C) | 270 | 275 | ||||||
Residential Accredit Loans, Ser 2003-QS18, Cl A1 | ||||||||
5.000%, 09/25/2018 (C) | 55 | 56 | ||||||
Residential Accredit Loans, Ser 2004-QA7, Cl A4 | ||||||||
5.500%, 05/25/2034 (C) | 290 | 297 | ||||||
Residential Asset Securitization Trust, Ser 2002-A13, Cl A4 | ||||||||
5.250%, 12/25/2017 (C) | 14 | 14 | ||||||
Residential Asset Securitization Trust, Ser 2003-A5, Cl A1 | ||||||||
5.500%, 06/25/2033 (C) | 59 | 60 | ||||||
Residential Asset Securitization Trust, Ser 2004-IP2, Cl 2A1 | ||||||||
2.477%, 12/25/2034 (A) (C) | 485 | 487 | ||||||
Salomon Brothers Mortgage Securities, | ||||||||
2.494%, 09/25/2033 (A) (C) | 81 | 82 | ||||||
Sequoia Mortgage Trust, Ser 2004-11, Cl A1 | ||||||||
0.474%, 12/20/2034 (A) (C) | 211 | 205 | ||||||
Springleaf Mortgage Loan Trust, Ser 2012-2A, Cl A | ||||||||
2.220%, 10/25/2057 (A) (C) | 49 | 49 | ||||||
Springleaf Mortgage Loan Trust, Ser 2012-2A, Cl M4 | ||||||||
6.000%, 10/25/2057 (A) (C) | 100 | 104 | ||||||
Springleaf Mortgage Loan Trust, Ser 2012-3A, Cl A | ||||||||
1.570%, 12/25/2059 (A) (C) | 108 | 108 | ||||||
Springleaf Mortgage Loan Trust, Ser 2013-1A, Cl A | ||||||||
1.270%, 06/25/2058 (A) (C) | 135 | 135 | ||||||
Springleaf Mortgage Loan Trust, Ser 2013-1A, Cl M1 | ||||||||
2.310%, 06/25/2058 (A) (C) | 103 | 101 | ||||||
Springleaf Mortgage Loan Trust, Ser 2013-2A, Cl A | ||||||||
1.780%, 12/25/2065 (A) (C) | 469 | 468 | ||||||
Springleaf Mortgage Loan Trust, Ser 2013-2A, Cl M1 | ||||||||
3.520%, 12/25/2065 (A) (C) | 125 | 127 | ||||||
Structured Adjustable Rate Mortgage Loan Trust, Ser 2004-5, Cl 2A | ||||||||
2.396%, 05/25/2034 (A) (C) | 297 | 296 | ||||||
| Description | Face Amount ($ Thousands) | Market Value ($ Thousands) | ||||||
Structured Adjustable Rate Mortgage Loan Trust, | ||||||||
2.353%, 06/25/2034 (A) (C) | $ | 27 | $ | 27 | ||||
Structured Asset Securities Mortgage Pass-Through Certificates, Ser 2003-24A, Cl 3A2 | ||||||||
2.380%, 07/25/2033 (A) (C) | 174 | 176 | ||||||
Structured Asset Securities Mortgage Pass-Through Certificates, Ser 2003-32, Cl 1A1 | ||||||||
5.474%, 11/25/2033 (A) (C) | 45 | 47 | ||||||
Structured Asset Securities Mortgage Pass-Through Certificates, Ser 2003-33H, Cl 1A1 | ||||||||
5.500%, 10/25/2033 (C) | 115 | 117 | ||||||
Structured Asset Securities Mortgage Pass-Through Certificates, Ser 2003-37A, Cl 2A | ||||||||
3.667%, 12/25/2033 (A) (C) | 52 | 52 | ||||||
Structured Asset Securities Mortgage Pass-Through Certificates, Ser 2004-5H, Cl A4 | ||||||||
5.540%, 12/25/2033 (C) | 188 | 194 | ||||||
TIAA Seasoned Commercial Mortgage Trust, | ||||||||
5.556%, 08/15/2039 (A) | 14 | 14 | ||||||
UBS Commercial Mortgage Trust, Ser 2012-C1, Cl XA, IO | ||||||||
2.278%, 05/10/2045 (A) (C) | 3,165 | 360 | ||||||
UBS-BAMLL Trust, | ||||||||
3.663%, 06/10/2030 (C) | 145 | 152 | ||||||
UBS-Barclays Commercial Mortgage Trust, | ||||||||
3.525%, 05/10/2063 | 130 | 139 | ||||||
UBS-Barclays Commercial Mortgage Trust, | ||||||||
1.750%, 05/10/2063 (A) (C) | 746 | 56 | ||||||
UBS-Barclays Commercial Mortgage Trust, | ||||||||
3.185%, 03/10/2046 | 93 | 97 | ||||||
UBS-Barclays Commercial Mortgage Trust, | ||||||||
3.244%, 04/10/2046 | 17 | 18 | ||||||
| 98 | SEI Institutional Managed Trust / Semi-Annual Report / March 31, 2015 |
| Description | Face Amount ($ Thousands) | Market Value ($ Thousands) | ||||||
Vendee Mortgage Trust, Ser 1993-1, Cl ZB | ||||||||
7.250%, 02/15/2023 | $ | 495 | $ | 566 | ||||
VNO Mortgage Trust, | ||||||||
2.996%, 11/15/2030 (C) | 100 | 102 | ||||||
VNO Mortgage Trust, | ||||||||
3.808%, 12/13/2029 (C) | 250 | 269 | ||||||
Wachovia Bank Commercial Mortgage Trust, | ||||||||
5.118%, 07/15/2042 (A) | 197 | 197 | ||||||
Wachovia Bank Commercial Mortgage Trust, | ||||||||
5.272%, 10/15/2044 (A) | 140 | 141 | ||||||
Wachovia Bank Commercial Mortgage Trust, Ser 2006C23, Cl A4 | ||||||||
5.418%, 01/15/2045 (A) | 774 | 787 | ||||||
Wachovia Bank Commercial Mortgage Trust, | ||||||||
5.383%, 12/15/2043 | 90 | 95 | ||||||
WaMu Mortgage Pass-Through Certificates, Ser 2003-AR10, Cl A7 | ||||||||
2.419%, 10/25/2033 (A) (C) | 137 | 139 | ||||||
WaMu Mortgage Pass-Through Certificates, Ser 2003-AR7, Cl A7 | ||||||||
2.299%, 08/25/2033 (A) (C) | 75 | 76 | ||||||
WaMu Mortgage Pass-Through Certificates, Ser 2003-AR8, Cl A | ||||||||
2.383%, 08/25/2033 (A) (C) | 38 | 39 | ||||||
WaMu Mortgage Pass-Through Certificates, Ser 2003-AR9, Cl 1A6 | ||||||||
2.405%, 09/25/2033 (A) (C) | 124 | 128 | ||||||
WaMu Mortgage Pass-Through Certificates, Ser 2003-S13, Cl 21A1 | ||||||||
4.500%, 12/25/2018 (C) | 26 | 26 | ||||||
WaMu Mortgage Pass-Through Certificates, Ser 2003-S4, Cl 2A10 | ||||||||
16.985%, 06/25/2033 (A) (C) | 17 | 19 | ||||||
WaMu Mortgage Pass-Through Certificates, Ser 2003-S9, Cl A8 | ||||||||
5.250%, 10/25/2033 (C) | 274 | 282 | ||||||
| Description | Face Amount ($ Thousands) | Market Value ($ Thousands) | ||||||
WaMu Mortgage Pass-Through Certificates, Ser 2004-AR3, Cl A1 | ||||||||
2.368%, 06/25/2034 (A) (C) | $ | 57 | $ | 57 | ||||
WaMu Mortgage Pass-Through Certificates, Ser 2004-AR3, Cl A2 | ||||||||
2.368%, 06/25/2034 (A) (C) | 85 | 86 | ||||||
WaMu Mortgage Pass-Through Certificates, Ser 2004-CB2, Cl 7A | ||||||||
5.500%, 08/25/2019 (C) | 83 | 85 | ||||||
WaMu Mortgage Pass-Through Certificates, Ser 2004-RA4, Cl 3A | ||||||||
7.500%, 07/25/2034 (C) | 205 | 214 | ||||||
WaMu Mortgage Pass-Through Certificates, Ser 2004-S2, Cl 2A4 | ||||||||
5.500%, 06/25/2034 (C) | 165 | 173 | ||||||
WaMu Mortgage Pass-Through Certificates, Ser 2005-AR13, Cl A1A1 | ||||||||
0.464%, 10/25/2045 (A)(C) | 853 | 782 | ||||||
WaMu Mortgage Pass-Through Certificates, Ser 2005-AR13, Cl A1A3 | ||||||||
0.954%, 10/25/2045 (A) (C) | 898 | 864 | ||||||
Wells Fargo Commercial Mortgage Trust, | ||||||||
2.710%, 03/18/2028 (A) (C) | 200 | 203 | ||||||
Wells Fargo Mortgage Loan Trust, Ser 2012-RR1, Cl A1 | ||||||||
2.847%, 08/27/2037 (A) (C) | 50 | 50 | ||||||
Wells Fargo Mortgage-Backed Securities Trust, Ser 2003-K, Cl 1A1 | ||||||||
2.490%, 11/25/2033 (A) (C) | 52 | 52 | ||||||
Wells Fargo Mortgage-Backed Securities Trust, Ser 2004-E, Cl A2 | ||||||||
2.631%, 05/25/2034 (A) (C) | 19 | 19 | ||||||
Wells Fargo Mortgage-Backed Securities Trust, | ||||||||
2.612%, 12/25/2034 (A) (C) | 117 | 118 | ||||||
Wells Fargo Mortgage-Backed Securities Trust, Ser 2004-EE, Cl 2A2 | ||||||||
2.612%, 12/25/2034 (A) (C) | 117 | 119 | ||||||
| SEI Institutional Managed Trust / Semi-Annual Report / March 31, 2015 | 99 |
SCHEDULE OF INVESTMENTS (Unaudited)
U.S. Fixed Income Fund (Continued)
March 31, 2015
| Description | Face Amount ($ Thousands) | Market Value ($ Thousands) | ||||||
Wells Fargo Mortgage-Backed Securities Trust, Ser 2004-EE, Cl 3A1 | ||||||||
2.496%, 12/25/2034 (A) (C) | $ | 57 | $ | 58 | ||||
Wells Fargo Mortgage-Backed Securities Trust, Ser 2004-H, Cl A1 | ||||||||
2.615%, 06/25/2034 (A) (C) | 223 | 224 | ||||||
Wells Fargo Mortgage-Backed Securities Trust, Ser 2004-I, Cl 1A1 | ||||||||
2.597%, 07/25/2034 (A) (C) | 127 | 128 | ||||||
Wells Fargo Mortgage-Backed Securities Trust, Ser 2004-P, Cl 2A1 | ||||||||
2.613%, 09/25/2034 (A) (C) | 216 | 216 | ||||||
Wells Fargo Mortgage-Backed Securities Trust, Ser 2004-V, Cl 1A1 | ||||||||
2.604%, 10/25/2034 (A) (C) | 63 | 63 | ||||||
Wells Fargo Mortgage-Backed Securities Trust, Ser 2004-V, Cl 1A2 | ||||||||
2.604%, 10/25/2034 (A) (C) | 125 | 127 | ||||||
Wells Fargo Mortgage-Backed Securities Trust, | ||||||||
2.620%, 03/25/2035 (A) (C) | 299 | 301 | ||||||
Wells Fargo Mortgage-Backed Securities Trust, | ||||||||
2.592%, 06/25/2035 (A) (C) | 107 | 108 | ||||||
WFRBS Commercial Mortgage Trust, Ser 2011-C3, Cl A4 | ||||||||
4.375%, 03/15/2044 (C) | 125 | 139 | ||||||
WFRBS Commercial Mortgage Trust, Ser 2011-C5, Cl A4 | ||||||||
3.667%, 11/15/2044 | 790 | 852 | ||||||
WFRBS Commercial Mortgage Trust, Ser 2012-C10, Cl XA, IO | ||||||||
1.787%, 12/15/2045 (A) (C) | 1,642 | 157 | ||||||
WFRBS Commercial Mortgage Trust, Ser 2012-C7, Cl XA, IO | ||||||||
1.569%, 06/15/2045 (A) (C) | 383 | 32 | ||||||
WFRBS Commercial Mortgage Trust, Ser 2013-C13, Cl XA, IO | ||||||||
1.451%, 05/15/2045 (A) (C) | 1,132 | 90 | ||||||
WFRBS Commercial Mortgage Trust, Ser 2014-C20, Cl XA, IO | ||||||||
1.236%, 01/15/2024 | 3,146 | 234 | ||||||
| Description | Face Amount ($ Thousands) | Market Value ($ Thousands) | ||||||
WFRBS Commercial Mortgage Trust, Ser 2014-C21, Cl B | ||||||||
4.213%, 08/15/2047 (A) | $ | 300 | $ | 321 | ||||
|
| |||||||
| 69,182 | ||||||||
|
| |||||||
Total Mortgage-Backed Securities | 370,676 | |||||||
|
| |||||||
CORPORATE OBLIGATIONS — 23.9% |
| |||||||
Consumer Discretionary — 1.7% |
| |||||||
21st Century Fox America | ||||||||
7.300%, 04/30/2028 | 150 | 195 | ||||||
7.250%, 05/18/2018 | 50 | 58 | ||||||
6.900%, 08/15/2039 | 10 | 14 | ||||||
6.750%, 01/09/2038 | 20 | 27 | ||||||
6.650%, 11/15/2037 | 25 | 34 | ||||||
6.150%, 03/01/2037 | 20 | 26 | ||||||
6.150%, 02/15/2041 | 15 | 19 | ||||||
Amazon.com | ||||||||
4.950%, 12/05/2044 | 785 | 856 | ||||||
4.800%, 12/05/2034 | 65 | 71 | ||||||
3.800%, 12/05/2024 | 435 | 457 | ||||||
3.300%, 12/05/2021 | 82 | 85 | ||||||
Bed Bath & Beyond | ||||||||
5.165%, 08/01/2044 | 175 | 193 | ||||||
4.915%, 08/01/2034 | 82 | 88 | ||||||
CBS | ||||||||
4.900%, 08/15/2044 | 45 | 48 | ||||||
3.375%, 03/01/2022 | 25 | 25 | ||||||
Coach | ||||||||
4.250%, 04/01/2025 | 230 | 233 | ||||||
Comcast | ||||||||
7.050%, 03/15/2033 | 90 | 128 | ||||||
6.950%, 08/15/2037 | 50 | 71 | ||||||
6.550%, 07/01/2039 | 70 | 96 | ||||||
6.500%, 01/15/2017 | 400 | 439 | ||||||
6.400%, 03/01/2040 | 60 | 82 | ||||||
4.250%, 01/15/2033 | 60 | 64 | ||||||
4.200%, 08/15/2034 | 30 | 33 | ||||||
3.375%, 02/15/2025 | 70 | 73 | ||||||
Comcast Cable Communications Holdings | ||||||||
9.455%, 11/15/2022 | 180 | 262 | ||||||
Comcast Cable Holdings | ||||||||
10.125%, 04/15/2022 | 45 | 63 | ||||||
Cox Communications (C) | ||||||||
6.950%, 06/01/2038 | 10 | 13 | ||||||
4.800%, 02/01/2035 | 335 | 352 | ||||||
Cox Enterprises | ||||||||
7.375%, 07/15/2027 (C) | 50 | 65 | ||||||
Daimler Finance North America LLC (C) | ||||||||
2.625%, 09/15/2016 | 150 | 153 | ||||||
| 100 | SEI Institutional Managed Trust / Semi-Annual Report / March 31, 2015 |
| Description | Face Amount ($ Thousands) | Market Value ($ Thousands) | ||||||
2.375%, 08/01/2018 | $ | 790 | $ | 810 | ||||
1.875%, 01/11/2018 | 247 | 250 | ||||||
1.300%, 07/31/2015 | 490 | 491 | ||||||
1.125%, 03/10/2017 | 555 | 555 | ||||||
DIRECTV Holdings | ||||||||
6.000%, 08/15/2040 | 455 | 516 | ||||||
5.150%, 03/15/2042 | 25 | 26 | ||||||
4.600%, 02/15/2021 | 100 | 109 | ||||||
4.450%, 04/01/2024 | 300 | 320 | ||||||
3.950%, 01/15/2025 | 410 | 422 | ||||||
3.800%, 03/15/2022 | 220 | 228 | ||||||
Discovery Communications | ||||||||
4.950%, 05/15/2042 | 25 | 26 | ||||||
4.375%, 06/15/2021 | 53 | 57 | ||||||
ERAC USA Finance (C) | ||||||||
6.700%, 06/01/2034 | 71 | 91 | ||||||
5.625%, 03/15/2042 | 300 | 350 | ||||||
4.500%, 02/15/2045 | 85 | 86 | ||||||
2.750%, 03/15/2017 | 16 | 16 | ||||||
Ford Motor | ||||||||
4.750%, 01/15/2043 | 240 | 262 | ||||||
Gap | ||||||||
5.950%, 04/12/2021 | 133 | 153 | ||||||
Grupo Televisa | ||||||||
5.000%, 05/13/2045 | 225 | 234 | ||||||
Historic TW | ||||||||
9.150%, 02/01/2023 | 200 | 276 | ||||||
Home Depot | ||||||||
3.750%, 02/15/2024 | 66 | 72 | ||||||
Hyundai Capital America (C) | ||||||||
2.600%, 03/19/2020 | 325 | 328 | ||||||
2.125%, 10/02/2017 | 60 | 61 | ||||||
2.000%, 03/19/2018 | 130 | 132 | ||||||
Johnson Controls | ||||||||
5.250%, 12/01/2041 | 120 | 137 | ||||||
4.950%, 07/02/2064 | 90 | 97 | ||||||
4.250%, 03/01/2021 | 65 | 71 | ||||||
3.750%, 12/01/2021 | 69 | 73 | ||||||
Lowe’s MTN | ||||||||
7.110%, 05/15/2037 | 110 | 154 | ||||||
5.125%, 11/15/2041 | 11 | 13 | ||||||
LVMH Moet Hennessy Louis Vuitton | ||||||||
1.625%, 06/29/2017 (C) | 462 | 467 | ||||||
Macy’s Retail Holdings | ||||||||
7.450%, 07/15/2017 | 35 | 40 | ||||||
5.125%, 01/15/2042 | 14 | 16 | ||||||
4.500%, 12/15/2034 | 32 | 34 | ||||||
McDonald’s MTN | ||||||||
5.350%, 03/01/2018 | 100 | 112 | ||||||
NBCUniversal Enterprise | ||||||||
1.974%, 04/15/2019 (C) | 200 | 201 | ||||||
NBCUniversal Media | ||||||||
5.950%, 04/01/2041 | 50 | 65 | ||||||
| Description | Face Amount ($ Thousands) | Market Value ($ Thousands) | ||||||
4.375%, 04/01/2021 | $ | 120 | $ | 134 | ||||
QVC | ||||||||
5.950%, 03/15/2043 | 10 | 10 | ||||||
Scripps Networks Interactive | ||||||||
3.900%, 11/15/2024 | 255 | 263 | ||||||
Sky PLC | ||||||||
3.750%, 09/16/2024 (C) | 310 | 321 | ||||||
TCI Communications | ||||||||
8.750%, 08/01/2015 | 210 | 216 | ||||||
7.125%, 02/15/2028 | 200 | 275 | ||||||
Thomson Reuters | ||||||||
4.700%, 10/15/2019 | 75 | 83 | ||||||
3.950%, 09/30/2021 | 109 | 116 | ||||||
3.850%, 09/29/2024 | 260 | 269 | ||||||
Time Warner | ||||||||
7.700%, 05/01/2032 | 530 | 754 | ||||||
7.625%, 04/15/2031 | 385 | 538 | ||||||
5.375%, 10/15/2041 | 12 | 14 | ||||||
3.550%, 06/01/2024 | 385 | 399 | ||||||
Time Warner Cable | ||||||||
8.250%, 04/01/2019 | 200 | 245 | ||||||
7.300%, 07/01/2038 | 110 | 148 | ||||||
6.750%, 07/01/2018 | 40 | 46 | ||||||
6.550%, 05/01/2037 | 80 | 101 | ||||||
5.875%, 11/15/2040 | 210 | 251 | ||||||
5.500%, 09/01/2041 | 44 | 51 | ||||||
5.000%, 02/01/2020 | 320 | 357 | ||||||
Toyota Motor Credit MTN | ||||||||
3.400%, 09/15/2021 | 365 | 388 | ||||||
2.750%, 05/17/2021 | 380 | 393 | ||||||
2.100%, 01/17/2019 | 174 | 177 | ||||||
1.250%, 10/05/2017 | 250 | 251 | ||||||
1.125%, 05/16/2017 | 625 | 627 | ||||||
Viacom | ||||||||
5.250%, 04/01/2044 | 115 | 123 | ||||||
4.850%, 12/15/2034 | 394 | 407 | ||||||
4.250%, 09/01/2023 | 60 | 63 | ||||||
3.875%, 12/15/2021 | 75 | 79 | ||||||
3.250%, 03/15/2023 | 22 | 22 | ||||||
Volkswagen Group of America Finance (C) | ||||||||
2.450%, 11/20/2019 | 305 | 312 | ||||||
2.125%, 05/23/2019 | 260 | 262 | ||||||
Volkswagen International Finance | ||||||||
1.125%, 11/18/2016 (C) | 580 | 582 | ||||||
Walt Disney MTN | ||||||||
0.450%, 12/01/2015 | 21 | 21 | ||||||
WPP Finance | ||||||||
5.125%, 09/07/2042 | 60 | 66 | ||||||
Yum! Brands | ||||||||
5.350%, 11/01/2043 | 150 | 166 | ||||||
|
| |||||||
| 20,204 | ||||||||
|
| |||||||
| SEI Institutional Managed Trust / Semi-Annual Report / March 31, 2015 | 101 |
SCHEDULE OF INVESTMENTS (Unaudited)
U.S. Fixed Income Fund (Continued)
March 31, 2015
| Description | Face Amount ($ Thousands) | Market Value ($ Thousands) | ||||||
Consumer Staples — 1.4% | ||||||||
Altria Group | ||||||||
9.950%, 11/10/2038 | $ | 50 | $ | 87 | ||||
5.375%, 01/31/2044 | 100 | 117 | ||||||
4.750%, 05/05/2021 | 230 | 257 | ||||||
4.500%, 05/02/2043 | 195 | 202 | ||||||
4.000%, 01/31/2024 | 180 | 193 | ||||||
2.850%, 08/09/2022 | 460 | 457 | ||||||
2.625%, 01/14/2020 | 355 | 361 | ||||||
Anheuser-Busch InBev Finance | ||||||||
2.625%, 01/17/2023 | 225 | 222 | ||||||
2.150%, 02/01/2019 | 455 | 463 | ||||||
Anheuser-Busch InBev Worldwide | ||||||||
7.750%, 01/15/2019 | 663 | 802 | ||||||
2.500%, 07/15/2022 | 420 | 414 | ||||||
1.375%, 07/15/2017 | 105 | 106 | ||||||
0.800%, 07/15/2015 | 110 | 110 | ||||||
Bunge Finance | ||||||||
8.500%, 06/15/2019 | 120 | 148 | ||||||
Coca-Cola | ||||||||
1.800%, 09/01/2016 | �� | 60 | 61 | |||||
Coca-Cola Femsa | ||||||||
2.375%, 11/26/2018 | 400 | 408 | ||||||
ConAgra Foods | ||||||||
2.100%, 03/15/2018 | 6 | 6 | ||||||
1.900%, 01/25/2018 | 250 | 250 | ||||||
Costco Wholesale | ||||||||
2.250%, 02/15/2022 | 56 | 56 | ||||||
CVS Health | ||||||||
5.750%, 05/15/2041 | 50 | 64 | ||||||
2.750%, 12/01/2022 | 550 | 553 | ||||||
CVS Pass-Through Trust | ||||||||
5.926%, 01/10/2034 (C) | 90 | 106 | ||||||
Diageo Capital PLC | ||||||||
4.828%, 07/15/2020 | 90 | 102 | ||||||
Diageo Investment | ||||||||
2.875%, 05/11/2022 | 580 | 591 | ||||||
Heineken | ||||||||
1.400%, 10/01/2017 (C) | 70 | 70 | ||||||
JM Smucker | ||||||||
4.375%, 03/15/2045 (C) | 60 | 62 | ||||||
Kimberly-Clark | ||||||||
2.400%, 03/01/2022 | 12 | 12 | ||||||
Kraft Foods Group | ||||||||
6.500%, 02/09/2040 | 140 | 181 | ||||||
6.125%, 08/23/2018 | 225 | 255 | ||||||
5.375%, 02/10/2020 | 16 | 18 | ||||||
5.000%, 06/04/2042 | 155 | 172 | ||||||
3.500%, 06/06/2022 | 910 | 942 | ||||||
Kroger | ||||||||
7.500%, 04/01/2031 | 90 | 123 | ||||||
| Description | Face Amount ($ Thousands) | Market Value ($ Thousands) | ||||||
6.900%, 04/15/2038 | $ | 80 | $ | 109 | ||||
5.400%, 07/15/2040 | 14 | 17 | ||||||
2.950%, 11/01/2021 | 235 | 240 | ||||||
2.200%, 01/15/2017 | 40 | 41 | ||||||
Lorillard Tobacco | ||||||||
8.125%, 06/23/2019 | 370 | 453 | ||||||
Mondelez International | ||||||||
4.000%, 02/01/2024 | 290 | 314 | ||||||
PepsiCo | ||||||||
7.900%, 11/01/2018 | 11 | 13 | ||||||
4.250%, 10/22/2044 | 455 | 485 | ||||||
4.000%, 03/05/2042 | 150 | 154 | ||||||
3.000%, 08/25/2021 | 31 | 32 | ||||||
2.500%, 05/10/2016 | 35 | 36 | ||||||
1.250%, 08/13/2017 | 72 | 72 | ||||||
0.700%, 08/13/2015 | 220 | 220 | ||||||
Pernod Ricard (C) | ||||||||
5.750%, 04/07/2021 | 370 | 429 | ||||||
4.450%, 01/15/2022 | 370 | 401 | ||||||
Philip Morris International | ||||||||
4.500%, 03/20/2042 | 200 | 217 | ||||||
2.500%, 08/22/2022 | 250 | 248 | ||||||
Reynolds American | ||||||||
3.250%, 11/01/2022 | 280 | 279 | ||||||
SABMiller Holdings | ||||||||
3.750%, 01/15/2022 (C) | 245 | 258 | ||||||
Sysco | �� | |||||||
3.000%, 10/02/2021 | 404 | 417 | ||||||
2.350%, 10/02/2019 | 535 | 547 | ||||||
Tyson Foods | ||||||||
5.150%, 08/15/2044 | 270 | 314 | ||||||
4.500%, 06/15/2022 | 166 | 183 | ||||||
3.950%, 08/15/2024 | 206 | 218 | ||||||
Walgreens Boots Alliance | ||||||||
4.800%, 11/18/2044 | 120 | 130 | ||||||
4.500%, 11/18/2034 | 28 | 30 | ||||||
3.300%, 11/18/2021 | 487 | 501 | ||||||
Wal-Mart Stores | ||||||||
5.625%, 04/15/2041 | 20 | 26 | ||||||
4.300%, 04/22/2044 | 605 | 675 | ||||||
3.300%, 04/22/2024 | 60 | 63 | ||||||
Wm Wrigley Jr (C) | ||||||||
3.375%, 10/21/2020 | 390 | 409 | ||||||
2.900%, 10/21/2019 | 526 | 542 | ||||||
2.400%, 10/21/2018 | 200 | 204 | ||||||
2.000%, 10/20/2017 | 115 | 116 | ||||||
|
| |||||||
| 16,364 | ||||||||
|
| |||||||
Energy — 2.9% | ||||||||
Anadarko Finance, Ser B | ||||||||
7.500%, 05/01/2031 | 60 | 80 | ||||||
Anadarko Petroleum | ||||||||
6.375%, 09/15/2017 | 10 | 11 | ||||||
| 102 | SEI Institutional Managed Trust / Semi-Annual Report / March 31, 2015 |
| Description | Face Amount ($ Thousands) | Market Value ($ Thousands) | ||||||
5.950%, 09/15/2016 | $ | 60 | $ | 64 | ||||
4.500%, 07/15/2044 | 125 | 128 | ||||||
Apache | ||||||||
5.625%, 01/15/2017 | 250 | 269 | ||||||
3.250%, 04/15/2022 | 109 | 111 | ||||||
Baker Hughes | ||||||||
7.500%, 11/15/2018 | 170 | 203 | ||||||
BG Energy Capital PLC | ||||||||
4.000%, 10/15/2021 (C) | 575 | 599 | ||||||
BP Capital Markets PLC | ||||||||
3.994%, 09/26/2023 | 95 | 101 | ||||||
3.814%, 02/10/2024 | 83 | 86 | ||||||
3.506%, 03/17/2025 | 540 | 551 | ||||||
3.245%, 05/06/2022 | 90 | 93 | ||||||
3.062%, 03/17/2022 | 50 | 51 | ||||||
1.846%, 05/05/2017 | 172 | 174 | ||||||
Buckeye Partners | ||||||||
5.850%, 11/15/2043 | 10 | 10 | ||||||
Cameron International | ||||||||
4.000%, 12/15/2023 | 21 | 22 | ||||||
Canadian Natural Resources | ||||||||
7.200%, 01/15/2032 | 50 | 61 | ||||||
6.450%, 06/30/2033 | 50 | 58 | ||||||
Canadian Oil Sands | ||||||||
6.000%, 04/01/2042 (C) | 183 | 165 | ||||||
Cenovus Energy | ||||||||
6.750%, 11/15/2039 | 5 | 6 | ||||||
4.450%, 09/15/2042 | 14 | 13 | ||||||
3.000%, 08/15/2022 | 8 | 8 | ||||||
Chevron | ||||||||
3.191%, 06/24/2023 | 22 | 23 | ||||||
2.411%, 03/03/2022 | 275 | 276 | ||||||
2.355%, 12/05/2022 | 15 | 15 | ||||||
1.961%, 03/03/2020 | 520 | 523 | ||||||
1.365%, 03/02/2018 | 480 | 482 | ||||||
CNOOC Nexen Finance | ||||||||
4.250%, 04/30/2024 | 200 | 213 | ||||||
Conoco Funding | ||||||||
7.250%, 10/15/2031 | 130 | 182 | ||||||
ConocoPhillips | ||||||||
6.000%, 01/15/2020 | 100 | 118 | ||||||
4.150%, 11/15/2034 | 395 | 420 | ||||||
2.875%, 11/15/2021 | 230 | 236 | ||||||
Continental Resources | ||||||||
5.000%, 09/15/2022 | 10 | 10 | ||||||
4.900%, 06/01/2044 | 125 | 110 | ||||||
4.500%, 04/15/2023 | 210 | 204 | ||||||
Devon Energy | ||||||||
6.300%, 01/15/2019 | 80 | 92 | ||||||
5.600%, 07/15/2041 | 290 | 338 | ||||||
4.750%, 05/15/2042 | 17 | 18 | ||||||
3.250%, 05/15/2022 | 327 | 330 | ||||||
Devon Financing LLC | ||||||||
7.875%, 09/30/2031 | 40 | 55 | ||||||
| Description | Face Amount ($ Thousands) | Market Value ($ Thousands) | ||||||
Diamond Offshore Drilling | ||||||||
4.875%, 11/01/2043 (D) | $ | 109 | $ | 91 | ||||
Ecopetrol | ||||||||
7.375%, 09/18/2043 | 140 | 152 | ||||||
5.875%, 05/28/2045 | 355 | 330 | ||||||
4.125%, 01/16/2025 | 43 | 41 | ||||||
Encana | ||||||||
6.500%, 05/15/2019 | 100 | 115 | ||||||
6.500%, 02/01/2038 | 315 | 361 | ||||||
Energy Transfer Partners | ||||||||
8.250%, 11/15/2029 | 675 | 932 | ||||||
5.150%, 03/15/2045 | 159 | 160 | ||||||
4.050%, 03/15/2025 | 240 | 242 | ||||||
3.600%, 02/01/2023 | 45 | 45 | ||||||
ENI | ||||||||
5.700%, 10/01/2040 (C) | 300 | 328 | ||||||
EnLink Midstream Partners | ||||||||
5.050%, 04/01/2045 | 225 | 229 | ||||||
Ensco | ||||||||
5.750%, 10/01/2044 | 19 | 18 | ||||||
5.200%, 03/15/2025 | 163 | 163 | ||||||
Enterprise Products Operating LLC | ||||||||
5.700%, 02/15/2042 | 40 | 48 | ||||||
5.100%, 02/15/2045 | 39 | 44 | ||||||
4.950%, 10/15/2054 | 20 | 21 | ||||||
4.850%, 03/15/2044 | 95 | 102 | ||||||
3.900%, 02/15/2024 | 58 | 61 | ||||||
3.750%, 02/15/2025 | 239 | 247 | ||||||
2.550%, 10/15/2019 | 78 | 79 | ||||||
Exxon Mobil | ||||||||
3.567%, 03/06/2045 | 345 | 358 | ||||||
2.709%, 03/06/2025 | 410 | 414 | ||||||
2.397%, 03/06/2022 | 100 | 101 | ||||||
1.912%, 09/06/2015 | 410 | 414 | ||||||
1.305%, 03/06/2018 | 680 | 684 | ||||||
Florida Gas Transmission | ||||||||
7.900%, 05/15/2019 (C) | 350 | 418 | ||||||
Halliburton | ||||||||
6.150%, 09/15/2019 | 80 | 94 | ||||||
Hess | ||||||||
8.125%, 02/15/2019 | 150 | 180 | ||||||
Kerr-McGee | ||||||||
7.875%, 09/15/2031 | 100 | 136 | ||||||
6.950%, 07/01/2024 | 818 | 1,024 | ||||||
Kinder Morgan | ||||||||
5.550%, 06/01/2045 | 155 | 163 | ||||||
5.300%, 12/01/2034 | 90 | 93 | ||||||
4.300%, 06/01/2025 | 1,030 | 1,057 | ||||||
Kinder Morgan Energy Partners | ||||||||
4.300%, 05/01/2024 | 235 | 239 | ||||||
4.100%, 11/15/2015 | 310 | 315 | ||||||
Magellan Midstream Partners | ||||||||
5.150%, 10/15/2043 | 35 | 38 | ||||||
| SEI Institutional Managed Trust / Semi-Annual Report / March 31, 2015 | 103 |
SCHEDULE OF INVESTMENTS (Unaudited)
U.S. Fixed Income Fund (Continued)
March 31, 2015
| Description | Face Amount ($ Thousands) | Market Value ($ Thousands) | ||||||
3.200%, 03/15/2025 | $ | 23 | $ | 23 | ||||
Marathon Petroleum | ||||||||
5.000%, 09/15/2054 | 50 | 50 | ||||||
3.625%, 09/15/2024 | 48 | 49 | ||||||
MPLX | ||||||||
4.000%, 02/15/2025 | 85 | 86 | ||||||
Nabors Industries | ||||||||
5.000%, 09/15/2020 | 120 | 120 | ||||||
Noble Energy | ||||||||
5.250%, 11/15/2043 | 60 | 63 | ||||||
5.050%, 11/15/2044 | 29 | 30 | ||||||
4.150%, 12/15/2021 | 270 | 286 | ||||||
3.900%, 11/15/2024 | 150 | 153 | ||||||
Noble Holding International | ||||||||
5.250%, 03/15/2042 | 40 | 31 | ||||||
4.625%, 03/01/2021 | 12 | 11 | ||||||
4.000%, 03/16/2018 | 12 | 12 | ||||||
Occidental Petroleum | ||||||||
2.700%, 02/15/2023 | 129 | 128 | ||||||
1.750%, 02/15/2017 | 35 | 35 | ||||||
ONEOK Partners | ||||||||
6.650%, 10/01/2036 | 70 | 74 | ||||||
6.200%, 09/15/2043 | 120 | 125 | ||||||
4.900%, 03/15/2025 | 310 | 314 | ||||||
3.800%, 03/15/2020 | 210 | 214 | ||||||
2.000%, 10/01/2017 | 240 | 239 | ||||||
Petrobras Global Finance | ||||||||
6.750%, 01/27/2041 | 50 | 44 | ||||||
Petrobras Global Finance BV | ||||||||
6.250%, 03/17/2024 | 410 | 387 | ||||||
4.875%, 03/17/2020 | 300 | 269 | ||||||
4.375%, 05/20/2023 | 39 | 33 | ||||||
3.000%, 01/15/2019 | 215 | 186 | ||||||
Petrobras International Finance | ||||||||
5.375%, 01/27/2021 | 1,120 | 1,016 | ||||||
Petro-Canada | ||||||||
6.800%, 05/15/2038 | 475 | 627 | ||||||
6.050%, 05/15/2018 | 115 | 129 | ||||||
Petrofac | ||||||||
3.400%, 10/10/2018 (C) | 270 | 266 | ||||||
Petroleos Mexicanos | ||||||||
6.625%, 06/15/2035 | 350 | 401 | ||||||
6.375%, 01/23/2045 | 768 | 859 | ||||||
5.625%, 01/23/2046 | 352 | 357 | ||||||
5.500%, 06/27/2044 (C) | 90 | 91 | ||||||
4.875%, 01/18/2024 | 32 | 34 | ||||||
4.500%, 01/23/2026 (C) | 220 | 224 | ||||||
3.500%, 01/30/2023 | 436 | 426 | ||||||
2.378%, 04/15/2025 | 355 | 361 | ||||||
Phillips 66 | ||||||||
5.875%, 05/01/2042 | 35 | 42 | ||||||
4.875%, 11/15/2044 | 125 | 134 | ||||||
4.300%, 04/01/2022 | 26 | 28 | ||||||
2.950%, 05/01/2017 | 33 | 34 | ||||||
| Description | Face Amount ($ Thousands) | Market Value ($ Thousands) | ||||||
Plains All American Pipeline | ||||||||
4.900%, 02/15/2045 | $ | 287 | $ | 302 | ||||
3.600%, 11/01/2024 | 90 | 90 | ||||||
2.600%, 12/15/2019 | 29 | 29 | ||||||
Rowan | ||||||||
5.850%, 01/15/2044 | 100 | 86 | ||||||
5.400%, 12/01/2042 | 159 | 130 | ||||||
Schlumberger Investment | ||||||||
3.650%, 12/01/2023 | 61 | 65 | ||||||
3.300%, 09/14/2021 (C) | 47 | 49 | ||||||
Shell International Finance | ||||||||
4.375%, 03/25/2020 | 140 | 157 | ||||||
3.400%, 08/12/2023 | 465 | 492 | ||||||
Sinopec Group Overseas Development | ||||||||
4.375%, 04/10/2024 (C) | 380 | 412 | ||||||
Spectra Energy Capital | ||||||||
8.000%, 10/01/2019 | 200 | 242 | ||||||
5.650%, 03/01/2020 | 100 | 110 | ||||||
Spectra Energy Partners | ||||||||
5.950%, 09/25/2043 | 30 | 36 | ||||||
4.500%, 03/15/2045 | 545 | 553 | ||||||
Statoil | ||||||||
5.250%, 04/15/2019 | 140 | 159 | ||||||
4.250%, 11/23/2041 | 27 | 29 | ||||||
3.150%, 01/23/2022 | 33 | 34 | ||||||
3.125%, 08/17/2017 | 50 | 52 | ||||||
2.900%, 11/08/2020 | 744 | 779 | ||||||
2.250%, 11/08/2019 | 255 | 259 | ||||||
Suncor Energy | ||||||||
6.850%, 06/01/2039 | 50 | 66 | ||||||
3.600%, 12/01/2024 | 42 | 43 | ||||||
Sunoco Logistics Partners Operations | ||||||||
5.350%, 05/15/2045 | 328 | 345 | ||||||
5.300%, 04/01/2044 | 15 | 15 | ||||||
4.250%, 04/01/2024 | 21 | 22 | ||||||
Talisman Energy | ||||||||
7.750%, 06/01/2019 | 100 | 115 | ||||||
3.750%, 02/01/2021 | 200 | 197 | ||||||
TC PipeLines | ||||||||
4.650%, 06/15/2021 | 85 | 89 | ||||||
4.375%, 03/13/2025 | 205 | 207 | ||||||
Tennessee Gas Pipeline | ||||||||
8.000%, 02/01/2016 | 1,000 | 1,052 | ||||||
Tosco | ||||||||
7.800%, 01/01/2027 | 65 | 90 | ||||||
Total Capital Canada | ||||||||
2.750%, 07/15/2023 | 50 | 50 | ||||||
Total Capital International | ||||||||
3.700%, 01/15/2024 | 42 | 45 | ||||||
2.875%, 02/17/2022 | 505 | 517 | ||||||
2.750%, 06/19/2021 | 160 | 164 | ||||||
2.700%, 01/25/2023 | 37 | 37 | ||||||
| 104 | SEI Institutional Managed Trust / Semi-Annual Report / March 31, 2015 |
| Description | Face Amount ($ Thousands) | Market Value ($ Thousands) | ||||||
2.100%, 06/19/2019 | $ | 235 | $ | 238 | ||||
1.550%, 06/28/2017 | 28 | 28 | ||||||
TransCanada Pipelines | ||||||||
7.125%, 01/15/2019 | 50 | 59 | ||||||
6.500%, 08/15/2018 | 175 | 200 | ||||||
4.625%, 03/01/2034 | 470 | 506 | ||||||
Transocean | ||||||||
7.350%, 12/15/2041 | 9 | 7 | ||||||
6.500%, 11/15/2020 (D) | 68 | 57 | ||||||
6.375%, 12/15/2021 (D) | 63 | 53 | ||||||
5.050%, 12/15/2016 | 70 | 71 | ||||||
2.500%, 10/15/2017 | 260 | 239 | ||||||
Union Pacific Resources Group | ||||||||
7.150%, 05/15/2028 | 52 | 67 | ||||||
Valero Energy | ||||||||
4.900%, 03/15/2045 | 135 | 140 | ||||||
3.650%, 03/15/2025 | 205 | 210 | ||||||
Weatherford International | ||||||||
5.950%, 04/15/2042 | 207 | 182 | ||||||
4.500%, 04/15/2022 | 165 | 151 | ||||||
Western Gas Partners | ||||||||
5.375%, 06/01/2021 | 110 | 122 | ||||||
4.000%, 07/01/2022 | 35 | 36 | ||||||
Williams | ||||||||
7.875%, 09/01/2021 | 496 | 576 | ||||||
Williams Partners | ||||||||
4.000%, 09/15/2025 | 235 | 230 | ||||||
|
| |||||||
| 34,328 | ||||||||
|
| |||||||
Financials — 10.1% | ||||||||
ABB Treasury Center USA | ||||||||
2.500%, 06/15/2016 (C) | 325 | 331 | ||||||
Abbey National Treasury Services | ||||||||
2.375%, 03/16/2020 | 535 | 539 | ||||||
ACE INA Holdings | ||||||||
5.600%, 05/15/2015 | 100 | 101 | ||||||
3.150%, 03/15/2025 | 409 | 418 | ||||||
African Development Bank | ||||||||
8.800%, 09/01/2019 | 100 | 126 | ||||||
AIA Group MTN | ||||||||
3.200%, 03/11/2025 (C) | 270 | 272 | ||||||
AIG Global Funding MTN | ||||||||
1.650%, 12/15/2017 (C) | 42 | 42 | ||||||
AIG SunAmerica Global Finance | ||||||||
6.900%, 03/15/2032 (C) | 30 | 42 | ||||||
American Express | ||||||||
7.000%, 03/19/2018 | 170 | 196 | ||||||
American Express Credit MTN | ||||||||
2.800%, 09/19/2016 | 44 | 45 | ||||||
2.250%, 08/15/2019 | 625 | 634 | ||||||
1.750%, 06/12/2015 | 654 | 655 | ||||||
| Description | Face Amount ($ Thousands) | Market Value ($ Thousands) | ||||||
American Honda Finance MTN | ||||||||
3.875%, 09/21/2020 (C) | $ | 495 | $ | 537 | ||||
2.250%, 08/15/2019 | 197 | 200 | ||||||
1.000%, 08/11/2015 (C) | 210 | 210 | ||||||
American International Group | ||||||||
6.400%, 12/15/2020 | 200 | 242 | ||||||
5.850%, 01/16/2018 | 655 | 732 | ||||||
4.875%, 06/01/2022 | 36 | 41 | ||||||
4.500%, 07/16/2044 | 140 | 150 | ||||||
4.375%, 01/15/2055 | 120 | 121 | ||||||
4.125%, 02/15/2024 | 71 | 77 | ||||||
3.875%, 01/15/2035 | 30 | 30 | ||||||
American Tower‡ | ||||||||
3.500%, 01/31/2023 | 388 | 385 | ||||||
3.450%, 09/15/2021 | 315 | 322 | ||||||
American Tower Trust‡ (C) | ||||||||
3.070%, 03/15/2023 | 120 | 120 | ||||||
1.551%, 03/15/2018 | 25 | 25 | ||||||
Ameriprise Financial | ||||||||
4.000%, 10/15/2023 | 130 | 141 | ||||||
Andina de Fomento | ||||||||
3.750%, 01/15/2016 | 90 | 92 | ||||||
ANZ New Zealand International MTN | ||||||||
3.125%, 08/10/2015 (C) | 100 | 101 | ||||||
ANZ New Zealand Int’l | ||||||||
1.750%, 03/29/2018 (C) | 200 | 200 | ||||||
Aon | ||||||||
6.250%, 09/30/2040 | 19 | 25 | ||||||
3.500%, 09/30/2015 | 11 | 11 | ||||||
3.500%, 06/14/2024 | 65 | 67 | ||||||
Associates of North America | ||||||||
6.950%, 11/01/2018 | 128 | 149 | ||||||
Assurant | ||||||||
2.500%, 03/15/2018 | 320 | 326 | ||||||
Australia & New Zealand Banking Group | ||||||||
4.500%, 03/19/2024 (C) | 310 | 324 | ||||||
Bank of America | ||||||||
6.875%, 04/25/2018 | 100 | 114 | ||||||
6.500%, 08/01/2016 | 1,325 | 1,414 | ||||||
6.400%, 08/28/2017 | 150 | 166 | ||||||
6.100%, 06/15/2017 | 2,600 | 2,848 | ||||||
6.000%, 09/01/2017 | 365 | 402 | ||||||
5.750%, 12/01/2017 | 70 | 77 | ||||||
5.700%, 01/24/2022 | 5 | 6 | ||||||
5.650%, 05/01/2018 | 1,100 | 1,220 | ||||||
5.625%, 07/01/2020 | 105 | 121 | ||||||
5.420%, 03/15/2017 | 200 | 214 | ||||||
5.000%, 05/13/2021 | 410 | 463 | ||||||
5.000%, 01/21/2044 | 640 | 735 | ||||||
4.875%, 04/01/2044 | 260 | 293 | ||||||
4.250%, 10/22/2026 | 297 | 307 | ||||||
4.200%, 08/26/2024 | 700 | 724 | ||||||
| SEI Institutional Managed Trust / Semi-Annual Report / March 31, 2015 | 105 |
SCHEDULE OF INVESTMENTS (Unaudited)
U.S. Fixed Income Fund (Continued)
March 31, 2015
| Description | Face Amount ($ Thousands) | Market Value ($ Thousands) | ||||||
4.125%, 01/22/2024 | $ | 290 | $ | 311 | ||||
4.100%, 07/24/2023 | 340 | 363 | ||||||
4.000%, 04/01/2024 | 675 | 718 | ||||||
4.000%, 01/22/2025 | 433 | 437 | ||||||
3.300%, 01/11/2023 | 440 | 446 | ||||||
2.600%, 01/15/2019 | 160 | 163 | ||||||
1.650%, 03/26/2018 | 370 | 371 | ||||||
1.500%, 10/09/2015 | 714 | 717 | ||||||
Bank of Montreal MTN | ||||||||
1.400%, 09/11/2017 | 108 | 108 | ||||||
Bank of New York Mellon MTN | ||||||||
4.600%, 01/15/2020 | 40 | 45 | ||||||
3.550%, 09/23/2021 | 34 | 36 | ||||||
3.400%, 05/15/2024 | 1,075 | 1,125 | ||||||
3.250%, 09/11/2024 | 100 | 103 | ||||||
2.950%, 06/18/2015 (D) | 125 | 126 | ||||||
2.400%, 01/17/2017 | 129 | 132 | ||||||
2.200%, 03/04/2019 | 360 | 366 | ||||||
Bank of Tokyo-Mitsubishi UFJ | ||||||||
4.100%, 09/09/2023 (C) | 200 | 217 | ||||||
Barclays | ||||||||
5.000%, 09/22/2016 | 100 | 106 | ||||||
3.650%, 03/16/2025 | 250 | 251 | ||||||
BB&T | ||||||||
5.250%, 11/01/2019 | 200 | 226 | ||||||
3.950%, 04/29/2016 | 160 | 166 | ||||||
2.450%, 01/15/2020 | 215 | 219 | ||||||
Bear Stearns | ||||||||
7.250%, 02/01/2018 | 1,500 | 1,727 | ||||||
Berkshire Hathaway | ||||||||
3.750%, 08/15/2021 (D) | 500 | 547 | ||||||
3.400%, 01/31/2022 | 65 | 70 | ||||||
Berkshire Hathaway Finance | ||||||||
5.400%, 05/15/2018 (D) | 110 | 124 | ||||||
4.400%, 05/15/2042 | 41 | 45 | ||||||
BlackRock | ||||||||
6.250%, 09/15/2017 | 145 | 163 | ||||||
Blackstone Holdings Finance | ||||||||
5.875%, 03/15/2021 (C) | 295 | 345 | ||||||
BNP Paribas MTN | ||||||||
2.700%, 08/20/2018 | 380 | 392 | ||||||
2.375%, 09/14/2017 | 110 | 112 | ||||||
BPCE | ||||||||
5.150%, 07/21/2024 (C) | 200 | 214 | ||||||
Capital One Financial | �� | |||||||
4.750%, 07/15/2021 | 50 | 56 | ||||||
3.500%, 06/15/2023 | 159 | 163 | ||||||
3.200%, 02/05/2025 | 245 | 243 | ||||||
Caterpillar Financial Services MTN | ||||||||
7.150%, 02/15/2019 | 110 | 132 | ||||||
5.850%, 09/01/2017 | 140 | 155 | ||||||
Charles Schwab | ||||||||
3.225%, 09/01/2022 | 20 | 21 | ||||||
| Description | Face Amount ($ Thousands) | Market Value ($ Thousands) | ||||||
Citigroup | ||||||||
8.125%, 07/15/2039 | $ | 275 | $ | 433 | ||||
6.875%, 03/05/2038 | 115 | 159 | ||||||
6.125%, 05/15/2018 | 45 | 51 | ||||||
6.000%, 08/15/2017 | 620 | 682 | ||||||
5.875%, 01/30/2042 | 250 | 319 | ||||||
5.500%, 02/15/2017 | 250 | 268 | ||||||
5.500%, 09/13/2025 | 269 | 305 | ||||||
5.375%, 08/09/2020 | 340 | 389 | ||||||
5.300%, 01/07/2016 | 220 | 227 | ||||||
5.300%, 05/06/2044 | 50 | 56 | ||||||
4.500%, 01/14/2022 | 380 | 420 | ||||||
4.450%, 01/10/2017 | 155 | 163 | ||||||
3.500%, 05/15/2023 | 130 | 130 | ||||||
2.500%, 09/26/2018 | 990 | 1,009 | ||||||
2.400%, 02/18/2020 | 295 | 296 | ||||||
1.700%, 07/25/2016 | 365 | 368 | ||||||
1.550%, 08/14/2017 | 520 | 520 | ||||||
0.812%, 08/25/2036 (A) | 1,500 | 1,168 | ||||||
CME Group | ||||||||
3.000%, 03/15/2025 | 526 | 531 | ||||||
CNA Financial | ||||||||
5.875%, 08/15/2020 | 72 | 83 | ||||||
Comerica | ||||||||
3.800%, 07/22/2026 | 82 | 83 | ||||||
3.000%, 09/16/2015 | 35 | 35 | ||||||
Commonwealth Bank of Australia | ||||||||
2.250%, 03/16/2017 (C) | 250 | 256 | ||||||
Cooperatieve Centrale Raiffeisen-Boerenleenbank | ||||||||
5.800%, 09/30/2110 (C) | 100 | 120 | ||||||
4.625%, 12/01/2023 | 530 | 573 | ||||||
3.875%, 02/08/2022 | 30 | 32 | ||||||
3.375%, 01/19/2017 | 370 | 386 | ||||||
Credit Agricole | ||||||||
8.375%, 12/31/2049 (A) (C) | 170 | 201 | ||||||
4.375%, 03/17/2025 (C) | 225 | 228 | ||||||
Credit Suisse Group Funding Guernsey | ||||||||
3.750%, 03/26/2025 (C) | 485 | 491 | ||||||
Credit Suisse NY | ||||||||
3.625%, 09/09/2024 | 290 | 300 | ||||||
0.583%, 08/24/2015 (A) | 850 | 850 | ||||||
0.492%, 04/10/2015 (A) | 400 | 400 | ||||||
Credit Suisse USA | ||||||||
5.125%, 08/15/2015 | 100 | 102 | ||||||
DDR‡ | ||||||||
4.625%, 07/15/2022 | 385 | 414 | ||||||
3.375%, 05/15/2023 | 370 | 367 | ||||||
Deutsche Bank | ||||||||
4.500%, 04/01/2025 | 460 | 461 | ||||||
1.875%, 02/13/2018 | 46 | 46 | ||||||
1.350%, 05/30/2017 | 460 | 460 | ||||||
| 106 | SEI Institutional Managed Trust / Semi-Annual Report / March 31, 2015 |
| Description | Face Amount ($ Thousands) | Market Value ($ Thousands) | ||||||
Discover Financial Services | ||||||||
6.450%, 06/12/2017 | $ | 250 | $ | 275 | ||||
3.750%, 03/04/2025 | 165 | 166 | ||||||
DnB Boligkreditt | ||||||||
2.100%, 10/14/2015 (C) | 400 | 403 | ||||||
Duke Realty‡ | ||||||||
3.875%, 02/15/2021 | 50 | 53 | ||||||
Equity Commonwealth‡ | ||||||||
6.650%, 01/15/2018 | 60 | 66 | ||||||
ERP Operating‡ | ||||||||
5.750%, 06/15/2017 | 125 | 137 | ||||||
4.625%, 12/15/2021 | 64 | 71 | ||||||
Farmers Exchange Capital | ||||||||
7.200%, 07/15/2048 (C) | 1,021 | 1,369 | ||||||
Federal Realty Investment Trust‡ | ||||||||
3.950%, 01/15/2024 | 170 | 182 | ||||||
3.000%, 08/01/2022 | 125 | 126 | ||||||
Fifth Third Bancorp | ||||||||
2.875%, 10/01/2021 | 200 | 204 | ||||||
2.300%, 03/01/2019 | 30 | 30 | ||||||
FMS Wertmanagement AoeR | ||||||||
1.000%, 11/21/2017 | 200 | 200 | ||||||
Ford Motor Credit LLC | ||||||||
5.875%, 08/02/2021 | 550 | 647 | ||||||
3.984%, 06/15/2016 | 200 | 206 | ||||||
3.664%, 09/08/2024 (D) | 310 | 320 | ||||||
3.219%, 01/09/2022 | 305 | 311 | ||||||
2.750%, 05/15/2015 | 800 | 802 | ||||||
2.597%, 11/04/2019 | 480 | 486 | ||||||
2.459%, 03/27/2020 | 270 | 270 | ||||||
2.375%, 03/12/2019 | 200 | 202 | ||||||
1.684%, 09/08/2017 | 200 | 200 | ||||||
General Electric Capital MTN | ||||||||
6.875%, 01/10/2039 | 520 | 748 | ||||||
6.375%, 11/15/2067 (A) | 40 | 43 | ||||||
6.150%, 08/07/2037 | 885 | 1,175 | ||||||
6.000%, 08/07/2019 | 645 | 753 | ||||||
5.875%, 01/14/2038 | 300 | 388 | ||||||
5.625%, 09/15/2017 | 100 | 111 | ||||||
5.500%, 01/08/2020 | 180 | 208 | ||||||
5.400%, 02/15/2017 | 200 | 216 | ||||||
5.300%, 02/11/2021 | 470 | 543 | ||||||
4.650%, 10/17/2021 | 140 | 158 | ||||||
4.625%, 01/07/2021 | 540 | 608 | ||||||
4.500%, 03/11/2044 | 635 | 713 | ||||||
4.375%, 09/16/2020 | 10 | 11 | ||||||
2.300%, 04/27/2017 | 45 | 46 | ||||||
2.200%, 01/09/2020 | 43 | 43 | ||||||
2.100%, 12/11/2019 | 30 | 31 | ||||||
1.625%, 07/02/2015 | 180 | 181 | ||||||
0.850%, 10/09/2015 | 110 | 110 | ||||||
0.737%, 08/15/2036 (A) | 850 | 738 | ||||||
0.635%, 05/05/2026 (A) | 155 | 145 | ||||||
| Description | Face Amount ($ Thousands) | Market Value ($ Thousands) | ||||||
Goldman Sachs Group | ||||||||
7.500%, 02/15/2019 | $ | 710 | $ | 847 | ||||
6.750%, 10/01/2037 | 192 | 252 | ||||||
6.250%, 09/01/2017 | 350 | 388 | ||||||
6.250%, 02/01/2041 | 430 | 560 | ||||||
6.150%, 04/01/2018 | 780 | 877 | ||||||
6.000%, 06/15/2020 | 880 | 1,027 | ||||||
5.750%, 01/24/2022 | 300 | 350 | ||||||
5.375%, 03/15/2020 | 950 | 1,078 | ||||||
4.000%, 03/03/2024 | 200 | 211 | ||||||
3.850%, 07/08/2024 | 121 | 127 | ||||||
3.500%, 01/23/2025 | 789 | 804 | ||||||
3.300%, 05/03/2015 | 55 | 55 | ||||||
2.900%, 07/19/2018 | 220 | 227 | ||||||
2.375%, 01/22/2018 | 520 | 531 | ||||||
GTP Acquisition Partners | ||||||||
4.347%, 06/15/2016 (C) | 144 | 147 | ||||||
HBOS PLC MTN | ||||||||
6.750%, 05/21/2018 (C) | 200 | 224 | ||||||
HCP MTN‡ | ||||||||
6.300%, 09/15/2016 | 375 | 402 | ||||||
4.250%, 11/15/2023 | 580 | 610 | ||||||
3.400%, 02/01/2025 | 57 | 56 | ||||||
2.625%, 02/01/2020 | 28 | 28 | ||||||
Health Care‡ | ||||||||
6.125%, 04/15/2020 | 1,475 | 1,710 | ||||||
4.500%, 01/15/2024 (D) | 102 | 110 | ||||||
Healthcare Realty Trust‡ | ||||||||
6.500%, 01/17/2017 | 1,400 | 1,523 | ||||||
Healthcare Trust of America Holdings‡ | ||||||||
3.375%, 07/15/2021 | 200 | 203 | ||||||
HSBC Bank PLC | ||||||||
4.125%, 08/12/2020 (C) | 100 | 109 | ||||||
HSBC Finance | ||||||||
6.676%, 01/15/2021 | 850 | 1,009 | ||||||
5.500%, 01/19/2016 | 140 | 145 | ||||||
HSBC Holdings PLC | ||||||||
5.250%, 03/14/2044 | 520 | 592 | ||||||
4.875%, 01/14/2022 | 100 | 113 | ||||||
4.000%, 03/30/2022 | 206 | 222 | ||||||
HSBC USA | ||||||||
2.375%, 11/13/2019 | 150 | 151 | ||||||
2.350%, 03/05/2020 | 780 | 784 | ||||||
1.700%, 03/05/2018 | 680 | 681 | ||||||
ING Bank (C) | ||||||||
5.800%, 09/25/2023 | 670 | 759 | ||||||
3.750%, 03/07/2017 | 200 | 209 | ||||||
2.450%, 03/16/2020 | 675 | 683 | ||||||
1.800%, 03/16/2018 | 355 | 357 | ||||||
Inter-American Development Bank | ||||||||
4.375%, 01/24/2044 | 105 | 135 | ||||||
| SEI Institutional Managed Trust / Semi-Annual Report / March 31, 2015 | 107 |
SCHEDULE OF INVESTMENTS (Unaudited)
U.S. Fixed Income Fund (Continued)
March 31, 2015
| Description | Face Amount ($ Thousands) | Market Value ($ Thousands) | ||||||
Intercontinental Exchange | ||||||||
4.000%, 10/15/2023 | $ | 65 | $ | 70 | ||||
2.500%, 10/15/2018 | 85 | 88 | ||||||
International Lease Finance (C) | ||||||||
7.125%, 09/01/2018 | 500 | 561 | ||||||
6.750%, 09/01/2016 | 640 | 680 | ||||||
Intesa Sanpaolo | ||||||||
5.017%, 06/26/2024 (C) | 510 | 522 | ||||||
3.125%, 01/15/2016 | 250 | 253 | ||||||
2.375%, 01/13/2017 | 368 | 372 | ||||||
Invesco Finance | ||||||||
4.000%, 01/30/2024 | 43 | 46 | ||||||
Jackson National Life Global Funding | ||||||||
4.700%, 06/01/2018 (C) | 100 | 109 | ||||||
Jefferies Group | ||||||||
6.450%, 06/08/2027 | 160 | 173 | ||||||
6.250%, 01/15/2036 | 120 | 120 | ||||||
JPMorgan Chase | ||||||||
5.400%, 01/06/2042 | 25 | 30 | ||||||
4.850%, 02/01/2044 | 135 | 154 | ||||||
4.500%, 01/24/2022 | 660 | 730 | ||||||
4.125%, 12/15/2026 | 675 | 700 | ||||||
3.875%, 09/10/2024 | 160 | 164 | ||||||
3.625%, 05/13/2024 | 230 | 239 | ||||||
3.375%, 05/01/2023 | 140 | 141 | ||||||
3.250%, 09/23/2022 | 240 | 245 | ||||||
3.200%, 01/25/2023 | 100 | 102 | ||||||
3.150%, 07/05/2016 | 180 | 185 | ||||||
3.125%, 01/23/2025 | 120 | 120 | ||||||
2.250%, 01/23/2020 | 1,490 | 1,493 | ||||||
JPMorgan Chase Bank | ||||||||
6.000%, 10/01/2017 | 1,927 | 2,133 | ||||||
JPMorgan Chase Capital XIII | ||||||||
1.223%, 09/30/2034 (A) | 500 | 420 | ||||||
Lazard Group LLC | ||||||||
6.850%, 06/15/2017 | 109 | 121 | ||||||
4.250%, 11/14/2020 | 315 | 337 | ||||||
3.750%, 02/13/2025 | 465 | 459 | ||||||
Liberty Mutual Insurance | ||||||||
8.500%, 05/15/2025 (C) | 100 | 129 | ||||||
Lincoln National | ||||||||
4.850%, 06/24/2021 | 10 | 11 | ||||||
3.350%, 03/09/2025 | 85 | 86 | ||||||
Lloyds Banking Group PLC | ||||||||
4.500%, 11/04/2024 | 305 | 317 | ||||||
2.400%, 03/17/2020 | 310 | 313 | ||||||
1.750%, 03/16/2018 | 640 | 643 | ||||||
Lloyds TSB Bank MTN | ||||||||
5.800%, 01/13/2020 (C) | 310 | 361 | ||||||
Macquarie Bank | ||||||||
5.000%, 02/22/2017 (C) | 170 | 181 | ||||||
Macquarie Group | ||||||||
6.250%, 01/14/2021 (C) | 166 | 193 | ||||||
| Description | Face Amount ($ Thousands) | Market Value ($ Thousands) | ||||||
6.000%, 01/14/2020 (C) | $ | 50 | $ | 57 | ||||
Marsh & McLennan | ||||||||
3.500%, 03/10/2025 | 52 | 53 | ||||||
2.350%, 03/06/2020 | 59 | 59 | ||||||
Massachusetts Mutual Life Insurance (C) | ||||||||
8.875%, 06/01/2039 | 295 | 484 | ||||||
5.375%,12/01/2041 (D) | 49 | 59 | ||||||
MetLife | ||||||||
6.750%, 06/01/2016 | 390 | 416 | ||||||
6.400%, 12/15/2036 | 945 | 1,120 | ||||||
5.700%, 06/15/2035 | 15 | 19 | ||||||
4.050%, 03/01/2045 | 105 | 109 | ||||||
3.000%, 03/01/2025 | 240 | 241 | ||||||
1.903%, 12/15/2017 | 165 | 166 | ||||||
Metropolitan Life Global Funding | ||||||||
1.500%, 01/10/2018 (C) | 313 | 314 | ||||||
Mid-America Apartments‡ | ||||||||
4.300%, 10/15/2023 | 250 | 267 | ||||||
3.750%, 06/15/2024 | 285 | 292 | ||||||
Mizuho Bank | ||||||||
1.800%, 03/26/2018 (C) | 200 | 200 | ||||||
Morgan Stanley MTN | ||||||||
7.300%, 05/13/2019 | 320 | 383 | ||||||
6.625%, 04/01/2018 | 2,050 | 2,332 | ||||||
5.950%, 12/28/2017 | 200 | 222 | ||||||
5.750%, 01/25/2021 | 100 | 117 | ||||||
5.625%, 09/23/2019 | 350 | 398 | ||||||
5.550%, 04/27/2017 | 100 | 108 | ||||||
5.450%, 01/09/2017 | 470 | 503 | ||||||
5.375%, 10/15/2015 | 290 | 297 | ||||||
4.350%, 09/08/2026 | 210 | 220 | ||||||
4.300%, 01/27/2045 | 465 | 482 | ||||||
3.700%, 10/23/2024 | 539 | 562 | ||||||
2.650%, 01/27/2020 | 725 | 735 | ||||||
Murray Street Investment Trust | ||||||||
4.647%, 03/09/2017 (E) | 572 | 606 | ||||||
National Australia Bank | ||||||||
3.000%, 07/27/2016 (C) | 180 | 185 | ||||||
National City | ||||||||
6.875%, 05/15/2019 | 50 | 59 | ||||||
National City Bank | ||||||||
0.634%, 06/07/2017 (A) | 600 | 597 | ||||||
National Rural Utilities Cooperative Finance | ||||||||
10.375%, 11/01/2018 | 60 | 78 | ||||||
Nationwide Mutual Insurance (C) | ||||||||
9.375%, 08/15/2039 | 165 | 266 | ||||||
2.561%, 12/15/2024 (A) | 760 | 760 | ||||||
Navient MTN | ||||||||
3.875%, 09/10/2015 | 390 | 393 | ||||||
| 108 | SEI Institutional Managed Trust / Semi-Annual Report / March 31, 2015 |
| Description | Face Amount ($ Thousands) | Market Value ($ Thousands) | ||||||
New York Life Global Funding (C) | ||||||||
3.000%, 05/04/2015 | $ | 150 | $ | 150 | ||||
2.150%, 06/18/2019 | 73 | 74 | ||||||
New York Life Insurance (C) | ||||||||
6.750%, 11/15/2039 | 255 | 365 | ||||||
2.100%, 01/02/2019 | 330 | 335 | ||||||
Nomura Holdings | ||||||||
6.700%, 03/04/2020 | 54 | 65 | ||||||
4.125%, 01/19/2016 | 60 | 61 | ||||||
Nordea Bank (C) | ||||||||
4.875%, 05/13/2021 | 250 | 274 | ||||||
1.625%, 05/15/2018 | 220 | 220 | ||||||
Northwestern Mutual Life Insurance | ||||||||
6.063%, 03/30/2040 (C) | 430 | 569 | ||||||
PACCAR Financial MTN | ||||||||
1.600%, 03/15/2017 | 53 | 54 | ||||||
Pacific Life Global Funding MTN | ||||||||
5.000%, 05/15/2017 (C) | 50 | 53 | ||||||
Pacific Life Insurance | ||||||||
9.250%, 06/15/2039 (C) | 80 | 128 | ||||||
Pipeline Funding | ||||||||
7.500%, 01/15/2030 (C) | 450 | 577 | ||||||
PNC Bank | ||||||||
2.400%, 10/18/2019 | 400 | 408 | ||||||
2.250%, 07/02/2019 | 325 | 330 | ||||||
PNC Funding | ||||||||
5.125%, 02/08/2020 | 90 | 103 | ||||||
3.300%, 03/08/2022 | 76 | 80 | ||||||
2.700%, 09/19/2016 | 20 | 20 | ||||||
Post Apartment Homes | ||||||||
4.750%, 10/15/2017 | 700 | 751 | ||||||
Pricoa Global Funding MTN | ||||||||
1.600%, 05/29/2018 (C) | 150 | 150 | ||||||
Prologis | ||||||||
6.875%, 03/15/2020 | 29 | 34 | ||||||
Prudential Financial MTN | ||||||||
5.625%, 05/12/2041 | 10 | 12 | ||||||
4.600%, 05/15/2044 | 70 | 74 | ||||||
Prudential Insurance of America | ||||||||
8.300%, 07/01/2025 (C) | 150 | 206 | ||||||
Royal Bank of Canada | ||||||||
2.300%, 07/20/2016 | 120 | 122 | ||||||
2.000%, 10/01/2018 | 183 | 186 | ||||||
1.875%, 02/05/2020 | 180 | 180 | ||||||
1.200%, 09/19/2017 | 140 | 140 | ||||||
Royal Bank of Scotland | ||||||||
4.650%, 06/04/2018 | 350 | 369 | ||||||
2.550%, 09/18/2015 | 330 | 332 | ||||||
Santander Holdings USA | ||||||||
3.450%, 08/27/2018 | 230 | 239 | ||||||
| Description | Face Amount ($ Thousands) | Market Value ($ Thousands) | ||||||
Simon Property Group‡ | ||||||||
10.350%, 04/01/2019 | $ | 130 | $ | 169 | ||||
5.650%, 02/01/2020 | 38 | 44 | ||||||
4.125%, 12/01/2021 | 27 | 30 | ||||||
2.150%, 09/15/2017 | 125 | 128 | ||||||
Standard Chartered | ||||||||
5.700%, 03/26/2044 (C) | 560 | 625 | ||||||
State Street | ||||||||
4.956%, 03/15/2018 | 300 | 325 | ||||||
3.700%, 11/20/2023 | 138 | 148 | ||||||
3.300%, 12/16/2024 | 70 | 73 | ||||||
3.100%, 05/15/2023 | 72 | 73 | ||||||
Sumitomo Mitsui Banking MTN | ||||||||
1.350%, 07/11/2017 | 460 | 460 | ||||||
Swedbank MTN | ||||||||
2.200%, 03/04/2020 (C) | 250 | 251 | ||||||
Synchrony Financial | ||||||||
4.250%, 08/15/2024 | 235 | 246 | ||||||
2.700%, 02/03/2020 | 365 | 367 | ||||||
Tanger Properties‡ | ||||||||
3.875%, 12/01/2023 | 165 | 172 | ||||||
3.750%, 12/01/2024 | 145 | 149 | ||||||
TD Ameritrade Holding | ||||||||
2.950%, 04/01/2022 | 45 | 46 | ||||||
Teachers Insurance & Annuity Association of America | ||||||||
6.850%, 12/16/2039 (C) | 150 | 209 | ||||||
Toronto-Dominion Bank MTN | ||||||||
2.500%, 07/14/2016 | 72 | 74 | ||||||
1.625%, 03/13/2018 | 24 | 24 | ||||||
Travelers Property Casualty | ||||||||
7.750%, 04/15/2026 | 100 | 137 | ||||||
UBS MTN | ||||||||
5.875%, 12/20/2017 | 120 | 133 | ||||||
5.750%, 04/25/2018 | 100 | 112 | ||||||
1.800%, 03/26/2018 | 445 | 446 | ||||||
US Bancorp MTN | ||||||||
3.000%, 03/15/2022 | 33 | 34 | ||||||
2.950%, 07/15/2022 | 25 | 25 | ||||||
2.450%, 07/27/2015 | 75 | 75 | ||||||
2.200%, 04/25/2019 | 100 | 102 | ||||||
US Bank/Cincinnati | ||||||||
2.125%, 10/28/2019 | 760 | 770 | ||||||
Wachovia Capital Trust III | ||||||||
5.570%, 12/31/2049 (A) | 500 | 494 | ||||||
WEA Finance (C) | ||||||||
3.750%, 09/17/2024 | 410 | 424 | ||||||
2.700%, 09/17/2019 | 270 | 273 | ||||||
Wells Fargo MTN | ||||||||
6.000%, 11/15/2017 | 590 | 659 | ||||||
5.375%, 11/02/2043 | 125 | 147 | ||||||
4.650%, 11/04/2044 | 121 | 130 | ||||||
4.125%, 08/15/2023 | 900 | 961 | ||||||
3.500%, 03/08/2022 | 430 | 457 | ||||||
| SEI Institutional Managed Trust / Semi-Annual Report / March 31, 2015 | 109 |
SCHEDULE OF INVESTMENTS (Unaudited)
U.S. Fixed Income Fund (Continued)
March 31, 2015
| Description | Face Amount ($ Thousands) | Market Value ($ Thousands) | ||||||
3.450%, 02/13/2023 | $ | 230 | $ | 235 | ||||
3.300%, 09/09/2024 | 200 | 207 | ||||||
3.000%, 01/22/2021 | 575 | 595 | ||||||
2.150%, 01/15/2019 | 46 | 47 | ||||||
2.125%, 04/22/2019 | 140 | 142 | ||||||
0.601%, 03/15/2016 (A) | 400 | 400 | ||||||
Westpac Banking | ||||||||
4.875%, 11/19/2019 | 170 | 191 | ||||||
2.450%, 11/28/2016 (C) | 200 | 205 | ||||||
XLIT | ||||||||
5.500%, 03/31/2045 | 145 | 145 | ||||||
4.450%, 03/31/2025 | 120 | 121 | ||||||
|
| |||||||
| 117,868 | ||||||||
|
| |||||||
Health Care — 1.8% | ||||||||
AbbVie | ||||||||
4.400%, 11/06/2042 | 575 | 592 | ||||||
2.900%, 11/06/2022 | 245 | 243 | ||||||
1.750%, 11/06/2017 | 150 | 151 | ||||||
Actavis | ||||||||
3.250%, 10/01/2022 | 13 | 13 | ||||||
Actavis Funding SCS | ||||||||
4.850%, 06/15/2044 | 70 | 74 | ||||||
4.750%, 03/15/2045 | 340 | 361 | ||||||
4.550%, 03/15/2035 | 160 | 167 | ||||||
3.800%, 03/15/2025 | 595 | 614 | ||||||
3.450%, 03/15/2022 | 1,181 | 1,210 | ||||||
3.000%, 03/12/2020 | 447 | 457 | ||||||
Aetna | ||||||||
2.200%, 03/15/2019 | 180 | 182 | ||||||
Amgen | ||||||||
5.750%, 03/15/2040 | 62 | 75 | ||||||
5.650%, 06/15/2042 | 227 | 278 | ||||||
5.150%, 11/15/2041 | 905 | 1,042 | ||||||
4.500%, 03/15/2020 | 22 | 24 | ||||||
3.875%, 11/15/2021 | 100 | 108 | ||||||
3.625%, 05/22/2024 | 100 | 105 | ||||||
3.450%, 10/01/2020 | 50 | 53 | ||||||
2.200%, 05/22/2019 | 240 | 243 | ||||||
Anthem | ||||||||
5.100%, 01/15/2044 | 115 | 132 | ||||||
4.625%, 05/15/2042 | 41 | 44 | ||||||
3.500%, 08/15/2024 | 300 | 308 | ||||||
3.125%, 05/15/2022 | 856 | 868 | ||||||
2.300%, 07/15/2018 | 65 | 66 | ||||||
1.250%, 09/10/2015 | 50 | 50 | ||||||
Bayer US Finance (C) | ||||||||
3.375%, 10/08/2024 | 200 | 208 | ||||||
1.500%, 10/06/2017 | 750 | 755 | ||||||
Becton Dickinson | ||||||||
4.685%, 12/15/2044 | 160 | 174 | ||||||
3.734%, 12/15/2024 | 96 | 101 | ||||||
2.675%, 12/15/2019 | 297 | 303 | ||||||
| Description | Face Amount ($ Thousands) | Market Value ($ Thousands) | ||||||
Celgene | ||||||||
5.250%, 08/15/2043 | $ | 140 | $ | 162 | ||||
3.625%, 05/15/2024 | 157 | 163 | ||||||
1.900%, 08/15/2017 | 63 | 64 | ||||||
EMD Finance (C) | ||||||||
2.400%, 03/19/2020 | 445 | 450 | ||||||
1.700%, 03/19/2018 | 385 | 387 | ||||||
Express Scripts Holding | ||||||||
2.650%, 02/15/2017 | 405 | 415 | ||||||
Forest Laboratories | ||||||||
5.000%, 12/15/2021 (C) | 35 | 39 | ||||||
Gilead Sciences | ||||||||
5.650%, 12/01/2041 | 35 | 45 | ||||||
3.700%, 04/01/2024 | 665 | 710 | ||||||
3.500%, 02/01/2025 | 23 | 24 | ||||||
GlaxoSmithKline Capital PLC | ||||||||
2.850%, 05/08/2022 | 170 | 173 | ||||||
1.500%, 05/08/2017 | 160 | 162 | ||||||
Humana | ||||||||
7.200%, 06/15/2018 | 159 | 185 | ||||||
4.625%, 12/01/2042 | 40 | 42 | ||||||
3.850%, 10/01/2024 | 495 | 517 | ||||||
3.150%, 12/01/2022 | 390 | 392 | ||||||
Laboratory Corp of America Holdings | ||||||||
3.200%, 02/01/2022 | 55 | 56 | ||||||
Medco Health Solutions | ||||||||
2.750%, 09/15/2015 | 35 | 35 | ||||||
Medtronic | ||||||||
4.625%, 03/15/2045 (C) | 160 | 181 | ||||||
4.375%, 03/15/2035 (C) | 276 | 300 | ||||||
3.625%, 03/15/2024 | 545 | 579 | ||||||
3.500%, 03/15/2025 (C) | 560 | 585 | ||||||
3.150%, 03/15/2022 (C) | 305 | 317 | ||||||
2.500%, 03/15/2020 (C) | 540 | 552 | ||||||
Merck | ||||||||
3.700%, 02/10/2045 | 410 | 412 | ||||||
2.750%, 02/10/2025 | 130 | 130 | ||||||
2.400%, 09/15/2022 | 29 | 29 | ||||||
2.350%, 02/10/2022 | 576 | 577 | ||||||
Mylan | ||||||||
5.400%, 11/29/2043 | 125 | 144 | ||||||
2.550%, 03/28/2019 | 390 | 392 | ||||||
Novartis Capital | ||||||||
3.400%, 05/06/2024 | 66 | 70 | ||||||
Perrigo Finance | ||||||||
4.900%, 12/15/2044 | 200 | 214 | ||||||
3.900%, 12/15/2024 | 290 | 300 | ||||||
3.500%, 12/15/2021 | 200 | 207 | ||||||
Pfizer | ||||||||
6.200%, 03/15/2019 | 120 | 140 | ||||||
Roche Holdings | ||||||||
6.000%, 03/01/2019 (C) | 67 | 78 | ||||||
| 110 | SEI Institutional Managed Trust / Semi-Annual Report / March 31, 2015 |
| Description | Face Amount ($ Thousands) | Market Value ($ Thousands) | ||||||
Teva Pharmaceutical Finance | ||||||||
3.650%, 11/10/2021 | $ | 86 | $ | 91 | ||||
Thermo Fisher Scientific | ||||||||
5.300%, 02/01/2044 | 70 | 84 | ||||||
4.150%, 02/01/2024 | 98 | 106 | ||||||
3.300%, 02/15/2022 | 535 | 549 | ||||||
1.300%, 02/01/2017 | 55 | 55 | ||||||
UnitedHealth Group | ||||||||
3.875%, 10/15/2020 | 180 | 197 | ||||||
3.375%, 11/15/2021 | 75 | 80 | ||||||
2.875%, 12/15/2021 | 460 | 472 | ||||||
2.875%, 03/15/2023 | 50 | 51 | ||||||
Wyeth LLC | ||||||||
5.950%, 04/01/2037 | 170 | 218 | ||||||
Zimmer Holdings | ||||||||
3.550%, 04/01/2025 | 295 | 301 | ||||||
Zoetis | ||||||||
4.700%, 02/01/2043 | 11 | 11 | ||||||
3.250%, 02/01/2023 | 190 | 189 | ||||||
|
| |||||||
| 20,633 | ||||||||
|
| |||||||
Industrials — 1.4% | ||||||||
ABB Finance USA | ||||||||
4.375%, 05/08/2042 | 42 | 47 | ||||||
2.875%, 05/08/2022 | 23 | 23 | ||||||
1.625%, 05/08/2017 | 20 | 20 | ||||||
ADT | ||||||||
4.875%, 07/15/2042 | 22 | 18 | ||||||
3.500%, 07/15/2022 | 21 | 19 | ||||||
Air Canada Pass-Through Trust, Ser 2013-1, Cl A | ||||||||
4.125%, 05/15/2025 (C) | 27 | 28 | ||||||
American Airlines Pass-Through Trust, Ser 2011-1, Cl A | ||||||||
5.250%, 01/31/2021 | 14 | 15 | ||||||
American Airlines Pass-Through Trust, Ser 2013-2, Cl A | ||||||||
4.950%, 01/15/2023 | 916 | 993 | ||||||
BAE Systems (C) | ||||||||
6.375%, 06/01/2019 | 100 | 116 | ||||||
5.800%, 10/11/2041 | 20 | 25 | ||||||
5.200%, 08/15/2015 | 90 | 91 | ||||||
4.750%, 10/11/2021 | 750 | 835 | ||||||
Boeing | ||||||||
4.875%, 02/15/2020 | 210 | 241 | ||||||
Burlington Northern Santa Fe | ||||||||
7.290%, 06/01/2036 | 90 | 128 | ||||||
5.750%, 03/15/2018 | 950 | 1,065 | ||||||
5.400%, 06/01/2041 | 50 | 60 | ||||||
4.550%, 09/01/2044 | 190 | 208 | ||||||
4.150%, 04/01/2045 | 640 | 666 | ||||||
3.850%, 09/01/2023 | 530 | 572 | ||||||
| Description | Face Amount ($ Thousands) | Market Value ($ Thousands) | ||||||
3.450%, 09/15/2021 | $ | 91 | $ | 97 | ||||
Canadian National Railway | ||||||||
5.850%, 11/15/2017 | 50 | 56 | ||||||
Canadian Pacific Railway | ||||||||
4.500%, 01/15/2022 | 50 | 55 | ||||||
Cargill | ||||||||
7.350%, 03/06/2019 (C) | 250 | 300 | ||||||
Caterpillar | ||||||||
0.950%, 06/26/2015 | 300 | 301 | ||||||
Caterpillar Financial Services MTN | ||||||||
2.750%, 08/20/2021 | 405 | 416 | ||||||
Catholic Health Initiatives | ||||||||
4.350%, 11/01/2042 | 30 | 30 | ||||||
Continental Airlines Pass-Through Trust, Ser 1999-2, Cl A-1 | ||||||||
7.256%, 03/15/2020 | 181 | 202 | ||||||
Continental Airlines Pass-Through Trust, Ser 2000-1, Cl A-1 | ||||||||
8.048%, 11/01/2020 | 317 | 359 | ||||||
Continental Airlines Pass-Through Trust, Ser 2007-1, Cl A | ||||||||
5.983%, 04/19/2022 | 677 | 762 | ||||||
Continental Airlines Pass-Through Trust, Ser 2009-2, Cl A | ||||||||
7.250%, 11/10/2019 | 155 | 179 | ||||||
CSX | ||||||||
6.250%, 03/15/2018 | 155 | 176 | ||||||
Danaher | ||||||||
3.900%, 06/23/2021 | 22 | 24 | ||||||
Deere & Company | ||||||||
3.900%, 06/09/2042 | 13 | 14 | ||||||
2.600%, 06/08/2022 | 15 | 15 | ||||||
Delta Air Lines Pass-Through Trust, Ser 2007-1, Cl A | ||||||||
6.821%, 08/10/2022 | 121 | 142 | ||||||
Delta Air Lines Pass-Through Trust, Ser 2010-1, Cl A | ||||||||
6.200%, 07/02/2018 (D) | 371 | 408 | ||||||
Delta Air Lines Pass-Through Trust, Ser 2010-2, Cl A | ||||||||
4.950%, 05/23/2019 | 34 | 36 | ||||||
Delta Air Lines Pass-Through Trust, Ser 2012-1, Cl A | ||||||||
4.750%, 05/07/2020 | 18 | 20 | ||||||
Eaton | ||||||||
7.625%, 04/01/2024 | 75 | 98 | ||||||
4.150%, 11/02/2042 | 110 | 114 | ||||||
2.750%, 11/02/2022 | 450 | 451 | ||||||
1.500%, 11/02/2017 | 60 | 60 | ||||||
| SEI Institutional Managed Trust / Semi-Annual Report / March 31, 2015 | 111 |
SCHEDULE OF INVESTMENTS (Unaudited)
U.S. Fixed Income Fund (Continued)
March 31, 2015
| Description | Face Amount ($ Thousands) | Market Value ($ Thousands) | ||||||
FedEx | ||||||||
4.100%, 02/01/2045 | $ | 210 | $ | 210 | ||||
3.900%, 02/01/2035 | 32 | 32 | ||||||
3.200%, 02/01/2025 | 210 | 213 | ||||||
Fluor | ||||||||
3.375%, 09/15/2021 | 68 | 71 | ||||||
Glencore Funding LLC | ||||||||
2.500%, 01/15/2019 (C) | 190 | 190 | ||||||
John Deere Capital MTN | ||||||||
5.750%, 09/10/2018 | 100 | 114 | ||||||
2.050%, 03/10/2020 | 40 | 40 | ||||||
L-3 Communications | ||||||||
3.950%, 05/28/2024 | 250 | 257 | ||||||
Lockheed Martin | ||||||||
4.070%, 12/15/2042 | 91 | 95 | ||||||
3.800%, 03/01/2045 | 160 | 159 | ||||||
3.350%, 09/15/2021 | 575 | 610 | ||||||
2.125%, 09/15/2016 | 37 | 38 | ||||||
Norfolk Southern | ||||||||
6.000%, 05/23/2111 | 158 | 200 | ||||||
Northrop Grumman | ||||||||
3.850%, 04/15/2045 | 251 | 247 | ||||||
3.250%, 08/01/2023 | 1,740 | 1,794 | ||||||
Parker-Hannifin MTN | ||||||||
4.450%, 11/21/2044 | 33 | 37 | ||||||
3.300%, 11/21/2024 | 270 | 283 | ||||||
Penske Truck Leasing L.P. (C) | ||||||||
3.375%, 02/01/2022 | 276 | 274 | ||||||
3.050%, 01/09/2020 | 490 | 498 | ||||||
2.500%, 06/15/2019 | 405 | 406 | ||||||
Pitney Bowes MTN | ||||||||
5.600%, 03/15/2018 | 25 | 27 | ||||||
Republic Services | ||||||||
3.550%, 06/01/2022 | 29 | 30 | ||||||
Ryder System MTN | ||||||||
3.600%, 03/01/2016 | 35 | 36 | ||||||
2.500%, 03/01/2017 | 47 | 48 | ||||||
Union Pacific | ||||||||
4.300%, 06/15/2042 | 20 | 22 | ||||||
4.163%, 07/15/2022 | 131 | 147 | ||||||
3.250%, 01/15/2025 | 265 | 278 | �� | |||||
United Airlines Pass-Through Trust, Ser 2013-1, Cl A | ||||||||
4.300%, 08/15/2025 | 32 | 34 | ||||||
United Technologies | ||||||||
8.875%, 11/15/2019 | 110 | 142 | ||||||
4.500%, 06/01/2042 | 117 | 130 | ||||||
UPS | ||||||||
8.375%, 04/01/2020 | 50 | 65 | ||||||
| Description | Face Amount ($ Thousands) | Market Value ($ Thousands) | ||||||
Valmont Industries | ||||||||
5.250%, 10/01/2054 | $ | 170 | $ | 168 | ||||
Waste Management | ||||||||
4.750%, 06/30/2020 | 93 | 104 | ||||||
4.600%, 03/01/2021 | 90 | 101 | ||||||
3.900%, 03/01/2035 | 10 | 10 | ||||||
3.500%, 05/15/2024 | 100 | 104 | ||||||
|
| |||||||
| 16,699 | ||||||||
|
| |||||||
Information Technology — 0.7% |
| |||||||
Alibaba Group Holding | ||||||||
3.600%, 11/28/2024 (C) | 270 | 271 | ||||||
Apple | ||||||||
3.850%, 05/04/2043 | 500 | 508 | ||||||
3.450%, 02/09/2045 | 236 | 224 | ||||||
2.850%, 05/06/2021 | 413 | 430 | ||||||
2.500%, 02/09/2025 | 305 | 298 | ||||||
2.400%, 05/03/2023 | 114 | 113 | ||||||
2.150%, 02/09/2022 | 82 | 81 | ||||||
0.503%, 05/03/2018 (A) | 69 | 69 | ||||||
Arrow Electronics | ||||||||
7.500%, 01/15/2027 | 80 | 98 | ||||||
6.875%, 06/01/2018 | 95 | 107 | ||||||
6.000%, 04/01/2020 | 45 | 51 | ||||||
Broadcom MTN | ||||||||
4.500%, 08/01/2034 | 65 | 70 | ||||||
Cisco Systems | ||||||||
5.900%, 02/15/2039 | 150 | 193 | ||||||
5.500%, 01/15/2040 | 100 | 124 | ||||||
eBay | ||||||||
4.000%, 07/15/2042 | 21 | 18 | ||||||
3.450%, 08/01/2024 | 100 | 99 | ||||||
2.875%, 08/01/2021 | 30 | 30 | ||||||
2.600%, 07/15/2022 | 49 | 47 | ||||||
Hewlett-Packard | ||||||||
6.000%, 09/15/2041 | 23 | 26 | ||||||
4.650%, 12/09/2021 | 20 | 22 | ||||||
4.375%, 09/15/2021 | 24 | 26 | ||||||
HP Enterprise Services | ||||||||
7.450%, 10/15/2029 | 125 | 158 | ||||||
Intel | ||||||||
4.800%, 10/01/2041 | 65 | 73 | ||||||
3.300%, 10/01/2021 | 70 | 74 | ||||||
International Business Machines | ||||||||
4.000%, 06/20/2042 | 169 | 170 | ||||||
1.625%, 05/15/2020 | 126 | 124 | ||||||
Intuit | ||||||||
5.750%, 03/15/2017 | 75 | 81 | ||||||
Keysight Technologies | ||||||||
4.550%, 10/30/2024 (C) | 155 | 156 | ||||||
KLA-Tencor | ||||||||
4.125%, 11/01/2021 | 370 | 390 | ||||||
| 112 | SEI Institutional Managed Trust / Semi-Annual Report / March 31, 2015 |
| Description | Face Amount ($ Thousands) | Market Value ($ Thousands) | ||||||
Koninklijke Philips Electronics | ||||||||
5.750%, 03/11/2018 | $ | 24 | $ | 27 | ||||
3.750%, 03/15/2022 | 127 | 133 | ||||||
MasterCard | ||||||||
3.375%, 04/01/2024 | 350 | 368 | ||||||
Microsoft | ||||||||
4.500%, 10/01/2040 | 14 | 16 | ||||||
4.000%, 02/12/2055 | 279 | 279 | ||||||
3.750%, 02/12/2045 | 330 | 331 | ||||||
3.625%, 12/15/2023 | 89 | 97 | ||||||
3.500%, 02/12/2035 | 593 | 591 | ||||||
2.375%, 02/12/2022 | 40 | 40 | ||||||
Oracle | ||||||||
6.125%, 07/08/2039 | 27 | 36 | ||||||
5.375%, 07/15/2040 | 17 | 21 | ||||||
4.300%, 07/08/2034 | 103 | 112 | ||||||
3.625%, 07/15/2023 | 56 | 60 | ||||||
2.800%, 07/08/2021 | 103 | 107 | ||||||
2.375%, 01/15/2019 | 61 | 63 | ||||||
2.250%, 10/08/2019 | 210 | 214 | ||||||
1.200%, 10/15/2017 | 250 | 251 | ||||||
Tencent Holdings MTN | ||||||||
3.800%, 02/11/2025 (C) | 215 | 220 | ||||||
Texas Instruments | ||||||||
2.750%, 03/12/2021 | 275 | 282 | ||||||
1.650%, 08/03/2019 | 55 | 55 | ||||||
TSMC Global | ||||||||
1.625%, 04/03/2018 (C) | 460 | 456 | ||||||
Xerox | ||||||||
4.800%, 03/01/2035 | 70 | 69 | ||||||
4.500%, 05/15/2021 | 13 | 14 | ||||||
2.950%, 03/15/2017 | 27 | 28 | ||||||
2.750%, 09/01/2020 | 251 | 251 | ||||||
|
| |||||||
| 8,252 | ||||||||
|
| |||||||
Materials — 0.9% | ||||||||
Agrium | ||||||||
5.250%, 01/15/2045 | 61 | 69 | ||||||
4.125%, 03/15/2035 | 62 | 61 | ||||||
3.375%, 03/15/2025 | 36 | 36 | ||||||
Albemarle | ||||||||
5.450%, 12/01/2044 | 210 | 226 | ||||||
Barrick Gold | ||||||||
4.100%, 05/01/2023 | 570 | 562 | ||||||
3.850%, 04/01/2022 | 540 | 528 | ||||||
BHP Billiton Finance USA | ||||||||
6.500%, 04/01/2019 | 125 | 147 | ||||||
5.000%, 09/30/2043 | 299 | 342 | ||||||
4.125%, 02/24/2042 | 40 | 41 | ||||||
3.850%, 09/30/2023 | 275 | 294 | ||||||
3.250%, 11/21/2021 | 360 | 376 | ||||||
2.050%, 09/30/2018 | 44 | 45 | ||||||
Celulosa Arauco y Constitucion | ||||||||
4.750%, 01/11/2022 | 170 | 179 | ||||||
| Description | Face Amount ($ Thousands) | Market Value ($ Thousands) | ||||||
CRH America | ||||||||
6.000%, 09/30/2016 | $ | 31 | $ | 33 | ||||
Dow Chemical | ||||||||
8.550%, 05/15/2019 | 22 | 28 | ||||||
5.250%, 11/15/2041 | 70 | 79 | ||||||
4.125%, 11/15/2021 | 86 | 93 | ||||||
3.000%, 11/15/2022 | 800 | 807 | ||||||
E.I. Du Pont de Nemours | ||||||||
5.600%, 12/15/2036 | 80 | 98 | ||||||
4.900%, 01/15/2041 | 25 | 28 | ||||||
1.950%, 01/15/2016 | 40 | 40 | ||||||
Eastman Chemical | ||||||||
4.650%, 10/15/2044 | 135 | 142 | ||||||
3.800%, 03/15/2025 | 290 | 301 | ||||||
2.700%, 01/15/2020 | 510 | 517 | ||||||
Ecolab | ||||||||
1.450%, 12/8/2017 | 31 | 31 | ||||||
Freeport-McMoRan | ||||||||
6.875%, 02/15/2023 | 36 | 38 | ||||||
6.500%, 11/15/2020 | 33 | 35 | ||||||
4.550%, 11/14/2024 | 205 | 197 | ||||||
3.550%, 03/01/2022 | 10 | 9 | ||||||
3.100%, 03/15/2020 | 140 | 136 | ||||||
2.150%, 03/01/2017 | 81 | 81 | ||||||
Glencore Finance Canada (C) | ||||||||
2.700%, 10/25/2017 | 250 | 254 | ||||||
2.050%, 10/23/2015 | 467 | 469 | ||||||
LYB International Finance BV | ||||||||
4.875%, 03/15/2044 | 125 | 134 | ||||||
LyondellBasell Industries | ||||||||
4.625%, 02/26/2055 | 125 | 124 | ||||||
Monsanto | ||||||||
4.700%, 07/15/2064 | 12 | 13 | ||||||
4.200%, 07/15/2034 | 12 | 13 | ||||||
3.375%, 07/15/2024 | 60 | 62 | ||||||
2.750%, 07/15/2021 | 50 | 51 | ||||||
Mosaic | ||||||||
5.625%, 11/15/2043 | 120 | 143 | ||||||
5.450%, 11/15/2033 | 204 | 236 | ||||||
4.875%, 11/15/2041 | 30 | 32 | ||||||
4.250%, 11/15/2023 | 60 | 64 | ||||||
3.750%, 11/15/2021 | 25 | 26 | ||||||
Nucor | ||||||||
4.000%, 08/01/2023 | 39 | 41 | ||||||
Potash Corp of Saskatchewan | ||||||||
6.500%, 05/15/2019 | 50 | 59 | ||||||
3.000%, 04/01/2025 | 55 | 55 | ||||||
PPG Industries | ||||||||
9.000%, 05/01/2021 | 145 | 196 | ||||||
Praxair | ||||||||
5.200%, 03/15/2017 | 70 | 76 | ||||||
2.650%, 02/05/2025 | 26 | 26 | ||||||
Rio Tinto Finance USA | ||||||||
6.500%, 07/15/2018 | 200 | 230 | ||||||
| SEI Institutional Managed Trust / Semi-Annual Report / March 31, 2015 | 113 |
SCHEDULE OF INVESTMENTS (Unaudited)
U.S. Fixed Income Fund (Continued)
March 31, 2015
| Description | Face Amount ($ Thousands) | Market Value ($ Thousands) | ||||||
3.750%, 09/20/2021 | $ | 450 | $ | 475 | ||||
2.875%, 08/21/2022 | 105 | 104 | ||||||
Southern Copper | ||||||||
5.250%, 11/08/2042 | 370 | 337 | ||||||
Teck Resources | ||||||||
3.750%, 02/01/2023 | 154 | 144 | ||||||
Teck Resources Limited | ||||||||
6.250%, 07/15/2041 | 5 | 5 | ||||||
Union Carbide | ||||||||
7.750%, 10/01/2096 | 50 | 68 | ||||||
Vale Overseas | ||||||||
8.250%, 01/17/2034 | 80 | 89 | ||||||
6.875%, 11/21/2036 | 190 | 184 | ||||||
4.375%, 01/11/2022 | 885 | 851 | ||||||
|
| |||||||
| 10,160 | ||||||||
|
| |||||||
Telecommunication Services — 1.3% |
| |||||||
America Movil | ||||||||
5.625%, 11/15/2017 | 400 | 442 | ||||||
3.125%, 07/16/2022 | 335 | 341 | ||||||
1.268%, 09/12/2016 (A) | 220 | 221 | ||||||
AT&T | ||||||||
6.300%, 01/15/2038 | 270 | 323 | ||||||
5.800%, 02/15/2019 | 210 | 238 | ||||||
5.500%, 02/01/2018 | 100 | 110 | ||||||
5.350%, 09/01/2040 | 423 | 462 | ||||||
4.350%, 06/15/2045 | 200 | 191 | ||||||
4.300%, 12/15/2042 | 230 | 220 | ||||||
3.875%, 08/15/2021 | 250 | 265 | ||||||
1.600%, 02/15/2017 | 45 | 45 | ||||||
BellSouth Telecommunications | ||||||||
6.300%, 12/15/2015 | 34 | 35 | ||||||
Bharti Airtel International Netherlands BV | ||||||||
5.350%, 05/20/2024 (C) | 210 | 231 | ||||||
British Telecommunications | ||||||||
5.950%, 01/15/2018 | 200 | 224 | ||||||
Centel Capital | ||||||||
9.000%, 10/15/2019 | 65 | 79 | ||||||
CenturyLink | ||||||||
7.650%, 03/15/2042 | 15 | 15 | ||||||
Deutsche Telekom International Finance | ||||||||
6.000%, 07/08/2019 | 175 | 204 | ||||||
5.750%, 03/23/2016 | 170 | 178 | ||||||
2.250%, 03/06/2017 (C) | 770 | 783 | ||||||
Nippon Telegraph & Telephone | ||||||||
1.400%, 07/18/2017 | 65 | 65 | ||||||
Orange | ||||||||
9.000%, 03/01/2031 | 50 | 77 | ||||||
2.750%, 09/14/2016 | 35 | 36 | ||||||
Qwest | ||||||||
6.750%, 12/01/2021 | 156 | 179 | ||||||
| Description | Face Amount ($ Thousands) | Market Value ($ Thousands) | ||||||
Rogers Communications | ||||||||
8.750%, 05/01/2032 | $ | 70 | $ | 102 | ||||
5.450%, 10/01/2043 | 33 | 39 | ||||||
4.100%, 10/01/2023 | 80 | 85 | ||||||
Telefonica Chile | ||||||||
3.875%, 10/12/2022 (C) | 210 | 211 | ||||||
Telefonica Emisiones | ||||||||
5.462%, 02/16/2021 | 23 | 26 | ||||||
5.134%, 04/27/2020 | 362 | 409 | ||||||
Telstra | ||||||||
3.125%, 04/07/2025 (C) | 60 | 60 | ||||||
Verizon Communications | ||||||||
6.550%, 09/15/2043 | 1,142 | 1,487 | ||||||
6.400%, 09/15/2033 | 367 | 458 | ||||||
5.050%, 03/15/2034 | 92 | 100 | ||||||
4.862%, 08/21/2046 | 1,207 | 1,264 | ||||||
4.672%, 03/15/2055 (C) | 39 | 38 | ||||||
4.522%, 09/15/2048 (C) | 750 | 747 | ||||||
4.500%, 09/15/2020 | 289 | 319 | ||||||
4.400%, 11/01/2034 | 1,387 | 1,413 | ||||||
4.272%, 01/15/2036 (C) | 184 | 183 | ||||||
4.150%, 03/15/2024 | 380 | 408 | ||||||
3.850%, 11/01/2042 | 200 | 182 | ||||||
3.500%, 11/01/2024 | 190 | 194 | ||||||
3.450%, 03/15/2021 | 150 | 157 | ||||||
3.000%, 11/01/2021 | 956 | 975 | ||||||
2.625%, 02/21/2020 | 24 | 24 | ||||||
2.500%, 09/15/2016 | 470 | 480 | ||||||
2.450%, 11/01/2022 | 90 | 87 | ||||||
Verizon Global Funding | ||||||||
5.850%, 09/15/2035 | 40 | 47 | ||||||
Vodafone Group PLC | ||||||||
5.450%, 06/10/2019 | 75 | 85 | ||||||
2.950%, 02/19/2023 | 475 | 467 | ||||||
1.625%, 03/20/2017 | 80 | 81 | ||||||
|
| |||||||
| 15,092 | ||||||||
|
| |||||||
Utilities — 1.7% | ||||||||
AEP Texas Central Transition Funding | ||||||||
5.170%, 01/01/2018 | 575 | 611 | ||||||
AGL Capital | ||||||||
6.375%, 07/15/2016 | 50 | 53 | ||||||
5.250%, 08/15/2019 | 50 | 56 | ||||||
Alabama Power | ||||||||
6.125%, 05/15/2038 | 18 | 25 | ||||||
5.875%, 12/01/2022 | 95 | 115 | ||||||
3.750%, 03/01/2045 | 169 | 172 | ||||||
Ameren Illinois | ||||||||
4.300%, 07/01/2044 | 140 | 158 | ||||||
American Electric Power | ||||||||
1.650%, 12/15/2017 | 418 | 420 | ||||||
American Water Capital | ||||||||
3.850%, 03/01/2024 | 120 | 129 | ||||||
| 114 | SEI Institutional Managed Trust / Semi-Annual Report / March 31, 2015 |
| Description | Face Amount ($ Thousands) | Market Value ($ Thousands) | ||||||
3.400%, 03/01/2025 | $ | 32 | $ | 33 | ||||
Appalachian Power | ||||||||
6.700%, 08/15/2037 | 100 | 137 | ||||||
5.950%, 05/15/2033 | 100 | 124 | ||||||
Arizona Public Service | ||||||||
5.050%, 09/01/2041 | 47 | 57 | ||||||
4.500%, 04/01/2042 | 15 | 17 | ||||||
2.200%, 01/15/2020 | 20 | 20 | ||||||
Atmos Energy | ||||||||
4.125%, 10/15/2044 | 50 | 53 | ||||||
Berkshire Hathaway Energy | ||||||||
4.500%, 02/01/2045 | 505 | 550 | ||||||
3.750%, 11/15/2023 | 156 | 166 | ||||||
Boston Gas | ||||||||
4.487%, 02/15/2042 (C) | 35 | 40 | ||||||
Carolina Power & Light | ||||||||
5.300%, 01/15/2019 | 175 | 198 | ||||||
3.000%, 09/15/2021 | 194 | 203 | ||||||
2.800%, 05/15/2022 | 25 | 26 | ||||||
CenterPoint Energy | ||||||||
6.500%, 05/01/2018 | 50 | 57 | ||||||
CenterPoint Energy Houston Electric LLC | ||||||||
4.500%, 04/01/2044 | 250 | 286 | ||||||
CenterPoint Energy Resources | ||||||||
4.500%, 01/15/2021 | 81 | 90 | ||||||
Cleveland Electric Illuminating | ||||||||
7.880%, 11/01/2017 | 170 | 198 | ||||||
Commonwealth Edison | ||||||||
3.700%, 03/01/2045 | 65 | 66 | ||||||
Consolidated Edison of | ||||||||
5.700%, 06/15/2040 | 38 | 49 | ||||||
4.625%, 12/01/2054 | 120 | 135 | ||||||
4.450%, 03/15/2044 | 470 | 523 | ||||||
Consumers Energy | ||||||||
6.700%, 09/15/2019 | 100 | 119 | ||||||
4.350%, 08/31/2064 | 120 | 131 | ||||||
Detroit Edison | ||||||||
2.650%, 06/15/2022 | 26 | 26 | ||||||
Dominion Resources | ||||||||
6.400%, 06/15/2018 | 180 | 206 | ||||||
5.250%, 08/01/2033 | 90 | 104 | ||||||
4.700%, 12/01/2044 | 195 | 217 | ||||||
2.500%, 12/01/2019 | 385 | 391 | ||||||
1.950%, 08/15/2016 | 165 | 167 | ||||||
DTE Electric | ||||||||
3.700%, 03/15/2045 | 49 | 50 | ||||||
DTE Energy | ||||||||
2.400%, 12/01/2019 | 24 | 24 | ||||||
Duke Energy | ||||||||
3.550%, 09/15/2021 | 76 | 81 | ||||||
Duke Energy Carolinas | ||||||||
4.300%, 06/15/2020 | 39 | 43 | ||||||
| Description | Face Amount ($ Thousands) | Market Value ($ Thousands) | ||||||
4.250%, 12/15/2041 | $ | 28 | $ | 31 | ||||
4.100%, 05/15/2042 | 25 | 27 | ||||||
Duke Energy Florida | ||||||||
3.850%, 11/15/2042 | 215 | 223 | ||||||
Duke Energy Indiana | ||||||||
4.200%, 03/15/2042 | 30 | 33 | ||||||
3.750%, 07/15/2020 | 52 | 57 | ||||||
Duquesne Light Holdings | ||||||||
6.400%, 09/15/2020 (C) | 500 | 593 | ||||||
Electricite de France | ||||||||
6.000%, 01/22/2114 (C) | 225 | 273 | ||||||
Enel Finance International | ||||||||
5.125%, 10/07/2019 (C) | 100 | 112 | ||||||
Exelon Generation | ||||||||
6.200%, 10/01/2017 | 100 | 111 | ||||||
4.000%, 10/01/2020 (D) | 120 | 127 | ||||||
FirstEnergy | ||||||||
4.250%, 03/15/2023 | 340 | 356 | ||||||
2.750%, 03/15/2018 | 70 | 72 | ||||||
FirstEnergy, Ser C | ||||||||
7.375%, 11/15/2031 | 480 | 610 | ||||||
Florida Power & Light | ||||||||
5.950%, 10/01/2033 | 35 | 47 | ||||||
5.125%, 06/01/2041 | 28 | 35 | ||||||
Jersey Central Power & Light | ||||||||
7.350%, 02/01/2019 | 100 | 118 | ||||||
5.625%, 05/01/2016 | 300 | 313 | ||||||
4.700%, 04/01/2024 (C) | 200 | 218 | ||||||
John Sevier Combined Cycle Generation | ||||||||
4.626%, 01/15/2042 | 57 | 65 | ||||||
Kansas City Power & Light | ||||||||
5.300%, 10/01/2041 | 100 | 118 | ||||||
KeySpan Gas East | ||||||||
5.819%, 04/01/2041 (C) | 400 | 530 | ||||||
Massachusetts Electric | ||||||||
5.900%, 11/15/2039 (C) | 55 | 72 | ||||||
Metropolitan Edison | ||||||||
3.500%, 03/15/2023 (C) | 350 | 357 | ||||||
MidAmerican Energy Holdings | ||||||||
6.500%, 09/15/2037 | 200 | 271 | ||||||
Nevada Power | ||||||||
7.125%, 03/15/2019 | 110 | 132 | ||||||
6.500%, 08/01/2018 | 40 | 46 | ||||||
5.450%, 05/15/2041 | 50 | 64 | ||||||
5.375%, 09/15/2040 | 12 | 15 | ||||||
NextEra Energy Capital Holdings | ||||||||
3.625%, 06/15/2023 | 100 | 105 | ||||||
Niagara Mohawk Power (C) | ||||||||
4.881%, 08/15/2019 | 80 | 90 | ||||||
4.278%, 10/01/2034 | 195 | 213 | ||||||
NiSource Finance | ||||||||
5.800%, 02/01/2042 | 149 | 190 | ||||||
| SEI Institutional Managed Trust / Semi-Annual Report / March 31, 2015 | 115 |
SCHEDULE OF INVESTMENTS (Unaudited)
U.S. Fixed Income Fund (Continued)
March 31, 2015
| Description | Face Amount ($ Thousands) | Market Value ($ Thousands) | ||||||
5.650%, 02/01/2045 | $ | 50 | $ | 64 | ||||
Northern States Power | ||||||||
6.250%, 06/01/2036 | 100 | 139 | ||||||
5.350%, 11/01/2039 | 19 | 25 | ||||||
Oncor Electric Delivery LLC | ||||||||
6.800%, 09/01/2018 | 460 | 537 | ||||||
5.250%, 09/30/2040 | 250 | 305 | ||||||
Pacific Gas & Electric | ||||||||
8.250%, 10/15/2018 | 180 | 220 | ||||||
6.050%, 03/01/2034 | 160 | 209 | ||||||
5.800%, 03/01/2037 | 70 | 89 | ||||||
5.625%, 11/30/2017 | 525 | 580 | ||||||
5.400%, 01/15/2040 | 42 | 52 | ||||||
4.500%, 12/15/2041 | 48 | 53 | ||||||
3.250%, 09/15/2021 | 12 | 13 | ||||||
3.250%, 06/15/2023 | 150 | 155 | ||||||
Pacificorp | ||||||||
6.250%, 10/15/2037 | 90 | 124 | ||||||
5.650%, 07/15/2018 | 175 | 198 | ||||||
3.600%, 04/01/2024 | 355 | 380 | ||||||
PECO Energy | ||||||||
4.150%, 10/01/2044 | 385 | 424 | ||||||
Potomac Electric Power | ||||||||
4.150%, 03/15/2043 | 165 | 178 | ||||||
3.600%, 03/15/2024 | 170 | 181 | ||||||
Progress Energy | ||||||||
3.150%, 04/01/2022 | 280 | 289 | ||||||
PSEG Power LLC | ||||||||
5.500%, 12/01/2015 | 100 | 103 | ||||||
5.320%, 09/15/2016 | 40 | 42 | ||||||
5.125%, 04/15/2020 | 45 | 51 | ||||||
4.150%, 09/15/2021 | 33 | 35 | ||||||
2.750%, 09/15/2016 | 200 | 205 | ||||||
Public Service Electric & Gas MTN | ||||||||
5.375%, 11/01/2039 | 28 | 36 | ||||||
3.050%, 11/15/2024 | 155 | 160 | ||||||
2.700%, 05/01/2015 | 45 | 45 | ||||||
Public Service of Colorado | ||||||||
4.300%, 03/15/2044 | 100 | 114 | ||||||
Public Service of | ||||||||
3.500%, 11/01/2023 | 205 | 218 | ||||||
Public Service of Oklahoma | ||||||||
5.150%, 12/01/2019 | 83 | 94 | ||||||
Puget Energy | ||||||||
6.000%, 09/01/2021 | 190 | 224 | ||||||
San Diego Gas & Electric | ||||||||
6.000%, 06/01/2026 | 60 | 76 | ||||||
3.950%, 11/15/2041 | 14 | 15 | ||||||
Sempra Energy | ||||||||
6.000%, 10/15/2039 | 50 | 64 | ||||||
South Carolina Electric & Gas | ||||||||
4.500%, 06/01/2064 | 13 | 14 | ||||||
| Description | Face Amount ($ Thousands) | Market Value ($ Thousands) | ||||||
Southern | ||||||||
2.150%, 09/01/2019 | $ | 375 | $ | 377 | ||||
1.950%, 09/01/2016 | 26 | 26 | ||||||
Southern California Edison | ||||||||
5.500%, 03/15/2040 | 50 | 65 | ||||||
4.050%, 03/15/2042 | 5 | 5 | ||||||
3.900%, 12/01/2041 | 60 | 63 | ||||||
3.875%, 06/01/2021 | 22 | 24 | ||||||
3.500%, 10/01/2023 | 205 | 219 | ||||||
Southern California Gas | ||||||||
4.450%, 03/15/2044 | 300 | 347 | ||||||
Southern Power | ||||||||
5.150%, 09/15/2041 | 11 | 13 | ||||||
Southwestern Electric Power | ||||||||
3.900%, 04/01/2045 | 165 | 163 | ||||||
3.550%, 02/15/2022 | 125 | 132 | ||||||
Southwestern Public Service | ||||||||
8.750%, 12/01/2018 | 90 | 112 | ||||||
Virginia Electric & Power | ||||||||
4.650%, 08/15/2043 | 245 | 285 | ||||||
4.450%, 02/15/2044 | 110 | 124 | ||||||
2.950%, 01/15/2022 | 330 | 340 | ||||||
Wisconsin Electric Power | ||||||||
2.950%, 09/15/2021 | 3 | 3 | ||||||
|
| |||||||
| 19,959 | ||||||||
|
| |||||||
Total Corporate Obligations (Cost $265,670) ($ Thousands) | 279,559 | |||||||
|
| |||||||
ASSET-BACKED SECURITIES — 9.7% |
| |||||||
Automotive — 1.9% | ||||||||
Ally Auto Receivables Trust, Ser 2011-5, Cl A4 | ||||||||
1.320%, 07/15/2016 | 52 | 52 | ||||||
Ally Auto Receivables Trust, Ser 2013-1, Cl A3 | ||||||||
0.630%, 05/15/2017 | 60 | 60 | ||||||
Ally Auto Receivables Trust, Ser 2013-2, Cl A3 | ||||||||
0.790%, 01/15/2018 | 574 | 574 | ||||||
Ally Auto Receivables Trust, Ser 2014-1, Cl A2 | ||||||||
0.480%, 02/15/2017 | 358 | 358 | ||||||
Ally Auto Receivables Trust, Ser 2014-1, Cl A4 | ||||||||
1.530%, 04/15/2019 | 1,108 | 1,112 | ||||||
Ally Auto Receivables Trust, Ser 2014-2, Cl A4 | ||||||||
1.840%, 01/15/2020 | 201 | 203 | ||||||
Ally Auto Receivables Trust, Ser 2014-SN2, Cl A3 | ||||||||
1.030%, 09/20/2017 | 66 | 66 | ||||||
| 116 | SEI Institutional Managed Trust / Semi-Annual Report / March 31, 2015 |
| Description | Face Amount ($ Thousands) | Market Value ($ Thousands) | ||||||
American Credit Acceptance Receivables Trust, Ser 2012-3, Cl A | ||||||||
1.640%, 11/15/2016 (C) | $ | 2 | $ | 2 | ||||
American Credit Acceptance Receivables Trust, Ser 2013-1, Cl A | ||||||||
1.450%, 04/16/2018 (C) | 43 | 43 | ||||||
American Credit Acceptance Receivables Trust, Ser 2014-2, Cl A | ||||||||
0.990%, 10/10/2017 (C) | 135 | 135 | ||||||
American Credit Acceptance Receivables Trust, Ser 2014-4, Cl A | ||||||||
1.330%, 07/10/2018 (C) | 112 | 112 | ||||||
American Credit Acceptance Receivables Trust, Ser 2015-1, Cl A | ||||||||
1.430%, 08/12/2019 (C) | 169 | 169 | ||||||
AmeriCredit Automobile Receivables Trust, Ser 2012-5, Cl A3 | ||||||||
0.620%, 06/08/2017 | 14 | 14 | ||||||
AmeriCredit Automobile Receivables Trust, Ser 2013-4, Cl A2 | ||||||||
0.740%, 11/08/2016 | 32 | 32 | ||||||
Avis Budget Rental Car Funding AESOP LLC, Ser 2012-3A, Cl A | ||||||||
2.100%, 03/20/2019 (C) | 336 | 340 | ||||||
Avis Budget Rental Car Funding AESOP LLC, Ser 2013-1A, Cl A | ||||||||
1.920%, 09/20/2019 (C) | 542 | 542 | ||||||
Avis Budget Rental Car Funding AESOP LLC, Ser 2013-2A, Cl A | ||||||||
2.970%, 02/20/2020 (C) | 190 | 196 | ||||||
Bank of The West Auto Trust, Ser 2014-1, Cl A3 | ||||||||
1.090%, 03/15/2019 (C) | 231 | 231 | ||||||
California Republic Auto Receivables Trust, Ser 2012-1, Cl A | ||||||||
1.180%, 08/15/2017 (C) | 19 | 19 | ||||||
California Republic Auto Receivables Trust, Ser 2014-2, Cl A4 | ||||||||
1.570%, 12/16/2019 | 148 | 149 | ||||||
| Description | Face Amount ($ Thousands) | Market Value ($ Thousands) | ||||||
California Republic Auto Receivables Trust, Ser 2014-3, Cl A4 | ||||||||
1.790%, 03/16/2020 | $ | 154 | $ | 155 | ||||
California Republic Auto Receivables Trust, Ser 2015-1, Cl A3 | ||||||||
1.330%, 04/15/2019 | 247 | 248 | ||||||
California Republic Auto Receivables Trust, Ser 2015-1, Cl A4 | ||||||||
1.820%, 09/15/2020 | 284 | 286 | ||||||
Capital Auto Receivables Asset Trust, Ser 2013-1, Cl A2 | ||||||||
0.620%, 07/20/2016 | 9 | 9 | ||||||
Capital Auto Receivables Asset Trust, Ser 2013-1, Cl A3 | ||||||||
0.790%, 06/20/2017 | 992 | 992 | ||||||
Capital Auto Receivables Asset Trust, Ser 2013-2, Cl A4 | ||||||||
1.560%, 07/20/2018 | 205 | 207 | ||||||
Capital Auto Receivables Asset Trust, Ser 2013-3, Cl A3 | ||||||||
1.310%, 12/20/2017 | 80 | 80 | ||||||
Capital Auto Receivables Asset Trust, Ser 2013-3, Cl A4 | ||||||||
1.680%, 04/20/2018 | 135 | 136 | ||||||
Capital Auto Receivables Asset Trust, Ser 2013-4, Cl A3 | ||||||||
1.090%, 03/20/2018 | 347 | 347 | ||||||
Capital Auto Receivables Asset Trust, Ser 2013-4, Cl A4 | ||||||||
1.470%, 07/20/2018 | 472 | 474 | ||||||
Capital Auto Receivables Asset Trust, Ser 2014-1, Cl A3 | ||||||||
1.320%, 06/20/2018 | 323 | 324 | ||||||
Capital Auto Receivables Asset Trust, Ser 2014-1, Cl A4 | ||||||||
1.690%, 10/22/2018 | 280 | 282 | ||||||
Capital Auto Receivables Asset Trust, Ser 2014-2, Cl A1 | ||||||||
0.476%, 06/20/2016 (A) | 566 | 566 | ||||||
Capital Auto Receivables Asset Trust, Ser 2014-2, Cl A3 | ||||||||
1.260%, 05/21/2018 | 480 | 480 | ||||||
Capital Auto Receivables Asset Trust, Ser 2014-2, Cl A4 | ||||||||
1.620%, 10/22/2018 | 137 | 138 | ||||||
Capital Auto Receivables Asset Trust, Ser 2014-3, Cl A3 | ||||||||
1.480%, 11/20/2018 | 637 | 639 | ||||||
Capital Auto Receivables Asset Trust, Ser 2014-3, Cl A4 | ||||||||
1.830%, 04/22/2019 | 175 | 176 | ||||||
| SEI Institutional Managed Trust / Semi-Annual Report / March 31, 2015 | 117 |
SCHEDULE OF INVESTMENTS (Unaudited)
U.S. Fixed Income Fund (Continued)
March 31, 2015
| Description | Face Amount ($ Thousands) | Market Value ($ Thousands) | ||||||
Capital Auto Receivables Asset Trust, Ser 2015-1, Cl A2 | ||||||||
1.420%, 06/20/2018 | $ | 711 | $ | 711 | ||||
Capital Auto Receivables Asset Trust, Ser 2015-1, Cl A3 | ||||||||
1.610%, 06/20/2019 | 432 | 432 | ||||||
Capital Auto Receivables Asset Trust, Ser 2015-1, Cl A4 | ||||||||
1.860%, 10/21/2019 | 238 | 238 | ||||||
Carfinance Capital Auto Trust, Ser 2013-1A, Cl A | ||||||||
1.650%, 07/17/2017 (C) | 14 | 14 | ||||||
CarFinance Capital Auto Trust, Ser 2015-1A, Cl A | ||||||||
1.750%, 06/15/2021 (C) | 102 | 102 | ||||||
Carnow Auto Receivables Trust, Ser 2014-1A, Cl A | ||||||||
0.960%, 01/17/2017 (C) | 86 | 86 | ||||||
CFC LLC, Ser 2014-1A, Cl A | ||||||||
1.460%, 12/17/2018 (C) | 120 | 120 | ||||||
CFC LLC, Ser 2014-2A, Cl A | ||||||||
1.440%, 11/16/2020 (C) | 194 | 193 | ||||||
CPS Auto Receivables Trust, Ser 2011-C, Cl A | ||||||||
4.210%, 03/15/2019 (C) | 33 | 33 | ||||||
CPS Auto Receivables Trust, Ser 2013-C, Cl A | ||||||||
1.640%, 04/16/2018 (C) | 171 | 171 | ||||||
CPS Auto Receivables Trust, Ser 2013-D, Cl A | ||||||||
1.540%, 07/16/2018 (C) | 167 | 167 | ||||||
CPS Auto Receivables Trust, Ser 2014-A, Cl A | ||||||||
1.210%, 08/15/2018 (C) | 61 | 61 | ||||||
CPS Auto Receivables Trust, Ser 2014-B, Cl A | ||||||||
1.110%, 11/15/2018 (C) | 217 | 217 | ||||||
CPS Auto Receivables Trust, Ser 2014-C, Cl A | ||||||||
1.310%, 02/15/2019 (C) | 196 | 195 | ||||||
CPS Auto Receivables Trust, Ser 2014-D, Cl A | ||||||||
1.490%, 04/15/2019 (C) | 225 | 225 | ||||||
CPS Auto Receivables Trust, Ser 2015-A, Cl A | ||||||||
1.530%, 07/15/2019 (C) | 213 | 213 | ||||||
Drive Auto Receivables Trust, Ser 2015-AA, Cl A2 | ||||||||
1.010%, 11/15/2017 (C) | 253 | 253 | ||||||
Drive Auto Receivables Trust, Ser 2015-AA, Cl D | ||||||||
4.120%, 06/15/2022 (C) | 147 | 147 | ||||||
| Description | Face Amount ($ Thousands) | Market Value ($ Thousands) | ||||||
DT Auto Owner Trust, | ||||||||
0.980%, 04/16/2018 (C) | $ | 219 | $ | 219 | ||||
DT Auto Owner Trust, | ||||||||
1.060%, 09/17/2018 (C) | 227 | 227 | ||||||
Exeter Auto Receivables Trust, Ser 2013-2A, Cl A | ||||||||
1.490%, 11/15/2017 (C) | 68 | 68 | ||||||
Exeter Automobile Receivables Trust, Ser 2013-1A, Cl A | ||||||||
1.290%, 10/16/2017 (C) | 89 | 89 | ||||||
Exeter Automobile Receivables Trust, Ser 2014-1A, Cl A | ||||||||
1.290%, 05/15/2018 (C) | 78 | 78 | ||||||
Exeter Automobile Receivables Trust, Ser 2014-2A, Cl A | ||||||||
1.060%, 08/15/2018 (C) | 57 | 57 | ||||||
Exeter Automobile Receivables Trust, Ser 2014-3A, Cl A | ||||||||
1.320%, 01/15/2019 (C) | 292 | 292 | ||||||
Exeter Automobile Receivables Trust, Ser 2015-1A, Cl A | ||||||||
1.600%, 06/17/2019 (C) | 380 | 380 | ||||||
Fifth Third Auto Trust, | ||||||||
0.880%, 10/16/2017 | 96 | 96 | ||||||
First Investors Auto Owner Trust, Ser 2013-1A, Cl A2 | ||||||||
0.900%, 10/15/2018 (C) | 16 | 16 | ||||||
First Investors Auto Owner Trust, Ser 2014-3A, Cl A2 | ||||||||
1.060%, 11/15/2018 (C) | 203 | 203 | ||||||
First Investors Auto Owner Trust, Ser 2014-3A, Cl A3 | ||||||||
1.670%, 11/16/2020 (C) | 83 | 83 | ||||||
Flagship Credit Auto Trust, Ser 2014-2, Cl A | ||||||||
1.430%, 12/16/2019 (C) | 168 | 168 | ||||||
Flagship Credit Auto Trust, Ser 2014-2, Cl B | ||||||||
2.840%, 11/16/2020 (C) | 45 | 45 | ||||||
Flagship Credit Auto Trust, Ser 2014-2, Cl C | ||||||||
3.950%, 12/15/2020 (C) | 22 | 22 | ||||||
Flagship Credit Auto Trust, Ser 2015-1, Cl A | ||||||||
1.630%, 06/15/2020 (C) | 276 | 276 | ||||||
Ford Credit Auto Lease Trust, Ser 2014-B, Cl A3 | ||||||||
0.890%, 09/15/2017 | 56 | 56 | ||||||
Ford Credit Auto Lease Trust, Ser 2014-B, Cl A4 | ||||||||
1.100%, 11/15/2017 | 22 | 22 | ||||||
| 118 | SEI Institutional Managed Trust / Semi-Annual Report / March 31, 2015 |
| Description | Face Amount ($ Thousands) | Market Value ($ Thousands) | ||||||
Ford Credit Auto Owner Trust, Ser 2013-B, Cl A3 | ||||||||
0.570%, 10/15/2017 | $ | 305 | $ | 305 | ||||
Ford Credit Auto Owner Trust, Ser 2014-1, Cl A | ||||||||
2.260%, 11/15/2025 (C) | 1,423 | 1,449 | ||||||
Ford Credit Auto Owner Trust, Ser 2014-2, Cl A | ||||||||
2.310%, 04/15/2026 (C) | 476 | 483 | ||||||
Ford Credit Auto Owner Trust, Ser 2014-C, Cl A2 | ||||||||
0.610%, 08/15/2017 | 200 | 200 | ||||||
Ford Credit Auto Owner Trust, Ser 2014-C, Cl A3 | ||||||||
1.060%, 05/15/2019 | 122 | 122 | ||||||
Ford Credit Auto Owner Trust, Ser 2015-1, Cl A | ||||||||
2.120%, 07/15/2026 (C) | 675 | 681 | ||||||
Ford Credit Auto Owner Trust, Ser 2015-A, Cl A2A | ||||||||
0.810%, 01/15/2018 | 166 | 166 | ||||||
Ford Credit Auto Owner Trust, Ser 2015-A, Cl A4 | ||||||||
1.640%, 06/15/2020 | 150 | 150 | ||||||
GM Financial Automobile Leasing Trust, | ||||||||
0.610%, 07/20/2016 (C) | 141 | 141 | ||||||
Hertz Vehicle Financing, Ser 2013-1A, Cl A2 | ||||||||
1.830%, 08/25/2019 (C) | 800 | 797 | ||||||
Honda Auto Receivables Owner Trust, Ser 2013-3, Cl A3 | ||||||||
0.770%, 05/15/2017 | 353 | 354 | ||||||
Honda Auto Receivables Owner Trust, Ser 2014-4, Cl A4 | ||||||||
1.460%, 10/15/2020 | 125 | 126 | ||||||
Huntington Auto Trust, Ser 2011-1A, Cl A4 | ||||||||
1.310%, 11/15/2016 (C) | 100 | 100 | ||||||
Hyundai Auto Receivables Trust, Ser 2011-C, Cl A4 | ||||||||
1.300%, 02/15/2018 | 161 | 161 | ||||||
MMCA Automobile Trust, Ser 2011-A, Cl A4 | ||||||||
2.020%, 10/17/2016 (C) | 2 | 2 | ||||||
MMCA Automobile Trust, Ser 2012-A, Cl A4 | ||||||||
1.570%, 08/15/2017 (C) | 88 | 89 | ||||||
Prestige Auto Receivables Trust, Ser 2014-1A, Cl A2 | ||||||||
0.970%, 03/15/2018 (C) | 252 | 252 | ||||||
| Description | Face Amount ($ Thousands) | Market Value ($ Thousands) | ||||||
Santander Drive Auto Receivables Trust, Ser 2013-A, Cl A3 | ||||||||
1.020%, 01/16/2018 (C) | $ | 142 | $ | 142 | ||||
Tidewater Auto Receivables Trust, Ser 2014-AA, Cl A3 | ||||||||
1.400%, 07/15/2018 (C) | 175 | 175 | ||||||
|
| |||||||
| 21,818 | ||||||||
|
| |||||||
Credit Cards — 1.0% |
| |||||||
American Express Credit Account Master Trust, Ser 2014-2, Cl A | ||||||||
1.260%, 01/15/2020 | 411 | 412 | ||||||
American Express Credit Account Secured Note Trust, Ser 2012-4, Cl A | ||||||||
0.415%, 05/15/2020 (A) | 396 | 395 | ||||||
BA Credit Card Trust, | ||||||||
0.215%, 11/15/2019 (A) | 445 | 442 | ||||||
BA Credit Card Trust, | ||||||||
0.445%, 09/16/2019 (A) | 752 | 752 | ||||||
BA Credit Card Trust, | ||||||||
0.462%, 01/15/2020 (A) | 260 | 260 | ||||||
Cabela’s Credit Card Master Note Trust, | ||||||||
1.630%, 02/18/2020 (C) | 200 | 202 | ||||||
Capital One Multi-Asset Execution Trust, Ser 2005-A9, Cl A | ||||||||
0.265%, 08/15/2018 (A) | 1,841 | 1,840 | ||||||
Capital One Multi-Asset Execution Trust, Ser 2015-A1, Cl A | ||||||||
1.390%, 01/15/2021 | 928 | 929 | ||||||
Citibank Credit Card Issuance Trust, Ser 2014-A6, Cl A6 | ||||||||
2.150%, 07/15/2021 | 2,439 | 2,478 | ||||||
Discover Card Execution Note Trust, Ser 2014-A1, Cl A1 | ||||||||
0.605%, 07/15/2021 (A) | 445 | 446 | ||||||
Discover Card Execution Note Trust, Ser 2015-A1, Cl A1 | ||||||||
0.525%, 08/17/2020 (A) | 1,313 | 1,314 | ||||||
GE Capital Credit Card Master Note Trust, | ||||||||
0.950%, 06/15/2018 | 927 | 928 | ||||||
MBNA Credit Card Master Note Trust, Ser 2004-A3, Cl A3 | ||||||||
0.435%, 08/16/2021 (A) | 667 | 664 | ||||||
| SEI Institutional Managed Trust / Semi-Annual Report / March 31, 2015 | 119 |
SCHEDULE OF INVESTMENTS (Unaudited)
U.S. Fixed Income Fund (Continued)
March 31, 2015
| Description | Face Amount ($ Thousands) | Market Value ($ Thousands) | ||||||
World Financial Network Credit Card Master Trust, Ser 2014-B, Cl A | ||||||||
0.610%, 07/15/2019 | $ | 299 | $ | 299 | ||||
|
| |||||||
| 11,361 | ||||||||
|
| |||||||
Mortgage Related Securities — 1.0% |
| |||||||
ABFC Trust, | ||||||||
0.791%, 04/25/2034 (A) | 86 | 85 | ||||||
Aegis Asset-Backed Securities Trust, Ser 2003-3, Cl M1 | ||||||||
1.224%, 01/25/2034 (A) | 505 | 479 | ||||||
Aegis Asset-Backed Securities Trust, Ser 2004-5, Cl M1 | ||||||||
1.146%, 12/25/2034 (A) | 393 | 387 | ||||||
Aegis Asset-Backed Securities Trust, Ser 2004-6, Cl M1 | ||||||||
0.711%, 03/25/2035 (A) | 32 | 32 | ||||||
Ameriquest Mortgage Security Asset-Backed Pass-Through Certificates, Ser 2003-9, Cl AV1 | ||||||||
0.928%, 09/25/2033 (A) | 185 | 178 | ||||||
Argent Securities, | ||||||||
1.218%, 10/25/2033 (A) | 519 | 507 | ||||||
Asset-Backed Funding Certificates, Ser 2005-WMC1, Cl M1 | ||||||||
0.834%, 06/25/2035 (A) | 322 | 318 | ||||||
Bear Stearns Asset-Backed Securities Trust, Ser 2004-BO1, Cl M5 | ||||||||
1.571%, 10/25/2034 (A) | 360 | 361 | ||||||
Bear Stearns Asset-Backed Securities Trust, Ser 2004-HE10, Cl M1 | ||||||||
1.146%, 12/25/2034 (A) | 429 | 402 | ||||||
Bear Stearns Asset-Backed Securities Trust, Ser 2005-SD1, Cl 1A3 | ||||||||
0.571%, 08/25/2043 (A) | 447 | 441 | ||||||
Bear Stearns Asset-Backed Securities Trust, Ser 2005-TC2, Cl A3 | ||||||||
0.541%, 08/25/2035 (A) | 211 | 210 | ||||||
Bear Stearns Asset-Backed Securities Trust, Ser 2006-1, Cl A | ||||||||
0.451%, 02/25/2036 (A) | 250 | 249 | ||||||
| Description | Face Amount ($ Thousands) | Market Value ($ Thousands) | ||||||
Citifinancial Mortgage Securities, Ser 2004-1, Cl AF4 | ||||||||
4.570%, 04/25/2034 | $ | 370 | $ | 385 | ||||
HSBC Home Equity Loan Trust, Ser 2007-1, Cl AS | ||||||||
0.376%, 03/20/2036 (A) | 44 | 43 | ||||||
HSBC Home Equity Loan Trust, Ser 2007-1, Cl M2 | ||||||||
0.656%, 03/20/2036 (A) | 2,000 | 1,879 | ||||||
HSBC Home Equity Loan Trust, Ser 2007-3, Cl APT | ||||||||
1.376%, 11/20/2036 (A) | 391 | 389 | ||||||
Lake Country Mortgage Loan Trust, Ser 2006-HE1, Cl A3 | ||||||||
0.524%, 07/25/2034 (A) (C) | 10 | 10 | ||||||
Master Asset Backed Securities Trust, Ser 2005-OPT1, Cl M1 | ||||||||
0.774%, 03/25/2035 (A) | 588 | 589 | ||||||
Morgan Stanley ABS Capital I Trust, Ser 2005-HE5, Cl M1 | ||||||||
0.594%, 09/25/2035 (A) | 472 | 463 | ||||||
Morgan Stanley ABS Capital I Trust, Ser 2005-HE6, Cl A2C | ||||||||
0.494%, 11/25/2035 (A) | 501 | 491 | ||||||
New Century Home Equity Loan Trust, Ser 2003-A, Cl A | ||||||||
0.888%, 10/25/2033 (A) (C) | 190 | 179 | ||||||
New Century Home Equity Loan Trust, Ser 2005-3, Cl M1 | ||||||||
0.654%, 07/25/2035 (A) | 619 | 617 | ||||||
New Century Home Equity Loan Trust, Ser 2005-4, Cl A2C | ||||||||
0.541%, 09/25/2035 (A) | 428 | 427 | ||||||
Nomura Home Equity Loan Home Equity Loan Trust, Ser 2006-HE1, Cl A4 | ||||||||
0.464%, 02/25/2036 (A) | 1,120 | 1,111 | ||||||
Normandy Mortgage Loan Trust, Ser 2013-NPL3, Cl A | ||||||||
4.949%, 09/16/2043 (C) | 401 | 400 | ||||||
NovaStar Mortgage Funding Trust, Ser 2004-4, Cl M4 | ||||||||
1.824%, 03/25/2035 (A) | 520 | 511 | ||||||
Salomon Brothers Mortgage Securities, Ser 2003-UP1, Cl A | ||||||||
3.950%, 04/25/2032 (C) | 37 | 36 | ||||||
Saxon Asset Securities Trust, Ser 2003-1, Cl AF6 | ||||||||
4.795%, 06/25/2033 | 35 | 35 | ||||||
| 120 | SEI Institutional Managed Trust / Semi-Annual Report / March 31, 2015 |
| Description | Face Amount ($ Thousands) | Market Value ($ Thousands) | ||||||
Structured Asset Securities, Ser 2002-AL1, Cl A2 | ||||||||
3.450%, 02/25/2032 | $ | 58 | $ | 57 | ||||
Structured Asset Securities, Ser 2005-NC1, Cl A11 | ||||||||
4.690%, 02/25/2035 | 6 | 6 | ||||||
Truman Capital Mortgage Loan Trust, Ser 2014-NPL1, Cl A1 | ||||||||
3.228%, 07/25/2053 (C) | 172 | 172 | ||||||
Truman Capital Mortgage Loan Trust, Ser 2014-NPL2, Cl A1 | ||||||||
3.125%, 06/25/2054 (C) | 150 | 150 | ||||||
Truman Capital Mortgage Loan Trust, Ser 2014-NPL3, Cl A1 | ||||||||
3.125%, 04/25/2053 (C) | 134 | 134 | ||||||
Wells Fargo Home Equity Trust, Ser 2004-2, Cl AI6 | ||||||||
5.000%, 10/25/2034 (A) | 31 | 31 | ||||||
|
| |||||||
| 11,764 | ||||||||
|
| |||||||
Other Asset-Backed Securities — 5.8% |
| |||||||
Academic Loan Funding Trust, Ser 2012-1A, Cl A1 | ||||||||
0.974%, 12/27/2022 (A) (C) | 111 | 112 | ||||||
Academic Loan Funding Trust, Ser 2013-1A, Cl A | ||||||||
0.974%, 12/26/2044 (A) (C) | 200 | 200 | ||||||
Access Group, Ser 2004-2, Cl A3 | ||||||||
0.446%, 10/25/2024 (A) | 400 | 378 | ||||||
Airspeed, Ser 2007-1A, Cl G2 | ||||||||
0.455%, 06/15/2032 (A) (C) | 432 | 367 | ||||||
Ally Master Owner Trust, Ser 2012-5, Cl A | ||||||||
1.540%, 09/15/2019 | 1,057 | 1,061 | ||||||
Ally Master Owner Trust, Ser 2014-4, Cl A2 | ||||||||
1.430%, 06/17/2019 | 1,328 | 1,335 | ||||||
Ally Master Owner Trust, Ser 2014-5, Cl A1 | ||||||||
0.665%, 10/15/2019 (A) | 818 | 818 | ||||||
Ally Master Owner Trust, Ser 2015-2, Cl A1 | ||||||||
0.742%, 01/15/2021 (A) | 335 | 335 | ||||||
ALM VII, Ser 2012-7A, Cl A1 | ||||||||
1.677%, 10/19/2024 (A) (C) | 450 | 450 | ||||||
Ascentium Equipment Receivables, Ser 2012-1A, Cl A | ||||||||
1.830%, 09/15/2019 (C) | 1 | 1 | ||||||
AXIS Equipment Finance Receivables II, Ser 2013-1A, Cl A | ||||||||
1.750%, 03/20/2017 (C) | 76 | 76 | ||||||
| Description | Face Amount ($ Thousands) | Market Value ($ Thousands) | ||||||
Blue Elephant Loan Trust, Ser 2015-1, Cl A | ||||||||
3.120%, 12/15/2022 (C) | $ | 250 | $ | 249 | ||||
Brazos Higher Education Authority, Ser 2010-1, Cl A2 | ||||||||
1.433%, 02/25/2035 (A) | 850 | 881 | ||||||
Brazos Higher Education Authority, Ser 2011-2, Cl A3 | ||||||||
1.256%, 10/27/2036 (A) | 400 | 405 | ||||||
Business Loan Express Business Loan Trust, Ser 2004-A, Cl A | ||||||||
0.604%, 02/25/2031 (A) (C) | 213 | 202 | ||||||
BXG Receivables Note Trust, Ser 2012-A, Cl A | ||||||||
2.660%, 12/02/2027 (C) | 45 | 45 | ||||||
Carlyle Global Market Strategies Commodities Funding, Ser 2014-1A, Cl A | ||||||||
2.153%, 10/15/2021 (A) (C) | 250 | 250 | ||||||
Chase Funding Mortgage Loan Asset-Backed Certificates, Ser 2003-6, Cl 1A5 | ||||||||
5.260%, 11/25/2034 | 118 | 121 | ||||||
CIT Education Loan Trust, Ser 2007-1, Cl A | ||||||||
0.357%, 03/25/2042 (A) (C) | 615 | 589 | ||||||
Citigroup Mortgage Loan Trust, Ser 2005-OPT3, Cl M1 | ||||||||
0.604%, 05/25/2035 (A) | 561 | 561 | ||||||
CNH Equipment Trust, Ser 2013-C, Cl A2 | ||||||||
0.630%, 01/17/2017 | 59 | 59 | ||||||
CNH Equipment Trust, Ser 2014-A, Cl A2 | ||||||||
0.490%, 06/15/2017 | 73 | 73 | ||||||
Concord Funding, Ser 2012-2, Cl A | ||||||||
3.145%, 01/15/2017 (C) | 200 | 200 | ||||||
Consumer Credit Origination Loan Trust, Ser 2015-1, Cl A | ||||||||
2.820%, 03/15/2021 (C) | 239 | 240 | ||||||
Countrywide Asset-Backed Certificates, Ser 2004-5, Cl 1A | ||||||||
0.674%, 10/25/2034 (A) | 614 | 561 | ||||||
Countrywide Asset-Backed Certificates, Ser 2004-6, Cl 1A1 | ||||||||
0.714%, 12/25/2034 (A) | 511 | 483 | ||||||
Countrywide Home Equity Loan Trust, Ser 2006-F, Cl 2A1A | ||||||||
0.315%, 07/15/2036 (A) | 1,148 | 1,043 | ||||||
| SEI Institutional Managed Trust / Semi-Annual Report / March 31, 2015 | 121 |
SCHEDULE OF INVESTMENTS (Unaudited)
U.S. Fixed Income Fund (Continued)
March 31, 2015
| Description | Face Amount ($ Thousands) | Market Value ($ Thousands) | ||||||
CWHEQ Revolving Home Equity Loan Trust, | ||||||||
0.365%, 11/15/2035 (A) | $ | 527 | $ | 479 | ||||
Educational Funding of the South, Ser 2011-1, Cl A2 | ||||||||
0.906%, 04/25/2035 (A) | 438 | 436 | ||||||
First Franklin Mortgage Loan Asset-Backed Certificates, Ser 2004-FF5, Cl A3C | ||||||||
1.171%, 08/25/2034 (A) | 1,160 | 1,071 | ||||||
First Franklin Mortgage Loan Asset-Backed Certificates, Ser 2005-FF4, Cl M1 | ||||||||
0.604%, 05/25/2035 (A) | 385 | 382 | ||||||
First Franklin Mortgage Loan Asset-Backed Certificates, Ser 2005-FF8, Cl A2D | ||||||||
0.554%, 09/25/2035 (A) | 22 | 22 | ||||||
Ford Credit Floorplan Master Owner Trust, Ser 2012-2, Cl A | ||||||||
1.920%, 01/15/2019 | 539 | 547 | ||||||
Ford Credit Floorplan Master Owner Trust, Ser 2013-1, Cl A2 | ||||||||
0.555%, 01/15/2018 (A) | 112 | 112 | ||||||
Ford Credit Floorplan Master Owner Trust, Ser 2013-5, Cl A1 | ||||||||
1.500%, 09/15/2018 | 275 | 277 | ||||||
Ford Credit Floorplan Master Owner Trust, Ser 2014-1, Cl A1 | ||||||||
1.200%, 02/15/2019 | 387 | 388 | ||||||
Ford Credit Floorplan Master Owner Trust, Ser 2014-1, Cl A2 | ||||||||
0.575%, 02/15/2019 (A) | 145 | 145 | ||||||
Ford Credit Floorplan Master Owner Trust, Ser 2014-4, Cl A1 | ||||||||
1.400%, 08/15/2019 | 640 | 642 | ||||||
Ford Credit Floorplan Master Owner Trust, Ser 2015-1, Cl A2 | ||||||||
0.575%, 01/15/2020 (A) | 116 | 116 | ||||||
Ford Credit Floorplan Master Owner Trust, Ser 2015-2, Cl A2 | ||||||||
0.745%, 01/15/2022 (A) | 892 | 893 | ||||||
GCAT, Ser 2014-1, Cl A1 | ||||||||
3.228%, 07/25/2019 (A) (C) | 239 | 241 | ||||||
| Description | Face Amount ($ Thousands) | Market Value ($ Thousands) | ||||||
Global SC Finance, | ||||||||
3.090%, 07/17/2029 (C) | $ | 555 | $ | 554 | ||||
GMAT Trust, Ser 2013-1A, Cl A | ||||||||
3.967%, 11/25/2043 (C) | 168 | 168 | ||||||
GMAT Trust, Ser 2014-1A, Cl A | ||||||||
3.721%, 02/25/2044 (C) | 44 | 44 | ||||||
GSAMP Trust, Ser 2005-HE4, Cl M1 | ||||||||
0.624%, 07/25/2045 (A) | 757 | 756 | ||||||
Higher Education Funding, Ser 2014-1, Cl A | ||||||||
1.311%, 05/25/2034 (A) (C) | 478 | 484 | ||||||
HLSS Servicer Advance Receivables Trust, | ||||||||
1.990%, 10/15/2045 (C) | 146 | 146 | ||||||
HLSS Servicer Advance Receivables Trust, | ||||||||
1.495%, 01/16/2046 (C) | 150 | 149 | ||||||
HLSS Servicer Advance Receivables Trust, | ||||||||
1.981%, 11/15/2046 (C) | 586 | 581 | ||||||
HLSS Servicer Advance Receivables Trust, | ||||||||
2.217%, 01/15/2047 (C) | 111 | 110 | ||||||
ING Investment Management, Ser 2012-4A, Cl A1 | ||||||||
1.643%, 10/15/2023 (A) (C) | 450 | 448 | ||||||
ING Investment Management, Ser 2014-1A, Cl A1 | ||||||||
1.757%, 04/18/2026 (A) (C) | 540 | 538 | ||||||
JGWPT XXX LLC, Ser 2013-3A, Cl A | ||||||||
4.080%, 01/17/2073 (C) | 308 | 328 | ||||||
JGWPT XXXI LLC, Ser 2014-1A, Cl A | ||||||||
3.960%, 03/15/2063 (C) | 292 | 311 | ||||||
JGWPT XXXII, Ser 2014-2A, Cl A | ||||||||
3.610%, 01/17/2073 (C) | 405 | 424 | ||||||
JGWPT XXXIII, Ser 2014-3A, Cl A | ||||||||
3.500%, 06/15/2077 (C) | 199 | 208 | ||||||
JPMorgan Chase Acquisition, Ser 2005-OPT1, Cl M1 | ||||||||
0.624%, 06/25/2035 (A) | 1,079 | 1,071 | ||||||
Key Resorts, Ser 2014-A, Cl A | ||||||||
3.220%, 03/17/2031 (C) | 119 | 119 | ||||||
| 122 | SEI Institutional Managed Trust / Semi-Annual Report / March 31, 2015 |
| Description | Face Amount ($ Thousands) | Market Value ($ Thousands) | ||||||
Lehman ABS Manufactured Housing Contract Trust, Ser 2001-B, Cl A4 | ||||||||
5.270%, 04/15/2040 | $ | 295 | $ | 314 | ||||
Madison Avenue Manufactured Housing Contract, | ||||||||
2.424%, 03/25/2032 (A) | 63 | 63 | ||||||
Magnetite XII, | ||||||||
1.817%, 04/15/2027 (A) (C) | 200 | 200 | ||||||
Mid-State Trust, | ||||||||
4.864%, 07/15/2038 | 823 | 874 | ||||||
Navient Private Education Loan Trust, Ser 2014-AA, Cl A2A | ||||||||
2.740%, 02/15/2029 (C) | 818 | 824 | ||||||
Navient Private Education Loan Trust, Ser 2015-AA, Cl A2A | ||||||||
2.650%, 12/15/2028 (C) | 328 | 328 | ||||||
Navient Private Education Loan Trust, Ser 2015-AA, Cl A2B | ||||||||
1.403%, 12/15/2028 (A) (C) | 445 | 445 | ||||||
Navient Student Loan Trust, Ser 2014-1, Cl A2 | ||||||||
0.484%, 03/27/2023 (A) | 312 | 312 | ||||||
Navient Student Loan Trust, Ser 2014-1, Cl A3 | ||||||||
0.684%, 06/25/2031 (A) | 1,005 | 999 | ||||||
Navient Student Loan Trust, Ser 2014-2, Cl A | ||||||||
0.814%, 03/25/2043 (A) | 986 | 981 | ||||||
Navient Student Loan Trust, Ser 2014-3, Cl A | ||||||||
0.794%, 02/25/2043 (A) | 984 | 978 | ||||||
Navient Student Loan Trust, Ser 2014-4, Cl A | ||||||||
0.794%, 03/25/2043 (A) | 569 | 566 | ||||||
Navient Student Loan Trust, Ser 2014-8, Cl A2 | ||||||||
0.614%, 04/25/2023 (A) | 305 | 305 | ||||||
Navient Student Loan Trust, Ser 2014-8, Cl B | ||||||||
1.674%, 07/26/2049 (A) | 54 | 52 | ||||||
Navitas Equipment Receivables, | ||||||||
1.950%, 11/15/2016 (C) | 45 | 45 | ||||||
Nelnet Student Loan Trust, Ser 2004-3, Cl A5 | ||||||||
0.436%, 10/27/2036 (A) | 450 | 445 | ||||||
Nelnet Student Loan Trust, Ser 2004-4, Cl A5 | ||||||||
0.416%, 01/25/2037 (A) | 409 | 404 | ||||||
| Description | Face Amount ($ Thousands) | Market Value ($ Thousands) | ||||||
Nelnet Student Loan Trust, Ser 2005-1, Cl A5 | ||||||||
0.366%, 10/25/2033 (A) | $ | 492 | $ | 481 | ||||
Nelnet Student Loan Trust, Ser 2005-2, Cl A5 | ||||||||
0.365%, 03/23/2037 (A) | 493 | 481 | ||||||
Nelnet Student Loan Trust, Ser 2005-3, Cl A5 | ||||||||
0.385%, 12/24/2035 (A) | 425 | 417 | ||||||
Nelnet Student Loan Trust, Ser 2006-1, Cl A4 | ||||||||
0.352%, 11/23/2022 (A) | 107 | 107 | ||||||
Nelnet Student Loan Trust, Ser 2006-2, Cl A4 | ||||||||
0.336%, 10/26/2026 (A) | 352 | 352 | ||||||
Nelnet Student Loan Trust, Ser 2007-2A, Cl A3L | ||||||||
0.617%, 03/25/2026 (A) (C) | 164 | 163 | ||||||
Nelnet Student Loan Trust, Ser 2010-4A, Cl A | ||||||||
0.974%, 04/25/2046 (A) (C) | 150 | 152 | ||||||
Nelnet Student Loan Trust, Ser 2011-1A, Cl A | ||||||||
1.024%, 02/25/2043 (A) (C) | 855 | 870 | ||||||
Nelnet Student Loan Trust, Ser 2014-4A, Cl A2 | ||||||||
1.121%, 11/25/2043 (A) (C) | 500 | 502 | ||||||
Nelnet Student Loan Trust, Ser 2015-2A, Cl A2 | ||||||||
0.821%, 09/25/2042 (A) (C) | 965 | 965 | ||||||
North Carolina State, Education Assistance Authority, | ||||||||
1.034%, 07/25/2025 (A) | 450 | 451 | ||||||
NYMT Residential, | ||||||||
4.250%, 12/25/2017 (A) (C) | 114 | 114 | ||||||
NYMT Residential, | ||||||||
4.850%, 09/25/2018 (C) | 261 | 261 | ||||||
Oak Hill Advisors Residential Loan Trust, | ||||||||
3.475%, 04/25/2054 (C) | 329 | 329 | ||||||
Oak Hill Advisors Residential Loan Trust, | ||||||||
3.475%, 01/25/2055 (C) | 370 | �� | 370 | |||||
OHA Credit Partners VII, | ||||||||
1.681%, 11/20/2023 (A) (C) | 450 | 449 | ||||||
OneMain Financial Issuance Trust, Ser 2014-2A, Cl A | ||||||||
2.470%, 09/18/2024 (C) | 478 | 477 | ||||||
| SEI Institutional Managed Trust / Semi-Annual Report / March 31, 2015 | 123 |
SCHEDULE OF INVESTMENTS (Unaudited)
U.S. Fixed Income Fund (Continued)
March 31, 2015
| Description | Face Amount ($ Thousands) | Market Value ($ Thousands) | ||||||
OneMain Financial Issuance Trust, Ser 2015-1A, Cl A | ||||||||
3.190%, 03/18/2026 (C) | $ | 288 | $ | 291 | ||||
Park Place Securities, | ||||||||
1.111%, 10/25/2034 (A) | 104 | 104 | ||||||
Park Place Securities, | ||||||||
1.299%, 12/25/2034 (A) | 445 | 446 | ||||||
Park Place Securities, | ||||||||
1.194%, 09/25/2034 (A) | 640 | 635 | ||||||
Park Place Securities, | ||||||||
0.444%, 05/25/2035 (A) | 713 | 712 | ||||||
RAMP Trust, | ||||||||
0.574%, 10/25/2035 (A) | 794 | 788 | ||||||
RAMP Trust, | ||||||||
0.574%, 09/25/2035 (A) | 962 | 957 | ||||||
RAMP Trust, | ||||||||
0.474%, 03/25/2036 (A) | 206 | 201 | ||||||
RSB Bondco LLC, | ||||||||
5.820%, 06/28/2019 | 405 | 434 | ||||||
Scholar Funding Trust, | ||||||||
1.156%, 10/28/2043 (A) (C) | 318 | 320 | ||||||
Selene Non-Performing Loans, Ser 2014-1A, Cl A | ||||||||
2.981%, 05/25/2054 (C) | 95 | 94 | ||||||
SLC Student Loan Trust, | ||||||||
0.657%, 05/15/2028 (A) | 121 | 121 | ||||||
SLM Private Education Loan Trust, Ser 2012-D, Cl A2 | ||||||||
2.950%, 02/15/2046 (C) | 550 | 567 | ||||||
SLM Private Education Loan Trust, Ser 2012-E, Cl A1 | ||||||||
0.925%, 10/16/2023 (A) (C) | 58 | 58 | ||||||
SLM Private Education Loan Trust, Ser 2012-E, Cl A2B | ||||||||
1.925%, 06/15/2045 (A) (C) | 655 | 673 | ||||||
SLM Private Education Loan Trust, Ser 2013-1, Cl B | ||||||||
1.974%, 11/25/2043 (A) | 180 | 181 | ||||||
SLM Private Education Loan Trust, Ser 2013-A, Cl A1 | ||||||||
0.775%, 08/15/2022 (A) (C) | 129 | 129 | ||||||
SLM Private Education Loan Trust, Ser 2013-B, Cl A1 | ||||||||
0.825%, 07/15/2022 (A) (C) | 143 | 143 | ||||||
| Description | Face Amount ($ Thousands) | Market Value ($ Thousands) | ||||||
SLM Student Loan Trust, | ||||||||
1.021%, 12/15/2025 (A) (C) | $ | 350 | $ | 349 | ||||
SLM Student Loan Trust, | ||||||||
0.426%, 07/25/2023 (A) | 627 | 625 | ||||||
SLM Student Loan Trust, | ||||||||
0.716%, 01/25/2040 (A) | 128 | 114 | ||||||
SLM Student Loan Trust, | ||||||||
0.356%, 04/25/2025 (A) | 76 | 76 | ||||||
SLM Student Loan Trust, | ||||||||
1.456%, 07/27/2026 (A) | 184 | 187 | ||||||
SLM Student Loan Trust, | ||||||||
0.396%, 10/27/2031 (A) | 374 | 363 | ||||||
SLM Student Loan Trust, | ||||||||
0.406%, 10/25/2029 (A) | 337 | 326 | ||||||
SLM Student Loan Trust, | ||||||||
0.376%, 01/27/2025 (A) | 349 | 348 | ||||||
SLM Student Loan Trust, | ||||||||
0.426%, 01/25/2041 (A) | 540 | 507 | ||||||
SLM Student Loan Trust, | ||||||||
0.356%, 01/25/2021 (A) | 531 | 523 | ||||||
SLM Student Loan Trust, | ||||||||
0.326%, 04/25/2022 (A) | 22 | 22 | ||||||
SLM Student Loan Trust, | ||||||||
0.416%, 01/25/2041 (A) | 540 | 505 | ||||||
SLM Student Loan Trust, | ||||||||
0.426%, 07/25/2025 (A) | 178 | 156 | ||||||
SLM Student Loan Trust, | ||||||||
1.106%, 04/27/2043 (A) | 146 | 132 | ||||||
SLM Student Loan Trust, | ||||||||
1.006%, 10/25/2028 (A) | 250 | 226 | ||||||
SLM Student Loan Trust, | ||||||||
1.456%, 01/25/2029 (A) | 160 | 144 | ||||||
SLM Student Loan Trust, | ||||||||
1.456%, 04/25/2029 (A) | 160 | 149 | ||||||
SLM Student Loan Trust, | ||||||||
1.906%, 07/25/2022 (A) | 1,300 | 1,354 | ||||||
| 124 | SEI Institutional Managed Trust / Semi-Annual Report / March 31, 2015 |
| Description | Face Amount ($ Thousands) | Market Value ($ Thousands) | ||||||
SLM Student Loan Trust, | ||||||||
2.106%, 04/25/2029 (A) | $ | 160 | $ | 156 | ||||
SLM Student Loan Trust, | ||||||||
1.556%, 01/25/2018 (A) | 100 | 100 | ||||||
SLM Student Loan Trust, | ||||||||
2.106%, 07/25/2029 (A) | 160 | 156 | ||||||
SLM Student Loan Trust, | ||||||||
2.106%, 07/25/2029 (A) | 160 | 155 | ||||||
SLM Student Loan Trust, | ||||||||
2.106%, 07/25/2029 (A) | 160 | 161 | ||||||
SLM Student Loan Trust, | ||||||||
2.506%, 10/25/2029 (A) | 160 | 166 | ||||||
SLM Student Loan Trust, | ||||||||
1.756%, 04/25/2023 (A) | 920 | 944 | ||||||
SLM Student Loan Trust, | ||||||||
2.506%, 10/25/2029 (A) | 160 | 169 | ||||||
SLM Student Loan Trust, | ||||||||
0.574%, 03/25/2025 (A) | 296 | 295 | ||||||
SLM Student Loan Trust, | ||||||||
0.921%, 05/26/2026 (A) | 211 | 212 | ||||||
SLM Student Loan Trust, | ||||||||
1.174%, 04/27/2043 (A) | 249 | 233 | ||||||
SLM Student Loan Trust, | ||||||||
1.671%, 06/25/2043 (A) | 128 | 126 | ||||||
SLM Student Loan Trust, | ||||||||
0.474%, 05/26/2020 (A) | 287 | 287 | ||||||
SLM Student Loan Trust, | ||||||||
1.674%, 09/25/2043 (A) | 136 | 133 | ||||||
SLM Student Loan Trust, | ||||||||
0.724%, 06/25/2027 (A) | 366 | 367 | ||||||
SLM Student Loan Trust, | ||||||||
0.571%, 10/26/2020 (A) | 228 | 228 | ||||||
SLM Student Loan Trust, | ||||||||
0.671%, 02/25/2021 (A) | 125 | 125 | ||||||
SLM Student Loan Trust, | ||||||||
2.940%, 10/15/2031 (C) | 129 | 133 | ||||||
| Description | Face Amount ($ Thousands) | Market Value ($ Thousands) | ||||||
SLM Student Loan Trust, | ||||||||
3.500%, 10/28/2029 (C) | $ | 589 | $ | 583 | ||||
SLM Student Loan Trust, | ||||||||
0.554%, 07/26/2021 (A) | 395 | 395 | ||||||
SLM Student Loan Trust, | ||||||||
0.764%, 03/26/2029 (A) | 448 | 449 | ||||||
SLM Student Loan Trust, | ||||||||
0.775%, 07/15/2022 (A) (C) | 148 | 148 | ||||||
SLM Student Loan Trust, | ||||||||
2.590%, 01/15/2026 (C) | 225 | 229 | ||||||
Small Business Administration, | ||||||||
3.620%, 09/01/2033 | 215 | 231 | ||||||
Small Business Administration, | ||||||||
3.380%, 12/01/2033 | 181 | 191 | ||||||
Small Business Administration, | ||||||||
2.520%, 01/01/2035 | 250 | 251 | ||||||
SpringCastle America Funding, | ||||||||
2.700%, 05/25/2023 (C) | 620 | 622 | ||||||
SpringCastle America Funding, | ||||||||
4.610%, 10/25/2027 (C) | 125 | 127 | ||||||
Springleaf Funding Trust, | ||||||||
2.580%, 09/15/2021 (C) | 517 | 519 | ||||||
Springleaf Funding Trust, | ||||||||
3.920%, 01/16/2023 (C) | 250 | 251 | ||||||
Springleaf Funding Trust, | ||||||||
2.410%, 12/15/2022 (C) | 467 | 467 | ||||||
Springleaf Funding Trust, | ||||||||
3.160%, 11/15/2024 (C) | 346 | 347 | ||||||
Stanwich Mortgage Loan Trust, | ||||||||
2.981%, 02/16/2043 (C) | 42 | 42 | ||||||
Stanwich Mortgage Loan Trust, | ||||||||
3.228%, 04/16/2059 (C) | 155 | 155 | ||||||
Structured Asset Investment Loan Trust, | ||||||||
0.724%, 09/25/2034 (A) | 495 | 473 | ||||||
| SEI Institutional Managed Trust / Semi-Annual Report / March 31, 2015 | 125 |
SCHEDULE OF INVESTMENTS (Unaudited)
U.S. Fixed Income Fund (Continued)
March 31, 2015
| Description | Face Amount ($ Thousands) | Market Value ($ Thousands) | ||||||
Structured Asset Securities Mortgage Loan Trust, Ser 2005-WF2, Cl A3 | ||||||||
0.774%, 05/25/2035 (A) | $ | 863 | $ | 864 | ||||
Structured Asset Securities Mortgage Loan Trust, Ser 2006-WF2, Cl A3 | ||||||||
0.321%, 07/25/2036 (A) | 271 | 270 | ||||||
TAL Advantage, Ser 2006-1A, Cl N | ||||||||
0.366%, 04/20/2021 (A) (C) | 114 | 113 | ||||||
Trade Maps, Ser 2013-1A, Cl A | ||||||||
0.875%, 12/10/2018 (A) (C) | 737 | 737 | ||||||
Trafigura Securitisation Finance, Ser 2012-1A, Cl A | ||||||||
2.572%, 10/15/2015 (A) (C) | 137 | 137 | ||||||
Trafigura Securitisation Finance, Ser 2014-1A, Cl A | ||||||||
1.125%, 10/15/2021 (A) (C) | 266 | 266 | ||||||
US Residential Opportunity Fund Trust, | ||||||||
3.625%, 02/27/2035 (C) | 248 | 247 | ||||||
US Residential Opportunity Fund Trust, | ||||||||
3.721%, 01/27/2035 (C) | 326 | 327 | ||||||
VOLT XIX, Ser 2014-NP11, Cl A1 | ||||||||
3.875%, 04/25/2055 (C) | 376 | 378 | ||||||
VOLT XXVI, Ser 2014-NPL6, Cl A1 | ||||||||
3.125%, 09/25/2043 (C) | 291 | 290 | ||||||
VOLT XXVII, Ser 2014-NPL7, Cl A1 | ||||||||
3.375%, 08/27/2057 (C) | 459 | 459 | ||||||
VOLT XXX, Ser 2015-NPL1, Cl A1 | ||||||||
3.625%, 10/25/2057 (C) | 223 | 224 | ||||||
VOLT XXXI, Ser 2015-NPL2, Cl A1 | ||||||||
3.375%, 02/25/2055 (C) | 185 | 185 | ||||||
VOLT XXXIII, Ser 2015-NPL5, Cl A1 | ||||||||
3.500%, 03/25/2055 (C) | 400 | 400 | ||||||
VOLT, Ser 2014-3A, Cl A1 | ||||||||
3.250%, 05/25/2054 | 106 | 106 | ||||||
VOLT, Ser 2014-NPL4, Cl A1 | ||||||||
3.125%, 04/27/2054 (C) | 439 | 437 | ||||||
VOLT, Ser 2014-NPL5, Cl A1 | ||||||||
3.228%, 09/25/2058 | 228 | 228 | ||||||
VOLT, Ser 2014-NPL6, Cl A2 | ||||||||
4.250%, 09/25/2043 | 100 | 98 | ||||||
| Description | Face Amount ($ Thousands) | Market Value ($ Thousands) | ||||||
VOLT, Ser 2015-NPL3, Cl A1 | ||||||||
3.375%, 10/25/2058 (C) | $ | 363 | $ | 363 | ||||
VOLT, Ser 2015-NPL4, Cl A1 | ||||||||
3.500%, 02/25/2055 | 282 | 282 | ||||||
VOLT, Ser 2015-NPL6, Cl A1 | ||||||||
3.500%, 02/25/2055 | 500 | 499 | ||||||
|
| |||||||
| 67,857 | ||||||||
|
| |||||||
Total Asset-Backed Securities | 112,800 | |||||||
|
| |||||||
U.S. GOVERNMENT AGENCY OBLIGATIONS — 1.8% |
| |||||||
FHLB | ||||||||
5.500%, 07/15/2036 | 300 | 421 | ||||||
0.875%, 05/24/2017 | 10 | 10 | ||||||
0.750%, 05/26/2015 (E) | 950 | 950 | ||||||
0.045%, 04/06/2015 to 04/22/2015 (B) | 4,800 | 4,800 | ||||||
FICO STRIPS, PO | ||||||||
9.800%, 11/30/2017 | 875 | 1,075 | ||||||
8.600%, 09/26/2019 | 845 | 1,103 | ||||||
3.631%, 12/06/2017 (B) | 660 | 639 | ||||||
1.628%, 10/06/2017 (B) | 360 | 352 | ||||||
0.000%, 05/11/2018 to 12/06/2018 (B) | 2,125 | 2,022 | ||||||
0.000%, 09/26/2019 (B) | 100 | 93 | ||||||
FNMA | ||||||||
5.375%, 06/12/2017 | 50 | 55 | ||||||
3.920%, 06/01/2017 (B) | 600 | 590 | ||||||
2.628%, 10/09/2019 (B) | 4,270 | 3,924 | ||||||
2.625%, 09/06/2024 | 303 | 314 | ||||||
Resolution Funding STRIPS | ||||||||
2.241%, 07/15/2020 (B) | 2,915 | 2,657 | ||||||
1.827%, 10/15/2019 (B) | 200 | 186 | ||||||
Tennessee Valley Authority | ||||||||
5.880%, 04/01/2036 | 250 | 350 | ||||||
5.250%, 09/15/2039 | 390 | 511 | ||||||
4.625%, 09/15/2060 | 60 | 70 | ||||||
2.875%, 09/15/2024 | 835 | 874 | ||||||
1.750%, 10/15/2018 | 83 | 85 | ||||||
|
| |||||||
Total U.S. Government Agency Obligations | 21,081 | |||||||
|
| |||||||
SOVEREIGN DEBT — 1.4% |
| |||||||
Brazilian Government International Bond | ||||||||
5.000%, 01/27/2045 | 215 | 199 | ||||||
Colombia Government International Bond | ||||||||
5.625%, 02/26/2044 | 1,070 | 1,196 | ||||||
Indonesia Government International Bond | ||||||||
5.125%, 01/15/2045 (C) | 210 | 221 | ||||||
| 126 | SEI Institutional Managed Trust / Semi-Annual Report / March 31, 2015 |
| Description | Face Amount ($ Thousands) | Market Value ($ Thousands) | ||||||
3.750%, 04/25/2022 (C) | $ | 470 | $ | 478 | ||||
Israel Government AID Bond (B) | ||||||||
2.993%, 02/15/2025 | 1,000 | 776 | ||||||
2.971%, 08/15/2025 | 609 | 465 | ||||||
2.564%, 11/15/2019 | 500 | 462 | ||||||
Japan Bank for International Cooperation | ||||||||
2.125%, 02/10/2025 | 210 | 209 | ||||||
Mexico Government International Bond MTN | ||||||||
5.750%, 10/12/2110 | 591 | 644 | ||||||
5.550%, 01/21/2045 | 3,172 | 3,719 | ||||||
4.750%, 03/08/2044 | 60 | 63 | ||||||
4.600%, 01/23/2046 | 215 | 220 | ||||||
4.000%, 10/02/2023 | 144 | 152 | ||||||
3.500%, 01/21/2021 | 195 | 203 | ||||||
Peruvian Government International Bond | ||||||||
5.625%, 11/18/2050 | 239 | 292 | ||||||
Poland Government International Bond | ||||||||
4.000%, 01/22/2024 | 1,257 | 1,380 | ||||||
Province of Manitoba Canada | ||||||||
3.050%, 05/14/2024 | 235 | 249 | ||||||
Province of Quebec Canada | ||||||||
6.350%, 01/30/2026 | 70 | 91 | ||||||
2.625%, 02/13/2023 | 620 | 639 | ||||||
Russia Government International Bond | ||||||||
7.500%, 03/31/2030 (C) | 761 | 873 | ||||||
Slovakia Government International Bond | ||||||||
4.375%, 05/21/2022 (C) | 680 | 760 | ||||||
Slovenia Government International Bond (C) | ||||||||
5.850%, 05/10/2023 | 200 | 237 | ||||||
5.500%, 10/26/2022 | 420 | 484 | ||||||
5.250%, 02/18/2024 | 415 | 476 | ||||||
South Africa Government International Bond | ||||||||
5.875%, 09/16/2025 | 750 | 859 | ||||||
Turkey Government International Bond | ||||||||
6.250%, 09/26/2022 | 450 | 512 | ||||||
5.750%, 03/22/2024 | 580 | 645 | ||||||
United Mexican States MTN | ||||||||
6.050%, 01/11/2040 | 100 | 124 | ||||||
|
| |||||||
Total Sovereign Debt | 16,628 | |||||||
|
| |||||||
MUNICIPAL BONDS — 0.6% |
| |||||||
American Municipal Power, Build America Project, RB | ||||||||
7.499%, 02/15/2050 | 80 | 118 | ||||||
| Description | Face Amount ($ Thousands) | Market Value ($ Thousands) | ||||||
California State, Build America Project, GO | ||||||||
7.600%, 11/01/2040 | $ | 240 | $ | 378 | ||||
6.650%, 03/01/2022 | 250 | 307 | ||||||
California State, GO | ||||||||
6.200%, 03/01/2019 | 300 | 346 | ||||||
Chicago, Ser B, GO | ||||||||
6.314%, 01/01/2044 | 380 | 390 | ||||||
Clark County, Airport System Revenue, Build America Project, Ser C, RB | ||||||||
6.820%, 07/01/2045 | 300 | 439 | ||||||
Houston, Ser A, GO | ||||||||
6.290%, 03/01/2032 | 235 | 298 | ||||||
Illinois State, GO | ||||||||
5.100%, 06/01/2033 | 535 | 541 | ||||||
4.950%, 06/01/2023 | 650 | 692 | ||||||
4.350%, 06/01/2018 | 475 | 496 | ||||||
Los Angeles, Community College District, Build America Project, GO | ||||||||
6.750%, 08/01/2049 | 280 | 422 | ||||||
Los Angeles, Department of Airports, Build America Project, RB | ||||||||
6.582%, 05/15/2039 | 25 | 34 | ||||||
New Jersey State, Turnpike Authority, Build America Project, Ser C, RB | ||||||||
7.102%, 01/01/2041 | 370 | 542 | ||||||
New York and New Jersey, Port Authority, RB | ||||||||
5.647%, 11/01/2040 | 105 | 134 | ||||||
4.458%, 10/01/2062 | 380 | 415 | ||||||
New York City, Transitional Finance Authority, Future Tax Secured, RB | ||||||||
5.508%, 08/01/2037 | 275 | 346 | ||||||
North Texas, Tollway Authority, Build America Project, | ||||||||
6.718%, 01/01/2049 | 331 | 494 | ||||||
Ohio State University, | ||||||||
4.800%, 06/01/2111 | 276 | 307 | ||||||
|
| |||||||
Total Municipal Bonds | 6,699 | |||||||
|
| |||||||
COLLATERALIZED DEBT OBLIGATIONS — 0.2% |
| |||||||
Other Asset-Backed Securities — 0.2% |
| |||||||
AMMC CLO XIV, Ser 2014-14A, Cl A1L | ||||||||
1.706%, 07/27/2026 (A) (C) | 500 | 498 | ||||||
| SEI Institutional Managed Trust / Semi-Annual Report / March 31, 2015 | 127 |
SCHEDULE OF INVESTMENTS (Unaudited)
U.S. Fixed Income Fund (Continued)
March 31, 2015
| Description | Face Amount ($ Thousands) | Market Value ($ Thousands) | ||||||
Ballyrock CLO, Ser 2014-1A, Cl A1 | ||||||||
1.711%, 10/20/2026 (A) (C) | $ | 150 | $ | 150 | ||||
Cent CLO, Ser 2013-18A, Cl A | ||||||||
1.377%, 07/23/2025 (A) (C) | 500 | 491 | ||||||
Eaton Vance CLO, | ||||||||
1.703%, 07/15/2026 (A) (C) | 200 | 199 | ||||||
Flatiron CLO, Ser 2014-1A, Cl A1 | ||||||||
1.637%, 07/17/2026 (A) (C) | 500 | 497 | ||||||
Voya CLO, Ser 2014-2A, Cl A1 | ||||||||
1.707%, 07/17/2026 (A) (C) | 500 | 499 | ||||||
|
| |||||||
Total Collateralized Debt Obligations (Cost $2,342) ($ Thousands) | 2,334 | |||||||
|
| |||||||
U.S. TREASURY OBLIGATIONS — 30.7% |
| |||||||
U.S. Treasury Bills | ||||||||
0.005%, 04/30/2015 (B) | 24 | 24 | ||||||
U.S. Treasury Bonds | ||||||||
7.274%, 08/15/2023 (B) | 950 | 807 | ||||||
6.375%, 08/15/2027 | 50 | 74 | ||||||
6.125%, 08/15/2029 | 50 | 74 | ||||||
5.375%, 02/15/2031 | 100 | 142 | ||||||
5.250%, 02/15/2029 | 100 | 137 | ||||||
5.000%, 05/15/2037 | 965 | 1,403 | ||||||
4.500%, 05/15/2038 | 200 | 272 | ||||||
4.250%, 05/15/2039 | 100 | 132 | ||||||
3.750%, 11/15/2043 | 5,784 | 7,225 | ||||||
3.625%, 08/15/2043 | 573 | 700 | ||||||
3.250%, 12/31/2016 | 500 | 524 | ||||||
3.125%, 11/15/2041 | 30 | 34 | ||||||
3.125%, 02/15/2043 | 340 | 380 | ||||||
3.125%, 08/15/2044 | 438 | 491 | ||||||
3.000%, 11/15/2044 | 3,647 | 3,996 | ||||||
2.875%, 05/15/2043 | 17,315 | 18,449 | ||||||
2.750%, 08/15/2042 | 1,540 | 1,603 | ||||||
2.750%, 11/15/2042 | 6,703 | 6,966 | ||||||
2.625%, 11/15/2020 | 200 | 212 | ||||||
2.500%, 02/15/2045 | 10,624 | 10,526 | ||||||
2.000%, 10/31/2021 | 1,169 | 1,193 | ||||||
2.000%, 02/15/2025 | 17,758 | 17,870 | ||||||
1.750%, 09/30/2019 | 21,479 | 21,888 | ||||||
1.750%, 02/28/2022 | 856 | 858 | ||||||
1.625%, 06/30/2019 | 3,590 | 3,646 | ||||||
1.375%, 02/29/2020 | 3,791 | 3,792 | ||||||
1.250%, 01/31/2020 | 526 | 523 | ||||||
1.000%, 11/30/2019 | 800 | 788 | ||||||
0.500%, 01/31/2017 | 5,545 | 5,545 | ||||||
U.S. Treasury Inflation Protected Securities | ||||||||
2.500%, 01/15/2029 | 109 | 139 | ||||||
| Description | Face Amount ($ Thousands) | Market Value ($ Thousands) | ||||||
2.375%, 01/15/2025 | $ | 87 | $ | 105 | ||||
2.125%, 02/15/2040 | 227 | 303 | ||||||
1.875%, 07/15/2015 | 1,141 | 1,159 | ||||||
1.750%, 01/15/2028 | 112 | 131 | ||||||
1.375%, 02/15/2044 | 5,034 | 5,917 | ||||||
0.750%, 02/15/2042 | 217 | 220 | ||||||
0.750%, 02/15/2045 | 1,657 | 1,685 | ||||||
0.625%, 01/15/2024 | 150 | 156 | ||||||
0.625%, 02/15/2043 | 3,436 | 3,366 | ||||||
0.500%, 04/15/2015 | 917 | 918 | ||||||
0.250%, 01/15/2025 | 2,042 | 2,057 | ||||||
0.125%, 04/15/2016 | 2,668 | 2,695 | ||||||
0.125%, 04/15/2017 | 936 | 953 | ||||||
0.125%, 04/15/2019 | 150 | 152 | ||||||
0.125%, 01/15/2022 | 516 | 521 | ||||||
0.125%, 07/15/2024 | 1,875 | 1,875 | ||||||
U.S. Treasury Notes | ||||||||
4.750%, 02/15/2037 | 100 | 141 | ||||||
4.625%, 11/15/2016 | 1,400 | 1,495 | ||||||
4.500%, 05/15/2017 to 05/15/2017 | 6,053 | 6,217 | ||||||
4.375%, 02/15/2038 | 550 | 737 | ||||||
3.625%, 02/15/2044 | 6,582 | 8,048 | ||||||
3.500%, 02/15/2018 to 02/15/2018 | 2,352 | 2,457 | ||||||
3.375%, 05/15/2044 | 832 | 975 | ||||||
3.125%, 04/30/2017 | 3,837 | 4,038 | ||||||
3.125%, 05/15/2021 | 1,250 | 1,361 | ||||||
2.875%, 03/31/2018 to 03/31/2018 | 7,535 | 7,790 | ||||||
2.750%, 05/31/2017 | 1,000 | 1,046 | ||||||
2.750%, 02/15/2019 | 250 | 265 | ||||||
2.500%, 05/15/2024 | 3,486 | 3,662 | ||||||
2.375%, 05/31/2018 | 500 | 522 | ||||||
2.250%, 07/31/2021 | 1,867 | 1,936 | ||||||
2.125%, 08/31/2020 | 541 | 559 | ||||||
2.125%, 01/31/2021 | 920 | 949 | ||||||
2.000%, 11/30/2020 | 1,620 | 1,662 | ||||||
2.000%, 05/31/2021 | 10,470 | 10,704 | ||||||
1.875%, 11/30/2021 | 1,180 | 1,194 | ||||||
1.750%, 05/15/2023 | 2,440 | 2,427 | ||||||
1.625%, 03/31/2019 | 3,880 | 3,945 | ||||||
1.625%, 07/31/2019 | 6,347 | 6,442 | ||||||
1.625%, 08/31/2019 to 08/31/2019 (D) | 3,306 | 3,337 | ||||||
1.625%, 12/31/2019 | 3,040 | 3,079 | ||||||
1.500%, 07/31/2016 | 360 | 365 | ||||||
1.500%, 08/31/2018 | 400 | 406 | ||||||
1.500%, 01/31/2019 | 3,329 | 3,372 | ||||||
1.500%, 05/31/2019 | 3,637 | 3,676 | ||||||
1.500%, 10/31/2019 | 2,185 | 2,202 | ||||||
1.500%, 11/30/2019 | 1,250 | 1,260 | ||||||
1.500%, 01/31/2022 | 2,914 | 2,877 | ||||||
1.375%, 03/31/2020 | 9,124 | 9,124 | ||||||
| 128 | SEI Institutional Managed Trust / Semi-Annual Report / March 31, 2015 |
| Description | Face Amount ($ Thousands) | Market Value ($ Thousands) | ||||||
1.000%, 09/15/2017 | $ | 2,235 | $ | 2,250 | ||||
1.000%, 03/15/2018 | 3,179 | 3,191 | ||||||
0.875%, 01/31/2017 | 1,268 | 1,276 | ||||||
0.875%, 07/15/2017 | 7,508 | 7,546 | ||||||
0.875%, 08/15/2017 | 1,487 | 1,494 | ||||||
0.875%, 10/15/2017 | 3,867 | 3,880 | ||||||
0.875%, 11/15/2017 | 7,766 | 7,787 | ||||||
0.625%, 10/15/2016 | 421 | 422 | ||||||
0.625%, 12/31/2016 | 4,603 | 4,614 | ||||||
0.625%, 02/15/2017 | 1,619 | 1,622 | ||||||
0.625%, 08/31/2017 | 8,871 | 8,855 | ||||||
0.625%, 09/30/2017 | 5,301 | 5,287 | ||||||
0.625%, 11/30/2017 | 2,850 | 2,838 | ||||||
0.500%, 06/30/2016 | 1,537 | 1,540 | ||||||
0.500%, 09/30/2016 | 3,453 | 3,457 | ||||||
0.500%, 02/28/2017 | 5,550 | 5,547 | ||||||
0.500%, 03/31/2017 | 8,571 | 8,561 | ||||||
0.375%, 10/31/2016 | 2,716 | 2,713 | ||||||
0.250%, 05/15/2015 | 3,210 | 3,211 | ||||||
U.S. Treasury STRIPS (B) | ||||||||
25.571%, 05/15/2032 | 850 | 556 | ||||||
10.171%, 11/15/2022 | 1,100 | 956 | ||||||
6.075%, 05/15/2026 | 700 | 549 | ||||||
5.741%, 05/15/2036 | 100 | 59 | ||||||
5.662%, 05/15/2029 | 100 | 71 | ||||||
5.610%, 02/15/2024 | 1,275 | 1,066 | ||||||
5.290%, 05/15/2034 | 175 | 108 | ||||||
5.260%, 08/15/2027 | 800 | 604 | ||||||
5.152%, 02/15/2034 | 250 | 155 | ||||||
5.111%, 02/15/2028 | 653 | 485 | ||||||
5.043%, 05/15/2028 | 830 | 611 | ||||||
5.026%, 08/15/2033 | 300 | 189 | ||||||
4.993%, 05/15/2033 | 425 | 270 | ||||||
4.910%, 11/15/2026 | 1,100 | 849 | ||||||
4.721%, 08/15/2019 | 1,350 | 1,275 | ||||||
4.520%, 05/15/2024 | 300 | 249 | ||||||
4.403%, 02/15/2030 | 1,300 | 907 | ||||||
4.374%, 11/15/2032 | 250 | 161 | ||||||
4.347%, 05/15/2030 | 400 | 277 | ||||||
4.343%, 11/15/2030 | 1,450 | 991 | ||||||
4.320%, 11/15/2033 | 750 | 471 | ||||||
4.233%, 11/15/2029 | 550 | 387 | ||||||
4.211%, 02/15/2027 | 1,450 | 1,111 | ||||||
4.113%, 11/15/2027 | 1,900 | 1,423 | ||||||
3.979%, 08/15/2020 | 3,550 | 3,273 | ||||||
3.957%, 05/15/2027 | 315 | 240 | ||||||
3.938%, 11/15/2024 | 250 | 205 | ||||||
3.891%, 08/15/2030 | 700 | 482 | ||||||
3.876%, 02/15/2033 | 100 | 64 | ||||||
3.860%, 11/15/2016 | 200 | 199 | ||||||
3.679%, 02/15/2017 | 4,460 | 4,417 | ||||||
3.648%, 11/15/2031 | 710 | 471 | ||||||
| Description | Face Amount ($ Thousands)/Shares | Market Value ($ Thousands) | ||||||
3.611%, 05/15/2031 | $ | 560 | $ | 377 | ||||
3.593%, 02/15/2031 | 1,025 | 699 | ||||||
3.509%, 05/15/2018 | 250 | 243 | ||||||
3.459%, 02/15/2018 | 925 | 902 | ||||||
3.379%, 02/15/2032 | 1,050 | 692 | ||||||
3.370%, 08/15/2031 | 275 | 184 | ||||||
3.350%, 08/15/2029 | 275 | 195 | ||||||
3.340%, 05/15/2020 | 3,359 | 3,112 | ||||||
3.270%, 02/15/2029 | 700 | 504 | ||||||
3.226%, 11/15/2017 | 650 | 636 | ||||||
3.019%, 05/15/2035 | 100 | 60 | ||||||
2.941%, 05/15/2019 | 2,725 | 2,589 | ||||||
2.910%, 11/15/2034 | 200 | 122 | ||||||
2.869%, 08/15/2028 | 100 | 73 | ||||||
2.733%, 08/15/2022 | 100 | 87 | ||||||
2.713%, 05/15/2023 | 1,800 | 1,539 | ||||||
2.712%, 08/15/2021 | 450 | 403 | ||||||
2.687%, 02/15/2023 (D) | 3,350 | 2,889 | ||||||
2.672%, 05/15/2044 | 1,180 | 552 | ||||||
2.663%, 08/15/2032 | 150 | 97 | ||||||
2.602%, 05/15/2025 | 300 | 243 | ||||||
2.589%, 08/15/2039 | 100 | 53 | ||||||
2.562%, 05/15/2022 | 700 | 615 | ||||||
2.527%, 11/15/2023 | 100 | 84 | ||||||
2.474%, 02/15/2022 | 1,885 | 1,666 | ||||||
2.398%, 02/15/2021 | 2,880 | 2,617 | ||||||
2.324%, 11/15/2021 | 1,600 | 1,423 | ||||||
1.961%, 05/15/2021 | 3,665 | 3,302 | ||||||
1.887%, 11/15/2019 | 200 | 187 | ||||||
1.430%, 08/15/2026 | 47 | 37 | ||||||
1.274%, 02/15/2020 | 2,435 | 2,273 | ||||||
1.136%, 02/15/2035 | 40 | 24 | ||||||
|
| |||||||
Total U.S. Treasury Obligations | 358,597 | |||||||
|
| |||||||
AFFILIATED PARTNERSHIP — 0.4% |
| |||||||
SEI Liquidity Fund, L.P. | ||||||||
0.070%**† (F) | 5,053,966 | 5,054 | ||||||
|
| |||||||
Total Affiliated Partnership (Cost $5,054) ($ Thousands) | 5,054 | |||||||
|
| |||||||
CASH EQUIVALENT — 7.1% |
| |||||||
SEI Daily Income Trust, Prime Obligation Fund, Cl A | ||||||||
0.010%**† | 83,472,320 | 83,472 | ||||||
|
| |||||||
Total Cash Equivalent (Cost $83,472) ($ Thousands) | 83,472 | |||||||
|
| |||||||
Total Investments — 107.5% (Cost $1,210,180) ($ Thousands) | $ | 1,256,900 | ||||||
|
| |||||||
| SEI Institutional Managed Trust / Semi-Annual Report / March 31, 2015 | 129 |
SCHEDULE OF INVESTMENTS (Unaudited)
U.S. Fixed Income Fund (Concluded)
March 31, 2015
| Description | Contracts | Market Value ($ Thousands) | ||||||
PURCHASED OPTIONS*‡‡ — 0.0% |
| |||||||
December 2015, Euro Call, Expires 12/19/15 | 26 | $ | 2 | |||||
December 2015, Euro Put, Expires 12/19/15 | 26 | 2 | ||||||
May 2015, U.S. 5-Year Treasury Note Call, Expires 04/18/15, Strike Price $119.50 | 31 | 27 | ||||||
May 2015, U.S. 5-Year Treasury Note Call, Expires 04/18/15, Strike Price $121.50 | 31 | 2 | ||||||
|
| |||||||
Total Purchased Options (Cost $22) ($ Thousands) | 33 | |||||||
|
| |||||||
WRITTEN OPTIONS*‡‡ — 0.0% |
| |||||||
December 2015, Euro Call, Expires 12/19/15 | (26 | ) | (13 | ) | ||||
December 2015, Euro Put, Expires 12/19/15 | (26 | ) | (7 | ) | ||||
January 2015, U.S. 10-Year Treasury Note Call, Expires 05/16/15, Strike Price $130.50 | (8 | ) | (4 | ) | ||||
June 2015, Euro Dollar Put, Expires 06/20/15 | (20 | ) | (2 | ) | ||||
June 2015, U.S. 10-Year Treasury Note Call, Expires 05/16/15, Strike Price $131.00 | (42 | ) | (17 | ) | ||||
June 2015, U.S. 10-Year Treasury Note Call, Expires 05/16/15, Strike Price $130.00 | (8 | ) | (6 | ) | ||||
June 2015, U.S. 10-Year Treasury Note Call, Expires 05/16/15, Strike Price $132.00 | (31 | ) | (7 | ) | ||||
| Description | Contracts | Market Value ($ Thousands) | ||||||
June 2015, U.S. 10-Year Treasury Note Put, Expires 05/16/15, Strike Price $124.00 | (42 | ) | $ | (3 | ) | |||
May 2015, U.S. 5-Year Treasury Note Call, Expires 04/18/15, Strike Price $120.50 | (62 | ) | (19 | ) | ||||
May 2015, U.S. 5-Year Treasury Note Call, Expires 04/18/15, Strike Price $128.00 | (11 | ) | (14 | ) | ||||
May 2015, U.S. 5-Year Treasury Note Call, Expires 04/18/15, Strike Price $130.50 | (52 | ) | (11 | ) | ||||
May 2015, U.S. 5-Year Treasury Note Put, Expires 04/18/15, Strike Price $124.50 | (21 | ) | — | |||||
|
| |||||||
Total Written Options | (103 | ) | ||||||
|
| |||||||
A list of the open futures contracts held by the Fund at March 31, 2015, is as follows:
| Type of Contract | Number of Contracts Long | Expiration Date | Unrealized Appreciation/ | |||||||||
90-Day Euro$ | 9 | Dec-2015 | $ | 1 | ||||||||
90-Day Euro$ | 69 | Dec-2016 | 54 | |||||||||
90-Day Euro$ | (10 | ) | Dec-2017 | (24 | ) | |||||||
90-Day Euro$ | 53 | Jun-2016 | 60 | |||||||||
90-Day Euro$ | 17 | Jun-2017 | 2 | |||||||||
90-Day Euro$ | (17 | ) | Jun-2018 | (2 | ) | |||||||
CBT T-Bonds | (52 | ) | Jun-2015 | (154 | ) | |||||||
U.S. 10-Year Treasury Note | 57 | Jun-2015 | 116 | |||||||||
U.S. 10-Year Treasury Note | (109 | ) | Jun-2015 | (143 | ) | |||||||
U.S. 2-Year Treasury Note | (270 | ) | Jun-2015 | (175 | ) | |||||||
U.S. 2-Year Treasury Note | 16 | Jun-2015 | 15 | |||||||||
U.S. 5-Year Treasury Note | 438 | Jun-2015 | 529 | |||||||||
U.S. Ultra Long Treasury Bond | (150 | ) | Jun-2015 | (609 | ) | |||||||
U.S. Ultra Long Treasury Bond | 19 | Jun-2015 | 80 | |||||||||
|
| |||||||||||
| $ | (250 | ) | ||||||||||
|
| |||||||||||
For the period ended March 31, 2015, the total amount of all open futures contracts, as presented in the table above, are representative of the volume of activity for this derivative type during the period.
A list of outstanding OTC swap agreements held by the Fund at March 31, 2015, is as follows:
| Interest Rate Swaps | ||||||||||||||||
| Counterparty | Fund Pays | Fund Receives | Termination Date | Notional Amount ($ Thousands) | Net Unrealized Depreciation ($ Thousands) | |||||||||||
| Barclays Bank PLC | 2.48% | 3 Month USD - LIBOR | 11/15/27 | $ | 415 | $ | (41 | ) | ||||||||
| Barclays Bank PLC | 2.42% | 3 Month USD - LIBOR | 11/15/27 | 420 | (38 | ) | ||||||||||
| Citigroup | 2.71% | 3 Month USD - LIBOR | 08/15/42 | 830 | (60 | ) | ||||||||||
|
| |||||||||||||||
| $ | (139 | ) | ||||||||||||||
|
| |||||||||||||||
A list of outstanding centrally cleared swap agreements held by the Fund at March 31, 2015, is as follows:
| Interest Rate Swaps | ||||||||||||||||
| Counterparty | Fund Pays | Fund Receives | Termination Date | Notional Amount ($ Thousands) | Net Unrealized Depreciation ($ Thousands) | |||||||||||
| Citigroup | 3.68% | 3 Month USD - LIBOR | 11/15/2043 | $ | 725 | $ | (202) | |||||||||
|
| |||||||||||||||
For the period ended March 31, 2015, the total amount of all open swap contracts, as presented in the table above, are representative of the volume of activity for this derivative type during the period.
| 130 | SEI Institutional Managed Trust / Semi-Annual Report / March 31, 2015 |
Percentages are based on a Net Assets of $1,168,842 ($ Thousands).
| † | Investment in Affiliated Security (see Note 6). |
| ‡ | Real Estate Investment Trust. |
| ‡‡ | For the period ended March 31, 2015, the total amount of all purchased and written options, as presented in the Schedule of Investments are representative of the volume of activity for these derivative types during the period. |
| * | Non-Income Producing Security. |
| ** | The rate reported is the 7-day effective yield as of March 31, 2015. |
| (A) | Variable Rate Security — The rate reported on the Schedule of Investments is the rate in effect as of March 31, 2015. |
| (B) | The rate reported is the effective yield at time of purchase. |
| (C) | Securities sold within terms of a private placement memorandum, exempt from registration under Section 144A of the Securities Act of 1933, as amended, and may be sold only to dealers in that program or other “accredited investors.” These securities have been determined to be liquid under guidelines established by the Board of Trustees. |
| (D) | This security or a partial position of this security is on loan at March 31, 2015. The total market value of securities on loan at March 31, 2015 was $4,928 ($ Thousands). |
| (E) | Step Bonds — The rate reflected on the Schedule of Investments is the effective yield on March 31, 2015. The coupon on a step bond changes on a specified date. |
| (F) | This security was purchased with cash collateral held from securities on loan. The total value of such securities as of March 31, 2015 was $5,054 ($ Thousands). |
ABS — Asset-Backed Security
ACES — Alternative Credit Enhancement Structure
AID — Agency for International Development
ARM — Adjustable Rate Mortgage
Cl — Class
CLO — Collateralized Loan Obligation
CMBS — Commercial Mortgage-Backed Securities
CMO — Collateralized Mortgage Obligation
FDIC — Federal Deposit Insurance Corporation
FHLB — Federal Home Loan Bank
FHLMC — Federal Home Loan Mortgage Corporation
FICO — Financing Corporation
FNMA — Federal National Mortgage Association
GNMA — Government National Mortgage Association
GO — General Obligation
IO — Interest Only
LIBOR — London Interbank Offered Rate
L.P. — Limited Partnership
LLC — Limited Liability Company
MTN — Medium Term Note
NCUA — National Credit Union Association
PLC — Public Limited Company
PO — Principle Only
Re-REMIC — Resecuritization of Real Estate Mortgage Investment Conduit
RB — Revenue Bond
Ser — Series
STRIPS — Separately Traded Registered Interest and Principal Securities
TBA — To Be Announced
Amounts designated as “—” are $O or have been rounded to $O
The following is a list of the level of inputs used as of March 31, 2015, in valuing the Fund’s investments and other financial instruments carried at value ($ Thousands):
| Investments in Securities | Level 1 | Level 2 | Level 3 | Total | ||||||||||||
Mortgage-Backed Securities | $ | — | $ | 370,676 | $ | — | $ | 370,676 | ||||||||
Corporate Obligations | — | 279,559 | — | 279,559 | ||||||||||||
Asset-Backed Securities | — | 112,800 | — | 112,800 | ||||||||||||
U.S Government Agency Obligations | — | 21,081 | — | 21,081 | ||||||||||||
Sovereign Debt | — | 16,628 | — | 16,628 | ||||||||||||
Municipal Bonds | — | 6,699 | — | 6,699 | ||||||||||||
Collateralized Debt Obligations | — | 2,334 | — | 2,334 | ||||||||||||
U.S. Treasury Obligations | — | 358,597 | — | 358,597 | ||||||||||||
Cash Equivalent | 83,472 | — | — | 83,472 | ||||||||||||
Affiliated Partnership | — | 5,054 | — | 5,054 | ||||||||||||
|
|
|
|
|
|
|
| |||||||||
Total Investments in Securities | $ | 83,472 | $ | 1,173,428 | $ | — | $ | 1,256,900 | ||||||||
|
|
|
|
|
|
|
| |||||||||
| Other Financial Instruments | Level 1 | Level 2 | Level 3 | Total | ||||||||||||
Purchased Options | $ | 33 | $ | — | $ | — | $ | 33 | ||||||||
Written Options | (103 | ) | — | — | (103 | ) | ||||||||||
Futures Contracts* | ||||||||||||||||
Unrealized Appreciation | 857 | — | — | 857 | ||||||||||||
Unrealized Depreciation | (1,107 | ) | — | — | (1,107 | ) | ||||||||||
OTC Swaps* | ||||||||||||||||
Interest Rate Swaps | ||||||||||||||||
Unrealized Depreciation | — | (139 | ) | — | (139 | ) | ||||||||||
Centrally Cleared Swaps* | ||||||||||||||||
Interest Rate Swaps | ||||||||||||||||
Unrealized Depreciation | — | (202 | ) | — | (202 | ) | ||||||||||
|
|
|
|
|
|
|
| |||||||||
Total Other Financial Instruments | $ | (320 | ) | $ | (341 | ) | $ | — | $ | (661 | ) | |||||
|
|
|
|
|
|
|
| |||||||||
| * | Futures contracts and swap contracts are valued at the unrealized appreciation/(depreciation) on the instruments. |
For the period ended March 31, 2015, there were no transfers between Level 1 and Level 2 assets and liabilities.
For the period ended March 31, 2015, there were no transfers between Level 2 and Level 3 assets and liabilities.
For the period ended March 31, 2015, there were no level 3 investments.
For more information on valuation inputs, see Note 2 — Significant Accounting Policies in Notes to Financial Statements.
Amounts designated as “—” are $0 or have been rounded to $0.
The accompanying notes are an integral part of the financial statements.
| SEI Institutional Managed Trust / Semi-Annual Report / March 31, 2015 | 131 |
SCHEDULE OF INVESTMENTS (Unaudited)
High Yield Bond Fund
March 31, 2015
| Description | Face Amount ($ Thousands) | Market Value ($ Thousands) | ||||||
CORPORATE OBLIGATIONS — 77.9% |
| |||||||
Consumer Discretionary — 19.8% |
| |||||||
1011778 BC ULC | ||||||||
6.000%, 04/01/2022 (A) | $ | 1,651 | $ | 1,709 | ||||
Academy | ||||||||
9.250%, 08/01/2019 (A) | 655 | 694 | ||||||
Adelphia Communications (Escrow Security) | ||||||||
10.250%, 06/15/2011 (B) | 150 | 1 | ||||||
0.000%, 01/15/2009 (B) | 225 | 2 | ||||||
Adelphia Communications (Escrow Security) PIK | ||||||||
0.000%, 02/15/2004 (B) | 25 | — | ||||||
Affinion Group Holdings | ||||||||
7.875%, 12/15/2018 | 1,519 | 949 | ||||||
Affinity Gaming | ||||||||
9.000%, 05/15/2018 | 3,275 | 3,193 | ||||||
American Achievement | ||||||||
10.875%, 04/15/2016 (A) | 3,365 | 3,298 | ||||||
American Axle & Manufacturing | ||||||||
6.250%, 03/15/2021 | 595 | 626 | ||||||
Apex Tool Group | ||||||||
7.000%, 02/01/2021 (A) | 2,225 | 2,091 | ||||||
Armored Autogroup | ||||||||
9.250%, 11/01/2018 | 845 | 865 | ||||||
Ashtead Capital | ||||||||
6.500%, 07/15/2022 (A) | 2,855 | 3,041 | ||||||
Aventine (Escrow Security) | ||||||||
0.000%, 10/15/2049 (B) (C) (D) | 2,750 | 1 | ||||||
Beazer Homes USA | ||||||||
5.750%, 06/15/2019 | 1,560 | 1,521 | ||||||
Belo | ||||||||
7.750%, 06/01/2027 | 1,675 | 1,876 | ||||||
| Description | Face Amount ($ Thousands) | Market Value ($ Thousands) | ||||||
Bon-Ton Department Stores | ||||||||
8.000%, 06/15/2021 | $ | 3,000 | $ | 2,475 | ||||
Boyd Gaming | ||||||||
9.000%, 07/01/2020 | 1,980 | 2,136 | ||||||
Cablevision Systems | ||||||||
7.750%, 04/15/2018 | 500 | 555 | ||||||
5.875%, 09/15/2022 | 1,917 | 2,008 | ||||||
Caesars Entertainment Operating | ||||||||
9.000%, 02/15/2020 (B) | 13,785 | 10,201 | ||||||
8.500%, 02/15/2020 (B) | 1,260 | 939 | ||||||
Caesars Entertainment Resort Properties | ||||||||
8.000%, 10/01/2020 | 3,259 | 3,235 | ||||||
Caesars Growth Properties Holdings | ||||||||
9.375%, 05/01/2022 (A) | 780 | 599 | ||||||
Carmike Cinemas | ||||||||
7.375%, 05/15/2019 | 750 | 795 | ||||||
CCO Holdings | ||||||||
7.375%, 06/01/2020 | 835 | 892 | ||||||
6.500%, 04/30/2021 | 35 | 37 | ||||||
5.250%, 03/15/2021 | 1,200 | 1,229 | ||||||
5.125%, 02/15/2023 | 2,000 | 2,020 | ||||||
CCOH Safari | ||||||||
5.750%, 12/01/2024 | 3,659 | 3,769 | ||||||
5.500%, 12/01/2022 | 1,279 | 1,308 | ||||||
Cedar Fair | ||||||||
5.375%, 06/01/2024 (A) | 1,174 | 1,200 | ||||||
5.250%, 03/15/2021 | 2,250 | 2,323 | ||||||
Century Communities | ||||||||
6.875%, 05/15/2022 | 2,295 | 2,272 | ||||||
Cequel Communications Holdings I | ||||||||
6.375%, 9/15/2020 (A) | 3,560 | 3,751 | ||||||
5.125%, 12/15/2021 (A) | 360 | 360 | ||||||
Chester Downs & Marina | ||||||||
9.250%, 02/01/2020 (A) | 4,490 | 3,412 | ||||||
Chinos Intermediate Holdings | ||||||||
7.750%, 05/01/2019 (A) | 1,425 | 1,250 | ||||||
Cinemark USA | ||||||||
7.375%, 06/15/2021 | 565 | 606 | ||||||
5.125%, 12/15/2022 | 1,390 | 1,411 | ||||||
4.875%, 06/01/2023 | 500 | 498 | ||||||
Claire’s Stores | ||||||||
9.000%, 03/15/2019 (A) | 1,590 | 1,443 | ||||||
8.875%, 03/15/2019 | 2,950 | 1,682 | ||||||
Clear Channel Worldwide Holdings | ||||||||
7.625%, 03/15/2020 | 1,510 | 1,588 | ||||||
6.500%, 11/15/2022 | 3,245 | 3,402 | ||||||
Cleopatra Finance | ||||||||
6.500%, 02/15/2025 (A) | 455 | 439 | ||||||
6.250%, 02/15/2022 (A) | 540 | 528 | ||||||
5.625%, 02/15/2020 (A) | 310 | 303 | ||||||
| 132 | SEI Institutional Managed Trust / Semi-Annual Report / March 31, 2015 |
| Description | Face Amount ($ Thousands) | Market Value ($ Thousands) | ||||||
Cogeco Cable | ||||||||
4.875%, 05/01/2020 (A) | $ | 1,050 | $ | 1,063 | ||||
Columbus International | ||||||||
7.375%, 03/30/2021 (A) | 3,580 | 3,759 | ||||||
Conn’s | ||||||||
7.250%, 07/15/2022 (A) | 2,427 | 2,172 | ||||||
CSC Holdings | ||||||||
8.625%, 02/15/2019 | 2,125 | 2,460 | ||||||
6.750%, 11/15/2021 | 1,250 | 1,388 | ||||||
5.250%, 06/01/2024 (A) | 4,559 | 4,650 | ||||||
CST Brands | ||||||||
5.000%, 05/01/2023 | 350 | 357 | ||||||
Dana Holding | ||||||||
6.750%, 02/15/2021 | 1,108 | 1,169 | ||||||
6.000%, 09/15/2023 | 495 | 527 | ||||||
5.500%, 12/15/2024 | 465 | 479 | ||||||
5.375%, 09/15/2021 | 200 | 208 | ||||||
DBP Holding | ||||||||
7.750%, 10/15/2020 (A) | 936 | 838 | ||||||
DISH DBS | ||||||||
7.875%, 09/01/2019 | 350 | 391 | ||||||
6.750%, 06/01/2021 | 2,535 | 2,700 | ||||||
5.875%, 07/15/2022 | 3,975 | 4,040 | ||||||
5.875%, 11/15/2024 | 2,065 | 2,068 | ||||||
5.125%, 05/01/2020 | 465 | 468 | ||||||
5.000%, 03/15/2023 | 2,805 | 2,727 | ||||||
DreamWorks Animation | ||||||||
6.875%, 08/15/2020 (A) | 745 | 726 | ||||||
Eldorado Resorts | ||||||||
8.625%, 06/15/2019 (A) | 1,490 | 1,561 | ||||||
Empire Today | ||||||||
11.375%, 02/01/2017 (A) | 2,000 | 1,600 | ||||||
Expo Event Transco | ||||||||
9.000%, 06/15/2021 (A) | 550 | 562 | ||||||
Family Tree Escrow | ||||||||
5.750%, 03/01/2023 (A) | 1,919 | 2,020 | ||||||
5.250%, 03/01/2020 (A) | 654 | 685 | ||||||
FCA US | ||||||||
8.250%, 06/15/2021 | 4,395 | 4,875 | ||||||
Fontainebleau Las Vegas Holdings | ||||||||
10.250%, 06/15/2015 (A) (B) | 3,125 | 12 | ||||||
Gannett | ||||||||
5.500%, 09/15/2024 (A) | 115 | 120 | ||||||
4.875%, 09/15/2021 (A) | 160 | 163 | ||||||
General Motors | ||||||||
4.875%, 10/02/2023 | 1,930 | 2,090 | ||||||
Gestamp Funding Luxembourg | ||||||||
5.625%, 05/31/2020 (A) | 2,720 | 2,808 | ||||||
Gibson Brands | ||||||||
8.875%, 08/01/2018 (A) | 1,414 | 1,416 | ||||||
Goodyear Tire & Rubber | ||||||||
8.750%, 08/15/2020 | 555 | 669 | ||||||
6.500%, 03/01/2021 | 2,700 | 2,876 | ||||||
| Description | Face Amount ($ Thousands) | Market Value ($ Thousands) | ||||||
Graton Economic Development Authority | ||||||||
9.625%, 09/01/2019 (A) | $ | 1,900 | $ | 2,081 | ||||
Guitar Center | ||||||||
9.625%, 04/15/2020 (A) | 2,880 | 2,102 | ||||||
6.500%, 04/15/2019 (A) | 2,270 | 1,981 | ||||||
Gymboree | ||||||||
9.125%, 12/01/2018 | 785 | 369 | ||||||
Harrah’s Operating | ||||||||
11.250%, 06/01/2017 (B) | 530 | 384 | ||||||
Hillman Group | ||||||||
6.375%, 07/15/2022 (A) | 425 | 425 | ||||||
iHeartCommunications | ||||||||
14.000%, 02/01/2021 | 1,466 | 1,165 | ||||||
10.625%, 03/15/2023 (A) | 703 | 707 | ||||||
10.000%, 01/15/2018 | 655 | 557 | ||||||
9.000%, 12/15/2019 | 529 | 524 | ||||||
9.000%, 03/01/2021 | 425 | 407 | ||||||
9.000%, 09/15/2022 | 5,705 | 5,448 | ||||||
International Automotive Components Group | ||||||||
9.125%, 06/01/2018 (A) | 1,295 | 1,316 | ||||||
Isle of Capri Casinos | ||||||||
5.875%, 03/15/2021 | 375 | 385 | ||||||
JC Penney | ||||||||
8.125%, 10/01/2019 | 850 | 833 | ||||||
6.375%, 10/15/2036 | 815 | 591 | ||||||
5.650%, 06/01/2020 | 3,655 | 3,152 | ||||||
L Brands | ||||||||
6.950%, 03/01/2033 | 1,146 | 1,235 | ||||||
6.625%, 04/01/2021 | 1,065 | 1,220 | ||||||
5.625%, 02/15/2022 | 1,175 | 1,292 | ||||||
5.625%, 10/15/2023 | 585 | 649 | ||||||
Landry’s | ||||||||
9.375%, 05/01/2020 (A) | 3,583 | 3,843 | ||||||
Liberty Media LLC | ||||||||
8.250%, 02/01/2030 | 5,215 | 5,710 | ||||||
LIN Television | ||||||||
5.875%, 11/15/2022 (A) | 2,797 | 2,853 | ||||||
McGraw-Hill Global Education Holdings | ||||||||
9.750%, 04/01/2021 | 450 | 497 | ||||||
MDC Partners | ||||||||
6.750%, 04/01/2020 (A) | 5,215 | 5,495 | ||||||
MGM Resorts International | ||||||||
6.750%, 10/01/2020 | 1,600 | 1,716 | ||||||
6.625%, 12/15/2021 | 2,900 | 3,098 | ||||||
6.000%, 03/15/2023 | 7,042 | 7,236 | ||||||
5.250%, 03/31/2020 | 2,675 | 2,715 | ||||||
Michaels FinCo Holdings PIK | ||||||||
7.500%, 08/01/2018 (A) | 568 | 579 | ||||||
Michaels Stores | ||||||||
5.875%, 12/15/2020 (A) | 1,480 | 1,521 | ||||||
Midas Intermediate Holdco II | ||||||||
7.875%, 10/01/2022 (A) | 400 | 393 | ||||||
| SEI Institutional Managed Trust / Semi-Annual Report / March 31, 2015 | 133 |
SCHEDULE OF INVESTMENTS (Unaudited)
High Yield Bond Fund (Continued)
March 31, 2015
| Description | Face Amount ($ Thousands) | Market Value ($ Thousands) | ||||||
Midcontinent Communications & Midcontinent Finance | ||||||||
6.250%, 08/01/2021 (A) | $ | 400 | $ | 416 | ||||
Millennium (Escrow Security) | ||||||||
7.625%, 11/15/2026 (B) | 175 | — | ||||||
0.000%, 12/31/2049 (B) | 1,760 | — | ||||||
Mohegan Tribal Gaming Authority | ||||||||
9.750%, 09/01/2021 | 6,477 | 6,866 | ||||||
Monitronics International | ||||||||
9.125%, 04/01/2020 | 7,870 | 7,703 | ||||||
MTR Gaming Group PIK | ||||||||
11.500%, 08/01/2019 | 1,170 | 1,267 | ||||||
Murphy Oil USA | ||||||||
6.000%, 08/15/2023 | 1,350 | 1,448 | ||||||
Neiman Marcus Group | ||||||||
8.750%, 10/15/2021 (A) | 555 | 588 | ||||||
8.000%, 10/15/2021 (A) | 455 | 482 | ||||||
Netflix | ||||||||
5.875%, 02/15/2025 (A) | 2,390 | 2,453 | ||||||
5.500%, 02/15/2022 (A) | 2,390 | 2,444 | ||||||
5.375%, 02/01/2021 | 1,947 | 1,986 | ||||||
New Academy Finance PIK | ||||||||
8.000%, 6/15/2018 (A) | 819 | 819 | ||||||
Nexstar Broadcasting | ||||||||
6.875%, 11/15/2020 | 2,900 | 3,059 | ||||||
6.125%, 02/15/2022 (A) | 1,420 | 1,455 | ||||||
Nine West Holdings | ||||||||
8.250%, 03/15/2019 (A) | 4,604 | 3,821 | ||||||
Numericable Group | ||||||||
6.250%, 05/15/2024 (A) | 1,540 | 1,559 | ||||||
6.000%, 05/15/2022 (A) | 4,065 | 4,116 | ||||||
Outfront Media Capital | ||||||||
5.875%, 03/15/2025 | 800 | 846 | ||||||
5.250%, 02/15/2022 | 390 | 409 | ||||||
Party City Holdings | ||||||||
8.875%, 08/01/2020 | 2,325 | 2,505 | ||||||
PC Nextco Holdings | ||||||||
8.750%, 08/15/2019 | 835 | 850 | ||||||
Peninsula Gaming | ||||||||
8.375%, 02/15/2018 (A) | 2,250 | 2,368 | ||||||
Petco Animal Supplies | ||||||||
9.250%, 12/01/2018 (A) | 895 | 940 | ||||||
PF Chang’s China Bistro | ||||||||
10.250%, 06/30/2020 (A) | 2,320 | 2,401 | ||||||
Pinnacle Entertainment | ||||||||
7.750%, 04/01/2022 | 595 | 662 | ||||||
7.500%, 04/15/2021 | 3,000 | 3,165 | ||||||
6.375%, 08/01/2021 | 425 | 450 | ||||||
Polymer Group | ||||||||
7.750%, 02/01/2019 | 1,162 | 1,206 | ||||||
6.875%, 06/01/2019 (A) | 1,395 | 1,332 | ||||||
Quebecor Media | ||||||||
5.750%, 01/15/2023 | 1,140 | 1,174 | ||||||
| Description | Face Amount ($ Thousands) | Market Value ($ Thousands) | ||||||
Quebecor Media (Escrow Security) | ||||||||
0.000%, 11/15/2013 (B) (E) | $ | 1,725 | $ | 4 | ||||
0.000%, 03/15/2016 (B) | 1,915 | 5 | ||||||
Radio One | ||||||||
9.250%, 02/15/2020 (A) | 2,946 | 2,813 | ||||||
Radio Systems | ||||||||
8.375%, 11/01/2019 (A) | 770 | 830 | ||||||
RCN Telecom Services | ||||||||
8.500%, 08/15/2020 (A) | 920 | 975 | ||||||
Regal Entertainment Group | ||||||||
5.750%, 03/15/2022 | 480 | 491 | ||||||
RSI Home Products | ||||||||
6.500%, 03/15/2023 (A) | 1,805 | 1,832 | ||||||
Sally Holdings | ||||||||
5.750%, 06/01/2022 | 200 | 213 | ||||||
5.500%, 11/01/2023 | 195 | 206 | ||||||
Schaeffler Finance | ||||||||
6.750%, 11/15/2022 (A) | 625 | 675 | ||||||
4.750%, 05/15/2021 (A) | 265 | 268 | ||||||
4.750%, 05/15/2023 (A) | 300 | 303 | ||||||
Scientific Games International | ||||||||
10.000%, 12/01/2022 (A) | 1,915 | 1,791 | ||||||
7.000%, 01/01/2022 (A) | 2,000 | 2,045 | ||||||
Seminole Tribe of Florida | ||||||||
6.535%, 10/01/2020 (A) | 440 | 473 | ||||||
Serta Simmons Holdings | ||||||||
8.125%, 10/01/2020 (A) | 2,075 | 2,184 | ||||||
Service International | ||||||||
7.500%, 04/01/2027 | 1,295 | 1,515 | ||||||
5.375%, 05/15/2024 | 285 | 298 | ||||||
ServiceMaster | ||||||||
8.000%, 02/15/2020 | 71 | 75 | ||||||
7.450%, 08/15/2027 | 1,900 | 1,924 | ||||||
7.250%, 03/01/2038 | 2,990 | 2,792 | ||||||
7.000%, 08/15/2020 | 406 | 431 | ||||||
Shingle Springs Tribal Gaming Authority | ||||||||
9.750%, 09/01/2021 (A) | 3,310 | 3,715 | ||||||
Sinclair Television Group | ||||||||
6.125%, 10/01/2022 | 310 | 325 | ||||||
5.625%, 08/01/2024 (A) | 2,693 | 2,740 | ||||||
5.375%, 04/01/2021 | 5,750 | 5,901 | ||||||
Sirius XM Radio | ||||||||
6.000%, 07/15/2024 (A) | 105 | 110 | ||||||
5.875%, 10/01/2020 (A) | 1,050 | 1,095 | ||||||
5.750%, 08/01/2021 (A) | 1,135 | 1,183 | ||||||
5.375%, 04/15/2025 (A) | 5,965 | 5,995 | ||||||
4.625%, 05/15/2023 (A) | 2,100 | 2,021 | ||||||
4.250%, 05/15/2020 (A) | 4,058 | 4,017 | ||||||
SITEL | ||||||||
11.000%, 08/01/2017 (A) | 2,221 | 2,299 | ||||||
Six Flags Entertainment | ||||||||
5.250%, 01/15/2021 (A) | 3,200 | 3,288 | ||||||
| 134 | SEI Institutional Managed Trust / Semi-Annual Report / March 31, 2015 |
| Description | Face Amount ($ Thousands) | Market Value ($ Thousands) | ||||||
Spanish Broadcasting System | ||||||||
12.500%, 04/15/2017 (A) | $ | 1,603 | $ | 1,663 | ||||
Spencer Spirit Holdings PIK | ||||||||
9.000%, 05/01/2018 (A) | 3,590 | 3,639 | ||||||
Station Casinos | ||||||||
7.500%, 03/01/2021 | 2,043 | 2,176 | ||||||
Taylor Morrison Communities | ||||||||
5.625%, 03/01/2024 (A) | 3,010 | 2,942 | ||||||
Tempur Sealy International | ||||||||
6.875%, 12/15/2020 | 415 | 443 | ||||||
Time | ||||||||
5.750%, 04/15/2022 (A) | 675 | 660 | ||||||
Townsquare Media | ||||||||
6.500%, 04/01/2023 (A) | 3,090 | 3,090 | ||||||
Toys R Us | ||||||||
10.375%, 8/15/2017 | 5,775 | 4,966 | ||||||
UCI International | ||||||||
8.625%, 02/15/2019 | 1,110 | 1,005 | ||||||
Unitymedia Hessen GmbH & KG | ||||||||
5.500%, 01/15/2023 (A) | 4,770 | 4,991 | ||||||
5.000%, 01/15/2025 (A) | 1,100 | 1,111 | ||||||
Unitymedia KabelBW GmbH | ||||||||
6.125%, 01/15/2025 (A) | 1,345 | 1,422 | ||||||
Univision Communications | ||||||||
8.500%, 05/15/2021 (A) | 975 | 1,042 | ||||||
5.125%, 05/15/2023 (A) | 700 | 710 | ||||||
Vail Resorts | ||||||||
6.500%, 05/01/2019 | 654 | 677 | ||||||
Videotron | ||||||||
5.375%, 06/15/2024 (A) | 310 | 319 | ||||||
5.000%, 07/15/2022 | 1,975 | 2,034 | ||||||
Viking Cruises | ||||||||
8.500%, 10/15/2022 (A) | 5,010 | 5,574 | ||||||
VTR Finance BV | ||||||||
6.875%, 01/15/2024 (A) | 2,440 | 2,531 | ||||||
Wave Holdco PIK | ||||||||
8.250%, 07/15/2019 (A) | 381 | 390 | ||||||
WideOpenWest Finance | ||||||||
10.250%, 07/15/2019 | 1,135 | 1,220 | ||||||
William Lyon Homes | ||||||||
7.000%, 08/15/2022 | 1,800 | 1,856 | ||||||
5.750%, 04/15/2019 | 945 | 954 | ||||||
WMG Acquisition | ||||||||
6.750%, 04/15/2022 (A) | 1,975 | 1,871 | ||||||
6.000%, 01/15/2021 (A) | 601 | 613 | ||||||
5.625%, 04/15/2022 (A) | 940 | 944 | ||||||
Wynn Las Vegas | ||||||||
5.500%, 03/01/2025 (A) | 2,695 | 2,729 | ||||||
4.250%, 05/30/2023 (A) | 479 | 457 | ||||||
|
| |||||||
| 360,310 | ||||||||
|
| |||||||
Consumer Staples — 3.7% | ||||||||
Albea Beauty Holdings | ||||||||
8.375%, 11/01/2019 (A) | 740 | 794 | ||||||
| Description | Face Amount ($ Thousands) | Market Value ($ Thousands) | ||||||
Albertsons Holdings | ||||||||
7.750%, 10/15/2022 (A) | $ | 1,252 | $ | 1,340 | ||||
B&G Foods | ||||||||
4.625%, 06/01/2021 | 455 | 454 | ||||||
Bumble Bee Holdco | ||||||||
9.000%, 12/15/2017 (A) | 2,411 | 2,532 | ||||||
Bumble Bee Holdco PIK | ||||||||
9.625%, 03/15/2018 (A) | 2,250 | 2,323 | ||||||
Central Garden and Pet | ||||||||
8.250%, 03/01/2018 | 5,185 | 5,305 | ||||||
Chiquita Brands International | ||||||||
7.875%, 02/01/2021 | 465 | 509 | ||||||
Cott Beverages | ||||||||
6.750%, 01/01/2020 (A) | 1,470 | 1,521 | ||||||
5.375%, 07/01/2022 (A) | 1,150 | 1,108 | ||||||
Darling Ingredients | ||||||||
5.375%, 01/15/2022 | 1,535 | 1,547 | ||||||
Dean Foods | ||||||||
6.500%, 03/15/2023 (A) | 162 | 163 | ||||||
Diamond Foods | ||||||||
7.000%, 03/15/2019 (A) | 900 | 927 | ||||||
Elizabeth Arden | ||||||||
7.375%, 03/15/2021 | 2,626 | 2,311 | ||||||
HJ Heinz | ||||||||
4.875%, 02/15/2025 (A) | 730 | 791 | ||||||
HRG Group | ||||||||
7.875%, 07/15/2019 | 1,734 | 1,825 | ||||||
7.750%, 01/15/2022 (A) | 1,582 | 1,574 | ||||||
JBS Investments GmbH | ||||||||
7.750%, 10/28/2020 (A) | 1,710 | 1,808 | ||||||
JBS USA | ||||||||
5.875%, 07/15/2024 (A) | 530 | 537 | ||||||
KeHE Distributors | ||||||||
7.625%, 08/15/2021 (A) | 1,900 | 2,016 | ||||||
New Albertsons | ||||||||
8.700%, 05/01/2030 | 360 | 355 | ||||||
8.000%, 05/01/2031 | 7,565 | 7,187 | ||||||
7.750%, 06/15/2026 | 160 | 151 | ||||||
7.450%, 08/01/2029 | 2,105 | 1,926 | ||||||
Pantry | ||||||||
8.375%, 08/01/2020 | 1,325 | 1,504 | ||||||
Pilgrim’s Pride | ||||||||
5.750%, 03/15/2025 (A) | 554 | 566 | ||||||
Post Holdings | ||||||||
7.375%, 02/15/2022 | 1,870 | 1,935 | ||||||
6.000%, 12/15/2022 (A) | 1,409 | 1,360 | ||||||
Rite Aid | ||||||||
7.700%, 02/15/2027 | 2,550 | 2,945 | ||||||
6.125%, 04/01/2023 (A) | 6,572 | 6,736 | ||||||
Spectrum Brands | ||||||||
6.750%, 03/15/2020 | 1,015 | 1,071 | ||||||
6.625%, 11/15/2022 | 1,125 | 1,204 | ||||||
6.375%, 11/15/2020 | 250 | 265 | ||||||
6.125%, 12/15/2024 (A) | 1,786 | 1,907 | ||||||
| SEI Institutional Managed Trust / Semi-Annual Report / March 31, 2015 | 135 |
SCHEDULE OF INVESTMENTS (Unaudited)
High Yield Bond Fund (Continued)
March 31, 2015
| Description | Face Amount ($ Thousands) | Market Value ($ Thousands) | ||||||
Sun Products | ||||||||
7.750%, 03/15/2021 (A) | $ | 730 | $ | 639 | ||||
SUPERVALU | ||||||||
7.750%, 11/15/2022 | 1,790 | 1,906 | ||||||
6.750%, 06/01/2021 | 3,650 | 3,760 | ||||||
Vector Group | ||||||||
7.750%, 02/15/2021 | 2,595 | 2,760 | ||||||
|
| |||||||
| 67,562 | ||||||||
|
| |||||||
Energy — 10.2% | ||||||||
Alpha Natural Resources | ||||||||
6.250%, 06/01/2021 | 600 | 151 | ||||||
6.000%, 06/01/2019 | 1,825 | 511 | ||||||
American Energy-Permian Basin | ||||||||
7.375%, 11/01/2021 (A) | 1,060 | 795 | ||||||
7.125%, 11/01/2020 (A) | 1,335 | 1,018 | ||||||
6.732%, 08/01/2019 (A) (F) | 5,755 | 4,374 | ||||||
American Greetings | ||||||||
7.375%, 12/01/2021 | 555 | 592 | ||||||
Antero Resources | ||||||||
6.000%, 12/01/2020 | 480 | 480 | ||||||
5.125%, 12/01/2022 | 125 | 120 | ||||||
Arch Coal | ||||||||
8.000%, 01/15/2019 (A) | 200 | 96 | ||||||
7.250%, 06/15/2021 | 880 | 202 | ||||||
7.000%, 06/15/2019 | 450 | 106 | ||||||
Atlas Energy Holdings Operating | ||||||||
9.250%, 08/15/2021 | 2,050 | 1,415 | ||||||
7.750%, 01/15/2021 | 1,250 | 850 | ||||||
Atlas Pipeline Partners | ||||||||
6.625%, 10/01/2020 | 1,724 | 1,776 | ||||||
Atwood Oceanics | ||||||||
6.500%, 02/01/2020 | 1,105 | 1,061 | ||||||
Baytex Energy | ||||||||
5.625%, 06/01/2024 (A) | 1,440 | 1,318 | ||||||
5.125%, 06/01/2021 (A) | 35 | 32 | ||||||
Berry Petroleum | ||||||||
6.750%, 11/01/2020 | 1,060 | 861 | ||||||
6.375%, 09/15/2022 | 2,548 | 1,981 | ||||||
Bill Barrett | ||||||||
7.625%, 10/01/2019 | 2,078 | 1,953 | ||||||
Blue Racer Midstream | ||||||||
6.125%, 11/15/2022 (A) | 4,055 | 4,167 | ||||||
BreitBurn Energy Partners | ||||||||
8.625%, 10/15/2020 | 1,145 | 847 | ||||||
7.875%, 04/15/2022 | 600 | 432 | ||||||
California Resources | ||||||||
6.000%, 11/15/2024 (A) | 1,770 | 1,553 | ||||||
5.500%, 09/15/2021 (A) | 1,130 | 1,003 | ||||||
Calumet Specialty Products Partners | ||||||||
7.625%, 01/15/2022 | 1,715 | 1,732 | ||||||
| Description | Face Amount ($ Thousands) | Market Value ($ Thousands) | ||||||
Carrizo Oil & Gas | ||||||||
7.500%, 09/15/2020 | $ | 375 | $ | 385 | ||||
Chaparral Energy | ||||||||
8.250%, 09/01/2021 | 515 | 355 | ||||||
7.625%, 11/15/2022 | 785 | 526 | ||||||
CHC Helicopter | ||||||||
9.375%, 06/01/2021 | 1,549 | 929 | ||||||
9.250%, 10/15/2020 | 225 | 190 | ||||||
Chesapeake Energy | ||||||||
6.875%, 11/15/2020 | 65 | 68 | ||||||
6.625%, 08/15/2020 | 1,290 | 1,332 | ||||||
6.125%, 02/15/2021 | 260 | 263 | ||||||
5.750%, 03/15/2023 | 830 | 809 | ||||||
4.875%, 04/15/2022 | 2,140 | 2,006 | ||||||
Citgo Holding | ||||||||
10.750%, 02/15/2020 (A) | 1,965 | 2,024 | ||||||
Comstock Resources | ||||||||
10.000%, 03/15/2020 (A) | 1,080 | 1,045 | ||||||
Crestwood Midstream Partners | ||||||||
6.250%, 04/01/2023 (A) | 365 | 369 | ||||||
6.000%, 12/15/2020 | 1,700 | 1,709 | ||||||
CSI Compressco | ||||||||
7.250%, 08/15/2022 (A) | 1,075 | 935 | ||||||
Denbury Resources | ||||||||
5.500%, 05/01/2022 | 815 | 731 | ||||||
4.625%, 07/15/2023 | 515 | 442 | ||||||
Endeavor Energy Resources | ||||||||
7.000%, 08/15/2021 (A) | 3,600 | 3,474 | ||||||
Energy Transfer Equity | ||||||||
5.875%, 01/15/2024 | 5,129 | 5,411 | ||||||
EP Energy | ||||||||
9.375%, 05/01/2020 | 1,695 | 1,776 | ||||||
7.750%, 09/01/2022 | 720 | 734 | ||||||
EV Energy Partners | ||||||||
8.000%, 04/15/2019 | 860 | 783 | ||||||
EXCO Resources | ||||||||
8.500%, 04/15/2022 | 915 | 509 | ||||||
Exterran Partners | ||||||||
6.000%, 04/01/2021 | 475 | 437 | ||||||
Genesis Energy | ||||||||
5.750%, 02/15/2021 | 370 | 357 | ||||||
Gibson Energy | ||||||||
6.750%, 07/15/2021 (A) | 3,750 | 3,825 | ||||||
Global Partners | ||||||||
6.250%, 07/15/2022 (A) | 3,275 | 3,226 | ||||||
Halcon Resources | ||||||||
9.750%, 07/15/2020 | 1,640 | 1,156 | ||||||
9.250%, 02/15/2022 | 310 | 214 | ||||||
8.875%, 05/15/2021 | 3,457 | 2,403 | ||||||
Hiland Partners | ||||||||
7.250%, 10/01/2020 (A) | 2,634 | 2,838 | ||||||
5.500%, 05/15/2022 (A) | 490 | 502 | ||||||
IronGate Energy Services | ||||||||
11.000%, 07/01/2018 (A) | 400 | 264 | ||||||
| 136 | SEI Institutional Managed Trust / Semi-Annual Report / March 31, 2015 |
| Description | Face Amount ($ Thousands) | Market Value ($ Thousands) | ||||||
Jupiter Resources | ||||||||
8.500%, 10/01/2022 (A) | $ | 1,195 | $ | 980 | ||||
Kinder Morgan | ||||||||
5.000%, 02/15/2021 (A) | 891 | 952 | ||||||
Laredo Petroleum | ||||||||
7.375%, 05/01/2022 | 1,565 | 1,614 | ||||||
5.625%, 01/15/2022 | 980 | 951 | ||||||
Legacy Reserves | ||||||||
8.000%, 12/01/2020 | 2,040 | 1,673 | ||||||
6.625%, 12/01/2021 | 1,555 | 1,228 | ||||||
Linn Energy | ||||||||
8.625%, 04/15/2020 | 85 | 72 | ||||||
7.750%, 02/01/2021 | 1,735 | 1,379 | ||||||
6.500%, 09/15/2021 | 1,805 | 1,427 | ||||||
6.250%, 11/01/2019 | 3,940 | 3,113 | ||||||
MarkWest Energy Partners | ||||||||
6.500%, 08/15/2021 | 310 | 325 | ||||||
5.500%, 02/15/2023 | 280 | 288 | ||||||
4.875%, 12/01/2024 | 3,450 | 3,527 | ||||||
MEG Energy | ||||||||
7.000%, 03/31/2024 (A) | 1,100 | 1,037 | ||||||
6.500%, 03/15/2021 (A) | 1,016 | 940 | ||||||
6.375%, 01/30/2023 (A) | 840 | 773 | ||||||
Memorial Production Partners | ||||||||
7.625%, 05/01/2021 | 5,503 | 5,008 | ||||||
6.875%, 08/01/2022 (A) | 5,433 | 4,808 | ||||||
Midstates Petroleum | ||||||||
10.750%, 10/01/2020 | 2,648 | 1,430 | ||||||
9.250%, 06/01/2021 | 615 | 298 | ||||||
Milagro Oil & Gas | ||||||||
10.500%, 05/15/2016 (B) | 1,700 | 986 | ||||||
Newfield Exploration | ||||||||
5.375%, 01/01/2026 | 1,340 | 1,354 | ||||||
NGL Energy Partners | ||||||||
6.875%, 10/15/2021 | 1,600 | 1,672 | ||||||
Northern Oil & Gas | ||||||||
8.000%, 06/01/2020 | 1,095 | 972 | ||||||
NuStar Logistics | ||||||||
6.750%, 02/01/2021 | 1,000 | 1,057 | ||||||
Oasis Petroleum | ||||||||
6.875%, 03/15/2022 | 2,160 | 2,106 | ||||||
Ocean Rig UDW | ||||||||
7.250%, 04/01/2019 (A) | 596 | 346 | ||||||
Pacific Drilling | ||||||||
5.375%, 06/01/2020 (A) | 2,635 | 2,108 | ||||||
Parker Drilling | ||||||||
6.750%, 07/15/2022 | 850 | 674 | ||||||
0.000%, 08/01/2020 (B) | 450 | 4 | ||||||
PDC Energy | ||||||||
7.750%, 10/15/2022 | 720 | 756 | ||||||
Peabody Energy | ||||||||
10.000%, 03/15/2022 (A) | 809 | 720 | ||||||
6.500%, 09/15/2020 | 130 | 81 | ||||||
6.250%, 11/15/2021 | 1,525 | 938 | ||||||
| Description | Face Amount ($ Thousands) | Market Value ($ Thousands) | ||||||
Penn Virginia Resource Partners | ||||||||
8.375%, 06/01/2020 | $ | 1,938 | $ | 2,112 | ||||
6.500%, 05/15/2021 | 2,100 | 2,210 | ||||||
Petrobras Global Finance | ||||||||
6.750%, 01/27/2041 | 1,475 | 1,306 | ||||||
Pioneer Energy Services | ||||||||
6.125%, 03/15/2022 | 1,295 | 984 | ||||||
Regency Energy Partners | ||||||||
8.375%, 06/01/2019 (A) | 3,850 | 4,033 | ||||||
5.875%, 03/01/2022 | 3,080 | 3,342 | ||||||
5.750%, 09/01/2020 | 35 | 38 | ||||||
5.500%, 04/15/2023 | 510 | 527 | ||||||
5.000%, 10/01/2022 | 325 | 338 | ||||||
RKI Exploration & Production | ||||||||
8.500%, 08/01/2021 (A) | 520 | 494 | ||||||
Rockies Express Pipeline | ||||||||
6.000%, 01/15/2019 (A) | 180 | 191 | ||||||
5.625%, 04/15/2020 (A) | 5,350 | 5,591 | ||||||
Rose Rock Midstream | ||||||||
5.625%, 07/15/2022 | 4,606 | 4,537 | ||||||
Rosetta Resources | ||||||||
5.875%, 06/01/2022 | 1,050 | 990 | ||||||
RSP Permian | ||||||||
6.625%, 10/01/2022 (A) | 130 | 131 | ||||||
Sabine Pass Liquefaction | ||||||||
6.250%, 03/15/2022 | 2,825 | 2,920 | ||||||
5.750%, 05/15/2024 | 2,655 | 2,668 | ||||||
5.625%, 02/01/2021 | 3,095 | 3,115 | ||||||
5.625%, 04/15/2023 | 6,900 | 6,883 | ||||||
5.625%, 03/01/2025 (A) | 5,818 | 5,753 | ||||||
Sanchez Energy | ||||||||
7.750%, 06/15/2021 | 85 | 82 | ||||||
6.125%, 01/15/2023 | 430 | 386 | ||||||
SandRidge Energy | ||||||||
8.750%, 01/15/2020 | 212 | 138 | ||||||
8.125%, 10/15/2022 | 981 | 602 | ||||||
7.500%, 03/15/2021 | 385 | 239 | ||||||
7.500%, 02/15/2023 | 6,250 | 3,812 | ||||||
Seventy Seven Energy | ||||||||
6.500%, 07/15/2022 | 775 | 353 | ||||||
SM Energy | ||||||||
6.125%, 11/15/2022 (A) | 500 | 497 | ||||||
Targa Resources Partners | ||||||||
5.250%, 05/01/2023 | 730 | 734 | ||||||
4.125%, 11/15/2019 (A) | 165 | 164 | ||||||
Tesoro Logistics | ||||||||
6.250%, 10/15/2022 (A) | 255 | 264 | ||||||
6.125%, 10/15/2021 | 250 | 257 | ||||||
5.875%, 10/01/2020 | 818 | 838 | ||||||
5.500%, 10/15/2019 (A) | 220 | 227 | ||||||
Trinidad Drilling | ||||||||
7.875%, 01/15/2019 (A) | 750 | 697 | ||||||
| SEI Institutional Managed Trust / Semi-Annual Report / March 31, 2015 | 137 |
SCHEDULE OF INVESTMENTS (Unaudited)
High Yield Bond Fund (Continued)
March 31, 2015
| Description | Face Amount ($ Thousands) | Market Value ($ Thousands) | ||||||
Ultra Petroleum | ||||||||
6.125%, 10/01/2024 (A) | $ | 415 | $ | 356 | ||||
5.750%, 12/15/2018 (A) | 1,400 | 1,263 | ||||||
Unit | ||||||||
6.625%, 05/15/2021 | 2,000 | 1,880 | ||||||
Vanguard Natural Resources | ||||||||
7.875%, 04/01/2020 | 420 | 384 | ||||||
Western Refining Logistics | ||||||||
7.500%, 02/15/2023 (A) | 1,135 | 1,158 | ||||||
Whiting Canadian Holding ULC | ||||||||
8.125%, 12/01/2019 | 790 | 828 | ||||||
Whiting Petroleum | ||||||||
6.250%, 04/01/2023 (A) | 425 | 423 | ||||||
5.750%, 03/15/2021 | 1,294 | 1,284 | ||||||
Williams Partners | ||||||||
6.125%, 07/15/2022 | 620 | 657 | ||||||
WPX Energy | ||||||||
5.250%, 09/15/2024 | 225 | 198 | ||||||
YPF | ||||||||
8.750%, 04/04/2024 (A) | 1,335 | 1,365 | ||||||
|
| |||||||
| 184,299 | ||||||||
|
| |||||||
Financials — 7.2% | ||||||||
AAF Holdings PIK | ||||||||
12.000%, 07/01/2019 (A) | 984 | 925 | ||||||
Ally Financial | ||||||||
8.000%, 03/15/2020 | 1,204 | 1,436 | ||||||
8.000%, 11/01/2031 | 1,230 | 1,538 | ||||||
6.250%, 12/01/2017 | 890 | 948 | ||||||
5.125%, 09/30/2024 | 3,323 | 3,427 | ||||||
4.625%, 03/30/2025 | 2,445 | 2,408 | ||||||
4.125%, 03/30/2020 | 1,050 | 1,043 | ||||||
3.500%, 01/27/2019 | 1,845 | 1,822 | ||||||
American Equity Investment Life Holding | ||||||||
6.625%, 07/15/2021 | 1,900 | 2,038 | ||||||
American International Group | ||||||||
8.175%, 05/15/2058 (F) | 1,000 | 1,418 | ||||||
ARC Properties Operating Partnership‡ | ||||||||
3.000%, 02/06/2019 | 3,705 | 3,603 | ||||||
Argos Merger Sub | ||||||||
7.125%, 03/15/2023 (A) | 2,358 | 2,443 | ||||||
A-S - Issuer Subsidiary | ||||||||
7.875%, 12/15/2020 (A) | 3,533 | 3,639 | ||||||
Bank of America | ||||||||
8.000%, 12/29/2049 (F) | 1,365 | 1,459 | ||||||
6.500%, 12/31/2049 (F) | 1,300 | 1,375 | ||||||
5.125%, 12/31/2049 (F) | 1,917 | 1,898 | ||||||
Barclays Bank | ||||||||
7.625%, 11/21/2022 | 1,310 | 1,534 | ||||||
CIT Group | ||||||||
6.625%, 04/01/2018 (A) | 250 | 268 | ||||||
5.500%, 02/15/2019 (A) | 3,115 | 3,240 | ||||||
| Description | Face Amount ($ Thousands) | Market Value ($ Thousands) | ||||||
5.250%, 03/15/2018 | $ | 140 | $ | 145 | ||||
3.875%, 02/19/2019 | 1,070 | 1,059 | ||||||
Citigroup | ||||||||
5.950%, 12/29/2049 (F) | 1,950 | 1,974 | ||||||
City National Bank | ||||||||
9.000%, 08/12/2019 | 3,384 | 4,148 | ||||||
Consolidated Energy Finance | ||||||||
6.750%, 10/15/2019 (A) | 1,348 | 1,358 | ||||||
Corrections Corp of America‡ | ||||||||
4.625%, 05/01/2023 | 885 | 885 | ||||||
4.125%, 04/01/2020 | 945 | 951 | ||||||
Credit Acceptance | ||||||||
7.375%, 03/15/2023 | 3,165 | 3,122 | ||||||
Credit Suisse Group | ||||||||
7.500%, 12/11/2048 | 2,775 | 2,980 | ||||||
CTR Partnership‡ | ||||||||
5.875%, 06/01/2021 | 1,970 | 2,009 | ||||||
CyrusOne | ||||||||
6.375%, 11/15/2022 | 500 | 531 | ||||||
Denali Borrower | ||||||||
5.625%, 10/15/2020 (A) | 805 | 851 | ||||||
E*TRADE Financial | ||||||||
5.375%, 11/15/2022 | 1,250 | 1,319 | ||||||
Genworth Holdings | ||||||||
7.625%, 09/24/2021 | 3,335 | 3,468 | ||||||
6.500%, 06/15/2034 | 230 | 205 | ||||||
GEO Group‡ | ||||||||
5.875%, 01/15/2022 | 1,050 | 1,108 | ||||||
5.875%, 10/15/2024 | 550 | 572 | ||||||
5.125%, 04/01/2023 | 740 | 755 | ||||||
GLP Capital | ||||||||
4.875%, 11/01/2020 | 643 | 659 | ||||||
Harland Clarke Holdings | ||||||||
9.250%, 03/01/2021 (A) | 8,093 | 7,850 | ||||||
HSBC Holdings | ||||||||
6.375%, 12/29/2049 (F) | 1,405 | 1,435 | ||||||
Hub Holdings PIK | ||||||||
8.125%, 07/15/2019 (A) | 650 | 645 | ||||||
HUB International | ||||||||
7.875%, 10/01/2021 (A) | 4,705 | 4,823 | ||||||
Infinity Acquisition | ||||||||
7.250%, 08/01/2022 (A) | 1,105 | 1,033 | ||||||
Iron Mountain‡ | ||||||||
6.000%, 08/15/2023 | 540 | 568 | ||||||
5.750%, 08/15/2024 | 244 | 247 | ||||||
Jefferies Finance | ||||||||
6.875%, 04/15/2022 (A) | 2,645 | 2,460 | ||||||
JPMorgan Chase | ||||||||
7.900%, 04/29/2049 (F) | 1,967 | 2,117 | ||||||
6.750%, 08/29/2049 (F) | 1,570 | 1,703 | ||||||
Kennedy-Wilson | ||||||||
5.875%, 04/01/2024 | 2,920 | 2,927 | ||||||
LBG Capital No.1 MTN | ||||||||
8.000%, 06/15/2020 (F) | 2,000 | 2,175 | ||||||
| 138 | SEI Institutional Managed Trust / Semi-Annual Report / March 31, 2015 |
| Description | Face Amount ($ Thousands) | Market Value ($ Thousands) | ||||||
Lloyds Banking Group | ||||||||
7.500%, 12/01/2099 (F) | $ | 6,690 | $ | 7,108 | ||||
Mattamy Group | ||||||||
6.500%, 11/15/2020 (A) | 1,810 | 1,742 | ||||||
MSCI | ||||||||
5.250%, 11/15/2024 (A) | 1,010 | 1,044 | ||||||
National Life Insurance | ||||||||
10.500%, 09/15/2039 (A) | 990 | 1,605 | ||||||
Nationstar Mortgage | ||||||||
6.500%, 08/01/2018 | 1,350 | 1,357 | ||||||
6.500%, 07/01/2021 | 1,525 | 1,479 | ||||||
NSG Holdings | ||||||||
7.750%, 12/15/2025 (A) | 1,919 | 2,068 | ||||||
Opal Acquisition | ||||||||
8.875%, 12/15/2021 (A) | 5,400 | 5,495 | ||||||
Popular | ||||||||
7.000%, 07/01/2019 | 3,177 | 3,193 | ||||||
Realogy | ||||||||
7.625%, 01/15/2020 (A) | 330 | 355 | ||||||
Realogy Group | ||||||||
5.250%, 12/01/2021 (A) | 185 | 188 | ||||||
RHP Hotel Properties‡ | ||||||||
5.000%, 04/15/2021 | 2,508 | 2,564 | ||||||
Royal Bank of Scotland Group PLC | ||||||||
5.125%, 05/28/2024 | 780 | 818 | ||||||
Standard Chartered PLC | ||||||||
6.500%, 12/29/2049 | 200 | 201 | ||||||
TransUnion PIK | ||||||||
9.625%, 06/15/2018 | 625 | 631 | ||||||
USI | ||||||||
7.750%, 1/15/2021 (A) | 3,630 | 3,721 | ||||||
Walter Investment Management | ||||||||
7.875%, 12/15/2021 | 1,342 | 1,201 | ||||||
Wells Fargo | ||||||||
7.980%, 03/15/2018 (F) | 950 | 1,040 | ||||||
Wilton Re Finance LLC | ||||||||
5.875%, 03/30/2033 (A) (F) | 1,900 | 2,053 | ||||||
XLIT | ||||||||
6.500%, 12/31/2049 (F) | 1,270 | 1,124 | ||||||
|
| |||||||
| 131,531 | ||||||||
|
| |||||||
Health Care — 7.1% | ||||||||
21st Century Oncology | ||||||||
9.875%, 04/15/2017 | 335 | 335 | ||||||
8.875%, 01/15/2017 | 780 | 796 | ||||||
Acadia Healthcare | ||||||||
12.875%, 11/01/2018 | 1,250 | 1,400 | ||||||
5.625%, 02/15/2023 (A) | 1,395 | 1,419 | ||||||
5.125%, 07/01/2022 | 1,600 | 1,602 | ||||||
Alere | ||||||||
6.500%, 06/15/2020 | 215 | 222 | ||||||
Amsurg | ||||||||
5.625%, 11/30/2020 | 700 | 714 | ||||||
5.625%, 07/15/2022 | 500 | 511 | ||||||
| Description | Face Amount ($ Thousands) | Market Value ($ Thousands) | ||||||
Aurora Diagnostics Holdings | ||||||||
10.750%, 01/15/2018 | $ | 4,385 | $ | 3,870 | ||||
Biomet | ||||||||
6.500%, 08/01/2020 | 3,905 | 4,139 | ||||||
CHS | ||||||||
8.000%, 11/15/2019 | 1,075 | 1,142 | ||||||
7.125%, 07/15/2020 | 2,650 | 2,809 | ||||||
6.875%, 02/01/2022 | 4,140 | 4,425 | ||||||
DaVita HealthCare Partners | ||||||||
5.125%, 07/15/2024 | 3,315 | 3,381 | ||||||
DJO Finance | ||||||||
9.875%, 04/15/2018 | 190 | 198 | ||||||
8.750%, 03/15/2018 | 585 | 613 | ||||||
7.750%, 04/15/2018 | 1,225 | 1,243 | ||||||
Endo Finance | ||||||||
6.000%, 02/01/2025 (A) | 1,825 | 1,880 | ||||||
Fresenius Medical Care US Finance II | ||||||||
5.625%, 07/31/2019 (A) | 1,375 | 1,493 | ||||||
4.750%, 10/15/2024 (A) | 800 | 838 | ||||||
4.125%, 10/15/2020 (A) | 2,250 | 2,288 | ||||||
Gates Global | ||||||||
6.000%, 07/15/2022 (A) | 1,235 | 1,165 | ||||||
Grifols Worldwide Operations | ||||||||
5.250%, 04/01/2022 (A) | 3,889 | 3,952 | ||||||
HCA | ||||||||
7.500%, 02/15/2022 | 5,805 | 6,770 | ||||||
6.500%, 02/15/2020 | 910 | 1,025 | ||||||
5.375%, 02/01/2025 | 1,776 | 1,863 | ||||||
5.250%, 04/15/2025 | 570 | 616 | ||||||
5.000%, 03/15/2024 | 863 | 915 | ||||||
HCA Holdings | ||||||||
7.750%, 05/15/2021 | 2,871 | 3,055 | ||||||
HealthSouth | ||||||||
5.750%, 11/01/2024 | 931 | 968 | ||||||
5.125%, 03/15/2023 | 463 | 471 | ||||||
Hologic | ||||||||
6.250%, 08/01/2020 | 3,070 | 3,185 | ||||||
IASIS Healthcare | ||||||||
8.375%, 05/15/2019 | 900 | 936 | ||||||
Immucor | ||||||||
11.125%, 08/15/2019 | 4,400 | 4,724 | ||||||
IMS Health | ||||||||
6.000%, 11/01/2020 (A) | 785 | 817 | ||||||
inVentiv Health | ||||||||
11.000%, 08/15/2018 (A) | 388 | 370 | ||||||
9.000%, 01/15/2018 (A) | 750 | 787 | ||||||
inVentiv Health PIK | ||||||||
10.000%, 08/15/2018 (A) | 569 | 578 | ||||||
Kindred Healthcare | ||||||||
8.750%, 01/15/2023 (A) | 1,315 | 1,440 | ||||||
8.000%, 01/15/2020 (A) | 2,307 | 2,476 | ||||||
6.375%, 04/15/2022 | 4,200 | 4,237 | ||||||
Kinetic Concepts | ||||||||
12.500%, 11/01/2019 | 660 | 721 | ||||||
10.500%, 11/01/2018 | 1,500 | 1,624 | ||||||
| SEI Institutional Managed Trust / Semi-Annual Report / March 31, 2015 | 139 |
SCHEDULE OF INVESTMENTS (Unaudited)
High Yield Bond Fund (Continued)
March 31, 2015
| Description | Face Amount ($ Thousands) | Market Value ($ Thousands) | ||||||
Lantheus Medical Imaging | ||||||||
9.750%, 05/15/2017 | $ | 1,500 | $ | 1,470 | ||||
LifePoint Hospitals | ||||||||
5.500%, 12/01/2021 | 2,940 | 3,080 | ||||||
Mallinckrodt International Finance | ||||||||
5.750%, 08/01/2022 (A) | 1,750 | 1,807 | ||||||
4.750%, 04/15/2023 | 790 | 752 | ||||||
Omnicare | ||||||||
5.000%, 12/01/2024 | 1,765 | 1,844 | ||||||
4.750%, 12/01/2022 | 142 | 147 | ||||||
Par Pharmaceutical | ||||||||
7.375%, 10/15/2020 | 2,605 | 2,748 | ||||||
Salix Pharmaceuticals | ||||||||
6.500%, 01/15/2021 (A) | 699 | 775 | ||||||
Surgical Care Affiliates | ||||||||
6.000%, 04/01/2023 (A) | 667 | 674 | ||||||
Tenet Healthcare | ||||||||
8.125%, 04/01/2022 | 2,505 | 2,762 | ||||||
8.000%, 08/01/2020 | 960 | 1,008 | ||||||
6.750%, 02/01/2020 | 2,426 | 2,559 | ||||||
6.000%, 10/01/2020 | 990 | 1,049 | ||||||
5.500%, 03/01/2019 (A) | 1,323 | 1,333 | ||||||
5.000%, 03/01/2019 (A) | 955 | 948 | ||||||
4.750%, 06/01/2020 | 760 | 770 | ||||||
4.500%, 04/01/2021 | 240 | 235 | ||||||
Trinseo Materials Operating SCA | ||||||||
8.750%, 02/01/2019 | 869 | 917 | ||||||
Truven Health Analytics | ||||||||
10.625%, 06/01/2020 | 1,591 | 1,670 | ||||||
United Surgical Partners International | ||||||||
9.000%, 04/01/2020 | 1,230 | 1,321 | ||||||
Valeant Pharmaceuticals International | ||||||||
7.250%, 07/15/2022 (A) | 1,033 | 1,092 | ||||||
7.000%, 10/01/2020 (A) | 2,805 | 2,928 | ||||||
6.750%, 08/15/2021 (A) | 905 | 946 | ||||||
5.500%, 03/01/2023 (A) | 3,323 | 3,348 | ||||||
Valeant Pharmaceuticals International Escrow | ||||||||
7.500%, 07/15/2021 (A) | 3,095 | 3,347 | ||||||
VRX Escrow | ||||||||
6.125%, 04/15/2025 (A) | 4,636 | 4,798 | ||||||
5.875%, 05/15/2023 (A) | 4,826 | 4,947 | ||||||
5.375%, 03/15/2020 (A) | 1,821 | 1,837 | ||||||
|
| |||||||
| 129,125 | ||||||||
|
| |||||||
Industrials — 8.3% | ||||||||
ACCO Brands | ||||||||
6.750%, 04/30/2020 | 1,160 | 1,215 | ||||||
Accudyne Industries Borrower | ||||||||
7.750%, 12/15/2020 (A) | 1,025 | 915 | ||||||
| Description | Face Amount ($ Thousands) | Market Value ($ Thousands) | ||||||
Actuant | ||||||||
5.625%, 06/15/2022 | $ | 3,000 | $ | 3,109 | ||||
ADT | ||||||||
6.250%, 10/15/2021 | 1,635 | 1,741 | ||||||
3.500%, 07/15/2022 | 915 | 833 | ||||||
AECOM | ||||||||
5.875%, 10/15/2024 (A) | 805 | 845 | ||||||
5.750%, 10/15/2022 (A) | 660 | 683 | ||||||
AerCap Ireland Capital | ||||||||
4.500%, 05/15/2021 (A) | 2,637 | 2,726 | ||||||
3.750%, 05/15/2019 (A) | 145 | 146 | ||||||
Air Medical Group Holdings | ||||||||
9.250%, 11/01/2018 | 2,666 | 2,803 | ||||||
Aircastle | ||||||||
7.625%, 04/15/2020 | 1,360 | 1,564 | ||||||
Algeco Scotsman Global Finance | ||||||||
10.750%, 10/15/2019 (A) | 1,420 | 1,164 | ||||||
8.500%, 10/15/2018 (A) | 1,670 | 1,655 | ||||||
Allegiant Travel | ||||||||
5.500%, 07/15/2019 | 190 | 195 | ||||||
Allegion US Holding | ||||||||
5.750%, 10/01/2021 | 1,031 | 1,077 | ||||||
Allison Transmission | ||||||||
7.125%, 05/15/2019 (A) | 1,905 | 1,985 | ||||||
Alphabet Holding PIK | ||||||||
7.750%, 11/01/2017 | 3,520 | 3,450 | ||||||
American Builders & Contractors Supply | ||||||||
5.625%, 04/15/2021 (A) | 1,340 | 1,357 | ||||||
American Tire Distributors | ||||||||
10.250%, 03/01/2022 (A) | 585 | 608 | ||||||
Amsted Industries | ||||||||
5.000%, 03/15/2022 (A) | 950 | 956 | ||||||
APX Group | ||||||||
8.750%, 12/01/2020 | 6,680 | 6,162 | ||||||
6.375%, 12/01/2019 | 2,322 | 2,310 | ||||||
Avis Budget Car Rental | ||||||||
5.500%, 04/01/2023 | 960 | 988 | ||||||
5.250%, 03/15/2025 (A) | 1,470 | 1,463 | ||||||
5.125%, 06/01/2022 (A) | 60 | 61 | ||||||
BlueLine Rental Finance | ||||||||
7.000%, 02/01/2019 (A) | 360 | 371 | ||||||
Boart Longyear Management Properties | ||||||||
10.000%, 10/01/2018 (A) | 2,000 | 2,035 | ||||||
7.000%, 04/01/2021 (A) | 4,090 | 2,653 | ||||||
Bombardier | ||||||||
7.500%, 03/15/2025 (A) | 1,195 | 1,179 | ||||||
6.000%, 10/15/2022 (A) | 3,200 | 3,004 | ||||||
5.750%, 03/15/2022 (A) | 825 | 778 | ||||||
Briggs & Stratton | ||||||||
6.875%, 12/15/2020 | 1,500 | 1,643 | ||||||
Builders FirstSource | ||||||||
7.625%, 06/01/2021 (A) | 1,218 | 1,227 | ||||||
| 140 | SEI Institutional Managed Trust / Semi-Annual Report / March 31, 2015 |
| Description | Face Amount ($ Thousands) | Market Value ($ Thousands) | ||||||
Building Materials Corp of America | ||||||||
6.750%, 05/01/2021 (A) | $ | 620 | $ | 659 | ||||
CDW | ||||||||
5.500%, 12/01/2024 | 615 | 644 | ||||||
5.000%, 09/01/2023 | 2,450 | 2,487 | ||||||
Cenveo | ||||||||
11.500%, 05/15/2017 | 2,040 | 2,040 | ||||||
6.000%, 08/01/2019 (A) | 3,945 | 3,698 | ||||||
Ceridian HCM Holding | ||||||||
11.000%, 03/15/2021 (A) | 1,300 | 1,346 | ||||||
CEVA Group PLC | ||||||||
7.000%, 03/01/2021 (A) | 1,235 | 1,198 | ||||||
Clean Harbors | ||||||||
5.250%, 08/01/2020 | 4,095 | 4,187 | ||||||
CNH Industrial Capital | ||||||||
3.625%, 04/15/2018 | 815 | 817 | ||||||
Covanta Holding | ||||||||
5.875%, 03/01/2024 | 1,560 | 1,615 | ||||||
CPG Merger | ||||||||
8.000%, 10/01/2021 (A) | 955 | 967 | ||||||
DigitalGlobe | ||||||||
5.250%, 02/01/2021 (A) | 4,375 | 4,375 | ||||||
EnPro Industries | ||||||||
5.875%, 09/15/2022 (A) | 222 | 231 | ||||||
Esterline Technologies | ||||||||
7.000%, 08/01/2020 | 300 | 313 | ||||||
FGI Operating | ||||||||
7.875%, 05/01/2020 | 930 | 793 | ||||||
Gardner Denver | ||||||||
6.875%, 08/15/2021 (A) | 1,537 | 1,383 | ||||||
GenCorp | ||||||||
7.125%, 03/15/2021 | 1,160 | 1,241 | ||||||
General Cable | ||||||||
5.750%, 10/01/2022 | 865 | 804 | ||||||
Global A&T Electronics | ||||||||
10.000%, 02/01/2019 (A) | 400 | 391 | ||||||
Great Lakes Dredge & Dock | ||||||||
7.375%, 02/01/2019 | 1,087 | 1,114 | ||||||
H&E Equipment Services | ||||||||
7.000%, 09/01/2022 | 505 | 520 | ||||||
Hardwoods Acquisition | ||||||||
7.500%, 08/01/2021 (A) | 605 | 578 | ||||||
HD Supply | ||||||||
11.500%, 07/15/2020 | 2,000 | 2,312 | ||||||
7.500%, 07/15/2020 | 1,567 | 1,677 | ||||||
5.250%, 12/15/2021 (A) | 822 | 847 | ||||||
Hertz | ||||||||
7.375%, 01/15/2021 | 320 | 336 | ||||||
6.250%, 10/15/2022 | 1,170 | 1,208 | ||||||
5.875%, 10/15/2020 | 670 | 688 | ||||||
Icahn Enterprises | ||||||||
5.875%, 02/01/2022 | 1,615 | 1,663 | ||||||
4.875%, 03/15/2019 | 1,632 | 1,663 | ||||||
| Description | Face Amount ($ Thousands) | Market Value ($ Thousands) | ||||||
Interline Brands PIK | ||||||||
10.000%, 11/15/2018 | $ | 219 | $ | 230 | ||||
International Lease Finance | ||||||||
6.250%, 05/15/2019 | 840 | 918 | ||||||
5.875%, 04/01/2019 | 1,960 | 2,127 | ||||||
4.625%, 04/15/2021 | 35 | 36 | ||||||
Jack Cooper Holdings | ||||||||
9.250%, 06/01/2020 (A) | 740 | 764 | ||||||
James Hardie International Finance | ||||||||
5.875%, 02/15/2023 (A) | 1,365 | 1,406 | ||||||
JCH Parent PIK | ||||||||
10.500%, 03/15/2019 (A) | 378 | 340 | ||||||
KLX | ||||||||
5.875%, 12/01/2022 (A) | 1,820 | 1,815 | ||||||
Kratos Defense & Security Solutions | ||||||||
7.000%, 05/15/2019 | 820 | 715 | ||||||
Manitowoc | ||||||||
8.500%, 11/01/2020 | 910 | 974 | ||||||
Marquette Transportation | ||||||||
10.875%, 01/15/2017 | 1,292 | 1,332 | ||||||
Masonite International | ||||||||
5.625%, 03/15/2023 (A) | 475 | 487 | ||||||
Meritor | ||||||||
6.750%, 06/15/2021 | 1,015 | 1,051 | ||||||
6.250%, 02/15/2024 | 340 | 343 | ||||||
Milacron | ||||||||
7.750%, 02/15/2021 (A) | 1,375 | 1,423 | ||||||
Navios South American Logistics | ||||||||
7.250%, 05/01/2022 (A) | 1,405 | 1,363 | ||||||
NCI Building Systems | ||||||||
8.250%, 01/15/2023 (A) | 615 | 650 | ||||||
Nielsen Finance | ||||||||
5.000%, 04/15/2022 (A) | 5,508 | 5,542 | ||||||
4.500%, 10/01/2020 | 1,290 | 1,313 | ||||||
Nielsen Luxembourg | ||||||||
5.500%, 10/01/2021 (A) | 475 | 490 | ||||||
Nortek | ||||||||
8.500%, 04/15/2021 | 1,700 | 1,819 | ||||||
Orbital ATK | ||||||||
5.250%, 10/01/2021 (A) | 475 | 482 | ||||||
Oshkosh | ||||||||
5.375%, 03/01/2022 | 75 | 78 | ||||||
5.375%, 03/01/2025 (A) | 170 | 175 | ||||||
RSC Equipment Rental | ||||||||
8.250%, 02/01/2021 | 1,735 | 1,874 | ||||||
Sensata Technologies | ||||||||
5.625%, 11/01/2024 (A) | 395 | 421 | ||||||
5.000%, 10/01/2025 (A) | 1,669 | 1,692 | ||||||
4.875%, 10/15/2023 (A) | 1,600 | 1,644 | ||||||
Syncreon Group BV | ||||||||
8.625%, 11/01/2021 (A) | 1,700 | 1,453 | ||||||
| SEI Institutional Managed Trust / Semi-Annual Report / March 31, 2015 | 141 |
SCHEDULE OF INVESTMENTS (Unaudited)
High Yield Bond Fund (Continued)
March 31, 2015
| Description | Face Amount ($ Thousands) | Market Value ($ Thousands) | ||||||
Tempel Steel | ||||||||
12.000%, 08/15/2016 (A) | $ | 860 | $ | 729 | ||||
Terex | ||||||||
6.500%, 04/01/2020 | 115 | 120 | ||||||
6.000%, 05/15/2021 | 3,450 | 3,536 | ||||||
TransDigm | ||||||||
6.500%, 07/15/2024 | 3,420 | 3,437 | ||||||
6.000%, 07/15/2022 | 1,400 | 1,400 | ||||||
Triumph Group | ||||||||
4.875%, 04/01/2021 | 860 | 841 | ||||||
Unifrax I | ||||||||
7.500%, 02/15/2019 (A) | 600 | 603 | ||||||
United Air Lines, Ser 95A1 | ||||||||
9.020%, 04/19/2012 (B) | 235 | — | ||||||
3.000%, 10/19/2018 | 369 | 1 | ||||||
United Airlines Pass-Through Trust, Ser 2013-1, Cl B | ||||||||
5.375%, 08/15/2021 | 1,434 | 1,495 | ||||||
United Rentals North America | ||||||||
7.625%, 04/15/2022 | 325 | 356 | ||||||
7.375%, 05/15/2020 | 525 | 567 | ||||||
5.750%, 11/15/2024 | 1,315 | 1,358 | ||||||
5.500%, 07/15/2025 | 1,245 | 1,268 | ||||||
USG | ||||||||
5.500%, 03/01/2025 (A) | 2,005 | 2,045 | ||||||
Watco | ||||||||
6.375%, 04/01/2023 (A) | 2,260 | 2,260 | ||||||
West | ||||||||
5.375%, 07/15/2022 (A) | 1,600 | 1,564 | ||||||
Wise Metals Group | ||||||||
8.750%, 12/15/2018 (A) | 625 | 667 | ||||||
Wise Metals Intermediate Holdings | ||||||||
9.750%, 06/15/2019 (A) | 420 | 454 | ||||||
|
| |||||||
| 150,354 | ||||||||
|
| |||||||
Information Technology — 6.8% |
| |||||||
ACI Worldwide | ||||||||
6.375%, 08/15/2020 (A) | 525 | 549 | ||||||
Activision Blizzard | ||||||||
5.625%, 09/15/2021 (A) | 6,200 | 6,603 | ||||||
Advanced Micro Devices | ||||||||
7.500%, 08/15/2022 | 2,115 | 2,025 | ||||||
7.000%, 07/01/2024 | 1,900 | 1,639 | ||||||
Alcatel-Lucent USA | ||||||||
8.875%, 01/01/2020 (A) | 1,550 | 1,690 | ||||||
6.750%, 11/15/2020 (A) | 155 | 165 | ||||||
Amkor Technology | ||||||||
6.625%, 06/01/2021 | 401 | 417 | ||||||
6.375%, 10/01/2022 | 1,985 | 2,045 | ||||||
Aspect Software | ||||||||
10.625%, 05/15/2017 | 785 | 683 | ||||||
Audatex North America | ||||||||
6.125%, 11/01/2023 (A) | 4,510 | 4,769 | ||||||
6.000%, 06/15/2021 (A) | 1,480 | 1,565 | ||||||
| Description | Face Amount ($ Thousands) | Market Value ($ Thousands) | ||||||
Avaya | ||||||||
10.500%, 03/01/2021 (A) | $ | 1,631 | $ | 1,386 | ||||
9.000%, 04/01/2019 (A) | 2,220 | 2,276 | ||||||
7.000%, 04/01/2019 (A) | 1,140 | 1,131 | ||||||
Bankrate | ||||||||
6.125%, 08/15/2018 (A) | 1,996 | 1,971 | ||||||
Belden | ||||||||
5.500%, 09/01/2022 (A) | 845 | 866 | ||||||
Blackboard | ||||||||
7.750%, 11/15/2019 (A) | 800 | 768 | ||||||
BMC Software Finance | ||||||||
8.125%, 07/15/2021 (A) | 6,645 | 6,080 | ||||||
Cimpress | ||||||||
7.000%, 04/01/2022 (A) | 237 | 240 | ||||||
CommScope | ||||||||
5.500%, 06/15/2024 (A) | 3,575 | 3,575 | ||||||
CommScope PIK | ||||||||
6.625%, 06/01/2020 (A) | 1,810 | 1,855 | ||||||
Eagle Midco | ||||||||
9.000%, 06/15/2018 (A) | 2,985 | 3,041 | ||||||
EarthLink Holdings | ||||||||
7.375%, 06/01/2020 | 1,950 | 1,999 | ||||||
Entegris | ||||||||
6.000%, 04/01/2022 (A) | 795 | 829 | ||||||
Epicor Software | ||||||||
8.625%, 05/01/2019 | 1,030 | 1,076 | ||||||
Equinix | ||||||||
5.750%, 01/01/2025 | 1,988 | 2,072 | ||||||
5.375%, 01/01/2022 | 859 | 896 | ||||||
4.875%, 04/01/2020 | 2,175 | 2,246 | ||||||
First Data | ||||||||
12.625%, 01/15/2021 | 1,104 | 1,308 | ||||||
11.750%, 08/15/2021 | 1,917 | 2,216 | ||||||
11.250%, 01/15/2021 | 758 | 862 | ||||||
8.875%, 08/15/2020 (A) | 1,470 | 1,566 | ||||||
8.250%, 01/15/2021 (A) | 410 | 439 | ||||||
7.375%, 06/15/2019 (A) | 3,000 | 3,135 | ||||||
6.750%, 11/01/2020 (A) | 1,411 | 1,503 | ||||||
First Data PIK | ||||||||
8.750%, 01/15/2022 (A) | 6,510 | 7,006 | ||||||
Hughes Satellite Systems | ||||||||
7.625%, 06/15/2021 | 3,255 | 3,580 | ||||||
Infor Software Parent | ||||||||
7.125%, 05/01/2021 (A) | 2,820 | 2,793 | ||||||
Infor US | ||||||||
9.375%, 4/1/2019 | 3,760 | 4,032 | ||||||
6.500%, 05/15/2022 (A) | 2,826 | 2,897 | ||||||
Magnachip Semiconductor | ||||||||
6.625%, 07/15/2021 | 915 | 641 | ||||||
Micron Technology | ||||||||
5.875%, 02/15/2022 | 2,260 | 2,385 | ||||||
5.500%, 02/01/2025 (A) | 3,480 | 3,506 | ||||||
5.250%, 08/01/2023 (A) | 255 | 259 | ||||||
NCR | ||||||||
6.375%, 12/15/2023 | 900 | 959 | ||||||
| 142 | SEI Institutional Managed Trust / Semi-Annual Report / March 31, 2015 |
| Description | Face Amount ($ Thousands) | Market Value ($ Thousands) | ||||||
5.875%, 12/15/2021 | $ | 900 | $ | 938 | ||||
5.000%, 07/15/2022 | 1,675 | 1,692 | ||||||
NeuStar | ||||||||
4.500%, 01/15/2023 | 1,985 | 1,697 | ||||||
NXP Funding | ||||||||
5.750%, 02/15/2021 (A) | 3,230 | 3,416 | ||||||
5.750%, 03/15/2023 (A) | 435 | 462 | ||||||
Open Text | ||||||||
5.625%, 01/15/2023 (A) | 675 | 700 | ||||||
Project Homestake Merger | ||||||||
8.875%, 03/01/2023 (A) | 755 | 757 | ||||||
Sabre | ||||||||
8.500%, 05/15/2019 (A) | 1,131 | 1,208 | ||||||
SPCM | ||||||||
6.000%, 01/15/2022 (A) | 1,311 | 1,357 | ||||||
STATS ChipPAC | ||||||||
4.500%, 03/20/2018 (A) | 2,206 | 2,195 | ||||||
Sungard Availability Services Capital | ||||||||
8.750%, 04/01/2022 (A) | 940 | 590 | ||||||
SunGard Data Systems | ||||||||
7.625%, 11/15/2020 | 360 | 381 | ||||||
6.625%, 11/01/2019 | 515 | 530 | ||||||
VeriSign | ||||||||
4.625%, 05/01/2023 | 900 | 898 | ||||||
Viasystems | ||||||||
7.875%, 05/01/2019 (A) | 555 | 584 | ||||||
WEX | ||||||||
4.750%, 02/01/2023 (A) | 2,825 | 2,804 | ||||||
Zayo Group | ||||||||
8.125%, 01/01/2020 | 1,232 | 1,303 | ||||||
6.000%, 04/01/2023 (A) | 6,252 | 6,283 | ||||||
Zebra Technologies | ||||||||
7.250%, 10/15/2022 (A) | 1,085 | 1,169 | ||||||
|
| |||||||
| 122,508 | ||||||||
|
| |||||||
Materials — 5.5% | ||||||||
AK Steel | ||||||||
7.625%, 05/15/2020 | 1,065 | 916 | ||||||
7.625%, 10/01/2021 | 350 | 284 | ||||||
ArcelorMittal | ||||||||
6.250%, 03/01/2021 | 375 | 398 | ||||||
Ardagh Finance Holdings | ||||||||
8.625%, 06/15/2019 (A) | 1,354 | 1,411 | ||||||
Ardagh Packaging Finance | ||||||||
9.125%, 10/15/2020 (A) | 2,260 | 2,418 | ||||||
7.000%, 11/15/2020 (A) | 77 | 77 | ||||||
6.000%, 06/30/2021 (A) | 1,576 | 1,548 | ||||||
3.271%, 12/15/2019 (A) (F) | 695 | 678 | ||||||
Ashland | ||||||||
4.750%, 08/15/2022 | 1,435 | 1,457 | ||||||
Axalta Coating Systems US Holdings | ||||||||
7.375%, 05/01/2021 (A) | 365 | 392 | ||||||
Ball | ||||||||
5.000%, 03/15/2022 | 1,150 | 1,202 | ||||||
| Description | Face Amount ($ Thousands) | Market Value ($ Thousands) | ||||||
BWAY Holding | ||||||||
9.125%, 08/15/2021 (A) | $ | 1,960 | $ | 2,038 | ||||
Cemex | ||||||||
7.250%, 01/15/2021 (A) | 660 | 705 | ||||||
Cliffs Natural Resources | ||||||||
5.950%, 01/15/2018 | 450 | 349 | ||||||
Consolidated Container | ||||||||
10.125%, 07/15/2020 (A) | 1,285 | 1,118 | ||||||
Constellium | ||||||||
5.750%, 05/15/2024 (A) | 250 | 236 | ||||||
Cornerstone Chemical | ||||||||
9.375%, 03/15/2018 (A) | 6,638 | 6,870 | ||||||
Evolution Escrow Issuer | ||||||||
7.500%, 03/15/2022 (A) | 860 | 869 | ||||||
First Quantum Minerals | ||||||||
7.250%, 05/15/2022 (A) | 760 | 701 | ||||||
7.000%, 02/15/2021 (A) | 736 | 679 | ||||||
FMG Resources | ||||||||
8.250%, 11/01/2019 (A) | 1,507 | 1,296 | ||||||
6.875%, 04/01/2022 (A) | 546 | 403 | ||||||
Graphic Packaging International | ||||||||
4.750%, 04/15/2021 | 1,154 | 1,200 | ||||||
Hecla Mining | ||||||||
6.875%, 05/01/2021 | 1,750 | 1,549 | ||||||
Hexion US Finance | ||||||||
8.875%, 02/01/2018 | 635 | 560 | ||||||
6.625%, 04/15/2020 | 4,900 | 4,483 | ||||||
Huntsman International | ||||||||
8.625%, 03/15/2021 | 135 | 144 | ||||||
4.875%, 11/15/2020 | 925 | 925 | ||||||
IAMGOLD | ||||||||
6.750%, 10/01/2020 (A) | 6,220 | 5,147 | ||||||
Ineos Finance | ||||||||
8.375%, 02/15/2019 (A) | 1,180 | 1,255 | ||||||
7.500%, 05/01/2020 (A) | 1,005 | 1,060 | ||||||
INEOS Group Holdings | ||||||||
6.125%, 08/15/2018 (A) | 595 | 598 | ||||||
5.875%, 02/15/2019 (A) | 985 | 974 | ||||||
Kaiser Aluminum | ||||||||
8.250%, 06/01/2020 | 1,650 | 1,798 | ||||||
KGHM International | ||||||||
7.750%, 06/15/2019 (A) | 1,190 | 1,226 | ||||||
Kissner Milling | ||||||||
7.250%, 06/01/2019 (A) | 590 | 609 | ||||||
LSB Industries | ||||||||
7.750%, 08/01/2019 | 1,620 | 1,689 | ||||||
Lundin Mining | ||||||||
7.875%, 11/01/2022 (A) | 1,205 | 1,256 | ||||||
Mirabela Nickel | ||||||||
9.500%, 06/24/2019 (A) (D) | 1,280 | 1,280 | ||||||
8.750%, 04/15/2018 (A) (B) | 2,420 | 363 | ||||||
Momentive Performance (Escrow) | ||||||||
8.875%, 10/15/2020 (B) | 75 | — | ||||||
| SEI Institutional Managed Trust / Semi-Annual Report / March 31, 2015 | 143 |
SCHEDULE OF INVESTMENTS (Unaudited)
High Yield Bond Fund (Continued)
March 31, 2015
| Description | Face Amount ($ Thousands) | Market Value ($ Thousands) | ||||||
Momentive Performance Materials | ||||||||
3.880%, 10/24/2021 | $ | 75 | $ | 66 | ||||
New Gold | ||||||||
7.000%, 04/15/2020 (A) | 600 | 617 | ||||||
6.250%, 11/15/2022 (A) | 937 | 928 | ||||||
Nexeo Solutions | ||||||||
8.375%, 03/01/2018 | 750 | 669 | ||||||
Noranda Aluminum Acquisition | ||||||||
11.000%, 06/01/2019 | 355 | 344 | ||||||
NOVA Chemicals | ||||||||
5.000%, 05/01/2025 (A) | 1,985 | 2,074 | ||||||
Plastipak Holdings | ||||||||
6.500%, 10/01/2021 (A) | 1,335 | 1,358 | ||||||
Platform Specialty Products | ||||||||
6.500%, 02/01/2022 | 3,910 | 4,086 | ||||||
Rain CII Carbon | ||||||||
8.250%, 01/15/2021 (A) | 5,275 | 4,919 | ||||||
8.000%, 12/01/2018 (A) | 270 | 257 | ||||||
Rayonier AM Products | ||||||||
5.500%, 06/01/2024 (A) | 1,205 | 1,033 | ||||||
Reichhold Industries | ||||||||
15.000%, 03/13/2017 | 420 | 395 | ||||||
0.619%, 10/06/2034 (G) | 705 | 670 | ||||||
0.310%, 10/06/2034 (G) | 290 | 276 | ||||||
Reichhold Industries PIK | ||||||||
9.000%, 05/08/2017 (A) (B) | 1,458 | 583 | ||||||
Rentech Nitrogen Partners | ||||||||
6.500%, 04/15/2021 (A) | 340 | 330 | ||||||
Reynolds Group | ||||||||
9.875%, 08/15/2019 | 1,160 | 1,241 | ||||||
9.000%, 04/15/2019 | 1,086 | 1,138 | ||||||
8.250%, 02/15/2021 | 3,389 | 3,626 | ||||||
6.875%, 02/15/2021 | 2,280 | 2,400 | ||||||
5.750%, 10/15/2020 | 4,045 | 4,182 | ||||||
Ryerson | ||||||||
11.250%, 10/15/2018 | 330 | 335 | ||||||
9.000%, 10/15/2017 | 935 | 944 | ||||||
Sappi Papier Holdings | ||||||||
7.750%, 07/15/2017 (A) | 300 | 326 | ||||||
Scotts Miracle-Gro | ||||||||
6.625%, 12/15/2020 | 290 | 306 | ||||||
Sealed Air | ||||||||
4.875%, 12/01/2022 (A) | 332 | 339 | ||||||
Signode Industrial Group | ||||||||
6.375%, 05/01/2022 (A) | 5,275 | 5,242 | ||||||
Smurfit Kappa Acquisitions | ||||||||
4.875%, 09/15/2018 (A) | 1,400 | 1,467 | ||||||
Steel Dynamics | ||||||||
5.500%, 10/01/2024 (A) | 755 | 765 | ||||||
TPC Group | ||||||||
8.750%, 12/15/2020 (A) | 2,985 | 2,731 | ||||||
Tupy Overseas | ||||||||
6.625%, 07/17/2024 (A) | 365 | 350 | ||||||
| Description | Face Amount ($ Thousands) | Market Value ($ Thousands) | ||||||
Walter Energy | ||||||||
9.875%, 12/15/2020 | $ | 3,745 | $ | 225 | ||||
8.500%, 04/15/2021 | 1,455 | 87 | ||||||
WR Grace & Conn | ||||||||
5.625%, 10/01/2024 (A) | 570 | 608 | ||||||
5.125%, 10/01/2021 (A) | 1,712 | 1,776 | ||||||
|
| |||||||
| 98,854 | ||||||||
|
| |||||||
Telecommunication Services — 7.4% |
| |||||||
Altice | ||||||||
7.750%, 05/15/2022 (A) | 7,005 | 7,123 | ||||||
7.625%, 02/15/2025 (A) | 915 | 919 | ||||||
Altice Financing | ||||||||
6.625%, 02/15/2023 (A) | 4,615 | 4,753 | ||||||
6.500%, 01/15/2022 (A) | 930 | 954 | ||||||
CenturyLink | ||||||||
6.750%, 12/01/2023 | 3,195 | 3,519 | ||||||
5.800%, 03/15/2022 | 1,360 | 1,416 | ||||||
5.625%, 04/01/2020 | 1,460 | 1,533 | ||||||
5.625%, 04/01/2025 (A) | 120 | 120 | ||||||
Cincinnati Bell | ||||||||
8.750%, 03/15/2018 | 1,519 | 1,557 | ||||||
Cogent Communications Finance | ||||||||
5.625%, 04/15/2021 (A) | 2,100 | 2,058 | ||||||
Cogent Communications Group | ||||||||
5.375%, 03/01/2022 (A) | 1,927 | 1,922 | ||||||
Digicel Group | ||||||||
8.250%, 09/30/2020 (A) | 5,055 | 5,063 | ||||||
7.125%, 04/01/2022 (A) | 725 | 663 | ||||||
6.750%, 03/01/2023 (A) | 1,440 | 1,395 | ||||||
Frontier Communications | ||||||||
7.625%, 04/15/2024 | 1,005 | 1,046 | ||||||
7.125%, 01/15/2023 | 950 | 971 | ||||||
6.875%, 01/15/2025 | 315 | 312 | ||||||
6.250%, 09/15/2021 | 160 | 160 | ||||||
GCI | ||||||||
6.750%, 06/01/2021 | 650 | 658 | ||||||
Gray Television | ||||||||
7.500%, 10/01/2020 | 1,865 | 1,963 | ||||||
Intelsat Jackson Holdings | ||||||||
7.500%, 04/01/2021 | 1,180 | 1,214 | ||||||
7.250%, 10/15/2020 | 2,810 | 2,894 | ||||||
6.625%, 12/15/2022 | 380 | 367 | ||||||
5.500%, 08/01/2023 | 3,517 | 3,319 | ||||||
Intelsat Luxembourg | ||||||||
8.125%, 06/01/2023 | 3,580 | 3,294 | ||||||
7.750%, 06/01/2021 | 3,570 | 3,293 | ||||||
Level 3 Communications | ||||||||
5.750%, 12/01/2022 | 1,650 | 1,694 | ||||||
Level 3 Financing | ||||||||
8.625%, 07/15/2020 | 710 | 769 | ||||||
8.125%, 07/01/2019 | 300 | 315 | ||||||
7.000%, 06/01/2020 | 970 | 1,047 | ||||||
6.125%, 01/15/2021 | 500 | 524 | ||||||
| 144 | SEI Institutional Managed Trust / Semi-Annual Report / March 31, 2015 |
| Description | Face Amount ($ Thousands) | Market Value ($ Thousands) | ||||||
5.625%, 02/01/2023 (A) | $ | 345 | $ | 355 | ||||
5.375%, 08/15/2022 | 995 | 1,024 | ||||||
Lynx I | ||||||||
5.375%, 04/15/2021 (A) | 3,485 | 3,655 | ||||||
Lynx II | ||||||||
6.375%, 04/15/2023 (A) | 1,445 | 1,539 | ||||||
NII Capital | ||||||||
7.625%, 04/01/2021 (B) | 82 | 25 | ||||||
NII International Telecom | ||||||||
7.875%, 08/15/2019 (A) (B) | 1,350 | 1,252 | ||||||
Qwest Capital Funding | ||||||||
7.750%, 02/15/2031 | 550 | 578 | ||||||
Sable International Finance | ||||||||
8.750%, 02/01/2020 (A) | 68 | 73 | ||||||
SBA Communications | ||||||||
4.875%, 07/15/2022 (A) | 1,600 | 1,567 | ||||||
SBA Telecommunications | ||||||||
5.750%, 07/15/2020 | 675 | 710 | ||||||
SoftBank | ||||||||
4.500%, 04/15/2020 (A) | 1,351 | 1,380 | ||||||
Sprint | ||||||||
7.875%, 09/15/2023 | 10,130 | 10,333 | ||||||
7.625%, 02/15/2025 | 2,427 | 2,415 | ||||||
7.250%, 09/15/2021 | 1,280 | 1,286 | ||||||
7.125%, 06/15/2024 | 4,380 | 4,271 | ||||||
Sprint Capital | ||||||||
8.750%, 03/15/2032 | 3,195 | 3,299 | ||||||
6.900%, 05/01/2019 | 3,250 | 3,360 | ||||||
6.875%, 11/15/2028 | 5,364 | 4,922 | ||||||
Telecom Italia | ||||||||
5.303%, 05/30/2024 (A) | 860 | 901 | ||||||
T-Mobile USA | ||||||||
6.731%, 04/28/2022 | 2,020 | 2,126 | ||||||
6.633%, 04/28/2021 | 330 | 346 | ||||||
6.625%, 04/01/2023 | 2,000 | 2,093 | ||||||
6.542%, 04/28/2020 | 875 | 921 | ||||||
6.375%, 03/01/2025 | 6,595 | 6,805 | ||||||
6.125%, 01/15/2022 | 435 | 449 | ||||||
6.000%, 03/01/2023 | 455 | 466 | ||||||
United States Cellular | ||||||||
6.700%, 12/15/2033 | 385 | 370 | ||||||
UPCB Finance III | ||||||||
6.625%, 07/01/2020 (A) | 850 | 887 | ||||||
UPCB Finance IV | ||||||||
5.375%, 01/15/2025 (A) | 1,985 | 1,985 | ||||||
UPCB Finance V | ||||||||
7.250%, 11/15/2021 (A) | 2,440 | 2,626 | ||||||
UPCB Finance VI | ||||||||
6.875%, 01/15/2022 (A) | 643 | 686 | ||||||
Virgin Media Finance | ||||||||
5.750%, 01/15/2025 (A) | 397 | 412 | ||||||
Virgin Media Secured Finance PLC | ||||||||
5.250%, 01/15/2026 (A) | 1,080 | 1,102 | ||||||
| Description | Face Amount ($ Thousands) | Market Value ($ Thousands) | ||||||
Wind Acquisition Finance | ||||||||
7.375%, 04/23/2021 (A) | $ | 5,040 | $ | 5,229 | ||||
6.500%, 04/30/2020 (A) | 1,189 | 1,260 | ||||||
4.750%, 07/15/2020 (A) | 3,125 | 3,133 | ||||||
Windstream | ||||||||
7.750%, 10/01/2021 | 3,955 | 3,945 | ||||||
7.500%, 06/01/2022 | 490 | 473 | ||||||
|
| |||||||
| 135,094 | ||||||||
|
| |||||||
Utilities — 1.9% | ||||||||
Abengoa Yield | ||||||||
7.000%, 11/15/2019 (A) | 1,210 | 1,246 | ||||||
AES | ||||||||
8.000%, 06/01/2020 | 325 | 371 | ||||||
7.375%, 07/01/2021 | 2,200 | 2,442 | ||||||
5.500%, 04/15/2025 | 1,165 | 1,153 | ||||||
4.875%, 05/15/2023 | 215 | 210 | ||||||
AES Gener | ||||||||
8.375%, 12/18/2073 (A) (F) | 465 | 509 | ||||||
AmeriGas Finance | ||||||||
7.000%, 05/20/2022 | 4,641 | 4,978 | ||||||
Calpine | ||||||||
5.500%, 02/01/2024 | 600 | 605 | ||||||
5.375%, 01/15/2023 | 1,270 | 1,270 | ||||||
DPL | ||||||||
6.750%, 10/01/2019 (A) | 525 | 554 | ||||||
Dynegy | ||||||||
5.875%, 06/01/2023 | 2,770 | 2,694 | ||||||
Dynegy Finance I | ||||||||
7.625%, 11/01/2024 (A) | 2,470 | 2,587 | ||||||
7.375%, 11/01/2022 (A) | 2,130 | 2,239 | ||||||
Enel | ||||||||
8.750%, 09/24/2073 (A) (F) | 1,438 | 1,735 | ||||||
Ferrellgas | ||||||||
6.500%, 05/01/2021 | 2,825 | 2,853 | ||||||
GenOn Americas Generation | ||||||||
9.125%, 05/01/2031 | 285 | 264 | ||||||
GenOn Energy | ||||||||
9.875%, 10/15/2020 | 960 | 972 | ||||||
LBC Tank Terminals Holding Netherlands | ||||||||
6.875%, 05/15/2023 (A) | 2,800 | 2,863 | ||||||
Mirant Americas Generation LLC | ||||||||
8.500%, 10/01/2021 | 3,850 | 3,658 | ||||||
NRG Energy | ||||||||
7.875%, 05/15/2021 | 215 | 231 | ||||||
6.250%, 07/15/2022 | 615 | 632 | ||||||
6.250%, 05/01/2024 | 683 | 688 | ||||||
|
| |||||||
| 34,754 | ||||||||
|
| |||||||
Total Corporate Obligations | 1,414,391 | |||||||
|
| |||||||
| SEI Institutional Managed Trust / Semi-Annual Report / March 31, 2015 | 145 |
SCHEDULE OF INVESTMENTS (Unaudited)
High Yield Bond Fund (Continued)
March 31, 2015
| Description | Face Amount ($ Thousands) | Market Value ($ Thousands) | ||||||
LOAN PARTICIPATIONS — 8.8% |
| |||||||
Academy Sports Limited, Term Loan | ||||||||
4.500%, 08/03/2018 | $ | 546 | $ | 547 | ||||
Acadia Healthcare Company, 1st Lien | ||||||||
4.250%, 02/11/2022 | 800 | 807 | ||||||
Accellent, 1st Lien Term Loan | ||||||||
4.500%, 03/12/2021 | 1,380 | 1,369 | ||||||
Accellent, Cov-Lite, 2nd Lien | ||||||||
7.500%, 03/11/2022 | 515 | 488 | ||||||
Affinion Group Holdings | ||||||||
6.750%, 10/08/2016 | 1,777 | 1,683 | ||||||
Air Medical Group Holdings, 1st Lien Term Loan | ||||||||
7.625%, 05/21/2018 | 4,350 | 4,372 | ||||||
Albertson’s | ||||||||
4.750%, 06/27/2021 | 778 | 780 | ||||||
Alinta Energy Finance, Draw Term Loan | ||||||||
6.375%, 08/13/2018 | 43 | 43 | ||||||
Alinta, Cov-Lite, 1st Lien Term Loan | ||||||||
6.375%, 08/13/2019 | 2,521 | 2,518 | ||||||
Alinta, Delayed Term Loan Unfunded | ||||||||
1.000%, 08/13/2018 | 124 | — | ||||||
Alliance Laundry System, Term Loan B | ||||||||
4.250%, 12/07/2018 | 910 | 911 | ||||||
Alliance Laundry Systems, Term Loan B | ||||||||
4.250%, 12/10/2018 | 10 | 10 | ||||||
American Energy | ||||||||
5.250%, 08/04/2020 | 665 | 562 | ||||||
American Renal Holdings | ||||||||
4.500%, 08/14/2019 | 2,000 | 1,996 | ||||||
American Renal Holdings, Term Loan | ||||||||
8.500%, 02/20/2020 | 1,750 | 1,737 | ||||||
American Tire Distributors, | ||||||||
0.000%, 09/24/2021 | 1,000 | 1,004 | ||||||
ANVC Merger, 1st Lien Term Loan | ||||||||
5.500%, 02/18/2021 | 1,881 | 1,876 | ||||||
Applied Systems, 2nd Lien Term Loan | ||||||||
7.500%, 01/24/2022 | 1,183 | 1,179 | ||||||
Arctic Glacier, Cov-Lite, 1st Lien | ||||||||
6.000%, 05/10/2019 | 1,033 | 1,025 | ||||||
Arizona Chemical, Cov-Lite, 2nd Lien Term Loan | ||||||||
7.500%, 06/10/2022 | 384 | 378 | ||||||
| Description | Face Amount ($ Thousands) | Market Value ($ Thousands) | ||||||
Aspect Software | ||||||||
7.000%, 05/07/2016 | $ | 1,066 | $ | 1,060 | ||||
Asurion, 2nd Lien Term Loan | ||||||||
8.500%, 03/03/2021 | 3,000 | 3,010 | ||||||
Atkore, Cov-Lite, 2nd Lien Term Loan | ||||||||
7.750%, 10/09/2021 | 375 | 362 | ||||||
Avaya, Term Loan B3 | ||||||||
4.672%, 10/26/2017 | 1,002 | 985 | ||||||
Azure Midstream, 1st Lien Term Loan B | ||||||||
7.500%, 11/15/2018 | 157 | 149 | ||||||
BJ’s Wholesale Club, 2nd Lien | ||||||||
8.500%, 03/26/2020 | 970 | 962 | ||||||
BWAY Intermediate Company, 1st Lien Term Loan | ||||||||
5.500%, 08/14/2020 | 542 | 547 | ||||||
Carestream Health, Cov-Lite, 1st Lien Term Loan | ||||||||
5.000%, 06/07/2019 | 2 | 2 | ||||||
Carestream Health, Cov-Lite, 2nd Lien Term Loan | ||||||||
9.500%, 12/07/2019 | 2,348 | 2,338 | ||||||
CD&R Millennium | ||||||||
8.250%, 07/31/2022 | 2,285 | 2,224 | ||||||
Cengage Learning Acquisitions, 1st Lien Term Loan | ||||||||
7.000%, 03/31/2020 | 2,516 | 2,523 | ||||||
Ceridian HCM Holding, 1st Lien | ||||||||
4.500%, 09/15/2020 | 967 | 951 | ||||||
Ceva Group PLC, 1st Lien Term Loan | ||||||||
6.500%, 03/19/2021 | 497 | 464 | ||||||
Ceva Intercompany BV, 1st Lien Term Loan | ||||||||
6.500%, 03/19/2021 | 213 | 199 | ||||||
Ceva Logistics, 1st Lien Term Loan | ||||||||
6.500%, 03/19/2021 | 37 | 34 | ||||||
Charter Communications Operating | ||||||||
4.250%, 09/12/2021 | 1,385 | 1,396 | ||||||
City Center Holdings, Cov-Lite, 1st Lien Term Loan B | ||||||||
4.250%, 10/16/2020 | 1,155 | 1,159 | ||||||
CKX, Term Loan B | ||||||||
9.000%, 06/21/2017 | 421 | 295 | ||||||
Clear Channel Communications, 1st Lien Term Loan D | ||||||||
6.906%, 01/22/2019 | 6,397 | 6,075 | ||||||
Crestwood Holdings, 1st Lien Term Loan B | ||||||||
7.000%, 05/24/2019 | 1,400 | 1,319 | ||||||
| 146 | SEI Institutional Managed Trust / Semi-Annual Report / March 31, 2015 |
| Description | Face Amount ($ Thousands) | Market Value ($ Thousands) | ||||||
CTI Foods, 2nd Lien Term Loan | ||||||||
8.250%, 06/28/2021 | $ | 1,190 | $ | 1,169 | ||||
DAE Aviation Holdings, 1st Lien Term Loan | ||||||||
7.750%, 08/05/2019 | 1,000 | 1,001 | ||||||
Dex Media West | ||||||||
8.000%, 12/30/2016 | 1,447 | 1,187 | ||||||
Diamond Foods, Cov-Lite, 1st Lien | ||||||||
4.250%, 08/20/2018 | 881 | 880 | ||||||
Dollar Tree, Cov-Lite, 1st Lien | ||||||||
4.250%, 02/06/2022 | 1,500 | 1,515 | ||||||
Drillships Ocean Ventures, Term Loan | ||||||||
5.500%, 07/16/2021 | 2,308 | 1,919 | ||||||
Empire Generating | ||||||||
5.250%, 03/12/2021 | 1,832 | 1,830 | ||||||
Energy & Exploration Partners, 1st Lien Term | ||||||||
7.750%, 01/22/2019 | 1,391 | 1,146 | ||||||
Evergreen Skillsoft, 1st Lien | ||||||||
5.750%, 04/28/2021 | 1,274 | 1,258 | ||||||
Fender Musical Instruments, 1st Lien Term Loan | ||||||||
5.750%, 04/03/2019 | 273 | 272 | ||||||
First Advantage, 2nd Lien Term Loan | ||||||||
10.500%, 08/28/2019 (B) | 600 | 596 | ||||||
First Advantage, Cov-Lite, Term Loan B | ||||||||
6.250%, 02/13/2019 | 491 | 488 | ||||||
Flint Group, Cov-Lite, 2nd Lien | ||||||||
8.250%, 05/02/2022 | 1,220 | 1,169 | ||||||
Foxwoods, 1st Lien | ||||||||
5.000%, 07/01/2018 | 214 | 167 | ||||||
GCA Services Group, Cov-Lite, 2nd Lien Term Loan | ||||||||
9.250%, 10/11/2020 | 560 | 554 | ||||||
Global Aviation Holdings | ||||||||
10.000%, 07/13/2017 (B) (D) | 1,869 | — | ||||||
3.000%, 02/13/2018 (B) (D) | 611 | — | ||||||
Green Energy Partners/Stonewall, Term B-1 Conversion Advances | ||||||||
6.500%, 11/12/2021 | 720 | 724 | ||||||
Greenway Medical Technologies, 1st Lien Term Loan | ||||||||
9.250%, 11/04/2021 | 900 | 877 | ||||||
Gymboree, Cov-Lite, 1st Lien Term Loan | ||||||||
5.000%, 02/23/2018 | 340 | 258 | ||||||
| Description | Face Amount ($ Thousands) | Market Value ($ Thousands) | ||||||
Hearthside Food Solutions, 1st Lien Term Loan | ||||||||
4.500%, 06/02/2021 | $ | 357 | $ | 359 | ||||
Hillman, 1st Lien Term Loan B | ||||||||
4.500%, 06/30/2021 | 303 | 306 | ||||||
Hilton Hotels, Cov-Lite, 1st Lien Term Loan B | ||||||||
3.500%, 10/26/2020 | 200 | 201 | ||||||
Hilton Worldwide Holdings, 1st Lien Term Loan B | ||||||||
3.500%, 10/26/2020 | 470 | 470 | ||||||
Hostess Brands | ||||||||
6.750%, 04/09/2020 | 1,173 | 1,193 | ||||||
Hub International, 1st Lien Term Loan B | ||||||||
4.250%, 10/02/2020 | 1,975 | 1,957 | ||||||
Ikaria, 2nd Lien | ||||||||
8.750%, 02/14/2022 | 390 | 394 | ||||||
Indivior Finance (USD), 1st Lien | ||||||||
7.000%, 12/19/2019 | 1,945 | 1,838 | ||||||
Infor US, 1st Lien Term Loan B | ||||||||
3.750%, 06/03/2020 | 1,359 | 1,346 | ||||||
Integra Telecom, 2nd Lien | ||||||||
9.750%, 02/19/2020 | 700 | 694 | ||||||
Integra Telecom, Term Loan B | ||||||||
5.250%, 02/22/2019 | 1,326 | 1,324 | ||||||
Interactive Date, Cov-Lite, 1st Lien Term Loan | ||||||||
4.750%, 05/02/2021 | 1,030 | 1,034 | ||||||
Interline Brands, 1st Lien Term Loan | ||||||||
4.000%, 03/17/2021 | 635 | 632 | ||||||
ION Trading Technologies, 2nd Lien Term Loan | ||||||||
7.250%, 06/10/2022 | 2,150 | 2,109 | ||||||
J Crew Group, 1st Lien | ||||||||
4.000%, 03/05/2021 | 768 | 711 | ||||||
J Crew Group, Term Loan B | ||||||||
4.000%, 03/05/2021 | 609 | 564 | ||||||
KCA Deutag Drilling, 1st Lien Term Loan B | ||||||||
6.250%, 05/15/2020 | 1,030 | 862 | ||||||
Lions Gate, 2nd Lien | ||||||||
5.000%, 03/11/2022 | 2,340 | 2,342 | ||||||
Marine District Finance, 1st Lien | ||||||||
6.500%, 08/15/2018 | 923 | 928 | ||||||
Mashantucket Pequot Tribe, 1st Lien Term Loan | ||||||||
9.375%, 06/30/2020 | 3,913 | 3,263 | ||||||
Mauser-Werke GMBH, Cov-Lite, Term Loan | ||||||||
4.500%, 07/31/2021 | 638 | 632 | ||||||
| SEI Institutional Managed Trust / Semi-Annual Report / March 31, 2015 | 147 |
SCHEDULE OF INVESTMENTS (Unaudited)
High Yield Bond Fund (Continued)
March 31, 2015
| Description | Face Amount ($ Thousands) | Market Value ($ Thousands) | ||||||
Medical Card, Term Loan | ||||||||
12.000%, 09/17/2015 | $ | 1,222 | $ | 1,161 | ||||
Metroflag, 2nd Lien | ||||||||
14.000%, 01/06/2009 (B) | 300 | — | ||||||
MISYS, 1st Lien Term Loan | ||||||||
5.000%, 12/12/2018 | 1,182 | 1,183 | ||||||
MISYS, 2nd Lien | ||||||||
12.000%, 06/12/2019 | 1,250 | 1,359 | ||||||
Moxie Liberty LLC, 1st Lien Term Loan B1 | ||||||||
7.500%, 08/21/2020 | 2,755 | 2,762 | ||||||
Moxie Patriot LLC, 1st Lien Term Loan B1 | ||||||||
6.750%, 12/19/2020 | 780 | 782 | ||||||
NANA Development, 1st Lien Term Loan | ||||||||
8.000%, 03/15/2018 | 408 | 391 | ||||||
Navistar International | ||||||||
5.750%, 08/17/2017 | 556 | 558 | ||||||
Nelson Education Limited, Term Loan B1 | ||||||||
6.750%, 07/05/2014 (B) | 913 | 732 | ||||||
New MMI, Term Loan | ||||||||
9.000%, 01/31/2020 | 3,076 | 2,820 | ||||||
NII Internationa, 1st Lien Term Loan | ||||||||
8.000%, 03/23/2016 | 628 | 612 | ||||||
Nine West Holdings, Term Loan | ||||||||
6.250%, 01/08/2020 | 1,290 | 1,079 | ||||||
Obsidian Natural Gas Trust | ||||||||
7.000%, 11/02/2015 | 343 | 345 | ||||||
Ocean, Cov-Lite, 1st Lien Term Loan B1 | ||||||||
6.000%, 03/31/2021 | 2,549 | 1,939 | ||||||
One Call Medical, 1st Lien Term Loan | ||||||||
5.000%, 11/27/2020 | 2,249 | 2,248 | ||||||
Ortho-Clinical Diagnostics, 1st Lien Term Loan | ||||||||
4.750%, 06/30/2021 | 791 | 783 | ||||||
Oxbow Carbon & Minerals, 2nd Lien | ||||||||
8.000%, 01/19/2020 | 1,250 | 1,019 | ||||||
Oxea, Cov-Lite, 2nd Lien | ||||||||
8.250%, 07/15/2020 | 750 | 694 | ||||||
Panda Sherman Power, Term Loan | ||||||||
9.000%, 09/14/2018 | 1,646 | 1,632 | ||||||
Panolam Industries International | ||||||||
7.500%, 08/23/2017 | 687 | 680 | ||||||
Peak, Cov-Lite, 2nd Lien Term Loan | ||||||||
8.250%, 06/17/2022 | 2,300 | 2,220 | ||||||
| Description | Face Amount ($ Thousands) | Market Value ($ Thousands) | ||||||
Performance Food Group, Cov-Lite, 2nd Lien Term Loan | ||||||||
6.250%, 11/07/2019 | $ | 200 | $ | 200 | ||||
6.250%, 11/14/2019 | 391 | 392 | ||||||
Petsmart | ||||||||
5.000%, 03/11/2022 | 840 | 846 | ||||||
Polymer Group, Cov-Lite, First Lien | ||||||||
5.250%, 12/19/2019 | 35 | 35 | ||||||
Polymer Group, 1st Lien Term Loan B | ||||||||
5.250%, 12/19/2019 | 635 | 637 | ||||||
Reddy Ice, 2nd Lien Term Loan | ||||||||
10.750%, 11/01/2019 | 1,670 | 1,269 | ||||||
Rite Aid, 2nd Lien Term Loan | ||||||||
5.750%, 07/07/2020 | 727 | 734 | ||||||
Riverbed Technology, Cov-Lite, 1st Lien | ||||||||
0.000%, 02/25/2022 | 695 | 701 | ||||||
Road Infrastructure Investments, 2nd Lien Term Loan | ||||||||
7.750%, 09/30/2021 | 300 | 270 | ||||||
Salix Pharmaceuticals, 1st Lien Term Loan | ||||||||
4.250%, 01/02/2020 | 3,084 | 3,084 | ||||||
Sears Holdings, 1st Lien Term Loan | ||||||||
5.500%, 06/30/2018 | 1,523 | 1,498 | ||||||
SIG Combibloc, Cov-Lite, 1st Lien | ||||||||
0.000%, 02/03/2022 | 250 | 252 | ||||||
Sirva Worldwide, Term Loan | ||||||||
7.500%, 03/27/2019 | 924 | 919 | ||||||
Skillsoft, Cov-Lite, 2nd Lien | ||||||||
9.250%, 04/28/2022 | 2,367 | 2,219 | ||||||
Solenis, Cov-Lite, 2nd Lien Term Loan | ||||||||
7.750%, 07/31/2022 | 410 | 396 | ||||||
SS&C Technologies, Bridge Loan | ||||||||
0.000%, 02/02/2016 | 1,215 | 1,215 | ||||||
Steinway Musical Instruments, 1st Lien Term Loan | ||||||||
4.750%, 09/19/2019 | 966 | 964 | ||||||
Syncreon Holdings, 1st Lien Term Loan B | ||||||||
5.250%, 10/28/2020 | 2,237 | 2,142 | ||||||
TASC, 2nd Lien Term Loan | ||||||||
12.000%, 05/23/2021 | 1,300 | 1,368 | ||||||
Templar Energy, Cov-Lite, 2nd Lien Term Loan | ||||||||
8.500%, 11/25/2020 | 2,500 | 1,688 | ||||||
| 148 | SEI Institutional Managed Trust / Semi-Annual Report / March 31, 2015 |
| Description | Face Amount ($ Thousands) | Market Value ($ Thousands) | ||||||
Texas Competitive Electric Holdings, Extending Term Loan | ||||||||
4.662%, 10/10/2017 (B) | $ | 1,660 | $ | 996 | ||||
4.650%, 10/10/2017 (B) | 17 | 10 | ||||||
Texas Competitive Electric Holdings, Term Loan | ||||||||
4.662%, 04/25/2015 (B) | 86 | 51 | ||||||
4.648%, 04/25/2015 (B) | 9,712 | 5,745 | ||||||
The Nieman Marcus Group, 1st Lien Term Loan | ||||||||
4.250%, 10/25/2020 | 2,866 | 2,854 | ||||||
Toys ‘R’ US-Delaware, | ||||||||
9.750%, 04/09/2020 | 1,910 | 1,774 | ||||||
Trans Union LLC, 1st Lien Term Loan | ||||||||
4.000%, 04/09/2021 | 1,996 | 1,995 | ||||||
Travelport | ||||||||
6.000%, 09/02/2021 | 2,320 | 2,339 | ||||||
True Religion Apparel, 1st Lien Term Loan | ||||||||
5.875%, 07/30/2019 | 368 | 328 | ||||||
True Religion Apparel, Term Loan | ||||||||
5.875%, 07/30/2019 | 391 | 350 | ||||||
TSAM Delaware, 1st Lien | ||||||||
8.750%, 09/12/2019 (D) | 938 | 930 | ||||||
Valeant, Delayed Draw F1, 1st Lien | ||||||||
0.000%, 03/11/2022 | 513 | 515 | ||||||
Valeant, Delayed Draw F2, 1st Lien | ||||||||
0.000%, 03/11/2022 | 393 | 395 | ||||||
Varsity Brands, Cov-Lite, 1st Lien | ||||||||
6.000%, 12/10/2021 | 810 | 817 | ||||||
Vertafore | ||||||||
9.750%, 10/27/2017 | 560 | 562 | ||||||
Walter Investment Management, 1st Lien Term Loan | ||||||||
4.750%, 12/18/2020 | 997 | 913 | ||||||
Weight Watchers International | ||||||||
3.750%, 04/02/2020 | 648 | 345 | ||||||
Weight Watchers International, 1st Lien Term | ||||||||
4.000%, 04/02/2020 | 2 | 1 | ||||||
Wilton Brands, 1st Lien Term | ||||||||
7.500%, 08/30/2018 | 2,416 | 2,303 | ||||||
WTG Holdings III | ||||||||
4.750%, 01/15/2021 | 1,485 | 1,485 | ||||||
|
| |||||||
Total Loan Participations | 160,044 | |||||||
|
| |||||||
| Description | Face Amount ($ Thousands) | Market Value ($ Thousands) | ||||||
COLLATERALIZED DEBT OBLIGATIONS — 9.4% |
| |||||||
Financials — 1.0% | ||||||||
Battalion CLO V, Ser 2014-5A | ||||||||
0.000%, 04/17/2026 (A) (G) | $ | 3,274 | $ | 2,390 | ||||
Battalion CLO VII, Ser 2014-7A | ||||||||
0.000%, 10/17/2026 (A) | 4,007 | 3,206 | ||||||
Battalion CLO VII, Ser 2014-7A, Cl D | ||||||||
5.500%, 10/17/2026 (A) (F) | 2,260 | 2,111 | ||||||
Battalion CLO VIII Warehouse Note | ||||||||
0.000%‡‡ | 4,364 | 4,632 | ||||||
Battalion CLO, Ser 2012-3A | ||||||||
0.000%, 1/18/2025 (A) | 2,303 | 2,005 | ||||||
Battalion CLO, Ser 2013-4A | ||||||||
0.000%, 10/22/2025 | 5,640 | 3,891 | ||||||
|
| |||||||
| 18,235 | ||||||||
|
| |||||||
Other Asset-Backed Securities — 8.4% |
| |||||||
B&M CLO, Ser 2014-1A, Cl C | ||||||||
3.979%, 04/16/2026 (A) (F) | 2,108 | 1,986 | ||||||
B&M CLO, Ser 2014-1A, Cl D | ||||||||
4.979%, 04/16/2026 (A) (F) | 3,471 | 2,997 | ||||||
B&M CLO, Ser 2014-1A, Cl E | ||||||||
5.979%, 04/16/2026 (A) (F) | 2,480 | 2,062 | ||||||
Battalion CLO VIII, | ||||||||
5.711%, 04/18/2027 (A) (F) | 982 | 894 | ||||||
Battalion CLO VIII, Ser 2015-8A | ||||||||
0.000%, 04/18/2027 (A) | 3,655 | 3,472 | ||||||
Benefit Street Partners CLO III, Ser 2013-IIIA | ||||||||
0.000%, 01/20/2026 (A) | 2,528 | 1,997 | ||||||
Benefit Street Partners CLO IV | ||||||||
0.000%, 07/20/2026 | 2,462 | 2,068 | ||||||
Benefit Street Partners CLO V | ||||||||
0.000%, 10/20/2026 | 5,389 | 4,864 | ||||||
Benefit Street Partners CLO VI Warehouse Note | ||||||||
0.000%‡‡ | 4,228 | 4,228 | ||||||
Benefit Street Partners CLO, Ser 2015-VIA | ||||||||
0.000%, 04/18/2027 | 7,502 | 6,752 | ||||||
CVP Cascade CLO, | ||||||||
5.031%, 07/18/2026 (A) (F) | 1,709 | 1,466 | ||||||
CVP Cascade CLO, | ||||||||
6.031%, 07/18/2026 (A) (F) | 2,469 | 2,078 | ||||||
Fifth Street Senior Loan Fund, Ser 2015-1A, Cl E | ||||||||
7.456%, 01/20/2027 (A) (F) | 3,890 | 3,307 | ||||||
Fifth Street Senior Loan Fund II Warehouse Note | ||||||||
0.000%‡‡ | 5,585 | 5,585 | ||||||
| SEI Institutional Managed Trust / Semi-Annual Report / March 31, 2015 | 149 |
SCHEDULE OF INVESTMENTS (Unaudited)
High Yield Bond Fund (Continued)
March 31, 2015
| Description | Face Amount ($ Thousands) | Market Value ($ Thousands) | ||||||
Figueroa CLO, Ser 2013-1I | ||||||||
0.000%, 3/21/2024 | $ | 18,856 | $ | 14,236 | ||||
Figueroa CLO, Ser 2013-2A | ||||||||
0.000%, 12/15/2025 | 2,930 | 2,646 | ||||||
Fortress Credit Opportunities III CLO, Ser 2014-3A, Cl E | ||||||||
6.504%, 04/28/2026 (A) (F) | 3,482 | 3,272 | ||||||
Fortress Credit Opportunities VI CLO, Ser 2015-6A, Cl F | ||||||||
7.019%, 10/10/2026 (A) (F) | 1,730 | 1,644 | ||||||
Great Lakes CLO, Ser 2012-1A | ||||||||
0.000%, 01/15/2023 (A) | 2,457 | 1,769 | ||||||
Great Lakes CLO, Ser 2012-1A, Cl E | ||||||||
5.731%, 01/15/2023 (A) (F) | 2,811 | 2,579 | ||||||
Great Lakes CLO, Ser 2014-1A, Cl F | ||||||||
6.253%, 04/15/2025 (A) (F) | 2,480 | 2,071 | ||||||
Great Lakes CLO, Ser 2014-1A | ||||||||
0.000%, 04/15/2025 | 6,943 | 5,554 | ||||||
Hildene CLO II, Ser 2014-2A, Cl E | ||||||||
5.331%, 07/19/2026 (A) (F) | 1,987 | 1,772 | ||||||
Hildene CLO II, Ser 2014-2A, Cl D | ||||||||
3.931%, 07/19/2026 (A) (F) | 1,987 | 1,907 | ||||||
Hildene CLO II, Ser 2014-2A, Cl C | ||||||||
3.131%, 07/19/2026 (A) (F) | 1,987 | 1,946 | �� | |||||
Ivy Hill Middle Market Credit Fund, Ser 7A | ||||||||
0.000%, 10/20/2025 (A) | 3,198 | 2,558 | ||||||
JFIN Revolver CLO, | ||||||||
2.257%, 01/20/2021 (A) (F) | 1,990 | 1,980 | ||||||
JFIN Revolver CLO, | ||||||||
3.011%, 02/20/2022 (A) (F) | 1,951 | 1,907 | ||||||
KVK CLO, Ser 2012-2A | ||||||||
0.000%, 02/10/2025 (A) | 2,471 | 1,643 | ||||||
Lockwood Grove CLO, Ser 2014-1A, Cl E | ||||||||
6.812%, 01/25/2024 (A) (F) | 2,191 | 2,175 | ||||||
Lockwood Grove CLO, Ser 2014-1A | ||||||||
0.000%, 01/25/2024 (A) (G) | 2,701 | 2,606 | ||||||
MidOcean Credit CLO III, Ser 2014-3A, Cl F | ||||||||
6.256%, 07/21/2026 (A) (F) | 1,968 | 1,677 | ||||||
Nelder Grove CLO, | ||||||||
4.770%, 08/28/2026 (A) (F) | 1,951 | 1,931 | ||||||
Nelder Grove CLO, | ||||||||
7.000%, 08/28/2026 (A) (F) | 2,926 | 2,897 | ||||||
| Description | Face Amount ($ Thousands)/Shares | Market Value ($ Thousands) | ||||||
Neuberger Berman CLO XIII, Ser 2012-13A | ||||||||
0.000%, 01/23/2024 (A) | $ | 447 | $ | 246 | ||||
Neuberger Berman CLO XVI, Ser 2014-16A | ||||||||
0.000%, 04/15/2026 (A) (G) | 2,613 | 1,797 | ||||||
NewStar Arlington Senior Loan Program, Ser 2014-1A, Cl E | ||||||||
6.356%, 07/25/2025 (A) (F) | 1,974 | 1,826 | ||||||
NewStar Clarendon Fund CLO, | ||||||||
6.315%, 01/25/2027 (A) (F) | 3,439 | 3,104 | ||||||
NXT Capital CLO, Ser 2012-1A, Cl E | ||||||||
7.731%, 07/20/2022 (A) (F) | 2,417 | 2,405 | ||||||
OCP CLO, Ser 2012-2A | ||||||||
0.000%, 11/22/2023 (A) | 2,615 | 1,883 | ||||||
Peaks CLO, Ser 2014-1A, Cl D | ||||||||
4.653%, 06/15/2026 (A) (F) | 985 | 916 | ||||||
Rockwall CDO, Ser 2007-1A | ||||||||
0.482%, 08/01/2024 (A) (F) | 17,687 | 17,218 | ||||||
Shackleton CLO, Ser 2014-6A | ||||||||
0.000%, 07/17/2026 (A) (G) | 7,935 | 5,554 | ||||||
Trinitas CLO I, Ser 2014-1A | ||||||||
0.000%, 04/15/2026 (A) (G) | 3,507 | 3,139 | ||||||
Trinitas CLO II, Ser 2014-2A, Cl D | ||||||||
4.031%, 07/15/2026 (A) (F) | 1,184 | 1,125 | ||||||
Venture CDO, Ser 2012-10A | ||||||||
0.000%, 07/20/2022 (A) | 5,284 | 3,540 | ||||||
Venture X CLO, Ser 2013-12A | ||||||||
0.000%, 02/28/2024 (A) | 2,693 | 2,074 | ||||||
Venture XI CLO, Ser 2012-11A | ||||||||
0.000%, 11/14/2022 (A) | 5,403 | 3,674 | ||||||
Venture XIV CLO, | ||||||||
0.000%, 08/25/2025 (A) | 1,833 | 1,488 | ||||||
|
| |||||||
| 152,515 | ||||||||
|
| |||||||
Total Collateralized Debt Obligations (Cost $163,455) ($ Thousands) | 170,750 | |||||||
|
| |||||||
PREFERRED STOCK — 0.8% |
| |||||||
Ally Financial, 7.000% (A) (F) | 27,345 | 8,036 | ||||||
Aspen Insurance Holdings, 5.950% (F) | 86,000 | 2,209 | ||||||
Ceva Holdings, 0.000%* (D) | 1,214 | 971 | ||||||
Dana Holding, 0.000%* (A) | 5,478 | 966 | ||||||
RBS Capital Funding Trust, 5.900% | 22,579 | 554 | ||||||
Regions Financial, 6.375% | 36,850 | 929 | ||||||
Royal Bank of Scotland Group PLC, 6.400% | 70 | 2 | ||||||
SLM, 1.934% (F) | 15,457 | 958 | ||||||
|
| |||||||
Total Preferred Stock (Cost $12,626) ($ Thousands) | 14,625 | |||||||
|
| |||||||
| 150 | SEI Institutional Managed Trust / Semi-Annual Report / March 31, 2015 |
| Description | Face Amount ($ Thousands)/Shares | Market Value ($ Thousands) | ||||||
MUNICIPAL BONDS — 0.5% |
| |||||||
Commonwealth of Puerto Rico, Ser A, GO | ||||||||
Callable 07/01/2020 @ 100 | ||||||||
8.000%, 07/01/2035 | $ | 4,188 | $ | 3,434 | ||||
Commonwealth of Puerto Rico, Ser A, GO | ||||||||
Callable 07/01/2022 @ 100 | ||||||||
5.000%, 07/01/2041 | 455 | 294 | ||||||
Mohegan Tribal, Finance Authority, RB | ||||||||
Callable 02/01/2023 @ 100 | ||||||||
7.000%, 02/01/2045 | 1,910 | 1,922 | ||||||
Texas State, Public Finance Authority, RB | ||||||||
Callable 07/01/2019 @ 100 | ||||||||
8.250%, 07/01/2024 | 3,730 | 3,743 | ||||||
|
| |||||||
Total Municipal Bonds | 9,393 | |||||||
|
| |||||||
COMMON STOCK — 0.2% | ||||||||
Cengage Learning Holdings II* (D) | 2,408 | 54 | ||||||
Ceva Holdings* (D) | 561 | 448 | ||||||
CUI Acquisition* (D) | 3 | 225 | ||||||
Dana Holding | 67,046 | 1,419 | ||||||
Global Aviation Holdings, Cl A* | 97,655 | — | ||||||
HMH Holdings Delaware* | 63,251 | 1,485 | ||||||
Mmodal* | 42,431 | 552 | ||||||
Quad | 654 | 15 | ||||||
|
| |||||||
Total Common Stock (Cost $2,933) ($ Thousands) | 4,198 | |||||||
|
| |||||||
CONVERTIBLE BONDS — 0.2% |
| |||||||
Liberty Media CV to 16.7764 | ||||||||
3.750%, 02/15/2030 | 4,090 | 2,567 | ||||||
Liberty Media CV to 22.94686 | ||||||||
4.000%, 11/15/2029 | 1,670 | 1,083 | ||||||
| Description | Shares/Face Amount ($ Thousands) | Market Value ($ Thousands) | ||||||
Mirant CV to 14.7167 | ||||||||
0.000%, 06/15/2021 (B) | $ | 2,200 | $ | — | ||||
|
| |||||||
Total Convertible Bonds (Cost $3,516) ($ Thousands) | 3,650 | |||||||
|
| |||||||
ASSET-BACKED SECURITY — 0.0% |
| |||||||
Other Asset-Backed Security — 0.0% |
| |||||||
Airplanes Pass-Through Trust, Ser 2001-1A, Cl A9 | ||||||||
0.711%, 03/15/2019 (F) | 1,097 | 449 | ||||||
|
| |||||||
Total Asset-Backed Security (Cost $846) ($ Thousands) | 449 | |||||||
|
| |||||||
Number of | ||||||||
WARRANTS — 0.0% |
| |||||||
Alion Science & Technology* | 1,790 | — | ||||||
Medical Card Systems* | 14,662 | — | ||||||
Mmodal* (D) | 19,978 | 1 | ||||||
Mmodal* (D) | 15,150 | — | ||||||
|
| |||||||
Total Warrants | 1 | |||||||
|
| |||||||
AFFILIATED PARTNERSHIP — 0.0% |
| |||||||
SEI Liquidity Fund, L.P. | ||||||||
0.070%**† (H) | 6,082 | 6 | ||||||
|
| |||||||
Total Affiliated Partnership | 6 | |||||||
|
| |||||||
CASH EQUIVALENT — 2.9% |
| |||||||
SEI Daily Income Trust, Prime Obligation Fund, Cl A | ||||||||
0.010%**† | 52,093,541 | 52,094 | ||||||
|
| |||||||
Total Cash Equivalent (Cost $52,094) ($ Thousands) | 52,094 | |||||||
|
| |||||||
Total Investments — 100.7% (Cost $1,855,078) ($ Thousands) | $ | 1,829,601 | ||||||
|
| |||||||
A list of the outstanding centrally cleared swap agreements held by the Fund at March 31, 2015, is as follows:
| Credit Default Swaps | ||||||||||||||||
| Counterparty | Reference Entity/ Obligation | Buy/Sell Protection | (Pays)/ Receives Rate | Termination Date | Notional Amount ($ Thousands) | Net Unrealized Depreciation ($ Thousands) | ||||||||||
| JPMorgan Chase Bank | CDX.NA.HY SERIES 23 | SELL | 5.00% | 12/20/19 | $ | (3,470 | ) | $ | (16 | ) | ||||||
| JPMorgan Chase Bank | CDX.NA.HY.24 | BUY | 5.00 | 06/20/20 | 15,400 | (40 | ) | |||||||||
|
| |||||||||||||||
| $ | (56 | ) | ||||||||||||||
|
| |||||||||||||||
| SEI Institutional Managed Trust / Semi-Annual Report / March 31, 2015 | 151 |
SCHEDULE OF INVESTMENTS (Unaudited)
High Yield Bond Fund (Concluded)
March 31, 2015
Percentages are based on a Net Assets of $1,817,044 ($ Thousands).
| * | Non-income producing security. |
| ** | The rate reported is the 7-day effective yield as of March 31, 2015. |
| † | Investment in Affiliated Security (see Note 6). |
| ‡ | Real Estate Investment Trust. |
| ‡‡ | Maturity date is unavailable. |
| (A) | Securities sold within terms of a private placement memorandum, exempt from registration under Section 144A of the Securities Act of 1933, as amended, and may be sold only to dealers in that program or other “accredited investors.” These securities have been determined to be liquid under guidelines established by the Board of Trustees. |
| (B) | Security in default on interest payments. |
| (C) | Securities considered illiquid. The total market value of such securities as of March 31, 2015 was $1 ($ Thousands) and represented 0.0% of Net Assets. |
| (D) | Security fair valued using methods determined in good faith by the Valuation Committee of the Board of Trustees. The total market value of such securities as of March 31, 2015 was $3,910 ($ Thousands) and represented 0.22% of Net Assets. |
| (E) | This security or a partial position of this security is on loan at March 31, 2015 (see Note 10). The total market value of securities on loan at March 31, 2015 was $4 ($ Thousands). |
| (F) | Variable Rate Security — The rate reported on the Schedule of Investments is the rate in effect as of March 31, 2015. |
| (G) | The rate reported is the effective yield at time of purchase. |
| (H) | This security was purchased with cash collateral held from securities on loan (see Note 10). The total value of such securities as of March 31, 2015 was $6 ($ Thousands). |
CDO — Collateralized Debt Obligation
Cl — Class
CLO — Collateralized Loan Obligation
CV — Convertible Security
LLC — Limited Liability Company
L.P. — Limited Partnership
GO — General Obligation
MTN — Medium Term Note
PIK — Payment-in-Kind
PLC — Public Limited Company
RB — Revenue Bond
Ser — Series
ULC — Unlimited Liability Corporation
Amounts designated as “—” are $O or have been rounded to $O
The following is a list of the level of inputs used as of March 31, 2015 in valuing the Fund’s investments and other financial instruments at value ($ Thousands):
| Investments in Securities | Level 1 | Level 2 | Level 3(1) | Total | ||||||||||||
Corporate Obligations | $ | — | $ | 1,414,349 | $ | 42 | $ | 1,414,391 | ||||||||
Loan Participations | — | 154,623 | 5,421 | 160,044 | ||||||||||||
Collateralized Debt Obligations | — | — | 170,750 | 170,750 | ||||||||||||
Preferred Stock | 13,654 | 971 | — | 14,625 | ||||||||||||
Asset-Backed Security | — | 449 | — | 449 | ||||||||||||
Municipal Bonds | — | 9,393 | — | 9,393 | ||||||||||||
Common Stock | 3,525 | — | 673 | 4,198 | ||||||||||||
Convertible Bonds | — | 2,370 | 1,280 | 3,650 | ||||||||||||
Warrants | — | — | 1 | 1 | ||||||||||||
Cash Equivalent | 52,094 | — | — | 52,094 | ||||||||||||
Affiliated Partnership | — | 6 | — | 6 | ||||||||||||
|
|
|
|
|
|
|
| |||||||||
Total Investments in Securities | $ | 69,273 | $ | 1,582,161 | $ | 178,167 | $ | 1,829,601 | ||||||||
|
|
|
|
|
|
|
| |||||||||
| Other Financial Instruments | Level 1 | Level 2 | Level 3 | Total | ||||||||||||
Centrally Cleared Swaps* | ||||||||||||||||
Credit Default Swaps Unrealized Depreciation | $ | — | $ | (56 | ) | $ | — | $ | (56 | ) | ||||||
|
|
|
|
|
|
|
| |||||||||
Total Other Financial Instruments | $ | — | $ | (56 | ) | $ | — | $ | (56 | ) | ||||||
|
|
|
|
|
|
|
| |||||||||
| * | Swaps are valued at the unrealized depreciation on the instrument. |
| (1) | Please see Note 2 for details on the unobservable inputs and the interrelationships and sensitivity between those inputs for those Level 3 securities that are not valued by third party pricing vendors on broker quotes. |
The following is a reconciliation of the investments in which significant unobservable inputs (Level 3) were used in determining value ($ Thousands):
| Corporate Obligations | Loan Participations | Collateralized Debt Obligations | Common Stock | Convertible Bonds | Warrants | |||||||||||||||||||
Beginning balance as of October 1, 2014 | $ | 4,261 | $ | 8,643 | $ | 156,908 | $ | 1,368 | $ | 1,280 | $ | — | ||||||||||||
Accrued discounts/premiums | (139 | ) | (5 | ) | (983 | ) | — | (1 | ) | — | ||||||||||||||
Realized gain (loss) | (8,444 | ) | 46 | 3,072 | 135 | — | — | |||||||||||||||||
Change in unrealized appreciation (depreciation) | 4,425 | (124 | ) | (3,293 | ) | (135 | ) | 1 | — | |||||||||||||||
Purchases | (129 | ) | — | 52,481 | — | — | — | |||||||||||||||||
Sales | 43 | (3,139 | ) | (37,435 | ) | (620 | ) | — | — | |||||||||||||||
Transfer into Level 3 | 25 | — | — | — | — | 1 | ||||||||||||||||||
Transfer out of Level 3 | — | — | — | (75 | ) | — | — | |||||||||||||||||
|
|
|
|
|
|
|
|
|
|
|
| |||||||||||||
Ending balance as of March 31, 2015 | $ | 42 | $ | 5,421 | $ | 170,750 | $ | 673 | $ | 1,280 | $ | 1 | ||||||||||||
|
|
|
|
|
|
|
|
|
|
|
| |||||||||||||
Changes in unrealized gains (losses) in earnings related to securities held at reporting date | $ | (5 | ) | $ | (76 | ) | $ | (632 | ) | $ | (217 | ) | $ | (49 | ) | $ | (14 | ) | ||||||
|
|
|
|
|
|
|
|
|
|
|
| |||||||||||||
For the period ended March 31, 2015, there have been no transfers between Level 1 and Level 2 assets and liabilities.
For the period ended March 31, 2015, there have been no transfers between Level 2 and Level 3 assets and liabilities.
For more information on valuation inputs, see Note 2 — Significant Accounting Policies in Notes to Financial Statements.
Amounts designated as “—” are $O or have been rounded to $O
The accompanying notes are an integral part of the financial statements.
| 152 | SEI Institutional Managed Trust / Semi-Annual Report / March 31, 2015 |
SCHEDULE OF INVESTMENTS (Unaudited)
Real Return Fund
March 31, 2015
| Description | Face Amount ($ Thousands)/Shares | Market Value ($ Thousands) | ||||||
U.S. TREASURY OBLIGATIONS — 99.5% |
| |||||||
U.S. Treasury Inflation Protected Securities | ||||||||
2.625%, 07/15/2017 | $ | 12,380 | $ | 13,441 | ||||
2.500%, 07/15/2016 | 16,692 | 17,533 | ||||||
2.375%, 01/15/2017 | 14,459 | 15,319 | ||||||
2.125%, 01/15/2019 | 11,993 | 13,203 | ||||||
1.875%, 07/15/2019 | 13,696 | 15,100 | ||||||
1.625%, 01/15/2018 | 13,078 | 13,932 | ||||||
1.375%, 07/15/2018 | 12,897 | 13,802 | ||||||
1.375%, 01/15/2020 | 18,159 | 19,638 | ||||||
0.125%, 04/15/2016 | 33,079 | 33,412 | ||||||
0.125%, 04/15/2017 | 39,552 | 40,256 | ||||||
0.125%, 04/15/2018 | 43,098 | 43,967 | ||||||
0.125%, 04/15/2019 | 42,689 | 43,480 | ||||||
|
| |||||||
Total U.S. Treasury Obligations | 283,083 | |||||||
|
| |||||||
CASH EQUIVALENT — 0.4% |
| |||||||
SEI Daily Income Trust, Prime Obligation Fund, Cl A | ||||||||
0.010%*† | 1,180,676 | 1,181 | ||||||
|
| |||||||
Total Cash Equivalent | 1,181 | |||||||
|
| |||||||
Total Investments — 99.9% | $ | 284,264 | ||||||
|
| |||||||
Percentages are based on a Net Assets of $284,635 ($ Thousands)
| * | Rate shown is the 7-day effective yield as of March 31, 2015. |
| † | Investment in Affiliated Security (see Note 6). |
Cl — Class
The following is a summary of the inputs used as of March 31, 2015, in valuing the Fund’s investments carried at value ($ Thousands):
| Investments in Securities | Level 1 | Level 2 | Level 3 | Total | ||||||||||||
U.S. Treasury Obligations | $ | — | $ | 283,083 | $ | — | $ | 283,083 | ||||||||
Cash Equivalent | 1,181 | — | — | 1,181 | ||||||||||||
|
|
|
|
|
|
|
| |||||||||
Total Investments in Securities | $ | 1,181 | $ | 283,083 | $ | — | $ | 284,264 | ||||||||
|
|
|
|
|
|
|
| |||||||||
For the period ended March 31, 2015, there were no transfers between Level 1 and Level 2 assets and liabilities.
For the period ended March 31, 2015, there were no transfers between Level 2 and Level 3 assets and liabilities.
For the period ended March 31, 2015, there were no Level 3 investments.
For more information on valuation inputs, see Note 2 — Significant Accounting Policies in Notes to Financial Statements.
Amounts designated as “—” are $0 or have been rounded to $0.
The accompanying notes are an integral part of the financial statements.
| SEI Institutional Managed Trust / Semi-Annual Report / March 31, 2015 | 153 |
SCHEDULE OF INVESTMENTS (Unaudited)
Multi-Strategy Alternative Fund
March 31, 2015
| Description | Shares | Market Value ($ Thousands) | ||||||
REGISTERED INVESTMENT COMPANIES — 95.6% |
| |||||||
AQR Managed Futures Strategy Fund, Class I, Cl I | 2,620,089 | $ | 30,236 | |||||
ASG Managed Futures Strategy Fund, Cl Y | 1,786,533 | 21,974 | ||||||
Avenue Credit Strategies Fund, Cl I | 5,115,505 | 54,634 | ||||||
Blackrock Global Long/Short Credit Fund, Cl I | 6,500,987 | 68,585 | ||||||
Diamond Hill Long-Short Fund, Cl Y | 981,089 | 23,762 | ||||||
Driehaus Active Income Fund, Cl I | 4,497,082 | 46,995 | ||||||
Driehaus Select Credit Fund | 1,708,489 | 15,684 | ||||||
FPA Crescent Fund, Cl R | 782,116 | 26,428 | ||||||
Gabelli ABC Fund, Cl A | 2,775,356 | 28,364 | ||||||
Gotham Absolute Return Fund | 1,953,463 | 26,606 | ||||||
Merger Fund, Cl I | 4,597,876 | 72,646 | ||||||
Robeco Boston Partners Long/Short Research Fund, Cl I | 2,576,833 | 39,606 | ||||||
SEI Institutional Managed Trust Long/Short Alternative Fund, Cl A† | 3,623,202 | 37,066 | ||||||
WisdomTree Europe Hedged Equity Fund | 237,077 | 15,680 | ||||||
|
| |||||||
Total Registered Investment Companies (Cost $509,576) ($ Thousands) | 508,266 | |||||||
|
| |||||||
CASH EQUIVALENT — 4.3% |
| |||||||
SEI Daily Income Trust, Prime Obligation Fund, Cl A | ||||||||
0.010%*† | 22,960,140 | 22,960 | ||||||
|
| |||||||
Total Cash Equivalent | 22,960 | |||||||
|
| |||||||
Total Investments — 99.9% | $ | 531,226 | ||||||
|
| |||||||
Percentages are based on Net Assets of $531,498 ($Thousands).
| † | Investment in Affiliated Security (See Note 6). |
| * | Rate shown is the 7-day effective yield as of March 31, 2015. |
Cl — Class
As of March 31, 2015, all of the Fund’s investments were considered level 1, in accordance with ASC-820.
The following is a summary of the inputs used as of March 31, 2015, in valuing the Fund’s investments carried at value ($ Thousands):
| Investments in Securities | Level 1 | Level 2 | Level 3 | Total | ||||||||||||
Registered Investment Companies | $ | 508,266 | $ | — | $ | — | $ | 508,266 | ||||||||
Cash Equivalent | 22,960 | — | — | 22,960 | ||||||||||||
|
|
|
|
|
|
|
| |||||||||
Total Investments in Securities | $ | 531,226 | $ | — | $ | — | $ | 531,226 | ||||||||
|
|
|
|
|
|
|
| |||||||||
For the period ended March 31, 2015, there have been no transfers between Level 1 and Level 2 assets and liabilities.
For the period ended March 31, 2015, there have been no transfers between Level 2 and Level 3 assets and liabilities.
For the period ended March 31, 2015, there were no Level 3 investments.
For more information on valuation inputs, see Note 2 — Significant Accounting Policies in Notes to Financial Statements.
Amounts designated as “—” are $0 or have been rounded to $0.
The accompanying notes are an integral part of the financial statements.
| 154 | SEI Institutional Managed Trust / Semi-Annual Report / March 31, 2015 |
CONSOLIDATED SCHEDULE OF INVESTMENTS (Unaudited)
Multi-Asset Accumulation Fund
March 31, 2015
| Description | Face Amount (1) (Thousands) | Market Value ($ Thousands) | ||||||||||
SOVEREIGN DEBT — 12.7% |
| |||||||||||
Bundesrepublik Deutschland Bundesobligation Inflation Linked Bond | ||||||||||||
0.750%, 04/15/2018 to 04/15/2018 | EUR | 29,837 | $ | 33,761 | ||||||||
Canada Government International Bond (A) | ||||||||||||
1.625%, 02/27/2019 | 500 | 508 | ||||||||||
0.875%, 02/14/2017 | 1,200 | 1,206 | ||||||||||
Chile Government International Bond | ||||||||||||
3.875%, 08/05/2020 (A) | 250 | 273 | ||||||||||
China Development Bank | ||||||||||||
5.000%, 10/15/2015 (A) | 250 | 255 | ||||||||||
Deutsche Bundesrepublik Inflation Linked Bond | ||||||||||||
1.750%, 04/15/2020 to 04/15/2020 | EUR | 18,497 | 22,806 | |||||||||
1.500%, 04/15/2016 | EUR | 2,334 | 2,573 | |||||||||
0.500%, 04/15/2030 | EUR | 1,042 | 1,397 | |||||||||
0.100%, 04/15/2023 | EUR | 34,784 | 41,239 | |||||||||
Development Bank of Japan | ||||||||||||
5.125%, 02/01/2017 (A) | 200 | 215 | ||||||||||
Export Development Canada (A) | ||||||||||||
2.250%, 05/28/2015 | 250 | 251 | ||||||||||
0.750%, 12/15/2017 | 750 | 747 | ||||||||||
0.500%, 09/15/2015 | 1,250 | 1,252 | ||||||||||
France Government Bond OAT | ||||||||||||
3.400%, 07/25/2029 | EUR | 867 | 1,521 | |||||||||
3.150%, 07/25/2032 | EUR | 813 | 1,482 | |||||||||
2.250%, 07/25/2020 | EUR | 1,689 | 2,145 | |||||||||
2.100%, 07/25/2023 | EUR | 4,101 | 5,569 | |||||||||
1.850%, 07/25/2027 | EUR | 492 | 707 | |||||||||
1.800%, 07/25/2040 | EUR | 962 | 1,720 | |||||||||
1.600%, 07/25/2015 | EUR | 897 | 984 | |||||||||
1.300%, 07/25/2019 | EUR | 28,488 | 33,812 | |||||||||
1.100%, 07/25/2022 | EUR | 8,437 | 10,492 | |||||||||
1.000%, 07/25/2017 | EUR | 1,064 | 1,205 | |||||||||
0.700%, 07/25/2030 (B) | 197 | 261 | ||||||||||
| Description | Face Amount (1) (Thousands) | Market Value ($ Thousands) | ||||||||||
0.450%, 07/25/2016 | EUR | 602 | $ | 663 | ||||||||
0.250%, 07/25/2018 to 07/25/2024 | EUR | 15,957 | 18,220 | |||||||||
0.100%, 07/25/2021 | EUR | 1,198 | 1,380 | |||||||||
Hydro-Quebec (A) | ||||||||||||
2.000%, 06/30/2016 | 250 | 254 | ||||||||||
1.375%, 06/19/2017 | 150 | 152 | ||||||||||
Italy Buoni Poliennali Del Tesoro | ||||||||||||
3.100%, 09/15/2026 | EUR | 417 | 600 | |||||||||
2.600%, 09/15/2023 | EUR | 1,198 | 1,586 | |||||||||
2.550%, 09/15/2041 | EUR | 939 | 1,493 | |||||||||
2.350%, 09/15/2019 to 09/15/2035 (B) | EUR | 1,686 | 2,255 | |||||||||
2.100%, 09/15/2016 to 09/15/2021 | EUR | 2,623 | 3,105 | |||||||||
1.700%, 09/15/2018 to 09/15/2018 | EUR | 596 | 692 | |||||||||
Korea Development Bank | ||||||||||||
4.625%, 11/16/2021 (A) | 250 | 282 | ||||||||||
Province of British Columbia (A) | ||||||||||||
6.500%, 01/15/2026 | 250 | 340 | ||||||||||
2.000%, 10/23/2022 | 250 | 250 | ||||||||||
Province of Ontario Canada (A) | ||||||||||||
2.450%, 06/29/2022 | 250 | 256 | ||||||||||
0.950%, 05/26/2015 | 250 | 250 | ||||||||||
Svensk Exportkredit | ||||||||||||
5.125%, 03/01/2017 (A) | 150 | 162 | ||||||||||
United Kingdom Gilt Inflation Linked | ||||||||||||
4.125%, 07/22/2030 | GBP | 160 | 813 | |||||||||
2.500%, 07/26/2016 to 07/17/2024 | GBP | 869 | 4,552 | |||||||||
2.000%, 01/26/2035 | GBP | 432 | 1,520 | |||||||||
1.875%, 11/22/2022 to 11/22/2022 | GBP | 18,007 | 33,229 | |||||||||
1.250%, 11/22/2017 to 11/22/2055 | GBP | 4,168 | 9,325 | |||||||||
1.125%, 11/22/2037 | GBP | 1,394 | 3,131 | |||||||||
0.750%, 03/22/2034 to 11/22/2047 | GBP | 1,287 | 2,878 | |||||||||
0.625%, 03/22/2040 to 11/22/2042 | GBP | 1,428 | 3,114 | |||||||||
0.500%, 03/22/2050 | GBP | 419 | 978 | |||||||||
0.375%, 03/22/2062 | GBP | 480 | 1,245 | |||||||||
0.250%, 03/22/2052 | GBP | 633 | 1,404 | |||||||||
0.125%, 03/22/2024 to 03/22/2068 | GBP | 6,745 | 11,501 | |||||||||
|
| |||||||||||
Total Sovereign Debt (Cost $295,655) ($ Thousands) |
| 272,011 | ||||||||||
|
| |||||||||||
| SEI Institutional Managed Trust / Semi-Annual Report / March 31, 2015 | 155 |
CONSOLIDATED SCHEDULE OF INVESTMENTS (Unaudited)
Multi-Asset Accumulation Fund (Continued)
March 31, 2015
| Description | Shares | Market Value ($ Thousands) | ||||||||
FOREIGN COMMON STOCK — 4.7% |
| |||||||||
Australia — 0.3% | ||||||||||
AGL Energy | 25,712 | $ | 299 | |||||||
ALS | 15,614 | 59 | ||||||||
APA Group | 38,075 | 263 | ||||||||
Asciano | 15,358 | 74 | ||||||||
ASX | 2,472 | 78 | ||||||||
Aurizon Holdings | 21,309 | 79 | ||||||||
AusNet Services | 307,946 | 344 | ||||||||
BHP Billiton | 5,561 | 132 | ||||||||
Brambles | 9,655 | 85 | ||||||||
Caltex Australia | 6,748 | 180 | ||||||||
Coca-Cola Amatil | 19,358 | 160 | ||||||||
Cochlear | 2,895 | 200 | ||||||||
Computershare | 58,392 | 568 | ||||||||
Crown Resorts | 10,576 | 108 | ||||||||
CSL | 3,524 | 248 | ||||||||
Fortescue Metals Group | 27,506 | 41 | ||||||||
Harvey Norman Holdings | 38,002 | 129 | ||||||||
Iluka Resources | 13,740 | 89 | ||||||||
Incitec Pivot | 29,314 | 91 | ||||||||
Insurance Australia Group | 7,664 | 36 | ||||||||
Leighton Holdings | 4,686 | 76 | ||||||||
Lend Lease Group | 1,259 | 16 | ||||||||
Novion Property Group† | 17,960 | 35 | ||||||||
Origin Energy | 18,917 | 163 | ||||||||
Qantas Airways* | 27,446 | 66 | ||||||||
Ramsay Health Care | 5,073 | 260 | ||||||||
REA Group | 2,602 | 96 | ||||||||
Rio Tinto | 2,745 | 120 | ||||||||
Santos | 26,897 | 147 | ||||||||
Scentre Group† | 11,668 | 33 | ||||||||
Sonic Healthcare | 16,500 | 258 | ||||||||
Sydney Airport | 20,066 | 79 | ||||||||
Tabcorp Holdings | 34,462 | 125 | ||||||||
Tatts Group | 44,420 | 135 | ||||||||
Telstra, Cl B | 100,746 | 485 | ||||||||
Toll Holdings | 15,948 | 108 | ||||||||
TPG Telecom | 39,634 | 278 | ||||||||
Transurban Group | 13,849 | 101 | ||||||||
Treasury Wine Estates | 30,987 | 121 | ||||||||
Wesfarmers | 4,028 | 135 | ||||||||
Westfield† | 9,207 | 67 | ||||||||
Woodside Petroleum | 6,856 | 181 | ||||||||
Woolworths | 9,620 | 217 | ||||||||
WorleyParsons | 13,343 | 97 | ||||||||
|
| |||||||||
| 6,662 | ||||||||||
|
| |||||||||
Austria — 0.0% | ||||||||||
Andritz | 4,304 | 257 | ||||||||
Erste Group Bank | 2,296 | 57 | ||||||||
OMV | 10,786 | 296 | ||||||||
Raiffeisen Bank International | 5,812 | 81 | ||||||||
| Description | Shares | Market Value ($ Thousands) | ||||||||
Vienna Insurance Group Wiener Versicherung Gruppe | 1,302 | $ | 58 | |||||||
voestalpine | 5,195 | 190 | ||||||||
|
| |||||||||
| 939 | ||||||||||
|
| |||||||||
Belgium — 0.1% | ||||||||||
Ageas | 2,714 | 98 | ||||||||
Anheuser-Busch InBev | 1,572 | 192 | ||||||||
Belgacom | 10,032 | 351 | ||||||||
Colruyt | 7,170 | 312 | ||||||||
Delhaize Group | 2,391 | 215 | ||||||||
KBC Groep | 1,942 | 120 | ||||||||
Solvay | 1,290 | 187 | ||||||||
Telenet Group Holding* | 5,192 | 285 | ||||||||
UCB, Cl A | 5,104 | 369 | ||||||||
Umicore | 4,213 | 176 | ||||||||
|
| |||||||||
| 2,305 | ||||||||||
|
| |||||||||
Canada — 0.4% | ||||||||||
Agnico Eagle Mines | 2,432 | 68 | ||||||||
Agrium | 572 | 60 | ||||||||
Alimentation Couche-Tard, Cl B | 5,390 | 215 | ||||||||
Atco, Cl I | 7,027 | 250 | ||||||||
Bank of Montreal | 1,312 | 79 | ||||||||
Bank of Nova Scotia, Cl C | 1,590 | 80 | ||||||||
Barrick Gold | 5,996 | 65 | ||||||||
BCE | 7,519 | 319 | ||||||||
BlackBerry* | 20,413 | 182 | ||||||||
Bombardier, Cl B | 39,089 | 77 | ||||||||
CAE | 9,180 | 107 | ||||||||
Cameco | 4,393 | 61 | ||||||||
Canadian National Railway | 2,192 | 147 | ||||||||
Canadian Natural Resources | 4,257 | 131 | ||||||||
Canadian Pacific Railway | 641 | 117 | ||||||||
Canadian Tire, Cl A | 1,794 | 183 | ||||||||
Canadian Utilities, Cl A | 9,262 | 291 | ||||||||
Catamaran* | 8,256 | 492 | ||||||||
CGI Group, Cl A* | 8,094 | 343 | ||||||||
CI Financial | 3,354 | 94 | ||||||||
Constellation Software | 1,025 | 354 | ||||||||
Crescent Point Energy, Cl F | 3,070 | 68 | ||||||||
Dollarama | 3,747 | 209 | ||||||||
Empire, Cl A | 2,869 | 200 | ||||||||
Encana | 2,274 | 25 | ||||||||
Enerplus | 6,704 | 68 | ||||||||
Finning International | 5,472 | 102 | ||||||||
First Quantum Minerals (Canada) | 2,143 | 26 | ||||||||
Fortis | 9,759 | 297 | ||||||||
Franco-Nevada | 1,000 | 48 | ||||||||
George Weston | 2,819 | 223 | ||||||||
Gildan Activewear | 4,096 | 121 | ||||||||
H&R† | 2,987 | 55 | ||||||||
Husky Energy | 3,850 | 79 | ||||||||
Imperial Oil | 1,807 | 72 | ||||||||
| 156 | SEI Institutional Managed Trust / Semi-Annual Report / March 31, 2015 |
| Description | Shares | Market Value ($ Thousands) | ||||||||
Intact Financial | 860 | $ | 65 | |||||||
Kinross Gold* | 14,314 | 32 | ||||||||
Loblaw | 4,968 | 243 | ||||||||
Magna International, Cl A | 2,438 | 130 | ||||||||
MEG Energy* | 4,716 | 76 | ||||||||
Methanex | 1,070 | 57 | ||||||||
Metro, Cl A | 7,776 | 211 | ||||||||
National Bank of Canada | 2,275 | 83 | ||||||||
Open Text | 4,874 | 257 | ||||||||
Potash Corp of Saskatchewan | 2,157 | 70 | ||||||||
Restaurant Brands International | 2,608 | 100 | ||||||||
RioCan, Cl Trust Unit† | 3,430 | 79 | ||||||||
Rogers Communications, Cl B | 8,565 | 287 | ||||||||
Saputo | 6,869 | 189 | ||||||||
Shaw Communications, Cl B | 7,879 | 177 | ||||||||
Silver Wheaton, Cl H | 3,032 | 58 | ||||||||
SNC-Lavalin Group | 2,856 | 89 | ||||||||
Suncor Energy | 2,370 | 69 | ||||||||
Teck Resources, Cl B | 2,423 | 33 | ||||||||
TELUS | 9,642 | 320 | ||||||||
Thomson Reuters, Cl B | 4,373 | 177 | ||||||||
Toronto-Dominion Bank | 1,857 | 79 | ||||||||
TransAlta | 39,227 | 364 | ||||||||
Turquoise Hill Resources* | 6,748 | 21 | ||||||||
Valeant Pharmaceuticals International* | 1,935 | 382 | ||||||||
Vermilion Energy | 783 | 33 | ||||||||
|
| |||||||||
| 8,989 | ||||||||||
|
| |||||||||
China — 0.0% | ||||||||||
Sands China | 18,800 | 78 | ||||||||
Yangzijiang Shipbuilding Holdings | 63,108 | 58 | ||||||||
|
| |||||||||
| 136 | ||||||||||
|
| |||||||||
Denmark — 0.1% | ||||||||||
AP Moeller - Maersk, Cl A | 30 | 61 | ||||||||
AP Moeller - Maersk, Cl B | 35 | 73 | ||||||||
Carlsberg, Cl B | 3,116 | 257 | ||||||||
Coloplast, Cl B | 4,159 | 314 | ||||||||
Danske Bank | 4,782 | 126 | ||||||||
Novo Nordisk, Cl B | 5,821 | 311 | ||||||||
Novozymes, Cl B | 7,255 | 332 | ||||||||
Pandora | 2,293 | 209 | ||||||||
TDC | 45,663 | 327 | ||||||||
Tryg | 1,437 | 170 | ||||||||
Vestas Wind Systems | 2,083 | 86 | ||||||||
William Demant Holding* | 4,218 | 358 | ||||||||
|
| |||||||||
| 2,624 | ||||||||||
|
| |||||||||
Finland — 0.1% | ||||||||||
Elisa | 11,689 | 294 | ||||||||
Fortum | 15,567 | 327 | ||||||||
| Description | Shares | Market Value ($ Thousands) | ||||||||
Kone, Cl B | 2,993 | $ | 133 | |||||||
Metso | 2,878 | 84 | ||||||||
Neste Oil | 14,268 | 374 | ||||||||
Nokia | 45,724 | 349 | ||||||||
Nokian Renkaat | 6,652 | 199 | ||||||||
Orion, Cl B | 11,412 | 322 | ||||||||
Sampo, Cl A | 3,627 | 183 | ||||||||
Stora Enso, Cl R | 16,819 | 173 | ||||||||
UPM-Kymmene, Cl V | 9,046 | 176 | ||||||||
Wartsila OYJ Abp | 2,318 | 103 | ||||||||
|
| |||||||||
| 2,717 | ||||||||||
|
| |||||||||
France — 0.3% | ||||||||||
Accor | 875 | 46 | ||||||||
Aeroports de Paris, Cl A | 373 | 45 | ||||||||
Air Liquide | 1,030 | 133 | ||||||||
Alcatel-Lucent* | 39,326 | 149 | ||||||||
ArcelorMittal | 7,041 | 66 | ||||||||
Arkema | 1,313 | 104 | ||||||||
AtoS | 2,646 | 183 | ||||||||
Bouygues | 892 | 35 | ||||||||
Bureau Veritas | 900 | 19 | ||||||||
Capital Gemini | 2,586 | 212 | ||||||||
Carrefour | 3,050 | 102 | ||||||||
Casino Guichard Perrachon | 1,110 | 98 | ||||||||
Christian Dior, Cl B | 506 | 96 | ||||||||
CNP Assurances | 1,903 | 33 | ||||||||
Credit Agricole | 5,388 | 79 | ||||||||
Danone | 1,646 | 111 | ||||||||
Dassault Systemes | 4,104 | 278 | ||||||||
Electricite de France | 6,186 | 148 | ||||||||
Essilor International | 3,685 | 423 | ||||||||
Eutelsat Communications | 1,501 | 50 | ||||||||
Fonciere Des Regions† | 434 | 43 | ||||||||
GDF Suez | 8,471 | 167 | ||||||||
Groupe Eurotunnel | 4,624 | 66 | ||||||||
Hermes International | 26 | 9 | ||||||||
ICADE† | 512 | 46 | ||||||||
Iliad | 890 | 208 | ||||||||
Klepierre† | 1,965 | 96 | ||||||||
L’Oreal | 607 | 112 | ||||||||
LVMH Moet Hennessy Louis Vuitton | 241 | 42 | ||||||||
Natixis | 5,679 | 42 | ||||||||
Numericable-SFR SAS* | 536 | 29 | ||||||||
Orange | 12,973 | 208 | ||||||||
Pernod Ricard | 1,010 | 120 | ||||||||
Remy Cointreau | 1,323 | 97 | ||||||||
Renault | 450 | 41 | ||||||||
Rexel | 3,641 | 69 | ||||||||
Sanofi | 3,584 | 354 | ||||||||
Schneider Electric | 577 | 45 | ||||||||
SCOR | 1,457 | 49 | ||||||||
Suez Environnement | 8,879 | 153 | ||||||||
| SEI Institutional Managed Trust / Semi-Annual Report / March 31, 2015 | 157 |
CONSOLIDATED SCHEDULE OF INVESTMENTS (Unaudited)
Multi-Asset Accumulation Fund (Continued)
March 31, 2015
| Description | Shares | Market Value ($ Thousands) | ||||||||
Technip | 3,330 | $ | 202 | |||||||
Thales, Cl A | 1,585 | 88 | ||||||||
Total | 4,332 | 215 | ||||||||
Unibail-Rodamco† | 139 | 38 | ||||||||
Valeo | 335 | 50 | ||||||||
Veolia Environnement | 8,189 | 155 | ||||||||
Vinci | 822 | 47 | ||||||||
Vivendi | 5,849 | 145 | ||||||||
Wendel | 681 | 81 | ||||||||
|
| |||||||||
| 5,427 | ||||||||||
|
| |||||||||
Germany — 0.3% | ||||||||||
adidas | 861 | 68 | ||||||||
Allianz | 347 | 60 | ||||||||
BASF | 1,028 | 102 | ||||||||
Bayer | 1,109 | 167 | ||||||||
Beiersdorf | 1,696 | 147 | ||||||||
Brenntag | 1,131 | 68 | ||||||||
Commerzbank* | 5,497 | 76 | ||||||||
Continental | 286 | 68 | ||||||||
Deutsche Bank | 2,043 | 71 | ||||||||
Deutsche Boerse | 557 | 45 | ||||||||
Deutsche Lufthansa | 5,273 | 74 | ||||||||
Deutsche Post | 2,302 | 72 | ||||||||
Deutsche Telekom | 15,661 | 287 | ||||||||
E.ON | 19,460 | 290 | ||||||||
Fraport Frankfurt Airport Services Worldwide | 1,521 | 91 | ||||||||
Fresenius | 3,623 | 216 | ||||||||
Fresenius Medical Care | 3,975 | 331 | ||||||||
GEA Group | 1,568 | 76 | ||||||||
Hannover Rueck | 619 | 64 | ||||||||
HeidelbergCement | 879 | 70 | ||||||||
Henkel & KGaA | 1,543 | 159 | ||||||||
Infineon Technologies | 20,066 | 240 | ||||||||
K+S | 2,963 | 97 | ||||||||
LANXESS | 1,587 | 84 | ||||||||
Linde | 488 | 99 | ||||||||
MAN | 398 | 42 | ||||||||
Merck KGaA | 1,711 | 192 | ||||||||
Metro | 4,277 | 145 | ||||||||
Muenchener Rueckversicherungs-Gesellschaft in Muenchen | 274 | 59 | ||||||||
OSRAM Licht | 1,575 | 78 | ||||||||
RTL Group | 682 | 66 | ||||||||
RWE | 9,447 | 241 | ||||||||
SAP | 4,798 | 348 | ||||||||
Siemens | 850 | 92 | ||||||||
Telefonica Deutschland Holding | 49,505 | 286 | ||||||||
ThyssenKrupp | 3,604 | 95 | ||||||||
TUI | 3,217 | 57 | ||||||||
United Internet | 6,170 | 281 | ||||||||
Volkswagen | 135 | 35 | ||||||||
|
| |||||||||
| 5,139 | ||||||||||
|
| |||||||||
| Description | Shares | Market Value ($ Thousands) | ||||||||
Hong Kong — 0.3% | ||||||||||
AIA Group | 13,800 | $ | 87 | |||||||
ASM Pacific Technology | 55,600 | 579 | ||||||||
Cathay Pacific Airways | 77,000 | 178 | ||||||||
Cheung Kong Infrastructure Holdings | 60,438 | 520 | ||||||||
CLP Holdings, Cl B | 67,500 | 590 | ||||||||
Galaxy Entertainment Group | 24,000 | 109 | ||||||||
Genting Singapore | 238,600 | 160 | ||||||||
HKT Trust and HKT | 283,920 | 366 | ||||||||
Hong Kong & China Gas | 165,420 | 383 | ||||||||
Hopewell Hong Kong Properties* | 660 | 0 | ||||||||
Hutchison Whampoa | 12,000 | 167 | ||||||||
Kerry Properties | 13,000 | 45 | ||||||||
Li & Fung | 154,000 | 150 | ||||||||
Link† | 13,500 | 83 | ||||||||
MGM China Holdings | 30,000 | 56 | ||||||||
MTR | 49,500 | 236 | ||||||||
NWS Holdings | 87,000 | 145 | ||||||||
PCCW | 841,000 | 513 | ||||||||
Power Assets Holdings | 58,602 | 599 | ||||||||
Shangri-La Asia | 82,000 | 113 | ||||||||
SJM Holdings | 52,000 | 68 | ||||||||
Swire Pacific, Cl A | 4,000 | 55 | ||||||||
Swire Properties | 7,800 | 25 | ||||||||
Techtronic Industries | 31,500 | 106 | ||||||||
WH Group* (B) | 769,000 | 437 | ||||||||
Wynn Macau | 27,600 | 60 | ||||||||
Yue Yuen Industrial Holdings | 30,500 | 108 | ||||||||
|
| |||||||||
| 5,938 | ||||||||||
|
| |||||||||
Ireland — 0.1% | ||||||||||
Accenture, Cl A | 1,368 | 128 | ||||||||
Actavis* | 639 | 190 | ||||||||
Bank of Ireland* | 340,737 | 130 | ||||||||
CRH | 8,888 | 231 | ||||||||
Eaton | 1,420 | 97 | ||||||||
Endo International* | 1,107 | 99 | ||||||||
Kerry Group, Cl A | 4,069 | 273 | ||||||||
Mallinckrodt* | 905 | 115 | ||||||||
Pentair | 1,504 | 95 | ||||||||
Perrigo | 895 | 148 | ||||||||
Ryanair Holdings ADR | 3,514 | 235 | ||||||||
Seagate Technology | 1,313 | 68 | ||||||||
|
| |||||||||
| 1,809 | ||||||||||
|
| |||||||||
Israel — 0.1% | ||||||||||
Bank Hapoalim | 29,177 | 141 | ||||||||
Bank Leumi Le-Israel* | 39,720 | 147 | ||||||||
Bezeq The Israeli Telecommunication | 203,497 | 379 | ||||||||
Delek Group | 1,554 | 401 | ||||||||
Israel | 713 | 249 | ||||||||
| 158 | SEI Institutional Managed Trust / Semi-Annual Report / March 31, 2015 |
| Description | Shares | Market Value ($ Thousands) | ||||||||
Israel Chemicals | 35,881 | $ | 255 | |||||||
Mizrahi Tefahot Bank* | 12,761 | 130 | ||||||||
NICE-Systems | 10,385 | 637 | ||||||||
Teva Pharmaceutical Industries | 8,893 | 558 | ||||||||
|
| |||||||||
| 2,897 | ||||||||||
|
| |||||||||
Italy — 0.1% | ||||||||||
Assicurazioni Generali | 2,134 | 42 | ||||||||
Atlantia | 3,095 | 81 | ||||||||
Banca Monte dei Paschi di Siena* | 35,686 | 24 | ||||||||
CNH Industrial | 12,849 | 105 | ||||||||
Enel | 50,173 | 227 | ||||||||
Enel Green Power | 79,805 | 149 | ||||||||
Eni | 10,812 | 187 | ||||||||
Fiat Chrysler Automobiles* | 8,569 | 139 | ||||||||
Finmeccanica | 5,105 | 61 | ||||||||
Luxottica Group | 2,908 | 185 | ||||||||
Pirelli & C. | 9,024 | 150 | ||||||||
Prysmian | 5,661 | 117 | ||||||||
Saipem | 14,596 | 149 | ||||||||
Snam Rete Gas | 39,115 | 190 | ||||||||
Telecom Italia | 386,623 | 402 | ||||||||
Tenaris | 11,719 | 164 | ||||||||
Terna Rete Elettrica Nazionale | 44,057 | 194 | ||||||||
UnipolSai | 8,846 | 26 | ||||||||
|
| |||||||||
| 2,592 | ||||||||||
|
| |||||||||
Japan — 0.8% | ||||||||||
Acom* | 22,800 | 79 | ||||||||
Aeon, Cl H | 8,800 | 97 | ||||||||
AEON Financial Service | 2,800 | 71 | ||||||||
Air Water | 5,000 | 89 | ||||||||
Aisin Seiki | 2,000 | 73 | ||||||||
Ajinomoto | 7,000 | 154 | ||||||||
Alfresa Holdings | 9,100 | 129 | ||||||||
ANA Holdings | 20,000 | 54 | ||||||||
Asahi Group Holdings | 2,800 | 89 | ||||||||
Asahi Kasei | 9,000 | 86 | ||||||||
Astellas Pharma | 8,000 | 131 | ||||||||
Bank of Kyoto | 11,000 | 115 | ||||||||
Bank of Yokohama | 13,000 | 76 | ||||||||
Benesse, Cl A | 2,700 | 85 | ||||||||
Bridgestone | 2,000 | 80 | ||||||||
Calbee | 2,000 | 87 | ||||||||
Central Japan Railway | 400 | 72 | ||||||||
Chiba Bank, Cl B | 14,000 | 103 | ||||||||
Chubu Electric Power | 11,300 | 135 | ||||||||
Chugai Pharmaceutical | 2,500 | 79 | ||||||||
Chugoku Bank | 7,600 | 114 | ||||||||
Chugoku Electric Power | 12,200 | 159 | ||||||||
Daicel | 7,000 | 84 | ||||||||
Daiichi Sankyo | 6,700 | 106 | ||||||||
Daito Trust Construction | 900 | 101 | ||||||||
Daiwa House Industry | 3,400 | 67 | ||||||||
| Description | Shares | Market Value ($ Thousands) | ||||||||
Daiwa Securities Group | 8,000 | $ | 63 | |||||||
Dentsu | 1,000 | 43 | ||||||||
East Japan Railway | 1,000 | 80 | ||||||||
Eisai | 2,700 | 192 | ||||||||
Electric Power Development | 6,100 | 206 | ||||||||
FamilyMart, Cl H | 2,600 | 109 | ||||||||
Fast Retailing | 100 | 39 | ||||||||
Fuji Heavy Industries | 900 | 30 | ||||||||
FUJIFILM Holdings | 2,200 | 79 | ||||||||
Fukuoka Financial Group | 17,000 | 88 | ||||||||
Gunma Bank | 14,000 | 95 | ||||||||
Hachijuni Bank | 15,000 | 106 | ||||||||
Hakuhodo DY Holdings | 7,000 | 75 | ||||||||
Hankyu Hanshin Holdings | 7,000 | 43 | ||||||||
Hirose Electric | 840 | 109 | ||||||||
Hiroshima Bank | 19,000 | 103 | ||||||||
Hisamitsu Pharmaceutical | 2,900 | 119 | ||||||||
Hitachi Chemical | 3,039 | 65 | ||||||||
Hitachi Metals | 5,000 | 77 | ||||||||
Hokuriku Electric Power | 11,100 | 147 | ||||||||
Idemitsu Kosan | 13,400 | 234 | ||||||||
Inpex | 16,300 | 180 | ||||||||
Itochu Techno-Solutions | 4,800 | 100 | ||||||||
Iyo Bank | 8,900 | 106 | ||||||||
J Front Retailing | 3,000 | 47 | ||||||||
Japan Prime Realty Investment, Cl A† | 24 | 83 | ||||||||
Japan Real Estate Investment† | 20 | 94 | ||||||||
Japan Retail Fund Investment, Cl A† | 52 | 103 | ||||||||
Japan Tobacco | 2,300 | 73 | ||||||||
Joyo Bank | 21,000 | 108 | ||||||||
JX Holdings | 56,400 | 217 | ||||||||
Kajima | 7,000 | 33 | ||||||||
Kakaku.com | 5,600 | 93 | ||||||||
Kamigumi | 8,000 | 76 | ||||||||
Kaneka | 12,000 | 85 | ||||||||
Kansai Electric Power | 14,900 | 143 | ||||||||
Kansai Paint | 3,000 | 54 | ||||||||
Kao | 2,700 | 135 | ||||||||
KDDI | 12,600 | 286 | ||||||||
Keikyu | 4,000 | 32 | ||||||||
Keio | 10,000 | 79 | ||||||||
Keyence | 200 | 109 | ||||||||
Kintetsu Group Holdings | 15,000 | 55 | ||||||||
Kirin Holdings | 6,100 | 80 | ||||||||
Konami | 3,656 | 68 | ||||||||
Kyowa Hakko Kirin | 10,000 | 131 | ||||||||
Kyushu Electric Power | 13,700 | 133 | ||||||||
Lawson | 1,600 | 111 | ||||||||
LIXIL Group | 3,000 | 71 | ||||||||
M3 | 5,900 | 126 | ||||||||
Maruichi Steel Tube | 3,200 | 76 | ||||||||
McDonald’s Holdings Japan | 6,600 | 146 | ||||||||
| SEI Institutional Managed Trust / Semi-Annual Report / March 31, 2015 | 159 |
CONSOLIDATED SCHEDULE OF INVESTMENTS (Unaudited)
Multi-Asset Accumulation Fund (Continued)
March 31, 2015
| Description | Shares | Market Value ($ Thousands) | ||||||||
Medipal Holdings | 9,200 | $ | 120 | |||||||
MEIJI Holdings | 1,300 | 159 | ||||||||
Miraca Holdings | 2,800 | 129 | ||||||||
Mitsubishi Chemical Holdings, Cl B | 13,500 | 79 | ||||||||
Mitsubishi Motors | 4,200 | 38 | ||||||||
Mitsubishi Tanabe Pharma | 7,400 | 127 | ||||||||
Mitsui Chemicals | 9,000 | 29 | ||||||||
Murata Manufacturing | 500 | 69 | ||||||||
NEC | 12,000 | 35 | ||||||||
NGK Spark Plug | 2,600 | 70 | ||||||||
NH Foods | 4,000 | 92 | ||||||||
NHK Spring | 3,000 | 32 | ||||||||
Nippon Building Fund† | 23 | 113 | ||||||||
Nippon Electric Glass | 13,000 | 63 | ||||||||
Nippon Express | 13,000 | 73 | ||||||||
Nippon Prologis† | 52 | 115 | ||||||||
Nippon Steel & Sumitomo Metal | 28,555 | 72 | ||||||||
Nippon Telegraph & Telephone | 6,300 | 389 | ||||||||
Nisshin Seifun Group | 9,415 | 111 | ||||||||
Nissin Food Products | 2,000 | 98 | ||||||||
Nitori Holdings | 1,000 | 68 | ||||||||
NOK | 1,500 | 45 | ||||||||
Nomura Research Institute | 1,800 | 68 | ||||||||
NTT Data | 2,000 | 87 | ||||||||
NTT DOCOMO | 22,700 | 395 | ||||||||
Odakyu Electric Railway | 8,000 | 82 | ||||||||
Oji Holdings | 22,000 | 90 | ||||||||
Ono Pharmaceutical | 1,100 | 125 | ||||||||
Oracle Japan | 1,900 | 82 | ||||||||
Osaka Gas | 78,000 | 327 | ||||||||
Otsuka Holdings | 3,400 | 107 | ||||||||
Resona Holdings | 16,900 | 84 | ||||||||
Rohm | 800 | 55 | ||||||||
Sankyo | 2,300 | 82 | ||||||||
Santen Pharmaceutical | 8,500 | 124 | ||||||||
Sekisui Chemical | 3,000 | 39 | ||||||||
Seven & i Holdings | 2,100 | 89 | ||||||||
Seven Bank | 22,700 | 112 | ||||||||
Sharp | 8,000 | 15 | ||||||||
Shikoku Electric Power | 12,600 | 156 | ||||||||
Shimadzu | 9,000 | 101 | ||||||||
Shimamura | 1,000 | 92 | ||||||||
Shimizu | 3,000 | 20 | ||||||||
Shin-Etsu Chemical, Cl A | 1,100 | 72 | ||||||||
Shiseido | 5,900 | 105 | ||||||||
Shizuoka Bank | 11,000 | 110 | ||||||||
Showa Shell Sekiyu | 23,600 | 216 | ||||||||
SoftBank | 4,100 | 238 | ||||||||
Sumitomo | 6,500 | 70 | ||||||||
Suntory Beverage & Food | 4,000 | 172 | ||||||||
Suruga Bank | 5,600 | 117 | ||||||||
Suzuken | 3,960 | 121 | ||||||||
Sysmex | 2,500 | 139 | ||||||||
Taisei | 5,000 | 28 | ||||||||
| Description | Shares | Market Value ($ Thousands) | ||||||||
Takeda Pharmaceutical | 2,600 | $ | 130 | |||||||
Teijin | 24,000 | 82 | ||||||||
Terumo | 4,000 | 106 | ||||||||
Tobu Railway | 17,000 | 81 | ||||||||
Toho | 1,600 | 39 | ||||||||
Toho Gas | 49,063 | 287 | ||||||||
Tohoku Electric Power | 8,400 | 96 | ||||||||
Tokyo Electric Power* | 8,800 | 33 | ||||||||
Tokyo Gas | 47,000 | 296 | ||||||||
Tokyu | 4,000 | 25 | ||||||||
TonenGeneral Sekiyu | 28,000 | 242 | ||||||||
Toray Industries | 10,000 | 84 | ||||||||
TOTO | 2,000 | 30 | ||||||||
Toyo Seikan Group Holdings | 1,900 | 28 | ||||||||
Toyo Suisan Kaisha | 3,000 | 106 | ||||||||
Toyota Industries | 1,900 | 109 | ||||||||
Toyota Motor | 1,700 | 119 | ||||||||
Unicharm | 4,900 | 129 | ||||||||
United Urban Investment† | 66 | 103 | ||||||||
USS | 5,600 | 97 | ||||||||
West Japan Railway | 1,500 | 79 | ||||||||
Yakult Honsha | 1,800 | 126 | ||||||||
Yamaguchi Financial Group | 9,000 | 104 | ||||||||
Yamato Holdings | 1,400 | 32 | ||||||||
Yamato Kogyo | 2,400 | 58 | ||||||||
Yamazaki Baking | 9,000 | 163 | ||||||||
|
| |||||||||
| 16,480 | ||||||||||
|
| |||||||||
Luxembourg — 0.0% | ||||||||||
SES | 1,713 | 61 | ||||||||
|
| |||||||||
Netherlands — 0.2% | ||||||||||
Aegon | 10,544 | 83 | ||||||||
Akzo Nobel | 2,588 | 196 | ||||||||
Altice* | 1,441 | 156 | ||||||||
ASML Holding | 3,148 | 321 | ||||||||
Delta Lloyd | 4,573 | 86 | ||||||||
Gemalto | 4,556 | 363 | ||||||||
Heineken | 1,925 | 147 | ||||||||
ING Groep* | 6,346 | 93 | ||||||||
Koninklijke Ahold | 9,243 | 182 | ||||||||
Koninklijke Boskalis Westminster | 1,861 | 91 | ||||||||
Koninklijke DSM | 3,445 | 192 | ||||||||
Koninklijke Philips | 3,383 | 96 | ||||||||
Koninklijke Vopak | 7,881 | 435 | ||||||||
LyondellBasell Industries, Cl A | 1,954 | 172 | ||||||||
Nielsen | 2,573 | 115 | ||||||||
OCI* | 4,290 | 133 | ||||||||
QIAGEN* | 7,992 | 202 | ||||||||
Randstad Holding | 1,641 | 99 | ||||||||
Reed Elsevier | 7,135 | 178 | ||||||||
Royal KPN | 104,373 | 354 | ||||||||
STMicroelectronics | 19,072 | 178 | ||||||||
TNT Express | 11,374 | 72 | ||||||||
| 160 | SEI Institutional Managed Trust / Semi-Annual Report / March 31, 2015 |
| Description | Shares | Market Value ($ Thousands) | ||||||||
Unilever | 3,312 | $ | 138 | |||||||
Wolters Kluwer | 5,792 | 189 | ||||||||
|
| |||||||||
| 4,271 | ||||||||||
|
| |||||||||
New Zealand — 0.1% | ||||||||||
Auckland International Airport | 76,585 | 259 | ||||||||
Contact Energy | 79,201 | 355 | ||||||||
Fletcher Building | 46,704 | 295 | ||||||||
Meridian Energy | 197,096 | 299 | ||||||||
Mighty River Power | 112,969 | 263 | ||||||||
Ryman Healthcare | 67,499 | 397 | ||||||||
Spark New Zealand | 186,746 | 417 | ||||||||
|
| |||||||||
| 2,285 | ||||||||||
|
| |||||||||
Norway — 0.1% | ||||||||||
DNB, Cl A | 7,426 | 120 | ||||||||
Gjensidige Forsikring | 8,708 | 150 | ||||||||
Norsk Hydro | 27,439 | 144 | ||||||||
Orkla | 35,918 | 272 | ||||||||
Seadrill | 8,660 | 81 | ||||||||
Statoil | 8,873 | 157 | ||||||||
Telenor | 19,827 | 401 | ||||||||
Yara International | 3,178 | 162 | ||||||||
|
| |||||||||
| 1,487 | ||||||||||
|
| |||||||||
Panama — 0.0% | ||||||||||
Carnival | 1,983 | 95 | ||||||||
|
| |||||||||
Portugal — 0.1% | ||||||||||
Banco Comercial Portugues, Cl R* | 1,595,885 | 164 | ||||||||
Banco Espirito Santo* | 50,830 | 7 | ||||||||
EDP - Energias de Portugal | 85,324 | 319 | ||||||||
Galp Energia SGPS | 24,102 | 261 | ||||||||
Jeronimo Martins SGPS | 20,081 | 252 | ||||||||
|
| |||||||||
| 1,003 | ||||||||||
|
| |||||||||
Singapore — 0.2% | ||||||||||
Avago Technologies, Cl A | 714 | 91 | ||||||||
CapitaLand | 33,800 | 88 | ||||||||
DBS Group Holdings | 7,800 | 116 | ||||||||
Global Logistic Properties | 42,000 | 81 | ||||||||
Golden Agri-Resources | 1,002,400 | 311 | ||||||||
Hutchison Port Holdings, Cl U | 150,126 | 104 | ||||||||
Jardine Cycle & Carriage | 6,200 | 186 | ||||||||
Keppel | 16,600 | 109 | ||||||||
Keppel Land | 18,000 | 59 | ||||||||
Oversea-Chinese Banking | 12,800 | 98 | ||||||||
Sembcorp Industries | 31,300 | 96 | ||||||||
Sembcorp Marine | 42,000 | 89 | ||||||||
Singapore Exchange | 22,900 | 136 | ||||||||
Singapore Press Holdings | 97,800 | 299 | ||||||||
Singapore Technologies Engineering | 25,400 | 64 | ||||||||
| Description | Shares | Market Value ($ Thousands) | ||||||||
Singapore Telecommunications | 133,600 | $ | 427 | |||||||
StarHub | 141,300 | 448 | ||||||||
United Overseas Bank | 5,300 | 89 | ||||||||
UOL Group | 7,072 | 39 | ||||||||
Wilmar International | 117,100 | 278 | ||||||||
|
| |||||||||
| 3,208 | ||||||||||
|
| |||||||||
Spain — 0.2% | ||||||||||
Abertis Infraestructuras | 5,513 | 100 | ||||||||
ACS Actividades de Construccion y Servicios | 2,833 | 101 | ||||||||
Amadeus IT Holding, Cl A | 11,484 | 493 | ||||||||
Banco Bilbao Vizcaya Argentaria | 3,923 | 39 | ||||||||
Bankia* | 12,911 | 18 | ||||||||
Distribuidora Internacional de Alimentacion | 38,251 | 299 | ||||||||
Enagas | 5,493 | 157 | ||||||||
Endesa | 4,836 | 94 | ||||||||
Ferrovial | 4,529 | 96 | ||||||||
Gas Natural SDG | 6,561 | 147 | ||||||||
Grifols | 7,310 | 314 | ||||||||
Iberdrola | 26,058 | 168 | ||||||||
Inditex | 9,200 | 295 | ||||||||
International Consolidated Airlines Group* | 7,033 | 63 | ||||||||
Red Electrica, Cl B | 2,080 | 169 | ||||||||
Repsol, Cl A | 15,562 | 290 | ||||||||
Telefonica* | 18,046 | 257 | ||||||||
Zardoya Otis | 7,495 | 97 | ||||||||
|
| |||||||||
| 3,197 | ||||||||||
|
| |||||||||
Sweden — 0.2% | ||||||||||
Alfa Laval | 3,670 | 72 | ||||||||
Atlas Copco, Cl A | 1,818 | 59 | ||||||||
Atlas Copco, Cl B | 1,891 | 56 | ||||||||
Boliden | 12,111 | 241 | ||||||||
Electrolux | 4,260 | 122 | ||||||||
Elekta, Cl B | 29,642 | 266 | ||||||||
Getinge, Cl B | 9,507 | 236 | ||||||||
Hennes & Mauritz, Cl B | 4,059 | 164 | ||||||||
Hexagon, Cl B | 8,618 | 306 | ||||||||
Husqvarna, Cl B | 17,924 | 130 | ||||||||
ICA Gruppen | 6,378 | 214 | ||||||||
Industrivarden, Cl C | 4,865 | 92 | ||||||||
Investment Kinnevik, Cl B | 1,565 | 52 | ||||||||
Lundin Petroleum* | 20,495 | 281 | ||||||||
Millicom International Cellular | 2,887 | 209 | ||||||||
Nordea Bank | 6,982 | 85 | ||||||||
Skandinaviska Enskilda Banken, Cl A | 7,936 | 93 | ||||||||
Svenska Cellulosa SCA, Cl B | 6,221 | 143 | ||||||||
Swedbank, Cl A | 2,347 | 56 | ||||||||
Swedish Match | 5,303 | 156 | ||||||||
Tele2, Cl B | 19,037 | 227 | ||||||||
| SEI Institutional Managed Trust / Semi-Annual Report / March 31, 2015 | 161 |
CONSOLIDATED SCHEDULE OF INVESTMENTS (Unaudited)
Multi-Asset Accumulation Fund (Continued)
March 31, 2015
| Description | Shares | Market Value ($ Thousands) | ||||||||
Telefonaktiebolaget LM Ericsson, Cl B | 29,503 | $ | 371 | |||||||
TeliaSonera | 34,860 | 221 | ||||||||
Volvo, Cl B | 6,277 | 76 | ||||||||
|
| |||||||||
| 3,928 | ||||||||||
|
| |||||||||
Switzerland — 0.2% | ||||||||||
ABB | 4,545 | 97 | ||||||||
ACE | 744 | 83 | ||||||||
Actelion | 1,534 | 178 | ||||||||
Adecco | 1,187 | 99 | ||||||||
Aryzta* | 1,814 | 111 | ||||||||
Baloise Holding | 496 | 66 | ||||||||
Barry Callebaut | 121 | 118 | ||||||||
Chocoladefabriken Lindt & Sprungli | 31 | 283 | ||||||||
Cie Financiere Richemont | 1,741 | 140 | ||||||||
Coca-Cola HBC | 5,412 | 98 | ||||||||
EMS-Chemie Holding | 353 | 144 | ||||||||
Geberit | 215 | 81 | ||||||||
Givaudan | 89 | 161 | ||||||||
Holcim | 803 | 60 | ||||||||
Kuehne & Nagel International | 661 | 98 | ||||||||
Lonza Group | 1,481 | 185 | ||||||||
Nestle | 1,850 | 140 | ||||||||
Novartis | 2,503 | 248 | ||||||||
Partners Group Holding | 322 | 96 | ||||||||
Roche Holding | 773 | 213 | ||||||||
Schindler Holding | 1,164 | 192 | ||||||||
SGS, Cl B | 41 | 78 | ||||||||
Sika | 37 | 133 | ||||||||
Sonova Holding | 1,666 | 232 | ||||||||
Swatch Group | 1,778 | 149 | ||||||||
Swatch Group, Cl B | 331 | 141 | ||||||||
Swiss Life Holding | 254 | 63 | ||||||||
Swiss Prime Site, Cl H | 1,126 | 98 | ||||||||
Swisscom | 1,034 | 601 | ||||||||
Syngenta | 389 | 132 | ||||||||
TE Connectivity | 1,250 | 90 | ||||||||
Transocean | 19,707 | 286 | ||||||||
|
| |||||||||
| 4,894 | ||||||||||
|
| |||||||||
United Kingdom — 0.4% | ||||||||||
Admiral Group | 3,076 | 70 | ||||||||
Amec Foster Wheeler | 10,389 | 140 | ||||||||
Anglo American | 5,511 | 83 | ||||||||
Antofagasta | 8,667 | 94 | ||||||||
Aon | 1,040 | 100 | ||||||||
ARM Holdings | 21,827 | 358 | ||||||||
Associated British Foods | 2,191 | 92 | ||||||||
AstraZeneca | 3,801 | 261 | ||||||||
BG Group | 8,271 | 102 | ||||||||
BHP Billiton | 4,135 | 90 | ||||||||
| Description | Shares | Market Value ($ Thousands) | ||||||||
BP | 21,882 | $ | 142 | |||||||
British American Tobacco | 1,681 | 87 | ||||||||
BT Group, Cl A | 41,849 | 272 | ||||||||
Bunzl | 3,000 | 81 | ||||||||
Burberry Group | 1,376 | 35 | ||||||||
Capita | 2,265 | 38 | ||||||||
Centrica | 91,279 | 343 | ||||||||
Compass Group | 5,292 | 92 | ||||||||
Croda International | 2,603 | 106 | ||||||||
Diageo | 2,888 | 80 | ||||||||
Dixons Carphone | 10,596 | 65 | ||||||||
Ensco, Cl A | 6,052 | 127 | ||||||||
Friends Life Group | 5,557 | 34 | ||||||||
G4S | 16,567 | 73 | ||||||||
GlaxoSmithKline | 14,130 | 324 | ||||||||
Glencore | 17,593 | 75 | ||||||||
IMI | 1,574 | 30 | ||||||||
Imperial Tobacco Group | 2,202 | 97 | ||||||||
Inmarsat | 19,273 | 265 | ||||||||
InterContinental Hotels Group | 1,529 | 60 | ||||||||
Intertek Group | 544 | 20 | ||||||||
ITV | 11,950 | 45 | ||||||||
J Sainsbury | 21,670 | 83 | ||||||||
Johnson Matthey | 1,976 | 99 | ||||||||
Marks & Spencer Group | 10,789 | 86 | ||||||||
Melrose Industries | 19,336 | 80 | ||||||||
National Grid | 20,542 | 263 | ||||||||
Next, Cl A | 560 | 58 | ||||||||
Noble | 9,410 | 134 | ||||||||
Pearson | 3,900 | 84 | ||||||||
Petrofac | 9,373 | 133 | ||||||||
Reckitt Benckiser Group | 1,075 | 92 | ||||||||
Reed Elsevier | 3,034 | 52 | ||||||||
Rexam | 15,230 | 131 | ||||||||
Rio Tinto | 1,309 | 54 | ||||||||
Royal Dutch Shell, Cl A | 7,616 | 227 | ||||||||
Royal Dutch Shell, Cl B | 4,214 | 131 | ||||||||
RSA Insurance Group | 3,364 | 21 | ||||||||
SABMiller | 1,731 | 91 | ||||||||
Sage Group | 75,549 | 523 | ||||||||
Severn Trent | 8,989 | 275 | ||||||||
Shire | 3,125 | 249 | ||||||||
Sky | 5,534 | 82 | ||||||||
Smith & Nephew | 15,129 | 257 | ||||||||
Smiths Group | 4,570 | 76 | ||||||||
SSE | 11,470 | 255 | ||||||||
Subsea 7 | 17,156 | 148 | ||||||||
Tate & Lyle | 7,790 | 69 | ||||||||
Tesco | 23,253 | 83 | ||||||||
Travis Perkins | 3,353 | 97 | ||||||||
Tullow Oil | 33,811 | 142 | ||||||||
Unilever | 2,107 | 88 | ||||||||
United Utilities Group, Cl B | 17,772 | 246 | ||||||||
Vodafone Group | 83,074 | 272 | ||||||||
| 162 | SEI Institutional Managed Trust / Semi-Annual Report / March 31, 2015 |
| Description | Shares | Market Value ($ Thousands) | ||||||||
WM Morrison Supermarkets | 34,659 | $ | 100 | |||||||
WPP | 2,771 | 63 | ||||||||
|
| |||||||||
| 8,725 | ||||||||||
|
| |||||||||
Total Foreign Common Stock | 97,808 | |||||||||
|
| |||||||||
COMMON STOCK — 3.1% | ||||||||||
Consumer Discretionary — 0.3% | ||||||||||
Amazon.com, Cl A* | 210 | 78 | ||||||||
Autonation* | 925 | 60 | ||||||||
Autozone* | 115 | 78 | ||||||||
Bed Bath & Beyond* | 871 | 67 | ||||||||
Best Buy | 1,208 | 46 | ||||||||
BorgWarner | 1,249 | 75 | ||||||||
Cablevision Systems, Cl A | 4,420 | 81 | ||||||||
CarMax* | 974 | 67 | ||||||||
CBS, Cl B | 891 | 54 | ||||||||
Chipotle Mexican Grill, Cl A* | 131 | 85 | ||||||||
Coach | 2,031 | 84 | ||||||||
Comcast, Cl A | 1,791 | 101 | ||||||||
Darden Restaurants | 1,212 | 84 | ||||||||
Delphi Automotive | 1,026 | 82 | ||||||||
DIRECTV* | 748 | 64 | ||||||||
Discovery Communications, Cl A* | 1,971 | 61 | ||||||||
Discovery Communications, Cl C* | 1,457 | 43 | ||||||||
Dollar General | 1,154 | 87 | ||||||||
Dollar Tree* | 1,222 | 99 | ||||||||
DR Horton | 2,237 | 64 | ||||||||
Expedia | 660 | 62 | ||||||||
Family Dollar Stores | 921 | 73 | ||||||||
Ford Motor | 2,814 | 45 | ||||||||
Fossil Group* | 541 | 45 | ||||||||
GameStop, Cl A | 1,141 | 43 | ||||||||
Gannett | 1,572 | 58 | ||||||||
Gap | 2,002 | 87 | ||||||||
Garmin | 1,579 | 75 | ||||||||
General Motors | 2,216 | 83 | ||||||||
Genuine Parts | 1,030 | 96 | ||||||||
Goodyear Tire & Rubber | 1,985 | 54 | ||||||||
H&R Block | 2,909 | 93 | ||||||||
Harley-Davidson, Cl A | 750 | 46 | ||||||||
Harman International Industries, Cl A | 559 | 75 | ||||||||
Hasbro | 950 | 60 | ||||||||
Home Depot | 660 | 75 | ||||||||
Interpublic Group | 2,930 | 65 | ||||||||
Johnson Controls | 1,192 | 60 | ||||||||
Kohl’s | 1,084 | 85 | ||||||||
L Brands | 1,100 | 104 | ||||||||
Leggett & Platt | 2,324 | 107 | ||||||||
Lennar, Cl A | 1,255 | 65 | ||||||||
Lowe’s | 1,189 | 88 | ||||||||
Macy’s | 1,130 | 73 | ||||||||
| Description | Shares | Market Value ($ Thousands) | ||||||||
Marriott International, Cl A | 974 | $ | 78 | |||||||
Mattel | 1,549 | 35 | ||||||||
McDonald’s | 1,336 | 130 | ||||||||
Michael Kors Holdings* | 798 | 53 | ||||||||
NetFlix* | 139 | 58 | ||||||||
Newell Rubbermaid, Cl B | 1,797 | 70 | ||||||||
News, Cl A* | 3,347 | 54 | ||||||||
Nike, Cl B | 721 | 72 | ||||||||
Nordstrom | 882 | 71 | ||||||||
Omnicom Group | 1,019 | 79 | ||||||||
O’Reilly Automotive* | 451 | 98 | ||||||||
Priceline Group* | 50 | 58 | ||||||||
PulteGroup | 2,869 | 64 | ||||||||
PVH | 529 | 56 | ||||||||
Ralph Lauren, Cl A | 318 | 42 | ||||||||
Ross Stores | 730 | 77 | ||||||||
Royal Caribbean Cruises | 434 | 36 | ||||||||
Scripps Networks Interactive, Cl A | 899 | 62 | ||||||||
Staples | 3,583 | 58 | ||||||||
Starbucks | 1,141 | 108 | ||||||||
Starwood Hotels & Resorts Worldwide | 802 | 67 | ||||||||
Target, Cl A | 1,487 | 122 | ||||||||
Tiffany | 1,091 | 96 | ||||||||
Time Warner | 1,132 | 96 | ||||||||
Time Warner Cable, Cl A | 430 | 64 | ||||||||
TJX | 1,183 | 83 | ||||||||
Tractor Supply | 780 | 66 | ||||||||
TripAdvisor* | 606 | 51 | ||||||||
Twenty-First Century Fox, Cl A | 2,526 | 85 | ||||||||
Under Armour, Cl A* | 870 | 70 | ||||||||
Urban Outfitters* | 2,108 | 96 | ||||||||
VF | 892 | 67 | ||||||||
Viacom, Cl B | 751 | 51 | ||||||||
Walt Disney | 1,065 | 112 | ||||||||
Whirlpool | 397 | 80 | ||||||||
Wyndham Worldwide | 1,075 | 97 | ||||||||
Wynn Resorts | 376 | 48 | ||||||||
Yum! Brands | 892 | 70 | ||||||||
|
| |||||||||
| 5,957 | ||||||||||
|
| |||||||||
Consumer Staples — 0.4% | ||||||||||
Altria Group | 3,188 | 160 | ||||||||
Archer-Daniels-Midland | 3,709 | 176 | ||||||||
Avon Products | 28,698 | 229 | ||||||||
Brown-Forman, Cl B | 2,047 | 185 | ||||||||
Campbell Soup | 5,326 | 248 | ||||||||
Clorox | 2,249 | 248 | ||||||||
Coca-Cola | 5,902 | 239 | ||||||||
Coca-Cola Enterprises | 4,506 | 199 | ||||||||
Colgate-Palmolive | 3,224 | 224 | ||||||||
ConAgra Foods | 6,607 | 241 | ||||||||
Constellation Brands, Cl A* | 1,588 | 185 | ||||||||
Costco Wholesale | 1,313 | 199 | ||||||||
| SEI Institutional Managed Trust / Semi-Annual Report / March 31, 2015 | 163 |
CONSOLIDATED SCHEDULE OF INVESTMENTS (Unaudited)
Multi-Asset Accumulation Fund (Continued)
March 31, 2015
| Description | Shares | Market Value ($ Thousands) | ||||||||
CVS Health | 1,903 | $ | 196 | |||||||
Dr Pepper Snapple Group | 3,217 | 253 | ||||||||
Estee Lauder, Cl A | 2,569 | 214 | ||||||||
General Mills, Cl A | 5,049 | 286 | ||||||||
Hershey | 2,261 | 228 | ||||||||
Hormel Foods | 4,868 | 277 | ||||||||
JM Smucker | 2,125 | 246 | ||||||||
Kellogg | 3,591 | 237 | ||||||||
Keurig Green Mountain | 1,377 | 154 | ||||||||
Kimberly-Clark | 1,716 | 184 | ||||||||
Kraft Foods | 3,022 | 263 | ||||||||
Kroger | 2,087 | 160 | ||||||||
Lorillard | 3,253 | 213 | ||||||||
McCormick | 3,744 | 289 | ||||||||
Mead Johnson Nutrition, Cl A | 2,001 | 201 | ||||||||
Molson Coors Brewing, Cl B | 2,906 | 216 | ||||||||
Mondelez International, Cl A | 5,619 | 203 | ||||||||
Monster Beverage* | 1,453 | 201 | ||||||||
PepsiCo | 2,423 | 232 | ||||||||
Philip Morris International | 2,511 | 189 | ||||||||
Procter & Gamble | 2,984 | 244 | ||||||||
Reynolds American | 3,052 | 210 | ||||||||
SYSCO, Cl A | 5,177 | 195 | ||||||||
Tyson Foods, Cl A | 4,314 | 165 | ||||||||
Walgreens Boots Alliance | 2,355 | 200 | ||||||||
Wal-Mart Stores | 2,334 | 192 | ||||||||
Whole Foods Market | 2,824 | 147 | ||||||||
|
| |||||||||
| 8,328 | ||||||||||
|
| |||||||||
Energy — 0.2% | ||||||||||
Anadarko Petroleum, Cl A | 1,968 | 163 | ||||||||
Apache | 1,962 | 118 | ||||||||
Baker Hughes | 2,100 | 134 | ||||||||
Cabot Oil & Gas | 4,417 | 130 | ||||||||
Cameron International* | 2,161 | 97 | ||||||||
Chesapeake Energy | 8,038 | 114 | ||||||||
Chevron | 1,331 | 140 | ||||||||
Cimarex Energy | 1,075 | 124 | ||||||||
ConocoPhillips | 1,874 | 117 | ||||||||
Consol Energy | 3,992 | 111 | ||||||||
Denbury Resources | 17,805 | 130 | ||||||||
Devon Energy | 1,712 | 103 | ||||||||
Diamond Offshore Drilling | 4,101 | 110 | ||||||||
EOG Resources | 1,575 | 144 | ||||||||
EQT | 1,936 | 160 | ||||||||
Exxon Mobil | 1,690 | 144 | ||||||||
FMC Technologies* | 3,378 | 125 | ||||||||
Halliburton | 4,031 | 177 | ||||||||
Helmerich & Payne | 1,548 | 105 | ||||||||
Hess | 2,354 | 160 | ||||||||
Kinder Morgan | 4,448 | 187 | ||||||||
Marathon Oil | 4,333 | 113 | ||||||||
Marathon Petroleum | 1,154 | 118 | ||||||||
Murphy Oil | 2,333 | 109 | ||||||||
| Description | Shares | Market Value ($ Thousands) | ||||||||
Nabors Industries | 9,523 | $ | 130 | |||||||
National Oilwell Varco, Cl A | 2,636 | 132 | ||||||||
Newfield Exploration* | 3,970 | 139 | ||||||||
Noble Energy | 2,186 | 107 | ||||||||
Occidental Petroleum | 1,710 | 125 | ||||||||
Oneok | 3,044 | 147 | ||||||||
Phillips 66 | 1,688 | 133 | ||||||||
Pioneer Natural Resources | 645 | 106 | ||||||||
QEP Resources | 5,190 | 108 | ||||||||
Range Resources | 2,620 | 136 | ||||||||
Schlumberger, Cl A | 1,258 | 105 | ||||||||
Southwestern Energy, Cl A* | 5,452 | 126 | ||||||||
Spectra Energy | 4,725 | 171 | ||||||||
Tesoro | 1,406 | 128 | ||||||||
Valero Energy | 2,308 | 147 | ||||||||
Williams | 3,552 | 180 | ||||||||
|
| |||||||||
| 5,253 | ||||||||||
|
| |||||||||
Financials — 0.3% | ||||||||||
Affiliated Managers Group* | 278 | 60 | ||||||||
Aflac | 669 | 43 | ||||||||
Allstate | 963 | 68 | ||||||||
American Express | 700 | 55 | ||||||||
American International Group | 1,531 | 84 | ||||||||
American Tower, Cl A† | 1,028 | 97 | ||||||||
Ameriprise Financial | 614 | 80 | ||||||||
Apartment Investment & Management, Cl A† | 1,239 | 49 | ||||||||
Assurant | 976 | 60 | ||||||||
AvalonBay Communities† | 370 | 64 | ||||||||
Bank of America | 3,043 | 47 | ||||||||
Bank of New York Mellon | 2,301 | 93 | ||||||||
BB&T | 567 | 22 | ||||||||
Berkshire Hathaway, Cl B* | 698 | 101 | ||||||||
BlackRock | 239 | 87 | ||||||||
Boston Properties† | 488 | 69 | ||||||||
Capital One Financial | 700 | 55 | ||||||||
CBRE Group, Cl A* | 1,563 | 61 | ||||||||
Charles Schwab | 2,369 | 72 | ||||||||
Chubb | 1,297 | 131 | ||||||||
Cincinnati Financial | 2,017 | 107 | ||||||||
Citigroup | 1,388 | 71 | ||||||||
CME Group | 964 | 91 | ||||||||
Comerica | 1,055 | 48 | ||||||||
Crown Castle International† | 1,247 | 103 | ||||||||
Discover Financial Services | 1,159 | 65 | ||||||||
E*Trade Financial* | 2,457 | 70 | ||||||||
Equity Residential† | 941 | 73 | ||||||||
Essex Property Trust† | 340 | 78 | ||||||||
Fifth Third Bancorp | 3,134 | 59 | ||||||||
Franklin Resources | 1,671 | 86 | ||||||||
General Growth Properties† | 2,355 | 70 | ||||||||
Genworth Financial, Cl A* | 6,399 | 47 | ||||||||
Goldman Sachs Group | 268 | 50 | ||||||||
| 164 | SEI Institutional Managed Trust / Semi-Annual Report / March 31, 2015 |
| Description | Shares | Market Value ($ Thousands) | ||||||||
Hartford Financial Services Group | 2,184 | $ | 91 | |||||||
HCP† | 1,674 | 72 | ||||||||
Health Care† | 867 | 67 | ||||||||
Host Hotels & Resorts† | 3,192 | 64 | ||||||||
Hudson City Bancorp, Cl A | 5,691 | 60 | ||||||||
Huntington Bancshares | 5,352 | 59 | ||||||||
Intercontinental Exchange | 310 | 72 | ||||||||
Invesco | 1,903 | 76 | ||||||||
Iron Mountain† | 2,607 | 95 | ||||||||
JPMorgan Chase | 1,363 | 83 | ||||||||
KeyCorp | 3,605 | 51 | ||||||||
Kimco Realty† | 2,593 | 70 | ||||||||
Legg Mason | 1,384 | 76 | ||||||||
Leucadia National | 2,506 | 56 | ||||||||
Lincoln National | 607 | 35 | ||||||||
Loews | 1,936 | 79 | ||||||||
M&T Bank | 738 | 94 | ||||||||
Macerich† | 1,104 | 93 | ||||||||
Marsh & McLennan | 1,756 | 98 | ||||||||
McGraw-Hill | 893 | 92 | ||||||||
MetLife | 873 | 44 | ||||||||
Moody’s | 673 | 70 | ||||||||
Morgan Stanley | 1,399 | 50 | ||||||||
NASDAQ OMX Group, Cl A | 1,585 | 81 | ||||||||
Navient | 2,108 | 43 | ||||||||
Northern Trust | 1,475 | 103 | ||||||||
People’s United Financial | 6,719 | 102 | ||||||||
Plum Creek Timber | 2,281 | 99 | ||||||||
PNC Financial Services Group | 595 | 55 | ||||||||
Principal Financial Group, Cl A | 1,244 | 64 | ||||||||
Progressive | 2,974 | 81 | ||||||||
ProLogis† | 2,009 | 87 | ||||||||
Prudential Financial | 570 | 46 | ||||||||
Public Storage† | 541 | 107 | ||||||||
Regions Financial | 5,512 | 52 | ||||||||
Simon Property Group† | 325 | 64 | ||||||||
State Street | 770 | 57 | ||||||||
SunTrust Banks | 1,338 | 55 | ||||||||
T. Rowe Price Group | 832 | 67 | ||||||||
Torchmark, Cl A | 964 | 53 | ||||||||
Travelers | 849 | 92 | ||||||||
Unum Group | 1,475 | 50 | ||||||||
Urban Edge Properties† | 329 | 8 | ||||||||
US Bancorp | 1,531 | 67 | ||||||||
Ventas† | 1,347 | 98 | ||||||||
Vornado Realty Trust† | 658 | 74 | ||||||||
Wells Fargo | 1,744 | 95 | ||||||||
Weyerhaeuser | 2,304 | 76 | ||||||||
XL Group, Cl A | 2,550 | 94 | ||||||||
Zions Bancorporation | 1,416 | 38 | ||||||||
|
| |||||||||
| 5,971 | ||||||||||
|
| |||||||||
Health Care — 0.3% | ||||||||||
Abbott Laboratories | 3,250 | 150 | ||||||||
AbbVie | 2,377 | 139 | ||||||||
| Description | Shares | Market Value ($ Thousands) | ||||||||
Aetna, Cl A | 1,342 | $ | 143 | |||||||
Agilent Technologies | 2,392 | 99 | ||||||||
Alexion Pharmaceuticals* | 748 | 130 | ||||||||
AmerisourceBergen | 1,216 | 138 | ||||||||
Amgen, Cl A | 840 | 134 | ||||||||
Anthem | 1,014 | 157 | ||||||||
Baxter International | 2,273 | 156 | ||||||||
Becton Dickinson | 1,134 | 163 | ||||||||
Biogen* | 324 | 137 | ||||||||
Boston Scientific* | 8,618 | 153 | ||||||||
Bristol-Myers Squibb | 2,001 | 129 | ||||||||
C.R. Bard | 751 | 126 | ||||||||
Cardinal Health | 1,831 | 165 | ||||||||
Celgene, Cl A* | 1,198 | 138 | ||||||||
Cerner* | 2,136 | 156 | ||||||||
Cigna | 1,164 | 151 | ||||||||
DaVita HealthCare Partners* | 1,726 | 140 | ||||||||
Dentsply International | 2,721 | 138 | ||||||||
Edwards Lifesciences, Cl A* | 918 | 131 | ||||||||
Eli Lilly | 2,348 | 171 | ||||||||
Express Scripts Holding* | 1,303 | 113 | ||||||||
Gilead Sciences* | 1,056 | 103 | ||||||||
HCA Holdings* | 1,835 | 138 | ||||||||
Hospira* | 1,289 | 113 | ||||||||
Humana | 710 | 126 | ||||||||
Intuitive Surgical* | 262 | 132 | ||||||||
Johnson & Johnson | 1,602 | 161 | ||||||||
Laboratory Corp of America Holdings* | 954 | 120 | ||||||||
McKesson | 595 | 135 | ||||||||
Medtronic | 1,421 | 111 | ||||||||
Merck | 2,621 | 151 | ||||||||
Mylan* | 2,116 | 126 | ||||||||
Patterson | 2,743 | 134 | ||||||||
PerkinElmer | 2,942 | 151 | ||||||||
Pfizer | 5,065 | 176 | ||||||||
Quest Diagnostics | 1,743 | 134 | ||||||||
Regeneron Pharmaceuticals* | 294 | 133 | ||||||||
St. Jude Medical | 1,964 | 128 | ||||||||
Stryker | 1,505 | 139 | ||||||||
Tenet Healthcare* | 2,567 | 127 | ||||||||
Thermo Fisher Scientific | 1,047 | 141 | ||||||||
UnitedHealth Group | 1,450 | 172 | ||||||||
Universal Health Services, Cl B | 1,153 | 136 | ||||||||
Varian Medical Systems* | 1,374 | 129 | ||||||||
Vertex Pharmaceuticals* | 829 | 98 | ||||||||
Waters* | 1,193 | 148 | ||||||||
Zimmer Holdings | 1,217 | 143 | ||||||||
Zoetis, Cl A | 2,551 | 118 | ||||||||
|
| |||||||||
| 6,880 | ||||||||||
|
| |||||||||
Industrials — 0.3% | ||||||||||
3M | 528 | 87 | ||||||||
ADT, Cl A | 1,823 | 76 | ||||||||
Allegion | 1,531 | 93 | ||||||||
| SEI Institutional Managed Trust / Semi-Annual Report / March 31, 2015 | 165 |
CONSOLIDATED SCHEDULE OF INVESTMENTS (Unaudited)
Multi-Asset Accumulation Fund (Continued)
March 31, 2015
| Description | Shares | Market Value ($ Thousands) | ||||||||
Ametek | 1,214 | $ | 64 | |||||||
Boeing | 707 | 106 | ||||||||
C.H. Robinson Worldwide | 1,277 | 94 | ||||||||
Caterpillar, Cl A | 1,034 | 83 | ||||||||
Cintas | 1,129 | 92 | ||||||||
CSX | 2,876 | 95 | ||||||||
Cummins | 612 | 85 | ||||||||
Danaher, Cl A | 1,448 | 123 | ||||||||
Deere | 725 | 63 | ||||||||
Delta Air Lines, Cl A | 2,132 | 96 | ||||||||
Dover | 1,286 | 89 | ||||||||
Dun & Bradstreet | 676 | 87 | ||||||||
Emerson Electric | 1,725 | 98 | ||||||||
Equifax | 1,030 | 96 | ||||||||
Expeditors International of Washington | 1,954 | 94 | ||||||||
Fastenal, Cl A | 2,002 | 83 | ||||||||
FedEx | 581 | 96 | ||||||||
Flowserve | 922 | 52 | ||||||||
Fluor | 1,527 | 87 | ||||||||
General Dynamics | 849 | 115 | ||||||||
General Electric | 3,393 | 84 | ||||||||
Honeywell International | 1,142 | 119 | ||||||||
Illinois Tool Works | 945 | 92 | ||||||||
Ingersoll-Rand | 1,099 | 75 | ||||||||
Jacobs Engineering Group* | 1,127 | 51 | ||||||||
Joy Global | 1,525 | 60 | ||||||||
Kansas City Southern | 757 | 77 | ||||||||
L-3 Communications Holdings | 643 | 81 | ||||||||
Lockheed Martin | 686 | 139 | ||||||||
Masco | 3,321 | 89 | ||||||||
Norfolk Southern | 909 | 93 | ||||||||
Northrop Grumman | 759 | 122 | ||||||||
PACCAR | 1,058 | 67 | ||||||||
Pall | 857 | 86 | ||||||||
Parker-Hannifin, Cl A | 653 | 77 | ||||||||
Pitney Bowes | 4,588 | 107 | ||||||||
Precision Castparts | 492 | 104 | ||||||||
Quanta Services* | 1,779 | 51 | ||||||||
Raytheon | 1,173 | 128 | ||||||||
Republic Services | 2,778 | 113 | ||||||||
Robert Half International | 1,948 | 118 | ||||||||
Rockwell Automation | 815 | 94 | ||||||||
Rockwell Collins | 1,442 | 139 | ||||||||
Roper Industries | 650 | 112 | ||||||||
Ryder System | 976 | 93 | ||||||||
Snap-on | 801 | 118 | ||||||||
Southwest Airlines, Cl A | 2,040 | 90 | ||||||||
Stanley Black & Decker | 854 | 81 | ||||||||
Stericycle, Cl A* | 907 | 127 | ||||||||
Textron | 1,353 | 60 | ||||||||
Tyco International | 2,113 | 91 | ||||||||
Union Pacific | 856 | 93 | ||||||||
United Parcel Service, Cl B | 1,298 | 126 | ||||||||
United Rentals* | 770 | 70 | ||||||||
| Description | Shares | Market Value ($ Thousands) | ||||||||
United Technologies | 989 | $ | 116 | |||||||
Waste Management | 2,460 | 133 | ||||||||
WW Grainger | 409 | 97 | ||||||||
Xylem | 2,824 | 99 | ||||||||
|
| |||||||||
| 5,726 | ||||||||||
|
| |||||||||
Information Technology — 0.3% | ||||||||||
Adobe Systems* | 1,333 | 99 | ||||||||
Akamai Technologies* | 1,426 | 101 | ||||||||
Alliance Data Systems* | 225 | 67 | ||||||||
Altera | 2,530 | 109 | ||||||||
Amphenol, Cl A | 2,224 | 131 | ||||||||
Analog Devices | 2,198 | 138 | ||||||||
Apple | 785 | 98 | ||||||||
Applied Materials | 3,455 | 78 | ||||||||
Autodesk, Cl A* | 1,851 | 109 | ||||||||
Automatic Data Processing | 1,236 | 106 | ||||||||
Broadcom, Cl A | 2,356 | 102 | ||||||||
CA | 2,697 | 88 | ||||||||
Cisco Systems | 3,423 | 94 | ||||||||
Citrix Systems* | 1,207 | 77 | ||||||||
Cognizant Technology Solutions, Cl A* | 1,460 | 91 | ||||||||
Computer Sciences | 1,227 | 80 | ||||||||
Corning, Cl B | 3,400 | 77 | ||||||||
eBay* | 2,055 | 118 | ||||||||
Electronic Arts* | 1,687 | 99 | ||||||||
EMC | 4,090 | 104 | ||||||||
F5 Networks, Cl A* | 656 | 76 | ||||||||
Facebook, Cl A* | 1,264 | 104 | ||||||||
Fidelity National Information Services, Cl B | 1,370 | 93 | ||||||||
First Solar* | 1,275 | 76 | ||||||||
Fiserv, Cl A* | 1,220 | 97 | ||||||||
Flir Systems | 3,188 | 100 | ||||||||
Google, Cl A* | 194 | 108 | ||||||||
Google, Cl C* | 142 | 78 | ||||||||
Harris | 1,488 | 117 | ||||||||
Hewlett-Packard | 1,974 | 61 | ||||||||
Intel | 2,316 | 72 | ||||||||
International Business Machines | 503 | 81 | ||||||||
Intuit | 1,158 | 112 | ||||||||
Juniper Networks | 3,845 | 87 | ||||||||
KLA-Tencor | 1,572 | 92 | ||||||||
Lam Research | 1,034 | 73 | ||||||||
Linear Technology | 1,618 | 76 | ||||||||
MasterCard, Cl A | 1,158 | 100 | ||||||||
Microchip Technology | 1,617 | 79 | ||||||||
Micron Technology* | 2,701 | 73 | ||||||||
Microsoft | 2,982 | 121 | ||||||||
Motorola Solutions | 1,038 | 69 | ||||||||
NetApp | 2,048 | 73 | ||||||||
Nvidia | 4,153 | 87 | ||||||||
Oracle, Cl B | 2,124 | 92 | ||||||||
Paychex | 2,240 | 111 | ||||||||
| 166 | SEI Institutional Managed Trust / Semi-Annual Report / March 31, 2015 |
| Description | Shares | Market Value ($ Thousands) | ||||||||
Qualcomm | 1,825 | $ | 127 | |||||||
Red Hat* | 1,165 | 88 | ||||||||
Salesforce.com* | 1,699 | 114 | ||||||||
SanDisk | 1,208 | 77 | ||||||||
Symantec, Cl A | 4,377 | 102 | ||||||||
Teradata* | 1,941 | 86 | ||||||||
Texas Instruments | 1,935 | 111 | ||||||||
Total System Services | 2,623 | 100 | ||||||||
VeriSign* | 1,285 | 86 | ||||||||
Visa, Cl A | 1,380 | 90 | ||||||||
Western Digital | 821 | 75 | ||||||||
Western Union | 3,646 | 76 | ||||||||
Xerox | 7,739 | 99 | ||||||||
Xilinx | 2,202 | 93 | ||||||||
Yahoo!* | 1,891 | 84 | ||||||||
|
| |||||||||
| 5,682 | ||||||||||
|
| |||||||||
Materials — 0.2% | ||||||||||
Air Products & Chemicals | 1,608 | 243 | ||||||||
Airgas | 1,875 | 199 | ||||||||
Alcoa | 12,949 | 167 | ||||||||
Allegheny Technologies | 6,273 | 188 | ||||||||
Avery Dennison | 4,450 | 235 | ||||||||
Ball | 2,941 | 208 | ||||||||
CF Industries Holdings | 634 | 180 | ||||||||
Dow Chemical, Cl A | 3,569 | 171 | ||||||||
E.I. Du Pont de Nemours | 2,587 | 185 | ||||||||
Eastman Chemical | 2,102 | 146 | ||||||||
Ecolab | 2,094 | 240 | ||||||||
FMC | 3,030 | 173 | ||||||||
Freeport-McMoRan, Cl B | 8,940 | 170 | ||||||||
International Flavors & Fragrances | 2,183 | 256 | ||||||||
International Paper | 4,222 | 234 | ||||||||
Martin Marietta Materials, Cl A | 1,209 | 169 | ||||||||
MeadWestvaco | 4,323 | 216 | ||||||||
Monsanto | 1,793 | 202 | ||||||||
Mosaic | 4,106 | 189 | ||||||||
Newmont Mining | 9,106 | 198 | ||||||||
Nucor | 4,278 | 203 | ||||||||
Owens-Illinois* | 7,144 | 166 | ||||||||
PPG Industries | 910 | 205 | ||||||||
Praxair | 2,010 | 243 | ||||||||
Sealed Air | 4,952 | 226 | ||||||||
Sherwin-Williams, Cl A | 831 | 236 | ||||||||
Sigma-Aldrich | 1,578 | 218 | ||||||||
Vulcan Materials | 2,079 | 175 | ||||||||
|
| |||||||||
| 5,641 | ||||||||||
|
| |||||||||
Telecommunication Services — 0.4% | ||||||||||
AT&T | 54,555 | 1,781 | ||||||||
CenturyTel | 33,804 | 1,168 | ||||||||
Frontier Communications | 161,903 | 1,141 | ||||||||
Level 3 Communications* | 16,415 | 884 | ||||||||
| Description | Shares/Face Amount ($ Thousands) | Market Value ($ Thousands) | ||||||||
Verizon Communications | 35,838 | $ | 1,743 | |||||||
Windstream Holdings | 177,613 | 1,314 | ||||||||
|
| |||||||||
| 8,031 | ||||||||||
|
| |||||||||
Utilities — 0.4% | ||||||||||
AES | 21,306 | 274 | ||||||||
AGL Resources | 5,532 | 275 | ||||||||
Ameren | 8,029 | 339 | ||||||||
American Electric Power | 5,062 | 285 | ||||||||
Centerpoint Energy | 13,638 | 278 | ||||||||
CMS Energy | 8,242 | 288 | ||||||||
Consolidated Edison | 5,448 | 332 | ||||||||
Dominion Resources | 4,207 | 298 | ||||||||
DTE Energy | 3,434 | 277 | ||||||||
Duke Energy | 4,681 | 359 | ||||||||
Edison International | 4,542 | 284 | ||||||||
Entergy | 4,562 | 353 | ||||||||
Eversource Energy | 7,041 | 356 | ||||||||
Exelon | 8,683 | 292 | ||||||||
FirstEnergy | 8,630 | 302 | ||||||||
Integrys Energy Group | 5,064 | 365 | ||||||||
NextEra Energy | 2,892 | 301 | ||||||||
NiSource | 7,251 | 320 | ||||||||
NRG Energy | 11,693 | 294 | ||||||||
Pepco Holdings | 11,279 | 303 | ||||||||
PG&E | 6,354 | 337 | ||||||||
Pinnacle West Capital | 6,098 | 389 | ||||||||
PPL | 8,711 | 293 | ||||||||
Public Service Enterprise Group | 8,559 | 359 | ||||||||
SCANA | 4,876 | 268 | ||||||||
Sempra Energy | 2,911 | 318 | ||||||||
Southern | 8,324 | 369 | ||||||||
TECO Energy | 17,230 | 334 | ||||||||
Wisconsin Energy | 5,715 | 283 | ||||||||
Xcel Energy | 8,583 | 299 | ||||||||
|
| |||||||||
| 9,424 | ||||||||||
|
| |||||||||
Total Common Stock | 66,893 | |||||||||
|
| |||||||||
CORPORATE OBLIGATIONS (A) — 1.2% |
| |||||||||
Consumer Discretionary — 0.0% |
| |||||||||
Trustees of Dartmouth College | ||||||||||
4.750%, 06/01/2019 | $ | 250 | 280 | |||||||
University of Southern California | ||||||||||
5.250%, 10/01/2111 | 100 | 134 | ||||||||
|
| |||||||||
| 414 | ||||||||||
|
| |||||||||
Consumer Staples — 0.0% | ||||||||||
Wal-Mart Stores | ||||||||||
2.800%, 04/15/2016 | 300 | 307 | ||||||||
|
| |||||||||
| SEI Institutional Managed Trust / Semi-Annual Report / March 31, 2015 | 167 |
CONSOLIDATED SCHEDULE OF INVESTMENTS (Unaudited)
Multi-Asset Accumulation Fund (Continued)
March 31, 2015
| Description | Face Amount ($ Thousands) | Market Value ($ Thousands) | ||||||||
Energy — 0.1% | ||||||||||
Chevron | ||||||||||
4.950%, 03/03/2019 | $ | 150 | $ | 168 | ||||||
Exxon Mobil | ||||||||||
3.176%, 03/15/2024 | 500 | 526 | ||||||||
Shell International Finance BV | ||||||||||
3.250%, 09/22/2015 | 250 | 253 | ||||||||
Total Capital | ||||||||||
3.000%, 06/24/2015 | 250 | 251 | ||||||||
XTO Energy | ||||||||||
6.750%, 08/01/2037 | 300 | 460 | ||||||||
6.500%, 12/15/2018 | 750 | 879 | ||||||||
|
| |||||||||
| 2,537 | ||||||||||
|
| |||||||||
Financials — 0.9% | ||||||||||
African Development Bank | ||||||||||
2.500%, 03/15/2016 | 250 | 255 | ||||||||
1.125%, 03/15/2017 | 200 | 202 | ||||||||
0.875%, 03/15/2018 | 500 | 498 | ||||||||
Andina de Fomento | ||||||||||
4.375%, 06/15/2022 | 250 | 273 | ||||||||
Asian Development Bank | ||||||||||
5.593%, 07/16/2018 | 250 | 283 | ||||||||
1.125%, 03/15/2017 | 150 | 151 | ||||||||
0.500%, 06/20/2016 | 1,000 | 1,001 | ||||||||
Australia & New Zealand Banking Group NY MTN | ||||||||||
1.875%, 10/06/2017 | 250 | 254 | ||||||||
Bank of Montreal MTN | ||||||||||
1.400%, 09/11/2017 | 200 | 201 | ||||||||
Bank of New York Mellon | ||||||||||
3.550%, 09/23/2021 | 200 | 213 | ||||||||
Berkshire Hathaway Finance | ||||||||||
5.400%, 05/15/2018 | 250 | 281 | ||||||||
Canadian Imperial Bank of Commerce | ||||||||||
2.350%, 12/11/2015 | 250 | 253 | ||||||||
CME Group | ||||||||||
3.000%, 09/15/2022 | 100 | 104 | ||||||||
Commonwealth Bank of Australia NY MTN | ||||||||||
1.900%, 09/18/2017 | 150 | 153 | ||||||||
Cooperatieve Centrale Raiffeisen-Boerenleenbank | ||||||||||
3.375%, 01/19/2017 | 250 | 261 | ||||||||
Council of Europe Development Bank MTN | ||||||||||
1.500%, 02/22/2017 | 850 | 862 | ||||||||
European Bank for Reconstruction & Development | ||||||||||
1.500%, 03/16/2020 | 250 | 250 | ||||||||
European Bank for Reconstruction & Development MTN | ||||||||||
1.000%, 02/16/2017 | 600 | 605 | ||||||||
0.750%, 09/01/2017 | 200 | 200 | ||||||||
| Description | Face Amount ($ Thousands) | Market Value ($ Thousands) | ||||||||
European Investment Bank | ||||||||||
4.875%, 02/15/2036 | $ | 250 | $ | 336 | ||||||
1.000%, 12/15/2017 | 150 | 150 | ||||||||
FMS Wertmanagement AoeR | ||||||||||
1.000%, 11/21/2017 | 950 | 951 | ||||||||
0.625%, 04/18/2016 | 750 | 752 | ||||||||
General Electric Capital | ||||||||||
0.850%, 10/09/2015 | 500 | 502 | ||||||||
HSBC Holdings | ||||||||||
5.100%, 04/05/2021 | 250 | 286 | ||||||||
Inter-American Development Bank | ||||||||||
7.000%, 06/15/2025 | 500 | 703 | ||||||||
3.875%, 09/17/2019 | 350 | 388 | ||||||||
1.125%, 03/15/2017 | 300 | 303 | ||||||||
International Bank for Reconstruction & Development | ||||||||||
4.750%, 02/15/2035 | 250 | 324 | ||||||||
0.875%, 04/17/2017 | 450 | 453 | ||||||||
International Finance | ||||||||||
2.125%, 11/17/2017 | 750 | 770 | ||||||||
1.750%, 09/04/2018 | 200 | 203 | ||||||||
1.125%, 11/23/2016 | 750 | 755 | ||||||||
1.000%, 04/24/2017 | 300 | 301 | ||||||||
KFW | ||||||||||
2.375%, 08/25/2021 | 500 | 519 | ||||||||
0.875%, 09/05/2017 | 200 | 200 | ||||||||
Landwirtschaftliche Rentenbank | ||||||||||
1.875%, 09/17/2018 | 550 | 563 | ||||||||
1.750%, 04/15/2019 | 200 | 204 | ||||||||
1.375%, 10/23/2019 | 500 | 499 | ||||||||
1.000%, 04/04/2018 | 200 | 200 | ||||||||
0.875%, 09/12/2017 | 300 | 300 | ||||||||
National Australia Bank Ltd. | ||||||||||
1.600%, 08/07/2015 | 350 | 351 | ||||||||
Nordic Investment Bank MTN | ||||||||||
2.500%, 07/15/2015 | 200 | 201 | ||||||||
1.000%, 03/07/2017 | 750 | 754 | ||||||||
0.750%, 01/17/2018 | 200 | 199 | ||||||||
0.500%, 04/14/2016 | 750 | 750 | ||||||||
North American Development Bank | ||||||||||
2.400%, 10/26/2022 | 200 | 198 | ||||||||
Oesterreichische Kontrollbank MTN | ||||||||||
1.125%, 07/06/2015 | 150 | 150 | ||||||||
Svenska Handelsbanken | ||||||||||
2.875%, 04/04/2017 | 200 | 207 | ||||||||
Toronto-Dominion Bank | ||||||||||
2.375%, 10/19/2016 | 250 | 256 | ||||||||
Toyota Motor Credit MTN | ||||||||||
3.400%, 09/15/2021 | 150 | 159 | ||||||||
3.200%, 06/17/2015 | 100 | 101 | ||||||||
Westpac Banking | ||||||||||
4.875%, 11/19/2019 | 200 | 225 | ||||||||
3.000%, 08/04/2015 | 250 | 252 | ||||||||
|
| |||||||||
| 19,765 | ||||||||||
|
| |||||||||
| 168 | SEI Institutional Managed Trust / Semi-Annual Report / March 31, 2015 |
| Description | Face Amount/Shares ($ Thousands) | Market Value ($ Thousands) | ||||||||
Health Care — 0.0% | ||||||||||
Johns Hopkins University | ||||||||||
5.250%, 07/01/2019 | $ | 18 | $ | 20 | ||||||
Johnson & Johnson | ||||||||||
5.950%, 08/15/2037 | 300 | 415 | ||||||||
3.375%, 12/05/2023 | 500 | 536 | ||||||||
Novartis Securities Investment | ||||||||||
5.125%, 02/10/2019 | 150 | 169 | ||||||||
Sanofi | ||||||||||
4.000%, 03/29/2021 | 150 | 165 | ||||||||
|
| |||||||||
| 1,305 | ||||||||||
|
| |||||||||
Industrials — 0.0% | ||||||||||
3M MTN | ||||||||||
5.700%, 03/15/2037 | 150 | 199 | ||||||||
|
| |||||||||
Information Technology — 0.2% |
| |||||||||
3.625%, 05/19/2021 | 150 | 163 | ||||||||
Microsoft | ||||||||||
2.500%, 02/08/2016 | 350 | 356 | ||||||||
2.125%, 11/15/2022 | 500 | 491 | ||||||||
1.625%, 09/25/2015 | 1,250 | 1,258 | ||||||||
0.875%, 11/15/2017 | 1,500 | 1,496 | ||||||||
|
| |||||||||
| 3,764 | ||||||||||
|
| |||||||||
Telecommunication Services — 0.0% |
| |||||||||
Nippon Telegraph & Telephone | ||||||||||
1.400%, 07/18/2017 | 200 | 201 | ||||||||
|
| |||||||||
Utilities — 0.0% | ||||||||||
Southern California Gas | ||||||||||
5.125%, 11/15/2040 | 150 | 188 | ||||||||
|
| |||||||||
Total Corporate Obligations | 28,680 | |||||||||
|
| |||||||||
EXCHANGE TRADED FUND — 0.6% |
| |||||||||
iShares iBoxx Investment Grade Corporate Bond Fund | 101,278 | 12,327 | ||||||||
|
| |||||||||
Total Exchange Traded Fund |
| 12,327 | ||||||||
|
| |||||||||
PREFERRED STOCK — 0.0% |
| |||||||||
Consumer Discretionary — 0.0% |
| |||||||||
Porsche Automobil Holding | 342 | 34 | ||||||||
|
| |||||||||
Consumer Staples — 0.0% |
| |||||||||
Henkel & KGaA | 1,296 | 152 | ||||||||
|
| |||||||||
| Description | Shares/Face Amount (1) (Thousands) | Market Value ($ Thousands) | ||||||||||
Materials — 0.0% | ||||||||||||
Fuchs Petrolub | 1,520 | $ | 61 | |||||||||
|
| |||||||||||
Total Preferred Stock |
| 247 | ||||||||||
|
| |||||||||||
Number of Warrants | ||||||||||||
WARRANTS — 0.0% |
| |||||||||||
Olam International, Strike Price: $1.291 |
| |||||||||||
Expires 12/31/17 |
| 4,698 | — | |||||||||
|
| |||||||||||
Total Warrants |
| — | ||||||||||
|
| |||||||||||
Number of Rights | ||||||||||||
RIGHTS — 0.0% | ||||||||||||
Safeway CVR - Casa Ley |
| 2,823 | 3 | |||||||||
Safeway CVR - PDC | 2,823 | — | ||||||||||
Telefonica | ||||||||||||
Expires 04/16/15 |
| 18,046 | 3 | |||||||||
|
| |||||||||||
Total Rights |
| 6 | ||||||||||
|
| |||||||||||
CASH EQUIVALENT — 33.3% |
| |||||||||||
SEI Daily Income Trust, Prime Obligation Fund, Cl A |
| 715,177,907 | 715,178 | |||||||||
|
| |||||||||||
Total Cash Equivalent |
| 715,178 | ||||||||||
|
| |||||||||||
TIME DEPOSITS — 21.1% |
| |||||||||||
Brown Brothers Harriman |
| |||||||||||
2.950%, 04/01/2015 | NZD | 22 | 17 | |||||||||
1.462%, 04/01/2015 | AUD | 97 | 74 | |||||||||
0.350%, 04/01/2015 | NOK | 46 | 6 | |||||||||
0.100%, 04/01/2015 | CAD | 33 | 26 | |||||||||
0.074%, 04/01/2015 | GBP | 925 | 1,373 | |||||||||
0.030%, 04/01/2015 (A) | 450,117 | 450,117 | ||||||||||
0.005%, 04/01/2015 | SGD | 6 | 4 | |||||||||
0.005%, 04/01/2015 | HKD | 177 | 23 | |||||||||
0.005%, 04/01/2015 | JPY | 6,142 | 51 | |||||||||
(0.100)%, 04/01/2015 @ | DKK | 77 | 11 | |||||||||
(0.198)%, 04/01/2015 @ | EUR | 1,575 | 1,692 | |||||||||
(0.270)%, 04/01/2015 @ | SEK | 99 | 12 | |||||||||
(1.000)%, 04/01/2015 @ | CHF | 30 | 30 | |||||||||
|
| |||||||||||
Total Time Deposits |
| 453,436 | ||||||||||
|
| |||||||||||
| SEI Institutional Managed Trust / Semi-Annual Report / March 31, 2015 | 169 |
CONSOLIDATED SCHEDULE OF INVESTMENTS (Unaudited)
Multi-Asset Accumulation Fund (Continued)
March 31, 2015
| Description | Face Amount ($ Thousands) | Market Value ($ Thousands) | ||||||||
U.S. TREASURY OBLIGATIONS — 18.3% |
| |||||||||
U.S. Treasury Inflation Protected Securities |
| |||||||||
3.875%, 04/15/2029 | $ | 597 | $ | 877 | ||||||
3.625%, 04/15/2028 | 814 | 1,147 | ||||||||
2.625%, 07/15/2017 | 677 | 735 | ||||||||
2.500%, 07/15/2016 | 1,537 | 1,614 | ||||||||
2.500%, 01/15/2029 | 714 | 912 | ||||||||
2.375%, 01/15/2017 | 232 | 246 | ||||||||
2.375%, 01/15/2025 | 1,325 | 1,606 | ||||||||
2.375%, 01/15/2027 | 1,133 | 1,644 | ||||||||
2.125%, 01/15/2019 | 15,784 | 17,376 | ||||||||
2.125%, 02/15/2041 | 1,138 | 1,533 | ||||||||
2.000%, 01/15/2016 | 177 | 181 | ||||||||
2.000%, 01/15/2026 | 453 | 537 | ||||||||
1.875%, 07/15/2015 | 383 | 388 | ||||||||
1.875%, 07/15/2019 | 1,318 | 1,453 | ||||||||
1.750%, 01/15/2028 | 640 | 749 | ||||||||
1.375%, 07/15/2018 | 1,804 | 1,931 | ||||||||
1.375%, 01/15/2020 | 943 | 1,020 | ||||||||
1.250%, 07/15/2020 | 1,237 | 1,341 | ||||||||
1.125%, 01/15/2021 | 1,957 | 2,101 | ||||||||
0.750%, 02/15/2042 | 1,500 | 1,517 | ||||||||
0.625%, 07/15/2021 | 2,261 | 2,369 | ||||||||
0.625%, 01/15/2024 | 29,247 | 30,463 | ||||||||
0.500%, 04/15/2015 | 821 | 822 | ||||||||
0.375%, 07/15/2023 | 26,211 | 26,877 | ||||||||
0.250%, 01/15/2025 | 1,184 | 1,192 | ||||||||
0.125%, 04/15/2016 | 872 | 881 | ||||||||
0.125%, 04/15/2017 | 669 | 681 | ||||||||
0.125%, 04/15/2018 | 79,011 | 80,604 | ||||||||
0.125%, 04/15/2019 | 74,605 | 75,986 | ||||||||
0.125%, 01/15/2022 | 2,478 | 2,499 | ||||||||
0.125%, 07/15/2022 | 965 | 975 | ||||||||
0.125%, 01/15/2023 | 19,273 | 19,356 | ||||||||
0.125%, 07/15/2024 | 24,213 | 24,203 | ||||||||
U.S. Treasury Bills (A) (C) | ||||||||||
0.071%, 06/04/2015 | 42,750 | 42,749 | ||||||||
0.067%, 05/28/2015 | 42,750 | 42,748 | ||||||||
0.027%, 05/14/2015 | 1,100 | 1,100 | ||||||||
|
| |||||||||
Total U.S. Treasury Obligations |
| 392,413 | ||||||||
|
| |||||||||
Total Investments — 95.0% |
| $ | 2,038,999 | |||||||
|
| |||||||||
A list of the open futures contracts held by the Fund at March 31, 2015, is as follows:
| Type of Contract | Number of Long | Expiration Date | Unrealized Appreciation (Depreciation) ($ Thousands) | |||||||||
Amsterdam Index | 89 | Apr-2015 | $ | (107 | ) | |||||||
Australian 3-Year Bond | 1,282 | Jun-2015 | 2,835 | |||||||||
CAC40 10 Euro | 471 | Apr-2015 | 50 | |||||||||
Canadian 10-Year Bond | 990 | Jun-2015 | 425 | |||||||||
Dax Index | 97 | Jun-2015 | (115 | ) | ||||||||
| Type of Contract | Number of Long | Expiration Date | Unrealized Appreciation (Depreciation) ($ Thousands) | |||||||||
DJ Euro Stoxx 50 Index | 1,495 | Jun-2015 | $ | 418 | ||||||||
Euro-Bobl | 116 | Jun-2015 | 20 | |||||||||
Euro-BTP Future | 375 | Jun-2015 | 405 | |||||||||
Euro-Bund | 1,348 | Jun-2015 | 1,517 | |||||||||
Euro-Buxl 30 Year Bond | 35 | Jun-2015 | 375 | |||||||||
Euro-Schatz | 487 | Jun-2015 | 32 | |||||||||
FTSE 100 Index | 597 | Jun-2015 | (234 | ) | ||||||||
FTSE/JSE Top 40 Index | 476 | Jun-2015 | (96 | ) | ||||||||
Hang Seng Index | 79 | Apr-2015 | 159 | |||||||||
H-shares Index | 371 | Apr-2015 | 1,076 | |||||||||
IBEX 35 Plus Index | 124 | Apr-2015 | 485 | |||||||||
Japanese 10-Year Bond | 2,161 | Jun-2015 | (448 | ) | ||||||||
KOSPI 200 Index | 314 | Jun-2015 | 518 | |||||||||
Long Gilt 10-Year Bond | 953 | Jun-2015 | 3,472 | |||||||||
MSCI Emerging Index E-MINI | 888 | Jun-2015 | 1,542 | |||||||||
OMX Index | 68 | Apr-2015 | (11 | ) | ||||||||
Russell 2000 Index E-MINI | 601 | Jun-2015 | 947 | |||||||||
S&P 500 Index EMINI | 3,758 | Jun-2015 | (1,153 | ) | ||||||||
S&P Composite Index | 29 | Jun-2015 | (56 | ) | ||||||||
S&P Mid 400 Index E-MINI | 259 | Jun-2015 | 403 | |||||||||
S&P TSE 60 Index | 193 | Jun-2015 | (16 | ) | ||||||||
SGX S&P CNX Nifty Index | 352 | Apr-2015 | (93 | ) | ||||||||
SPI 200 Index | 262 | Jun-2015 | 270 | |||||||||
Taiwan Index | 378 | Apr-2015 | (63 | ) | ||||||||
Topix Index | 598 | Jun-2015 | 894 | |||||||||
U.S. 10-Year Treasury Note | 3,337 | Jun-2015 | 4,332 | |||||||||
U.S. 2-Year Treasury Note | 153 | May-2015 | 82 | |||||||||
U.S. 5-Year Treasury Note | 13 | Jun-2015 | 16 | |||||||||
U.S. Ultra Long Treasury Bond | 271 | Jun-2015 | 565 | |||||||||
Bloomberg Commodity Total Return Index | 377 | Jun-2015 | 4 | |||||||||
Brent Crude Penultimate*** | 89 | May-2015 | (203 | ) | ||||||||
Cocoa*** | 111 | Jul-2015 | (254 | ) | ||||||||
Cocoa*** | 147 | May-2015 | (148 | ) | ||||||||
Cocoa*** | 23 | Sep-2015 | (57 | ) | ||||||||
Coffee ‘C’*** | 85 | May-2015 | (1,008 | ) | ||||||||
Copper*** | 63 | May-2015 | 198 | |||||||||
Corn*** | 131 | Jul-2015 | (124 | ) | ||||||||
Cotton No. 2*** | 86 | Jul-2015 | (82 | ) | ||||||||
Cotton No. 2*** | 58 | May-2015 | 38 | |||||||||
Feeder Cattle*** | 66 | Aug-2015 | — | |||||||||
Feeder Cattle*** | 7 | May-2015 | 18 | |||||||||
Gas Oil ICE*** | 31 | Jul-2015 | (115 | ) | ||||||||
Gasoline RBOB*** | 16 | May-2015 | (35 | ) | ||||||||
Gold*** | 348 | Jun-2015 | (578 | ) | ||||||||
Goldman Sachs Index*** | 20 | Apr-2015 | (80 | ) | ||||||||
Heating Oil*** | 36 | May-2015 | (2 | ) | ||||||||
Lean Hogs | 239 | Jun-2015 | (536 | ) | ||||||||
Live Cattle*** | 95 | Jun-2015 | 141 | |||||||||
Live Cattle*** | 270 | Sep-2015 | 702 | |||||||||
LME Copper*** | 147 | Sep-2015 | 800 | |||||||||
LME Lead*** | 34 | Sep-2015 | 20 | |||||||||
LME Nickel*** | 42 | Jun-2015 | (387 | ) | ||||||||
LME Nickel*** | 17 | Sep-2015 | (181 | ) | ||||||||
LME Primary Aluminum*** | 134 | Jun-2015 | (62 | ) | ||||||||
LME Primary Aluminum*** | 446 | Sep-2015 | 32 | |||||||||
LME Zinc*** | 86 | Jun-2015 | 50 | |||||||||
LME Zinc*** | 165 | Sep-2015 | 173 | |||||||||
Natural Gas*** | 193 | May-2015 | (276 | ) | ||||||||
Silver*** | 178 | May-2015 | (115 | ) | ||||||||
Soybean*** | 216 | Jul-2015 | (87 | ) | ||||||||
Soybean Meal*** | 113 | Jul-2015 | (180 | ) | ||||||||
Soybean Meal*** | 59 | May-2015 | (21 | ) | ||||||||
Soybean Oil*** | 118 | Jul-2015 | (176 | ) | ||||||||
Soybean Oil*** | 65 | May-2015 | (59 | ) | ||||||||
Sugar #11*** | 498 | Apr-2015 | (1,201 | ) | ||||||||
Sugar #11*** | 60 | Jun-2015 | (186 | ) | ||||||||
Wheat*** | 159 | Jul-2015 | (298 | ) | ||||||||
WTI Crude Oil*** | 5 | May-2015 | (11 | ) | ||||||||
|
| |||||||||||
| $ | 14,160 | |||||||||||
|
| |||||||||||
For the period ended March 31, 2015, the total amount of all open futures contracts, as presented in the table above, are representative of the volume of activity for the derivative type during the period.
| 170 | SEI Institutional Managed Trust / Semi-Annual Report / March 31, 2015 |
A list of the open forward foreign currency contracts held by the Fund at March 31, 2015, is as follows:
| Settlement Date | Currency to Deliver (Thousands) | Currency to Receive (Thousands) | Unrealized Appreciation (Depreciation) ($ Thousands) | |||||||||||||||||
4/6/15-6/17/15 | USD | 9,129 | SGD | 12,589 | $ | 34 | ||||||||||||||
4/7/15 | USD | 57 | NZD | 76 | — | |||||||||||||||
4/7/15-6/17/15 | USD | 23,595 | EUR | 21,084 | (929 | ) | ||||||||||||||
4/28/15 | AUD | 8,900 | USD | 6,932 | 146 | |||||||||||||||
4/28/15 | CAD | 11,200 | USD | 8,964 | 122 | |||||||||||||||
4/28/15 | JPY | 2,044,600 | USD | 17,142 | 84 | |||||||||||||||
4/28/15 | USD | 56 | JPY | 6,674 | — | |||||||||||||||
4/28/15-6/17/15 | CHF | 4,548 | USD | 4,715 | 25 | |||||||||||||||
4/28/15-6/17/15 | EUR | 376,802 | USD | 412,398 | 7,366 | |||||||||||||||
4/28/15-6/17/15 | GBP | 60,839 | USD | 92,800 | 2,532 | |||||||||||||||
4/28/15-6/17/15 | HKD | 50,394 | USD | 6,498 | (2 | ) | ||||||||||||||
6/17/15 | CNH | 12,000 | USD | 1,893 | (24 | ) | ||||||||||||||
6/17/15 | HUF | 477,300 | USD | 1,665 | (43 | ) | ||||||||||||||
6/17/15 | KRW | 8,863,300 | USD | 7,821 | (169 | ) | ||||||||||||||
6/17/15 | MXP | 11,200 | USD | 727 | (4 | ) | ||||||||||||||
6/17/15 | PLN | 6,100 | �� | USD | 1,571 | (34 | ) | |||||||||||||
6/17/15 | SGD | 400 | USD | 289 | (2 | ) | ||||||||||||||
6/17/15 | TRY | 2,200 | USD | 845 | 14 | |||||||||||||||
6/17/15 | USD | 25,605 | BRL | 81,700 | (621 | ) | ||||||||||||||
6/17/15 | USD | 105 | CAD | 131 | (1 | ) | ||||||||||||||
6/17/15 | USD | 1,236 | CHF | 1,216 | 21 | |||||||||||||||
6/17/15 | USD | 41,104 | CNH | 260,800 | 556 | |||||||||||||||
6/17/15 | USD | 10,502 | GBP | 6,819 | (387 | ) | ||||||||||||||
6/17/15 | USD | 1,699 | HKD | 13,191 | 2 | |||||||||||||||
6/17/15 | USD | 32,067 | HUF | 8,843,100 | (417 | ) | ||||||||||||||
6/17/15 | USD | 7,473 | INR | 474,300 | (20 | ) | ||||||||||||||
| Settlement Date | Currency to Deliver (Thousands) | Currency to Receive (Thousands) | Unrealized Appreciation (Depreciation) ($ Thousands) | |||||||||||||||||
6/17/15 | USD | 45,499 | KRW | 50,798,100 | $ | 291 | ||||||||||||||
6/17/15 | USD | 24,695 | MXP | 377,800 | (22 | ) | ||||||||||||||
6/17/15 | USD | 35,612 | PLN | 133,800 | (402 | ) | ||||||||||||||
6/17/15 | USD | 40,610 | TRY | 108,300 | 287 | |||||||||||||||
6/17/15 | USD | 26,538 | ZAR | 320,700 | (400 | ) | ||||||||||||||
6/17/15 | ZAR | 6,600 | USD | 529 | (9 | ) | ||||||||||||||
|
| |||||||||||||||||||
| $ | 7,994 | |||||||||||||||||||
|
| |||||||||||||||||||
For the period ended March 31, 2014, the total amount of all open forward foreign currency contracts, as presented in the table above, are representative of the volume of activity for the derivative type during the period.
A list of the counterparties for the outstanding forward foreign currency contracts held by the Fund at March 31, 2015, is as follows:
| Counterparty | Currency to Deliver ($ Thousands) | Currency to Receive ($ Thousands) | Unrealized Appreciation (Depreciation) ($ Thousands) | |||||||||
Bank of New York | $ | (36,162 | ) | $ | 38,267 | $ | 2,105 | |||||
Barclays PLC | (2,321 | ) | 2,384 | 63 | ||||||||
Brown Brothers Harriman | (6,489 | ) | 6,488 | (1 | ) | |||||||
Citigroup | (330,734 | ) | 333,465 | 2,731 | ||||||||
Credit Suisse First Boston | (400,577 | ) | 401,799 | 1,222 | ||||||||
JPMorgan Chase Bank | (7,434 | ) | 7,534 | 100 | ||||||||
Northern Trust Company | (69,287 | ) | 69,964 | 677 | ||||||||
State Street | (27,364 | ) | 28,461 | 1,097 | ||||||||
|
| |||||||||||
| $ | 7,994 | |||||||||||
|
| |||||||||||
A list of open OTC swap agreements held by the Fund at March 31, 2015, is as follows:
| Total Return Swaps | ||||||||||||||||||
| Counterparty | Reference Entity/Obligation | Fund Pays | Fund Receives | Termination Date | Currency | Notional Amount (Thousands) (1) | Net Unrealized Appreciation (Depreciation) ($ Thousands) | |||||||||||
| Bank of America | Taiex Futures Index | Negative Price Return | Positve Price Return | 04/15/15 | TWD | 6,737 | $ | (20 | ) | |||||||||
| JPMorgan Chase Bank | Bovespa Index | Negative Price Return | Positve Price Return | 04/16/15 | BRL | 17,560 | 103 | |||||||||||
| Bank of America | Taiwan Index | Negative Price Return | Positve Price Return | 04/29/15 | TWD | 16,732 | (269 | ) | ||||||||||
| Bank of America | H-Shares Index | Negative Price Return | Positve Price Return | 04/30/15 | HKD | 25,811 | 813 | |||||||||||
| JPMorgan Chase Bank | H-Shares Index | Negative Price Return | Positve Price Return | 04/30/15 | HKD | 1,678 | 51 | |||||||||||
| Bank of America | Hang Seng Index | Negative Price Return | Positve Price Return | 04/30/15 | HKD | 10,137 | 167 | |||||||||||
| Bank of America | SGX S&P CNX Nifty Index | Negative Price Return | Positve Price Return | 04/30/15 | 9,000 | (126 | ) | |||||||||||
| Bank of America | Canadian 10-Year Bond | Negative Price Return | Positve Price Return | 06/01/15 | CAD | 2,029 | 10 | |||||||||||
| Bank of America | Long Gilt 10-Year Bond | Negative Price Return | Positve Price Return | 06/01/15 | 7,170 | 138 | ||||||||||||
| Bank of America | U.S. Treasury 10-Year Note | Negative Price Return | Positve Price Return | 06/01/15 | 588,070 | 5,786 | ||||||||||||
| Bank of America | Euro-Bund | Negative Price Return | Positve Price Return | 06/10/15 | EUR | 111,853 | 1,147 | |||||||||||
| JPMorgan Chase Bank | Swiss Market Index | Negative Price Return | Positve Price Return | 06/19/15 | CHF | 23,353 | (166 | ) | ||||||||||
| Citigroup | Soybean Oil*** | Negative Price Return | Positve Price Return | 05/01/15 | 2,097 | (86 | ) | |||||||||||
| BoA Merrill Lynch | Soybean Oil*** | Negative Price Return | Positve Price Return | 05/01/15 | 2,243 | (95 | ) | |||||||||||
| Citigroup | Soybean Meal*** | Negative Price Return | Positve Price Return | 05/01/15 | 719 | 15 | ||||||||||||
| BoA Merrill Lynch | Soybean Meal*** | Negative Price Return | Positve Price Return | 05/01/15 | 2,255 | 44 | ||||||||||||
| Barclays | Brent Crude Penultimate*** | Negative Price Return | Positve Price Return | 05/15/15 | 4,834 | (490 | ) | |||||||||||
| Citigroup | Brent Crude Penultimate*** | Negative Price Return | Positve Price Return | 05/15/15 | 11,860 | (1,076 | ) | |||||||||||
| Citibank | WTI Crude*** | Negative Price Return | Positve Price Return | 06/01/15 | 18,404 | (865 | ) | |||||||||||
| Citigroup | Natural Gas*** | Negative Price Return | Positve Price Return | 06/01/15 | 2,180 | (85 | ) | |||||||||||
| Deutsche Bank | Heating Oil*** | Negative Price Return | Positve Price Return | 06/06/15 | 2,956 | (134 | ) | |||||||||||
| Deutsche Bank | Unleaded Gasoline RBOB*** | Negative Price Return | Positve Price Return | 06/06/15 | 2,659 | (89 | ) | |||||||||||
| Deutsche Bank | Lean Hogs*** | Negative Price Return | Positve Price Return | 06/16/15 | 1,577 | (2 | ) | |||||||||||
| BoA Merrill Lynch | Lean Hogs*** | Negative Price Return | Positve Price Return | 06/16/15 | 1,637 | 2 | ||||||||||||
| Barclays | Gasoil*** | Negative Price Return | Positve Price Return | 06/16/15 | 1,208 | (37 | ) | |||||||||||
| BoA Merrill Lynch | Gasoil*** | Negative Price Return | Positve Price Return | 06/16/15 | 3,833 | (133 | ) | |||||||||||
| BoA Merrill Lynch | Live Cattle*** | Negative Price Return | Positve Price Return | 06/18/15 | 7,738 | 361 | ||||||||||||
| Citigroup | Corn*** | Negative Price Return | Positve Price Return | 07/01/15 | 96 | (5 | ) | |||||||||||
| BoA Merrill Lynch | Corn*** | Negative Price Return | Positve Price Return | 07/01/15 | 6,186 | (318 | ) | |||||||||||
| Citibank | Soybean*** | Negative Price Return | Positve Price Return | 07/01/15 | 4,351 | (20 | ) | |||||||||||
| BoA Merrill Lynch | Soybean*** | Negative Price Return | Positve Price Return | 07/01/15 | 4,498 | (12 | ) | |||||||||||
| BoA Merrill Lynch | Wheat*** | Negative Price Return | Positve Price Return | 07/01/15 | 514 | (13 | ) | |||||||||||
|
| |||||||||||||||||
| $ | 4,596 | |||||||||||||||||
|
| |||||||||||||||||
| SEI Institutional Managed Trust / Semi-Annual Report / March 31, 2015 | 171 |
CONSOLIDATED SCHEDULE OF INVESTMENTS (Unaudited)
Multi-Asset Accumulation Fund (Concluded)
March 31, 2015
A list of open centrally cleared swap agreements held by the Fund at March 31, 2015, is as follows:
| Interest Rate Swaps | ||||||||||||||
| Counterparty | Fund Pays | Fund Receives | Termination Date | Notional Amount ($ Thousands) | Net Unrealized ($ Thousands) | |||||||||
| JPMorgan Chase Bank | 2.25% | 3-Month USD - LIBOR | 06/17/2020 | $ | 75,379 | $ | 881 | |||||||
| JPMorgan Chase Bank | 1.25% | 3-Month USD - LIBOR | 06/17/2017 | 208,088 | 786 | |||||||||
|
| |||||||||||||
| $ | 1,667 | |||||||||||||
|
| |||||||||||||
For the period ended March 31, 2015 , the total amount of all open swap agreements, as presented in the tables above, are representative of the volume of activity for this derivative type during the period.
Percentages are based on Net Assets of $2,145,628 ($Thousands).
| (1) | In U.S. Dollars unless otherwise indicated. |
| * | Non-income producing security. |
| ** | The rate reported is the 7-day effective yield as of March 31, 2015. |
| *** | Futures and swap contracts held by Accumulation Commodity Strategy Subsidiary, Ltd. as of March 31, 2015. |
| † | Real Estate Investment Trust. |
| †† | Investment in Affiliated Security (see Note 6). |
| @ | Rate is negative due to the decrease in the value of the foreign currency against the U.S. Dollar. |
| (A) | Security, or portion thereof, is held by Accumulation Commodity Strategy Subsidiary, Ltd. as of March 31, 2015. |
| (B) | Securities sold within terms of a private placement memorandum, exempt from registration under Section 144A of the Securities Act of 1933, as amended, and may not be sold to dealers in that program or other “accredited investors.” These securities have been determined to be liquid under guidelines established by the Board of Trustees. |
| (C) | The rate reported is the effective yield at the time of purchase. |
ADR — American Depositary Receipt
AUD — Australian Dollar
BRL — Brazilian Real
Cl — Class
CAD — Canadian Dollar
CHF — Swiss Franc
CNH — Chinese Renminbi
DKK — Denmark Krone
EUR — Euro
FTSE — Financial Times Stock Exchange
GBP — British Pound
HKD — Hong Kong Dollar
HUF — Hungarian Forint
INR — Indian Rupee
JPY — Japanese Yen
JSE — Johannesburg Stock Exchange
KRW — Korean wan
LIBOR — London Interbank Offered Rate
LME — London Metal Exchange
NOK — Norwegian Krone
NZD — New Zealand Dollar
MSCI — Morgan Stanley Capital International
MTN — Medium Term Note
MXP — Mexican Peso
PLC — Public Limited Company
PLN — Polish Zloty
RBOB — Reformulated Blendstock for Oxygenate Blending
S&P — Standard & Poor’s
SEK — Swedish Krona
SGD — Singapore Dollar
SGX — Singapore Exchange
TSE — Tokyo Stock Exchange
TRY — Turkish New Lira
TWD — Taiwanese Dollar
USD — U.S. Dollar
ZAR — South African Rand
The following is a summary of the inputs used as of March 31, 2015, in valuing the Fund’s investments and other financial instruments carried at value ($ Thousands):
| Investments in Securities | Level 1 | Level 2 | Level 3 | Total | ||||||||||||
Sovereign Debt | $ | 3,131 | $ | 268,880 | $ | — | $ | 272,011 | ||||||||
Foreign Common Stock | 97,801 | — | 7 | 97,808 | ||||||||||||
Common Stock | 66,893 | — | — | 66,893 | ||||||||||||
Corporate Obligations | — | 28,680 | — | 28,680 | ||||||||||||
Exchange Traded Funds | 12,327 | — | — | 12,327 | ||||||||||||
Preferred Stock | 247 | — | — | 247 | ||||||||||||
Warrant | — | — | — | — | ||||||||||||
Rights | 6 | — | — | 6 | ||||||||||||
Cash Equivalent | 715,178 | — | — | 715,178 | ||||||||||||
Time Deposits | — | 453,436 | — | 453,436 | ||||||||||||
U.S. Treasury Obligations | — | 392,413 | — | 392,413 | ||||||||||||
|
|
|
|
|
|
|
| |||||||||
Total Investments in Securities | $ | 895,583 | $ | 1,143,409 | $ | 7 | $ | 2,038,999 | ||||||||
|
|
|
|
|
|
|
| |||||||||
| Other Financial Instruments | Level 1 | Level 2 | Level 3 | Total | ||||||||||||
Futures Contracts* | ||||||||||||||||
Unrealized Appreciation | $ | 23,014 | $ | — | $ | — | $ | 23,014 | ||||||||
Unrealized Depreciation | (8,854 | ) | — | — | (8,854 | ) | ||||||||||
Forwards* | ||||||||||||||||
Unrealized Appreciation | — | 11,480 | — | 11,480 | ||||||||||||
Unrealized Depreciation | — | (3,486 | ) | — | (3,486 | ) | ||||||||||
OTC Swaps* | ||||||||||||||||
Total Return Swaps | ||||||||||||||||
Unrealized Appreciation | — | 8,637 | — | 8,637 | ||||||||||||
Unrealized Depreciation | — | (4,041 | ) | — | (4,041 | ) | ||||||||||
Centrally Cleared Swaps* | ||||||||||||||||
Interest Rate Swaps | ||||||||||||||||
Unrealized Appreciation | — | 1,667 | — | 1,667 | ||||||||||||
|
|
|
|
|
|
|
| |||||||||
Total Other Financial Instruments | $ | 14,160 | $ | 14,257 | $ | — | $ | 28,417 | ||||||||
|
|
|
|
|
|
|
| |||||||||
| * | Futures contracts, forwards contracts and swap contracts are valued at the unrealized appreciation (depreciation) on the instrument. |
For the period ended March 31, 2015, there have been no transfers between Level 1 and Level 2 assets and liabilities.
For the period ended March 31, 2015, there have been no transfers between Level 2 and Level 3 assets and liabilities.
Amounts designed as “— “are $0 or have been rounded to $0.
For more information on valuation inputs, see Note 2 — Significant Accounting Policies in Notes to Financial Statements.
Amounts designated as “—” are $0 or rounded to $0.
The accompanying notes are an integral part of the financial statements.
| 172 | SEI Institutional Managed Trust / Semi-Annual Report / March 31, 2015 |
SCHEDULE OF INVESTMENTS (Unaudited)
Multi-Asset Income Fund
March 31, 2015
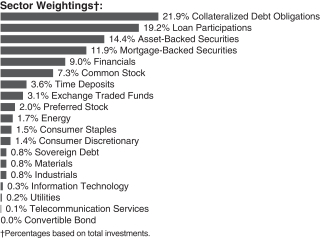
| Description | Face Amount ($ Thousands) | Market Value ($ Thousands) | ||||||
COLLATERALIZED DEBT OBLIGATIONS — 23.4% |
| |||||||
Financials — 0.1% | ||||||||
Covenant Credit Partners CLO, | ||||||||
3.177%, 07/20/26 | $ | 500 | $ | 479 | ||||
WhiteHorse II | ||||||||
0.000%, 06/15/17 (A) (B) | 11 | — | ||||||
|
| |||||||
| 479 | ||||||||
|
| |||||||
Other Asset-Backed Securities — 23.3% |
| |||||||
ACA CLO, Ser 2007-1A, Cl C | ||||||||
1.181%, 06/15/22 (B) (C) | 1,650 | 1,589 | ||||||
ACAS CLO, Ser 2012-1AR, Cl CR | ||||||||
3.497%, 09/20/23 (B) (C) | 2,500 | 2,501 | ||||||
ACAS CLO, Ser 2013-1A, Cl C | ||||||||
3.007%, 04/20/25 | 1,000 | 964 | ||||||
ACIS CLO, Ser 2013-1A, Cl D | ||||||||
4.731%, 04/18/24 (B) (C) | 800 | 800 | ||||||
ACIS CLO, Ser 2013-2A, Cl D | ||||||||
4.080%, 10/14/22 (B) (C) | 1,100 | 1,093 | ||||||
AMMC CLO XI, Ser 2012-11A | ||||||||
0.000%, 10/30/23 (A) (B) | 2,100 | 1,278 | ||||||
AMMC CLO XIV, Ser 2014-14A, Cl A3L | ||||||||
3.030%, 07/27/26 (B) (C) | 1,000 | 969 | ||||||
Ares XXV CLO, Ser 2012-3A | ||||||||
0.000%, 01/17/24 (A) (B) | 750 | 504 | ||||||
Ares XXVI CLO, Ser 2013-1A | ||||||||
0.000%, 04/15/25 (A) (B) | 1,500 | 1,019 | ||||||
Ares XXVI CLO, | ||||||||
3.003%, 04/15/25 (B) (C) | 750 | 733 | ||||||
Ares XXVI CLO, Ser 2013-1X | ||||||||
0.000%, 04/15/25 (A) | 500 | 340 | ||||||
| Description | Face Amount ($ Thousands) | Market Value ($ Thousands) | ||||||
Atlas Senior Loan Fund, | ||||||||
2.957%, 02/17/26 | $ | 1,350 | $ | 1,304 | ||||
Atlas Senior Loan Fund II, | ||||||||
0.000%, 01/30/24 (A) (B) | 950 | 757 | ||||||
Avery Point III CLO, | ||||||||
0.694%, 01/18/25 (A) | 3,000 | 2,798 | ||||||
Babson CLO, Ser 2012-2A | ||||||||
2.389%, 05/15/23 (A) (B) | 3,000 | 2,273 | ||||||
Babson CLO, Ser 2014-IA | ||||||||
0.787%, 07/20/25 (B) | 2,400 | 1,902 | ||||||
Battalion CLO, Ser 2007-1A, Cl D | ||||||||
2.380%, 07/14/22 (B) (C) | 1,900 | 1,870 | ||||||
Black Diamond CLO Delaware, | ||||||||
2.032%, 01/07/18 (B) (C) | 1,800 | 1,750 | ||||||
Black Diamond CLO Luxembourg, | ||||||||
0.943%, 04/29/19 (B) (C) | 1,100 | 1,034 | ||||||
BlackRock Senior Income, | ||||||||
0.000%, 09/15/16 (A) (B) (F) | 950 | — | ||||||
Callidus Debt Partners CLO Fund VI, Ser 2007-6A, Cl B | ||||||||
1.481%, 10/23/21 (B) (C) | 500 | 480 | ||||||
Carlyle Global Market Strategies CLO, Ser 2012-3A | ||||||||
0.000%, 10/14/24 (A) (B) | 750 | 623 | ||||||
Carlyle Global Market Strategies CLO, Ser 2014-2AR, Cl DR | ||||||||
4.157%, 07/20/23 (B) (C) | 1,000 | 992 | ||||||
Cedarwoods CRE CDO, | ||||||||
0.460%, 07/25/51 | 2,827 | 2,557 | ||||||
Cent CLO 16, Ser 2014-16AR, Cl BR | ||||||||
3.500%, 08/01/24 (B) (C) | 2,500 | 2,500 | ||||||
Cerberus Offshore Levered I CLO, | ||||||||
6.241%, 11/30/18 (B) (C) | 300 | 300 | ||||||
Cerberus Onshore II CLO, | ||||||||
3.753%, 10/15/23 (B) (C) | 250 | 244 | ||||||
3.626%, 10/15/23 (B) (C) | 750 | 732 | ||||||
Cerberus Onshore II CLO, | ||||||||
4.426%, 10/15/23 (B) (C) | 750 | 717 | ||||||
4.253%, 10/15/23 (B) (C) | 250 | 237 | ||||||
COA Summit CLO, Ser 2014-1A, Cl C | ||||||||
4.081%, 04/20/23 (B) (C) | 500 | 501 | ||||||
| SEI Institutional Managed Trust / Semi-Annual Report / March 31, 2015 | 173 |
SCHEDULE OF INVESTMENTS (Unaudited)
Multi-Asset Income Fund (Continued)
March 31, 2015
| Description | Face Amount ($ Thousands) | Market Value ($ Thousands) | ||||||
ColumbusNova CLO, | ||||||||
1.582%, 05/16/19 (B) (C) | $ | 1,500 | $ | 1,450 | ||||
Connecticut Valley Structured Credit CDO III, Ser 2006-3A, Cl A3A | ||||||||
0.915%, 03/23/23 (B) (C) | 500 | 484 | ||||||
Copper River CLO, | ||||||||
0.000%, 01/20/21 (A) (B) | 3,000 | 1,541 | ||||||
DIVCORE CLO, Ser 2013-1A, Cl B | ||||||||
4.069%, 11/15/32 | 750 | 754 | ||||||
Diversified Asset Securitization Holdings II, Ser 2000-1A, Cl A1L | ||||||||
0.724%, 09/15/35 (B) (C) | 153 | 150 | ||||||
Dryden 37 Senior Loan Fund, | ||||||||
0.216%, 04/15/27 (A) (B) | 1,000 | 971 | ||||||
Dryden 37 Senior Loan Fund, | ||||||||
0.645%, 04/15/27 (A) (B) | 1,100 | 1,004 | ||||||
Dryden XXIII Senior Loan Fund, | ||||||||
3.181%, 07/17/23 (B) (C) | 1,750 | 1,750 | ||||||
Duane Street CLO II, | ||||||||
3.982%, 08/20/18 (B) (C) | 1,250 | 1,220 | ||||||
Finn Square CLO, Ser 2012-1A | ||||||||
0.000%, 12/24/23 (A) (B) | 1,000 | 709 | ||||||
Flagship CLO VI, Ser 2007-1A, Cl D | ||||||||
2.665%, 06/10/21 (B) (C) | 2,000 | 1,971 | ||||||
Fortress Credit Opportunities III CLO, Ser 2014-3A, Cl C | ||||||||
3.504%, 04/28/26 (B) (C) | 2,500 | 2,414 | ||||||
Fortress Credit Opportunities V CLO, Ser 2014-5A, Cl D | ||||||||
4.734%, 10/15/26 (B) (C) | 1,000 | 945 | ||||||
Fortress Credit Opportunities V CLO, Ser 2014-5A, Cl C | ||||||||
3.784%, 10/15/26 (B) (C) | 2,250 | 2,219 | ||||||
Fortress Credit Opportunities VI CLO, Ser 2015-6A, Cl D | ||||||||
5.269%, 10/10/26 (B) (C) | 1,000 | 963 | ||||||
Galaxy XIX CLO, Ser 2015-19A, Cl COMB | ||||||||
0.000%, 01/24/27 (A) (B) | 1,000 | 943 | ||||||
Gallatin CLO VII, | ||||||||
3.991%, 07/15/23 (B) (C) | 500 | 493 | ||||||
Garrison Funding, CLO, | ||||||||
4.882%, 09/25/23 (B) (C) | 250 | 248 | ||||||
| Description | Face Amount ($ Thousands) | Market Value ($ Thousands) | ||||||
Global Leveraged Capital Credit Opportunity Fund, | ||||||||
1.231%, 12/20/18 (B) (C) | $ | 1,550 | $ | 1,528 | ||||
Golub Capital Partners CLO, | ||||||||
3.181%, 10/20/21 (B) (C) | 1,500 | 1,494 | ||||||
Golub Capital Partners CLO, | ||||||||
0.373%, 04/25/26 (B) (C) | 600 | 583 | ||||||
Golub Capital Partners CLO, | ||||||||
4.234%, 04/25/26 (B) (C) | 300 | 277 | ||||||
Golub Capital Partners CLO, | ||||||||
3.533%, 10/25/26 (B) (C) | 1,200 | 1,156 | ||||||
Golub Capital Partners CLO, | ||||||||
4.019%, 02/05/27 (B) (C) (F) | 2,000 | 2,000 | ||||||
Gramercy Park CLO, | ||||||||
2.254%, 07/17/23 (A) (B) | 1,100 | 943 | ||||||
Gramercy Park CLO, | ||||||||
3.183%, 07/17/23 (B) (C) | 2,700 | 2,700 | ||||||
Gramercy Park CLO, | ||||||||
4.283%, 07/17/23 (B) (C) | 600 | 598 | ||||||
Gramercy Real Estate CDO, | ||||||||
0.512%, 08/15/56 (B) (C) | 3,588 | 3,233 | ||||||
Grayson CLO, Ser 2006-1A, Cl A2 | ||||||||
0.642%, 11/01/21 (B) (C) | 700 | 653 | ||||||
Great Lakes CLO, Ser 2012-1A | ||||||||
0.000%, 01/15/23 (A) (B) | 1,000 | 720 | ||||||
Great Lakes CLO, Ser 2014-1A, Cl D | ||||||||
4.431%, 04/15/25 (B) (C) | 500 | 465 | ||||||
Great Lakes CLO, Ser 2014-1A, Cl C | ||||||||
3.931%, 04/15/25 (B) (C) | 2,500 | 2,448 | ||||||
Greywolf CLO III, Ser 2014-1A, Cl B | ||||||||
3.080%, 04/22/26 (B) (C) | 750 | 726 | ||||||
GSC Partners CDO Fund V, | ||||||||
0.000%, 11/20/16 (A) (B) | 2 | — | ||||||
Halcyon Loan Investors CLO II, Ser 2007-2A, Cl C | ||||||||
1.656%, 04/24/21 (B) (C) | 500 | 483 | ||||||
Helios Series I Multi Asset, | ||||||||
1.188%, 12/13/36 (B) (C) | 1,025 | 962 | ||||||
| 174 | SEI Institutional Managed Trust / Semi-Annual Report / March 31, 2015 |
| Description | Face Amount ($ Thousands) | Market Value ($ Thousands) | ||||||
Highland Park CDO I, | ||||||||
0.563%, 11/25/51 (B) (C) | $ | 1,402 | $ | 1,339 | ||||
Katonah, Ser 2007-10A, Cl D | ||||||||
2.262%, 04/17/20 (B) (C) | 500 | 492 | ||||||
Kingsland CLO III, Ser 2006-3A, Cl C1 | ||||||||
1.833%, 08/24/21 (B) (C) | 1,350 | 1,287 | ||||||
KKR Financial CLO, | ||||||||
2.482%, 05/15/21 (B) (C) | 2,600 | 2,589 | ||||||
KVK CLO, Ser 2013-1A | ||||||||
0.000%, 04/14/25 (A) (B) | 3,500 | 2,499 | ||||||
KVK CLO, Ser 2014-1A, Cl C | ||||||||
3.132%, 05/15/26 (B) (C) | 1,000 | 967 | ||||||
KVK CLO, Ser 2014-2A, Cl C | ||||||||
3.231%, 07/15/26 (B) (C) | 1,000 | 970 | ||||||
Lime Street CLO, Ser 2007-1A, Cl D | ||||||||
2.747%, 06/20/21 (B) (C) | 750 | 724 | ||||||
Marathon CLO II, Ser 2005-2A, Cl INC | ||||||||
0.000%, 12/20/19 (A) (B) | 750 | 88 | ||||||
Marathon CLO, Ser 2014-6A, Cl B | ||||||||
3.108%, 05/13/25 | 1,000 | 970 | ||||||
MCF CLO III, Ser 2013-3A, Cl D | ||||||||
3.462%, 01/20/24 (C) | 250 | 229 | ||||||
MCF CLO IV, Ser 2014-1A, Cl E | ||||||||
6.197%, 10/15/25 (B) (C) | 500 | 449 | ||||||
Mountain Hawk II CLO, | ||||||||
2.831%, 07/22/24 (B) (C) | 1,000 | 951 | ||||||
Mountain Hawk II CLO, | ||||||||
3.381%, 07/22/24 (B) (C) | 1,000 | 901 | ||||||
MT Wilson CLO II, Ser 2007-2A, Cl D | ||||||||
3.002%, 07/11/20 (B) (C) | 3,000 | 2,961 | ||||||
MWAM CBO, Ser 2001-1A, Cl C1 | ||||||||
5.105%, 01/30/31 (B) (C) | 2,117 | 1,978 | ||||||
MWAM CBO, Ser 2001-1A, Cl C2 | ||||||||
14.092%, 01/30/31 (B) | 1,631 | 1,788 | ||||||
Neuberger Berman CLO, | ||||||||
0.419%, 07/25/23 (B) | 3,200 | 2,181 | ||||||
Neuberger Berman CLO, | ||||||||
3.356%, 07/25/23 | 2,000 | 1,990 | ||||||
NewStar Arlington Senior Loan Program, Ser 2014-1A, Cl D | ||||||||
4.614%, 07/25/25 (B) (C) | 750 | 698 | ||||||
NewStar Arlington Senior Loan Program, Ser 2014-1A, Cl C1 | ||||||||
3.664%, 07/25/25 (B) (C) | 1,000 | 958 | ||||||
| Description | Face Amount ($ Thousands) | Market Value ($ Thousands) | ||||||
Newstar Commercial Loan Funding, Ser 2013-1A, Cl D | ||||||||
4.783%, 09/20/23 (B) (C) | $ | 600 | $ | 583 | ||||
Newstar Commercial Loan Funding, Ser 2013-1A, Cl E | ||||||||
5.533%, 09/20/23 (B) (C) | 250 | 247 | ||||||
Newstar Commercial Loan Trust, | ||||||||
1.562%, 09/30/22 (B) (C) | 500 | 476 | ||||||
Newstar Trust, Ser 2012-2A, Cl D | ||||||||
6.481%, 01/20/23 (B) (C) | 500 | 505 | ||||||
Northwoods Capital VII CDO, | ||||||||
3.757%, 10/22/21 (B) (C) | 300 | 300 | ||||||
N-Star CDO VIII, Ser 2006-8A, Cl A1 | ||||||||
0.475%, 02/01/41 | 1,833 | 1,751 | ||||||
N-Star CDO VIII, Ser 2006-8A, Cl A2 | ||||||||
0.515%, 02/01/41 (B) (C) | 1,000 | 902 | ||||||
Oaktree EIF II, Ser 2014-A2, Cl C | ||||||||
0.218%, 11/15/25 (B) (C) | 1,000 | 994 | ||||||
OCP CLO, Ser 2014-6A, Cl B | ||||||||
3.224%, 07/17/26 (B) (C) | 1,000 | 988 | ||||||
Octagon Loan Funding, | ||||||||
1.124%, 11/18/26 (B) | 1,000 | 756 | ||||||
Palmer Square CLO, | ||||||||
2.778%, 10/17/22 (B) (C) | 1,000 | 976 | ||||||
Pangaea CLO, Ser 2007-1A, Cl B | ||||||||
1.231%, 10/21/21 (B) (C) | 500 | 487 | ||||||
Primus CLO II, Ser 2007-2A, Cl C | ||||||||
1.203%, 07/15/21 (B) (C) | 1,500 | 1,455 | ||||||
Putnam Structured Product Funding CDO, Ser 2002-1A, Cl A2 | ||||||||
0.855%, 01/10/38 | 997 | 929 | ||||||
Race Point CLO, Ser 2007-4A, Cl D | ||||||||
2.232%, 08/01/21 (B) (C) | 750 | 744 | ||||||
Race Point CLO, Ser 2011-5AR, Cl DR | ||||||||
3.991%, 12/15/22 | 1,600 | 1,597 | ||||||
RAIT CRE CDO I, Ser 2006-1X, Cl A1B | ||||||||
0.485%, 11/20/46 (C) | 2,321 | 2,136 | ||||||
Rockwall CDO II, Ser 2007-1A, Cl A1LB | ||||||||
0.782%, 08/01/24 (B) (C) | 3,400 | 3,170 | ||||||
Rockwall CDO, Ser 2006-1A, Cl A2L | ||||||||
0.882%, 08/01/21 (B) (C) | 200 | 190 | ||||||
| SEI Institutional Managed Trust / Semi-Annual Report / March 31, 2015 | 175 |
SCHEDULE OF INVESTMENTS (Unaudited)
Multi-Asset Income Fund (Continued)
March 31, 2015
| Description | Face Amount ($ Thousands) | Market Value ($ Thousands) | ||||||
Rockwall CDO, Ser 2006-1A, Cl A1LB | ||||||||
0.732%, 08/01/21 (B) (C) | $ | 1,700 | $ | 1,659 | ||||
Salus CLO, Ser 2012-1AN, Cl DN | ||||||||
6.985%, 03/05/21 | 250 | 247 | ||||||
Shackleton CLO, Ser 2012-2A, Cl D | ||||||||
4.307%, 10/20/23 | 1,000 | 990 | ||||||
Steele Creek CLO, Ser 2014-1A, Cl C | ||||||||
3.434%, 08/21/26 (B) (C) | 500 | 488 | ||||||
Suane Street CLO, Ser 2007-4A, Cl D | ||||||||
2.507%, 11/14/21 | 1,850 | 1,800 | ||||||
TCW Global Project Fund II, | ||||||||
1.581%, 06/15/16 (B) (C) (F) | 131 | 126 | ||||||
TCW Global Project Fund III, | ||||||||
0.884%, 09/01/17 (B) (C) (F) | 717 | 695 | ||||||
TCW Global Project Fund III, | ||||||||
1.084%, 09/01/17 (B) (C) (F) | 500 | 475 | ||||||
Telos CLO, Ser 2013-3A, Cl D | ||||||||
4.478%, 01/17/24 (B) (C) | 1,050 | 1,036 | ||||||
Telos CLO, Ser 2014-6A, Cl C | ||||||||
3.233%, 01/17/27 (B) (C) | 3,000 | 2,923 | ||||||
TICP CLO II, Ser 2014-2A, Cl B | ||||||||
3.234%, 07/20/26 (B) (C) | 600 | 589 | ||||||
Treman Park CLO, Ser 2015-1A, Cl COM | ||||||||
0.000%, 04/20/27 (A) (B) | 3,000 | 2,880 | ||||||
Tricadia CDO, Ser 2006-6A, Cl A2L | ||||||||
0.988%, 11/05/41 (B) (C) | 550 | 536 | ||||||
Venture XIV CLO, Ser 2013-14A, Cl C | ||||||||
2.988%, 08/28/25 (B) (C) | 500 | 485 | ||||||
Venture XV CLO, Ser 2013-15A, Cl C | ||||||||
3.331%, 07/15/25 (B) (C) | 250 | 247 | ||||||
Vibrant CLO II, Ser 2013-2A, Cl B | ||||||||
3.006%, 07/24/24 (B) (C) | 1,000 | 961 | ||||||
West CLO, Ser 2013-1A | ||||||||
2.907%, 11/07/25 (B) | 1,350 | 917 | ||||||
West CLO, Ser 2013-1A, Cl B | ||||||||
3.132%, 11/07/25 (B) (C) | 1,000 | 973 | ||||||
West Coast Funding, | ||||||||
0.374%, 11/02/41 (B) (C) | 453 | 450 | ||||||
|
| |||||||
| 141,231 | ||||||||
|
| |||||||
Total Collateralized Debt Obligations |
| 141,710 | ||||||
|
| |||||||
| Description | Face Amount ($ Thousands) | Market Value ($ Thousands) | ||||||
LOAN PARTICIPATIONS — 20.6% |
| |||||||
1-800 Contacts, Term Loan, | ||||||||
4.250%, 01/29/21 | $ | 695 | $ | 692 | ||||
AABS, Bridge Term Loan | ||||||||
4.875%, 01/15/38 (F) | 875 | 890 | ||||||
ABG Intermediate Holdings 2, | ||||||||
5.500%, 05/27/21 | 496 | 497 | ||||||
Acosta HoldCo | ||||||||
0.000%, 09/26/19 (D) (E) | 2,000 | (2 | ) | |||||
Active Network, 1st Lien Term Loan | ||||||||
5.500%, 11/13/20 | 471 | 469 | ||||||
Advantage Sales and Marketing, 1st Lien | ||||||||
4.250%, 07/23/21 | 1,594 | 1,592 | ||||||
Advantage Sales and Marketing, Revolver Loan | ||||||||
0.500%, 07/25/19 | 375 | (52 | ) | |||||
Advantage Sales, 1st Lien | ||||||||
4.250%, 07/23/21 (D) (E) | 2 | 2 | ||||||
Aircell Business Aviation Services, 1st Lien | ||||||||
7.500%, 03/21/18 | 248 | 238 | ||||||
Akorn, 1st Lien Term Loan B | ||||||||
4.500%, 04/16/21 | 549 | 550 | ||||||
Albertsons Holdings, 1st Lien | ||||||||
5.500%, 08/25/21 | 2,500 | 2,520 | ||||||
Alexander Mann Solutions, | ||||||||
5.750%, 12/20/19 | 347 | 343 | ||||||
AlliedBarton Security Services, Term Loan, 1st Lien | ||||||||
4.250%, 02/12/21 | 909 | 908 | ||||||
AmWINS Group, 1st Lien Term Loan B | ||||||||
5.250%, 09/06/19 | 47 | 48 | ||||||
AmWINS Group, Cov-Lite, | ||||||||
5.250%, 09/06/19 | 101 | 102 | ||||||
ANVC Merger, 1st Lien Term Loan | ||||||||
5.500%, 02/18/21 | 495 | 494 | ||||||
Araren, 2nd Lien Term Loan | ||||||||
9.250%, 08/18/21 | 500 | 495 | ||||||
Arctic Glacier, Cov-Lite, 1st Lien | ||||||||
6.000%, 05/10/19 | 312 | 309 | ||||||
Aspect Software | ||||||||
7.000%, 05/07/16 | 552 | 549 | ||||||
Assured Partners, 1st Lien Term Loan | ||||||||
4.500%, 04/02/21 | 549 | 547 | ||||||
| 176 | SEI Institutional Managed Trust / Semi-Annual Report / March 31, 2015 |
| Description | Face Amount ($ Thousands) | Market Value ($ Thousands) | ||||||
Assured Partners, 2nd Lien Term Loan | ||||||||
7.750%, 04/02/22 | $ | 100 | $ | 96 | ||||
Atkore, Cov-Lite, 1st Lien Term Loan | ||||||||
4.500%, 04/09/21 | 1,294 | 1,281 | ||||||
Atkore, Cov-Lite, 2nd Lien Term Loan | ||||||||
7.750%, 10/09/21 | 350 | 338 | ||||||
Avaya | ||||||||
6.500%, 03/31/18 | 1,615 | 1,610 | ||||||
Avaya, Term Loan B3 | ||||||||
4.672%, 10/26/17 | 1,905 | 1,873 | ||||||
BJ’s Wholesale Club | ||||||||
4.500%, 09/26/19 | 1,615 | 1,614 | ||||||
Bonne Terre Limited Sky, | ||||||||
6.500%, 02/09/22 | 650 | 961 | ||||||
Brickman Group Holdings, | ||||||||
4.000%, 12/18/20 | 1,194 | 1,188 | ||||||
California Pizza Kitchen, Term Loan | ||||||||
5.250%, 03/29/18 | 235 | 229 | ||||||
CAMP Systems, Cov-Lite, 1st Lien Term Loan | ||||||||
4.750%, 05/31/19 | 148 | 149 | ||||||
CAMP Systems, Cov-Lite, 2nd Lien Term Loan | ||||||||
8.250%, 11/29/19 | 200 | 200 | ||||||
Capital Automotive | ||||||||
6.000%, 04/30/20 | 210 | 213 | ||||||
Carcore National, 1st Lien Term Loan | ||||||||
5.500%, 03/05/21 | 2,691 | 2,704 | ||||||
Castlelake Aircraft Securitization Trust, Ser 2014-1, Cl B | ||||||||
7.500%, 02/15/29 | 1,713 | 1,709 | ||||||
Castlelake Aircraft Securitization Trust, Ser 2014-1, Cl A1 | ||||||||
5.250%, 02/15/29 | 2,570 | 2,551 | ||||||
Cengage Learning Acquisitions, 1st Lien Term Loan | ||||||||
7.000%, 03/31/20 | 893 | 896 | ||||||
Ceridian HCM Holding, 1st Lien | ||||||||
4.500%, 09/15/20 | 465 | 458 | ||||||
Ceva Group PLC, 1st Lien Term Loan | ||||||||
6.500%, 03/19/21 | 1,126 | 1,051 | ||||||
Ceva Intercompany BV, 1st Lien Term Loan | ||||||||
6.500%, 03/19/21 | 482 | 451 | ||||||
Ceva Logistics, 1st Lien Term Loan | ||||||||
6.500%, 03/19/21 | 83 | 78 | ||||||
| Description | Face Amount ($ Thousands) | Market Value ($ Thousands) | ||||||
CHG Healthcare Services, 1st Lien | ||||||||
4.250%, 11/19/19 | $ | 732 | $ | 734 | ||||
CompuCom Systems, Term Loan | ||||||||
4.250%, 05/07/20 | 931 | 865 | ||||||
Connolly, Cov-Lite, 1st Lien Term Loan | ||||||||
5.000%, 05/14/21 | 1,493 | 1,499 | ||||||
CPM Holdings, 1st Lien | ||||||||
6.250%, 08/29/17 | 320 | 320 | ||||||
CPM Holdings, 2nd Lien | ||||||||
10.250%, 03/01/18 | 200 | 200 | ||||||
CTI Foods, 1st Lien Term Loan | ||||||||
4.500%, 06/12/20 | 199 | 198 | ||||||
CTI Foods, 2nd Lien Term Loan | ||||||||
8.250%, 06/28/21 | 400 | 393 | ||||||
Cumulus Media, 1st Lien | ||||||||
4.250%, 12/23/20 | 497 | 488 | ||||||
Cunningham Lindsey, Cov-Lite, 1st Lien | ||||||||
5.000%, 12/10/19 | 196 | 193 | ||||||
Deltek Systems, 1st Lien Term Loan | ||||||||
4.500%, 10/10/18 | 432 | 432 | ||||||
Dematic, Cov-Lite, 1st Lien | ||||||||
4.250%, 12/28/19 | 1,228 | 1,224 | ||||||
Diamond Foods, Cov-Lite, | ||||||||
4.250%, 08/20/18 | 1,092 | 1,090 | ||||||
DJO Finance, 1st Lien | ||||||||
4.250%, 09/15/17 | 245 | 245 | ||||||
Doncaster PLC, 2nd Lien Term Loan | ||||||||
9.500%, 10/09/20 | 138 | 137 | ||||||
Endurance International, | ||||||||
5.000%, 11/09/19 | 786 | 789 | ||||||
Equinox Fitness Club, Term Loan B | ||||||||
5.000%, 01/31/20 | 673 | 675 | ||||||
Evergreen Skillsoft, 1st Lien | ||||||||
5.750%, 04/28/21 | 507 | 501 | ||||||
EXE Castle, 2nd Lien Term Loan | ||||||||
7.250%, 04/05/21 | 150 | 141 | ||||||
Exopack, Cov-Lite, 1st Lien Term Loan B | ||||||||
5.250%, 05/08/19 | 198 | 199 | ||||||
Expert Global | ||||||||
8.000%, 04/02/18 | 447 | 446 | ||||||
Expro Holdings, 1st Lien | ||||||||
5.750%, 09/02/21 | 698 | 593 | ||||||
EyeMart Express | ||||||||
5.000%, 12/16/21 | 1,000 | 1,005 | ||||||
| SEI Institutional Managed Trust / Semi-Annual Report / March 31, 2015 | 177 |
SCHEDULE OF INVESTMENTS (Unaudited)
Multi-Asset Income Fund (Continued)
March 31, 2015
| Description | Face Amount ($ Thousands) | Market Value ($ Thousands) | ||||||
Fender Musical Instruments, | ||||||||
5.750%, 04/03/19 | $ | 221 | $ | 221 | ||||
Filtration Group, Cov-Lite, 1st Lien | ||||||||
4.500%, 11/20/20 | 396 | 398 | ||||||
First Advantage, 2nd Lien Term Loan | ||||||||
10.500%, 08/28/19 (F) | 150 | 149 | ||||||
First Advantage, Cov-Lite, | ||||||||
6.250%, 02/13/19 | 688 | 683 | ||||||
First Data, 1st Lien Extended | ||||||||
4.168%, 03/24/21 | 700 | 702 | ||||||
First Data, 1st Lien Term Loan | ||||||||
3.672%, 03/23/18 | 780 | 779 | ||||||
Fitness International | ||||||||
5.500%, 07/01/20 | 697 | 648 | ||||||
Flakt Woods Group Hybrid | ||||||||
4.751%, 03/20/17 | 654 | 688 | ||||||
Fleetpride, 1st Lien | ||||||||
5.250%, 11/19/19 | 160 | 158 | ||||||
Flexera Software, Cov-Lite, 1st Lien Term Loan | ||||||||
4.500%, 04/02/20 | 386 | 385 | ||||||
Flexera Software, Cov-Lite, 2nd Lien | ||||||||
8.000%, 04/02/21 | 150 | 146 | ||||||
FMG Resources Property | ||||||||
3.750%, 06/30/19 | 5,450 | 4,913 | ||||||
Gates Global LLC | ||||||||
4.250%, 07/05/21 | 998 | 993 | ||||||
GCA Services Group, Cov-Lite, 1st Lien Term Loan | ||||||||
4.250%, 11/01/19 | 88 | 88 | ||||||
GCA Services Group, Cov-Lite, 2nd Lien Term Loan | ||||||||
9.250%, 10/11/20 | 120 | 119 | ||||||
GlobalLogic Holdings, 1st Lien Term Loan B | ||||||||
6.250%, 05/31/19 | 297 | 295 | ||||||
Go Daddy, Cov-Lite, 1st Lien Term Loan | ||||||||
4.750%, 05/13/21 | 594 | 596 | ||||||
GOGO LLC | ||||||||
11.250%, 06/21/17 | 462 | 471 | ||||||
Goodpack, Cov-Lite, 1st Lien Term Loan | ||||||||
4.750%, 09/09/21 | 700 | 698 | ||||||
| Description | Face Amount ($ Thousands) | Market Value ($ Thousands) | ||||||
Greenway Medical Technologies, 1st Lien Term Loan | ||||||||
9.250%, 11/04/21 | $ | 100 | $ | 98 | ||||
6.000%, 11/04/20 | 891 | 891 | ||||||
Gypsum, Cov-Lite, 1st Lien Term Loan | ||||||||
4.750%, 04/01/21 | 1,195 | 1,163 | ||||||
Hardware Holdings, Interactive Date, Cov-Lite, 1st Lien Term Loan | ||||||||
8.000%, 03/30/20 (F) | 998 | 968 | ||||||
HDV Holdings, Term Loan | ||||||||
5.750%, 12/18/18 | 180 | 178 | ||||||
Hearthside Food Solutions, | ||||||||
4.500%, 06/02/21 | 498 | 500 | ||||||
Hoffmaster Group, 1st Lien Term Loan | ||||||||
5.300%, 05/09/20 | 746 | 749 | ||||||
Hostess Brands, Term Loan B | ||||||||
6.750%, 04/09/20 | 99 | 101 | ||||||
Hub International, 1st Lien Term | ||||||||
4.250%, 10/02/20 | 1,390 | 1,377 | ||||||
Hyland Software, 1st Lien Term Loan | ||||||||
4.750%, 02/19/21 | 199 | 199 | ||||||
Interactive Date, Cov-Lite, | ||||||||
4.750%, 05/02/21 | 995 | 999 | ||||||
Interline Brands, 1st Lien Term Loan | ||||||||
4.000%, 03/17/21 | 1,590 | 1,581 | ||||||
Intertrust Group, 1st Lien Term Loan | ||||||||
4.404%, 04/16/21 | 500 | 499 | ||||||
Intertrust Group, 2nd Lien Term Loan | ||||||||
8.000%, 04/15/22 | 1,700 | 1,692 | ||||||
Intrawest Holdings | ||||||||
0.375%, 12/10/18 (D) (F) | 200 | — | ||||||
Intrawest, 1st Lien Term Loan | ||||||||
5.500%, 12/09/20 | 477 | 480 | ||||||
J Crew Group, 1st Lien | ||||||||
4.000%, 03/05/21 | 609 | 564 | ||||||
J Crew Group, Term Loan B | ||||||||
4.000%, 03/05/21 | 287 | 266 | ||||||
Jacobs Entertainment, 1st Lien Term Loan | ||||||||
5.250%, 10/29/18 | 387 | 375 | ||||||
Jazz Acquisition Wencor, Cov-Lite | ||||||||
0.000%, 06/19/19 (D) (E) | 450 | (6 | ) | |||||
| 178 | SEI Institutional Managed Trust / Semi-Annual Report / March 31, 2015 |
| Description | Face Amount ($ Thousands) | Market Value ($ Thousands) | ||||||
Knowledge Universe Education, 1st Lien Term Loan | ||||||||
5.250%, 03/18/21 | $ | 794 | $ | 801 | ||||
Kronos, Incremental Term Loan | ||||||||
4.500%, 10/30/19 | 363 | 364 | ||||||
Lafarge MONIER, 1st Lien Term Loan | ||||||||
4.569%, 10/15/20 | 655 | 709 | ||||||
Landest Software, 1st Lien | ||||||||
5.000%, 02/25/20 | 644 | 642 | ||||||
Learning Care Group, 1st Lien | ||||||||
5.500%, 05/05/21 | 1,493 | 1,498 | ||||||
Lineage Logistics, Cov-Lite, 1st Lien Term Loan | ||||||||
4.500%, 04/07/21 | 2,164 | 2,143 | ||||||
Lions Gate, 2nd Lien | ||||||||
5.000%, 03/11/22 | 500 | 500 | ||||||
McJunkin Red Man, 1st Lien Term Loan B | ||||||||
5.000%, 11/08/19 | 1,827 | 1,752 | ||||||
Men’s Warehouse | ||||||||
4.500%, 06/18/21 | 848 | 851 | ||||||
Mergermarket, 1st Lien Term Loan | ||||||||
4.500%, 02/04/21 | 744 | 722 | ||||||
Minimax GmbH & Co., Term Loan B1 | ||||||||
4.250%, 08/14/20 | 348 | 350 | ||||||
MISYS, 1st Lien Term Loan | ||||||||
5.000%, 12/12/18 | 788 | 789 | ||||||
MISYS, 2nd Lien | ||||||||
12.000%, 06/12/19 | 350 | 381 | ||||||
Mitchell International, Cov-Lite, 2nd Lien Term Loan | ||||||||
8.500%, 10/11/21 | 1,150 | 1,138 | ||||||
Mitel Networks, 1st Lien | ||||||||
5.250%, 01/31/20 | 557 | 557 | ||||||
MRI Software, 1st Lien | ||||||||
5.250%, 02/04/21 | 199 | 198 | ||||||
NANA Development, 1st Lien Term Loan | ||||||||
8.000%, 03/15/18 | 235 | 225 | ||||||
National Veterinary Associates, | ||||||||
4.750%, 08/14/21 | 748 | 748 | ||||||
National Veterinary Associates, | ||||||||
8.000%, 08/14/22 | 250 | 250 | ||||||
National Vision, Cov-Lite, 1st Lien Term Loan | ||||||||
4.000%, 03/12/21 | 1,290 | 1,275 | ||||||
Navistar International | ||||||||
5.750%, 08/17/17 | 118 | 118 | ||||||
| Description | Face Amount ($ Thousands) | Market Value ($ Thousands) | ||||||
Nes Global Talent, 1st Lien Term Loan | ||||||||
6.500%, 10/03/19 | $ | 1,006 | $ | 955 | ||||
Nord Anglia Education, 1st Lien Term Loan | ||||||||
4.500%, 03/31/21 | 1,195 | 1,195 | ||||||
One Call Medical, 1st Lien Term Loan | ||||||||
5.000%, 11/27/20 | 874 | 874 | ||||||
P2 Energy Solutions, Cov-Lite, 1st Lien Term Loan | ||||||||
5.000%, 10/30/20 | 583 | 565 | ||||||
P2 Energy Solutions, Cov-Lite, 2nd Lien Term Loan | ||||||||
9.000%, 04/30/21 | 150 | 138 | ||||||
Packers Sanitation Services, | ||||||||
5.000%, 11/25/21 | 1,000 | 1,006 | ||||||
Panda Temple Power, 1st Lien Term Loan B | ||||||||
7.250%, 04/03/19 | 350 | 341 | ||||||
Paradigm | ||||||||
4.750%, 07/30/19 | 135 | 121 | ||||||
Pelican Products | ||||||||
9.250%, 04/09/21 | 1,000 | 990 | ||||||
Performance Food Group, Cov-Lite, 2nd Lien Term Loan | ||||||||
6.250%, 11/07/19 | 401 | 402 | ||||||
6.250%, 11/14/19 | 785 | 785 | ||||||
Phillips-Medisize, 1st Lien | ||||||||
4.750%, 06/16/21 | 498 | 497 | ||||||
Pierre Foods, 2nd Lien Term Loan | ||||||||
9.500%, 10/02/17 | 326 | 326 | ||||||
Pierre Foods, Term Loan, 1st Lien | ||||||||
5.750%, 07/10/17 | 361 | 362 | ||||||
Pipeline Supply & Service, 1st Lien Term Loan | ||||||||
5.500%, 01/28/20 | 272 | 213 | ||||||
Reddy Ice, 1st Lien Term Loan | ||||||||
6.750%, 05/01/19 | 344 | 301 | ||||||
Reddy Ice, 2nd Lien Term Loan | ||||||||
10.750%, 11/01/19 | 225 | 171 | ||||||
Renaissance Learning, 1st Lien | ||||||||
4.500%, 04/09/21 | 723 | 708 | ||||||
Rexam PLC, 1st Lien Term Loan | ||||||||
8.000%, 05/02/22 | 650 | 650 | ||||||
4.250%, 05/03/21 | 995 | 996 | ||||||
Rise, Term Loan | ||||||||
4.750%, 02/12/39 | 2,828 | 2,849 | ||||||
Rite Aid, Unfunded Bridge Loan, 1st Lien | ||||||||
0.000%, 02/10/16 (D) (E) | 1,200 | — | ||||||
| SEI Institutional Managed Trust / Semi-Annual Report / March 31, 2015 | 179 |
SCHEDULE OF INVESTMENTS (Unaudited)
Multi-Asset Income Fund (Continued)
March 31, 2015
| Description | Face Amount ($ Thousands) | Market Value ($ Thousands) | ||||||
Road Infrastructure Investments, 1st Lien Term Loan | ||||||||
4.250%, 03/31/21 | $ | 744 | $ | 730 | ||||
Road Infrastructure Investments, 2nd Lien Term Loan | ||||||||
7.750%, 09/30/21 | 200 | 180 | ||||||
Royal Adhesives and Sealants, Term Loan | ||||||||
5.500%, 07/31/18 | 321 | 322 | ||||||
Sabre Holdings | ||||||||
4.000%, 02/15/19 | 585 | 585 | ||||||
Sears Holdings, 1st Lien Term Loan | ||||||||
5.500%, 06/30/18 | 495 | 487 | ||||||
Servicemaster, 1st Lien Term Loan | ||||||||
4.250%, 07/01/21 | 1,147 | 1,141 | ||||||
Shields Finance, 1st Lien Term Loan B | ||||||||
5.000%, 01/29/21 | 1,489 | 1,492 | ||||||
SI Organization, 1st Lien Term Loan | ||||||||
5.750%, 11/23/19 | 439 | 441 | ||||||
Signode Industrial Group | ||||||||
3.750%, 05/01/21 | 947 | 940 | ||||||
3.750%, 05/01/21 | 1,344 | 1,335 | ||||||
Sirva Worldwide, Term Loan | ||||||||
7.500%, 03/27/19 | 835 | 831 | ||||||
Smart & Final, Cov-Lite, 1st Lien Term Loan | ||||||||
4.750%, 11/15/19 | 749 | 752 | ||||||
Southern Graphic Systems | ||||||||
4.250%, 10/17/19 | 239 | 239 | ||||||
Southern Graphic Systems, 1st Lien | ||||||||
4.250%, 10/17/19 | 169 | 168 | ||||||
Sparta Systems | ||||||||
7.750%, 07/28/20 | 698 | 692 | ||||||
Stuart Weitzman Acquisition LLC, 1st Lien Term Loan | ||||||||
4.500%, 04/08/20 | 746 | 745 | ||||||
Syncreon Holdings, 1st Lien Term Loan B | ||||||||
5.250%, 10/28/20 | 644 | 616 | ||||||
Texas Competitive Electric Holdings | ||||||||
3.750%, 05/05/16 | 139 | 139 | ||||||
Texas Competitive Electric Holdings, Delayed Term Loan 1st Lien | ||||||||
3.750%, 05/05/16 | 144 | 144 | ||||||
The Harvard Drug Group, | ||||||||
5.000%, 10/29/19 | 580 | 575 | ||||||
| Description | Face Amount ($ Thousands) | Market Value ($ Thousands) | ||||||
The Nieman Marcus Group, 1st Lien Term Loan | ||||||||
4.250%, 10/25/20 | $ | 1,487 | $ | 1,481 | ||||
The Telx Group | ||||||||
7.500%, 04/09/21 | 300 | 296 | ||||||
4.500%, 04/09/20 | 995 | 988 | ||||||
ThermaSys, Term Loan, 1st Lien | ||||||||
5.250%, 05/03/19 | 361 | 360 | ||||||
TI Group Automotive Systems, 1st Lien | ||||||||
4.250%, 07/02/21 | 269 | 268 | ||||||
Tibo Balboa Merger, Cov-Lite, Term Loan BL1 | ||||||||
6.500%, 11/25/20 | 2,000 | 1,998 | ||||||
TMS International, Cov-Lite, 1st Lien | ||||||||
4.500%, 10/16/20 | 396 | 386 | ||||||
Travelport | ||||||||
6.000%, 09/02/21 | 2,000 | 2,016 | ||||||
TSAM Delaware, 1st Lien | ||||||||
8.750%, 09/12/19 | 696 | 691 | ||||||
Univision Communications, | ||||||||
4.000%, 03/01/20 | 992 | 990 | ||||||
V Group, Cov-Lite, 1st Lien | ||||||||
5.000%, 06/25/21 | 249 | 250 | ||||||
Vencore | ||||||||
5.750%, 11/23/19 | 29 | 29 | ||||||
Viking Aquisitions | ||||||||
4.612%, 11/05/16 | 76 | 76 | ||||||
Wall Street Systems Delaware, | ||||||||
4.500%, 04/30/21 | 2,290 | 2,277 | ||||||
WTG Holdings III | ||||||||
4.750%, 01/15/21 | 495 | 495 | ||||||
|
| |||||||
Total Loan Participations | 124,623 | |||||||
|
| |||||||
CORPORATE OBLIGATIONS — 17.1% |
| |||||||
Consumer Discretionary — 1.5% |
| |||||||
Checkers Drive-In Restaurants | ||||||||
11.000%, 12/01/17 (B) | 575 | 626 | ||||||
GRD Holdings III | ||||||||
10.750%, 06/01/19 (B) | 1,500 | 1,631 | ||||||
Guitar Center | ||||||||
6.500%, 04/15/19 (B) | 135 | 118 | ||||||
MDC Partners | ||||||||
6.750%, 04/01/20 (B) | 3,535 | 3,725 | ||||||
Men’s Warehouse | ||||||||
7.000%, 07/01/22 (B) | 650 | 684 | ||||||
PF Chang’s China Bistro | ||||||||
10.250%, 06/30/20 (B) | 160 | 166 | ||||||
| 180 | SEI Institutional Managed Trust / Semi-Annual Report / March 31, 2015 |
| Description | Face Amount ($ Thousands) | Market Value ($ Thousands) | ||||||
R&R Ice Cream | ||||||||
8.250%, 05/15/20 | $ | 300 | $ | 225 | ||||
Seminole Hard Rock Entertainment | ||||||||
5.875%, 05/15/21 (B) | 300 | 301 | ||||||
SITEL | ||||||||
11.000%, 08/01/17 (B) | 750 | 776 | ||||||
Wynn Las Vegas | ||||||||
5.500%, 03/01/25 (B) | 1,000 | 1,013 | ||||||
|
| |||||||
| 9,265 | ||||||||
|
| |||||||
Consumer Staples — 1.6% | ||||||||
Bumble Bee Acquisitions | ||||||||
9.000%, 12/15/17 (B) | 1,690 | 1,774 | ||||||
Central Garden and Pet | ||||||||
8.250%, 03/01/18 | 1,910 | 1,954 | ||||||
HRG Group | ||||||||
7.875%, 07/15/19 | 1,999 | 2,104 | ||||||
KeHE Distributors | ||||||||
7.625%, 08/15/21 (B) | 550 | 584 | ||||||
Vector Group | ||||||||
7.750%, 02/15/21 | 3,050 | 3,245 | ||||||
|
| |||||||
| 9,661 | ||||||||
|
| |||||||
Energy — 1.8% | ||||||||
Atlas Energy Holdings Operating | ||||||||
9.250%, 08/15/21 | 1,250 | 862 | ||||||
7.750%, 01/15/21 | 789 | 537 | ||||||
Carrizo Oil & Gas | ||||||||
7.500%, 09/15/20 | 500 | 514 | ||||||
Comstock Resources | ||||||||
10.000%, 03/15/20 (B) | 450 | 435 | ||||||
Consol Energy | ||||||||
8.000%, 04/01/23 (B) | 1,000 | 980 | ||||||
ContourGlobal Power Holdings | ||||||||
7.125%, 06/01/19 (B) | 1,650 | 1,683 | ||||||
Dynagas LNG Partners | ||||||||
6.250%, 10/30/19 | 1,800 | 1,548 | ||||||
Northern Oil & Gas | ||||||||
8.000%, 06/01/20 | 1,050 | 932 | ||||||
Penn Virginia Resource Partners | ||||||||
8.375%, 06/01/20 | 1,024 | 1,116 | ||||||
SandRidge Energy | ||||||||
8.125%, 10/15/22 | 300 | 184 | ||||||
Schahin II Finance | ||||||||
5.875%, 09/25/22 (B) | 1,737 | 1,050 | ||||||
Ultra Resources | ||||||||
4.510%, 10/12/20 (F) | 500 | 458 | ||||||
Unit | ||||||||
6.625%, 05/15/21 | 420 | 395 | ||||||
|
| |||||||
| 10,694 | ||||||||
|
| |||||||
| Description | Face Amount ($ Thousands) | Market Value ($ Thousands) | ||||||
Financials — 9.7% | ||||||||
Bank of America | ||||||||
6.250%, 09/29/49 (C) | $ | 2,200 | $ | 2,241 | ||||
6.100%, 12/29/49 (C) | 1,600 | 1,619 | ||||||
5.125%, 12/31/49 (C) | 4,400 | 4,356 | ||||||
Barclays | ||||||||
8.250%, 12/31/99 (C) | 750 | 804 | ||||||
Cadence Financial | ||||||||
4.875%, 06/28/19 (B) | 1,750 | 1,767 | ||||||
CIC Receive Master Trust | ||||||||
4.890%, 10/07/21 (F) | 2,800 | 2,865 | ||||||
Citigroup | ||||||||
5.950%, 12/29/49 (C) | 1,250 | 1,266 | ||||||
5.875%, 12/29/49 (C) | 2,595 | 2,605 | ||||||
5.800%, 11/29/49 (C) | 3,950 | 3,960 | ||||||
5.350%, 05/29/49 (C) | 355 | 343 | ||||||
Credit Suisse Group | ||||||||
6.250%, 12/29/49 (B) (C) | 600 | 589 | ||||||
Customers Bank | ||||||||
6.125%, 06/26/29 (B) (C) | 2,300 | 2,363 | ||||||
Fifth Third Bancorp | ||||||||
5.100%, 12/31/49 (C) | 1,630 | 1,549 | ||||||
4.900%, 12/29/49 (C) | 1,200 | 1,160 | ||||||
HSBC Holdings | ||||||||
6.375%, 12/29/49 (C) | 1,000 | 1,021 | ||||||
5.625%, 12/29/49 (C) | 2,850 | 2,871 | ||||||
Jefferies Finance | ||||||||
7.375%, 04/01/20 (B) | 1,000 | 970 | ||||||
Jefferies LoanCore | ||||||||
6.875%, 06/01/20 (B) | 300 | 278 | ||||||
JPMorgan Chase | ||||||||
5.150%, 04/05/23 (C) | 2,110 | 2,060 | ||||||
5.000%, 12/29/49 (C) | 6,070 | 5,963 | ||||||
Morgan Stanley | ||||||||
5.550%, 12/29/49 (C) | 1,400 | 1,414 | ||||||
Nordea Bank | ||||||||
6.125%, 12/31/49 (B) (C) | 1,700 | 1,754 | ||||||
5.500%, 09/29/49 (B) (C) | 1,350 | 1,372 | ||||||
Opal Acquisition | ||||||||
8.875%, 12/15/21 (B) | 1,600 | 1,628 | ||||||
Oxford Finance | ||||||||
7.250%, 01/15/18 (B) | 2,250 | 2,318 | ||||||
ProSight Global | ||||||||
7.500%, 11/20/20 (F) | 250 | 262 | ||||||
SunTrust Banks | ||||||||
5.625%, 12/15/19 (C) | 7,500 | 7,631 | ||||||
Wilton Re Finance LLC | ||||||||
5.875%, 03/30/33 (B) (C) | 1,350 | 1,458 | ||||||
|
| |||||||
| 58,487 | ||||||||
|
| |||||||
| SEI Institutional Managed Trust / Semi-Annual Report / March 31, 2015 | 181 |
SCHEDULE OF INVESTMENTS (Unaudited)
Multi-Asset Income Fund (Continued)
March 31, 2015
| Description | Face Amount (Thousands) (1) | Market Value ($ Thousands) | ||||||||||
Industrials — 0.9% | ||||||||||||
LMI Aerospace | ||||||||||||
7.375%, 07/15/19 (B) | 250 | $ | 252 | |||||||||
Marquette Transportation | ||||||||||||
10.875%, 01/15/17 | 50 | 52 | ||||||||||
Princess Juliana International Airport Operating | ||||||||||||
5.500%, 12/20/27 (B) | 1,009 | 1,024 | ||||||||||
Quality Distribution | ||||||||||||
9.875%, 11/01/18 | 946 | 991 | ||||||||||
Skyway Concession LLC | ||||||||||||
0.637%, 06/30/26 (B) (C) | 850 | 705 | ||||||||||
Unifrax I | ||||||||||||
7.500%, 02/15/19 (B) | 200 | 201 | ||||||||||
Xefin Lux MTN | ||||||||||||
3.832%, 06/01/19 (B) (C) | EUR | 1,850 | 1,989 | |||||||||
|
| |||||||||||
| 5,214 | ||||||||||||
|
| |||||||||||
Information Technology — 0.4% |
| |||||||||||
Avaya | ||||||||||||
7.000%, 04/01/19 (B) | 1,250 | 1,240 | ||||||||||
Blackboard | ||||||||||||
7.750%, 11/15/19 (B) | (350 | ) | (336 | ) | ||||||||
Eagle Midco | ||||||||||||
9.000%, 06/15/18 (B) | 800 | 815 | ||||||||||
Sabre | ||||||||||||
8.500%, 05/15/19 (B) | 420 | 449 | ||||||||||
|
| |||||||||||
| 2,168 | ||||||||||||
|
| |||||||||||
Materials — 0.9% | ||||||||||||
Kaiser Aluminum | ||||||||||||
8.250%, 06/01/20 | 225 | 245 | ||||||||||
KGHM International | ||||||||||||
7.750%, 06/15/19 (B) | 650 | 670 | ||||||||||
Reynolds Group Issuer | ||||||||||||
7.875%, 08/15/19 | 1,250 | 1,320 | ||||||||||
7.125%, 04/15/19 | 1,500 | 1,554 | ||||||||||
TPC Group | ||||||||||||
8.750%, 12/15/20 (B) | 1,695 | 1,551 | ||||||||||
|
| |||||||||||
| 5,340 | ||||||||||||
|
| |||||||||||
Telecommunication Services — 0.1% |
| |||||||||||
CenturyLink | ||||||||||||
5.625%, 04/01/25 (B) | 200 | 201 | ||||||||||
Sprint | ||||||||||||
7.625%, 02/15/25 | 600 | 597 | ||||||||||
|
| |||||||||||
| 798 | ||||||||||||
|
| |||||||||||
Utilities — 0.2% | ||||||||||||
AES | ||||||||||||
3.234%, 06/01/19 (C) | 1,500 | 1,493 | ||||||||||
|
| |||||||||||
Total Corporate Obligations | 103,120 | |||||||||||
|
| |||||||||||
| Description | Face Amount ($ Thousands) | Market Value ($ Thousands) | ||||||
ASSET-BACKED SECURITIES — 15.4% |
| |||||||
Credit Cards — 0.0% |
| |||||||
Citi Holdings Liquidating Unrated Performing Assets, Ser 2012-BIZ, Cl A | ||||||||
0.228%, 12/15/49 (B) (F) | $ | 278 | $ | 245 | ||||
|
| |||||||
Mortgage Related Securities — 1.1% |
| |||||||
Asset-Backed Securities Home Equity, Ser 2004-HE8, Cl M1 | ||||||||
1.205%, 12/25/34 (C) | 681 | 654 | ||||||
GSAA Home Equity Trust, Ser 06-18, Cl AF5A | ||||||||
6.002%, 11/25/36 | 3,046 | 2,038 | ||||||
GSAA Home Equity Trust, Ser 2005-10, Cl M4 | ||||||||
0.805%, 06/25/35 (C) | 950 | 861 | ||||||
GSAA Home Equity Trust, Ser 2006-14, Cl A3A | ||||||||
0.405%, 09/25/36 (C) | 638 | 392 | ||||||
GSAA Home Equity Trust, Ser 2007-7, Cl A4 | ||||||||
0.440%, 07/25/37 (C) | 1,222 | 1,032 | ||||||
Home Equity Asset Trust, Ser 2005-7, Cl M1 | ||||||||
0.605%, 01/25/36 (C) | 800 | 724 | ||||||
New Century Home Equity Loan Trust, Ser 2004-4, Cl M2 | ||||||||
0.950%, 02/25/35 (C) | 490 | 439 | ||||||
New Century Home Equity Loan Trust, Ser 2005-1, Cl M2 | ||||||||
0.875%, 03/25/35 (C) | 434 | 377 | ||||||
|
| |||||||
| 6,517 | ||||||||
|
| |||||||
Other Asset-Backed Securities — 14.3% |
| |||||||
AASET, Ser 2014-1, Cl A | ||||||||
5.125%, 12/15/29 (C) (F) | 5,394 | 5,408 | ||||||
AASET, Ser 2014-1, Cl B | ||||||||
7.375%, 12/15/29 (C) | 5,149 | 5,162 | ||||||
ACE Securities Home Equity Loan Trust, Ser 2006-ASP2, Cl A2D | ||||||||
0.435%, 03/25/36 (C) | 1,750 | 1,560 | ||||||
Aerco, Ser 2000-2A, Cl A3 | ||||||||
0.621%, 07/15/25 (C) (F) | 855 | 348 | ||||||
AIM Aviation Finance, | ||||||||
5.072%, 02/15/40 (B) | 994 | 1,003 | ||||||
Airplanes Pass-Through Trust, Ser 2001-1A, Cl A9 | ||||||||
0.725%, 03/15/19 (C) | 1,381 | 566 | ||||||
ALM VI, Ser 2012-6A | ||||||||
0.000%, 06/14/23 (A) | 500 | 395 | ||||||
| 182 | SEI Institutional Managed Trust / Semi-Annual Report / March 31, 2015 |
| Description | Face Amount ($ Thousands) | Market Value ($ Thousands) | ||||||
ALM VII, Ser 2013-7R2A, Cl B | ||||||||
2.856%, 04/24/24 (B) (C) | $ | 1,250 | $ | 1,236 | ||||
ALM VII, Ser 2013-7RA, Cl C | ||||||||
3.706%, 04/24/24 (B) (C) | 1,250 | 1,239 | ||||||
ALM XIV, Ser 2014-14A, Cl C | ||||||||
3.681%, 07/28/26 (B) (C) | 1,250 | 1,187 | ||||||
ALM XIV, Ser 2014-14A, Cl B | ||||||||
3.181%, 07/28/26 (B) (C) | 1,000 | 990 | ||||||
Avalon IV Capital, | ||||||||
4.078%, 04/17/23 (B) (C) | 750 | 752 | ||||||
Babcock & Brown Air Funding I, Ser 2007-1A, Cl G1 | ||||||||
0.453%, 11/14/33 (B) (C) | 737 | 626 | ||||||
CCR MT100 Payment Rights Master Trust, Ser 2010-CA, Cl C | ||||||||
0.620%, 07/10/17 (B) (C) | 5,604 | 5,482 | ||||||
CIFC Funding, Ser 2006-1BA, Cl B2L | ||||||||
4.265%, 12/22/20 (B) (C) | 1,000 | 992 | ||||||
CIFC Funding, Ser 2012-2A, Cl A3L | ||||||||
3.235%, 12/05/24 (B) (C) | 500 | 493 | ||||||
CIFC Funding, Ser 2014-1A, Cl C | ||||||||
3.053%, 04/18/25 (B) (C) | 750 | 732 | ||||||
CIFC Funding, Ser 2014-1AR, Cl A3R | ||||||||
3.327%, 08/14/24 (B) (C) | 1,000 | 1,004 | ||||||
CIT Mortgage Loan Trust, Ser 2007-1, Cl 2A3 | ||||||||
1.605%, 10/25/37 (B) (C) | 4,700 | 4,466 | ||||||
Connecticut Valley Structured Credit, Ser 2006-3A, Cl B2 | ||||||||
6.676%, 03/23/23 | 442 | 439 | ||||||
Credit Suisse Mortgage Trust, Ser 14-SURF, Cl E | ||||||||
3.276%, 02/15/29 | 3,150 | 3,146 | ||||||
Emerald Aviation Finance, Ser 2013-1, Cl B | ||||||||
6.350%, 10/15/38 (B) | 1,367 | 1,388 | ||||||
First Frankin Mortgage Loan Trust, Ser 2006-FF1, Cl 2A4 | ||||||||
0.495%, 01/25/36 (C) | 500 | 441 | ||||||
GCAT, Ser 2014-2, Cl A1 | ||||||||
3.721%, 10/25/19 (B) | 5,068 | 5,056 | ||||||
GreenPoint Mortgage Funding Trust, Ser 2005-HE4, Cl M1 | ||||||||
0.860%, 07/25/30 (C) | 2,778 | 2,655 | ||||||
GSAMP Trust, Ser 2005-HE6, Cl M1 | ||||||||
0.595%, 11/25/35 (C) | 2,850 | 2,643 | ||||||
| Description | Face Amount ($ Thousands) | Market Value ($ Thousands) | ||||||
Halcyon Loan Advisors Funding, Ser 2012-1A, Cl B | ||||||||
3.258%, 08/15/23 (B) (C) | $ | 500 | $ | 489 | ||||
Halcyon Loan Advisors Funding, Ser 2012-2A, Cl C | ||||||||
3.120%, 12/20/24 (B) (C) | 500 | 483 | ||||||
Kingsland IV, Ser 2007-4A, Cl D | ||||||||
1.704%, 04/16/21 (B) (C) | 500 | 459 | ||||||
LCM X, Ser 2014-10AR, Cl DR | ||||||||
3.981%, 04/15/22 (B) (C) | 1,000 | 998 | ||||||
LCM X, Ser 5A, Cl D | ||||||||
1.615%, 03/21/19 | 500 | 486 | ||||||
Nationstar HECM Loan Trust, Ser 2014-1A, Cl A | ||||||||
4.500%, 11/25/17 (B) | 4,846 | 4,871 | ||||||
Newstar Commercial Loan Funding, Ser 2014-1A, Cl C | ||||||||
3.831%, 04/20/25 (B) (C) | 1,500 | 1,496 | ||||||
Newstar Commercial Loan Funding, Ser 2014-1A, Cl D | ||||||||
4.981%, 04/20/25 (B) (C) | 750 | 750 | ||||||
Newstar Commercial Loan Funding, Ser 2015-1A, Cl C | ||||||||
4.117%, 01/20/27 (B) (C) | 1,000 | 995 | ||||||
Northwoods Capital XIV, Ser 2014-14A, Cl C | ||||||||
3.582%, 11/12/25 (B) (C) | 1,500 | 1,463 | ||||||
Northwoods Capital XIV, Ser 2014-14A, Cl B | ||||||||
2.692%, 11/12/25 (B) (C) | 1,500 | 1,500 | ||||||
NRPL Trust, Ser 2015-1A, Cl A1 | ||||||||
3.875%, 11/01/54 (B) | 2,978 | 2,979 | ||||||
Octagon Investment Partners X, Ser 2006-10A, Cl D | ||||||||
1.657%, 10/18/20 (B) (C) | 1,250 | 1,202 | ||||||
Octagon Investment Partners XV, Ser 2013-1A, Cl C | ||||||||
3.081%, 01/19/25 (B) (C) | 500 | 494 | ||||||
OHA Credit Partners IX, Ser 2013-9A, Cl ACOM | ||||||||
0.484%, 10/20/25 (A) (B) | 2,000 | 1,894 | ||||||
OHA Credit Partners VII, Ser 2012-7A, Cl D | ||||||||
4.261%, 11/20/23 (B) (C) | 500 | 499 | ||||||
OZLM Funding V, Ser 2013-5A, Cl B | ||||||||
3.228%, 01/17/26 (B) (C) | 750 | 739 | ||||||
Sands Point Funding, | ||||||||
1.981%, 07/18/20 (B) (C) | 500 | 479 | ||||||
Saxon Asset Securities Trust, Ser 2005-4, Cl M1 | ||||||||
0.592%, 11/25/37 (C) | 1,650 | 1,422 | ||||||
| SEI Institutional Managed Trust / Semi-Annual Report / March 31, 2015 | 183 |
SCHEDULE OF INVESTMENTS (Unaudited)
Multi-Asset Income Fund (Continued)
March 31, 2015
| Description | Face Amount ($ Thousands) | Market Value ($ Thousands) | ||||||
Structured Asset Securities Mortgage Loan Trust, Ser 2006-BC6, Cl A4 | ||||||||
0.325%, 01/25/37 (C) | $ | 750 | $ | 625 | ||||
Structured Asset Securities Mortgage Loan Trust, Ser 2006-OPT1, Cl A5 | ||||||||
0.412%, 04/25/36 (C) | 1,700 | 1,543 | ||||||
Structured Asset Securities Mortgage Loan Trust, Ser 2007-BC1, Cl A4 | ||||||||
0.300%, 02/25/37 (C) | 1,850 | 1,609 | ||||||
Turbine Engines Securitization, Ser 2013-1A, Cl B | ||||||||
6.375%, 12/15/48 (F) | 619 | 637 | ||||||
Turbine Engines Securitization, Ser 2013-1A, Cl A | ||||||||
5.125%, 12/13/48 (B) (F) | 1,041 | 1,055 | ||||||
VOLT, Ser 2015-NPL3, Cl A1 | ||||||||
3.375%, 10/25/58 (B) | 3,962 | 3,954 | ||||||
Wachovia Asset Securitization Issuance II, Ser 2007-HE1, Cl A | ||||||||
0.292%, 07/25/37 (B) (C) | 909 | 807 | ||||||
Wachovia Bank Commercial Mortgage Trust, | ||||||||
0.875%, 06/15/20 | 419 | 407 | ||||||
Willis Engine Securitization | ||||||||
5.500%, 09/15/37 (B) | 1,779 | 1,783 | ||||||
Witeh, Ser 2014-1A, Cl C | ||||||||
3.006%, 05/01/26 | 1,000 | 944 | ||||||
|
| |||||||
| 86,471 | ||||||||
|
| |||||||
Total Asset-Backed Securities | 93,233 | |||||||
|
| |||||||
MORTGAGE-BACKED SECURITIES — 12.7% |
| |||||||
Non-Agency Mortgage-Backed Obligations — 12.7% |
| |||||||
Alliance Bancorp Trust, Ser 2007-OA1, Cl A1 | ||||||||
0.410%, 07/25/37 (C) | 1,254 | 837 | ||||||
American Home Mortgage Assets Trust, Ser 2006-6, Cl A1A | ||||||||
0.364%, 12/25/46 (C) | 2,412 | 1,691 | ||||||
American Home Mortgage Assets Trust, Ser 2007-1, Cl A1 | ||||||||
0.815%, 02/25/47 (C) | 5,474 | 3,482 | ||||||
American Home Mortgage Investment Trust, Ser 2006-1, Cl 12A1 | ||||||||
0.370%, 03/25/46 (C) | 1,782 | 1,481 | ||||||
| Description | Face Amount ($ Thousands) | Market Value ($ Thousands) | ||||||
Brad, Ser 2014-1, Cl B | ||||||||
5.438%, 03/12/26 | $ | 1,000 | $ | 1,007 | ||||
CDGJ Commercial Mortgage Trust, Ser 2014-BXCH, Cl EPA | ||||||||
4.404%, 12/15/27 (B) (C) | 4,000 | 4,005 | ||||||
Chase Mortgage Finance, Ser 2006-S3, Cl 1A2 | ||||||||
6.000%, 11/25/36 | 1,354 | 1,182 | ||||||
First Horizon Alternative Mortgage Securities Trust, Ser 2006-FA1, Cl 1A3 | ||||||||
5.750%, 04/25/36 | 1,937 | 1,582 | ||||||
GE Business Loan Trust, Ser 2007-1, Cl C | ||||||||
0.625%, 04/16/35 (B) (C) | 2,042 | 1,879 | ||||||
GreenPoint Mortgage Funding Trust, Ser 2006-AR1, Cl A1A | ||||||||
0.445%, 02/25/36 (C) | 757 | 652 | ||||||
GreenPoint Mortgage Funding Trust, Ser 2007-AR1, Cl 1A1A | ||||||||
0.235%, 02/25/47 (C) | 2,040 | 1,905 | ||||||
HarborView Mortgage Loan Trust, Ser 2006-12, Cl 2A2A | ||||||||
0.354%, 01/19/38 (C) | 3,862 | 3,262 | ||||||
HarborView Mortgage Loan Trust, Ser 2006-14, Cl 2A1A | ||||||||
0.328%, 01/25/47 (C) | 3,451 | 2,646 | ||||||
Hilton USA Trust, Ser 2013-HLT, Cl EFX | ||||||||
5.222%, 11/05/30 (B) (C) | 1,600 | 1,643 | ||||||
Lehman XS Trust, | ||||||||
0.345%, 11/25/46 (C) | 3,950 | 3,297 | ||||||
LSTAR Securities Investment Trust, Ser 2014-1 | ||||||||
3.279%, 09/01/21 (B) (C) | 7,934 | 8,008 | ||||||
Luminent Mortgage Trust, Ser 2006-2, Cl A1A | ||||||||
0.370%, 02/25/46 (C) | 5,015 | 3,751 | ||||||
Morgan Stanley Re-REMIC Trust, Ser 2010-R5, Cl 4B | ||||||||
0.454%, 06/26/36 (B) (C) | 1,049 | 782 | ||||||
Motel 6 Trust, Ser 2015-MTL6, Cl E | ||||||||
5.279%, 02/05/30 (B) | 8,000 | 8,020 | ||||||
Nomura Resecuritization Trust, Ser 2012-1R, Cl A | ||||||||
0.596%, 08/27/47 (B) (C) | 3,811 | 3,662 | ||||||
Nomura Resecuritization Trust, Ser 2015-4R, Cl 5A1 | ||||||||
0.608%, 03/26/36 (B) (C) | 1,300 | 1,176 | ||||||
Residential Asset Securitization Trust, Ser 2006-A12, Cl A1 | ||||||||
6.250%, 11/25/36 | 3,515 | 2,503 | ||||||
| 184 | SEI Institutional Managed Trust / Semi-Annual Report / March 31, 2015 |
| Description | Face Amount ($ Thousands)/Shares | Market Value ($ Thousands) | ||||||
Residential Asset Securitization Trust, Ser 2007-A1, Cl A9 | ||||||||
5.750%, 03/25/37 | $ | 344 | $ | 237 | ||||
Resource Capital, | ||||||||
3.661%, 12/15/28 (B) (C) | 400 | 400 | ||||||
Resource Capital, | ||||||||
4.172%, 03/15/32 (B) (C) | 1,000 | 1,000 | ||||||
SRERS Funding, Ser 2011-RS, Cl A1B1 | ||||||||
0.404%, 05/09/46 (B) (C) | 3,965 | 3,770 | ||||||
Structured Asset Mortgage Investments II Trust, Ser 2006-AR1, Cl 2A1 | ||||||||
0.382%, 02/25/36 (C) | 1,913 | 1,594 | ||||||
Washington Mutual Mortgage Pass-Through Certificates, Ser 2005-8, Cl 3CB1 | ||||||||
6.000%, 10/25/35 | 234 | 175 | ||||||
Washington Mutual Mortgage Pass-Through Certificates, Ser 2006-7, Cl A5 | ||||||||
6.422%, 09/25/36 | 4,116 | 2,319 | ||||||
Washington Mutual Mortgage Pass-Through Certificates, Ser 2006-8, Cl A6 | ||||||||
4.898%, 10/25/36 | 1,384 | 996 | ||||||
Washington Mutual Mortgage Pass-Through Certificates, Ser 2006-AR9, Cl 2A | ||||||||
0.955%, 11/25/46 (C) | 8,042 | 5,605 | ||||||
Washington Mutual Mortgage Pass-Through Certificates, Ser 2007-5, Cl A6 | ||||||||
6.000%, 06/25/37 | 319 | 278 | ||||||
Washington Mutual Mortgage Pass-Through Certificates, Ser 2007-OA4, Cl A1A | ||||||||
0.881%, 04/25/47 | 870 | 639 | ||||||
Wells Fargo Alternative Loan Trust, Ser 2007-PA3, Cl 3A1 | ||||||||
6.250%, 07/25/37 | 1,547 | 1,402 | ||||||
|
| |||||||
Total Mortgage-Backed Securities | 76,868 | |||||||
|
| |||||||
COMMON STOCK — 7.8% | ||||||||
3M | 1,534 | 253 | ||||||
Abbott Laboratories | 3,766 | 175 | ||||||
AbbVie | 3,952 | 231 | ||||||
Accenture, Cl A | 1,502 | 141 | ||||||
ACE | 794 | 89 | ||||||
Actavis* | 943 | 281 | ||||||
Adobe Systems* | 1,112 | 82 | ||||||
| Description | Shares | Market Value ($ Thousands) | ||||||
ADT, Cl A | 464 | $ | 19 | |||||
AES | 1,535 | 19 | ||||||
Aetna, Cl A | 825 | 88 | ||||||
Affiliated Managers Group* | 127 | 27 | ||||||
Aflac | 1,120 | 72 | ||||||
Agilent Technologies | 848 | 35 | ||||||
AGL Resources | 316 | 16 | ||||||
Air Products & Chemicals | 450 | 68 | ||||||
Airgas | 158 | 17 | ||||||
Akamai Technologies* | 410 | 29 | ||||||
Alcoa | 2,954 | 38 | ||||||
Alexion Pharmaceuticals* | 488 | 85 | ||||||
Allegheny Technologies | 394 | 12 | ||||||
Allegion | 176 | 11 | ||||||
Alliance Data Systems* | 160 | 47 | ||||||
Allstate | 982 | 70 | ||||||
Altera | 704 | 30 | ||||||
Altria Group | 4,736 | 237 | ||||||
Amazon.com, Cl A* | 938 | 349 | ||||||
Ameren | 557 | 24 | ||||||
American Airlines Group | 1,730 | 91 | ||||||
American Electric Power | 1,213 | 68 | ||||||
American Express | 2,144 | 167 | ||||||
American International Group | 3,334 | 183 | ||||||
American Tower, Cl A‡ | 1,052 | 99 | ||||||
Ameriprise Financial | 452 | 59 | ||||||
AmerisourceBergen | 515 | 58 | ||||||
Ametek | 627 | 33 | ||||||
Amgen, Cl A | 1,873 | 299 | ||||||
Amphenol, Cl A | 779 | 46 | ||||||
Anadarko Petroleum, Cl A | 1,212 | 100 | ||||||
Analog Devices | 783 | 49 | ||||||
Anthem | 646 | 100 | ||||||
Aon | 667 | 64 | ||||||
Apache | 937 | 56 | ||||||
Apartment Investment & Management, Cl A‡ | 411 | 16 | ||||||
Apple | 14,205 | 1,768 | ||||||
Applied Materials | 2,854 | 64 | ||||||
Archer-Daniels-Midland | 1,508 | 72 | ||||||
Assurant | 131 | 8 | ||||||
AT&T | 12,549 | 410 | ||||||
Autodesk, Cl A* | 579 | 34 | ||||||
Automatic Data Processing | 1,153 | 99 | ||||||
Autonation* | 202 | 13 | ||||||
Autozone* | 79 | 54 | ||||||
Avago Technologies, Cl A | 658 | 84 | ||||||
AvalonBay Communities‡ | 318 | 55 | ||||||
Avery Dennison | 169 | 9 | ||||||
Baker Hughes | 1,076 | 68 | ||||||
Ball | 319 | 23 | ||||||
Bank of America | 25,445 | 392 | ||||||
Bank of New York Mellon | 2,677 | 108 | ||||||
Baxter International | 1,272 | 87 | ||||||
| SEI Institutional Managed Trust / Semi-Annual Report / March 31, 2015 | 185 |
SCHEDULE OF INVESTMENTS (Unaudited)
Multi-Asset Income Fund (Continued)
March 31, 2015
| Description | Shares | Market Value ($ Thousands) | ||||||
BB&T | 1,791 | $ | 70 | |||||
Becton Dickinson | 489 | 70 | ||||||
Bed Bath & Beyond* | 469 | 36 | ||||||
Berkshire Hathaway, Cl B* | 4,468 | 645 | ||||||
Best Buy | 672 | 25 | ||||||
Biogen* | 565 | 239 | ||||||
BlackRock | 305 | 112 | ||||||
Boeing | 1,587 | 238 | ||||||
BorgWarner | 578 | 35 | ||||||
Boston Properties‡ | 380 | 53 | ||||||
Boston Scientific* | 3,284 | 58 | ||||||
Bristol-Myers Squibb | 4,110 | 265 | ||||||
Broadcom, Cl A | 1,320 | 57 | ||||||
Brown-Forman, Cl B | 396 | 36 | ||||||
C.H. Robinson Worldwide | 337 | 24 | ||||||
C.R. Bard | 190 | 32 | ||||||
CA | 742 | 24 | ||||||
Cablevision Systems, Cl A | 411 | 7 | ||||||
Cabot Oil & Gas | 1,035 | 31 | ||||||
California Republic Bancorp* | 48,000 | 1,296 | ||||||
Cameron International* | 461 | 21 | ||||||
Campbell Soup | 419 | 20 | ||||||
Capital One Financial | 1,330 | 105 | ||||||
Cardinal Health | 775 | 70 | ||||||
CarMax* | 546 | 38 | ||||||
Carnival | 1,118 | 53 | ||||||
Caterpillar, Cl A | 1,464 | 117 | ||||||
CBRE Group, Cl A* | 649 | 25 | ||||||
CBS, Cl B | 1,103 | 67 | ||||||
Celgene, Cl A* | 1,984 | 229 | ||||||
Cengage Learning Holdings II* | 5,114 | 115 | ||||||
Centerpoint Energy | 994 | 20 | ||||||
CenturyTel | 1,416 | 49 | ||||||
Cerner* | 753 | 55 | ||||||
CF Industries Holdings | 126 | 36 | ||||||
Charles Schwab | 2,694 | 82 | ||||||
Chesapeake Energy | 1,199 | 17 | ||||||
Chevron | 4,617 | 485 | ||||||
Chipotle Mexican Grill, Cl A* | 75 | 49 | ||||||
Chubb | 578 | 58 | ||||||
Cigna | 613 | 79 | ||||||
Cimarex Energy | 203 | 23 | ||||||
Cincinnati Financial | 346 | 18 | ||||||
Cintas | 228 | 19 | ||||||
Cisco Systems | 12,378 | 341 | ||||||
Citigroup | 7,331 | 378 | ||||||
Citrix Systems* | 373 | 24 | ||||||
Clorox | 328 | 36 | ||||||
CME Group | 741 | 70 | ||||||
CMS Energy | 634 | 22 | ||||||
Coach | 636 | 26 | ||||||
Coca-Cola | 9,671 | 392 | ||||||
Coca-Cola Enterprises | 515 | 23 | ||||||
| Description | Shares | Market Value ($ Thousands) | ||||||
Cognizant Technology Solutions, Cl A* | 1,429 | $ | 89 | |||||
Colgate-Palmolive | 2,086 | 145 | ||||||
Comcast, Cl A | 6,182 | 349 | ||||||
Comerica | 423 | 19 | ||||||
Computer Sciences | 327 | 21 | ||||||
ConAgra Foods | 1,073 | 39 | ||||||
ConocoPhillips | 3,067 | 191 | ||||||
Consol Energy | 605 | 17 | ||||||
Consolidated Edison | 657 | 40 | ||||||
Constellation Brands, Cl A* | 421 | 49 | ||||||
Corning, Cl B | 3,003 | 68 | ||||||
Costco Wholesale | 1,048 | 159 | ||||||
Crown Castle International‡ | 781 | 65 | ||||||
CSX | 2,335 | 77 | ||||||
Cummins | 423 | 59 | ||||||
CVS Health | 2,754 | 284 | ||||||
Danaher, Cl A | 1,464 | 124 | ||||||
Darden Restaurants | 325 | 22 | ||||||
DaVita HealthCare Partners* | 437 | 35 | ||||||
Deere | 840 | 74 | ||||||
Delphi Automotive | 700 | 56 | ||||||
Delta Air Lines, Cl A | 1,966 | 88 | ||||||
Dentsply International | 372 | 19 | ||||||
Devon Energy | 941 | 57 | ||||||
Diamond Offshore Drilling | 97 | 3 | ||||||
DIRECTV* | 1,202 | 102 | ||||||
Discover Financial Services | 1,128 | 64 | ||||||
Discovery Communications, Cl A* | 278 | 8 | ||||||
Discovery Communications, Cl C* | 640 | 19 | ||||||
Dollar General | 751 | 57 | ||||||
Dollar Tree* | 519 | 42 | ||||||
Dominion Resources | 1,397 | 99 | ||||||
Dover | 422 | 29 | ||||||
Dow Chemical, Cl A | 2,626 | 126 | ||||||
DR Horton | 777 | 22 | ||||||
Dr Pepper Snapple Group | 491 | 38 | ||||||
DTE Energy | 447 | 36 | ||||||
Duke Energy | 1,709 | 131 | ||||||
Dun & Bradstreet | 68 | 9 | ||||||
E*Trade Financial* | 758 | 22 | ||||||
E.I. du Pont de Nemours | 2,228 | 159 | ||||||
Eastman Chemical | 343 | 24 | ||||||
Eaton | 1,113 | 76 | ||||||
eBay* | 2,677 | 154 | ||||||
Ecolab | 633 | 72 | ||||||
Edison International | 809 | 51 | ||||||
Edwards Lifesciences, Cl A* | 271 | 39 | ||||||
Electronic Arts* | 782 | 46 | ||||||
Eli Lilly | 2,383 | 173 | ||||||
EMC | 4,804 | 123 | ||||||
Emerson Electric | 1,660 | 94 | ||||||
| 186 | SEI Institutional Managed Trust / Semi-Annual Report / March 31, 2015 |
| Description | Shares | Market Value ($ Thousands) | ||||||
Endo International* | 428 | $ | 38 | |||||
Ensco, Cl A | 620 | 13 | ||||||
Entergy | 455 | 35 | ||||||
EOG Resources | 1,312 | 120 | ||||||
EQT | 348 | 29 | ||||||
Equifax | 278 | 26 | ||||||
Equinix‡ | 136 | 32 | ||||||
Equity Residential‡ | 900 | 70 | ||||||
Essex Property Trust‡ | 162 | 37 | ||||||
Estee Lauder, Cl A | 564 | 47 | ||||||
Eversource Energy | 796 | 40 | ||||||
Exelon | 2,130 | 72 | ||||||
Expedia | 230 | 22 | ||||||
Expeditors International of Washington | 450 | 22 | ||||||
Express Scripts Holding* | 1,771 | 154 | ||||||
Exxon Mobil | 10,257 | 872 | ||||||
F5 Networks, Cl A* | 172 | 20 | ||||||
Facebook, Cl A* | 5,160 | 424 | ||||||
Family Dollar Stores | 252 | 20 | ||||||
Fastenal, Cl A | 697 | 29 | ||||||
FedEx | 630 | 104 | ||||||
Fidelity National Information Services, Cl B | 712 | 48 | ||||||
Fifth Third Bancorp | 2,082 | 39 | ||||||
First Solar* | 148 | 9 | ||||||
FirstEnergy | 1,059 | 37 | ||||||
Fiserv, Cl A* | 612 | 49 | ||||||
Flir Systems | 265 | 8 | ||||||
Flowserve | 321 | 18 | ||||||
Fluor | 365 | 21 | ||||||
FMC | 313 | 18 | ||||||
FMC Technologies* | 546 | 20 | ||||||
Ford Motor | 9,541 | 154 | ||||||
Fossil Group* | 107 | 9 | ||||||
Franklin Resources | 972 | 50 | ||||||
Freeport-McMoRan, Cl B | 2,606 | 49 | ||||||
Frontier Communications | 2,632 | 18 | ||||||
GameStop, Cl A | 298 | 11 | ||||||
Gannett | 592 | 22 | ||||||
Gap | 612 | 26 | ||||||
Garmin | 320 | 15 | ||||||
General Dynamics | 753 | 102 | ||||||
General Electric | 24,662 | 612 | ||||||
General Growth Properties‡ | 1,675 | 50 | ||||||
General Mills, Cl A | 1,415 | 80 | ||||||
General Motors | 3,223 | 121 | ||||||
Genuine Parts | 387 | 36 | ||||||
Genworth Financial, Cl A* | 955 | 7 | ||||||
Gilead Sciences* | 3,592 | 352 | ||||||
Goldman Sachs Group | 970 | 182 | ||||||
Goodyear Tire & Rubber | 725 | 19 | ||||||
Google, Cl A* | 703 | 390 | ||||||
Google, Cl C* | 704 | 386 | ||||||
| Description | Shares | Market Value ($ Thousands) | ||||||
H&R Block | 637 | $ | 20 | |||||
Halliburton | 1,995 | 88 | ||||||
Hanesbrands | 967 | 32 | ||||||
Harley-Davidson, Cl A | 544 | 33 | ||||||
Harman International Industries, Cl A | 177 | 24 | ||||||
Harris | 275 | 21 | ||||||
Hartford Financial Services Group | 1,085 | 45 | ||||||
Hasbro | 293 | 19 | ||||||
HCA Holdings* | 752 | 57 | ||||||
HCP‡ | 1,228 | 53 | ||||||
Health Care‡ | 815 | 63 | ||||||
Helmerich & Payne | 285 | 19 | ||||||
Henry Schein* | 200 | 28 | ||||||
Hershey | 373 | 38 | ||||||
Hess | 638 | 43 | ||||||
Hewlett-Packard | 4,478 | 140 | ||||||
Home Depot | 3,196 | 363 | ||||||
Honeywell International | 1,874 | 195 | ||||||
Hormel Foods | 353 | 20 | ||||||
Hospira* | 389 | 34 | ||||||
Host Hotels & Resorts‡ | 1,904 | 38 | ||||||
Hudson City Bancorp, Cl A | 902 | 9 | ||||||
Humana | 375 | 67 | ||||||
Huntington Bancshares | 1,908 | 21 | ||||||
Illinois Tool Works | 844 | 82 | ||||||
Ingersoll-Rand | 667 | 46 | ||||||
Integrys Energy Group | 212 | 15 | ||||||
Intel | 11,422 | 357 | ||||||
IntercontinentalExchange Group | 275 | 64 | ||||||
International Business Machines | 2,264 | 363 | ||||||
International Flavors & Fragrances | 189 | 22 | ||||||
International Paper | 1,038 | 58 | ||||||
Interpublic Group | 977 | 22 | ||||||
Intuit | 667 | 65 | ||||||
Intuitive Surgical* | 82 | 41 | ||||||
Invesco | 1,085 | 43 | ||||||
Iron Mountain‡ | 439 | 16 | ||||||
Jacobs Engineering Group* | 348 | 16 | ||||||
JM Smucker | 234 | 27 | ||||||
Johnson & Johnson | 6,808 | 685 | ||||||
Johnson Controls | 1,562 | 79 | ||||||
Joy Global | 185 | 7 | ||||||
JPMorgan Chase | 9,037 | 547 | ||||||
Juniper Networks | 896 | 20 | ||||||
Kansas City Southern | 281 | 29 | ||||||
Kellogg | 635 | 42 | ||||||
Keurig Green Mountain | 307 | 34 | ||||||
KeyCorp | 1,989 | 28 | ||||||
Kimberly-Clark | 891 | 96 | ||||||
| SEI Institutional Managed Trust / Semi-Annual Report / March 31, 2015 | 187 |
SCHEDULE OF INVESTMENTS (Unaudited)
Multi-Asset Income Fund (Continued)
March 31, 2015
| Description | Shares | Market Value ($ Thousands) | ||||||
Kimco Realty‡ | 943 | $ | 25 | |||||
Kinder Morgan | 4,069 | 171 | ||||||
KLA-Tencor | 379 | 22 | ||||||
Kohl’s | 513 | 40 | ||||||
Kraft Foods | 1,382 | 120 | ||||||
Kroger | 1,152 | 88 | ||||||
L Brands | 638 | 60 | ||||||
L-3 Communications Holdings | 196 | 25 | ||||||
Laboratory Corp of America Holdings* | 250 | 31 | ||||||
Lam Research | 405 | 28 | ||||||
Legg Mason | 267 | 15 | ||||||
Leggett & Platt | 367 | 17 | ||||||
Lennar, Cl A | 418 | 22 | ||||||
Leucadia National | 832 | 18 | ||||||
Level 3 Communications* | 705 | 38 | ||||||
Lincoln National | 659 | 38 | ||||||
Linear Technology | 548 | 26 | ||||||
Lockheed Martin | 643 | 131 | ||||||
Loews | 686 | 28 | ||||||
Lorillard | 881 | 58 | ||||||
Lowe’s | 2,365 | 176 | ||||||
LyondellBasell Industries, Cl A | 994 | 87 | ||||||
M&T Bank | 333 | 42 | ||||||
Macerich‡ | 358 | 30 | ||||||
Macy’s | 855 | 55 | ||||||
Mallinckrodt* | 296 | 38 | ||||||
Marathon Oil | 1,693 | 44 | ||||||
Marathon Petroleum | 656 | 67 | ||||||
Marriott International, Cl A | 536 | 43 | ||||||
Marsh & McLennan | 1,267 | 71 | ||||||
Martin Marietta Materials, Cl A | 163 | 23 | ||||||
Masco | 828 | 22 | ||||||
MasterCard, Cl A | 2,358 | 204 | ||||||
Mattel | 787 | 18 | ||||||
McCormick | 300 | 23 | ||||||
McDonald’s | 2,341 | 228 | ||||||
McGraw-Hill | 635 | 66 | ||||||
McKesson | 555 | 125 | ||||||
Mead Johnson Nutrition, Cl A | 501 | 50 | ||||||
MeadWestvaco | 389 | 19 | ||||||
Medtronic | 3,437 | 268 | ||||||
Merck | 6,908 | 397 | ||||||
MetLife | 2,693 | 136 | ||||||
Michael Kors Holdings* | 521 | 34 | ||||||
Microchip Technology | 466 | 23 | ||||||
Micron Technology* | 2,561 | 70 | ||||||
Microsoft | 20,063 | 816 | ||||||
Mirabela Nickel* | 597,236 | 64 | ||||||
Mohawk Industries* | 143 | 27 | ||||||
Molson Coors Brewing, Cl B | 406 | 30 | ||||||
Mondelez International, Cl A | 4,027 | 145 | ||||||
Monsanto | 1,159 | 130 | ||||||
Monster Beverage* | 363 | 50 | ||||||
| Description | Shares | Market Value ($ Thousands) | ||||||
Moody’s | 462 | $ | 48 | |||||
Morgan Stanley | 3,656 | 130 | ||||||
Mosaic | 797 | 37 | ||||||
Motorola Solutions | 460 | 31 | ||||||
Murphy Oil | 393 | 18 | ||||||
Mylan* | 925 | 55 | ||||||
NASDAQ OMX Group, Cl A | 311 | 16 | ||||||
National Oilwell Varco, Cl A | 1,055 | 53 | ||||||
Navient | 961 | 20 | ||||||
NetApp | 795 | 28 | ||||||
NetFlix* | 141 | 59 | ||||||
Newell Rubbermaid, Cl B | 626 | 24 | ||||||
Newfield Exploration* | 388 | 14 | ||||||
Newmont Mining | 1,271 | 28 | ||||||
News, Cl A* | 1,173 | 19 | ||||||
NextEra Energy | 1,122 | 117 | ||||||
Nielsen | 820 | 37 | ||||||
Nike, Cl B | 1,671 | 168 | ||||||
NiSource | 800 | 35 | ||||||
Noble Energy | 906 | 44 | ||||||
Noble PLC | 476 | 7 | ||||||
Nordstrom | 324 | 26 | ||||||
Norfolk Southern | 726 | 75 | ||||||
Northern Trust | 559 | 39 | ||||||
Northrop Grumman | 474 | 76 | ||||||
NRG Energy | 790 | 20 | ||||||
Nucor | 807 | 38 | ||||||
Nvidia | 1,193 | 25 | ||||||
Occidental Petroleum | 1,871 | 137 | ||||||
Omnicom Group | 623 | 49 | ||||||
Oneok | 485 | 23 | ||||||
Oracle, Cl B | 7,731 | 334 | ||||||
O’Reilly Automotive* | 251 | 54 | ||||||
Owens-Illinois* | 314 | 7 | ||||||
PACCAR | 918 | 58 | ||||||
Pall | 246 | 25 | ||||||
Parker-Hannifin, Cl A | 373 | 44 | ||||||
Patterson | 161 | 8 | ||||||
Paychex | 825 | 41 | ||||||
Pentair | 477 | 30 | ||||||
People’s United Financial | 577 | 9 | ||||||
Pepco Holdings | 665 | 18 | ||||||
PepsiCo | 3,575 | 342 | ||||||
PerkinElmer | 209 | 11 | ||||||
Perrigo | 340 | 56 | ||||||
Pfizer | 15,039 | 523 | ||||||
PG&E | 1,180 | 63 | ||||||
Philip Morris International | 3,764 | 283 | ||||||
Phillips 66 | 1,324 | 104 | ||||||
Pinnacle West Capital | 259 | 17 | ||||||
Pioneer Natural Resources | 365 | 60 | ||||||
Pitney Bowes | 373 | 9 | ||||||
Plum Creek Timber | 413 | 18 | ||||||
PNC Financial Services Group | �� | 1,260 | 118 | |||||
| 188 | SEI Institutional Managed Trust / Semi-Annual Report / March 31, 2015 |
| Description | Shares | Market Value ($ Thousands) | ||||||
PPG Industries | 322 | $ | 73 | |||||
PPL | 1,631 | 55 | ||||||
Praxair | 684 | 83 | ||||||
Precision Castparts | 334 | 70 | ||||||
priceline.com* | 125 | 145 | ||||||
Principal Financial Group, Cl A | 694 | 36 | ||||||
Procter & Gamble | 6,532 | 535 | ||||||
Progressive | 1,356 | 37 | ||||||
ProLogis‡ | 1,240 | 54 | ||||||
Prudential Financial | 1,075 | 86 | ||||||
Public Service Enterprise Group | 1,256 | 53 | ||||||
Public Storage‡ | 360 | 71 | ||||||
PulteGroup | 877 | 19 | ||||||
PVH | 191 | 20 | ||||||
QEP Resources | 460 | 10 | ||||||
Qualcomm | 3,967 | 275 | ||||||
Quanta Services* | 580 | 16 | ||||||
Quest Diagnostics | 333 | 26 | ||||||
Ralph Lauren, Cl A | 140 | 19 | ||||||
Range Resources | 395 | 21 | ||||||
Raytheon | 723 | 79 | ||||||
Red Hat* | 479 | 36 | ||||||
Regeneron Pharmaceuticals* | 174 | 79 | ||||||
Regions Financial | 3,505 | 33 | ||||||
Republic Services | 582 | 23 | ||||||
Reynolds American | 798 | 55 | ||||||
Robert Half International | 319 | 19 | ||||||
Rockwell Automation | 343 | 40 | ||||||
Rockwell Collins | 305 | 29 | ||||||
Roper Industries | 253 | 43 | ||||||
Ross Stores | 519 | 55 | ||||||
Royal Caribbean Cruises | 425 | 35 | ||||||
Ryder System | 99 | 9 | ||||||
Salesforce.com* | 1,459 | 97 | ||||||
SanDisk | 555 | 35 | ||||||
SCANA | 331 | 18 | ||||||
Schlumberger, Cl A | 3,120 | 260 | ||||||
Scripps Networks Interactive, Cl A | 239 | 16 | ||||||
Seagate Technology | 736 | 38 | ||||||
Sealed Air | 493 | 22 | ||||||
Sempra Energy | 575 | 63 | ||||||
Sherwin-Williams, Cl A | 195 | 56 | ||||||
Sigma-Aldrich | 300 | 41 | ||||||
Simon Property Group‡ | 744 | 146 | ||||||
Skyworks Solutions | 500 | 49 | ||||||
SL Green Realty‡ | 238 | 31 | ||||||
Snap-on | 136 | 20 | ||||||
Southern | 2,314 | 102 | ||||||
Southwest Airlines, Cl A | 1,590 | 71 | ||||||
Southwestern Energy, Cl A* | 879 | 20 | ||||||
Spectra Energy | 1,644 | 59 | ||||||
St. Jude Medical | 643 | 42 | ||||||
| Description | Shares | Market Value ($ Thousands) | ||||||
Stanley Black & Decker | 396 | $ | 38 | |||||
Staples | 1,472 | 24 | ||||||
Starbucks | 1,804 | 171 | ||||||
Starwood Hotels & Resorts Worldwide | 454 | 38 | ||||||
State Street | 978 | 72 | ||||||
Stericycle, Cl A* | 195 | 27 | ||||||
Stryker | 699 | 65 | ||||||
SunTrust Banks | 1,291 | 53 | ||||||
Symantec, Cl A | 1,734 | 41 | ||||||
SYSCO, Cl A | 1,442 | 54 | ||||||
T. Rowe Price Group | 643 | 52 | ||||||
Target, Cl A | 1,524 | 125 | ||||||
TE Connectivity | 952 | 68 | ||||||
TECO Energy | 433 | 8 | ||||||
Tenet Healthcare* | 184 | 9 | ||||||
Teradata* | 402 | 18 | ||||||
Tesoro | 291 | 27 | ||||||
Texas Instruments | 2,496 | 143 | ||||||
Textron | 633 | 28 | ||||||
Thermo Fisher Scientific | 958 | 129 | ||||||
Tiffany | 260 | 23 | ||||||
Time Warner | 2,022 | 171 | ||||||
Time Warner Cable, Cl A | 671 | 100 | ||||||
TJX | 1,648 | 115 | ||||||
Torchmark, Cl A | 340 | 19 | ||||||
Total System Services | 433 | 17 | ||||||
Tractor Supply | 313 | 27 | ||||||
Transocean | 908 | 13 | ||||||
Travelers | 777 | 84 | ||||||
Travelport Worldwide | 67,628 | 1,129 | ||||||
TripAdvisor* | 262 | 22 | ||||||
Twenty-First Century Fox, Cl A | 4,453 | 151 | ||||||
Tyco International | 1,052 | 45 | ||||||
Tyson Foods, Cl A | 749 | 29 | ||||||
Under Armour, Cl A* | 382 | 31 | ||||||
Union Pacific | 2,129 | 231 | ||||||
United Parcel Service, Cl B | 1,669 | 162 | ||||||
United Rentals* | 233 | 21 | ||||||
United Technologies | 1,993 | 234 | ||||||
UnitedHealth Group | 2,298 | 272 | ||||||
Universal Health Services, Cl B | 211 | 25 | ||||||
Unum Group | 591 | 20 | ||||||
Urban Outfitters* | 276 | 13 | ||||||
US Bancorp | 4,287 | 187 | ||||||
Valero Energy | 1,221 | 78 | ||||||
Varian Medical Systems* | 233 | 22 | ||||||
Ventas‡ | 797 | 58 | ||||||
VeriSign* | 283 | 19 | ||||||
Verizon Communications | 10,200 | 496 | ||||||
Vertex Pharmaceuticals* | 598 | 70 | ||||||
VF | 844 | 64 | ||||||
Viacom, Cl B | 920 | 63 | ||||||
Visa, Cl A | 4,676 | 306 | ||||||
| SEI Institutional Managed Trust / Semi-Annual Report / March 31, 2015 | 189 |
SCHEDULE OF INVESTMENTS (Unaudited)
Multi-Asset Income Fund (Continued)
March 31, 2015
| Description | Shares | Market Value ($ Thousands) | ||||||
Vornado Realty Trust‡ | 465 | $ | 52 | |||||
Vulcan Materials | 306 | 26 | ||||||
Walgreens Boots Alliance | 2,102 | 178 | ||||||
Wal-Mart Stores | 3,825 | 315 | ||||||
Walt Disney | 3,775 | 396 | ||||||
Waste Management | 1,044 | 57 | ||||||
Waters* | 192 | 24 | ||||||
Wells Fargo | 11,487 | 625 | ||||||
Western Digital | 564 | 51 | ||||||
Western Union | 1,216 | 25 | ||||||
Weyerhaeuser‡ | 1,316 | 44 | ||||||
Whirlpool | 196 | 40 | ||||||
Whole Foods Market | 893 | 47 | ||||||
Williams | 1,577 | 80 | ||||||
Windstream Holdings | 1,110 | 8 | ||||||
Wisconsin Energy | 574 | 28 | ||||||
WW Grainger | 154 | 36 | ||||||
Wyndham Worldwide | 284 | 26 | ||||||
Wynn Resorts | 185 | 23 | ||||||
Xcel Energy | 1,137 | 40 | ||||||
Xerox | 2,716 | 35 | ||||||
Xilinx | 610 | 26 | ||||||
XL Group, Cl A | 600 | 22 | ||||||
Xylem | 483 | 17 | ||||||
Yahoo!* | 2,076 | 92 | ||||||
Yum! Brands | 1,026 | 81 | ||||||
Zimmer Holdings | 452 | 53 | ||||||
Zions Bancorporation | 374 | 10 | ||||||
Zoetis, Cl A | 1,296 | 60 | ||||||
|
| |||||||
Total Common Stock | 47,117 | |||||||
|
| |||||||
EXCHANGE TRADED FUNDS — 3.3% |
| |||||||
iShares iBoxx USD High Yield Corporate Bond | 33,800 | 3,063 | ||||||
iShares MSCI Italy Capped | 391,792 | 5,798 | ||||||
iShares MSCI Spain Capped | 154,717 | 5,381 | ||||||
SPDR EURO STOXX 50 | 144,375 | 5,605 | ||||||
|
| |||||||
Total Exchange Traded Funds | 19,847 | |||||||
|
| |||||||
PREFERRED STOCK — 2.2% |
| |||||||
ALM Loan Funding* (C) | 392 | 310 | ||||||
Aspen Insurance Holdings (C) | 80,000 | 2,054 | ||||||
CoBank ACB* | 11,500 | 1,175 | ||||||
Goldman Sachs Group (C) | 94,300 | 2,374 | ||||||
Morgan Stanley (C) | 64,000 | 1,667 | ||||||
Seaspan | 216,000 | 5,439 | ||||||
|
| |||||||
Total Preferred Stock | 13,019 | |||||||
|
| |||||||
| Description | Face Amount /Contracts | Market Value ($ Thousands) | ||||||||||
SOVEREIGN DEBT — 0.9% |
| |||||||||||
Dominican Republic International Bond | ||||||||||||
6.850%, 01/27/45 (B) | 1,400 | $ | 1,470 | |||||||||
Kenya Government International Bond | ||||||||||||
6.875%, 06/24/24 (B) | 3,650 | 3,812 | ||||||||||
|
| |||||||||||
Total Sovereign Debt (Cost $5,134) ($ Thousands) | 5,282 | |||||||||||
|
| |||||||||||
CONVERTIBLE BOND — 0.0% |
| |||||||||||
Mirabela Nickel | ||||||||||||
9.500%, 06/24/19 (B) (F) | 139 | 139 | ||||||||||
|
| |||||||||||
Total Convertible Bond | 139 | |||||||||||
|
| |||||||||||
TIME DEPOSITS — 3.9% | ||||||||||||
Brown Brothers Harriman | ||||||||||||
0.074%, 04/01/15 | GBP | 30 | 45 | |||||||||
0.030%, 04/01/15 | 23,531 | 23,531 | ||||||||||
(0.198)%, 04/01/15 @ | EUR | 3 | 3 | |||||||||
|
| |||||||||||
Total Time Deposits |
| 23,579 | ||||||||||
|
| |||||||||||
Total Investments — 107.3% | $ | 648,537 | ||||||||||
|
| |||||||||||
PURCHASED OPTIONS* — 0.3% |
| |||||||||||
February 2016, U.S. Call, AED Put, Expires 02/20/16, Strike Price $3.68 | 13,175,000 | 26 | ||||||||||
February 2016, U.S. Call, AED Put, Expires 02/20/16, Strike Price $3.68 | 39,525,000 | 79 | ||||||||||
July 2015, Euro Put, DKK Call, Expires 07/30/15, Strike Price $7.42 | 52,148,626 | 295 | ||||||||||
June 2015, TLT U.S. Call, Expires 06/20/15, Strike Price $134.00 | 2,162 | 435 | ||||||||||
June 2015, USO U.S. Put, Expires 06/20/15, Strike Price $15.00 | 5,400 | 432 | ||||||||||
September 2015, IEF U.S. Call, Expires 09/19/15, Strike Price $109.00 | 5,656 | 679 | ||||||||||
|
| |||||||||||
Total Purchased Options | 1,946 | |||||||||||
|
| |||||||||||
WRITTEN OPTIONS* — (0.2)% |
| |||||||||||
April 2015, SPX U.S. Short Index Call, Expires 04/18/15, Strike Price $2,075.00 | (294 | ) | (548 | ) | ||||||||
April 2015, SPX U.S. Short Index Call, Expires 04/18/15, Strike Price $2,095.00 | (1 | ) | (1 | ) | ||||||||
| 190 | SEI Institutional Managed Trust / Semi-Annual Report / March 31, 2015 |
| Description | Contracts | Market Value ($ Thousands) | ||||||
June 2015, TLT U.S. Call, Expires 06/20/15, Strike Price $139.00 | (2,162 | ) | $ | (203 | ) | |||
June 2015, USO U.S. Put, Expires 06/20/15, Strike Price $134.00 | (5,400 | ) | (54 | ) | ||||
September 2015, IEF U.S. Call, Expires 09/19/15, Strike Price $111.00 | (5,656 | ) | (481 | ) | ||||
|
| |||||||
Total Written Options | $ | (1,287 | ) | |||||
|
| |||||||
A list of the open futures contracts held by the Fund at March 31, 2015, is as follows:
| Type of Contract | Number of Contracts Long | Expiration Date | Unrealized Appreciation/ (Depreciation) ($ Thousands) | |||||||||
S&P 500 Index EMINI | 159 | Jun-2015 | $ | 9 | ||||||||
U.S. Dollar Index | 123 | Jun-2015 | (141 | ) | ||||||||
|
| |||||||||||
| $ | (132 | ) | ||||||||||
|
| |||||||||||
For the period ended March 31, 2015, the total amount of all open futures contracts, as presented in the table above, are representative of the volume of activity for the derivative type during the period.
A list of the open forward foreign currency contracts held by the Fund at March 31, 2015, is as follows:
| Maturity Date | Currency to Deliver (Thousands) | Currency to Receive (Thousands) | Unrealized Appreciation/ (Depreciation) ($ Thousands) | |||||||||||||||||
4/7/15 | AUD | 350 | USD | 272 | $ | 4 | ||||||||||||||
4/7/15 | GBP | 620 | USD | 922 | 2 | |||||||||||||||
4/7/15-6/2/15 | EUR | 16,050 | USD | 18,172 | 927 | |||||||||||||||
5/8/15-5/18/15 | RUB | 255,381 | USD | 4,579 | 249 | |||||||||||||||
5/18/15 | USD | — | RUB | — | (1 | ) | ||||||||||||||
7/2/15 | IDR | 64,500,000 | USD | 5,000 | 165 | |||||||||||||||
|
| |||||||||||||||||||
| $ | 1,346 | |||||||||||||||||||
|
| |||||||||||||||||||
A list of the counterparties for the outstanding forward foreign currency contracts held by the Fund at March 31, 2015, is as follows:
| Counterparty | Currency to Deliver ($ Thousands) | Currency to Receive ($ Thousands) | Unrealized Appreciation ($ Thousands) | |||||||||
Bank of America | (7,155 | ) | 7,729 | $ | 574 | |||||||
Barclays PLC | (20,444 | ) | 21,216 | 772 | ||||||||
|
| |||||||||||
| $ | 1,346 | |||||||||||
|
| |||||||||||
For the period ended March 31, 2015, the total amount of all forward foreign currency contracts, as presented in the table above, are representative of the volume of activity for this derivative type during the period.
A list of open centrally cleared swap agreements held by the Fund at March 31, 2015, is as follows:
| Interest Rate Swaps | ||||||||||||||
| Counterparty | Fund Pays | Fund Receives | Termination Date | Notional Amount (Thousands) | Net Unrealized Depreciation ($ Thousands) | |||||||||
| Bank of America | 2.70% | 3 Month USD - LIBOR | 07/18/23 | 600 | $ | (47 | ) | |||||||
| Bank of America | 1.56% | 3 Month USD - LIBOR | 07/03/18 | 7,150 | (163 | ) | ||||||||
| Bank of America | USD 3M LIBOR | 2.26% | 12/29/25 | 8,600 | 42 | |||||||||
| Bank of America | 0.81% | 6M EUR - EURIOBOR | 12/29/25 | 7,095 | (142 | ) | ||||||||
| Bank of America | REC: 2.927 | PAY: 3 Month USD - LIBOR | 08/24/25 | 16,400 | 1,200 | |||||||||
| Bank of America | 1.42% | 6 Month EURIRBOR | 08/24/25 | 11,515 | (1,131 | ) | ||||||||
| Bank of America | REC: 3.13 | PAY: 3 Month USD - LIBOR | 06/08/25 | 17,400 | 1,689 | |||||||||
| Bank of America | 1.89% | 6 Month EURIRBOR | 06/08/25 | 12,100 | (1,987 | ) | ||||||||
|
| |||||||||||||
| $ | (539 | ) | ||||||||||||
|
| |||||||||||||
A list of open OTC swap agreements held by the Fund at March 31, 2015, is as follows:
| Total Return Swaps | ||||||||||||||||
| Counterparty | Reference Entity/Obligation | Fund Pays | Fund Receives | Termination Date | Notional Amount (Thousands) | Net Unrealized Appreciation/ (Depreciation) ($ Thousands) | ||||||||||
| Bank of America | S15ESDV Index | Index Return | 1-Month USD LIBOR Plus 70 Bps | 04/08/15 | (885 | ) | $ | (71 | ) | |||||||
| Bank of America | S15ESDV Index | Index Return | 1-Month USD LIBOR Plus 30 Bps | 04/08/15 | (15,407 | ) | (1,518 | ) | ||||||||
| Bank of America | S5HOME Index | Index Return | 1-Month USD LIBOR Plus 30 Bps | 04/08/15 | (13,753 | ) | 945 | |||||||||
| Bank of America | S5HOME Index | Index Return | 1-Month USD LIBOR Plus 30 Bps | 07/09/15 | (1,669 | ) | 79 | |||||||||
| Bank of America | 88160R101 | Index Return | 3-Month USD LIBOR Plus 158 Bps | 09/11/15 | 5,553 | 45 | ||||||||||
|
| |||||||||||||||
| $ | (520 | ) | ||||||||||||||
|
| |||||||||||||||
For the period ended March 31, 2015, the total amount of all swap contracts, as presented in the tables above, are representative of the volume of activity for this derivative type during the period.
| SEI Institutional Managed Trust / Semi-Annual Report / March 31, 2015 | 191 |
SCHEDULE OF INVESTMENTS (Unaudited)
Multi-Asset Income Fund (Concluded)
March 31, 2015
Percentages are based on a Net Assets of $604,404 ($ Thousands)
| (1) | In U.S. Dollars unless otherwise indicated. |
| * | Non-income producing security. |
| ‡ | Real Estate Investment Trust |
| @ | Rate is negative due to the decrease in the value of the foreign currency against the U.S. Dollar. |
| (A) | Zero coupon security. The rate reported on the Schedule of Investments is the effective yield at time of purchase. |
| (B) | Securities sold within terms of a private placement memorandum, exempt from registration under Section 144A of the Securities Act of 1933, as amended, and may be sold only to dealers in that program or other “accredited investors.” These securities have been determined to be liquid under guidelines established by the board of Trustees. |
| (C) | Variable Rate Security — The rate reported on the Schedule of Investments is the rate in effects as of March 31, 2015. The date reported on the Schedule of Investments is the next reset date. |
| (D) | Unfunded bank loan. Interest rate not available. |
| (E) | Unsettled bank loan. Interest rate not available. |
| (F) | Security fair valued using methods determined in good faith by the Valuation Committee of the Board of Trustees. The total market value of such securities as of March 31, 2015 was $16,720 ($ Thousands) and represented 2.77% of Net Assets. |
AED — United Arab Emirates Dirham
AUD — Australian Dollar
CBO — Collateralized Bond Obligation
CDO — Collateralized Debt Obligation
Cl — Class
CLO — Collateralized Loan Obligation
DKK — Danish Krone
EUR — Euro
EURIBOR — Euro Interbank Offered Rate
FHLMC — Federal Home Loan Mortgage Corporation
FNMA — Federal National Mortgage Association
GBP — British Pound
IDR — Indonesian Rupiah
LIBOR — London Interbank Offered Rate
LLC — Limited Liability Company
MSCI — Morgan Stanley Capital International
NASDAQ — National Association of Securities Dealers Automated Quotations
OTC — Over The Counter
PLC — Public Limited Company
Re-REMIC — Re-securitization of Real Estate Mortgage Investment Conduit
RUB — Russian Ruble
Ser — Series
S&P — Standard & Poor’s
SPDR — Standard & Poor’s Depositary Receipt
USD — United States Dollar
The following is a list of inputs used as of March 31, 2015, in valuing the Fund’s investments and other financial instruments carried at value ($ Thousands):
| Investments in Securities | Level 1 | Level 2 | Level 3(1) | Total | ||||||||||||
Collateralized Debt Obligations | $ | — | $ | 138,110 | $ | 3,600 | $ | 141,710 | ||||||||
Loan Participations | — | 122,464 | 2,159 | 124,623 | ||||||||||||
Corporate Obligations | — | 99,535 | 3,585 | 103,120 | ||||||||||||
Asset-Backed Securities | — | 85,527 | 7,706 | 93,233 | ||||||||||||
Mortgage-Backed Securities | — | 76,868 | — | 76,868 | ||||||||||||
Common Stock | 47,117 | — | — | 47,117 | ||||||||||||
Exchange Traded Funds | 19,847 | — | — | 19,847 | ||||||||||||
Preferred Stock | 13,019 | — | — | 13,019 | ||||||||||||
Sovereign Debt | — | 5,282 | — | 5,282 | ||||||||||||
Convertible Bond | — | — | 139 | 139 | ||||||||||||
Time Deposits | — | 23,579 | — | 23,579 | ||||||||||||
|
|
|
|
|
|
|
| |||||||||
Total Investments in Securities | $ | 79,983 | $ | 551,365 | $ | 17,189 | $ | 648,537 | ||||||||
|
|
|
|
|
|
|
| |||||||||
| Other Financial Instruments | Level 1 | Level 2 | Level 3 | Total | ||||||||||||
Purchased Options | $ | 1,946 | $ | — | $ | — | $ | 1,946 | ||||||||
Written Options | (1,287 | ) | — | — | (1,287 | ) | ||||||||||
Futures Contracts* | ||||||||||||||||
Unrealized Appreciation | 9 | — | — | 9 | ||||||||||||
Unrealized Depreciation | (141 | ) | — | — | (141 | ) | ||||||||||
Forwards Contracts* | ||||||||||||||||
Unrealized Appreciation | 1,347 | — | — | 1,347 | ||||||||||||
Unrealized Depreciation | (1 | ) | — | — | (1 | ) | ||||||||||
Centrally Cleared Swaps* | ||||||||||||||||
Interest Rate Swaps | ||||||||||||||||
Unrealized Appreciation | — | 2,931 | — | 2,931 | ||||||||||||
Unrealized Depreciation | — | (3,470 | ) | — | (3,470 | ) | ||||||||||
OTC Swaps* | ||||||||||||||||
Total Return Swaps | ||||||||||||||||
Unrealized Appreciation | — | 1,069 | — | 1,069 | ||||||||||||
Unrealized Depreciation | — | (1,589 | ) | — | (1,589 | ) | ||||||||||
Reverse Repurchase Agreements** | (61,822 | ) | — | — | (61,822 | ) | ||||||||||
|
|
|
|
|
|
|
| |||||||||
Total Other Financial Instruments | $ | (59,949 | ) | $ | (1,059 | ) | $ | — | $ | (61,008 | ) | |||||
|
|
|
|
|
|
|
| |||||||||
| * | Futures, forwards and swap contracts are valued at the unrealized appreciation/ (depreciation) on the instrument. |
| ** | See Note 2 for more information on the reverse repurchase agreements. |
| (1) | Please see Note 2 for details on the unobservable inputs and the interrelationships and sensitivity between these inputs for those Level 3 securities that are not valued by third party pricing vendors or broker quotes. |
The following is a reconciliation of the investments in which significant unobservable inputs (Level 3) were used in determining fair value ($ Thousands):
| Collateralized Debt Obligations | Loan Participations | Corporate Obligations | Asset-Backed Securities | Convertible Bond | Mortgage-Backed Securities | Common Stock | |||||||||||||||||||||||||||||
Beginning balance as of October 1, 2014 | $ | 9,489 | $ | 10,354 | $ | 3,535 | $ | 11,510 | $ | 139 | $ | 4,037 | $ | 159 | |||||||||||||||||||||
Accrued discounts/premiums | — | (2 | ) | 2 | 23 | (32 | ) | — | — | ||||||||||||||||||||||||||
Realized gain/(loss) | — | 13 | — | 1,036 | — | — | — | ||||||||||||||||||||||||||||
Change in unrealized appreciation/(depreciation) | (76 | ) | 5 | 48 | 19 | 32 | — | — | |||||||||||||||||||||||||||
Purchases | 2,836 | 304 | — | 974 | — | — | — | ||||||||||||||||||||||||||||
Sales | — | (828 | ) | — | (2,293 | ) | — | — | — | ||||||||||||||||||||||||||
Transfer into Level 3 | — | 627 | — | — | — | — | — | ||||||||||||||||||||||||||||
Transfer out of Level 3 | (8,649 | ) | (8,314 | ) | — | (3,563 | ) | — | (4,037 | ) | (159 | ) | |||||||||||||||||||||||
|
|
|
|
|
|
|
|
|
|
|
|
|
| ||||||||||||||||||||||
Ending balance as of March 31, 2015 | $ | 3,600 | $ | 2,159 | $ | 3,585 | $ | 7,706 | $ | 139 | $ | — | $ | — | |||||||||||||||||||||
|
|
|
|
|
|
|
|
|
|
|
|
|
| ||||||||||||||||||||||
|
|
|
|
|
|
|
|
|
|
|
|
|
| ||||||||||||||||||||||
Changes in unrealized gains/(losses) in earnings related to securities held at reporting date | $ | (798 | ) | $ | (53 | ) | $ | 49 | $ | 5 | $ | 32 | $ | — | $ | — | |||||||||||||||||||
|
|
|
|
|
|
|
|
|
|
|
|
|
| ||||||||||||||||||||||
For the period ended March 31, 2015, there have been no transfers between Level 1 and Level 2 assets and liabilities.
For more information on valuation inputs, see Note 2 — Significant Accounting Policies in Notes to Financial Statements.
Amounts designated as “—” are $0 or have been rounded to $0.
The accompanying notes are an integral part of the financial statements.
| 192 | SEI Institutional Managed Trust / Semi-Annual Report / March 31, 2015 |
CONSOLIDATED SCHEDULE OF INVESTMENTS (Unaudited)
Multi-Asset Inflation Managed Fund
March 31, 2015
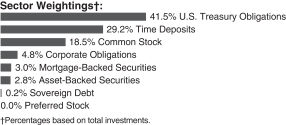
| Description | Shares | Market Value ($ Thousands) | ||||||
COMMON STOCK — 29.6% | ||||||||
Consumer Discretionary — 0.2% | ||||||||
Cinemark Holdings | 22,300 | $ | 1,005 | |||||
News, Cl A* | 89,300 | 1,430 | ||||||
|
| |||||||
| 2,435 | ||||||||
|
| |||||||
Consumer Staples — 5.2% | ||||||||
Altria Group | 20,600 | 1,030 | ||||||
Archer-Daniels-Midland | 25,700 | 1,218 | ||||||
Cal-Maine Foods | 55,100 | 2,152 | ||||||
Central Garden and Pet, Cl A* | 7,200 | 77 | ||||||
Clorox | 13,200 | 1,457 | ||||||
Coca-Cola | 10,100 | 410 | ||||||
Costco Wholesale | 24,300 | 3,681 | ||||||
CVS Health | 53,500 | 5,522 | ||||||
Dean Foods | 8,200 | 135 | ||||||
Dr Pepper Snapple Group | 66,300 | 5,203 | ||||||
Kimberly-Clark | 14,400 | 1,542 | ||||||
Kroger | 3,900 | 299 | ||||||
Lorillard | 67,300 | 4,398 | ||||||
Medifast* | 1,800 | 54 | ||||||
Monster Beverage* | 46,700 | 6,463 | ||||||
Omega Protein* | 18,700 | 256 | ||||||
PepsiCo | 24,800 | 2,371 | ||||||
Pilgrim’s Pride | 123,500 | 2,790 | ||||||
Procter & Gamble | 35,000 | 2,868 | ||||||
Rite Aid* | 75,400 | 655 | ||||||
Sanderson Farms | 69,500 | 5,536 | ||||||
SUPERVALU* | 207,100 | 2,409 | ||||||
USANA Health Sciences* | 2,600 | 289 | ||||||
|
| |||||||
| 50,815 | ||||||||
|
| |||||||
Energy — 6.7% | ||||||||
Alon USA Energy | 158,900 | 2,633 | ||||||
Anadarko Petroleum, Cl A | 9,100 | 754 | ||||||
Apache | 600 | 36 | ||||||
Basic Energy Services* | 83,700 | 580 | ||||||
Chesapeake Energy | 9,000 | 127 | ||||||
Chevron | 29,190 | 3,064 | ||||||
ConocoPhillips | 17,910 | 1,115 | ||||||
CVR Energy | 12,900 | 549 | ||||||
Dawson Geophysical* | 92 | — | ||||||
Devon Energy | 10,300 | 621 | ||||||
| Description | Shares | Market Value ($ Thousands) | ||||||
Ensco, Cl A | 80,900 | $ | 1,705 | |||||
Exxon Mobil | 121,830 | 10,356 | ||||||
Frontline* | 136,900 | 307 | ||||||
Green Plains | 12,900 | 368 | ||||||
Gulf Island Fabrication | 12,000 | 178 | ||||||
Helmerich & Payne | 1,000 | 68 | ||||||
Hess | 9,820 | 666 | ||||||
Kosmos Energy* | 209,600 | 1,658 | ||||||
Matrix Service* | 11,300 | 198 | ||||||
Nabors Industries | 39,320 | 537 | ||||||
Newpark Resources, Cl A* | 58,600 | 534 | ||||||
Noble | 119,700 | 1,709 | ||||||
Nordic American Tankers, Cl US | 168,100 | 2,002 | ||||||
Pacific Ethanol* | 192,100 | 2,073 | ||||||
PBF Energy, Cl A | 142,300 | 4,827 | ||||||
PDC Energy, Cl A* | 8,700 | 470 | ||||||
Pioneer Energy Services* | 90,600 | 491 | ||||||
REX American Resources* | 76,400 | 4,646 | ||||||
SM Energy | 41,300 | 2,134 | ||||||
Superior Energy Services | 55,500 | 1,240 | ||||||
Teekay Tankers, Cl A | 56,500 | 324 | ||||||
Tesoro | 65,600 | 5,989 | ||||||
Unit* | 14,900 | 417 | ||||||
VAALCO Energy* | 175,300 | 430 | ||||||
Valero Energy | 82,200 | 5,230 | ||||||
Western Refining | 53,600 | 2,647 | ||||||
World Fuel Services | 19,500 | 1,121 | ||||||
WPX Energy* | 301,400 | 3,294 | ||||||
|
| |||||||
| 65,098 | ||||||||
|
| |||||||
Financials — 3.3% | ||||||||
Alleghany* | 6,770 | 3,297 | ||||||
Allstate | 30,400 | 2,163 | ||||||
American Financial Group | 9,300 | 597 | ||||||
Arch Capital Group* | 16,100 | 992 | ||||||
Ashford Hospitality Trust† | 60,300 | 580 | ||||||
Berkshire Hills Bancorp | 2,700 | 75 | ||||||
BGC Partners, Cl A | 16,100 | 152 | ||||||
Chimera Investment† | 1,064,800 | 3,344 | ||||||
CoreSite Realty† | 20,600 | 1,003 | ||||||
Corporate Office Properties Trust† | 1,510 | 44 | ||||||
CyrusOne† | 15,100 | 470 | ||||||
FelCor Lodging Trust† | 40,600 | 467 | ||||||
First BanCorp Puerto Rico* | 28,000 | 174 | ||||||
Heartland Financial USA | 2,400 | 78 | ||||||
Hospitality Properties Trust† | 4,900 | 162 | ||||||
International. FCStone* | 9,200 | 274 | ||||||
Jones Lang LaSalle | 3,900 | 665 | ||||||
LaSalle Hotel Properties† | 2,700 | 105 | ||||||
Lazard, Cl A | 20,200 | 1,062 | ||||||
Marcus & Millichap* | 3,100 | 116 | ||||||
Mortgage Investment Trust† | 81,700 | 1,539 | ||||||
Popular* | 24,800 | 853 | ||||||
ProLogis† | 54,602 | 2,378 | ||||||
| SEI Institutional Managed Trust / Semi-Annual Report / March 31, 2015 | 193 |
CONSOLIDATED SCHEDULE OF INVESTMENTS (Unaudited)
Multi-Asset Inflation Managed Fund (Continued)
March 31, 2015
| Description | Shares | Market Value ($ Thousands) | ||||||
Public Storage† | 9,300 | $ | 1,833 | |||||
RE, Cl A | 6,200 | 206 | ||||||
Regency Centers† | 15,300 | 1,041 | ||||||
Ryman Hospitality Properties† | 28,200 | 1,718 | ||||||
Simon Property Group† | 8,700 | 1,702 | ||||||
SL Green Realty† | 9,294 | 1,193 | ||||||
Sovran Self Storage† | 4,270 | 401 | ||||||
St. Joe* | 147,800 | 2,743 | ||||||
Voya Financial | 25,000 | 1,078 | ||||||
|
| |||||||
| 32,505 | ||||||||
|
| |||||||
Health Care — 7.6% | ||||||||
Abaxis | 500 | 32 | ||||||
Affymetrix, Cl A* | 113,600 | 1,427 | ||||||
Almost Family* | 4,200 | 188 | ||||||
Amgen, Cl A | 34,000 | 5,435 | ||||||
ANI Pharmaceuticals* | 2,600 | 163 | ||||||
Anthem | 41,800 | 6,454 | ||||||
Biogen* | 12,110 | 5,113 | ||||||
Cambrex* | 8,000 | 317 | ||||||
Centene* | 84,800 | 5,995 | ||||||
Cigna | 17,000 | 2,200 | ||||||
Edwards Lifesciences, Cl A* | 20,700 | 2,949 | ||||||
Gilead Sciences* | 60,400 | 5,927 | ||||||
Health Net, Cl A* | 77,900 | 4,712 | ||||||
Hospira* | 44,200 | 3,882 | ||||||
Hyperion Therapeutics* | 14,400 | 661 | ||||||
ICU Medical* | 13,600 | 1,267 | ||||||
Illumina* | 27,600 | 5,124 | ||||||
Johnson & Johnson | 49,700 | 5,000 | ||||||
Laboratory Corp of America Holdings* | 6,600 | 832 | ||||||
Lannett* | 13,300 | 900 | ||||||
LifePoint Hospitals* | 22,300 | 1,638 | ||||||
Magellan Health* | 21,600 | 1,530 | ||||||
McKesson | 900 | 204 | ||||||
Merge Healthcare* | 67,200 | 300 | ||||||
Parexel International* | 8,900 | 614 | ||||||
PDL BioPharma | 175,200 | 1,233 | ||||||
Pfizer | 29,000 | 1,009 | ||||||
Pharmacyclics* | 7,000 | 1,792 | ||||||
Quintiles Transnational Holdings* | 60,200 | 4,031 | ||||||
Sucampo Pharmaceuticals, Cl A* | 65,600 | 1,021 | ||||||
United Therapeutics* | 6,700 | 1,155 | ||||||
Universal Health Services, Cl B | 6,800 | 800 | ||||||
|
| |||||||
| 73,905 | ||||||||
|
| |||||||
Industrials — 1.5% | ||||||||
Argan | 6,600 | 239 | ||||||
Cintas | 2,100 | 171 | ||||||
Civeo | 112,900 | 287 | ||||||
Dycom Industries* | 4,400 | 215 | ||||||
General Dynamics | 39,400 | 5,348 | ||||||
Higher One Holdings* | 11,400 | 28 | ||||||
| Description | Shares | Market Value ($ Thousands) | ||||||
Huntington Ingalls Industries, Cl A | 500 | $ | 70 | |||||
Insperity, Cl A | 22,800 | 1,192 | ||||||
JetBlue Airways* | 7,900 | 152 | ||||||
Matson | 12,900 | 544 | ||||||
Meritor* | 14,700 | 185 | ||||||
RPX, Cl Comdty (histrt)* | 69,500 | 1,000 | ||||||
Skywest | 3,600 | 52 | ||||||
Southwest Airlines, Cl A | 92,000 | 4,076 | ||||||
Spirit AeroSystems Holdings, Cl A* | 2,600 | 136 | ||||||
United Continental Holdings* | 4,700 | 316 | ||||||
USA Truck* | 15,800 | 437 | ||||||
|
| |||||||
| 14,448 | ||||||||
|
| |||||||
Information Technology — 3.8% |
| |||||||
Angie’s List* | 6,100 | 36 | ||||||
AVG Technologies* | 61,900 | 1,340 | ||||||
Booz Allen Hamilton Holding, Cl A | 6,400 | 185 | ||||||
Broadridge Financial Solutions | 21,900 | 1,205 | ||||||
Cognizant Technology Solutions, Cl A* | 18,000 | 1,123 | ||||||
Computer Sciences | 7,700 | 503 | ||||||
Convergys | 40,400 | 924 | ||||||
DST Systems | 31,300 | 3,465 | ||||||
EarthLink Holdings | 260,200 | 1,155 | ||||||
Electronic Arts* | 104,000 | 6,117 | ||||||
Ellie Mae* | 5,400 | 299 | ||||||
EPAM Systems* | 38,100 | 2,335 | ||||||
ePlus* | 6,000 | 521 | ||||||
Euronet Worldwide* | 1,300 | 76 | ||||||
Facebook, Cl A* | 2,800 | 230 | ||||||
Factset Research Systems | 22,900 | 3,646 | ||||||
GrubHub* | 7,500 | 341 | ||||||
Hackett Group | 9,300 | 83 | ||||||
Leidos Holdings | 33,600 | 1,410 | ||||||
LogMeIn* | 44,800 | 2,508 | ||||||
Manhattan Associates* | 70,800 | 3,583 | ||||||
MAXIMUS | 5,800 | 387 | ||||||
Monster Worldwide* | 124,800 | 791 | ||||||
Progress Software* | 28,500 | 774 | ||||||
Rackspace Hosting* | 26,700 | 1,378 | ||||||
Sykes Enterprises* | 10,000 | 249 | ||||||
Unisys* | 51,600 | 1,198 | ||||||
Visa, Cl A | 15,200 | 994 | ||||||
|
| |||||||
| 36,856 | ||||||||
|
| |||||||
Telecommunication Services — 0.6% |
| |||||||
Atlantic Telegraph-Network | 16,100 | 1,115 | ||||||
CenturyTel | 3,600 | 124 | ||||||
Inteliquent | 85,500 | 1,346 | ||||||
magicJack VocalTec* | 75,500 | 516 | ||||||
Verizon Communications | 52,700 | 2,563 | ||||||
|
| |||||||
| 5,664 | ||||||||
|
| |||||||
| 194 | SEI Institutional Managed Trust / Semi-Annual Report / March 31, 2015 |
| Description | Shares/Face Amount ($ Thousands) | Market Value ($ Thousands) | ||||||
Utilities — 0.7% | ||||||||
Entergy | 43,200 | $ | 3,348 | |||||
PG&E | 57,200 | 3,036 | ||||||
|
| |||||||
| 6,384 | ||||||||
|
| |||||||
Total Common Stock | 288,110 | |||||||
|
| |||||||
CORPORATE OBLIGATIONS — 7.8% |
| |||||||
Consumer Discretionary — 1.0% |
| |||||||
21st Century Fox America | ||||||||
6.150%, 02/15/2041 | $ | 165 | 213 | |||||
4.500%, 02/15/2021 | 260 | 288 | ||||||
4.000%, 10/01/2023 | 185 | 198 | ||||||
3.000%, 09/15/2022 | 405 | 410 | ||||||
Comcast | ||||||||
6.450%, 03/15/2037 | 185 | 250 | ||||||
CSC Holdings | ||||||||
8.625%, 02/15/2019 | 162 | 188 | ||||||
Dana Holding | ||||||||
6.000%, 09/15/2023 | 148 | 158 | ||||||
DIRECTV Holdings | ||||||||
5.000%, 03/01/2021 | 1,055 | 1,174 | ||||||
4.450%, 04/01/2024 | 348 | 372 | ||||||
3.800%, 03/15/2022 | 262 | 272 | ||||||
Discovery Communications | ||||||||
3.450%, 03/15/2025 | 450 | 450 | ||||||
Ford Motor Credit | ||||||||
2.597%, 11/04/2019 | 1,152 | 1,167 | ||||||
General Motors | ||||||||
3.500%, 10/02/2018 | 465 | 477 | ||||||
Goodyear Tire & Rubber | ||||||||
8.250%, 08/15/2020 | 210 | 222 | ||||||
Hertz | ||||||||
5.875%, 10/15/2020 | 470 | 483 | ||||||
KB Home | ||||||||
4.750%, 05/15/2019 | 382 | 373 | ||||||
MCE Finance | ||||||||
5.000%, 02/15/2021 (A) | 405 | 379 | ||||||
Numericable Group | ||||||||
5.375%, 05/15/2022 (A) | 235 | 264 | ||||||
Omnicom Group | ||||||||
3.625%, 05/01/2022 | 65 | 68 | ||||||
Reed Elsevier Capital | ||||||||
8.625%, 01/15/2019 | 475 | 583 | ||||||
Sirius XM Radio | ||||||||
4.625%, 05/15/2023 (A) | 421 | 405 | ||||||
Time Warner | ||||||||
3.550%, 06/01/2024 | 257 | 266 | ||||||
Time Warner Cable | ||||||||
4.500%, 09/15/2042 | 137 | 141 | ||||||
| Description | Face Amount ($ Thousands) | Market Value ($ Thousands) | ||||||
Viacom | ||||||||
3.875%, 04/01/2024 | $ | 344 | $ | 354 | ||||
|
| |||||||
| 9,155 | ||||||||
|
| |||||||
Consumer Staples — 0.6% | ||||||||
Altria Group | ||||||||
4.750%, 05/05/2021 | 210 | 234 | ||||||
2.625%, 01/14/2020 | 1,160 | 1,179 | ||||||
Grupo Bimbo | ||||||||
3.875%, 06/27/2024 (A) | 703 | 722 | ||||||
Kroger | ||||||||
3.400%, 04/15/2022 | 638 | 659 | ||||||
Marfrig Overseas | ||||||||
9.500%, 05/04/2020 (A) | 375 | 354 | ||||||
Reynolds American | ||||||||
3.250%, 11/01/2022 | 330 | 328 | ||||||
Tyson Foods | ||||||||
3.950%, 08/15/2024 | 715 | 756 | ||||||
2.650%, 08/15/2019 | 219 | 224 | ||||||
Virgolino de Oliveira Finance | ||||||||
10.500%, 01/28/2018 (A) (B) | 660 | 26 | ||||||
Walgreens Boots Alliance | ||||||||
3.800%, 11/18/2024 | 1,160 | 1,200 | ||||||
|
| |||||||
| 5,682 | ||||||||
|
| |||||||
Energy — 1.0% | ||||||||
DCP Midstream | ||||||||
4.750%, 09/30/2021 (A) | 220 | 204 | ||||||
Diamond Offshore Drilling | ||||||||
4.875%, 11/01/2043 | 370 | 310 | ||||||
Ecopetrol | ||||||||
5.875%, 05/28/2045 | 309 | 287 | ||||||
Energy Transfer Partners | ||||||||
6.125%, 02/15/2017 | 200 | 216 | ||||||
5.200%, 02/01/2022 | 465 | 507 | ||||||
Enterprise Products Operating | ||||||||
5.200%, 09/01/2020 | 340 | 383 | ||||||
Kinder Morgan Energy Partners | ||||||||
3.950%, 09/01/2022 | 990 | 1,005 | ||||||
Korea National Oil | ||||||||
3.125%, 04/03/2017 (A) | 465 | 479 | ||||||
Marathon Petroleum | ||||||||
5.125%, 03/01/2021 | 196 | 220 | ||||||
Noble Energy | ||||||||
8.250%, 03/01/2019 | 153 | 183 | ||||||
4.150%, 12/15/2021 | 475 | 503 | ||||||
3.900%, 11/15/2024 | 606 | 617 | ||||||
ONEOK | ||||||||
4.250%, 02/01/2022 | 300 | 284 | ||||||
Paragon Offshore (A) | ||||||||
7.250%, 08/15/2024 | 389 | 129 | ||||||
6.750%, 07/15/2022 | 66 | 22 | ||||||
| SEI Institutional Managed Trust / Semi-Annual Report / March 31, 2015 | 195 |
CONSOLIDATED SCHEDULE OF INVESTMENTS (Unaudited)
Multi-Asset Inflation Managed Fund (Continued)
March 31, 2015
| Description | Face Amount ($ Thousands) | Market Value ($ Thousands) | ||||||
Petrobras Global Finance BV | ||||||||
5.750%, 01/20/2020 | $ | 888 | $ | 824 | ||||
Petroleos Mexicanos | ||||||||
3.500%, 07/18/2018 (A) | 452 | 470 | ||||||
Petronas Capital | ||||||||
5.250%, 08/12/2019 | 330 | 370 | ||||||
Regency Energy Partners | ||||||||
4.500%, 11/01/2023 | 114 | 115 | ||||||
Reliance Holding USA | ||||||||
5.400%, 02/14/2022 (A) | 1,161 | 1,276 | ||||||
SM Energy | ||||||||
6.500%, 01/01/2023 | 43 | 44 | ||||||
Transocean | ||||||||
6.500%, 11/15/2020 | 570 | 478 | ||||||
Valero Energy | ||||||||
6.125%, 02/01/2020 | 480 | 556 | ||||||
Williams Partners | ||||||||
3.900%, 01/15/2025 | 217 | 212 | ||||||
|
| |||||||
| 9,694 | ||||||||
|
| |||||||
Financials — 2.6% | ||||||||
American International Group | ||||||||
6.400%, 12/15/2020 | 325 | 394 | ||||||
4.875%, 06/01/2022 | 520 | 591 | ||||||
American Tower† | ||||||||
4.700%, 03/15/2022 | 365 | 392 | ||||||
3.500%, 01/31/2023 | 485 | 481 | ||||||
Bank of America (C) | ||||||||
6.500%, 12/31/2049 | 292 | 309 | ||||||
0.919%, 03/28/2018 | 1,100 | 1,174 | ||||||
Barclays Bank | ||||||||
7.750%, 04/10/2023 (C) | 393 | 436 | ||||||
7.625%, 11/21/2022 | 207 | 242 | ||||||
6.860%, 09/29/2049 | 131 | 146 | ||||||
6.625%, 03/30/2022 | 103 | 144 | ||||||
4.375%, 09/11/2024 | 300 | 305 | ||||||
BNP Paribas | ||||||||
5.186%, 06/29/2049 (A) (C) | 259 | 260 | ||||||
Citigroup | ||||||||
3.875%, 03/26/2025 | 905 | 908 | ||||||
Credit Agricole | ||||||||
7.875%, 01/23/2024 (A) (C) | 249 | 264 | ||||||
Credit Suisse Group Funding Guernsey | ||||||||
3.750%, 03/26/2025 (A) | 995 | 1,006 | ||||||
Dai-ichi Life Insurance | ||||||||
5.100%, 12/31/2049 (A) (C) | 508 | 549 | ||||||
Ford Motor Credit | ||||||||
5.875%, 08/02/2021 | 695 | 818 | ||||||
Goldman Sachs Group MTN | ||||||||
1.861%, 11/29/2023 (C) | 810 | 835 | ||||||
Hartford Financial Services Group | ||||||||
5.125%, 04/15/2022 | 655 | 746 | ||||||
| Description | Face Amount ($ Thousands) | Market Value ($ Thousands) | ||||||
HBOS Capital Funding | ||||||||
4.939%, 05/29/2049 (C) | $ | 1,006 | $ | 1,077 | ||||
HCP† | ||||||||
5.375%, 02/01/2021 | 455 | 512 | ||||||
Health Care† | ||||||||
5.250%, 01/15/2022 | 695 | 783 | ||||||
Healthcare Realty Trust† | ||||||||
5.750%, 01/15/2021 | 285 | 322 | ||||||
Host Hotels & Resorts† | ||||||||
5.250%, 03/15/2022 | 190 | 211 | ||||||
ING Bank | ||||||||
2.000%, 09/25/2015 (A) | 665 | 669 | ||||||
Intesa Sanpaolo MTN | ||||||||
5.017%, 06/26/2024 (A) | 746 | 763 | ||||||
JPMorgan Chase | ||||||||
5.400%, 01/06/2042 | 175 | 210 | ||||||
Lincoln National | ||||||||
4.200%, 03/15/2022 | 355 | 384 | ||||||
MetLife | ||||||||
5.700%, 06/15/2035 | 80 | 101 | ||||||
Metropolitan Life Global Funding I | ||||||||
3.875%, 04/11/2022 (A) | 275 | 295 | ||||||
Mizuho Financial Group Cayman 3 | ||||||||
4.600%, 03/27/2024 (A) | 840 | 902 | ||||||
Morgan Stanley MTN | ||||||||
5.500%, 07/28/2021 | 585 | 679 | ||||||
Murray Street Investment Trust I | ||||||||
4.647%, 03/09/2017 (D) | 55 | 58 | ||||||
Nationwide Financial Services | ||||||||
5.375%, 03/25/2021 (A) | 470 | 529 | ||||||
Navient MTN | ||||||||
7.250%, 01/25/2022 | 52 | 55 | ||||||
Nomura Holdings MTN | ||||||||
2.000%, 09/13/2016 | 804 | 812 | ||||||
Nordea Bank | ||||||||
6.125%, 12/31/2049 (A) (C) | 205 | 211 | ||||||
PNC Bank | ||||||||
3.800%, 07/25/2023 | 960 | 1,016 | ||||||
Prudential Financial | ||||||||
5.625%, 06/15/2043 (C) | 365 | 387 | ||||||
Rabobank Capital Funding Trust III | ||||||||
5.254%, 10/21/2016 (A) (C) | 380 | 395 | ||||||
Royal Bank of Scotland MTN | ||||||||
9.500%, 03/16/2022 (C) | 110 | 124 | ||||||
Santander Bank | ||||||||
1.182%, 01/12/2018 (C) | 1,205 | 1,205 | ||||||
Santander UK | ||||||||
5.000%, 11/07/2023 (A) | 700 | 754 | ||||||
Societe Generale | ||||||||
5.922%, 04/05/2017 (A) (C) | 115 | 120 | ||||||
Standard Chartered MTN | ||||||||
4.000%, 07/12/2022 (C) | 775 | 795 | ||||||
| 196 | SEI Institutional Managed Trust / Semi-Annual Report / March 31, 2015 |
| Description | Face Amount ($ Thousands) | Market Value ($ Thousands) | ||||||
Trust F/1401† | ||||||||
5.250%, 12/15/2024 (A) | $ | 830 | $ | 892 | ||||
XLIT | ||||||||
4.450%, 03/31/2025 | 622 | 626 | ||||||
|
| |||||||
| 24,887 | ||||||||
|
| |||||||
Health Care — 0.5% | ||||||||
Actavis Funding SCS | ||||||||
3.850%, 06/15/2024 | 297 | 307 | ||||||
3.800%, 03/15/2025 | 1,096 | 1,131 | ||||||
Bayer US Finance | ||||||||
3.375%, 10/08/2024 (A) | 405 | 422 | ||||||
Becton Dickinson | ||||||||
3.734%, 12/15/2024 | 513 | 537 | ||||||
CHS | ||||||||
5.125%, 08/15/2018 | 169 | 174 | ||||||
Medtronic | ||||||||
3.500%, 03/15/2025 (A) | 1,170 | 1,223 | ||||||
Perrigo Finance | ||||||||
3.500%, 12/15/2021 | 227 | 235 | ||||||
Thermo Fisher Scientific | ||||||||
4.150%, 02/01/2024 | 365 | 394 | ||||||
|
| |||||||
| 4,423 | ||||||||
|
| |||||||
Industrials — 0.2% | ||||||||
AerCap Aviation Solutions BV | ||||||||
6.375%, 05/30/2017 | 234 | 248 | ||||||
Empresa de Transporte de Pasajeros Metro | ||||||||
4.750%, 02/04/2024 (A) | 360 | 386 | ||||||
Hutchison Whampoa International 14 | ||||||||
1.625%, 10/31/2017 (A) | 424 | 422 | ||||||
International Lease Finance | ||||||||
5.875%, 04/01/2019 | 325 | 353 | ||||||
Odebrecht Finance | ||||||||
5.250%, 06/27/2029 (A) | 457 | 369 | ||||||
|
| |||||||
| 1,778 | ||||||||
|
| |||||||
Information Technology — 0.3% | ||||||||
KLA-Tencor | ||||||||
4.650%, 11/01/2024 | 894 | 939 | ||||||
Sabre | ||||||||
8.500%, 05/15/2019 (A) | 421 | 450 | ||||||
Seagate HDD Cayman | ||||||||
4.750%, 01/01/2025 (A) | 427 | 442 | ||||||
Tencent Holdings MTN | ||||||||
3.375%, 05/02/2019 (A) | 676 | 701 | ||||||
Total System Services | ||||||||
2.375%, 06/01/2018 | 262 | 263 | ||||||
|
| |||||||
| 2,795 | ||||||||
|
| |||||||
| Description | Face Amount ($ Thousands) | Market Value ($ Thousands) | ||||||
Materials — 0.7% | ||||||||
Basell Finance BV | ||||||||
8.100%, 03/15/2027 (A) | $ | 220 | $ | 303 | ||||
Cia Minera Milpo SAA | ||||||||
4.625%, 03/28/2023 (A) | 428 | 427 | ||||||
Dow Chemical | ||||||||
4.250%, 11/15/2020 | 210 | 230 | ||||||
Glencore Funding | ||||||||
3.125%, 04/29/2019 (A) | 1,840 | 1,882 | ||||||
International Paper | ||||||||
4.750%, 02/15/2022 | 490 | 542 | ||||||
3.650%, 06/15/2024 | 247 | 252 | ||||||
Minsur | ||||||||
6.250%, 02/07/2024 (A) | 875 | 963 | ||||||
NOVA Chemicals | ||||||||
5.250%, 08/01/2023 (A) | 420 | 439 | ||||||
Novelis | ||||||||
8.375%, 12/15/2017 | 99 | 103 | ||||||
OCP | ||||||||
5.625%, 04/25/2024 (A) | 341 | 371 | ||||||
Sealed Air | ||||||||
5.250%, 04/01/2023 (A) | 332 | 346 | ||||||
Sociedad Quimica y Minera de Chile | ||||||||
3.625%, 04/03/2023 (A) | 408 | 358 | ||||||
Yamana | ||||||||
4.950%, 07/15/2024 | 917 | 901 | ||||||
|
| |||||||
| 7,117 | ||||||||
|
| |||||||
Telecommunication Services — 0.5% |
| |||||||
AT&T | ||||||||
5.550%, 08/15/2041 | 245 | 275 | ||||||
3.000%, 02/15/2022 | 465 | 467 | ||||||
Comcel Trust via Comunicaciones Celulares | ||||||||
6.875%, 02/06/2024 (A) | 208 | 222 | ||||||
Rogers Communications | ||||||||
4.000%, 06/06/2022 | 60 | 52 | ||||||
SBA Tower Trust | ||||||||
2.898%, 10/15/2019 (A) | 950 | 961 | ||||||
Sprint | ||||||||
7.875%, 09/15/2023 | 405 | 413 | ||||||
Telecom Italia Capital | ||||||||
7.175%, 06/18/2019 | 260 | 299 | ||||||
Telefonica Emisiones SAU | ||||||||
5.462%, 02/16/2021 | 200 | 229 | ||||||
Verizon Communications | ||||||||
7.350%, 04/01/2039 | 350 | 476 | ||||||
6.550%, 09/15/2043 | 360 | 469 | ||||||
4.272%, 01/15/2036 (A) | 1,170 | 1,161 | ||||||
Virgin Media Finance | ||||||||
5.250%, 02/15/2022 | 200 | 194 | ||||||
|
| |||||||
| 5,218 | ||||||||
|
| |||||||
| SEI Institutional Managed Trust / Semi-Annual Report / March 31, 2015 | 197 |
CONSOLIDATED SCHEDULE OF INVESTMENTS (Unaudited)
Multi-Asset Inflation Managed Fund (Continued)
March 31, 2015
| Description | Face Amount ($ Thousands) | Market Value ($ Thousands) | ||||||
Utilities — 0.4% | ||||||||
AES | ||||||||
7.375%, 07/01/2021 | $ | 415 | $ | 461 | ||||
Berkshire Hathaway Energy | ||||||||
6.125%, 04/01/2036 | 390 | 508 | ||||||
CMS Energy | ||||||||
5.050%, 03/15/2022 | 185 | 212 | ||||||
Constellation Energy Group | ||||||||
5.150%, 12/01/2020 | 70 | 79 | ||||||
Exelon Generation | ||||||||
4.250%, 06/15/2022 | 460 | 485 | ||||||
Israel Electric | ||||||||
5.000%, 11/12/2024 (A) | 792 | 821 | ||||||
NRG Energy | ||||||||
6.250%, 05/01/2024 | 315 | 317 | ||||||
Talent Yield Investments | ||||||||
4.500%, 04/25/2022 (A) | 1,301 | 1,383 | ||||||
|
| |||||||
| 4,266 | ||||||||
|
| |||||||
Total Corporate Obligations | 75,015 | |||||||
|
| |||||||
MORTGAGE-BACKED SECURITIES — 4.7% |
| |||||||
Agency Mortgage-Backed Obligations — 0.5% |
| |||||||
FHLMC Structured Agency Credit Risk Debt Notes, Ser 2013-DN2, Cl M2 | ||||||||
4.421%, 11/25/2023 (C) | 1,035 | 1,065 | ||||||
FHLMC Structured Agency Credit Risk Debt Notes, Ser 2014-DN2, Cl M3 | ||||||||
3.771%, 04/25/2024 (C) | 352 | 343 | ||||||
FHLMC Structured Agency Credit Risk Debt Notes, Ser 2014-DN3, Cl M3 | ||||||||
4.171%, 08/25/2024 (C) | 1,165 | 1,169 | ||||||
FHLMC Structured Agency Credit Risk Debt Notes, Ser 2015-HQ1, Cl M2 | ||||||||
2.373%, 03/25/2025 (C) | 530 | 531 | ||||||
FNMA Connecticut Avenue Securities, Ser 2014-C03, Cl 1M1 | ||||||||
1.374%, 07/25/2024 (C) | 395 | 395 | ||||||
FNMA Connecticut Avenue Securities, Ser 2014-C04, Cl 1M2 | ||||||||
5.071%, 11/25/2024 (C) | 933 | 986 | ||||||
FNMA Connecticut Avenue Securities, Ser 2015-C01, Cl 1M2 | ||||||||
4.474%, 02/25/2025 (C) | 630 | 637 | ||||||
|
| |||||||
| 5,126 | ||||||||
|
| |||||||
| Description | Face Amount ($ Thousands) | Market Value ($ Thousands) | ||||||
Non-Agency Mortgage-Backed Obligations — 4.2% |
| |||||||
Banc of America Commercial Mortgage Trust, Ser 2007-4, Cl A1A | ||||||||
5.774%, 02/10/2051 (C) | $ | 1,749 | $ | 1,898 | ||||
Banc of America Commercial Mortgage Trust, Ser 2007-5, Cl AM | ||||||||
5.772%, 02/10/2051 (C) | 262 | 280 | ||||||
Bear Stearns Commercial Mortgage Securities Trust, Ser 2006-PW13, Cl AJ | ||||||||
5.611%, 09/11/2041 (C) | 718 | 739 | ||||||
Carefree Portfolio Trust, | ||||||||
1.495%, 11/15/2019 (A) (C) | 653 | 655 | ||||||
Chase Mortgage Finance Trust, Ser 2007-S5, Cl 1A17 | ||||||||
6.000%, 07/25/2037 | 244 | 213 | ||||||
CHL Mortgage Pass-Through Trust, Ser 2006-10, Cl 1A8 | ||||||||
6.000%, 05/25/2036 | 443 | 412 | ||||||
CHL Mortgage Pass-Through Trust, Ser 2006-13, Cl 1A18 | ||||||||
6.250%, 09/25/2036 | 593 | 545 | ||||||
CHL Mortgage Pass-Through Trust, Ser 2006-13, Cl 1A19 | ||||||||
6.250%, 09/25/2036 | 214 | 197 | ||||||
CHL Mortgage Pass-Through Trust, Ser 2007-HYB2, Cl 3A1 | ||||||||
2.655%, 02/25/2047 (C) | 551 | 458 | ||||||
Citigroup Commercial Mortgage Trust, Ser 2006-C4, Cl A1A | ||||||||
5.768%, 03/15/2049 (C) | 497 | 513 | ||||||
Citigroup Commercial Mortgage Trust, Ser 2015-GC27, Cl A5 | ||||||||
3.137%, 02/10/2048 | 980 | 1,003 | ||||||
COBALT CMBS Commercial Mortgage Trust, Ser 2007-C3, Cl A4 | ||||||||
5.761%, 05/15/2046 (C) | 498 | 538 | ||||||
Commercial Mortgage Loan Trust, Ser 2008-LS1, Cl A1A | ||||||||
6.028%, 12/10/2049 (C) | 1,690 | 1,839 | ||||||
Commercial Mortgage Pass-Through Certificates, | ||||||||
1.873%, 04/12/2035 (A) | 397 | 394 | ||||||
Commercial Mortgage Pass-Through Certificates, | ||||||||
1.077%, 06/11/2027 (A) (C) | 835 | 832 | ||||||
| 198 | SEI Institutional Managed Trust / Semi-Annual Report / March 31, 2015 |
| Description | Face Amount ($ Thousands) | Market Value ($ Thousands) | ||||||
Commercial Mortgage Pass-Through Certificates, | ||||||||
1.322%, 06/15/2034 (A) (C) | $ | 719 | $ | 718 | ||||
Commercial Mortgage Trust, Ser 2013-VN05, Cl A | ||||||||
3.187%, 03/13/2035 | 915 | 956 | ||||||
Countrywide Alternative Loan Trust, Ser 2005-20CB, Cl 3A6 | ||||||||
5.500%, 07/25/2035 | 184 | 174 | ||||||
Countrywide Alternative Loan Trust, Ser 2005-57CB, Cl 4A3 | ||||||||
5.500%, 12/25/2035 | 502 | 461 | ||||||
Countrywide Alternative Loan Trust, Ser 2006-23CB, Cl 1A7 | ||||||||
6.000%, 08/25/2036 | 296 | 286 | ||||||
Countrywide Alternative Loan Trust, Ser 2006-24CB, Cl A16 | ||||||||
5.750%, 06/25/2036 | 704 | 635 | ||||||
Countrywide Alternative Loan Trust, Ser 2006-28CB, Cl A14 | ||||||||
6.250%, 10/25/2036 | 481 | 410 | ||||||
Countrywide Alternative Loan Trust, Ser 2006-9T1, Cl A1 | ||||||||
5.750%, 05/25/2036 | 318 | 265 | ||||||
Countrywide Alternative Loan Trust, Ser 2006-J1, Cl 1A13 | ||||||||
5.500%, 02/25/2036 | 437 | 393 | ||||||
Countrywide Alternative Loan Trust, Ser 2007-2CB, Cl 2A4 | ||||||||
5.750%, 03/25/2037 | 430 | 385 | ||||||
Credit Suisse Commercial Mortgage Trust, | ||||||||
5.704%, 06/15/2039 (C) | 581 | 610 | ||||||
Deutsche Alt-A Securities Mortgage Loan Trust, Ser 2013-G1, Cl A2 | ||||||||
2.059%, 04/10/2031 (C) | 690 | 682 | ||||||
Deutsche Alt-A Securities Mortgage Loan Trust, | ||||||||
0.361%, 12/25/2036 (C) | 769 | 457 | ||||||
Extended Stay America Trust, Ser 2013-ESFL, Cl A2FL | ||||||||
0.873%, 12/05/2031 (A) (C) | 425 | 423 | ||||||
Extended Stay America Trust, Ser 2013-ESH7, Cl A17 | ||||||||
2.295%, 12/05/2031 (A) | 560 | 560 | ||||||
First Horizon Alternative Mortgage Securities Trust, Ser 2006-FA3, Cl A9 | ||||||||
6.000%, 07/25/2036 | 456 | 381 | ||||||
| Description | Face Amount ($ Thousands) | Market Value ($ Thousands) | ||||||
Greenwich Capital Commercial Funding, Ser 2007-GG9, Cl AM | ||||||||
5.475%, 03/10/2039 | $ | 613 | $ | 647 | ||||
Greenwich Capital Commercial Funding, Ser 2007-GG9, Cl A4 | ||||||||
5.444%, 03/10/2039 | 754 | 796 | ||||||
GS Mortgage Securities II, Ser 2013-KING, Cl A | ||||||||
2.706%, 12/10/2027 (A) | 835 | 850 | ||||||
HomeBanc Mortgage Trust, Ser 2005-1, Cl A1 | ||||||||
0.421%, 03/25/2035 (C) | 380 | 338 | ||||||
IndyMac INDX Mortgage Loan Trust, Ser 2006-AR15, Cl A1 | ||||||||
0.291%, 07/25/2036 (C) | 565 | 448 | ||||||
JPMorgan Chase Commercial Mortgage Securities Trust, Ser 2004-LN2, Cl A1A | ||||||||
4.838%, 07/15/2041 (A) (C) | 258 | 257 | ||||||
JPMorgan Chase Commercial Mortgage Securities Trust, Ser 2007-CB19, Cl AM | ||||||||
5.694%, 02/12/2049 (C) | 300 | 317 | ||||||
JPMorgan Chase Commercial Mortgage Securities Trust, Ser 2007-LD12, Cl A4 | ||||||||
5.882%, 02/15/2051 (C) | 930 | 997 | ||||||
JPMorgan Chase Commercial Mortgage Securities Trust, Ser 2007-LD12, Cl AM | ||||||||
6.010%, 02/15/2051 (C) | 254 | 276 | ||||||
JPMorgan Chase Commercial Mortgage Securities Trust, Ser 2007-LDP10, Cl A1A | ||||||||
5.439%, 01/15/2049 | 1,958 | 2,096 | ||||||
JPMorgan Chase Commercial Mortgage Securities Trust, Ser 2007-LDPX, Cl A3 | ||||||||
5.420%, 01/15/2049 | 867 | 919 | ||||||
JPMorgan Chase Commercial Mortgage Securities Trust, Ser 2007-S3, Cl 1A8 | ||||||||
6.000%, 08/25/2037 | 335 | 303 | ||||||
JPMorgan Chase Commercial Mortgage Securities Trust, Ser 2008-C2, Cl A1A | ||||||||
5.998%, 02/12/2051 | 895 | 981 | ||||||
JPMorgan Chase Commercial Mortgage Securities Trust, Ser 2014-INN, Cl A | ||||||||
1.095%, 06/15/2029 (A) (C) | 1,145 | 1,142 | ||||||
LB-UBS Commercial Mortgage Trust, Ser 2007-C1, Cl AM | ||||||||
5.455%, 02/15/2040 | 395 | 422 | ||||||
| SEI Institutional Managed Trust / Semi-Annual Report / March 31, 2015 | 199 |
CONSOLIDATED SCHEDULE OF INVESTMENTS (Unaudited)
Multi-Asset Inflation Managed Fund (Continued)
March 31, 2015
| Description | Face Amount ($ Thousands) | Market Value ($ Thousands) | ||||||
LSTAR Commercial Mortgage Trust, Ser 2014-2, Cl A2 | ||||||||
2.767%, 01/20/2041 (A) | $ | 687 | $ | 701 | ||||
Merrill Lynch Mortgage Trust, Ser 2006-C2, Cl A1A | ||||||||
5.739%, 08/12/2043 (C) | 604 | 633 | ||||||
ML-CFC Commercial Mortgage Trust, Ser 2006-4, Cl A1A | ||||||||
5.166%, 12/12/2049 | 2,242 | 2,345 | ||||||
ML-CFC Commercial Mortgage Trust, Ser 2007-9, Cl A4 | ||||||||
5.700%, 09/12/2049 | 1,220 | 1,308 | ||||||
PFP III, Ser 2014-1, Cl A | ||||||||
1.345%, 06/14/2031 (A) (C) | 709 | 710 | ||||||
Resource Capital, Ser 2014-CRE2, Cl A | ||||||||
1.228%, 04/15/2032 (A) (C) | 488 | 485 | ||||||
UBS-Barclays Commercial Mortgage Trust, Ser 2012-C3, Cl A4 | ||||||||
3.091%, 08/10/2049 | 297 | 309 | ||||||
UBS-Barclays Commercial Mortgage Trust, Ser 2012-C4, Cl A5 | ||||||||
2.850%, 12/10/2045 | 596 | 608 | ||||||
Wachovia Bank Commercial Mortgage Trust, Ser 2006-C23, Cl A5 | ||||||||
5.416%, 01/15/2045 (C) | 2,041 | 2,096 | ||||||
Wachovia Bank Commercial Mortgage Trust, Ser 2006-C26, Cl A1A | ||||||||
6.009%, 06/15/2045 (C) | 590 | 618 | ||||||
Wells Fargo Mortgage Backed Securities Trust, Ser 2007-8, Cl 2A5 | ||||||||
5.750%, 07/25/2037 | 293 | 286 | ||||||
WFRBS Commercial Mortgage Trust, Ser 2013-C14, Cl A5 | ||||||||
3.337%, 06/15/2046 | 856 | 902 | ||||||
WFRBS Commercial Mortgage Trust, Ser 2014-C20, Cl A2 | ||||||||
3.036%, 05/15/2047 | 701 | 734 | ||||||
|
| |||||||
| 40,836 | ||||||||
|
| |||||||
Total Mortgage-Backed Securities (Cost $46,258) ($ Thousands) |
| 45,962 | ||||||
|
| |||||||
ASSET-BACKED SECURITIES — 4.4% |
| |||||||
Automotive — 2.1% | ||||||||
AmeriCredit Automobile Receivables Trust, Ser 2012-3, Cl A3 | ||||||||
0.960%, 01/09/2017 | 12 | 12 | ||||||
| Description | Face Amount ($ Thousands) | Market Value ($ Thousands) | ||||||
AmeriCredit Automobile Receivables Trust, Ser 2013-3, Cl A3 | ||||||||
0.920%, 04/09/2018 | $ | 1,245 | $ | 1,246 | ||||
AmeriCredit Automobile Receivables Trust, Ser 2013-4, Cl A3 | ||||||||
0.960%, 04/09/2018 | 550 | 550 | ||||||
AmeriCredit Automobile Receivables Trust, Ser 2014-1, Cl A3 | ||||||||
0.900%, 02/08/2019 | 530 | 529 | ||||||
ARI Fleet Lease Trust, | ||||||||
0.700%, 12/15/2015 (A) | 193 | 193 | ||||||
ARI Fleet Lease Trust, | ||||||||
0.810%, 11/15/2022 (A) | 414 | 414 | ||||||
Avis Budget Rental Car Funding AESOP, Ser 2012-3A, Cl A | ||||||||
2.100%, 03/20/2019 (A) | 435 | 440 | ||||||
Avis Budget Rental Car Funding AESOP, Ser 2013-2A, Cl A | ||||||||
2.970%, 02/20/2020 (A) | 594 | 614 | ||||||
Avis Budget Rental Car Funding AESOP, Ser 2014-1A, Cl A | ||||||||
2.460%, 07/20/2020 (A) | 1,404 | 1,418 | ||||||
California Republic Auto Receivables Trust, Ser 2014-2, Cl A4 | ||||||||
1.570%, 12/16/2019 | 907 | 911 | ||||||
Capital Auto Receivables Asset Trust, Ser 2013-1, Cl A2 | ||||||||
0.620%, 07/20/2016 | 50 | 50 | ||||||
Capital Auto Receivables Asset Trust, Ser 2013-3, Cl A2 | ||||||||
1.040%, 11/21/2016 | 939 | 940 | ||||||
Capital Auto Receivables Asset Trust, Ser 2014-1, Cl B | ||||||||
2.220%, 01/22/2019 | 200 | 202 | ||||||
Carfinance Capital Auto Trust, Ser 2013-1A, Cl A | ||||||||
1.650%, 07/17/2017 (A) | 70 | 70 | ||||||
Chrysler Capital Auto Receivables Trust, Ser 2014-BA, Cl A2 | ||||||||
0.690%, 09/15/2017 (A) | 1,646 | 1,646 | ||||||
CPS Auto Receivables Trust, Ser 2013-B, Cl A | ||||||||
1.820%, 09/15/2020 (A) | 545 | 546 | ||||||
CPS Auto Receivables Trust, Ser 2014-B, Cl A | ||||||||
1.110%, 11/15/2018 (A) | 537 | 536 | ||||||
Enterprise Fleet Financing, Ser 2014-1, Cl A2 | ||||||||
0.870%, 09/20/2019 (A) | 378 | 378 | ||||||
| 200 | SEI Institutional Managed Trust / Semi-Annual Report / March 31, 2015 |
| Description | Face Amount ($ Thousands) | Market Value ($ Thousands) | ||||||
Enterprise Fleet Financing, Ser 2015-1, Cl A2 | ||||||||
1.300%, 09/20/2020 (A) | $ | 983 | $ | 984 | ||||
Exeter Automobile Receivables Trust, Ser 2012-2A, Cl A | ||||||||
1.300%, 06/15/2017 (A) | 18 | 18 | ||||||
Exeter Automobile Receivables Trust, Ser 2013-1A, Cl A | ||||||||
1.290%, 10/16/2017 (A) | 88 | 88 | ||||||
Exeter Automobile Receivables Trust, Ser 2014-1A, Cl A | ||||||||
1.290%, 05/15/2018 (A) | 235 | 235 | ||||||
Exeter Automobile Receivables Trust, Ser 2014-2A, Cl A | ||||||||
1.060%, 08/15/2018 (A) | 255 | 255 | ||||||
Flagship Credit Auto Trust, Ser 2013-1, Cl A | ||||||||
1.320%, 04/16/2018 (A) | 115 | 115 | ||||||
Ford Auto Securitization Trust, Ser 2013-R1A, Cl A2 | ||||||||
1.676%, 09/15/2016 (A) | 190 | 150 | ||||||
Ford Auto Securitization Trust, Ser 2014-R2A, Cl A1 | ||||||||
1.353%, 03/15/2016 (A) | 188 | 148 | ||||||
Ford Credit Auto Owner Trust, Ser 2012-D, Cl B | ||||||||
1.010%, 05/15/2018 | 240 | 239 | ||||||
Ford Credit Auto Owner Trust, Ser 2014-2, Cl A | ||||||||
2.310%, 04/15/2026 (A) | 816 | 828 | ||||||
GM Financial Automobile Leasing Trust, Ser 2015-1, Cl A2 | ||||||||
1.100%, 12/20/2017 | 984 | 984 | ||||||
Harley-Davidson Motorcycle Trust, Ser 2014-1, Cl A3 | ||||||||
1.100%, 09/15/2019 | 420 | 420 | ||||||
Hertz Fleet Lease Funding, Ser 2013-3, Cl A | ||||||||
0.722%, 12/10/2027 (A) (C) | 1,241 | 1,241 | ||||||
Hertz Vehicle Financing, | ||||||||
1.120%, 08/25/2017 (A) | 2,230 | 2,230 | ||||||
Hyundai Auto Lease Securitization Trust, Ser 2015-A, Cl A2 | ||||||||
1.000%, 10/16/2017 (A) | 681 | 681 | ||||||
Hyundai Auto Receivables Trust, Ser 2012-B, Cl C | ||||||||
1.950%, 10/15/2018 | 170 | 172 | ||||||
Mercedes Benz Auto Lease Trust, Ser 2014-A, Cl A2A | ||||||||
0.480%, 06/15/2016 | 437 | 437 | ||||||
Mercedes-Benz Auto Lease Trust, Ser 2013-A, Cl A3 | ||||||||
0.590%, 02/15/2016 | 88 | 88 | ||||||
| Description | Face Amount ($ Thousands) | Market Value ($ Thousands) | ||||||
Santander Drive Auto Receivables Trust, Ser 2013-4, Cl A3 | ||||||||
1.110%, 12/15/2017 | $ | 705 | $ | 705 | ||||
Santander Drive Auto Receivables Trust, Ser 2013-5, Cl A2A | ||||||||
0.640%, 04/17/2017 | 13 | 13 | ||||||
|
| |||||||
| 20,726 | ||||||||
|
| |||||||
Credit Cards — 0.7% | ||||||||
Barclays Dryrock Issuance Trust, Ser 2014-3, Cl A | ||||||||
2.410%, 07/15/2022 | 570 | 583 | ||||||
Barclays Dryrock Issuance Trust, Ser 2015-1, Cl A | ||||||||
2.200%, 12/15/2022 | 989 | 998 | ||||||
Cabela’s Credit Card Master Note Trust, Ser 2014-1, Cl A | ||||||||
0.523%, 03/16/2020 (C) | 500 | 500 | ||||||
Discover Card Execution Note Trust, Ser 2015-A1, Cl A1 | ||||||||
0.525%, 08/17/2020 (C) | 750 | 750 | ||||||
First National Master Note Trust, Ser 2013-2, Cl A | ||||||||
0.705%, 10/15/2019 (C) | 794 | 795 | ||||||
Synchrony Credit Card Master Note Trust, Ser 2012-2, Cl A | ||||||||
2.220%, 01/15/2022 | 1,389 | 1,402 | ||||||
World Financial Network Credit Card Master Trust, Ser 2012-B, Cl A | ||||||||
1.760%, 05/17/2021 | 380 | 384 | ||||||
World Financial Network Credit Card Master Trust, Ser 2013-A, Cl A | ||||||||
1.610%, 12/15/2021 | 385 | 386 | ||||||
World Financial Network Credit Card Master Trust, Ser 2014-A, Cl A | ||||||||
0.555%, 12/15/2019 (C) | 915 | 915 | ||||||
|
| |||||||
| 6,713 | ||||||||
|
| |||||||
Other Asset-Backed Securities — 1.6% |
| |||||||
Ally Master Owner Trust, Ser 2014-1, Cl A2 | ||||||||
1.290%, 01/15/2019 | 1,405 | 1,412 | ||||||
Ally Master Owner Trust, | ||||||||
0.545%, 01/16/2018 (C) | 810 | 810 | ||||||
BHMS, Ser 2014-ATLS, Cl AFX | ||||||||
3.600%, 07/01/2033 | 1,180 | 1,227 | ||||||
BMW Floorplan Master Owner Trust, Ser 2012-1A, Cl A | ||||||||
0.575%, 09/15/2017 (A) (C) | 906 | 907 | ||||||
| SEI Institutional Managed Trust / Semi-Annual Report / March 31, 2015 | 201 |
CONSOLIDATED SCHEDULE OF INVESTMENTS (Unaudited)
Multi-Asset Inflation Managed Fund (Continued)
March 31, 2015
| Description | Face Amount (1) ($ Thousands)/Shares | Market Value ($ Thousands) | ||||||||
CIT Equipment Collateral, | ||||||||||
0.860%, 05/22/2017 (A) | 1,129 | $ | 1,129 | |||||||
CNH Equipment Trust, | ||||||||||
1.850%, 04/15/2021 | 673 | 676 | ||||||||
Ford Credit Floorplan Master Owner Trust, Ser 2014-1, Cl A1 | ||||||||||
1.200%, 02/15/2019 | 999 | 1,002 | ||||||||
Ford Credit Floorplan Master Owner Trust, Ser 2015-2, Cl A2 | ||||||||||
0.745%, 01/15/2022 (C) | 954 | 955 | ||||||||
GE Dealer Floorplan Master Note Trust, Ser 2014-1, Cl A | ||||||||||
0.556%, 07/20/2019 (C) | 1,159 | 1,159 | ||||||||
GE Dealer Floorplan Master Note Trust, Ser 2015-1, Cl A | ||||||||||
0.676%, 01/20/2020 (C) | 956 | 957 | ||||||||
GE Equipment Small Ticket, Ser 2014-1A, Cl A2 | ||||||||||
0.590%, 08/24/2016 (A) | 868 | 868 | ||||||||
GSAA Home Equity Trust, | ||||||||||
0.441%, 03/25/2036 (C) | 706 | 481 | ||||||||
Mercedes-Benz Master Owner Trust, Ser 2012-AA, Cl A | ||||||||||
0.790%, 11/15/2017 (A) | 1,278 | 1,278 | ||||||||
Navistar Financial Dealer Note Master Owner Trust II, Ser 2014-1, Cl A | ||||||||||
0.921%, 10/25/2019 (A) (C) | 768 | 768 | ||||||||
Starwood Retail Property Trust, Ser 2014, Cl A | ||||||||||
1.392%, 11/15/2027 | 773 | 774 | ||||||||
Volvo Financial Equipment, | ||||||||||
1.510%, 06/17/2019 (A) | 986 | 990 | ||||||||
|
| |||||||||
| 15,393 | ||||||||||
|
| |||||||||
Total Asset-Backed Securities | 42,832 | |||||||||
|
| |||||||||
SOVEREIGN DEBT — 0.3% | ||||||||||
Brazil Notas do Tesouro Nacional, Ser F | ||||||||||
10.000%, 01/01/2017 | BRL | 6,145 | 1,823 | |||||||
IPIC GMTN | ||||||||||
3.750%, 03/01/2017 (A) | 460 | 480 | ||||||||
| Description | Face Amount (1) (Thousands)/Shares | Market Value ($ Thousands) | ||||||||||
Qatar Government International Bond | ||||||||||||
4.500%, 01/20/2022 (A) | $ | 355 | $ | 395 | ||||||||
|
| |||||||||||
Total Sovereign Debt | 2,698 | |||||||||||
|
| |||||||||||
PREFERRED STOCK — 0.0% |
| |||||||||||
Financials — 0.0% | ||||||||||||
Allstate (A) | 2,250 | 58 | ||||||||||
|
| |||||||||||
Total Preferred Stock | 58 | |||||||||||
|
| |||||||||||
U.S. TREASURY OBLIGATIONS — 66.2% |
| |||||||||||
U.S. Treasury Inflation Protected Securities | ||||||||||||
2.625%, 07/15/2017 | 14,423 | 15,660 | ||||||||||
2.500%, 07/15/2016 | 40,936 | 42,999 | ||||||||||
2.375%, 01/15/2017 | 7,798 | 8,262 | ||||||||||
2.125%, 01/15/2019 | 17,187 | 18,920 | ||||||||||
1.625%, 01/15/2018 | 27,991 | 29,819 | ||||||||||
1.375%, 01/15/2020 | 37,237 | 40,272 | ||||||||||
0.125%, 04/15/2016 | 44,592 | 45,041 | ||||||||||
0.125%, 04/15/2017 | 80,740 | 82,178 | ||||||||||
0.125%, 04/15/2018 | 98,739 | 100,729 | ||||||||||
0.125%, 04/15/2019 | 107,503 | 109,493 | ||||||||||
U.S. Treasury Bills (E) (F) | ||||||||||||
0.025%, 06/25/2015 | 40,000 | 39,998 | ||||||||||
0.015%, 04/23/2015 | 41,000 | 41,000 | ||||||||||
0.015%, 05/14/2015 | 40,000 | 39,999 | ||||||||||
0.005%, 06/04/2015 | 31,000 | 30,999 | ||||||||||
|
| |||||||||||
Total U.S. Treasury Obligations |
| 645,369 | ||||||||||
|
| |||||||||||
TIME DEPOSITS — 4.0% |
| |||||||||||
Brown Brothers Harriman | ||||||||||||
4.800%, 04/01/2014 | ZAR | — | — | |||||||||
0.074%, 10/01/2014 | GBP | — | — | |||||||||
0.030%, 01/01/2015 (E) | 39,377 | 39,377 | ||||||||||
0.005%, 10/01/2014 | JPY | — | — | |||||||||
0.005%, 10/01/2014 | HKD | — | — | |||||||||
(0.198)%, 07/01/2014 @ | EUR | 9 | 10 | |||||||||
(0.270)%, 10/01/2014 @ | SEK | — | — | |||||||||
|
| |||||||||||
Total Time Deposits |
| 39,387 | ||||||||||
|
| |||||||||||
Total Investments — 117.0% |
| $ | 1,139,431 | |||||||||
|
| |||||||||||
COMMON STOCK SOLD SHORT — (14.4)% |
| |||||||||||
Consumer Discretionary — (6.8)% |
| |||||||||||
Amazon.com, Cl A* | (7,800 | ) | (2,902 | ) | ||||||||
ANN* | (2,300 | ) | (94 | ) | ||||||||
| 202 | SEI Institutional Managed Trust / Semi-Annual Report / March 31, 2015 |
| Description | Shares | Market Value ($ Thousands) | ||||||
Apollo Education Group, Cl A* | (15,600 | ) | $ | (295 | ) | |||
Arctic Cat | (24,100 | ) | (875 | ) | ||||
bebe stores, Cl A | (198,000 | ) | (719 | ) | ||||
Big 5 Sporting Goods | (6,900 | ) | (92 | ) | ||||
Black Diamond* | (11,700 | ) | (111 | ) | ||||
Bob Evans Farms | (53,600 | ) | (2,480 | ) | ||||
Cabela’s* | (101,200 | ) | (5,665 | ) | ||||
Callaway Golf | (83,900 | ) | (800 | ) | ||||
CarMax* | (21,800 | ) | (1,504 | ) | ||||
Carmike Cinemas* | (6,700 | ) | (225 | ) | ||||
CBS, Cl B | (3,400 | ) | (206 | ) | ||||
Christopher & Banks* | (19,100 | ) | (106 | ) | ||||
Chuy’s Holdings * | (95,200 | ) | (2,145 | ) | ||||
CROCS* | (42,900 | ) | (507 | ) | ||||
Cumulus Media, Cl A* | (89,600 | ) | (221 | ) | ||||
Destination XL Group* | (46,700 | ) | (231 | ) | ||||
Dixie Group* | (79,800 | ) | (722 | ) | ||||
Dorman Products* | (7,600 | ) | (378 | ) | ||||
DreamWorks Animation SKG, Cl A* | (71,600 | ) | (1,733 | ) | ||||
Entravision Communications, Cl A | (26,600 | ) | (169 | ) | ||||
EVINE Live* | (18,900 | ) | (127 | ) | ||||
Federal-Mogul Holdings, Cl A* | (7,300 | ) | (97 | ) | ||||
Ford Motor | (402,800 | ) | (6,501 | ) | ||||
Fox Factory Holding* | (41,900 | ) | (643 | ) | ||||
Fuel Systems Solutions* | (110,300 | ) | (1,218 | ) | ||||
Gray Television* | (22,200 | ) | (307 | ) | ||||
Groupon, Cl A* | (191,300 | ) | (1,379 | ) | ||||
Harley-Davidson, Cl A | (29,500 | ) | (1,792 | ) | ||||
Johnson Controls | (10,400 | ) | (524 | ) | ||||
Lifetime Brands | (6,700 | ) | (102 | ) | ||||
LKQ* | (69,100 | ) | (1,766 | ) | ||||
M/I Homes* | (14,700 | ) | (351 | ) | ||||
Mattel | (62,600 | ) | (1,430 | ) | ||||
MDC Holdings | (31,200 | ) | (889 | ) | ||||
Media General* | (32,500 | ) | (536 | ) | ||||
Men’s Wearhouse | (40,000 | ) | (2,088 | ) | ||||
Meritage Homes* | (11,500 | ) | (559 | ) | ||||
MGM Mirage* | (31,500 | ) | (662 | ) | ||||
Movado Group | (26,600 | ) | (758 | ) | ||||
NACCO Industries, Cl A | (600 | ) | (32 | ) | ||||
NetFlix* | (5,570 | ) | (2,321 | ) | ||||
New Home* | (2,500 | ) | (40 | ) | ||||
New Remy Holdco* | (4,700 | ) | (104 | ) | ||||
Pep Boys-Manny Moe & Jack* | (34,200 | ) | (329 | ) | ||||
Pinnacle Entertainment* | (13,300 | ) | (480 | ) | ||||
Ralph Lauren, Cl A | (21,800 | ) | (2,867 | ) | ||||
Rentrak* | (10,800 | ) | (600 | ) | ||||
Scientific Games, Cl A* | (58,200 | ) | (609 | ) | ||||
SeaWorld Entertainment | (56,700 | ) | (1,093 | ) | ||||
Standard-Pacific* | (194,200 | ) | (1,748 | ) | ||||
Stoneridge* | (64,100 | ) | (724 | ) | ||||
Thor Industries | (7,100 | ) | (449 | ) | ||||
Town Sports International Holdings | (55,900 | ) | (381 | ) | ||||
TRI Pointe Homes* | (206,700 | ) | (3,189 | ) | ||||
| Description | Shares | Market Value ($ Thousands) | ||||||
TripAdvisor* | (7,500 | ) | $ | (624 | ) | |||
UCP, Cl A* | (4,900 | ) | (43 | ) | ||||
VOXX International, Cl A* | (29,900 | ) | (274 | ) | ||||
William Lyon Homes, Cl A* | (9,400 | ) | (243 | ) | ||||
Winnebago Industries | (14,200 | ) | (302 | ) | ||||
Wynn Resorts | (47,700 | ) | (6,005 | ) | ||||
|
| |||||||
| (66,366 | ) | |||||||
|
| |||||||
Financials — (0.7)% | ||||||||
Bancorp* | (46,600 | ) | (421 | ) | ||||
CBOE Holdings | (20,200 | ) | (1,160 | ) | ||||
Commerce Bancshares | (24,100 | ) | (1,020 | ) | ||||
eHealth* | (91,100 | ) | (855 | ) | ||||
Ezcorp, Cl A* | (41,200 | ) | (376 | ) | ||||
Ocwen Financial* | (231,500 | ) | (1,910 | ) | ||||
Regional Management* | (20,600 | ) | (304 | ) | ||||
TFS Financial | (43,700 | ) | (641 | ) | ||||
|
| |||||||
| (6,687 | ) | |||||||
|
| |||||||
Industrials — (1.4)% | ||||||||
Ameresco, Cl A* | (46,700 | ) | (346 | ) | ||||
American Science & Engineering, Cl A | (5,200 | ) | (254 | ) | ||||
Barrett Business Services | (4,500 | ) | (193 | ) | ||||
Chart Industries* | (34,100 | ) | (1,196 | ) | ||||
Copa Holdings, Cl A | (16,200 | ) | (1,636 | ) | ||||
Hub Group, Cl A* | (13,800 | ) | (542 | ) | ||||
KBR | (32,000 | ) | (463 | ) | ||||
LMI Aerospace* | (15,100 | ) | (184 | ) | ||||
Manitowoc | (4,200 | ) | (90 | ) | ||||
Powell Industries | (12,500 | ) | (422 | ) | ||||
Power Solutions International* | (8,900 | ) | (572 | ) | ||||
PowerSecure International* | (130,600 | ) | (1,719 | ) | ||||
Raven Industries | (5,600 | ) | (115 | ) | ||||
Shiloh Industries* | (3,200 | ) | (45 | ) | ||||
UTI Worldwide* | (373,700 | ) | (4,596 | ) | ||||
Wesco Aircraft Holdings* | (93,800 | ) | (1,437 | ) | ||||
|
| |||||||
| (13,810 | ) | |||||||
|
| |||||||
Information Technology — (3.5)% | ||||||||
Apple | (11,500 | ) | (1,431 | ) | ||||
Applied Micro Circuits* | (770,400 | ) | (3,929 | ) | ||||
Applied Optoelectronics* | (27,700 | ) | (385 | ) | ||||
Audience* | (27,600 | ) | (125 | ) | ||||
CalAmp* | (39,900 | ) | (646 | ) | ||||
CommScope Holding* | (50,400 | ) | (1,438 | ) | ||||
Cray* | (33,200 | ) | (932 | ) | ||||
CUI Global* | (13,300 | ) | (78 | ) | ||||
Cypress Semiconductor | — | — | ||||||
Dot Hill Systems* | (25,600 | ) | (136 | ) | ||||
Electro Scientific Industries | (36,000 | ) | (223 | ) | ||||
Entropic Communications* | (553,900 | ) | (1,640 | ) | ||||
Exar* | (38,500 | ) | (387 | ) | ||||
| SEI Institutional Managed Trust / Semi-Annual Report / March 31, 2015 | 203 |
CONSOLIDATED SCHEDULE OF INVESTMENTS (Unaudited)
Multi-Asset Inflation Managed Fund (Continued)
March 31, 2015
| Description | Shares | Market Value ($ Thousands) | ||||||
Extreme Networks* | (572,700 | ) | $ | (1,810 | ) | |||
Finisar* | (133,500 | ) | (2,849 | ) | ||||
Immersion* | (92,200 | ) | (846 | ) | ||||
Intevac* | (48,700 | ) | (299 | ) | ||||
Ixia* | (5,700 | ) | (69 | ) | ||||
JDS Uniphase* | (212,100 | ) | (2,783 | ) | ||||
Kopin* | (73,400 | ) | (258 | ) | ||||
MaxLinear, Cl A* | (15,500 | ) | (126 | ) | ||||
Maxwell Technologies* | (52,400 | ) | (422 | ) | ||||
Nanometrics* | (12,000 | ) | (202 | ) | ||||
NeoPhotonics* | (14,300 | ) | (96 | ) | ||||
Numerex, Cl A* | (4,600 | ) | (52 | ) | ||||
Procera Networks* | (243,700 | ) | (2,288 | ) | ||||
Radisys* | (35,800 | ) | (77 | ) | ||||
Silicon Graphics International* | (107,600 | ) | (935 | ) | ||||
SunEdison* | (241,800 | ) | (5,803 | ) | ||||
Ultratech* | (187,600 | ) | (3,253 | ) | ||||
Vitesse Semiconductor* | (63,200 | ) | (336 | ) | ||||
|
| |||||||
| (33,854 | ) | |||||||
|
| |||||||
Materials — (2.0)% | ||||||||
Advanced Emissions Solutions* | (64,700 | ) | (1,106 | ) | ||||
Allegheny Technologies | (7,900 | ) | (237 | ) | ||||
AM Castle* | (38,000 | ) | (139 | ) | ||||
American Vanguard, Cl B | (312,500 | ) | (3,319 | ) | ||||
Axiall | (28,600 | ) | (1,342 | ) | ||||
Carpenter Technology | (19,800 | ) | (770 | ) | ||||
Deltic Timber | (7,400 | ) | (490 | ) | ||||
Flotek Industries* | (70,000 | ) | (1,032 | ) | ||||
Freeport-McMoRan, Cl B | (14,600 | ) | (277 | ) | ||||
H.B. Fuller | (50,000 | ) | (2,143 | ) | ||||
Hecla Mining | (246,700 | ) | (735 | ) | ||||
Horsehead Holding* | (16,300 | ) | (206 | ) | ||||
Koppers Holdings | (22,400 | ) | (441 | ) | ||||
Louisiana-Pacific* | (331,100 | ) | (5,467 | ) | ||||
LSB Industries* | (6,500 | ) | (269 | ) | ||||
Olympic Steel | (5,300 | ) | (71 | ) | ||||
Platform Specialty Products* | (29,700 | ) | (762 | ) | ||||
Worthington Industries | (2,100 | ) | (56 | ) | ||||
WR Grace* | (7,400 | ) | (732 | ) | ||||
|
| |||||||
| (19,594 | ) | |||||||
|
| |||||||
Total Common Stock Sold Short (Proceeds ($147,062)) ($ Thousands) |
| $ | (140,311 | ) | ||||
|
| |||||||
A list of the open futures contracts held by the Fund at March 31, 2015, is as follows:
| Type of Contract | Number of Contracts Long (Short) | Expiration Date | Unrealized Appreciation (Depreciation) ($ Thousands) | |||||||||
Brent Crude Penultimate** | (85 | ) | Jun-2015 | $ | (173 | ) | ||||||
Brent Crude Penultimate** | 205 | Nov-2015 | (334 | ) | ||||||||
Canadian 10-Year Bond | 25 | Jun-2015 | 34 | |||||||||
Coffee ‘C’** | 125 | May-2015 | (1,264 | ) | ||||||||
Copper** | 58 | Dec-2015 | 166 | |||||||||
Copper** | 84 | May-2015 | 369 | |||||||||
Corn** | 88 | Dec-2015 | (75 | ) | ||||||||
Corn** | 649 | May-2015 | (619 | ) | ||||||||
| Type of Contract | Number of Contracts Long (Short) | Expiration Date | Unrealized Appreciation (Depreciation) ($ Thousands) | |||||||||
Cotton No. 3** | 147 | May-2015 | $ | 88 | ||||||||
Crude Oil** | 269 | May-2015 | (669 | ) | ||||||||
Crude Oil** | 22 | Nov-2015 | 4 | |||||||||
E-MINI MSCI Future | (159 | ) | Jun-2015 | (243 | ) | |||||||
Euro-Bobl | (101 | ) | Jun-2015 | (15 | ) | |||||||
Feeder Cattle** | (49 | ) | May-2015 | (227 | ) | |||||||
Gasoline ** | 52 | May-2015 | (142 | ) | ||||||||
Gold** | 172 | Jun-2015 | 406 | |||||||||
Heating Oil** | 95 | May-2015 | (401 | ) | ||||||||
Live Cattle** | 87 | Jun-2015 | 100 | |||||||||
LME Aluminum** | 222 | Jul-2015 | (41 | ) | ||||||||
LME Nickel** | 137 | May-2015 | (1,905 | ) | ||||||||
LME Zinc** | 118 | May-2015 | (30 | ) | ||||||||
Natural Gas** | 244 | Apr-2015 | (434 | ) | ||||||||
Natural Gas** | 295 | Jun-2015 | (403 | ) | ||||||||
Natural Gas** | 108 | Oct-2016 | (265 | ) | ||||||||
Natural Gas** | (123 | ) | Sep-2015 | 178 | ||||||||
Palladium** | 68 | Jun-2015 | (188 | ) | ||||||||
Platinum** | 191 | Aug-2015 | 76 | |||||||||
S&P 500 Index EMINI | (153 | ) | Jun-2015 | (144 | ) | |||||||
Silver** | 92 | May-2015 | (125 | ) | ||||||||
Soybean Meal** | 137 | May-2015 | 60 | |||||||||
Soybean Oil** | 265 | May-2015 | (134 | ) | ||||||||
Soybean** | 80 | May-2015 | (35 | ) | ||||||||
Soybean** | (185 | ) | Nov-2015 | 291 | ||||||||
Sugar #11** | 602 | Jun-2015 | (562 | ) | ||||||||
U.S. 10-Year Treasury Note | (226 | ) | Jun-2015 | (353 | ) | |||||||
U.S. 2-Year Treasury Note | (16 | ) | Jun-2015 | (13 | ) | |||||||
U.S. 5-Year Treasury Note | (59 | ) | Jun-2015 | (71 | ) | |||||||
U.S. Long Treasury Bond | (21 | ) | Jun-2015 | (73 | ) | |||||||
U.S. Ultra Long Treasury Bond | 22 | Jun-2015 | 120 | |||||||||
Wheat** | 277 | May-2015 | (156 | ) | ||||||||
|
| |||||||||||
| $ | (7,202 | ) | ||||||||||
|
| |||||||||||
For the period ended March 31, 2015, the total amount of all open futures contracts, as presented in the table above, are representative of the volume of activity for the derivative type during the period.
A list of the open forward foreign currency contracts held by the Fund at March 31, 2015, is as follows:
| Settlement Date | Currency to Deliver (Thousands) | Currency to Receive (Thousands) | Unrealized Appreciation (Depreciation) ($ Thousands) | |||||||||||||||||
4/2/15 | USD | 1,914 | BRL | 6,092 | $ | (9 | ) | |||||||||||||
4/2/15-5/3/21 | BRL | 12,183 | USD | 4,006 | 211 | |||||||||||||||
4/10/15 | CAD | 3,424 | USD | 2,718 | 15 | |||||||||||||||
4/17/15 | IDR | 12,467,410 | USD | 940 | (10 | ) | ||||||||||||||
4/23/15 | GBP | 1,682 | USD | 2,467 | (29 | ) | ||||||||||||||
4/24/15 | SGD | 1,683 | USD | 1,233 | 7 | |||||||||||||||
4/28/15 | TWD | 38,709 | USD | 1,241 | 4 | |||||||||||||||
4/30/15 | EUR | 5,703 | USD | 6,232 | 105 | |||||||||||||||
5/15/15 | AUD | 4,610 | USD | 3,522 | 10 | |||||||||||||||
4/10/15 | USD | 228 | CAD | 287 | (1 | ) | ||||||||||||||
4/17/15 | USD | 2,471 | IDR | 32,240,769 | (14 | ) | ||||||||||||||
|
| |||||||||||||||||||
| $ | 289 | |||||||||||||||||||
|
| |||||||||||||||||||
A list of the counterparties for the outstanding forward foreign currency contracts held by the Fund at March 31, 2015, is as follows:
| Counterparty | Currency to Deliver ($ Thousands) | Currency to Receive ($ Thousands) | Unrealized Appreciation ($ Thousands) | |||||||||
Brown Brothers Harriman | $ | (22,707 | ) | $ | 22,981 | $ | 274 | |||||
Goldman Sachs | (1,251 | ) | 1,251 | — | ||||||||
JPMorgan Chase Bank | (2,703 | ) | 2,718 | 15 | ||||||||
|
| |||||||||||
| $ | 289 | |||||||||||
|
| |||||||||||
For the period ended March 31, 2015, the total amount of all open forward foreign currency contracts, as presented in the table above, are representative of the volume of activity for the derivative type during the period.
| 204 | SEI Institutional Managed Trust / Semi-Annual Report / March 31, 2015 |
A list of open OTC swap agreements held by the Fund at March 31, 2015, is as follows:
| Credit Default Swaps | ||||||||||||||||
| Counterparty | Reference Entity/Obligation | Buy/Sell Protection | (Pays)/ Receives Rate | Termination Date | Notional Amount ($ Thousands) | Net Unrealized Appreciation ($ Thousands) | ||||||||||
| Bank of America | Societe Generale | SELL | 3.00 | 12/20/17 | $ | (550 | ) | $ | 24 | |||||||
| Credit Suisse | Kohl’S Corporation | SELL | 1.00 | 06/20/19 | (471 | ) | 15 | |||||||||
| Credit Suisse | Kohl’S Corporation | SELL | 1.00 | 06/20/19 | (190 | ) | 6 | |||||||||
| Credit Suisse | Kohl’S Corporation | SELL | 1.00 | 06/20/19 | (192 | ) | 6 | |||||||||
| Credit Suisse | Kohl’S Corporation | SELL | 1.00 | 06/20/19 | (276 | ) | 8 | |||||||||
| Deutsche Bank | Anadarko Petroleum Corporation | SELL | 1.00 | 09/20/17 | (500 | ) | 15 | |||||||||
|
| |||||||||||||||
| $ | 74 | |||||||||||||||
|
| |||||||||||||||
| Interest Rate Swaps | ||||||||||||||
| Counterparty | Fund Pays | Fund Receives | Termination Date | Notional Amount ($ Thousands) | Net Unrealized Depreciation ($ Thousands) | |||||||||
| JPMorgan Chase Bank | 2.83% | 3 Month USD - LIBOR | 04/12/42 | $ | 2,790 | $ | (295) | |||||||
|
| |||||||||||||
A list of open centrally cleared swap agreements held by the Fund at March 31, 2015, is as follows:
| Credit Default Swaps | ||||||||||||||||
| Counterparty | Reference Entity/Obligation | Buy/Sell Protection | (Pays)/ Receives Rate | Termination Date | Notional Amount ($ Thousands) | Net Unrealized Appreciation (Depreciation) ($ Thousands) | ||||||||||
| Morgan Stanley | CDX.NA.HY. 21 V1 | BUY | 5.00 | 12/20/18 | $ | 2,798 | $ | (158 | ) | |||||||
| Morgan Stanley | CDX.NA.IG. 22 V1 | BUY | 1.00 | 06/20/19 | 8,590 | (52 | ) | |||||||||
| Morgan Stanley | CDX.NA.IG. 23 V1 | SELL | 1.00 | 12/20/19 | (20,390 | ) | 24 | |||||||||
|
| |||||||||||||||
| $ | (186 | ) | ||||||||||||||
|
| |||||||||||||||
| Interest Rate Swaps | ||||||||||||||||
| Counterparty | Fund Pays | Fund Receives | Termination Date | Currency | Notional Amount (Thousands) (1) | Net Unrealized Appreciation (Depreciation) ($ Thousands) | ||||||||||
| Morgan Stanley | 3-Month USD - LIBOR | 3.31% | 05/06/34 | 1,510 | $ | 260 | ||||||||||
| Morgan Stanley | 2.31% | 3-Month USD - LIBOR | 03/11/25 | 2,460 | (66 | ) | ||||||||||
| Morgan Stanley | 6-Month AUD - BBR | 2.97% | 03/11/25 | AUD | 4,780 | 80 | ||||||||||
| Morgan Stanley | 3-Month USD - LIBOR | 2.69% | 09/24/24 | 3,090 | 190 | |||||||||||
| Morgan Stanley | 3-Month USD - LIBOR | 2.67% | 07/18/24 | 2,060 | 131 | |||||||||||
| Morgan Stanley | 2.67% | 3-Month USD - LIBOR | 07/10/24 | 2,570 | (167 | ) | ||||||||||
| Morgan Stanley | 2.63% | 3-Month USD - LIBOR | 07/02/24 | 4,100 | (253 | ) | ||||||||||
| Morgan Stanley | 3-Month USD - LIBOR | 2.63% | 05/29/24 | 1,990 | 128 | |||||||||||
| Morgan Stanley | 2.63% | 3-Month USD - LIBOR | 05/23/24 | 3,980 | (257 | ) | ||||||||||
| Morgan Stanley | 2.82% | 3-Month USD - LIBOR | 04/28/24 | 3,520 | (293 | ) | ||||||||||
| Morgan Stanley | 2.89% | 3-Month USD - LIBOR | 02/14/24 | 2,310 | (186 | ) | ||||||||||
| Morgan Stanley | 2.98% | 3-Month USD - LIBOR | 01/14/24 | 2,630 | (238 | ) | ||||||||||
| Morgan Stanley | 2.24% | 3-Month USD - LIBOR | 06/25/21 | 2,100 | (79 | ) | ||||||||||
| Morgan Stanley | 3-Month USD - LIBOR | 1.57% | 04/01/20 | 10,270 | (16 | ) | ||||||||||
| Morgan Stanley | 3-Month USD - LIBOR | 1.75% | 10/31/19 | 4,860 | 96 | |||||||||||
| Morgan Stanley | 3-Month USD - LIBOR | 1.70% | 07/02/19 | 1,900 | 31 | |||||||||||
| Morgan Stanley | 3-Month USD - LIBOR | 0.96% | 03/11/17 | 17,190 | 66 | |||||||||||
| Morgan Stanley | 2.14% | 3-Month AUD - BBR | 03/11/17 | AUD | 31,390 | (81 | ) | |||||||||
| Morgan Stanley | 0.97% | 3-Month CAD - CDOR | 03/10/17 | CAD | 23,700 | (32 | ) | |||||||||
| Morgan Stanley | 0.54% | 3-Month USD - LIBOR | 05/06/16 | 56,710 | (127 | ) | ||||||||||
|
| |||||||||||||||
| $ | (813 | ) | ||||||||||||||
|
| |||||||||||||||
For the period ended March 31, 2015 , the total amount of all open swap agreements, as presented in the tables above, are representative of the volume of activity for this derivative type during the period.
| SEI Institutional Managed Trust / Semi-Annual Report / March 31, 2015 | 205 |
CONSOLIDATED SCHEDULE OF INVESTMENTS (Unaudited)
Multi-Asset Inflation Managed Fund (Concluded)
March 31, 2015
Percentages are based on Net Assets of $974,268 ($Thousands).
| (1) | In U.S. Dollars unless otherwise indicated. |
| * | Non-income producing security. |
| ** | Future is held by Inflation Commodity Strategy Subsidiary, Ltd. As of March 31, 2015. |
| † | Real Estate Investment Trust. |
| @ | Rate is negative due to the decrease in the value of the foreign currency against the U.S. Dollar. |
| (A) | Securities sold within terms of a private placement memorandum, exempt from registration under Section 144A of the Securities Act of 1933, as amended, and may not be sold to dealers in that program or other “accredited investors.” These securities have been determined to be liquid under guidelines established by the Board of Trustees. |
| (B) | Security in default on interest payments. |
| (C) | Variable Rate Security — The rate reported on the Schedule of Investments is the rate in effect as of March 31, 2015. |
| (D) | Step Bonds — The rate reflected on the Schedule of Investments is the effective yield on March 31, 2015. The coupon on a step bond changes on a specified date. |
| (E) | Security, or portion thereof, is held by Inflation Commodity Strategy Subsidiary, Ltd. as of March 31, 2015. |
| (F) | The rate reported is the effective yield at the time of purchase. |
AUD — Australian Dollar
BBR — Australian Bank Bill Rate
BRL — Brazilian Real
CAD — Canadian Dollar
CDOR — Canadian Dollar Offered Rate
Cl — Class
ETF — Exchange Traded Fund
EUR — Euro
FHLMC — Federal Home Loan Mortgage Corporation
FNMA — Fannie Mae
GBP — British Pound
GMTN — Global Medium Term Note
HKD — Hong Kong Dollar
IDR — Indonesian Rupiah
JPY — Japanese Yen
LIBOR — London Interbank Offered Rate
LME — London Metal Exchange
MTN — Medium Term Note
NYMEX — New York Mercantile Exchange
RUB — Russian Ruble
SEK — Swedish Krona
Ser — Series
SGD — Singapore Dollar
THB — Thailand Baht
TWD — Taiwanese Dollar
USD — United States Dollar
The following is a summary of the inputs used as of March 31, 2015, in valuing the Fund’s investments and other financial instruments carried at value ($ Thousands):
| Investments in Securities | Level 1 | Level 2 | Level 3 | Total | ||||||||||||
Common Stock | $ | 288,110 | $ | — | $ | — | $ | 288,110 | ||||||||
Corporate Obligations | — | 75,015 | — | 75,015 | ||||||||||||
Mortgage-Backed Securities | — | 45,962 | — | 45,962 | ||||||||||||
Asset-Backed Securities | — | 42,832 | — | 42,832 | ||||||||||||
Sovereign Debt | — | 2,698 | — | 2,698 | ||||||||||||
Preferred Stock | — | 58 | — | 58 | ||||||||||||
U.S. Treasury Obligations | — | 645,369 | — | 645,369 | ||||||||||||
Time Deposits | — | 39,387 | — | 39,387 | ||||||||||||
|
|
|
|
|
|
|
| |||||||||
Total Investments in Securities | $ | 288,110 | $ | 851,321 | $ | — | $ | 1,139,431 | ||||||||
|
|
|
|
|
|
|
| |||||||||
| Securities Sold Short | Level 1 | Level 2 | Level 3 | Total | ||||||||||||
Common Stock | $ | (140,311 | ) | $ | — | $ | — | $ | (140,311 | ) | ||||||
|
|
|
|
|
|
|
| |||||||||
Total Securities Sold Short | $ | (140,311 | ) | $ | — | $ | — | $ | (140,311 | ) | ||||||
|
|
|
|
|
|
|
| |||||||||
| Other Financial Instruments | Level 1 | Level 2 | Level 3 | Total | ||||||||||||
Futures Contracts* | ||||||||||||||||
Unrealized Appreciation | $ | 1,892 | $ | — | $ | — | $ | 1,892 | ||||||||
Unrealized Depreciation | (9,094 | ) | — | — | (9,094 | ) | ||||||||||
Forwards* | ||||||||||||||||
Unrealized Appreciation | — | 352 | — | 352 | ||||||||||||
Unrealized Depreciation | — | (63 | ) | — | (63 | ) | ||||||||||
OTC Swaps* | ||||||||||||||||
Credit Default Swaps | ||||||||||||||||
Unrealized Appreciation | — | 74 | — | 74 | ||||||||||||
Interest Rate Swaps | ||||||||||||||||
Unrealized Depreciation | — | (295 | ) | — | (295 | ) | ||||||||||
Centrally Cleared Swaps* | ||||||||||||||||
Credit Default Swaps | ||||||||||||||||
Unrealized Appreciation | — | 24 | — | 24 | ||||||||||||
Unrealized Depreciation | — | (210 | ) | — | (210 | ) | ||||||||||
Interest Rate Swaps | ||||||||||||||||
Unrealized Appreciation | — | 982 | — | 982 | ||||||||||||
Unrealized Depreciation | — | (1,795 | ) | — | (1,795 | ) | ||||||||||
Reverse Repurchase Agreements** | (166,358 | ) | — | — | (166,358 | ) | ||||||||||
|
|
|
|
|
|
|
| |||||||||
Total Other Financial Instruments | $ | (173,560 | ) | $ | (931 | ) | $ | — | $ | (174,491 | ) | |||||
|
|
|
|
|
|
|
| |||||||||
| * | Futures contracts, forwards contracts and swaps are valued at the unrealized appreciation (depreciation) on the instrument. |
| ** | See Note 2 for more information on the reverse repurchase agreements. |
For the period ended March 31, 2015, there have been no transfers between Level 1 and Level 2 assets and liabilities.
For the period ended March 31, 2015, there have been no transfers between Level 2 and Level 3 assets and liabilities.
For more information on valuation inputs, see Note 2 — Significant Accounting Policies in Notes to Financial Statements.
Amounts designated as “—” are $0 or rounded to $0.
The accompanying notes are an integral part of the financial statements.
| 206 | SEI Institutional Managed Trust / Semi-Annual Report / March 31, 2015 |
SCHEDULE OF INVESTMENTS (Unaudited)
Multi-Asset Capital Stability Fund
March 31, 2015
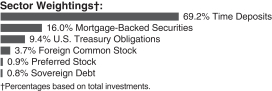
| Description | Face Amount ($ Thousands) | Market Value ($ Thousands) | ||||||
MORTGAGE-BACKED SECURITIES — 15.7% |
| |||||||
Agency Mortgage-Backed Obligations — 15.7% |
| |||||||
FHLMC | ||||||||
2.500%, 05/27/16 | $ | 44,484 | $ | 45,544 | ||||
FNMA | ||||||||
5.250%, 09/15/16 | 41,873 | 44,753 | ||||||
|
| |||||||
Total Mortgage-Backed Securities | 90,297 | |||||||
|
| |||||||
U.S. TREASURY OBLIGATIONS — 9.2% |
| |||||||
U.S. Treasury Bonds | ||||||||
3.625%, 08/15/43 | 8,060 | 9,850 | ||||||
U.S. Treasury Inflation Protected Securities | ||||||||
3.875%, 04/15/29 | 723 | 1,062 | ||||||
3.625%, 04/15/28 | 595 | 840 | ||||||
3.375%, 04/15/32 | 275 | 403 | ||||||
2.625%, 07/15/17 | 615 | 667 | ||||||
2.500%, 07/15/16 to 01/15/29 | 1,568 | 1,801 | ||||||
2.375%, 01/15/17 to 01/15/27 | 2,397 | 2,836 | ||||||
2.125%, 01/15/19 to 02/15/41 | 1,483 | 1,837 | ||||||
2.000%, 01/15/26 | 877 | 1,039 | ||||||
1.875%, 07/15/19 | 725 | 800 | ||||||
1.750%, 01/15/28 | 703 | 823 | ||||||
1.625%, 01/15/18 | 649 | 691 | ||||||
1.375%, 07/15/18 to 02/15/44 | 2,421 | 2,695 | ||||||
1.250%, 07/15/20 | 1,353 | 1,466 | ||||||
1.125%, 01/15/21 | 1,548 | 1,662 | ||||||
0.750%, 02/15/42 to 02/15/45 | 1,225 | 1,241 | ||||||
0.625%, 07/15/21 to 02/15/43 | 4,121 | 4,265 | ||||||
0.375%, 07/15/23 | 1,866 | 1,913 | ||||||
0.250%, 01/15/25 to 01/15/25 | 1,059 | 1,072 | ||||||
0.125%, 04/15/16 to 07/15/24 | 15,791 | 15,975 | ||||||
|
| |||||||
Total U.S. Treasury Obligations |
| 52,938 | ||||||
|
| |||||||
| Description | Shares | Market Value ($ Thousands) | ||||||||
FOREIGN COMMON STOCK — 3.7% |
| |||||||||
Anhui Gujing Distillery, Cl B | 138,066 | $ | 441 | |||||||
Bengang Steel Plates, Cl B | 1,308,375 | 521 | ||||||||
Changchai, Cl B | 168,892 | 113 | ||||||||
China Fangda Group, Cl B | 893,798 | 552 | ||||||||
China Merchants Property Development, Cl B | 98,167 | 290 | ||||||||
China National Accord Medicines, Cl B | 12,493 | 65 | ||||||||
CSG Holding | 427,502 | 337 | ||||||||
Dalian Refrigeration, Cl B | 128,293 | 123 | ||||||||
Danhua Chemical Technology, Cl B* | 659,301 | 381 | ||||||||
Dazhong Transportation Group, Cl B | 683,101 | 627 | ||||||||
Dongxu Optoelectronic Technology, Cl B* | 342,360 | 298 | ||||||||
Double Coin Holdings, Cl B | 440,858 | 436 | ||||||||
Eastern Communications, Cl B | 794,603 | 522 | ||||||||
Fiyta Holdings, Cl B | 132,810 | 134 | ||||||||
Foshan Electrical and Lighting, Cl B | 553,874 | 557 | ||||||||
Greattown Holdings, Cl B* | 733,680 | 498 | ||||||||
Guangdong Electric Power Development, Cl B | 436,301 | 335 | ||||||||
Guangdong Provincial Expressway Development* | 931,689 | 435 | ||||||||
Huadian Energy, Cl B* | 444,200 | 210 | ||||||||
Huangshan Tourism Development, Cl B | 360,432 | 622 | ||||||||
Hubei Sanonda, Cl B | 43,006 | 52 | ||||||||
Hunan Tyen Machinery, Cl B* | 861,082 | 437 | ||||||||
INESA Electron, Cl B* | 265,209 | 167 | ||||||||
Jiangling Motors, Cl B | 9,805 | 47 | ||||||||
Jinshan Development & Construction, Cl B* | 341,107 | 232 | ||||||||
Konka Group, Cl B | 463,900 | 268 | ||||||||
Lao Feng Xiang, Cl B | 135,210 | 466 | ||||||||
Petroleo Brasileiro ADR, Cl A | 53,760 | 323 | ||||||||
Shandong Chenming Paper Holdings, Cl B | 944,591 | 569 | ||||||||
Shang Gong Group, Cl B* | 813,305 | 630 | ||||||||
Shanghai Baosight Software, Cl B | 82,402 | 311 | ||||||||
Shanghai Chlor-Alkali Chemical, Cl B | 923,881 | 527 | ||||||||
Shanghai Diesel Engine, Cl B | 654,220 | 516 | ||||||||
Shanghai Dingli Technology Development Group, Cl B | 415,993 | 427 | ||||||||
Shanghai Greencourt Investment Group, Cl B* | 1,148,197 | 510 | ||||||||
Shanghai Haixin Group, Cl B* | 982,233 | 687 | ||||||||
Shanghai Highly Group, Cl B | 563,126 | 368 | ||||||||
| SEI Institutional Managed Trust / Semi-Annual Report / March 31, 2015 | 207 |
SCHEDULE OF INVESTMENTS (Unaudited)
Multi-Asset Capital Stability Fund (Continued)
March 31, 2015
| Description | Shares/Face Amount (1) (Thousands) | Market Value ($ Thousands) | ||||||||||
Shanghai Jinjiang International Hotels Development | 302,608 | $ | 629 | |||||||||
Shanghai Jinjiang International Industrial Development, Cl B | 168,628 | 227 | ||||||||||
Shanghai Kaikai Industrial, Cl B | 551,914 | 550 | ||||||||||
Shanghai Lujiazui Finance & Trade Zone Development, Cl B | 238,315 | 570 | ||||||||||
Shanghai Material Trading, Cl B* | 558,930 | 367 | ||||||||||
Shanghai Outer Gaoqiao, Cl B | 201,502 | 414 | ||||||||||
Shanghai Potevio, Cl B* | 592,556 | 570 | ||||||||||
Shanxi Guoxin Energy, Cl B* | 186,458 | 486 | ||||||||||
Shenzhen Properties & Resources Development Group, Cl B | 46,900 | 42 | ||||||||||
Shenzhen SEG, Cl B* | 810,155 | 504 | ||||||||||
Shenzhen Textile Holdings, Cl B* | 61,654 | 55 | ||||||||||
Tianjin Marine Shipping, Cl B* | 1,569,496 | 846 | ||||||||||
Weifu High-Technology Group, Cl B | 46,268 | 193 | ||||||||||
Wuxi Little Swan, Cl B | 66,093 | 128 | ||||||||||
Yantai Changyu Pioneer Wine, Cl B | 174,747 | 624 | ||||||||||
Zhonglu, Cl B | 412,483 | 721 | ||||||||||
|
| |||||||||||
Total Foreign Common Stock |
| 20,960 | ||||||||||
|
| |||||||||||
PREFERRED STOCK† — 0.9% |
| |||||||||||
Apartment Investment & Management , 6.875% | 51,000 | 1,365 | ||||||||||
Hersha Hospitality Trust, 6.875% | 49,075 | 1,240 | ||||||||||
Pebblebrook Hotel Trust, 6.500% | 54,050 | 1,365 | ||||||||||
Sabra Health Care, 7.125% | 43,875 | 1,167 | ||||||||||
|
| |||||||||||
Total Preferred Stock |
| 5,137 | ||||||||||
|
| |||||||||||
SOVEREIGN DEBT — 0.8% |
| |||||||||||
Canadian Government Bond | ||||||||||||
1.500%, 06/01/23 | CAD | 5,435 | 4,409 | |||||||||
|
| |||||||||||
Total Sovereign Debt | 4,409 | |||||||||||
|
| |||||||||||
TIME DEPOSITS — 68.1% |
| |||||||||||
Brown Brothers Harriman | ||||||||||||
0.100%, 04/01/15 | CAD | 51 | 40 | |||||||||
0.074%, 04/01/15 | GBP | 22 | 32 | |||||||||
0.030%, 04/01/15 | 390,332 | 390,332 | ||||||||||
| Description | Face Amount (1) (Thousands) | Market Value ($ Thousands) | ||||||||||
0.005%, 04/01/15 | HKD | 26,630 | $ | 247 | ||||||||
(0.198)%, 04/01/15@ | EUR | 422 | 454 | |||||||||
|
| |||||||||||
Total Time Deposits |
| 391,105 | ||||||||||
|
| |||||||||||
Total Investments — 98.4% |
| $ | 564,846 | |||||||||
|
| |||||||||||
A list of the open futures contracts held by the Fund at March 31, 2015, is as follows:
| Type of Contract | Number of Contracts Long (Short) | Expiration Date | Unrealized Appreciation (Depreciation) ($ Thousands) | |||||||||
Dax Index | 19 | Jun-2015 | $ | (107 | ) | |||||||
DJ Euro Stoxx 50 Index | 37 | Jun-2015 | 8 | |||||||||
E-MINI MSCI Future | 498 | Jun-2015 | 458 | |||||||||
FTSE China A50 Index | (461 | ) | Apr-2015 | (188 | ) | |||||||
Nikkei 225 Index | 28 | Jun-2015 | 32 | |||||||||
S&P 500 Index EMINI | 545 | Jun-2015 | (83 | ) | ||||||||
S&P TSE 60 Index | 36 | Jun-2015 | 59 | |||||||||
Topix Index | 11 | Jun-2015 | 15 | |||||||||
U.S. 10-Year Treasury Note | 280 | Jun-2015 | 419 | |||||||||
U.S. Ultra Long Treasury Bond | 218 | Jun-2015 | 298 | |||||||||
|
| |||||||||||
| $ | 911 | |||||||||||
|
| |||||||||||
For the period ended March 31, 2015, the total amount of all open futures contracts, as presented in the table above, are representative of the volume of activity for the derivative type during the period.
A list of the open forward foreign currency contracts held by the Fund at March 31, 2015, is as follows:
| Settlement | Currency to Deliver (Thousands) | Currency to Receive (Thousands) | Unrealized Appreciation (Depreciation) ($ Thousands) | |||||||||||||||||
6/18/15 | CAD | 6,952 | USD | 5,493 | $ | 8 | ||||||||||||||
6/18/15 | EUR | 1,116 | USD | 1,201 | 2 | |||||||||||||||
6/18/15 | JPY | 9,416 | USD | 78 | (1 | ) | ||||||||||||||
6/18/15 | USD | 6,457 | CAD | 8,129 | (45 | ) | ||||||||||||||
6/18/15 | USD | 1,221 | EUR | 1,116 | (21 | ) | ||||||||||||||
|
| |||||||||||||||||||
| $ | (57 | ) | ||||||||||||||||||
|
| |||||||||||||||||||
A list of the counterparties for the outstanding forward foreign currency contracts held by the Fund at March 31, 2015, is as follows:
| Counterparty | Currency to Deliver ($ Thousands) | Currency to Receive ($ Thousands) | Unrealized Appreciation (Depreciation) ($ Thousands) | |||||||||
Brown Brothers Harriman | $ | (1,778 | ) | $ | 1,782 | $ | 4 | |||||
Deutsche Bank | (2,217 | ) | 2,183 | (34 | ) | |||||||
Goldman Sachs | (604 | ) | 600 | (4 | ) | |||||||
HSBC | (6,252 | ) | 6,257 | 5 | ||||||||
JPMorgan Chase Bank | (1,349 | ) | 1,332 | (17 | ) | |||||||
Nomura Securities Internation | (1,706 | ) | 1,701 | (5 | ) | |||||||
Royal Bank of Scotland | (535 | ) | 529 | (6 | ) | |||||||
|
| |||||||||||
| $ | (57 | ) | ||||||||||
|
| |||||||||||
For the period ended March 31, 2015, the total amount of all open forward foreign currency contracts, as presented in the table above, are representative of the volume of activity for the derivative type during the period.
| 208 | SEI Institutional Managed Trust / Semi-Annual Report / March 31, 2015 |
A list of open OTC swap agreements held by the Fund at March 31, 2015, is as follows:
| Credit Default Swaps | ||||||||||||||||||
| Counterparty | Reference Entity/Obligation | Buy/Sell Protection | (Pays)/ Receives Rate | Termination Date | Currency | Notional Amount (Thousands) (1) | Net Unrealized Appreciation (Depreciation) ($ Thousands) | |||||||||||
| Deutsche Bank | CM BX.NA .BB .6 Index | SELL | 5.00 | 05/11/63 | USD | (1,410 | ) | $ | 14 | |||||||||
| Morgan Stanley | ITRAXX-JAPAN 21.V1Index | BUY | 1.00 | 06/20/19 | JPY | 1,470,100 | (108 | ) | ||||||||||
|
| |||||||||||||||||
| $ | (94 | ) | ||||||||||||||||
|
| |||||||||||||||||
| Interest Rate Swaps | ||||||||||||||||
| Counterparty | Fund Pays | Fund Receives | Termination Date | Currency | Notional Amount (Thousands) (1) | Net Unrealized Appreciation (Depreciation) ($ Thousands) | ||||||||||
Morgan Stanley | 5.86% | 28-DAY MXN - TIIE | 02/11/25 | MXP | 212,145 | $ | (180 | ) | ||||||||
Morgan Stanley | 12.46% | 1-Year - BRL-CDI | 01/04/21 | BRL | 12,260 | 94 | ||||||||||
Morgan Stanley | 28-DAY MXN - TIIE | 4.20% | 02/21/17 | MXP | 848,180 | 13 | ||||||||||
Morgan Stanley | 1-Year - BRL-CDI | 13.06% | 01/02/17 | BRL | 38,823 | (62 | ) | |||||||||
| Morgan Stanley | 28-DAY MXP - TIIE | 6.08% | 02/20/25 | MXP | 85,660 | 36 | ||||||||||
| Morgan Stanley | 4.28% | 28-DAY MXN - TIIE | 03/02/17 | MXP | 341,540 | (36 | ) | |||||||||
|
| |||||||||||||||
| $ | (135 | ) | ||||||||||||||
|
| |||||||||||||||
A list of open centrally cleared swap agreements held by the Fund at March 31, 2015, is as follows:
| Credit Default Swaps | ||||||||||||||||
| Counterparty | Reference Entity/Obligation | Buy/Sell Protection | (Pays)/ Receives Rate | Termination Date | Notional Amount (Thousands) | Net Unrealized Appreciation (Depreciation) ($ Thousands) | ||||||||||
| Morgan Stanley | CDX.NA.HY.23.V3 Index | SELL | 1.00 | 12/20/19 | (6,782 | ) | $ | 33 | ||||||||
| Morgan Stanley | CDX.NA.HY.23.V3 Index | SELL | 5.00 | 12/20/19 | (1,499 | ) | 1 | |||||||||
| Morgan Stanley | CDX.NA.IG.23.V1Index | SELL | 1.00 | 12/20/19 | (220 | ) | — | |||||||||
| Morgan Stanley | CDX.NA.IG.23.V1Index | SELL | 1.00 | 12/20/19 | (4,995 | ) | (9 | ) | ||||||||
| Morgan Stanley | CDX.NA.IG.23.V1Index | SELL | 1.00 | 12/20/19 | (4,995 | ) | (9 | ) | ||||||||
| Morgan Stanley | CDX.NA.IG.23.V1Index | SELL | 1.00 | 12/20/19 | (1,540 | ) | (1 | ) | ||||||||
|
| |||||||||||||||
| $ | 15 | |||||||||||||||
|
| |||||||||||||||
| Interest Rate Swaps | ||||||||||||||||
| Counterparty | Fund Pays | Fund Receives | Termination Date | Currency | Notional Amount (Thousands) (1) | Net Unrealized Appreciation (Depreciation) ($ Thousands) | ||||||||||
| Morgan Stanley | 6-Month EUR - IBOR | 0.88% | 03/30/45 | EUR | 5,870 | $ | 133 | |||||||||
| Morgan Stanley | 6-Month JPY - LIBOR | 1.44% | 03/13/45 | JPY | 882,290 | (183 | ) | |||||||||
| Morgan Stanley | 1.21% | 6-Month JPY - LIBOR | 03/13/35 | JPY | 1,368,490 | 177 | ||||||||||
| Morgan Stanley | 6-Month AUD - BBR | 2.94% | 03/26/30 | AUD | 1,110 | — | ||||||||||
| Morgan Stanley | 6-Month AUD - BBR | 2.98% | 03/23/30 | AUD | 3,520 | 16 | ||||||||||
| Morgan Stanley | 6-Month AUD - BBR | 3.16% | 03/12/30 | AUD | 18,220 | 400 | ||||||||||
| Morgan Stanley | 0.59% | 6-Month EUR - LIBOR | 03/30/25 | EUR | 15,990 | (56 | ) | |||||||||
| Morgan Stanley | 3-Month CAD - CDOR | 1.75% | 03/25/25 | CAD | 2,820 | (16 | ) | |||||||||
| Morgan Stanley | 3-Month CAD - LIBOR | 1.79% | 03/19/25 | CAD | 5,470 | (16 | ) | |||||||||
| Morgan Stanley | 3-Month USD - LIBOR | 2.78% | 03/13/25 | USD | 2,085 | 18 | ||||||||||
| Morgan Stanley | 0.94% | 6-Month EUR - IBOR | 03/13/25 | EUR | 4,265 | (16 | ) | |||||||||
| Morgan Stanley | 3-Month CAD - CDOR | 1.94% | 03/12/25 | CAD | 1,270 | 11 | ||||||||||
| Morgan Stanley | 3-Month USD - LIBOR | 2.95% | 03/10/25 | USD | 1,880 | 30 | ||||||||||
| Morgan Stanley | 1.24% | 6-Month EUR - LIBOR | 03/10/25 | EUR | 1,730 | (34 | ) | |||||||||
| Morgan Stanley | 3-Month CAD - LIBOR | 1.77% | 02/25/25 | CAD | 9,940 | (36 | ) | |||||||||
| Morgan Stanley | 3-Month CAD - LIBOR | 1.87% | 02/11/25 | CAD | 1,580 | 7 | ||||||||||
| Morgan Stanley | 3-Month CAD - LIBOR | 1.72% | 02/04/25 | CAD | 2,860 | (18 | ) | |||||||||
| Morgan Stanley | 3-Month CAD - LIBOR | 1.86% | 01/26/25 | CAD | 2,810 | 11 | ||||||||||
| Morgan Stanley | 3-Month CAD - LIBOR | 2.19% | 01/05/25 | CAD | 820 | 25 | ||||||||||
| Morgan Stanley | 3-Month CAD - CDOR | 2.41% | 12/04/24 | CAD | 1,850 | 92 | ||||||||||
| Morgan Stanley | 3-Month CAD - LIBOR | 2.45% | 11/24/24 | CAD | 2,420 | 130 | ||||||||||
| Morgan Stanley | 3-Month USD - LIBOR | 3.63% | 09/17/24 | USD | 13,500 | 649 | ||||||||||
| Morgan Stanley | 6-Month GBP - LIBOR | 2.22% | 09/17/24 | EUR | 10,400 | (728 | ) | |||||||||
| Morgan Stanley | 1.97% | 6-Month EUR - LIBOR | 08/19/24 | EUR | 9,900 | (685 | ) | |||||||||
| Morgan Stanley | 3-Month USD - LIBOR | 3.51% | 08/19/24 | USD | 13,300 | 578 | ||||||||||
| Morgan Stanley | 6-Month JPY - LIBOR | 0.26% | 03/13/20 | JPY | 546,240 | 3 | ||||||||||
| Morgan Stanley | 3-Month NZD - BKBM | 3.53% | 03/27/17 | NZD | 15,040 | 4 | ||||||||||
| SEI Institutional Managed Trust / Semi-Annual Report / March 31, 2015 | 209 |
SCHEDULE OF INVESTMENTS (Unaudited)
Multi-Asset Capital Stability Fund (Concluded)
March 31, 2015
| Interest Rate Swaps | ||||||||||||||||
| Counterparty | Fund Pays | Fund Receives | Termination Date | Currency | Notional Amount (Thousands) (1) | Net Unrealized Appreciation (Depreciation) ($ Thousands) | ||||||||||
| Morgan Stanley | 3-Month NZD - BKBM | 3.55% | 03/24/17 | NZD | 49,940 | $ | 27 | |||||||||
| Morgan Stanley | 3-Month NZD - BKBM | 3.58% | 03/17/17 | NZD | 10,750 | 11 | ||||||||||
| Morgan Stanley | 3-Month NZD - BKBM | 3.57% | 03/02/17 | NZD | 15,780 | 12 | ||||||||||
| Morgan Stanley | 3-Month NZD - BKBM | 3.58% | 02/26/17 | NZD | 195,000 | 186 | ||||||||||
| Morgan Stanley | 3-Month NZD - BKBM | 3.61% | 02/20/17 | NZD | 17,140 | 24 | ||||||||||
|
| |||||||||||||||
| $ | 756 | |||||||||||||||
|
| |||||||||||||||
For the period ended March 31, 2015 , the total amount of all open swap agreements, as presented in the tables above, are representative of the volume of activity for this derivative type during the period.
Percentages are based on Net Assets of $574,129 ($Thousands).
| (1) | In U.S. Dollars unless otherwise indicated. |
| † | Real Estate Investment Trust. |
| * | Non-income producing security. |
| @ | Rate is negative due to the decrease in the value of the foreign currency against the U.S. Dollar. |
AUD — Australian Dollar
BKBM — Bank Bill Reference Rate
BRL — Brazilian Real
CAD — Canadian Dollar
CDOR — Canadian Dollar Offered Rate
Cl — Class
DJ — Dow Jones
EUR — Euro
FHLMC — Federal Home Loan Mortgage Corporation
FNMA — Federal National Mortgage Association
FTSE — Financial Times and London Stock Exchange
GBP — British Pound
iTRAXX — Credit Derivatives Index – Europe, Australia, Japan and non-Japan Asia
HKD — Hong Kong Dollar
JPY — Japanese Yen
LIBOR — London Interbank Offered Rate
MSCI — Morgan Stanley Capital International
MXP — Mexican Peso
NZD — New Zealand Dollar
S&P — Standard & Poor’s
TIIE — Equilibrium Interbank Interest Rate
Topix — Tokyo Stock Price Index
TSE — Tokyo Stock Exchange
USD — U.S. Dollar
The following is a summary of the inputs used as of March 31, 2015, in valuing the Fund’s investments carried at value ($ Thousands):
| Investments in Securities | Level 1 | Level 2 | Level 3 | Total | ||||||||||||
Mortgage-Backed Securities | $ | — | $ | 90,297 | $ | — | $ | 90,297 | ||||||||
U.S. Treasury Obligations | — | 52,938 | — | 52,938 | ||||||||||||
Foreign Common Stock | 20,439 | 521 | — | 20,960 | ||||||||||||
Preferred Stock | — | 5,137 | — | 5,137 | ||||||||||||
Sovereign Debt | — | 4,409 | — | 4,409 | ||||||||||||
Time Deposits | — | 391,105 | — | 391,105 | ||||||||||||
|
|
|
|
|
|
|
| |||||||||
Total Investments in Securities | $ | 20,439 | $ | 544,407 | $ | — | $ | 564,846 | ||||||||
|
|
|
|
|
|
|
| |||||||||
| Other Financial Instruments | Level 1 | Level 2 | Level 3 | Total | ||||||||||||
Futures Contracts* | ||||||||||||||||
Unrealized Appreciation | $ | 1,289 | $ | — | $ | — | $ | 1,289 | ||||||||
Unrealized Depreciation | (378 | ) | — | — | (378 | ) | ||||||||||
Forwards* | ||||||||||||||||
Unrealized Appreciation | — | 10 | — | 10 | ||||||||||||
Unrealized Depreciation | — | (67 | ) | — | (67 | ) | ||||||||||
OTC Swaps* | ||||||||||||||||
Credit Default Swaps | ||||||||||||||||
Unrealized Appreciation | — | 14 | — | 14 | ||||||||||||
Unrealized Depreciation | — | (108 | ) | — | (108 | ) | ||||||||||
Interest Rate Swaps | ||||||||||||||||
Unrealized Appreciation | — | 143 | — | 143 | ||||||||||||
Unrealized Depreciation | — | (278 | ) | — | (278 | ) | ||||||||||
Centrally Cleared Swaps* | ||||||||||||||||
Credit Default Swaps | ||||||||||||||||
Unrealized Appreciation | — | 34 | — | 34 | ||||||||||||
Unrealized Depreciation | — | (19 | ) | — | (19 | ) | ||||||||||
Interest Rate Swaps | ||||||||||||||||
Unrealized Appreciation | — | 2,544 | — | 2,544 | ||||||||||||
Unrealized Depreciation | — | (1,788 | ) | — | (1,788 | ) | ||||||||||
|
|
|
|
|
|
|
| |||||||||
Total Other Financial Instruments | $ | 911 | $ | 485 | $ | — | $ | 1,396 | ||||||||
|
|
|
|
|
|
|
| |||||||||
| * | Futures contracts, forwards contracts and swaps are valued at the unrealized appreciation (depreciation) on the instrument. |
For the period ended March 31, 2015, there have been no transfers between Level 1 and Level 2 assets and liabilities.
For the period ended March 31, 2015, there have been no transfers between Level 2 and Level 3 assets and liabilities.
For more information on valuation inputs, see Note 2 — Significant Accounting Policies in Notes to Financial Statements.
Amounts designated as “—” are $0 or rounded to $0.
The accompanying notes are an integral part of the financial statements.
| 210 | SEI Institutional Managed Trust / Semi-Annual Report / March 31, 2015 |
SCHEDULE OF INVESTMENTS (Unaudited)
Long/Short Alternative Fund
March 31, 2015

| Description | Shares | Market Value ($ Thousands) | ||||||||
EXCHANGE TRADED FUND — 0.0% |
| |||||||||
iShares iBoxx USD High Yield Corporate Bond ETF | 134 | $ | 12 | |||||||
|
| |||||||||
Total Exchange Traded Fund |
| 12 | ||||||||
|
| |||||||||
Total Investments — 0.0% |
| $ | 12 | |||||||
|
| |||||||||
A list of the open futures contracts held by the Fund at March 31, 2015, is as follows:
| Type of Contract | Number of Contracts Long/ (Short) | Expiration Date | Unrealized Appreciation (Depreciation) ($ Thousands) | |||||||||
Dollar Index | 39 | Jun-2015 | $ | (21 | ) | |||||||
MSCI EAFE E-MINI Index | (82 | ) | Jun-2015 | (161 | ) | |||||||
MSCI EAFE E-MINI Index | 28 | Jun-2015 | 60 | |||||||||
NASDAQ 100 E-MINI | 24 | Jun-2015 | 13 | |||||||||
S&P Mid 400 Index E-MINI | 48 | Jun-2015 | 200 | |||||||||
U.S. Long Treasury Bond | 17 | Jun-2015 | 66 | |||||||||
|
| |||||||||||
| $ | 157 | |||||||||||
|
| |||||||||||
For the period ended March 31, 2015, the total amount of all open futures contracts, as presented in the table above, are representative of the volume of activity for this derivative type during the period.
Percentages are based on Net Assets of $37,069 ($Thousands).
ETF — Exchange Traded Fund
The following is a summary of the inputs used as of March 31, 2015, in valuing the Fund’s investments carried at value ($ Thousands):
| Investments in Securities | Level 1 | Level 2 | Level 3 | Total | ||||||||||||
Exchange Traded Fund | 12 | — | — | 12 | ||||||||||||
|
|
|
|
|
|
|
| |||||||||
Total Investments in Securities | $ | 12 | $ | — | $ | — | $ | 12 | ||||||||
|
|
|
|
|
|
|
| |||||||||
| Other Financial Instruments | Level 1 | Level 2 | Level 3 | Total | ||||||||||||
Futures Contracts* | ||||||||||||||||
Unrealized Appreciation | $ | 339 | $ | — | $ | — | $ | 339 | ||||||||
Unrealized Depreciation | (182 | ) | — | — | (182 | ) | ||||||||||
|
|
|
|
|
|
|
| |||||||||
Total Other Financial Instruments | $ | 157 | $ | — | $ | — | $ | 157 | ||||||||
|
|
|
|
|
|
|
| |||||||||
| * | Futures contracts are valued at the unrealized appreciation (depreciation) on the instrument. |
For the period ended March 31, 2015, there were no transfers between Level 1 and Level 2 assets and liabilities.
For the period ended March 31, 2015, there were no transfers between Level 2 and Level 3 assets and liabilities.
For more information on valuation inputs, see Note 2 — Significant Accounting Policies in Notes to Financial Statements.
Amounts designated as “—” are $0 or have been rounded to $0.
The accompanying notes are an integral part of the financial statements.
| SEI Institutional Managed Trust / Semi-Annual Report / March 31, 2015 | 211 |
Statements of Assets and Liabilities ($ Thousands)
March 31, 2015 (Unaudited)
| Large Cap Fund | Large Cap Value Fund | Large Cap Growth Fund | ||||||||||
ASSETS: | ||||||||||||
Investments, at value† | $2,683,201 | * | $1,465,257 | * | $1,585,868 | * | ||||||
Affiliated investment, at value†† | 156,531 | 114,641 | 52,982 | |||||||||
Cash | 132 | 7 | — | |||||||||
Receivable for investment securities sold | 16,356 | 3,600 | 7,566 | |||||||||
Receivable for fund shares sold | 2,824 | 444 | 485 | |||||||||
Dividends and interest receivable | 2,274 | 2,686 | 861 | |||||||||
Prepaid Expenses | 47 | — | — | |||||||||
Total Assets | 2,861,365 | 1,586,635 | 1,647,762 | |||||||||
LIABILITIES: | ||||||||||||
Payable upon return on securities loaned | 27,907 | 55,747 | 24,315 | |||||||||
Payable for investment securities purchased | 11,688 | 3,827 | 5,780 | |||||||||
Payable for fund shares redeemed | 1,892 | 2,725 | 2,822 | |||||||||
Payable to custodian | — | — | — | |||||||||
Payable for variation margin | 430 | 66 | 163 | |||||||||
Administration fees payable | — | 390 | 345 | |||||||||
Investment advisory fees payable | 762 | 418 | 509 | |||||||||
Shareholder servicing fees payable Class A | 548 | 323 | 343 | |||||||||
Shareholder servicing fees payable Class E | — | — | — | |||||||||
Shareholder servicing fees payable Class I | — | 2 | 1 | |||||||||
Chief Compliance Officer fees payable | 3 | 1 | 2 | |||||||||
Administration servicing fees payable Class I | 716 | — | 1 | |||||||||
Accrued expense payable | 43 | 3 | 2 | |||||||||
Total Liabilites | 43,989 | 63,502 | 34,283 | |||||||||
Net Assets | $2,817,376 | $1,523,133 | $1,613,479 | |||||||||
† Cost of investments | 2,061,280 | 1,177,988 | 1,185,841 | |||||||||
†† Cost of affiliated investments | 156,531 | 114,641 | 52,982 | |||||||||
* Includes market value of securities on loan | 26,772 | 53,753 | 23,659 | |||||||||
NET ASSETS: | ||||||||||||
Paid-in-Capital — (unlimited authorization — no par value) | $2,093,529 | $1,185,651 | $1,131,026 | |||||||||
Undistributed (distributions in excess of) net investment income | 6,783 | 9,386 | 3,977 | |||||||||
Accumulated net realized gain (loss) on investments, securities sold short, option contracts, futures, swap contracts, swaptions and foreign currency | 94,343 | 40,705 | 78,067 | |||||||||
Net unrealized appreciation on investments, securities sold short, and affiliated investments | 621,921 | 287,269 | 400,027 | |||||||||
Net unrealized appreciation (depreciation) on futures contracts | 800 | 122 | 382 | |||||||||
Net unrealized depreciation on forward foreign currency contracts, foreign currencies and translation of other assets and liabilities denominated in foreign currencies | — | — | — | |||||||||
Net Assets | $2,817,376 | $1,523,133 | $1,613,479 | |||||||||
Net Asset Value, Offering and Redemption Price Per Share — Class A | $14.91 | $25.20 | $34.72 | |||||||||
| | ($2,587,816,830 ÷ 173,568,570 shares | ) | | ($1,514,764,618 ÷ 60,098,616 shares | ) | | ($1,607,358,531 ÷ 46,295,068 shares | ) | ||||
Net Asset Value, Offering and Redemption Price Per Share — Class E | N/A | N/A | N/A | |||||||||
Net Asset Value, Offering and Redemption Price Per Share — Class I | N/A | $25.20 | $34.22 | |||||||||
| | ($8,368,494 ÷ 332,101 shares | ) | | ($6,120,159 ÷ 178,858 shares | ) | |||||||
Net Asset Value, Offering and Redemption Price Per Share — Class Y | $14.92 | N/A | N/A | |||||||||
| | ($229,558,548 ÷ 15,390,971 shares | ) | ||||||||||
Amounts designated as “—” are $0 or have been rounded to $0.
N/A — Not Applicable. Share class currently not offered.
| ^ | As of March 31, 2015, the components of net assets include a permanent book/tax difference adjustment relating to a capital reclassification. The adjustment increased Paid-in-Capital and decreased Accumulated net realized gain (loss) on investments by $1,379,936. |
The accompanying notes are an integral part of the financial statements.
| 212 | SEI Institutional Managed Trust / Semi-Annual Report / March 31, 2015 |
| Tax-Managed Large Cap Fund | S&P 500 Index Fund | Small Cap Fund | Small Cap Value Fund | Small Cap Growth Fund | Tax-Managed Small/Mid Cap Fund | Mid-Cap Fund | ||||||||||||||||||||
| $3,152,054 | * | $690,604 | * | $543,175 | * | $380,416 | * | $359,882 | * | $624,455 | * | $83,995 | * | |||||||||||||
| 244,050 | 16,274 | 69,298 | 37,881 | 53,196 | 91,427 | 1,477 | ||||||||||||||||||||
| 127 | 8 | 429 | — | — | 22 | 3 | ||||||||||||||||||||
| 39,328 | 6,567 | 12,319 | 1,296 | 2,135 | — | 4,193 | ||||||||||||||||||||
| 2,381 | 566 | 643 | 147 | 109 | 489 | 29 | ||||||||||||||||||||
| 3,007 | 870 | 365 | 539 | 147 | 535 | 110 | ||||||||||||||||||||
| 45 | — | 9 | 7 | 6 | 10 | 2 | ||||||||||||||||||||
| 3,440,992 | 714,889 | 626,238 | 420,286 | 415,475 | 716,938 | 89,809 | ||||||||||||||||||||
| 49,580 | 4,859 | 39,269 | 22,692 | 42,956 | 53,582 | 694 | ||||||||||||||||||||
| 32,872 | 9,349 | 14,492 | 1,718 | 2,761 | — | 140 | ||||||||||||||||||||
| 1,524 | 6,041 | 462 | 551 | 574 | 253 | 48 | ||||||||||||||||||||
| — | — | — | — | 7 | — | — | ||||||||||||||||||||
| 690 | 56 | 39 | 22 | 3 | 62 | 8 | ||||||||||||||||||||
| 854 | 89 | 143 | 100 | 94 | 166 | 24 | ||||||||||||||||||||
| 909 | 18 | 272 | 189 | 168 | 315 | 31 | ||||||||||||||||||||
| 682 | 53 | 111 | 82 | 77 | 116 | 19 | ||||||||||||||||||||
| — | 11 | — | — | — | — | — | ||||||||||||||||||||
| — | 1 | — | — | 1 | — | — | ||||||||||||||||||||
| 3 | 2 | 1 | — | — | 1 | — | ||||||||||||||||||||
| — | 2 | — | 1 | 1 | — | — | ||||||||||||||||||||
| 34 | 196 | — | 11 | 5 | 14 | 4 | ||||||||||||||||||||
| 87,148 | 20,677 | 54,789 | 25,366 | 46,647 | 54,509 | 968 | ||||||||||||||||||||
| $3,353,844 | $694,212 | $571,449 | $394,920 | $368,828 | $662,429 | $88,841 | ||||||||||||||||||||
| 1,834,592 | 365,644 | 448,373 | 320,790 | 315,912 | 419,243 | 73,898 | ||||||||||||||||||||
| 244,050 | 16,274 | 69,298 | 37,881 | 53,196 | 91,427 | 1,477 | ||||||||||||||||||||
| 48,147 | 4,677 | 37,842 | 21,791 | 40,093 | 52,082 | 676 | ||||||||||||||||||||
| $2,263,888 | $528,676 | ^ | $453,495 | $328,656 | $372,779 | $461,807 | $67,794 | |||||||||||||||||||
| 7,275 | 3,328 | (4 | ) | 500 | (2,300 | ) | 114 | 285 | ||||||||||||||||||
| (236,161 | ) | (162,727 | )^ | 22,673 | 5,829 | (45,656 | ) | (5,329 | ) | 10,644 | |||||||||||||||
| 1,317,462 |
| 324,960 | 94,802 | 59,626 | 43,970 | 205,212 | 10,097 | ||||||||||||||||||
| 1,380 | (25 | ) | 483 | 309 | 35 | 626 | 21 | |||||||||||||||||||
| — |
| — | — | — | — | (1 | ) | — | |||||||||||||||||
| $3,353,844 | $694,212 | $571,449 | $394,920 | $368,828 | $662,429 | $88,841 | ||||||||||||||||||||
| $20.81 | $50.85 | $13.46 | $24.32 | $29.83 | $19.27 | $27.70 | ||||||||||||||||||||
| | ($3,210,656,688 ÷ 154,291,477 shares | ) | | ($411,692,577 ÷ 8,096,767 shares | ) | | ($533,534,210 ÷ 39,632,998 shares | ) | | ($390,989,629 ÷ 16,077,960 shares | ) | | ($366,014,108 ÷ 12,270,240 shares | ) | | ($630,718,252 ÷ 32,725,450 shares | ) | | ($87,916,224 ÷ 3,174,225 shares | ) | ||||||
| N/A | $51.18 | N/A | N/A | N/A | N/A | N/A | ||||||||||||||||||||
| | ($274,549,467 ÷ 5,364,809 shares | ) | ||||||||||||||||||||||||
| N/A | $51.09 | N/A | $24.14 | $28.87 | N/A | $27.65 | ||||||||||||||||||||
| | ($7,969,604 ÷ 155,990 shares | ) | | ($3,930,180 ÷ 162,784 shares | ) | | ($2,813,647 ÷ 97,444 shares | ) | | ($924,700 ÷ 33,439 shares | ) | |||||||||||||||
| $20.82 | N/A | $13.47 | N/A | N/A | $19.28 | N/A | ||||||||||||||||||||
| | ($143,187,129 ÷ 6,877,840 shares | ) | | ($37,914,837 ÷ 2,815,207 shares | ) | | ($31,710,745÷ 1,644,493 shares | ) | ||||||||||||||||||
| SEI Institutional Managed Trust / Semi-Annual Report / March 31, 2015 | 213 |
Statements of Assets and Liabilities ($ Thousands) (Continued)
March 31, 2015 (Unaudited)
| U.S. Managed Volatility Fund | Global Managed Volatility Fund | Tax-Managed Managed Volatility Fund | ||||||||||
ASSETS: | ||||||||||||
Investments, at value† | $1,349,745 | $1,900,572 | $830,440 | |||||||||
Affiliated investment, at value†† | 56,094 | 116,760 | 50,205 | |||||||||
Repurchase Agreements† | — | — | — | |||||||||
Cash | — | — | 133 | |||||||||
Foreign currency, at value††† | 7 | — | 229 | |||||||||
Cash collateral on futures | — | — | — | |||||||||
Cash collateral on swaps | — | — | — | |||||||||
Receivable for investment securities sold | 198 | 215 | — | |||||||||
Receivable for fund shares sold | 2,172 | 6,363 | 1,179 | |||||||||
Dividends and interest receivable | 2,975 | 5,818 | 1,714 | |||||||||
Receivable for variation margin | — | — | — | |||||||||
OTC Swap contracts, at value†††† | — | — | — | |||||||||
Options purchased, at value††††† | — | — | — | |||||||||
Swaptions purchased, at value‡ | — | — | — | |||||||||
Foreign tax reclaim receivable | 3 | — | 2 | |||||||||
Unrealized gain on forward foreign currency contracts | — | 7,973 | — | |||||||||
Prepaid Expenses | 18 | 32 | 14 | |||||||||
Total Assets | 1,411,212 | 2,037,733 | 883,916 | |||||||||
LIABILITIES: | ||||||||||||
Payable upon return on securities loaned | — | — | — | |||||||||
Payable for investment securities purchased | — | 215 | — | |||||||||
Payable for fund shares redeemed | 1,492 | 6,547 | 1,398 | |||||||||
Payable to custodian | — | — | — | |||||||||
Payable for variation margin | 285 | 669 | 247 | |||||||||
Administration fees payable | 324 | 516 | 222 | |||||||||
Investment advisory fees payable | 466 | 927 | 318 | |||||||||
Shareholder servicing fees payable Class A | 214 | 409 | 185 | |||||||||
Shareholder servicing fees payable Class I | — | — | — | |||||||||
Chief Compliance Officer fees payable | 1 | 2 | 1 | |||||||||
Administration servicing fees payable Class I | — | — | — | |||||||||
Income distribution payable | — | — | — | |||||||||
OTC Swap contracts, at value†††† | — | — | — | |||||||||
Options written, at value # | — | — | — | |||||||||
Swaptions, written, at value‡ | — | — | — | |||||||||
Unrealized loss on forward foreign currency contracts | — | 107 | — | |||||||||
Accrued expense payable | 17 | 70 | 12 | |||||||||
Total Liabilities | 2,799 | 9,462 | 2,383 | |||||||||
Net Assets | $1,408,413 | $2,028,271 | $881,533 | |||||||||
† Cost of investments and repurchase agreements | 1,127,383 | 1,753,167 | 612,891 | |||||||||
†† Cost of affiliated investments | 56,094 | 116,760 | 50,205 | |||||||||
††† Cost of foreign currency/(overdraft of foreign currency) | — | — | 238 | |||||||||
†††† Premiums received/(paid) | — | — | — | |||||||||
††††† Cost of options purchased | — | — | — | |||||||||
# Premiums received/(paid) on options written | — | — | — | |||||||||
‡ Premiums received | — | — | — | |||||||||
* Includes market value of securities on loan | — | — | — | |||||||||
NET ASSETS: | ||||||||||||
Paid-in-Capital — (unlimited authorization — no par value) | $1,145,311 | $1,784,873 | $643,790 | |||||||||
Undistributed (distributions in excess of) net investment income/accumulated net investment loss | 5,081 | (19,602 | ) | 3,439 | ||||||||
Accumulated net realized gain (loss) on investments, securities sold short, option contracts, futures, swap contracts, swaptions and foreign currency | 35,197 | 107,185 | 16,337 | |||||||||
Net unrealized appreciation (depreciation) on investments, securities sold short, and affiliated investments | 222,362 | 147,405 | 217,549 | |||||||||
Net unrealized appreciation (depreciation) on futures contracts | 463 | 729 | 427 | |||||||||
Net unrealized appreciation depreciation on swap contracts | — | — | — | |||||||||
Net unrealized appreciation on options | — | — | — | |||||||||
Net unrealized appreciation on swaptions | — | — | — | |||||||||
Net unrealized appreciation (depreciation) on forward foreign currency contracts, foreign currencies and translation of other assets and liabilities denominated in foreign currencies | (1 | ) | 7,681 | (9 | ) | |||||||
Net Assets | $1,408,413 | $2,028,271 | $881,533 | |||||||||
Net Asset Value, Offering and Redemption Price Per Share — Class A | $17.11 | $11.15 | $14.43 | |||||||||
| | ($1,013,588,719 ÷ 59,244,062 shares | ) | | ($1,928,556,570 ÷ 172,999,238 shares | ) | | ($881,533,285 ÷ 61,098,794 shares | ) | ||||
Net Asset Value, Offering and Redemption Price Per Share — Class I | $17.08 | $10.96 | N/A | |||||||||
| | ($1,837,698 ÷ 107,566 shares | ) | | ($1,184,358 ÷ 108,109 shares | ) | |||||||
Net Asset Value, Offering and Redemption Price Per Share — Class Y | $17.12 | $11.16 | N/A | |||||||||
| | ($392,986,186 ÷ 22,960,268 shares | ) | | ($98,529,775 ÷ 8,828,917 shares | ) | |||||||
Amounts designated as “—” are $0 or have been rounded to $0.
The accompanying notes are an integral part of the financial statements.
| 214 | SEI Institutional Managed Trust / Semi-Annual Report / March 31, 2015 |
| Real Estate Fund | Enhanced Income Fund | Core Fixed Income Fund | U.S. Fixed Income Fund | High Yield Bond Fund | Real Return Fund | Multi-Strategy Alternative Fund | ||||||||||||||||||||
| $256,804 | * | $231,475 | $2,154,365 | * | $1,168,374 | * | $1,777,501 | * | $283,083 | $471,200 | ||||||||||||||||
| 8,554 | 2,295 | 151,001 | 88,526 | 52,100 | 1,181 | 60,026 | ||||||||||||||||||||
| — | 1,100 | — | — | — | — | — | ||||||||||||||||||||
| 2 | 32 | 1,543 | 4 | — | — | 526 | ||||||||||||||||||||
| — | — | 594 | — | — | — | — | ||||||||||||||||||||
| — | 30 | 4,077 | 341 | — | — | — | ||||||||||||||||||||
| — | — | — | 54 | 439 | — | — | ||||||||||||||||||||
| 2,588 | 5,190 | 185,761 | 86,399 | 8,250 | — | — | ||||||||||||||||||||
| 1,235 | 340 | 1,133 | 1,270 | 1,241 | 339 | 538 | ||||||||||||||||||||
| 748 | 733 | 10,329 | 5,111 | 28,026 | 561 | — | ||||||||||||||||||||
| — | 1 | 285 | 127 | 4 | — | — | ||||||||||||||||||||
| — | — | 2,424 | 620 | — | — | — | ||||||||||||||||||||
| — | — | 95 | 33 | — | — | — | ||||||||||||||||||||
| — | — | 66 | — | — | — | — | ||||||||||||||||||||
| — | — | — | — | — | — | — | ||||||||||||||||||||
| — | — | 844 | — | — | — | — | ||||||||||||||||||||
| 4 | 5 | 37 | 20 | 31 | 5 | 9 | ||||||||||||||||||||
| 269,935 | 241,201 | 2,512,554 | 1,350,879 | 1,867,592 | 285,169 | 532,299 | ||||||||||||||||||||
| 4,219 | — | 15,887 | 5,054 | 6 | — | — | ||||||||||||||||||||
| 1,604 | 12,370 | 371,857 | 173,673 | 42,577 | — | — | ||||||||||||||||||||
| 215 | 367 | 3,118 | 1,394 | 2,831 | 428 | 588 | ||||||||||||||||||||
| — | — | — | — | 2,817 | — | — | ||||||||||||||||||||
| — | 5 | 234 | 137 | 20 | — | — | ||||||||||||||||||||
| 66 | 29 | 356 | 197 | 306 | 48 | 67 | ||||||||||||||||||||
| 127 | 49 | 313 | 161 | 624 | 31 | 24 | ||||||||||||||||||||
| 51 | 23 | 443 | 226 | 349 | 22 | 112 | ||||||||||||||||||||
| — | — | 1 | — | 1 | — | — | ||||||||||||||||||||
| — | — | 2 | 1 | 2 | — | — | ||||||||||||||||||||
| — | — | 2 | — | 1 | — | — | ||||||||||||||||||||
| — | — | 341 | 249 | 929 | — | — | ||||||||||||||||||||
| — | — | 2,972 | 759 | — | — | — | ||||||||||||||||||||
| — | — | 288 | 103 | — | — | — | ||||||||||||||||||||
| — | — | 87 | — | — | — | — | ||||||||||||||||||||
| — | — | 302 | — | — | — | — | ||||||||||||||||||||
| 4 | 13 | 121 | 83 | 85 | 5 | 9 | ||||||||||||||||||||
| 6,286 | 12,856 | 396,324 | 182,037 | 50,548 | 534 | 800 | ||||||||||||||||||||
| $263,649 | $228,345 | $2,116,230 | $1,168,842 | $1,817,044 | $284,635 | $531,499 | ||||||||||||||||||||
| 195,008 | 234,455 | 2,090,795 | 1,121,654 | 1,802,978 | 283,295 | 473,307 | ||||||||||||||||||||
| 8,554 | 2,295 | 151,001 | 88,526 | 52,100 | 1,181 | 59,229 | ||||||||||||||||||||
| — | — | 611 | — | — | — | — | ||||||||||||||||||||
| — | — | (21 | ) | — | — | — | — | |||||||||||||||||||
| — | — | 60 | 22 | — | — | — | ||||||||||||||||||||
| — | — | 291 | 101 | — | — | — | ||||||||||||||||||||
| — | — | 112 | — | — | — | — | ||||||||||||||||||||
| 4,096 | — | 15,440 | 4,928 | 6 | — | — | ||||||||||||||||||||
| $194,392 | $354,752 | $2,051,933 | $1,124,579 | $1,905,729 | $294,863 | $526,736 | ||||||||||||||||||||
| 812 |
| 1,048 | (3,488 | ) | (187 | ) | 2,912 | (6,997 | ) | 1,085 | |||||||||||||||
| 6,649 |
| (125,563 | ) | 3,340 | (1,688 | ) | (66,064 | ) | (3,019 | ) | 4,988 | ||||||||||||||
| 61,796 |
| (1,880 | ) | 63,570 | 46,720 | (25,477 | ) | (212 | ) | (1,310 | ) | ||||||||||||||
| — | (12 | ) | 1,228 | (250 | ) | — | — | — | ||||||||||||||||||
| — | — | (775 | ) | (341 | ) | (56 | ) | — | — | |||||||||||||||||
| — | — | 38 | 9 | — | — | — | ||||||||||||||||||||
| — | — | 91 | — | — | — | — | ||||||||||||||||||||
| — |
| — | 293 | — | — | — | — | ||||||||||||||||||
| $263,649 | $228,345 | $2,116,230 | $1,168,842 | $1,817,044 | $284,635 | $531,499 | ||||||||||||||||||||
| $19.89 | $7.59 | $11.73 | $10.56 | $7.53 | $9.94 | $9.99 | ||||||||||||||||||||
| | ($242,717,245 ÷ 12,200,675 shares | ) | | ($194,486,220 ÷ 25,632,425 shares | ) | | ($2,106,377,942 ÷ 179,628,843 shares | ) | | ($1,072,007,496 ÷ 101,499,453 shares | ) | | ($1,658,127,238 ÷ 220,094,933 shares | ) | | ($258,083,170 ÷ 25,959,052 shares | ) | | ($531,498,480 ÷ 53,212,480 shares | ) | ||||||
| $19.88 | $7.57 | $11.72 | N/A | $7.31 | N/A | N/A | ||||||||||||||||||||
| | ($768,023 ÷ 38,638 shares | ) | | ($367,024 ÷ 48,481 shares | ) | | ($9,851,922 ÷ 840,457 shares | ) | | ($7,139,973 ÷ 976,832 shares | ) | |||||||||||||||
| $19.90 | $7.59 | N/A | $10.56 | $7.53 | $9.95 | N/A | ||||||||||||||||||||
| | ($20,164,110 ÷ 1,013,025 shares | ) | | ($33,491,978 ÷ 4,415,230 shares | ) | | ($96,834,294 ÷ 9,169,882 shares | ) | | ($151,776,581 ÷ 20,143,272 shares | ) | | ($26,551,674 ÷ 2,667,904 shares | ) | ||||||||||||
| SEI Institutional Managed Trust / Semi-Annual Report / March 31, 2015 | 215 |
Consolidated Statements of Assets and Liabilities/
Statements of Assets and Liabilities ($ Thousands) (Concluded)
March 31, 2015 (Unaudited)
| Multi-Asset Accumulation Fund | ||||
ASSETS: | ||||
Investments, at value† | $1,323,821 | |||
Affiliated investment, at value†† | 715,178 | |||
Cash | 7,306 | |||
Foreign currency, at value††† | 470 | |||
Cash collateral on futures | 92,939 | |||
Cash collateral on swaps | 9,016 | |||
Options purchased, at value‡ | — | |||
Cash collateral on forward foreign currency contracts | 1,010 | |||
Receivable for investment securities sold | 1,318 | |||
Receivable for fund shares sold | 2,162 | |||
Dividends and interest receivable | 2,312 | |||
Receivable for variation margin | 2,772 | |||
OTC Swap contracts, at value†††† | 8,637 | |||
Foreign tax reclaim receivable | 88 | |||
Cash collateral on options | — | |||
Unrealized gain on forward foreign currency contracts | 11,480 | |||
Prepaid Expenses | 34 | |||
Total Assets | 2,178,543 | |||
LIABILITIES: | ||||
Payable for securities sold short@ | — | |||
Payable for investment securities purchased | 2,608 | |||
Payable for fund shares redeemed | 2,165 | |||
Dividend payable for securities sold short | — | |||
Payable to custodian | — | |||
Payable for variation margin | 8,782 | |||
Administration fees payable | 538 | |||
Investment advisory fees payable | 1,076 | |||
Shareholder servicing fees payable Class A | 402 | |||
Chief Compliance Officer fees payable | 2 | |||
Trustees fees payable | 9 | |||
Overdraft of foreign currency, at value††† | 9,773 | |||
OTC Swap contracts, at value†††† | 4,041 | |||
Options written, at value # | — | |||
Reverse repurchase agreements | — | |||
Unrealized loss on forward foreign currency contracts | 3,486 | |||
Income distribution payable | — | |||
Accrued expense payable | 33 | |||
Total Liabilities | 32,915 | |||
Net Assets | $2,145,628 | |||
† Cost of investments | 1,322,079 | |||
†† Cost of affiliated investments | 715,178 | |||
††† Cost of foreign currency/(overdraft of foreign currency) | (2,944 | ) | ||
†††† Premiums received/(paid) | — | |||
‡ Cost of options purchased | — | |||
# Premiums received on options written | — | |||
@ Proceeds from securities sold short | — | |||
NET ASSETS: | ||||
Paid-in-Capital — (unlimited authorization — no par value) | $2,089,351 | |||
Undistributed (distributions in excess of) net investment income/accumulated net investment loss | (30,364 | ) | ||
Accumulated net realized gain (loss) on investments, securities sold short, option contracts, futures, swap contracts, swaptions and foreign currency | 56,572 | |||
Net unrealized appreciation (depreciation) on investments, securities sold short, and affiliated investments | 1,742 | |||
Net unrealized appreciation (depreciation) on futures contracts | 14,160 | |||
Net unrealized appreciation (depreciation) on swap contracts | 6,263 | |||
Net unrealized depreciation on options | — | |||
Net unrealized appreciation (depreciation) on forward foreign currency contracts, foreign currencies and translation of other assets and liabilities denominated in foreign currencies | 7,904 | |||
Net Assets | $2,145,628 | |||
Net Asset Value, Offering and Redemption Price Per Share — Class A | $10.57 | |||
| | ($1,923,716,304 ÷ 182,056,385 shares | ) | ||
Net Asset Value, Offering and Redemption Price Per Share — Class Y | $10.57 | |||
| | ($221,911,985 ÷ 20,985,774 shares | ) | ||
| (1) | Commenced operations on December 19, 2014. |
Amounts designated as “—” are $0 or have been rounded to $0.
The accompanying notes are an integral part of the financial statements.
| 216 | SEI Institutional Managed Trust / Semi-Annual Report / March 31, 2015 |
| Multi-Asset Income Fund | Multi-Asset Inflation Managed Fund | Multi-Asset Capital Stability Fund | Long/Short Alternative Fund(1) | |||||||||||
| $648,537 | $1,139,431 | $564,846 | $12 | |||||||||||
| — | — | — | — | |||||||||||
| 2,180 | 143,062 | 55 | 36,452 | |||||||||||
| — | — | 214 | — | |||||||||||
| 731 | 2,110 | 6,931 | 692 | |||||||||||
| 1,395 | — | 2,393 | — | |||||||||||
| 1,946 | — | — | — | |||||||||||
| — | — | — | — | |||||||||||
| 3,781 | 20,958 | 471 | — | |||||||||||
| 1,653 | 866 | 799 | — | |||||||||||
| 3,633 | 2,227 | 719 | — | |||||||||||
| 88 | 2,193 | 2,259 | 33 | |||||||||||
| 1,070 | 66 | 19,987 | — | |||||||||||
| 2 | 20 | — | — | |||||||||||
| 13,886 | — | — | — | |||||||||||
| 1,507 | 352 | 16 | — | |||||||||||
| 10 | 18 | 10 | 3 | |||||||||||
| 680,419 | 1,311,303 | 598,700 | 37,192 | |||||||||||
| — | 140,311 | — | — | |||||||||||
| 9,191 | 22,585 | 445 | — | |||||||||||
| 680 | 1,082 | 736 | — | |||||||||||
| — | 16 | — | — | |||||||||||
| — | 671 | — | — | |||||||||||
| 409 | 4,805 | 2,625 | 85 | |||||||||||
| 153 | 206 | 236 | 9 | |||||||||||
| 191 | 307 | 6 | 18 | |||||||||||
| 48 | 186 | 44 | 8 | |||||||||||
| — | 1 | — | — | |||||||||||
| — | — | — | — | |||||||||||
| 12 | 73 | — | — | |||||||||||
| 1,590 | — | — | — | |||||||||||
| 1,287 | 295 | 20,406 | — | |||||||||||
| 61,822 | 166,358 | — | — | |||||||||||
| 161 | 63 | 73 | — | |||||||||||
| 423 | — | — | — | |||||||||||
| 48 | 76 | — | 3 | |||||||||||
| 76,015 | 337,035 | 24,571 | 123 | |||||||||||
| $604,404 | $974,268 | $574,129 | $37,069 | |||||||||||
| 653,989 | 1,109,080 | 556,580 | 12 | |||||||||||
| — | — | — | — | |||||||||||
| (12 | ) | (74 | ) | 203 | — | |||||||||
| — | (2 | ) | (190 | ) | — | |||||||||
| 2,606 | — | — | — | |||||||||||
| 1,697 | — | — | — | |||||||||||
| — | 147,062 | — | — | |||||||||||
| $595,343 | $1,042,318 | $569,234 | $36,269 | |||||||||||
| 5,125 | (17,271 | ) | (2,390 | ) | (87 | ) | ||||||||
| | 9,484 | | (79,741 | ) | (2,382 | ) | 730 | |||||||
| (5,452 | ) | 37,102 | 8,266 | — | ||||||||||
| (132 | ) | (7,202 | ) | 911 | 157 | |||||||||
| (1,059 | ) | (1,220 | ) | 542 | — | |||||||||
| (250 | ) | — | — | — | ||||||||||
| | 1,345 | | 282 | (52 | ) | — | ||||||||
| $604,404 | $974,268 | $574,129 | $37,069 | |||||||||||
| $10.76 | $9.01 | $10.14 | $10.23 | |||||||||||
| | ($568,395,544 ÷ 52,831,217 shares | ) | | ($883,559,159 ÷ 98,053,748 shares | ) | | ($519,827,388 ÷ 51,271,305 shares | ) | | ($37,069,447 ÷ 3,623,213 shares | ) | |||
| $10.76 | $9.02 | $10.14 | N/A | |||||||||||
| | ($36,008,090 ÷ 3,347,785 shares | ) | | ($90,708,743 ÷ 10,060,079 shares | ) | | ($54,301,608 ÷ 5,352,900 shares | ) | ||||||
| SEI Institutional Managed Trust / Semi-Annual Report / March 31, 2015 | 217 |
Statements of Operations ($ Thousands)
For the six month period ended March 31, 2015 (Unaudited)
| Large Cap Fund | Large Cap Value Fund | Large Cap Growth Fund | ||||||||||
Investment Income: | ||||||||||||
Dividends | $ | 22,496 | $ | 16,707 | $ | 11,025 | ||||||
Dividends from Affiliated Investments*† | 7 | 2 | 2 | |||||||||
Interest Income | 1 | — | — | |||||||||
Securities Lending Income — Net | 132 | 48 | 56 | |||||||||
Less: Foreign Taxes Witheld | (100 | ) | (50 | ) | (49 | ) | ||||||
Total Investment Income | 22,536 | 16,707 | 11,034 | |||||||||
Expenses: | ||||||||||||
Investment Advisory Fees | 5,251 | 2,664 | 3,163 | |||||||||
Administration Fees | 4,039 | 2,283 | 2,372 | |||||||||
Shareholder Servicing Fees Class (A) | 3,232 | 1,891 | 1,968 | |||||||||
Shareholder Servicing Fees Class (E) | — | 34 | 36 | |||||||||
Shareholder Servicing Fees Class (I) | — | 11 | 9 | |||||||||
Shareholder Servicing Fees Class (Y) | — | — | — | |||||||||
Administration Servicing Fees Class (I) | — | 11 | 9 | |||||||||
Trustee Fees | 15 | 9 | 9 | |||||||||
Chief Compliance Officer Fees | 7 | 4 | 4 | |||||||||
Printing Fees | 97 | 55 | 57 | |||||||||
Professional Fees | 59 | 34 | 35 | |||||||||
Custodian/Wire Agent Fees | 75 | 48 | 48 | |||||||||
Registration Fees | 27 | 17 | 16 | |||||||||
Interest expense | — | — | — | |||||||||
Other Expenses | 24 | 14 | 15 | |||||||||
Total Expenses | 12,826 | 7,075 | 7,741 | |||||||||
Less: | ||||||||||||
Waiver of Investment Advisory Fees | (728 | ) | (249 | ) | (346 | ) | ||||||
Waiver of Shareholder Servicing Fees Class (A) | (208 | ) | — | — | ||||||||
Waiver of Shareholder Servicing Fees Class (I) | — | (1 | ) | (1 | ) | |||||||
Waiver of Shareholder Servicing Fees Class (Y) | — | — | — | |||||||||
Waiver of Administration Fees | — | — | (333 | ) | ||||||||
Fees Paid Indirectly | (21 | ) | (34 | ) | (6 | ) | ||||||
Net Expenses | 11,869 | 6,791 | 7,055 | |||||||||
Net Investment Income (Loss) | 10,667 | 9,916 | 3,979 | |||||||||
Net Realized and Unrealized Gain (Loss) on Investments: | ||||||||||||
Net Realized Gain (Loss) on: | ||||||||||||
Investments | 126,286 | 73,999 | 89,163 | |||||||||
Futures Contracts | 1,760 | 1,046 | 984 | |||||||||
Net Change in Unrealized Appreciation (Depreciation) on: | ||||||||||||
Investments | 27,820 | (9,744 | ) | 65,999 | ||||||||
Futures Contracts | 2,091 | 624 | 594 | |||||||||
Net Increase in Net Assets from Operations | $ | 168,624 | $ | 75,841 | $ | 160,719 | ||||||
| * | See Note 6 in Notes to Financial Statements. |
| † | Portion of the income is from the investment of collateral in an affiliated security. |
| # | Includes realized gains of $1,179,815 ($ Thousands) due to affiliated transactions (see Note 6). |
Amounts designated as “—” are $0 or have been rounded to $0.
The accompanying notes are an integral part of the financial statements.
| 218 | SEI Institutional Managed Trust / Semi-Annual Report / March 31, 2015 |
| Tax-Managed Large Cap Fund | S&P 500 Index Fund | Small Cap Fund | Small Cap Value Fund | Small Cap Growth Fund | Tax-Managed Small/Mid Cap Fund | |||||||||||||||||
| $ | 25,778 | $ | 13,552 | $ | 2,695 | $ | 3,396 | $ | 928 | $ | 3,901 | |||||||||||
| 9 | 1 | 11 | 1 | 1 | 2 | |||||||||||||||||
| 1 | — | — | — | — | 3 | |||||||||||||||||
| 349 | 53 | 283 | 242 | 264 | 141 | |||||||||||||||||
| (97 | ) | — | (6 | ) | (5 | ) | (2 | ) | (2 | ) | ||||||||||||
| 26,040 | 13,606 | 2,983 | 3,634 | 1,191 | 4,045 | |||||||||||||||||
| 6,407 | 203 | 1,707 | 1,245 | 1,137 | 1,989 | |||||||||||||||||
| 4,805 | 1,490 | 788 | 575 | 525 | 918 | |||||||||||||||||
| 3,922 | 515 | 634 | 474 | 434 | 747 | |||||||||||||||||
| — | 62 | — | — | — | — | |||||||||||||||||
| — | 10 | — | 13 | 4 | — | |||||||||||||||||
| 74 | — | — | — | — | — | |||||||||||||||||
| — | 10 | — | 5 | 4 | — | |||||||||||||||||
| 19 | 12 | 3 | 2 | 2 | 3 | |||||||||||||||||
| 8 | 5 | 1 | 1 | 1 | 2 | |||||||||||||||||
| 115 | 70 | 19 | 14 | 13 | 22 | |||||||||||||||||
| 71 | 42 | 11 | 8 | 8 | 13 | |||||||||||||||||
| 87 | 93 | 14 | 13 | 11 | 17 | |||||||||||||||||
| 29 | 27 | 5 | 4 | 4 | 6 | |||||||||||||||||
| — | 55 | — | — | — | — | |||||||||||||||||
| 29 | 23 | 7 | 5 | 2 | 13 | |||||||||||||||||
| 15,566 | 2,617 | 3,189 | 2,359 | 2,145 | 3,730 | |||||||||||||||||
| (1,375 | ) | — | (199 | ) | (166 | ) | (197 | ) | (267 | ) | ||||||||||||
| — | (206 | ) | — | — | — | — | ||||||||||||||||
| — | (4 | ) | — | — | — | — | ||||||||||||||||
| — | — | — | — | — | (76 | ) | ||||||||||||||||
| — | (316 | ) | — | — | — | — | ||||||||||||||||
| — | — | (16 | ) | (4 | ) | (1 | ) | — | ||||||||||||||
| 14,191 | 2,091 | 2,974 | 2,189 | 1,947 | 3,387 | |||||||||||||||||
| 11,849 | 11,515 | 9 | 1,445 | (756 | ) | 658 | ||||||||||||||||
| 22,296 | 1,245,586 | # | 25,189 | 10,813 | 34,792 | (4,634 | ) | |||||||||||||||
| 1,661 | 1,138 | 1,725 | (102 | ) | 596 | 782 | ||||||||||||||||
| 152,896 | (1,142,238 | ) | 32,276 | 25,533 | 14,153 | 63,202 | ||||||||||||||||
| 2,735 | 109 | 939 | 678 | 149 | 1,602 | |||||||||||||||||
| $ | 191,437 | $ | 116,110 | $ | 60,138 | $ | 38,367 | $ | 48,934 | $ | 61,610 | |||||||||||
| SEI Institutional Managed Trust / Semi-Annual Report / March 31, 2015 | 219 |
Statements of Operations ($ Thousands) (Continued)
For the six month period ended March 31, 2015 (Unaudited)
Mid-Cap Fund | U.S. Managed Volatility Fund | Global Managed Volatility Fund | ||||||||||
Investment Income: | ||||||||||||
Dividends | $ | 735 | $ | 14,654 | $ | 26,431 | ||||||
Dividends from Affiliated Investments*† | — | 2 | 6 | |||||||||
Interest Income | — | — | 3 | |||||||||
Securities Lending Income — Net | 3 | — | — | |||||||||
Less: Foreign Taxes Witheld | — | (88 | ) | (1,460 | ) | |||||||
Total Investment Income | 738 | 14,568 | 24,980 | |||||||||
Expenses: | ||||||||||||
Investment Advisory Fees | 187 | 3,562 | 6,242 | |||||||||
Administration Fees | 139 | 1,644 | 2,881 | |||||||||
Shareholder Servicing Fees Class (A) | 115 | 1,274 | 2,351 | |||||||||
Shareholder Servicing Fees Class (I) | 1 | 2 | 1 | |||||||||
Shareholder Servicing Fees Class (Y) | — | — | — | |||||||||
Administration Servicing Fees Class (I) | 1 | 2 | 1 | |||||||||
Trustee Fees | 1 | 6 | 11 | |||||||||
Chief Compliance Officer Fees | — | 3 | 5 | |||||||||
Printing Fees | 3 | 38 | 68 | |||||||||
Professional Fees | 2 | 23 | 42 | |||||||||
Custodian/Wire Agent Fees | 3 | 30 | 61 | |||||||||
Registration Fees | 1 | 11 | 15 | |||||||||
Interest expense | — | — | — | |||||||||
Other Expenses | 1 | 10 | 22 | |||||||||
Total Expenses | 454 | 6,605 | 11,700 | |||||||||
Less: | ||||||||||||
Waiver of Investment Advisory Fees | — | (1,208 | ) | (1,075 | ) | |||||||
Waiver of Shareholder Servicing Fees Class (A) | (1 | ) | — | — | ||||||||
Waiver of Shareholder Servicing Fees Class (I) | — | — | — | |||||||||
Waiver of Administration Fees | — | — | — | |||||||||
Fees Paid Indirectly | — | — | — | |||||||||
Net Expenses | 453 | 5,397 | 10,625 | |||||||||
Net Investment Income | 285 | 9,171 | 14,355 | |||||||||
Net Realized and Unrealized Gain (Loss) on Investments: | ||||||||||||
Net Realized Gain (Loss) on: | ||||||||||||
Investments | 11,565 | 47,781 | 10,731 | |||||||||
Futures Contracts | 223 | 2,043 | 5,103 | |||||||||
Options | — | — | — | |||||||||
Swaptions | — | — | — | |||||||||
Swap Contracts | — | — | — | |||||||||
Foreign Currency Transactions | — | (58 | ) | 98,007 | ||||||||
Net Change in Unrealized Appreciation (Depreciation) on: | ||||||||||||
Investments | (2,900 | ) | 42,020 | 35,035 | ||||||||
Futures Contracts | 21 | 550 | 1,267 | |||||||||
Options | — | — | — | |||||||||
Swaptions | — | — | — | |||||||||
Swap Contracts | — | — | — | |||||||||
Foreign Currency and Translation of Other Assets and Liabilities Denominated in Foreign Currency | — | 8 | (367 | ) | ||||||||
Net Increase in Net Assets from Operations | $ | 9,194 | $ | 101,515 | $ | 164,131 | ||||||
| * | See Note 6 in Notes to Financial Statements. |
| † | Portion of the income is from the investment of collateral in an affiliated security. |
Amounts designated as “—” are $0 or have been rounded to $0.
The accompanying notes are an integral part of the financial statements.
| 220 | SEI Institutional Managed Trust / Semi-Annual Report / March 31, 2015 |
| Tax-Managed Managed Volatility Fund | Real Estate Fund | Enhanced Income Fund | Core Fixed Income Fund | U.S. Fixed Income Fund | High Yield Bond Fund | |||||||||||||||||
| $ | 10,731 | $ | 2,486 | $ | — | $ | 24 | $ | — | $ | 1,071 | |||||||||||
| 2 | — | — | 6 | 4 | 3 | |||||||||||||||||
| — | — | 2,670 | 29,887 | 14,129 | 53,877 | |||||||||||||||||
| — | 5 | — | 78 | 29 | — | |||||||||||||||||
| (60 | ) | — | — | 8 | — | (16 | ) | |||||||||||||||
| 10,673 | 2,491 | 2,670 | 30,003 | 14,162 | 54,935 | |||||||||||||||||
| 2,697 | 822 | 453 | 2,861 | 1,557 | 4,240 | |||||||||||||||||
| 1,245 | 379 | 340 | 2,913 | 1,585 | 2,609 | |||||||||||||||||
| 1,037 | 304 | 263 | 2,588 | 1,360 | 2,082 | |||||||||||||||||
| — | 1 | — | 61 | — | 6 | |||||||||||||||||
| — | — | — | — | — | 6 | |||||||||||||||||
| — | 1 | — | 13 | — | — | |||||||||||||||||
| 5 | 1 | 1 | — | 6 | 11 | |||||||||||||||||
| 2 | 1 | 1 | 5 | 3 | 4 | |||||||||||||||||
| 29 | 9 | 8 | 74 | 40 | 62 | |||||||||||||||||
| 18 | 5 | 5 | 46 | 25 | 37 | |||||||||||||||||
| 23 | 7 | 7 | 63 | 33 | 61 | |||||||||||||||||
| 8 | 2 | 2 | 20 | 11 | 21 | |||||||||||||||||
| — | — | — | 12 | — | — | |||||||||||||||||
| 8 | 2 | 40 | 257 | 154 | 109 | |||||||||||||||||
| 5,072 | 1,534 | 1,120 | 8,913 | 4,774 | 9,248 | |||||||||||||||||
| (918 | ) | (80 | ) | (167 | ) | (1,221 | ) | (571 | ) | (518 | ) | |||||||||||
| — | (17 | ) | — | — | (134 | ) | (331 | ) | ||||||||||||||
| — | — | (95 | ) | (1 | ) | — | — | |||||||||||||||
| — | — | (186 | ) | (696 | ) | (380 | ) | (729 | ) | |||||||||||||
| — | (5 | ) | — | — | — | — | ||||||||||||||||
| 4,154 | 1,432 | 672 | 6,995 | 3,689 | 7,670 | |||||||||||||||||
| 6,519 | 1,059 | 1,998 | 23,008 | 10,473 | 47,265 | |||||||||||||||||
| 20,618 | 10,133 | (73 | ) | 24,924 | 10,822 | (12,933 | ) | |||||||||||||||
| 349 | — | (115 | ) | (1,690 | ) | (2,060 | ) | (89 | ) | |||||||||||||
| — | — | — | 472 | 141 | — | |||||||||||||||||
| — | — | — | (738 | ) | — | — | ||||||||||||||||
| — | — | — | (26 | ) | (11 | ) | (200 | ) | ||||||||||||||
| (34 | ) | — | — | 1,096 | — | — | ||||||||||||||||
| 44,521 | 33,958 | (44 | ) | 22,329 | 18,907 | (16,274 | ) | |||||||||||||||
| 679 | — | (43 | ) | 1,105 | (586 | ) | (19 | ) | ||||||||||||||
| — | — | — | 106 | (21 | ) | — | ||||||||||||||||
| — | — | — | 495 | — | — | |||||||||||||||||
| — | — | — | (738 | ) | (344 | ) | (134 | ) | ||||||||||||||
| (1 | ) | — | — | (1,183 | ) | — | — | ||||||||||||||
| $ | 72,651 | $ | 45,150 | $ | 1,723 | $ | 69,160 | $ | 37,321 | $ | 17,616 | |||||||||||
| SEI Institutional Managed Trust / Semi-Annual Report / March 31, 2015 | 221 |
Statements of Operations/Consolidated Statements of Operations ($ Thousands) (Concluded)
For the six month period ended March 31, 2015 (Unaudited)
| Real Return Fund | Multi-Strategy Alternative Fund | Multi-Asset Accumulation Fund‡ | ||||||||||
Investment Income: | ||||||||||||
Dividends | $ | — | $ | 9,222 | $ | 1,848 | ||||||
Dividends from Affiliated Investments*† | — | 1 | 35 | |||||||||
Interest Income | (6,280 | )†† | — | (8,388 | )†† | |||||||
Less: Foreign Taxes Witheld | — | — | (80 | ) | ||||||||
Total Investment Income (Loss) | (6,280 | ) | 9,223 | (6,585 | ) | |||||||
Expenses: | ||||||||||||
Investment Advisory Fees | 311 | 3,842 | 7,470 | |||||||||
Administration Fees | 424 | 768 | 2,988 | |||||||||
Trustee Fees | 2 | 3 | 11 | |||||||||
Shareholder Servicing Fees Class (A) | 338 | 640 | 2,368 | |||||||||
Chief Compliance Officer Fees | 1 | 1 | 5 | |||||||||
Printing Fees | 10 | 18 | 70 | |||||||||
Professional Fees | 6 | 11 | 43 | |||||||||
Custodian/Wire Agent Fees | 8 | 15 | 36 | |||||||||
Registration Fees | 3 | 5 | 20 | |||||||||
Dividend expense | — | — | — | |||||||||
Interest expense | — | — | — | |||||||||
Other Expenses | 2 | 5 | 38 | |||||||||
Total Expenses | 1,105 | 5,308 | 13,049 | |||||||||
Less: | ||||||||||||
Waiver of Investment Advisory Fees | (113 | ) | (4,062 | ) | (1,505 | ) | ||||||
Waiver of Shareholder Servicing Fees Class (A) | (227 | ) | — | — | ||||||||
Waiver of Administration Fees | (134 | ) | — | — | ||||||||
Net Expenses | 631 | 1,246 | 11,544 | |||||||||
Net Investment Income (Loss) | (6,911 | ) | 7,977 | (18,129 | ) | |||||||
Net Realized and Unrealized Gain (Loss) on Investments: | ||||||||||||
Net Realized Gain (Loss) on: | ||||||||||||
Investments | (429 | ) | 9,513 | 1,703 | ||||||||
Securities Sold Short | — | — | — | |||||||||
Futures Contracts | — | — | 85,729 | |||||||||
Options | — | — | — | |||||||||
Swap Contracts | — | — | (23,865 | ) | ||||||||
Foreign Currency Transactions | — | — | 22,480 | |||||||||
Net Change in Unrealized Appreciation (Depreciation) on: | ||||||||||||
Investments | 3,716 | (13,152 | ) | (11,253 | ) | |||||||
Affiliated Investments | — | 797 | — | |||||||||
Securities Sold Short | — | — | — | |||||||||
Futures Contracts | — | — | 39,018 | |||||||||
Options | — | — | — | |||||||||
Swap Contracts | — | — | 20,846 | |||||||||
Foreign Currency and Translation of Other Assets and Liabilities Denominated in Foreign Currency | — | — | 8,228 | |||||||||
Net Increase (Decrease) in Net Assets from Operations | $ | (3,624 | ) | $ | 5,135 | $ | 124,757 | |||||
| * | See Note 6 in Notes to Financial Statements. |
| † | Portion of the income is from the investment of collateral in an affiliated security. |
| ‡ | See Note 5 for details on gains and losses attributed to the Funds investments in Subsidiaries. |
| †† | Negative interest income is due to negative yields on U.S. Treasury and Foreign Sovereign Debt Inflation Protected Securities. |
| (1) | Commenced operations on December 19, 2014. |
Amounts designated as “—” are $0 or have been rounded to $0.
The accompanying notes are an integral part of the financial statements.
| 222 | SEI Institutional Managed Trust / Semi-Annual Report / March 31, 2015 |
| Multi-Asset Income Fund | Multi-Asset Inflation Managed Fund‡ | Multi-Asset Capital Stability Fund | Long/Short Alternative Fund(1) | |||||||||||
| $ | 4,032 | $ | 3,529 | $ | 169 | $ | 19 | |||||||
| — | — | — | — | |||||||||||
| 13,205 | (8,317 | )†† | (52 | ) | — | |||||||||
| (1 | ) | — | — | — | ||||||||||
| 17,236 | (4,788 | ) | 117 | 19 | ||||||||||
| 1,717 | 2,586 | 1,112 | 74 | |||||||||||
| 858 | 1,410 | 834 | 27 | |||||||||||
| 3 | 5 | 3 | — | |||||||||||
| 694 | 1,123 | 664 | 23 | |||||||||||
| 1 | 2 | 1 | — | |||||||||||
| 20 | 33 | 20 | 1 | |||||||||||
| 13 | 21 | 12 | — | |||||||||||
| 8 | 15 | 10 | 2 | |||||||||||
| 6 | — | 6 | 1 | |||||||||||
| — | 505 | — | — | |||||||||||
| 134 | 153 | — | — | |||||||||||
| 39 | 254 | 7 | 1 | |||||||||||
| 3,493 | 6,107 | 2,669 | 129 | |||||||||||
| (838 | ) | (850 | ) | (844 | ) | (19 | ) | |||||||
| (110 | ) | — | (111 | ) | — | |||||||||
| (125 | ) | (197 | ) | — | (4 | ) | ||||||||
| 2,420 | 5,060 | 1,714 | 106 | |||||||||||
| 14,816 | (9,848 | ) | (1,597 | ) | (87 | ) | ||||||||
| (123 | ) | (5,053 | ) | 1,155 | 12 | |||||||||
| — | (10,229 | ) | — | — | ||||||||||
| 2,578 | (42,182 | ) | (3,105 | ) | 718 | |||||||||
| (2,088 | ) | — | (407 | ) | — | |||||||||
| 4,077 | (2 | ) | 659 | — | ||||||||||
| 4,757 | 2,977 | 1,390 | — | |||||||||||
| (3,576 | ) | 23,806 | 3,971 | — | ||||||||||
| — | — | — | — | |||||||||||
| — | 93 | — | — | |||||||||||
| (132 | ) | 3,792 | 2,194 | 157 | ||||||||||
| (250 | ) | — | — | — | ||||||||||
| 1,879 | (1,038 | ) | 610 | — | ||||||||||
| 801 |
| (440 | ) | (275 | ) | — | |||||||
| $ | 22,739 | $ | (38,124 | ) | $ | 4,595 | $ | 800 | ||||||
| SEI Institutional Managed Trust / Semi-Annual Report / March 31, 2015 | 223 |
Statements of Changes in Net Assets ($ Thousands)
For the six month period ended March 31, 2015 (Unaudited) and the year ended September 30, 2014
| Large Cap Fund | Large Cap Value Fund | Large Cap Growth Fund | ||||||||||||||||||||||
10/01/14 to | 10/01/13 to | 10/01/14 to | 10/01/13 to | 10/01/14 to | 10/01/13 to | |||||||||||||||||||
Operations: | ||||||||||||||||||||||||
Net Investment Income (Loss) | $ | 10,667 | $ | 14,277 | $ | 9,916 | $ | 18,240 | $ | 3,979 | $ | 3,981 | ||||||||||||
Net Realized Gain from Investments and Futures Contracts | 128,046 | 217,068 | 75,045 | 188,003 | 90,147 | 122,575 | ||||||||||||||||||
Net Change in Unrealized Appreciation (Depreciation) of Investments, Affiliated Investments and Futures Contracts | 29,911 | 126,758 | (9,120 | ) | 50,538 | 66,593 | 78,050 | |||||||||||||||||
Net Increase in Net Assets from Operations | 168,624 | 358,103 | 75,841 | 256,781 | 160,719 | 204,606 | ||||||||||||||||||
Dividends and Distributions From: | ||||||||||||||||||||||||
Net Investment Income: | ||||||||||||||||||||||||
Class A | (6,346 | ) | (14,803 | ) | (4,334 | ) | (17,800 | ) | (125 | ) | (4,128 | ) | ||||||||||||
Class E | — | — | — | — | — | — | ||||||||||||||||||
Class I | — | — | (21 | ) | (100 | ) | — | (10 | ) | |||||||||||||||
Class T‡ | — | — | — | — | — | — | ||||||||||||||||||
Net Capital Gains: | ||||||||||||||||||||||||
Class A | (207,875 | ) | (146,397 | ) | (100,168 | ) | — | (116,418 | ) | (33,112 | ) | |||||||||||||
Class E | — | — | — | — | — | — | ||||||||||||||||||
Class I | — | — | (623 | ) | — | (538 | ) | (192 | ) | |||||||||||||||
Total Dividends and Distributions | (214,221 | ) | (161,200 | ) | (105,146 | ) | (17,900 | ) | (117,081 | ) | (37,442 | ) | ||||||||||||
Capital Share Transactions(1): | ||||||||||||||||||||||||
Class A: | ||||||||||||||||||||||||
Proceeds from Shares Issued | 385,378 | 856,029 | 91,962 | 226,708 | 76,709 | 200,094 | ||||||||||||||||||
Reinvestment of Dividends and Distributions | 194,391 | 145,509 | 98,523 | 16,703 | 110,244 | 34,948 | ||||||||||||||||||
Cost of Shares Redeemed | (523,065 | ) | (723,689 | ) | (174,111 | ) | (398,149 | ) | (173,793 | ) | (283,862 | ) | ||||||||||||
Increase (Decrease) in Net Assets Derived from Class A Transactions | 56,704 | 277,849 | 16,374 | (154,738 | ) | 13,160 | (48,820 | ) | ||||||||||||||||
Class E: | ||||||||||||||||||||||||
Proceeds from Shares Issued | — | — | — | — | — | — | ||||||||||||||||||
Reinvestment of Dividends and Distributions | — | — | — | — | — | — | ||||||||||||||||||
Cost of Shares Redeemed | — | — | — | — | — | — | ||||||||||||||||||
Decrease in Net Assets Derived from Class E Transactions | — | — | — | — | — | — | ||||||||||||||||||
Class I: | ||||||||||||||||||||||||
Proceeds from Shares Issued | — | — | 476 | 2,372 | 425 | 2,037 | ||||||||||||||||||
Reinvestment of Dividends and Distributions | — | — | 544 | 87 | 425 | 171 | ||||||||||||||||||
Cost of Shares Redeemed | — | — | (1,955 | ) | (3,944 | ) | (2,137 | ) | (4,192 | ) | ||||||||||||||
Increase (Decrease) in Net Assets Derived from Class I Transactions | — | — | (935 | ) | (1,485 | ) | (1,287 | ) | (1,984 | ) | ||||||||||||||
Class T‡ | ||||||||||||||||||||||||
Proceeds from Shares Issued | — | — | — | — | — | — | ||||||||||||||||||
Reinvestment of Dividends and Distributions | — | — | — | — | — | — | ||||||||||||||||||
Cost of Shares Redeemed | — | — | — | — | — | — | ||||||||||||||||||
Increase in net Assets Derived from Class T Transactions | — | — | — | — | — | — | ||||||||||||||||||
Class Y(2): | ||||||||||||||||||||||||
Proceeds from Shares Issued | 233,806 | — | — | — | — | — | ||||||||||||||||||
Reinvestment of Dividends and Distributions | — | — | — | — | — | — | ||||||||||||||||||
Cost of Shares Redeemed | (9,481 | ) | — | — | — | — | — | |||||||||||||||||
Increase in Net Assets Derived from Class Y(2) Transactions | 224,325 | — | — | — | — | — | ||||||||||||||||||
Increase (Decrease) in Net Assets Derived from Capital Share Transactions | 281,029 | 277,849 | 15,439 | (156,223 | ) | 11,873 | (50,804 | ) | ||||||||||||||||
Net Increase (Decrease) in Net Assets | 235,432 | 474,752 | (13,866 | ) | 82,658 | 55,511 | 116,360 | |||||||||||||||||
Net Assets: | ||||||||||||||||||||||||
Beginning of Period | 2,581,944 | 2,107,192 | 1,536,999 | 1,454,341 | 1,557,968 | 1,441,608 | ||||||||||||||||||
End of Period | $ | 2,817,376 | $ | 2,581,944 | $ | 1,523,133 | $ | 1,536,999 | $ | 1,613,479 | $ | 1,557,968 | ||||||||||||
Undistributed (Distributions in Excess of) Net Investment Income/(Accumulated Net Investment Loss) Included in Net Assets at Period End | $ | 6,783 | $ | 2,462 | $ | 9,386 | $ | 3,825 | $ | 3,977 | $ | 123 | ||||||||||||
| (1) | See Note 7 in Notes to Financial Statements. |
| (2) | Class Y commenced operations on December 31, 2014. |
| @ | Includes realized gains of $204,201 ($ Thousands) due to affiliated transactions (see Note 6). |
| # | Includes realized gains of $1,179,815 ($ Thousands) due to affiliated transactions (see Note 6). |
| * | Includes redemptions as a result of affiliated transactions (see Note 6). |
| ‡ | Class T closed on December 30, 2014. |
Amounts designated as “—” are $0 or have been rounded to $0.
The accompanying notes are an integral part of the financial statements.
| 224 | SEI Institutional Managed Trust / Semi-Annual Report / March 31, 2015 |
| Tax-Managed Large Cap Fund | S&P 500 Index Fund | Small Cap Fund | Small Cap Value Fund | Small Cap Growth Fund | ||||||||||||||||||||||||||||||||||
10/01/14 to | 10/01/13 to | 10/01/14 to | 10/01/13 to | 10/01/14 to | 10/01/13 to | 10/01/14 to | 10/01/13 to | 10/01/14 to | 10/01/13 to | |||||||||||||||||||||||||||||
| $ | 11,849 | $ | 18,346 | $ | 11,515 | $ | 47,238 | $ | 9 | $ | (1,121 | ) | $ | 1,445 | $ | 1,986 | $ | (756 | ) | $ | (2,040 | ) | ||||||||||||||||
| 23,957 |
| 51,645 |
| 1,246,724 | # | 331,712 | @ | 26,914 | 45,152 | 10,711 | 35,992 | 35,388 | 52,086 | |||||||||||||||||||||||||
| 155,631 | | 367,283 | | (1,142,129 | ) | 110,002 | 33,215 | (28,120 | ) | 26,211 | (19,409 | ) | 14,302 | (31,019 | ) | |||||||||||||||||||||||
| 191,437 | 437,274 | 116,110 | 488,952 | 60,138 | 15,911 | 38,367 | 18,569 | 48,934 | 19,027 | |||||||||||||||||||||||||||||
| (8,175 | ) | (18,673 | ) | (3,499 | ) | (6,454 | ) | — | (63 | ) | (1,779 | ) | (2,228 | ) | — | (10 | ) | |||||||||||||||||||||
| — | — | (15,003 | ) | (42,481 | ) | — | — | — | — | — | — | |||||||||||||||||||||||||||
| — | — | (56 | ) | (114 | ) | — | — | (14 | ) | (18 | ) | — | — | |||||||||||||||||||||||||
| �� | (1 | ) | (3 | ) | — | — | — | — | — | — | — | — | ||||||||||||||||||||||||||
| — | — | (35,643 | ) | (8,230 | ) | (40,220 | ) | (27,889 | ) | (29,816 | ) | (3,246 | ) | — | — | |||||||||||||||||||||||
| — | — | (103,471 | ) | (54,970 | ) | — | — | — | — | — | — | |||||||||||||||||||||||||||
| — | — | (693 | ) | (174 | ) | — | — | (337 | ) | (45 | ) | — | — | |||||||||||||||||||||||||
| (8,176 | ) | (18,676 | ) | (158,365 | ) | (112,423 | ) | (40,220 | ) | (27,952 | ) | (31,946 | ) | (5,537 | ) | — | (10 | ) | ||||||||||||||||||||
| 333,774 | 669,352 | 60,398 | 73,402 | 85,681 | 181,468 | 19,755 | 47,546 | 15,203 | 41,391 | |||||||||||||||||||||||||||||
| 7,283 | 16,653 | 36,952 | 13,773 | 35,321 | 24,258 | 29,289 | 5,062 | — | 9 | |||||||||||||||||||||||||||||
| (400,734 | ) | (422,640 | ) | (63,376 | ) | (97,840 | ) | (88,750 | ) | (121,183 | ) | (39,259 | ) | (81,718 | ) | (33,575 | ) | (77,480 | ) | |||||||||||||||||||
| (59,677 | ) | | 263,365 | | 33,974 | (10,665 | ) | 32,252 | 84,543 | 9,785 | (29,110 | ) | (18,372 | ) | (36,080 | ) | ||||||||||||||||||||||
| — | — | 35,489 | 351,973 | — | — | — | — | — | — | |||||||||||||||||||||||||||||
| — | — | 116,755 | 95,326 | — | — | — | — | — | — | |||||||||||||||||||||||||||||
| — | — | (1,922,752 | )* | (1,065,608 | )* | — | — | — | — | — | — | |||||||||||||||||||||||||||
| — | | — | | (1,770,508 | ) | (618,309 | ) | — | — | — | — | — | — | |||||||||||||||||||||||||
| — | — | 1,411 | 2,360 | — | — | 305 | 1,193 | 198 | 1,835 | |||||||||||||||||||||||||||||
| — | — | 452 | 188 | — | — | 314 | 58 | — | — | |||||||||||||||||||||||||||||
| — | — | (1,580 | ) | (3,247 | ) | — | — | (912 | ) | (2,587 | ) | (749 | ) | (2,436 | ) | |||||||||||||||||||||||
| — | | — | | 283 | (699 | ) | — | — | (293 | ) | (1,336 | ) | (551 | ) | (601 | ) | ||||||||||||||||||||||
| — | — | — | — | — | — | — | — | — | — | |||||||||||||||||||||||||||||
| 1 | 3 | — | — | — | — | — | — | — | — | |||||||||||||||||||||||||||||
| (498 | ) | (61 | ) | — | — | — | — | — | — | — | — | |||||||||||||||||||||||||||
| (497 | ) | (58 | ) | | — | | — | — | — | — | — | — | — | |||||||||||||||||||||||||
| 144,185 | — | — | — | 38,132 | — | — | — | — | — | |||||||||||||||||||||||||||||
| — | — | — | — | — | — | — | — | — | — | |||||||||||||||||||||||||||||
| (3,739) | — | — | — | (2,135 | ) | — | — | — | — | — | ||||||||||||||||||||||||||||
| | 140,446 | | | — | | — | — | 35,997 | — | — | — | — | — | |||||||||||||||||||||||||
| 80,272 | | 263,307 | | (1,736,251 | ) | (629,673 | ) | 68,249 | 84,543 | 9,492 | (30,446 | ) | (18,923 | ) | (36,681 | ) | ||||||||||||||||||||||
| 263,533 | 681,905 | (1,778,506 | ) | (253,144 | ) | 88,167 | 72,502 | 15,913 | (17,414 | ) | 30,011 | (17,664 | ) | |||||||||||||||||||||||||
| 3,090,311 | 2,408,406 | 2,472,718 | 2,725,862 | 483,282 | 410,780 | 379,007 | 396,421 | 338,817 | 356,481 | |||||||||||||||||||||||||||||
| $ | 3,353,844 | $ | 3,090,311 | $ | 694,212 | $ | 2,472,718 | $ | 571,449 | $ | 483,282 | $ | 394,920 | $ | 379,007 | $ | 368,828 | $ | 338,817 | |||||||||||||||||||
| $ | 7,275 | $ | 3,602 | | $ | 3,328 | $ | 10,371 | $ | (4 | ) | $ | (13 | ) | $ | 500 | $ | 848 | $ | (2,300 | ) | $ | (1,544 | ) | ||||||||||||||
| SEI Institutional Managed Trust / Semi-Annual Report / March 31, 2015 | 225 |
Statements of Changes in Net Assets ($ Thousands) (Continued)
For the six month period ended March 31, 2015 (Unaudited) and the year ended September 30, 2014
| Tax-Managed Small/Mid Cap Fund | ||||||||
10/01/14 to | 10/01/13 to | |||||||
Operations: | ||||||||
Net Investment Income | $ | 658 | $ | 366 | ||||
Net Realized Gain (Loss) from Investments and Futures Contracts | (3,852 | ) | 10,694 | |||||
Net Realized Gain (Loss) on Foreign Currency Transactions | — | (3 | ) | |||||
Net Change in Unrealized Appreciation (Depreciation) of Investments, Affiliated Investments and Futures Contracts | 64,804 | 29,433 | ||||||
Net Change in Unrealized Appreciation (Depreciation) on Foreign Currency and Translation of Other Assets and Liabilities Denominated in Foreign Currency | — | — | ||||||
Net Increase in Net Assets from Operations | 61,610 | 40,490 | ||||||
Dividends and Distributions From: | ||||||||
Net Investment Income: | ||||||||
Class A | (348 | ) | (696 | ) | ||||
Class I | — | — | ||||||
Net Capital Gains: | ||||||||
Class A | (6,161 | ) | (24,789 | ) | ||||
Class I | — | — | ||||||
Total Dividends and Distributions | (6,509 | ) | (25,485 | ) | ||||
Capital Share Transactions(1): | ||||||||
Class A: | ||||||||
Proceeds from Shares Issued | 70,108 | 147,032 | ||||||
Reinvestment of Dividends and Distributions | 5,750 | 22,644 | ||||||
Cost of Shares Redeemed | (71,983 | ) | (97,722 | ) | ||||
Increase (Decrease) in Net Assets Derived from Class A Transactions | 3,875 | 71,954 | ||||||
Class I: | ||||||||
Proceeds from Shares Issued | — | — | ||||||
Reinvestment of Dividends and Distributions | — | — | ||||||
Cost of Shares Redeemed | — | — | ||||||
Increase (Decrease) in Net Assets Derived from Class I Transactions | — | — | ||||||
Class Y(2): | ||||||||
Proceeds from Shares Issued | 31,616 | — | ||||||
Cost of Shares Redeemed | (1,338 | ) | — | |||||
Increase (Decrease) in Net Assets Derived from Class Y(2) Transactions | 30,278 | — | ||||||
Increase (Decrease) in Net Assets Derived from Capital Share Transactions | 34,153 | 71,954 | ||||||
Net Increase (Decrease) in Net Assets | 89,254 | 86,959 | ||||||
Net Assets: | ||||||||
Beginning of Period | 573,175 | 486,216 | ||||||
End of Period | $ | 662,429 | $ | 573,175 | ||||
Undistributed (Distributions in Excess of) Net Investment Income Included in Net Assets at Period | $ | 114 | $ | (196 | ) | |||
| (1) | See Note 7 in Notes to Financial Statements. |
| (2) | Class Y commenced operations December 31, 2014. |
Amounts designated as “—” are $0 or have been rounded to $0.
The accompanying notes are an integral part of the financial statements.
| 226 | SEI Institutional Managed Trust / Semi-Annual Report / March 31, 2015 |
| Mid-Cap Fund | U.S. Managed Volatility Fund | Global Managed Volatility Fund | ||||||||||||||||||||
10/01/14 to | 10/01/13 to | 10/01/14 to | 10/01/13 to | 10/01/14 to | 10/01/13 to | |||||||||||||||||
| $ | 285 | $ | 158 | $ | 9,171 | $ | 13,289 | $ | 14,355 | $ | 28,753 | |||||||||||
| 11,788 | 11,659 | 49,824 | 116,667 | 15,834 | 120,526 | |||||||||||||||||
| — | — | (58 | ) | (9 | ) | 98,007 | 42,848 | |||||||||||||||
| (2,879 | ) | 1,825 | 42,570 | 29,376 | 36,302 | (4,822 | ) | |||||||||||||||
| | — | | — | 8 | (10 | ) | (367 | ) | 11,234 | |||||||||||||
| 9,194 | 13,642 | 101,515 | 159,313 | 164,131 | 198,539 | |||||||||||||||||
| — | (239 | ) | (7,839 | ) | (13,072 | ) | (96,403 | ) | (66,968 | ) | ||||||||||||
| — | (1 | ) | (9 | ) | (14 | ) | (54 | ) | (44 | ) | ||||||||||||
| (8,477 | ) | (2,727 | ) | (109,056 | ) | (65,044 | ) | (108,330 | ) | (67,367 | ) | |||||||||||
| (74 | ) | (48 | ) | (175 | ) | (92 | ) | (69 | ) | (46 | ) | |||||||||||
| (8,551 | ) | (3,015 | ) | (117,079 | ) | (78,222 | ) | (204,856 | ) | (134,425 | ) | |||||||||||
| 25,827 | 33,084 | 177,253 | 314,017 | 261,949 | 614,792 | |||||||||||||||||
| 7,450 | 2,680 | 102,053 | 67,114 | 190,920 | 124,774 | |||||||||||||||||
| (39,683 | ) | (60,015 | ) | (244,486 | ) | (311,670 | ) | (280,435 | ) | (403,113 | ) | |||||||||||
| (6,406 | ) | (24,251 | ) | 34,820 | 69,461 | 172,434 | 336,453 | |||||||||||||||
| 87 | 495 | 531 | 311 | 184 | 359 | |||||||||||||||||
| 74 | 49 | 185 | 106 | 124 | 91 | |||||||||||||||||
| (406 | ) | (1,116 | ) | (117 | ) | (473 | ) | (133 | ) | (411 | ) | |||||||||||
| (245 | ) | (572 | ) | 599 | (56 | ) | 175 | 39 | ||||||||||||||
| — | — | 394,500 | — | 98,523 | — | |||||||||||||||||
| — | — | (8,787 | ) | — | (3,012 | ) | — | |||||||||||||||
| — | — | 385,713 | — | 95,511 | — | |||||||||||||||||
| (6,651 | ) | (24,823 | ) | 421,132 | 69,405 | 268,120 | 336,492 | |||||||||||||||
| (6,008 | ) | (14,196 | ) | 405,568 | 150,496 | 227,395 | 400,606 | |||||||||||||||
| 94,849 | 109,045 | 1,002,845 | 852,349 | 1,800,876 | 1,400,270 | |||||||||||||||||
| $ | 88,841 | $ | 94,849 | $ | 1,408,413 | $ | 1,002,845 | $ | 2,028,271 | $ | 1,800,876 | |||||||||||
| $ | 285 | $ | — | $ | 5,081 | $ | 3,758 | $ | (19,602 | ) | $ | 62,500 | ||||||||||
| SEI Institutional Managed Trust / Semi-Annual Report / March 31, 2015 | 227 |
Statements of Changes in Net Assets ($ Thousands) (Continued)
For the six month period ended March 31, 2015 (Unaudited) and the year ended September 30, 2014
| Tax-Managed Managed Volatility Fund | Real Estate Fund | Enhanced Income Fund | ||||||||||||||||||||||
| 10/01/14 to 03/31/15 | 10/01/13 to 09/30/14 | 10/01/14 to 03/31/15 | 10/01/13 to 09/30/14 | 10/01/14 to 03/31/15 | 10/01/13 to 09/30/14 | |||||||||||||||||||
Operations: | ||||||||||||||||||||||||
Net Investment Income (Loss) | $ | 6,519 | $ | 9,643 | $ | 1,059 | $ | 3,820 | $ | 1,998 | $ | 3,874 | ||||||||||||
Net Realized Gain (Loss) from Investments, Securities Sold Short Affiliated Investments, Futures Contracts, Options, Swaptions and Swap Contracts | 20,967 | 48,503 | 10,133 | 23,505 | (188 | ) | (1,794 | ) | ||||||||||||||||
Net Realized Gain (Loss) on Foreign Currency Transactions | (34 | ) | (14 | ) | — | — | — | — | ||||||||||||||||
Net Change in Unrealized Appreciation (Depreciation) of Investments, Securities Sold Short, Affiliated Investments, Futures Contracts, Options, Swaptions and Swap Contracts | 45,200 | 49,598 | 33,958 | (2,744 | ) | (87 | ) | 1,478 | ||||||||||||||||
Net Change in Unrealized Appreciation (Depreciation) on Foreign Currency and Translation of Other Assets and Liabilities Denominated in Foreign Currency | (1 | ) | (9 | ) | — | — | — | — | ||||||||||||||||
Net Increase (Decrease) in Net Assets from Operations | 72,651 | 107,721 | 45,150 | 24,581 | 1,723 | 3,558 | ||||||||||||||||||
Dividends and Distributions From: | ||||||||||||||||||||||||
Net Investment Income: | ||||||||||||||||||||||||
Class A | (5,715 | ) | (9,448 | ) | (1,921 | ) | (3,897 | ) | (2,053 | ) | (3,802 | ) | ||||||||||||
Class I | — | — | (5 | ) | (10 | ) | (3 | ) | (6 | ) | ||||||||||||||
Class Y | — | — | — | — | — | — | ||||||||||||||||||
Net Capital Gains: | ||||||||||||||||||||||||
Class A | (50,428 | ) | (25,166 | ) | (5,727 | ) | — | — | — | |||||||||||||||
Class I | — | — | (16 | ) | — | — | — | |||||||||||||||||
Total Dividends and Distributions | (56,143 | ) | (34,614 | ) | (7,669 | ) | (3,907 | ) | (2,056 | ) | (3,808 | ) | ||||||||||||
Capital Share Transactions(1): | ||||||||||||||||||||||||
Class A: | ||||||||||||||||||||||||
Proceeds from Shares Issued | 138,275 | 216,416 | 28,950 | 61,684 | 28,184 | 101,380 | ||||||||||||||||||
Reinvestment of Dividends and Distributions | 47,418 | 29,162 | 7,264 | 3,731 | 1,686 | 3,298 | ||||||||||||||||||
Redemption Fees | — | — | — | — | — | — | ||||||||||||||||||
Cost of Shares Redeemed | (86,412 | ) | (174,471 | ) | (56,983 | ) | (67,122 | ) | (65,626 | ) | (68,340 | ) | ||||||||||||
Increase (Decrease) in Net Assets Derived from Class A | 99,281 | 71,107 | (20,769 | ) | (1,707 | ) | (35,756 | ) | 36,338 | |||||||||||||||
Class I: | ||||||||||||||||||||||||
Proceeds from Shares Issued | — | — | 28 | 215 | 58 | 110 | ||||||||||||||||||
Reinvestment of Dividends and Distributions | — | — | 21 | 10 | 3 | 6 | ||||||||||||||||||
Cost of Shares Redeemed | — | — | (8 | ) | (231 | ) | (70 | ) | (107 | ) | ||||||||||||||
Increase (Decrease) in Net Assets Derived from Class I | — | — | 41 | (6 | ) | (9 | ) | 9 | ||||||||||||||||
Class Y(2): | ||||||||||||||||||||||||
Proceeds from Shares Issued | — | — | 21,193 | — | 33,944 | — | ||||||||||||||||||
Reinvestment of Dividends and Distributions | — | — | — | — | — | — | ||||||||||||||||||
Cost of Shares Redeemed | — | — | (1,699 | ) | — | (787 | ) | — | ||||||||||||||||
Increase in Net Assets Derived from Class Y(2) Transactions | — | — | 19,494 | — | 33,157 | — | ||||||||||||||||||
Increase (Decrease) in Net Assets Derived from Capital Share Transactions | 99,281 | 71,107 | (1,234 | ) | (1,713 | ) | (2,608 | ) | 36,347 | |||||||||||||||
Net Increase (Decrease) in Net Assets | 115,789 | 144,214 | 36,247 | 18,961 | (2,941 | ) | 36,097 | |||||||||||||||||
Net Assets: | ||||||||||||||||||||||||
Beginning of Period | 765,744 | 621,530 | 227,402 | 208,441 | 231,286 | 195,189 | ||||||||||||||||||
End of Period | $ | 881,533 | $ | 765,744 | $ | 263,649 | $ | 227,402 | $ | 228,345 | $ | 231,286 | ||||||||||||
Undistributed (Distributions in Excess of) Net Investment | $ | 3,439 | $ | 2,635 | $ | 812 | $ | 1,679 | $ | 1,048 | $ | 1,106 | ||||||||||||
| (1) | See Note 7 in Notes to Financial Statements. |
| (2) | Class Y commenced operations December 31, 2014. |
Amounts designated as “—” are $0 or have been rounded to $0.
The accompanying notes are an integral part of the financial statements.
| 228 | SEI Institutional Managed Trust / Semi-Annual Report / March 31, 2015 |
| Core Fixed Income Fund | U.S. Fixed Income Fund | High Yield Bond Fund | Real Return Fund | Multi-Strategy Alternative Fund | ||||||||||||||||||||||||||||||||||
| 10/01/14 to 03/31/15 | 10/01/13 to 09/30/14 | 10/01/14 to 03/31/15 | 10/01/13 to 09/30/14 | 10/01/14 to 03/31/15 | 10/01/13 to 09/30/14 | 10/01/14 to 03/31/15 | 10/01/13 to 09/30/14 | 10/01/14 to 03/31/15 | 10/01/13 to 09/30/14 | |||||||||||||||||||||||||||||
| $ | 23,008 | $ | 51,760 | $ | 10,473 | $ | 21,316 | $ | 47,265 | $ | 112,740 | $ | (6,911 | ) | $ | 1,513 | $ | 7,977 | $ | 2,997 | ||||||||||||||||||
| | 22,942 | | 27,776 | 8,892 | 2,978 | (13,222 | ) | 62,951 | (429 | ) | (61 | ) | 9,513 | 10,410 | ||||||||||||||||||||||||
| 1,096 | 417 | — | — | — | — | — | — | — | (17 | ) | ||||||||||||||||||||||||||||
| | 23,297 | | 18,732 | 17,956 | 16,549 | (16,427 | ) | (39,295 | ) | 3,716 | (2,136 | ) | (12,355 | ) | 1,330 | |||||||||||||||||||||||
| | (1,183 | ) | 1,899 | — | — | — | — | — | — | — | 1 | |||||||||||||||||||||||||||
| 69,160 | 100,584 | 37,321 | 40,843 | 17,616 | 136,396 | (3,624 | ) | (684 | ) | 5,135 | 14,721 | |||||||||||||||||||||||||||
| (22,932 | ) | (52,363 | ) | (10,397 | ) | (21,901 | ) | (44,990 | ) | (110,759 | ) | (344 | ) | (1,083 | ) | (8,032 | ) | (3,459 | ) | |||||||||||||||||||
| (102 | ) | (290 | ) | — | — | (117 | ) | (1,720 | ) | — | — | — | — | |||||||||||||||||||||||||
| — | — | (477 | ) | — | (1,994 | ) | — | — | — | — | — | |||||||||||||||||||||||||||
| — | — | (1,985 | ) | — | (9,791 | ) | (11,776 | ) | — | (1,247 | ) | — | — | |||||||||||||||||||||||||
| — | — | — | — | (21 | ) | (226 | ) | — | — | — | — | |||||||||||||||||||||||||||
| (23,034 | ) | (52,653 | ) | (12,859 | ) | (21,901 | ) | (56,913 | ) | (124,481 | ) | (344 | ) | (2,330 | ) | (8,032 | ) | (3,459 | ) | |||||||||||||||||||
| 186,669 | 474,834 | 158,258 | 349,872 | 376,434 | 706,633 | 42,907 | 92,554 | 83,772 | 160,649 | |||||||||||||||||||||||||||||
| 20,844 | 46,904 | 10,643 | 18,894 | 48,524 | 104,472 | 294 | 2,014 | 7,058 | 3,082 | |||||||||||||||||||||||||||||
| — | — | — | — | — | 671 | — | — | — | — | |||||||||||||||||||||||||||||
| (188,297 | ) | (432,728 | ) | (218,950 | ) | (311,461 | ) | (433,401 | ) | (1,105,068 | ) | (66,037 | ) | (115,431 | ) | (54,524 | ) | (103,636 | ) | |||||||||||||||||||
| | 19,216 | | 89,010 | (50,049 | ) | 57,305 | (8,443 | ) | (293,292 | ) | (22,836 | ) | (20,863 | ) | 36,306 | 60,095 | ||||||||||||||||||||||
| 1,180 | 2,059 | — | — | 12,712 | 13,625 | — | — | — | — | |||||||||||||||||||||||||||||
| 71 | 211 | — | — | 125 | 1,878 | — | — | — | — | |||||||||||||||||||||||||||||
| (2,119 | ) | (6,206 | ) | — | — | (9,194 | ) | (51,054 | ) | — | — | — | — | |||||||||||||||||||||||||
| | (868 | ) | (3,936 | ) | — | — | 3,643 | (35,551 | ) | — | — | — | — | |||||||||||||||||||||||||
| — | — | 97,683 | — | 153,620 | — | 27,143 | — | — | — | |||||||||||||||||||||||||||||
| — | — | 497 | — | 2,085 | — | — | — | — | — | |||||||||||||||||||||||||||||
| — | — | (2,231 | ) | — | (5,840 | ) | — | (648 | ) | — | — | — | ||||||||||||||||||||||||||
| — | — | 95,949 | — | 149,865 | — | 26,495 | — | — | — | |||||||||||||||||||||||||||||
| | 18,348 | | 85,074 | 45,900 | 57,305 | 145,065 | (328,843 | ) | 3,659 | (20,863 | ) | 36,306 | 60,095 | |||||||||||||||||||||||||
| 64,474 | 133,005 | 70,362 | 76,247 | 105,768 | (316,928 | ) | (309 | ) | (23,877 | ) | 33,409 | 71,357 | ||||||||||||||||||||||||||
| 2,051,756 | 1,918,751 | 1,098,480 | 1,022,233 | 1,711,276 | 2,028,204 | 284,944 | 308,821 | 498,090 | 426,733 | |||||||||||||||||||||||||||||
| $ | 2,116,230 | $ | 2,051,756 | $ | 1,168,842 | $ | 1,098,480 | $ | 1,817,044 | $ | 1,711,276 | $ | 284,635 | $ | 284,944 | $ | 531,499 | $ | 498,090 | |||||||||||||||||||
| $ | (3,488 | ) | $ | (3,462 | ) | $ | (187 | ) | $ | 214 | $ | 2,912 | $ | 2,748 | $ | (6,997 | ) | $ | 258 | $ | 1,085 | $ | 1,140 | |||||||||||||||
| SEI Institutional Managed Trust / Semi-Annual Report / March 31, 2015 | 229 |
Consolidated Statements of Changes in Net Assets/Statements of Changes in Net Assets ($ Thousands) (Concluded)
For the six month period ended March 31, 2015 (Unaudited) and for the year ended September 30, 2014
| Multi-Asset Accumulation Fund | ||||||||
| 10/01/14 to 03/31/15 | 10/01/13 to 09/30/14 | |||||||
Operations: | ||||||||
Net Investment Income (Loss) | $ | (18,129 | ) | $ | (7,713 | ) | ||
Net Realized Gain (Loss) from Investments, Securities Sold Short, Futures Contracts, Purchased Options, Written Options and Swap Contracts | 63,567 | 178,166 | ||||||
Net Realized Gain (Loss) on Foreign Currency Transactions | 22,480 | 17,646 | ||||||
Net Change in Unrealized Appreciation (Depreciation) of Investments, Securities Sold Short, Futures Contracts, Purchased Options, Written Options, Written Swaptions and Swap Contracts | 48,611 | (52,130 | ) | |||||
Net Change in Unrealized Appreciation (Depreciation) on Foreign Currency and Translation of Other Assets and Liabilities Denominated in Foreign Currency | 8,228 | 3,927 | ||||||
Net Increase (Decrease) in Net Assets from Operations | 124,757 | 139,896 | ||||||
Dividends and Distributions From: | ||||||||
Net Investment Income: | ||||||||
Class A | (21,898 | ) | (639 | ) | ||||
Class Y | — | — | ||||||
Net Capital Gains: | ||||||||
Class A | (155,829 | ) | (46,026 | ) | ||||
Total Dividends and Distributions | (177,727 | ) | (46,665 | ) | ||||
Capital Share Transactions(1): | ||||||||
Class A: | ||||||||
Proceeds from Shares Issued | 353,478 | 649,470 | ||||||
Reinvestment of Dividends and Distributions | 161,925 | 42,225 | ||||||
Cost of Shares Redeemed | (395,996 | ) | (333,643 | ) | ||||
Increase (Decrease) in Net Assets Derived from Class A Transactions | 119,407 | 358,052 | ||||||
Class Y(2): | ||||||||
Proceeds from Shares Issued | 221,026 | — | ||||||
Reinvestment of Dividends and Distributions | — | — | ||||||
Cost of Shares Redeemed | (7,681 | ) | — | |||||
Increase in Net Assets Derived from Class Y(2) Transactions | 213,345 | — | ||||||
Increase in Net Assets Derived from Capital Share Transactions | 332,752 | 358,052 | ||||||
Net Increase in Net Assets | 279,782 | 451,283 | ||||||
Net Assets: | ||||||||
Beginning of Period | 1,865,846 | 1,414,563 | ||||||
End of Period | $ | 2,145,628 | $ | 1,865,846 | ||||
Undistributed (Distributions in Excess of) Net Investment | $ | (30,364 | ) | $ | 9,663 | |||
| (1) | See Note 7 in Notes to Financial Statements. |
| (2) | Class Y commenced operations on December 31, 2014. |
| (3) | Commenced operations on December 19, 2014. |
Amounts designated as “—” are $0 or have been rounded to $0.
The accompanying notes are an integral part of the financial statements.
| 230 | SEI Institutional Managed Trust / Semi-Annual Report / March 31, 2015 |
| Multi-Asset Income Fund | Multi-Asset Inflation Managed Fund | Multi-Asset Capital Stability Fund | Long/Short Alternative Fund(3) | |||||||||||||||||||||||
| 10/01/14 to 03/31/15 | 10/01/13 to 09/30/14 | 10/01/14 to 03/31/15 | 10/01/13 to 09/30/14 | 10/01/14 to 03/31/15 | 10/01/13 to 09/30/14 | 12/19/14 to 03/31/15 | ||||||||||||||||||||
| $ | 14,816 | $ | 18,538 | (9,848 | ) | $ | 5,537 | $ | (1,597 | ) | $ | (590 | ) | $ | (87 | ) | ||||||||||
| 4,444 |
| 2,018 |
| (57,466 | ) | (16,100 | ) | (1,698 | ) | 13,352 |
| 730 |
| |||||||||||||
| 4,757 | 808 | 2,977 | (1,475 | ) | 1,390 | 376 | — | |||||||||||||||||||
| (2,079 | ) |
| (3,509 | ) | 26,653 | 3,978 | 6,775 | 3,809 |
| 157 |
| |||||||||||||||
| 801 | | 544 | | (440 | ) | 3,762 | (275 | ) | 35 |
| — |
| ||||||||||||||
| 22,739 | 18,399 | (38,124 | ) | (4,298 | ) | 4,595 | 16,982 | 800 | ||||||||||||||||||
| (11,014 | ) | (17,264 | ) | — | — | (254 | ) | — | — | |||||||||||||||||
| (401 | ) | — | — | — | — | — | — | |||||||||||||||||||
| (2,779 | ) | (3,989 | ) | — | — | (10,427 | ) | (1,179 | ) | — | ||||||||||||||||
| (14,194 | ) | (21,253 | ) | — | — | (10,681 | ) | (1,179 | ) | — | ||||||||||||||||
| 108,577 | 400,040 | 171,237 | 349,047 | 93,298 | 197,842 | 36,269 | ||||||||||||||||||||
| 11,391 | 17,265 | — | — | 8,724 | 964 | — | ||||||||||||||||||||
| (99,166 | ) | (105,303 | ) | (172,655 | ) | (187,576 | ) | (117,322 | ) | (159,933 | ) | — | ||||||||||||||
| 20,802 | 312,002 | (1,418 | ) | 161,471 | (15,300 | ) | 38,873 | 36,269 | ||||||||||||||||||
| 36,240 | — | 91,624 | — | 55,701 | — | — | ||||||||||||||||||||
| 401 | — | — | — | — | — | — | ||||||||||||||||||||
| (1,088 | ) | — | (1,355 | ) | — | (1,788 | ) | — | — | |||||||||||||||||
| 35,553 | — | 90,269 | — | 53,913 | — | — | ||||||||||||||||||||
| 56,355 | 312,002 | 88,851 | 161,471 | 38,613 | 38,873 | 36,269 | ||||||||||||||||||||
| 64,900 | 309,148 | 50,727 | 157,173 | 32,527 | 54,676 | 37,069 | ||||||||||||||||||||
| 539,504 | 230,356 | 923,541 | 766,368 | 541,602 | 486,926 | — | ||||||||||||||||||||
| $ | 604,404 | $ | 539,504 | $ | 974,268 | $ | 923,541 | $ | 574,129 | $ | 541,602 | $ | 37,069 | |||||||||||||
| $ | 5,125 | $ | 1,724 | | $ | (17,271 | ) | $ | (7,423 | ) | $ | (2,390 | ) | $ | (539 | ) | $ | (87 | ) | |||||||
| SEI Institutional Managed Trust / Semi-Annual Report / March 31, 2015 | 231 |
Statement of Cash Flows/Consolidated Statement of Cash Flows ($ Thousands)
For the six month period ended March 31, 2015 (Unaudited)
| Multi-Asset Income Fund | Multi-Asset Inflation Managed Fund | |||||||
Cash Flows from Operating Activities: | ||||||||
Net Increase (Decrease) in Net Assets from Operations | $ | 22,739 | $ | (38,124 | ) | |||
Adjustments to Reconcile Net Increase (Decrease) in Net Assets Resulting from Operations to Net Cash Used in Operating Activities: | ||||||||
Purchase of Investment Securities | (264,772 | ) | (801,221 | ) | ||||
Proceeds from Disposition of Investment Securities | 157,009 | 751,304 | ||||||
Proceeds from Securities Sold Short | — | 96,380 | ||||||
Purchases to Cover Securities Sold Short | — | (99,038 | ) | |||||
Purchased Options/Purchases to Cover Written Options | (5,979 | ) | — | |||||
Proceeds from Sale of Options/Expired Options | 2,982 | — | ||||||
Amortization (Accretion of Market Discount) | (949 | ) | 4,108 | |||||
Net Realized (Gain) Loss on: | ||||||||
Investments and Securities Sold Short | 123 | 15,282 | ||||||
Options | 2,088 | — | ||||||
Net Change in Unrealized (Appreciation) Depreciation on: | ||||||||
Investments and Securities Sold Short | 3,576 | (23,899 | ) | |||||
Options | 250 | — | ||||||
Changes in assets: | ||||||||
Foreign currency, at value | 71 | — | ||||||
Cash collateral for reverse repos | (731 | ) | — | |||||
Cash collateral on swaps | 842 | 141 | ||||||
Cash collateral on futures | — | (336 | ) | |||||
Cash collateral on options | (13,886 | ) | — | |||||
Receivable for investment securities sold | (2,873 | ) | 33,756 | |||||
Dividends and interest receivable | (429 | ) | (8 | ) | ||||
Receivable for variation margin | (85 | ) | (1,492 | ) | ||||
Swap contracts, at value | (36,960 | ) | 156 | |||||
Foreign tax reclaim receivable | — | (5 | ) | |||||
Unrealized gain on forward foreign currency contracts | (901 | ) | 563 | |||||
Prepaid Expenses | 105 | (11 | ) | |||||
Changes in liabilities: | ||||||||
Payable for investment securities purchased | 3,447 | (66,274 | ) | |||||
Dividend payable for securities sold short | — | (102 | ) | |||||
Payable for variation margin | 222 | 1,336 | ||||||
Administration fees payable | 100 | (58 | ) | |||||
Payable to custodian | (624 | ) | (1,305 | ) | ||||
Investment advisory fees payable | (48 | ) | 39 | |||||
Shareholder servicing fees payable Class A | 48 | 76 | ||||||
Chief Compliance Officer fees payable | (1 | ) | — | |||||
Swap contracts, at value | 35,298 | 295 | ||||||
Reverse repurchase agreements | 57,803 | 41,361 | ||||||
Unrealized loss on forward foreign currency contracts | 161 | (134 | ) | |||||
Unrealized loss on foreign spot currency contracts | — | — | ||||||
Overdraft of foreign currency, at value | 12 | (228 | ) | |||||
Interest payable | — | — | ||||||
Accrued expense payable | — | 7 | ||||||
Net Cash Used in Operating Activities | (41,362 | ) | (87,431 | ) | ||||
Cash Flows from Financing Activities: | ||||||||
Dividends and Distributions | (14,194 | ) | — | |||||
Proceeds from Shares Issued | 145,971 | 266,891 | ||||||
Reinvestment of Dividends and Distributions | 11,877 | — | ||||||
Cost of Shares Redeemed | (100,250 | ) | (174,104 | ) | ||||
Net Cash Provided by Financing Activities | 43,404 | 92,787 | ||||||
Net Change in Cash | 2,042 | 5,356 | ||||||
Cash at beginning of period | 138 | 137,706 | ||||||
Cash at end of period | $ | 2,180 | $ | 143,062 | ||||
| Amounts | designated as “—” are $0 or have been rounded to $0. |
The accompanying notes are an integral part of the financial statements.
| 232 | SEI Institutional Managed Trust / Semi-Annual Report / March 31, 2015 |
For the period ended March 31, 2015 (Unaudited) and the years or periods ended September 30, (unless otherwise indicated)
For a Share Outstanding Throughout the Periods
| Net Asset Value, Beginning of Period | Net Investment Income (1) | Net Realized and Unrealized Gains (Losses) on Securities(1) | Total from Operations | Dividends from Net Investment Income | Distributions from Realized Capital Gains | Total Dividends and Distributions | Net Asset Value, End of Period | Total Return† | Net Assets End of Period ($Thousands) | Ratio of Expenses to Average Net Assets | Ratio of Expenses to Average Net Assets (Excluding Fees Paid Indirectly) | Ratio of Expenses to Average Net Assets (Excluding Fees Paid Indirectly and Waivers) | Ratio of Net Investment Income (Loss) to Average Net Assets | Portfolio Turnover Rate† | ||||||||||||||||||||||||||||||||||||||||||||||
Large Cap Fund |
| |||||||||||||||||||||||||||||||||||||||||||||||||||||||||||
Class A | ||||||||||||||||||||||||||||||||||||||||||||||||||||||||||||
2015** | $ | 15.19 | $ | 0.06 | $ | 0.90 | $ | 0.96 | $ | (0.04 | ) | $ | (1.20 | ) | $ | (1.24 | ) | $ | 14.91 | 6.46 | % | $ | 2,587,817 | 0.89 | % | 0.89 | % | 0.96 | % | 0.77 | % | 34 | % | |||||||||||||||||||||||||||
2014 | 13.95 | 0.09 | 2.19 | 2.28 | (0.09 | ) | (0.95 | ) | (1.04 | ) | 15.19 | 16.96 | 2,581,944 | 0.89 | 0.89 | 1.01 | 0.60 | 57 | ||||||||||||||||||||||||||||||||||||||||||
2013 | 12.15 | 0.12 | 2.43 | 2.55 | (0.13 | ) | (0.62 | ) | (0.75 | ) | 13.95 | 22.23 | 2,107,192 | 0.89 | 0.89 | 1.01 | 0.94 | 49 | ||||||||||||||||||||||||||||||||||||||||||
2012 | 10.15 | 0.10 | 2.72 | 2.82 | (0.09 | ) | (0.73 | ) | (0.82 | ) | 12.15 | 29.04 | 1,488,259 | 0.89 | 0.89 | 1.02 | 0.89 | 50 | ||||||||||||||||||||||||||||||||||||||||||
2011 | 10.77 | 0.08 | (0.22 | ) | (0.14 | ) | (0.08 | ) | (0.40 | ) | (0.48 | ) | 10.15 | (1.71 | ) | 1,521,942 | 0.89 | 0.89 | 1.02 | 0.70 | 100 | |||||||||||||||||||||||||||||||||||||||
2010(9) | 10.00 | 0.10 | 0.80 | 0.90 | (0.08 | ) | (0.05 | ) | (0.13 | ) | 10.77 | 9.00 | 1,395,899 | 0.89 | 0.89 | 1.02 | 0.96 | 90 | ||||||||||||||||||||||||||||||||||||||||||
Class Y@ | ||||||||||||||||||||||||||||||||||||||||||||||||||||||||||||
2015** | $ | 14.62 | $ | 0.05 | $ | 0.25 | $ | 0.30 | $ | — | $ | — | $ | — | $ | 14.92 | 2.05 | % | $ | 229,559 | 0.64 | % | 0.64 | % | 0.71 | % | 1.27 | % | 34 | % | ||||||||||||||||||||||||||||||
Large Cap Value Fund |
| |||||||||||||||||||||||||||||||||||||||||||||||||||||||||||
Class A | ||||||||||||||||||||||||||||||||||||||||||||||||||||||||||||
2015** | $ | 25.71 | $ | 0.16 | $ | 1.11 | $ | 1.27 | $ | (0.07 | ) | $ | (1.71 | ) | $ | (1.78 | ) | $ | 25.20 | 5.07 | % | $ | 1,514,765 | 0.89 | % | 0.89 | % | 0.92 | % | 1.30 | % | 23 | % | |||||||||||||||||||||||||||
2014 | 21.94 | 0.29 | 3.76 | 4.05 | (0.28 | ) | — | (0.28 | ) | 25.71 | 18.55 | 1,527,500 | 0.89 | 0.89 | 0.97 | 1.19 | 58 | |||||||||||||||||||||||||||||||||||||||||||
2013 | 18.02 | 0.28 | 3.92 | 4.20 | (0.28 | ) | — | (0.28 | ) | 21.94 | 23.55 | 1,444,929 | 0.89 | 0.89 | 0.97 | 1.39 | 55 | |||||||||||||||||||||||||||||||||||||||||||
2012 | 14.13 | 0.25 | 3.89 | 4.14 | (0.25 | ) | — | (0.25 | ) | 18.02 | 29.54 | 1,344,405 | 0.89 | 0.89 | 0.98 | 1.51 | 37 | |||||||||||||||||||||||||||||||||||||||||||
2011 | 14.75 | 0.22 | (0.61 | ) | (0.39 | ) | (0.23 | ) | — | (0.23 | ) | 14.13 | (2.89 | ) | 1,197,272 | 0.89 | 0.89 | 0.98 | 1.35 | 63 | ||||||||||||||||||||||||||||||||||||||||
2010 | 13.83 | 0.21 | 0.94 | 1.15 | (0.23 | ) | — | (0.23 | ) | 14.75 | 8.43 | 1,504,082 | 0.89 | 0.89 | 0.98 | 1.48 | 64 | |||||||||||||||||||||||||||||||||||||||||||
Class I | ||||||||||||||||||||||||||||||||||||||||||||||||||||||||||||
2015** | $ | 25.71 | $ | 0.13 | $ | 1.13 | $ | 1.26 | $ | (0.06 | ) | $ | (1.71 | ) | $ | (1.77 | ) | $ | 25.20 | 5.00 | % | $ | 8,368 | 1.11 | % | 1.11 | % | 1.17 | % | 1.06 | % | 23 | % | |||||||||||||||||||||||||||
2014 | 21.96 | 0.24 | 3.75 | 3.99 | (0.24 | ) | — | (0.24 | ) | 25.71 | 18.22 | 9,499 | 1.11 | 1.11 | 1.22 | 0.97 | 58 | |||||||||||||||||||||||||||||||||||||||||||
2013 | 18.02 | 0.23 | 3.95 | 4.18 | (0.24 | ) | — | (0.24 | ) | 21.96 | 23.35 | 9,412 | 1.11 | 1.11 | 1.22 | 1.16 | 55 | |||||||||||||||||||||||||||||||||||||||||||
2012 | 14.13 | 0.21 | 3.89 | 4.10 | (0.21 | ) | — | (0.21 | ) | 18.02 | 29.20 | 7,668 | 1.11 | 1.11 | 1.23 | 1.28 | 37 | |||||||||||||||||||||||||||||||||||||||||||
2011 | 14.76 | 0.18 | (0.62 | ) | (0.44 | ) | (0.19 | ) | — | (0.19 | ) | 14.13 | (3.14 | ) | 7,073 | 1.11 | 1.11 | 1.23 | 1.13 | 63 | ||||||||||||||||||||||||||||||||||||||||
2010 | 13.83 | 0.18 | 0.95 | 1.13 | (0.20 | ) | — | (0.20 | ) | 14.76 | 8.23 | 10,358 | 1.11 | 1.11 | 1.24 | 1.25 | 64 | |||||||||||||||||||||||||||||||||||||||||||
Large Cap Growth Fund |
| |||||||||||||||||||||||||||||||||||||||||||||||||||||||||||
Class A | ||||||||||||||||||||||||||||||||||||||||||||||||||||||||||||
2015** | $ | 33.82 | $ | 0.09 | $ | 3.41 | $ | 3.50 | $ | — | $ | (2.60 | ) | $ | (2.60 | ) | $ | 34.72 | 10.69 | % | $ | 1,607,359 | 0.89 | % | 0.89 | % | 0.93 | % | 0.50 | % | 27 | % | ||||||||||||||||||||||||||||
2014 | 30.28 | 0.09 | 4.25 | 4.34 | (0.09 | ) | (0.71 | ) | (0.80 | ) | 33.82 | 14.51 | 1,550,723 | 0.89 | 0.89 | 1.02 | 0.26 | 61 | ||||||||||||||||||||||||||||||||||||||||||
2013 | 25.57 | 0.08 | 4.73 | 4.81 | (0.10 | ) | — | (0.10 | ) | 30.28 | 18.89 | 1,433,284 | 0.89 | 0.89 | 1.02 | 0.28 | 69 | |||||||||||||||||||||||||||||||||||||||||||
2012 | 19.77 | 0.05 | 5.78 | 5.83 | (0.03 | ) | — | (0.03 | ) | 25.57 | 29.47 | 1,354,774 | 0.89 | 0.90 | 1.03 | 0.19 | 88 | |||||||||||||||||||||||||||||||||||||||||||
2011 | 19.66 | 0.06 | 0.14 | 0.20 | (0.09 | ) | — | (0.09 | ) | 19.77 | 0.97 | 1,278,538 | 0.89 | 0.89 | 1.03 | 0.27 | 108 | |||||||||||||||||||||||||||||||||||||||||||
2010 | 17.62 | 0.12 | 2.04 | 2.16 | (0.12 | ) | — | (0.12 | ) | 19.66 | 12.29 | 1,602,130 | 0.89 | 0.89 | 1.03 | 0.63 | 83 | |||||||||||||||||||||||||||||||||||||||||||
Class I | ||||||||||||||||||||||||||||||||||||||||||||||||||||||||||||
2015** | $ | 33.40 | $ | 0.04 | $ | 3.38 | $ | 3.42 | $ | — | $ | (2.60 | ) | $ | (2.60 | ) | $ | 34.22 | 10.57 | % | $ | 6,120 | 1.11 | % | 1.11 | % | 1.18 | % | 0.27 | % | 27 | % | ||||||||||||||||||||||||||||
2014 | 29.93 | 0.01 | 4.21 | 4.22 | (0.04 | ) | (0.71 | ) | (0.75 | ) | 33.40 | 14.28 | 7,245 | 1.11 | 1.11 | 1.27 | 0.05 | 61 | ||||||||||||||||||||||||||||||||||||||||||
2013 | 25.28 | 0.02 | 4.68 | 4.70 | (0.05 | ) | — | (0.05 | ) | 29.93 | 18.62 | 8,324 | 1.11 | 1.11 | 1.27 | 0.06 | 69 | |||||||||||||||||||||||||||||||||||||||||||
2012 | 19.57 | — | * | 5.71 | 5.71 | — | — | — | 25.28 | 29.18 | 8,549 | 1.11 | 1.12 | 1.28 | (0.02 | ) | 88 | |||||||||||||||||||||||||||||||||||||||||||
2011 | 19.47 | 0.01 | 0.14 | 0.15 | (0.05 | ) | — | (0.05 | ) | 19.57 | 0.73 | 6,695 | 1.11 | 1.11 | 1.28 | 0.05 | 108 | |||||||||||||||||||||||||||||||||||||||||||
2010 | 17.44 | 0.08 | 2.02 | 2.10 | (0.07 | ) | — | (0.07 | ) | 19.47 | 12.06 | 7,953 | 1.11 | 1.11 | 1.28 | 0.41 | 83 | |||||||||||||||||||||||||||||||||||||||||||
Tax-Managed Large Cap Fund |
| |||||||||||||||||||||||||||||||||||||||||||||||||||||||||||
Class A | ||||||||||||||||||||||||||||||||||||||||||||||||||||||||||||
2015** | $ | 19.64 | $ | 0.07 | $ | 1.15 | $ | 1.22 | $ | (0.05 | ) | $ | — | $ | (0.05 | ) | $ | 20.81 | 6.23 | % | $ | 3,210,657 | 0.89 | % | 0.89 | % | 0.97 | % | 0.73 | % | 27 | % | ||||||||||||||||||||||||||||
2014 | 16.81 | 0.12 | 2.84 | 2.96 | (0.13 | ) | — | (0.13 | ) | 19.64 | 17.63 | 3,089,839 | 0.89 | 0.89 | 1.02 | 0.65 | 39 | |||||||||||||||||||||||||||||||||||||||||||
2013 | 13.88 | 0.15 | 2.94 | 3.09 | (0.16 | ) | — | (0.16 | ) | 16.81 | 22.47 | 2,407,951 | 0.89 | 0.89 | 1.02 | 1.00 | 42 | |||||||||||||||||||||||||||||||||||||||||||
2012 | 10.80 | 0.12 | 3.07 | 3.19 | (0.11 | ) | — | (0.11 | ) | 13.88 | 29.70 | 1,882,834 | 0.89 | 0.89 | 1.03 | 0.96 | 53 | |||||||||||||||||||||||||||||||||||||||||||
2011 | 11.02 | 0.10 | (0.22 | ) | (0.12 | ) | (0.10 | ) | — | (0.10 | ) | 10.80 | (1.20 | ) | 1,495,783 | 0.89 | 0.89 | 1.03 | 0.78 | 72 | ||||||||||||||||||||||||||||||||||||||||
2010 | 10.19 | 0.10 | 0.84 | 0.94 | (0.11 | ) | — | (0.11 | ) | 11.02 | 9.26 | 1,534,797 | 0.89 | 0.89 | 1.04 | 0.95 | 58 | |||||||||||||||||||||||||||||||||||||||||||
Class Y@ | ||||||||||||||||||||||||||||||||||||||||||||||||||||||||||||
2015** | $ | 20.46 | $ | 0.06 | $ | 0.30 | $ | 0.36 | $ | — | $ | — | $ | — | $ | 20.82 | 1.76 | % | $ | 143,187 | 0.64 | % | 0.64 | % | 0.72 | % | 1.15 | % | 27 | % | ||||||||||||||||||||||||||||||
S&P 500 Index Fund |
| |||||||||||||||||||||||||||||||||||||||||||||||||||||||||||
Class A |
| |||||||||||||||||||||||||||||||||||||||||||||||||||||||||||
2015** | $ | 53.00 | $ | 0.43 | $ | 2.55 | $ | 2.98 | $ | (0.44 | ) | $ | (4.69 | ) | $ | (5.13 | ) | $ | 50.85 | 5.73 | % | $ | 411,693 | 0.43 | % | 0.43 | % | 0.56 | % | 1.67 | % | 7 | % | |||||||||||||||||||||||||||
2014 | 46.20 | 0.79 | 7.91 | 8.70 | (0.83 | ) | (1.07 | ) | (1.90 | ) | 53.00 | 19.23 | 394,132 | 0.43 | 0.43 | 0.54 | 1.58 | 10 | ||||||||||||||||||||||||||||||||||||||||||
2013 | 39.60 | 0.76 | 6.61 | 7.37 | (0.77 | ) | — | (0.77 | ) | 46.20 | 18.87 | 352,589 | 0.43 | 0.43 | 0.54 | 1.78 | 6 | |||||||||||||||||||||||||||||||||||||||||||
2012 | 31.03 | 0.64 | 8.51 | 9.15 | (0.58 | ) | — | (0.58 | ) | 39.60 | 29.74 | 294,234 | 0.43 | 0.43 | 0.54 | 1.76 | 18 | |||||||||||||||||||||||||||||||||||||||||||
2011 | 31.30 | 0.55 | (0.26 | )(5) | 0.29 | (0.56 | ) | — | (0.56 | ) | 31.03 | 0.75 | 255,345 | 0.43 | 0.43 | 0.53 | 1.61 | 61 | ||||||||||||||||||||||||||||||||||||||||||
2010 | 29.01 | 0.56 | 2.29 | 2.85 | (0.56 | ) | — | (0.56 | ) | 31.30 | 9.93 | 325,796 | 0.43 | 0.43 | 0.54 | 1.85 | 20 | |||||||||||||||||||||||||||||||||||||||||||
| SEI Institutional Managed Trust / Semi-Annual Report / March 31, 2015 | 233 |
Financial Highlights (Continued)
For the period ended March 31, 2015 (Unaudited) and the years or periods ended September 30, (unless otherwise indicated)
For a Share Outstanding Throughout the Periods
| Net Asset Value, Beginning of Period | Net Investment Income/ (loss)(1) | Net Realized and Unrealized Gains (Losses) on Securities(1) | Total from Operations | Dividends from Net Investment Income | Distributions from Realized Capital Gains | Total Dividends and Distributions | Net Asset Value, End of Period | Total Return† | Net Assets End of Period ($Thousands) | Ratio of Expenses to Average Net Assets | Ratio of Expenses to Average Net Assets (Excluding Fees Paid Indirectly) | Ratio of Expenses to Average Net Assets (Excluding Fees Paid Indirectly and Waivers) | Ratio of Net Investment Income (Loss) to Average Net Assets | Portfolio Turnover Rate† | ||||||||||||||||||||||||||||||||||||||||||||||
S&P 500 Index Fund (continued) |
| |||||||||||||||||||||||||||||||||||||||||||||||||||||||||||
Class E |
| |||||||||||||||||||||||||||||||||||||||||||||||||||||||||||
2015** | $ | 53.30 | $ | 0.45 | $ | 2.60 | $ | 3.05 | $ | (0.48 | ) | $ | (4.69 | ) | $ | (5.17 | ) | $ | 51.18 | 5.84 | % | $ | 274,549 | 0.25 | % | 0.25 | % | 0.29 | % | 1.71 | % | 7 | % | |||||||||||||||||||||||||||
2014 | 46.45 | 0.89 | 7.94 | 8.83 | (0.91 | ) | (1.07 | ) | (1.98 | ) | 53.30 | 19.42 | 2,070,624 | 0.25 | 0.25 | 0.29 | 1.76 | 10 | ||||||||||||||||||||||||||||||||||||||||||
2013 | 39.79 | 0.85 | 6.65 | 7.50 | (0.84 | ) | — | (0.84 | ) | 46.45 | 19.11 | 2,365,696 | 0.25 | 0.25 | 0.29 | 1.99 | 6 | |||||||||||||||||||||||||||||||||||||||||||
2012 | 31.17 | 0.71 | 8.54 | 9.25 | (0.63 | ) | — | (0.63 | ) | 39.79 | 29.97 | 2,580,512 | 0.25 | 0.25 | 0.29 | 1.92 | 18 | |||||||||||||||||||||||||||||||||||||||||||
2011 | 31.42 | 0.61 | (0.25 | )(5) | 0.36 | (0.61 | ) | — | (0.61 | ) | 31.17 | 0.96 | 1,195,729 | 0.25 | 0.25 | 0.29 | 1.76 | 61 | ||||||||||||||||||||||||||||||||||||||||||
2010 | 29.12 | 0.61 | 2.29 | 2.90 | (0.60 | ) | — | (0.60 | ) | 31.42 | 10.10 | 1,046,410 | 0.25 | 0.25 | 0.29 | 2.02 | 20 | |||||||||||||||||||||||||||||||||||||||||||
Class I |
| |||||||||||||||||||||||||||||||||||||||||||||||||||||||||||
2015** | $ | 53.22 | $ | 0.38 | $ | 2.55 | $ | 2.93 | $ | (0.37 | ) | $ | (4.69 | ) | $ | (5.06 | ) | $ | 51.09 | 5.61 | % | $ | 7,970 | 0.65 | % | 0.65 | % | 0.81 | % | 1.46 | % | 7 | % | |||||||||||||||||||||||||||
2014 | 46.38 | 0.68 | 7.94 | 8.62 | (0.71 | ) | (1.07 | ) | (1.78 | ) | 53.22 | 18.95 | 7,962 | 0.65 | 0.65 | 0.79 | 1.35 | 10 | ||||||||||||||||||||||||||||||||||||||||||
2013 | 39.73 | 0.67 | 6.65 | 7.32 | (0.67 | ) | — | (0.67 | ) | 46.38 | 18.60 | 7,577 | 0.65 | 0.65 | 0.79 | 1.58 | 6 | |||||||||||||||||||||||||||||||||||||||||||
2012 | 31.12 | 0.56 | 8.54 | 9.10 | (0.49 | ) | — | (0.49 | ) | 39.73 | 29.46 | 8,500 | 0.65 | 0.65 | 0.79 | 1.53 | 18 | |||||||||||||||||||||||||||||||||||||||||||
2011 | 31.37 | 0.47 | (0.25 | )(5) | 0.22 | (0.47 | ) | — | (0.47 | ) | 31.12 | 0.56 | 7,198 | 0.65 | 0.65 | 0.79 | 1.35 | 61 | ||||||||||||||||||||||||||||||||||||||||||
2010 | 29.07 | 0.49 | 2.29 | 2.78 | (0.48 | ) | — | (0.48 | ) | 31.37 | 9.66 | 8,341 | 0.65 | 0.65 | 0.79 | 1.63 | 20 | |||||||||||||||||||||||||||||||||||||||||||
Small Cap Fund |
| |||||||||||||||||||||||||||||||||||||||||||||||||||||||||||
Class A |
| |||||||||||||||||||||||||||||||||||||||||||||||||||||||||||
2015** | $ | 13.01 | $ | — | $ | 1.50 | $ | 1.50 | $ | — | $ | (1.05 | ) | $ | (1.05 | ) | $ | 13.46 | 11.99 | % | $ | 533,534 | 1.14 | % | 1.14 | % | 1.22 | % | (0.01 | )% | 74 | % | ||||||||||||||||||||||||||||
2014 | 13.32 | (0.03 | ) | 0.61 | 0.58 | — | * | (0.89 | ) | (0.89 | ) | 13.01 | 4.38 | 483,282 | 1.14 | 1.14 | 1.28 | (0.24 | ) | 72 | ||||||||||||||||||||||||||||||||||||||||
2013 | 10.62 | 0.01 | 3.25 | 3.26 | (0.05 | ) | (0.51 | ) | (0.56 | ) | 13.32 | 32.40 | 410,780 | 1.14 | 1.14 | 1.28 | 0.08 | 72 | ||||||||||||||||||||||||||||||||||||||||||
2012 | 9.51 | 0.01 | 2.67 | 2.68 | (0.01 | ) | (1.56 | ) | (1.57 | ) | 10.62 | 29.93 | 254,051 | 1.14 | 1.15 | 1.28 | 0.08 | 114 | ||||||||||||||||||||||||||||||||||||||||||
2011 | 11.14 | (0.01 | ) | (0.55 | ) | (0.56 | ) | (0.01 | ) | (1.06 | ) | (1.07 | ) | 9.51 | (6.54 | ) | 203,909 | 1.14 | 1.14 | 1.28 | (0.09 | ) | 123 | |||||||||||||||||||||||||||||||||||||
2010(9) | 10.00 | 0.01 | 1.15 | 1.16 | (0.01 | ) | (0.01 | ) | (0.02 | ) | 11.14 | 11.64 | 223,978 | 1.14 | 1.14 | 1.29 | 0.10 | 115 | ||||||||||||||||||||||||||||||||||||||||||
Class Y@ |
| |||||||||||||||||||||||||||||||||||||||||||||||||||||||||||
2015** | $ | 12.89 | $ | 0.01 | $ | 0.57 | $ | 0.58 | $ | — | $ | — | $ | — | $ | 13.47 | 4.50 | % | $ | 37,915 | 0.89 | % | 0.89 | % | 0.97 | % | 0.23 | % | 74 | % | ||||||||||||||||||||||||||||||
Small Cap Value Fund |
| |||||||||||||||||||||||||||||||||||||||||||||||||||||||||||
Class A |
| |||||||||||||||||||||||||||||||||||||||||||||||||||||||||||
2015** | $ | 23.97 | $ | 0.09 | $ | 2.33 | $ | 2.42 | $ | (0.11 | ) | $ | (1.96 | ) | $ | (2.07 | ) | $ | 24.32 | 10.51 | % | $ | 390,990 | 1.14 | % | 1.14 | % | 1.23 | % | 0.76 | % | 45 | % | |||||||||||||||||||||||||||
2014 | 23.24 | 0.12 | 0.95 | 1.07 | (0.14 | ) | (0.20 | ) | (0.34 | ) | 23.97 | 4.54 | 374,828 | 1.14 | 1.14 | 1.27 | 0.49 | 52 | ||||||||||||||||||||||||||||||||||||||||||
2013 | 18.23 | 0.17 | 5.03 | 5.20 | (0.19 | ) | — | (0.19 | ) | 23.24 | 28.73 | 391,113 | 1.14 | 1.14 | 1.28 | 0.84 | 51 | |||||||||||||||||||||||||||||||||||||||||||
2012 | 14.26 | 0.11 | 4.02 | 4.13 | (0.16 | ) | — | (0.16 | ) | 18.23 | 29.04 | 405,106 | 1.14 | 1.15 | 1.28 | 0.64 | 53 | |||||||||||||||||||||||||||||||||||||||||||
2011 | 15.45 | 0.07 | (1.16 | ) | (1.09 | ) | (0.10 | ) | — | (0.10 | ) | 14.26 | (7.15 | ) | 377,222 | 1.14 | 1.14 | 1.28 | 0.41 | 70 | ||||||||||||||||||||||||||||||||||||||||
2010 | 13.66 | 0.07 | 1.82 | 1.89 | (0.10 | ) | — | (0.10 | ) | 15.45 | 13.93 | 535,938 | 1.14 | 1.15 | 1.29 | 0.46 | 69 | |||||||||||||||||||||||||||||||||||||||||||
Class I |
| |||||||||||||||||||||||||||||||||||||||||||||||||||||||||||
2015** | $ | 23.81 | $ | 0.06 | $ | 2.31 | $ | 2.37 | $ | (0.08 | ) | $ | (1.96 | ) | $ | (2.04 | ) | $ | 24.14 | 10.35 | % | $ | 3,930 | 1.36 | % | 1.36 | % | 1.48 | % | 0.53 | % | 45 | % | |||||||||||||||||||||||||||
2014 | 23.09 | 0.07 | 0.93 | 1.00 | (0.08 | ) | (0.20 | ) | (0.28 | ) | 23.81 | 4.29 | 4,179 | 1.36 | 1.36 | 1.52 | 0.27 | 52 | ||||||||||||||||||||||||||||||||||||||||||
2013 | 18.10 | 0.11 | 5.02 | 5.13 | (0.14 | ) | — | (0.14 | ) | 23.09 | 28.51 | 5,308 | 1.36 | 1.36 | 1.53 | 0.55 | 51 | |||||||||||||||||||||||||||||||||||||||||||
2012 | 14.15 | 0.07 | 3.99 | 4.06 | (0.11 | ) | — | (0.11 | ) | 18.10 | 28.78 | 4,368 | 1.36 | 1.37 | 1.53 | 0.42 | 53 | |||||||||||||||||||||||||||||||||||||||||||
2011 | 15.34 | 0.03 | (1.15 | ) | (1.12 | ) | (0.07 | ) | — | (0.07 | ) | 14.15 | (7.40 | ) | 3,908 | 1.36 | 1.36 | 1.53 | 0.20 | 70 | ||||||||||||||||||||||||||||||||||||||||
2010 | 13.56 | 0.04 | 1.81 | 1.85 | (0.07 | ) | — | (0.07 | ) | 15.34 | 13.73 | 6,933 | 1.36 | 1.37 | 1.54 | 0.25 | 69 | |||||||||||||||||||||||||||||||||||||||||||
Small Cap Growth Fund |
| |||||||||||||||||||||||||||||||||||||||||||||||||||||||||||
Class A |
| |||||||||||||||||||||||||||||||||||||||||||||||||||||||||||
2015** | $ | 25.95 | $ | (0.06 | ) | $ | 3.94 | $ | 3.88 | $ | — | $ | — | $ | — | $ | 29.83 | 14.95 | % | $ | 366,014 | 1.11 | % | 1.11 | % | 1.22 | % | (0.43 | )% | 74 | % | |||||||||||||||||||||||||||||
2014 | 24.63 | (0.15 | ) | 1.47 | 1.32 | — | * | — | — | 25.95 | 5.36 | 335,849 | 1.11 | 1.11 | 1.28 | (0.57 | ) | 70 | ||||||||||||||||||||||||||||||||||||||||||
2013 | 18.57 | (0.02 | ) | 6.16 | 6.14 | (0.08 | ) | — | (0.08 | ) | 24.63 | 33.21 | 353,097 | 1.11 | 1.11 | 1.28 | (0.08 | ) | 81 | |||||||||||||||||||||||||||||||||||||||||
2012 | 14.20 | (0.02 | ) | 4.39 | 4.37 | — | — | — | 18.57 | 30.77 | 300,972 | 1.11 | 1.12 | 1.28 | (0.13 | ) | 110 | |||||||||||||||||||||||||||||||||||||||||||
2011 | 14.69 | (0.07 | ) | (0.42 | ) | (0.49 | ) | — | — | — | 14.20 | (3.34 | ) | 272,275 | 1.11 | 1.12 | 1.28 | (0.43 | ) | 125 | ||||||||||||||||||||||||||||||||||||||||
2010 | 12.96 | (0.03 | ) | 1.76 | 1.73 | — | (2) | — | — | 14.69 | 13.36 | 380,910 | 1.11 | 1.11 | 1.29 | (0.21 | ) | 99 | ||||||||||||||||||||||||||||||||||||||||||
Class I |
| |||||||||||||||||||||||||||||||||||||||||||||||||||||||||||
2015** | $ | 25.15 | $ | (0.09 | ) | $ | 3.81 | $ | 3.72 | $ | — | $ | — | $ | — | $ | 28.87 | 14.83 | % | $ | 2,814 | 1.36 | % | 1.36 | % | 1.47 | % | (0.68 | )% | 74 | % | |||||||||||||||||||||||||||||
2014 | 23.93 | (0.21 | ) | 1.43 | 1.22 | — | — | — | 25.15 | 5.10 | 2,968 | 1.36 | 1.36 | 1.52 | (0.82 | ) | 70 | |||||||||||||||||||||||||||||||||||||||||||
2013 | 18.04 | (0.07 | ) | 5.99 | 5.92 | (0.03 | ) | — | (0.03 | ) | 23.93 | 32.86 | 3,384 | 1.36 | 1.36 | 1.53 | (0.35 | ) | 81 | |||||||||||||||||||||||||||||||||||||||||
2012 | 13.82 | (0.06 | ) | 4.28 | 4.22 | — | — | — | 18.04 | 30.54 | 2,650 | 1.36 | 1.37 | 1.53 | (0.38 | ) | 110 | |||||||||||||||||||||||||||||||||||||||||||
2011 | 14.34 | (0.12 | ) | (0.40 | ) | (0.52 | ) | — | — | — | 13.82 | (3.63 | ) | 2,826 | 1.36 | 1.37 | 1.53 | (0.69 | ) | 125 | ||||||||||||||||||||||||||||||||||||||||
2010 | 12.68 | (0.06 | ) | 1.72 | 1.66 | — | — | — | 14.34 | 13.09 | 3,703 | 1.36 | 1.36 | 1.54 | (0.45 | ) | 99 | |||||||||||||||||||||||||||||||||||||||||||
Tax-Managed Small/Mid Cap Fund |
| |||||||||||||||||||||||||||||||||||||||||||||||||||||||||||
Class A |
| |||||||||||||||||||||||||||||||||||||||||||||||||||||||||||
2015** | $ | 17.62 | $ | 0.02 | $ | 1.83 | $ | 1.85 | $ | (0.01 | ) | $ | (0.19 | ) | $ | (0.20 | ) | $ | 19.27 | 10.54 | % | $ | 630,718 | 1.11 | % | 1.11 | % | 1.22 | % | 0.21 | % | 33 | % | |||||||||||||||||||||||||||
2014 | 17.10 | 0.01 | 1.40 | 1.41 | (0.02 | ) | (0.87 | ) | (0.89 | ) | 17.62 | 8.44 | 573,175 | 1.11 | 1.11 | 1.28 | 0.07 | 61 | ||||||||||||||||||||||||||||||||||||||||||
2013 | 13.26 | 0.04 | 3.86 | 3.90 | (0.06 | ) | — | (0.06 | ) | 17.10 | 29.54 | 486,216 | 1.11 | 1.11 | 1.28 | 0.30 | 67 | |||||||||||||||||||||||||||||||||||||||||||
2012 | 10.39 | 0.03 | 2.88 | 2.91 | (0.04 | ) | — | (0.04 | ) | 13.26 | 28.09 | 336,339 | 1.11 | 1.12 | 1.28 | 0.24 | 67 | |||||||||||||||||||||||||||||||||||||||||||
2011 | 10.81 | 0.02 | (0.41 | ) | (0.39 | ) | (0.03 | ) | — | (0.03 | ) | 10.39 | (3.66 | ) | 255,297 | 1.11 | 1.12 | 1.29 | 0.17 | 105 | ||||||||||||||||||||||||||||||||||||||||
2010 | 9.42 | 0.03 | 1.39 | 1.42 | (0.03 | ) | — | (0.03 | ) | 10.81 | 15.05 | 300,343 | 1.11 | 1.13 | 1.29 | 0.30 | 75 | |||||||||||||||||||||||||||||||||||||||||||
| 234 | SEI Institutional Managed Trust / Semi-Annual Report / March 31, 2015 |
| Net Asset Value, Beginning of Period | Net Investment Income (Loss)(1) | Net Realized and Unrealized Gains (Losses) on Securities(1) | Total from Operations | Dividends from Net Investment Income | Distributions from Realized Capital Gains | Total Dividends and Distributions | Net Asset Value, End of Period | Total Return† | Net Assets End of Period ($Thousands) | Ratio of Expenses to Average Net Assets | Ratio of Expenses to Average Net Assets (Excluding Fees Paid Indirectly) | Ratio of Expenses to Average Net Assets (Excluding Fees Paid Indirectly and Waivers) | Ratio of Net Investment Income (Loss) to Average Net Assets | Portfolio Turnover Rate† | ||||||||||||||||||||||||||||||||||||||||||||||
Tax-Managed Small/Mid Cap Fund (continued) |
| |||||||||||||||||||||||||||||||||||||||||||||||||||||||||||
Class Y |
| |||||||||||||||||||||||||||||||||||||||||||||||||||||||||||
2015** | $ | 18.52 | $ | 0.02 | $ | 0.74 | $ | 0.76 | $ | — | $ | — | $ | — | $ | 19.28 | 4.10 | % | $ | 31,711 | 0.86 | % | 0.86 | % | 0.97 | % | 0.51 | % | 33 | % | ||||||||||||||||||||||||||||||
Mid-Cap Fund |
| |||||||||||||||||||||||||||||||||||||||||||||||||||||||||||
Class A |
| |||||||||||||||||||||||||||||||||||||||||||||||||||||||||||
2015** | $ | 27.53 | $ | 0.08 | $ | 2.76 | $ | 2.84 | $ | — | $ | (2.67 | ) | $ | (2.67 | ) | $ | 27.70 | 10.92 | % | $ | 87,916 | 0.98 | % | 0.98 | % | 0.98 | % | 0.62 | % | 101 | % | ||||||||||||||||||||||||||||
2014 | 24.64 | 0.04 | 3.65 | 3.69 | (0.06 | ) | (0.74 | ) | (0.80 | ) | 27.53 | 15.28 | 93,705 | 1.02 | 1.02 | 1.03 | 0.16 | 66 | ||||||||||||||||||||||||||||||||||||||||||
2013 | 19.30 | 0.11 | 5.37 | 5.48 | (0.14 | ) | — | (0.14 | ) | 24.64 | 28.52 | 107,487 | 1.02 | 1.02 | 1.03 | 0.52 | 108 | |||||||||||||||||||||||||||||||||||||||||||
2012 | 14.99 | 0.09 | 4.32 | 4.41 | (0.10 | ) | — | (0.10 | ) | 19.30 | 29.50 | 85,119 | 1.02 | 1.02 | 1.04 | 0.53 | 81 | |||||||||||||||||||||||||||||||||||||||||||
2011 | 15.80 | 0.06 | (0.79 | ) | (0.73 | ) | (0.08 | ) | — | (0.08 | ) | 14.99 | (4.67 | ) | 74,200 | 1.02 | 1.04 | 1.06 | 0.36 | 151 | ||||||||||||||||||||||||||||||||||||||||
2010 | 13.92 | 0.08 | 1.88 | 1.96 | (0.08 | ) | — | (0.08 | ) | 15.80 | 14.13 | 124,569 | 1.02 | 1.04 | 1.04 | 0.51 | 185 | |||||||||||||||||||||||||||||||||||||||||||
Class I |
| |||||||||||||||||||||||||||||||||||||||||||||||||||||||||||
2015** | $ | 27.52 | $ | 0.05 | $ | 2.75 | $ | 2.80 | $ | — | $ | (2.67 | ) | $ | (2.67 | ) | $ | 27.65 | 10.77 | % | $ | 925 | 1.23 | % | 1.23 | % | 1.23 | % | 0.34 | % | 101 | % | ||||||||||||||||||||||||||||
2014 | 24.64 | (0.02 | ) | 3.65 | 3.63 | (0.01 | ) | (0.74 | ) | (0.75 | ) | 27.52 | 15.01 | 1,144 | 1.26 | 1.26 | 1.28 | (0.08 | ) | 66 | ||||||||||||||||||||||||||||||||||||||||
2013 | 19.30 | 0.06 | 5.37 | 5.43 | (0.09 | ) | — | (0.09 | ) | 24.64 | 28.20 | 1,558 | 1.26 | 1.26 | 1.28 | 0.27 | 108 | |||||||||||||||||||||||||||||||||||||||||||
2012 | 14.99 | 0.05 | 4.32 | 4.37 | (0.06 | ) | — | (0.06 | ) | 19.30 | 29.21 | 1,088 | 1.26 | 1.26 | 1.29 | 0.28 | 81 | |||||||||||||||||||||||||||||||||||||||||||
2011 | 15.81 | 0.03 | (0.81 | ) | (0.78 | ) | (0.04 | ) | — | (0.04 | ) | 14.99 | (4.95 | ) | 940 | 1.26 | 1.28 | 1.31 | 0.18 | 151 | ||||||||||||||||||||||||||||||||||||||||
2010 | 13.92 | 0.04 | 1.89 | 1.93 | (0.04 | ) | — | (0.04 | ) | 15.81 | 13.91 | 623 | 1.26 | 1.28 | 1.29 | 0.30 | 185 | |||||||||||||||||||||||||||||||||||||||||||
U.S. Managed Volatility Fund |
| |||||||||||||||||||||||||||||||||||||||||||||||||||||||||||
Class A |
| |||||||||||||||||||||||||||||||||||||||||||||||||||||||||||
2015** | $ | 17.50 | $ | 0.14 | $ | 1.47 | $ | 1.61 | $ | (0.13 | ) | $ | (1.87 | ) | $ | (2.00 | ) | $ | 17.11 | 9.54 | % | $ | 1,013,589 | 1.00 | % | 1.00 | % | 1.22 | % | 1.62 | % | 25 | % | |||||||||||||||||||||||||||
2014 | 16.09 | 0.23 | 2.62 | 2.85 | (0.23 | ) | (1.21 | ) | (1.44 | ) | 17.50 | 18.68 | 1,001,565 | 1.00 | 1.00 | 1.27 | 1.38 | 71 | ||||||||||||||||||||||||||||||||||||||||||
2013 | 13.96 | 0.27 | 2.25 | 2.52 | (0.27 | ) | (0.12 | ) | (0.39 | ) | 16.09 | 18.39 | 851,119 | 1.00 | 1.00 | 1.27 | 1.78 | 39 | ||||||||||||||||||||||||||||||||||||||||||
2012 | 11.49 | 0.22 | 2.45 | 2.67 | (0.20 | ) | — | (0.20 | ) | 13.96 | 23.41 | 635,298 | 1.00 | 1.00 | 1.28 | 1.72 | 48 | |||||||||||||||||||||||||||||||||||||||||||
2011 | 10.81 | 0.16 | 0.67 | 0.83 | (0.15 | ) | — | (0.15 | ) | 11.49 | 7.63 | 452,489 | 1.00 | 1.00 | 1.28 | 1.33 | 71 | |||||||||||||||||||||||||||||||||||||||||||
2010 | 9.65 | 0.14 | 1.16 | 1.30 | (0.14 | ) | — | (0.14 | ) | 10.81 | 13.61 | 415,669 | 1.00 | 1.00 | 1.29 | 1.37 | 53 | |||||||||||||||||||||||||||||||||||||||||||
Class I |
| |||||||||||||||||||||||||||||||||||||||||||||||||||||||||||
2015** | $ | 17.47 | $ | 0.12 | $ | 1.47 | $ | 1.59 | $ | (0.11 | ) | $ | (1.87 | ) | $ | (1.98 | ) | $ | 17.08 | 9.42 | % | $ | 1,838 | 1.25 | % | 1.25 | % | 1.47 | % | 1.41 | % | 25 | % | |||||||||||||||||||||||||||
2014 | 16.07 | 0.19 | 2.61 | 2.80 | (0.19 | ) | (1.21 | ) | (1.40 | ) | 17.47 | 18.35 | 1,280 | 1.25 | 1.25 | 1.52 | 1.13 | 71 | ||||||||||||||||||||||||||||||||||||||||||
2013 | 13.93 | 0.23 | 2.25 | 2.48 | (0.22 | ) | (0.12 | ) | (0.34 | ) | 16.07 | 18.10 | 1,230 | 1.25 | 1.25 | 1.52 | 1.52 | 39 | ||||||||||||||||||||||||||||||||||||||||||
2012 | 11.47 | 0.22 | 2.41 | 2.63 | (0.17 | ) | — | (0.17 | ) | 13.93 | 23.08 | 709 | 1.25 | 1.25 | 1.53 | 1.62 | 48 | |||||||||||||||||||||||||||||||||||||||||||
2011 | 10.79 | 0.14 | 0.66 | 0.80 | (0.12 | ) | — | (0.12 | ) | 11.47 | 7.39 | 52 | 1.25 | 1.25 | 1.53 | 1.14 | 71 | |||||||||||||||||||||||||||||||||||||||||||
2010 | 9.63 | 0.11 | 1.17 | 1.28 | (0.12 | ) | — | (0.12 | ) | 10.79 | 13.38 | 37 | 1.25 | 1.25 | 1.54 | 1.08 | 53 | |||||||||||||||||||||||||||||||||||||||||||
Class Y@ |
| |||||||||||||||||||||||||||||||||||||||||||||||||||||||||||
2015** | $ | 16.70 | $ | 0.10 | $ | 0.32 | $ | 0.42 | $ | — | $ | — | $ | — | $ | 17.12 | 2.51 | % | $ | 392,986 | 0.75 | % | 0.75 | % | 0.97 | % | 2.63 | % | 25 | % | ||||||||||||||||||||||||||||||
Global Managed Volatility Fund |
| |||||||||||||||||||||||||||||||||||||||||||||||||||||||||||
Class A |
| |||||||||||||||||||||||||||||||||||||||||||||||||||||||||||
2015** | $ | 11.41 | $ | 0.08 | $ | 0.91 | $ | 0.99 | $ | (0.57 | ) | $ | (0.68 | ) | $ | (1.25 | ) | $ | 11.15 | 9.00 | % | $ | 1,928,557 | 1.11 | % | 1.11 | % | 1.22 | % | 1.48 | % | 27 | % | |||||||||||||||||||||||||||
2014 | 11.00 | 0.20 | 1.24 | 1.44 | (0.50 | ) | (0.53 | ) | (1.03 | ) | 11.41 | 13.97 | 1,799,842 | 1.11 | 1.11 | 1.28 | 1.84 | 68 | ||||||||||||||||||||||||||||||||||||||||||
2013 | 9.80 | 0.23 | 1.22 | 1.45 | (0.25 | ) | — | (0.25 | ) | 11.00 | 15.12 | 1,399,316 | 1.11 | 1.11 | 1.28 | 2.09 | 60 | |||||||||||||||||||||||||||||||||||||||||||
2012 | 8.53 | 0.20 | 1.07 | 1.27 | — | — | — | 9.80 | 14.89 | 928,141 | 1.11 | 1.11 | 1.30 | 2.19 | 48 | |||||||||||||||||||||||||||||||||||||||||||||
2011 | 8.21 | 0.18 | 0.14 | 0.32 | — | — | — | 8.53 | 3.90 | 522,646 | 1.11 | 1.11 | 1.29 | 2.11 | 68 | |||||||||||||||||||||||||||||||||||||||||||||
2010 | 7.82 | 0.13 | 0.29 | 0.42 | (0.03 | )(2) | — | (0.03 | ) | 8.21 | 5.37 | 330,526 | 1.11 | 1.11 | 1.31 | 1.62 | 91 | |||||||||||||||||||||||||||||||||||||||||||
Class I |
| |||||||||||||||||||||||||||||||||||||||||||||||||||||||||||
2015** | $ | 11.23 | $ | 0.07 | $ | 0.88 | $ | 0.95 | $ | (0.54 | ) | $ | (0.68 | ) | $ | (1.22 | ) | $ | 10.96 | 8.80 | % | $ | 1,184 | 1.36 | % | 1.36 | % | 1.47 | % | 1.24 | % | 27 | % | |||||||||||||||||||||||||||
2014 | 10.84 | 0.17 | 1.23 | 1.40 | (0.48 | ) | (0.53 | ) | (1.01 | ) | 11.23 | 13.78 | 1,034 | 1.36 | 1.36 | 1.53 | 1.59 | 68 | ||||||||||||||||||||||||||||||||||||||||||
2013 | 9.66 | 0.20 | 1.21 | 1.41 | (0.23 | ) | — | (0.23 | ) | 10.84 | 14.91 | 954 | 1.36 | 1.36 | 1.54 | 1.85 | 60 | |||||||||||||||||||||||||||||||||||||||||||
2012 | 8.44 | 0.22 | 1.00 | 1.22 | — | — | — | 9.66 | 14.45 | 320 | 1.36 | 1.36 | 1.55 | 2.32 | 48 | |||||||||||||||||||||||||||||||||||||||||||||
2011 | 8.15 | 0.15 | 0.14 | 0.29 | — | — | — | 8.44 | 3.56 | 21 | 1.36 | 1.36 | 1.54 | 1.78 | 68 | |||||||||||||||||||||||||||||||||||||||||||||
2010 | 7.76 | 0.16 | 0.25 | 0.41 | (0.02 | )(2) | — | (0.02 | ) | 8.15 | 5.32 | 64 | 1.36 | 1.36 | 1.57 | 2.00 | 91 | |||||||||||||||||||||||||||||||||||||||||||
Class Y@ |
| |||||||||||||||||||||||||||||||||||||||||||||||||||||||||||
2015** | $ | 10.73 | $ | 0.06 | $ | 0.37 | $ | 0.43 | $ | — | $ | — | $ | — | $ | 11.16 | 4.01 | % | $ | 98,530 | 0.86 | % | 0.86 | % | 0.97 | % | 2.21 | % | 27 | % | ||||||||||||||||||||||||||||||
Tax-Managed Managed Volatility Fund |
| |||||||||||||||||||||||||||||||||||||||||||||||||||||||||||
Class A |
| |||||||||||||||||||||||||||||||||||||||||||||||||||||||||||
2015** | $ | 14.14 | $ | 0.11 | $ | 1.18 | $ | 1.29 | $ | (0.10 | ) | $ | (0.90 | ) | $ | (1.00 | ) | $ | 14.43 | 9.35 | % | $ | 881,533 | 1.00 | % | 1.00 | % | 1.22 | % | 1.57 | % | 17 | % | |||||||||||||||||||||||||||
2014 | 12.70 | 0.19 | 1.94 | 2.13 | (0.18 | ) | (0.51 | ) | (0.69 | ) | 14.14 | 17.33 | 765,744 | 1.00 | 1.00 | 1.28 | 1.38 | 58 | ||||||||||||||||||||||||||||||||||||||||||
2013 | 11.28 | 0.22 | 1.75 | 1.97 | (0.22 | ) | (0.33 | ) | (0.55 | ) | 12.70 | 18.24 | 621,530 | 1.00 | 1.00 | 1.27 | 1.86 | 28 | ||||||||||||||||||||||||||||||||||||||||||
2012 | 9.77 | 0.18 | 1.87 | 2.05 | (0.16 | ) | (0.38 | ) | (0.54 | ) | 11.28 | 21.70 | 442,074 | 1.00 | 1.00 | 1.28 | 1.71 | 30 | ||||||||||||||||||||||||||||||||||||||||||
2011 | 9.24 | 0.14 | 0.52 | 0.66 | (0.13 | ) | — | (0.13 | ) | 9.77 | 7.13 | 279,408 | 1.00 | 1.00 | 1.28 | 1.41 | 63 | |||||||||||||||||||||||||||||||||||||||||||
2010 | 8.14 | 0.12 | 1.10 | 1.22 | (0.12 | ) | — | (0.12 | ) | 9.24 | 15.17 | 236,402 | 1.00 | 1.00 | 1.29 | 1.39 | 28 | |||||||||||||||||||||||||||||||||||||||||||
| SEI Institutional Managed Trust / Semi-Annual Report / March 31, 2015 | 235 |
Financial Highlights (Continued)
For the period ended March 31, 2015 (Unaudited) and the years or periods ended September 30, (unless otherwise indicated)
For a Share Outstanding Throughout the Periods
| Net Asset Value, Beginning of Period | Net Investment Income/ (loss)(1) | Net Realized and Unrealized Gains (Losses) on Securities(1) | Total from Operations | Dividends from Net Investment Income | Distributions from Realized Capital Gains | Total Dividends and Distributions | Net Asset Value, End of Period | Total Return† | Net Assets End of Period ($Thousands) | Ratio of Expenses to Average Net Assets | Ratio of Expenses to Average Net Assets (Excluding Fees Paid Indirectly) | Ratio of Expenses to Average Net Assets (Excluding Fees Paid Indirectly and Waivers) | Ratio of Net Investment Income (Loss) to Average Net Assets | Portfolio Turnover Rate† | ||||||||||||||||||||||||||||||||||||||||||||||
Real Estate Fund |
| |||||||||||||||||||||||||||||||||||||||||||||||||||||||||||
Class A |
| |||||||||||||||||||||||||||||||||||||||||||||||||||||||||||
2015** | $ | 17.05 | $ | 0.07 | $ | 3.37 | $ | 3.44 | $ | (0.15 | ) | $ | (0.45 | ) | $ | (0.60 | ) | $ | 19.89 | 20.37 | % | $ | 242,717 | 1.14 | % | 1.14 | % | 1.22 | % | 0.78 | % | 27 | % | |||||||||||||||||||||||||||
2014 | 15.42 | 0.29 | 1.64 | 1.93 | (0.30 | ) | — | (0.30 | ) | 17.05 | 12.63 | 226,780 | 1.14 | 1.14 | 1.28 | 1.76 | 57 | |||||||||||||||||||||||||||||||||||||||||||
2013 | 14.97 | 0.14 | 0.50 | 0.64 | (0.19 | ) | — | (0.19 | ) | 15.42 | 4.30 | 207,876 | 1.14 | 1.14 | 1.27 | 0.91 | 74 | |||||||||||||||||||||||||||||||||||||||||||
2012 | 11.67 | 0.08 | 3.34 | 3.42 | (0.12 | ) | — | (0.12 | ) | 14.97 | 29.44 | 191,484 | 1.14 | 1.14 | 1.28 | 0.55 | 68 | |||||||||||||||||||||||||||||||||||||||||||
2011 | 11.58 | 0.04 | 0.25 | 0.29 | (0.20 | ) | — | (0.20 | ) | 11.67 | 2.41 | 142,538 | 1.14 | 1.14 | 1.28 | 0.33 | 83 | |||||||||||||||||||||||||||||||||||||||||||
2010 | 9.42 | 0.05 | 2.46 | 2.51 | (0.35 | )(7) | — | (0.35 | ) | 11.58 | 27.37 | 220,866 | 1.14 | 1.15 | 1.29 | 0.50 | 69 | |||||||||||||||||||||||||||||||||||||||||||
Class I |
| |||||||||||||||||||||||||||||||||||||||||||||||||||||||||||
2015** | $ | 17.03 | $ | 0.07 | $ | 3.35 | $ | 3.42 | $ | (0.12 | ) | $ | (0.45 | ) | $ | (0.57 | ) | $ | 19.88 | 20.30 | % | $ | 768 | 1.39 | % | 1.39 | % | 1.47 | % | 0.70 | % | 27 | % | |||||||||||||||||||||||||||
2014 | 15.39 | 0.25 | 1.64 | 1.89 | (0.25 | ) | — | (0.25 | ) | 17.03 | 12.33 | 622 | 1.36 | 1.36 | 1.52 | 1.51 | 57 | |||||||||||||||||||||||||||||||||||||||||||
2013 | 14.93 | 0.10 | 0.51 | 0.61 | (0.15 | ) | — | (0.15 | ) | 15.39 | 4.09 | 565 | 1.36 | 1.36 | 1.52 | 0.65 | 74 | |||||||||||||||||||||||||||||||||||||||||||
2012 | 11.64 | 0.05 | 3.33 | 3.38 | (0.09 | ) | — | (0.09 | ) | 14.93 | 29.16 | 606 | 1.36 | 1.36 | 1.53 | 0.33 | 68 | |||||||||||||||||||||||||||||||||||||||||||
2011 | 11.57 | (0.01 | ) | 0.28 | 0.27 | (0.20 | ) | — | (0.20 | ) | 11.64 | 2.19 | 445 | 1.36 | 1.36 | 1.53 | (0.07 | ) | 83 | |||||||||||||||||||||||||||||||||||||||||
2010 | 9.41 | — | * | 2.49 | 2.49 | (0.33 | )(7) | — | (0.33 | ) | 11.57 | 27.12 | 306 | 1.36 | 1.37 | 1.54 | 0.00 | 69 | ||||||||||||||||||||||||||||||||||||||||||
Class Y@ |
| |||||||||||||||||||||||||||||||||||||||||||||||||||||||||||
2015** | $ | 19.00 | $ | 0.06 | $ | 0.84 | $ | 0.90 | $ | — | $ | — | $ | — | $ | 19.90 | 4.74 | % | $ | 20,164 | 0.89 | % | 0.89 | % | 0.97 | % | 1.29 | % | 27 | % | ||||||||||||||||||||||||||||||
Enhanced Income Fund |
| |||||||||||||||||||||||||||||||||||||||||||||||||||||||||||
Class A |
| |||||||||||||||||||||||||||||||||||||||||||||||||||||||||||
2015** | $ | 7.60 | $ | 0.07 | $ | (0.01 | ) | $ | 0.06 | $ | (0.07 | ) | $ | — | $ | (0.07 | ) | $ | 7.59 | 0.77 | % | $ | 194,486 | 0.60 | % | 0.60 | % | 1.00 | % | 1.76 | % | 44 | % | |||||||||||||||||||||||||||
2014 | 7.61 | 0.14 | (0.01 | ) | 0.13 | (0.14 | ) | — | (0.14 | ) | 7.60 | 1.69 | 230,910 | 0.60 | 0.60 | 1.05 | 1.78 | 106 | ||||||||||||||||||||||||||||||||||||||||||
2013 | 7.57 | 0.16 | 0.03 | 0.19 | (0.15 | ) | — | (0.15 | ) | 7.61 | 2.50 | 194,821 | 0.60 | 0.60 | 1.05 | 2.08 | 170 | |||||||||||||||||||||||||||||||||||||||||||
2012 | 7.36 | 0.18 | 0.20 | 0.38 | (0.17 | ) | — | (0.17 | ) | 7.57 | 5.30 | 161,037 | 0.60 | 0.60 | 1.05 | 2.41 | 198 | |||||||||||||||||||||||||||||||||||||||||||
2011 | 7.46 | 0.20 | (0.14 | ) | 0.06 | (0.16 | ) | — | (0.16 | ) | 7.36 | 0.83 | 158,936 | 0.60 | 0.60 | 1.05 | 2.61 | 174 | ||||||||||||||||||||||||||||||||||||||||||
2010 | 7.21 | 0.18 | 0.30 | 0.48 | (0.23 | ) | — | (0.23 | ) | 7.46 | 6.78 | 137,223 | 0.60 | 0.60 | 1.06 | 2.45 | 77 | |||||||||||||||||||||||||||||||||||||||||||
Class I |
| |||||||||||||||||||||||||||||||||||||||||||||||||||||||||||
2015** | $ | 7.58 | $ | 0.06 | $ | (0.01 | ) | $ | 0.05 | $ | (0.06 | ) | $ | — | $ | (0.06 | ) | $ | 7.57 | 0.64 | % | $ | 367 | 0.85 | % | 0.85 | % | 1.25 | % | 1.51 | % | 44 | % | |||||||||||||||||||||||||||
2014 | 7.59 | 0.12 | (0.01 | ) | 0.11 | (0.12 | ) | — | (0.12 | ) | 7.58 | 1.44 | 376 | 0.85 | 0.85 | 1.30 | 1.53 | 106 | ||||||||||||||||||||||||||||||||||||||||||
2013 | 7.56 | 0.14 | 0.02 | 0.16 | (0.13 | ) | — | (0.13 | ) | 7.59 | 2.17 | 368 | 0.85 | 0.85 | 1.30 | 1.85 | 170 | |||||||||||||||||||||||||||||||||||||||||||
2012 | 7.36 | 0.15 | 0.21 | 0.36 | (0.16 | ) | — | (0.16 | ) | 7.56 | 4.93 | 69 | 0.85 | 0.85 | 1.30 | 2.11 | 198 | |||||||||||||||||||||||||||||||||||||||||||
2011 | 7.45 | 0.18 | (0.12 | ) | 0.06 | (0.15 | ) | — | (0.15 | ) | 7.36 | 0.72 | 19 | 0.85 | 0.85 | 1.30 | 2.36 | 174 | ||||||||||||||||||||||||||||||||||||||||||
2010 | 7.20 | 0.16 | 0.29 | 0.45 | (0.20 | ) | — | (0.20 | ) | 7.45 | 6.35 | 16 | 0.85 | 0.85 | 1.33 | 2.21 | 77 | |||||||||||||||||||||||||||||||||||||||||||
Class Y@ |
| |||||||||||||||||||||||||||||||||||||||||||||||||||||||||||
2015** | $ | 7.51 | $ | 0.03 | $ | 0.05 | $ | 0.08 | $ | — | $ | — | $ | — | $ | 7.59 | 1.07 | % | $ | 33,492 | 0.46 | % | 0.46 | % | 0.75 | % | 1.95 | % | 44 | % | ||||||||||||||||||||||||||||||
Core Fixed Income Fund |
| |||||||||||||||||||||||||||||||||||||||||||||||||||||||||||
Class A |
| �� | ||||||||||||||||||||||||||||||||||||||||||||||||||||||||||
2015** | $ | 11.47 | $ | 0.13 | $ | 0.26 | $ | 0.39 | $ | (0.13 | ) | $ | — | $ | (0.13 | ) | $ | 11.73 | 3.40 | % | $ | 2,106,378 | 0.67 | % | 0.67 | % | 0.85 | % | 2.21 | % | 174 | % | ||||||||||||||||||||||||||||
2014 | 11.20 | 0.29 | 0.28 | 0.57 | (0.30 | ) | — | (0.30 | ) | 11.47 | 5.14 | 2,041,268 | 0.67 | 0.67 | 0.85 | 2.59 | 343 | |||||||||||||||||||||||||||||||||||||||||||
2013 | 11.64 | 0.30 | (0.42 | ) | (0.12 | ) | (0.32 | ) | — | (0.32 | ) | 11.20 | (1.09 | ) | 1,904,623 | 0.67 | 0.67 | 0.85 | 2.57 | 342 | ||||||||||||||||||||||||||||||||||||||||
2012 | 11.14 | 0.33 | 0.61 | 0.94 | (0.35 | ) | (0.09 | ) | (0.44 | ) | 11.64 | 8.67 | 2,172,794 | 0.67 | 0.67 | 0.85 | 2.93 | 349 | ||||||||||||||||||||||||||||||||||||||||||
2011 | 10.93 | 0.36 | 0.22 | 0.58 | (0.37 | ) | — | (0.37 | ) | 11.14 | 5.43 | 2,185,135 | 0.71 | (4) | 0.71 | (4) | 0.89 | (4) | 3.25 | 473 | ||||||||||||||||||||||||||||||||||||||||
2010 | 9.98 | 0.44 | 0.95 | 1.39 | (0.44 | ) | — | (0.44 | ) | 10.93 | 14.25 | 2,335,314 | 0.67 | 0.67 | 0.85 | 4.20 | 283 | |||||||||||||||||||||||||||||||||||||||||||
Class I |
| |||||||||||||||||||||||||||||||||||||||||||||||||||||||||||
2015** | $ | 11.46 | $ | 0.12 | $ | 0.26 | $ | 0.38 | $ | (0.12 | ) | $ | — | $ | (0.12 | ) | $ | 11.72 | 3.29 | % | $ | 9,852 | 0.89 | % | 0.89 | % | 1.10 | % | 1.99 | % | 174 | % | ||||||||||||||||||||||||||||
2014 | 11.19 | 0.27 | 0.27 | 0.54 | (0.27 | ) | — | (0.27 | ) | 11.46 | 4.91 | 10,488 | 0.89 | 0.89 | 1.08 | 2.38 | 343 | |||||||||||||||||||||||||||||||||||||||||||
2013 | 11.63 | 0.27 | (0.42 | ) | (0.15 | ) | (0.29 | ) | — | (0.29 | ) | 11.19 | (1.31 | ) | 14,128 | �� | 0.89 | 0.89 | 1.10 | 2.34 | 342 | |||||||||||||||||||||||||||||||||||||||
2012 | 11.13 | 0.31 | 0.61 | 0.92 | (0.33 | ) | (0.09 | ) | (0.42 | ) | 11.63 | 8.44 | 14,944 | 0.89 | 0.89 | 1.10 | 2.71 | 349 | ||||||||||||||||||||||||||||||||||||||||||
2011 | 10.92 | 0.33 | 0.23 | 0.56 | (0.35 | ) | — | (0.35 | ) | 11.13 | 5.20 | 15,701 | 0.93 | (4) | 0.93 | (4) | 1.14 | (4) | 3.03 | 473 | ||||||||||||||||||||||||||||||||||||||||
2010 | 9.97 | 0.41 | 0.96 | 1.37 | (0.42 | ) | — | (0.42 | ) | 10.92 | 14.01 | 17,445 | 0.89 | 0.89 | 1.10 | 3.96 | 283 | |||||||||||||||||||||||||||||||||||||||||||
U.S. Fixed Income Fund |
| |||||||||||||||||||||||||||||||||||||||||||||||||||||||||||
Class A |
| |||||||||||||||||||||||||||||||||||||||||||||||||||||||||||
2015** | $ | 10.33 | $ | 0.10 | $ | 0.25 | $ | 0.35 | $ | (0.10 | ) | $ | (0.02 | ) | $ | (0.12 | ) | $ | 10.56 | 3.38 | % | $ | 1,072,008 | 0.66 | % | 0.66 | % | 0.85 | % | 1.84 | % | 157 | % | |||||||||||||||||||||||||||
2014 | 10.15 | 0.21 | 0.18 | 0.39 | (0.21 | ) | — | (0.21 | ) | 10.33 | 3.91 | 1,098,480 | 0.66 | 0.66 | 0.86 | 2.02 | 345 | |||||||||||||||||||||||||||||||||||||||||||
2013 | 10.84 | 0.19 | (0.36 | ) | (0.17 | ) | (0.21 | ) | (0.31 | ) | (0.52 | ) | 10.15 | (1.61 | ) | 1,022,233 | 0.66 | 0.66 | 0.86 | 1.85 | 319 | |||||||||||||||||||||||||||||||||||||||
2012 | 10.70 | 0.25 | 0.44 | 0.69 | (0.27 | ) | (0.28 | ) | (0.55 | ) | 10.84 | 6.68 | 898,450 | 0.66 | 0.66 | 0.87 | 2.34 | 322 | ||||||||||||||||||||||||||||||||||||||||||
2011 | 10.81 | 0.30 | 0.26 | 0.56 | (0.32 | ) | (0.35 | ) | (0.67 | ) | 10.70 | 5.43 | 972,449 | 0.66 | 0.66 | 0.87 | 2.85 | 337 | ||||||||||||||||||||||||||||||||||||||||||
2010 | 10.28 | 0.33 | 0.60 | 0.93 | (0.36 | ) | (0.04 | ) | (0.40 | ) | 10.81 | 9.22 | 877,709 | 0.66 | 0.66 | 0.86 | 3.12 | 299 | ||||||||||||||||||||||||||||||||||||||||||
Class Y@ |
| |||||||||||||||||||||||||||||||||||||||||||||||||||||||||||
2015** | $ | 10.44 | $ | 0.05 | $ | 0.12 | $ | 0.17 | $ | (0.05 | ) | $ | — | $ | (0.05 | ) | $ | 10.56 | 1.61 | % | $ | 96,834 | 0.41 | % | 0.41 | % | 0.60 | % | 1.98 | % | 157 | % | ||||||||||||||||||||||||||||
| 236 | SEI Institutional Managed Trust / Semi-Annual Report / March 31, 2015 |
| Net Asset Value, Beginning of Period | Net Investment Income/ (loss)(1) | Net Realized and Unrealized Gains (Losses) on Securities(1) | Total from Operations | Dividends from Net Investment Income | Distributions from Realized Capital Gains | Total Dividends and Distributions | Net Asset Value, End of Period | Total Return† | Net Assets End of Period ($Thousands) | Ratio of Expenses to Average Net Assets | Ratio of Expenses to Average Net Assets (Excluding Fees Paid Indirectly) | Ratio of Expenses to Average Net Assets (Excluding Fees Paid Indirectly and Waivers) | Ratio of Net Investment Income (Loss) to Average Net Assets | Portfolio Turnover Rate† | ||||||||||||||||||||||||||||||||||||||||||||||
High Yield Bond Fund |
| |||||||||||||||||||||||||||||||||||||||||||||||||||||||||||
Class A |
| |||||||||||||||||||||||||||||||||||||||||||||||||||||||||||
2015** | $ | 7.70 | $ | 0.20 | $ | (0.13 | ) | $ | 0.07 | $ | (0.20 | ) | $ | (0.04 | ) | $ | (0.24 | ) | $ | 7.53 | 1.03 | % | $ | 1,658,127 | 0.89 | % | 0.89 | % | 1.07 | % | 5.42 | % | 24 | % | ||||||||||||||||||||||||||
2014 | 7.68 | 0.43 | 0.06 | ‡‡ | 0.49 | (0.43 | ) | (0.04 | ) | (0.47 | ) | 7.70 | 6.49 | 1,707,482 | 0.89 | 0.89 | 1.12 | 5.47 | 73 | |||||||||||||||||||||||||||||||||||||||||
2013 | 7.59 | 0.48 | 0.07 | 0.55 | (0.46 | ) | — | (0.46 | ) | 7.68 | 7.39 | 1,989,355 | 0.89 | 0.89 | 1.12 | 6.13 | 74 | |||||||||||||||||||||||||||||||||||||||||||
2012 | 6.92 | 0.53 | 0.68 | 1.21 | (0.51 | ) | (0.03 | ) | (0.54 | ) | 7.59 | 18.04 | 1,752,357 | 0.89 | 0.89 | 1.12 | 7.23 | 65 | ||||||||||||||||||||||||||||||||||||||||||
2011 | 7.27 | 0.55 | (0.32 | ) | 0.23 | (0.54 | ) | (0.04 | ) | (0.58 | ) | 6.92 | 2.96 | 1,316,158 | 0.89 | 0.89 | 1.13 | 7.38 | 82 | |||||||||||||||||||||||||||||||||||||||||
2010 | 6.52 | 0.64 | 0.74 | 1.38 | (0.61 | ) | (0.02 | ) | (0.63 | ) | 7.27 | 21.98 | 1,503,070 | 0.89 | 0.89 | 1.13 | 9.22 | 113 | ||||||||||||||||||||||||||||||||||||||||||
Class I |
| |||||||||||||||||||||||||||||||||||||||||||||||||||||||||||
2015** | $ | 7.48 | $ | 0.19 | $ | (0.13 | ) | $ | 0.06 | $ | (0.19 | ) | $ | (0.04 | ) | $ | (0.23 | ) | $ | 7.31 | 0.86 | % | $ | 7,140 | 1.11 | % | 1.11 | % | 1.32 | % | 5.28 | % | 24 | % | ||||||||||||||||||||||||||
2014 | 7.49 | 0.40 | 0.03 | 0.43 | (0.40 | ) | (0.04 | ) | (0.44 | ) | 7.48 | 5.81 | 3,794 | 1.11 | 1.11 | 1.37 | 5.24 | 73 | ||||||||||||||||||||||||||||||||||||||||||
2013 | 7.40 | 0.45 | 0.07 | 0.52 | (0.43 | ) | — | (0.43 | ) | 7.49 | 7.19 | 38,849 | 1.11 | 1.11 | 1.38 | 6.07 | 74 | |||||||||||||||||||||||||||||||||||||||||||
2012 | 6.82 | 0.50 | 0.59 | 1.09 | (0.48 | ) | (0.03 | ) | (0.51 | ) | 7.40 | 16.54 | 14,161 | 1.11 | 1.11 | 1.38 | 6.91 | 65 | ||||||||||||||||||||||||||||||||||||||||||
2011 | 7.28 | 0.53 | (0.42 | ) | 0.11 | (0.53 | ) | (0.04 | ) | (0.57 | ) | 6.82 | 1.19 | 915 | 1.11 | 1.11 | 1.37 | 7.06 | 82 | |||||||||||||||||||||||||||||||||||||||||
2010 | 6.53 | 0.63 | 0.74 | 1.37 | (0.60 | ) | (0.02 | ) | (0.62 | ) | 7.28 | 21.76 | 1,846 | 1.11 | 1.11 | 1.40 | 8.96 | 113 | ||||||||||||||||||||||||||||||||||||||||||
Class Y@ |
| |||||||||||||||||||||||||||||||||||||||||||||||||||||||||||
2015** | $ | 7.44 | $ | 0.10 | $ | 0.09 | $ | 0.19 | $ | (0.10 | ) | $ | — | $ | (0.10 | ) | $ | 7.53 | 2.43 | % | $ | 151,777 | 0.64 | % | 0.64 | % | 0.82 | % | 5.65 | % | 24 | % | ||||||||||||||||||||||||||||
Real Return Fund |
| |||||||||||||||||||||||||||||||||||||||||||||||||||||||||||
Class A |
| |||||||||||||||||||||||||||||||||||||||||||||||||||||||||||
2015** | $ | 10.08 | $ | (0.24 | ) | $ | 0.11 | $ | (0.13 | ) | $ | (0.01 | ) | $ | — | $ | (0.01 | ) | $ | 9.94 | (1.27 | )% | $ | 258,083 | 0.45 | % | 0.45 | % | 0.79 | % | (2.39 | )% | 12 | % | ||||||||||||||||||||||||||
2014 | 10.19 | 0.05 | (0.08 | ) | (0.03 | ) | (0.04 | ) | (0.04 | ) | (0.08 | ) | 10.08 | (0.30 | ) | 284,944 | 0.45 | 0.45 | 0.84 | 0.51 | 34 | |||||||||||||||||||||||||||||||||||||||
2013 | 10.67 | 0.05 | (0.23 | ) | (0.18 | ) | (0.06 | ) | (0.24 | ) | (0.30 | ) | 10.19 | (1.72 | ) | 308,821 | 0.45 | 0.45 | 0.84 | 0.48 | 72 | |||||||||||||||||||||||||||||||||||||||
2012 | 10.60 | 0.05 | 0.23 | 0.28 | (0.14 | ) | (0.07 | ) | (0.21 | ) | 10.67 | 2.66 | 283,646 | 0.45 | 0.45 | 0.85 | 0.48 | 137 | ||||||||||||||||||||||||||||||||||||||||||
2011 | 10.51 | 0.33 | 0.13 | 0.46 | (0.27 | ) | (0.10 | ) | (0.37 | ) | 10.60 | 4.51 | 373,560 | 0.45 | 0.45 | 0.85 | 3.06 | 77 | ||||||||||||||||||||||||||||||||||||||||||
2010 | 10.19 | 0.12 | 0.40 | 0.52 | (0.19 | ) | (0.01 | ) | (0.20 | ) | 10.51 | 5.20 | 240,925 | 0.45 | 0.45 | 0.86 | 1.18 | 94 | ||||||||||||||||||||||||||||||||||||||||||
Class Y@ |
| |||||||||||||||||||||||||||||||||||||||||||||||||||||||||||
2015** | $ | 9.91 | $ | (0.17 | ) | $ | 0.21 | $ | 0.04 | $ | — | $ | — | $ | — | $ | 9.95 | 0.40 | % | $ | 26,552 | 0.35 | % | 0.35 | % | 0.54 | % | (7.22 | )% | 12 | % | |||||||||||||||||||||||||||||
Multi-Strategy Alternative Fund |
| |||||||||||||||||||||||||||||||||||||||||||||||||||||||||||
Class A |
| |||||||||||||||||||||||||||||||||||||||||||||||||||||||||||
2015** | $ | 10.05 | $ | 0.15 | $ | (0.05 | ) | $ | 0.10 | $ | (0.16 | ) | $ | — | $ | (0.16 | ) | $ | 9.99 | 0.97 | % | $ | 531,499 | 0.50 | % | 0.50 | % | 2.07 | % | 3.11 | % | 31 | % | |||||||||||||||||||||||||||
2014 | 9.79 | 0.06 | 0.28 | 0.34 | (0.08 | ) | — | (0.08 | ) | 10.05 | 3.45 | 498,090 | 0.64 | (12) | 0.64 | (12) | 2.19 | (12) | 0.64 | 72 | ||||||||||||||||||||||||||||||||||||||||
2013 | 9.62 | 0.07 | 0.15 | 0.22 | (0.05 | ) | — | (0.05 | ) | 9.79 | 2.33 | 426,733 | 0.73 | (16) | 0.73 | (16) | 2.22 | (16) | 0.71 | 139 | ||||||||||||||||||||||||||||||||||||||||
2012 | 9.57 | 0.07 | 0.17 | 0.24 | (0.19 | ) | — | (0.19 | ) | 9.62 | 2.50 | 334,914 | 0.65 | (11) | 0.65 | (11) | 2.15 | (11) | 0.68 | 44 | ||||||||||||||||||||||||||||||||||||||||
2011 | 9.93 | 0.20 | (0.41 | ) | (0.21 | ) | (0.15 | ) | — | (0.15 | ) | 9.57 | (2.16 | ) | 292,006 | 0.50 | 0.50 | 2.13 | 1.76 | 25 | ||||||||||||||||||||||||||||||||||||||||
2010(6) | 10.00 | (0.02 | ) | (0.05 | ) | (0.07 | ) | — | — | — | 9.93 | (0.70 | ) | 191,055 | 0.50 | 0.50 | 2.19 | (0.42 | ) | 49 | ||||||||||||||||||||||||||||||||||||||||
Multi-Asset Accumulation Fund |
| |||||||||||||||||||||||||||||||||||||||||||||||||||||||||||
Class A |
| |||||||||||||||||||||||||||||||||||||||||||||||||||||||||||
2015** | $ | 10.89 | $ | (0.10 | ) | $ | 0.77 | $ | 0.67 | $ | (0.11 | ) | $ | (0.88 | ) | $ | (0.99 | ) | $ | 10.57 | 6.50 | % | $ | 1,923,716 | 1.17 | % | 1.17 | % | 1.32 | % | (1.80 | )% | 40 | % | ||||||||||||||||||||||||||
2014 | 10.30 | (0.05 | ) | 0.96 | 0.91 | — | * | (0.32 | ) | (0.32 | ) | 10.89 | 9.11 | 1,865,846 | 1.17 | 1.17 | 1.38 | (0.47 | ) | 55 | ||||||||||||||||||||||||||||||||||||||||
2013 | 10.51 | (0.05 | ) | 0.17 | 0.12 | (0.01 | ) | (0.32 | ) | (0.33 | ) | 10.30 | 1.12 | 1,414,563 | 1.17 | 1.17 | 1.37 | (0.52 | ) | 104 | ||||||||||||||||||||||||||||||||||||||||
2012(8) | 10.00 | (0.02 | ) | 0.57 | 0.55 | (0.04 | ) | — | (0.04 | ) | 10.51 | 5.51 | 959,727 | 1.17 | 1.17 | 1.39 | (0.46 | ) | 38 | |||||||||||||||||||||||||||||||||||||||||
Class Y@ |
| |||||||||||||||||||||||||||||||||||||||||||||||||||||||||||
2015** | $ | 10.11 | $ | (0.06 | ) | $ | 0.52 | $ | 0.46 | $ | — | $ | — | $ | — | $ | 10.57 | 4.55 | % | $ | 221,912 | 0.92 | % | 0.92 | % | 1.07 | % | (2.30 | )% | 40 | % | |||||||||||||||||||||||||||||
Multi-Asset Income Fund |
| |||||||||||||||||||||||||||||||||||||||||||||||||||||||||||
Class A |
| |||||||||||||||||||||||||||||||||||||||||||||||||||||||||||
2015** | $ | 10.60 | $ | 0.27 | $ | 0.15 | $ | 0.42 | $ | (0.21 | ) | $ | (0.05 | ) | $ | (0.26 | ) | $ | 10.76 | 4.03 | % | $ | 568,396 | 0.85 | %(21) | 0.85 | %(21) | 1.23 | %(21) | 5.13 | %(21) | 18 | % | |||||||||||||||||||||||||||
2014 | 10.60 | 0.51 | 0.13 | (5) | 0.64 | (0.47 | ) | (0.17 | ) | (0.64 | ) | 10.60 | 6.19 | 539,504 | 0.83 | (13) | 0.83 | (13) | 1.27 | (13) | 4.76 | 124 | ||||||||||||||||||||||||||||||||||||||
2013 | 10.35 | 0.67 | 0.17 | (5) | 0.84 | (0.52 | ) | (0.07 | ) | (0.59 | ) | 10.60 | 8.24 | 230,356 | 0.98 | (17) | 0.98 | (17) | 1.40 | (17) | 6.22 | 89 | ||||||||||||||||||||||||||||||||||||||
2012(8) | 10.00 | 0.23 | 0.30 | 0.53 | (0.18 | ) | — | (0.18 | ) | 10.35 | 5.37 | 84,499 | 0.89 | (10) | 0.89 | (10) | 1.36 | (10) | 4.88 | 25 | ||||||||||||||||||||||||||||||||||||||||
Class Y@ |
| |||||||||||||||||||||||||||||||||||||||||||||||||||||||||||
2015** | $ | 10.62 | $ | 0.17 | $ | 0.09 | $ | 0.26 | $ | (0.12 | ) | $ | — | $ | (0.12 | ) | $ | 10.76 | 2.46 | % | $ | 36,008 | 0.75 | %(21) | 0.75 | %(21) | 0.98 | %(21) | 6.63 | % | 18 | % | ||||||||||||||||||||||||||||
Multi-Asset Inflation Managed Fund |
| |||||||||||||||||||||||||||||||||||||||||||||||||||||||||||
Class A |
| |||||||||||||||||||||||||||||||||||||||||||||||||||||||||||
2015** | $ | 9.39 | $ | (0.09 | ) | $ | (0.29 | ) | $ | (0.38 | ) | $ | — | $ | — | $ | — | $ | 9.01 | (4.05 | )% | $ | 883,559 | 1.08 | %(19) | 1.08 | %(19) | 1.31 | %(19) | (2.28 | )% | 62 | % | |||||||||||||||||||||||||||
2014 | 9.42 | 0.06 | (0.09 | ) | (0.03 | ) | — | — | — | 9.39 | (0.32 | ) | 923,541 | 1.02 | (18) | 1.02 | (18) | 1.30 | (18) | 0.65 | 119 | |||||||||||||||||||||||||||||||||||||||
2013 | 10.10 | 0.06 | (0.69 | ) | (0.63 | ) | (0.04 | ) | (0.01 | ) | (0.05 | ) | 9.42 | (6.27 | ) | 766,368 | 0.93 | (14) | 0.93 | (14) | 1.20 | (14) | 0.59 | 61 | ||||||||||||||||||||||||||||||||||||
2012(8) | 10.00 | 0.02 | 0.13 | 0.15 | (0.05 | )(3) | — | (0.05 | ) | 10.10 | 1.54 | 540,255 | 0.93 | (15) | 0.93 | (15) | 1.22 | (15) | 0.47 | 19 | ||||||||||||||||||||||||||||||||||||||||
Class Y@ |
| |||||||||||||||||||||||||||||||||||||||||||||||||||||||||||
2015** | $ | 8.96 | $ | (0.07 | ) | $ | 0.13 | $ | 0.06 | $ | — | $ | — | $ | — | $ | 9.02 | 0.67 | % | $ | 90,709 | 1.06 | %(20) | 1.06 | %(20) | 1.12 | %(20) | (3.28 | )% | 62 | % | |||||||||||||||||||||||||||||
| SEI Institutional Managed Trust / Semi-Annual Report / March 31, 2015 | 237 |
Financial Highlights/Consolidated Financial Highlights
(concluded)
For the six month period ended March 31, 2015 (Unaudited) and the years or periods ended September 30, (unless otherwise indicated)
For a Share Outstanding Throughout the Periods
| Net Asset Value, Beginning of Period | Net Investment Loss(1) | Net Realized and Unrealized Gains (Losses) on Securities(1) | Total from Operations | Dividends from Net Investment Income | Distributions from Realized Capital Gains | Total Dividends and Distributions | Net Asset Value, End of Period | Total Return† | Net Assets End of Period ($Thousands) | Ratio of Expenses to Average Net Assets | Ratio of Expenses to Average Net Assets (Excluding Fees Paid Indirectly) | Ratio of Expenses to Average Net Assets (Excluding Fees Paid Indirectly and Waivers) | Ratio of Net Investment Loss to Average Net Assets | Portfolio Turnover Rate† | ||||||||||||||||||||||||||||||||||||||||||||||
Multi-Asset Capital Stability Fund |
| |||||||||||||||||||||||||||||||||||||||||||||||||||||||||||
Class A |
| |||||||||||||||||||||||||||||||||||||||||||||||||||||||||||
2015** | $ | 10.25 | $ | (0.03 | ) | $ | 0.11 | $ | 0.08 | $ | 0.00 | $ | (0.19 | ) | $ | (0.19 | ) | $ | 10.14 | 0.87 | % | $ | 519,827 | 0.62 | % | 0.62 | % | 0.97 | % | (0.57 | )% | 94 | % | |||||||||||||||||||||||||||
2014 | 9.94 | (0.01 | ) | 0.34 | 0.33 | — | (0.02 | ) | (0.02 | ) | 10.25 | 3.37 | 541,602 | 0.62 | 0.62 | 1.02 | (0.12 | ) | 246 | |||||||||||||||||||||||||||||||||||||||||
2013 | 10.14 | (0.02 | ) | (0.10 | ) | (0.12 | ) | (0.01 | ) | (0.07 | ) | (0.08 | ) | 9.94 | (1.23 | ) | 486,926 | 0.62 | 0.62 | 1.02 | (0.22 | ) | 410 | |||||||||||||||||||||||||||||||||||||
2012(8) | 10.00 | (0.01 | ) | 0.15 | 0.14 | — | * | — | — | * | 10.14 | 1.40 | 347,861 | 0.62 | 0.62 | 1.02 | (0.29 | ) | 180 | |||||||||||||||||||||||||||||||||||||||||
Class Y@ |
| |||||||||||||||||||||||||||||||||||||||||||||||||||||||||||
2015** | $ | 10.06 | $ | (0.02 | ) | $ | 0.10 | $ | 0.08 | $ | — | $ | — | $ | — | $ | 10.14 | 0.80 | % | $ | 54,302 | 0.52 | % | 0.52 | % | 0.71 | % | (0.71 | )% | 94 | % | |||||||||||||||||||||||||||||
Long/Short Alternative Fund |
| |||||||||||||||||||||||||||||||||||||||||||||||||||||||||||
Class A |
| |||||||||||||||||||||||||||||||||||||||||||||||||||||||||||
2015(9) | $ | 10.00 | $ | (0.03 | ) | $ | 0.26 | $ | 0.23 | $ | — | $ | — | $ | — | $ | 10.23 | 2.30 | % | $ | 37,069 | 1.16 | % | 1.16 | % | 1.41 | % | (0.95 | )% | 133 | % | |||||||||||||||||||||||||||||
| † | Returns and turnover rates are for the period indicated and have not been annualized. |
| * | Amount represents less than $0.01. |
| @ | Class Y commenced operations on December 31, 2014. All ratios for the period have been annualized. |
| ** | For the six month period ended March 31, 2015. All ratios for the period have been annualized. |
| ‡‡ | Includes redemption fees of $0.03 per share. |
| (1) | Per share net investment income and net realized and unrealized gains/(losses) calculated using average shares. |
| (2) | Includes return of capital of less than $0.01. |
| (3) | Includes return of capital of $0.04. |
| (4) | The expense ratio includes interest expense. Had this expense been excluded the ratios would have been 0.67%, 0.67% and 0.85% for Class A and 0.89%, 0.89% and 1.10% for Class I, respectively. |
| (5) | The amount shown for a share outstanding throughout the period does not accord with the aggregate net gains on investments for that period because of the sales and repurchase of Fund shares in relation to fluctuating market value of the investments of the Fund. |
| (6) | Commenced operations on March 31, 2010. All ratios for the period have been annualized. |
| (7) | Includes return of capital of $0.10. |
| (8) | Commenced operations on April 9, 2012. All ratios for the period have been annualized. |
| (9) | Commenced operations on December 19, 2014. All ratios for the period have been annualized. |
| (10) | The expense ratio includes interest expense. Had this expense been excluded the ratios would have been 0.76%, 0.76% and 1.23%. |
| (11) | The expense ratio includes dividend expense. Had this expense been excluded the ratios would have been 0.63%, 0.63% and 2.13%. |
| (12) | The expense ratio includes dividend expense and other expenses outside the cap. Had this expense been excluded the ratios would have been 0.58%, 0.58% and 2.13%. |
| (13) | The expense ratio includes interest expense. Had this expense been excluded the ratios would have been 0.80%, 0.80% and 1.24%. |
| (14) | The expense ratio includes interest expense. Had this expense been excluded the ratios would have been 0.90%, 0.90% and 1.17%. |
| (15) | The expense ratio includes interest expense. Had this expense been excluded the ratios would have been 0.90%, 0.90% and 1.19%. |
| (16) | The expense ratio includes dividend expense and other expenses outside of the cap. Had this expense been excluded the ratios would have been 0.60%, 0.60% and 2.09%. |
| (17) | The expense ratio includes interest expense. Had this expense been excluded the ratios would have been 0.80%, 0.80% and 1.22% |
| (18) | The expense ratio includes dividend and interest expense and other expenses outside the cap. Had this expense been excluded the ratios would have been 0.90%, 0.90% and 1.18%. |
| (19) | The expense ratio includes dividend and interest expense and other expenses outside the cap. Had these expenses been excluded the ratios would have been 0.90%, 0.90%, and 1.17%. |
| (20) | The expense ratio includes dividend and interest expense and other expenses outside the cap. Had these expenses been excluded, the ratios would have been 0.65%, 0.65%, and 1.04%. |
| (21) | The expense ratio includes interest expense. Had this expense been excluded the ratios would have been unchanged. |
Amounts designated as “—” are $0 or have been rounded to $0.
The accompanying notes are an integral part of the financial statements.
| 238 | SEI Institutional Managed Trust / Semi-Annual Report / March 31, 2015 |
Notes to Financial Statements/Consolidated Notes to Financial Statements (Unaudited)
March 31, 2015
1. ORGANIZATION
SEI Institutional Managed Trust (the “Trust”) is organized as a Massachusetts business trust under a Declaration of Trust dated October 20, 1986.
The Trust is registered under the Investment Company Act of 1940, as amended, as an open-end investment company with 26 funds: Large Cap, Large Cap Value, Large Cap Growth, Tax-Managed Large Cap, S&P 500 Index, Small Cap, Small Cap Value, Small Cap Growth, Tax-Managed Small/Mid Cap, Mid-Cap, U.S. Managed Volatility, Global Managed Volatility, Tax-Managed Managed Volatility, Real Estate, Enhanced Income, Core Fixed Income, U.S. Fixed Income, High Yield Bond, Real Return, Prime Obligation, Multi-Strategy Alternative, Multi-Asset Accumulation, Multi-Asset Income, Multi-Asset Inflation Managed, Multi-Asset Capital Stability Funds, and Long/Short Alternative (each a “Fund,” collectively the “Funds”) each of which are diversified Funds, with the exception of the Real Estate, Multi-Asset Accumulation, Multi-Asset Inflation Managed and Long/Short Alternative Funds.
The Accumulation Commodity Strategy Subsidiary, Ltd. and Inflation Commodity Strategy Subsidiary, Ltd. are both wholly-owned subsidiaries of the Multi-Asset Accumulation and Multi-Asset Inflation Managed Funds, respectively, (each a “Subsidiary”, collectively the “Subsidiaries”). Each Subsidiary is organized under the laws of the Cayman Islands as an exempt limited company. Information regarding the Multi-Asset Accumulation and Multi-Asset Inflation Managed Funds and their respective subsidiaries have been consolidated in the Consolidated Schedule of Investments, Consolidated Statement of Assets and Liabilities, Consolidated Statement of Operations, Consolidated Statement of Changes in Net Assets and Consolidated Statement of Cash Flows.
The Trust is registered to offer: Class A shares of the Funds; Class E shares of the S&P 500 Fund; Class I shares of the Large Cap, Large Cap Value, Large Cap Growth, S&P 500 Index, Small Cap, Small Cap Value, Small Cap Growth, Mid-Cap, U.S. Managed Volatility, Global Managed Volatility, Real Estate, Enhanced Income, Core Fixed Income, U.S. Fixed Income, High Yield Bond and Real Return Funds; Class Y shares of the Large Cap, Large Cap Value, Large Cap Growth, Tax-Managed Large Cap Fund, Small Cap, Small Cap Value, Small Cap Growth, Tax-Managed Small/Mid Cap, Mid-Cap, U.S. Managed Volatility, Global Managed Volatility, Tax-Managed Managed Volatility, Real Estate, Enhanced Income, Core Fixed Income, U.S. Fixed Income, High Yield Bond, Real Return, Multi-Strategy Alternative, Multi-Asset Accumulation, Multi-Asset Income, Multi-Asset Inflation Managed and Multi-Asset Capital Stability Funds and Long/Short Alternative. The assets of each Fund are segregated, and a shareholder’s interest is limited to the Fund in which shares are held. The Funds’ prospectuses provide a description of each Fund’s investment objective and its principal strategies and risks.
As of March 31, 2015, the Prime Obligation Fund has not yet commenced operations.
Class Y commenced operations on December 31, 2014. Class T closed on December 30, 2014.
The Long/Short Alternative Fund commenced operations on December 19, 2014.
2. SIGNIFICANT ACCOUNTING POLICIES
The following is a summary of the significant accounting policies followed by the Funds.
Use of Estimates — The Funds are investment companies in conformity with accounting principles generally accepted in the United States of America (“U.S. GAAP”). Therefore, the Funds follow the accounting and reporting guidelines for investment companies. The preparation of financial statements, in conformity with U.S. GAAP requires management to make estimates and assumptions that affect the reported amounts of assets and liabilities and disclosure of contingent assets and liabilities as of the date of the financial statements and the reported amounts of increases and decreases in net assets from operations during the reporting period. Actual results could differ from those estimates.
Security Valuation — Securities listed on a securities exchange, market or automated quotation system for which quotations are readily available (except for securities traded on NASDAQ) are valued at the last quoted sale price on the primary exchange or market (foreign or domestic) on which they are traded, or, if there is no such reported sale, at the most recent quoted bid price. For securities traded on NASDAQ, the NASDAQ Official Closing Price will be used. If available, debt securities are priced based upon valuations provided by independent, third-party pricing agents. Such values generally reflect the last reported sales price if the security is actively traded. The third-party pricing agents may also value debt securities at an evaluated bid price by employing methodologies that utilize actual market transactions, broker-supplied valuations, or other methodologies designed to identify the market value for such securities. Debt obligations with remaining maturities of sixty days or less may be valued at their amortized cost, which approximates market value. Prices for most securities held in the Funds are provided daily by recognized independent pricing agents. SEI Investments Management Corporation (“SIMC”) or a Sub-Adviser, as applicable, reasonably believes that prices provided by independent pricing agents are reliable. However, there can be no assurance that such pricing service’s prices will be reliable. SIMC or a Sub-Adviser, as applicable, continuously monitors the reliability of prices obtained from any pricing service and will notify the Funds’ administrator if it believes that a particular pricing service is no longer a reliable source of prices. The Funds’ administrator, in turn, will notify the Trust’s Fair Value Committee (the “Committee”) if it receives such notification from SIMC or a Sub-Adviser, as applicable, or if the Funds’ administrator reasonably believes that a particular pricing service is no longer a reliable source for prices. If a security price cannot be obtained from an independent, third-party pricing agent, the Funds seek to obtain a bid price from at least one independent broker.
Securities for which market prices are not “readily available” are determined to be unreliable or cannot be valued using methodologies described above are valued in accordance with Fair Value Procedures established by the Trust’s Board of Trustees. The Trust’s Fair Value
| SEI Institutional Managed Trust / Semi-Annual Report / March 31, 2015 | 239 |
Notes to Financial Statements/Consolidated Notes to Financial Statements (Unaudited) (Continued)
March 31, 2015
Procedures are implemented through the Committee designated by the Trust’s Board of Trustees. The Committee is currently composed of two members of the Board of Trustees, as well as representatives from SIMC and its affiliates. The Committee provides regular reports to the Board concerning investments for which market prices are not readily available or may be unreliable. Some of the more common reasons that may necessitate that a security be valued using Fair Value Procedures include: the security’s trading has been halted or suspended; the security has been de-listed from a national exchange; the security’s primary trading market is temporarily closed at a time when, under normal conditions, it would be open; or the security’s primary pricing source is not able or willing to provide a price. When a security is valued in accordance with the Fair Value Procedures, the
Committee will determine the value after taking into consideration relevant information reasonably available to the Committee. Examples of factors the Committee may consider are: (i) the facts giving rise to the need to fair value; (ii) the last trade price; (iii) the performance of but may be Level 3 depending on the circumstances. For certain collateralized debt obligations, corporate obligations, mortgage backed securities, auction rate preferred securities and loan participations where observable inputs are limited, assumptions about market activity and risk are used and are categorized as Level 3 in the hierarchy.
The valuation techniques used by the Funds to measure fair value during the six month period ended March 31, 2015, maximized the use of observable inputs and minimized the use of unobservable inputs.
For the six month period ended March 31, 2015, there have been no significant changes to the Trust’s fair valuation methodologies.
The following table summarizes the quantitative inputs and assumptions used for items categorized as recurring Level 3 assets as of March 31, 2015. The disclosures below also include qualitative information on the sensitivity of the fair value measurements to changes in the significant unobservable inputs.
Multi-Asset Income Fund
| Assets | Fair Value (in Thousands) at March 31, 2015 | Valuation Technique(s) | Unobservable Input | Range (Weighted Average) | ||||||
| Collateralized Debt Obligations | $ | — | 1/2/2015 Broker price | Indicative Quote | N/A | |||||
| 2,880 | OAS off 3/5/2015 Trade Price | Indicative Quote | 316 | |||||||
| 720 | Broker Price | Broker Quote | N/A | |||||||
|
| |||||||||
| Total Collateralized Debt Obligations | 3,600 | |||||||||
|
| |||||||||
| Corporate Obligation | 2,865 | OAS off 2/27/2015 Single broker price | Indicative Quote | 306 | ||||||
|
| |||||||||
| Convertible Bond | 139 | |||||||||
|
| |||||||||
| Asset Backed-Securities | 6,699 | Quarterly model price | Indicative Quote | N/A | ||||||
|
| |||||||||
| Loan Participations | 2,220 | Quarterly model price | Indicative Quote | N/A | ||||||
| (61 | ) | Calculated | Indicative Quote | N/A | ||||||
|
| |||||||||
| Total Loan Participations | 2,159 | |||||||||
|
| |||||||||
The unobservable inputs used to determine fair value of reoccurring Level 3 assets may have similar or diverging impacts on valuation. Significant increases and decreases in these inputs in isolation and interrelationships between those inputs could result in significantly higher or lower fair value measurement.
Security Transactions and Investment Income — Security transactions are recorded on the trade date. Costs used in determining net realized capital gains and losses on the sale of securities are on the basis of specific identification. Dividend income is recognized on the ex-dividend date, and interest income is recognized using the accrual basis of accounting. Income from payment-in-kind securities is recorded daily based on the effective interest method of accrual.
Distributions received on securities that represent a return of capital or capital gain are recorded as a reduction of cost of investments and/
or as a realized gain. The Trust estimates the components of distributions received that may be considered nontaxable distributions or capital gain distributions.
Amortization and accretion is calculated using the scientific interest method, which approximates the effective interest method over the holding period of the security, which is not materially different from the effective interest method. Amortization of premiums and discounts is included in interest income.
Repurchase Agreements — Securities pledged as collateral for repurchase agreements are held by each Fund’s custodian bank until the repurchase date of the repurchase agreement. The Funds may also invest in tri-party repurchase agreements. Securities held as collateral for tri-party repurchase agreements are maintained by the broker’s custodian bank in a segregated account until the repurchase
| 240 | SEI Institutional Managed Trust / Semi-Annual Report / March 31, 2015 |
date of the repurchase agreement. Provisions of the repurchase agreements and the Trust’s policies require that the market value of the collateral, including accrued interest thereon, is sufficient in the event of default by the counterparty. If the counterparty defaults and the value of the collateral declines, or if the counterparty enters into an insolvency proceeding, realization of the collateral by the Funds may be delayed or limited.
Reverse Repurchase Agreements — To the extent consistent with its Investment Objective and Strategies, a Fund may issue reverse repurchase agreements. A reverse repurchase agreement involves the sale of portfolio assets together with an agreement to repurchase the same assets later at a fixed price. The segregated assets may consist of cash, U.S. Government securities, or other liquid securities at least equal in value to the obligations under the reverse repurchase agreements. In the event the buyer of securities under a reverse repurchase agreement files for bankruptcy or becomes insolvent, a Fund’s use of the proceeds under the agreement may be restricted pending a determination by the other party, or its trustee or receiver, whether to enforce the obligation to repurchase the securities. Reverse repurchase agreements outstanding as of March 31, 2015 were as follows:
MULTI-ASSET INCOME FUND
| Principal Amount ($ Thousands) | Counterparty | Value ($ Thousands) | ||||||
| $(11,271) | Barclays, 0.75% | $ | (11,271 | ) | ||||
| (11,247) | RBC, 0.90% | (11,247 | ) | |||||
| (10,010) | Barclays, 0.70% | (10,010 | ) | |||||
| (3,670) | Barclays, 0.70% | (3,670 | ) | |||||
| (3,238) | Nomura 0.75% | (3,238 | ) | |||||
| (2,927) | Nomura 0.75% | (2,927 | ) | |||||
| (2,672) | Barclays, 0.85% | (2,672 | ) | |||||
| (2,661) | RBC, 0.90% | (2,661 | ) | |||||
| (2,379) | Barclays, 0.50% | (2,379 | ) | |||||
| (1,935) | RBC, 0.90% | (1,935 | ) | |||||
| (1,765) | CitiBank 0.80% | (1,765 | ) | |||||
| (1,625) | Barclays, 0.85% | (1,625 | ) | |||||
| (1,274) | Credit Suisse First Boston, -0.75% | (1,274 | ) | |||||
| (987) | Barclays, -0.15% | (987 | ) | |||||
| (983) | Bank of America 0.58% | (983 | ) | |||||
| (885) | RBC, 0.63% | (885 | ) | |||||
| (769) | Bank of America 0.88% | (769 | ) | |||||
| (672) | RBC, 0.55% | (672 | ) | |||||
| (501) | Barclays, -1.25% | (500 | ) | |||||
| (352) | CitiBank 0.85% | (352 | ) | |||||
|
| |||||||
| $ | (61,822 | ) | ||||||
|
| |||||||
MULTI-ASSET INFLATION MANAGED FUND
| Principal Amount ($ Thousands) | Counterparty | Value ($ Thousands) | ||||||
| $(45,705) | JP Morgan, 0.18% | $ | (45,705 | ) | ||||
| (18,375) | JP Morgan, 0.18% | (18,375 | ) | |||||
| (16,813) | JP Morgan, 0.20% | (16,813 | ) | |||||
| (14,470) | Barclays, 0.23% | (14,470 | ) | |||||
| (13,970) | JP Morgan, 0.18% | (13,970 | ) | |||||
| (12,210) | Barclays, 0.23% | (12,210 | ) | |||||
| (10,788) | Bank of America, 0.24% | (10,788 | ) | |||||
| (9,969) | Bank of America, 0.20% | (9,969 | ) | |||||
| (6,854) | Barclays, 0.15% | (6,854 | ) | |||||
| (4,910) | Bank of America, 0.23% | (4,910 | ) | |||||
| (4,755) | Bank of America, 0.23% | (4,755 | ) | |||||
| (4,460) | Bank of America, 0.17% | (4,460 | ) | |||||
| (3,079) | Barclays, 0.23% | (3,079 | ) | |||||
|
| |||||||
| $ | (166,358 | ) | ||||||
|
| |||||||
Classes — Class-specific expenses are borne by that class of shares. Income, realized and unrealized gains/losses and non class-specific expenses are allocated to the respective class on the basis of relative daily net assets.
Expenses — Expenses that are directly related to a Fund are charged directly to that Fund. Other operating expenses of the Funds are prorated to the Funds on the basis of relative daily net assets.
Commodity-Linked Investments — To the extent consistent with its Investment Objective and Strategies, the Multi-Asset Accumulation Fund and the Multi-Asset Inflation Managed Fund may invest in commodity investments to provide exposure to the investment returns of the commodities markets. Commodity investments include notes with interest payments that are tied to an underlying commodity or commodity index, ETFs or other exchange-traded products that are tied to the performance of a commodity or commodity index or other types of investment vehicles or instruments that provide returns that are tied to commodities or commodity indices. The Multi-Asset Accumulation and Multi-Asset Inflation Managed Funds may also invest in equity securities of issuers in commodity-related industries.
The Multi-Asset Accumulation and Multi-Asset Inflation Managed Funds may also seek to gain exposure to the commodity markets, in whole or in part, through investments in a wholly owned Subsidiary. The Subsidiary, unlike the Fund, may invest to a significant extent directly in commodities and in equity-linked securities and commodity-linked derivative instruments, including options, futures contracts, swaps, options on futures contracts and commodity-linked structured notes. The Subsidiary may also invest in other instruments in which the Fund is permitted to invest, either as investments or to serve as margin or collateral for its derivative positions. A Fund may invest up to 25% of its total assets in its Subsidiary.
In order for a Fund to qualify as a regulated investment company under Subchapter M of the Code, the Fund must derive at least 90% of its gross income each taxable year from qualifying income. The status of certain commodity-linked derivative instruments as qualifying income has been addressed in Revenue Ruling 2006-1 and Revenue Ruling 2006-31 which provide that income from certain commodity-linked derivative instruments in which the Fund invests will not be considered qualifying income. To the extent the Multi-Asset Accumulation and the Multi-Asset Inflation Managed Funds invest in such instruments directly, each Fund will seek to restrict its income from commodity-linked derivative instruments that do not generate qualifying income, such as commodity-linked swaps, to a maximum of 10% of its gross income (when combined with its other investments that produce non-qualifying income).
Foreign Currency Translation — The books and records of the Funds are maintained in U.S. dollars on the following basis:
(I) market value of investment securities, assets and liabilities at the current rate of exchange; and
(II) purchases and sales of investment securities, income and expenses at the relevant rates of exchange prevailing on the respective dates of such transactions.
| SEI Institutional Managed Trust / Semi-Annual Report / March 31, 2015 | 241 |
Notes to Financial Statements/Consolidated Notes to Financial Statements (Unaudited) (Continued)
March 31, 2015
The Funds do not isolate that portion of gains and losses on investments in equity securities that is due to changes in the foreign exchange rates from that which is due to changes in market prices of equity securities.
The Funds report certain foreign-currency-related transactions as components of realized gains for financial reporting purposes, whereas such components are treated as ordinary income for Federal income tax purposes.
Forward Foreign Currency Contracts — To the extent consistent with its Investment Objective and Strategies, a Fund may enter into forward foreign currency contracts as hedges against either specific transactions, fund positions or anticipated fund positions. A Fund may also engage in currency transactions to enhance that Fund’s returns. All commitments are “marked-to-market” daily at the applicable foreign exchange rate, and any resulting unrealized gains or losses are recorded currently. The Funds realize gains and losses at the time forward contracts are extinguished. Unrealized gains or losses on outstanding positions in forward foreign currency contracts held at the close of the period are recognized as ordinary income or loss for Federal income tax purposes.
The Funds could be exposed to risk if the counterparties to the contracts are unable to meet the terms of the contract and from unanticipated movements in the value of a foreign currency relative to the U.S. dollar.
Finally, the risk exists that losses could exceed amounts disclosed on the Statements of Assets and Liabilities or Consolidated Statements of Assets and Liabilities. Refer to each Fund’s Schedule of Investments, Summary Schedule of Investments or Consolidated Schedule of Investments for details regarding open forward foreign currency contracts as of March 31, 2015, if applicable.
Futures Contracts — To the extent consistent with its Investment Objective and Strategies, a Fund may use futures contracts for tactical hedging purposes as well as to enhance the Fund’s returns. In addition, fixed income funds will utilize futures contracts to help manage duration and yield curve exposure. Initial margin deposits of cash or securities are made upon entering into futures contracts. The contracts are marked to market daily and the resulting changes in value are accounted for as unrealized gains and losses. Variation margin payments are paid or received, depending upon whether unrealized gains or losses are incurred. When the contract is closed, the Funds record a realized gain or loss equal to the difference between the proceeds from (or cost of) the closing transaction and the amount invested in the contract.
Risks of entering into futures contracts include the possibility that there will be an imperfect price correlation between the futures and the underlying securities. Second, it is possible that a lack of liquidity for futures contracts could exist in the secondary market, resulting in an inability to close a position prior to its maturity date. Third, the futures contract involves the risk that the Fund could lose more than the original margin deposit required to initiate a futures transaction.
Finally, the risk exists that losses could exceed amounts disclosed on the Statements of Assets and Liabilities or Consolidated Statements of Assets and Liabilities. Refer to each Fund’s Schedule of Investments, Summary Schedule of Investments or Consolidated Schedule of Investments for details regarding open futures contracts as of March 31, 2015, if applicable.
Options/Swaptions Writing/Purchasing — To the extent consistent with its Investment Objective and Strategies, a Fund may invest in financial options/swaptions contracts for the purpose of hedging its existing fund securities or to enhance the Fund’s returns. When a Fund writes or purchases an option/swaption, an amount equal to the premium received or paid by the Fund is recorded as a liability or an asset and is subsequently adjusted to the current market value of the option/swaption written or purchased. Premiums received or paid from writing or purchasing options/swaptions which expire unexercised are treated by the Fund on the expiration date as realized gains or losses. The difference between the premium and the amount paid or received on effecting a closing purchase or sale transaction, including brokerage commissions, is also treated as a realized gain or loss. If an option/swaption is exercised, the premium paid or received is added to the cost of the purchase or proceeds from the sale in determining whether the Fund has realized a gain or a loss on investment transactions.
The risk in writing a call option/swaption is that the Funds give up the opportunity for profit if the market price of the security increases. The risk in writing a put option/swaption is that the Funds may incur a loss if the market price of the security decreases and the option/swaption is exercised. The risk in purchasing an option/swaption is that the Funds pay a premium whether or not the option/swaption is exercised. The Funds also have the additional risk of being unable to enter into a closing transaction at an acceptable price if a liquid secondary market does not exist. Option/swaption contracts also involve the risk that they may not work as intended due to unanticipated developments in market conditions or other causes.
Finally, the risk exists that losses on written options could exceed amounts disclosed on the Statements of Assets and Liabilities. Refer to each Fund’s Schedule of Investments, Summary Schedule of Investments or Consolidated Schedule of Investments for details regarding open option/swaption contracts as of March 31, 2015, if applicable.
Securities Sold Short — To the extent consistent with its Investment Objective and Strategies, a Fund may engage in short sales. Short sales are transactions under which a Fund sells a security it does not own. To complete such a transaction, the Fund must borrow the security to make delivery to the buyer. A Fund then is obligated to replace the security borrowed by purchasing the security at the market price at the time of the replacement. The price at such time may be more or less than the price at which the security was sold by a Fund. Until the security is replaced, a Fund is required to pay the lender amounts equal to any dividends or interest that accrue during
| 242 | SEI Institutional Managed Trust / Semi-Annual Report / March 31, 2015 |
the period of the loan. Dividends and interest are shown as an expense for financial reporting purposes. To borrow the security, a Fund also may be required to pay a premium, which would decrease proceeds of the security sold. The proceeds of the short sale are retained by the broker, to the extent necessary to meet margin requirements, until the short position is closed out. A gain, limited to the price at which a Fund sold the security short, or a loss, unlimited in size, will be recognized upon the close of a short sale.
Until a Fund closes its short position or replaces the borrowed security, the Fund will: (i) earmark on the books of the Fund or place in a segregated account cash or liquid securities at such a level that the amount earmarked or deposited in the segregated account plus the amount deposited with the broker as collateral will equal the current value of the security sold short; or (ii) otherwise “cover” the Fund’s short position as required by the 1940 Act. Refer to each Fund’s Schedule of Investments, Summary Schedule of Investments or Consolidated Schedule of Investments for details regarding securities sold short as of March 31, 2015, if applicable.
Swap Agreements — To the extent consistent with its Investment Objective and Strategies, a Fund may invest in swap contracts as an efficient means to synthetically obtain exposure to securities or baskets of securities and to manage a Fund’s interest rate duration and yield curve exposure. Swap contracts may also be used to mitigate a Fund’s overall level of risk and/or a Fund’s risk to particular types of securities, currencies or market segments. Interest rate swaps may further be used to manage a Fund’s yield spread sensitivity. A Fund may buy credit default swaps in an attempt to manage credit risk where a Fund has credit exposure to an issuer, and a Fund may sell credit default swaps to more efficiently gain credit exposure to a security or basket of securities. A swap agreement is a two-party contract under which an agreement is made to exchange returns from predetermined investments or instruments, including a particular interest rate, foreign currency, or “basket” of securities representing a particular index. Swap agreements are privately negotiated in the over-the-counter market (“OTC swaps”) or may be executed in a multilateral or other trade facility platform, such as a registered commodities exchange (“Centrally Cleared swaps”). Interest rate swaps involve the exchange by a Fund with another party of their respective commitments to pay or receive interest (e.g., an exchange of floating rate payments for fixed rate payments) with respect to a notional amount of principal. Credit-default swaps involve periodic payments by a Fund or counterparty based on a specified rate multiplied by a notional amount assigned to an underlying debt instrument or group of debt instruments in exchange for the assumption of credit risk on the same instruments. In the event of a credit event, usually in the form of a credit rating downgrade, the party receiving periodic payments (i.e. floating rate payer) must pay the other party (i.e. fixed rate payer) an amount equal to the recovery rate used to settle the contracts. The recovery rate is a function of how many credit default swap investors wish to deliver the security or receive the security. The recovery rate is
determined through an auction process. Total return swaps allow an investor to benefit from the cash flow without ever actually owning the underlying security. The receiver must pay any decline in value to the payer at the end of the total return swap. However, the investor does not need to make a payment if there is no decline in price. Payments can be made on various indices, bonds (i.e. mortgage backed securities, bank debt and corporate), loans or commodities. The value of a total return swap is equal to the change in value of the underlying asset versus the accrued income payment based on LIBOR or some other form of indices on the notional amount. Payments received or made are recorded as realized gains or loss. A Fund could be exposed to credit or market risk due to unfavorable changes in the fluctuation of interest rates or if the counterparty defaults on its obligation to perform. Risk of loss may exceed amounts recognized on the statement of assets and liabilities. Interest rate swap contracts outstanding at period end, if any, are listed after a Fund’s portfolio. In connection with swap agreements securities may be set aside as collateral by a Fund’s custodian.
Swaps are marked-to-market daily based upon quotations from market makers and the resulting changes in market values, if any, are recorded as an unrealized gain or loss in the Statement of Operations or Consolidated Statement of Operations. Net payments of interest are recorded as realized gains or losses. Daily changes in valuation of Centrally Cleared swaps, if any, are recorded as a receivable or payable for the change in value as appropriate (“variation margin”) on the Statements of Assets and Liabilities.
Entering into swap agreements involves, to varying degrees, elements of credit and market risk in excess of the amounts recognized on the Statement of Assets and Liabilities or Consolidated Statement of Assets and Liabilities. Such risks involve the possibility that there will
be no liquid market for these agreements, that the counterparty to the agreement may default on its obligation to perform and that there may be unfavorable changes in the fluctuation of interest rates. Risks also arise from potential losses from adverse market movements.
This risk is mitigated by having a master netting arrangement between a Fund and the counterparty and by having the counterparty post collateral to cover a Fund’s exposure to the counterparty. See Note 3 for further details. Refer to each Fund’s Schedule of Investments, Summary Schedule of Investments or Consolidated Schedule of Investments. for details regarding open swap agreements as of March 31, 2015, if applicable.
Delayed Delivery Transactions — To the extent consistent with its Investment Objective and Strategies, a Fund may purchase or sell securities on a when-issued or delayed delivery basis. These transactions involve a commitment by the Fund to purchase or sell securities for a predetermined price or yield, with payment and delivery taking place beyond the customary settlement period. When delayed delivery purchases are outstanding, the Fund will set aside liquid assets in an amount sufficient to meet the purchase price. When purchasing a security on a delayed delivery basis, the Fund assumes
| SEI Institutional Managed Trust / Semi-Annual Report / March 31, 2015 | 243 |
Notes to Financial Statements/Consolidated Notes to Financial Statements (Unaudited) (Continued)
March 31, 2015
the rights and risks of ownership of the security, including the risk of price and yield fluctuations, and takes such fluctuations into account when determining its net asset value. The Fund may dispose of or renegotiate a delayed delivery transaction after it is entered into, and may sell when-issued securities before they are delivered, which may result in a capital gain or loss. When the Fund has sold a security on a delayed delivery basis, the Fund does not participate in future gains and losses with respect to the security.
Collateralized Debt Obligations — To the extent consistent with its Investment Objective and Strategies, a Fund may invest in collateralized debt obligations (“CDOs”), which include collateralized loan obligations (“CLOs”) and other similarly structured securities. CLOs are a type of asset-backed securities. A CLO is a trust typically collateralized by a pool of loans, which may include, among others, domestic and foreign senior secured loans, senior unsecured loans, and subordinate corporate loans, including loans that may be rated below investment grade or equivalent unrated loans. CDOs may charge management fees and administrative expenses.
For CDOs, the cash flows from the trust are split into two or more portions, called tranches, varying in risk and yield. The riskiest portion is the “equity” tranche which bears the bulk of defaults from the bonds or loans in the trust and serves to protect the other, more senior tranches from default in all but the most severe circumstances. Since it is partially protected from defaults, a senior tranche from a CDO trust typically has a higher rating and lower yield than its underlying securities, and can be rated investment grade. Despite the protection from the equity tranche, CDO tranches can experience substantial losses due to actual defaults, increased sensitivity to defaults due to collateral default and disappearance of protecting tranches, market anticipation of defaults, as well as aversion to CDO securities as a class.
The risks of an investment in a CDO depend largely on its Class and its collateral securities. Normally, CLOs and other CDOs are privately offered and sold, and thus, are not registered under the securities laws. As a result, investments in CDOs may be characterized by the Funds as illiquid securities; however, an active dealer market may exist for CDOs, allowing a CDO to qualify for Rule 144A transactions. In addition to the normal risks associated with fixed income securities (e.g., interest rate risk and default risk), CDOs carry additional risks including, but not limited to: (i) the possibility that distributions from collateral securities will not be adequate to make interest or other payments; (ii) the quality of the collateral may decline in value or default; (iii) the Funds may invest in CDOs that are subordinate to other classes; and (iv) the complex structure of the security may not be fully understood at the time of investment and may produce disputes with the issuer or unexpected investment results.
Illiquid Securities — A security is considered illiquid if it cannot be sold or disposed of in the ordinary course of business within seven days or less for its approximate carrying value on the books of a Fund. Valuations of illiquid securities may differ significantly from the values that would have been used had an active market value for these securities existed.
Restricted Securities — At March 31, 2015, the following Funds owned private placement investments that were purchased through private offerings or acquired through initial public offerings and cannot be sold without prior registration under the Securities Act of 1933 or pursuant to an exemption therefrom. In addition, the Funds have generally agreed to further restrictions on the disposition of certain holdings as set forth in various agreements entered into in connection with the purchase of these investments. These investments are valued at fair value as determined in accordance with the procedures approved by the Board of Trustees. The acquisition dates of these investments, the enforceable right to acquire these securities, along with their cost and values at March 31, 2015, were as follows:
Number of Shares/ Face Amount ($ Thousands) | Acquisition Date | Right to Acquire Date | Cost ($ Thousands) | Market Value ($ Thousands) | % of Net Assets | |||||||||||||||||||
| Small Cap Growth Fund | ||||||||||||||||||||||||
Value Creation | 145,600 | 08/10/06 | 08/10/06 | $ | 1,491 | $ | 61 | 0.02 | % | |||||||||||||||
|
|
|
|
|
| |||||||||||||||||||
| Enhanced Income | ||||||||||||||||||||||||
JHT Holding, 2nd Lien | $ | 53,319 | 12/16/2008 | 12/16/2008 | $ | 54 | $ | 18 | 0.01 | % | ||||||||||||||
|
|
|
|
|
| |||||||||||||||||||
| High Yield Bond Fund | ||||||||||||||||||||||||
Aventine (Escrow Security) | $ | 2,750 | 11/30/2010 | 11/30/2010 | $ | — | $ | 1 | 0.00 | % | ||||||||||||||
|
|
|
|
|
| |||||||||||||||||||
| 244 | SEI Institutional Managed Trust / Semi-Annual Report / March 31, 2015 |
Dividends and Distributions to Shareholders — Dividends from net investment income are declared and paid to shareholders quarterly for the Large Cap, Large Cap Value, Large Cap Growth, Tax-Managed Large Cap, S&P 500 Index, Small Cap, Small Cap Value, Small Cap Growth, Tax-Managed Small/Mid Cap, Mid-Cap, U.S. Managed Volatility, Tax-Managed Managed Volatility, Real Estate, Enhanced Income, Real Return, Multi-Strategy Alternative, Multi-Asset Accumulation and Multi-Asset Inflation Managed Funds; are declared and paid annually for the Global Managed Volatility Fund; are declared daily and paid monthly for the Core Fixed Income, U.S. Fixed Income, High Yield Bond, the Multi-Asset Income and Multi-Asset Capital Stability Funds. Any net realized capital gains on sales of securities are distributed to shareholders at least annually. Dividends and distributions are recorded on the ex-dividend date.
Investments in Real Estate Investment Trust — With respect to the Real Estate Fund, dividend income is recorded based on the income included in distributions received from the Real Estate Investment Trust (“REIT”) investments using published REIT reclassifications including some management estimates when actual amounts are not available. Distributions received in excess of this estimated amount are recorded as a reduction of the cost of investments or reclassified to capital gains. The actual amounts of income, return of capital, and capital gains are only determined by each REIT after its fiscal year-end, and may differ from the estimated amounts.
Investment in Subsidiary — Each of the Multi-Asset Accumulation and Multi-Asset Inflation Managed Funds may invest in its own Subsidiary. By investing in a Subsidiary, each Fund is indirectly exposed to the risks associated with such Subsidiary’s investments. The commodity-related instruments held by a Subsidiary are generally similar to those that are permitted to be held by the applicable Fund and are subject to the same risks that apply to similar investments if held directly by the Fund. A Subsidiary, however, is not registered under the 1940 Act and will not be subject to all of the investor protections of the 1940 Act. Thus, the Multi-Asset Accumulation and Multi-Asset Inflation Managed Funds, as investors in their respective Subsidiary, will not have all of the protections offered to investors in registered investment companies.
However, each Fund wholly owns and controls its respective Subsidiary, and the Funds and the Subsidiaries are all managed by SIMC, making it unlikely that a Subsidiary will take action contrary to the interests of the applicable Fund or its shareholders. While a Subsidiary has its own Board of Directors (“Board”) that is responsible for overseeing the operations of such Subsidiary, the respective Fund’s Board has oversight responsibility for the investment activities of the Fund, including its investment in the respective Subsidiary, and the Fund’s role as the sole shareholder of such Subsidiary. It is not currently expected that shares of any Subsidiary will be sold or offered to investors other than the respective Fund.
Changes in the laws of the United States and/or the Cayman Islands or governmental interpretation of such laws, under which the Funds
and the Subsidiaries, respectively, are organized, could result in the inability of a Fund and/or its respective Subsidiary to operate as intended and could negatively affect the Funds and their shareholders. For example, Cayman Islands law does not currently impose any income, corporate or capital gains tax, estate duty, inheritance tax, gift tax or withholding tax on the Subsidiaries. If Cayman Islands law changes such that the Subsidiaries must pay Cayman Islands governmental authority taxes, Fund shareholders would likely suffer decreased investment return.
Redemption Fees — The Funds charge a redemption fee based on a redemption, or a series of redemptions from a single identifiable source that in the aggregate exceed a specified dollar threshold within any thirty day period, as presented below:
| Dollar Threshold ($Thousands) | Redemption Fee | |||||||
Large Cap Fund | $ | 50,000 | 0.50 | % | ||||
Large Cap Value Fund | 50,000 | 0.50 | ||||||
Large Cap Growth Fund | 50,000 | 0.50 | ||||||
Tax-Managed Large Cap Fund | 50,000 | 0.50 | ||||||
S&P 500 Index Fund | 50,000 | 0.15 | ||||||
Small Cap Fund | 25,000 | 1.00 | ||||||
Small Cap Value Fund | 25,000 | 1.00 | ||||||
Small Cap Growth Fund | 25,000 | 1.00 | ||||||
Tax-Managed Small/Mid Cap Fund | 25,000 | 1.00 | ||||||
Mid-Cap Fund | 10,000 | 0.75 | ||||||
U.S. Managed Volatility Fund | 25,000 | 0.50 | ||||||
Global Managed Volatility Fund | 25,000 | 0.75 | ||||||
Tax-Managed Managed Volatility Fund | 25,000 | 0.50 | ||||||
Real Estate Fund | 10,000 | 1.00 | ||||||
Enhanced Income Fund | 10,000 | 0.75 | ||||||
Core Fixed Income Fund | 50,000 | 0.60 | ||||||
U.S. Fixed Income Fund | 50,000 | 0.60 | ||||||
High Yield Bond Fund | 25,000 | 1.00 | ||||||
Real Return Fund | 10,000 | 0.25 | ||||||
Multi-Strategy Alternative Fund | 25,000 | 0.25 | ||||||
Multi-Asset Accumulation Fund | 25,000 | 0.75 | ||||||
Multi-Asset Income Fund | 25,000 | 0.50 | ||||||
Multi-Asset Inflation Managed Fund | 25,000 | 0.75 | ||||||
Multi-Asset Capital Stability Fund | 10,000 | 0.25 | ||||||
For the six-months ended March 31, 2015, the Funds did not charge any redemption fees.
3. CREDIT DERIVATIVES
A Fund may use credit default swaps to reduce risk where a Fund has exposure to the issuer, or to take an active long or short position with respect to the likelihood of an event of default. The reference obligation of the swap can be a single issuer, a “basket” of issuers, or an index. The underlying referenced assets are corporate debt, sovereign debt and asset backed securities.
The buyer of a credit default swap is generally obligated to pay the seller a periodic stream of payments over the term of the contract in return for a contingent payment upon the occurrence of a credit event with respect to an underlying reference obligation. Generally, a credit event for corporate or sovereign reference obligations means bankruptcy, failure to pay, obligation acceleration, repudiation/moratorium or restructuring. For credit default swaps on asset-backed securities, a
| SEI Institutional Managed Trust / Semi-Annual Report / March 31, 2015 | 245 |
Notes to Financial Statements/Consolidated Notes to Financial Statements (Unaudited) (Continued)
March 31, 2015
credit event may be triggered by events such as failure to pay principal, maturity extension, rating downgrade or write-down.
If a Fund is a seller of protection, and a credit event occurs, as defined under the terms of that particular swap agreement, a Fund will generally either (i) pay to the buyer an amount equal to the notional amount of the swap and take delivery of the referenced obligation, other deliverable obligations, or underlying securities comprising a referenced index or (ii) pay a net settlement amount in the form of cash or securities equal to the notional amount of the swap less the recovery value of the referenced obligation or underlying securities comprising a referenced index.
If a Fund is a buyer of protection and a credit event occurs, as defined under the terms of that particular swap agreement, a Fund will either (i) receive from the seller of protection an amount equal to the notional amount of the swap and deliver the referenced obligation, other deliverable obligations or underlying securities comprising the
referenced index or (ii) receive a net settlement amount in the form of cash or securities equal to the notional amount of the swap less the recovery value of the referenced obligation or underlying securities comprising the referenced index. Recovery values are assumed by market makers considering either industry standard recovery rates or entity specific factors and considerations until a credit event occurs. If a credit event has occurred, the recovery value is determined by a facilitated auction whereby a minimum number of allowable broker bids, together with a specified valuation method, are used to calculate the settlement value.
Certain Funds are party to International Swap Dealers Association, Inc. Master Agreements (“ISDA Master Agreements”). These agreements are with select counterparties and they govern transactions, including certain over-the counter derivative and foreign exchange contracts, entered into by the Funds and the counterparty.
As of March 31, 2015, the High Yield Bond Fund, Multi-Asset Inflation Managed Fund and Multi-Asset Capital Stability Fund are the buyers (“receiving protection”) on a total notional amount of $15.4 million, $11.4 million and $1.5 million, respectively. As of March 31, 2015, the Core Fixed Income Fund, Multi-Asset Inflation Managed Fund and Multi-Asset Capital Stability Fund are the sellers (“providing protection”) on a total notional amount of $3.3 million, $22.6 million and $21.4 million respectively. The notional amounts of the swaps are not recorded in the financial statements. The notional amounts approximate the maximum potential amount of future payments that the Fund could be required to make if the Fund was the seller of protection and a credit event was to occur. Those credit default swaps (“CDS”) for which the Fund is providing protection at the balance sheet date are summarized as follows:
SIMT CORE FIXED INCOME FUND WRITTEN CREDIT DERIVATIVE CONTRACTS | SINGLE NAME CREDIT DEFAULT SWAPS | CREDIT DEFAULT SWAP INDEX | ||||||||||||||||||
| REFERENCE ASSET | CORPORATE DEBT | SOVEREIGN DEBT | ASSET BACKED SECURITIES | CORPORATE DEBT | Total | |||||||||||||||
Fair value of written credit derivatives | $ | 1,916 | — | $ | (8,476 | ) | $ | 840 | $ | (5,720 | ) | |||||||||
Maximum potential amount of future payments | $ | 3,080,000 | — | $ | 200,000 | $ | 9,700 | $ | 3,289,700 | |||||||||||
Recourse provisions with third parties to recover any amounts paid under the credit derivative (including any purchased credit protection)[1] | — | — | — | — | — | |||||||||||||||
Collateral held by the Partnership or other third parties which the Partnership can obtain upon occurrence of triggering event | — | — | — | — | — | |||||||||||||||
SIMT MULTI-ASSET INFLATION MANAGED FUND WRITTEN CREDIT DERIVATIVE CONTRACTS | SINGLE NAME CREDIT DEFAULT SWAPS | CREDIT DEFAULT SWAP INDEX | ||||||||||||||||||
| REFERENCE ASSET | CORPORATE DEBT | SOVEREIGN DEBT | ASSET BACKED SECURITIES | CORPORATE DEBT | Total | |||||||||||||||
Fair value of written credit derivatives | $ | 71,339 | — | — | $ | 336,297 | $ | 407,636 | ||||||||||||
Maximum potential amount of future payments | $ | 2,220,699 | — | — | $ | 20,390,000 | $ | 22,610,699 | ||||||||||||
Recourse provisions with third parties to recover any amounts paid under the credit derivative (including any purchased credit protection)[1] | — | — | — | — | — | |||||||||||||||
Collateral held by the Partnership or other third parties which the Partnership can obtain upon occurrence of triggering event | — | — | — | — | — | |||||||||||||||
SIMT MULTI-ASSET CAPITAL STABILITY FUND WRITTEN CREDIT DERIVATIVE CONTRACTS | SINGLE NAME CREDIT DEFAULT SWAPS | CREDIT DEFAULT SWAP INDEX | ||||||||||||||||||
| REFERENCE ASSET | CORPORATE DEBT | SOVEREIGN DEBT | ASSET BACKED SECURITIES | CORPORATE DEBT | Total | |||||||||||||||
Fair value of written credit derivatives | — | — | $ | 22,281 | $ | 870,517 | $ | 892,798 | ||||||||||||
Maximum potential amount of future payments | — | — | $ | 1,410,000 | $ | 20,031,000 | $ | 21,441,000 | ||||||||||||
Recourse provisions with third parties to recover any amounts paid under the credit derivative (including any purchased credit protection)[1] | — | — | — | — | — | |||||||||||||||
Collateral held by the Partnership or other third parties which the Partnership can obtain upon occurrence of triggering event | — | — | — | — | — | |||||||||||||||
| 1 | Potential recoveries would include purchased credit derivatives to the extent they offset written credit derivatives which have an identical underlying, or a netting arrangement or credit support annex with the counterparty. There may be other potential recoveries from recourse provisions where agreements cover multiple derivative arrangements but those amounts have not been included. |
| 246 | SEI Institutional Managed Trust / Semi-Annual Report / March 31, 2015 |
| MAXIMUM POTENTIAL AMOUNT OF FUTURE PAYMENTS BY CON TRACT TERM | ||||||||||||||||||||||||
| CORE FIXED INCOME FUND | 0-6 MONTHS | 6-12 MONTHS | 1-5 YEARS | 5-10 YEARS | > 10 YEARS | Total | ||||||||||||||||||
Current credit spread* on underlying (in basis points) | — | — | — | — | — | — | ||||||||||||||||||
0-100 | — | — | — | $ | 1,590,000 | — | $ | 1,590,000 | ||||||||||||||||
101-200 | — | — | $ | 9,700 | $ | 1,490,000 | — | $ | 1,499,700 | |||||||||||||||
201- 300 | — | — | — | — | $ | 200,000 | $ | 200,000 | ||||||||||||||||
301-400 | — | — | — | — | — | — | ||||||||||||||||||
> than 400 | — | — | — | — | — | — | ||||||||||||||||||
Total | — | — | $ | 9,700 | $ | 3,080,000 | $ | 200,000 | $ | 3,289,700 | ||||||||||||||
| MAXIMUM POTENTIAL AMOUNT OF FUTURE PAYMENTS BY CONTRACT TERM | ||||||||||||||||||||||||
| MULTI-ASSET INFLATION MANAGED FUND | 0-6 MONTHS | 6-12 MONTHS | 1-5 YEARS | 5-10 YEARS | > 10 YEARS | Total | ||||||||||||||||||
Current credit spread* on underlying (in basis points) | — | — | — | — | — | — | ||||||||||||||||||
0-100 | — | — | $ | 22,610,699 | — | — | $ | 22,610,699 | ||||||||||||||||
101-200 | — | — | — | — | — | — | ||||||||||||||||||
201-300 | — | — | — | — | — | — | ||||||||||||||||||
301-400 | — | — | — | — | — | — | ||||||||||||||||||
> than 400 | — | — | — | — | — | — | ||||||||||||||||||
Total | — | — | $ | 22,610,699 | — | — | $ | 22,610,699 | ||||||||||||||||
| MAXIMUM POTENTIAL AMOUNT OF FUTURE PAYMENTS BY CONTRACT TERM | ||||||||||||||||||||||||
| MULTI-ASSET CAPITAL STABILITY FUND | 0-6 MONTHS | 6-12 MONTHS | 1-5 YEARS | 5-10 YEARS | > 10 YEARS | Total | ||||||||||||||||||
Current credit spread* on underlying (in basis points) | — | — | — | — | — | — | ||||||||||||||||||
0-100 | — | — | $ | 11,750,000 | — | — | $ | 11,750,000 | ||||||||||||||||
101-200 | — | — | — | — | — | — | ||||||||||||||||||
201-300 | — | — | — | — | $ | 1,410,000 | $ | 1,410,000 | ||||||||||||||||
301-400 | — | — | $ | 8,281,000 | — | — | $ | 8,281,000 | ||||||||||||||||
> than 400 | — | — | — | — | — | — | ||||||||||||||||||
Total | — | — | $ | 20,031,000 | — | $ | 1,410,000 | $ | 21,441,000 | |||||||||||||||
| * | �� | The credit spread on the underlying asset is generally indicative of the current status of the underlying risk of the Fund having to perform. The spread also reflects the cost of buying/selling protection and may include upfront payments required to be made to enter into a contract. Higher credit spreads with a shorter contract term is indicative of a higher likelihood of performance by the Fund. |
The credit spread disclosed above for each reference obligation where the Fund is the seller of protection is a representation of the current payment/performance risk of the swap.
4. DERIVATIVE TRANSACTIONS
The following tables include only Funds that had exposure to more than one type of risk on derivatives held throughout the period. For Funds that held derivatives throughout the period with only one type of risk exposure, additional information can be found on the Summary Schedule of Investments, Schedule of Investments or Consolidated Schedule of Investments and the Statement of Operations or Consolidated Statement of Operations.
The fair value of derivative instruments as of March 31, 2015 was as follows:
| Asset Derivatives | Liability Derivatives | |||||||||||
| Six month period ended March 31, 2015 ($ Thousands) | Six month period ended March 31, 2015 ($ Thousands) | |||||||||||
| Statement of Assets and Liabilities/Consolidated Statements of Assets and Liabilities Location | Fair Value | Statement of Assets and Liabilities/Consolidated Statements of Assets and Liabilities Location | Fair Value | |||||||||
Derivatives not accounted for as hedging instruments: | ||||||||||||
| Global Managed Volatility Fund | ||||||||||||
Equity contracts | Net Assets — Unrealized appreciation on futures contracts | $ | 920 | * | Net Assets — Unrealized depreciation on futures contracts | $ | 191 | * | ||||
Foreign exchange contracts | Unrealized gain on forward foreign currency contracts | 7,973 | Unrealized loss on forward foreign currency contracts | 107 | ||||||||
|
|
|
| |||||||||
Total Derivatives not accounted for as hedging instruments | $ | 8,893 | $ | 298 | ||||||||
|
|
|
| |||||||||
| Core Fixed Income Fund | ||||||||||||
Interest rate contracts | Net Assets — Unrealized appreciation on futures contracts | $ | 1,806 | * | Net Assets — Unrealized depreciation on futures contracts | $ | 578 | * | ||||
Net Assets — Unrealized appreciation on swap contracts | 388† | Net Assets — Unrealized depreciation on swap contracts | 1,177† | |||||||||
Options Purchased, at value | 95 | Options written, at value | 288 | |||||||||
Swaptions Purchased, at value | 66 | Swaptions written, at value | 87 | |||||||||
Foreign exchange contracts | Unrealized gain on forward foreign currency contracts | 844 | Unrealized loss on forward foreign currency contracts | 302 | ||||||||
Credit contracts | Net Assets — Unrealized appreciation on swap contracts | 25† | Net Assets — Unrealized depreciation on swap contracts | 11† | ||||||||
|
|
|
| |||||||||
Total Derivatives not accounted for as hedging instruments | $ | 3,224 | $ | 2,443 | ||||||||
|
|
|
| |||||||||
| SEI Institutional Managed Trust / Semi-Annual Report / March 31, 2015 | 247 |
Notes to Financial Statements/Consolidated Notes to Financial Statements (Unaudited) (Continued)
March 31, 2015
| Asset Derivatives | Liability Derivatives | |||||||||||
| Six month period ended March 31, 2015 ($ Thousands) | Six month period ended March 31, 2015 ($ Thousands) | |||||||||||
| Statement of Assets and Liabilities/Consolidated Statements of Assets and Liabilities Location | Fair Value | Statement of Assets and Liabilities/Consolidated Statements of Assets and Liabilities Location | Fair Value | |||||||||
| U.S. Fixed Income Fund | ||||||||||||
Interest rate contracts | Net Assets — Unrealized appreciation on futures contracts | $ | 857 | * | Net Assets — Unrealized depreciation on futures contracts | $ | 1,107 | * | ||||
Net Assets — Unrealized appreciation on swap contracts | —† | Net Assets — Unrealized depreciation on swap contracts | 341† | |||||||||
Options Purchased, at value | 33 | Options written, at value | 103 | |||||||||
|
|
|
| |||||||||
Total Derivatives not accounted for as hedging instruments | $ | 890 | $ | 1,551 | ||||||||
|
|
|
| |||||||||
| Multi-Asset Accumulation Fund | ||||||||||||
Interest rate contracts | Net Assets — Unrealized appreciation on futures contracts | $ | 14,126 | * | Net Assets — Unrealized depreciation on futures contracts | $ | 448 | * | ||||
Net Assets — Unrealized appreciation on swap contracts | 1,667† | Net Assets — Unrealized depreciation on swap contracts | —† | |||||||||
Equity contracts | Net Assets — Unrealized appreciation on futures contracts | 6,716 | * | Net Assets — Unrealized depreciation on futures contracts | 1,944 | * | ||||||
Net Assets — Unrealized appreciation on swaps contracts | 8,215† | Net Assets — Unrealized depreciation on swap contracts | 581† | |||||||||
Foreign exchange contracts | Unrealized gain on forward foreign currency contracts | 11,480 | Unrealized loss on forward foreign currency contracts | 3,486 | ||||||||
Commodity contracts | Net Assets — Unrealized appreciation on futures contracts | 2,172 | * | Net Assets — Unrealized depreciation on futures contracts | 6,462 | * | ||||||
Net Assets — Unrealized appreciation on swaps contracts | 422† | Net Assets — Unrealized depreciation on swap contracts | 3,460† | |||||||||
|
|
|
| |||||||||
Total Derivatives not accounted for as hedging instruments | $ | 44,798 | $ | 16,381 | ||||||||
|
|
|
| |||||||||
| Multi-Asset Income Fund | ||||||||||||
Interest rate contracts | Options purchased, at value | $ | 1,946 | Options written, at value | $ | 1,287 | ||||||
Net Assets — Unrealized appreciation on swap contracts | 2,931† | Net Assets — Unrealized depreciation on swap contracts | 3,470† | |||||||||
Equity contracts | Net Assets — Unrealized appreciation on futures contracts | 9 | * | Net Assets — Unrealized depreciation on futures contracts | 141 | * | ||||||
Net Assets — Unrealized appreciation on swap contracts | 1,070† | Net Assets — Unrealized depreciation on swap contracts | 1,590† | |||||||||
Foreign exchange contracts | Unrealized gain on forward foreign currency contracts | 1,507 | Unrealized loss on forward foreign currency contracts | 161 | ||||||||
|
|
|
| |||||||||
Total Derivatives not accounted for as hedging instruments | $ | 7,463 | $ | 6,649 | ||||||||
|
|
|
| |||||||||
| Multi-Asset Inflation Managed Fund | ||||||||||||
Interest rate contracts | Net Assets — Unrealized appreciation on futures contracts | $ | 154 | Net Assets — Unrealized depreciation on futures contracts | $ | 525 | * | |||||
Net Assets — Unrealized appreciation on swap contracts | 982 | Net Assets — Unrealized depreciation on swap contracts | 2,090 | |||||||||
Equity contracts | Net Assets — Unrealized appreciation on futures contracts | — | * | Net Assets — Unrealized depreciation on futures contracts | 387 | * | ||||||
Foreign exchange contracts | Unrealized gain on forward foreign currency contracts | 352 | Unrealized loss on forward foreign currency contracts | 63 | ||||||||
Commodity contracts | Net Assets — Unrealized appreciation on futures contracts | 1,738 | * | Net Assets — Unrealized depreciation on futures contracts | 8,182 | * | ||||||
Credit contracts | Net Assets — Unrealized appreciation on swap contracts | 98† | Net Assets — Unrealized depreciation on swap contracts | 210† | ||||||||
|
|
|
| |||||||||
Total Derivatives not accounted for as hedging instruments | $ | 3,324 | $ | 11,457 | ||||||||
|
|
|
| |||||||||
| 248 | SEI Institutional Managed Trust / Semi-Annual Report / March 31, 2015 |
| Asset Derivatives | Liability Derivatives | |||||||||||
| Six month period ended March 31, 2015 ($ Thousands) | Six month period ended March 31, 2015 ($ Thousands) | |||||||||||
| Statement of Assets and Liabilities/Consolidated Statements of Assets and Liabilities Location | Fair Value | Statement of Assets and Liabilities/Consolidated Statements of Assets and Liabilities Location | Fair Value | |||||||||
| Multi-Asset Capital Stability Fund | ||||||||||||
Interest rate contracts | Net Assets — Unrealized appreciation on futures contracts | $ | 717 | * | Net Assets — Unrealized depreciation on futures contracts | $ | — | |||||
Net Assets — Unrealized appreciation on swap contracts | 2,687† | Net Assets — Unrealized depreciation on swap contracts | 2,066† | |||||||||
Equity contracts | Net Assets — Unrealized appreciation on futures contracts | 572 | * | Net Assets — Unrealized depreciation on futures contracts | 378 | * | ||||||
Foreign exchange contracts | Unrealized gain on forward foreign currency contracts | 16 | Unrealized loss on forward foreign currency contracts | 73 | ||||||||
Credit contracts | Net Assets — Unrealized appreciation on swap contracts | 48† | Net Assets — Unrealized depreciation on swap contracts | 127† | ||||||||
|
|
|
| |||||||||
Total Derivatives not accounted for as hedging instruments | $ | 4,040 | $ | 2,644 | ||||||||
|
|
|
| |||||||||
| * | Includes cumulative appreciation/depreciation of futures contracts as reported in the Schedules of Investments/Consolidated Schedule of Investments. Only current day’s variation margin is reported within the Statements of Assets & Liabilities. |
| † | Includes cumulative appreciation/depreciation of swap contracts as reported in the Schedules of Investments/Consolidated Schedule of Investments. Market Value is reported within the Statements of Assets & Liabilities for swap contracts that have paid premiums. |
The effect of derivative instruments on the Statements of Operations for the six month period ended March 31, 2015
Amount of realized gain or (loss) on derivatives recognized in income ($ Thousands):
| Derivatives Not Accounted for as Hedging Instruments | Options | Swaptions | Futures | Forward Currency Contracts | Swaps | Total | ||||||||||||||||||
Global Managed Volatility Fund | ||||||||||||||||||||||||
Equity contracts | $ | — | $ | — | $ | 5,103 | $ | — | $ | — | $ | 5,103 | ||||||||||||
Foreign exchange contracts | — | — | 98,788 | — | 98,788 | |||||||||||||||||||
Total | $ | — | $ | — | $ | 5,103 | $ | 98,788 | $ | — | $ | 103,891 | ||||||||||||
Core Fixed Income Fund | ||||||||||||||||||||||||
Interest rate contracts | $ | 472 | $ | (738 | ) | $ | (1,690 | ) | $ | — | $ | (203 | ) | $ | (2,159 | ) | ||||||||
Foreign exchange contracts | — | — | — | 2,218 | — | 2,218 | ||||||||||||||||||
Credit contracts | — | — | — | — | 177 | 177 | ||||||||||||||||||
Total | $ | 472 | $ | (738 | ) | $ | (1,690 | ) | $ | 2,218 | $ | (26 | ) | $ | 236 | |||||||||
U.S. Fixed Income Fund | ||||||||||||||||||||||||
Interest rate contracts | $ | 141 | $ | — | $ | (2,060 | ) | $ | — | $ | — | $ | (1,919 | ) | ||||||||||
Total | $ | 141 | $ | — | $ | (2,060 | ) | $ | — | $ | — | $ | (1,919 | ) | ||||||||||
Multi-Asset Accumulation Fund | ||||||||||||||||||||||||
Interest rate contracts | $ | — | $ | — | $ | 81,422 | $ | — | $ | 25,852 | $ | 107,274 | ||||||||||||
Equity contracts | — | — | 40,074 | — | (877 | ) | 39,197 | |||||||||||||||||
Foreign exchange contracts | — | — | — | 28,303 | — | 28,303 | ||||||||||||||||||
Commodity contracts | — | — | (35,767 | ) | — | (48,840 | ) | (84,607 | ) | |||||||||||||||
Total | $ | — | $ | — | $ | 85,729 | $ | 28,303 | $ | (23,865 | ) | $ | 90,167 | |||||||||||
Multi-Asset Income Fund | ||||||||||||||||||||||||
Interest rate contracts | $ | — | $ | — | $ | — | $ | — | $ | (45 | ) | $ | (125 | ) | ||||||||||
Equity contracts | (2,088 | ) | — | 863 | — | 4,122 | 2,897 | |||||||||||||||||
Foreign exchange contracts | — | — | — | 5,062 | — | 5,062 | ||||||||||||||||||
Commodity contracts | — | — | 1,715 | — | — | 1,715 | ||||||||||||||||||
Total | $ | (2,088 | ) | $ | — | $ | 2,578 | $ | 5,062 | $ | 4,077 | $ | 9,549 | |||||||||||
Multi-Asset Inflation Managed Fund | ||||||||||||||||||||||||
Interest rate contracts | $ | — | $ | — | $ | (1,103 | ) | $ | — | $ | (2 | ) | $ | (1,105 | ) | |||||||||
Equity contracts | — | — | (268 | ) | — | — | (268 | ) | ||||||||||||||||
Foreign exchange contracts | — | — | — | 3,294 | — | 3,294 | ||||||||||||||||||
Commodity contracts | — | — | (40,811 | ) | — | — | (40,811 | ) | ||||||||||||||||
Total | $ | — | $ | — | $ | (42,182 | ) | $ | 3,294 | $ | (2 | ) | $ | (38,890 | ) | |||||||||
Multi-Asset Capital Stability Fund | ||||||||||||||||||||||||
Interest rate contracts | $ | — | $ | — | $ | 2,958 | $ | — | $ | 412 | $ | 3,370 | ||||||||||||
Equity contracts | (407 | ) | — | (6,063 | ) | — | — | (6,470 | ) | |||||||||||||||
Foreign exchange contracts | — | — | — | 1,090 | — | 1,090 | ||||||||||||||||||
Credit contracts | — | — | — | — | 247 | 247 | ||||||||||||||||||
Total | $ | (407 | ) | $ | — | $ | (3,105 | ) | $ | 1,090 | $ | 659 | $ | (1,763 | ) | |||||||||
| SEI Institutional Managed Trust / Semi-Annual Report / March 31, 2015 | 249 |
Notes to Financial Statements/Consolidated Notes to Financial Statements (Unaudited) (Continued)
March 31, 2015
Change in unrealized appreciation or (depreciation) on derivatives recognized in income ($ Thousands):
| Derivatives Not Accounted for as Hedging Instruments | Options | Swaptions | Futures | Forward Currency Contracts | Swaps | Total | ||||||||||||||||||
| Global Managed Volatility Fund | ||||||||||||||||||||||||
Equity contracts | $ | — | — | $ | 1,267 | $ | — | $ | — | $ | 1,267 | |||||||||||||
Foreign exchange contracts | — | — | (318 | ) | — | (318 | ) | |||||||||||||||||
Total | $ | — | $ | — | $ | 1,267 | $ | (318 | ) | $ | — | $ | 949 | |||||||||||
| Core Fixed Income Fund | ||||||||||||||||||||||||
Interest rate contracts | $ | 106 | $ | 495 | $ | 1,105 | $ | — | $ | (769 | ) | $ | 937 | |||||||||||
Foreign exchange contracts | — | — | — | (954 | ) | — | (954 | ) | ||||||||||||||||
Credit contracts | — | — | — | — | 31 | 31 | ||||||||||||||||||
Total | $ | 106 | $ | 495 | $ | 1,105 | $ | (954 | ) | $ | (738 | ) | $ | 14 | ||||||||||
| U.S. Fixed Income Fund | ||||||||||||||||||||||||
Interest rate contracts | $ | (21 | ) | $ | — | $ | (586 | ) | $ | — | $ | (344 | ) | $ | (951 | ) | ||||||||
Total | $ | (21 | ) | $ | — | $ | (586 | ) | $ | — | $ | (344 | ) | $ | (951 | ) | ||||||||
| Multi-Asset Accumulation Fund | ||||||||||||||||||||||||
Interest rate contracts | $ | — | $ | — | $ | 15,364 | $ | — | $ | 4,694 | $ | 20,058 | ||||||||||||
Equity contracts | — | — | 16,923 | — | 10,489 | 27,412 | ||||||||||||||||||
Foreign exchange contracts | — | — | — | 8,269 | — | 8,269 | ||||||||||||||||||
Commodity contracts | — | — | 6,731 | — | 5,663 | 12,394 | ||||||||||||||||||
Total | $ | — | $ | — | $ | 39,018 | $ | 8,269 | $ | 20,846 | $ | 68,133 | ||||||||||||
| Multi-Asset Income Fund | ||||||||||||||||||||||||
Interest rate contracts | $ | (250 | ) | $ | — | $ | — | $ | — | $ | 217 | $ | (33 | ) | ||||||||||
Equity contracts | — | — | (132 | ) | — | 1,662 | 1,530 | |||||||||||||||||
Foreign exchange contracts | — | — | 740 | — | 740 | |||||||||||||||||||
Total | $ | (250 | ) | $ | — | $ | (132 | ) | $ | 740 | $ | 1,879 | $ | 2,237 | ||||||||||
| Multi-Asset Inflation Managed Fund | ||||||||||||||||||||||||
Interest rate contracts | $ | — | $ | — | $ | (565 | ) | $ | — | $ | (954 | ) | $ | (1,519 | ) | |||||||||
Equity contracts | — | — | (848 | ) | — | — | (848 | ) | ||||||||||||||||
Foreign exchange contracts | — | — | — | (429 | ) | — | (429 | ) | ||||||||||||||||
Commodity contracts | — | — | 5,205 | — | — | 5,205 | ||||||||||||||||||
Credit contracts | — | — | — | — | (84 | ) | (84 | ) | ||||||||||||||||
Total | $ | — | $ | — | $ | 3,792 | $ | (429 | ) | $ | (1,038 | ) | $ | 2,325 | ||||||||||
| Multi-Asset Capital Stability Fund | ||||||||||||||||||||||||
Interest rate contracts | $ | — | $ | — | $ | 898 | $ | — | $ | 631 | $ | 1,529 | ||||||||||||
Equity contracts | — | — | 1,296 | — | — | 1,296 | ||||||||||||||||||
Foreign exchange contracts | — | — | (285 | ) | — | (285 | ) | |||||||||||||||||
Credit contracts | — | — | — | — | (21 | ) | (21 | ) | ||||||||||||||||
Total | $ | — | $ | — | $ | 2,194 | $ | (285 | ) | $ | 610 | $ | 2,519 | |||||||||||
| 250 | SEI Institutional Managed Trust / Semi-Annual Report / March 31, 2015 |
A Fund is subject to various netting arrangements with select counterparties (“Master Agreements”). Master Agreements govern the terms of certain transactions, and reduce the counterparty risk associated with relevant transactions by specifying credit protection mechanisms and providing standardization that improves legal certainty. Since different types of transactions have different mechanics and are sometimes traded out of different legal entities of a particular counterparty organization, each type of transaction may be covered by a different Master Agreement, resulting in the need for multiple agreements with a single counterparty. As the Master Agreements are specific to unique operations of different asset types, they allow a Fund to close out and net its total exposure to a specific counterparty entity in the event of a default with respect to all the transactions governed under a single agreement with a specific counterparty entity.
Master Agreements can also help limit counterparty risk by specifying collateral posting arrangements at pre-arranged exposure levels. Under the Master Agreements, collateral is routinely transferred if the total net exposure to certain transactions (net of existing collateral already in place) governed under the relevant Master Agreement with a counterparty in a given account exceeds a specified threshold, which typically ranges from zero to $250,000 depending on the counterparty and the type of Master Agreement. United States Treasury Securities and U.S. dollar cash are generally the preferred forms of collateral. Securities
and cash pledged as collateral are reflected as assets on the Statements of Assets and Liabilities/Consolidated Statements of Assets and Liabilities as either a component of investments at value (securities) or deposits due from counterparties (cash). Cash collateral received is not typically held in a segregated account and as such is reflected as a liability on the Statements of Assets and Liabilities/Consolidated Statements of Assets and Liabilities as deposits due to counterparties. The market value of any securities received as collateral is not reflected as a component of net asset value. A Fund’s overall exposure to counterparty risk can change substantially within a short period, as it is affected by each transaction subject to the relevant Master Agreement.
Customer Account Agreements and related addendums govern exchange traded derivatives transactions such as futures, options on futures, and centrally cleared swaps. Exchange traded derivative transactions require posting of initial margin as determined by each relevant clearing agency which is segregated at a broker account registered with the Commodities Futures Trading Commission (CFTC), or the applicable regulator. In the US, counterparty risk is reduced as placement due to the Fund assets in the segregated account. Additionally, portability of exposure in the event of default further reduces risk to the Funds. Variation margin, or changes in market value, are exchanged daily, but may not be netted between futures and cleared OTC derivatives.
The following is a summary of the market value and variation margin of exchange-traded or centrally cleared financial derivative instruments of the Funds as of March 31, 2015 ($ Thousands):
| Financial Derivative Assets | Financial Derivative Liabilities | |||||||||||||||||||||||||||||||||
| Market value | Variation Margin Asset | Market value | Variation Margin Liability | |||||||||||||||||||||||||||||||
| Fund | Purchased Options/ Swaptions | Futures | Swap Agreements | Total | Written Options/ Swaptions | Futures | Swap Agreements | Total | ||||||||||||||||||||||||||
Large Cap Fund | $ | — | $ | — | $ | — | $ | — | $ | — | $ | 430 | $ | — | $ | 430 | ||||||||||||||||||
Large Cap Value Fund | — | — | — | — | — | 66 | — | 66 | ||||||||||||||||||||||||||
Large cap Growth Fund | — | — | — | — | — | 163 | — | 163 | ||||||||||||||||||||||||||
Tax-Managed Large Cap Fund | — | — | — | — | — | 690 | — | 690 | ||||||||||||||||||||||||||
S&P 500 Index Fund | — | — | — | — | — | 56 | — | 56 | ||||||||||||||||||||||||||
Extended Market Index Fund | — | — | — | — | — | 39 | — | 39 | ||||||||||||||||||||||||||
Small Cap Fund | — | — | — | — | — | 22 | — | 22 | ||||||||||||||||||||||||||
Small Cap Value Fund | — | — | — | — | — | 3 | — | 3 | ||||||||||||||||||||||||||
Tax-Managed Small/Mid Cap Fund | — | — | — | — | — | 62 | — | 62 | ||||||||||||||||||||||||||
Mid-Cap Fund | — | — | — | — | — | 8 | — | 8 | ||||||||||||||||||||||||||
U.S. Managed Volatility Fund | — | — | — | — | — | 285 | — | 285 | ||||||||||||||||||||||||||
Global Managed Volatility Fund | — | — | — | — | — | 669 | — | 669 | ||||||||||||||||||||||||||
Tax-Managed Managed Volatility Fund | — | — | — | — | — | 247 | — | 247 | ||||||||||||||||||||||||||
Enhanced Income Fund | — | 1 | — | 1 | — | 5 | — | 5 | ||||||||||||||||||||||||||
Core Fixed Income Fund | 161 | 285 | — | 446 | 375 | 193 | 41 | 609 | ||||||||||||||||||||||||||
U.S. Fixed Income Fund | 33 | 127 | — | 160 | 103 | 136 | 1 | 240 | ||||||||||||||||||||||||||
High Yield Bond Fund | — | — | 4 | 4 | — | — | 20 | 20 | ||||||||||||||||||||||||||
Multi-Asset Accumulation Fund | — | 2,487 | 285 | 2,772 | — | 8,782 | — | 8,782 | ||||||||||||||||||||||||||
Multi-Asset Income Fund | 1,946 | — | 88 | 2,034 | 1,287 | 118 | 291 | 1,696 | ||||||||||||||||||||||||||
Multi-Asset Inflation Managed Fund | — | — | 2,193 | 2,193 | — | 2,710 | 2,095 | 4,805 | ||||||||||||||||||||||||||
Multi-Asset Capital Stability Fund | — | 1,049 | 1,120 | 2,169 | — | 1,583 | 1,042 | 2,625 | ||||||||||||||||||||||||||
Long/Short Alternative Fund | — | 33 | — | 33 | — | 85 | — | 85 | ||||||||||||||||||||||||||
Total Exchange-Traded or Centrally Cleared | $ | 2,140 | $ | 3,982 | $ | 3,690 | $ | 9,812 | $ | 1,765 | $ | 16,352 | $ | 3,490 | $ | 21,607 | ||||||||||||||||||
| SEI Institutional Managed Trust / Semi-Annual Report / March 31, 2015 | 251 |
Notes to Financial Statements/Consolidated Notes to Financial Statements (Unaudited) (Continued)
March 31, 2015
Securities with an aggregate marked value of $40,254 ($ Thousands) have been pledged as collateral for exchange-traded and centrally cleared derivative instruments as of March 31, 2015.
International Swaps and Derivatives Association, Inc. Master Agreements and Credit Support Annexes (“ISDA Master Agreements”) govern OTC financial derivative transactions entered into by a Fund
and select counterparties. ISDA Master Agreements maintain provisions for general obligations, representations, agreements, collateral and events of default or termination. Events of termination include
conditions that may entitle counterparties to elect to terminate early and cause settlement of all outstanding transactions under the applicable ISDA Master Agreement. Any election to terminate early could be material to the financial statements. In limited circumstances, the ISDA Master Agreement may contain additional provisions that add additional counterparty protection beyond coverage of existing daily exposure if the counterparty has a decline in credit quality below a predefined level. These amounts, if any, may be segregated with a third party custodian.
The following is a summary by derivative type of the market value of OTC financial derivative instruments and collateral (received)/pledged as of March 31, 2015 ($ Thousands):
| Financial Derivative Assets | Financial Derivative Liabilities | |||||||||||||||||||||||||||||||||||||||||||
| Fund | Forward Foreign Currency Contracts | Swap Agreements | Total Over the Counter | Forward Foreign Currency Contracts | Reverse Repurchase Agreement | Swap Agreements | Total Over the Counter | Net Market Value of OTC Derivatives | Collateral (Received)/ Pledged | Net Exposures(1) | ||||||||||||||||||||||||||||||||||
Global Managed Volatility Fund | $ | 7,973 | $ | — | $ | 7,973 | $ | 107 | $ | — | $ | — | $ | 107 | $ | 7,866 | $ | — | $ | 7,866 | ||||||||||||||||||||||||
Core Fixed Income Fund | 844 | 2,424 | 3,268 | 302 | — | 2,972 | 3,274 | (6 | ) | 4,077 | 4,071 | |||||||||||||||||||||||||||||||||
U.S. Fixed Income Fund | — | 620 | 620 | — | — | 759 | 759 | (139 | ) | 395 | 256 | |||||||||||||||||||||||||||||||||
Multi-Asset Accumulation Fund | 11,480 | 8,637 | 20,117 | 3,486 | — | 4,041 | 7,527 | 12,590 | — | 12,590 | ||||||||||||||||||||||||||||||||||
Multi-Asset Income Fund | 1,507 | 1,070 | 2,577 | 161 | 61,822 | 1,590 | 63,573 | (60,996 | ) | 6,091 | (54,905 | ) | ||||||||||||||||||||||||||||||||
Multi-Asset Inflation Managed Fund | 352 | 66 | 418 | 63 | 166,358 | — | 63 | 355 | — | 355 | ||||||||||||||||||||||||||||||||||
Multi-Asset Capital Stability Fund | 16 | 19,987 | 20,003 | 73 | — | 20,406 | 20,479 | (476 | ) | 9,324 | 8,848 | |||||||||||||||||||||||||||||||||
Total Over the Counter | $ | 14,199 | $ | 32,804 | $ | 47,003 | $ | 4,085 | $ | 228,180 | $ | 29,768 | $ | 95,675 | ||||||||||||||||||||||||||||||
| (1) | Net Exposures represents the net receivable/(payable) that would be due from /to the counterparty in the event of default. Exposure from OTC financial derivative instruments can only be netted across transactions governed under the same master agreement with the same legal entity. |
| (2) | Excess collateral received is not shown for financial reporting purposes. |
Securities with an aggregate market value of $0 have been pledged and $0 have been received as collateral for financial derivative instruments as governed by International Swaps and Derivatives Association, Inc. master agreements as of March 31, 2015.
Written Options transactions entered into during the six month period ended March 31, 2015 are summarized as follows:
Core Fixed | ||||||||
| Number of Contracts | Premium ($ Thousands) | |||||||
| Balance at beginning of period | 10,390,471 | $ | 209 | |||||
| Written | 4,884 | 1,277 | ||||||
| Expired | (6,401,807 | ) | (503 | ) | ||||
| Closing Buys | (3,992,573 | ) | (692 | ) | ||||
| Balance at end of period | 975 | $ | 291 | |||||
U.S. Fixed | ||||||||
| Number of Contracts | Premium ($ Thousands) | |||||||
Balance at beginning of period | 1,490,150 | $ | 56 | |||||
| Written | 1,637 | 427 | ||||||
| Expired | (347 | ) | (62 | ) | ||||
| Closing Buys | (1,490,844 | ) | (230 | ) | ||||
| Balance at end of period | 596 | $ | 191 | |||||
Multi-Asset | ||||||||
| Number of Contracts | Premium ($ Thousands) | |||||||
| Balance at beginning of period | — | $ | — | |||||
| Written | 22,533 | 6,105 | ||||||
| Expired | — | — | ||||||
| Closing Buys | (9,020 | ) | (4,408 | ) | ||||
| Balance at end of period | 13,513 | $ | 1,697 | |||||
| 252 | SEI Institutional Managed Trust / Semi-Annual Report / March 31, 2015 |
| Multi-Asset Capital Stablility | ||||||||
| Number of Contracts | Premium ($ Thousands) | |||||||
| Balance at beginning of period | — | $ | — | |||||
| Written | 32,470,000 | 983 | ||||||
| Expired | — | — | ||||||
| Closing Buys | (32,470,000 | ) | (983 | ) | ||||
| Balance at end of period | — | $ | — | |||||
Written Swaptions transactions entered into during the six month period ended March 31, 2015 are summarized as follows:
| Core Fixed Income Fund | ||||||||
| Notional Amount ($ Thousands) | Premium ($ Thousands) | |||||||
| Balance at beginning of period | $ | 13,905 | $ | 360 | ||||
| Balance at end of period | $ | 13,905 | $ | 360 | ||||
At March 31, 2015 the Funds had cash and/or securities at least equal to the value of written options/written swaptions.
5. BASIS FOR CONSOLIDATION FOR THE MULTI-ASSET ACCUMULATION FUND AND MULTI-ASSET INFLATION MANAGED FUND
The consolidated Schedules of Investments, Statements of Assets and Liabilities, Statements of Operations, Statements of Changes in Net Assets, Statement of Cash Flows, and the Financial Highlights of the Multi-Asset Accumulation Fund and Multi-Asset Inflation Managed Fund include the accounts of their respective Subsidiaries. All inter-company accounts and transactions have been eliminated in consolidation for the Funds. Each of the Subsidiaries has a fiscal year end of September 30th for financial statement consolidation purposes and a nonconforming tax year end of August 31.
The Subsidiaries are classified as controlled foreign corporations under the Internal Revenue Code of 1986 (“IRC”). Each Subsidiary’s taxable income is included in the calculation of the relevant Fund’s taxable income. Net losses of the Subsidiaries are not deductible by the Funds either in the current period or carried forward to future periods.
The Multi-Asset Accumulation Fund and Multi-Asset Inflation Managed Fund may each invest up to 25% of their total assets in its respective Subsidiary.
A summary of the Funds’ investments in the Subsidiaries are as follows:
| INCEPTION DATE OF SUBSIDIARY | SUBSIDIARY NET MARCH 31, ($ THOUSANDS) | % OF TOTAL NET ASSETS AT | ||||||||
Accumulation Commodity Strategy Subsidiary, Ltd | April 9, 2012 | $ | 334,018 | 15.6 | % | |||||
Inflation Commodity Strategy Subsidiary, Ltd. | April 9, 2012 | 171,407 | 17.6 | % | ||||||
Gains and losses attributed to the Funds’ investments in Subsidiaries are as follows:
| ACCUMULATION COMMODITY STRATEGY SUBSIDIARY, LTD. ($ THOUSANDS) | INFLATION COMMODITY STRATEGY SUBSIDIARY, LTD. ($ THOUSANDS) | |||||||
Investment Income: | ||||||||
Interest Income | $ | 287 | $ | 14 | ||||
Net Realized Gain (Loss) on: | ||||||||
Investments | (38 | ) | — | |||||
Futures Contracts | (37,348 | ) | (40,810 | ) | ||||
Swap Contracts | (48,840 | ) | — | |||||
Foreign Currency Transactions | (3 | ) | 9 | |||||
Net Change in Unrealized Appreciation (Depreciation) on: | ||||||||
Investments | 601 | — | ||||||
Futures Contracts | 7,056 | 5,205 | ||||||
Swap Contracts | 5,663 | — | ||||||
Foreign Currency and Translation of Other Assets and Liabilities Denominated in Foreign Currency | — | (6 | ) | |||||
|
|
|
| |||||
Total gains and losses attributed to the Funds’ investments in Subsidiaries | $ | (72,622 | ) | $ | (35,588 | ) | ||
|
|
|
| |||||
6. INVESTMENT ADVISORY, ADMINISTRATION AND DISTRIBUTION AGREEMENTS, INVESTMENT SUB-ADVISORY AGREEMENTS AND OTHER TRANSACTIONS WITH AFFILIATES
Investment Advisory, Administration and Distribution Agreements — SIMC serves as investment adviser (the “Adviser”) to each Fund. In connection with serving as Adviser, SIMC is entitled to a fee, which is calculated daily and paid monthly, based on the average daily net assets of each Fund.
SEI Investments Global Funds Services (the “Administrator”) provides administrative and transfer agency services to the Funds for annual fees, based on the average daily net assets of each Fund.
SEI Investments Distribution Co. (the “Distributor”), a wholly owned subsidiary of SEI Investments Company (“SEI”) serves as each Fund’s Distributor. The Trust has adopted plans under which firms, including the Distributor, that provide shareholder and administrative services may receive compensation therefrom. Such plans provide fees payable to the Distributor, calculated as a percentage of the average daily net assets attributable to each particular class of each respective
fund. Under both the Shareholder Servicing Plan and Administrative Service Plan, the Distributor may retain as profit any difference between the fee it receives and the amount it pays to third parties. During the six month period ended March 31, 2015, the Distributor voluntarily waived a portion of its fee for all of the Funds except the U.S. Managed Volatility, Global Managed Volatility and Tax-Managed Managed Volatility Funds.
| SEI Institutional Managed Trust / Semi-Annual Report / March 31, 2015 | 253 |
Notes to Financial Statements/Consolidated Notes to Financial Statements (Unaudited) (Continued)
March 31, 2015
The Adviser, Administrator and/or Distributor have voluntarily agreed to waive a portion of their fees in order to keep total direct operating expenses (exclusive of interest from borrowings, brokerage commissions, taxes, Trustee fees, prime broker fees, interest and dividend expenses related to short sales and extraordinary expenses not incurred in the ordinary course of the Funds’ business) at a specified level. The waivers by the Funds’ Adviser, Administrator and/or Distributor are limited to the Funds’ direct operating expenses and,
therefore, do not apply to indirect expenses incurred by the Funds, such as acquired fund fees and expenses. The waivers are voluntarily and the Funds’ Adviser, Administrator and/or Distributor may discontinue all or part of any of these waivers at any time. In addition, some Funds may participate in a commission recapture program where the Funds’ trades may be executed through the Funds’ distributor, and a portion of the commissions paid on those trades are then used to pay the Funds’ expenses.
Effective October 1, 2014, the following is a summary of annual fees payable to the Adviser, Administrator and Distributor and the voluntary expense limitations for each fund:
| Advisory Fee | Administration Fee | Shareholder Servicing Fee | Administrative Servicing Fee | Voluntary Expense Limitation | ||||||||||||||||
Large Cap Fund |
| |||||||||||||||||||
Class A | 0.3900 | % | 0.30 | % | 0.25 | % | — | 0.89 | % | |||||||||||
Class Y | 0.3900 | % | 0.30 | % | — | — | 0.64 | % | ||||||||||||
Large Cap Value Fund |
| |||||||||||||||||||
Class A | 0.3500 | % | 0.30 | % | 0.25 | % | — | 0.89 | % | |||||||||||
Class I | 0.3500 | % | 0.30 | % | — | 0.25 | % | 1.11 | % | |||||||||||
Large Cap Growth Fund |
| |||||||||||||||||||
Class A | 0.4000 | % | 0.30 | % | 0.25 | % | — | 0.89 | % | |||||||||||
Class I | 0.4000 | % | 0.30 | % | — | 0.25 | % | 1.11 | % | |||||||||||
Tax-Managed Large Cap Fund |
| |||||||||||||||||||
Class A | 0.4000 | % | 0.30 | % | 0.25 | % | — | 0.89 | % | |||||||||||
Class Y | 0.4000 | % | 0.30 | % | — | — | 0.64 | % | ||||||||||||
S&P 500 Index Fund |
| |||||||||||||||||||
Class A | 0.0300 | % | 0.22 | % | 0.25 | % | — | 0.43 | % | |||||||||||
Class E | 0.0300 | % | 0.22 | % | — | — | 0.25 | % | ||||||||||||
Class I | 0.0300 | % | 0.22 | % | 0.25 | % | 0.25 | % | 0.65 | % | ||||||||||
Small Cap Fund |
| |||||||||||||||||||
Class A | 0.6500 | % | 0.30 | % | 0.25 | % | — | 1.14 | % | |||||||||||
Class Y | 0.6500 | % | 0.30 | % | — | — | 0.89 | % | ||||||||||||
Small Cap Value Fund |
| |||||||||||||||||||
Class A | 0.6500 | % | 0.30 | % | 0.25 | % | — | 1.14 | % | |||||||||||
Class I | 0.6500 | % | 0.30 | % | 0.25 | % | 0.25 | % | 1.36 | % | ||||||||||
Small Cap Growth Fund |
| |||||||||||||||||||
Class A | 0.6500 | % | 0.30 | % | 0.25 | % | — | 1.11 | % | |||||||||||
Class I | 0.6500 | % | 0.30 | % | 0.25 | % | 0.25 | % | 1.36 | % | ||||||||||
Tax-Managed Small/Mid Cap Fund |
| |||||||||||||||||||
Class A | 0.6500 | % | 0.30 | % | 0.25 | % | — | 1.11 | % | |||||||||||
Class Y | 0.6500 | % | 0.30 | % | — | — | 0.89 | % | ||||||||||||
Mid-Cap Fund |
| |||||||||||||||||||
Class A | 0.4000 | % | 0.30 | % | 0.25 | % | — | 1.02 | % | |||||||||||
Class I | 0.4000 | % | 0.30 | % | 0.25 | % | 0.25 | % | 1.26 | % | ||||||||||
U.S. Managed Volatility Fund |
| |||||||||||||||||||
Class A | 0.6500 | % | 0.30 | % | 0.25 | % | — | 1.00 | % | |||||||||||
Class I | 0.6500 | % | 0.30 | % | 0.25 | % | 0.25 | % | 1.25 | % | ||||||||||
Class Y | 0.6500 | % | 0.30 | % | — | — | 0.75 | % | ||||||||||||
Global Managed Volatility Fund |
| |||||||||||||||||||
Class A | 0.6500 | % | 0.30 | % | 0.25 | % | — | 1.11 | % | |||||||||||
Class I | 0.6500 | % | 0.30 | % | 0.25 | % | 0.25 | % | 1.36 | % | ||||||||||
Class Y | 0.6500 | % | 0.30 | % | — | — | 0.86 | % | ||||||||||||
Tax-Managed Managed Volatility Fund |
| |||||||||||||||||||
Class A | 0.6500 | % | 0.30 | % | 0.25 | % | — | 1.00 | % | |||||||||||
Real Estate Fund |
| |||||||||||||||||||
Class A | 0.6500 | % | 0.30 | % | 0.25 | % | — | 1.14 | % | |||||||||||
Class I | 0.6500 | % | 0.30 | % | 0.25 | % | 0.25 | % | 1.36 | % | ||||||||||
Class Y | 0.6500 | % | 0.30 | % | — | — | 0.89 | % | ||||||||||||
Enhanced Income Fund |
| |||||||||||||||||||
Class A | 0.4000 | % | 0.30 | % | 0.25 | % | — | 0.60 | % | |||||||||||
Class I | 0.4000 | % | 0.30 | % | 0.25 | % | 0.25 | % | 0.85 | % | ||||||||||
Class Y | 0.4000 | % | 0.30 | % | — | — | 0.46 | % | ||||||||||||
| 254 | SEI Institutional Managed Trust / Semi-Annual Report / March 31, 2015 |
| Advisory Fee | Administration Fee | Shareholder Servicing Fee | Administrative Servicing Fee | Voluntary Expense Limitation | ||||||||||||||||
Core Fixed Income Fund |
| |||||||||||||||||||
Class A | 0.2750 | % | 0.28 | % | 0.25 | % | — | 0.67 | % | |||||||||||
Class I | 0.2750 | % | 0.28 | % | 0.25 | % | 0.25 | % | 0.89 | % | ||||||||||
U.S. Fixed Income |
| |||||||||||||||||||
Class A | 0.2750 | % | 0.28 | % | 0.25 | % | — | 0.66 | % | |||||||||||
Class Y | 0.2750 | % | 0.28 | % | — | — | 0.41 | % | ||||||||||||
High Yield Bond Fund |
| |||||||||||||||||||
Class A | 0.4875 | % | 0.30 | % | 0.25 | % | — | 0.89 | % | |||||||||||
Class I | 0.4875 | % | 0.30 | % | 0.25 | % | 0.25 | % | 1.11 | % | ||||||||||
Class Y | 0.4875 | % | 0.30 | % | — | — | 0.64 | % | ||||||||||||
Real Return |
| |||||||||||||||||||
Class A | 0.2200 | % | 0.30 | % | 0.25 | % | — | 0.45 | % | |||||||||||
Class Y | 0.2200 | % | 0.30 | % | — | — | 0.35 | % | ||||||||||||
Multi-Strategy Alternative Fund |
| |||||||||||||||||||
Class A | 1.5000 | % | 0.30 | % | 0.25 | % | — | 0.50 | %† | |||||||||||
Multi-Asset Accumulation Fund |
| |||||||||||||||||||
Class A | 0.7500 | % | 0.30 | % | 0.25 | % | — | 1.17 | % | |||||||||||
Class Y | 0.7500 | % | 0.30 | % | — | — | 0.93 | % | ||||||||||||
Multi-Asset Income Fund |
| |||||||||||||||||||
Class A | 0.6000 | % | 0.30 | % | 0.25 | % | — | 0.80 | % | |||||||||||
Class Y | 0.6000 | % | 0.30 | % | — | — | 0.74 | % | ||||||||||||
Multi-Asset Inflation Managed Fund |
| |||||||||||||||||||
Class A | 0.5500 | % | 0.30 | % | 0.25 | % | — | 0.90 | % | |||||||||||
Class Y | 0.5500 | % | 0.30 | % | — | — | 0.95 | % | ||||||||||||
Multi-Asset Capital Stability Fund |
| |||||||||||||||||||
Class A | 0.4000 | % | 0.30 | % | 0.25 | % | — | 0.62 | % | |||||||||||
Class Y | 0.4000 | % | 0.30 | % | — | — | 0.52 | % | ||||||||||||
Long/Short Alternative Fund |
| |||||||||||||||||||
Class A | 0.8000 | % | 0.30 | % | 0.25 | % | — | 1.15 | % | |||||||||||
| † | Prior to May 15, 2014, the voluntary expense limitation was 0.63%. |
As of March 31, 2015, SIMC has entered into investment sub-advisory agreements with the following parties:
| Investment Sub-Adviser |
Large Cap Fund |
AQR Capital Management, LLC |
AJO, L.P. |
Brown Advisory LLC |
Jackson Square Partners, LLC |
LSV Asset Management |
Waddell + Reed Investment Management Company |
Large Cap Value Fund |
AJO, L.P. |
Brandywine Global Investment Management LLC |
Lazard Asset Management LLC |
LSV Asset Management |
Large Cap Growth Fund |
Brown Advisory LLC |
INTECH Investment Management, LLC |
Jackson Square Partners, LLC |
Tax-Managed Large Cap Fund |
AQR Capital Management, LLC |
AJO, L.P. |
Brown Advisory LLC |
Jackson Square Partners, LLC |
LSV Asset Management |
Parametric Portfolio Associates LLC |
Waddell + Reed Investment Management Company |
S&P 500 Index Fund |
SSgA Funds Management, Inc. |
Small Cap Fund |
AllianceBernstein, L.P. |
| Investment Sub-Adviser |
AQR Capital Management, LLC |
EAM Investors, LLC |
Fiduciary Management Associates, LLC |
Integrity Asset Management, LLC |
Montibus Capital Management, LLC |
Robeco Investment Management, Inc. |
Snow Capital Management L.P. |
Small Cap Value Fund |
Fiduciary Management Associates, LLC |
LMCG Investments, LLC |
LSV Asset Management |
Martingale Asset Management, L.P. |
Robeco Investment Management, Inc. |
Security Capital Research + Management |
William Blair + Company, LLC |
Small Cap Growth Fund |
AllianceBernstein, L.P. |
AQR Capital Management, LLC |
Arrowpoint Asset Management, LLC |
EAM Investors, LLC |
J.P. Morgan Investment Management Inc. |
Montibus Capital Management, LLC |
Tax-Managed Small/Mid Cap Fund |
AllianceBernstein, L.P. |
Castle Ark Management, LLC |
LMCG Investments, LLC |
Parametric Portfolio Associates LLC |
| SEI Institutional Managed Trust / Semi-Annual Report / March 31, 2015 | 255 |
Notes to Financial Statements/Consolidated Notes to Financial Statements (Unaudited) (Continued)
March 31, 2015
| Investment Sub-Adviser |
Snow Capital Management L.P. |
William Blair + Company, LLC |
Mid-Cap Fund |
Quantitative Management Associates LLC |
U.S. Managed Volatility Fund |
AJO, L.P. |
Analytic Investors, LLC |
LSV Asset Management |
Global Managed Volatility Fund |
Acadian Asset Management LLC |
Analytic Investors, LLC |
Tax-Managed Managed Volatility Fund |
Analytic Investors LLC |
AJO, L.P. |
LSV Asset Management |
Parametric Portfolio Associates, LLC |
Real Estate Fund |
Center Square Investment Management (formerly, Urdang Capital Management Inc.) |
Security Capital Research and Management, Inc. |
Enhanced Income Fund |
Ares Management LLC |
Wellington Management Company, LLP |
Core Fixed Income Fund |
Jennison Associates LLC |
Metropolitan West Asset Management LLC |
Wells Capital Management, Inc. |
Western Asset Management Company |
Western Asset Management Company Limited |
U.S. Fixed Income Fund |
Jennison Associates LLC |
J.P. Morgan Investment Management, Inc. |
Metropolitan West Asset Management LLC |
Wells Capital Management, Inc. |
Western Asset Management Company |
Western Asset Management Company Limited |
High Yield Bond Fund |
Ares Management LLC |
Benefit Street Partners, LLC |
Brigade Capital Management, LLC |
Delaware Investments Fund Advisers, a series of Delaware Management Business Trust |
J.P. Morgan Investment Management, Inc. |
Multi-Strategy Alternative Fund |
Multi-Asset Accumulation Fund |
AQR Capital Management, LLC |
PanAgora Asset Management Inc. |
SSgA Funds Management Inc. |
Multi-Asset Income Fund |
Guggenheim Partners Investment Management, LLC |
Multi-Asset Inflation Managed Fund |
AllianceBernstein, L.P. |
QS Investors, LLC |
Multi-Asset Capital Stability Fund |
AllianceBernstein, L.P. |
Long/Short Alternative Fund |
Beachhead Capital Management, LLC |
Under the investment sub-advisory agreements, each sub-adviser receives an annual fee paid by SIMC.
Other — The Distribution Agreement between the Distributor and the Trust provides that the Distributor may receive compensation on fund transactions effected for the Trust in accordance with the rules of the Securities and Exchange Commission (“SEC”). Accordingly, it is expected that fund transactions may result in brokerage commissions being paid to the Distributor. SEC rules require that such commissions not exceed usual and customary commissions.
Such commissions for the six month period ended March 31, 2015 were as follows ($ Thousands):
| Large Cap Fund | $ | 14 | ||
| Large Cap Value Fund | 66 | |||
| Large Cap Growth Fund | 14 | |||
| Small Cap Fund | 51 | |||
| Small Cap Value Fund | 16 | |||
| Small Cap Growth Fund | 34 | |||
| Mid-Cap Fund | 13 | |||
| Real Estate Fund | 6 | |||
|
| |||
| $ | 214 | |||
|
|
Payments to Affiliates — Certain officers and/or trustees of the Trust are also officers and/or Directors of the Administrator, Adviser and/or Distributor. The Trust pays each unaffiliated Trustee an annual fee for attendance at quarterly, interim and committee meetings. Compensation of officers and affiliated Trustees of the Trust is paid by the Administrator or Distributor.
A portion of the services provided by the Chief Compliance Officer (“CCO”) and his staff, whom are employees of the Administrator, are paid for by the Trust as incurred. The services include regulatory oversight of the Trust’s Adviser, sub-advisers and service providers as required by SEC regulations.
LSV Asset Management (a partially owned subsidiary of SIMC) serves as the sub-adviser to the Large Cap, Large Cap Value, Tax-Managed Large Cap, Small Cap Value, U.S. Managed Volatility and Tax-Managed Managed Volatility Funds. For this service LSV Asset Management is entitled to receive a fee from SIMC. Such fees for the six month period ended March 31, 2015 were as follows ($ Thousands):
| Large Cap Fund | $ | 272 | ||
| Large Cap Value Fund | 211 | |||
| Tax-Managed Large Cap Fund | 249 | |||
| Small Cap Value Fund | 220 | |||
| U.S. Managed Volatility Fund | 571 | |||
| Tax-Managed Managed Volatility Fund | 426 | |||
|
| |||
| $ | 1,949 | |||
|
|
Fees Paid Indirectly — The Funds may direct certain fund trades to the Distributor who pays a portion of the Funds’ expenses. Accordingly, the expenses reduced, which were used to pay third party expenses, and the effect on the Funds’ expense ratio, as a percentage of the Funds’ average daily net assets for the six month period ended
March 31, 2015, can be found on the Statement of Operations and Financial Highlights, respectively.
| 256 | SEI Institutional Managed Trust / Semi-Annual Report / March 31, 2015 |
Investment in Affiliated Security — The Funds may invest in the SEI Daily Income Trust Prime Obligation Fund, an affiliated money market fund to manage excess cash or to serve as margin or collateral for
derivative positions. Additionally, the Funds may invest the cash collateral from the securities lending program in the SEI Liquidity Fund, L.P.
The following is a summary of the transactions with affiliates for the six month period ended March 31, 2015 ($ Thousands):
| SEI Liquidity Fund | Purchases at Cost | Proceeds from Sales | Value 3/31/2015 | Dividend Income | ||||||||||||
Large Cap Fund | $ | 237,983 | $ | (271,276 | ) | $ | 27,907 | $ | 132 | |||||||
Large Cap Value Fund | 195,571 | (200,662 | ) | 55,747 | 48 | |||||||||||
Large Cap Growth Fund | 147,363 | (170,465 | ) | 24,315 | 56 | |||||||||||
Tax-Managed Large Cap Fund | 280,552 | (337,008 | ) | 49,580 | 349 | |||||||||||
S&P 500 Index Fund | 74,994 | (125,021 | ) | 4,859 | 53 | |||||||||||
Small Cap Fund | 89,106 | (109,345 | ) | 39,269 | 283 | |||||||||||
Small Cap Value Fund | 57,257 | (84,355 | ) | 22,692 | 242 | |||||||||||
Small Cap Growth Fund | 78,223 | (90,462 | ) | 42,956 | 264 | |||||||||||
Tax-Managed Small/Mid Cap Fund | 172,184 | (161,454 | ) | 53,582 | 141 | |||||||||||
Mid-Cap Fund | 12,130 | (14,953 | ) | 694 | 3 | |||||||||||
Real Estate Fund | 57,224 | (61,261 | ) | 4,219 | 5 | |||||||||||
Core Fixed Income Fund | 411,770 | (495,641 | ) | 15,887 | 78 | |||||||||||
U.S. Fixed Income Fund | 129,417 | (153,063 | ) | 5,054 | 29 | |||||||||||
High Yield Fund | — | — | 6 | — | ||||||||||||
| SDIT Prime Obligation | ||||||||||||||||
Large Cap Fund | 357,578 | (374,949 | ) | $ | 128,624 | 7 | ||||||||||
Large Cap Value Fund | 204,425 | (194,668 | ) | 58,894 | 2 | |||||||||||
Large Cap Growth Fund | 177,071 | (169,739 | ) | 28,667 | 2 | |||||||||||
Tax-Managed Large Cap Fund | 393,210 | (365,638 | ) | 194,470 | 9 | |||||||||||
S&P 500 Index Fund | 128,683 | (130,569 | ) | 11,415 | 1 | |||||||||||
Small Cap Fund | 154,171 | (147,991 | ) | 30,029 | 11 | |||||||||||
Small Cap Value Fund | 78,386 | (77,852 | ) | 15,189 | 1 | |||||||||||
Small Cap Growth Fund | 73,738 | (74,192 | ) | 10,240 | 1 | |||||||||||
Tax-Managed Small/Mid Cap Fund | 85,250 | (84,787 | ) | 37,845 | 2 | |||||||||||
Mid-Cap Fund | 53,397 | (57,317 | ) | 783 | — | |||||||||||
U.S. Managed Volatility Fund | 371,804 | (339,494 | ) | 56,094 | 2 | |||||||||||
Global Managed Volatility Fund | 204,233 | (189,326 | ) | 116,760 | 6 | |||||||||||
Tax-Managed Managed Volatility Fund | 231,784 | (223,249 | ) | 50,205 | 2 | |||||||||||
Real Estate Fund | 55,319 | (59,719 | ) | 4,335 | — | |||||||||||
Enhanced Income Fund | 12,162 | (13,538 | ) | 2,295 | — | |||||||||||
Core Fixed Income Fund | 588,229 | (570,962 | ) | 135,114 | 6 | |||||||||||
U.S. Fixed Income Fund | 273,057 | (255,570 | ) | 83,472 | 4 | |||||||||||
High Yield Fund | 452,769 | (408,672 | ) | 52,094 | 3 | |||||||||||
Real Return Fund | 15,209 | (14,323 | ) | 1,181 | — | |||||||||||
Multi-Strategy Alternative Fund | 100,379 | (142,757 | ) | 22,960 | 1 | |||||||||||
Multi-Asset Accumulation Fund | 47,011 | — | 715,178 | 35 | ||||||||||||
| SEI Institutional Managed Trust Long/Short Alternative Fund | Purchases at Cost | Proceeds from Sales | Value 3/15/15 | Change in Unrealized Appreciation | Dividend Income | |||||||||||||||
Multi-Strategy Alternative Fund | $ | 36,269 | $ | — | $ | 37,066 | $ | 797 | $ | — | ||||||||||
Affiliated Transactions — On December 19, 2013 and March 31, 2014, the S&P 500 Index Fund participated in a transaction with an affiliated fund. The Fund sold securities in the amount of $434,575 ($ Thousands) resulting in realized gains of $204,201 ($ Thousands). On October 31, 2014, December 30, 2014, February 27, 2015 and March 31, 2015, the S&P 500 Index Fund participated in a transaction with an affiliated fund. The Fund sold securities in the amount of $1,838,786 ($ Thousands) resulting in realized gains of $1,179,815 ($ Thousands).
Interfund Lending — The SEC has granted an exemption that permits the Trust to participate in an interfund lending program (“the Program”) with existing or future investment companies registered under the 1940 Act that are advised by SIMC (the “SEI Funds”). The Program allows the SEI Funds to lend money to and borrow money from each other for temporary or emergency purposes. Participation in the Program is voluntary for both borrowing and lending funds.
Interfund loans may be made only when the rate of interest to be charged is more favorable to the lending fund than an investment in
overnight repurchase agreements (“Repo Rate”), and more favorable to the borrowing fund than the rate of interest that would be charged by a bank for short-term borrowings (“Bank Loan Rate”). The Bank Loan Rate will be determined using a formula annually reviewed by the SEI Funds’ Board of Trustees. The interest rate imposed on interfund loans is the average of the Repo Rate and the Bank Loan Rate.
During the six month period ended March 31, 2015, the Trust borrowed funds from the SEI Liquid Asset Trust Prime Obligation Fund. The amount borrowed, interest paid on the borrowing and the corresponding interest rate were as follows ($ Thousands):
| Borrowing Date | Maturity Date | Amount Borrowed | Interest Paid | Interest Rate | ||||||||||||||||
Large Cap Growth Fund | 01/06/15 | 01/08/15 | $ | 7,100 | $ | — | 0.27 | % | ||||||||||||
Mid Cap Fund | 12/17/14 | 12/19/14 | 6,200 | — | 0.28 | |||||||||||||||
High Yield Bond Fund | 10/01/14 | 10/02/14 | 13,326 | — | 0.22 | |||||||||||||||
High Yield Bond Fund | 10/02/14 | 10/03/14 | 10,367 | — | 0.22 | |||||||||||||||
High Yield Bond Fund | 10/03/14 | 10/06/14 | 10,970 | — | 0.22 | |||||||||||||||
| SEI Institutional Managed Trust / Semi-Annual Report / March 31, 2015 | 257 |
Notes to Financial Statements/Consolidated Notes to Financial Statements (Unaudited) (Continued)
March 31, 2015
7. CAPITAL SHARE TRANSACTIONS
Capital Share Transactions for the Funds were as follows (Thousands):
For the six month period ended March 31, 2015 (Unaudited) and the year ended September 30, 2014
| Large Cap Fund | Large Cap Value Fund | Large Cap Growth Fund | Tax-Managed Large Cap Fund | S&P 500 Index Fund | ||||||||||||||||||||||||||||||||||||
10/01/14 to | 10/01/13 to | 10/01/14 to | 10/01/13 to | 10/01/14 to | 10/01/13 to | 10/01/14 to | 10/01/13 to | 10/01/14 to | 10/01/13 to | |||||||||||||||||||||||||||||||
Class A: | ||||||||||||||||||||||||||||||||||||||||
Shares Issued | 25,906 | 58,637 | 3,671 | 9,334 | 2,259 | 6,140 | 16,520 | 35,888 | 1,166 | 1,469 | ||||||||||||||||||||||||||||||
Shares Issued in Lieu of | 13,299 | 10,338 | 3,961 | 687 | 3,312 | 1,103 | 362 | 901 | 729 | 282 | ||||||||||||||||||||||||||||||
Shares Redeemed | (35,592 | ) | (50,023 | ) | (6,955 | ) | (16,445 | ) | (5,130 | ) | (8,725 | ) | (19,882 | ) | (22,769 | ) | (1,235 | ) | (1,946 | ) | ||||||||||||||||||||
Total Class A Transactions | 3,613 | 18,952 | 677 | (6,424 | ) | 441 | (1,482 | ) | (3,000 | ) | 14,020 | 660 | (195 | ) | ||||||||||||||||||||||||||
Class E: | ||||||||||||||||||||||||||||||||||||||||
Shares Issued | — | — | — | — | — | — | — | — | 677 | 7,068 | ||||||||||||||||||||||||||||||
Shares Issued in Lieu of | — | — | — | — | — | — | — | — | 2,286 | 1,941 | ||||||||||||||||||||||||||||||
Shares Redeemed | — | — | — | — | — | — | — | — | (36,443 | ) | (21,099 | )(1) | ||||||||||||||||||||||||||||
Total Class E Transactions | — | — | — | — | — | — | — | — | (33,480 | ) | (12,090 | ) | ||||||||||||||||||||||||||||
Class I: | ||||||||||||||||||||||||||||||||||||||||
Shares Issued | — | — | 19 | 96 | 13 | 64 | — | — | 28 | 47 | ||||||||||||||||||||||||||||||
Shares Issued in Lieu of | — | — | 22 | 4 | 13 | 5 | — | — | 8 | 4 | ||||||||||||||||||||||||||||||
Shares Redeemed | — | — | (78 | ) | (159 | ) | (64 | ) | (130 | ) | — | — | (30 | ) | (65 | ) | ||||||||||||||||||||||||
Total Class I Transactions | — | — | (37 | ) | (59 | ) | (38 | ) | (61 | ) | — | — | 6 | (14 | ) | |||||||||||||||||||||||||
Class T(4): | ||||||||||||||||||||||||||||||||||||||||
Shares Issued | — | — | — | — | — | — | — | — | — | — | ||||||||||||||||||||||||||||||
Shares Issued in Lieu of | — | — | — | — | — | — | — | — | — | — | ||||||||||||||||||||||||||||||
Shares Redeemed | — | — | — | — | — | — | — | (3 | ) | — | — | |||||||||||||||||||||||||||||
Total Class T Transactions | — | — | — | — | — | — | — | (3 | ) | — | — | |||||||||||||||||||||||||||||
Class Y(2): | ||||||||||||||||||||||||||||||||||||||||
Shares Issued | 16,028 | — | — | — | — | — | 7,058 | — | — | — | ||||||||||||||||||||||||||||||
Shares Issued in Lieu of | — | — | — | — | — | — | — | — | — | — | ||||||||||||||||||||||||||||||
Shares Redeemed | (637 | ) | — | — | — | — | — | (180 | ) | — | — | — | ||||||||||||||||||||||||||||
Total Class Y(2) Transactions | 15,391 | — | — | — | — | — | 6,878 | — | — | — | ||||||||||||||||||||||||||||||
Increase (Decrease) in Share Transactions | 19,004 | 18,952 | 640 | (6,483 | ) | 403 | (1,543 | ) | 3,878 | 14,017 | (32,814 | ) | (12,299 | ) | ||||||||||||||||||||||||||
Small Cap | Small Cap | Small Cap | Tax-Managed | Mid-Cap | ||||||||||||||||||||||||||||||||||||
10/01/14 to | 10/01/13 to | 10/01/14 to | 10/01/13 to | 10/01/14 to | 10/01/13 to | 10/01/14 to | 10/01/13 to | 10/01/14 to | 10/01/13 to | |||||||||||||||||||||||||||||||
Class A: | ||||||||||||||||||||||||||||||||||||||||
Shares Issued | 6,562 | 13,478 | 831 | 1,922 | 551 | 1,576 | 3,831 | 8,270 | 959 | 1,235 | ||||||||||||||||||||||||||||||
Shares Issued in Lieu of | 2,772 | 1,859 | 1,257 | 205 | — | — | 313 | 1,322 | 286 | 105 | ||||||||||||||||||||||||||||||
Shares Redeemed | (6,851 | ) | (9,025 | ) | (1,647 | ) | (3,317 | ) | (1,223 | ) | (2,973 | ) | (3,940 | ) | (5,512 | ) | (1,475 | ) | (2,298 | ) | ||||||||||||||||||||
Total Class A Transactions | 2,483 | 6,312 | 441 | (1,190 | ) | (672 | ) | (1,397 | ) | 204 | 4,080 | (230 | ) | (958 | ) | |||||||||||||||||||||||||
Class I: | ||||||||||||||||||||||||||||||||||||||||
Shares Issued | — | — | 12 | 48 | 7 | 72 | — | — | 3 | 18 | ||||||||||||||||||||||||||||||
Shares Issued in Lieu of | — | — | 14 | 2 | — | — | — | — | 3 | 2 | ||||||||||||||||||||||||||||||
Shares Redeemed | — | — | (39 | ) | (105 | ) | (28 | ) | (95 | ) | — | — | (15 | ) | (41 | ) | ||||||||||||||||||||||||
Total Class I Transactions | — | — | (13 | ) | (55 | ) | (21 | ) | (23 | ) | — | — | (9 | ) | (21 | ) | ||||||||||||||||||||||||
Class Y(2): | ||||||||||||||||||||||||||||||||||||||||
Shares Issued | 2,977 | — | — | — | — | — | 1,715 | — | — | — | ||||||||||||||||||||||||||||||
Shares Issued in Lieu of | — | — | — | — | — | — | — | — | — | — | ||||||||||||||||||||||||||||||
Shares Redeemed | (162 | ) | — | — | — | — | — | (71 | ) | — | — | — | ||||||||||||||||||||||||||||
Total Class Y(2) Transactions | 2,815 | — | — | — | — | — | 1,644 | — | — | — | ||||||||||||||||||||||||||||||
Increase (Decrease) in Share Transactions | 5,298 | 6,312 | 428 | (1,245 | ) | (693 | ) | (1,420 | ) | 1,848 | 4,080 | (239 | ) | (979 | ) | |||||||||||||||||||||||||
| 258 | SEI Institutional Managed Trust / Semi-Annual Report / March 31, 2015 |
| U.S. Managed Volatility Fund | Global Managed Volatility Fund | Tax-Managed Managed Volatility Fund | Real Estate Fund | Enhanced Income Fund | ||||||||||||||||||||||||||||||||||||
10/01/14 to | 10/01/13 to | 10/01/14 to | 10/01/13 to | 10/01/14 to | 10/01/13 to | 10/01/14 to | 10/01/13 to | 10/01/14 to | 10/01/13 to | |||||||||||||||||||||||||||||||
Class A: | ||||||||||||||||||||||||||||||||||||||||
Shares Issued | 10,285 | 18,835 | 23,265 | 55,338 | 9,630 | 15,996 | 1,501 | 3,725 | 3,730 | 13,321 | ||||||||||||||||||||||||||||||
Shares Issued in Lieu of | 6,101 | 4,189 | 17,258 | 11,679 | 3,355 | 2,236 | 388 | 229 | 224 | 435 | ||||||||||||||||||||||||||||||
Shares Redeemed | (14,390 | ) | (18,676 | ) | (25,202 | ) | (36,551 | ) | (6,057 | ) | (12,989 | ) | (2,991 | ) | (4,133 | ) | (8,711 | ) | (8,982 | ) | ||||||||||||||||||||
Total Class A Transactions | 1,996 | 4,348 | 15,321 | 30,466 | 6,928 | 5,243 | (1,102 | ) | (179 | ) | (4,757 | ) | 4,774 | |||||||||||||||||||||||||||
Class I: | ||||||||||||||||||||||||||||||||||||||||
Shares Issued | 30 | 17 | 17 | 33 | — | — | 1 | 13 | 8 | 14 | ||||||||||||||||||||||||||||||
Shares Issued in Lieu of Cash Distributions | 11 | 7 | 11 | 9 | — | — | 1 | 1 | — | 1 | ||||||||||||||||||||||||||||||
Shares Redeemed | (6 | ) | (28 | ) | (12 | ) | (38 | ) | — | — | — | (14 | ) | (10 | ) | (14 | ) | |||||||||||||||||||||||
Total Class I Transactions | 35 | (4 | ) | 16 | 4 | — | — | 2 | — | (2 | ) | 1 | ||||||||||||||||||||||||||||
Class Y(2): | ||||||||||||||||||||||||||||||||||||||||
Shares Issued | 23,476 | — | 9,101 | — | — | — | 1,099 | — | 4,519 | — | ||||||||||||||||||||||||||||||
Shares Issued in Lieu of | — | — | — | — | — | — | — | — | — | — | ||||||||||||||||||||||||||||||
Shares Redeemed | (516 | ) | — | (272 | ) | — | — | — | (86 | ) | — | (104 | ) | — | ||||||||||||||||||||||||||
Total Class Y(2) Transactions | 22,960 | — | 8,829 | — | — | — | 1,013 | — | 4,415 | — | ||||||||||||||||||||||||||||||
Increase (Decrease) in Share Transactions | 24,991 | 4,344 | 24,166 | 30,470 | 6,928 | 5,243 | (87 | ) | (179 | ) | (344 | ) | 4,775 | |||||||||||||||||||||||||||
| Core Fixed Income Fund | U.S. Fixed Income Fund | High Yield Bond Fund | Real Return Fund | Multi-Strategy Alternative Fund | ||||||||||||||||||||||||||||||||||||
10/01/14 to | 10/01/13 to | 10/01/14 to | 10/01/13 to | 10/01/14 to | 10/01/13 to | 10/01/14 to | 10/01/13 to | 10/01/14 to | 10/01/13 to | |||||||||||||||||||||||||||||||
Class A: | ||||||||||||||||||||||||||||||||||||||||
Shares Issued | 16,056 | 42,012 | 15,109 | 34,182 | 49,738 | 90,268 | 4,293 | 9,092 | 8,417 | 15,994 | ||||||||||||||||||||||||||||||
Shares Issued in Lieu of Cash Distributions | 1,788 | 4,123 | 1,015 | 1,840 | 6,432 | 13,360 | 30 | 197 | 711 | 309 | ||||||||||||||||||||||||||||||
Shares Redeemed | (16,205 | ) | (38,228 | ) | (20,913 | ) | (30,480 | ) | (57,712 | ) | (141,167 | ) | (6,620 | ) | (11,345 | ) | (5,486 | ) | (10,327 | ) | ||||||||||||||||||||
Total Class A Transactions | 1,639 | 7,907 | (4,789 | ) | 5,542 | (1,542 | ) | (37,539 | ) | (2,297 | ) | (2,056 | ) | 3,642 | 5,976 | |||||||||||||||||||||||||
Class I: | ||||||||||||||||||||||||||||||||||||||||
Shares Issued | 101 | 183 | — | — | 1,716 | 1,784 | — | — | — | — | ||||||||||||||||||||||||||||||
Shares Issued in Lieu of Cash Distributions | 6 | 19 | — | — | 17 | 246 | — | — | — | — | ||||||||||||||||||||||||||||||
Shares Redeemed | (182 | ) | (549 | ) | — | — | (1,263 | ) | (6,711 | ) | — | — | — | — | ||||||||||||||||||||||||||
Total Class I Transactions | (75 | ) | (347 | ) | — | — | 470 | (4,681 | ) | — | — | — | — | |||||||||||||||||||||||||||
Class Y(2): | ||||||||||||||||||||||||||||||||||||||||
Shares Issued | — | — | 9,335 | — | 20,643 | — | 2,733 | — | — | — | ||||||||||||||||||||||||||||||
Shares Issued in Lieu of | — | — | 47 | — | 277 | — | — | — | — | — | ||||||||||||||||||||||||||||||
Shares Redeemed | — | — | (212 | ) | — | (777 | ) | — | (65 | ) | — | — | — | |||||||||||||||||||||||||||
Total Class Y(2) Transactions | — | — | 9,170 | — | 20,143 | — | 2,668 | — | — | — | ||||||||||||||||||||||||||||||
Increase (Decrease) in Share Transactions | 1,564 | 7,560 | 4,381 | 5,542 | 19,071 | (42,220 | ) | 371 | (2,056 | ) | 3,642 | 5,976 | ||||||||||||||||||||||||||||
| SEI Institutional Managed Trust / Semi-Annual Report / March 31, 2015 | 259 |
Notes to Financial Statements/Consolidated Notes to Financial Statements (Unaudited) (Continued)
March 31, 2015
| Multi-Asset Accumulation Fund | Multi-Asset Income Fund | Multi-Asset Fund | Multi-Asset Fund | Long/Short Alternative Fund(3) | ||||||||||||||||||||||||||||||||
10/01/14 to | 10/01/13 to | 10/01/14 to | 10/01/13 to | 10/01/14 to | 10/01/13 to | 10/01/14 to | 10/01/13 to | 12/19/14 to 03/31/15 | ||||||||||||||||||||||||||||
Class A: | ||||||||||||||||||||||||||||||||||||
Shares Issued | 33,260 | 61,372 | 10,172 | 37,401 | 18,786 | 36,793 | 9,168 | 19,632 | 3,623 | |||||||||||||||||||||||||||
Shares Issued in Lieu of | 15,763 | 4,168 | 1,066 | 1,620 | — | — | 865 | 97 | — | |||||||||||||||||||||||||||
Shares Redeemed | (38,235 | ) | (31,636 | ) | (9,302 | ) | (9,850 | ) | (19,082 | ) | (19,793 | ) | (11,583 | ) | (15,893 | ) | — | |||||||||||||||||||
Total Class A Transactions | 10,788 | 33,904 | 1,936 | 29,171 | (296 | ) | 17,000 | (1,550 | ) | 3,836 | 3,623 | |||||||||||||||||||||||||
Class Y(2): | ||||||||||||||||||||||||||||||||||||
Shares Issued | 21,723 | — | 3,413 | — | 10,210 | — | 5,529 | — | — | |||||||||||||||||||||||||||
Shares Issued in Lieu of | — | — | 37 | — | — | — | — | — | — | |||||||||||||||||||||||||||
Shares Redeemed | (737 | ) | — | (102 | ) | — | (150 | ) | — | (176 | ) | — | — | |||||||||||||||||||||||
Total Class Y(2) Transactions | 20,986 | — | 3,348 | — | 10,060 | — | 5,353 | — | — | |||||||||||||||||||||||||||
Increase in Share Transactions | 31,774 | 33,904 | 5,284 | 29,171 | 9,764 | 17,000 | 3,803 | 3,836 | 3,623 | |||||||||||||||||||||||||||
| (1) | Includes redemptions as a result of affiliated transactions (see Note 6). |
| (2) | Class Y commenced operations on December 31, 2014. |
| (3) | Commenced operations on December 19, 2014 |
| (4) | Class T closed on December 30, 2014. |
Amounts designated as “—” are zero or have been rounded to zero.
8. INVESTMENT TRANSACTIONS
The cost of security purchases and proceeds from the sale of securities, other than temporary cash investments and futures, during the six month period ended March 31, 2015, were as follows:
| U.S. Gov’t ($ Thousands) | Other ($ Thousands) | Total ($ Thousands) | ||||||||||
Large Cap Fund | ||||||||||||
Purchases | $ | — | $ | 964,866 | $ | 964,866 | ||||||
Sales | — | 881,837 | 881,837 | |||||||||
Large Cap Value Fund | ||||||||||||
Purchases | — | 347,084 | 347,084 | |||||||||
Sales | — | 431,208 | 431,208 | |||||||||
Large Cap Growth Fund | ||||||||||||
Purchases | — | 425,052 | 425,052 | |||||||||
Sales | — | 543,404 | 543,404 | |||||||||
Tax-Managed Large Cap Fund | ||||||||||||
Purchases | — | 873,421 | 873,421 | |||||||||
Sales | — | 826,607 | 826,607 | |||||||||
S&P 500 Index Fund | ||||||||||||
Purchases | — | 96,751 | 96,751 | |||||||||
Sales | — | 1,963,201 | 1,963,201 | |||||||||
Small Cap Fund | ||||||||||||
Purchases | — | 392,745 | 392,745 | |||||||||
Sales | — | 367,070 | 367,070 | |||||||||
Small Cap Value Fund | ||||||||||||
Purchases | — | 167,357 | 167,357 | |||||||||
Sales | — | 188,193 | 188,193 | |||||||||
Small Cap Growth Fund | ||||||||||||
Purchases | — | 249,349 | 249,349 | |||||||||
Sales | — | 266,224 | 266,224 | |||||||||
Tax-Managed Small/Mid Cap Fund | ||||||||||||
Purchases | — | 221,326 | 221,326 | |||||||||
Sales | — | 191,853 | 191,853 | |||||||||
Mid-Cap Fund | ||||||||||||
Purchases | — | 90,150 | 90,150 | |||||||||
Sales | — | 109,111 | 109,111 | |||||||||
U.S. Managed Volatility Fund | ||||||||||||
Purchases | — | 548,053 | 548,053 | |||||||||
Sales | — | 270,184 | 270,184 | |||||||||
Global Managed Volatility Fund | ||||||||||||
Purchases | — | 646,146 | 646,146 | |||||||||
Sales | — | 482,645 | 482,645 | |||||||||
Tax-Managed Managed Volatility | ||||||||||||
Purchases | — | 174,474 | 174,474 | |||||||||
Sales | — | 131,250 | 131,250 | |||||||||
| U.S. Gov’t ($ Thousands) | Other ($ Thousands) | Total ($ Thousands) | ||||||||||
Real Estate Fund | ||||||||||||
Purchases | $ | — | $ | 64,693 | $ | 64,693 | ||||||
Sales | — | 67,252 | 67,252 | |||||||||
Enhanced Income Fund | ||||||||||||
Purchases | 31,558 | 21,629 | 53,187 | |||||||||
Sales | 33,640 | 22,681 | 56,321 | |||||||||
Core Fixed Income Fund | ||||||||||||
Purchases | 3,125,339 | 322,075 | 3,447,414 | |||||||||
Sales | 3,186,112 | 326,671 | 3,512,783 | |||||||||
U.S Fixed Income Fund | ||||||||||||
Purchases | 1,535,672 | 178,598 | 1,714,270 | |||||||||
Sales | 1,561,204 | 158,166 | 1,719,370 | |||||||||
High Yield Bond Fund | ||||||||||||
Purchases | — | 501,585 | 501,585 | |||||||||
Sales | — | 338,851 | 338,851 | |||||||||
Real Return Fund | ||||||||||||
Purchases | 37,659 | — | 37,659 | |||||||||
Sales | 34,533 | — | 34,533 | |||||||||
Multi-Strategy Alternative Fund | ||||||||||||
Purchases | — | 193,681 | 193,681 | |||||||||
Sales | — | 151,902 | 151,902 | |||||||||
Multi-Asset Accumulation Fund | ||||||||||||
Purchases | 198,001 | 208,934 | 406,935 | |||||||||
Sales | 160,972 | 87,423 | 248,395 | |||||||||
Multi-Asset Income Fund | ||||||||||||
Purchases | 5,836 | 139,784 | 145,620 | |||||||||
Sales | 145 | 47,416 | 47,561 | |||||||||
Multi-Asset Inflation Managed Fund | ||||||||||||
Purchases | 108,779 | 421,987 | 530,766 | |||||||||
Sales | 72,639 | 406,274 | 478,913 | |||||||||
Multi-Asset Capital Stability Fund | ||||||||||||
Purchases | 130,623 | 67,712 | 198,335 | |||||||||
Sales | 87,010 | 52,011 | 139,021 | |||||||||
Long/Short Alternative Fund(1) | ||||||||||||
Purchases | — | 2,862 | 2,862 | |||||||||
Sales | — | 2,861 | 2,861 | |||||||||
| (1) | Commenced operations on December 19, 2014. |
9. FEDERAL TAX INFORMATION
It is each Fund’s intention to continue to qualify as a regulated investment company under Subchapter M of The Internal Revenue Code and distribute all of its taxable income (including net capital gains). Accordingly, no provision for Federal income taxes is required.
| 260 | SEI Institutional Managed Trust / Semi-Annual Report / March 31, 2015 |
The Multi-Asset Accumulation and Multi-Asset Inflation Managed Funds have each requested private letter rulings from the Internal Revenue Service (“IRS”) concluding that the income generated from their investment in their respective Subsidiaries, each of which invests in commodity-linked derivatives, will be “qualifying income” for regulated investment company (“RIC”) qualification purposes, regardless of whether actual distributions are made to the Funds by the respective Subsidiary.
In July 2011, the IRS suspended the issuance of private letter rulings regarding the investment by RICs into controlled foreign corporations which principally invest in commodities, such as the Subsidiaries, indicating that it was reconsidering its policies surrounding the issuance of these rulings. The IRS subsequently stated that it intends to issue public guidance regarding the use of controlled foreign corporations by RICs to indirectly invest in commodities. It is unclear whether this guidance will continue to permit or somehow restrict the distributions from controlled foreign corporations to be treated as “qualifying income” for purposes of the RIC qualification rules. As a result, there can be no assurance that the IRS will grant the private letter ruling requested by the Funds. The IRS, however, has informally indicated that any guidance regarding the treatment of distributions from controlled foreign corporations will be prospective in application and provide for transition periods for affected RICs. While the private letter ruling request is pending with the IRS, the Multi-Asset Accumu-
lation and Multi-Asset Inflation Managed Funds have secured an opinion of counsel based on customary representations that actual distributions made to the Funds should be treated as “qualifying income.” If the IRS does issue public guidance that results in an adverse determination relating to the treatment of income and gain to the Funds from controlled foreign corporations such as the Subsidiaries, the Funds would likely need to significantly change their investment strategies, which could adversely affect such Funds.
The Real Estate Fund has a tax year that ends on December 31. The following tax disclosures are representative as of September 30, 2014, except for the permanent reclassification and tax character of distributions, which are as of December 31, 2013. Accordingly, the disclosures are for informational use by shareholders and are subject to change attributable to activity through the end of the tax year-ending December 31, 2014.
Dividends from net investment income and distributions from net realized capital gains are determined in accordance with U.S. Federal income tax regulations, which may differ from those amounts determined under U.S. GAAP. These book/tax differences are either temporary or permanent in nature. To the extent these differences are permanent, they are charged or credited to paid-in capital, undistributed net investment income or accumulated net realized gain, as appropriate, in the period that the differences arise.
The tax character of dividends and distributions paid during the fiscal years ended September 30, 2014 and September 30, 2013 (unless otherwise indicated) was as follows:
| Ordinary Income ($ Thousands) | Long-Term Capital Gain ($ Thousands) | Return of Capital ($ Thousands) | Total ($ Thousands) | |||||||||||||||||
Large Cap Fund | 2014 | $ | 48,424 | $ | 112,776 | $ | — | $ | 161,200 | |||||||||||
| 2013 | 34,159 | 60,066 | — | 94,225 | ||||||||||||||||
Large Cap Value Fund | 2014 | 17,900 | — | — | 17,900 | |||||||||||||||
| 2013 | 20,018 | — | — | 20,018 | ||||||||||||||||
Large Cap Growth Fund | 2014 | 12,795 | 24,647 | — | 37,442 | |||||||||||||||
| 2013 | 5,306 | — | — | 5,306 | ||||||||||||||||
Tax-Managed Large Cap Fund | 2014 | 18,676 | — | — | 18,676 | |||||||||||||||
| 2013 | 22,249 | — | — | 22,249 | ||||||||||||||||
S&P 500 Index Fund | 2014 | 50,107 | 62,316 | — | 112,423 | |||||||||||||||
| 2013 | 56,490 | — | — | 56,490 | ||||||||||||||||
Small Cap Fund | 2014 | 8,310 | 19,642 | — | 27,952 | |||||||||||||||
| 2013 | 1,273 | 12,487 | — | 13,760 | ||||||||||||||||
Small Cap Value Fund | 2014 | 2,246 | 3,291 | — | 5,537 | |||||||||||||||
| 2013 | 3,790 | — | — | 3,790 | ||||||||||||||||
Small Cap Growth Fund | 2014 | 10 | — | — | 10 | |||||||||||||||
| 2013 | 1,207 | — | — | 1,207 | ||||||||||||||||
Tax-Managed Small/Mid Cap Fund | 2014 | 2,853 | 22,632 | — | 25,485 | |||||||||||||||
| 2013 | 1,558 | — | — | 1,558 | ||||||||||||||||
Mid-Cap Fund | 2014 | 556 | 2,459 | — | 3,015 | |||||||||||||||
| 2013 | 626 | — | — | 626 | ||||||||||||||||
U.S. Managed Volatility Fund | 2014 | 25,724 | 52,498 | — | 78,222 | |||||||||||||||
| 2013 | 13,192 | 5,513 | — | 18,705 | ||||||||||||||||
Global Managed Volatility Fund | 2014 | 79,214 | 55,211 | — | 134,425 | |||||||||||||||
| 2013 | 26,164 | — | — | 26,164 | ||||||||||||||||
Tax- Managed Managed Volatility Fund | 2014 | 13,556 | 21,058 | — | 34,614 | |||||||||||||||
| 2013 | 11,340 | 11,647 | — | 22,987 | ||||||||||||||||
Real Estate Fund | 2014 | 3,907 | — | — | 3,907 | |||||||||||||||
| 2013 | 2,455 | — | — | 2,455 | ||||||||||||||||
Enhanced Income Fund | 2014 | 3,808 | — | — | 3,808 | |||||||||||||||
| 2013 | 3,334 | — | — | 3,334 | ||||||||||||||||
| SEI Institutional Managed Trust / Semi-Annual Report / March 31, 2015 | 261 |
Notes to Financial Statements/Consolidated Notes to Financial Statements (Unaudited) (Continued)
March 31, 2015
| Ordinary Income ($ Thousands) | Long-Term Capital Gain ($ Thousands) | Return of Capital ($ Thousands) | Total ($ Thousands) | |||||||||||||||||
Core Fixed Income Fund | 2014 | $ | 52,653 | $ | — | $ | — | $ | 52,653 | |||||||||||
| 2013 | 58,329 | — | — | 58,329 | ||||||||||||||||
U.S. Fixed Income Fund | 2014 | 21,901 | — | — | 21,901 | |||||||||||||||
| 2013 | 43,328 | 3,324 | — | 46,652 | ||||||||||||||||
High Yield Bond Fund | 2014 | 124,482 | — | — | 124,482 | |||||||||||||||
| 2013 | 112,692 | — | — | 112,692 | ||||||||||||||||
Real Return Fund | 2014 | 1,274 | 1,056 | — | 2,330 | |||||||||||||||
| 2013 | 8,291 | — | — | 8,291 | ||||||||||||||||
Multi-Strategy Alternative Fund | 2014 | 3,459 | — | — | 3,459 | |||||||||||||||
| 2013 | 1,930 | — | — | 1,930 | ||||||||||||||||
Multi-Asset Accumulation Fund | 2014 | 15,631 | 31,034 | — | 46,665 | |||||||||||||||
| 2013 | 24,477 | 7,602 | — | 32,079 | ||||||||||||||||
Multi-Asset Income Fund | 2014 | 20,220 | 1,033 | — | 21,253 | |||||||||||||||
| 2013 | 8,719 | — | — | 8,719 | ||||||||||||||||
Multi-Asset Inflation Managed Fund | 2014 | — | — | — | — | |||||||||||||||
| 2013 | 2,918 | 93 | — | 3,011 | ||||||||||||||||
Multi-Asset Capital Stability Fund | 2014 | 69 | 1,110 | — | 1,179 | |||||||||||||||
| 2013 | 1,266 | 1,703 | — | 2,969 | ||||||||||||||||
As of September 30, 2014, the components of Distributable Earnings/(Accumulated Losses) were as follows:
| Undistributed Ordinary Income ($ Thousands) | Undistributed Long-Term Capital Gain ($ Thousands) | Capital Loss Carryforwards ($ Thousands) | Post October Losses ($ Thousands) | Late-Year Loss Deferral ($ Thousands) | Unrealized Appreciation (Depreciation) ($ Thousands) | Other Temporary Differences ($ Thousands) | Total Distributable Earnings (Accumulated Losses) ($ Thousands) | |||||||||||||||||||||||||
Large Cap Fund | $ | 33,546 | $ | 152,458 | $ | — | $ | — | $ | — | $ | 582,149 | $ | 1,291 | $ | 769,444 | ||||||||||||||||
Large Cap Value Fund | 3,818 | 88,201 | — | — | — | 274,268 | 500 | 366,787 | ||||||||||||||||||||||||
Large Cap Growth Fund | 31,505 | 78,371 | — | — | — | 328,725 | 214 | 438,815 | ||||||||||||||||||||||||
Tax-Managed Large Cap Fund | 3,507 | — | (192,917 | ) | (33,478 | ) | — | 1,128,227 | 1,356 | 906,695 | ||||||||||||||||||||||
S&P 500 Index Fund | 13,928 | 114,753 | — | — | — | 1,458,905 | 141 | 1,587,727 | ||||||||||||||||||||||||
Small Cap Fund | 7,390 | 31,965 | — | — | — | 58,225 | 456 | 98,036 | ||||||||||||||||||||||||
Small Cap Value Fund | 7,648 | 21,527 | — | — | — | 30,301 | 367 | 59,843 | ||||||||||||||||||||||||
Small Cap Growth Fund | — | — | (79,469 | ) | — | (1,589 | ) | 28,059 | 114 | (52,885 | ) | |||||||||||||||||||||
Tax-Managed Small/Mid Cap Fund | — | 5,867 | — | — | — | 138,680 | 974 | 145,521 | ||||||||||||||||||||||||
Mid-Cap Fund | 3,840 | 3,860 | — | — | — | 12,704 | — | 20,404 | ||||||||||||||||||||||||
U.S. Managed Volatility Fund | 30,032 | 69,607 | — | — | — | 178,940 | 87 | 278,666 | ||||||||||||||||||||||||
Global Managed Volatility Fund | 101,709 | 75,794 | — | — | — | 113,595 | (6,975 | ) | 284,123 | |||||||||||||||||||||||
Tax-Managed Managed Volatility Fund | 5,831 | 43,574 | — | — | — | 171,579 | 251 | 221,235 | ||||||||||||||||||||||||
Real Estate Fund | 1,673 | 5,798 | — | — | — | 24,309 | (4 | ) | 31,776 | |||||||||||||||||||||||
Enhanced Income Fund | 1,108 | — | (123,600 | ) | (1,746 | ) | — | (1,805 | ) | (31 | ) | (126,074 | ) | |||||||||||||||||||
Core Fixed Income Fund | 1,942 | — | (11,883 | ) | — | — | 39,235 | (11,123 | ) | 18,171 | ||||||||||||||||||||||
U.S. Fixed Income Fund | 2,027 | — | — | (634 | ) | — | 27,099 | (8,691 | ) | 19,801 | ||||||||||||||||||||||
High Yield Bond Fund | 18,034 | — | (35,901 | ) | — | — | (21,495 | ) | (10,026 | ) | (49,388 | ) | ||||||||||||||||||||
Real Return Fund | 343 | — | (953 | ) | (1,021 | ) | — | (4,413 | ) | (216 | ) | (6,260 | ) | |||||||||||||||||||
Multi-Strategy Alternative Fund | 1,115 | — | (4,016 | ) | — | — | 10,561 | — | 7,660 | |||||||||||||||||||||||
Multi-Asset Accumulation Fund | 105,936 | 48,227 | — | — | — | (53,689 | ) | 8,773 | 109,247 | |||||||||||||||||||||||
Multi-Asset Income Fund | 5,511 | 1,430 | — | — | — | (3,829 | ) | (2,596 | ) | 516 | ||||||||||||||||||||||
Multi-Asset Inflation Managed Fund | — | — | (25,639 | ) | — | — | (2,993 | ) | (1,294 | ) | (29,926 | ) | ||||||||||||||||||||
Multi-Asset Capital Stability Fund | 4,774 | 4,282 | — | — | — | 2,550 | (625 | ) | 10,981 | |||||||||||||||||||||||
Post October losses represent losses realized on investment transactions from November 1, 2013 through September 30, 2014 that, in accordance with Federal income tax regulations, the Funds may defer and treat as having arisen in the following fiscal year. Deferred Late-Year Losses represent ordinary losses realized on investment transactions from January 1, 2014 through September 30, 2014 and specified losses realized on investment transactions from November 1, 2013 through September 30, 2014, that, in accordance with Federal income tax regulations, the Fund defers and treats as having arisen in the following fiscal year.
| 262 | SEI Institutional Managed Trust / Semi-Annual Report / March 31, 2015 |
For Federal income tax purposes, capital loss carryforwards may be carried forward and applied against future capital gains as follows:
| Expires 2019 ($ Thousands) | Expires 2018 ($ Thousands) | Expires 2017 ($ Thousands) | Expires 2016 ($ Thousands) | Expires 2015 ($ Thousands) | Total Capital Loss Carryforwards ($ Thousands) | |||||||||||||||||||
Tax-Managed Large Cap Fund | $ | — | $ | 192,917 | $ | — | $ | — | $ | — | $ | 192,917 | ||||||||||||
Small Cap Growth Fund | — | 79,469 | — | — | — | 79,469 | ||||||||||||||||||
Real Estate Fund* | — | — | 7,723 | — | — | 7,723 | ||||||||||||||||||
Enhanced Income Fund | 26,775 | 61,656 | 31,834 | 3,335 | — | 123,600 | ||||||||||||||||||
High Yield Bond Fund | — | 3,086 | 32,815 | — | — | 35,901 | ||||||||||||||||||
Multi-Strategy Alternative Fund | 1,945 | — | — | — | — | 1,945 | ||||||||||||||||||
| * | Balance as of December 31, 2013, the Fund’s tax year end. |
Under the Regulated Investment Company Modernization Act of 2010, Funds will be permitted to carry forward capital losses incurred in taxable years beginning after December 22, 2010 for an unlimited period. However, any losses incurred during those future taxable years are required to be utilized prior to the losses incurred in pre-enactment taxable years. As a result of this ordering rule, pre-enactment capital loss carryforwards are more likely to expire unused. Additionally, post-enactment capital losses that are carried forward will retain their character as either short-term or long-term capital losses rather than being considered all short-term as under previous law. Losses carried forward under these new provisions are as follows:
| Short-Term Loss | Long-Term Loss | Total* | ||||||||||
Core Fixed Income Fund | $ | — | $ | 11,883 | $ | 11,883 | ||||||
Real Return Fund | 951 | 2 | 953 | |||||||||
Multi-Strategy Alternative Fund | 1,639 | 432 | 2,071 | |||||||||
Multi-Asset Inflation Managed Fund | 8,244 | 17,395 | 25,639 | |||||||||
| * | This table should be used in conjuction with the capital loss carryforwards table. |
During the fiscal year ended September 30, 2014, the following Funds utilized capital loss carryforward to offset capital gains and/or had expired capital loss carryforwards:
| Utilized Capital Loss Carryforwards ($ Thousands) | Expired Capital Loss Carryforwards ($ Thousands) | |||||||
Large Cap Value Fund | $107,382 | $ | — | |||||
Tax-Managed Large Cap Fund | 81,129 | — | ||||||
Small Cap Value Fund | 2,868 | — | ||||||
Small Cap Growth Fund | 51,633 | — | ||||||
Mid-Cap Fund | 952 | — | ||||||
Enhanced Income Fund | 175 | — | ||||||
Core Fixed Income Fund | 15,667 | — | ||||||
High Yield Fund | 54,205 | — | ||||||
For Federal income tax purposes, the cost of securities owned at March 31, 2015, and the net realized gains or losses on securities sold for the period, were different from amounts reported for financial reporting purposes primarily due to investments in partnerships that captures losses from other securities, and wash sales which cannot be used for Federal income tax purposes in the current year and have been deferred for use in future years. The Federal tax cost and aggregate gross unrealized appreciation and depreciation on investments held by the Funds at March 31, 2015, were as follows:
| Federal Tax Cost ($ Thousands) | Appreciated Securities ($ Thousands) | Depreciated Securities ($ Thousands) | Net Unrealized Appreciation (Depreciation) ($ Thousands) | |||||||||||||
Large Cap Fund | $ | 2,217,811 | $ | 653,249 | $ | (31,328 | ) | $ | 621,921 | |||||||
Large Cap Value Fund | 1,292,629 | 325,050 | (37,781 | ) | 287,269 | |||||||||||
Large Cap Growth Fund | 1,238,823 | 416,359 | (16,332 | ) | 400,027 | |||||||||||
Tax-Managed Large Cap Fund | 2,078,642 | 1,318,404 | (942 | ) | 1,317,462 | |||||||||||
S&P 500 Index Fund | 381,918 | 329,382 | (4,422 | ) | 324,960 | |||||||||||
Small Cap Fund | 517,671 | 103,592 | (8,790 | ) | 94,802 | |||||||||||
Small Cap Value Fund | 358,671 | 75,882 | (16,256 | ) | 59,626 | |||||||||||
Small Cap Growth Fund | 369,108 | 58,532 | (14,562 | ) | 43,970 | |||||||||||
Tax-Managed Small/Mid Cap Fund | 510,669 | 208,093 | (2,880 | ) | 205,213 | |||||||||||
Mid-Cap Fund | 75,375 | 11,345 | (1,248 | ) | 10,097 | |||||||||||
U.S. Managed Volatility Fund | 1,183,477 | 232,772 | (10,410 | ) | 222,362 | |||||||||||
Global Managed Volatility Fund | 1,869,927 | 213,311 | (65,906 | ) | 147,405 | |||||||||||
Tax-Managed Managed Volatility Fund | 663,096 | 221,660 | (4,111 | ) | 217,549 | |||||||||||
Real Estate Fund | 203,562 | 62,065 | (269 | ) | 61,796 | |||||||||||
Enhanced Income Fund | 236,750 | 958 | (2,838 | ) | (1,880 | ) | ||||||||||
Core Fixed Income Fund | 2,241,796 | 91,043 | (27,473 | ) | 63,570 | |||||||||||
U.S. Fixed Income Fund | 1,210,180 | 49,227 | (2,507 | ) | 46,720 | |||||||||||
High Yield Bond Fund | 1,855,078 | 45,885 | (71,362 | ) | (25,477 | ) | ||||||||||
Real Return Fund | 284,476 | 718 | (930 | ) | (212 | ) | ||||||||||
Multi-Strategy Alternative Fund | 532,536 | 7,783 | (9,093 | ) | (1,310 | ) | ||||||||||
Multi-Asset Accumulation Fund | 2,037,257 | 35,123 | (16,352 | ) | 1,742 | |||||||||||
Multi-Asset Income Fund | 653,989 | 10,900 | (18,636 | ) | (5,452 | ) | ||||||||||
Multi-Asset Inflation Managed Fund | 1,109,080 | 40,667 | (10,316 | ) | 30,351 | |||||||||||
Multi-Asset Capital Stability Fund | 556,580 | 8,638 | (372 | ) | 8,266 | |||||||||||
Long/Short Alternative Fund | 12 | — | — | — | ||||||||||||
Management has analyzed the Funds’ tax positions taken on federal income tax returns for all open tax years and has concluded that as of March 31, 2015, no provision for income tax would be required in the
| SEI Institutional Managed Trust / Semi-Annual Report / March 31, 2015 | 263 |
Notes to Financial Statements/Consolidated Notes to Financial Statements (Unaudited) (Continued)
March 31, 2015
Funds’ financial statements. The Funds’ federal and state income and federal excise tax returns for tax years for which the applicable statutes of limitations have not expired are subject to examination by the Internal Revenue Service and state departments of revenue.
10. SECURITIES LENDING
Each Fund may lend portfolio securities to brokers, dealers and other financial organizations that meet capital and other credit requirements or other criteria established by the Trust’s Board of Trustees. These loans may not exceed 33 1/3% of the total asset value of the Fund (including the loan collateral). No Fund will lend portfolio securities to its Adviser, sub-adviser or their affiliates unless it has applied for and received specific authority to do so from the SEC. Loans of portfolio securities will be fully collateralized by cash. Collateral will be maintained in an amount equal to at least 100% of the current market value of the loaned securities by marking to market daily, although the borrower will be required to deliver collateral between 102% and 105% of the market value of borrowed securities for domestic and foreign securities, respectively. However, due to market fluctuations during the day, the value of securities loaned on a particular day may, during the course of the day, exceed the value of collateral. On each business day, the amount of collateral is adjusted based on the prior day’s market fluctuations and the current day’s lending activity. Income from lending activity is determined by the amount of interest earned on collateral, less any amounts payable to the borrowers of the securities and the lending agent. Lending securities involves certain risks, including the risk that the Fund may be delayed or prevented from recovering the collateral if the borrower fails to return the securities.
Cash collateral received in connection with securities lending is invested in short-term investments by the lending agent. These investments may include the SEI Liquidity Fund L.P., and the Fund bears all of the gains and losses on such investment. There is no guarantee that these investments will not lose value.
The following is a summary of securities lending agreements held by certain Funds which would be subject to offset as of March 31, 2015 (in $ Thousands):
| Fund | Securities Loaned at Value | Cash Collateral Received(1) | Net Amount | |||||||||
Large Cap Fund | $ | 26,772 | $ | 26,772 | $ | — | ||||||
Large Cap Value Fund | 53,753 | 53,753 | — | |||||||||
Large Cap Growth Fund | 23,659 | 23,659 | — | |||||||||
Tax-Managed Large Cap Fund | 48,147 | 48,147 | — | |||||||||
S&P 500 Index Fund | 4,677 | 4,677 | — | |||||||||
Small Cap Fund | 37,842 | 37,842 | — | |||||||||
Small Cap Value Fund | 21,791 | 21,791 | — | |||||||||
Small Cap Growth Fund | 40,093 | 40,093 | — | |||||||||
Tax-Managed Small/Mid Cap Fund | 52,082 | 52,082 | — | |||||||||
Mid-Cap Fund | 676 | 676 | — | |||||||||
Real Estate Fund | 4,096 | 4,096 | — | |||||||||
Core Fixed Income Fund | 15,440 | 15,440 | — | |||||||||
U.S. Fixed Income Fund | 4,928 | 4,928 | — | |||||||||
High Yield Bond Fund | 6 | 6 | — | |||||||||
| (1) | Excess collateral received in connection with the above securities lending transactions is not shown for financial reporting purposes. See each Fund’s Summary Schedule of Investments or Schedule of Investments for the total collateral received. |
11. CONCENTRATIONS/RISKS
In the normal course of business, the Trust enters into contracts that provide general indemnifications by the Trust to the counterparty to the contract. The Trust’s maximum exposure under these arrangements is dependent on future claims that may be made against the Trust and, therefore, cannot be estimated; however, Management believes that, based on experience, the risk of loss from such claims is considered remote.
In the normal course of business, the Multi-Strategy Alternative Fund invests substantially in underlying funds that are comprised of fixed income and equity securities in specific industries and that may engage in short selling activities, writing option contracts, and equity swaps, and therefore, the Fund may be affected by events in these industries. The Fund’s Prospectus provides a description of risks associated with the different investments in the underlying affiliated investment companies.
In the normal course of business, the Multi-Asset Funds’ invest in securities of foreign issuers in various countries. These investments may involve certain considerations and risks not typically associated with investments in the United States, as a result of, among other factors, the possibility of future political and economic developments and the level of governmental supervision and regulation of securities markets in the respective countries. The Funds’ Prospectus provides a description of the risk associated with the different investments.
The market values of the Core Fixed Income, U.S. Fixed Income, High Yield Bond and Multi-Asset Funds’ investments will change in response to interest rate changes and other factors. During periods of falling interest rates, the values of fixed income securities generally rise. Conversely, during periods of rising interest rates, the values of such securities generally decline. Changes by recognized rating agencies in the ratings of any fixed income security and in the ability of an issuer to make payments of interest and principal may also affect the value of these investments.
The following descriptions provide additional information about some of the risks of investing in the Funds:
Asset-Backed Securities Risk — Payment of principal and interest on asset-backed securities is dependent largely on the cash flows generated by the assets backing the securities, and asset-backed securities may not have the benefit of any security interest in the related assets.
Credit Risk — The risk that the issuer of a security or the counterparty to a contract will default or otherwise become unable to honor a financial obligation.
Currency Risk — Due to the Fund’s active positions in currencies, it will be subject to the risk that currency exchange rates may fluctuate in response to, among other things, changes in interest rates, intervention (or failure to intervene) by U.S. or foreign governments, central banks or supranational entities, or by the imposition of currency controls or other political developments in the United States or abroad.
| 264 | SEI Institutional Managed Trust / Semi-Annual Report / March 31, 2015 |
Fixed Income Market Risk — The prices of the Fund’s fixed income securities respond to economic developments, particularly interest rate changes, as well as to perceptions about the creditworthiness of individual issuers, including governments and their agencies. Generally, the Fund’s fixed income securities will decrease in value if interest rates rise and vice versa. In the case of foreign securities, price fluctuations will reflect international economic and political events, as well as changes in currency valuations relative to the U.S. dollar.
Foreign Investment/Emerging Markets Risk — The risk that non-U.S. securities may be subject to additional risks due to, among other things, political, social and economic developments abroad, currency movements, and different legal, regulatory and tax environments. These additional risks may be heightened with respect to emerging market countries since political turmoil and rapid changes in economic conditions are more likely to occur in these countries.
Interest Rate Risk — The risk that a rise in interest rates will cause a fall in the value of fixed income securities, including U.S. Government Securities, in which the Fund invests. Although U.S. Government securities are considered to be among the safest investments, they are not guaranteed against price movements due to changing interest rates. A low interest rate environment may present greater interest rate risk, because there may be a greater likelihood of rates increasing and rates may increase more rapidly.
Mortgage-Backed Securities Risk — Mortgage-backed securities are affected by, among other things, interest rate changes and the possibility of prepayment of the underlying mortgage loans. Mortgage-backed securities are also subject to the risk that underlying borrowers will be unable to meet their obligations.
The foregoing is not intended to be a complete discussion of the risks associated with investing in a Fund. Please review each Fund’s
current prospectus for additional disclosures regarding the principal risks associated with investing in a Fund.
12. IN-KIND TRANSACTIONS
During the year ended September 30, 2014, the S&P Index Fund participated in a transaction with an affiliated fund. The Fund sold securities at their current value on the date of the transaction.
| Transaction Date | Shares Redeemed (Thousands) | Value ($ Thousands) | Cash ($ Thousands) | Gain ($ Thousands) | ||||||||||||||
| 12/19/2013 | 5,658 | $ | 252,371 | $ | 24,437 | $ | 189,080 | |||||||||||
| 03/31/2014 | 3,131 | 151,190 | 6,577 | 15,121 | ||||||||||||||
13. NEW ACCOUNTING PRONOUNCEMENT
In May 2015, the Financial Accounting Standards Board (FASB) issued Accounting Standards Update (ASU) No. 2015-07 regarding “Disclosures for Investments in Certain Entities That Calculate Net Asset Value per Share”. The amendments in this update are effective for fiscal years beginning after December 15, 2015, and interim periods within those fiscal years. ASU No. 2015-07 will eliminate the requirement to categorize
investments in the fair value hierarchy if their fair value is measured at net asset value (NAV) per share (or its equivalent) using the practical expedient in the FASB’s fair value measurement guidance. At this time, management is evaluating the implications of ASU No. 2015-07 and its impact on the financial statement disclosures has not yet been determined.
14. SUBSEQUENT EVENTS
Management has evaluated the need for disclosures and/or adjustments resulting from subsequent events through the date the financial statements were issued. Based on this evaluation, no disclosures and/or adjustments were required to the financial statements as of June 1, 2015.
| SEI Institutional Managed Trust / Semi-Annual Report / March 31, 2015 | 265 |
Disclosure of Fund Expenses (Unaudited)
All mutual funds have operating expenses. As a shareholder of a mutual fund, your investment is affected by these ongoing costs, which include (among others) costs for portfolio management, administrative services, and shareholder reports like this one. It is important for you to understand the impact of these costs on your investment returns.
Operating expenses such as these are deducted from the mutual fund’s gross income and directly reduce your final investment return. These expenses are expressed as a percentage of the mutual fund’s average net assets; this percentage is known as the mutual fund’s expense ratio.
The following examples use the expense ratio and are intended to help you understand the ongoing costs (in dollars) of investing in your Fund and to compare these costs with those of other mutual funds. The examples are based on an investment of $1,000 made at the beginning of the period and held for the entire period from October 1, 2014 to March 31, 2015.
The table on the next page illustrates your Fund’s costs in two ways:
• Actual Fund return. This section helps you to estimate the actual expenses after fee waivers that your Fund incurred over the period. The “Expenses Paid During Period” column shows the actual dollar expense cost incurred by a $1,000 investment in the Fund, and the “Ending Account Value” number is derived from deducting that expense cost from the Fund’s gross investment return.
You can use this information, together with the actual amount you invested in your Fund, to estimate the expenses you paid over that period. Simply divide your actual starting account value by $1,000 to arrive at a ratio (for example, an $8,600 account value divided by $1,000 = 8.6), then multiply that ratio by the number shown for your Fund under “Expenses Paid During Period.”
• Hypothetical 5% return. This section helps you compare your Fund’s costs with those of other mutual funds. It assumes that your Fund had an annual 5% return before expenses during the year, but that the expense ratio (Column 3) is unchanged. This example is useful in making comparisons because the Securities and Exchange Commission requires all mutual funds to make this 5% calculation. You can assess your Fund’s comparative cost by comparing the hypothetical result for your Fund in the “Expense Paid During Period” column with those that appear in the same charts in the shareholder reports for other mutual funds.
NOTE: Because the return is set at 5% for comparison purposes — NOT your Fund’s actual return — the account values shown do not apply to your specific investment.
Beginning Account Value 10/1/14 | Ending Account Value 3/31/15 | Annualized Expense Ratios | Expense Paid During Period | |||||||||||||
Large Cap Fund |
| |||||||||||||||
Actual Fund Return |
| |||||||||||||||
Class A Shares | $ | 1,000.00 | $ | 1,064.60 | 0.89 | % | $ | 4.59 | * | |||||||
Class Y Shares‡ | 1,000.00 | 1,020.50 | 0.64 | 1.59 | ** | |||||||||||
Hypothetical 5% Return |
| |||||||||||||||
Class A Shares | $ | 1,000.00 | $ | 1,020.48 | 0.89 | % | $ | 4.49 | * | |||||||
Class Y Shares‡ | 1,000.00 | 1,021.74 | 0.64 | 3.23 | * | |||||||||||
Large Cap Value Fund |
| |||||||||||||||
Actual Fund Return |
| |||||||||||||||
Class A Shares | $ | 1,000.00 | $ | 1,050.70 | 0.89 | % | $ | 4.56 | * | |||||||
Class I Shares | 1,000.00 | 1,050.00 | 1.11 | 5.68 | * | |||||||||||
Hypothetical 5% Return |
| |||||||||||||||
Class A Shares | $ | 1,000.00 | $ | 1,020.48 | 0.89 | % | $ | 4.49 | * | |||||||
Class I Shares | 1,000.00 | 1,019.39 | 1.11 | 5.60 | * | |||||||||||
Large Cap Growth Fund |
| |||||||||||||||
Actual Fund Return |
| |||||||||||||||
Class A Shares | $ | 1,000.00 | $ | 1,106.90 | 0.89 | % | $ | 4.68 | * | |||||||
Class I Shares | 1,000.00 | 1,105.70 | 1.11 | 5.84 | * | |||||||||||
Hypothetical 5% Return |
| |||||||||||||||
Class A Shares | $ | 1,000.00 | $ | 1,020.48 | 0.89 | % | $ | 4.49 | * | |||||||
Class I Shares | 1,000.00 | 1,019.39 | 1.11 | 5.60 | * | |||||||||||
Beginning Account Value 10/1/14 | Ending Account Value 3/31/15 | Annualized Expense Ratios | Expense Paid During Period | |||||||||||||
Tax-Managed Large Cap Fund |
| |||||||||||||||
Actual Fund Return |
| |||||||||||||||
Class A Shares | $ | 1,000.00 | $ | 1,062.30 | 0.89 | % | $ | 4.59 | * | |||||||
Class Y Shares‡ | 1,000.00 | 1,017.60 | 0.64 | 1.59 | ** | |||||||||||
Hypothetical 5% Return |
| |||||||||||||||
Class A Shares | $ | 1,000.00 | $ | 1,020.48 | 0.89 | % | $ | 4.49 | * | |||||||
Class Y Shares‡ | 1,000.00 | 1,021.74 | 0.64 | 3.23 | * | |||||||||||
S&P 500 Fund |
| |||||||||||||||
Actual Fund Return |
| |||||||||||||||
Class A Shares | $ | 1,000.00 | $ | 1,057.30 | 0.43 | % | $ | 2.21 | * | |||||||
Class E Shares | 1,000.00 | 1,058.40 | 0.25 | 1.29 | * | |||||||||||
Class I Shares | 1,000.00 | 1,056.10 | 0.65 | 3.34 | * | |||||||||||
Hypothetical 5% Return |
| |||||||||||||||
Class A Shares | $ | 1,000.00 | $ | 1,022.78 | 0.43 | % | $ | 2.18 | * | |||||||
Class E Shares | 1,000.00 | 1,023.67 | 0.25 | 1.27 | * | |||||||||||
Class I Shares | 1,000.00 | 1,021.68 | 0.65 | 3.28 | * | |||||||||||
Small Cap Fund |
| |||||||||||||||
Actual Fund Return |
| |||||||||||||||
Class A Shares | $ | 1,000.00 | $ | 1,119.90 | 1.14 | % | $ | 6.04 | * | |||||||
Class Y Shares‡ | 1,000.00 | 1,045.00 | 0.89 | 2.24 | ** | |||||||||||
Hypothetical 5% Return |
| |||||||||||||||
Class A Shares | $ | 1,000.00 | $ | 1,019.24 | 1.14 | % | $ | 5.75 | * | |||||||
Class Y Shares‡ | 1,000.00 | 1,020.49 | 0.89 | 4.48 | * | |||||||||||
| 266 | SEI Institutional Managed Trust / Semi-Annual Report / March 31, 2015 |
Beginning Account Value 10/1/14 | Ending Account Value 3/31/15 | Annualized Expense Ratios | Expense Paid During Period | |||||||||||||
Small Cap Value Fund |
| |||||||||||||||
Actual Fund Return |
| |||||||||||||||
Class A Shares | $ | 1,000.00 | $ | 1,105.10 | 1.14 | % | $ | 5.99 | * | |||||||
Class I Shares | 1,000.00 | 1,103.50 | 1.36 | 7.14 | * | |||||||||||
Hypothetical 5% Return |
| |||||||||||||||
Class A Shares | $ | 1,000.00 | $ | 1,019.24 | 1.14 | % | $ | 5.75 | * | |||||||
Class I Shares | 1,000.00 | 1,018.14 | 1.36 | 6.85 | * | |||||||||||
Small Cap Growth Fund |
| |||||||||||||||
Actual Fund Return |
| |||||||||||||||
Class A Shares | $ | 1,000.00 | $ | 1,149.50 | 1.11 | % | $ | 5.96 | * | |||||||
Class I Shares | 1,000.00 | 1,148.30 | 1.36 | 7.29 | * | |||||||||||
Hypothetical 5% Return |
| |||||||||||||||
Class A Shares | $ | 1,000.00 | $ | 1,019.39 | 1.11 | % | $ | 5.60 | * | |||||||
Class I Shares | 1,000.00 | 1,018.14 | 1.36 | 6.85 | * | |||||||||||
Tax-Managed Small/Mid Cap Fund |
| |||||||||||||||
Actual Fund Return |
| |||||||||||||||
Class A Shares | $ | 1,000.00 | $ | 1,105.40 | 1.11 | % | $ | 5.84 | * | |||||||
Class Y Shares‡ | 1,000.00 | 1,041.00 | 0.89 | 2.24 | ** | |||||||||||
Hypothetical 5% Return |
| |||||||||||||||
Class A Shares | $ | 1,000.00 | $ | 1,019.39 | 1.11 | % | $ | 5.60 | * | |||||||
Class Y Shares‡ | 1,000.00 | 1,020.49 | 0.89 | 4.48 | * | |||||||||||
Mid-Cap Fund |
| |||||||||||||||
Actual Fund Return |
| |||||||||||||||
Class A Shares | $ | 1,000.00 | $ | 1,109.20 | 0.98 | % | $ | 5.15 | * | |||||||
Class I Shares | 1,000.00 | 1,107.70 | 1.23 | 6.46 | * | |||||||||||
Hypothetical 5% Return |
| |||||||||||||||
Class A Shares | $ | 1,000.00 | $ | 1,020.04 | 0.98 | % | $ | 4.94 | * | |||||||
Class I Shares | 1,000.00 | 1,018.80 | 1.23 | 6.19 | * | |||||||||||
U.S. Managed Volatility Fund |
| |||||||||||||||
Actual Fund Return |
| |||||||||||||||
Class A Shares | $ | 1,000.00 | $ | 1,095.40 | 1.00 | % | $ | 5.23 | * | |||||||
Class I Shares | 1,000.00 | 1,094.20 | 1.25 | 6.54 | * | |||||||||||
Class Y Shares‡ | 1,000.00 | 1,025.10 | 0.75 | 1.87 | ** | |||||||||||
Hypothetical 5% Return |
| |||||||||||||||
Class A Shares | $ | 1,000.00 | $ | 1,019.94 | 1.00 | % | $ | 5.05 | * | |||||||
Class I Shares | 1,000.00 | 1,018.69 | 1.25 | 6.30 | * | |||||||||||
Class Y Shares‡ | 1,000.00 | 1,021.19 | 0.75 | 3.78 | * | |||||||||||
Global Managed Volatility Fund |
| |||||||||||||||
Actual Fund Return |
| |||||||||||||||
Class A Shares | $ | 1,000.00 | $ | 1,090.00 | 1.11 | % | $ | 5.78 | * | |||||||
Class I Shares | 1,000.00 | 1,088.00 | 1.36 | 7.08 | * | |||||||||||
Class Y Shares‡ | 1,000.00 | 1,040.10 | 0.86 | 2.16 | ** | |||||||||||
Hypothetical 5% Return |
| |||||||||||||||
Class A Shares | $ | 1,000.00 | $ | 1,019.40 | 1.11 | % | $ | 5.59 | * | |||||||
Class I Shares | 1,000.00 | 1,018.15 | 1.36 | 6.84 | * | |||||||||||
Class Y Shares‡ | 1,000.00 | 1,020.64 | 0.86 | 4.33 | * | |||||||||||
Tax-Managed Managed Volatility Fund |
| |||||||||||||||
Actual Fund Return |
| |||||||||||||||
Class A Shares | $ | 1,000.00 | $ | 1,093.50 | 1.00 | % | $ | 5.23 | * | |||||||
Hypothetical 5% Return |
| |||||||||||||||
Class A Shares | $ | 1,000.00 | $ | 1,019.94 | 1.00 | % | $ | 5.05 | * | |||||||
Real Estate Fund |
| |||||||||||||||
Actual Fund Return |
| |||||||||||||||
Class A Shares | $ | 1,000.00 | $ | 1,203.70 | 1.14 | % | $ | 6.27 | * | |||||||
Class I Shares | 1,000.00 | 1,203.00 | 1.39 | 7.63 | * | |||||||||||
Class Y Shares‡ | 1,000.00 | 1,047.40 | 0.89 | 2.25 | ** | |||||||||||
Hypothetical 5% Return |
| |||||||||||||||
Class A Shares | $ | 1,000.00 | $ | 1,019.24 | 1.14 | % | $ | 5.75 | * | |||||||
Class I Shares | 1,000.00 | 1,018.00 | 1.39 | 6.99 | * | |||||||||||
Class Y Shares‡ | 1,000.00 | 1,020.49 | 0.89 | 4.48 | * | |||||||||||
Enhanced Income Fund |
| |||||||||||||||
Actual Fund Return |
| |||||||||||||||
Class A Shares | $ | 1,000.00 | $ | 1,007.70 | 0.60 | % | $ | 3.01 | * | |||||||
Class I Shares | 1,000.00 | 1,006.40 | 0.85 | 4.26 | * | |||||||||||
Class Y Shares‡ | 1,000.00 | 1,010.70 | 0.46 | 1.14 | ** | |||||||||||
Hypothetical 5% Return |
| |||||||||||||||
Class A Shares | $ | 1,000.00 | $ | 1,021.93 | 0.60 | % | $ | 3.03 | * | |||||||
Class I Shares | 1,000.00 | 1,020.69 | 0.85 | 4.29 | * | |||||||||||
Class Y Shares‡ | 1,000.00 | 1,022.64 | 0.46 | 2.32 | * | |||||||||||
Beginning Account Value 10/1/14 | Ending Account Value 3/31/15 | Annualized Expense Ratios | Expense Paid During Period | |||||||||||||
Core Fixed Income Fund |
| |||||||||||||||
Actual Fund Return |
| |||||||||||||||
Class A Shares | $ | 1,000.00 | $ | 1,034.00 | 0.67 | % | $ | 3.41 | * | |||||||
Class I Shares | 1,000.00 | 1,032.90 | 0.89 | 4.51 | * | |||||||||||
Hypothetical 5% Return |
| |||||||||||||||
Class A Shares | $ | 1,000.00 | $ | 1,021.58 | 0.67 | % | $ | 3.39 | * | |||||||
Class I Shares | 1,000.00 | 1,020.49 | 0.89 | 4.48 | * | |||||||||||
U.S. Fixed Income Fund |
| |||||||||||||||
Actual Fund Return |
| |||||||||||||||
Class A Shares | $ | 1,000.00 | $ | 1,033.80 | 0.66 | % | $ | 3.35 | * | |||||||
Class Y Shares‡ | 1,000.00 | 1,016.10 | 0.41 | 1.02 | ** | |||||||||||
Hypothetical 5% Return |
| |||||||||||||||
Class A Shares | $ | 1,000.00 | $ | 1,021.64 | 0.66 | % | $ | 3.33 | * | |||||||
Class Y Shares‡ | 1,000.00 | 1,022.89 | 0.41 | 2.07 | * | |||||||||||
High Yield Bond Fund | ||||||||||||||||
Actual Fund Return |
| |||||||||||||||
Class A Shares | $ | 1,000.00 | $ | 1,010.30 | 0.89 | % | $ | 4.47 | * | |||||||
Class I Shares | 1,000.00 | 1,008.60 | 1.11 | 5.56 | * | |||||||||||
Class Y Shares‡ | 1,000.00 | 1,024.30 | 0.64 | 1.60 | ** | |||||||||||
Hypothetical 5% Return |
| |||||||||||||||
Class A Shares | $ | 1,000.00 | $ | 1,020.48 | 0.89 | % | $ | 4.50 | * | |||||||
Class I Shares | 1,000.00 | 1,019.40 | 1.11 | 5.59 | * | |||||||||||
Class Y Shares‡ | 1,000.00 | 1,021.74 | 0.64 | 2.23 | * | |||||||||||
Real Return Fund | ||||||||||||||||
Actual Fund Return |
| |||||||||||||||
Class A Shares | $ | 1,000.00 | $ | 987.30 | 0.45 | % | $ | 2.23 | * | |||||||
Class Y Shares‡ | 1,000.00 | 1,004.00 | 0.35 | 0.86 | ** | |||||||||||
Hypothetical 5% Return |
| |||||||||||||||
Class A Shares | $ | 1,000.00 | $ | 1,022.69 | 0.45 | % | $ | 2.27 | * | |||||||
Class Y Shares‡ | 1,000.00 | 1,023.19 | 0.35 | 1.77 | * | |||||||||||
Multi-Strategy Alternative Fund |
| |||||||||||||||
Actual Fund Return |
| |||||||||||||||
Class A Shares | $ | 1,000.00 | $ | 1,009.70 | 0.50 | % | $ | 2.51 | * | |||||||
Hypothetical 5% Return |
| |||||||||||||||
Class A Shares | $ | 1,000.00 | $ | 1,022.44 | 0.50 | % | $ | 2.52 | * | |||||||
Multi-Asset Accumulation Fund |
| |||||||||||||||
Actual Fund Return |
| |||||||||||||||
Class A Shares | $ | 1,000.00 | $ | 1,065.00 | 1.17 | % | $ | 6.02 | * | |||||||
Class Y Shares‡ | 1,000.00 | 1,045.50 | 0.92 | 2.32 | ** | |||||||||||
Hypothetical 5% Return |
| |||||||||||||||
Class A Shares | $ | 1,000.00 | $ | 1,019.10 | 1.17 | % | $ | 5.89 | * | |||||||
Class Y Shares‡ | 1,000.00 | 1,020.34 | 0.92 | 4.63 | * | |||||||||||
Multi-Asset Income Fund |
| |||||||||||||||
Actual Fund Return |
| |||||||||||||||
Class A Shares | $ | 1,000.00 | $ | 1,040.30 | 0.85 | % | $ | 4.32 | * | |||||||
Class Y Shares‡ | 1,000.00 | 1,024.60 | 0.74 | 1.85 | ** | |||||||||||
Hypothetical 5% Return |
| |||||||||||||||
Class A Shares | $ | 1,000.00 | $ | 1,020.69 | 0.85 | % | $ | 4.28 | * | |||||||
Class Y Shares‡ | 1,000.00 | 1,021.24 | 0.74 | 3.73 | * | |||||||||||
Multi-Asset Inflation Managed Fund |
| |||||||||||||||
Actual Fund Return |
| |||||||||||||||
Class A Shares | $ | 1,000.00 | $ | 959.50 | 1.08 | % | $ | 5.28 | * | |||||||
Class Y Shares‡ | 1,000.00 | 1,006.70 | 0.95 | 2.35 | ** | |||||||||||
Hypothetical 5% Return |
| |||||||||||||||
Class A Shares | $ | 1,000.00 | $ | 1,019.55 | 1.08 | % | $ | 5.44 | * | |||||||
Class Y Shares‡ | 1,000.00 | 1,020.19 | 0.95 | 4.78 | * | |||||||||||
Multi-Asset Capital Stability Fund |
| |||||||||||||||
Actual Fund Return |
| |||||||||||||||
Class A Shares | $ | 1,000.00 | $ | 1,008.70 | 0.62 | % | $ | 3.10 | * | |||||||
Class Y Shares‡ | 1,000.00 | 1,008.00 | 0.52 | 1.29 | ** | |||||||||||
Hypothetical 5% Return |
| |||||||||||||||
Class A Shares | $ | 1,000.00 | $ | 1,021.84 | 0.62 | % | $ | 3.13 | * | |||||||
Class Y Shares‡ | 1,000.00 | 1,022.34 | 0.52 | 2.62 | * | |||||||||||
| SEI Institutional Managed Trust / Semi-Annual Report / March 31, 2015 | 267 |
Disclosure of Fund Expenses (Unaudited) (Concluded)
Beginning Account Value 10/1/14 | Ending Account Value 3/31/15 | Annualized Expense Ratios | Expense Paid During Period | |||||||||||||
Long/Short Alternative Fund† |
| |||||||||||||||
Actual Fund Return |
| |||||||||||||||
Class A Shares | $ | 1,000.00 | $ | 1,023.00 | 1.16 | % | $ | 3.28 | *** | |||||||
Hypothetical 5% Return |
| |||||||||||||||
Class A Shares | $ | 1,000.00 | $ | 1,019.15 | 1.16 | % | $ | 5.84 | * | |||||||
| † | The Fund commenced operations on December 19, 2014. |
| ‡ | Class Y Shares commenced operations on December 31, 2014. |
| * | Expenses are equal to the Fund’s annualized expense ratio multiplied by the average account value over the period, multiplied by 182/365 (to reflect one-half year period shown). |
| ** | Expenses are equal to the Fund’s annualized expense ratio multiplied by the average account value over the period, multiplied by 90/365 (to reflect one-half year period shown). |
| *** | Expenses are equal to the Fund’s annualized expense ratio multiplied by the average account value over the period, multiplied by 102/365 (to reflect one-half year period shown). |
| 268 | SEI Institutional Managed Trust / Semi-Annual Report / March 31, 2015 |
Board of Trustee Considerations in Approving the Advisory and Sub-Advisory Agreements (Unaudited)
SEI Institutional Managed Trust (the “Trust”) and SEI Investments Management Corporation (“SIMC”) have entered into an investment advisory agreement (the “Advisory Agreement”). Pursuant to the Advisory Agreement, SIMC oversees the investment advisory services provided to the series of the Trust (the “Funds”) and may manage all or a portion of the Funds’ assets. With the exception of any Fund for which SIMC directly manages the Fund’s assets, pursuant to separate sub-advisory agreements (the “Sub-Advisory Agreements” and, together with the Advisory Agreement, the “Investment Advisory Agreements”) with SIMC, and under the supervision of SIMC and the Trust’s Board of Trustees (the “Board”), the sub-advisers (each, a “Sub-Adviser” and collectively, the “Sub-Advisers”) are responsible for the day-to-day investment management of all or a discrete portion of the assets of the Funds. The Sub-Advisers are also responsible for managing their employees who provide services to these Funds. The Sub-Advisers are selected based primarily upon the research and recommendations of SIMC, which evaluates quantitatively and qualitatively the Sub-Advisers’ skills and investment results in managing assets for specific asset classes, investment styles and strategies.
The Investment Company Act of 1940, as amended (the “1940 Act”) requires that the initial approval of, as well as the continuation of, the Funds’ Investment Advisory Agreements must be specifically approved: (i) by the vote of the Board or by a vote of the shareholders of the Funds; and (ii) by the vote of a majority of the Trustees who are not parties to the Investment Advisory Agreements or “interested persons” of any party (the “Independent Trustees”), cast in person at a meeting called for the purpose of voting on such approval(s). In connection with their consideration of such approval(s), the Funds’ Trustees must request and evaluate, and SIMC and the Sub-Advisers are required to furnish, such information as may be reasonably necessary to evaluate the terms of the Investment Advisory Agreements. In addition, the Securities and Exchange Commission takes the position that, as part of their fiduciary duties with respect to a mutual fund’s fees, mutual fund boards are required to evaluate the material factors applicable to a decision to approve an Investment Advisory Agreement.
Consistent with these responsibilities, the Board calls and holds meetings each year that are dedicated to considering whether to approve new and terminate or renew existing Investment Advisory Agreements between the Trust and SIMC and SIMC and the Sub-Advisers with respect to the Funds. In preparation for these meetings, the Board requests and reviews a wide variety of materials provided by SIMC and the Sub-Advisers, including information about SIMC’s and the Sub-Advisers’ affiliates, personnel and operations. The Board also receives data from third parties. This information is provided in addition to the detailed information about the Funds that the Board reviews during the course of each year, including information that relates to Fund operations and Fund performance. The Trustees also receive a memorandum from counsel regarding the responsibilities of Trustees in connection with their consideration of whether to approve the Trust’s Investment Advisory Agreements. Finally, the Independent Trustees receive advice from independent counsel to the Independent Trustees, meet in executive sessions outside the presence of Fund management and participate in question and answer sessions with representatives of SIMC and the Sub-Advisers.
Specifically, during the course of the Trust’s fiscal year, the Board requested and received written materials from SIMC and the Sub-Advisers regarding: (i) the quality of SIMC’s and the Sub-Advisers’ investment management and other services; (ii) SIMC’s and the Sub-Advisers’ investment management personnel; (iii) SIMC’s and the Sub-Advisers’ operations and financial condition; (iv) SIMC’s and the Sub-Advisers’ brokerage practices (including any soft dollar arrangements) and investment strategies; (v) the level of the advisory fees that SIMC charges the Funds and the level of the sub-advisory fees that SIMC pays the Sub-Advisers, compared with fees each charge to comparable accounts; (vi) the advisory fees charged by SIMC and the Funds’ overall fees and operating expenses compared with peer groups of mutual funds generally, as classified by Lipper (unless otherwise adjusted), an independent provider of investment company data; (vii) the level of SIMC’s and the Sub-Advisers’ profitability from their Fund-related operations; (viii) SIMC’s and the Sub-Advisers’ compliance systems; (ix) the Adviser’s and Sub-Advisers’ potential economies of scale; (x) SIMC’s and the Sub-Advisers’ policies on and compliance procedures for personal securities transactions; (xi) SIMC’s and the Sub-Advisers’ expertise and resources in domestic and/or international financial markets; and (xii) the Funds’ performance compared with peer groups of mutual funds as classified by Lipper (unless otherwise adjusted) and the Funds’ benchmark indices.
| SEI Institutional Managed Trust / Semi-Annual Report / March 31, 2015 | 269 |
Board of Trustee Considerations in Approving the Advisory and Sub-Advisory Agreements (Unaudited) (Continued)
At the December 9-10, 2014 and March 24-25, 2015 meetings of the Board, the Trustees, including a majority of the Independent Trustees, approved the Advisory Agreement and approved the selection of SIMC and certain Sub-Advisers to act in their respective capacities for the Funds. The Board’s approval was based on its consideration and evaluation of a variety of specific factors discussed at the meetings and at prior meetings, including but not necessarily limited to:
| • | the nature, extent and quality of the services provided to the Funds under the Investment Advisory Agreements, including the resources of SIMC and the Sub-Advisers dedicated to the Funds; |
| • | the Funds’ investment performance and how it compared to that of other comparable mutual funds and the applicable benchmarks; |
| • | the Funds’ expenses under each Investment Advisory Agreement and how those expenses compared to those of other comparable mutual funds; |
| • | the profitability of SIMC and, in most cases, the Sub-Advisers and their affiliates with respect to the Funds, including both direct and indirect benefits accruing to SIMC and the Sub-Advisers and their affiliates; and |
| • | the extent to which economies of scale would be realized as the Funds grow and whether fee levels in the Investment Advisory Agreements reflect those economies of scale for the benefit of Fund investors. |
Nature, Extent and Quality of Services. The Board considered the nature, extent and quality of the services provided by SIMC and the Sub-Advisers to the Funds and the resources of SIMC and the Sub-Advisers and their affiliates dedicated to the Funds. In this regard, the Trustees evaluated, among other things, SIMC’s and each Sub-Adviser’s personnel, experience, track record and compliance program. Following evaluation, the Board concluded that, within the context of its full deliberations, the nature, extent and quality of services provided by SIMC and the Sub-Advisers to the Funds and the resources of SIMC and the Sub-Advisers and their affiliates dedicated to the Funds were sufficient to support renewal of the Investment Advisory Agreements.
Fund Performance. The Board considered Fund performance in determining whether to approve new and terminate or renew existing Investment Advisory Agreements. Specifically, the Trustees considered the Funds’ performance relative to their peer groups and appropriate indices/benchmarks in light of total return, yield and market trends. As part of this review, the Trustees considered the composition of each peer group and selection criteria. In evaluating performance, the Trustees considered both market risk and shareholder risk expectations for the Funds. The Trustees found Fund performance satisfactory, or, where performance was materially below the benchmark and/or peer group, the Trustees were satisfied that appropriate steps were being taken, but agreed that they would continue to closely monitor the Fund performance. Following evaluation, the Board concluded that, within the context of its full deliberations, the performance of the Funds was sufficient to support renewal of the Investment Advisory Agreements.
Fund Expenses. With respect to the Funds’ expenses under the Investment Advisory Agreements, the Trustees considered the rate of compensation called for by the Investment Advisory Agreements and the Funds’ net operating expense ratio in comparison to those of the Funds’ respective peer groups. The Trustees further considered the fact that the comparative fee analysis either showed that the various fees were below average or that there was a reasonable basis for the fee level. The Trustees also considered the effects of SIMC’s voluntary waiver of management and other fees to prevent total Fund expenses from exceeding a specified cap and concluded that SIMC, through waivers, has maintained the Funds’ net operating expenses at competitive levels for its distribution channels. Following evaluation, the Board concluded that, within the context of its full deliberations, the expenses of the Funds are reasonable and supported renewal of the Investment Advisory Agreements.
Profitability. With regard to profitability, the Trustees considered compensation flowing to SIMC and the Sub-Advisers and their affiliates, directly or indirectly. The Trustees considered whether the levels of compensation and profitability were reasonable. The Trustees found that profitability was reasonable. When considering the profitability of the Sub-Advisers, the Board took into account the fact that the Sub-Advisers are compensated by SIMC and not by the Funds directly, and such compensation with
| 270 | SEI Institutional Managed Trust / Semi-Annual Report / March 31, 2015 |
respect to any unaffiliated Sub-Adviser reflects an arms-length negotiation between the Sub-Adviser and SIMC. Based on this evaluation, the Board concluded that, within the context of its full deliberations, the profitability of each of SIMC and the Sub-Advisers is reasonable and supported renewal of the Investment Advisory Agreements.
Economies of Scale. The Trustees considered the existence of any economies of scale and whether those were passed along to the Funds’ shareholders through a graduated investment advisory fee schedule or other means, including any fee waivers by SIMC and its affiliates. The Trustees recognized that economies of scale are difficult to identify and quantify and are rarely identifiable on a fund-by-fund basis. Based on this evaluation, the Board was unable to conclude that economies of scale, if any, were not appropriately shared with the Funds.
Based on the Trustees’ deliberation and their evaluation of the information described above, the Board, including all of the Independent Trustees, unanimously approved the continuation of the Investment Advisory Agreements and concluded that the compensation under the Investment Advisory Agreements is fair and reasonable in light of such services and expenses and such other matters as the Trustees considered to be relevant in the exercise of their reasonable judgment. In the course of their deliberations, different factors may have been given varied weight by different Trustees, and the Trustees did not identify any particular information that was all-important or controlling.
| SEI Institutional Managed Trust / Semi-Annual Report / March 31, 2015 | 271 |
SEI INSTITUTIONAL MANAGED TRUST SEMI-ANNUAL REPORT MARCH 31, 2015
Robert A. Nesher, Chairman
Trustees
William M. Doran
George J. Sullivan, Jr.
Nina Lesavoy
James M. Williams
Mitchell A. Johnson
Hubert L. Harris, Jr.
Officers
Robert A. Nesher
President and Chief Executive Officer
Peter A. Rodriguez
Controller and Chief Financial Officer
Russell Emery
Chief Compliance Officer
Timothy D. Barto
Vice President, Secretary
Aaron Buser
Vice President, Assistant Secretary
David F. McCann
Vice President, Assistant Secretary
Stephen G. MacRae
Vice President
Investment Adviser
SEI Investments Management Corporation
Administrator
SEI Investments Global Funds Services
Distributor
SEI Investments Distribution Co.
Legal Counsel
Morgan, Lewis & Bockius LLP
Independent Registered Public Accounting Firm
KPMG LLP
This report and the financial statements contained herein are submitted for the general information of the shareholders of the Trust and must be preceded or accompanied by a current prospectus. Shares of the Funds are not deposits or obligations of, or guaranteed or endorsed by, any bank. The shares are not federally insured by the Federal Deposit Insurance Corporation (FDIC), the Federal Reserve Board, or any other government agency. Investment in the shares involves risk, including the possible loss of principal.
For more information call
1 800 DIAL SEI
(1 800 342 5734)

SEI-F-092 (03/15)
| Item 2. | Code of Ethics. |
Not applicable for semi-annual report.
| Item 3. | Audit Committee Financial Expert. |
Not applicable for semi-annual report.
| Item 4. | Principal Accountant Fees and Services. |
Not applicable for semi-annual report.
| Item 5. | Audit Committee of Listed Registrants. |
Not applicable.
| Item 6. | Schedule of Investments. |
The Schedules of Investments in securities of unaffiliated issuers as of the close of the reporting period for the Large Cap Fund, Large Cap Value Fund, Large Cap Growth Fund, Tax-Managed Large Cap Fund, S&P 500 Index Fund, Small Cap Fund, Small Cap Value Fund, Small Cap Growth Fund, Tax-Managed Small/Mid Cap Fund, Mid-Cap Fund, U.S. Managed Volatility Fund, Global Managed Volatility Fund and Tax-Managed Managed Volatility Fund are listed below. The Schedule of Investments in securities of unaffiliated issuers as of the close of the reporting period for the Real Estate Fund, Enhanced Income Fund, Core Fixed Income Fund, U.S. Fixed Income Fund, High Yield Bond Fund, Real Return Fund, Multi-Strategy Alternative Fund, Multi-Asset Accumulation Fund, Multi-Asset Income Fund, Multi-Asset Inflation Managed Fund, Multi-Asset Capital Stability Fund and Long/Short Alternative Fund is included as part of the report to shareholders filed under Item 1 of this form.
SCHEDULE OF INVESTMENTS (Unaudited)
Large Cap Fund
March 31, 2015
| Description | Shares | Market Value ($ Thousands) | ||||||
COMMON STOCK — 94.8% |
| |||||||
Consumer Discretionary — 13.0% |
| |||||||
Abercrombie & Fitch, Cl A (A) | 38,600 | $ | 851 | |||||
Amazon.com, Cl A* | 52,857 | 19,668 | ||||||
Apollo Education Group, Cl A* | 104,000 | 1,968 | ||||||
Autoliv | 17,400 | 2,049 | ||||||
Best Buy | 122,200 | 4,618 | ||||||
Big Lots | 60,400 | 2,901 | ||||||
Cablevision Systems, Cl A (A) | 80,040 | 1,465 | ||||||
Carnival | 6,200 | 297 | ||||||
CBS, Cl B | 143,048 | 8,673 | ||||||
Charter Communications, Cl A* | 37,091 | 7,163 | ||||||
Comcast, Cl A | 156,680 | 8,848 | ||||||
Cooper Tire & Rubber | 21,620 | 926 | ||||||
Dana Holding | 126,200 | 2,671 | ||||||
Deckers Outdoor* | 8,400 | 612 | ||||||
Delphi Automotive | 126,860 | 10,116 | ||||||
DeVry | 8,400 | 280 | ||||||
Dillard’s, Cl A | 36,200 | 4,942 | ||||||
DIRECTV* | 65,900 | 5,608 | ||||||
Discovery Communications, Cl A* | 116,045 | 3,569 | ||||||
Discovery Communications, Cl C* | 313,787 | 9,249 | ||||||
Dollar General | 155,290 | 11,706 | ||||||
Dollar Tree* | 24,600 | 1,996 | ||||||
Expedia | 13,300 | 1,252 | ||||||
Foot Locker, Cl A | 53,900 | 3,396 | ||||||
Ford Motor | 695,380 | 11,223 | ||||||
GameStop, Cl A (A) | 45,700 | 1,735 | ||||||
Gannett | 57,600 | 2,136 | ||||||
Gap | 2,400 | 104 | ||||||
General Motors | 211,800 | 7,943 | ||||||
Graham Holdings, Cl B | 300 | 315 | ||||||
Harley-Davidson, Cl A | 73,694 | 4,476 | ||||||
Harman International Industries, Cl A | 10,500 | 1,403 | ||||||
Hilton Worldwide Holdings* | 235,830 | 6,985 | ||||||
Home Depot | 139,340 | 15,830 | ||||||
Hyatt Hotels, Cl A* | 1,800 | 107 | ||||||
International Game Technology | 131,900 | 2,296 | ||||||
Kohl’s | 78,500 | 6,143 | ||||||
L Brands | 151,525 | 14,287 | ||||||
Lear | 93,200 | 10,329 | ||||||
Liberty Media - Interactive, Cl A* | 644,500 | 18,813 | ||||||
Lowe’s | 49,300 | 3,668 | ||||||
Macy’s | 95,680 | 6,210 | ||||||
Magna International, Cl A | 10,420 | 559 | ||||||
Murphy USA* | 13,000 | 941 | ||||||
Nike, Cl B | 105,325 | 10,567 | ||||||
priceline.com* | 9,575 | 11,147 | ||||||
PulteGroup | 15,400 | 342 | ||||||
Ralph Lauren, Cl A | 24,780 | 3,259 | ||||||
Sally Beauty Holdings* | 202,600 | 6,963 | ||||||
Staples | 423,400 | 6,895 | ||||||
Starbucks | 227,516 | 21,546 | ||||||
Target, Cl A | 88,200 | 7,238 | ||||||
Time Warner | 76,600 | 6,468 | ||||||
Time Warner Cable, Cl A | 77,758 | 11,654 | ||||||
TripAdvisor* | 265,941 | 22,118 | ||||||
TRW Automotive Holdings* | 27,500 | 2,883 | ||||||
Viacom, Cl B | 50,100 | 3,422 | ||||||
| Description | Shares | Market Value ($ Thousands) | ||||||
Whirlpool | 86,360 | $ | 17,450 | |||||
Wyndham Worldwide | 9,000 | 814 | ||||||
Wynn Resorts | 34,600 | 4,355 | ||||||
|
| |||||||
| 367,448 | ||||||||
|
| |||||||
Consumer Staples — 8.3% |
| |||||||
Altria Group | 108,700 | 5,437 | ||||||
Anheuser-Busch InBev ADR | 82,592 | 10,069 | ||||||
Archer-Daniels-Midland | 235,000 | 11,139 | ||||||
Bunge | 90,580 | 7,460 | ||||||
Coca-Cola | 82,300 | 3,337 | ||||||
Coca-Cola Enterprises | 36,100 | 1,596 | ||||||
ConAgra Foods | 52,700 | 1,925 | ||||||
Constellation Brands, Cl A* | 8,300 | 964 | ||||||
Costco Wholesale | 139,058 | 21,067 | ||||||
CVS Health | 120,100 | 12,395 | ||||||
Dr Pepper Snapple Group | 17,430 | 1,368 | ||||||
Estee Lauder, Cl A | 166,439 | 13,841 | ||||||
Ingredion | 16,500 | 1,284 | ||||||
Kimberly-Clark | 44,400 | 4,756 | ||||||
Kraft Foods | 52,560 | 4,579 | ||||||
Kroger | 198,900 | 15,248 | ||||||
Lorillard | 121,200 | 7,920 | ||||||
Mead Johnson Nutrition, Cl A | 142,106 | 14,286 | ||||||
Monster Beverage* | 24,200 | 3,349 | ||||||
PepsiCo | 34,100 | 3,261 | ||||||
Philip Morris International | 159,370 | 12,005 | ||||||
Pilgrim’s Pride (A) | 205,300 | 4,638 | ||||||
Procter & Gamble | 126,100 | 10,332 | ||||||
Reynolds American | 13,200 | 910 | ||||||
Tyson Foods, Cl A | 343,790 | 13,167 | ||||||
Walgreens Boots Alliance | 234,796 | 19,882 | ||||||
Wal-Mart Stores | 170,100 | 13,991 | ||||||
Whole Foods Market | 278,528 | 14,506 | ||||||
|
| |||||||
| 234,712 | ||||||||
|
| |||||||
Energy — 6.8% |
| |||||||
Apache | 28,300 | 1,707 | ||||||
Cabot Oil & Gas | 226,360 | 6,684 | ||||||
California Resources | 162,360 | 1,236 | ||||||
Cameron International* | 139,800 | 6,308 | ||||||
Chevron | 59,550 | 6,252 | ||||||
ConocoPhillips | 29,200 | 1,818 | ||||||
Ensco, Cl A | 213,000 | 4,488 | ||||||
EOG Resources | 124,410 | 11,407 | ||||||
Exxon Mobil | 328,900 | 27,956 | ||||||
FMC Technologies* | 206,352 | 7,637 | ||||||
Halliburton | 38,900 | 1,707 | ||||||
Helmerich & Payne | 16,200 | 1,103 | ||||||
Hess | 27,900 | 1,894 | ||||||
Kinder Morgan | 245,600 | 10,330 | ||||||
Marathon Oil | 64,100 | 1,674 | ||||||
Marathon Petroleum | 117,640 | 12,045 | ||||||
MarkWest Energy Partners | 118,760 | 7,850 | ||||||
Murphy Oil | 36,800 | 1,715 | ||||||
Nabors Industries | 49,980 | 682 | ||||||
Newfield Exploration* | 83,400 | 2,927 | ||||||
Noble Energy | 137,310 | 6,714 | ||||||
Noble PLC | 59,900 | 855 | ||||||
Occidental Petroleum | 24,400 | 1,781 | ||||||
Oil States International* | 106,960 | 4,254 | ||||||
Paragon Offshore (A) | 19,966 | 26 | ||||||
PBF Energy, Cl A | 30,800 | 1,045 | ||||||
Phillips 66 | 128,050 | 10,065 | ||||||
| 1 | SEI Institutional Managed Trust / Semi-Annual Report / March 31, 2015 |
SCHEDULE OF INVESTMENTS (Unaudited)
Large Cap Fund
March 31, 2015
| Description | Shares | Market Value ($ Thousands) | ||||||
Rowan, Cl A | 20,100 | $ | 356 | |||||
Schlumberger, Cl A | 116,511 | 9,721 | ||||||
Tesoro | 78,410 | 7,158 | ||||||
Valero Energy | 335,400 | 21,338 | ||||||
Williams | 229,600 | 11,615 | ||||||
|
| |||||||
| 192,348 | ||||||||
|
| |||||||
Financials — 14.3% | ||||||||
ACE | 5,000 | 557 | ||||||
Aflac | 28,900 | 1,850 | ||||||
Allied World Assurance Holdings | 33,900 | 1,369 | ||||||
Allstate | 185,750 | 13,220 | ||||||
Ally Financial* | 122,250 | 2,565 | ||||||
American Financial Group | 52,347 | 3,358 | ||||||
American International Group | 319,460 | 17,503 | ||||||
American Tower, Cl A† | 96,750 | 9,109 | ||||||
Ameriprise Financial | 60,800 | 7,955 | ||||||
Annaly Capital Management† | 64,200 | 668 | ||||||
Assurant | 108,640 | 6,672 | ||||||
Axis Capital Holdings | 58,960 | 3,041 | ||||||
Bank of America | 220,900 | 3,400 | ||||||
Bank of New York Mellon | 26,200 | 1,054 | ||||||
BB&T | 51,400 | 2,004 | ||||||
Berkshire Hathaway, Cl B* | 40,900 | 5,903 | ||||||
Boston Properties† | 400 | 56 | ||||||
Brandywine Realty Trust† | 67,500 | 1,079 | ||||||
Capital One Financial | 227,370 | 17,921 | ||||||
CBL & Associates Properties† | 35,800 | 709 | ||||||
CBOE Holdings | 46,000 | 2,640 | ||||||
CBRE Group, Cl A* | 126,970 | 4,915 | ||||||
Charles Schwab | 595,840 | 18,137 | ||||||
Chubb | 61,820 | 6,250 | ||||||
CIT Group | 30,300 | 1,367 | ||||||
Citigroup | 736,780 | 37,959 | ||||||
CNA Financial | 25,700 | 1,065 | ||||||
Crown Castle International† | 193,775 | 15,994 | ||||||
Discover Financial Services | 182,700 | 10,295 | ||||||
Endurance Specialty Holdings | 20,000 | 1,223 | ||||||
Equity Commonwealth*† | 17,600 | 467 | ||||||
Everest Re Group | 43,270 | 7,529 | ||||||
Fifth Third Bancorp | 105,300 | 1,985 | ||||||
General Growth Properties† | 15,400 | 455 | ||||||
Goldman Sachs Group | 41,490 | 7,799 | ||||||
Hartford Financial Services Group | 84,800 | 3,546 | ||||||
HCP† | 12,600 | 544 | ||||||
Hospitality Properties Trust | 29,600 | 977 | ||||||
Host Hotels & Resorts† | 89,900 | 1,814 | ||||||
Huntington Bancshares | 451,320 | 4,987 | ||||||
IntercontinentalExchange Group | 47,050 | 10,975 | ||||||
Iron Mountain† | 4,600 | 168 | ||||||
Jones Lang LaSalle | 7,500 | 1,278 | ||||||
JPMorgan Chase | 520,600 | 31,538 | ||||||
KeyCorp | 131,600 | 1,864 | ||||||
Lincoln National | 177,500 | 10,199 | ||||||
McGraw-Hill | 52,380 | 5,416 | ||||||
MetLife | 39,500 | 1,997 | ||||||
MFA Financial† | 94,700 | 744 | ||||||
Moody’s | 53,380 | 5,541 | ||||||
Morgan Stanley | 96,800 | 3,455 | ||||||
Navient | 117,200 | 2,383 | ||||||
Northern Trust | 4,400 | 307 | ||||||
Ocwen Financial* (A) | 11,200 | 93 | ||||||
PartnerRe | 75,900 | 8,678 | ||||||
| Description | Shares | Market Value ($ Thousands) | ||||||
PNC Financial Services Group | 78,500 | $ | 7,319 | |||||
Prudential Financial | 30,700 | 2,465 | ||||||
Public Storage† | 3,900 | 769 | ||||||
Radian Group (A) | 88,100 | 1,479 | ||||||
Realogy Holdings* | 3,600 | 164 | ||||||
Regions Financial | 155,700 | 1,471 | ||||||
Reinsurance Group of America, Cl A | 96,700 | 9,011 | ||||||
RenaissanceRe Holdings | 37,780 | 3,768 | ||||||
Senior Housing Properties Trust† | 28,600 | 635 | ||||||
Simon Property Group† | 8,400 | 1,643 | ||||||
State Street | 30,100 | 2,213 | ||||||
SunTrust Banks | 53,700 | 2,207 | ||||||
Travelers | 183,380 | 19,829 | ||||||
Unum Group | 269,340 | 9,085 | ||||||
Validus Holdings | 45,100 | 1,899 | ||||||
Vornado Realty Trust† | 2,800 | 314 | ||||||
Voya Financial | 132,700 | 5,721 | ||||||
Wells Fargo | 326,000 | 17,734 | ||||||
Weyerhaeuser† | 8,000 | 265 | ||||||
|
| |||||||
| 402,568 | ||||||||
|
| |||||||
Health Care — 16.8% | ||||||||
AbbVie | 188,000 | 11,006 | ||||||
Actavis* | 102,560 | 30,524 | ||||||
Aetna, Cl A | 117,300 | 12,496 | ||||||
Alexion Pharmaceuticals* | 48,770 | 8,452 | ||||||
AmerisourceBergen | 60,500 | 6,877 | ||||||
Amgen, Cl A | 49,300 | 7,881 | ||||||
Anthem | 141,580 | 21,861 | ||||||
Baxter International | 40,200 | 2,754 | ||||||
Biogen* | 63,530 | 26,825 | ||||||
Bristol-Myers Squibb | 333,013 | 21,479 | ||||||
Cardinal Health | 90,470 | 8,167 | ||||||
Catamaran* | 90,390 | 5,382 | ||||||
Celgene, Cl A* | 261,250 | 30,117 | ||||||
Cigna | 24,300 | 3,145 | ||||||
DaVita HealthCare Partners* | 154,777 | 12,580 | ||||||
Edwards Lifesciences, Cl A* | 36,500 | 5,200 | ||||||
Eli Lilly | 46,100 | 3,349 | ||||||
Express Scripts Holding* | 308,304 | 26,751 | ||||||
Gilead Sciences* | 186,778 | 18,328 | ||||||
Halyard Health* | 3,712 | 182 | ||||||
HCA Holdings* | 3,000 | 226 | ||||||
Health Net, Cl A* | 120,700 | 7,301 | ||||||
Humana | 138,990 | 24,743 | ||||||
Intuitive Surgical* | 30,487 | 15,397 | ||||||
Johnson & Johnson | 119,300 | 12,002 | ||||||
McKesson | 32,390 | 7,327 | ||||||
Medtronic | 193,460 | 15,088 | ||||||
Merck | 253,500 | 14,571 | ||||||
Myriad Genetics* (A) | 17,700 | 626 | ||||||
Novo Nordisk ADR | 267,125 | 14,262 | ||||||
Omnicare | 78,260 | 6,031 | ||||||
Perrigo | 54,125 | 8,960 | ||||||
Pfizer | 499,357 | 17,373 | ||||||
Quintiles Transnational Holdings* | 3,500 | 235 | ||||||
Shire ADR | 55,930 | 13,383 | ||||||
Teva Pharmaceutical Industries ADR | 236,802 | 14,753 | ||||||
United Therapeutics* | 92,080 | 15,878 | ||||||
UnitedHealth Group | 47,500 | 5,619 | ||||||
| 2 | SEI Institutional Managed Trust / Semi-Annual Report / March 31, 2015 |
SCHEDULE OF INVESTMENTS (Unaudited)
Large Cap Fund
March 31, 2015
| Description | Shares | Market Value ($ Thousands) | ||||||
Valeant Pharmaceuticals International* | 77,012 | $ | 15,296 | |||||
Zoetis, Cl A | 30,900 | 1,430 | ||||||
|
| |||||||
| 473,857 | ||||||||
|
| |||||||
Industrials — 7.4% | ||||||||
3M | 700 | 115 | ||||||
AGCO | 48,500 | 2,310 | ||||||
Alaska Air Group | 162,700 | 10,768 | ||||||
Amerco | 3,400 | 1,123 | ||||||
American Airlines Group | 63,100 | 3,330 | ||||||
Avis Budget Group* | 25,100 | 1,481 | ||||||
Boeing | 45,230 | 6,788 | ||||||
Canadian Pacific Railway | 60,370 | 11,030 | ||||||
Caterpillar, Cl A | 22,600 | 1,809 | ||||||
Cintas | 7,700 | 628 | ||||||
Colfax* | 150,318 | 7,175 | ||||||
Con-way | 3,100 | 137 | ||||||
Danaher, Cl A | 169,644 | 14,403 | ||||||
Deere | 57,600 | 5,051 | ||||||
Delta Air Lines, Cl A | 216,500 | 9,734 | ||||||
Engility Holdings | 4,883 | 147 | ||||||
Exelis | 33,600 | 819 | ||||||
Fastenal, Cl A | 248,635 | 10,302 | ||||||
FedEx | 53,110 | 8,787 | ||||||
General Dynamics | 42,080 | 5,712 | ||||||
Huntington Ingalls Industries, Cl A | 61,200 | 8,577 | ||||||
ITT | 11,300 | 451 | ||||||
Kansas City Southern | 79,650 | 8,131 | ||||||
L-3 Communications Holdings | 28,600 | 3,598 | ||||||
Lincoln Electric Holdings | 2,400 | 157 | ||||||
Lockheed Martin | 8,000 | 1,624 | ||||||
Norfolk Southern | 14,800 | 1,523 | ||||||
Northrop Grumman | 131,500 | 21,166 | ||||||
Orbital ATK | 12,949 | 992 | ||||||
Raytheon | 42,000 | 4,588 | ||||||
RR Donnelley & Sons | 78,200 | 1,501 | ||||||
Southwest Airlines, Cl A | 341,060 | 15,109 | ||||||
Spirit AeroSystems Holdings, Cl A* | 119,000 | 6,213 | ||||||
Stericycle, Cl A* | 109,828 | 15,423 | ||||||
Timken | 37,500 | 1,580 | ||||||
Trinity Industries | 50,000 | 1,775 | ||||||
Union Pacific | 96,580 | 10,461 | ||||||
United Continental Holdings* | 63,700 | 4,284 | ||||||
Vectrus* | 1,294 | 33 | ||||||
|
| |||||||
| 208,835 | ||||||||
|
| |||||||
Information Technology — 21.6% |
| |||||||
Adobe Systems* | 258,530 | 19,116 | ||||||
Akamai Technologies* | 24,000 | 1,705 | ||||||
Alliance Data Systems* | 24,031 | 7,119 | ||||||
Amdocs | 101,170 | 5,504 | ||||||
Amphenol, Cl A | 233,203 | 13,743 | ||||||
Ansys* | 86,613 | 7,638 | ||||||
Apple | 297,116 | 36,970 | ||||||
Applied Materials | 811,160 | 18,300 | ||||||
Arrow Electronics, Cl A* | 61,000 | 3,730 | ||||||
Autodesk, Cl A* | 115,950 | 6,799 | ||||||
Avnet | 52,900 | 2,354 | ||||||
Baidu ADR* | 50,900 | 10,607 | ||||||
Booz Allen Hamilton Holding, Cl A | 30,000 | 868 | ||||||
| Description | Shares | Market Value ($ Thousands) | ||||||
Broadcom, Cl A | 140,400 | $ | 6,079 | |||||
Broadridge Financial Solutions | 13,000 | 715 | ||||||
Brocade Communications Systems | 445,600 | 5,287 | ||||||
CA | 43,400 | 1,415 | ||||||
CDW | 27,100 | 1,009 | ||||||
Cisco Systems | 668,800 | 18,409 | ||||||
Cognizant Technology Solutions, Cl A* | 343,635 | 21,440 | ||||||
Computer Sciences | 10,700 | 699 | ||||||
Corning, Cl B | 282,400 | 6,405 | ||||||
DST Systems | 4,400 | 487 | ||||||
eBay* | 356,725 | 20,576 | ||||||
Electronic Arts* | 248,900 | 14,639 | ||||||
EMC | 57,700 | 1,475 | ||||||
Equinix† | 75,842 | 17,660 | ||||||
Facebook, Cl A* | 166,161 | 13,661 | ||||||
Factset Research Systems | 12,500 | 1,990 | ||||||
Fidelity National Information Services, Cl B | 18,500 | 1,259 | ||||||
Fiserv, Cl A* | 11,100 | 881 | ||||||
Flextronics International* | 426,480 | 5,406 | ||||||
Genpact* | 433,431 | 10,077 | ||||||
Google, Cl A* | 40,773 | 22,617 | ||||||
Google, Cl C* | 33,660 | 18,446 | ||||||
Harris | 32,900 | 2,591 | ||||||
Hewlett-Packard | 407,000 | 12,682 | ||||||
Ingram Micro, Cl A* | 78,200 | 1,964 | ||||||
Intel | 566,500 | 17,714 | ||||||
Intuit | 89,332 | 8,662 | ||||||
Jabil Circuit | 181,700 | 4,248 | ||||||
Leidos Holdings | 4,000 | 168 | ||||||
Lexmark International, Cl A | 54,200 | 2,295 | ||||||
MasterCard, Cl A | 360,810 | 31,170 | ||||||
Micron Technology* | 146,900 | 3,985 | ||||||
Microsoft | 836,220 | 33,996 | ||||||
National Instruments | 201,302 | 6,450 | ||||||
NetSuite* (A) | 59,681 | 5,536 | ||||||
NXP Semiconductors* | 113,709 | 11,412 | ||||||
Oracle, Cl B | 74,200 | 3,202 | ||||||
Qualcomm | 363,117 | 25,178 | ||||||
Rackspace Hosting* | 24,100 | 1,243 | ||||||
Salesforce.com* | 191,660 | 12,805 | ||||||
Seagate Technology | 53,000 | 2,758 | ||||||
Skyworks Solutions | 81,800 | 8,040 | ||||||
Take-Two Interactive Software, Cl A* | 34,120 | 869 | ||||||
TE Connectivity | 25,300 | 1,812 | ||||||
Tech Data* | 20,300 | 1,173 | ||||||
Texas Instruments | 194,180 | 11,104 | ||||||
VeriSign* (A) | 64,960 | 4,350 | ||||||
Visa, Cl A | 612,352 | 40,054 | ||||||
Western Digital | 179,700 | 16,354 | ||||||
Western Union (A) | 78,840 | 1,641 | ||||||
Xerox | 365,100 | 4,692 | ||||||
Yahoo!* | 24,500 | 1,089 | ||||||
Yelp, Cl A* (A) | 102,225 | 4,840 | ||||||
Zebra Technologies, Cl A* | 4,200 | 381 | ||||||
|
| |||||||
| 609,543 | ||||||||
|
| |||||||
Materials — 2.7% | ||||||||
Air Products & Chemicals | 60,490 | 9,151 | ||||||
Alcoa | 142,960 | 1,847 | ||||||
Cabot | 27,000 | 1,215 | ||||||
| 3 | SEI Institutional Managed Trust / Semi-Annual Report / March 31, 2015 |
SCHEDULE OF INVESTMENTS (Unaudited)
Large Cap Fund
March 31, 2015
| Description | Shares | Market Value ($ Thousands) | ||||||
Celanese, Ser A | 22,400 | $ | 1,251 | |||||
CF Industries Holdings | 36,070 | 10,232 | ||||||
Eastman Chemical | 23,100 | 1,600 | ||||||
Ecolab | 113,141 | 12,941 | ||||||
Freeport-McMoRan, Cl B | 62,100 | 1,177 | ||||||
Huntsman | 85,300 | 1,891 | ||||||
International Paper | 24,400 | 1,354 | ||||||
LyondellBasell Industries, Cl A | 122,310 | 10,739 | ||||||
Mosaic | 61,900 | 2,851 | ||||||
PPG Industries | 32,845 | 7,408 | ||||||
Rock-Tenn, Cl A | 33,000 | 2,129 | ||||||
Steel Dynamics | 48,200 | 969 | ||||||
United States Steel (A) | 312,900 | 7,634 | ||||||
Westlake Chemical | 31,200 | 2,245 | ||||||
|
| |||||||
| 76,634 | ||||||||
|
| |||||||
Telecommunication Services — 1.1% |
| |||||||
AT&T | 489,040 | 15,967 | ||||||
CenturyTel | 85,570 | 2,956 | ||||||
Level 3 Communications* | 135,170 | 7,278 | ||||||
Verizon Communications | 82,800 | 4,027 | ||||||
|
| |||||||
| 30,228 | ||||||||
|
| |||||||
Utilities — 2.6% | ||||||||
AES | 370,550 | 4,761 | ||||||
Ameren | 40,100 | 1,692 | ||||||
American Electric Power | 248,230 | 13,963 | ||||||
Atmos Energy | �� | 6,900 | 381 | |||||
Calpine* | 85,300 | 1,951 | ||||||
Consolidated Edison | 22,400 | 1,366 | ||||||
DTE Energy | 47,400 | 3,825 | ||||||
Duke Energy | 9,500 | 729 | ||||||
Edison International | 179,890 | 11,238 | ||||||
Entergy | 154,470 | 11,970 | ||||||
Exelon | 75,500 | 2,538 | ||||||
FirstEnergy | 50,800 | 1,781 | ||||||
Pinnacle West Capital | 20,900 | 1,332 | ||||||
Public Service Enterprise Group | 331,480 | 13,896 | ||||||
SCANA | 33,800 | 1,859 | ||||||
UGI | 3,800 | 124 | ||||||
Vectren | 16,200 | 715 | ||||||
|
| |||||||
| 74,121 | ||||||||
|
| |||||||
Total Common Stock | 2,670,294 | |||||||
|
| |||||||
AFFILIATED PARTNERSHIP — 1.0% |
| |||||||
SEI Liquidity Fund, L.P. 0.070%**†† (B) | 27,906,646 | 27,907 | ||||||
|
| |||||||
Total Affiliated Partnership | 27,907 | |||||||
|
| |||||||
CASH EQUIVALENTS — 4.8% |
| |||||||
Investors Cash Trust - Treasury Portfolio - DWS US Treasury Money Fund, 0.010% | 6,300,309 | 6,300 | ||||||
SEI Daily Income Trust, Prime Obligation Fund, Cl A 0.010%**†† | 128,624,068 | 128,624 | ||||||
|
| |||||||
Total Cash Equivalents | 134,924 | |||||||
|
| |||||||
| Description | Face Amount ($ Thousands) | Market Value ($ Thousands) | ||||||
U.S. TREASURY OBLIGATIONS (C) (D) — 0.2% |
| |||||||
U.S. Treasury Bills |
| |||||||
0.009%, 5/28/2015 | $ | 6,607 | $ | 6,607 | ||||
|
| |||||||
Total U.S. Treasury Obligations | 6,607 | |||||||
|
| |||||||
Total Investments — 100.8% | $ | 2,839,732 | ||||||
|
| |||||||
A list of the open futures contracts held by the Fund at March 31, 2015, is as follows:
| Type of Contract | Number of Contracts Long | Expiration Date | Unrealized Appreciation ($ Thousands) | |||||||||
S&P 500 Index EMINI | 549 | Jun-2015 | $ | 621 | ||||||||
S&P Mid 400 Index EMINI | 50 | Jun-2015 | 179 | |||||||||
|
| |||||||||||
| $ | 800 | |||||||||||
|
| |||||||||||
For the period ended March 31, 2015, the total amount of all open futures contracts, as presented in the table above, are representative of the volume of activity for this derivative type during the period.
Percentages are based on Net Assets of $2,817,376 ($Thousands).
| * | Non-income producing security. |
| ** | Rate shown is the 7-day effective yield as of March 31, 2015. |
| † | Real Estate Investment Trust. |
| †† | Investment in Affiliated Security (see Note 6). |
| (A) | This security or a partial position of this security is on loan at March 31, 2015 (see Note 10) The total market value of securities on loan at March 31, 2015 was $26,772 ($ Thousands) |
| (B) | This security was purchased with cash collateral held from securities on loan (see Note 10) The total market value of such securities as of March 31, 2015 was $27,907 $Thousands). |
| (C) | The rate reported is the effective yield at the time of purchase. |
| (D) | Security, or portion thereof, has been pledged as collateral on open futures contracts. |
ADR — American Depositary Receipt
Cl — Class
L.P. — Limited Partnership
Ser — Series
S&P — Standard & Poor’s
The following is a list of the level of inputs used as of March 31, 2015, in valuing the Fund’s investments and other financial instruments carried at value ($ Thousands):
| Investments in Securities | Level 1 | Level 2 | Level 3 | Total | ||||||||||||
Common Stock | $ | 2,670,294 | $ | — | $ | — | $ | 2,670,294 | ||||||||
Affiliated Partnership | — | 27,907 | — | 27,907 | ||||||||||||
Cash Equivalents | 134,924 | — | — | 134,924 | ||||||||||||
U.S. Treasury Obligations | — | 6,607 | — | 6,607 | ||||||||||||
|
|
|
|
|
|
|
| |||||||||
Total Investments in Securities | $ | 2,805,218 | $ | 34,514 | $ | — | $ | 2,839,732 | ||||||||
|
|
|
|
|
|
|
| |||||||||
| Other Financial Instruments | Level 1 | Level 2 | Level 3 | Total | ||||||||||||
Futures Contracts* | ||||||||||||||||
Unrealized Appreciation | $ | 800 | $ | — | $ | — | $ | 800 | ||||||||
|
|
|
|
|
|
|
| |||||||||
Total Other Financial Instruments | $ | 800 | $ | — | $ | — | $ | 800 | ||||||||
|
|
|
|
|
|
|
| |||||||||
| * | Futures contracts are valued at the unrealized appreciation on the instrument. |
For the period ended March 31, 2015, there were no transfers between Level 1 and Level 2 assets and liabilities.
For the period ended March 31, 2015, there were no transfers between Level 2 and Level 3 assets and liabilities.
For the period ended March 31, 2015, there were no Level 3 investments.
For more information on valuation inputs, see Note 2 — Significant Accounting Policies in
Notes to Financial Statements.
Amounts designated as “—” are $0 or have been rounded to $0.
The accompanying notes are an integral part of the financial statements.
| 4 | SEI Institutional Managed Trust / Semi-Annual Report / March 31, 2015 |
SCHEDULE OF INVESTMENTS (Unaudited)
Large Cap Value Fund
March 31, 2015
| Description | Shares | Market Value ($ Thousands) | ||||||
COMMON STOCK — 96.0% | ||||||||
Consumer Discretionary — 10.3% | ||||||||
Autoliv | 17,400 | $ | 2,049 | |||||
Autozone* | 6,450 | 4,400 | ||||||
Best Buy | 26,000 | 983 | ||||||
Comcast, Cl A (A) | 68,700 | 3,852 | ||||||
Cooper Tire & Rubber | 19,110 | 819 | ||||||
Dana Holding | 91,050 | 1,927 | ||||||
Deckers Outdoor* | 17,960 | 1,309 | ||||||
Delphi Automotive | 17,870 | 1,425 | ||||||
Dillard’s, Cl A | 12,500 | 1,706 | ||||||
DIRECTV* | 114,800 | 9,769 | ||||||
Foot Locker, Cl A | 97,290 | 6,129 | ||||||
Ford Motor | 199,700 | 3,223 | ||||||
GameStop, Cl A (A) | 38,000 | 1,442 | ||||||
Gannett | 54,900 | 2,036 | ||||||
General Motors | 481,784 | 18,067 | ||||||
Harley-Davidson, Cl A | 60,837 | 3,695 | ||||||
Hasbro (A) | 37,200 | 2,353 | ||||||
Kohl’s | 80,040 | 6,263 | ||||||
Lear | 64,820 | 7,183 | ||||||
Macy’s | 166,370 | 10,799 | ||||||
Magna International, Cl A | 6,720 | 361 | ||||||
McDonald’s | 27,500 | 2,679 | ||||||
Michael Kors Holdings* | 66,100 | 4,346 | ||||||
Norwegian Cruise Line Holdings* | 47,600 | 2,571 | ||||||
PVH | 26,100 | 2,781 | ||||||
Starz - Liberty Capital* | 92,300 | 3,176 | ||||||
Target, Cl A | 20,100 | 1,650 | ||||||
Time Warner Cable, Cl A | 19,300 | 2,893 | ||||||
Toyota Motor ADR (A) | 133,100 | 18,620 | ||||||
Tribune Media* | 104,400 | 6,348 | ||||||
TRW Automotive Holdings* | 26,500 | 2,778 | ||||||
Viacom, Cl B | 147,350 | 10,064 | ||||||
Whirlpool | 45,380 | 9,170 | ||||||
|
| |||||||
| 156,866 | ||||||||
|
| |||||||
Consumer Staples — 4.5% | ||||||||
Altria Group | 45,070 | 2,254 | ||||||
Archer-Daniels-Midland | 65,300 | 3,095 | ||||||
Bunge | 63,660 | 5,243 | ||||||
ConAgra Foods | 100,200 | 3,660 | ||||||
CVS Health | 15,100 | 1,558 | ||||||
Dr Pepper Snapple Group | 15,300 | 1,200 | ||||||
Ingredion | 32,300 | 2,514 | ||||||
JM Smucker | 41,900 | 4,849 | ||||||
Kellogg | 67,300 | 4,439 | ||||||
Kroger | 115,360 | 8,843 | ||||||
Lorillard | 71,270 | 4,658 | ||||||
Molson Coors Brewing, Cl B | 39,500 | 2,941 | ||||||
PepsiCo | 35,200 | 3,366 | ||||||
Philip Morris International | 31,240 | 2,353 | ||||||
Pilgrim’s Pride (A) | 41,950 | 948 | ||||||
Procter & Gamble | 53,000 | 4,343 | ||||||
SUPERVALU* | 111,437 | 1,296 | ||||||
SYSCO, Cl A | 106,700 | 4,026 | ||||||
Tyson Foods, Cl A | 124,600 | 4,772 | ||||||
Wal-Mart Stores | 35,910 | 2,954 | ||||||
|
| |||||||
| 69,312 | ||||||||
|
| |||||||
Energy — 11.4% | ||||||||
Anadarko Petroleum, Cl A | 52,600 | 4,356 | ||||||
Apache | 78,500 | 4,736 | ||||||
| Description | Shares | Market Value ($ Thousands) | ||||||
BP ADR | 247,400 | $ | 9,676 | |||||
Cabot Oil & Gas | 79,000 | 2,333 | ||||||
California Resources | 7,160 | 54 | ||||||
Cameron International* | 110,660 | 4,993 | ||||||
Canadian Natural Resources | 241,700 | 7,423 | ||||||
Chevron | 179,010 | 18,792 | ||||||
Cimarex Energy | 72,100 | 8,298 | ||||||
ConocoPhillips | 48,800 | 3,038 | ||||||
Continental Resources, Cl A* | 87,700 | 3,830 | ||||||
Ensco, Cl A | 169,200 | 3,565 | ||||||
EOG Resources | 30,300 | 2,778 | ||||||
Exxon Mobil | 306,770 | 26,075 | ||||||
Halliburton | 255,600 | 11,216 | ||||||
Helmerich & Payne | 20,100 | 1,368 | ||||||
Hess | 61,200 | 4,154 | ||||||
Marathon Oil | 147,500 | 3,851 | ||||||
Marathon Petroleum | 116,875 | 11,967 | ||||||
Memorial Resource Development* | 101,600 | 1,802 | ||||||
Murphy Oil | 30,300 | 1,412 | ||||||
Nabors Industries | 42,230 | 577 | ||||||
Noble PLC | 42,500 | 607 | ||||||
Occidental Petroleum | 75,400 | 5,504 | ||||||
Oil States International* | 86,200 | 3,428 | ||||||
Paragon Offshore (A) | 14,166 | 18 | ||||||
PBF Energy, Cl A | 29,950 | 1,016 | ||||||
Phillips 66 | 52,850 | 4,154 | ||||||
Rowan, Cl A | 20,550 | 364 | ||||||
Schlumberger, Cl A | 45,300 | 3,780 | ||||||
Tesoro | 91,030 | 8,310 | ||||||
Valero Energy | 158,670 | 10,095 | ||||||
|
| |||||||
| 173,570 | ||||||||
|
| |||||||
Financials — 26.5% ‡ | ||||||||
ACE | 30,800 | 3,434 | ||||||
Aflac | 25,000 | 1,600 | ||||||
Allstate | 210,540 | 14,984 | ||||||
Ally Financial* | 277,620 | 5,824 | ||||||
American International Group | 201,010 | 11,013 | ||||||
Ameriprise Financial | 44,620 | 5,838 | ||||||
Aon | 51,900 | 4,989 | ||||||
Assurant | 58,050 | 3,565 | ||||||
Axis Capital Holdings | 47,570 | 2,454 | ||||||
Bank of America | 1,018,900 | 15,681 | ||||||
Berkshire Hathaway, Cl B* | 61,928 | 8,937 | ||||||
Blackstone Group | 125,700 | 4,889 | ||||||
Capital One Financial | 112,950 | 8,903 | ||||||
CBL & Associates Properties† | 83,500 | 1,653 | ||||||
CBOE Holdings | 41,220 | 2,366 | ||||||
CBRE Group, Cl A* | 96,240 | 3,726 | ||||||
Chubb | 61,800 | 6,248 | ||||||
Citigroup | 821,160 | 42,306 | ||||||
Discover Financial Services | 100,350 | 5,655 | ||||||
Endurance Specialty Holdings | 29,300 | 1,791 | ||||||
Everest Re Group | 61,090 | 10,630 | ||||||
Fifth Third Bancorp | 349,200 | 6,582 | ||||||
Goldman Sachs Group | 29,570 | 5,558 | ||||||
Hartford Financial Services Group | 277,950 | 11,624 | ||||||
Hatteras Financial† | 244,100 | 4,433 | ||||||
Hospitality Properties Trust | 48,600 | 1,603 | ||||||
Host Hotels & Resorts† | 59,180 | 1,194 | ||||||
Huntington Bancshares | 448,870 | 4,960 | ||||||
Invesco | 100,800 | 4,001 | ||||||
Jones Lang LaSalle | 5,870 | 1,000 | ||||||
| 1 | SEI Institutional Managed Trust / Semi-Annual Report / March 31, 2015 |
SCHEDULE OF INVESTMENTS (Unaudited)
Large Cap Value Fund
March 31, 2015
| Description | Shares | Market Value ($ Thousands) | ||||||
JPMorgan Chase | 844,320 | $ | 51,149 | |||||
KeyCorp | 215,100 | 3,046 | ||||||
KKR, Cl Miscellaneous (A) | 378,100 | 8,624 | ||||||
Lincoln National | 181,230 | 10,414 | ||||||
McGraw-Hill | 42,600 | 4,405 | ||||||
MetLife | 413,500 | 20,902 | ||||||
Moody’s | 41,160 | 4,272 | ||||||
Morgan Stanley | 125,840 | 4,491 | ||||||
PartnerRe | 41,660 | 4,763 | ||||||
PNC Financial Services Group | 141,900 | 13,231 | ||||||
Prudential Financial | 30,300 | 2,433 | ||||||
Regions Financial | 611,300 | 5,777 | ||||||
Reinsurance Group of America, Cl A | 27,540 | 2,566 | ||||||
RenaissanceRe Holdings | 30,520 | 3,044 | ||||||
Santander Consumer USA Holdings | 249,700 | 5,778 | ||||||
State Street | 32,600 | 2,397 | ||||||
Tanger Factory Outlet Centers† | 73,057 | 2,570 | ||||||
Travelers | 92,110 | 9,960 | ||||||
Two Harbors Investment† | 316,100 | 3,357 | ||||||
Unum Group | 117,370 | 3,959 | ||||||
Voya Financial | 107,020 | 4,614 | ||||||
Wells Fargo | 464,100 | 25,247 | ||||||
|
| |||||||
| 404,440 | ||||||||
|
| |||||||
Health Care — 12.4% | ||||||||
AbbVie | 100,900 | 5,907 | ||||||
Aetna, Cl A | 111,970 | 11,928 | ||||||
AmerisourceBergen | 47,800 | 5,433 | ||||||
Amgen, Cl A | 25,200 | 4,028 | ||||||
Anthem | 106,390 | 16,428 | ||||||
Baxter International | 45,900 | 3,144 | ||||||
Biogen* | 11,740 | 4,957 | ||||||
Cardinal Health | 72,920 | 6,582 | ||||||
Catamaran* | 77,000 | 4,585 | ||||||
Cigna | 65,360 | 8,460 | ||||||
Eli Lilly | 71,500 | 5,194 | ||||||
Endo International*(A) | 34,500 | 3,095 | ||||||
Express Scripts Holding* | 59,810 | 5,190 | ||||||
Gilead Sciences* | 12,210 | 1,198 | ||||||
Health Net, Cl A* | 55,970 | 3,386 | ||||||
Horizon Pharma* | 109,000 | 2,831 | ||||||
Humana | 36,270 | 6,457 | ||||||
Jazz Pharmaceuticals* | 12,400 | 2,143 | ||||||
Johnson & Johnson | 73,600 | 7,404 | ||||||
Keryx Biopharmaceuticals*(A) | 101,450 | 1,292 | ||||||
McKesson | 33,230 | 7,517 | ||||||
Merck | 180,200 | 10,358 | ||||||
Mylan* | 122,600 | 7,276 | ||||||
Omnicare | 60,180 | 4,637 | ||||||
Pfizer | 1,013,800 | 35,270 | ||||||
PTC Therapeutics* | 25,200 | 1,533 | ||||||
Thermo Fisher Scientific | 19,700 | 2,646 | ||||||
United Therapeutics* | 46,770 | 8,065 | ||||||
Zimmer Holdings | 13,600 | 1,598 | ||||||
|
| |||||||
| 188,542 | ||||||||
|
| |||||||
Industrials — 10.1% | ||||||||
AGCO (A) | 47,000 | �� | 2,239 | |||||
Alaska Air Group | 67,600 | 4,474 | ||||||
American Airlines Group | 255,330 | 13,476 | ||||||
Avis Budget Group* | 26,950 | 1,590 | ||||||
Boeing | 23,900 | 3,587 | ||||||
| Description | Shares | Market Value ($ Thousands) | ||||||
Caterpillar, Cl A | 67,500 | $ | 5,402 | |||||
Chicago Bridge & Iron (A) | 92,500 | 4,557 | ||||||
Deere | 49,700 | 4,358 | ||||||
Delta Air Lines, Cl A | 311,330 | 13,997 | ||||||
Eaton | 147,500 | 10,021 | ||||||
Engility Holdings | 9,516 | 286 | ||||||
FedEx | 35,450 | 5,865 | ||||||
Generac Holdings* | 52,200 | 2,542 | ||||||
General Dynamics | 18,140 | 2,462 | ||||||
General Electric | 669,100 | 16,600 | ||||||
Honeywell International | 28,100 | 2,931 | ||||||
Huntington Ingalls Industries, Cl A | 18,400 | 2,579 | ||||||
Joy Global | 106,500 | 4,173 | ||||||
Kennametal | 64,800 | 2,183 | ||||||
Lockheed Martin | 3,900 | 792 | ||||||
Norfolk Southern | 14,000 | 1,441 | ||||||
Northrop Grumman | 66,380 | 10,684 | ||||||
Oshkosh Truck | 121,700 | 5,938 | ||||||
Parker-Hannifin, Cl A | 25,700 | 3,053 | ||||||
Raytheon | 19,900 | 2,174 | ||||||
RR Donnelley & Sons | 82,500 | 1,583 | ||||||
Southwest Airlines, Cl A | 99,980 | 4,429 | ||||||
Spirit AeroSystems Holdings, Cl A* | 69,770 | 3,643 | ||||||
SPX | 40,100 | 3,404 | ||||||
Terex | 112,323 | 2,987 | ||||||
United Continental Holdings* | 45,810 | 3,081 | ||||||
United Technologies | 64,000 | 7,501 | ||||||
|
| |||||||
| 154,032 | ||||||||
|
| |||||||
Information Technology — 10.0% | ||||||||
Activision Blizzard | 158,498 | 3,602 | ||||||
Amdocs | 86,820 | 4,723 | ||||||
Apple | 43,690 | 5,436 | ||||||
Applied Materials | 203,900 | 4,600 | ||||||
Arrow Electronics, Cl A* | 24,090 | 1,473 | ||||||
CA | 156,400 | 5,100 | ||||||
Check Point Software Technologies*(A) | 38,500 | 3,156 | ||||||
Cisco Systems | 883,400 | 24,316 | ||||||
Corning, Cl B | 109,300 | 2,479 | ||||||
EMC | 235,100 | 6,009 | ||||||
Factset Research Systems | 10,200 | 1,624 | ||||||
Flextronics International* | 348,270 | 4,415 | ||||||
Harris | 26,600 | 2,095 | ||||||
Hewlett-Packard | 261,900 | 8,161 | ||||||
Ingram Micro, Cl A* | 50,300 | 1,264 | ||||||
Intel | 562,100 | 17,577 | ||||||
Jabil Circuit | 146,290 | 3,420 | ||||||
Lam Research | 52,500 | 3,687 | ||||||
Lexmark International, Cl A | 56,890 | 2,409 | ||||||
Micron Technology* | 285,630 | 7,749 | ||||||
Microsoft | 101,100 | 4,110 | ||||||
NCR* | 114,900 | 3,391 | ||||||
Oracle, Cl B | 45,700 | 1,972 | ||||||
Qualcomm | 34,100 | 2,364 | ||||||
Seagate Technology | 51,800 | 2,695 | ||||||
Take-Two Interactive Software, Cl A* | 25,510 | 649 | ||||||
TE Connectivity | 37,200 | 2,664 | ||||||
Tech Data* | 24,600 | 1,421 | ||||||
Vantiv, Cl A* | 81,500 | 3,073 | ||||||
VeriSign*(A) | 52,510 | 3,517 | ||||||
Vishay Intertechnology (A) | 103,400 | 1,429 | ||||||
| 2 | SEI Institutional Managed Trust / Semi-Annual Report / March 31, 2015 |
SCHEDULE OF INVESTMENTS (Unaudited)
Large Cap Value Fund
March 31, 2015
| Description | Shares | Market Value ($ Thousands) | ||||||
Western Digital | 90,860 | $ | 8,269 | |||||
Western Union (A) | 52,290 | 1,088 | ||||||
Xerox | 200,000 | 2,570 | ||||||
|
| |||||||
| 152,507 | ||||||||
|
| |||||||
Materials — 4.2% | ||||||||
Alcoa | 145,830 | 1,884 | ||||||
Celanese, Ser A | 21,000 | 1,173 | ||||||
CF Industries Holdings | 18,390 | 5,217 | ||||||
Crown Holdings* | 86,400 | 4,667 | ||||||
Domtar | 30,200 | 1,396 | ||||||
Dow Chemical, Cl A | 70,400 | 3,378 | ||||||
Eastman Chemical | 189,700 | 13,138 | ||||||
Freeport-McMoRan, Cl B | 44,900 | 851 | ||||||
Huntsman | 70,000 | 1,552 | ||||||
International Paper | 71,640 | 3,975 | ||||||
Louisiana-Pacific*(A) | 228,300 | 3,769 | ||||||
LyondellBasell Industries, Cl A | 14,110 | 1,239 | ||||||
Mosaic | 59,700 | 2,750 | ||||||
Owens-Illinois* | 134,800 | 3,143 | ||||||
Reliance Steel & Aluminum | 99,600 | 6,084 | ||||||
Rio Tinto ADR (A) | 79,250 | 3,281 | ||||||
Rock-Tenn, Cl A | 28,600 | 1,845 | ||||||
United States Steel (A) | 191,730 | 4,678 | ||||||
|
| |||||||
| 64,020 | ||||||||
|
| |||||||
Telecommunication Services — 3.1% |
| |||||||
AT&T | 510,900 | 16,681 | ||||||
CenturyTel | 100,860 | 3,485 | ||||||
China Mobile ADR | 152,700 | 9,930 | ||||||
Verizon Communications | 340,800 | 16,573 | ||||||
|
| |||||||
| 46,669 | ||||||||
|
| |||||||
Utilities — 3.5% | ||||||||
AES | 306,310 | 3,936 | ||||||
Ameren | 36,600 | 1,544 | ||||||
American Electric Power | 183,280 | 10,310 | ||||||
Calpine* | 89,370 | 2,044 | ||||||
Edison International | 84,830 | 5,299 | ||||||
Entergy | 98,560 | 7,637 | ||||||
Exelon | 156,700 | 5,267 | ||||||
PG&E | 13,860 | 735 | ||||||
Pinnacle West Capital | 41,600 | 2,652 | ||||||
Public Service Enterprise Group | 147,390 | 6,179 | ||||||
Westar Energy, Cl A | 80,000 | 3,101 | ||||||
Xcel Energy | 117,600 | 4,095 | ||||||
|
| |||||||
| 52,799 | ||||||||
|
| |||||||
Total Common Stock |
| 1,462,757 | ||||||
|
| |||||||
AFFILIATED PARTNERSHIP — 3.6% |
| |||||||
SEI Liquidity Fund, L.P. 0.070%**†† (B) | 55,746,954 | 55,747 | ||||||
|
| |||||||
Total Affiliated Partnership |
| 55,747 | ||||||
|
| |||||||
CASH EQUIVALENT — 3.9% |
| |||||||
SEI Daily Income Trust, Prime Obligation Fund, Cl A 0.010%**†† | 58,893,833 | 58,894 | ||||||
|
| |||||||
Total Cash Equivalent |
| 58,894 | ||||||
|
| |||||||
| Description | Face Amount ($ Thousands) | Market Value ($ Thousands) | ||||||
U.S. TREASURY OBLIGATIONS (C) (D) — 0.2% |
| |||||||
U.S. Treasury Bills | $ | 2,500 | $ | 2,500 | ||||
|
| |||||||
Total U.S. Treasury Obligations | 2,500 | |||||||
|
| |||||||
Total Investments — 103.7% |
| $ | 1,579,898 | |||||
|
| |||||||
A list of the open futures contracts held by the Fund at March 31, 2015, is as follows:
| Type of Contract | Number of Contracts Long | Expiration Date | Unrealized Appreciation ($ Thousands) | |||||||||
Russell 2000 Index EMINI | 1 | Jun-2015 | $ | — | ||||||||
S&P 500 Index EMINI | 86 | Jun-2015 | 122 | |||||||||
|
| |||||||||||
| $ | 122 | |||||||||||
|
| |||||||||||
For the period ended March 31, 2015, the total amount of all open futures contracts, as presented in the table above, are representative of the volume of activity for this derivative type during the period.
Percentages are based on Net Assets of $1,523,133 ($Thousands).
| * | Non-income producing security. |
| ‡ | Narrow Industries are utilized for compliance purposes, whereas broad sectors are utilized for reporting. |
| ** | Rate shown is the 7-day effective yield as of March 31, 2015. |
| † | Real Estate Investment Trust. |
| ‡ | Narrow Industries are utilized for compliance purposes, whereas broad sectors are utilized for reporting. |
| †† | Investment in Affiliated Security (see Note 6). |
| (A) | This security or a partial position of this security is on loan at March 31, 2015 (see Note 10). The total market value of securities on loan at March 31, 2015 was $53,753 ($ Thousands) |
| (B) | This security was purchased with cash collateral held from securities on loan (see Note 10). The total value of such securities as of March 31, 2015 was $55,747 ($ Thousands). |
| (C) | The rate reported is the effective yield at the time of purchase. |
| (D) | Security, or portion thereof, has been pledged as collateral on open future contracts. |
ADR — American Depositary Receipt
Cl — Class
L.P. — Limited Partnership
PLC — Public Limited Company
Ser — Series
The following is a summary of the inputs used as of March 31, 2015, in valuing the Fund’s investments carried at value ($ Thousands):
| Investments in Securities | Level 1 | Level 2 | Level 3 | Total | ||||||||||||
Common Stock | $ | 1,462,757 | $ | — | $ | — | $ | 1,462,757 | ||||||||
Affiliated Partnership | — | 55,747 | — | 55,747 | ||||||||||||
Cash Equivalent | 58,894 | — | — | 58,894 | ||||||||||||
U.S. Treasury Obligations | — | 2,500 | — | 2,500 | ||||||||||||
|
|
|
|
|
|
|
| |||||||||
Total Investments in Securities | $ | 1,521,651 | $ | 58,247 | $ | — | $ | 1,579,898 | ||||||||
|
|
|
|
|
|
|
| |||||||||
| Other Financial Instruments | Level 1 | Level 2 | Level 3 | Total | ||||||||||||
Futures Contracts* | ||||||||||||||||
Unrealized Appreciation | $ | 122 | $ | — | $ | — | $ | 122 | ||||||||
|
|
|
|
|
|
|
| |||||||||
Total Other Financial Instruments | $ | 122 | $ | — | $ | — | $ | 122 | ||||||||
|
|
|
|
|
|
|
| |||||||||
| * | Futures contracts are valued at the unrealized appreciation on the instrument. |
For the period ended March 31, 2015, there were no transfers between Level 1 and Level 2 assets and liabilities.
For the period ended March 31, 2015, there were no transfers between Level 2 and Level 3 assets and liabilities.
For more information on valuation inputs, see Note 2 — Significant Accounting Policies in Notes to Financial Statements.
For the period ended March 31, 2015, there were no Level 3 investments.
Amounts designated as “—” are $0 or have been rounded to $0.
The accompanying notes are an integral part of the financial statements.
| 3 | SEI Institutional Managed Trust / Semi-Annual Report / March 31, 2015 |
SCHEDULE OF INVESTMENTS (Unaudited)
Large Cap Growth Fund
March 31, 2015
| Description | Shares | Market Value ($ Thousands) | ||||||
COMMON STOCK — 97.4% | ||||||||
Consumer Discretionary — 14.5% | ||||||||
Amazon.com, Cl A* | 48,067 | $ | 17,886 | |||||
Autozone* | 3,800 | 2,592 | ||||||
Best Buy | 24,700 | 933 | ||||||
BorgWarner | 5,700 | 345 | ||||||
Brinker International | 21,700 | 1,336 | ||||||
Chipotle Mexican Grill, Cl A* | 1,500 | 976 | ||||||
CST Brands | 2,600 | 114 | ||||||
Deckers Outdoor* | 9,900 | 721 | ||||||
Discovery Communications, Cl A* | 141,640 | 4,357 | ||||||
Discovery Communications, Cl C* | 383,111 | 11,292 | ||||||
Dollar Tree* | 6,100 | 495 | ||||||
Domino’s Pizza | 19,400 | 1,951 | ||||||
Foot Locker, Cl A | 7,700 | 485 | ||||||
Genuine Parts | 44,200 | 4,119 | ||||||
Goodyear Tire & Rubber | 17,300 | 469 | ||||||
Hanesbrands | 129,600 | �� | 4,343 | |||||
Hilton Worldwide Holdings* | 44,400 | 1,315 | ||||||
Home Depot | 5,700 | 648 | ||||||
Interpublic Group | 140,800 | 3,115 | ||||||
Jarden* | 18,650 | 986 | ||||||
L Brands | 207,375 | 19,553 | ||||||
Lear | 17,600 | 1,950 | ||||||
Leggett & Platt | 22,300 | 1,028 | ||||||
Liberty Media - Interactive, Cl A* | 743,060 | 21,690 | ||||||
Liberty Ventures, Ser A* | 12,600 | 529 | ||||||
Live Nation* | 26,300 | 664 | ||||||
Lowe’s | 28,200 | 2,098 | ||||||
Marriott International, Cl A | 68,700 | 5,518 | ||||||
Murphy USA* | 8,200 | �� | 593 | |||||
Newell Rubbermaid, Cl B | 59,200 | 2,313 | ||||||
Nike, Cl B | 142,350 | 14,282 | ||||||
Norwegian Cruise Line Holdings* | 6,600 | 357 | ||||||
Omnicom Group | 17,300 | 1,349 | ||||||
O’Reilly Automotive* | 32,700 | 7,071 | ||||||
Polaris Industries | 2,300 | 325 | ||||||
priceline.com* | 11,689 | 13,608 | ||||||
Restaurant Brands International | 36,799 | 1,413 | ||||||
Ross Stores | 1,800 | 190 | ||||||
Sally Beauty Holdings* | 247,450 | 8,505 | ||||||
Service International | 5,700 | 148 | ||||||
Signet Jewelers | 2,500 | 347 | ||||||
Starbucks | 221,029 | 20,931 | ||||||
Starwood Hotels & Resorts Worldwide | 1,500 | 125 | ||||||
Tempur-Pedic International* | 3,200 | 185 | ||||||
Time Warner Cable, Cl A | 8,500 | 1,274 | ||||||
TripAdvisor* | 337,010 | 28,029 | ||||||
Under Armour, Cl A* | 16,000 | 1,292 | ||||||
VF | 86,800 | 6,537 | ||||||
Walt Disney | 51,000 | 5,349 | ||||||
Whirlpool | 2,500 | 505 | ||||||
Williams-Sonoma | 4,600 | 367 | ||||||
Wyndham Worldwide | 25,500 | 2,307 | ||||||
Wynn Resorts | 42,250 | 5,318 | ||||||
|
| |||||||
| 234,228 | ||||||||
|
| |||||||
Consumer Staples — 9.4% | ||||||||
Altria Group | 87,097 | 4,356 | ||||||
Archer-Daniels-Midland | 24,000 | 1,138 | ||||||
| Description | Shares | Market Value ($ Thousands) | ||||||
Brown-Forman, Cl B | 19,900 | $ | 1,798 | |||||
Church & Dwight | 45,500 | 3,887 | ||||||
Clorox (A) | 11,500 | 1,269 | ||||||
Coca-Cola Enterprises | 13,700 | 605 | ||||||
Colgate-Palmolive | 12,600 | 874 | ||||||
Constellation Brands, Cl A* | 47,600 | 5,532 | ||||||
Costco Wholesale | 92,040 | 13,943 | ||||||
CVS Health | 60,300 | 6,223 | ||||||
Dr Pepper Snapple Group | 54,700 | 4,293 | ||||||
Estee Lauder, Cl A | 217,144 | 18,058 | ||||||
General Mills, Cl A | 35,900 | 2,032 | ||||||
Hain Celestial Group* | 2,000 | 128 | ||||||
Hershey | 31,000 | 3,128 | ||||||
Hormel Foods | 46,300 | 2,632 | ||||||
Ingredion | 3,000 | 234 | ||||||
Kimberly-Clark | 37,000 | 3,963 | ||||||
Kroger | 107,300 | 8,226 | ||||||
Lorillard | 35,000 | 2,287 | ||||||
Mead Johnson Nutrition, Cl A | 185,398 | 18,638 | ||||||
Monster Beverage* | 2,000 | 277 | ||||||
PepsiCo | 4,100 | 392 | ||||||
Reynolds American | 48,000 | 3,308 | ||||||
Rite Aid* | 32,000 | 278 | ||||||
Tyson Foods, Cl A | 7,000 | 268 | ||||||
Walgreens Boots Alliance | 286,593 | 24,269 | ||||||
Whole Foods Market | 366,743 | 19,100 | ||||||
|
| |||||||
| 151,136 | ||||||||
|
| |||||||
Energy — 4.1% | ||||||||
Cheniere Energy* | 31,700 | 2,454 | ||||||
EOG Resources | 134,250 | 12,309 | ||||||
FMC Technologies* | 274,301 | 10,152 | ||||||
Kinder Morgan | 297,800 | 12,525 | ||||||
Schlumberger, Cl A | 153,538 | 12,811 | ||||||
Targa Resources | 10,300 | 987 | ||||||
Tesoro | 3,300 | 301 | ||||||
Williams | 280,075 | 14,169 | ||||||
|
| |||||||
| 65,708 | ||||||||
|
| |||||||
Financials — 6.5% | ||||||||
American Express | 15,900 | 1,242 | ||||||
American Financial Group | 4,100 | 263 | ||||||
American Tower, Cl A† | 1,100 | 104 | ||||||
Ameriprise Financial | 23,000 | 3,009 | ||||||
Aon | 25,400 | 2,441 | ||||||
Apartment Investment & Management, Cl A† | 33,100 | 1,303 | ||||||
BlackRock | 5,300 | 1,939 | ||||||
Boston Properties† | 6,200 | 871 | ||||||
CBOE Holdings | 7,500 | 431 | ||||||
CBRE Group, Cl A* | 16,400 | 635 | ||||||
Charles Schwab | 798,160 | 24,296 | ||||||
Crown Castle International† | 236,550 | 19,525 | ||||||
Equity Lifestyle Properties† | 23,400 | 1,286 | ||||||
Extra Space Storage† | 43,500 | 2,939 | ||||||
Federal Realty Investment Trust† | 11,500 | 1,693 | ||||||
HealthCare Trust of America, Cl A† | 3,750 | 105 | ||||||
IntercontinentalExchange Group | 57,450 | 13,401 | ||||||
Invesco | 3,200 | 127 | ||||||
Jones Lang LaSalle | 4,400 | 750 | ||||||
Lazard, Cl A | 18,500 | 973 | ||||||
| 1 | SEI Institutional Managed Trust / Semi-Annual Report / March 31, 2015 |
SCHEDULE OF INVESTMENTS (Unaudited)
Large Cap Growth Fund
March 31, 2015
| Description | Shares | Market Value ($ Thousands) | ||||||
Legg Mason | 14,100 | $ | 778 | |||||
Marsh & McLennan | 136,100 | 7,634 | ||||||
McGraw-Hill | 55,700 | 5,759 | ||||||
Moody’s | 54,100 | 5,616 | ||||||
MSCI, Cl A | 12,200 | 748 | ||||||
NorthStar Asset Management Group | 6,900 | 161 | ||||||
NorthStar Realty Finance† | 16,300 | 295 | ||||||
Omega Healthcare Investors†(A) | 14,400 | 584 | ||||||
Public Storage† | 5,800 | 1,143 | ||||||
Reinsurance Group of America, Cl A | 7,500 | 699 | ||||||
Simon Property Group† | 6,400 | 1,252 | ||||||
Taubman Centers† | 6,200 | 478 | ||||||
TD Ameritrade Holding | 19,900 | 742 | ||||||
Urban Edge Properties† | 7,600 | 180 | ||||||
Vornado Realty Trust† | 14,000 | 1,568 | ||||||
Weyerhaeuser† | 18,800 | 623 | ||||||
|
| |||||||
| 105,593 | ||||||||
|
| |||||||
Health Care — 16.7% | ||||||||
Actavis* | 77,177 | 22,969 | ||||||
Aetna, Cl A | 14,700 | 1,566 | ||||||
Agilent Technologies | 5,700 | 237 | ||||||
Alkermes* | 12,700 | 774 | ||||||
AmerisourceBergen | 71,700 | 8,150 | ||||||
Becton Dickinson | 57,500 | 8,256 | ||||||
Biogen* | 23,475 | 9,912 | ||||||
Bristol-Myers Squibb | 204,583 | 13,196 | ||||||
C.R. Bard | 11,300 | 1,891 | ||||||
Cardinal Health | 10,000 | 903 | ||||||
Celgene, Cl A* | 261,400 | 30,134 | ||||||
Centene* | 25,600 | 1,809 | ||||||
Cerner* | 5,200 | 381 | ||||||
Charles River Laboratories International* | 2,400 | 190 | ||||||
Cigna | 6,900 | 893 | ||||||
Cooper, Cl A | 10,300 | 1,930 | ||||||
DaVita HealthCare Partners* | 201,930 | 16,413 | ||||||
Dentsply International | 16,000 | 814 | ||||||
Edwards Lifesciences, Cl A* | 14,900 | 2,123 | ||||||
Envision Healthcare Holdings* | 13,800 | 529 | ||||||
Express Scripts Holding* | 321,572 | 27,903 | ||||||
Gilead Sciences* | 142,921 | 14,025 | ||||||
HCA Holdings* | 10,000 | 752 | ||||||
Henry Schein* | 32,200 | 4,496 | ||||||
Idexx Laboratories* | 3,500 | 541 | ||||||
Illumina* | 5,500 | 1,021 | ||||||
Incyte* | 2,100 | 193 | ||||||
Intuitive Surgical* | 39,775 | 20,088 | ||||||
Johnson & Johnson | 47,200 | 4,748 | ||||||
Laboratory Corp of America Holdings* | 1,800 | 227 | ||||||
Mallinckrodt* | 5,900 | 747 | ||||||
McKesson | 21,400 | 4,841 | ||||||
Medivation* | 1,000 | 129 | ||||||
MEDNAX* | 9,100 | 660 | ||||||
Mettler Toledo International* | 1,200 | 394 | ||||||
Novo Nordisk ADR | 326,385 | 17,426 | ||||||
Patterson | 2,600 | 127 | ||||||
PerkinElmer | 6,500 | 332 | ||||||
Perrigo | 66,075 | 10,939 | ||||||
Quintiles Transnational Holdings* | 7,300 | 489 | ||||||
| Description | Shares | Market Value ($ Thousands) | ||||||
Sirona Dental Systems, Cl A* | 9,400 | $ | 846 | |||||
St. Jude Medical | 26,500 | 1,733 | ||||||
Stryker | 58,100 | 5,360 | ||||||
Thermo Fisher Scientific | 36,800 | 4,944 | ||||||
Universal Health Services, Cl B | 3,400 | 400 | ||||||
Valeant Pharmaceuticals International* | 94,019 | 18,674 | ||||||
Varian Medical Systems*(A) | 23,100 | 2,174 | ||||||
Zimmer Holdings | 4,300 | 505 | ||||||
Zoetis, Cl A | 38,600 | 1,787 | ||||||
|
| |||||||
| 269,571 | ||||||||
|
| |||||||
Industrials — 11.2% | ||||||||
3M | 89,400 | 14,746 | ||||||
Acuity Brands | 8,000 | 1,345 | ||||||
Alaska Air Group | 44,700 | 2,958 | ||||||
Allegion | 2,300 | 141 | ||||||
American Airlines Group | 10,500 | 554 | ||||||
Avis Budget Group* | 13,900 | 820 | ||||||
C.H. Robinson Worldwide (A) | 22,200 | 1,626 | ||||||
Cintas | 27,100 | 2,212 | ||||||
Colfax*(A) | 195,390 | 9,326 | ||||||
Covanta Holding | 16,400 | 368 | ||||||
Danaher, Cl A | 242,925 | 20,624 | ||||||
Delta Air Lines, Cl A | 14,700 | 661 | ||||||
Donaldson, Cl A | 3,700 | 139 | ||||||
Dun & Bradstreet | 4,300 | 552 | ||||||
Equifax | 22,300 | 2,074 | ||||||
Fastenal, Cl A (A) | 324,380 | 13,441 | ||||||
FedEx | 23,000 | 3,805 | ||||||
HD Supply Holdings* | 3,400 | 106 | ||||||
Hexcel, Cl A | 2,200 | 113 | ||||||
Honeywell International | 41,200 | 4,297 | ||||||
Huntington Ingalls Industries, Cl A | 15,100 | 2,116 | ||||||
IDEX | 25,700 | 1,949 | ||||||
Illinois Tool Works | 67,600 | 6,567 | ||||||
Ingersoll-Rand | 5,200 | 354 | ||||||
Kansas City Southern | 6,300 | 643 | ||||||
KAR Auction Services | 14,700 | 558 | ||||||
Kirby* | 12,400 | 931 | ||||||
Landstar System | 14,500 | 962 | ||||||
Lennox International | 7,400 | 826 | ||||||
Lockheed Martin | 50,100 | 10,168 | ||||||
Nielsen | 16,300 | 727 | ||||||
Norfolk Southern | 20,300 | 2,089 | ||||||
Old Dominion Freight Line, Cl A* | 23,600 | 1,824 | ||||||
Pall | 36,600 | 3,674 | ||||||
Robert Half International | 41,900 | 2,536 | ||||||
Rockwell Collins | 20,700 | 1,999 | ||||||
Roper Industries | 7,900 | 1,359 | ||||||
Snap-on | 2,700 | 397 | ||||||
Southwest Airlines, Cl A | 188,200 | 8,337 | ||||||
Spirit AeroSystems Holdings, Cl A* | 39,300 | 2,052 | ||||||
Spirit Airlines* | 24,900 | 1,927 | ||||||
Stanley Black & Decker | 4,800 | 458 | ||||||
Stericycle, Cl A* | 172,387 | 24,208 | ||||||
TransDigm Group | 19,000 | 4,156 | ||||||
Union Pacific | 73,000 | 7,907 | ||||||
United Parcel Service, Cl B | 60,300 | 5,845 | ||||||
United Rentals* | 9,600 | 875 | ||||||
Wabtec | 32,100 | 3,050 | ||||||
Waste Connections | 13,500 | 650 | ||||||
| 2 | SEI Institutional Managed Trust / Semi-Annual Report / March 31, 2015 |
SCHEDULE OF INVESTMENTS (Unaudited)
Large Cap Growth Fund
March 31, 2015
| Description | Shares | Market Value ($ Thousands) | ||||||
Waste Management | 17,100 | $ | 927 | |||||
|
| |||||||
| 179,979 | ||||||||
|
| |||||||
Information Technology — 31.5% ‡ | ||||||||
Adobe Systems* | 141,900 | 10,492 | ||||||
Alliance Data Systems* | 8,200 | 2,429 | ||||||
Amphenol, Cl A | 410,047 | 24,164 | ||||||
Ansys* | 112,999 | 9,966 | ||||||
Apple | 336,738 | 41,900 | ||||||
Automatic Data Processing | 134,700 | 11,536 | ||||||
Avago Technologies, Cl A | 27,600 | 3,505 | ||||||
Avnet | 6,100 | 271 | ||||||
Baidu ADR* | 62,225 | 12,968 | ||||||
Broadridge Financial Solutions | 39,000 | 2,145 | ||||||
Cadence Design Systems* | 25,700 | 474 | ||||||
CDK Global | 24,700 | 1,155 | ||||||
CDW | 33,800 | 1,259 | ||||||
Cognizant Technology Solutions, Cl A* | 252,853 | 15,775 | ||||||
Corning, Cl B | 98,900 | 2,243 | ||||||
DST Systems | 7,400 | 819 | ||||||
eBay* | 435,475 | 25,118 | ||||||
Electronic Arts* | 273,250 | 16,071 | ||||||
EMC | 9,800 | 251 | ||||||
Equinix† | 93,680 | 21,813 | ||||||
F5 Networks, Cl A* | 1,900 | 218 | ||||||
Facebook, Cl A* | 218,960 | 18,002 | ||||||
Factset Research Systems | 13,300 | 2,117 | ||||||
Fidelity National Information Services, Cl B | 12,100 | 824 | ||||||
Fiserv, Cl A* | 82,800 | 6,574 | ||||||
FleetCor Technologies* | 5,800 | 875 | ||||||
Fortinet* | 26,300 | 919 | ||||||
Gartner* | 32,500 | 2,725 | ||||||
Genpact* | 572,976 | 13,322 | ||||||
Global Payments | 12,900 | 1,183 | ||||||
Google, Cl A* | 36,045 | 19,994 | ||||||
Google, Cl C* | 36,341 | 19,915 | ||||||
Harris | 7,100 | 559 | ||||||
Intel | 125,400 | 3,921 | ||||||
Intuit | 155,305 | 15,058 | ||||||
Jack Henry & Associates | 27,900 | 1,950 | ||||||
Keysight Technologies* | 6,150 | 228 | ||||||
KLA-Tencor | 50,200 | 2,926 | ||||||
Lam Research | 7,700 | 541 | ||||||
Linear Technology | 1,700 | 80 | ||||||
MasterCard, Cl A | 266,350 | 23,010 | ||||||
Microchip Technology (A) | 19,600 | 959 | ||||||
Micron Technology* | 48,300 | 1,310 | ||||||
Microsoft | 390,250 | 15,866 | ||||||
National Instruments | 262,628 | 8,415 | ||||||
NetSuite*(A) | 78,285 | 7,262 | ||||||
NXP Semiconductors* | 150,360 | 15,090 | ||||||
Palo Alto Networks* | 5,100 | 745 | ||||||
Paychex | 94,500 | 4,689 | ||||||
PTC* | 13,300 | 481 | ||||||
Qualcomm | 449,219 | 31,149 | ||||||
Salesforce.com* | 250,049 | 16,706 | ||||||
SanDisk | 28,000 | 1,781 | ||||||
Skyworks Solutions | 21,700 | 2,133 | ||||||
Texas Instruments | 52,200 | 2,985 | ||||||
| Description | Shares | Market Value ($ Thousands) | ||||||
Vantiv, Cl A* | 13,600 | $ | 513 | |||||
Visa, Cl A | 770,948 | 50,428 | ||||||
Western Union (A) | 16,300 | 339 | ||||||
Xilinx | 46,200 | 1,954 | ||||||
Yelp, Cl A*(A) | 124,975 | 5,918 | ||||||
|
| |||||||
| 508,018 | ||||||||
|
| |||||||
Materials — 3.1% | ||||||||
Airgas | 17,000 | 1,804 | ||||||
Ball | 38,400 | 2,712 | ||||||
Dow Chemical, Cl A | 29,100 | 1,396 | ||||||
E.I. Du Pont de Nemours | 28,700 | 2,051 | ||||||
Ecolab | 206,208 | 23,586 | ||||||
International Flavors & Fragrances | 26,000 | 3,053 | ||||||
LyondellBasell Industries, Cl A | 40,600 | 3,565 | ||||||
NewMarket (A) | 3,100 | 1,481 | ||||||
PPG Industries | 1,300 | 293 | ||||||
Praxair | 11,100 | 1,340 | ||||||
RPM International | 41,300 | 1,982 | ||||||
Scotts Miracle-Gro, Cl A | 4,200 | 282 | ||||||
Sealed Air | 3,400 | 155 | ||||||
Sherwin-Williams, Cl A | 5,400 | 1,537 | ||||||
Sigma-Aldrich | 21,000 | 2,903 | ||||||
Silgan Holdings | 12,500 | 727 | ||||||
Valspar | 22,400 | 1,882 | ||||||
|
| |||||||
| 50,749 | ||||||||
|
| |||||||
Telecommunication Services — 0.3% |
| |||||||
CenturyTel | 12,100 | 418 | ||||||
SBA Communications, Cl A* | 32,600 | 3,818 | ||||||
Windstream Holdings (A) | 65,700 | 486 | ||||||
|
| |||||||
| 4,722 | ||||||||
|
| |||||||
Utilities — 0.1% | ||||||||
Dominion Resources | 9,900 | 702 | ||||||
ITC Holdings | 36,900 | 1,381 | ||||||
|
| |||||||
| 2,083 | ||||||||
|
| |||||||
Total Common Stock |
| 1,571,787 | ||||||
|
| |||||||
AFFILIATED PARTNERSHIP — 1.5% |
| |||||||
SEI Liquidity Fund, L.P. | 24,314,603 | 24,315 | ||||||
Total Affiliated Partnership |
| 24,315 | ||||||
|
| |||||||
CASH EQUIVALENTS — 2.5% |
| |||||||
Investors Cash Trust - Treasury Portfolio - DWS US Treasury Money Fund | 11,231,318 | 11,231 | ||||||
SEI Daily Income Trust, Prime Obligation Fund, Cl A | 28,667,372 | 28,668 | ||||||
|
| |||||||
Total Cash Equivalents |
| 39,899 | ||||||
|
| |||||||
| 3 | SEI Institutional Managed Trust / Semi-Annual Report / March 31, 2015 |
SCHEDULE OF INVESTMENTS (Unaudited)
Large Cap Growth Fund
March 31, 2015
| Description | Face Amount ($ Thousands) | Market Value ($ Thousands) | ||||||
U.S. TREASURY OBLIGATIONS (C) (D) — 0.2% |
| |||||||
U.S. Treasury Bills | $ | 2,850 | $ | 2,849 | ||||
|
| |||||||
Total U.S. Treasury Obligations | 2,849 | |||||||
|
| |||||||
Total Investments — 101.6% | $ | 1,638,850 | ||||||
|
| |||||||
A list of the open futures contracts held by the Fund at March 31, 2015, is as follows:
| Type of Contract | Number of Contracts Long | Expiration Date | Unrealized Appreciation ($ Thousands) | |||||||||
Russell 2000 Index EMINI | 26 | Jun-2015 | $ | 97 | ||||||||
S&P 500 Index EMINI | 202 | Jun-2015 | 285 | |||||||||
|
| |||||||||||
| $ | 382 | |||||||||||
|
| |||||||||||
For the period ended March 31, 2015, the total amount of all open futures contracts, as presented in the table above, are representative of the volume of activity for this derivative type during the period.
Percentages are based on Net Assets of $1,613,479 ($Thousands).
| * | Non-income producing security. |
| ‡ | Narrow Industries are utilized for compliance purposes, whereas broad sectors are utilized for reporting. |
| † | Real Estate Investment Trust. |
| †† | Investment in Affiliated Security (see Note 6). |
| ** | The rate reported is the 7-day effective yield as of March 31, 2015. |
| (A) | This security or a partial position of this security is on loan at March 31, 2015 (see Note 10). The total market value of securities on loan at March 31, 2015 was $23,659 ($ Thousands) |
| (B) | This security was purchased with cash collateral held from securities on loan (see Note 10). The total value of such securities as of March 31, 2015 was $24,315 ($ Thousands). |
| (C) | Security, or portion thereof, has been pledged as collateral on open future contracts. |
| (D) | The rate reported is the effective yield at the time of purchase. |
ADR — American Depositary Receipt
Cl — Class
L.P. — Limited Partnership
S&P — Standard and Poor’s
Ser — Series
The following is a summary of the inputs used as of March 31, 2015, in valuing the Fund’s investments and other financial instruments carried at value ($ Thousands):
| Investments in Securities | Level 1 | Level 2 | Level 3 | Total | ||||||||||||
Common Stock | $ | 1,571,787 | $ | — | $ | — | $ | 1,571,787 | ||||||||
Affiliated Partnership | — | 24,315 | — | 24,315 | ||||||||||||
Cash Equivalents | 39,899 | — | — | 39,899 | ||||||||||||
U.S. Treasury Obligations | — | 2,849 | — | 2,849 | ||||||||||||
|
|
|
|
|
|
|
| |||||||||
Total Investments in Securities | $ | 1,611,686 | $ | 27,164 | $ | — | $ | 1,638,850 | ||||||||
|
|
|
|
|
|
|
| |||||||||
| Other Financial Instruments | Level 1 | Level 2 | Level 3 | Total | ||||||||||||
Futures Contracts* | ||||||||||||||||
Unrealized Appreciation | $ | 382 | $ | — | $ | — | $ | 382 | ||||||||
|
|
|
|
|
|
|
| |||||||||
Total Other Financial Instruments | $ | 382 | $ | — | $ | — | $ | 382 | ||||||||
|
|
|
|
|
|
|
| |||||||||
| * | Futures contracts are valued at the unrealized appreciation on the instrument. |
For the period ended March 31, 2015, there were no transfers between Level 1 and Level 2 assets and liabilities.
For the period ended March 31, 2015, there were no transfers between Level 2 and Level 3 assets and liabilities.
For the period ended March 31, 2015, there were no Level 3 Investments.
For more information on valuation inputs, see Note 2 — Significant Accounting Policies in
Notes to Financial Statements.
Amounts designated as “—�� are $0 or have been rounded to $0.
The accompanying notes are an integral part of the financial statements.
| 4 | SEI Institutional Managed Trust / Semi-Annual Report / March 31, 2015 |
SCHEDULE OF INVESTMENTS (Unaudited)
Tax-Managed Large Cap Fund
March 31, 2015
| Description | Shares | Market Value ($ Thousands) | ||||||
COMMON STOCK — 93.8% | ||||||||
Consumer Discretionary — 13.1% | ||||||||
Amazon.com, Cl A* | 53,407 | $ | 19,873 | |||||
Autoliv (A) | 22,650 | 2,667 | ||||||
Bed Bath & Beyond* | 18,911 | 1,452 | ||||||
Best Buy | 86,319 | 3,262 | ||||||
CarMax* | 1,883 | 130 | ||||||
CBS, Cl B | 208,745 | 12,656 | ||||||
Charter Communications, Cl A* | 21,156 | 4,085 | ||||||
Chipotle Mexican Grill, Cl A* | 13,788 | 8,970 | ||||||
Coach | 56,395 | 2,336 | ||||||
Comcast, Cl A | 168,899 | 9,538 | ||||||
CST Brands | 26,846 | 1,177 | ||||||
Darden Restaurants | 3,127 | 217 | ||||||
Delphi Automotive | 91,343 | 7,284 | ||||||
Dillard’s, Cl A | 52,548 | 7,173 | ||||||
DIRECTV* | 137,105 | 11,668 | ||||||
Discovery Communications, Cl C* | 26,104 | 769 | ||||||
Discovery Communications, Cl A*(A) | 26,104 | 803 | ||||||
DISH Network, Cl A* | 17,303 | 1,212 | ||||||
Dollar General | 142,515 | 10,743 | ||||||
Domino’s Pizza | 18,894 | 1,900 | ||||||
DR Horton | 6,500 | 185 | ||||||
Expedia | 11,877 | 1,118 | ||||||
Family Dollar Stores | 701 | 56 | ||||||
Foot Locker, Cl A | 30,000 | 1,890 | ||||||
Ford Motor | 772,889 | 12,475 | ||||||
Fossil Group* | 16,750 | 1,381 | ||||||
GameStop, Cl A (A) | 164,221 | 6,234 | ||||||
Gannett | 153,973 | 5,709 | ||||||
Gap | 100,419 | 4,351 | ||||||
General Motors | 55,904 | 2,096 | ||||||
Genuine Parts | 2,400 | 224 | ||||||
Graham Holdings, Cl B | 809 | 849 | ||||||
H&R Block | 52,113 | 1,671 | ||||||
Harley-Davidson, Cl A | 184,226 | 11,190 | ||||||
Harman International Industries, Cl A | 55,213 | 7,378 | ||||||
Hasbro (A) | 9,640 | 610 | ||||||
Home Depot | 160,728 | 18,260 | ||||||
International Game Technology | 28,909 | 503 | ||||||
Interpublic Group | 2,743 | 61 | ||||||
Johnson Controls | 4,300 | 217 | ||||||
Kohl’s | 11,093 | 868 | ||||||
L Brands | 177,912 | 16,775 | ||||||
Lands’ End*(A) | 119,166 | 4,276 | ||||||
Las Vegas Sands | 4,119 | 227 | ||||||
Lear | 115,549 | 12,805 | ||||||
Liberty Media - Interactive, Cl A* | 569,028 | 16,610 | ||||||
Liberty Ventures, Ser A* | 97,716 | 4,105 | ||||||
LKQ* | 13,165 | 336 | ||||||
Lowe’s | 45,020 | 3,349 | ||||||
Macy’s | 86,900 | 5,641 | ||||||
Magna International, Cl A | 73,164 | 3,926 | ||||||
Marriott International, Cl A | 11 | 1 | ||||||
McDonald’s | 6,294 | 613 | ||||||
| Description | Shares | Market Value ($ Thousands) | ||||||
MGM Mirage*(A) | 33,662 | $ | 708 | |||||
Murphy USA* | 24,225 | 1,753 | ||||||
New Remy Holdco* | 3,810 | 85 | ||||||
Newell Rubbermaid, Cl B | 63,977 | 2,499 | ||||||
News, Cl A* | 48,686 | 780 | ||||||
Nike, Cl B | 236,598 | 23,738 | ||||||
Nordstrom | 117,714 | 9,455 | ||||||
Omnicom Group | 3,479 | 271 | ||||||
priceline.com* | 13,299 | 15,482 | ||||||
Ralph Lauren, Cl A | 900 | 118 | ||||||
Royal Caribbean Cruises | 3,900 | 319 | ||||||
Sally Beauty Holdings* | 160,101 | 5,503 | ||||||
Signet Jewelers | 40,637 | 5,640 | ||||||
Sirius XM Holdings* | 19,560 | 75 | ||||||
Staples | 179,552 | 2,924 | ||||||
Starbucks | 139,397 | 13,201 | ||||||
Starwood Hotels & Resorts Worldwide | 4,743 | 396 | ||||||
Target, Cl A | 21,414 | 1,757 | ||||||
Tempur-Pedic International* | 21,091 | 1,218 | ||||||
Tesla Motors*(A) | 10,289 | 1,942 | ||||||
Time | 5,248 | 118 | ||||||
Time Warner | 41,985 | 3,545 | ||||||
Time Warner Cable, Cl A | 74,382 | 11,148 | ||||||
TJX | 4,954 | 347 | ||||||
TripAdvisor* | 288,776 | 24,017 | ||||||
TRW Automotive Holdings* | 16,424 | 1,722 | ||||||
Tupperware Brands | 5,517 | 381 | ||||||
Twenty-First Century Fox, Cl A | 114,501 | 3,875 | ||||||
Twenty-First Century Fox, Cl B | 177,000 | 5,820 | ||||||
Under Armour, Cl A*(A) | 66,082 | 5,336 | ||||||
Urban Outfitters* | 763 | 35 | ||||||
VF | 4,748 | 358 | ||||||
Viacom, Cl B | 72,803 | 4,973 | ||||||
Vista Outdoor* | 25,714 | 1,101 | ||||||
Walt Disney | 114,940 | 12,056 | ||||||
Whirlpool | 68,064 | 13,753 | ||||||
Wyndham Worldwide | 55,235 | 4,997 | ||||||
Yum! Brands | 29,668 | 2,335 | ||||||
|
| |||||||
| 437,686 | ||||||||
|
| |||||||
Consumer Staples — 8.6% | ||||||||
Altria Group | 89,960 | 4,500 | ||||||
Anheuser-Busch InBev ADR | 132,920 | 16,204 | ||||||
Archer-Daniels-Midland | 240,966 | 11,422 | ||||||
Brown-Forman, Cl B | 19,493 | 1,761 | ||||||
Bunge | 22,852 | 1,882 | ||||||
Church & Dwight | 11,874 | 1,014 | ||||||
Clorox | 832 | 92 | ||||||
Coca-Cola | 84,125 | 3,411 | ||||||
Coca-Cola Enterprises | 20,024 | 885 | ||||||
Colgate-Palmolive | 6,566 | 455 | ||||||
ConAgra Foods | 49,133 | 1,795 | ||||||
Constellation Brands, Cl A* | 10,975 | 1,276 | ||||||
Costco Wholesale | 190,219 | 28,817 | ||||||
CVS Health | 260,343 | 26,870 | ||||||
Dr Pepper Snapple Group | 25,908 | 2,033 | ||||||
Estee Lauder, Cl A | 164,034 | 13,641 | ||||||
Herbalife (A) | 10,600 | 453 | ||||||
Hershey | 47,876 | 4,831 | ||||||
| 1 | SEI Institutional Managed Trust / Semi-Annual Report / March 31, 2015 |
SCHEDULE OF INVESTMENTS (Unaudited)
Tax-Managed Large Cap Fund
March 31, 2015
| Description | Shares | Market Value ($ Thousands) | ||||||
Ingredion | 22,400 | $ | 1,743 | |||||
Keurig Green Mountain | 11,520 | 1,287 | ||||||
Kimberly-Clark | 41,873 | 4,485 | ||||||
Kraft Foods | 13,143 | 1,145 | ||||||
Kroger | 265,496 | 20,353 | ||||||
Lorillard | 96,988 | 6,338 | ||||||
Mead Johnson Nutrition, Cl A | 211,348 | 21,247 | ||||||
Mondelez International, Cl A | 244,723 | 8,832 | ||||||
PepsiCo | 3,825 | 366 | ||||||
Philip Morris International | 142,499 | 10,734 | ||||||
Procter & Gamble | 155,374 | 12,732 | ||||||
Reynolds American | 93,279 | 6,428 | ||||||
SYSCO, Cl A | 6,029 | 227 | ||||||
Tyson Foods, Cl A | 381,578 | 14,615 | ||||||
Walgreens Boots Alliance | 299,929 | 25,398 | ||||||
Wal-Mart Stores | 168,480 | 13,858 | ||||||
WhiteWave Foods, Cl A* | 17,791 | 789 | ||||||
Whole Foods Market | 305,323 | 15,901 | ||||||
|
| |||||||
| 287,820 | ||||||||
|
| |||||||
Energy — 7.0% |
| |||||||
Apache | 5,272 | 318 | ||||||
Atwood Oceanics, Cl A | 36,063 | 1,014 | ||||||
Cameron International* | 613 | 28 | ||||||
Cheniere Energy* | 15,424 | 1,194 | ||||||
Chevron | 232,209 | 24,377 | ||||||
Cimarex Energy | 5,805 | 668 | ||||||
ConocoPhillips | 224,019 | 13,947 | ||||||
Continental Resources, Cl A* | 31,358 | 1,369 | ||||||
Devon Energy | 6,790 | 410 | ||||||
Dresser-Rand Group* | 12,943 | 1,040 | ||||||
Dril-Quip* | 31,838 | 2,177 | ||||||
Energen | 750 | 50 | ||||||
EOG Resources | 220,434 | 20,212 | ||||||
EP Energy, Cl A* (A) | 133,869 | 1,403 | ||||||
EQT | 2,100 | 174 | ||||||
Exxon Mobil | 284,425 | 24,176 | ||||||
FMC Technologies* | 82,474 | 3,052 | ||||||
Halliburton | 150,136 | 6,588 | ||||||
Hess | 55,294 | 3,753 | ||||||
Kinder Morgan | 312,177 | 13,130 | ||||||
Kosmos Energy* | 137,174 | 1,085 | ||||||
Marathon Oil | 114,459 | 2,989 | ||||||
Marathon Petroleum | 136,931 | 14,020 | ||||||
MarkWest Energy Partners | 128,658 | 8,504 | ||||||
Murphy Oil | 21,532 | 1,003 | ||||||
Nabors Industries | 96,525 | 1,318 | ||||||
National Oilwell Varco, Cl A | 8,071 | 403 | ||||||
Newfield Exploration* | 108,529 | 3,808 | ||||||
Noble Energy | 6,933 | 339 | ||||||
Noble PLC (A) | 128,128 | 1,830 | ||||||
Oil States International* | 139,430 | 5,545 | ||||||
Patterson-UTI Energy | 103,178 | 1,937 | ||||||
PBF Energy, Cl A | 12,274 | 416 | ||||||
Phillips 66 | 157,249 | 12,360 | ||||||
Pioneer Natural Resources | 2,401 | 393 | ||||||
QEP Resources | 51,627 | 1,076 | ||||||
Schlumberger, Cl A | 189,164 | 15,784 | ||||||
Seadrill | 134,097 | 1,254 | ||||||
SM Energy | 131,965 | 6,820 | ||||||
Tesoro | 31,268 | 2,854 | ||||||
Valero Energy | 277,986 | 17,686 | ||||||
Western Refining | 29,977 | 1,481 | ||||||
Williams | 178,593 | 9,035 | ||||||
| Description | Shares | Market Value ($ Thousands) | ||||||
World Fuel Services | 42,810 | $ | 2,461 | |||||
|
| |||||||
| 233,481 | ||||||||
|
| |||||||
Financials — 14.5% |
| |||||||
ACE | 32,344 | 3,606 | ||||||
Aflac | 68,072 | 4,357 | ||||||
Allied World Assurance Holdings | 112,032 | 4,526 | ||||||
Allstate | 59,438 | 4,230 | ||||||
American Capital* | 110,000 | 1,627 | ||||||
American Express | 6,330 | 495 | ||||||
American Financial Group | 39,790 | 2,552 | ||||||
American International Group | 531,198 | 29,104 | ||||||
American Tower, Cl A† | 49,283 | 4,640 | ||||||
Ameriprise Financial | 82,444 | 10,787 | ||||||
Aon | 17,008 | 1,635 | ||||||
Arch Capital Group* | 6,051 | 373 | ||||||
Arthur J. Gallagher | 11,453 | 535 | ||||||
Associated Banc-Corp | 21,133 | 393 | ||||||
Assurant | 132,522 | 8,138 | ||||||
AvalonBay Communities† | 1,788 | 312 | ||||||
Axis Capital Holdings | 113,203 | 5,839 | ||||||
Bank of America | 737,209 | 11,346 | ||||||
Bank of New York Mellon | 51,336 | 2,066 | ||||||
BB&T | 21,661 | 845 | ||||||
Berkshire Hathaway, Cl B* | 43,666 | 6,302 | ||||||
BlackRock | 2,401 | 878 | ||||||
Boston Properties† | 4,827 | 678 | ||||||
Brandywine Realty Trust† | 101,137 | 1,616 | ||||||
Capital One Financial | 188,167 | 14,831 | ||||||
CBL & Associates Properties† | 28,663 | 568 | ||||||
CBRE Group, Cl A* | 126,394 | 4,893 | ||||||
Charles Schwab | 508,727 | 15,486 | ||||||
Chimera Investment† | 314,466 | 987 | ||||||
Chubb | 129,966 | 13,140 | ||||||
Citigroup | 607,013 | 31,273 | ||||||
CME Group | 87,815 | 8,317 | ||||||
Crown Castle International† | 321,932 | 26,572 | ||||||
Digital Realty Trust, Cl A† | 1,300 | 86 | ||||||
Discover Financial Services | 300,119 | 16,912 | ||||||
E*Trade Financial* | 109,253 | 3,120 | ||||||
Equity Residential† | 13,138 | 1,023 | ||||||
Everest Re Group | 60,718 | 10,565 | ||||||
Fifth Third Bancorp | 478,279 | 9,016 | ||||||
FNF Group | 8,706 | 320 | ||||||
FNFV Group* | 21,311 | 300 | ||||||
Franklin Resources | 5,770 | 296 | ||||||
Gaming and Leisure Properties† | 34,735 | 1,281 | ||||||
General Growth Properties† | 22,472 | 664 | ||||||
Goldman Sachs Group | 29,481 | 5,541 | ||||||
Hartford Financial Services Group | 101,910 | 4,262 | ||||||
Health Care† | 5,009 | 388 | ||||||
Hospitality Properties Trust | 55,114 | 1,818 | ||||||
Host Hotels & Resorts† | 15,849 | 320 | ||||||
Huntington Bancshares | 321,477 | 3,552 | ||||||
IntercontinentalExchange Group | 50,070 | 11,680 | ||||||
JPMorgan Chase | 544,019 | 32,957 | ||||||
KeyCorp | 816,571 | 11,563 | ||||||
Kimco Realty† | 15,742 | 423 | ||||||
Lincoln National | 182,558 | 10,490 | ||||||
Macerich† | 5,647 | 476 | ||||||
| 2 | SEI Institutional Managed Trust / Semi-Annual Report / March 31, 2015 |
SCHEDULE OF INVESTMENTS (Unaudited)
Tax-Managed Large Cap Fund
March 31, 2015
| Description | Shares | Market Value ($ Thousands) | ||||||
McGraw-Hill | 110,000 | $ | 11,374 | |||||
MetLife | 56,878 | 2,875 | ||||||
Moody’s | 10,667 | 1,107 | ||||||
Morgan Stanley | 24,877 | 888 | ||||||
Navient | 76,532 | 1,556 | ||||||
PartnerRe | 84,412 | 9,651 | ||||||
People’s United Financial | 23,725 | 360 | ||||||
PNC Financial Services Group | 130,957 | 12,210 | ||||||
Popular* | 44,819 | 1,541 | ||||||
Progressive | 309,125 | 8,408 | ||||||
ProLogis† | 14,709 | 641 | ||||||
Prudential Financial | 44,724 | 3,592 | ||||||
Public Storage† | 4,106 | 809 | ||||||
Radian Group (A) | 172,593 | 2,898 | ||||||
Raymond James Financial | 4,992 | 283 | ||||||
Regions Financial | 507,300 | 4,794 | ||||||
Reinsurance Group of America, Cl A | 80,696 | 7,520 | ||||||
RenaissanceRe Holdings | 16,714 | 1,667 | ||||||
RLJ Lodging Trust† | 38,000 | 1,190 | ||||||
Simon Property Group† | 20,571 | 4,025 | ||||||
SLM | 76,532 | 710 | ||||||
Spirit Realty Capital† | 131,075 | 1,583 | ||||||
State Street | 40,538 | 2,981 | ||||||
SunTrust Banks | 16,281 | 669 | ||||||
Torchmark, Cl A | 17,535 | 963 | ||||||
Travelers | 120,419 | 13,021 | ||||||
Unum Group | 110,928 | 3,742 | ||||||
Urban Edge Properties† | 2,667 | 63 | ||||||
US Bancorp | 65,779 | 2,873 | ||||||
Validus Holdings | 28,272 | 1,190 | ||||||
Ventas† | 7,372 | 538 | ||||||
Vornado Realty Trust† | 5,334 | 597 | ||||||
Voya Financial | 39,187 | 1,689 | ||||||
Wells Fargo | 525,725 | 28,599 | ||||||
Weyerhaeuser† | 17,503 | 580 | ||||||
WP GLIMCHER† | 3,361 | 56 | ||||||
|
| |||||||
| 487,243 | ||||||||
|
| |||||||
Health Care — 16.4% | ||||||||
Abbott Laboratories | 99,343 | 4,602 | ||||||
AbbVie | 157,679 | 9,230 | ||||||
Actavis* | 109,461 | 32,578 | ||||||
Aetna, Cl A | 102,433 | 10,912 | ||||||
Agilent Technologies | 5,250 | 218 | ||||||
Alexion Pharmaceuticals* | 45,693 | 7,919 | ||||||
AmerisourceBergen | 88,988 | 10,115 | ||||||
Amgen, Cl A | 120,417 | 19,249 | ||||||
Anthem | 143,581 | 22,170 | ||||||
Ariad Pharmaceuticals* (A) | 428,752 | 3,533 | ||||||
Baxter International | 36,801 | 2,521 | ||||||
Becton Dickinson | 2,360 | 339 | ||||||
Biogen* | 64,586 | 27,271 | ||||||
Bristol-Myers Squibb | 348,022 | 22,447 | ||||||
Cardinal Health | 108,112 | 9,759 | ||||||
Celgene, Cl A* | 336,014 | 38,736 | ||||||
Cerner* (A) | 4,400 | 322 | ||||||
Cigna | 68,071 | 8,811 | ||||||
Community Health Systems* | 39,000 | 2,039 | ||||||
DaVita HealthCare Partners* | 134,537 | 10,935 | ||||||
Edwards Lifesciences, Cl A* | 1,400 | 199 | ||||||
Eli Lilly | 51,961 | 3,775 | ||||||
| Description | Shares | Market Value ($ Thousands) | ||||||
Endo International* | 29,070 | $ | 2,608 | |||||
Express Scripts Holding* | 351,850 | 30,530 | ||||||
Gilead Sciences* | 190,489 | 18,693 | ||||||
Halyard Health* | 5,234 | 258 | ||||||
HCA Holdings* | 91,112 | 6,854 | ||||||
Health Net, Cl A* | 45,095 | 2,728 | ||||||
Henry Schein* | 1,000 | 140 | ||||||
Hill-Rom Holdings | 14,983 | 734 | ||||||
Humana | 172,261 | 30,666 | ||||||
Idexx Laboratories* | 36,178 | 5,589 | ||||||
Illumina* | 3,684 | 684 | ||||||
Intuitive Surgical* | 21,265 | 10,739 | ||||||
Jazz Pharmaceuticals* | 30,220 | 5,222 | ||||||
Johnson & Johnson | 181,443 | 18,253 | ||||||
Laboratory Corp of America Holdings* | 24,965 | 3,148 | ||||||
Mallinckrodt* | 24,625 | 3,119 | ||||||
McKesson | 63,426 | 14,347 | ||||||
Medivation* | 8,573 | 1,106 | ||||||
Medtronic | 180,050 | 14,042 | ||||||
Merck | 178,638 | 10,268 | ||||||
Novo Nordisk ADR | 197,370 | 10,538 | ||||||
Omnicare | 95,994 | 7,397 | ||||||
Patterson | 2,100 | 103 | ||||||
Perrigo | 34,098 | 5,645 | ||||||
Pfizer | 803,311 | 27,947 | ||||||
Premier, Cl A* | 9,031 | 340 | ||||||
Regeneron Pharmaceuticals* | 4,677 | 2,111 | ||||||
Salix Pharmaceuticals* | 4,958 | 857 | ||||||
Shire ADR | 84,071 | 20,117 | ||||||
St. Jude Medical | 64,996 | 4,251 | ||||||
Teva Pharmaceutical Industries ADR | 134,697 | 8,392 | ||||||
United Therapeutics* | 85,645 | 14,768 | ||||||
UnitedHealth Group | 4,280 | 506 | ||||||
Valeant Pharmaceuticals International* | 73,617 | 14,622 | ||||||
Vertex Pharmaceuticals* | 7,611 | 898 | ||||||
Waters* | 1,600 | 199 | ||||||
Zimmer Holdings | 37,448 | 4,401 | ||||||
|
| |||||||
| 550,500 | ||||||||
|
| |||||||
Industrials — 8.0% | ||||||||
ADT, Cl A (A) | 1,662 | 69 | ||||||
Aecom Technology* | 36,400 | 1,122 | ||||||
AGCO (A) | 52,600 | 2,506 | ||||||
Alaska Air Group | 181,446 | 12,008 | ||||||
Allegion | 3,048 | 187 | ||||||
American Airlines Group | 22,471 | 1,186 | ||||||
Avis Budget Group* | 64,459 | 3,804 | ||||||
Babcock & Wilcox | 37,080 | 1,190 | ||||||
Boeing | 12,550 | 1,883 | ||||||
C.H. Robinson Worldwide | 2,502 | 183 | ||||||
Canadian Pacific Railway | 116,068 | 21,206 | ||||||
Carlisle | 1,500 | 139 | ||||||
Caterpillar, Cl A | 16,328 | 1,307 | ||||||
Copa Holdings, Cl A | 2,992 | 302 | ||||||
CSX | 10,047 | 333 | ||||||
Cummins | 13,061 | 1,811 | ||||||
Danaher, Cl A | 125,204 | 10,630 | ||||||
Deere | 26,437 | 2,318 | ||||||
Delta Air Lines, Cl A | 265,596 | 11,941 | ||||||
Donaldson, Cl A (A) | 3,800 | 143 | ||||||
| 3 | SEI Institutional Managed Trust / Semi-Annual Report / March 31, 2015 |
SCHEDULE OF INVESTMENTS (Unaudited)
Tax-Managed Large Cap Fund
March 31, 2015
| Description | Shares | Market Value ($ Thousands) | ||||||
Dover | 3,105 | $ | 215 | |||||
Dun & Bradstreet | 21,406 | 2,748 | ||||||
Eaton | 3,913 | 266 | ||||||
Emerson Electric | 4,998 | 283 | ||||||
Engility Holdings | 13,582 | 408 | ||||||
Equifax | 2,500 | 232 | ||||||
Expeditors International of Washington | 1,343 | 65 | ||||||
Fastenal, Cl A | 31,389 | 1,300 | ||||||
FedEx | 73,794 | 12,209 | ||||||
Fluor | 34,681 | 1,982 | ||||||
Fortune Brands Home & Security | 1,837 | 87 | ||||||
General Dynamics | 19,797 | 2,687 | ||||||
General Electric | 224,840 | 5,578 | ||||||
Hertz Global Holdings* | 4,200 | 91 | ||||||
Honeywell International | 4,905 | 512 | ||||||
Huntington Ingalls Industries, Cl A | 63,273 | 8,868 | ||||||
Illinois Tool Works | 3,529 | 343 | ||||||
Ingersoll-Rand | 9,146 | 623 | ||||||
ITT | 12,586 | 502 | ||||||
Jacobs Engineering Group* | 17,906 | 809 | ||||||
Kansas City Southern | 85,377 | 8,715 | ||||||
L-3 Communications Holdings | 67,566 | 8,499 | ||||||
Lincoln Electric Holdings | 16,823 | 1,100 | ||||||
Lockheed Martin | 35,370 | 7,179 | ||||||
Manitowoc | 4,100 | 88 | ||||||
ManpowerGroup | 18,167 | 1,565 | ||||||
Navistar International* (A) | 9,626 | 284 | ||||||
Nielsen | 67,500 | 3,009 | ||||||
Norfolk Southern | 26,000 | 2,676 | ||||||
Northrop Grumman | 156,994 | 25,270 | ||||||
Orbital ATK | 12,857 | 985 | ||||||
Oshkosh Truck | 98,940 | 4,827 | ||||||
Pall | 109,286 | 10,971 | ||||||
Parker-Hannifin, Cl A | 18,236 | 2,166 | ||||||
Pentair | 27,867 | 1,752 | ||||||
Precision Castparts | 5,500 | 1,155 | ||||||
Quanta Services* | 1,386 | 39 | ||||||
Raytheon | 135,818 | 14,838 | ||||||
Republic Services | 2,031 | 82 | ||||||
Robert Half International | 2,900 | 176 | ||||||
Roper Industries | 60,847 | 10,466 | ||||||
RR Donnelley & Sons | 93,388 | 1,792 | ||||||
Southwest Airlines, Cl A | 350,305 | 15,519 | ||||||
Stericycle, Cl A* | 80,668 | 11,328 | ||||||
Textron | 5,200 | 230 | ||||||
Timken | 24,553 | 1,035 | ||||||
Towers Watson, Cl A | 4,588 | 606 | ||||||
Union Pacific | 86,966 | 9,419 | ||||||
United Continental Holdings* | 41,749 | 2,808 | ||||||
United Parcel Service, Cl B | 4,585 | 445 | ||||||
United Rentals* | 7,390 | 674 | ||||||
United Technologies | 17,341 | 2,032 | ||||||
Vectrus* | 22,388 | 571 | ||||||
Veritiv* | 591 | 26 | ||||||
Waste Management | 18,232 | 989 | ||||||
WW Grainger | 762 | 180 | ||||||
|
| |||||||
| 267,572 | ||||||||
|
| |||||||
Information Technology — 20.7% |
| |||||||
Accenture, Cl A | 117,395 | 10,999 | ||||||
| Description | Shares | Market Value ($ Thousands) | ||||||
Activision Blizzard | 17,055 | $ | 388 | |||||
Adobe Systems* | 506,682 | 37,464 | ||||||
Akamai Technologies* | 12,058 | 857 | ||||||
Alliance Data Systems* | 22,877 | 6,777 | ||||||
Altera | 16,400 | 704 | ||||||
Amdocs | 149,815 | 8,150 | ||||||
Amphenol, Cl A | 195,242 | 11,506 | ||||||
Analog Devices | 42,023 | 2,647 | ||||||
Ansys* | 62,424 | 5,505 | ||||||
Apple | 371,259 | 46,196 | ||||||
Applied Materials | 1,075,100 | 24,254 | ||||||
Atmel | 156,217 | 1,286 | ||||||
Autodesk, Cl A* | 31,671 | 1,857 | ||||||
Avnet | 36,856 | 1,640 | ||||||
Baidu ADR* | 54,500 | 11,358 | ||||||
Blackhawk Network Holdings, Cl B* | 17,735 | 631 | ||||||
Broadcom, Cl A | 61,995 | 2,684 | ||||||
Brocade Communications Systems | 306,466 | 3,636 | ||||||
CA | 17,197 | 561 | ||||||
Cisco Systems | 544,747 | 14,994 | ||||||
Citrix Systems* | 23,629 | 1,509 | ||||||
Cognizant Technology Solutions, Cl A* | 266,853 | 16,649 | ||||||
Computer Sciences | 28,981 | 1,892 | ||||||
CoreLogic* | 9,831 | 347 | ||||||
Corning, Cl B | 215,764 | 4,893 | ||||||
DST Systems | 11,635 | 1,288 | ||||||
eBay* | 379,498 | 21,889 | ||||||
Electronic Arts* | 211,523 | 12,441 | ||||||
EMC | 232,384 | 5,940 | ||||||
Equinix† | 49,574 | 11,543 | ||||||
F5 Networks, Cl A* | 17,041 | 1,959 | ||||||
Facebook, Cl A* | 209,203 | 17,200 | ||||||
Fidelity National Information Services, Cl B | 64,209 | 4,370 | ||||||
Fiserv, Cl A* | 42,046 | 3,338 | ||||||
FleetCor Technologies* | 19,160 | 2,892 | ||||||
Freescale Semiconductor* | 174,002 | 7,092 | ||||||
Genpact* | 184,547 | 4,291 | ||||||
Global Payments | 17,235 | 1,580 | ||||||
Google, Cl A* | 43,087 | 23,900 | ||||||
Google, Cl C* | 30,812 | 16,885 | ||||||
Harris | 25,220 | 1,986 | ||||||
Hewlett-Packard | 215,578 | 6,717 | ||||||
Ingram Micro, Cl A* | 92,405 | 2,321 | ||||||
Intel | 258,431 | 8,081 | ||||||
International Business Machines | 20,181 | 3,239 | ||||||
Intuit | 156,005 | 15,126 | ||||||
Jabil Circuit | 47,326 | 1,106 | ||||||
Juniper Networks | 10,346 | 234 | ||||||
Keysight Technologies* | 2,625 | 98 | ||||||
Knowles* (A) | 1,552 | 30 | ||||||
Lam Research | 4,787 | 336 | ||||||
Leidos Holdings | 11,079 | 465 | ||||||
Lexmark International, Cl A | 23,673 | 1,002 | ||||||
Marvell Technology Group | 349,312 | 5,135 | ||||||
MasterCard, Cl A | 505,598 | 43,679 | ||||||
Microchip Technology (A) | 1,219 | 60 | ||||||
Micron Technology* | 211,630 | 5,742 | ||||||
Microsoft | 933,147 | 37,937 | ||||||
| 4 | SEI Institutional Managed Trust / Semi-Annual Report / March 31, 2015 |
SCHEDULE OF INVESTMENTS (Unaudited)
Tax-Managed Large Cap Fund
March 31, 2015
| Description | Shares | Market Value ($ Thousands) | ||||||
National Instruments | 70,199 | $ | 2,249 | |||||
NetApp | 7,296 | 259 | ||||||
NXP Semiconductors* | 86,962 | 8,727 | ||||||
Oracle, Cl B | 382,668 | 16,512 | ||||||
Qualcomm | 534,150 | 37,038 | ||||||
Rackspace Hosting* | 18,353 | 947 | ||||||
Red Hat* | 1,214 | 92 | ||||||
Rovi* | 33,373 | 608 | ||||||
Salesforce.com* | 162,152 | 10,833 | ||||||
SanDisk (A) | 64,021 | 4,073 | ||||||
Science Applications International | 15,900 | 816 | ||||||
Seagate Technology | 94,758 | 4,930 | ||||||
Skyworks Solutions | 63,738 | 6,265 | ||||||
Symantec, Cl A | 139,365 | 3,256 | ||||||
TE Connectivity | 36,055 | 2,582 | ||||||
Tech Data* | 22,300 | 1,288 | ||||||
Teradata* (A) | 63,400 | 2,799 | ||||||
Texas Instruments | 269,748 | 15,426 | ||||||
Total System Services | 13,564 | 517 | ||||||
VeriFone Holdings* | 138,073 | 4,817 | ||||||
VeriSign* (A) | 91,384 | 6,120 | ||||||
Visa, Cl A (A) | 556,476 | 36,399 | ||||||
Vishay Intertechnology (A) | 88,686 | 1,226 | ||||||
Western Digital | 230,097 | 20,941 | ||||||
Xerox | 527,667 | 6,781 | ||||||
Yahoo!* | 155,857 | 6,926 | ||||||
Yelp, Cl A* (A) | 78,657 | 3,724 | ||||||
|
| |||||||
| 695,437 | ||||||||
|
| |||||||
Materials — 2.7% |
| |||||||
Air Products & Chemicals | 20,000 | 3,026 | ||||||
Avery Dennison | 11,196 | 592 | ||||||
Cabot | 18,468 | 831 | ||||||
CF Industries Holdings | 21,896 | 6,212 | ||||||
Domtar | 28,000 | 1,294 | ||||||
Dow Chemical, Cl A | 265,094 | 12,719 | ||||||
E.I. Du Pont de Nemours | 5,201 | 372 | ||||||
Eastman Chemical | 34,295 | 2,375 | ||||||
Ecolab | 81,810 | 9,357 | ||||||
Freeport-McMoRan, Cl B | 91,990 | 1,743 | ||||||
Huntsman | 130,787 | 2,900 | ||||||
International Paper | 30,956 | 1,718 | ||||||
LyondellBasell Industries, Cl A | 180,507 | 15,849 | ||||||
Martin Marietta Materials, Cl A | 550 | 77 | ||||||
Monsanto | 35,004 | 3,939 | ||||||
Newmont Mining | 4,000 | 87 | ||||||
Owens-Illinois* | 29,088 | 678 | ||||||
Packaging Corp of America | 58,377 | 4,565 | ||||||
PPG Industries | 19,537 | 4,406 | ||||||
Praxair | 2,548 | 308 | ||||||
Rock-Tenn, Cl A | 26,000 | 1,677 | ||||||
Sherwin-Williams, Cl A | 3,368 | 958 | ||||||
Sigma-Aldrich | 2,200 | 304 | ||||||
Steel Dynamics | 94,148 | 1,892 | ||||||
Syngenta ADR | 53,000 | 3,594 | ||||||
TimkenSteel | 12,276 | 325 | ||||||
United States Steel (A) | 209,378 | 5,109 | ||||||
Vulcan Materials | 1,097 | 92 | ||||||
Westlake Chemical | 24,674 | 1,775 | ||||||
|
| |||||||
| 88,774 | ||||||||
|
| |||||||
| Description | Shares/ Number of Rights | Market Value ($ Thousands) | ||||||
Telecommunication Services — 0.6% |
| |||||||
AT&T | 265,343 | $ | 8,664 | |||||
CenturyTel | 9,061 | 313 | ||||||
Level 3 Communications* | 77,625 | 4,179 | ||||||
SBA Communications, Cl A* | 19,500 | 2,283 | ||||||
T-Mobile US* | 1,671 | 53 | ||||||
Verizon Communications | 97,068 | 4,720 | ||||||
|
| |||||||
| 20,212 | ||||||||
|
| |||||||
Utilities — 2.3% |
| |||||||
AES | 246,798 | 3,171 | ||||||
Ameren | 113,300 | 4,781 | ||||||
American Electric Power | 260,203 | 14,636 | ||||||
American Water Works | 5,896 | 320 | ||||||
Calpine* | 248,228 | 5,677 | ||||||
Centerpoint Energy | 4,900 | 100 | ||||||
CMS Energy | 7,966 | 278 | ||||||
Dominion Resources | 23,292 | 1,651 | ||||||
DTE Energy | 45,523 | 3,673 | ||||||
Duke Energy | 7,375 | 566 | ||||||
Edison International | 234,583 | 14,654 | ||||||
Entergy | 92,753 | 7,188 | ||||||
Exelon | 85,088 | 2,860 | ||||||
Hawaiian Electric Industries | 3,200 | 103 | ||||||
MDU Resources Group | 2,200 | 47 | ||||||
National Fuel Gas | 1,300 | 78 | ||||||
NextEra Energy | 4,538 | 472 | ||||||
NRG Energy | 110,000 | 2,771 | ||||||
OGE Energy | 5,224 | 165 | ||||||
PG&E | 6,066 | 322 | ||||||
PNM Resources | 43,000 | 1,256 | ||||||
Public Service Enterprise Group | 213,330 | 8,943 | ||||||
Sempra Energy | 1,517 | 165 | ||||||
UGI | 1,065 | 35 | ||||||
Vectren | 34,000 | 1,501 | ||||||
|
| |||||||
| 75,413 | ||||||||
|
| |||||||
Total Common Stock | 3,144,138 | |||||||
|
| |||||||
RIGHTS — 0.0% | ||||||||
Safeway CVR - Casa Ley* | 107,954 | 110 | ||||||
Safeway CVR - PDC* | 107,954 | 5 | ||||||
|
| |||||||
Total Rights | 115 | |||||||
|
| |||||||
AFFILIATED PARTNERSHIP — 1.5% |
| |||||||
SEI Liquidity Fund, L.P. | 49,579,515 | 49,580 | ||||||
|
| |||||||
Total Affiliated Partnership | 49,580 | |||||||
|
| |||||||
CASH EQUIVALENT — 5.8% |
| |||||||
SEI Daily Income Trust, | 194,469,779 | 194,470 | ||||||
|
| |||||||
Total Cash Equivalent | 194,470 | |||||||
|
| |||||||
| 5 | SEI Institutional Managed Trust / Semi-Annual Report / March 31, 2015 |
SCHEDULE OF INVESTMENTS (Unaudited)
Tax-Managed Large Cap Fund
March 31, 2015
| Description | Face Amount ($ Thousands) | Market Value ($ Thousands) | ||||||
U.S. TREASURY OBLIGATIONS (C) (D) — 0.2% |
| |||||||
U.S. Treasury Bills | $ | 7,802 | $ | 7,801 | ||||
|
| |||||||
Total U.S. Treasury Obligations | 7,801 | |||||||
|
| |||||||
Total Investments — 101.3% | $ | 3,396,104 | ||||||
|
| |||||||
A list of the open futures contracts held by the Fund at March 31, 2015, is as follows:
| Type of Contract | Number of Contracts Long | Expiration Date | Unrealized Appreciation ($ Thousands) | |||||||||
S&P 500 Index EMINI | 882 | Jun-2015 | $ | 1,082 | ||||||||
S&P Mid 400 Index EMINI | 80 | Jun-2015 | 298 | |||||||||
|
| |||||||||||
| $ | 1,380 | |||||||||||
|
| |||||||||||
For the period ended March 31, 2015, the total amount of all open futures contracts, as presented in the table above, are representative of the volume of activity for this derivative type during the period.
Percentages are based on Net Assets of $3,353,844 ($Thousands).
| * | Non-income producing security. |
| ** | Rate shown is the 7-day effective yield as of March 31, 2015. |
| † | Real Estate Investment Trust. |
| †† | Investment in Affiliated Security (see Note 6). |
| (A) | This security or a partial position of this security is on loan at March 31, 2015 (see Note 10). The total market value of securities on loan at March 31, 2015 was $48,147 ($ Thousands) |
| (B) | This security was purchased with cash collateral held from securities on loan (see Note 10). The total value of such securities as of March 31, 2015 was $49,580 ($ Thousands). |
| (C) | The rate reported is the effective yield at the time of purchase. |
| (D) | Security, or portion thereof, has been pledged as collateral on open futures contracts. |
ADR — American Depositary Receipt
Cl — Class
L.P. — Limited Partnership
PLC — Public Limited Company
S&P — Standard & Poor’s
Ser — Series
The following is a summary of the inputs used as of March 31, 2015, in valuing the Fund’s investments carried at value ($ Thousands):
| Investments in Securities | Level 1 | Level 2 | Level 3 | Total | ||||||||||||
Common Stock | $ | 3,144,138 | $ | — | $ | — | $ | 3,144,138 | ||||||||
Rights | — | 115 | — | 115 | ||||||||||||
Affiliated Partnership | — | 49,580 | — | 49,580 | ||||||||||||
Cash Equivalent | 194,470 | — | — | 194,470 | ||||||||||||
U.S. Treasury Obligations | — | 7,801 | — | 7,801 | ||||||||||||
|
|
|
|
|
|
|
| |||||||||
Total Investments in Securities | $ | 3,338,608 | $ | 57,496 | $ | — | $ | 3,396,104 | ||||||||
|
|
|
|
|
|
|
| |||||||||
| Other Financial Instruments | Level 1 | Level 2 | Level 3 | Total | ||||||||||||
Futures Contracts* | ||||||||||||||||
Unrealized Appreciation | $ | 1,380 | $ | — | $ | — | $ | 1,380 | ||||||||
|
|
|
|
|
|
|
| |||||||||
Total Other Financial Instruments | $ | 1,380 | $ | — | $ | — | $ | 1,380 | ||||||||
|
|
|
|
|
|
|
| |||||||||
| * | Futures contracts are valued at the unrealized appreciation on the instrument. |
For the period ended March 31, 2015, there have been no transfers between Level 1 and Level 2 assets and liabilities.
For the period ended March 31, 2015, there have been no transfers between Level 2 and Level 3 assets and liabilities.
For the period March 31, 2015, there were no level 3 investments.
For more information on valuation inputs, see Note 2 — Significant Accounting Policies in Notes to Financial Statements
Amounts designated as “—” are $0 or have been rounded to $0.
The accompanying notes are an integral part of the financial statements.
| 6 | SEI Institutional Managed Trust / Semi-Annual Report / March 31, 2015 |
SCHEDULE OF INVESTMENTS (Unaudited)
S & P 500 Index Fund
March 31, 2015
| Description | Shares | Market Value ($ Thousands) | ||||||
COMMON STOCK — 99.0% | ||||||||
Consumer Discretionary — 12.5% | ||||||||
Amazon.com, Cl A* | 14,304 | $ | 5,322 | |||||
Autonation* | 2,826 | 182 | ||||||
Autozone* | 1,194 | 815 | ||||||
Bed Bath & Beyond* | 6,933 | 532 | ||||||
Best Buy | 10,754 | 406 | ||||||
BorgWarner | 8,400 | 508 | ||||||
Cablevision Systems, Cl A (A) | 8,300 | 152 | ||||||
CarMax* | 7,800 | 538 | ||||||
Carnival | 16,784 | 803 | ||||||
CBS, Cl B | 17,195 | 1,042 | ||||||
Chipotle Mexican Grill, Cl A* | 1,204 | 783 | ||||||
Coach | 10,219 | 424 | ||||||
Comcast, Cl A | 95,448 | 5,390 | ||||||
Darden Restaurants | 4,618 | 320 | ||||||
Delphi Automotive | 10,800 | 861 | ||||||
DIRECTV* | 18,909 | 1,609 | ||||||
Discovery Communications, Cl A* | 5,600 | 172 | ||||||
Discovery Communications, Cl C* | 10,000 | 295 | ||||||
Dollar General | 11,300 | 852 | ||||||
Dollar Tree* | 7,804 | 633 | ||||||
DR Horton | 12,358 | 352 | ||||||
Expedia | 3,655 | 344 | ||||||
Family Dollar Stores | 3,622 | 287 | ||||||
Ford Motor | 148,737 | 2,401 | ||||||
Fossil Group* | 1,700 | 140 | ||||||
GameStop, Cl A (A) | 4,100 | 156 | ||||||
Gannett | 8,547 | 317 | ||||||
Gap | 9,831 | 426 | ||||||
Garmin | 4,505 | 214 | ||||||
General Motors | 50,913 | 1,909 | ||||||
Genuine Parts | 5,736 | 535 | ||||||
Goodyear Tire & Rubber | 9,893 | 268 | ||||||
H&R Block | 10,213 | 327 | ||||||
Hanesbrands | 14,900 | 499 | ||||||
Harley-Davidson, Cl A | 7,808 | 474 | ||||||
Harman International Industries, Cl A | 2,605 | 348 | ||||||
Hasbro (A) | 4,196 | 266 | ||||||
Home Depot | 49,509 | 5,625 | ||||||
Interpublic Group | 15,201 | 336 | ||||||
Johnson Controls | 24,761 | 1,249 | ||||||
Kohl’s | 7,656 | 599 | ||||||
L Brands | 9,227 | 870 | ||||||
Leggett & Platt | 5,159 | 238 | ||||||
Lennar, Cl A | 6,616 | 343 | ||||||
Lowe’s | 36,549 | 2,719 | ||||||
Macy’s | 12,664 | 822 | ||||||
Marriott International, Cl A | 7,856 | 631 | ||||||
Mattel | 12,531 | 286 | ||||||
McDonald’s | 36,083 | 3,516 | ||||||
Michael Kors Holdings* | 7,500 | 493 | ||||||
Mohawk Industries* | 2,300 | 427 | ||||||
NetFlix* | 2,300 | 958 | ||||||
Newell Rubbermaid, Cl B | �� | 10,056 | 393 | |||||
News, Cl A* | 18,475 | 296 | ||||||
Nike, Cl B | 26,297 | 2,639 | ||||||
Nordstrom | 5,207 | 418 | ||||||
Omnicom Group | 9,204 | 718 | ||||||
O’Reilly Automotive* | 3,800 | 822 | ||||||
priceline.com* | 1,984 | 2,310 | ||||||
| Description | Shares | Market Value ($ Thousands) | ||||||
PulteGroup | 12,299 | $ | 273 | |||||
PVH | 3,100 | 330 | ||||||
Ralph Lauren, Cl A | 2,205 | 290 | ||||||
Ross Stores | 7,768 | 818 | ||||||
Royal Caribbean Cruises | 6,100 | 499 | ||||||
Scripps Networks Interactive, Cl A | 3,600 | 247 | ||||||
Staples | 23,736 | 387 | ||||||
Starbucks | 28,167 | 2,667 | ||||||
Starwood Hotels & Resorts Worldwide | 6,535 | 546 | ||||||
Target, Cl A | 23,928 | 1,964 | ||||||
Tiffany | 4,178 | 368 | ||||||
Time Warner | 31,225 | 2,636 | ||||||
Time Warner Cable, Cl A | 10,587 | 1,587 | ||||||
TJX | 25,643 | 1,796 | ||||||
Tractor Supply | 5,200 | 442 | ||||||
TripAdvisor* | 4,155 | 346 | ||||||
Twenty-First Century Fox, Cl A | 68,759 | 2,327 | ||||||
Under Armour, Cl A* | 6,205 | 501 | ||||||
Urban Outfitters* | 3,800 | 173 | ||||||
VF | 12,865 | 969 | ||||||
Viacom, Cl B | 13,601 | 929 | ||||||
Walt Disney | 58,744 | 6,162 | ||||||
Whirlpool | 2,905 | 587 | ||||||
Wyndham Worldwide | 4,502 | 407 | ||||||
Wynn Resorts | 3,000 | 378 | ||||||
Yum! Brands | 16,270 | 1,281 | ||||||
|
| |||||||
| 86,520 | ||||||||
|
| |||||||
Consumer Staples — 9.6% | ||||||||
Altria Group | 73,973 | 3,700 | ||||||
Archer-Daniels-Midland | 23,875 | 1,132 | ||||||
Brown-Forman, Cl B | 5,796 | 524 | ||||||
Campbell Soup | 6,584 | 306 | ||||||
Clorox (A) | 4,942 | 546 | ||||||
Coca-Cola | 147,649 | 5,987 | ||||||
Coca-Cola Enterprises | 8,017 | 354 | ||||||
Colgate-Palmolive | 32,095 | 2,226 | ||||||
ConAgra Foods | 16,065 | 587 | ||||||
Constellation Brands, Cl A* | 6,300 | 732 | ||||||
Costco Wholesale | 16,518 | 2,502 | ||||||
CVS Health | 42,252 | 4,361 | ||||||
Dr Pepper Snapple Group | 7,200 | 565 | ||||||
Estee Lauder, Cl A | 8,300 | 690 | ||||||
General Mills, Cl A | 22,686 | 1,284 | ||||||
Hershey | 5,512 | 556 | ||||||
Hormel Foods | 5,004 | 284 | ||||||
JM Smucker | 3,853 | 446 | ||||||
Kellogg | 9,567 | 631 | ||||||
Keurig Green Mountain | 4,500 | 503 | ||||||
Kimberly-Clark | 13,803 | 1,478 | ||||||
Kraft Foods | 22,108 | 1,926 | ||||||
Kroger | 18,468 | 1,416 | ||||||
Lorillard | 13,532 | 885 | ||||||
McCormick | 4,766 | 368 | ||||||
Mead Johnson Nutrition, Cl A | 7,534 | 757 | ||||||
Molson Coors Brewing, Cl B | 5,951 | 443 | ||||||
Mondelez International, Cl A | 62,020 | 2,238 | ||||||
Monster Beverage* | 5,500 | 761 | ||||||
PepsiCo | 55,707 | 5,327 | ||||||
Philip Morris International | 58,187 | 4,383 | ||||||
Procter & Gamble | 101,431 | 8,311 | ||||||
Reynolds American | 11,480 | 791 | ||||||
SYSCO, Cl A | 22,320 | 842 | ||||||
| 1 | SEI Institutional Managed Trust / Semi-Annual Report / March 31, 2015 |
SCHEDULE OF INVESTMENTS (Unaudited)
S & P 500 Index Fund
March 31, 2015
| Description | Shares | Market Value ($ Thousands) | ||||||
Tyson Foods, Cl A | 10,803 | $ | 414 | |||||
Walgreens Boots Alliance | 32,757 | 2,774 | ||||||
Wal-Mart Stores | 59,361 | 4,883 | ||||||
Whole Foods Market | 13,409 | 698 | ||||||
|
| |||||||
| 66,611 | ||||||||
|
| |||||||
Energy — 7.9% | ||||||||
Anadarko Petroleum, Cl A | 19,085 | 1,580 | ||||||
Apache | 14,200 | 857 | ||||||
Baker Hughes | 16,349 | 1,039 | ||||||
Cabot Oil & Gas | 15,313 | 452 | ||||||
Cameron International* | 7,200 | 325 | ||||||
Chesapeake Energy (A) | 19,222 | 272 | ||||||
Chevron | 70,600 | 7,412 | ||||||
Cimarex Energy | 3,304 | 380 | ||||||
ConocoPhillips | 46,260 | 2,880 | ||||||
Consol Energy | 8,700 | 243 | ||||||
Devon Energy | 14,613 | 881 | ||||||
Diamond Offshore Drilling (A) | 2,500 | 67 | ||||||
Ensco, Cl A | 8,900 | 187 | ||||||
EOG Resources | 20,597 | 1,889 | ||||||
EQT | 5,705 | 473 | ||||||
Exxon Mobil | 157,546 | 13,391 | ||||||
FMC Technologies* | 8,500 | 315 | ||||||
Halliburton | 31,942 | 1,402 | ||||||
Helmerich & Payne | 4,005 | 273 | ||||||
Hess | 9,075 | 616 | ||||||
Kinder Morgan | 64,082 | 2,695 | ||||||
Marathon Oil | 25,056 | 654 | ||||||
Marathon Petroleum | 10,282 | 1,053 | ||||||
Murphy Oil | 6,172 | 288 | ||||||
National Oilwell Varco, Cl A | 15,268 | 763 | ||||||
Newfield Exploration* | 6,100 | 214 | ||||||
Noble Energy | 14,400 | 704 | ||||||
Noble PLC | 9,022 | 129 | ||||||
Occidental Petroleum | 28,964 | 2,114 | ||||||
Oneok | 7,709 | 372 | ||||||
Phillips 66 | 20,475 | 1,609 | ||||||
Pioneer Natural Resources | 5,604 | 916 | ||||||
QEP Resources | 6,013 | 125 | ||||||
Range Resources | 6,100 | 318 | ||||||
Schlumberger, Cl A | 47,960 | 4,002 | ||||||
Southwestern Energy, Cl A* (A) | 14,400 | 334 | ||||||
Spectra Energy | 25,261 | 914 | ||||||
Tesoro | 4,600 | 420 | ||||||
Transocean (A) | 12,900 | 189 | ||||||
Valero Energy | 19,408 | 1,235 | ||||||
Williams | 25,369 | 1,283 | ||||||
|
| |||||||
| 55,265 | ||||||||
|
| |||||||
Financials — 16.0% | ||||||||
ACE | 12,305 | 1,372 | ||||||
Affiliated Managers Group* | 2,100 | 451 | ||||||
Aflac | 16,517 | 1,057 | ||||||
Allstate | 15,659 | 1,114 | ||||||
American Express | 32,928 | 2,572 | ||||||
American International Group | 51,630 | 2,829 | ||||||
American Tower, Cl A† | 15,900 | 1,497 | ||||||
Ameriprise Financial | 6,884 | 901 | ||||||
Aon | 10,529 | 1,012 | ||||||
Apartment Investment & Management, Cl A† | 5,839 | 230 | ||||||
Assurant | 2,605 | 160 | ||||||
AvalonBay Communities† | 5,008 | 873 | ||||||
| Description | Shares | Market Value ($ Thousands) | ||||||
Bank of America | 395,245 | $ | 6,083 | |||||
Bank of New York Mellon | 41,899 | 1,686 | ||||||
BB&T | 27,106 | 1,057 | ||||||
Berkshire Hathaway, Cl B* | 68,469 | 9,881 | ||||||
BlackRock | 4,761 | 1,742 | ||||||
Boston Properties† | 5,700 | 801 | ||||||
Capital One Financial | 20,766 | 1,637 | ||||||
CBRE Group, Cl A* | 10,409 | 403 | ||||||
Charles Schwab | 43,436 | 1,322 | ||||||
Chubb | 8,656 | 875 | ||||||
Cincinnati Financial | 5,483 | 292 | ||||||
Citigroup | 113,951 | 5,871 | ||||||
CME Group | 11,940 | 1,131 | ||||||
Comerica | 6,592 | 297 | ||||||
Crown Castle International† | 12,604 | 1,040 | ||||||
Discover Financial Services | 16,830 | 948 | ||||||
E*Trade Financial* | 10,752 | 307 | ||||||
Equity Residential† | 13,744 | 1,070 | ||||||
Essex Property Trust† | 2,500 | 575 | ||||||
Fifth Third Bancorp | 30,311 | 571 | ||||||
Franklin Resources | 14,550 | 747 | ||||||
General Growth Properties† | 23,400 | 691 | ||||||
Genworth Financial, Cl A* | 18,800 | 137 | ||||||
Goldman Sachs Group | 15,265 | 2,869 | ||||||
Hartford Financial Services Group | 15,686 | 656 | ||||||
HCP† | 17,400 | 752 | ||||||
Health Care† | 13,200 | 1,021 | ||||||
Host Hotels & Resorts† | 28,074 | 566 | ||||||
Hudson City Bancorp, Cl A | 18,200 | 191 | ||||||
Huntington Bancshares | 30,014 | 332 | ||||||
IntercontinentalExchange Group | 4,181 | 975 | ||||||
Invesco | 16,200 | 643 | ||||||
Iron Mountain† | 7,038 | 257 | ||||||
JPMorgan Chase | 140,100 | 8,487 | ||||||
KeyCorp | 31,683 | 449 | ||||||
Kimco Realty† | 15,313 | 411 | ||||||
Legg Mason | 3,705 | 204 | ||||||
Leucadia National | 11,713 | 261 | ||||||
Lincoln National | 9,498 | 546 | ||||||
Loews | 11,062 | 452 | ||||||
M&T Bank | 4,961 | 630 | ||||||
Macerich† | 5,204 | 439 | ||||||
Marsh & McLennan | 20,259 | 1,136 | ||||||
McGraw-Hill | 10,321 | 1,067 | ||||||
MetLife | 42,039 | 2,125 | ||||||
Moody’s | 6,608 | 686 | ||||||
Morgan Stanley | 57,961 | 2,069 | ||||||
NASDAQ OMX Group, Cl A | 4,400 | 224 | ||||||
Navient | 14,843 | 302 | ||||||
Northern Trust | 8,309 | 579 | ||||||
People’s United Financial | 11,700 | 178 | ||||||
Plum Creek Timber | 6,635 | 288 | ||||||
PNC Financial Services Group | 19,584 | 1,826 | ||||||
Principal Financial Group, Cl A | 10,157 | 522 | ||||||
Progressive | 19,885 | 541 | ||||||
ProLogis† | 19,300 | 841 | ||||||
Prudential Financial | 17,066 | 1,371 | ||||||
Public Storage† | 5,433 | 1,071 | ||||||
Regions Financial | 49,863 | 471 | ||||||
Simon Property Group† | 11,706 | 2,290 | ||||||
SL Green Realty† (A) | 3,700 | 475 | ||||||
State Street | 15,491 | 1,139 | ||||||
SunTrust Banks | 19,796 | 813 | ||||||
| 2 | SEI Institutional Managed Trust / Semi-Annual Report / March 31, 2015 |
SCHEDULE OF INVESTMENTS (Unaudited)
S & P 500 Index Fund
March 31, 2015
| Description | Shares | Market Value ($ Thousands) | ||||||
T. Rowe Price Group | 9,708 | $ | 786 | |||||
Torchmark, Cl A | 4,739 | 260 | ||||||
Travelers | 12,056 | 1,304 | ||||||
Unum Group | 9,361 | 316 | ||||||
US Bancorp | 66,923 | 2,923 | ||||||
Ventas† | 12,432 | 908 | ||||||
Vornado Realty Trust† | 6,577 | 737 | ||||||
Wells Fargo | 176,115 | 9,581 | ||||||
Weyerhaeuser† | 19,845 | 658 | ||||||
XL Group, Cl A | 9,405 | 346 | ||||||
Zions Bancorporation | 7,660 | 207 | ||||||
|
| |||||||
| 111,413 | ||||||||
|
| |||||||
Health Care — 14.8% | ||||||||
Abbott Laboratories | 56,763 | 2,630 | ||||||
AbbVie | 59,868 | 3,505 | ||||||
Actavis* | 14,653 | 4,361 | ||||||
Aetna, Cl A | 13,207 | 1,407 | ||||||
Agilent Technologies | 12,415 | 516 | ||||||
Alexion Pharmaceuticals* | 7,600 | 1,317 | ||||||
AmerisourceBergen | 7,896 | 898 | ||||||
Amgen, Cl A | 28,564 | 4,566 | ||||||
Anthem | 10,002 | 1,544 | ||||||
Baxter International | 20,442 | 1,400 | ||||||
Becton Dickinson | 7,859 | 1,128 | ||||||
Biogen* | 8,800 | 3,716 | ||||||
Boston Scientific* | 50,112 | 890 | ||||||
Bristol-Myers Squibb | 62,492 | 4,031 | ||||||
C.R. Bard | 2,788 | 467 | ||||||
Cardinal Health | 12,459 | 1,125 | ||||||
Celgene, Cl A* | 30,113 | 3,471 | ||||||
Cerner* | 11,500 | 842 | ||||||
Cigna | 9,771 | 1,265 | ||||||
DaVita HealthCare Partners* | 6,405 | 521 | ||||||
Dentsply International | 5,209 | 265 | ||||||
Edwards Lifesciences, Cl A* | 4,000 | 570 | ||||||
Eli Lilly | 36,739 | 2,669 | ||||||
Endo International* | 6,700 | 601 | ||||||
Express Scripts Holding* | 27,370 | 2,375 | ||||||
Gilead Sciences* | 55,966 | 5,492 | ||||||
HCA Holdings* | 11,105 | 835 | ||||||
Henry Schein* | 3,100 | 433 | ||||||
Hospira* | 6,404 | 562 | ||||||
Humana | 5,601 | 997 | ||||||
Intuitive Surgical* | 1,420 | 717 | ||||||
Johnson & Johnson | 104,412 | 10,504 | ||||||
Laboratory Corp of America Holdings* | 3,763 | 474 | ||||||
Mallinckrodt* | 4,404 | 558 | ||||||
McKesson | 8,769 | 1,984 | ||||||
Medtronic | 53,572 | 4,178 | ||||||
Merck | 106,674 | 6,132 | ||||||
Mylan* | 14,015 | 832 | ||||||
Patterson | 3,200 | 156 | ||||||
PerkinElmer | 4,240 | 217 | ||||||
Perrigo | 5,304 | 878 | ||||||
Pfizer | 230,256 | 8,010 | ||||||
Quest Diagnostics | 5,324 | 409 | ||||||
Regeneron Pharmaceuticals* | 2,800 | 1,264 | ||||||
St. Jude Medical | 10,456 | 684 | ||||||
Stryker | 11,246 | 1,037 | ||||||
Tenet Healthcare* | 3,719 | 184 | ||||||
Thermo Fisher Scientific | 14,952 | 2,008 | ||||||
UnitedHealth Group | 35,860 | 4,242 | ||||||
| Description | Shares | Market Value ($ Thousands) | ||||||
Universal Health Services, Cl B | 3,400 | $ | 400 | |||||
Varian Medical Systems* (A) | 3,705 | 349 | ||||||
Vertex Pharmaceuticals* | 9,100 | 1,074 | ||||||
Waters* | 3,097 | 385 | ||||||
Zimmer Holdings | 6,460 | 759 | ||||||
Zoetis, Cl A | 18,646 | 863 | ||||||
|
| |||||||
| 102,697 | ||||||||
|
| |||||||
Industrials — 10.3% | ||||||||
3M | 23,891 | 3,941 | ||||||
ADT, Cl A (A) | 6,350 | 264 | ||||||
Allegion | 3,570 | 218 | ||||||
American Airlines Group | 27,009 | 1,426 | ||||||
Ametek | 9,000 | 473 | ||||||
Boeing | 24,641 | 3,698 | ||||||
C.H. Robinson Worldwide | 5,405 | 396 | ||||||
Caterpillar, Cl A | 22,806 | 1,825 | ||||||
Cintas | 3,612 | 295 | ||||||
CSX | 37,272 | 1,234 | ||||||
Cummins | 6,344 | 880 | ||||||
Danaher, Cl A | 23,096 | 1,961 | ||||||
Deere | 12,806 | 1,123 | ||||||
Delta Air Lines, Cl A | 31,013 | 1,394 | ||||||
Dover | 6,037 | 417 | ||||||
Dun & Bradstreet | 1,305 | 167 | ||||||
Eaton | 17,915 | 1,217 | ||||||
Emerson Electric | 25,815 | 1,462 | ||||||
Equifax | 4,430 | 412 | ||||||
Expeditors International of Washington | 7,109 | 342 | ||||||
Fastenal, Cl A (A) | 10,109 | 419 | ||||||
FedEx | 9,905 | 1,639 | ||||||
Flowserve | 5,000 | 282 | ||||||
Fluor | 5,444 | 311 | ||||||
General Dynamics | 11,830 | 1,606 | ||||||
General Electric | 378,104 | 9,381 | ||||||
Honeywell International | 29,468 | 3,074 | ||||||
Illinois Tool Works | 13,129 | 1,275 | ||||||
Ingersoll-Rand | 9,804 | 667 | ||||||
Jacobs Engineering Group* | 4,804 | 217 | ||||||
Joy Global | 3,700 | 145 | ||||||
Kansas City Southern | 4,100 | 419 | ||||||
L-3 Communications Holdings | 3,123 | 393 | ||||||
Lockheed Martin | 10,098 | 2,049 | ||||||
Masco | 12,868 | 344 | ||||||
Nielsen | 11,700 | 521 | ||||||
Norfolk Southern | 11,530 | 1,187 | ||||||
Northrop Grumman | 7,523 | 1,211 | ||||||
PACCAR | 13,191 | 833 | ||||||
Pall | 3,995 | 401 | ||||||
Parker-Hannifin, Cl A | 5,371 | 638 | ||||||
Pentair | 6,766 | 426 | ||||||
Pitney Bowes | 7,575 | 177 | ||||||
Precision Castparts | 5,304 | 1,114 | ||||||
Quanta Services* | 7,800 | 223 | ||||||
Raytheon | 11,573 | 1,264 | ||||||
Republic Services | 9,283 | 376 | ||||||
Robert Half International | 5,032 | 304 | ||||||
Rockwell Automation | 5,030 | 583 | ||||||
Rockwell Collins | 4,978 | 481 | ||||||
Roper Industries | 3,800 | 653 | ||||||
Ryder System | 1,959 | 186 | ||||||
Snap-on | 2,153 | 317 | ||||||
Southwest Airlines, Cl A | 25,462 | 1,128 | ||||||
| 3 | SEI Institutional Managed Trust / Semi-Annual Report / March 31, 2015 |
SCHEDULE OF INVESTMENTS (Unaudited)
S & P 500 Index Fund
March 31, 2015
| Description | Shares | Market Value ($ Thousands) | ||||||
Stanley Black & Decker | 5,840 | $ | 557 | |||||
Stericycle, Cl A* | 3,204 | 450 | ||||||
Textron | 10,307 | 457 | ||||||
Tyco International | 15,600 | 672 | ||||||
Union Pacific | 33,101 | 3,585 | ||||||
United Parcel Service, Cl B | 26,124 | 2,532 | ||||||
United Rentals* | 3,600 | 328 | ||||||
United Technologies | 31,041 | 3,638 | ||||||
Waste Management | 16,128 | 875 | ||||||
WW Grainger | 2,265 | 534 | ||||||
Xylem | 6,900 | 242 | ||||||
|
| |||||||
| 71,259 | ||||||||
|
| |||||||
Information Technology — 19.5% | ||||||||
Accenture, Cl A | 23,604 | 2,211 | ||||||
Adobe Systems* | 17,941 | 1,327 | ||||||
Akamai Technologies* | 6,604 | 469 | ||||||
Alliance Data Systems* | 2,400 | 711 | ||||||
Altera | 11,151 | 478 | ||||||
Amphenol, Cl A | 11,709 | 690 | ||||||
Analog Devices | 11,599 | 731 | ||||||
Apple | 218,782 | 27,223 | ||||||
Applied Materials | 46,250 | 1,043 | ||||||
Autodesk, Cl A* | 8,417 | 494 | ||||||
Automatic Data Processing | 17,859 | 1,529 | ||||||
Avago Technologies, Cl A | 9,700 | 1,232 | ||||||
Broadcom, Cl A | 20,536 | 889 | ||||||
CA | 11,840 | 386 | ||||||
Cisco Systems | 191,761 | 5,278 | ||||||
Citrix Systems* | 5,942 | 380 | ||||||
Cognizant Technology Solutions, Cl A* | 22,905 | 1,429 | ||||||
Computer Sciences | 5,238 | 342 | ||||||
Corning, Cl B | 47,908 | 1,087 | ||||||
eBay* | 41,449 | 2,391 | ||||||
Electronic Arts* | 11,578 | 681 | ||||||
EMC | 74,766 | 1,911 | ||||||
Equinix† | 2,100 | 489 | ||||||
F5 Networks, Cl A* | 2,700 | 310 | ||||||
Facebook, Cl A* | 78,822 | 6,480 | ||||||
Fidelity National Information Services, Cl B | 10,765 | 733 | ||||||
First Solar* | 2,840 | 170 | ||||||
Fiserv, Cl A* | 8,860 | 703 | ||||||
Flir Systems | 5,300 | 166 | ||||||
Google, Cl A* | 10,767 | 5,973 | ||||||
Google, Cl C* | 10,767 | 5,900 | ||||||
Harris | 3,800 | 299 | ||||||
Hewlett-Packard | 68,391 | 2,131 | ||||||
Intel | 177,963 | 5,565 | ||||||
International Business Machines | 34,546 | 5,545 | ||||||
Intuit | 10,386 | 1,007 | ||||||
Juniper Networks | 13,400 | 303 | ||||||
KLA-Tencor | 5,971 | 348 | ||||||
Lam Research | 5,922 | 416 | ||||||
Linear Technology | 8,898 | 416 | ||||||
MasterCard, Cl A | 36,713 | 3,172 | ||||||
Microchip Technology (A) | 7,504 | 367 | ||||||
Micron Technology* | 40,569 | 1,101 | ||||||
Microsoft | 308,189 | 12,529 | ||||||
Motorola Solutions | 7,129 | 475 | ||||||
NetApp | 11,585 | 411 | ||||||
Nvidia | 19,165 | 401 | ||||||
Oracle, Cl B | 120,423 | 5,196 | ||||||
| Description | Shares | Market Value ($ Thousands) | ||||||
Paychex | 12,369 | $ | 614 | |||||
Qualcomm | 61,954 | 4,296 | ||||||
Red Hat* | 6,800 | 515 | ||||||
Salesforce.com* | 22,809 | 1,524 | ||||||
SanDisk | 7,900 | 502 | ||||||
Seagate Technology | 12,200 | 635 | ||||||
Skyworks Solutions | 7,104 | 698 | ||||||
Symantec, Cl A | 25,347 | 592 | ||||||
TE Connectivity | 15,309 | 1,096 | ||||||
Teradata* | 5,368 | 237 | ||||||
Texas Instruments | 39,366 | 2,251 | ||||||
Total System Services | 6,089 | 232 | ||||||
VeriSign* (A) | 3,900 | 261 | ||||||
Visa, Cl A | 72,918 | 4,770 | ||||||
Western Digital | 8,204 | 747 | ||||||
Western Union (A) | 19,334 | 402 | ||||||
Xerox | 38,806 | 499 | ||||||
Xilinx | 9,709 | 411 | ||||||
Yahoo!* | 32,747 | 1,455 | ||||||
|
| |||||||
| 135,255 | ||||||||
|
| |||||||
Materials — 3.1% | ||||||||
Air Products & Chemicals | 7,226 | 1,093 | ||||||
Airgas | 2,500 | 265 | ||||||
Alcoa | 46,135 | 596 | ||||||
Allegheny Technologies | 4,159 | 125 | ||||||
Avery Dennison | 3,415 | 181 | ||||||
Ball | 5,086 | 359 | ||||||
CF Industries Holdings | 1,790 | 508 | ||||||
Dow Chemical, Cl A | 40,892 | 1,962 | ||||||
E.I. Du Pont de Nemours | 34,048 | 2,434 | ||||||
Eastman Chemical | 5,520 | 382 | ||||||
Ecolab | 10,134 | 1,159 | ||||||
FMC | 5,000 | 286 | ||||||
Freeport-McMoRan, Cl B | 38,736 | 734 | ||||||
International Flavors & Fragrances | 2,994 | 352 | ||||||
International Paper | 15,974 | 886 | ||||||
LyondellBasell Industries, Cl A | 14,904 | 1,309 | ||||||
Martin Marietta Materials, Cl A | 2,300 | 322 | ||||||
MeadWestvaco | 6,219 | 310 | ||||||
Monsanto | 18,157 | 2,043 | ||||||
Mosaic | 11,509 | 530 | ||||||
Newmont Mining | 18,525 | 402 | ||||||
Nucor | 12,095 | 575 | ||||||
Owens-Illinois* | 6,200 | 145 | ||||||
PPG Industries | 5,145 | 1,160 | ||||||
Praxair | 10,899 | 1,316 | ||||||
Sealed Air | 7,728 | 352 | ||||||
Sherwin-Williams, Cl A | 3,016 | 858 | ||||||
Sigma-Aldrich | 4,436 | 613 | ||||||
Vulcan Materials | 4,949 | 417 | ||||||
|
| |||||||
| 21,674 | ||||||||
|
| |||||||
Telecommunication Services — 2.3% | ||||||||
AT&T | 194,997 | 6,367 | ||||||
CenturyTel | 21,370 | 738 | ||||||
Frontier Communications (A) | 37,160 | 262 | ||||||
Level 3 Communications* | 10,800 | 582 | ||||||
Verizon Communications | 156,096 | 7,591 | ||||||
Windstream Holdings (A) | 22,846 | 169 | ||||||
|
| |||||||
| 15,709 | ||||||||
|
| |||||||
Utilities — 3.0% | ||||||||
AES | 23,890 | 307 | ||||||
| 4 | SEI Institutional Managed Trust / Semi-Annual Report / March 31, 2015 |
SCHEDULE OF INVESTMENTS (Unaudited)
S & P 500 Index Fund
March 31, 2015
| Description | Shares/Face Amount ($ Thousands) | Market Value ($ Thousands) | ||||||
AGL Resources | 4,500 | $ | 224 | |||||
Ameren | 8,953 | 378 | ||||||
American Electric Power | 18,415 | 1,036 | ||||||
Centerpoint Energy | 15,885 | 324 | ||||||
CMS Energy | 10,201 | 356 | ||||||
Consolidated Edison | 10,933 | 667 | ||||||
Dominion Resources | 22,140 | 1,569 | ||||||
DTE Energy | 6,745 | 544 | ||||||
Duke Energy | 26,616 | 2,043 | ||||||
Edison International | 12,257 | 766 | ||||||
Entergy | 6,864 | 532 | ||||||
Eversource Energy | 11,835 | 598 | ||||||
Exelon | 32,355 | 1,087 | ||||||
FirstEnergy | 15,623 | 548 | ||||||
Integrys Energy Group | 2,938 | 212 | ||||||
NextEra Energy | 16,720 | 1,740 | ||||||
NiSource | 11,992 | 530 | ||||||
NRG Energy | 12,513 | 315 | ||||||
Pepco Holdings | 9,500 | 255 | ||||||
PG&E | 17,729 | 941 | ||||||
Pinnacle West Capital | 4,149 | 264 | ||||||
PPL | 25,171 | 847 | ||||||
Public Service Enterprise Group | 18,830 | 789 | ||||||
SCANA | 5,304 | 292 | ||||||
Sempra Energy | 8,770 | 956 | ||||||
Southern | 34,235 | 1,516 | ||||||
TECO Energy | 8,912 | 173 | ||||||
Wisconsin Energy (A) | 8,405 | 416 | ||||||
Xcel Energy | 19,136 | 666 | ||||||
|
| |||||||
| 20,891 | ||||||||
|
| |||||||
Total Common Stock |
| 687,294 | ||||||
|
| |||||||
AFFILIATED PARTNERSHIP — 0.7% |
| |||||||
SEI Liquidity Fund, L.P., 0.070%**†† (B) | 4,859,159 | 4,859 | ||||||
|
| |||||||
Total Affiliated Partnership |
| 4,859 | ||||||
|
| |||||||
CASH EQUIVALENT — 1.6% |
| |||||||
SEI Daily Income Trust, Prime Obligation Fund, Cl A 0.010%**†† | 11,414,893 | 11,415 | ||||||
|
| |||||||
Total Cash Equivalent |
| 11,415 | ||||||
|
| |||||||
U.S. TREASURY OBLIGATIONS (C) (D) — 0.5% |
| |||||||
United States Treasury Bills 0.016%, 4/16/2015 | $ | 3,310 | 3,310 | |||||
|
| |||||||
Total U.S. Treasury Obligations |
| 3,310 | ||||||
|
| |||||||
Total Investments — 101.8% |
| $ | 706,878 | |||||
|
| |||||||
A list of the open futures contracts held by the Fund at March 31, 2015, is as follows:
| Type of Contract | Number of Contracts | Expiration Date | Unrealized (Depreciation) ($ Thousands) | |||||||||
S&P 500 Index EMINI | 76 | Jun-2015 | $ | (25 | ) | |||||||
|
| |||||||||||
For the period ended March 31, 2015, the total amount of all open futures contracts as presented in the table above, are representative of the volume of activity for this derivative type during the period.
Percentages are based on Net Assets of $694,212 ($Thousands).
| * | Non-income producing security. |
| ** | Rate shown is the 7-day effective yield as of March 31, 2015. |
| † | Real Estate Investment Trust. |
| †† | Investment in Affiliated Security (see Note 6). |
| (A) | This security or a partial position of this security is on loan at March 31, 2015 (see Note 10). The total market value of securities on loan at March 31, 2015 was $4,677 ($ Thousands) |
| (B) | This security was purchased with cash collateral held from securities on loan (see Note 10). The total value of such securities as of March 31, 2015 was $4,859 ($ Thousands). |
| (C) | The rate reported is the effective yield at the time of purchase. |
| (D) | Security, or portion thereof, has been pledged as collateral on open futures contracts. |
ADR — American Depositary Receipt
Cl — Class
L.P. — Limited Partnership
PLC — Public Limited Company
S&P — Standard & Poor’s
Ser — Series
The following is a summary of the inputs used as of March 31, 2015, in valuing the Fund’s investments and other financial instruments carried at value ($ Thousands):
| Investments in Securities | Level 1 | Level 2 | Level 3 | Total | ||||||||||||
Common Stock | $ | 687,294 | $ | — | $ | — | $ | 687,294 | ||||||||
Affiliated Partnership | — | 4,859 | — | 4,859 | ||||||||||||
Cash Equivalent | 11,415 | — | — | 11,415 | ||||||||||||
U.S. Treasury Obligations | — | 3,310 | — | 3,310 | ||||||||||||
|
|
|
|
|
|
|
| |||||||||
Total Investments in Securities | $ | 698,709 | $ | 8,169 | $ | — | $ | 706,878 | ||||||||
|
|
|
|
|
|
|
| |||||||||
| Other Financial Instruments | Level 1 | Level 2 | Level 3 | Total | ||||||||||||
Futures Contracts * | ||||||||||||||||
Unrealized Depreciation | $ | (25 | ) | $ | — | $ | — | $ | (25 | ) | ||||||
|
|
|
|
|
|
|
| |||||||||
Total Other Financial Instruments | $ | (25 | ) | $ | — | $ | — | $ | (25 | ) | ||||||
|
|
|
|
|
|
|
| |||||||||
| * | Futures contracts are valued at the unrealized depreciation on the instrument. |
For the period ended March 31, 2015, there were no transfers between Level 1 and
Level 2 assets and liabilities.
For the period ended March 31, 2015, there were no transfers between Level 2 and
Level 3 assets and liabilities.
For the period ended March 31, 2015, there were no level 3 investments.
For more information on valuation inputs, see Note 2 — Significant Accounting Policies in
Notes to Financial Statements.
Amounts designated as “—” are $0 or have been rounded to $0.
The accompanying notes are an integral part of the financial statements.
| 5 | SEI Institutional Managed Trust / Semi-Annual Report / March 31, 2015 |
SCHEDULE OF INVESTMENTS (Unaudited)
Small Cap Fund
March 31, 2015
| Description | Shares | Market Value ($ Thousands) | ||||||
COMMON STOCK — 94.3% | ||||||||
Consumer Discretionary — 14.6% | ||||||||
1-800-Flowers.com, Cl A* | 19,900 | $ | 236 | |||||
2U* | 23,731 | 607 | ||||||
Abercrombie & Fitch, Cl A (A) | 90,800 | 2,001 | ||||||
Aeropostale* | 24,800 | 86 | ||||||
AMC Entertainment Holdings, Cl A | 39,351 | 1,397 | ||||||
American Axle & Manufacturing Holdings* | 48,481 | 1,252 | ||||||
American Eagle Outfitters | 35,321 | 603 | ||||||
America’s Car-Mart* | 1,100 | 60 | ||||||
ANN* | 11,945 | 490 | ||||||
Arctic Cat | 400 | 14 | ||||||
Ascena Retail Group* | 46,686 | 677 | ||||||
bebe stores, Cl A | 22,500 | 82 | ||||||
Big 5 Sporting Goods | 8,365 | 111 | ||||||
Big Lots | 47,168 | 2,265 | ||||||
Bloomin’ Brands | 11,200 | 273 | ||||||
Boot Barn Holdings* | 27,695 | 662 | ||||||
Bravo Brio Restaurant Group* | 20,100 | 295 | ||||||
Bright Horizons Family Solutions* | 38,163 | 1,957 | ||||||
Brown Shoe | 29,359 | 963 | ||||||
Brunswick | 21,866 | 1,125 | ||||||
Buffalo Wild Wings* | 7,009 | 1,270 | ||||||
Build-A-Bear Workshop* | 14,700 | 289 | ||||||
Burlington Stores* | 30,928 | 1,838 | ||||||
Cabela’s* (A) | 2,354 | 132 | ||||||
Callaway Golf | 83,802 | 799 | ||||||
Capella Education | 19,422 | 1,260 | ||||||
Career Education* | 40,400 | 203 | ||||||
Carmike Cinemas* | 43,893 | 1,475 | ||||||
Cato, Cl A | 6,300 | 249 | ||||||
Children’s Place | 8,495 | 545 | ||||||
Christopher & Banks* | 17,800 | 99 | ||||||
Chuy’s Holdings* | 45,534 | 1,026 | ||||||
Citi Trends* | 7,500 | 203 | ||||||
Columbia Sportswear | 10,789 | 657 | ||||||
Cooper Tire & Rubber | 27,670 | 1,185 | ||||||
Core-Mark Holding, Cl A | 10,565 | 680 | ||||||
Cracker Barrel Old Country Store | 100 | 15 | ||||||
CROCS* | 58,685 | 693 | ||||||
Denny’s, Cl A* | 20,473 | 233 | ||||||
Destination Maternity | 3,300 | 50 | ||||||
Destination XL Group* | 19,300 | 95 | ||||||
Dex Media* (A) | 8,000 | 33 | ||||||
Diamond Resorts International* | 44,281 | 1,480 | ||||||
DineEquity | 1,400 | 150 | ||||||
Drew Industries | 3,900 | 240 | ||||||
Entravision Communications, Cl A | 47,323 | 300 | ||||||
EW Scripps, Cl A* | 22,382 | 637 | ||||||
Fiesta Restaurant Group* | 30,270 | 1,846 | ||||||
Five Below* | 55,678 | 1,980 | ||||||
Francesca’s Holdings* | 5,100 | 91 | ||||||
Gentherm* | 15,475 | 782 | ||||||
G-III Apparel Group* | 5,589 | 629 | ||||||
Grand Canyon Education* | 1,400 | 61 | ||||||
Gray Television* | 51,592 | 713 | ||||||
Harte-Hanks | 7,700 | 60 | ||||||
Haverty Furniture | 6,976 | 174 | ||||||
Helen of Troy* | 7,400 | 603 | ||||||
hhgregg, Cl A* (A) | 18,400 | 113 | ||||||
| Description | Shares | Market Value ($ Thousands) | ||||||
Hovnanian Enterprises, Cl A* (A) | 36,000 | $ | 128 | |||||
HSN, Cl A | 200 | 14 | ||||||
Imax* | 31,208 | 1,052 | ||||||
Isle of Capri Casinos* | 16,500 | 232 | ||||||
Jack in the Box | 24,994 | 2,397 | ||||||
K12* | 33,900 | 533 | ||||||
Kirkland’s* | 20,399 | 484 | ||||||
La Quinta Holdings* | 61,592 | 1,459 | ||||||
Lands’ End* | 12,106 | 434 | ||||||
La-Z-Boy, Cl Z | 62,141 | 1,747 | ||||||
LeapFrog Enterprises* (A) | 17,800 | 39 | ||||||
Libbey | 19,500 | 778 | ||||||
Loral Space & Communications* | 6,500 | 445 | ||||||
Marriott Vacations Worldwide | 25,839 | 2,094 | ||||||
Matthews International, Cl A | 12,600 | 649 | ||||||
MDC Partners, Cl A | 52,426 | 1,486 | ||||||
Meredith | 14,529 | 810 | ||||||
Meritage Homes* | 11,489 | 559 | ||||||
Modine Manufacturing* | 57,896 | 780 | ||||||
Movado Group | 4,300 | 123 | ||||||
National CineMedia | 45,320 | 684 | ||||||
Nautilus* | 56,707 | 866 | ||||||
New Media Investment Group | 26,780 | 641 | ||||||
New Remy Holdco* | 4,241 | 94 | ||||||
Office Depot* | 27,700 | 255 | ||||||
Orbitz Worldwide* | 2,334 | 27 | ||||||
Overstock.com* | 12,100 | 293 | ||||||
Perry Ellis International, Cl A* | 5,000 | 116 | ||||||
PetMed Express (A) | 8,000 | 132 | ||||||
Pool | 32,139 | 2,242 | ||||||
Popeyes Louisiana Kitchen* | 17,573 | 1,051 | ||||||
Red Robin Gourmet Burgers* | 17,688 | 1,539 | ||||||
Restoration Hardware Holdings* | 7,803 | 774 | ||||||
Ruth’s Chris Steak House | 32,509 | 516 | ||||||
Ryland Group | 21,432 | 1,044 | ||||||
Select Comfort* | 14,959 | 516 | ||||||
Shoe Carnival | 21,076 | 620 | ||||||
Shutterfly* | 16,747 | 758 | ||||||
Six Flags Entertainment (B) | 10,710 | 519 | ||||||
Skechers U.S.A., Cl A* | 18,312 | 1,317 | ||||||
Skullcandy* | 8,300 | 94 | ||||||
SodaStream International* (A) | 41,500 | 841 | ||||||
Sonic | 17,304 | 549 | ||||||
Sportsman’s Warehouse Holdings* (A) | 62,685 | 501 | ||||||
Stage Stores | 24,415 | 560 | ||||||
Standard Motor Products | 2,500 | 106 | ||||||
Stein Mart | 12,500 | 156 | ||||||
Steven Madden* | 25,087 | 953 | ||||||
Stoneridge* | 4,901 | 55 | ||||||
Strayer Education* | 3,200 | 171 | ||||||
TAL Education Group ADR* (A) | 18,227 | 605 | ||||||
Tempur-Pedic International* | 13,488 | 779 | ||||||
Tenneco* | 5,000 | 287 | ||||||
Tile Shop Holdings* | 47,014 | 569 | ||||||
Tilly’s, Cl A* | 10,600 | 166 | ||||||
Titan International (A) | 106,600 | 998 | ||||||
Tower International* | 13,600 | 362 | ||||||
TRI Pointe Homes* | 8,500 | 131 | ||||||
Tuesday Morning* (A) | 49,748 | 801 | ||||||
Universal Electronics* | 11,535 | 651 | ||||||
Vail Resorts | 16,911 | 1,749 | ||||||
| 1 | SEI Institutional Managed Trust / Semi-Annual Report / March 31, 2015 |
SCHEDULE OF INVESTMENTS (Unaudited)
Small Cap Fund
March 31, 2015
| Description | Shares | Market Value ($ Thousands) | ||||||
Vista Outdoor* | 19,735 | $ | 845 | |||||
Vitamin Shoppe* | 11,400 | 470 | ||||||
VOXX International, Cl A* | 60,600 | 555 | ||||||
Wayfair, Cl A* (A) | 15,947 | 512 | ||||||
Wolverine World Wide | 18,575 | 621 | ||||||
World Wrestling Entertainment, Cl A (A) | 23,700 | 332 | ||||||
Zoe’s Kitchen* (A) | 25,436 | 847 | ||||||
Zumiez* | 4,500 | 181 | ||||||
|
| |||||||
| 83,738 | ||||||||
|
| |||||||
Consumer Staples — 2.1% | ||||||||
Andersons | 11,200 | 463 | ||||||
Casey’s General Stores | 15,790 | 1,423 | ||||||
Chefs’ Warehouse Holdings* (A) | 27,902 | 626 | ||||||
Cott | 40,777 | 382 | ||||||
Diplomat Pharmacy* | 14,535 | 502 | ||||||
Freshpet* (A) | 34,540 | 671 | ||||||
John B Sanfilippo & Son | 2,800 | 121 | ||||||
Lancaster Colony | 2,800 | 267 | ||||||
Landec* | 44,400 | 619 | ||||||
Medifast* | 13,833 | 415 | ||||||
Omega Protein* | 55,900 | 765 | ||||||
Pinnacle Foods | 13,322 | 544 | ||||||
Post Holdings* | 10,392 | 487 | ||||||
Roundy’s* | 3,300 | 16 | ||||||
Sanderson Farms (A) | 8,050 | 641 | ||||||
Snyder’s-Lance | 21,290 | 680 | ||||||
SpartanNash | 7,000 | 221 | ||||||
Sprouts Farmers Market* | 29,574 | 1,042 | ||||||
SUPERVALU* | 88,900 | 1,034 | ||||||
TreeHouse Foods* | 4,576 | 389 | ||||||
Universal (A) | 5,800 | 274 | ||||||
USANA Health Sciences* | 6,500 | 722 | ||||||
|
| |||||||
| 12,304 | ||||||||
|
| |||||||
Energy — 3.6% | ||||||||
Abraxas Petroleum* | 33,800 | 110 | ||||||
Alberta Oilsands* | 184,500 | 15 | ||||||
Approach Resources, Cl A* (A) | 110,300 | 727 | ||||||
Bill Barrett* (A) | 75,900 | 630 | ||||||
Bristow Group | 6,001 | 327 | ||||||
Callon Petroleum* | 69,764 | 521 | ||||||
CARBO Ceramics (A) | 41,300 | 1,260 | ||||||
Carrizo Oil & Gas* | 22,765 | 1,130 | ||||||
Cloud Peak Energy* | 14,400 | 84 | ||||||
Contango Oil & Gas* | 800 | 18 | ||||||
Delek US Holdings | 11,095 | 441 | ||||||
DHT Holdings | 32,700 | 228 | ||||||
Dril-Quip* | 5,578 | 382 | ||||||
Green Plains | 9,500 | 271 | ||||||
Gulfport Energy* | 18,459 | 847 | ||||||
Helix Energy Solutions Group* | 2,500 | 37 | ||||||
ION Geophysical* | 16,600 | 36 | ||||||
Laredo Petroleum* (A) | 36,502 | 476 | ||||||
Matador Resources* (A) | 33,787 | 741 | ||||||
Matrix Service* | 30,713 | 539 | ||||||
Nabors Industries | 21,900 | 299 | ||||||
Navigator Holdings* | 20,200 | 386 | ||||||
Newpark Resources, Cl A* | 900 | 8 | ||||||
Nuverra Environmental Solutions* (A) | 15,500 | 55 | ||||||
Oil States International* | 24,425 | 971 | ||||||
PBF Energy, Cl A | 50,500 | 1,713 | ||||||
PDC Energy, Cl A* | 12,660 | 684 | ||||||
| Description | Shares | Market Value ($ Thousands) | ||||||
PetroQuest Energy* | 24,500 | $ | 56 | |||||
Pioneer Energy Services* | 11,800 | 64 | ||||||
REX American Resources* | 12,000 | 730 | ||||||
Scorpio Tankers | 114,400 | 1,078 | ||||||
StealthGas* | 49,400 | 324 | ||||||
Superior Energy Services | 48,931 | 1,093 | ||||||
Synergy Resources* | 56,956 | 675 | ||||||
TETRA Technologies* | 49,800 | 308 | ||||||
Tidewater, Cl A (A) | 100,200 | 1,918 | ||||||
Triangle Petroleum* (A) | — | — | ||||||
US Silica Holdings (A) | 28,873 | 1,028 | ||||||
VAALCO Energy* | 67,740 | 166 | ||||||
Willbros Group* | 75,100 | 249 | ||||||
|
| |||||||
| 20,625 | ||||||||
|
| |||||||
Financials — 18.0% | ||||||||
Agree Realty† | 1,200 | 40 | ||||||
Altisource Residential† | 4,400 | 92 | ||||||
American Capital Mortgage Investment† | 12,100 | 217 | ||||||
American Equity Investment Life Holding | 28,889 | 841 | ||||||
Argo Group International Holdings | 16,236 | 814 | ||||||
Armada Hoffler Properties† | 4,700 | 50 | ||||||
Ashford Hospitality Prime† | 3,800 | 64 | ||||||
Astoria Financial | 58,200 | 754 | ||||||
Banco Latinoamericano de Exportaciones, Cl E | 6,300 | 207 | ||||||
Bancorp* | 87,000 | 786 | ||||||
Bancorpsouth, Cl A (A) | 40,189 | 933 | ||||||
Bank of the Ozarks (A) | 23,809 | 879 | ||||||
Banner | 33,734 | 1,548 | ||||||
BBCN Bancorp | 2,200 | 32 | ||||||
BGC Partners, Cl A | 21,300 | 201 | ||||||
Brandywine Realty Trust† | 56,605 | 904 | ||||||
Capital Bank Financial, Cl A* | 40,628 | 1,122 | ||||||
Capitol Federal Financial | 72,830 | 910 | ||||||
Caretrust† | 2,825 | 38 | ||||||
CatchMark Timber Trust, Cl A† | 43,000 | 504 | ||||||
Cathay General Bancorp | 9,700 | 276 | ||||||
Cedar Realty Trust† | 67,900 | 509 | ||||||
Central Pacific Financial | 71,987 | 1,653 | ||||||
Chatham Lodging Trust† (B) | 5,000 | 147 | ||||||
Chesapeake Lodging Trust† | 22,365 | 757 | ||||||
City National | 7,582 | 675 | ||||||
CNO Financial Group | 86,239 | 1,485 | ||||||
Columbia Banking System | 27,050 | 784 | ||||||
Cousins Properties, Cl A† | 16,200 | 172 | ||||||
Credit Acceptance, Cl A* | 3,837 | 748 | ||||||
CubeSmart† | 25,979 | 627 | ||||||
Customers Bancorp* | 31,400 | 765 | ||||||
CyrusOne† | 7,500 | 233 | ||||||
DCT Industrial Trust† | 9,330 | 323 | ||||||
DiamondRock Hospitality† | 56,560 | 799 | ||||||
DuPont Fabros Technology† | 2,500 | 82 | ||||||
EastGroup Properties† | 9,775 | 588 | ||||||
Employers Holdings | 32,700 | 883 | ||||||
EPR Properties, Cl A† | 7,000 | 420 | ||||||
EverBank Financial, Cl A | 50,200 | 905 | ||||||
Evercore Partners, Cl A | 17,705 | 915 | ||||||
Excel Trust† | 29,000 | 407 | ||||||
FBL Financial Group, Cl A | 9,400 | 583 | ||||||
FBR* | 38,975 | 901 | ||||||
Federated National Holding | 15,600 | 477 | ||||||
| 2 | SEI Institutional Managed Trust / Semi-Annual Report / March 31, 2015 |
SCHEDULE OF INVESTMENTS (Unaudited)
Small Cap Fund
March 31, 2015
| Description | Shares | Market Value ($ Thousands) | ||||||
FelCor Lodging Trust† | 56,300 | $ | 647 | |||||
Fidelity & Guaranty Life | 34,300 | 727 | ||||||
First American Financial | 300 | 11 | ||||||
First BanCorp Puerto Rico* | 122,663 | 760 | ||||||
First Cash Financial Services* | 672 | 31 | ||||||
First Citizens BancShares, Cl A | 900 | 234 | ||||||
First Commonwealth Financial | 110,540 | 995 | ||||||
First Financial Bancorp | 35,958 | 640 | ||||||
First Horizon National | 61,106 | 873 | ||||||
First Interstate BancSystem, Cl A | 19,148 | 533 | ||||||
First Midwest Bancorp | 12,300 | 214 | ||||||
First NBC Bank Holding* | 1,600 | 53 | ||||||
First Niagara Financial Group | 232,200 | 2,053 | ||||||
FNB (Pennsylvania) | 79,700 | 1,047 | ||||||
FNFV Group* (A) | 16,000 | 225 | ||||||
Fulton Financial | 68,945 | 851 | ||||||
FXCM, Cl A (A) | 28,000 | 60 | ||||||
Genworth Financial, Cl A* | 29,000 | 212 | ||||||
Geo Group† | 41,557 | 1,818 | ||||||
Gramercy Property Trust† | 23,375 | 656 | ||||||
Green Dot, Cl A* | 69,600 | 1,108 | ||||||
Hancock Holding, Cl A | 3,400 | 101 | ||||||
Hanover Insurance Group, Cl A | 16,210 | 1,176 | ||||||
Hatteras Financial† | 12,200 | 222 | ||||||
HCI Group | 4,100 | 188 | ||||||
Healthcare Realty Trust† | 6,900 | 192 | ||||||
HFF, Cl A | 3,200 | 120 | ||||||
Highwoods Properties† | 40,200 | 1,840 | ||||||
Horace Mann Educators, Cl A | 21,500 | 735 | ||||||
IBERIABANK | 27,065 | 1,706 | ||||||
Infinity Property & Casualty | 1,800 | 148 | ||||||
Inland Real Estate† | 33,900 | 362 | ||||||
Investment Technology Group* | 47,814 | 1,449 | ||||||
Investors Bancorp | 62,600 | 734 | ||||||
Investors Real Estate Trust† | 4,500 | 34 | ||||||
Janus Capital Group | 41,458 | 713 | ||||||
Kemper, Cl A | 19,600 | 764 | ||||||
Kennedy-Wilson Holdings | 44,791 | 1,171 | ||||||
Kite Realty Group Trust† | 20,079 | 566 | ||||||
LaSalle Hotel Properties† | 6,800 | 264 | ||||||
LendingTree* | 10,247 | 574 | ||||||
Lexington Realty Trust† | 124,543 | 1,224 | ||||||
LTC Properties† | 3,100 | 143 | ||||||
Mack-Cali Realty† | 30,870 | 595 | ||||||
Maiden Holdings | 58,300 | 865 | ||||||
Manning & Napier, Cl A | 34,700 | 451 | ||||||
MarketAxess Holdings | 7,802 | 647 | ||||||
Medical Properties Trust† | 88,776 | 1,309 | ||||||
Meridian Bancorp* | 33,100 | 436 | ||||||
MGIC Investment* | 87,050 | 838 | ||||||
Montpelier Re Holdings | 11,700 | 450 | ||||||
National Health Investors† | 16,310 | 1,158 | ||||||
Navigators Group* | 2,200 | 171 | ||||||
NBT Bancorp | 6,100 | 153 | ||||||
Nelnet, Cl A | 18,700 | 885 | ||||||
Northfield Bancorp | 39,350 | 583 | ||||||
OFG Bancorp (A) | 165,866 | 2,707 | ||||||
Old National Bancorp, Cl A | 42,705 | 606 | ||||||
Opus Bank | 11,504 | 355 | ||||||
Parkway Properties† | 26,783 | 465 | ||||||
Pebblebrook Hotel Trust† | 20,783 | 968 | ||||||
Pennsylvania Real Estate Investment Trust† | 19,229 | 447 | ||||||
Physicians Realty Trust† | 25,121 | 442 | ||||||
| Description | Shares | Market Value ($ Thousands) | ||||||
Pinnacle Financial Partners | 2,600 | $ | 116 | |||||
Piper Jaffray* | 2,800 | 147 | ||||||
Popular* | 30,000 | 1,032 | ||||||
Potlatch† | 4,677 | 187 | ||||||
Primerica | 2,900 | 148 | ||||||
PrivateBancorp, Cl A | 38,755 | 1,363 | ||||||
Prosperity Bancshares | 2,000 | 105 | ||||||
PS Business Parks† | 6,400 | 531 | ||||||
QTS Realty Trust* | 2,000 | 73 | ||||||
Radian Group (A) | 58,861 | 988 | ||||||
RAIT Financial Trust† | 63,323 | 434 | ||||||
Ramco-Gershenson Properties† | 10,000 | 186 | ||||||
RLI | 15,344 | 804 | ||||||
RLJ Lodging Trust† | 9,800 | 307 | ||||||
Rouse Properties† | 30,500 | 578 | ||||||
Ryman Hospitality Properties | 21,960 | 1,338 | ||||||
Sabra Health Care† | 1,700 | 56 | ||||||
Selective Insurance Group | 27,300 | 793 | ||||||
Signature Bank NY, Cl B* | 7,178 | 930 | ||||||
South State | 14,864 | 1,017 | ||||||
Southwest Bancorp | 1,900 | 34 | ||||||
Sovran Self Storage† | 9,900 | 930 | ||||||
Springleaf Holdings, Cl A* | 15,756 | 816 | ||||||
StanCorp Financial Group | 13,130 | 901 | ||||||
Starwood Property Trust† | 14,700 | 357 | ||||||
State Bank Financial | 40,300 | 846 | ||||||
Stewart Information Services | 16,546 | 672 | ||||||
Stifel Financial* | 27,945 | 1,558 | ||||||
Strategic Hotels & Resorts*† | 33,000 | 410 | ||||||
Summit Hotel Properties† | 37,952 | 534 | ||||||
Sunstone Hotel Investors† | 54,035 | 901 | ||||||
Susquehanna Bancshares | 3,600 | 49 | ||||||
SVB Financial Group, Cl B* | 8,094 | 1,028 | ||||||
Symetra Financial | 31,748 | 745 | ||||||
Synovus Financial | 34,501 | 966 | ||||||
TCF Financial | 120,585 | 1,896 | ||||||
THL Credit | 15,200 | 187 | ||||||
Two Harbors Investment† | 22,800 | 242 | ||||||
United Community Banks | 79,338 | 1,498 | ||||||
United Insurance Holdings | 16,000 | 360 | ||||||
Universal Insurance Holdings | 15,500 | 397 | ||||||
Virtus Investment Partners | 2,330 | 305 | ||||||
Webster Financial | 35,820 | 1,327 | ||||||
Western Alliance Bancorp* | 67,573 | 2,003 | ||||||
Winthrop Realty Trust† | 21,500 | 351 | ||||||
Wintrust Financial | 20,205 | 963 | ||||||
WisdomTree Investments (A) | 28,174 | 604 | ||||||
World Acceptance* (A) | 4,801 | 350 | ||||||
WSFS Financial | 3,400 | 257 | ||||||
Yadkin Financial* | 15,900 | 323 | ||||||
|
| |||||||
| 102,698 | ||||||||
|
| |||||||
Health Care — 17.3% | ||||||||
ABIOMED* (A) | 8,665 | 620 | ||||||
Acadia Healthcare, Cl A* (A) | 47,273 | 3,385 | ||||||
Accuray* (A) | 106,800 | 993 | ||||||
Achillion Pharmaceuticals* | 30,272 | 298 | ||||||
Acorda Therapeutics* | 6,400 | 213 | ||||||
Addus HomeCare* | 8,933 | 206 | ||||||
Aerie Pharmaceuticals* | 27,438 | 860 | ||||||
Affymetrix, Cl A* (A) | 21,100 | 265 | ||||||
Agenus* | 100,152 | 514 | ||||||
Agios Pharmaceuticals* | 5,336 | 503 | ||||||
Akorn* | 48,609 | 2,309 | ||||||
Alder Biopharmaceuticals* | 11,372 | 328 | ||||||
| 3 | SEI Institutional Managed Trust / Semi-Annual Report / March 31, 2015 |
SCHEDULE OF INVESTMENTS (Unaudited)
Small Cap Fund
March 31, 2015
| Description | Shares | Market Value ($ Thousands) | ||||||
Alere* | 6,800 | $ | 332 | |||||
Align Technology* | 13,482 | 725 | ||||||
AMAG Pharmaceuticals* (A) | 8,788 | 480 | ||||||
Amedisys* | 2,900 | 78 | ||||||
Amicus Therapeutics* | 55,189 | 600 | ||||||
AMN Healthcare Services* | 22,610 | 521 | ||||||
Ampio Pharmaceuticals* (A) | 59,585 | 449 | ||||||
Amsurg* | 38,795 | 2,387 | ||||||
Analogic | 15,820 | 1,438 | ||||||
Angiodynamics* | 62,897 | 1,119 | ||||||
ANI Pharmaceuticals* (A) | 1,000 | 63 | ||||||
Anika Therapeutics* | 16,100 | 663 | ||||||
Aratana Therapeutics* | 56,481 | 904 | ||||||
Arrowhead Research* (A) | 16,200 | 110 | ||||||
AtriCure* | 23,566 | 483 | ||||||
Auspex Pharmaceuticals* | 11,370 | 1,140 | ||||||
BioCryst Pharmaceuticals* (A) | — | — | ||||||
BioDelivery Sciences International* | 53,498 | 562 | ||||||
Bio-Rad Laboratories, Cl A* | 3,968 | 536 | ||||||
BioSpecifics Technologies* | 1,700 | 67 | ||||||
Bluebird Bio* | 8,450 | 1,020 | ||||||
Cambrex* | 32,703 | 1,296 | ||||||
Cardiovascular Systems* | 33,173 | 1,295 | ||||||
Celldex Therapeutics, Cl A* | 6,600 | 184 | ||||||
Cempra* | 21,306 | 731 | ||||||
Centene* | 11,795 | 834 | ||||||
Cepheid* | 8,494 | 483 | ||||||
Charles River Laboratories International* | 6,177 | 490 | ||||||
Chimerix* | 6,500 | 245 | ||||||
Coherus Biosciences* | 18,819 | 575 | ||||||
Community Health Systems* | 24,400 | 1,276 | ||||||
Conmed | 7,800 | 394 | ||||||
Cynosure, Cl A* | 4,800 | 147 | ||||||
Depomed* | 35,434 | 794 | ||||||
DexCom* | 36,931 | 2,302 | ||||||
Dicerna Pharmaceuticals* | 900 | 22 | ||||||
Dyax* | 37,318 | 625 | ||||||
Dynavax Technologies* (A) | 21,833 | 490 | ||||||
Eagle Pharmaceuticals* | 8,739 | 366 | ||||||
Emergent Biosolutions* | 42,560 | 1,224 | ||||||
Enanta Pharmaceuticals* | 900 | 28 | ||||||
Endocyte* | 9,100 | 57 | ||||||
Endologix* | 26,163 | 447 | ||||||
Ensign Group | 8,100 | 379 | ||||||
Esperion Therapeutics* (A) | 11,645 | 1,078 | ||||||
ExamWorks Group* | 22,733 | 946 | ||||||
Five Prime Therapeutics* | 14,600 | 334 | ||||||
Flexion Therapeutics* | 900 | 20 | ||||||
Globus Medical, Cl A* | 52,005 | 1,313 | ||||||
Greatbatch* | 30,260 | 1,751 | ||||||
GW Pharmaceuticals PLC ADR* (A) | 3,843 | 350 | ||||||
Halozyme Therapeutics* | 40,674 | 581 | ||||||
Halyard Health* | 15,900 | 782 | ||||||
Health Net, Cl A* | 18,343 | 1,109 | ||||||
HealthSouth | 53,624 | 2,379 | ||||||
HeartWare International* | 10,359 | 909 | ||||||
Heron Therapeutics* | 35,889 | 522 | ||||||
Hill-Rom Holdings | 10,051 | 492 | ||||||
ICON* | 11,908 | 840 | ||||||
ICU Medical* | 9,810 | 914 | ||||||
Idera Pharmaceuticals* (A) | 43,600 | 162 | ||||||
ImmunoGen* (A) | 5,000 | 45 | ||||||
| Description | Shares | Market Value ($ Thousands) | ||||||
Impax Laboratories* | 26,557 | $ | 1,245 | |||||
Insmed* | 39,346 | 818 | ||||||
Integra LifeSciences Holdings* | 34,900 | 2,152 | ||||||
Invacare | 800 | 15 | ||||||
IPC The Hospitalist* | 900 | 42 | ||||||
Ironwood Pharmaceuticals, Cl A* | 4,100 | 66 | ||||||
Isis Pharmaceuticals* (A) | 20,236 | 1,288 | ||||||
Jazz Pharmaceuticals* | 3,970 | 686 | ||||||
Juno Therapeutics* | 8,839 | 536 | ||||||
K2M Group Holdings* | 26,096 | 575 | ||||||
Karyopharm Therapeutics* (A) | 7,405 | 227 | ||||||
Kite Pharma* (A) | 8,631 | 498 | ||||||
KYTHERA Biopharmaceuticals* (A) | 6,361 | 319 | ||||||
Lannett* | 5,600 | 379 | ||||||
LDR Holding* | 56,360 | 2,065 | ||||||
Ligand Pharmaceuticals* (A) | 19,007 | 1,466 | ||||||
Luminex* | 8,800 | 141 | ||||||
MacroGenics* | 18,812 | 590 | ||||||
Magellan Health* | 15,520 | 1,099 | ||||||
Merge Healthcare* | 14,800 | 66 | ||||||
Merrimack Pharmaceuticals* (A) | 44,186 | 525 | ||||||
Molina Healthcare* | 19,407 | 1,306 | ||||||
Momenta Pharmaceuticals* | 17,000 | 258 | ||||||
Natus Medical* | 17,600 | 695 | ||||||
Neovasc* | 27,102 | 244 | ||||||
Neurocrine Biosciences* | 10,800 | 429 | ||||||
Nevro* | 18,669 | 895 | ||||||
NewLink Genetics* | 7,765 | 425 | ||||||
Novavax* (A) | 68,385 | 566 | ||||||
NuVasive* | 900 | 41 | ||||||
Omeros* | 21,251 | 468 | ||||||
Ophthotech* | 23,269 | 1,083 | ||||||
OraSure Technologies* | 41,900 | 274 | ||||||
Orexigen Therapeutics* (A) | 57,573 | 451 | ||||||
Orthofix International* | 12,400 | 445 | ||||||
Otonomy* | 9,857 | 349 | ||||||
Pacific Biosciences of California* | 6,700 | 39 | ||||||
Pacira Pharmaceuticals* | 3,883 | 345 | ||||||
Parexel International* | 5,340 | 369 | ||||||
Pernix Therapeutics Holdings* | 2,100 | 22 | ||||||
PharMerica* | 22,986 | 648 | ||||||
POZEN* | 38,500 | 297 | ||||||
Premier, Cl A* | 23,234 | 873 | ||||||
Prestige Brands Holdings, Cl A* | 21,725 | 932 | ||||||
Progenics Pharmaceuticals* (A) | 80,506 | 481 | ||||||
Providence Service* | 3,192 | 169 | ||||||
PTC Therapeutics* | 4,370 | 266 | ||||||
Puma Biotechnology* | 5,132 | 1,212 | ||||||
RadNet* | 13,600 | 114 | ||||||
Receptos* | 6,926 | 1,142 | ||||||
Relypsa* | 36,009 | 1,299 | ||||||
Repligen* | 7,593 | 231 | ||||||
Repros Therapeutics* | 13,700 | 118 | ||||||
Retrophin* (A) | 8,200 | 196 | ||||||
Sage Therapeutics* (A) | 18,674 | 938 | ||||||
Sangamo Biosciences* | 31,700 | 497 | ||||||
SciClone Pharmaceuticals* | 18,600 | 165 | ||||||
Sirona Dental Systems, Cl A* | 9,176 | 826 | ||||||
Spectranetics* (A) | 22,061 | 767 | ||||||
STERIS, Cl A | 10,218 | 718 | ||||||
| 4 | SEI Institutional Managed Trust / Semi-Annual Report / March 31, 2015 |
SCHEDULE OF INVESTMENTS (Unaudited)
Small Cap Fund
March 31, 2015
| Description | Shares | Market Value ($ Thousands) | ||||||
Sucampo Pharmaceuticals, Cl A* | 48,620 | $ | 757 | |||||
Supernus Pharmaceuticals* | 11,100 | 134 | ||||||
Surgical Care Affiliates* | 12,914 | 443 | ||||||
Symmetry Surgical* | 4,775 | 35 | ||||||
Synageva BioPharma, Cl A* (A) | 4,170 | 407 | ||||||
Team Health Holdings* | 22,077 | 1,292 | ||||||
TESARO* (A) | 20,462 | 1,174 | ||||||
Tetraphase Pharmaceuticals* | 33,267 | 1,219 | ||||||
TG Therapeutics* | 33,803 | 523 | ||||||
Thoratec* | 1,100 | 46 | ||||||
Trinity Biotech ADR | 33,200 | 639 | ||||||
Triple-S Management, Cl B* | 9,500 | 189 | ||||||
Ultragenyx Pharmaceutical* | 5,495 | 341 | ||||||
US Physical Therapy | 11,118 | 528 | ||||||
WellCare Health Plans* | 11,578 | 1,059 | ||||||
Xencor* | 23,611 | 362 | ||||||
XenoPort* | 26,600 | 189 | ||||||
Zeltiq Aesthetics* | 16,759 | 517 | ||||||
ZS Pharma* | 7,921 | 333 | ||||||
|
| |||||||
| 98,960 | ||||||||
|
| |||||||
Industrials — 14.4% | ||||||||
AAON | 3,600 | 88 | ||||||
AAR | 17,111 | 525 | ||||||
Acacia Research | 79,300 | 849 | ||||||
ACCO Brands* | 193,100 | 1,605 | ||||||
Actuant, Cl A | 60,747 | 1,442 | ||||||
Acuity Brands | 3,697 | 622 | ||||||
Aegean Marine Petroleum Network | 9,200 | 132 | ||||||
Aegion, Cl A* | 16,800 | 303 | ||||||
Aerovironment* | 5,600 | 149 | ||||||
AGCO (A) | 11,497 | 548 | ||||||
Air Transport Services Group* | 42,500 | 392 | ||||||
Allegiant Travel, Cl A | 2,951 | 567 | ||||||
American Woodmark* | 5,200 | 285 | ||||||
Apogee Enterprises | 27,433 | 1,185 | ||||||
ArcBest | 6,400 | 243 | ||||||
Argan | 10,300 | 373 | ||||||
Astronics, Cl B* | 1,476 | 108 | ||||||
Astronics* | 15,443 | 1,138 | ||||||
Atlas Air Worldwide Holdings* | 42,796 | 1,841 | ||||||
Barnes Group | 23,040 | 933 | ||||||
Beacon Roofing Supply* | 13,586 | 425 | ||||||
Blount International* | 7,300 | 94 | ||||||
Brady, Cl A | 12,450 | 352 | ||||||
CAI International* | 1,800 | 44 | ||||||
Carlisle | 13,421 | 1,243 | ||||||
Celadon Group | 16,100 | 438 | ||||||
CIRCOR International | 700 | 38 | ||||||
Clarcor | 14,140 | 934 | ||||||
Corporate Executive Board | 12,039 | 961 | ||||||
Covenant Transportation Group, Cl A* | 22,565 | 748 | ||||||
Crane, Cl A | 15,820 | 987 | ||||||
Curtiss-Wright | 16,340 | 1,208 | ||||||
Deluxe | 15,524 | 1,076 | ||||||
Ducommun* | 10,420 | 270 | ||||||
DXP Enterprises* | 13,670 | 603 | ||||||
Dycom Industries* | 53,897 | 2,632 | ||||||
EMCOR Group | 32,535 | 1,512 | ||||||
EnerSys | 12,306 | 791 | ||||||
Engility Holdings | 17,723 | 532 | ||||||
Esterline Technologies* | 6,331 | 724 | ||||||
Exponent | 2,200 | 195 | ||||||
| Description | Shares | Market Value ($ Thousands) | ||||||
Forward Air | 25,858 | $ | 1,404 | |||||
FreightCar America, Cl A | 36,345 | 1,142 | ||||||
FTI Consulting* | 13,900 | 521 | ||||||
G&K Services | 12,898 | 936 | ||||||
GenCorp* | 42,882 | 995 | ||||||
Generac Holdings* | 9,200 | 448 | ||||||
Genesee & Wyoming, Cl A* | 11,609 | 1,120 | ||||||
Global Brass & Copper Holdings | 5,700 | 88 | ||||||
Global Power Equipment Group | 39,700 | 524 | ||||||
GP Strategies* | 1,700 | 63 | ||||||
GrafTech International* | 100,100 | 389 | ||||||
Great Lakes Dredge & Dock* | 173,200 | 1,041 | ||||||
Greenbrier (A) | 6,582 | 382 | ||||||
H&E Equipment Services | 53,497 | 1,337 | ||||||
Hawaiian Holdings* | 28,547 | 629 | ||||||
Healthcare Services Group | 27,275 | 876 | ||||||
Hexcel, Cl A | 37,374 | 1,922 | ||||||
Hub Group, Cl A* | 9,685 | 381 | ||||||
Huron Consulting Group* | 14,090 | 932 | ||||||
Hyster-Yale Materials Handling | 16,550 | 1,213 | ||||||
ICF International, Cl A* | 6,800 | 278 | ||||||
IDEX | 12,777 | 969 | ||||||
Insperity, Cl A | 17,055 | 892 | ||||||
Interface, Cl A | 27,419 | 570 | ||||||
JetBlue Airways* | 28,600 | 551 | ||||||
John Bean Technologies, Cl A | 23,805 | 850 | ||||||
Kadant | 10,715 | 564 | ||||||
KAR Auction Services | 6,100 | 231 | ||||||
KBR | 21,600 | 313 | ||||||
Kelly Services, Cl A | 15,600 | 272 | ||||||
Kennametal | 29,200 | 984 | ||||||
Kforce | 1,200 | 27 | ||||||
Kirby* | 12,708 | 954 | ||||||
Knight Transportation | 15,956 | 515 | ||||||
Korn/Ferry International | 7,200 | 237 | ||||||
Kratos Defense & Security Solutions* | 22,200 | 123 | ||||||
LB Foster, Cl A | 6,600 | 313 | ||||||
Lincoln Electric Holdings | 15,130 | 989 | ||||||
Lindsay (A) | 7,802 | 595 | ||||||
Marten Transport | 3,200 | 74 | ||||||
Meritor* | 48,285 | 609 | ||||||
Middleby* | 11,397 | 1,170 | ||||||
Mobile Mini | 16,680 | 711 | ||||||
Moog, Cl A* | 6,600 | 495 | ||||||
MSA Safety | 1,200 | 60 | ||||||
MYR Group* | 33,073 | 1,036 | ||||||
Navigant Consulting* | 7,900 | 102 | ||||||
Orion Marine Group* | 23,700 | 210 | ||||||
PAM Transportation Services* | 1,300 | 74 | ||||||
Patrick Industries* | 11,595 | 722 | ||||||
Pitney Bowes | 21,200 | 494 | ||||||
Primoris Services | 94,125 | 1,618 | ||||||
Quality Distribution* | 15,500 | 160 | ||||||
Rand Logistics* | 24,200 | 79 | ||||||
RBC Bearings | 9,782 | 749 | ||||||
Republic Airways Holdings* | 9,400 | 129 | ||||||
Resources Connection | 9,100 | 159 | ||||||
Rush Enterprises, Cl A* | 22,801 | 624 | ||||||
Safe Bulkers (A) | 33,600 | 120 | ||||||
Saia* | 14,142 | 626 | ||||||
Scorpio Bulkers* | 31,300 | 74 | ||||||
Spirit AeroSystems Holdings, Cl A* | 21,900 | 1,143 | ||||||
| 5 | SEI Institutional Managed Trust / Semi-Annual Report / March 31, 2015 |
SCHEDULE OF INVESTMENTS (Unaudited)
Small Cap Fund
March 31, 2015
| Description | Shares | Market Value ($ Thousands) | ||||||
Standex International | 4,600 | $ | 378 | |||||
Steelcase, Cl A | 53,202 | 1,008 | ||||||
Swift Transportation, Cl A* | 60,421 | 1,572 | ||||||
Titan Machinery* (A) | 76,587 | 1,022 | ||||||
Trex* | 8,130 | 443 | ||||||
Triumph Group | 33,300 | 1,989 | ||||||
TrueBlue* | 21,052 | 513 | ||||||
Tutor Perini* | 44,100 | 1,030 | ||||||
Unifirst | 1,100 | 129 | ||||||
United Rentals* | 7,546 | 688 | ||||||
US Ecology | 12,106 | 605 | ||||||
USG* | 33,410 | 892 | ||||||
UTI Worldwide* | 37,934 | 467 | ||||||
Valmont Industries (A) | 7,194 | 884 | ||||||
Viad | 5,300 | 147 | ||||||
Wabash National* | 40,189 | 567 | ||||||
Werner Enterprises | 7,500 | 236 | ||||||
Wesco Aircraft Holdings* | 104,200 | 1,597 | ||||||
WESCO International* (A) | 9,825 | 686 | ||||||
XPO Logistics* | 11,841 | 538 | ||||||
|
| |||||||
| 82,334 | ||||||||
|
| |||||||
Information Technology — 19.4% | ||||||||
ACI Worldwide* | 35,785 | 775 | ||||||
Advanced Energy Industries* | 51,185 | 1,313 | ||||||
Alliance Fiber Optic Products | 25,400 | 442 | ||||||
Amkor Technology* | 43,600 | 385 | ||||||
Anixter International* | 2,300 | 175 | ||||||
Arista Networks* | 7,275 | 513 | ||||||
Aspen Technology* | 55,548 | 2,138 | ||||||
AVG Technologies* | 24,208 | 524 | ||||||
Barracuda Networks* | 13,726 | 528 | ||||||
Belden | 9,483 | 887 | ||||||
Benchmark Electronics* | 27,909 | 671 | ||||||
Black Box | 34,700 | 726 | ||||||
Blackbaud, Cl A | 40,747 | 1,931 | ||||||
Blucora* | 2,800 | 38 | ||||||
Brightcove* | 8,700 | 64 | ||||||
BroadSoft* | 16,598 | 555 | ||||||
Brooks Automation | 45,129 | 525 | ||||||
Cabot Microelectronics* | 5,300 | 265 | ||||||
CACI International, Cl A* | 13,535 | 1,217 | ||||||
Calix* | 33,200 | 279 | ||||||
Callidus Software* | 64,770 | 821 | ||||||
Carbonite* | 5,300 | 76 | ||||||
Cavium* | 42,960 | 3,043 | ||||||
Checkpoint Systems | 5,300 | 57 | ||||||
Ciber* | 115,400 | 475 | ||||||
Ciena* (A) | 25,354 | 490 | ||||||
Cimpress* | 11,767 | 993 | ||||||
Cirrus Logic* | 22,156 | 737 | ||||||
Clearfield* (A) | — | — | ||||||
CommScope Holding* | 19,055 | 544 | ||||||
Computer Task Group | 21,500 | 157 | ||||||
Comtech Telecommunications | 4,300 | 125 | ||||||
Comverse* | 2,300 | 45 | ||||||
Constant Contact* | 5,400 | 206 | ||||||
Cornerstone OnDemand* | 17,797 | 514 | ||||||
CoStar Group* | 4,958 | 981 | ||||||
Cray* | 26,180 | 735 | ||||||
Cypress Semiconductor | 98,711 | 1,393 | ||||||
Daktronics | 6,700 | 72 | ||||||
Dealertrack Technologies* | 58,528 | 2,255 | ||||||
Demand Media* | 11,900 | 68 | ||||||
Demandware* (A) | 15,604 | 950 | ||||||
| Description | Shares | Market Value ($ Thousands) | ||||||
Dice Holdings* | 20,200 | $ | 180 | |||||
Digi International* | 46,100 | 460 | ||||||
Diodes* | 18,800 | 537 | ||||||
Dot Hill Systems* | 76,800 | 407 | ||||||
DTS* | 1,100 | 37 | ||||||
EarthLink Holdings | 18,400 | 82 | ||||||
Ebix | 13,273 | 403 | ||||||
Emulex* | 3,200 | 25 | ||||||
Endurance International Group Holdings* | 27,253 | 520 | ||||||
Entegris* | 138,471 | 1,896 | ||||||
Entropic Communications* | 49,100 | 145 | ||||||
Envestnet* | 39,182 | 2,197 | ||||||
EPAM Systems* | 6,000 | 368 | ||||||
EPIQ Systems | 900 | 16 | ||||||
ePlus* | 3,300 | 287 | ||||||
Euronet Worldwide* | 24,145 | 1,419 | ||||||
Exar* | 65,800 | 661 | ||||||
ExlService Holdings* | 1,900 | 71 | ||||||
Extreme Networks* | 127,300 | 402 | ||||||
Fabrinet* | 18,900 | 359 | ||||||
Fair Isaac | 6,266 | 556 | ||||||
Fairchild Semiconductor International* | 40,514 | 737 | ||||||
FEI | 4,372 | 334 | ||||||
Finisar* | 9,900 | 211 | ||||||
FormFactor* | 60,906 | 540 | ||||||
Fortinet* | 35,581 | 1,244 | ||||||
Gigamon* | 26,668 | 567 | ||||||
Global Cash Access Holdings* | 45,300 | 345 | ||||||
GrubHub* (A) | 11,929 | 542 | ||||||
Guidewire Software, Cl Z* (A) | 33,353 | 1,755 | ||||||
Harmonic, Cl A* | 28,400 | 210 | ||||||
HomeAway* | 20,293 | 612 | ||||||
HubSpot* | 13,519 | 539 | ||||||
Hutchinson Technology* | 2,850 | 7 | ||||||
Infinera* | 27,335 | 538 | ||||||
Infoblox* | 119,587 | 2,855 | ||||||
Inphi* | 28,967 | 517 | ||||||
Insight Enterprises* | 19,500 | 556 | ||||||
Integrated Device Technology* | 54,203 | 1,085 | ||||||
Interactive Intelligence Group* (A) | 9,820 | 404 | ||||||
Intersil, Cl A | 144,842 | 2,074 | ||||||
IPG Photonics* (A) | 5,746 | 533 | ||||||
j2 Global | 7,661 | 503 | ||||||
Kofax* | 48,500 | 531 | ||||||
Lattice Semiconductor* | 61,900 | 393 | ||||||
Littelfuse | 8,006 | 796 | ||||||
LivePerson* | 12,100 | 124 | ||||||
LogMeIn* | 2,000 | 112 | ||||||
M* | 14,504 | 540 | ||||||
Manhattan Associates* | 8,600 | 435 | ||||||
MAXIMUS | 29,541 | 1,972 | ||||||
Mellanox Technologies* | 18,450 | 837 | ||||||
Mentor Graphics | 74,002 | 1,778 | ||||||
Methode Electronics | 18,000 | 847 | ||||||
MoneyGram International* | 11,400 | 99 | ||||||
Monolithic Power Systems | 16,796 | 884 | ||||||
Monotype Imaging Holdings | 13,300 | 434 | ||||||
NetScout Systems* (A) | 1,900 | 83 | ||||||
Newport* | 4,100 | 78 | ||||||
NIC | 2,400 | 42 | ||||||
Nimble Storage* (A) | 21,455 | 479 | ||||||
OmniVision Technologies* | 87,800 | 2,315 | ||||||
| 6 | SEI Institutional Managed Trust / Semi-Annual Report / March 31, 2015 |
SCHEDULE OF INVESTMENTS (Unaudited)
Small Cap Fund
March 31, 2015
| Description | Shares | Market Value ($ Thousands) | ||||||
ON Semiconductor* | 46,869 | $ | 568 | |||||
Orbotech* | 32,900 | 527 | ||||||
OSI Systems* | 19,900 | 1,478 | ||||||
Pandora Media* | 26,368 | 427 | ||||||
PDF Solutions* | 12,000 | 215 | ||||||
Pegasystems | 1,800 | 39 | ||||||
Pericom Semiconductor, Cl A | 8,100 | 125 | ||||||
Photronics* | 66,223 | 563 | ||||||
Plantronics | 10,500 | 556 | ||||||
Plexus* | 16,849 | 687 | ||||||
Polycom* | 3,600 | 48 | ||||||
PRGX Global* | 21,700 | 87 | ||||||
Procera Networks* (A) | 900 | 8 | ||||||
Proofpoint* | 32,376 | 1,917 | ||||||
Qlik Technologies* | 47,765 | 1,487 | ||||||
QLogic* | 93,333 | 1,376 | ||||||
Qorvo* | 19,119 | 1,524 | ||||||
Qualys* | 1,200 | 56 | ||||||
Quantum* | 10,400 | 17 | ||||||
Rally Software Development* | 35,620 | 559 | ||||||
RealD* | 39,808 | 509 | ||||||
Rofin-Sinar Technologies* | 2,100 | 51 | ||||||
Rogers* | 17,222 | 1,416 | ||||||
Ruckus Wireless* | 86,091 | 1,108 | ||||||
Sanmina* | 18,500 | 448 | ||||||
Scansource* | 3,700 | 150 | ||||||
Science Applications International | 4,800 | 246 | ||||||
ShoreTel* | 20,100 | 137 | ||||||
Shutterstock* (A) | 11,988 | 823 | ||||||
Silicon Graphics International* | 110,200 | 958 | ||||||
Silicon Laboratories* | 30,555 | 1,551 | ||||||
SolarWinds* | 24,688 | 1,265 | ||||||
Sonus Networks* | 11,500 | 91 | ||||||
SPS Commerce* | 27,256 | 1,829 | ||||||
SS&C Technologies Holdings | 18,217 | 1,135 | ||||||
Stamps.com* | 10,855 | 731 | ||||||
SunEdison* (A) | 22,217 | 533 | ||||||
Super Micro Computer* | 15,100 | 501 | ||||||
Sykes Enterprises* | 13,300 | 331 | ||||||
Synaptics* | 13,251 | 1,077 | ||||||
SYNNEX | 9,987 | 771 | ||||||
Tableau Software, Cl A* | 16,814 | 1,556 | ||||||
Take-Two Interactive Software, Cl A* | 54,194 | 1,380 | ||||||
Tech Data* | 10,830 | 626 | ||||||
TeleTech Holdings | 800 | 20 | ||||||
Tessera Technologies | 24,902 | 1,003 | ||||||
Tyler Technologies* | 300 | 36 | ||||||
Ultimate Software Group* | 11,171 | 1,899 | ||||||
Ultra Clean Holdings* | 12,500 | 89 | ||||||
Ultratech* | 7,200 | 125 | ||||||
Unisys* | 21,444 | 498 | ||||||
Universal Display* | 12,076 | 565 | ||||||
Vasco Data Security International* | 5,600 | 121 | ||||||
VeriFone Holdings* | 16,120 | 562 | ||||||
Verint Systems* | 27,325 | 1,692 | ||||||
Virtusa* | 1,700 | 70 | ||||||
Vishay Intertechnology | 47,862 | 661 | ||||||
WEX* | 10,354 | 1,112 | ||||||
Xcerra* | 61,900 | 550 | ||||||
XO Group* | 4,700 | 83 | ||||||
Zebra Technologies, Cl A* | 11,129 | 1,010 | ||||||
|
| |||||||
| 110,786 | ||||||||
|
| |||||||
| Description | Shares | Market Value ($ Thousands) | ||||||
Materials — 2.5% | ||||||||
American Vanguard, Cl B (A) | 22,900 | $ | 243 | |||||
Axiall | 5,000 | 235 | ||||||
Balchem | 9,145 | 507 | ||||||
Berry Plastics Group* | 54,311 | 1,965 | ||||||
Boise Cascade* | 13,880 | 520 | ||||||
Calgon Carbon | 8,300 | 175 | ||||||
Carpenter Technology | 6,700 | 260 | ||||||
Century Aluminum* | 1,200 | 17 | ||||||
Ferro* | 35,000 | 439 | ||||||
FutureFuel | 3,700 | 38 | ||||||
Globe Specialty Metals | 6,800 | 129 | ||||||
Gold Resource (A) | 41,600 | 133 | ||||||
Graphic Packaging Holding | 18,400 | 268 | ||||||
H.B. Fuller | 19,659 | 843 | ||||||
Headwaters, Cl A* | 44,395 | 814 | ||||||
Innophos Holdings | 4,000 | 225 | ||||||
Innospec | 300 | 14 | ||||||
Kaiser Aluminum | 4,793 | 368 | ||||||
KapStone Paper and Packaging | 4,800 | 157 | ||||||
Louisiana-Pacific* (A) | 27,912 | 461 | ||||||
LSB Industries* | 12,300 | 508 | ||||||
Materion | 4,100 | 158 | ||||||
Novagold Resources* | 57,500 | 170 | ||||||
PolyOne | 35,277 | 1,318 | ||||||
Quaker Chemical | 7,181 | 615 | ||||||
Schulman A | 5,600 | 270 | ||||||
Scotts Miracle-Gro, Cl A | 7,491 | 503 | ||||||
Senomyx* (A) | — | — | ||||||
Sensient Technologies | 21,547 | 1,484 | ||||||
Summit Materials, Cl A* | 24,345 | 539 | ||||||
US Concrete* | 22,146 | 751 | ||||||
Walter Energy (A) | — | — | ||||||
|
| |||||||
| 14,127 | ||||||||
|
| |||||||
Telecommunication Services — 0.5% | ||||||||
Cincinnati Bell, Cl A* | 4,500 | 16 | ||||||
IDT, Cl B | 7,700 | 136 | ||||||
inContact* | 45,753 | 499 | ||||||
Inteliquent | 19,700 | 310 | ||||||
Intelsat* | 1,600 | 19 | ||||||
magicJack VocalTec* | 13,000 | 89 | ||||||
RingCentral, Cl A* (A) | 90,109 | 1,382 | ||||||
Vonage Holdings* | 30,700 | 151 | ||||||
|
| |||||||
| 2,602 | ||||||||
|
| |||||||
Utilities — 1.9% | ||||||||
ALLETE | 34,003 | 1,794 | ||||||
American States Water | 1,800 | 72 | ||||||
Cadiz* (A) | 35,000 | 359 | ||||||
California Water Service Group, Cl A | 1,900 | 46 | ||||||
Chesapeake Utilities | 7,900 | 400 | ||||||
Cleco | 8,200 | 447 | ||||||
Dynegy, Cl A* | 20,200 | 635 | ||||||
Empire District Electric | 23,800 | 591 | ||||||
Idacorp, Cl A | 1,300 | 82 | ||||||
Laclede Group | 500 | 26 | ||||||
New Jersey Resources | 17,400 | 540 | ||||||
NorthWestern | 13,825 | 744 | ||||||
Otter Tail | 5,500 | 177 | ||||||
Piedmont Natural Gas (A) | 10,000 | 369 | ||||||
PNM Resources | 61,861 | 1,806 | ||||||
Portland General Electric | 8,900 | 330 | ||||||
South Jersey Industries, Cl A | 10,110 | 549 | ||||||
| 7 | SEI Institutional Managed Trust / Semi-Annual Report / March 31, 2015 |
SCHEDULE OF INVESTMENTS (Unaudited)
Small Cap Fund
March 31, 2015
| Description | Shares/Number of ($ Thousands) | Market Value ($ Thousands) | ||||||
Southwest Gas | 2,000 | $ | 116 | |||||
UIL Holdings | 27,200 | 1,398 | ||||||
Vivint Solar* | 41,083 | 499 | ||||||
|
| |||||||
| 10,980 | ||||||||
|
| |||||||
Total Common Stock | 539,154 | |||||||
|
| |||||||
EXCHANGE TRADED FUNDS — 0.4% |
| |||||||
iShares Russell 2000 Growth ETF (A) | 8,426 | 1,277 | ||||||
iShares Russell 2000 Value ETF | 8,800 | 908 | ||||||
|
| |||||||
Total Exchange Traded Funds | 2,185 | |||||||
|
| |||||||
RIGHTS — 0.0% |
| |||||||
Allos Therapeutics* | 45,500 | — | ||||||
Furiex Pharmaceuticals - CVR* | 300 | — | ||||||
|
| |||||||
Total Rights | — | |||||||
|
| |||||||
AFFILIATED PARTNERSHIP — 6.9% |
| |||||||
SEI Liquidity Fund, L.P., | 39,269,182 | 39,269 | ||||||
|
| |||||||
Total Affiliated Partnership | 39,269 | |||||||
|
| |||||||
CASH EQUIVALENT — 5.3% |
| |||||||
SEI Daily Income Trust, | 30,029,177 | 30,029 | ||||||
|
| |||||||
Total Cash Equivalent | 30,029 | |||||||
|
| |||||||
U.S. TREASURY OBLIGATIONS — 0.3% |
| |||||||
U.S. Treasury Bills | $ | 1,836 | 1,836 | |||||
|
| |||||||
Total U.S. Treasury Obligations | 1,836 | |||||||
|
| |||||||
Total Investments — 107.2% | $ | 612,473 | ||||||
|
| |||||||
A list of the open futures contracts held by the Fund at March 31, 2015, is as follows:
| Type of Contract | Number of Contracts Long | Expiration Date | Unrealized Appreciation ($ Thousands) | |||||||||
Russell 2000 Index E-MINI | 143 | Jun-2015 | $ | 483 | ||||||||
|
| |||||||||||
For the period ended March 31, 2015, the total amount of all open futures contracts, as presented in the table above, are representative of the volume of activity for this derivative type during the year.
Percentages are based on Net Assets of $571,449 ($Thousands).
| * | Non-income producing security. |
| ** | Rate shown is the 7-day effective yield as of March 31, 2015. |
| † | Real Estate Investment Trust. |
| †† | Investment in Affiliated Security (see Note 6). |
| (A) | This security or a partial position of this security is on loan at March 31, 2015 (see Note 10). The total market value of securities on loan at March 31, 2015 was $37,842 ($ Thousands). |
| (B) | This security was purchased with cash collateral received from securities on loan (see Note 10). The total market value of such securities as of March 31, 2015 was $39,269 ($Thousands). |
| (C) | Security, or portion thereof, has been pledged as collateral on open futures contracts. |
| (D) | The rate reported is the effective yield at the time of purchase. |
| ADR | — American Depositary Receipt |
| Cl | — Class |
| ETF | — Exchange Traded Fund |
| L.P. | — Limited Partnership |
| PLC | — Public Limited Company |
The following is a summary of the inputs used as of March 31, 2015, in valuing the Fund’s investments and other financial instruments carried at value ($ Thousands):
| Investments in Securities | Level 1 | Level 2 | Level 3 | Total | ||||||||||||
Common Stock | $ | 539,154 | $ | — | $ | — | $ | 539,154 | ||||||||
Exchange Traded Funds | 2,185 | — | — | 2,185 | ||||||||||||
Rights | — | — | — | — | ||||||||||||
Affiliated Partnership | — | 39,269 | — | 39,269 | ||||||||||||
Cash Equivalent | 30,029 | — | — | 30,029 | ||||||||||||
U.S. Treasury Obligations | — | 1,836 | — | 1,836 | ||||||||||||
|
|
|
|
|
|
|
| |||||||||
Total Investments in Securities | $ | 571,368 | $ | 41,105 | $ | — | $ | 612,473 | ||||||||
|
|
|
|
|
|
|
| |||||||||
| Other Financial Instruments | Level 1 | Level 2 | Level 3 | Total | ||||||||||||
Futures Contracts* | ||||||||||||||||
Unrealized Appreciation | $ | 483 | $ | — | $ | — | $ | 483 | ||||||||
|
|
|
|
|
|
|
| |||||||||
Total Other Financial Instruments | $ | 483 | $ | — | $ | — | $ | 483 | ||||||||
|
|
|
|
|
|
|
| |||||||||
| * | Futures contracts are valued at the unrealized appreciation on the instrument. |
For the period ended March 31, 2015, there were no transfers between Level 1 and Level 2 assets and liabilities.
For the period ended March 31, 2015, there were no transfers between Level 2 and Level 3 assets and liabilities.
For the period ended March 31, 2015, there were no level 3 investments.
For more information on valuation inputs, see Note 2 — Significant Accounting Policies in Notes to Financial Statements.
Amounts designated as “—” are $0 or have been rounded to $0.
The accompanying notes are an integral part of the financial statements.
| 8 | SEI Institutional Managed Trust / Semi-Annual Report / March 31, 2015 |
SCHEDULE OF INVESTMENTS (Unaudited)
Small Cap Value Fund
March 31, 2015
| Description | Shares | Market Value ($ Thousands) | ||||||
COMMON STOCK — 95.3% |
| |||||||
Consumer Discretionary — 11.2% |
| |||||||
AMC Entertainment Holdings, Cl A | 29,240 | $ | 1,038 | |||||
American Axle & Manufacturing Holdings* | 29,500 | 762 | ||||||
American Eagle Outfitters | 29,146 | 498 | ||||||
Arctic Cat | 19,754 | 717 | ||||||
Ascena Retail Group* | 16,800 | 244 | ||||||
Big 5 Sporting Goods | 14,100 | 187 | ||||||
Big Lots | 31,745 | 1,525 | ||||||
Boot Barn Holdings* | 33,985 | 813 | ||||||
Bravo Brio Restaurant Group* | 12,600 | 185 | ||||||
Bright Horizons Family Solutions* | 21,595 | 1,107 | ||||||
Brinker International | 7,500 | 462 | ||||||
Brunswick | 14,420 | 742 | ||||||
Cabela’s (A)* | 9,457 | 529 | ||||||
Callaway Golf (A) | 111,951 | 1,067 | ||||||
Carmike Cinemas* | 17,700 | 595 | ||||||
Children’s Place | 11,070 | 711 | ||||||
Core-Mark Holding, Cl A | 17,998 | 1,158 | ||||||
CROCS* | 45,100 | 533 | ||||||
CSS Industries | 24,100 | 727 | ||||||
Dana Holding | 47,495 | 1,005 | ||||||
Destination XL Group* | 32,000 | 158 | ||||||
Dorman Products (A)* | 11,946 | 594 | ||||||
Ethan Allen Interiors (A) | 31,175 | 862 | ||||||
Express* | 28,503 | 471 | ||||||
Finish Line, Cl A | 13,100 | 321 | ||||||
Genesco* | 8,530 | 608 | ||||||
Gentherm* | 19,005 | 960 | ||||||
Haverty Furniture | 9,400 | 234 | ||||||
Hyatt Hotels, Cl A* | 650 | 39 | ||||||
Journal Communications, Cl A* | 10,198 | 151 | ||||||
K12* | 40,400 | 635 | ||||||
Krispy Kreme Doughnuts* | 47,657 | 953 | ||||||
La Quinta Holdings* | 48,457 | 1,147 | ||||||
La-Z-Boy, Cl Z | 38,010 | 1,068 | ||||||
Libbey | 31,400 | 1,253 | ||||||
Marriott Vacations Worldwide | 13,280 | 1,076 | ||||||
Matthews International, Cl A | 33,320 | 1,716 | ||||||
MDC Partners, Cl A | 53,800 | 1,525 | ||||||
Men’s Wearhouse | 10,226 | 534 | ||||||
Meredith | 12,010 | 670 | ||||||
NACCO Industries, Cl A | 6,900 | 366 | ||||||
New Remy Holdco* | 6,831 | 152 | ||||||
Outerwall (A) | 4,600 | 304 | ||||||
Oxford Industries, Cl A | 4,707 | 355 | ||||||
Pep Boys-Manny Moe & Jack* | 33,270 | 320 | ||||||
Pier 1 Imports | 14,047 | 196 | ||||||
Pool | 15,335 | 1,070 | ||||||
Popeyes Louisiana Kitchen* | 12,308 | 736 | ||||||
Rent-A-Center | 22,000 | 604 | ||||||
Ryland Group | 15,845 | 772 | ||||||
Scientific Games, Cl A (A)* | 25,803 | 270 | ||||||
Select Comfort* | 15,827 | 545 | ||||||
Shoe Carnival | 7,400 | 218 | ||||||
Smith & Wesson Holding* | 34,100 | 434 | ||||||
Stage Stores | 21,300 | 488 | ||||||
Standard Motor Products | 8,000 | 338 | ||||||
Starwood Hotels & Resorts Worldwide | 450 | 38 | ||||||
Steven Madden* | 11,634 | 442 | ||||||
Stoneridge* | 23,900 | 270 | ||||||
| Description | Shares | Market Value ($ Thousands) | ||||||
TRI Pointe Homes* | 13,800 | $ | 213 | |||||
Universal Electronics* | 14,150 | 799 | ||||||
Vail Resorts | 15,889 | 1,643 | ||||||
Vera Bradley (A)* | 12,833 | 208 | ||||||
Vista Outdoor* | 33,215 | 1,422 | ||||||
Vitamin Shoppe* | 18,600 | 766 | ||||||
Wolverine World Wide | 45,155 | 1,510 | ||||||
|
| |||||||
| 44,059 | ||||||||
|
| |||||||
Consumer Staples — 2.6% | ||||||||
Casey’s General Stores | 3,686 | 332 | ||||||
Darling Ingredients* | 76,840 | 1,076 | ||||||
Fresh Del Monte Produce (A) | 19,500 | 759 | ||||||
Ingles Markets, Cl A | 19,800 | 980 | ||||||
J&J Snack Foods | 7,205 | 769 | ||||||
Landec* | 70,300 | 981 | ||||||
Roundy’s* | 22,600 | 110 | ||||||
Snyder’s-Lance | 36,963 | 1,181 | ||||||
SpartanNash | 58,865 | 1,858 | ||||||
TreeHouse Foods* | 6,399 | 544 | ||||||
Universal (A) | 21,600 | 1,019 | ||||||
USANA Health Sciences* | 2,600 | 289 | ||||||
Weis Markets | 4,700 | 234 | ||||||
|
| |||||||
| 10,132 | ||||||||
|
| |||||||
Energy — 4.0% | ||||||||
Alon USA Energy (A) | 25,100 | 416 | ||||||
Approach Resources, Cl A (A)* | 179,500 | 1,183 | ||||||
Bill Barrett (A)* | 123,100 | 1,022 | ||||||
Bonanza Creek Energy* | 11,995 | 296 | ||||||
Carrizo Oil & Gas* | 21,058 | 1,046 | ||||||
Cloud Peak Energy* | 23,300 | 136 | ||||||
Dawson Geophysical* | 8,812 | 38 | ||||||
DHT Holdings | 53,000 | 370 | ||||||
Diamondback Energy, Cl A* | 5,448 | 419 | ||||||
Energy XXI (A) | 30,252 | 110 | ||||||
Exterran Holdings | 15,670 | 526 | ||||||
GasLog | 16,275 | 316 | ||||||
Green Plains | 18,900 | 540 | ||||||
Gulfport Energy* | 10,500 | 482 | ||||||
Helix Energy Solutions Group* | 23,405 | 350 | ||||||
Hercules Offshore (A)* | 197,200 | 83 | ||||||
Key Energy Services* | 30,782 | 56 | ||||||
McDermott International (A)* | 19,883 | 76 | ||||||
Navigator Holdings* | 32,800 | 626 | ||||||
Newpark Resources, Cl A* | 37,200 | 339 | ||||||
Northern Oil And Gas (A)* | 36,400 | 281 | ||||||
Nuverra Environmental Solutions (A)* | 24,900 | 89 | ||||||
Oasis Petroleum (A)* | 17,738 | 252 | ||||||
Oil States International* | 19,150 | 761 | ||||||
Parker Drilling* | 90,900 | 317 | ||||||
PDC Energy, Cl A* | 7,455 | 403 | ||||||
Ring Energy (A)* | 16,046 | 170 | ||||||
Rosetta Resources* | 7,594 | 129 | ||||||
Scorpio Tankers (A) | 183,900 | 1,732 | ||||||
StealthGas* | 79,300 | 519 | ||||||
Superior Energy Services | 64,235 | 1,435 | ||||||
TETRA Technologies* | 139,365 | 861 | ||||||
Unit* | 10,900 | 305 | ||||||
VAALCO Energy* | 7,000 | 17 | ||||||
Warren Resources* | 117,300 | 104 | ||||||
|
| |||||||
| 15,805 | ||||||||
|
| |||||||
| 1 | SEI Institutional Managed Trust / Semi-Annual Report / March 31, 2015 |
SCHEDULE OF INVESTMENTS (Unaudited)
Small Cap Value Fund
March 31, 2015
| Description | Shares | Market Value ($ Thousands) | ||||||
Financials — 35.8%‡ | ||||||||
1st Source | 23,100 | $ | 742 | |||||
Acadia Realty Trust† | 26,105 | 911 | ||||||
Agree Realty† | 8,280 | 273 | ||||||
Alexandria Real Estate Equities† | 950 | 93 | ||||||
American Assets Trust† | 22,835 | 988 | ||||||
American Campus Communities† | 16,820 | 721 | ||||||
American Capital Mortgage Investment† | 19,600 | 352 | ||||||
American Equity Investment Life Holding | 14,700 | 428 | ||||||
American National Bankshares | 700 | 16 | ||||||
Ameris Bancorp | 2,144 | 57 | ||||||
AmTrust Financial Services (A) | 5,600 | 319 | ||||||
Anchor BanCorp Wisconsin* | 850 | 30 | ||||||
Anworth Mortgage Asset† | 61,400 | 313 | ||||||
Apartment Investment & Management, Cl A† | 2,203 | 87 | ||||||
Arrow Financial | 2,268 | 62 | ||||||
Ashford* | 708 | 84 | ||||||
Ashford Hospitality Prime† | 3,860 | 65 | ||||||
Ashford Hospitality Trust† | 61,600 | 593 | ||||||
Aspen Insurance Holdings | 9,700 | 458 | ||||||
AvalonBay Communities† | 819 | 143 | ||||||
BancFirst | 2,100 | 128 | ||||||
Banco Latinoamericano de Exportaciones, Cl E | 32,100 | 1,053 | ||||||
Bancorpsouth, Cl A (A) | 13,850 | 322 | ||||||
Bank of Marin Bancorp | 1,450 | 74 | ||||||
Bank of the Ozarks (A) | 22,875 | 845 | ||||||
BankFinancial | 1,900 | 25 | ||||||
BankUnited | 10,129 | 332 | ||||||
Banner | 4,250 | 195 | ||||||
BBCN Bancorp | 11,450 | 166 | ||||||
Beneficial Bancorp* | 5,974 | 68 | ||||||
Berkshire Hills Bancorp | 31,315 | 867 | ||||||
BioMed Realty Trust† | 4,850 | 110 | ||||||
BlackRock Capital Investment | 52,500 | 476 | ||||||
Blackstone Mortgage Trust, Cl A† | 29,529 | 838 | ||||||
BNC Bancorp | 4,350 | 79 | ||||||
Boston Private Financial Holdings | 50,698 | 616 | ||||||
Boston Properties† | 685 | 96 | ||||||
Brandywine Realty Trust† | 110,005 | 1,758 | ||||||
Brixmor Property Group† | 2,850 | 76 | ||||||
Brookline Bancorp, Cl A | 15,050 | 151 | ||||||
Bryn Mawr Bank | 2,100 | 64 | ||||||
Camden National | 12,600 | 502 | ||||||
Capitol Federal Financial | 94,175 | 1,177 | ||||||
Capstead Mortgage† | 30,900 | 364 | ||||||
Cardinal Financial | 9,289 | 186 | ||||||
Cascade Bancorp* | 56,779 | 272 | ||||||
CatchMark Timber Trust, Cl A† | 69,100 | 810 | ||||||
Cathay General Bancorp | 3,500 | 100 | ||||||
CBL & Associates Properties† | 28,700 | 568 | ||||||
Cedar Realty Trust† | 104,000 | 779 | ||||||
CenterState Banks | 2,000 | 24 | ||||||
Central Pacific Financial | 69,700 | 1,601 | ||||||
Chatham Lodging Trust† | 13,300 | 391 | ||||||
Chemical Financial | 4,200 | 132 | ||||||
Chesapeake Lodging Trust† | 22,550 | 763 | ||||||
Citizens & Northern | 2,050 | 41 | ||||||
City Holding | 3,400 | 160 | ||||||
CNB Financial | 2,700 | 46 | ||||||
CNO Financial Group | 168,120 | 2,895 | ||||||
| Description | Shares | Market Value ($ Thousands) | ||||||
CoBiz Financial | 58,317 | $ | 718 | |||||
Columbia Banking System | 36,465 | 1,056 | ||||||
Columbia Property Trust† | 1,250 | 34 | ||||||
Community Bank System | 900 | 32 | ||||||
Community Trust Bancorp | 14,480 | 480 | ||||||
Corporate Office Properties Trust† | 28,233 | 829 | ||||||
CubeSmart† | 3,950 | 95 | ||||||
Customers Bancorp* | 50,500 | 1,230 | ||||||
CVB Financial | 3,000 | 48 | ||||||
CYS Investments† | 21,700 | 193 | ||||||
DCT Industrial Trust† | 12,400 | 430 | ||||||
DDR† | 3,550 | 66 | ||||||
Dime Community Bancshares | 3,600 | 58 | ||||||
Douglas Emmett† | 28,075 | 837 | ||||||
Duke Realty† | 3,930 | 86 | ||||||
DuPont Fabros Technology† | 23,300 | 761 | ||||||
Dynex Capital† | 37,400 | 317 | ||||||
Eagle Bancorp* | 50,306 | 1,932 | ||||||
EastGroup Properties† | 7,515 | 452 | ||||||
Education Realty Trust† | 42,699 | 1,511 | ||||||
Employers Holdings | 74,420 | 2,009 | ||||||
Endurance Specialty Holdings | 14,694 | 898 | ||||||
Enterprise Bancorp | 1,100 | 23 | ||||||
Enterprise Financial Services | 3,150 | 65 | ||||||
EPR Properties, Cl A† | 12,105 | 727 | ||||||
Equity LifeStyle Properties† | 1,100 | 60 | ||||||
Equity One, Cl A† | 23,643 | 631 | ||||||
Equity Residential† | 2,000 | 156 | ||||||
Essex Property Trust† | 259 | 60 | ||||||
EverBank Financial, Cl A | 76,090 | 1,372 | ||||||
Evercore Partners, Cl A | 21,745 | 1,123 | ||||||
Excel Trust† | 47,000 | 659 | ||||||
Extra Space Storage† | 600 | 41 | ||||||
Ezcorp, Cl A (A)* | 11,400 | 104 | ||||||
FBR* | 34,700 | 802 | ||||||
FCB Financial Holdings, Cl A* | 500 | 14 | ||||||
Federal Agricultural Mortgage, Cl C | 14,900 | 420 | ||||||
Federated Investors, Cl B (A) | 11,864 | 402 | ||||||
FelCor Lodging Trust† | 90,900 | 1,044 | ||||||
Fidelity & Guaranty Life | 55,200 | 1,170 | ||||||
Fidelity Southern | 4,462 | 75 | ||||||
Financial Institutions | 2,000 | 46 | ||||||
First American Financial | 18,710 | 668 | ||||||
First Bancorp | 4,150 | 73 | ||||||
First BanCorp Puerto Rico* | 30,800 | 191 | ||||||
First Busey | 14,300 | 96 | ||||||
First Business Financial Services | 1,200 | 52 | ||||||
First Citizens BancShares, Cl A | 1,000 | 260 | ||||||
First Commonwealth Financial | 78,200 | 704 | ||||||
First Community Bancshares | 24,445 | 428 | ||||||
First Defiance Financial | 2,600 | 85 | ||||||
First Financial | 2,900 | 104 | ||||||
First Financial Northwest | 350 | 4 | ||||||
First Horizon National | 59,105 | 845 | ||||||
First Interstate BancSystem, Cl A | 22,000 | 612 | ||||||
First Merchants | 9,650 | 227 | ||||||
First Midwest Bancorp | 12,800 | 222 | ||||||
First NBC Bank Holding* | 8,820 | 291 | ||||||
First of Long Island | 300 | 8 | ||||||
FirstMerit, Cl A | 9,605 | 183 | ||||||
Flagstar Bancorp* | 4,550 | 66 | ||||||
Flushing Financial | 50,925 | 1,022 | ||||||
FNB (Pennsylvania) | 19,650 | 258 | ||||||
| 2 | SEI Institutional Managed Trust / Semi-Annual Report / March 31, 2015 |
SCHEDULE OF INVESTMENTS (Unaudited)
Small Cap Value Fund
March 31, 2015
| Description | Shares | Market Value ($ Thousands) | ||||||
FNFV Group (A)* | 25,900 | $ | 365 | |||||
Forest City Enterprises, Cl A* | 25,105 | 641 | ||||||
Franklin Street Properties† | 26,000 | 333 | ||||||
Fulton Financial | 144,560 | 1,784 | ||||||
General Growth Properties† | 2,582 | 76 | ||||||
GEO Group† | 36,800 | 1,610 | ||||||
German American Bancorp | 2,250 | 66 | ||||||
Glacier Bancorp, Cl A | 33,385 | 840 | ||||||
Gladstone Commercial† | 20,500 | 382 | ||||||
Gramercy Property Trust† | 37,775 | 1,060 | ||||||
Great Southern Bancorp | 2,100 | 83 | ||||||
Great Western Bancorp | 6,850 | 151 | ||||||
Green Bancorp* | 2,800 | 31 | ||||||
Guaranty Bancorp | 1,500 | 25 | ||||||
Hancock Holding, Cl A | 34,424 | 1,028 | ||||||
Hanover Insurance Group, Cl A | 61,828 | 4,488 | ||||||
Hatteras Financial† | 38,400 | 697 | ||||||
HCP† | 2,462 | 106 | ||||||
Health Care† | 1,980 | 153 | ||||||
Heartland Financial USA | 4,000 | 130 | ||||||
Hercules Technology Growth Capital, Cl A (A) | 24,200 | 326 | ||||||
Heritage Commerce | 3,000 | 27 | ||||||
Heritage Financial | 4,550 | 77 | ||||||
Heritage Oaks Bancorp | 700 | 6 | ||||||
Hersha Hospitality Trust, Cl A† | 57,300 | 371 | ||||||
Highwoods Properties† | 33,110 | 1,516 | ||||||
Hilltop Holdings* | 7,450 | 145 | ||||||
Home BancShares | 29,710 | 1,007 | ||||||
Home Loan Servicing Solutions (A) | 26,350 | 436 | ||||||
Horace Mann Educators, Cl A | 38,509 | 1,317 | ||||||
Horizon Bancorp | 2,175 | 51 | ||||||
Hospitality Properties Trust† | 12,900 | 426 | ||||||
Host Hotels & Resorts† | 4,206 | 85 | ||||||
IBERIABANK | 34,968 | 2,204 | ||||||
Independent Bank | 150 | 2 | ||||||
Infinity Property & Casualty | 10,809 | 887 | ||||||
Inland Real Estate† | 17,700 | 189 | ||||||
International Bancshares | 31,855 | 829 | ||||||
Investors Bancorp | 178,684 | 2,094 | ||||||
Janus Capital Group (A) | 18,000 | 309 | ||||||
Kemper, Cl A | 31,500 | 1,227 | ||||||
Kennedy-Wilson Holdings | 44,000 | 1,150 | ||||||
Kilroy Realty† | 400 | 30 | ||||||
Kimco Realty† | 2,550 | 68 | ||||||
Kite Realty Group Trust† | 2,100 | 59 | ||||||
Ladder Capital, Cl A† | 1,850 | 34 | ||||||
Lakeland Financial | 1,250 | 51 | ||||||
LaSalle Hotel Properties† | 21,320 | 828 | ||||||
LendingTree* | 100 | 6 | ||||||
Lexington Realty Trust† | 117,737 | 1,157 | ||||||
Liberty Property Trust† | 1,250 | 45 | ||||||
Macerich† | 811 | 68 | ||||||
Maiden Holdings | 94,000 | 1,394 | ||||||
MainSource Financial Group | 50,050 | 983 | ||||||
MB Financial | 26,429 | 827 | ||||||
Medical Properties Trust† | 71,425 | 1,053 | ||||||
Meridian Bancorp* | 53,100 | 699 | ||||||
Meta Financial Group | 2,950 | 117 | ||||||
Metro Bancorp | 1,500 | 41 | ||||||
MFA Financial† | 123,602 | 972 | ||||||
MGIC Investment* | 11,650 | 112 | ||||||
Mid-America Apartment Communities† | 450 | 35 | ||||||
| Description | Shares | Market Value ($ Thousands) | ||||||
MidSouth Bancorp | 4,000 | $ | 59 | |||||
MidWestOne Financial Group | 1,350 | 39 | ||||||
Montpelier Re Holdings | 19,300 | 742 | ||||||
Mortgage Investment Trust† | 16,600 | 313 | ||||||
National Bank Holdings, Cl A | 16,356 | 308 | ||||||
National Bankshares, Cl A | 1,050 | 31 | ||||||
National Health Investors† | 15,485 | 1,100 | ||||||
National Penn Bancshares | 64,554 | 695 | ||||||
NBT Bancorp | 5,850 | 147 | ||||||
Nelnet, Cl A | 25,500 | 1,207 | ||||||
Northfield Bancorp | 63,487 | 941 | ||||||
Northrim BanCorp | 2,200 | 54 | ||||||
Northwest Bancshares | 16,475 | 195 | ||||||
OceanFirst Financial | 30,300 | 523 | ||||||
OFG Bancorp (A) | 39,750 | 649 | ||||||
Old National Bancorp, Cl A | 60,350 | 856 | ||||||
Oppenheimer Holdings, Cl A | 11,000 | 258 | ||||||
Pacific Continental | 2,400 | 32 | ||||||
Pacific Premier Bancorp* | 1,500 | 24 | ||||||
PacWest Bancorp | 38,016 | 1,783 | ||||||
Palmetto Bancshares | 650 | 12 | ||||||
Pebblebrook Hotel Trust† | 22,114 | 1,030 | ||||||
Pennsylvania Real Estate Investment Trust† | 26,400 | 613 | ||||||
PennyMac Financial Services, Cl A* | 500 | 9 | ||||||
PennyMac Mortgage Investment Trust† | 18,700 | 398 | ||||||
Pinnacle Financial Partners | 550 | 24 | ||||||
Popular* | 61,700 | 2,122 | ||||||
Post Properties† | 350 | 20 | ||||||
Preferred Bank | 3,450 | 95 | ||||||
PrivateBancorp, Cl A | 35,450 | 1,247 | ||||||
ProLogis† | 4,139 | 180 | ||||||
Prosperity Bancshares (A) | 8,750 | 459 | ||||||
Provident Financial Services | 11,850 | 221 | ||||||
Public Storage† | 757 | 149 | ||||||
Radian Group (A) | 58,515 | 983 | ||||||
RAIT Financial Trust† | 9,799 | 67 | ||||||
Regency Centers† | 681 | 46 | ||||||
Renasant | 25,665 | 771 | ||||||
Republic Bancorp, Cl A (A) | 20,200 | 499 | ||||||
Retail Opportunity Investments† | 1,900 | 35 | ||||||
RLJ Lodging Trust† | 1,600 | 50 | ||||||
Rouse Properties† | 49,100 | 931 | ||||||
S&T Bancorp | 17,200 | 488 | ||||||
Safeguard Scientifics* | 29,837 | 540 | ||||||
Select Income† | 15,700 | 392 | ||||||
Selective Insurance Group | 32,935 | 957 | ||||||
Senior Housing Properties Trust† | 2,900 | 64 | ||||||
ServisFirst Bancshares | 2,500 | 82 | ||||||
Sierra Bancorp | 1,800 | 30 | ||||||
Simmons First National, Cl A | 2,600 | 118 | ||||||
Simon Property Group† | 1,594 | 312 | ||||||
SL Green Realty (A)† | 492 | 63 | ||||||
South State | 3,866 | 264 | ||||||
StanCorp Financial Group | 21,625 | 1,483 | ||||||
Starwood Property Trust† | 23,800 | 578 | ||||||
State Bank Financial | 64,700 | 1,359 | ||||||
Sterling Bancorp | 82,901 | 1,112 | ||||||
Stifel Financial* | 15,065 | 840 | ||||||
Stock Yards Bancorp | 3,050 | 105 | ||||||
Summit Hotel Properties† | 51,200 | 720 | ||||||
Sunstone Hotel Investors† | 18,895 | 315 | ||||||
| 3 | SEI Institutional Managed Trust / Semi-Annual Report / March 31, 2015 |
SCHEDULE OF INVESTMENTS (Unaudited)
Small Cap Value Fund
March 31, 2015
| Description | Shares | Market Value ($ Thousands) | ||||||
Susquehanna Bancshares | 19,502 | $ | 267 | |||||
Symetra Financial | 33,900 | 795 | ||||||
Talmer Bancorp, Cl A | 9,200 | 141 | ||||||
Taubman Centers† | 750 | 58 | ||||||
TCF Financial | 122,010 | 1,918 | ||||||
Texas Capital Bancshares* | 400 | 19 | ||||||
THL Credit | 24,700 | 304 | ||||||
Tompkins Financial | 11,300 | 608 | ||||||
TowneBank | 5,800 | 93 | ||||||
TriCo Bancshares | 550 | 13 | ||||||
TriState Capital Holdings* | 2,650 | 28 | ||||||
Triumph Bancorp* | 1,850 | 25 | ||||||
Trustmark | 6,050 | 147 | ||||||
Two Harbors Investment† | 37,000 | 393 | ||||||
UDR† | 2,500 | 85 | ||||||
UMB Financial | 2,450 | 130 | ||||||
Umpqua Holdings | 13,174 | 226 | ||||||
Union Bankshares | 23,000 | 511 | ||||||
United Bankshares (A) | 3,370 | 127 | ||||||
United Community Banks | 57,250 | 1,081 | ||||||
Univest Corp of Pennsylvania | 4,050 | 80 | ||||||
Validus Holdings | 25,456 | 1,072 | ||||||
Valley National Bancorp | 9,800 | 92 | ||||||
Ventas† | 1,419 | 104 | ||||||
Vornado Realty Trust† | 900 | 101 | ||||||
Walker & Dunlop* | 1,000 | 18 | ||||||
Washington Federal | 12,800 | 279 | ||||||
Webster Financial | 57,130 | 2,117 | ||||||
WesBanco | 15,150 | 494 | ||||||
West Bancorporation | 2,300 | 46 | ||||||
Western Alliance Bancorp* | 67,705 | 2,007 | ||||||
Western Asset Mortgage Capital (A)† | 24,400 | 368 | ||||||
Wilshire Bancorp | 17,800 | 177 | ||||||
Winthrop Realty Trust† | 34,700 | 566 | ||||||
Wintrust Financial | 31,605 | 1,507 | ||||||
World Acceptance (A)* | 5,149 | 375 | ||||||
WSFS Financial | 17,085 | 1,292 | ||||||
Yadkin Financial* | 58,900 | 1,196 | ||||||
|
| |||||||
| 141,258 | ||||||||
|
| |||||||
Health Care — 5.9% | ||||||||
Accuray (A)* | 170,500 | 1,586 | ||||||
Alere* | 11,000 | 538 | ||||||
Amsurg* | 37,987 | 2,337 | ||||||
AngioDynamics* | 41,885 | 745 | ||||||
Bio-Reference Laboratories* | 7,100 | 250 | ||||||
Charles River Laboratories International* | 14,719 | 1,167 | ||||||
Chemed | 2,400 | 287 | ||||||
Conmed | 15,015 | 758 | ||||||
Emergent Biosolutions* | 35,195 | 1,012 | ||||||
Exactech* | 12,600 | 323 | ||||||
Globus Medical, Cl A* | 44,210 | 1,116 | ||||||
Greatbatch* | 24,770 | 1,433 | ||||||
Halyard Health* | 19,505 | 960 | ||||||
HealthSouth | 36,300 | 1,610 | ||||||
Hill-Rom Holdings | 7,300 | 358 | ||||||
Ligand Pharmaceuticals (A)* | 14,655 | 1,130 | ||||||
Magellan Health* | 7,050 | 499 | ||||||
MEDNAX* | 8,885 | 644 | ||||||
Natus Medical* | 6,800 | 268 | ||||||
PDL BioPharma | 48,900 | 344 | ||||||
PerkinElmer | 17,470 | 893 | ||||||
PharMerica* | 9,900 | 279 | ||||||
| Description | Shares | Market Value ($ Thousands) | ||||||
PhotoMedex (A)* | 18,900 | $ | 38 | |||||
POZEN* | 8,500 | 66 | ||||||
Prestige Brands Holdings, Cl A* | 36,778 | 1,577 | ||||||
SciClone Pharmaceuticals* | 42,500 | 377 | ||||||
Select Medical Holdings | 68,400 | 1,015 | ||||||
Symmetry Surgical* | 7,850 | 57 | ||||||
Teleflex | 4,647 | 561 | ||||||
Trinity Biotech ADR | 53,500 | 1,030 | ||||||
|
| |||||||
| 23,258 | ||||||||
|
| |||||||
Industrials — 15.8% | ||||||||
AAR | 20,200 | 620 | ||||||
ACCO Brands* | 51,500 | 428 | ||||||
Actuant, Cl A | 14,332 | 340 | ||||||
Aegean Marine Petroleum Network | 14,900 | 214 | ||||||
Aegion, Cl A* | 27,200 | 491 | ||||||
Air Transport Services Group* | 52,200 | 482 | ||||||
Aircastle | 39,500 | 887 | ||||||
Alamo Group | 6,300 | 398 | ||||||
Alaska Air Group | 10,900 | 721 | ||||||
Altra Industrial Motion | 14,496 | 401 | ||||||
American Railcar Industries (A) | 5,800 | 288 | ||||||
Ampco-Pittsburgh | 7,500 | 131 | ||||||
Apogee Enterprises | 21,885 | 945 | ||||||
ArcBest | 9,200 | 349 | ||||||
Astronics* | 10,370 | 764 | ||||||
Astronics, Cl B* | 940 | 69 | ||||||
Atlas Air Worldwide Holdings* | 8,000 | 344 | ||||||
Barnes Group | 48,340 | 1,957 | ||||||
Brink’s | 28,900 | 798 | ||||||
Celadon Group | 25,900 | 705 | ||||||
CIRCOR International | 9,140 | 500 | ||||||
Clarcor | 17,350 | 1,146 | ||||||
Clean Harbors (A)* | 16,957 | 963 | ||||||
Curtiss-Wright | 38,929 | 2,878 | ||||||
Deluxe | 10,200 | 707 | ||||||
EMCOR Group | 33,291 | 1,547 | ||||||
EnPro Industries | 9,903 | 653 | ||||||
Esterline Technologies* | 7,800 | 893 | ||||||
Forward Air | 20,225 | 1,098 | ||||||
FreightCar America, Cl A | 37,600 | 1,182 | ||||||
FTI Consulting* | 22,400 | 839 | ||||||
G&K Services | 22,171 | 1,608 | ||||||
Generac Holdings (A)* | 27,515 | 1,340 | ||||||
Global Power Equipment Group | 64,500 | 851 | ||||||
GrafTech International* | 161,600 | 628 | ||||||
Great Lakes Dredge & Dock* | 279,800 | 1,682 | ||||||
Hawaiian Holdings* | 40,500 | 892 | ||||||
Healthcare Services Group | 33,470 | 1,075 | ||||||
Hexcel, Cl A | 14,372 | 739 | ||||||
Huron Consulting Group* | 24,998 | 1,654 | ||||||
Hyster-Yale Materials Handling | 11,000 | 806 | ||||||
ICF International, Cl A* | 8,900 | 364 | ||||||
Interface, Cl A | 37,526 | 780 | ||||||
ITT | 17,807 | 711 | ||||||
JetBlue Airways (A)* | 45,800 | 882 | ||||||
John Bean Technologies, Cl A | 24,930 | 890 | ||||||
Kadant | 33,737 | 1,775 | ||||||
KAR Auction Services | 24,986 | 948 | ||||||
KBR | 35,100 | 508 | ||||||
Korn/Ferry International | 19,328 | 635 | ||||||
LB Foster, Cl A | 5,700 | 271 | ||||||
Lydall* | 10,735 | 341 | ||||||
Meritor* | 40,300 | 508 | ||||||
| 4 | SEI Institutional Managed Trust / Semi-Annual Report / March 31, 2015 |
SCHEDULE OF INVESTMENTS (Unaudited)
Small Cap Value Fund
March 31, 2015
| Description | Shares | Market Value ($ Thousands) | ||||||
Moog, Cl A* | 8,604 | $ | 646 | |||||
MYR Group* | 11,500 | 360 | ||||||
Navigant Consulting* | 12,700 | 165 | ||||||
NN, Cl A | 300 | 8 | ||||||
Northwest Pipe* | 15,700 | 360 | ||||||
Orbital ATK | 4,500 | 345 | ||||||
Orion Marine Group* | 65,128 | 577 | ||||||
Pitney Bowes | 34,200 | 798 | ||||||
Primoris Services | 43,500 | 748 | ||||||
Quad | 18,500 | 425 | ||||||
Rand Logistics* | 50,700 | 165 | ||||||
Regal-Beloit | 9,168 | 733 | ||||||
Republic Airways Holdings (A)* | 35,200 | 484 | ||||||
RR Donnelley & Sons | 18,986 | 364 | ||||||
Safe Bulkers (A) | 31,000 | 111 | ||||||
Scorpio Bulkers* | 50,700 | 120 | ||||||
Skywest | 27,200 | 397 | ||||||
Standex International | 7,100 | 583 | ||||||
Steelcase, Cl A | 16,800 | 318 | ||||||
Swift Transportation, Cl A* | 20,600 | 536 | ||||||
TAL International Group (A) | 10,400 | 424 | ||||||
Team* | 13,243 | 516 | ||||||
Teledyne Technologies* | 4,667 | 498 | ||||||
Terex | 10,775 | 287 | ||||||
Tetra Tech | 23,350 | 561 | ||||||
Textainer Group Holdings | 8,400 | 252 | ||||||
Titan Machinery (A)* | 35,500 | 474 | ||||||
Toro | 10,320 | 724 | ||||||
TriMas* | 36,605 | 1,127 | ||||||
Triumph Group | 13,351 | 797 | ||||||
Tutor Perini* | 86,500 | 2,020 | ||||||
United Stationers | 6,500 | 266 | ||||||
VSE | 5,800 | 475 | ||||||
Wabash National* | 26,100 | 368 | ||||||
Watts Water Technologies, Cl A | 10,875 | 598 | ||||||
Werner Enterprises | 12,100 | 380 | ||||||
WESCO International (A)* | 12,065 | 843 | ||||||
|
| |||||||
| 62,479 | ||||||||
|
| |||||||
Information Technology — 11.6% | ||||||||
ACI Worldwide* | 43,910 | 951 | ||||||
Acxiom* | 42,395 | 784 | ||||||
Adtran | 24,753 | 462 | ||||||
Advanced Energy Industries* | 29,610 | 760 | ||||||
Amkor Technology* | 76,200 | 673 | ||||||
Atmel | 76,415 | 629 | ||||||
Belden | 15,566 | 1,456 | ||||||
Benchmark Electronics* | 30,800 | 740 | ||||||
Black Box | 12,300 | 257 | ||||||
Blackbaud, Cl A | 22,640 | 1,073 | ||||||
Booz Allen Hamilton Holding, Cl A | 9,715 | 281 | ||||||
BroadSoft* | 26,083 | 873 | ||||||
CACI International, Cl A* | 14,655 | 1,318 | ||||||
Cadence Design Systems* | 81,651 | 1,506 | ||||||
Ciber* | 187,200 | 771 | ||||||
Coherent* | 7,702 | 500 | ||||||
Computer Task Group | 34,900 | 255 | ||||||
Convergys | 29,545 | 676 | ||||||
Cray* | 32,145 | 903 | ||||||
CSG Systems International | 25,600 | 778 | ||||||
Dealertrack Technologies* | 23,260 | 896 | ||||||
Diebold | 17,181 | 609 | ||||||
Digi International* | 77,400 | 773 | ||||||
Diodes* | 13,100 | 374 | ||||||
Dot Hill Systems* | 123,800 | 656 | ||||||
| Description | Shares | Market Value ($ Thousands) | ||||||
Emulex* | 41,400 | $ | 330 | |||||
Entegris* | 82,495 | 1,129 | ||||||
EVERTEC | 25,756 | 563 | ||||||
Exar* | 106,200 | 1,067 | ||||||
ExlService Holdings* | 18,312 | 681 | ||||||
Extreme Networks* | 113,600 | 359 | ||||||
Fair Isaac | 6,977 | 619 | ||||||
Finisar* | 16,000 | 341 | ||||||
Heartland Payment Systems | 11,489 | 538 | ||||||
IGATE* | 13,144 | 561 | ||||||
Inphi* | 38,597 | 688 | ||||||
Insight Enterprises* | 27,600 | 787 | ||||||
Integrated Silicon Solution | 15,700 | 281 | ||||||
Intersil, Cl A | 68,017 | 974 | ||||||
Intralinks Holdings, Cl A* | 43,630 | 451 | ||||||
Ixia* | 44,038 | 534 | ||||||
j2 Global | 11,655 | 766 | ||||||
Kofax* | 78,300 | 857 | ||||||
Kulicke & Soffa Industries* | 29,000 | 453 | ||||||
Mentor Graphics | 59,540 | 1,431 | ||||||
MKS Instruments | 18,765 | 635 | ||||||
MoneyGram International* | 26,500 | 229 | ||||||
Multi-Fineline Electronix* | 7,600 | 139 | ||||||
NETGEAR* | 21,800 | 717 | ||||||
Photronics* | 28,300 | 241 | ||||||
Plantronics | 16,500 | 874 | ||||||
PRGX Global* | 53,600 | 215 | ||||||
PTC* | 39,078 | 1,413 | ||||||
Pulse Electronics (A)* | 3,630 | 6 | ||||||
QLogic* | 58,800 | 867 | ||||||
Rogers* | 11,815 | 971 | ||||||
Sanmina* | 27,400 | 663 | ||||||
Semtech* | 26,837 | 715 | ||||||
Solera Holdings | 15,642 | 808 | ||||||
SYNNEX | 7,300 | 564 | ||||||
Take-Two Interactive Software, Cl A* | 31,735 | 808 | ||||||
Tech Data* | 9,100 | 526 | ||||||
TeleCommunication Systems, Cl A* | 47,000 | 180 | ||||||
TeleTech Holdings | 12,100 | 308 | ||||||
TESSCO Technologies | 6,000 | 148 | ||||||
Ultratech* | 11,700 | 203 | ||||||
Verint Systems* | 19,370 | 1,199 | ||||||
Xcerra* | 58,900 | 524 | ||||||
Zebra Technologies, Cl A* | 5,489 | 498 | ||||||
|
| |||||||
| 45,815 | ||||||||
|
| |||||||
Materials — 3.8% | ||||||||
Allegheny Technologies | 28,675 | 861 | ||||||
Balchem | 11,230 | 622 | ||||||
Berry Plastics Group* | 46,399 | 1,679 | ||||||
Cabot | 20,043 | 902 | ||||||
Carpenter Technology | 10,900 | 424 | ||||||
Cytec Industries | 7,962 | 430 | ||||||
Domtar | 7,700 | 356 | ||||||
Glatfelter | 14,800 | 407 | ||||||
Headwaters, Cl A* | 54,510 | 1,000 | ||||||
Innophos Holdings | 10,066 | 567 | ||||||
Innospec | 7,300 | 339 | ||||||
Minerals Technologies | 11,395 | 833 | ||||||
Neenah Paper, Cl A | 5,700 | 356 | ||||||
Novagold Resources (A)* | 93,300 | 276 | ||||||
Olin | 20,900 | 669 | ||||||
PolyOne | 20,580 | 769 | ||||||
| 5 | SEI Institutional Managed Trust / Semi-Annual Report / March 31, 2015 |
SCHEDULE OF INVESTMENTS (Unaudited)
Small Cap Value Fund
March 31, 2015
| Description | Shares/Face Amount ($ Thousands) | Market Value ($ Thousands) | ||||||
RTI International Metals* | 17,055 | $ | 612 | |||||
Schweitzer-Mauduit International | 10,400 | 480 | ||||||
Sensient Technologies | 34,146 | 2,352 | ||||||
Silgan Holdings | 20,276 | 1,179 | ||||||
|
| |||||||
| 15,113 | ||||||||
|
| |||||||
Telecommunication Services — 0.5% |
| |||||||
Cogent Communications Holdings | 13,305 | 470 | ||||||
Inteliquent | 29,000 | 456 | ||||||
Iridium Communications (A)* | 76,700 | 745 | ||||||
Spok Holdings | 21,800 | 418 | ||||||
|
| |||||||
| 2,089 | ||||||||
|
| |||||||
Utilities — 4.1% | ||||||||
ALLETE | 36,960 | 1,950 | ||||||
Avista | 28,900 | 988 | ||||||
Cadiz (A)* | 56,700 | 582 | ||||||
Chesapeake Utilities | 12,800 | 648 | ||||||
Empire District Electric | 16,100 | 400 | ||||||
Great Plains Energy | 46,812 | 1,249 | ||||||
Idacorp, Cl A | 8,470 | 532 | ||||||
NorthWestern | 6,802 | 366 | ||||||
Piedmont Natural Gas (A) | 16,300 | 601 | ||||||
PNM Resources | 78,110 | 2,281 | ||||||
Portland General Electric (A) | 91,532 | 3,395 | ||||||
South Jersey Industries, Cl A | 10,795 | 586 | ||||||
Southwest Gas | 15,060 | 876 | ||||||
UIL Holdings | 35,885 | 1,845 | ||||||
|
| |||||||
| 16,299 | ||||||||
|
| |||||||
Total Common Stock |
| 376,307 | ||||||
|
| |||||||
EXCHANGE TRADED FUNDS — 0.8% |
| |||||||
iShares Russell 2000 ETF (A) | 12,748 | 1,585 | ||||||
iShares Russell 2000 Value ETF | 13,800 | 1,424 | ||||||
|
| |||||||
| 3,009 | ||||||||
|
| |||||||
Total Exchange Traded Funds |
| 3,009 | ||||||
|
| |||||||
AFFILIATED PARTNERSHIP — 5.8% |
| |||||||
SEI Liquidity Fund, L.P. 0.120%**† (B) | 22,692,422 | 22,692 | ||||||
|
| |||||||
Total Affiliated Partnership | 22,692 | |||||||
|
| |||||||
CASH EQUIVALENT — 3.8% |
| |||||||
SEI Daily Income Trust, Prime Obligation Fund, Cl A 0.010%**† | 15,188,549 | 15,189 | ||||||
|
| |||||||
Total Cash Equivalent | 15,189 | |||||||
|
| |||||||
U.S. TREASURY OBLIGATION — 0.3% |
| |||||||
U.S. Treasury Bills | ||||||||
0.020%, 05/28/15 (C) (D) | $ | 1,100 | 1,100 | |||||
|
| |||||||
Total U.S. Treasury Obligation |
| 1,100 | ||||||
|
| |||||||
Total Investments — 105.9% |
| $ | 418,297 | |||||
|
| |||||||
The open futures contracts held by the Fund at March 31, 2015, are as follows:
| Type of Contract | Number of Contracts Long (Short) | Expiration Date | Unrealized Appreciation (Depreciation) ($ Thousands) | |||||||||
Russell 2000 Index E-MINI | 80 | Jun-2015 | $ | 309 | ||||||||
|
| |||||||||||
For the period ended March 31, 2015, the total amount of all open futures contracts, as presented in the table above, are representative of the volume of activity for this derivative type during the period.
Percentages are based on Net Assets of $394,920 ($ Thousands).
| * | Non-income producing security. |
| ** | Rate shown is the 7-day effective yield as of March 31, 2015. |
| † | Real Estate Investment Trust. |
| †† | Investment in Affiliated Security. |
| ‡ | Narrow Industries are utilized for compliance purposes, whereas broad sectors are utilized for reporting. |
| (A) | This security or a partial position of this security is on loan at March 31, 2015. The total market value of securities on loan at March 31, 2015 was $22,692 ($ Thousands) |
| (B) | This security was purchased with cash collateral held from securities on loan. The total value of such securities as of March 31, 2015 was $21,791 ($ Thousands). |
| (C) | The rate reported is the effective yield at the time of purchase. |
| (D) | Security, or portion thereof, has been pledged as collateral on open futures contracts. |
ADR — American Depositary Receipt
Cl — Class
ETF — Exchange-Traded Fund
L.P. — Limited Partnership
PIPE — Private Investment in Public Entity
The following is a summary of the inputs used as of March 31, 2015, in valuing the Fund’s investments carried at value ($ Thousands):
| Investments in Securities | Level 1 | Level 2 | Level 3 | Total | ||||||||||||
Common Stock | $ | 376,307 | $ | — | $ | — | $ | 376,307 | ||||||||
Exchange Traded Funds | 3,009 | — | — | 3,009 | ||||||||||||
Affiliated Partnership | — | 22,692 | — | 22,692 | ||||||||||||
Cash Equivalent | 15,189 | — | — | 15,189 | ||||||||||||
U.S. Treasury Obligation | — | 1,100 | — | 1,100 | ||||||||||||
|
|
|
|
|
|
|
| |||||||||
Total Investments in Securities | $ | 394,505 | $ | 23,792 | $ | — | $ | 418,297 | ||||||||
|
|
|
|
|
|
|
| |||||||||
| Other Financial Instruments | Level 1 | Level 2 | Level 3 | Total | ||||||||||||
Futures Contracts* | ||||||||||||||||
Unrealized Appreciation | $ | 309 | $ | — | $ | — | $ | 309 | ||||||||
|
|
|
|
|
|
|
| |||||||||
Total Other Financial Instruments | $ | 309 | $ | — | $ | — | $ | 309 | ||||||||
|
|
|
|
|
|
|
| |||||||||
| * | Futures contracts are valued at unrealized depreciation on the instrument. |
For the period ended March 31, 2015, there were no transfers between Level 1 and Level 2 assets and liabilities.
For the period ended March 31, 2015, there were no transfers between Level 2 and Level 3 assets and liabilities.
For the period ended March 31, 2015, there were no Level 3 investments.
For more information on valuation inputs, see Note 2 – Significant Accounting Policies in Notes to Financial Statements.
Amounts designated as “—” are $0 or have been rounded to $0.
The accompanying notes are an integral part of the financial statements.
| 6 | SEI Institutional Managed Trust / Semi-Annual Report / March 31, 2015 |
SCHEDULE OF INVESTMENTS (Unaudited)
Small Cap Growth Fund
March 31, 2015
| Description | Shares | Market Value ($ Thousands) | ||||||
COMMON STOCK — 97.1% |
| |||||||
Consumer Discretionary — 16.4% |
| |||||||
2U* | 88,881 | $ | 2,274 | |||||
AMC Entertainment Holdings, Cl A | 11,960 | 424 | ||||||
American Axle & Manufacturing Holdings* | 16,643 | 430 | ||||||
Arctic Cat | 8,356 | 303 | ||||||
Asbury Automotive Group* | 1,400 | 116 | ||||||
Big Lots | 8,006 | 385 | ||||||
Bloomin’ Brands | 23,700 | 577 | ||||||
Boot Barn Holdings* | 31,107 | 744 | ||||||
Boyd Gaming* | 20,493 | 291 | ||||||
Bravo Brio Restaurant Group* | 6,600 | 97 | ||||||
Bright Horizons Family Solutions* | 15,222 | 780 | ||||||
Brown Shoe | 8,700 | 285 | ||||||
Brunswick | 10,125 | 521 | ||||||
Buffalo Wild Wings* | 5,187 | 940 | ||||||
Build-A-Bear Workshop* | 7,100 | 140 | ||||||
Burlington Stores* | 17,416 | 1,035 | ||||||
Cabela’s (A)* | 1,799 | 101 | ||||||
Callaway Golf | 46,500 | 443 | ||||||
Capella Education | 14,028 | 910 | ||||||
Carmike Cinemas* | 12,281 | 413 | ||||||
Carter’s | 14,722 | 1,361 | ||||||
Cato, Cl A | 3,200 | 127 | ||||||
Chuy’s Holdings* | 35,069 | 790 | ||||||
Columbia Sportswear | 8,579 | 522 | ||||||
Container Store Group (A)* | 24,627 | 469 | ||||||
Cooper Tire & Rubber | 2,900 | 124 | ||||||
Core-Mark Holding, Cl A | 6,700 | 431 | ||||||
Dana Holding | 1,600 | 34 | ||||||
Del Frisco’s Restaurant Group* | 26,913 | 542 | ||||||
Diamond Resorts International* | 32,938 | 1,101 | ||||||
DineEquity | 1,000 | 107 | ||||||
Dorman Products (A)* | 17,256 | 859 | ||||||
Drew Industries | 5,100 | 314 | ||||||
Entravision Communications, Cl A | 44,500 | 282 | ||||||
EW Scripps, Cl A* | 17,798 | 506 | ||||||
Fiesta Restaurant Group* | 23,493 | 1,433 | ||||||
Five Below* | 64,243 | 2,285 | ||||||
G-III Apparel Group* | 4,444 | 501 | ||||||
Grand Canyon Education* | 19,800 | 857 | ||||||
Gray Television* | 41,027 | 567 | ||||||
Helen of Troy* | 200 | 16 | ||||||
hhgregg, Cl A* | 13,300 | 82 | ||||||
Hibbett Sports* | 13,357 | 655 | ||||||
HSN, Cl A | 1,800 | 123 | ||||||
IMAX (A)* | 24,036 | 810 | ||||||
Jack in the Box | 20,130 | 1,931 | ||||||
K12* | 7,400 | 116 | ||||||
Kate Spade* | 17,540 | 586 | ||||||
Kirkland’s* | 16,221 | 385 | ||||||
La Quinta Holdings* | 17,572 | 416 | ||||||
Lands’ End* | 9,324 | 335 | ||||||
La-Z-Boy, Cl Z | 14,800 | 416 | ||||||
Life Time Fitness* | 600 | 43 | ||||||
Lithia Motors, Cl A | 9,038 | 898 | ||||||
Loral Space & Communications* | 6,000 | 411 | ||||||
Malibu Boats, Cl A* | 36,887 | 861 | ||||||
MDC Partners, Cl A | 15,050 | 427 | ||||||
| Description | Shares | Market Value ($ Thousands) | ||||||
Men’s Wearhouse | 13,723 | $ | 716 | |||||
Monro Muffler (A) | 9,256 | 602 | ||||||
Movado Group | 4,900 | 140 | ||||||
National CineMedia | 120,060 | 1,813 | ||||||
Nautilus* | 26,725 | 408 | ||||||
New Media Investment Group | 21,296 | 509 | ||||||
Orbitz Worldwide* | 12,600 | 147 | ||||||
Overstock.com* | 22,300 | 540 | ||||||
Papa Murphy’s Holdings* | 17,896 | 325 | ||||||
Penske Auto Group, Cl A | 9,239 | 476 | ||||||
PetMed Express (A) | 7,200 | 119 | ||||||
Pier 1 Imports | 2,700 | 38 | ||||||
Pool | 21,581 | 1,506 | ||||||
Popeyes Louisiana Kitchen* | 6,002 | 359 | ||||||
Red Robin Gourmet Burgers* | 7,398 | 644 | ||||||
Rentrak (A)* | 6,854 | 381 | ||||||
Restoration Hardware Holdings* | 6,004 | 596 | ||||||
Ruth’s Chris Steak House | 48,400 | 769 | ||||||
Select Comfort* | 17,895 | 617 | ||||||
ServiceMaster Global Holdings* | 30,058 | 1,015 | ||||||
Shutterfly* | 12,898 | 583 | ||||||
Six Flags Entertainment | 8,516 | 412 | ||||||
Skechers U.S.A., Cl A* | 16,905 | 1,216 | ||||||
Sonic | 12,806 | 406 | ||||||
Sportsman’s Warehouse | 48,279 | 386 | ||||||
Stage Stores | 18,381 | 421 | ||||||
Standard Motor Products | 3,000 | 127 | ||||||
Steven Madden* | 25,072 | 953 | ||||||
Stoneridge* | 14,200 | 160 | ||||||
Strayer Education* | 1,400 | 75 | ||||||
TAL Education Group ADR (A)* | 14,038 | 466 | ||||||
Tempur-Pedic International* | 9,946 | 574 | ||||||
Tenneco* | 10,100 | 580 | ||||||
Texas Roadhouse, Cl A | 13,596 | 495 | ||||||
Tile Shop Holdings* | 36,209 | 439 | ||||||
Tower International* | 9,300 | 247 | ||||||
TRI Pointe Homes* | 20,914 | 323 | ||||||
Tuesday Morning* | 55,720 | 897 | ||||||
Tumi Holdings (A)* | 30,906 | 756 | ||||||
Universal Electronics* | 700 | 40 | ||||||
Vail Resorts | 10,646 | 1,101 | ||||||
Vera Bradley (A)* | 19,810 | 321 | ||||||
Vitamin Shoppe* | 10,413 | 429 | ||||||
Wayfair, Cl A (A)* | 35,958 | 1,155 | ||||||
Winmark | 4,457 | 390 | ||||||
Wolverine World Wide (A) | 63,803 | 2,134 | ||||||
Zoe’s Kitchen (A)* | 18,777 | 625 | ||||||
|
| |||||||
| 60,363 | ||||||||
|
| |||||||
Consumer Staples — 2.1% | ||||||||
Andersons | 7,600 | 315 | ||||||
Boston Beer, Cl A (A)* | 1,000 | 267 | ||||||
Casey’s General Stores | 10,650 | 960 | ||||||
Chefs’ Warehouse Holdings (A)* | 20,569 | 461 | ||||||
Diamond Foods* | 16,329 | 532 | ||||||
Diplomat Pharmacy* | 10,738 | 371 | ||||||
Freshpet (A)* | 59,137 | 1,149 | ||||||
J&J Snack Foods | 1,600 | 171 | ||||||
Lancaster Colony | 5,003 | 476 | ||||||
Medifast* | 15,267 | 457 | ||||||
Natural Grocers by Vitamin Cottage* | 300 | 8 | ||||||
Pinnacle Foods | 10,589 | 432 | ||||||
| 1 | SEI Institutional Managed Trust / Semi-Annual Report / March 31, 2015 |
SCHEDULE OF INVESTMENTS (Unaudited)
Small Cap Growth Fund
March 31, 2015
| Description | Shares | Market Value ($ Thousands) | ||||||
Post Holdings* | 8,263 | $ | 387 | |||||
PriceSmart | 1,500 | 128 | ||||||
Sanderson Farms (A) | 2,500 | 199 | ||||||
Sprouts Farmers Market* | 21,896 | 771 | ||||||
USANA Health Sciences* | 6,000 | 667 | ||||||
|
| |||||||
| 7,751 | ||||||||
|
| |||||||
Energy — 3.0% | ||||||||
Abraxas Petroleum* | 140,400 | 456 | ||||||
Callon Petroleum* | 55,477 | 415 | ||||||
Clayton Williams Energy* | 2,100 | 106 | ||||||
Delek US Holdings | 13,887 | 552 | ||||||
Diamondback Energy, Cl A* | 2,700 | 207 | ||||||
Dril-Quip* | 9,920 | 678 | ||||||
Eclipse Resources (A)* | 16,620 | 93 | ||||||
Era Group* | 24,537 | 511 | ||||||
Evolution Petroleum | 183,544 | 1,092 | ||||||
Forum Energy Technologies* | 17,084 | 335 | ||||||
Geospace Technologies* | 300 | 5 | ||||||
Green Plains | 11,400 | 326 | ||||||
Gulfport Energy* | 9,510 | 437 | ||||||
ION Geophysical* | 52,900 | 115 | ||||||
Laredo Petroleum (A)* | 66,741 | 870 | ||||||
Matador Resources (A)* | 10,556 | 231 | ||||||
Matrix Service* | 19,800 | 348 | ||||||
Oil States International* | 6,536 | 260 | ||||||
PDC Energy, Cl A* | 10,067 | 544 | ||||||
PetroQuest Energy* | 77,600 | 179 | ||||||
Pioneer Energy Services* | 3,000 | 16 | ||||||
REX American Resources* | 14,800 | 900 | ||||||
RigNet, Cl A* | 38,052 | 1,088 | ||||||
Sabine Oil & Gas* | 30,600 | 3 | ||||||
Superior Energy Services | 13,592 | 304 | ||||||
US Silica Holdings (A) | 22,218 | 791 | ||||||
|
| |||||||
| 10,862 | ||||||||
|
| |||||||
Financials — 5.9% | ||||||||
AmTrust Financial Services (A) | 7,911 | 451 | ||||||
Bank of the Ozarks (A) | 40,523 | 1,496 | ||||||
Banner | 12,950 | 594 | ||||||
BGC Partners, Cl A | 19,900 | 188 | ||||||
BofI Holding* | 9,246 | 860 | ||||||
Capital Bank Financial, Cl A* | 14,946 | 413 | ||||||
City National | 5,601 | 499 | ||||||
Credit Acceptance, Cl A* | 2,530 | 493 | ||||||
EastGroup Properties† | 13,441 | 808 | ||||||
Evercore Partners, Cl A | 300 | 16 | ||||||
Federated National Holding | 3,400 | 104 | ||||||
Financial Engines (A) | 34,123 | 1,427 | ||||||
First Cash Financial Services* | 1,028 | 48 | ||||||
GEO Group† | 9,584 | 419 | ||||||
HFF, Cl A | 10,000 | 375 | ||||||
Highwoods Properties† | 6,901 | 316 | ||||||
IBERIABANK | 9,644 | 608 | ||||||
Kennedy-Wilson Holdings | 13,988 | 366 | ||||||
LendingTree* | 8,648 | 485 | ||||||
MarketAxess Holdings | 6,009 | 498 | ||||||
National Health Investors† | 3,400 | 241 | ||||||
On Deck Capital (A)* | 12,320 | 262 | ||||||
Pebblebrook Hotel Trust† | 16,007 | 746 | ||||||
PennantPark Investment | 96,815 | 876 | ||||||
Potlatch† | 3,523 | 141 | ||||||
PRA Group (A)* | 3,500 | 190 | ||||||
PrivateBancorp, Cl A | 19,440 | 684 | ||||||
| Description | Shares | Market Value ($ Thousands) | ||||||
PS Business Parks† | 1,400 | $ | 116 | |||||
RE, Cl A | 11,277 | 374 | ||||||
Ryman Hospitality Properties† | 6,898 | 420 | ||||||
Sabra Health Care† | 2,200 | 73 | ||||||
Signature Bank NY, Cl B* | 9,573 | 1,240 | ||||||
South State | 11,448 | 783 | ||||||
Sovran Self Storage† | 2,000 | 188 | ||||||
Springleaf Holdings, Cl A* | 12,529 | 649 | ||||||
Stifel Financial* | 11,570 | 645 | ||||||
Strategic Hotels & Resorts*† | 24,100 | 300 | ||||||
Summit Hotel Properties† | 28,748 | 404 | ||||||
Sun Communities† | 4,100 | 274 | ||||||
SVB Financial Group, Cl B* | 5,963 | 758 | ||||||
Texas Capital Bancshares* | 10,525 | 512 | ||||||
United Insurance Holdings | 3,000 | 67 | ||||||
Value Creation (B) (C)* | 145,600 | 61 | ||||||
Virtus Investment Partners | 200 | 26 | ||||||
Western Alliance Bancorp* | 5,560 | 165 | ||||||
WisdomTree Investments (A) | 56,560 | 1,214 | ||||||
|
| |||||||
| 21,873 | ||||||||
|
| |||||||
Health Care — 25.2%‡ | ||||||||
ABIOMED (A)* | 8,190 | 586 | ||||||
Acadia Healthcare, Cl A (A)* | 51,789 | 3,708 | ||||||
ACADIA Pharmaceuticals (A)* | 18,105 | 590 | ||||||
Acceleron Pharma (A)* | 8,960 | 341 | ||||||
Achillion Pharmaceuticals* | 22,357 | 220 | ||||||
Acorda Therapeutics* | 14,500 | 483 | ||||||
Addus HomeCare* | 25,600 | 589 | ||||||
Aegerion Pharmaceuticals, Cl A (A)* | 11,216 | 294 | ||||||
Aerie Pharmaceuticals* | 21,467 | 673 | ||||||
Agenus* | 77,018 | 395 | ||||||
Agios Pharmaceuticals* | 2,839 | 268 | ||||||
Akorn (A)* | 36,926 | 1,754 | ||||||
Alder Biopharmaceuticals* | 8,400 | 242 | ||||||
Align Technology* | 9,960 | 536 | ||||||
AMAG Pharmaceuticals (A)* | 6,988 | 382 | ||||||
Amicus Therapeutics* | 43,887 | 478 | ||||||
AMN Healthcare Services* | 17,980 | 415 | ||||||
Ampio Pharmaceuticals (A)* | 47,362 | 357 | ||||||
Amsurg* | 7,508 | 462 | ||||||
AngioDynamics* | 22,171 | 394 | ||||||
ANI Pharmaceuticals (A)* | 3,600 | 225 | ||||||
Anika Therapeutics* | 15,000 | 618 | ||||||
Aratana Therapeutics* | 43,702 | 700 | ||||||
Arrowhead Research (A)* | 43,983 | 298 | ||||||
Atara Biotherapeutics (A)* | 10,371 | 431 | ||||||
AtriCure* | 18,731 | 384 | ||||||
Auspex Pharmaceuticals* | 6,825 | 684 | ||||||
Avalanche Biotechnologies* | 5,829 | 236 | ||||||
Bellicum Pharmaceuticals (A)* | 6,486 | 150 | ||||||
BioCryst Pharmaceuticals (A)* | 6,400 | 58 | ||||||
BioDelivery Sciences International* | 48,199 | 506 | ||||||
Bio-Rad Laboratories, Cl A* | 3,155 | 426 | ||||||
Bluebird Bio* | 8,444 | 1,020 | ||||||
Cambrex* | 34,533 | 1,369 | ||||||
Cantel Medical | 2,600 | 123 | ||||||
Cardiovascular Systems* | 25,261 | 986 | ||||||
Castlight Health, Cl B (A)* | 43,938 | 341 | ||||||
Celldex Therapeutics, Cl A* | 4,900 | 137 | ||||||
Cellectis ADR | 4,664 | 161 | ||||||
Cempra* | 12,173 | 418 | ||||||
| 2 | SEI Institutional Managed Trust / Semi-Annual Report / March 31, 2015 |
SCHEDULE OF INVESTMENTS (Unaudited)
Small Cap Growth Fund
March 31, 2015
| Description | Shares | Market Value ($ Thousands) | ||||||
Centene* | 9,077 | $ | 642 | |||||
Cepheid* | 6,754 | 384 | ||||||
Chimerix* | 26,090 | 983 | ||||||
Clovis Oncology* | 3,944 | 293 | ||||||
Coherus Biosciences* | 31,855 | 974 | ||||||
Computer Programs & Systems (A) | 5,300 | 288 | ||||||
Cyberonics* | 600 | 39 | ||||||
Cynosure, Cl A* | 3,100 | 95 | ||||||
Depomed* | 29,330 | 657 | ||||||
DexCom* | 35,086 | 2,187 | ||||||
Dyax* | 29,676 | 497 | ||||||
Dynavax Technologies* | 17,354 | 389 | ||||||
Eagle Pharmaceuticals* | 6,949 | 291 | ||||||
Emergent Biosolutions* | 8,800 | 253 | ||||||
Endocyte* | 31,900 | 200 | ||||||
Endologix* | 69,861 | 1,192 | ||||||
Ensign Group | 3,600 | 169 | ||||||
Esperion Therapeutics (A)* | 9,656 | 894 | ||||||
Exact Sciences (A)* | 35,468 | 781 | ||||||
ExamWorks Group (A)* | 17,509 | 729 | ||||||
Five Prime Therapeutics* | 2,900 | 66 | ||||||
Fluidigm (A)* | 29,108 | 1,225 | ||||||
GenMark Diagnostics* | 48,600 | 631 | ||||||
Globus Medical, Cl A* | 21,700 | 548 | ||||||
GW Pharmaceuticals ADR (A)* | 2,840 | 259 | ||||||
Halozyme Therapeutics (A)* | 64,972 | 928 | ||||||
Health Net, Cl A* | 8,145 | 493 | ||||||
HealthSouth | 31,729 | 1,407 | ||||||
HeartWare International* | 7,636 | 670 | ||||||
Heron Therapeutics* | 28,539 | 415 | ||||||
Hill-Rom Holdings | 7,992 | 392 | ||||||
Horizon Pharma* | 15,350 | 399 | ||||||
ICON* | 8,789 | 620 | ||||||
Idera Pharmaceuticals* | 24,400 | 91 | ||||||
Ignyta* | 23,308 | 232 | ||||||
ImmunoGen (A)* | 18,000 | 161 | ||||||
Impax Laboratories* | 8,566 | 402 | ||||||
Insmed* | 54,139 | 1,126 | ||||||
Insulet* | 30,944 | 1,032 | ||||||
Intrexon* | 7,527 | 342 | ||||||
Invitae (A)* | 9,020 | 151 | ||||||
Ironwood Pharmaceuticals, Cl A* | 6,600 | 106 | ||||||
Isis Pharmaceuticals (A)* | 28,936 | 1,842 | ||||||
Jazz Pharmaceuticals* | 2,931 | 506 | ||||||
Juno Therapeutics (A)* | 7,026 | 426 | ||||||
K2M Group Holdings* | 41,587 | 917 | ||||||
Karyopharm Therapeutics (A)* | 5,460 | 167 | ||||||
Keryx Biopharmaceuticals (A)* | 24,169 | 308 | ||||||
Kindred Healthcare | 1 | — | ||||||
Kite Pharma (A)* | 12,623 | 728 | ||||||
KYTHERA Biopharmaceuticals (A)* | 4,693 | 235 | ||||||
Lannett* | 5,700 | 386 | ||||||
LDR Holding* | 53,626 | 1,965 | ||||||
Ligand Pharmaceuticals (A)* | 5,623 | 434 | ||||||
Luminex* | 4,500 | 72 | ||||||
MacroGenics* | 11,937 | 374 | ||||||
Magellan Health* | 6,219 | 440 | ||||||
MannKind (A)* | 26,900 | 140 | ||||||
Masimo* | 1,500 | 49 | ||||||
Medidata Solutions* | 6,961 | 341 | ||||||
Merit Medical Systems* | 32,188 | 620 | ||||||
| Description | Shares | Market Value ($ Thousands) | ||||||
Merrimack Pharmaceuticals (A)* | 35,137 | $ | 417 | |||||
Molina Healthcare* | 8,800 | 592 | ||||||
Momenta Pharmaceuticals* | 11,300 | 172 | ||||||
National Research, Cl A | 21,246 | 306 | ||||||
Natus Medical* | 13,500 | 533 | ||||||
Nektar Therapeutics* | 31,109 | 342 | ||||||
Neovasc* | 20,012 | 180 | ||||||
Neurocrine Biosciences* | 11,839 | 470 | ||||||
Nevro* | 26,821 | 1,286 | ||||||
NewLink Genetics* | 5,983 | 327 | ||||||
Novadaq Technologies (A)* | 74,137 | 1,204 | ||||||
Novavax (A)* | 54,381 | 450 | ||||||
NuVasive* | 7,800 | 359 | ||||||
NxStage Medical* | 9,600 | 166 | ||||||
Omeros* | 16,899 | 372 | ||||||
Omnicell* | 400 | 14 | ||||||
Ophthotech* | 18,148 | 844 | ||||||
OraSure Technologies* | 37,400 | 245 | ||||||
Orexigen Therapeutics (A)* | 44,293 | 347 | ||||||
Otonomy* | 7,275 | 257 | ||||||
OvaScience* | 7,146 | 248 | ||||||
Pacific Biosciences of California* | 13,400 | 78 | ||||||
Pacira Pharmaceuticals* | 2,863 | 254 | ||||||
Parexel International* | 8,183 | 565 | ||||||
PDL BioPharma | 12,900 | 91 | ||||||
Pernix Therapeutics Holdings* | 1,300 | 14 | ||||||
Portola Pharmaceuticals, Cl A* | 12,009 | 456 | ||||||
POZEN* | 28,800 | 222 | ||||||
Premier, Cl A* | 17,129 | 644 | ||||||
Prestige Brands Holdings, Cl A* | 22,202 | 952 | ||||||
Progenics Pharmaceuticals (A)* | 64,020 | 383 | ||||||
Providence Service* | 13,400 | 712 | ||||||
PTC Therapeutics* | 4,580 | 279 | ||||||
Puma Biotechnology* | 7,340 | 1,733 | ||||||
Quidel* | 14,398 | 388 | ||||||
RadNet* | 13,300 | 112 | ||||||
Receptos* | 11,233 | 1,852 | ||||||
Relypsa* | 27,709 | 999 | ||||||
Repligen* | 19,537 | 593 | ||||||
Repros Therapeutics* | 7,800 | 67 | ||||||
Revance Therapeutics (A)* | 29,743 | 617 | ||||||
Sage Therapeutics (A)* | 21,280 | 1,069 | ||||||
Sagent Pharmaceuticals* | 12,576 | 292 | ||||||
Sangamo Biosciences* | 24,394 | 383 | ||||||
SciClone Pharmaceuticals* | 9,100 | 81 | ||||||
Select Medical Holdings | 19,800 | 293 | ||||||
Sirona Dental Systems, Cl A* | 6,793 | 611 | ||||||
Spark Therapeutics* | 5,186 | 402 | ||||||
Spectranetics (A)* | 27,504 | 956 | ||||||
STERIS, Cl A | 10,308 | 724 | ||||||
Sucampo Pharmaceuticals, Cl A* | 26,178 | 407 | ||||||
Supernus Pharmaceuticals* | 15,800 | 191 | ||||||
Surgical Care Affiliates* | 24,150 | 829 | ||||||
Synageva BioPharma, Cl A (A)* | 9,606 | 937 | ||||||
Syneron Medical* | 41,996 | 520 | ||||||
Team Health Holdings* | 16,651 | 974 | ||||||
TESARO (A)* | 17,213 | 988 | ||||||
Tetraphase Pharmaceuticals* | 22,203 | 814 | ||||||
TG Therapeutics* | 26,880 | 416 | ||||||
Thoratec* | 10,600 | 444 | ||||||
Trupanion (A)* | 58,654 | 469 | ||||||
Ultragenyx Pharmaceutical* | 4,053 | 252 | ||||||
| 3 | SEI Institutional Managed Trust / Semi-Annual Report / March 31, 2015 |
SCHEDULE OF INVESTMENTS (Unaudited)
Small Cap Growth Fund
March 31, 2015
| Description | Shares | Market Value ($ Thousands) | ||||||
Unilife (A)* | 190,222 | $ | 763 | |||||
US Physical Therapy | 8,838 | 420 | ||||||
Veeva Systems, Cl A* | 25,976 | 663 | ||||||
Versartis* | 26,948 | 495 | ||||||
WellCare Health Plans* | 10,172 | 930 | ||||||
West Pharmaceutical Services | 1,000 | 60 | ||||||
Xencor* | 32,235 | 494 | ||||||
XenoPort* | 14,200 | 101 | ||||||
Zeltiq Aesthetics* | 13,327 | 411 | ||||||
ZS Pharma* | 6,298 | 265 | ||||||
|
| |||||||
| 92,817 | ||||||||
|
| |||||||
Industrials — 16.3% | ||||||||
Actuant, Cl A | 24,866 | 590 | ||||||
Acuity Brands | 8,778 | 1,476 | ||||||
Advisory Board* | 8,187 | 436 | ||||||
Allegiant Travel, Cl A | 3,946 | 759 | ||||||
American Woodmark* | 5,900 | 323 | ||||||
Apogee Enterprises | 7,633 | 330 | ||||||
ArcBest | 7,800 | 296 | ||||||
Argan | 10,700 | 387 | ||||||
Astronics* | 6,125 | 451 | ||||||
Astronics, Cl B* | 1,972 | 144 | ||||||
Atlas Air Worldwide Holdings* | 8,187 | 352 | ||||||
Beacon Roofing Supply (A)* | 10,464 | 328 | ||||||
Blount International* | 7,100 | 92 | ||||||
Caesarstone Sdot-Yam | 6,520 | 396 | ||||||
Carlisle | 16,790 | 1,555 | ||||||
Chart Industries* | 1,300 | 46 | ||||||
CIRCOR International | 2,200 | 120 | ||||||
Clean Harbors (A)* | 35,520 | 2,017 | ||||||
Corporate Executive Board | 26,167 | 2,090 | ||||||
Covenant Transportation Group, Cl A* | 12,017 | 398 | ||||||
Curtiss-Wright | 1,800 | 133 | ||||||
Deluxe | 1,100 | 76 | ||||||
Dycom Industries* | 30,720 | 1,500 | ||||||
EMCOR Group | 14,504 | 674 | ||||||
Exponent | 2,800 | 249 | ||||||
Fortune Brands Home & Security | 11,936 | 567 | ||||||
Forward Air | 17,099 | 929 | ||||||
G&K Services | 4,531 | 329 | ||||||
GenCorp* | 19,332 | 448 | ||||||
Genesee & Wyoming, Cl A* | 8,591 | 828 | ||||||
Global Brass & Copper Holdings | 3,200 | 49 | ||||||
Graco | 4,691 | 339 | ||||||
H&E Equipment Services | 52,297 | 1,307 | ||||||
Hawaiian Holdings* | 2,700 | 59 | ||||||
Heartland Express | 26,512 | 630 | ||||||
Heico, Cl A | 28,385 | 1,406 | ||||||
HEICO | 6,594 | 403 | ||||||
Heritage-Crystal Clean* | 127,334 | 1,490 | ||||||
Hexcel, Cl A | 39,107 | 2,011 | ||||||
Hub Group, Cl A* | 7,459 | 293 | ||||||
Hyster-Yale Materials Handling | 8,200 | 601 | ||||||
IDEX | 9,432 | 715 | ||||||
Insperity, Cl A | 9,336 | 488 | ||||||
Interface, Cl A | 21,804 | 453 | ||||||
John Bean Technologies, Cl A | 4,500 | 161 | ||||||
Kadant | 8,517 | 448 | ||||||
Kennametal | 21,752 | 733 | ||||||
Kforce | 7,600 | 170 | ||||||
Kirby* | 9,365 | 703 | ||||||
| Description | Shares | Market Value ($ Thousands) | ||||||
Korn/Ferry International | 12,400 | $ | 408 | |||||
Lennox International | 1,500 | 168 | ||||||
Lincoln Electric Holdings | 11,160 | 730 | ||||||
Lindsay (A) | 6,009 | 458 | ||||||
Masonite International* | 7,551 | 508 | ||||||
Meritor* | 23,400 | 295 | ||||||
Middleby* | 14,907 | 1,530 | ||||||
Mobile Mini | 12,837 | 547 | ||||||
Moog, Cl A* | 3,900 | 293 | ||||||
MSA Safety | 900 | 45 | ||||||
Mueller Water Products, Cl A | 5,500 | 54 | ||||||
MYR Group* | 13,650 | 428 | ||||||
Norcraft* | 10,309 | 264 | ||||||
Old Dominion Freight Line, Cl A* | 9,089 | 703 | ||||||
Park-Ohio Holdings | 10,367 | 546 | ||||||
Patrick Industries* | 9,548 | 595 | ||||||
PGT* | 29,300 | 327 | ||||||
Polypore International* | 13,454 | 793 | ||||||
Power Solutions International (A)* | 17,941 | 1,153 | ||||||
Primoris Services | 38,695 | 665 | ||||||
Proto Labs (A)* | 9,128 | 639 | ||||||
Raven Industries | 18,328 | 375 | ||||||
RBC Bearings | 7,226 | 553 | ||||||
Rexnord* | 200 | 5 | ||||||
Ritchie Bros. Auctioneers (A) | 25,233 | 629 | ||||||
Roadrunner Transportation Systems* | 28,189 | 712 | ||||||
Rush Enterprises, Cl A* | 36,203 | 990 | ||||||
Saia* | 6,606 | 293 | ||||||
SP Plus* | 43,424 | 949 | ||||||
Spirit Airlines* | 6,290 | 487 | ||||||
Standex International | 2,700 | 222 | ||||||
Steelcase, Cl A | 60,626 | 1,148 | ||||||
Swift Transportation, Cl A* | 32,369 | 842 | ||||||
Tennant | 12,183 | 796 | ||||||
Titan Machinery* | 53,193 | 710 | ||||||
Trex* | 27,404 | 1,494 | ||||||
TriNet Group* | 29,942 | 1,055 | ||||||
TrueBlue* | 38,856 | 946 | ||||||
United Rentals* | 5,586 | 509 | ||||||
US Ecology | 9,324 | 466 | ||||||
USG* | 25,709 | 686 | ||||||
UTI Worldwide* | 30,166 | 371 | ||||||
Valmont Industries (A) | 5,320 | 654 | ||||||
voxeljet ADR (A)* | 37,616 | 298 | ||||||
Watsco | 8,635 | 1,085 | ||||||
Werner Enterprises | 1,800 | 57 | ||||||
WESCO International* | 13,904 | 972 | ||||||
West | 600 | 20 | ||||||
Woodward | 1,200 | 61 | ||||||
XPO Logistics* | 22,257 | 1,012 | ||||||
|
| |||||||
| 60,324 | ||||||||
|
| |||||||
Information Technology — 25.2%‡ |
| |||||||
Advanced Energy Industries* | 24,730 | 635 | ||||||
Advent Software | 8,394 | 370 | ||||||
Alliance Fiber Optic Products | 39,000 | 679 | ||||||
Amkor Technology* | 72,700 | 642 | ||||||
Anixter International* | 2,600 | 198 | ||||||
Arista Networks* | 5,783 | 408 | ||||||
Aruba Networks* | 20,490 | 502 | ||||||
Aspen Technology* | 49,867 | 1,919 | ||||||
AVG Technologies* | 19,200 | 416 | ||||||
| 4 | SEI Institutional Managed Trust / Semi-Annual Report / March 31, 2015 |
SCHEDULE OF INVESTMENTS (Unaudited)
Small Cap Growth Fund
March 31, 2015
| Description | Shares | Market Value ($ Thousands) | ||||||
Barracuda Networks* | 23,635 | $ | 909 | |||||
Belden | 7,304 | 683 | ||||||
Blackbaud, Cl A | 16,451 | 779 | ||||||
Brightcove* | 28,200 | 207 | ||||||
BroadSoft* | 13,199 | 442 | ||||||
Cabot Microelectronics* | 6,000 | 300 | ||||||
Callidus Software* | 93,911 | 1,191 | ||||||
Carbonite* | 48,109 | 688 | ||||||
Cass Information Systems | 15,752 | 884 | ||||||
Cavium* | 43,473 | 3,079 | ||||||
ChannelAdvisor* | 74,777 | 725 | ||||||
Ciena (A)* | 27,218 | 526 | ||||||
Cimpress (A)* | 14,735 | 1,243 | ||||||
Cirrus Logic* | 17,558 | 584 | ||||||
Coherent* | 800 | 52 | ||||||
CommScope Holding* | 15,152 | 432 | ||||||
CommVault Systems* | 10,848 | 474 | ||||||
Constant Contact* | 5,600 | 214 | ||||||
Cornerstone OnDemand* | 28,021 | 809 | ||||||
CoStar Group* | 7,809 | 1,545 | ||||||
Cypress Semiconductor | 88,785 | 1,253 | ||||||
Daktronics | 11,500 | 124 | ||||||
Dealertrack Technologies* | 53,780 | 2,072 | ||||||
Demandware (A)* | 22,690 | 1,382 | ||||||
Diodes* | 9,400 | 268 | ||||||
DTS* | 12,752 | 434 | ||||||
Ebix (A) | 10,555 | 321 | ||||||
Endurance International Group Holdings* | 21,672 | 413 | ||||||
Entegris* | 31,429 | 430 | ||||||
Envestnet* | 42,154 | 2,364 | ||||||
EPAM Systems* | 7,400 | 454 | ||||||
Euronet Worldwide* | 31,905 | 1,874 | ||||||
Exa* | 42,352 | 503 | ||||||
Extreme Networks* | 11,100 | 35 | ||||||
Fair Isaac | 5,582 | 495 | ||||||
FEI | 5,890 | 450 | ||||||
Fleetmatics Group (A)* | 13,722 | 615 | ||||||
FormFactor* | 46,286 | 411 | ||||||
Fortinet* | 43,957 | 1,536 | ||||||
Gigamon* | 21,207 | 450 | ||||||
GrubHub (A)* | 9,486 | 431 | ||||||
Guidewire Software, Cl Z (A)* | 40,463 | 2,129 | ||||||
HomeAway* | 23,362 | 705 | ||||||
HubSpot (A)* | 30,545 | 1,219 | ||||||
Imperva* | 12,192 | 521 | ||||||
Infinera* | 21,737 | 428 | ||||||
Infoblox* | 90,773 | 2,167 | ||||||
Inphi* | 63,267 | 1,128 | ||||||
Integrated Device Technology* | 39,342 | 788 | ||||||
Interactive Intelligence Group (A)* | 7,563 | 311 | ||||||
InterDigital | 900 | 46 | ||||||
Intersil, Cl A | 29,410 | 421 | ||||||
IPG Photonics (A)* | 4,569 | 424 | ||||||
j2 Global | 7,192 | 472 | ||||||
Lattice Semiconductor* | 97,800 | 620 | ||||||
Littelfuse | 600 | 60 | ||||||
LivePerson* | 53,636 | 549 | ||||||
LogMeIn* | 2,200 | 123 | ||||||
Luxoft Holding, Cl A* | 6,300 | 326 | ||||||
M* | 30,413 | 1,133 | ||||||
Manhattan Associates* | 7,800 | 395 | ||||||
Marketo (A)* | 15,203 | 389 | ||||||
| Description | Shares | Market Value ($ Thousands) | ||||||
MAXIMUS | 25,781 | $ | 1,721 | |||||
Mellanox Technologies* | 13,682 | 620 | ||||||
Mesa Laboratories | 6,255 | 452 | ||||||
Methode Electronics | 20,800 | 978 | ||||||
Microsemi* | 2,000 | 71 | ||||||
MKS Instruments | 13,042 | 441 | ||||||
Monolithic Power Systems | 29,147 | 1,535 | ||||||
Monotype Imaging Holdings | 17,200 | 561 | ||||||
NetScout Systems (A)* | 9,900 | 434 | ||||||
New Relic* | 5,597 | 194 | ||||||
Newport* | 3,800 | 72 | ||||||
NIC | 15,100 | 267 | ||||||
Nimble Storage (A)* | 39,965 | 892 | ||||||
ON Semiconductor* | 37,271 | 451 | ||||||
OSI Systems* | 2,300 | 171 | ||||||
Palo Alto Networks* | 2,532 | 370 | ||||||
Pandora Media* | 19,461 | 315 | ||||||
PDF Solutions* | 8,400 | 150 | ||||||
Pegasystems | 11,200 | 244 | ||||||
Plantronics | 3,900 | 207 | ||||||
Polycom* | 20,400 | 273 | ||||||
Procera Networks (A)* | 6,700 | 63 | ||||||
Proofpoint* | 36,553 | 2,165 | ||||||
PROS Holdings* | 14,847 | 367 | ||||||
Q2 Holdings* | 15,833 | 335 | ||||||
Qlik Technologies* | 37,147 | 1,156 | ||||||
QLogic* | 28,325 | 417 | ||||||
Qorvo* | 29,424 | 2,345 | ||||||
Qualys* | 2,100 | 98 | ||||||
Rally Software Development* | 28,312 | 444 | ||||||
RealD* | 31,656 | 405 | ||||||
RealPage* | 17,027 | 343 | ||||||
RetailMeNot* | 20,781 | 374 | ||||||
Rogers* | 7,428 | 611 | ||||||
Ruckus Wireless* | 96,522 | 1,242 | ||||||
Science Applications International | 5,000 | 257 | ||||||
SciQuest* | 25,255 | 428 | ||||||
ShoreTel* | 20,400 | 139 | ||||||
Shutterstock (A)* | 8,847 | 607 | ||||||
Silicon Laboratories* | 17,910 | 909 | ||||||
SolarWinds* | 45,446 | 2,329 | ||||||
SPS Commerce* | 28,242 | 1,895 | ||||||
SS&C Technologies Holdings | 16,553 | 1,031 | ||||||
Stamps.com* | 10,300 | 693 | ||||||
Stratasys (A)* | 17,140 | 905 | ||||||
SunEdison (A)* | 17,667 | 424 | ||||||
Super Micro Computer* | 17,100 | 568 | ||||||
Sykes Enterprises* | 8,600 | 214 | ||||||
Synaptics* | 9,889 | 804 | ||||||
Syntel* | 1,800 | 93 | ||||||
Tableau Software, Cl A* | 18,371 | 1,700 | ||||||
Take-Two Interactive Software, Cl A* | 18,105 | 461 | ||||||
TeleTech Holdings | 4,300 | 109 | ||||||
Tessera Technologies | 21,608 | 870 | ||||||
Travelzoo* | 5,000 | 48 | ||||||
Tyler Technologies* | 2,400 | 289 | ||||||
Ultimate Software Group* | 8,426 | 1,432 | ||||||
Ultra Clean Holdings* | 11,900 | 85 | ||||||
Unisys* | 9,900 | 230 | ||||||
Universal Display* | 9,603 | 449 | ||||||
VeriFone Holdings* | 11,965 | 417 | ||||||
Verint Systems* | 12,042 | 746 | ||||||
| 5 | SEI Institutional Managed Trust / Semi-Annual Report / March 31, 2015 |
SCHEDULE OF INVESTMENTS (Unaudited)
Small Cap Growth Fund
March 31, 2015
| Description | Shares | Market Value ($ Thousands) | ||||||
Web.com Group* | 300 | $ | 6 | |||||
WEX* | 7,667 | 823 | ||||||
Xcerra* | 31,900 | 284 | ||||||
Zebra Technologies, Cl A* | 8,258 | 749 | ||||||
|
| |||||||
| 92,982 | ||||||||
|
| |||||||
Materials — 2.2% | ||||||||
Balchem | 12,412 | 687 | ||||||
Berry Plastics Group* | 18,215 | 659 | ||||||
Calgon Carbon | 17,000 | 358 | ||||||
Eagle Materials | 8,103 | 677 | ||||||
Ferro* | 51,700 | 649 | ||||||
FutureFuel | 2,600 | 27 | ||||||
Globe Specialty Metals | 5,300 | 100 | ||||||
Graphic Packaging Holding | 16,900 | 246 | ||||||
H.B. Fuller | 15,128 | 648 | ||||||
Innophos Holdings | 6,900 | 389 | ||||||
KapStone Paper and Packaging | 6,100 | 200 | ||||||
Louisiana-Pacific (A)* | 21,497 | 355 | ||||||
Materion | 700 | 27 | ||||||
PolyOne | 26,125 | 976 | ||||||
Schulman A | 4,800 | 231 | ||||||
Scotts Miracle-Gro, Cl A | 5,954 | 400 | ||||||
Sensient Technologies | 6,122 | 422 | ||||||
Summit Materials, Cl A* | 18,022 | 399 | ||||||
US Concrete* | 17,611 | 597 | ||||||
Worthington Industries | 5,700 | 152 | ||||||
|
| |||||||
| 8,199 | ||||||||
|
| |||||||
Telecommunication Services — 0.6% |
| |||||||
Boingo Wireless* | 33,107 | 250 | ||||||
inContact* | 36,383 | 396 | ||||||
Inteliquent | 1,700 | 27 | ||||||
magicJack VocalTec (A)* | 26,900 | 184 | ||||||
RingCentral, Cl A (A)* | 99,135 | 1,520 | ||||||
|
| |||||||
| 2,377 | ||||||||
|
| |||||||
Utilities — 0.1% | ||||||||
American States Water | 200 | 8 | ||||||
Vivint Solar* | 32,656 | 396 | ||||||
|
| |||||||
| 404 | ||||||||
|
| |||||||
Total Common Stock | 357,952 | |||||||
|
| |||||||
EXCHANGE TRADED FUND — 0.3% |
| |||||||
iShares Russell 2000 Growth ETF (A) | 6,033 | 915 | ||||||
|
| |||||||
Total Exchange Traded Fund | 915 | |||||||
|
| |||||||
PREFERRED STOCK — 0.0% |
| |||||||
Utilities — 0.0% | ||||||||
Genie Energy Ltd (D) | 9,400 | 65 | ||||||
|
| |||||||
Total Preferred Stock | 65 | |||||||
|
| |||||||
RIGHTS — 0.0% | ||||||||
Durata Therapeutics CVR | 8,500 | — | ||||||
Furiex Pharmaceuticals - CVR | 800 | — | ||||||
|
| |||||||
Total Rights | — | |||||||
|
| |||||||
| Description | Shares/Face Amount ($ Thousands) | Market Value ($ Thousands) | ||||||
AFFILIATED PARTNERSHIP — 11.7% |
| |||||||
SEI Liquidity Fund, L.P. | $ | 42,956,281 | $ | 42,956 | ||||
|
| |||||||
Total Affiliated Partnership | 42,956 | |||||||
|
| |||||||
CASH EQUIVALENT — 2.8% |
| |||||||
SEI Daily Income Trust, Prime Obligation Fund, Cl A 0.010%**†† | 10,240,255 | 10,240 | ||||||
|
| |||||||
Total Cash Equivalent | 10,240 | |||||||
|
| |||||||
U.S. TREASURY OBLIGATION — 0.3% |
| |||||||
U.S. Treasury Bills | ||||||||
0.032%, 05/28/15 (F) (G) | 950 | 950 | ||||||
|
| |||||||
Total U.S. Treasury Obligation | 950 | |||||||
|
| |||||||
Total Investments — 112.0% | $ | 413,078 | ||||||
|
| |||||||
The open futures contracts held by the Fund at March 31, 2015, are as follows:
| Type of Contract | Number of Long (Short) | Expiration Date | Unrealized Appreciation ($ Thousands) | |||||||||
Russell 2000 Index E-MINI | 10 | Jun-2015 | $ | 35 | ||||||||
|
| |||||||||||
For the period ended March 31, 2015, the total amount of all open futures contracts, as presented in the table above, are representative of the volume of activity for this derivative type during the year.
Percentages are based on Net Assets of $368,828 ($Thousands).
| * | Non-income producing security. |
| ** | Rate shown is the 7-day effective yield as of March 31, 2015. |
| † | Real Estate Investment Trust. |
| †† | Investment in Affiliated Security. |
| ‡ | Narrow Industries are utilized for compliance purposes, whereas broad sectors are utilized for reporting. |
| (A) | This security or a partial position of this security is on loan at March 31, 2015. The total market value of securities on loan at March 31, 2015 was $42,956 ($ Thousands) |
| (B) | Security is fair valued using methods determined in good faith by the Fair Value Pricing Committee of the Board of Trustees. The total market value of such securities as of March 31, 2015 was $61 and represented 0.0% of net assets. |
| (C) | Security considered illiquid. The total value of such security as of March 31, 2015 was $61 ($ Thousands) and represented 0.0% of Net Assets. |
| (D) | Variable Rate Security — The rate reported on the Schedule of Investments is the rate in effect as of March 31, 2015. |
| (E) | This security was purchased with cash collateral held from securities on loan. The total value of such securities as of March 31, 2015 was $40,093 ($ Thousands). |
| (F) | The rate reported is the effective yield at the time of purchase. |
| (G) | Security, or portion thereof, has been pledged as collateral on open futures contracts. |
| 6 | SEI Institutional Managed Trust / Semi-Annual Report / March 31, 2015 |
SCHEDULE OF INVESTMENTS (Unaudited)
Small Cap Growth Fund
March 31, 2015
ADR — American Depositary Receipt
Cl — Class
ETF — Exchange-Traded Fund
L.P. — Limited Partnership
The following is a summary of the inputs used as of March 31, 2015, in valuing the Fund’s investments carried at value ($ Thousands):
| Investments in Securities | Level 1 | Level 2 | Level 3(1) | Total | ||||||||||||
Common Stock | $ | 357,891 | $ | — | $ | 61 | $ | 357,952 | ||||||||
Affiliated Partnership | — | 42,956 | — | 42,956 | ||||||||||||
Exchange Traded Fund | 915 | — | — | 915 | ||||||||||||
Preferred Stock | — | 65 | — | 65 | ||||||||||||
Rights | — | — | — | — | ||||||||||||
U.S. Treasury Obligation | — | 950 | — | 950 | ||||||||||||
Cash Equivalent | 10,240 | — | — | 10,240 | ||||||||||||
|
|
|
|
|
|
|
| |||||||||
Total Investments in Securities | $ | 369,046 | $ | 43,971 | $ | 61 | $ | 413,078 | ||||||||
|
|
|
|
|
|
|
| |||||||||
| Other Financial Instruments | Level 1 | Level 2 | Level 3 | Total | ||||||||||||
Futures Contracts* | ||||||||||||||||
Unrealized appreciation | $ | 35 | $ | — | $ | — | $ | 35 | ||||||||
|
|
|
|
|
|
|
| |||||||||
Total Other Financial Instruments | $ | 35 | $ | — | $ | — | $ | 35 | ||||||||
|
|
|
|
|
|
|
| |||||||||
| * | Futures contracts are valued at the unrealized appreciation on the instrument. |
| (1) | A reconciliation of Level 3 investments is presented when the Fund has a significant amount of Level 3 investments at the beginning and/or end of the period in relation to the net assets. |
For the period ended March 31, 2015, there were no transfers between Level 1 and Level 2 assets and liabilities.
For the period ended March 31, 2015, there were no significant transfers between Level 2 and Level 3 assets and liabilities.
Amounts designated as “—” are $0 or have been rounded to $0.
| 7 | SEI Institutional Managed Trust / Semi-Annual Report / March 31, 2015 |
SCHEDULE OF INVESTMENTS (Unaudited)
Tax-Managed Small/Mid Cap Fund
March 31, 2015
| Description | Shares | Market Value ($ Thousands) | ||||||
COMMON STOCK — 93.9% |
| |||||||
Consumer Discretionary — 13.4% |
| |||||||
Advance Auto Parts | 5,098 | $ | 763 | |||||
AMC Networks, Cl A* | 717 | 55 | ||||||
American Axle & Manufacturing Holdings* | 3,600 | 93 | ||||||
American Eagle Outfitters | 81,923 | 1,399 | ||||||
America’s Car-Mart* | 1,300 | 70 | ||||||
ANN* | 4,100 | 168 | ||||||
Apollo Education Group, Cl A* | 867 | 16 | ||||||
Aramark | 4,079 | 129 | ||||||
Arctic Cat | 3,476 | 126 | ||||||
Asbury Automotive Group* | 2,041 | 170 | ||||||
Ascena Retail Group* | 15,860 | 230 | ||||||
Ascent Capital Group, Cl A* | 1,500 | 60 | ||||||
Autoliv (A) | 7,000 | 824 | ||||||
Autonation* | 1,905 | 123 | ||||||
Barnes & Noble* | 1,500 | 36 | ||||||
Beazer Homes USA, Cl A* | 18,345 | 325 | ||||||
Bed Bath & Beyond* | 7,267 | 558 | ||||||
Belmond, Cl A* | 5,400 | 66 | ||||||
Big Lots | 35,551 | 1,707 | ||||||
Biglari Holdings* | 461 | 191 | ||||||
BJ’s Restaurants* | 7,157 | 361 | ||||||
Bloomin’ Brands | 17,720 | 431 | ||||||
Bob Evans Farms (A) | 2,641 | 122 | ||||||
Boyd Gaming* | 44,937 | 638 | ||||||
Bright Horizons Family Solutions (A)* | 14,619 | 750 | ||||||
Brinker International | 9,400 | 579 | ||||||
Brown Shoe | 2,700 | 89 | ||||||
Brunswick | 43,408 | 2,233 | ||||||
Buckle (A) | 4,078 | 208 | ||||||
Buffalo Wild Wings* | 7,855 | 1,424 | ||||||
Burlington Stores* | 10,030 | 596 | ||||||
Cabela’s (A)* | 10,880 | 609 | ||||||
Cablevision Systems, Cl A | 5,644 | 103 | ||||||
Callaway Golf | 36,270 | 346 | ||||||
Capella Education | 14,650 | 950 | ||||||
Career Education* | 2,696 | 14 | ||||||
Carrols Restaurant Group* | 1,575 | 13 | ||||||
Carter’s | 2,200 | 203 | ||||||
Cato, Cl A | 9,700 | 384 | ||||||
Cheesecake Factory | 3,149 | 155 | ||||||
Chico’s FAS | 5,500 | 97 | ||||||
Children’s Place | 23,771 | 1,526 | ||||||
Chipotle Mexican Grill, Cl A* | 700 | 455 | ||||||
Chuy’s Holdings (A)* | 12,285 | 277 | ||||||
Cinemark Holdings | 1,913 | 86 | ||||||
Citi Trends* | 653 | 18 | ||||||
Columbia Sportswear | 1,000 | 61 | ||||||
Container Store Group (A)* | 1,184 | 23 | ||||||
Cooper Tire & Rubber | 18,400 | 788 | ||||||
Core-Mark Holding, Cl A | 14,946 | 961 | ||||||
Cracker Barrel Old Country Store | 600 | 91 | ||||||
CSS Industries | 649 | 20 | ||||||
CST Brands | 5,292 | 232 | ||||||
Dana Holding | 54,869 | 1,161 | ||||||
Deckers Outdoor* | 409 | 30 | ||||||
DeVry | 292 | 10 | ||||||
Diamond Resorts International* | 10,346 | 346 | ||||||
Dick’s Sporting Goods | 6,670 | 380 | ||||||
| Description | Shares | Market Value ($ Thousands) | ||||||
Dillard’s, Cl A (A) | 2,522 | $ | 344 | |||||
DineEquity | 800 | 86 | ||||||
Dollar General | 5,211 | 393 | ||||||
Domino’s Pizza | 2,231 | 224 | ||||||
DR Horton | 7,350 | 209 | ||||||
DSW, Cl A | 846 | 31 | ||||||
Dunkin’ Brands Group | 2,386 | 114 | ||||||
Entercom Communications* | 1,583 | 19 | ||||||
Ethan Allen Interiors | 19,967 | 552 | ||||||
Express* | 35,085 | 580 | ||||||
Fiesta Restaurant Group* | 9,148 | 558 | ||||||
Five Below* | 30,879 | 1,098 | ||||||
Foot Locker, Cl A | 3,237 | 204 | ||||||
Fossil Group* | 1,300 | 107 | ||||||
Francesca’s Holdings* | 9,552 | 170 | ||||||
GameStop, Cl A | 10,900 | 414 | ||||||
Gannett | 18,864 | 700 | ||||||
Genesco* | 10,583 | 754 | ||||||
Gentex | 5,200 | 95 | ||||||
Gentherm (A)* | 3,300 | 167 | ||||||
G-III Apparel Group* | 12,589 | 1,418 | ||||||
Goodyear Tire & Rubber | 20,773 | 563 | ||||||
Graham Holdings, Cl B | 42 | 44 | ||||||
Grand Canyon Education* | 533 | 23 | ||||||
Group 1 Automotive | 1,724 | 149 | ||||||
Groupon, Cl A* | 29,795 | 215 | ||||||
Guess?, Cl 3 | 11,442 | 213 | ||||||
H&R Block | 20,000 | 641 | ||||||
Habit Restaurants, Cl A (A)* | 6,700 | 215 | ||||||
Hanesbrands | 7,152 | 240 | ||||||
Harley-Davidson, Cl A | 9,326 | 567 | ||||||
Harman International Industries, Cl A | 3,737 | 499 | ||||||
Hasbro | 8,180 | 517 | ||||||
Helen of Troy* | 5,974 | 487 | ||||||
HSN, Cl A | 17,792 | 1,214 | ||||||
Iconix Brand Group* | 1,300 | 44 | ||||||
IMAX* | 39,067 | 1,317 | ||||||
International Game Technology | 26,916 | 469 | ||||||
International Speedway, Cl A | 900 | 29 | ||||||
Interpublic Group | 33,148 | 733 | ||||||
Isle of Capri Casinos* | 14,702 | 207 | ||||||
J.C. Penney* | 24,570 | 207 | ||||||
Jack in the Box | 5,987 | 574 | ||||||
Jarden* | 9,996 | 529 | ||||||
John Wiley & Sons, Cl A | 900 | 55 | ||||||
Journal Communications, Cl A* | 13,350 | 198 | ||||||
Kate Spade* | 5,373 | 179 | ||||||
KB Home (A) | 1,372 | 21 | ||||||
Krispy Kreme Doughnuts* | 84,976 | 1,699 | ||||||
Lands’ End* | 236 | 8 | ||||||
La-Z-Boy, Cl Z | 513 | 14 | ||||||
Lear | 15,285 | 1,694 | ||||||
Leggett & Platt | 2,310 | 106 | ||||||
Lennar, Cl A | 3,465 | 180 | ||||||
Libbey | 11,000 | 439 | ||||||
Liberty TripAdvisor Holdings, Cl A* | 1,338 | 42 | ||||||
Liberty Ventures, Ser A* | 1,338 | 56 | ||||||
Life Time Fitness* | 800 | 57 | ||||||
Lions Gate Entertainment | 5,485 | 186 | ||||||
Lithia Motors, Cl A | 1,589 | 158 | ||||||
Live Nation* | 5,200 | 131 | ||||||
| 1 | SEI Institutional Managed Trust / Semi-Annual Report / March 31, 2015 |
SCHEDULE OF INVESTMENTS (Unaudited)
Tax-Managed Small/Mid Cap Fund
March 31, 2015
| Description | Shares | Market Value ($ Thousands) | ||||||
LKQ* | 20,997 | $ | 537 | |||||
Loral Space & Communications* | 800 | 55 | ||||||
lululemon athletica (A)* | 2,699 | 173 | ||||||
M/I Homes (A)* | 595 | 14 | ||||||
Madison Square Garden, Cl A* | 3,928 | 333 | ||||||
Marcus | 723 | 15 | ||||||
Matthews International, Cl A | 13,564 | 699 | ||||||
Mattress Firm Holding (A)* | 220 | 15 | ||||||
MDC Holdings | 2,000 | 57 | ||||||
MDC Partners, Cl A | 5,287 | 150 | ||||||
Men’s Wearhouse | 6,088 | 318 | ||||||
Meredith | 13,204 | 736 | ||||||
Meritage Homes (A)* | 1,800 | 88 | ||||||
Modine Manufacturing* | 2,100 | 28 | ||||||
Mohawk Industries* | 1,400 | 260 | ||||||
Monro Muffler | 5,724 | 372 | ||||||
Morgans Hotel Group* | 3,749 | 29 | ||||||
Morningstar, Cl A | 300 | 22 | ||||||
NACCO Industries, Cl A | 400 | 21 | ||||||
Nathan’s Famous | 200 | 11 | ||||||
National CineMedia | 77,987 | 1,178 | ||||||
Nautilus* | 534 | 8 | ||||||
NetFlix* | 256 | 107 | ||||||
New Remy Holdco* | 29,772 | 661 | ||||||
New York Times, Cl A | 11,962 | 165 | ||||||
Newell Rubbermaid, Cl B | 17,223 | 673 | ||||||
Nexstar Broadcasting Group, Cl A | 532 | 30 | ||||||
Norwegian Cruise Line Holdings* | 18,229 | 985 | ||||||
NVR* | 262 | 348 | ||||||
Office Depot* | 70,820 | 651 | ||||||
Outerwall | 1,200 | 79 | ||||||
Oxford Industries, Cl A | 3,452 | 261 | ||||||
Panera Bread, Cl A* | 8,513 | 1,362 | ||||||
Papa Murphy’s Holdings* | 1,688 | 31 | ||||||
Penn National Gaming* | 148,358 | 2,323 | ||||||
Penske Auto Group, Cl A | 1,800 | 93 | ||||||
Pep Boys-Manny Moe & Jack* | 11,862 | 114 | ||||||
Pier 1 Imports (A) | 17,078 | 239 | ||||||
Pinnacle Entertainment* | 527 | 19 | ||||||
Polaris Industries | 5,645 | 796 | ||||||
Pool | 24,064 | 1,679 | ||||||
Popeyes Louisiana Kitchen* | 5,887 | 352 | ||||||
Potbelly* | 9,023 | 124 | ||||||
PulteGroup | 7,423 | 165 | ||||||
PVH | 893 | 95 | ||||||
Red Robin Gourmet Burgers* | 5,117 | �� | 445 | |||||
Regal Entertainment Group, Cl A (A) | 1,592 | 36 | ||||||
Regis* | 8,334 | 136 | ||||||
Restaurant Brands International | 22,733 | 873 | ||||||
Ruby Tuesday* | 3,000 | 18 | ||||||
Ruth’s Chris Steak House | 1,450 | 23 | ||||||
Ryland Group (A) | 13,709 | 668 | ||||||
Sally Beauty Holdings* | 62,468 | 2,147 | ||||||
Scholastic, Cl B | 4,931 | 202 | ||||||
Scientific Games, Cl A (A)* | 60,886 | 638 | ||||||
Sears Holdings (A)* | 8,857 | 366 | ||||||
Select Comfort* | 20,267 | 699 | ||||||
Service International | 6,700 | 175 | ||||||
Shutterfly* | 1,700 | 77 | ||||||
Signet Jewelers | 9,058 | 1,257 | ||||||
Sinclair Broadcast Group, Cl A (A) | 621 | 20 | ||||||
Six Flags Entertainment | 312 | 15 | ||||||
| Description | Shares | Market Value ($ Thousands) | ||||||
Skechers U.S.A., Cl A* | 21,398 | $ | 1,539 | |||||
Skullcandy* | 3,473 | 39 | ||||||
SodaStream International (A)* | 23,134 | 469 | ||||||
Sonic | 1,045 | 33 | ||||||
Sonic Automotive, Cl A | 477 | 12 | ||||||
Sotheby’s (A) | 1,400 | 59 | ||||||
Stage Stores (A) | 17,500 | 401 | ||||||
Standard-Pacific* | 20,871 | 188 | ||||||
Starz - Liberty Capital* | 3,849 | 132 | ||||||
Steven Madden* | 9,797 | 372 | ||||||
Stoneridge* | 1,763 | 20 | ||||||
Strayer Education* | 4,662 | 249 | ||||||
Sturm Ruger | 7,913 | 393 | ||||||
Tempur Sealy International* | 5,145 | 297 | ||||||
Tenneco* | 14,569 | 837 | ||||||
Tesla Motors (A)* | 691 | 131 | ||||||
Texas Roadhouse, Cl A | 6,788 | 247 | ||||||
Thor Industries | 700 | 44 | ||||||
Titan International (A) | 114,568 | 1,073 | ||||||
Toll Brothers* | 3,528 | 139 | ||||||
TRI Pointe Homes* | 8,134 | 125 | ||||||
TRW Automotive Holdings* | 2,355 | 247 | ||||||
Tuesday Morning* | 44,322 | 714 | ||||||
Tumi Holdings* | 13,321 | 326 | ||||||
Tupperware Brands | 1,200 | 83 | ||||||
Ulta Salon Cosmetics & Fragrance* | 10,360 | 1,563 | ||||||
Under Armour, Cl A* | 2,400 | 194 | ||||||
Urban Outfitters* | 3,714 | 169 | ||||||
Vail Resorts | 9,395 | 972 | ||||||
Vista Outdoor* | 8,030 | 344 | ||||||
Visteon* | 5,986 | 577 | ||||||
Vitamin Shoppe* | 2,650 | 109 | ||||||
Wayfair, Cl A* | 12,441 | 400 | ||||||
Wendy’s | 35,881 | 391 | ||||||
Whirlpool | 5,200 | 1,051 | ||||||
Williams-Sonoma | 11,752 | 937 | ||||||
Winnebago Industries (A) | 1,852 | 39 | ||||||
Wolverine World Wide | 16,538 | 553 | ||||||
World Wrestling Entertainment, Cl A | 18,055 | 253 | ||||||
Zoe’s Kitchen (A)* | 34,999 | 1,165 | ||||||
Zumiez (A)* | 6,569 | 264 | ||||||
|
| |||||||
| 88,451 | ||||||||
|
| |||||||
Consumer Staples — 3.1% | ||||||||
Avon Products (A) | 21,978 | 176 | ||||||
B&G Foods, Cl A | 10,062 | 296 | ||||||
Boston Beer, Cl A* | 489 | 131 | ||||||
Boulder Brands* | 41,673 | 397 | ||||||
Cal-Maine Foods | 2,200 | 86 | ||||||
Casey’s General Stores | 10,240 | 923 | ||||||
Central Garden and Pet, Cl A* | 7,100 | 75 | ||||||
Chefs’ Warehouse Holdings* | 17,920 | 402 | ||||||
Coca-Cola Enterprises | 9,282 | 410 | ||||||
Constellation Brands, Cl A* | 353 | 41 | ||||||
Darling Ingredients* | 101,525 | 1,422 | ||||||
Dean Foods (A) | 2,650 | 44 | ||||||
Diamond Foods* | 1,500 | 49 | ||||||
Elizabeth Arden (A)* | 7,875 | 123 | ||||||
Energizer Holdings | 10,900 | 1,505 | ||||||
Flowers Foods | 4,500 | 102 | ||||||
Fresh Del Monte Produce | 10,000 | 389 | ||||||
Fresh Market (A)* | 3,016 | 123 | ||||||
| 2 | SEI Institutional Managed Trust / Semi-Annual Report / March 31, 2015 |
SCHEDULE OF INVESTMENTS (Unaudited)
Tax-Managed Small/Mid Cap Fund
March 31, 2015
| Description | Shares | Market Value ($ Thousands) | ||||||
Freshpet* | 33,808 | $ | 657 | |||||
Hain Celestial Group* | 3,400 | 218 | ||||||
Herbalife (A) | 2,400 | 103 | ||||||
Ingredion | 6,334 | 493 | ||||||
J&J Snack Foods | 12,068 | 1,288 | ||||||
JM Smucker | 5,662 | 655 | ||||||
Keurig Green Mountain | 739 | 83 | ||||||
Kroger | 13,284 | 1,018 | ||||||
Lancaster Colony | 2,331 | 222 | ||||||
Medifast* | 931 | 28 | ||||||
Molson Coors Brewing, Cl B | 10,490 | 781 | ||||||
Monster Beverage* | 1,046 | 145 | ||||||
Nu Skin Enterprises, Cl A (A) | 900 | 54 | ||||||
Omega Protein* | 23,400 | 320 | ||||||
Post Holdings* | 500 | 23 | ||||||
Rite Aid* | 68,864 | 598 | ||||||
Sanderson Farms | 1,000 | 80 | ||||||
Snyder’s-Lance | 7,852 | 251 | ||||||
SpartanNash | 24,477 | 772 | ||||||
Spectrum Brands Holdings | 9,521 | 853 | ||||||
Sprouts Farmers Market* | 37,187 | 1,310 | ||||||
SUPERVALU* | 55,338 | 644 | ||||||
SYSCO, Cl A | 10,784 | 407 | ||||||
TreeHouse Foods* | 8,728 | 742 | ||||||
United Natural Foods* | 3,596 | 277 | ||||||
Universal | 5,400 | 255 | ||||||
USANA Health Sciences* | 4,700 | 522 | ||||||
Vector Group | 3,699 | 81 | ||||||
WD-40 | 400 | 35 | ||||||
Weis Markets | 3,800 | 189 | ||||||
WhiteWave Foods, Cl A* | 20,031 | 888 | ||||||
|
| |||||||
| 20,686 | ||||||||
|
| |||||||
Energy — 3.2% | ||||||||
Abraxas Petroleum* | 5,943 | 19 | ||||||
Alon USA Energy | 841 | 14 | ||||||
Atwood Oceanics, Cl A | 7,355 | 207 | ||||||
Basic Energy Services* | 60,411 | 419 | ||||||
Bill Barrett* | 28,893 | 240 | ||||||
Bonanza Creek Energy* | 20,693 | 510 | ||||||
Bristow Group (A) | 4,687 | 255 | ||||||
Callon Petroleum* | 45,062 | 337 | ||||||
CARBO Ceramics (A) | 33,457 | 1,021 | ||||||
Carrizo Oil & Gas* | 17,323 | 860 | ||||||
Cheniere Energy* | 5,327 | 412 | ||||||
Comstock Resources (A) | 38,461 | 137 | ||||||
Diamondback Energy, Cl A* | 10,189 | 783 | ||||||
Dresser-Rand Group* | 2,636 | 212 | ||||||
Dril-Quip* | 4,470 | 306 | ||||||
Energen | 2,800 | 185 | ||||||
Energy XXI (A) | 44,643 | 163 | ||||||
EQT | 5,505 | 456 | ||||||
Exterran Holdings | 19,351 | 650 | ||||||
Frank’s International | 15,500 | 290 | ||||||
GasLog | 20,245 | 393 | ||||||
Golar LNG | 3,200 | 107 | ||||||
Hallador Energy | 1,311 | 15 | ||||||
Helmerich & Payne | 1,300 | 88 | ||||||
Hornbeck Offshore Services (A)* | 17,377 | 327 | ||||||
Key Energy Services* | 90,909 | 165 | ||||||
Kosmos Energy* | 30,000 | 237 | ||||||
Laredo Petroleum (A)* | 42,710 | 557 | ||||||
LinnCo (A) | 2,688 | 26 | ||||||
Matador Resources* | 49,612 | 1,087 | ||||||
| Description | Shares | Market Value ($ Thousands) | ||||||
McDermott International (A)* | 87,918 | $ | 338 | |||||
Nabors Industries | 22,802 | 311 | ||||||
Natural Gas Services Group* | 1,469 | 28 | ||||||
Newfield Exploration* | 1,429 | 50 | ||||||
Newpark Resources, Cl A* | 25,960 | 236 | ||||||
Oasis Petroleum (A)* | 41,542 | 591 | ||||||
Oceaneering International, Cl A | 2,699 | 145 | ||||||
Oil States International* | 1,249 | 50 | ||||||
Panhandle Oil and Gas, Cl A | 1,200 | 24 | ||||||
Parsley Energy, Cl A (A)* | 18,072 | 289 | ||||||
Patterson-UTI Energy | 4,000 | 75 | ||||||
PBF Energy, Cl A | 56,660 | 1,922 | ||||||
PDC Energy, Cl A* | 4,059 | 219 | ||||||
Penn Virginia* | 76,789 | 498 | ||||||
Pioneer Natural Resources | 2,474 | 405 | ||||||
Range Resources | 2,470 | 129 | ||||||
RigNet, Cl A (A)* | 519 | 15 | ||||||
Rosetta Resources* | 22,228 | 378 | ||||||
Rowan, Cl A | 10,005 | 177 | ||||||
Sanchez Energy (A)* | 23,365 | 304 | ||||||
SandRidge Energy, Cl A (A)* | 114,942 | 205 | ||||||
SEACOR Holdings, Cl A* | 2,768 | 193 | ||||||
SemGroup, Cl A | 407 | 33 | ||||||
Stone Energy, Cl A* | 4,784 | 70 | ||||||
Superior Energy Services | 23,629 | 528 | ||||||
Tesoro | 14,233 | 1,299 | ||||||
Tidewater, Cl A (A) | 27,792 | 532 | ||||||
Unit* | 7,250 | 203 | ||||||
US Silica Holdings (A) | 8,435 | 300 | ||||||
Western Refining | 21,873 | 1,080 | ||||||
World Fuel Services | 1,200 | 69 | ||||||
|
| |||||||
| 21,174 | ||||||||
|
| |||||||
Financials — 19.1% | ||||||||
1st Source | 4,900 | 157 | ||||||
Acadia Realty Trust† | 37,048 | 1,292 | ||||||
Affiliated Managers Group* | 681 | 146 | ||||||
Alexander’s† | 100 | 46 | ||||||
Alexandria Real Estate Equities† | 10,497 | 1,029 | ||||||
Alleghany* | 298 | 145 | ||||||
Allied World Assurance Holdings | 18,600 | 751 | ||||||
Allstate | 8,087 | 576 | ||||||
Altisource Residential† | 525 | 11 | ||||||
American Assets Trust† | 28,220 | 1,221 | ||||||
American Campus Communities† | 28,488 | 1,221 | ||||||
American Capital* | 8,900 | 132 | ||||||
American Equity Investment Life Holding | 4,000 | 117 | ||||||
American Financial Group | 13,800 | 885 | ||||||
American National Insurance | 4,000 | 394 | ||||||
American Residential Properties*† | 606 | 11 | ||||||
Ameriprise Financial | 5,318 | 696 | ||||||
Ameris Bancorp | 612 | 16 | ||||||
Amerisafe | 1,639 | 76 | ||||||
Ames National, Cl B | 463 | 11 | ||||||
Anchor BanCorp Wisconsin* | 13,083 | 454 | ||||||
Anworth Mortgage Asset† | 27,389 | 139 | ||||||
Apartment Investment & Management, Cl A† | 3,753 | 148 | ||||||
Apollo Commercial Real Estate Finance† | 2,950 | 51 | ||||||
Arch Capital Group* | 3,336 | 205 | ||||||
Ares Capital | 10,969 | 188 | ||||||
| 3 | SEI Institutional Managed Trust / Semi-Annual Report / March 31, 2015 |
SCHEDULE OF INVESTMENTS (Unaudited)
Tax-Managed Small/Mid Cap Fund
March 31, 2015
| Description | Shares | Market Value ($ Thousands) | ||||||
Argo Group International Holdings | 4,935 | $ | 247 | |||||
Armada Hoffler Properties† | 908 | 10 | ||||||
Arthur J. Gallagher | 24,458 | 1,143 | ||||||
Artisan Partners Asset Management, Cl A | 6,834 | 311 | ||||||
Ashford* | 13 | 1 | ||||||
Ashford Hospitality Trust (A)† | 1,207 | 12 | ||||||
Aspen Insurance Holdings | 8,500 | 401 | ||||||
Associated Banc-Corp | 34,174 | 636 | ||||||
Associated Estates Realty (A)† | 3,300 | 81 | ||||||
Assurant | 10,159 | 624 | ||||||
Assured Guaranty | 6,000 | 158 | ||||||
Axis Capital Holdings | 2,535 | 131 | ||||||
Banco Latinoamericano de Exportaciones, Cl E (A) | 21,159 | 694 | ||||||
Bancorp* | 54,406 | 491 | ||||||
Bank Mutual | 2,912 | 21 | ||||||
Bank of Hawaii | 4,313 | 264 | ||||||
Bank of Marin Bancorp | 496 | 25 | ||||||
Bank of the Ozarks (A) | 32,535 | 1,201 | ||||||
BankFinancial | 1,059 | 14 | ||||||
BankUnited | 32,581 | 1,067 | ||||||
Banner | 523 | 24 | ||||||
BBCN Bancorp | 8,316 | 120 | ||||||
Beneficial Bancorp* | 51,000 | 576 | ||||||
Berkshire Hills Bancorp | 11,600 | 321 | ||||||
BGC Partners, Cl A | 3,162 | 30 | ||||||
BioMed Realty Trust† | 4,615 | 105 | ||||||
BlackRock Capital Investment | 2,400 | 22 | ||||||
Blackstone Mortgage Trust, Cl A† | 5,656 | 160 | ||||||
Boston Private Financial Holdings | 96,724 | 1,175 | ||||||
Brandywine Realty Trust (A)† | 29,277 | 468 | ||||||
Bridge Capital Holdings* | 649 | 17 | ||||||
Brixmor Property Group† | 8,180 | 217 | ||||||
Brown & Brown | 2,724 | 90 | ||||||
Calamos Asset Management, Cl A | 28,862 | 388 | ||||||
Camden Property Trust† | 1,473 | 115 | ||||||
Capitol Federal Financial | 1,659 | 21 | ||||||
Capstead Mortgage (A)† | 1,900 | 22 | ||||||
Cardinal Financial | 13,748 | 275 | ||||||
Cash America International | 520 | 12 | ||||||
Cathay General Bancorp | 2,100 | 60 | ||||||
CBL & Associates Properties† | 40,731 | 806 | ||||||
CBRE Group, Cl A* | 31,362 | 1,214 | ||||||
Cedar Realty Trust† | 1,931 | 14 | ||||||
Chambers Street Properties† | 32,497 | 256 | ||||||
Charter Financial | 994 | 11 | ||||||
Chatham Lodging Trust† | 669 | 20 | ||||||
Chemical Financial | 10,100 | 317 | ||||||
Chesapeake Lodging Trust† | 3,000 | 102 | ||||||
Chimera Investment† | 35,088 | 110 | ||||||
City National | 10,652 | 949 | ||||||
CNB Financial | 608 | 10 | ||||||
CNO Financial Group | 105,066 | 1,809 | ||||||
CoBiz Financial | 72,117 | 888 | ||||||
Cohen & Steers | 491 | 20 | ||||||
Colony Financial, Cl A† | 2,059 | 53 | ||||||
Columbia Banking System | 1,330 | 39 | ||||||
Commerce Bancshares | 8,371 | 354 | ||||||
Community Trust Bancorp | 11,110 | 368 | ||||||
ConnectOne Bancorp | 1,704 | 33 | ||||||
Consolidated-Tomoka Land | 276 | 17 | ||||||
Corporate Office Properties Trust† | 12,045 | 354 | ||||||
| Description | Shares | Market Value ($ Thousands) | ||||||
Corrections Corp of America | 2,250 | $ | 91 | |||||
Cousins Properties, Cl A† | 14,402 | 153 | ||||||
Cowen Group, Cl A* | 3,345 | 17 | ||||||
Credit Acceptance, Cl A (A)* | 230 | 45 | ||||||
CubeSmart† | 3,500 | 85 | ||||||
CVB Financial | 14,812 | 236 | ||||||
CYS Investments† | 36,241 | 323 | ||||||
DCT Industrial Trust† | 2,275 | 79 | ||||||
DDR† | 6,338 | 118 | ||||||
DiamondRock Hospitality† | 4,812 | 68 | ||||||
Dime Community Bancshares | 15,500 | 249 | ||||||
Douglas Emmett† | 27,499 | 820 | ||||||
Duke Realty† | 7,859 | 171 | ||||||
DuPont Fabros Technology† | 41,958 | 1,371 | ||||||
E*Trade Financial* | 36,907 | 1,054 | ||||||
Eagle Bancorp* | 39,339 | 1,511 | ||||||
East West Bancorp | 49,395 | 1,999 | ||||||
EastGroup Properties† | 17,132 | 1,030 | ||||||
Education Realty Trust† | 33,993 | 1,203 | ||||||
Empire State Realty Trust, Cl A† | 999 | 19 | ||||||
Employers Holdings | 17,888 | 483 | ||||||
Encore Capital Group (A)* | 303 | 13 | ||||||
Endurance Specialty Holdings | 18,886 | 1,155 | ||||||
Enstar Group* | 400 | 57 | ||||||
EPR Properties, Cl A† | 5,520 | 331 | ||||||
Equity Commonwealth*† | 11,100 | 295 | ||||||
Equity LifeStyle Properties† | 1,800 | 99 | ||||||
Equity One, Cl A† | 16,882 | 451 | ||||||
Erie Indemnity, Cl A | 2,000 | 175 | ||||||
Essex Property Trust† | 697 | 160 | ||||||
Evercore Partners, Cl A | 700 | 36 | ||||||
Everest Re Group | 6,060 | 1,054 | ||||||
Excel Trust (A)† | 2,400 | 34 | ||||||
Extra Space Storage† | 2,600 | 176 | ||||||
Ezcorp, Cl A* | 1,038 | 10 | ||||||
FBL Financial Group, Cl A (A) | 2,500 | 155 | ||||||
Federal Agricultural Mortgage, Cl C | 381 | 11 | ||||||
Federal Realty Investment Trust† | 1,637 | 241 | ||||||
Federated Investors, Cl B (A) | 9,971 | 338 | ||||||
FelCor Lodging Trust† | 6,100 | 70 | ||||||
Fifth Third Bancorp | 35,039 | 660 | ||||||
Financial Engines (A) | 16,863 | 705 | ||||||
First American Financial | 3,200 | 114 | ||||||
First Bancorp | 1,688 | 29 | ||||||
First BanCorp Puerto Rico* | 19,799 | 123 | ||||||
First Busey | 2,233 | 15 | ||||||
First Citizens BancShares, Cl A | 499 | 130 | ||||||
First Commonwealth Financial (A) | 51,502 | 463 | ||||||
First Financial Bancorp | 3,100 | 55 | ||||||
First Financial Bankshares, Cl A (A) | 1,800 | 50 | ||||||
First Financial Northwest | 979 | 12 | ||||||
First Horizon National | 48,411 | 692 | ||||||
First Industrial Realty Trust† | 4,500 | 96 | ||||||
First Midwest Bancorp | 37,558 | 652 | ||||||
First NBC Bank Holding* | 12,995 | 429 | ||||||
First Niagara Financial Group | 193,795 | 1,713 | ||||||
First Potomac Realty Trust† | 3,400 | 40 | ||||||
First Republic Bank | 2,614 | 149 | ||||||
FirstMerit, Cl A (A) | 40,104 | 764 | ||||||
Flushing Financial | 1,600 | 32 | ||||||
FNB (Pennsylvania) (A) | 42,284 | 556 | ||||||
| 4 | SEI Institutional Managed Trust / Semi-Annual Report / March 31, 2015 |
SCHEDULE OF INVESTMENTS (Unaudited)
Tax-Managed Small/Mid Cap Fund
March 31, 2015
| Description | Shares | Market Value ($ Thousands) | ||||||
FNF Group | 6,136 | $ | 226 | |||||
FNFV Group* | 1,233 | 17 | ||||||
Forest City Enterprises, Cl A* | 59,109 | 1,509 | ||||||
Fox Chase Bancorp, Cl A | 613 | 10 | ||||||
Franklin Street Properties† | 5,100 | 65 | ||||||
FRP Holdings* | 8,252 | 300 | ||||||
Fulton Financial | 49,639 | 613 | ||||||
GAMCO Investors, Cl A | 400 | 31 | ||||||
Gaming and Leisure Properties† | 1,300 | 48 | ||||||
Genworth Financial, Cl A* | 34,591 | 253 | ||||||
GEO Group† | 2,419 | 106 | ||||||
Getty Realty† | 3,100 | 56 | ||||||
GFI Group | 4,000 | 24 | ||||||
Glacier Bancorp, Cl A (A) | 23,321 | 587 | ||||||
Gladstone Commercial† | 2,329 | 43 | ||||||
Gramercy Property Trust† | 1,715 | 48 | ||||||
Green Dot, Cl A (A)* | 16,458 | 262 | ||||||
Greenlight Capital Re (A)* | 1,000 | 32 | ||||||
Hampton Roads Bankshares* | 6,129 | 12 | ||||||
Hancock Holding, Cl A | 20,826 | 622 | ||||||
Hanmi Financial (A) | 586 | 12 | ||||||
Hanover Insurance Group, Cl A | 40,984 | 2,975 | ||||||
Hartford Financial Services Group | 18,429 | 771 | ||||||
Hatteras Financial† | 2,449 | 44 | ||||||
HCC Insurance Holdings | 1,700 | 96 | ||||||
Healthcare Realty Trust† | 3,400 | 94 | ||||||
Hercules Technology Growth Capital, Cl A (A) | 2,284 | 31 | ||||||
Heritage Commerce | 1,359 | 12 | ||||||
Hersha Hospitality Trust, Cl A† | 6,370 | 41 | ||||||
HFF, Cl A | 12,537 | 471 | ||||||
Highwoods Properties† | 20,896 | 957 | ||||||
Hilltop Holdings* | 610 | 12 | ||||||
Home BancShares | 17,734 | 601 | ||||||
Home Loan Servicing Solutions (A) | 12,292 | 203 | ||||||
Home Properties† | 588 | 41 | ||||||
Horace Mann Educators, Cl A | 23,303 | 797 | ||||||
Hospitality Properties Trust | 21,800 | 719 | ||||||
Host Hotels & Resorts† | 20,555 | 415 | ||||||
Hudson City Bancorp, Cl A | 69,643 | 730 | ||||||
Hudson Pacific Properties† | 1,170 | 39 | ||||||
Hudson Valley Holding | 589 | 15 | ||||||
Huntington Bancshares | 148,998 | 1,646 | ||||||
IBERIABANK | 14,109 | 889 | ||||||
Independent Bank (A) | 800 | 35 | ||||||
Infinity Property & Casualty | 6,577 | 540 | ||||||
Inland Real Estate (A)† | 46,050 | 492 | ||||||
International Bancshares | 1,392 | 36 | ||||||
Investment Technology Group* | 715 | 22 | ||||||
Investors Bancorp | 122,838 | 1,440 | ||||||
iStar Financial*† | 1,894 | 25 | ||||||
Janus Capital Group | 35,474 | 610 | ||||||
Jones Lang LaSalle | 999 | 170 | ||||||
Kemper, Cl A | 2,400 | 93 | ||||||
Kennedy-Wilson Holdings | 33,283 | 870 | ||||||
Kilroy Realty† | 1,275 | 97 | ||||||
Kite Realty Group Trust† | 569 | 16 | ||||||
Lamar Advertising, Cl A | 1,502 | 89 | ||||||
LaSalle Hotel Properties† | 23,535 | 915 | ||||||
LegacyTexas Financial Group | 21,650 | 492 | ||||||
Legg Mason | 2,550 | 141 | ||||||
Lexington Realty Trust† | 72,556 | 713 | ||||||
Liberty Property Trust† | 2,295 | 82 | ||||||
| Description | Shares | Market Value ($ Thousands) | ||||||
LPL Financial Holdings | 655 | $ | 29 | |||||
LTC Properties† | 2,500 | 115 | ||||||
Mack-Cali Realty† | 18,777 | 362 | ||||||
MainSource Financial Group | 1,220 | 24 | ||||||
Manning & Napier, Cl A | 843 | 11 | ||||||
Markel (A)* | 320 | 246 | ||||||
MarketAxess Holdings | 3,601 | 298 | ||||||
MB Financial (A) | 21,400 | 670 | ||||||
MBIA* | 5,600 | 52 | ||||||
MCG Capital | 3,030 | 12 | ||||||
Meadowbrook Insurance Group | 6,300 | 54 | ||||||
Medical Properties Trust† | 5,500 | 81 | ||||||
Mercury General | 500 | 29 | ||||||
MFA Financial† | 110,139 | 866 | ||||||
MGIC Investment* | 111,185 | 1,071 | ||||||
Mid-America Apartment Communities† | 8,042 | 621 | ||||||
Monmouth Real Estate Investment, Cl A† | 2,183 | 24 | ||||||
Montpelier Re Holdings (A) | 18,100 | 696 | ||||||
MSCI, Cl A | 2,800 | 172 | ||||||
NASDAQ OMX Group, Cl A | 1,409 | 72 | ||||||
National Health Investors (A)† | 800 | 57 | ||||||
National Penn Bancshares | 58,312 | 628 | ||||||
National Retail Properties† | 2,469 | 101 | ||||||
National Western Life Insurance, Cl A | 200 | 51 | ||||||
Navigators Group* | 800 | 62 | ||||||
NBT Bancorp (A) | 800 | 20 | ||||||
Nelnet, Cl A | 932 | 44 | ||||||
New Residential Investment† | 1,634 | 25 | ||||||
New York Mortgage Trust (A)† | 3,009 | 23 | ||||||
Northfield Bancorp | 1,122 | 17 | ||||||
NorthStar Asset Management Group | 9,218 | 215 | ||||||
NorthStar Realty Finance† | 3,601 | 65 | ||||||
Ocwen Financial* | 24,840 | 205 | ||||||
OFG Bancorp (A) | 64,134 | 1,047 | ||||||
Old National Bancorp, Cl A (A) | 19,003 | 270 | ||||||
Old Republic International | 4,000 | 60 | ||||||
Omega Healthcare Investors† | 33,700 | 1,367 | ||||||
One Liberty Properties† | 635 | 16 | ||||||
Oppenheimer Holdings, Cl A | 660 | 15 | ||||||
Oritani Financial | 4,100 | 60 | ||||||
Pacific Continental | 884 | 12 | ||||||
PacWest Bancorp | 74,451 | 3,491 | ||||||
Park National | 300 | 26 | ||||||
Parkway Properties† | 1,187 | 21 | ||||||
PartnerRe | 14,878 | 1,701 | ||||||
Pebblebrook Hotel Trust† | 47,337 | 2,205 | ||||||
Pennsylvania Real Estate Investment Trust (A)† | 27,100 | 630 | ||||||
Peoples Bancorp | 840 | 20 | ||||||
People’s United Financial | 9,000 | 137 | ||||||
PHH* | 11,775 | 285 | ||||||
Phoenix* | 230 | 11 | ||||||
Physicians Realty Trust† | 763 | 13 | ||||||
Piedmont Office Realty Trust, Cl A† | 2,520 | 47 | ||||||
Popular* | 19,440 | 669 | ||||||
Post Properties† | 1,200 | 68 | ||||||
Potlatch† | 4,057 | 162 | ||||||
PRA Group (A)* | 1,200 | 65 | ||||||
| 5 | SEI Institutional Managed Trust / Semi-Annual Report / March 31, 2015 |
SCHEDULE OF INVESTMENTS (Unaudited)
Tax-Managed Small/Mid Cap Fund
March 31, 2015
| Description | Shares | Market Value ($ Thousands) | ||||||
Preferred Bank | 479 | $ | 13 | |||||
Principal Financial Group, Cl A | 7,000 | 360 | ||||||
PrivateBancorp, Cl A | 11,302 | 397 | ||||||
ProAssurance | 3,352 | 154 | ||||||
Prosperity Bancshares | 9,377 | 492 | ||||||
Provident Financial Services | 11,461 | 214 | ||||||
PS Business Parks† | 3,811 | 316 | ||||||
Pzena Investment Management, Cl A | 1,239 | 11 | ||||||
Radian Group | 60,509 | 1,016 | ||||||
Ramco-Gershenson Properties† | 16,374 | 305 | ||||||
Raymond James Financial | 1,947 | 111 | ||||||
Realogy Holdings* | 10,819 | 492 | ||||||
Redwood Trust (A) | 1,200 | 21 | ||||||
Regency Centers† | 1,585 | 108 | ||||||
Regions Financial | 21,200 | 200 | ||||||
Reinsurance Group of America, Cl A | 13,116 | 1,222 | ||||||
RenaissanceRe Holdings | 4,670 | 466 | ||||||
Renasant | 17,000 | 511 | ||||||
Resource Capital (A)† | 2,600 | 12 | ||||||
Retail Opportunity Investments (A)† | 10,108 | 185 | ||||||
Rexford Industrial Realty (A)† | 15,104 | 239 | ||||||
RLI (A) | 1,600 | 84 | ||||||
RLJ Lodging Trust† | 17,849 | 559 | ||||||
Ryman Hospitality Properties | 1,086 | 66 | ||||||
S&T Bancorp | 5,000 | 142 | ||||||
Sabra Health Care (A)† | 2,365 | 78 | ||||||
Safeguard Scientifics* | 34,616 | 626 | ||||||
Selective Insurance Group | 19,441 | 565 | ||||||
Senior Housing Properties Trust† | 3,100 | 69 | ||||||
Signature Bank NY, Cl B* | 12,022 | 1,558 | ||||||
Silver Bay Realty Trust† | 17,157 | 277 | ||||||
Southwest Bancorp | 1,279 | 23 | ||||||
Sovran Self Storage† | 1,800 | 169 | ||||||
Spirit Realty Capital† | 11,051 | 134 | ||||||
STAG Industrial (A)† | 5,138 | 121 | ||||||
StanCorp Financial Group | 11,989 | 822 | ||||||
Starwood Property Trust† | 2,300 | 56 | ||||||
State Bank Financial | 1,268 | 27 | ||||||
State National | 21,483 | 214 | ||||||
Sterling Bancorp (A) | 18,456 | 247 | ||||||
Stifel Financial* | 20,005 | 1,115 | ||||||
Strategic Hotels & Resorts*† | 8,200 | 102 | ||||||
Summit Hotel Properties† | 2,321 | 33 | ||||||
Sun Communities† | 1,400 | 93 | ||||||
Sunstone Hotel Investors† | 5,146 | 86 | ||||||
SunTrust Banks | 17,965 | 738 | ||||||
Susquehanna Bancshares | 41,068 | 563 | ||||||
SVB Financial Group, Cl B* | 8,313 | 1,056 | ||||||
Symetra Financial | 31,096 | 729 | ||||||
Synovus Financial | 3,642 | 102 | ||||||
Tanger Factory Outlet Centers† | 4,779 | 168 | ||||||
Taubman Centers† | 1,493 | 115 | ||||||
TCF Financial | 132,731 | 2,087 | ||||||
Terreno Realty† | 654 | 15 | ||||||
Texas Capital Bancshares* | 2,000 | 97 | ||||||
TFS Financial | 7,901 | 116 | ||||||
Triumph Bancorp* | 21,299 | 291 | ||||||
Trustmark (A) | 7,233 | 176 | ||||||
Two Harbors Investment† | 22,381 | 238 | ||||||
UMB Financial | 180 | 10 | ||||||
| Description | Shares | Market Value ($ Thousands) | ||||||
UMH Properties† | 1,069 | $ | 11 | |||||
Umpqua Holdings | 11,040 | 190 | ||||||
United Bankshares (A) | 4,300 | 162 | ||||||
United Community Banks | 805 | 15 | ||||||
United Fire Group | 4,000 | 127 | ||||||
Universal Health Realty Income Trust† | 296 | 17 | ||||||
Unum Group | 29,327 | 989 | ||||||
Urstadt Biddle Properties, Cl A† | 1,048 | 24 | ||||||
Validus Holdings | 15,363 | 647 | ||||||
Waddell & Reed Financial, Cl A | 1,215 | 60 | ||||||
Washington† | 10,111 | 279 | ||||||
Washington Federal | 1,500 | 33 | ||||||
Webster Financial | 7,700 | 285 | ||||||
Weingarten Realty Investors† | 1,925 | 69 | ||||||
WesBanco | 12,800 | 417 | ||||||
Western Alliance Bancorp* | 70,979 | 2,104 | ||||||
White Mountains Insurance Group | 100 | 68 | ||||||
Whitestone, Cl B† | 763 | 12 | ||||||
Willis Group Holdings | 10,107 | 487 | ||||||
Wilshire Bancorp (A) | 1,754 | 17 | ||||||
Wintrust Financial | 600 | 29 | ||||||
WisdomTree Investments | 68,088 | 1,461 | ||||||
WL Ross Holding* | 23,700 | 249 | ||||||
World Acceptance* | 4,501 | 328 | ||||||
WR Berkley | 1,441 | 73 | ||||||
WSFS Financial | 9,335 | 706 | ||||||
Yadkin Financial* | 20,000 | 406 | ||||||
Zions Bancorporation | 20,346 | 549 | ||||||
|
| |||||||
| 126,272 | ||||||||
|
| |||||||
Health Care — 15.5% | ||||||||
Abaxis (A) | 5,321 | 341 | ||||||
ABIOMED* | 13,981 | 1,001 | ||||||
Acadia Healthcare, Cl A* | 54,196 | 3,880 | ||||||
ACADIA Pharmaceuticals (A)* | 1,229 | 40 | ||||||
Accuray* | 4,734 | 44 | ||||||
Acorda Therapeutics* | 3,969 | 132 | ||||||
Aegerion Pharmaceuticals, Cl A* | 9,737 | 255 | ||||||
Affymetrix, Cl A* | 4,300 | 54 | ||||||
Air Methods* | 6,516 | 304 | ||||||
Akorn* | 82,788 | 3,933 | ||||||
Alere* | 21,452 | 1,049 | ||||||
Alexion Pharmaceuticals* | 2,909 | 504 | ||||||
Align Technology* | 16,270 | 875 | ||||||
Alkermes* | 19,572 | 1,193 | ||||||
Allscripts Healthcare Solutions* | 2,740 | 33 | ||||||
Almost Family* | 454 | 20 | ||||||
Alnylam Pharmaceuticals (A)* | 6,062 | 633 | ||||||
AMAG Pharmaceuticals* | 10,039 | 549 | ||||||
Amedisys* | 8,915 | 239 | ||||||
AmerisourceBergen | 6,362 | 723 | ||||||
Amicus Therapeutics* | 4,902 | 53 | ||||||
Amsurg* | 34,469 | 2,121 | ||||||
Anacor Pharmaceuticals* | 7,269 | 421 | ||||||
ANI Pharmaceuticals* | 3,892 | 243 | ||||||
Arena Pharmaceuticals (A)* | 9,805 | 43 | ||||||
Ariad Pharmaceuticals* | 19,758 | 163 | ||||||
Array BioPharma* | 5,436 | 40 | ||||||
Arrowhead Research (A)* | 39,601 | 268 | ||||||
athenahealth (A)* | 1,600 | 191 | ||||||
Becton Dickinson | 1,218 | 175 | ||||||
| 6 | SEI Institutional Managed Trust / Semi-Annual Report / March 31, 2015 |
SCHEDULE OF INVESTMENTS (Unaudited)
Tax-Managed Small/Mid Cap Fund
March 31, 2015
| Description | Shares | Market Value ($ Thousands) | ||||||
BioDelivery Sciences International* | 1,090 | $ | 11 | |||||
BioMarin Pharmaceuticals* | 7,292 | 909 | ||||||
Bio-Rad Laboratories, Cl A* | 2,502 | 338 | ||||||
Bio-Reference Laboratories (A)* | 1,000 | 35 | ||||||
Bio-Techne | 1,171 | 117 | ||||||
Brookdale Senior Living, Cl A* | 21,161 | 799 | ||||||
Bruker BioSciences* | 19,364 | 358 | ||||||
Capital Senior Living* | 200 | 5 | ||||||
Catamaran* | 10,286 | 612 | ||||||
Celldex Therapeutics, Cl A (A)* | 7,382 | 206 | ||||||
Centene* | 3,200 | 226 | ||||||
Cepheid* | 11,079 | 630 | ||||||
Cerus (A)* | 5,403 | 23 | ||||||
Charles River Laboratories International* | 29,906 | 2,371 | ||||||
Chemed (A) | 9,100 | 1,087 | ||||||
ChemoCentryx (A)* | 2,128 | 16 | ||||||
Chimerix* | 4,814 | 181 | ||||||
Clovis Oncology (A)* | 2,787 | 207 | ||||||
Community Health Systems* | 11,818 | 618 | ||||||
Conmed | 15,740 | 795 | ||||||
Cooper, Cl A | 5,976 | 1,120 | ||||||
Corcept Therapeutics* | 5,556 | 31 | ||||||
CTI BioPharma (A)* | 5,848 | 11 | ||||||
Dentsply International | 21,678 | 1,103 | ||||||
Depomed* | 13,744 | 308 | ||||||
DexCom* | 26,872 | 1,675 | ||||||
Dyax* | 3,774 | 63 | ||||||
Endo International* | 10,232 | 918 | ||||||
Envision Healthcare Holdings* | 37,160 | 1,425 | ||||||
Exact Sciences* | 4,766 | 105 | ||||||
ExamWorks Group* | 24,081 | 1,002 | ||||||
Fluidigm (A)* | 4,776 | 201 | ||||||
Foundation Medicine* | 4,150 | 200 | ||||||
GenMark Diagnostics* | 1,141 | 15 | ||||||
Genomic Health* | 436 | 13 | ||||||
Geron* | 41,240 | 155 | ||||||
Globus Medical, Cl A* | 581 | 15 | ||||||
Greatbatch* | 31,203 | 1,805 | ||||||
GW Pharmaceuticals ADR* | 3,328 | 303 | ||||||
Haemonetics* | 1,600 | 72 | ||||||
Halozyme Therapeutics* | 2,500 | 36 | ||||||
Health Net, Cl A* | 28,410 | 1,719 | ||||||
HealthSouth | 30,384 | 1,348 | ||||||
Healthways* | 644 | 13 | ||||||
HeartWare International* | 13,901 | 1,220 | ||||||
Hill-Rom Holdings | 1,400 | 69 | ||||||
HMS Holdings* | 7,739 | 119 | ||||||
Hologic* | 11,706 | 387 | ||||||
Horizon Pharma* | 56,467 | 1,466 | ||||||
Humana | 11,175 | 1,989 | ||||||
Hyperion Therapeutics* | 1,076 | 49 | ||||||
ICON* | 11,790 | 832 | ||||||
ICU Medical* | 5,669 | 528 | ||||||
Idexx Laboratories* | 1,226 | 189 | ||||||
Illumina* | 7,121 | 1,322 | ||||||
ImmunoGen* | 27,027 | 242 | ||||||
Impax Laboratories* | 2,000 | 94 | ||||||
Incyte* | 14,870 | 1,363 | ||||||
Insulet* | 17,032 | 568 | ||||||
Integra LifeSciences Holdings* | 18,951 | 1,168 | ||||||
Intercept Pharmaceuticals* | 451 | 127 | ||||||
| Description | Shares | Market Value ($ Thousands) | ||||||
Intersect ENT (A)* | 14,071 | $ | 364 | |||||
IPC Healthcare* | 10,309 | 481 | ||||||
Ironwood Pharmaceuticals, Cl A* | 11,691 | 187 | ||||||
Isis Pharmaceuticals (A)* | 26,940 | 1,715 | ||||||
Jazz Pharmaceuticals* | 13,364 | 2,309 | ||||||
Karyopharm Therapeutics (A)* | 5,686 | 174 | ||||||
Keryx Biopharmaceuticals (A)* | 2,148 | 27 | ||||||
Kindred Healthcare | 14,295 | 340 | ||||||
Laboratory Corp of America Holdings* | 7,709 | 972 | ||||||
LDR Holding* | 25,250 | 925 | ||||||
LHC Group* | 500 | 17 | ||||||
LifePoint Hospitals* | 6,958 | 511 | ||||||
Ligand Pharmaceuticals (A)* | 2,770 | 214 | ||||||
Magellan Health* | 7,805 | 553 | ||||||
Mallinckrodt* | 6,229 | 789 | ||||||
MannKind (A)* | 9,300 | 48 | ||||||
Masimo* | 8,888 | 293 | ||||||
MedAssets* | 4,742 | 89 | ||||||
Medicines* | 22,827 | 640 | ||||||
Medidata Solutions* | 1,048 | 51 | ||||||
Medivation* | 10,985 | 1,418 | ||||||
MEDNAX * | 27,690 | 2,008 | ||||||
Merge Healthcare* | 8,683 | 39 | ||||||
Merit Medical Systems* | 3,125 | 60 | ||||||
Merrimack Pharmaceuticals (A)* | 3,589 | 43 | ||||||
Mettler Toledo International* | 2,460 | 808 | ||||||
MiMedx Group (A)* | 1,945 | 20 | ||||||
Myriad Genetics (A)* | 7,923 | 280 | ||||||
Nektar Therapeutics* | 16,412 | 181 | ||||||
Neogen, Cl B* | 4,029 | 188 | ||||||
Neovasc* | 28,825 | 259 | ||||||
Neurocrine Biosciences* | 750 | 30 | ||||||
Nevro (A)* | 8,092 | 388 | ||||||
Novavax (A)* | 3,449 | 29 | ||||||
NuVasive* | 1,300 | 60 | ||||||
NxStage Medical* | 12,588 | 218 | ||||||
Ocular Therapeutix (A)* | 2,300 | 97 | ||||||
Omeros (A)* | 1,972 | 43 | ||||||
Omnicare | 3,200 | 247 | ||||||
Omnicell* | 1,300 | 46 | ||||||
Opko Health (A)* | 1,431 | 20 | ||||||
OraSure Technologies* | 2,604 | 17 | ||||||
Orthofix International* | 1,400 | 50 | ||||||
Otonomy* | 8,157 | 288 | ||||||
OvaScience* | 2,593 | 90 | ||||||
Owens & Minor (A) | 950 | 32 | ||||||
Pacific Biosciences of California* | 5,998 | 35 | ||||||
Pacira Pharmaceuticals* | 18,049 | 1,604 | ||||||
Parexel International* | 18,480 | 1,275 | ||||||
Patterson | 33,887 | 1,653 | ||||||
PDL BioPharma | 1,700 | 12 | ||||||
PerkinElmer | 14,013 | 717 | ||||||
Pernix Therapeutics Holdings (A)* | 4,566 | 49 | ||||||
Pharmacyclics* | 3,791 | 970 | ||||||
PharMerica* | 19,608 | 553 | ||||||
Portola Pharmaceuticals, Cl A* | 15,310 | 581 | ||||||
Premier, Cl A* | 41,427 | 1,557 | ||||||
Prestige Brands Holdings, Cl A (A)* | 15,021 | 644 | ||||||
Progenics Pharmaceuticals* | 37,884 | 227 | ||||||
PTC Therapeutics (A)* | 5,983 | 364 | ||||||
Puma Biotechnology* | 3,463 | 818 | ||||||
| 7 | SEI Institutional Managed Trust / Semi-Annual Report / March 31, 2015 |
SCHEDULE OF INVESTMENTS (Unaudited)
Tax-Managed Small/Mid Cap Fund
March 31, 2015
| Description | Shares | Market Value ($ Thousands) | ||||||
QIAGEN* | 8,077 | $ | 204 | |||||
Quest Diagnostics | 9,721 | 747 | ||||||
Quidel* | 8,633 | 233 | ||||||
Quintiles Transnational Holdings* | 213 | 14 | ||||||
Receptos* | 3,092 | 510 | ||||||
Repros Therapeutics (A)* | 32,392 | 278 | ||||||
ResMed | 4,239 | 304 | ||||||
Rockwell Medical* | 2,762 | 30 | ||||||
RTI Biologics* | 3,333 | 17 | ||||||
Salix Pharmaceuticals* | 7,980 | 1,379 | ||||||
Sangamo Biosciences* | 980 | 15 | ||||||
SciClone Pharmaceuticals* | 43,342 | 384 | ||||||
Seattle Genetics (A)* | 12,188 | 431 | ||||||
Select Medical Holdings | 50,800 | 753 | ||||||
Sequenom (A)* | 35,019 | 138 | ||||||
Sientra* | 15,000 | 288 | ||||||
Sirona Dental Systems, Cl A* | 17,098 | 1,539 | ||||||
Spectranetics (A)* | 43,190 | 1,501 | ||||||
Spectrum Pharmaceuticals (A)* | 1,424 | 9 | ||||||
STERIS, Cl A (A) | 1,400 | 98 | ||||||
Supernus Pharmaceuticals* | 1,449 | 18 | ||||||
Symmetry Surgical* | 26,519 | 194 | ||||||
Synageva BioPharma, Cl A* | 6,098 | 595 | ||||||
Team Health Holdings* | 46,665 | 2,730 | ||||||
Teleflex | 3,980 | 481 | ||||||
Tenet Healthcare* | 3,525 | 175 | ||||||
TESARO* | 29,683 | 1,704 | ||||||
Tetraphase Pharmaceuticals* | 5,855 | 215 | ||||||
Theravance, Cl A (A) | 16,500 | 259 | ||||||
Thoratec* | 5,840 | 245 | ||||||
Tokai Pharmaceuticals (A)* | 15,500 | 175 | ||||||
Tornier BV* | 677 | 18 | ||||||
Ultragenyx Pharmaceutical* | 6,905 | 429 | ||||||
United Therapeutics* | 10,414 | 1,796 | ||||||
Universal Health Services, Cl B | 4,124 | 485 | ||||||
US Physical Therapy | 900 | 43 | ||||||
VCA* | 1,119 | 61 | ||||||
Veeva Systems, Cl A (A)* | 13,036 | 333 | ||||||
WellCare Health Plans* | 800 | 73 | ||||||
West Pharmaceutical Services | 2,200 | 132 | ||||||
Wright Medical Group* | 11,795 | 304 | ||||||
XenoPort* | 1,229 | 9 | ||||||
|
| |||||||
| 102,515 | ||||||||
|
| |||||||
Industrials — 14.2% | ||||||||
AAON | 5,062 | 124 | ||||||
AAR | 1,100 | 34 | ||||||
ABM Industries | 2,100 | 67 | ||||||
ACCO Brands* | 1,693 | 14 | ||||||
Actuant, Cl A | 18,563 | 441 | ||||||
Acuity Brands | 11,976 | 2,014 | ||||||
Advisory Board* | 16,927 | 902 | ||||||
AECOM (A)* | 17,658 | 544 | ||||||
AGCO (A) | 9,866 | 470 | ||||||
Air Lease, Cl A | 1,979 | 75 | ||||||
Aircastle (A) | 31,832 | 715 | ||||||
Alaska Air Group | 3,200 | 212 | ||||||
Albany International, Cl A | 1,900 | 75 | ||||||
Altra Industrial Motion | 28,293 | 782 | ||||||
American Airlines Group | 3,969 | 209 | ||||||
American Railcar Industries (A) | 4,073 | 202 | ||||||
American Woodmark* | 2,878 | 157 | ||||||
AO Smith | 14,044 | 922 | ||||||
| Description | Shares | Market Value ($ Thousands) | ||||||
Applied Industrial Technologies, Cl A | 11,145 | $ | 505 | |||||
ARC Document Solutions* | 2,532 | 23 | ||||||
Armstrong World Industries* | 2,339 | 134 | ||||||
Atlas Air Worldwide Holdings* | 21,881 | 941 | ||||||
Avis Budget Group* | 2,625 | 155 | ||||||
Barnes Group | 20,518 | 831 | ||||||
Barrett Business Services (A) | 14,931 | 640 | ||||||
BE Aerospace | 1,400 | 89 | ||||||
Beacon Roofing Supply* | 5,422 | 170 | ||||||
Brink’s (A) | 3,100 | 86 | ||||||
Carlisle | 24,197 | 2,241 | ||||||
Chart Industries* | 7,150 | 251 | ||||||
Cintas | 12,501 | 1,020 | ||||||
CIRCOR International | 10,570 | 578 | ||||||
Clarcor | 2,766 | 183 | ||||||
Clean Harbors* | 9,837 | 558 | ||||||
Colfax* | 4,951 | 236 | ||||||
Con-way | 6,445 | 284 | ||||||
Copa Holdings, Cl A (A) | 2,016 | 203 | ||||||
Copart* | 2,400 | 90 | ||||||
Corporate Executive Board | 1,100 | 88 | ||||||
Covanta Holding (A) | 3,100 | 69 | ||||||
Crane, Cl A | 600 | 37 | ||||||
Curtiss-Wright | 29,201 | 2,159 | ||||||
Delta Air Lines, Cl A | 15,938 | 717 | ||||||
Deluxe (A) | 11,400 | 790 | ||||||
DigitalGlobe* | 6,762 | 230 | ||||||
Donaldson, Cl A (A) | 3,901 | 147 | ||||||
Douglas Dynamics | 569 | 13 | ||||||
Dover | 5,288 | 365 | ||||||
Dun & Bradstreet | 651 | 84 | ||||||
Dycom Industries* | 34,625 | 1,691 | ||||||
Dynamic Materials (A) | 986 | 13 | ||||||
EMCOR Group | 42,960 | 1,996 | ||||||
Engility Holdings | 1,216 | 37 | ||||||
EnPro Industries | 5,587 | 368 | ||||||
Equifax | 2,212 | 206 | ||||||
ESCO Technologies | 5,019 | 196 | ||||||
Esterline Technologies* | 8,433 | 965 | ||||||
Exelis | 1,677 | 41 | ||||||
Federal Signal | 3,905 | 62 | ||||||
Fluor | 4,822 | 276 | ||||||
Fortune Brands Home & Security | 19,979 | 949 | ||||||
Forward Air (A) | 4,163 | 226 | ||||||
Franklin Electric (A) | 9,102 | 347 | ||||||
FTI Consulting (A)* | 331 | 12 | ||||||
G&K Services | 26,335 | 1,910 | ||||||
GATX | 700 | 41 | ||||||
GenCorp (A)* | 17,287 | 401 | ||||||
Generac Holdings (A)* | 28,985 | 1,411 | ||||||
General Cable | 13,957 | 241 | ||||||
Genesee & Wyoming, Cl A* | 9,427 | 909 | ||||||
Gibraltar Industries* | 686 | 11 | ||||||
Gorman-Rupp | 1,952 | 58 | ||||||
Graco | 12,388 | 894 | ||||||
Graham, Cl A | 528 | 13 | ||||||
Granite Construction | 5,570 | 196 | ||||||
Great Lakes Dredge & Dock (A)* | 3,253 | 20 | ||||||
Greenbrier (A) | 13,161 | 763 | ||||||
H&E Equipment Services | 32,000 | 800 | ||||||
Harsco | 3,200 | 55 | ||||||
Hawaiian Holdings (A)* | 41,000 | 903 | ||||||
| 8 | SEI Institutional Managed Trust / Semi-Annual Report / March 31, 2015 |
SCHEDULE OF INVESTMENTS (Unaudited)
Tax-Managed Small/Mid Cap Fund
March 31, 2015
| Description | Shares | Market Value ($ Thousands) | ||||||
HD Supply Holdings* | 47,938 | $ | 1,493 | |||||
Healthcare Services Group | 4,458 | 143 | ||||||
Heartland Express | 4,998 | 119 | ||||||
HEICO (A) | 2,201 | 134 | ||||||
Heidrick & Struggles International | 411 | 10 | ||||||
Herman Miller | 8,185 | 227 | ||||||
Hexcel, Cl A (A) | 38,441 | 1,977 | ||||||
Hillenbrand | 2,500 | 77 | ||||||
HNI | 3,926 | 217 | ||||||
Hub Group, Cl A* | 10,657 | 419 | ||||||
Hubbell, Cl B | 1,284 | 141 | ||||||
Hyster-Yale Materials Handling | 1,266 | 93 | ||||||
IDEX | 14,201 | 1,077 | ||||||
Insteel Industries | 905 | 20 | ||||||
Interface, Cl A | 36,562 | 760 | ||||||
ITT | 10,115 | 404 | ||||||
JetBlue Airways* | 33,398 | 643 | ||||||
John Bean Technologies, Cl A | 1,377 | 49 | ||||||
Kadant | 25,142 | 1,323 | ||||||
Kaman, Cl A | 2,096 | 89 | ||||||
KAR Auction Services | 26,659 | 1,011 | ||||||
Kelly Services, Cl A | 1,200 | 21 | ||||||
Kennametal | 13,900 | 468 | ||||||
Keyw Holding, Cl A (A)* | 1,958 | 16 | ||||||
Kirby* | 10,198 | 765 | ||||||
KLX * | 700 | 27 | ||||||
Knight Transportation | 14,097 | 455 | ||||||
Knoll, Cl B | 1,220 | 29 | ||||||
Korn/Ferry International | 13,035 | 428 | ||||||
L-3 Communications Holdings | 7,300 | 918 | ||||||
Landstar System | 13,509 | 896 | ||||||
Lennox International | 2,400 | 268 | ||||||
Lincoln Electric Holdings | 11,796 | 771 | ||||||
Lindsay (A) | 1,772 | 135 | ||||||
LMI Aerospace* | 911 | 11 | ||||||
Lydall* | 13,800 | 438 | ||||||
Manitowoc (A) | 2,585 | 56 | ||||||
ManpowerGroup | 1,493 | 129 | ||||||
Marten Transport (A) | 2,100 | 49 | ||||||
Masonite International* | 13,399 | 901 | ||||||
MasTec* | 4,539 | 88 | ||||||
Mcgrath Rentcorp | 1,900 | 62 | ||||||
Meritor* | 1,468 | 18 | ||||||
Middleby* | 18,565 | 1,906 | ||||||
Moog, Cl A* | 23,071 | 1,732 | ||||||
MSC Industrial Direct, Cl A (A) | 6,583 | 475 | ||||||
Mueller Industries | 1,000 | 36 | ||||||
Mueller Water Products, Cl A | 42,314 | 417 | ||||||
Nordson | 9,392 | 736 | ||||||
Northwest Pipe* | 13,944 | 320 | ||||||
Old Dominion Freight Line, Cl A* | 14,168 | 1,095 | ||||||
On Assignment* | 6,369 | 244 | ||||||
Orbital ATK | 6,990 | 536 | ||||||
Oshkosh Truck (A) | 13,500 | 659 | ||||||
Pall | 12,698 | 1,275 | ||||||
Parker-Hannifin, Cl A | 4,644 | 552 | ||||||
Pentair | 2,782 | 175 | ||||||
Pitney Bowes | 25,426 | 593 | ||||||
Polypore International* | 613 | 36 | ||||||
Quanex Building Products | 1,800 | �� | 36 | |||||
Quanta Services* | 3,656 | 104 | ||||||
RBC Bearings | 9,272 | 710 | ||||||
Regal-Beloit | 22,673 | 1,812 | ||||||
| Description | Shares | Market Value ($ Thousands) | ||||||
Robert Half International | 3,076 | $ | 186 | |||||
Rollins | 5,659 | 140 | ||||||
RR Donnelley & Sons (A) | 24,687 | 474 | ||||||
Ryder System | 8,900 | 844 | ||||||
Saia* | 9,900 | 438 | ||||||
Simpson Manufacturing | 19,075 | 713 | ||||||
Snap-on | 800 | 118 | ||||||
SolarCity* | 576 | 30 | ||||||
Spirit AeroSystems Holdings, Cl A* | 32,539 | 1,699 | ||||||
Spirit Airlines* | 11,740 | 908 | ||||||
Steelcase, Cl A | 25,800 | 489 | ||||||
Swift Transportation, Cl A* | 19,251 | 501 | ||||||
TAL International Group | 8,600 | 350 | ||||||
Team* | 6,035 | 235 | ||||||
Teledyne Technologies* | 13,020 | 1,390 | ||||||
Terex | 7,552 | 201 | ||||||
Tetra Tech | 46,635 | 1,120 | ||||||
Timken | 6,716 | 283 | ||||||
Titan Machinery (A)* | 30,000 | 400 | ||||||
Toro | 5,174 | 363 | ||||||
Towers Watson, Cl A | 1,300 | 172 | ||||||
TransDigm Group | 500 | 109 | ||||||
TriMas* | 20,117 | 619 | ||||||
TriNet Group* | 9,279 | 327 | ||||||
Trinity Industries | 30,383 | 1,079 | ||||||
Triumph Group (A) | 13,348 | 797 | ||||||
TrueBlue* | 59,202 | 1,442 | ||||||
Tutor Perini (A)* | 3,700 | 86 | ||||||
Unifirst | 644 | 76 | ||||||
United Rentals* | 12,187 | 1,111 | ||||||
United Stationers | 1,000 | 41 | ||||||
Universal Forest Products | 1,908 | 106 | ||||||
USG (A)* | 8,140 | 217 | ||||||
UTI Worldwide* | 21,013 | 258 | ||||||
Valmont Industries (A) | 11,168 | 1,372 | ||||||
Vectrus* | 93 | 2 | ||||||
Vicor* | 2,300 | 35 | ||||||
Wabash National* | 2,806 | 40 | ||||||
WABCO Holdings* | 5,849 | 719 | ||||||
Wabtec | 3,600 | 342 | ||||||
WageWorks* | 14,512 | 774 | ||||||
Waste Connections | 1,800 | 87 | ||||||
Watsco | 6,700 | 842 | ||||||
Watts Water Technologies, Cl A | 7,681 | 423 | ||||||
WESCO International (A)* | 10,460 | 731 | ||||||
Woodward | 1,400 | 71 | ||||||
XPO Logistics (A)* | 25,987 | 1,182 | ||||||
Xylem | 29,843 | 1,045 | ||||||
|
| |||||||
| 93,698 | ||||||||
|
| |||||||
Information Technology — 17.1% | ||||||||
ACI Worldwide* | 6,906 | 150 | ||||||
Acxiom* | 81,656 | 1,510 | ||||||
Adtran | 5,830 | 109 | ||||||
Advanced Energy Industries* | 1,400 | 36 | ||||||
Advent Software | 1,000 | 44 | ||||||
Alliance Data Systems* | 3,254 | 964 | ||||||
Alpha & Omega Semiconductor* | 1,342 | 12 | ||||||
Anixter International* | 500 | 38 | ||||||
Ansys* | 10,146 | 895 | ||||||
AOL* | 2,700 | 107 | ||||||
Applied Micro Circuits (A)* | 370 | 2 | ||||||
Arista Networks* | 1,705 | 120 | ||||||
| 9 | SEI Institutional Managed Trust / Semi-Annual Report / March 31, 2015 |
SCHEDULE OF INVESTMENTS (Unaudited)
Tax-Managed Small/Mid Cap Fund
March 31, 2015
| Description | Shares | Market Value ($ Thousands) | ||||||
ARRIS Group* | 7,200 | $ | 208 | |||||
Arrow Electronics, Cl A* | 1,900 | 116 | ||||||
Aruba Networks* | 13,266 | 325 | ||||||
ASML Holding, Cl G (A) | 690 | 70 | ||||||
Aspen Technology* | 37,677 | 1,450 | ||||||
Atmel | 100,034 | 823 | ||||||
Autodesk, Cl A* | 935 | 55 | ||||||
Avago Technologies, Cl A | 12,340 | 1,567 | ||||||
Avnet | 8,652 | 385 | ||||||
Bankrate* | 12,046 | 137 | ||||||
Belden | 20,653 | 1,932 | ||||||
Benchmark Electronics* | 25,072 | 602 | ||||||
Blackbaud, Cl A (A) | 3,876 | 184 | ||||||
Blackhawk Network Holdings, Cl A (A)* | 3,134 | 112 | ||||||
Blackhawk Network Holdings, Cl B* | 1,872 | 67 | ||||||
Blucora* | 16,678 | 228 | ||||||
Broadridge Financial Solutions | 1,700 | 93 | ||||||
BroadSoft* | 25,122 | 841 | ||||||
Brocade Communications Systems | 100,100 | 1,188 | ||||||
CACI International, Cl A* | 900 | 81 | ||||||
Cadence Design Systems* | 196,641 | 3,626 | ||||||
Callidus Software* | 1,561 | 20 | ||||||
Carbonite* | 1,001 | 14 | ||||||
Cavium* | 16,410 | 1,162 | ||||||
Check Point Software Technologies* | 9,590 | 786 | ||||||
Checkpoint Systems | 1,100 | 12 | ||||||
Ciena* | 19,778 | 382 | ||||||
Cimpress* | 8,108 | 684 | ||||||
Citrix Systems* | 7,271 | 464 | ||||||
Cognex* | 19,576 | 971 | ||||||
Coherent* | 5,166 | 336 | ||||||
Cohu | 1,032 | 11 | ||||||
CommVault Systems* | 3,421 | 149 | ||||||
comScore* | 30,165 | 1,544 | ||||||
Comtech Telecommunications | 400 | 12 | ||||||
Constant Contact* | 33,098 | 1,265 | ||||||
Convergys | 20,581 | 471 | ||||||
CoreLogic* | 1,800 | 63 | ||||||
Cornerstone OnDemand* | 2,249 | 65 | ||||||
CoStar Group* | 13,719 | 2,714 | ||||||
Cray* | 1,586 | 45 | ||||||
Cree (A)* | 1,902 | 67 | ||||||
CSG Systems International | 16,700 | 507 | ||||||
Cvent* | 9,504 | 266 | ||||||
Cypress Semiconductor | 91,383 | 1,289 | ||||||
Dealertrack Technologies* | 39,259 | 1,512 | ||||||
Demandware* | 13,070 | 796 | ||||||
Diebold | 20,103 | 713 | ||||||
Diodes* | 6,645 | 190 | ||||||
Dolby Laboratories, Cl A | 257 | 10 | ||||||
DST Systems | 600 | 66 | ||||||
EarthLink Holdings | 5,988 | 27 | ||||||
Ebix | 1,665 | 51 | ||||||
Echo Global Logistics (A)* | 1,761 | 48 | ||||||
EchoStar, Cl A* | 2,900 | 150 | ||||||
Electronic Arts* | 30,159 | 1,774 | ||||||
Electronics For Imaging* | 1,300 | 54 | ||||||
EnerNOC* | 1,300 | 15 | ||||||
Entegris* | 6,300 | 86 | ||||||
| Description | Shares | Market Value ($ Thousands) | ||||||
Envestnet* | 26,795 | $ | 1,503 | |||||
EPAM Systems* | 372 | 23 | ||||||
Euronet Worldwide* | 1,400 | 82 | ||||||
EVERTEC | 45,000 | 984 | ||||||
ExlService Holdings* | 1,448 | 54 | ||||||
Factset Research Systems | 644 | 102 | ||||||
Fair Isaac | 800 | 71 | ||||||
Fairchild Semiconductor International* | 25,548 | 464 | ||||||
FARO Technologies (A)* | 1,300 | 81 | ||||||
FEI | 1,500 | 114 | ||||||
Fidelity National Information Services, Cl B | 12,644 | 861 | ||||||
Finisar (A)* | 1,589 | 34 | ||||||
FleetCor Technologies* | 923 | 139 | ||||||
Fleetmatics Group (A)* | 29,163 | 1,308 | ||||||
Flir Systems | 2,745 | 86 | ||||||
FormFactor* | 1,809 | 16 | ||||||
Fortinet* | 45,622 | 1,594 | ||||||
Freescale Semiconductor* | 17,100 | 697 | ||||||
Gartner* | 5,828 | 489 | ||||||
Genpact* | 2,904 | 68 | ||||||
Gigamon* | 30,379 | 645 | ||||||
Global Payments | 2,534 | 232 | ||||||
Glu Mobile (A)* | 4,445 | 22 | ||||||
Gogo* | 14,000 | 267 | ||||||
Guidewire Software, Cl Z (A)* | 28,765 | 1,513 | ||||||
Harmonic, Cl A* | 17,385 | 129 | ||||||
Harris | 11,700 | 922 | ||||||
Heartland Payment Systems | 30,098 | 1,410 | ||||||
HomeAway* | 24,130 | 728 | ||||||
IAC | 4,575 | 309 | ||||||
Immersion* | 2,588 | 24 | ||||||
Infinera* | 57,442 | 1,130 | ||||||
Infoblox* | 36,642 | 875 | ||||||
Informatica* | 2,900 | 127 | ||||||
Ingram Micro, Cl A* | 1,651 | 41 | ||||||
Inphi* | 48,603 | 867 | ||||||
Insight Enterprises* | 9,500 | 271 | ||||||
Integrated Device Technology* | 45,635 | 914 | ||||||
InterDigital | 1,288 | 65 | ||||||
Intersil, Cl A | 71,088 | 1,018 | ||||||
Intralinks Holdings, Cl A* | 37,705 | 390 | ||||||
IPG Photonics* | 900 | 83 | ||||||
j2 Global | 32,545 | 2,137 | ||||||
Jabil Circuit | 5,381 | 126 | ||||||
Jack Henry & Associates (A) | 926 | 65 | ||||||
JDS Uniphase* | 14,471 | 190 | ||||||
Juniper Networks | 6,218 | 140 | ||||||
Kemet* | 2,428 | 10 | ||||||
Keysight Technologies* | 7,861 | 292 | ||||||
Lam Research | 8,828 | 620 | ||||||
Lattice Semiconductor* | 68,670 | 435 | ||||||
Lexmark International, Cl A | 5,199 | 220 | ||||||
Littelfuse | 800 | 80 | ||||||
LivePerson* | 1,135 | 12 | ||||||
LogMeIn* | 35,792 | 2,004 | ||||||
Manhattan Associates* | 10,280 | 520 | ||||||
Marketo (A)* | 10,614 | 272 | ||||||
MAXIMUS | 14,462 | 965 | ||||||
Mellanox Technologies* | 32,927 | 1,493 | ||||||
Mentor Graphics | 2,400 | 58 | ||||||
Mercury Systems* | 1,090 | 17 | ||||||
| 10 | SEI Institutional Managed Trust / Semi-Annual Report / March 31, 2015 |
SCHEDULE OF INVESTMENTS (Unaudited)
Tax-Managed Small/Mid Cap Fund
March 31, 2015
| Description | Shares | Market Value ($ Thousands) | ||||||
Methode Electronics | 2,700 | $ | 127 | |||||
Micrel | 7,000 | 106 | ||||||
Microchip Technology | 13,883 | 679 | ||||||
Microsemi* | 1,731 | 61 | ||||||
MicroStrategy, Cl A* | 118 | 20 | ||||||
MKS Instruments | 13,957 | 472 | ||||||
Monolithic Power Systems | 10,454 | 550 | ||||||
Monotype Imaging Holdings | 454 | 15 | ||||||
Monster Worldwide (A)* | 56,859 | 360 | ||||||
MTS Systems, Cl A | 1,000 | 76 | ||||||
National Instruments | 1,606 | 51 | ||||||
NCR* | 3,736 | 110 | ||||||
NETGEAR* | 8,400 | 276 | ||||||
NetScout Systems* | 4,329 | 190 | ||||||
NetSuite* | 3,285 | 305 | ||||||
NeuStar, Cl A* | 1,000 | 25 | ||||||
NIC | 13,854 | 245 | ||||||
Nimble Storage (A)* | 7,959 | 178 | ||||||
NVE | 200 | 14 | ||||||
OmniVision Technologies* | 42,689 | 1,126 | ||||||
ON Semiconductor* | 13,433 | 163 | ||||||
OSI Systems* | 4,968 | 369 | ||||||
Palo Alto Networks* | 13,214 | 1,930 | ||||||
Pandora Media (A)* | 18,533 | 300 | ||||||
Pericom Semiconductor, Cl A | 1,168 | 18 | ||||||
Plantronics | 1,100 | 58 | ||||||
Plexus* | 1,500 | 61 | ||||||
PMC - Sierra* | 28,762 | 267 | ||||||
Polycom* | 8,000 | 107 | ||||||
Power Integrations | 7,067 | 368 | ||||||
Progress Software* | 6,993 | 190 | ||||||
Proofpoint* | 18,598 | 1,101 | ||||||
PTC* | 74,811 | 2,706 | ||||||
Qlik Technologies (A)* | 10,779 | 336 | ||||||
QLogic* | 41,390 | 610 | ||||||
Qorvo* | 14,916 | 1,189 | ||||||
Rackspace Hosting* | 22,777 | 1,175 | ||||||
Riverbed Technology* | 3,096 | 65 | ||||||
Rofin-Sinar Technologies* | 1,100 | 27 | ||||||
Rovi* | 1,112 | 20 | ||||||
Ruckus Wireless* | 21,263 | 274 | ||||||
Sanmina* | 1,177 | 28 | ||||||
Scansource* | 3,394 | 138 | ||||||
Science Applications International | 4,528 | 232 | ||||||
Seagate Technology | 19,200 | 999 | ||||||
Semtech (A)* | 31,053 | 827 | ||||||
ServiceNow* | 8,245 | 649 | ||||||
Shutterstock (A)* | 14,762 | 1,014 | ||||||
Silicon Graphics International (A)* | 2,400 | 21 | ||||||
Silicon Laboratories* | 10,120 | 514 | ||||||
Skyworks Solutions | 4,477 | 440 | ||||||
SolarWinds* | 38,985 | 1,998 | ||||||
Solera Holdings | 14,450 | 746 | ||||||
Splunk* | 8,168 | 484 | ||||||
SS&C Technologies Holdings | 14,354 | 894 | ||||||
SunEdison (A)* | 42,575 | 1,022 | ||||||
Super Micro Computer* | 19,666 | 653 | ||||||
Sykes Enterprises* | 2,600 | 65 | ||||||
Synaptics (A)* | 13,144 | 1,069 | ||||||
Synchronoss Technologies* | 2,862 | 136 | ||||||
SYNNEX | 395 | 31 | ||||||
Synopsys* | 26,169 | 1,212 | ||||||
Syntel* | 2,800 | 145 | ||||||
| Description | Shares | Market Value ($ Thousands) | ||||||
Tableau Software, Cl A* | 18,270 | $ | 1,690 | |||||
Take-Two Interactive Software, Cl A* | 2,400 | 61 | ||||||
Tech Data* | 12,100 | 699 | ||||||
Teradyne | 32,898 | 620 | ||||||
Tessera Technologies | 4,036 | 163 | ||||||
Textura (A)* | 506 | 14 | ||||||
Total System Services | 2,800 | 107 | ||||||
Trimble Navigation* | 5,604 | 141 | ||||||
Tyler Technologies* | 8,899 | 1,073 | ||||||
Ultimate Software Group* | 10,428 | 1,772 | ||||||
United Online* | 457 | 7 | ||||||
Universal Display (A)* | 7,430 | 347 | ||||||
Veeco Instruments (A)* | 2,300 | 70 | ||||||
VeriFone Holdings* | 16,046 | 560 | ||||||
Verint Systems* | 23,725 | 1,469 | ||||||
Viasat* | 9,478 | 565 | ||||||
Viasystems Group* | 876 | 15 | ||||||
Virtusa* | 24,849 | 1,028 | ||||||
Vishay Intertechnology | 13,000 | 180 | ||||||
Web.com Group* | 24,580 | 466 | ||||||
WebMD Health, Cl A (A)* | 1,121 | 49 | ||||||
Western Digital | 6,200 | 564 | ||||||
WEX * | 6,580 | 706 | ||||||
WNS Holdings ADR* | 33,640 | 818 | ||||||
Xcerra* | 1,585 | 14 | ||||||
Xoom (A)* | 19,356 | 284 | ||||||
Yelp, Cl A* | 863 | 41 | ||||||
Yodlee* | 19,157 | 258 | ||||||
Zebra Technologies, Cl A* | 19,739 | 1,791 | ||||||
Zillow Group, Cl A (A)* | 4,843 | 486 | ||||||
|
| |||||||
| 112,971 | ||||||||
|
| |||||||
Materials — 4.7% | ||||||||
Air Products & Chemicals | 3,876 | 586 | ||||||
Albemarle | 5,863 | 310 | ||||||
Allegheny Technologies | 38,547 | 1,157 | ||||||
AptarGroup | 1,800 | 114 | ||||||
Ashland | 9,200 | 1,171 | ||||||
Avery Dennison | 2,472 | 131 | ||||||
Axiall | 3,045 | 143 | ||||||
Balchem (A) | 1,400 | 77 | ||||||
Ball | 4,242 | 300 | ||||||
Bemis | 2,526 | 117 | ||||||
Berry Plastics Group* | 37,478 | 1,356 | ||||||
Boise Cascade* | 400 | 15 | ||||||
Cabot | 10,750 | 484 | ||||||
Calgon Carbon | 5,791 | 122 | ||||||
Century Aluminum* | 5,100 | 70 | ||||||
Chemtura* | 10,212 | 279 | ||||||
Clearwater Paper* | 3,752 | 245 | ||||||
Cliffs Natural Resources | 28,902 | 139 | ||||||
Coeur Mining* | 65,379 | 308 | ||||||
Compass Minerals International, Cl A | 1,100 | 102 | ||||||
Crown Holdings* | 9,800 | 529 | ||||||
Cytec Industries | 10,520 | 568 | ||||||
Eagle Materials | 700 | 59 | ||||||
Eastman Chemical | 3,200 | 222 | ||||||
Ferro* | 2,300 | 29 | ||||||
Flotek Industries (A)* | 16,260 | 240 | ||||||
FMC | 23,933 | 1,370 | ||||||
Glatfelter | 1,700 | 47 | ||||||
Globe Specialty Metals | 5,200 | 98 | ||||||
| 11 | SEI Institutional Managed Trust / Semi-Annual Report / March 31, 2015 |
SCHEDULE OF INVESTMENTS (Unaudited)
Tax-Managed Small/Mid Cap Fund
March 31, 2015
| Description | Shares | Market Value ($ Thousands) | ||||||
Graphic Packaging Holding | 80,905 | $ | 1,176 | |||||
H.B. Fuller | 4,209 | 180 | ||||||
Handy & Harman* | 715 | 29 | ||||||
Headwaters, Cl A* | 1,045 | 19 | ||||||
Horsehead Holding* | 2,100 | 27 | ||||||
Huntsman | 28,000 | 621 | ||||||
Innophos Holdings | 7,786 | 439 | ||||||
International Flavors & Fragrances | 1,459 | 171 | ||||||
Intrepid Potash (A)* | 16,716 | 193 | ||||||
Kaiser Aluminum | 2,571 | 198 | ||||||
KapStone Paper and Packaging | 19,156 | 629 | ||||||
LSB Industries (A)* | 15,000 | 620 | ||||||
Martin Marietta Materials, Cl A | 1,281 | 179 | ||||||
Materion (A) | 595 | 23 | ||||||
Minerals Technologies | 17,582 | 1,285 | ||||||
Neenah Paper, Cl A | 14,000 | 875 | ||||||
NewMarket | 373 | 178 | ||||||
Olin | 10,591 | 339 | ||||||
Owens-Illinois* | 7,319 | 171 | ||||||
Packaging Corp of America | 7,600 | 594 | ||||||
Platform Specialty Products* | 2,400 | 62 | ||||||
Platform Speciatly Products (PIPE)* | 35,716 | 916 | ||||||
PolyOne | 78,604 | 2,936 | ||||||
Reliance Steel & Aluminum | 1,200 | 73 | ||||||
Resolute Forest Products* | 1,718 | 30 | ||||||
Rock-Tenn, Cl A | 2,660 | 172 | ||||||
Royal Gold, Cl A | 2,437 | 154 | ||||||
RPM International | 3,100 | 149 | ||||||
RTI International Metals* | 26,765 | 961 | ||||||
Schulman A | 3,375 | 163 | ||||||
Schweitzer-Mauduit International | 10,535 | 486 | ||||||
Scotts Miracle-Gro, Cl A | 1,500 | 101 | ||||||
Sealed Air | 13,010 | 593 | ||||||
Sensient Technologies | 30,569 | 2,106 | ||||||
Silgan Holdings | 46,881 | 2,725 | ||||||
Sonoco Products | 1,400 | 64 | ||||||
Steel Dynamics | 6,072 | 122 | ||||||
Stillwater Mining* | 22,801 | 295 | ||||||
SunCoke Energy | 907 | 14 | ||||||
TimkenSteel | 3,358 | 89 | ||||||
UFP Technologies* | 13,800 | 314 | ||||||
United States Steel (A) | 3,182 | 78 | ||||||
Valspar | 1,860 | 156 | ||||||
WR Grace* | 1,400 | 138 | ||||||
Zep | 713 | 12 | ||||||
|
| |||||||
| 31,243 | ||||||||
|
| |||||||
Telecommunication Services — 0.5% |
| |||||||
Boingo Wireless (A)* | 3,128 | 23 | ||||||
Cincinnati Bell, Cl A* | 4,400 | 15 | ||||||
Cogent Communications Holdings | 17,849 | 631 | ||||||
Consolidated Communications Holdings (A) | 1,000 | 20 | ||||||
Frontier Communications | 20,667 | 146 | ||||||
inContact* | 1,263 | 14 | ||||||
Iridium Communications (A)* | 58,600 | 569 | ||||||
Level 3 Communications* | 12,213 | 657 | ||||||
RingCentral, Cl A* | 10,935 | 168 | ||||||
SBA Communications, Cl A* | 2,217 | 260 | ||||||
Shenandoah Telecommunications | 520 | 16 | ||||||
Spok Holdings | 15,500 | 297 | ||||||
Telephone & Data Systems | 8,561 | 213 | ||||||
| Description | Shares | Market Value ($ Thousands) | ||||||
T-Mobile US* | 932 | $ | 29 | |||||
Vonage Holdings* | 10,100 | 50 | ||||||
Windstream Holdings (A) | 12,378 | 92 | ||||||
|
| |||||||
| 3,200 | ||||||||
|
| |||||||
Utilities — 3.3% | ||||||||
AGL Resources | 15,461 | 768 | ||||||
ALLETE | 11,946 | 630 | ||||||
Alliant Energy | 1,300 | 82 | ||||||
American States Water | 3,400 | 135 | ||||||
American Water Works | 3,741 | 203 | ||||||
Aqua America | 10,673 | 281 | ||||||
Atmos Energy | 2,500 | 138 | ||||||
Avista | 32,600 | 1,114 | ||||||
Black Hills, Cl A | 2,714 | 137 | ||||||
California Water Service Group, Cl A | 2,800 | 69 | ||||||
Chesapeake Utilities | 600 | 30 | ||||||
Cleco | 26,686 | 1,455 | ||||||
CMS Energy | 10,600 | 370 | ||||||
Edison International | 10,136 | 633 | ||||||
El Paso Electric, Cl A | 4,700 | 182 | ||||||
Empire District Electric | 4,400 | 109 | ||||||
Great Plains Energy | 54,770 | 1,461 | ||||||
Hawaiian Electric Industries | 4,800 | 154 | ||||||
Idacorp, Cl A | 7,162 | 450 | ||||||
Integrys Energy Group | 10,100 | 727 | ||||||
ITC Holdings | 4,434 | 166 | ||||||
Laclede Group | 2,600 | 133 | ||||||
MDU Resources Group | 5,300 | 113 | ||||||
MGE Energy | 2,400 | 107 | ||||||
New Jersey Resources | 1,500 | 47 | ||||||
Northwest Natural Gas (A) | 3,203 | 154 | ||||||
NorthWestern | 7,335 | 395 | ||||||
OGE Energy | 2,277 | 72 | ||||||
Otter Tail (A) | 1,800 | 58 | ||||||
Pepco Holdings | 3,471 | 93 | ||||||
Piedmont Natural Gas | 6,280 | 232 | ||||||
Pinnacle West Capital | 1,100 | 70 | ||||||
PNM Resources | 44,269 | 1,293 | ||||||
Portland General Electric | 100,050 | 3,711 | ||||||
Questar | 434 | 10 | ||||||
SCANA | 29,391 | 1,616 | ||||||
South Jersey Industries, Cl A | 16,695 | 906 | ||||||
Southwest Gas | 13,930 | 810 | ||||||
TECO Energy | 1,800 | 35 | ||||||
TerraForm Power, Cl A | 8,792 | 321 | ||||||
UGI | 6,450 | 210 | ||||||
UIL Holdings | 10,402 | 535 | ||||||
Vectren | 2,100 | 93 | ||||||
Vivint Solar* | 78,219 | 950 | ||||||
Westar Energy, Cl A | 1,900 | 74 | ||||||
WGL Holdings | 1,200 | 68 | ||||||
Xcel Energy | 12,195 | 424 | ||||||
|
| |||||||
| 21,824 | ||||||||
|
| |||||||
Total Common Stock | 622,034 | |||||||
|
| |||||||
EXCHANGE TRADED FUND — 0.2% |
| |||||||
iShares Russell 2000 ETF (A) | 8,119 | 1,009 | ||||||
|
| |||||||
Total Exchange Traded Fund | 1,009 | |||||||
|
| |||||||
| 12 | SEI Institutional Managed Trust / Semi-Annual Report / March 31, 2015 |
SCHEDULE OF INVESTMENTS (Unaudited)
Tax-Managed Small/Mid Cap Fund
March 31, 2015
| Description | Number of Rights/ Number of Warrants/Shares/ Face Amount ($ Thousands) | Market Value ($ Thousands) | ||||||
RIGHTS — 0.0% |
| |||||||
Central European Media Enterprises | 53 | $ | — | |||||
Chelseea Therapeutics International CVR | 3,004 | — | ||||||
Endo Pharmaceuticals | 1,900 | — | ||||||
Safeway CVR - Casa Ley | 11,400 | 12 | ||||||
Safeway CVR - PDC | 11,400 | — | ||||||
|
| |||||||
Total Rights | 12 | |||||||
|
| |||||||
WARRANTS — 0.0% |
| |||||||
Magnum Hunter Expires 04/20/16* | 467 | — | ||||||
|
| |||||||
Total Warrants | — | |||||||
|
| |||||||
AFFILIATED PARTNERSHIP — 8.1% |
| |||||||
SEI Liquidity Fund, L.P. | 53,582,303 | 53,582 | ||||||
|
| |||||||
Total Affiliated Partnership | 53,582 | |||||||
|
| |||||||
CASH EQUIVALENT — 5.7% |
| |||||||
SEI Daily Income Trust, Prime Obligation Fund, | 37,844,702 | 37,845 | ||||||
|
| |||||||
Total Cash Equivalent | 37,845 | |||||||
|
| |||||||
U.S. TREASURY OBLIGATION — 0.2% |
| |||||||
U.S. Treasury Bills | ||||||||
0.006%, 05/28/15 (C) (D) | 1,400 | 1,400 | ||||||
|
| |||||||
Total U.S. Treasury Obligation | 1,400 | |||||||
|
| |||||||
Total Investments — 108.1% | $ | 715,882 | ||||||
|
| |||||||
The open futures contracts held by the Fund at March 31, 2015, are as follows:
| Type of Contract | Number of Long (Short) | Expiration Date | Unrealized Appreciation ($ Thousands) | |||||||||
Russell 2000 Index E-MINI | 92 | Jun-2015 | $ | 323 | ||||||||
S&P Mid 400 Index E-MINI | 80 | Jun-2015 | 303 | |||||||||
|
| |||||||||||
| $ | 626 | |||||||||||
|
| |||||||||||
For the period ended March 31, 2015, the total amount of all open futures contracts, as presented in the table above, are representative of the volume of activity for this derivative type during the year.
Percentages are based on Net Assets of $662,429 ($Thousands).
| * | Non-income producing security. |
| ** | Rate shown is the 7-day effective yield as of March 31, 2015. |
| † | Real Estate Investment Trust. |
| †† | Investment in Affiliated Security (see Note 6). |
| (A) | This security or a partial position of this security is on loan at March 31, 2015. The total market value of securities on loan at March 31, 2015 was $53,582 ($ Thousands) |
| (B) | This security was purchased with cash collateral held from securities on loan. The total value of such securities as of March 31, 2015 was $52,082 ($ Thousands). |
| (C) | The rate reported is the effective yield at the time of purchase. |
| (D) | Security, or portion thereof, has been pledged as collateral on open futures contracts. |
ADR — American Depositary Receipt
Cl — Class
ETF — Exchange-Traded Fund
L.P. — Limited Partnership
PIPE — Private Investment in Public Entity
PLC — Public Limited Company
Ser — Series
The following is a summary of the inputs used as of March 31, 2015, in valuing the Fund’s investments carried at value ($ Thousands):
| Investments in Securities | Level 1 | Level 2 | Level 3 | Total | ||||||||||||
Common Stock | $ | 621,118 | $ | 916 | $ | — | $ | 622,034 | ||||||||
Exchange Traded Fund | 1,009 | — | — | 1,009 | ||||||||||||
Rights | 12 | — | — | 12 | ||||||||||||
Warrant | — | — | — | — | ||||||||||||
Affiliated Partnership | — | 53,582 | — | 53,582 | ||||||||||||
Cash Equivalent | 37,845 | — | — | 37,845 | ||||||||||||
U.S. Treasury Obligation | — | 1,400 | — | 1,400 | ||||||||||||
|
|
|
|
|
|
|
| |||||||||
Total Investments in Securities | $ | 659,984 | $ | 55,898 | $ | — | $ | 715,882 | ||||||||
|
|
|
|
|
|
|
| |||||||||
| Other Financial Instruments | Level 1 | Level 2 | Level 3 | Total | ||||||||||||
Futures Contracts* | ||||||||||||||||
Unrealized Appreciation | $ | 626 | $ | — | $ | — | $ | 626 | ||||||||
|
|
|
|
|
|
|
| |||||||||
Total Other Financial Instruments | $ | 626 | $ | — | $ | — | $ | 626 | ||||||||
|
|
|
|
|
|
|
| |||||||||
| * | Futures contracts are valued at the unrealized appreciation on the instrument. |
For the period ended March 31, 2015, there were no transfers between Level 1 and Level 2 assets and liabilities.
For the period ended March 31, 2015, there were no transfers between Level 2 and Level 3 assets and liabilities.
For the period ended March 31, 2015, there were no Level 3 investments.
Amounts designated as “—” are $0 or have been rounded to $0.
| 13 | SEI Institutional Managed Trust / Semi-Annual Report / March 31, 2015 |
SCHEDULE OF INVESTMENTS (Unaudited)
Mid-Cap Fund
March 31, 2015
| Description | Shares | Market Value ($ Thousands) | ||||||
COMMON STOCK — 94.0% | ||||||||
Consumer Discretionary — 15.1% | ||||||||
Autonation* | 4,000 | $ | 257 | |||||
Bed Bath & Beyond* | 7,800 | 599 | ||||||
Best Buy | 10,000 | 378 | ||||||
Brunswick | 6,300 | 324 | ||||||
Capella Education | 600 | 39 | ||||||
Chipotle Mexican Grill, Cl A* | 1,010 | 657 | ||||||
Cinemark Holdings | 11,800 | 532 | ||||||
Darden Restaurants | 8,900 | 617 | ||||||
Dillard’s, Cl A | 3,600 | 491 | ||||||
DineEquity | 800 | 86 | ||||||
Discovery Communications, Cl A* | 2,900 | 89 | ||||||
Discovery Communications, Cl C* | 10,600 | 312 | ||||||
Dollar General | 500 | 38 | ||||||
Dollar Tree* | 700 | 57 | ||||||
Foot Locker, Cl A | 10,000 | 630 | ||||||
Gannett | 5,300 | 197 | ||||||
Gap | 13,900 | 602 | ||||||
Genuine Parts | 5,100 | 475 | ||||||
Harman International Industries, Cl A | 3,500 | 468 | ||||||
Helen of Troy* | 2,100 | 171 | ||||||
Interpublic Group | 24,200 | 535 | ||||||
Johnson Controls | 3,000 | 151 | ||||||
Kohl’s | 8,483 | 664 | ||||||
L Brands | 1,300 | 123 | ||||||
Marriott Vacations Worldwide | 800 | 65 | ||||||
Michael Kors Holdings* | 9,300 | 611 | ||||||
Murphy USA* | 6,800 | 492 | ||||||
NVR* | 140 | 186 | ||||||
Polaris Industries | 4,000 | 565 | ||||||
PVH | 4,400 | 469 | ||||||
Ross Stores | 7,500 | 790 | ||||||
Royal Caribbean Cruises | 1,200 | 98 | ||||||
Scripps Networks Interactive, Cl A | 700 | 48 | ||||||
Thor Industries | 6,700 | 424 | ||||||
TripAdvisor* | 1,900 | 158 | ||||||
Tupperware Brands | 700 | 48 | ||||||
Ulta Salon Cosmetics & Fragrance* | 4,100 | 619 | ||||||
Whirlpool | 1,530 | 309 | ||||||
|
| |||||||
| 13,374 | ||||||||
|
| |||||||
Consumer Staples — 4.7% | ||||||||
Bunge | 6,600 | 543 | ||||||
Coca-Cola Enterprises | 12,000 | 530 | ||||||
ConAgra Foods | 18,200 | 665 | ||||||
Hormel Foods | 1,500 | 85 | ||||||
Kroger | 11,000 | 843 | ||||||
Monster Beverage* | 5,600 | 775 | ||||||
Tyson Foods, Cl A | 6,700 | 257 | ||||||
Whole Foods Market | 9,400 | 490 | ||||||
|
| |||||||
| 4,188 | ||||||||
|
| |||||||
Energy — 5.0% | ||||||||
Atwood Oceanics, Cl A | 8,800 | 247 | ||||||
Cabot Oil & Gas | 5,700 | 168 | ||||||
Chesapeake Energy (B) | — | — | ||||||
Continental Resources, Cl A* | 1,500 | 66 | ||||||
EQT | 7,400 | 613 | ||||||
HollyFrontier | 15,400 | 620 | ||||||
Marathon Petroleum | 1,400 | 143 | ||||||
| Description | Shares | Market Value ($ Thousands) | ||||||
Noble | 25,200 | $ | 360 | |||||
Noble Energy | 900 | 44 | ||||||
Oneok | 12,400 | 598 | ||||||
Targa Resources | 2,800 | 268 | ||||||
Tesoro | 3,800 | 347 | ||||||
Valero Energy | 5,300 | 337 | ||||||
Western Refining | 8,600 | 425 | ||||||
World Fuel Services | 3,800 | 219 | ||||||
|
| |||||||
| 4,455 | ||||||||
|
| |||||||
Financials — 18.2% | ||||||||
Aflac | 2,200 | 141 | ||||||
American Assets Trust† | 7,800 | 338 | ||||||
American Capital Agency, Cl A† | 21,700 | 463 | ||||||
American Financial Group | 2,500 | 160 | ||||||
Ameriprise Financial | 1,800 | 236 | ||||||
Annaly Capital Management† | 53,100 | 552 | ||||||
Apollo Residential Mortgage† | 7,600 | 121 | ||||||
Ares Commercial Real Estate† | 6,300 | 70 | ||||||
Ashford Hospitality Prime† | 3,400 | 57 | ||||||
Ashford Hospitality Trust† | 16,600 | 160 | ||||||
Assurant | 2,000 | 123 | ||||||
Brixmor Property Group† | 15,500 | 412 | ||||||
CBRE Group, Cl A* | 16,600 | 643 | ||||||
Chambers Street Properties† | 50,700 | 400 | ||||||
Chimera Investment† | 82,700 | 260 | ||||||
CNA Financial | 3,800 | 157 | ||||||
Crown Castle International† | 9,500 | 784 | ||||||
Fidelity & Guaranty Life | 1,700 | 36 | ||||||
Fifth Third Bancorp | 35,100 | 662 | ||||||
Franklin Street Properties† | 8,600 | 110 | ||||||
Gain Capital Holdings | 13,100 | 128 | ||||||
Genworth Financial, Cl A* | 49,200 | 360 | ||||||
GEO Group† | 900 | 39 | ||||||
Gladstone Commercial† | 3,300 | 61 | ||||||
HCC Insurance Holdings | 2,300 | 130 | ||||||
HCP† | 15,600 | 674 | ||||||
Hospitality Properties Trust† | 13,600 | 449 | ||||||
Host Hotels & Resorts† | 29,000 | 585 | ||||||
Invesco | 17,200 | 683 | ||||||
Invesco Mortgage Capital† | 6,600 | 102 | ||||||
Jones Lang LaSalle | 3,460 | 589 | ||||||
KeyCorp | 43,800 | 620 | ||||||
Lincoln National | 4,300 | 247 | ||||||
Loews | 9,100 | 372 | ||||||
Marcus & Millichap* | 2,200 | 82 | ||||||
Mortgage Investment Trust† | 2,200 | 41 | ||||||
Navient | 27,500 | 559 | ||||||
Nelnet, Cl A | 4,200 | 199 | ||||||
Northern Trust | 4,600 | 320 | ||||||
Paramount Group† | 7,900 | 152 | ||||||
Piper Jaffray* | 6,500 | 341 | ||||||
Popular* | 14,300 | 492 | ||||||
Progressive | 2,900 | 79 | ||||||
ProLogis† | 15,100 | 658 | ||||||
Regions Financial | 64,500 | 609 | ||||||
Resource Capital† | 8,100 | 37 | ||||||
Signature Bank NY, Cl B* | 300 | 39 | ||||||
Synchrony Financial (B)* | 15,600 | 473 | ||||||
T. Rowe Price Group | 1,200 | 97 | ||||||
Unum Group | 14,500 | 489 | ||||||
Voya Financial | 12,700 | 548 | ||||||
WP Carey† | 500 | 34 | ||||||
|
| |||||||
| 16,173 | ||||||||
|
| |||||||
| 1 | SEI Institutional Managed Trust / Semi-Annual Report / March 31, 2015 |
SCHEDULE OF INVESTMENTS (Unaudited)
Mid-Cap Fund
March 31, 2015
| Description | Shares | Market Value ($ Thousands) | ||||||
Health Care — 12.9% |
| |||||||
Aetna, Cl A | 4,200 | $ | 447 | |||||
Agilent Technologies | 8,000 | 332 | ||||||
Alexion Pharmaceuticals* | 1,030 | 179 | ||||||
AmerisourceBergen | 7,300 | 830 | ||||||
Boston Scientific* | 46,700 | 829 | ||||||
C.R. Bard | 3,500 | 586 | ||||||
Cardinal Health | 9,200 | 831 | ||||||
Cerner* | 10,300 | 755 | ||||||
Cigna | 3,100 | 401 | ||||||
Edwards Lifesciences, Cl A* | 4,800 | 684 | ||||||
HCA Holdings* | 3,700 | 278 | ||||||
Hologic* | 6,400 | 211 | ||||||
Humana | 350 | 62 | ||||||
Illumina* | 4,010 | 745 | ||||||
IMS Health Holdings* | 15,300 | 414 | ||||||
Intuitive Surgical* | 1,240 | 626 | ||||||
Jazz Pharmaceuticals* | 1,060 | 183 | ||||||
Mallinckrodt* | 1,900 | 241 | ||||||
Mylan* | 13,200 | 783 | ||||||
Quest Diagnostics | 7,800 | 600 | ||||||
Quintiles Transnational Holdings* | 7,500 | 502 | ||||||
United Therapeutics* | 2,400 | 414 | ||||||
Universal Health Services, Cl B | 4,700 | 553 | ||||||
|
| |||||||
| 11,486 | ||||||||
Industrials — 10.6% |
| |||||||
Acuity Brands | 3,500 | 588 | ||||||
Alamo Group | 700 | 44 | ||||||
Alaska Air Group | 8,700 | 576 | ||||||
Allegiant Travel, Cl A | 500 | 96 | ||||||
Amerco | 580 | 192 | ||||||
Ametek | 3,500 | 184 | ||||||
AO Smith | 7,900 | 519 | ||||||
Argan | 1,500 | 54 | ||||||
Babcock & Wilcox | 7,900 | 253 | ||||||
C.H. Robinson Worldwide | 7,200 | 527 | ||||||
Copart* | 12,900 | 485 | ||||||
Exelis | 1,400 | 34 | ||||||
Expeditors International of Washington | 10,652 | 513 | ||||||
Hillenbrand | 2,700 | 84 | ||||||
Huntington Ingalls Industries, Cl A | 3,800 | 533 | ||||||
L-3 Communications Holdings | 1,580 | 199 | ||||||
Lincoln Electric Holdings | 6,700 | 438 | ||||||
ManpowerGroup | 2,000 | 172 | ||||||
Old Dominion Freight Line, Cl A* | 5,500 | 425 | ||||||
Parker-Hannifin, Cl A | 5,600 | 665 | ||||||
Regal-Beloit | 4,300 | 344 | ||||||
Robert Half International | 5,600 | 339 | ||||||
Southwest Airlines, Cl A | 19,500 | 864 | ||||||
Spirit AeroSystems Holdings, Cl A* | 3,700 | 193 | ||||||
Spirit Airlines* | 3,100 | 240 | ||||||
Trinity Industries | 15,800 | 561 | ||||||
United Continental Holdings* | 2,500 | 168 | ||||||
United Rentals* | 1,600 | 146 | ||||||
|
| |||||||
| 9,436 | ||||||||
|
| |||||||
Information Technology — 15.3% |
| |||||||
Amkor Technology* | 18,000 | 159 | ||||||
Analog Devices | 2,800 | 176 | ||||||
| Description | Shares | Market Value ($ Thousands) | ||||||
Ansys* | 3,100 | $ | 273 | |||||
ARRIS Group* | 8,600 | 249 | ||||||
Arrow Electronics, Cl A* | 7,700 | 471 | ||||||
Avago Technologies, Cl A | 7,400 | 940 | ||||||
Avnet | 5,600 | 249 | ||||||
Booz Allen Hamilton Holding, Cl A | 6,500 | 188 | ||||||
Broadcom, Cl A | 17,200 | 745 | ||||||
Broadridge Financial Solutions | 9,900 | 545 | ||||||
CA | 6,000 | 196 | ||||||
CDW | 13,200 | 491 | ||||||
Citrix Systems* | 9,200 | 588 | ||||||
DST Systems | 4,500 | 498 | ||||||
Electronic Arts* | 1,600 | 94 | ||||||
Equinix† | 1,100 | 256 | ||||||
F5 Networks, Cl A* | 4,000 | 460 | ||||||
Fiserv, Cl A* | 3,200 | 254 | ||||||
Harris | 6,900 | 543 | ||||||
Ingram Micro, Cl A* | 18,700 | 470 | ||||||
Integrated Device Technology* | 1,700 | 34 | ||||||
Intuit | 6,300 | 611 | ||||||
Jabil Circuit | 23,300 | 545 | ||||||
Jack Henry & Associates | 400 | 28 | ||||||
Leidos Holdings | 7,200 | 302 | ||||||
Maxim Integrated Products | 12,400 | 432 | ||||||
NetApp | 2,400 | 85 | ||||||
NetScout Systems (B)* | 3,600 | 158 | ||||||
Nuance Communications* | 18,800 | 270 | ||||||
Progress Software* | 4,500 | 122 | ||||||
Rovi* | 6,600 | 120 | ||||||
ShoreTel* | 4,800 | 33 | ||||||
Skyworks Solutions | 8,000 | 786 | ||||||
SolarWinds* | 9,100 | 466 | ||||||
Solera Holdings | 6,500 | 336 | ||||||
Symantec, Cl A | 20,000 | 467 | ||||||
Synopsys* | 4,000 | 185 | ||||||
Tessera Technologies | 8,900 | 358 | ||||||
Western Digital | 4,200 | 383 | ||||||
|
| |||||||
| 13,566 | ||||||||
|
| |||||||
Materials — 5.8% |
| |||||||
Alcoa | 11,600 | 150 | ||||||
Cabot | 9,000 | 405 | ||||||
Celanese, Ser A | 8,600 | 480 | ||||||
Century Aluminum* | 4,100 | 56 | ||||||
Eastman Chemical | 1,100 | 76 | ||||||
Greif, Cl A | 7,300 | 286 | ||||||
International Paper | 8,500 | 472 | ||||||
Mosaic | 12,300 | 567 | ||||||
Nucor | 2,100 | 100 | ||||||
Rock-Tenn, Cl A | 8,600 | 555 | ||||||
Sherwin-Williams, Cl A | 2,630 | 748 | ||||||
Stepan | 2,100 | 88 | ||||||
Vulcan Materials | 6,900 | 582 | ||||||
Westlake Chemical | 7,900 | 568 | ||||||
|
| |||||||
| 5,133 | ||||||||
|
| |||||||
Utilities — 6.4% |
| |||||||
AES | 43,900 | 564 | ||||||
AGL Resources | 3,100 | 154 | ||||||
Calpine* | 25,100 | 574 | ||||||
Consolidated Edison | 9,600 | 586 | ||||||
DTE Energy | 3,200 | 258 | ||||||
Entergy | 8,100 | 628 | ||||||
ITC Holdings | 1,100 | 41 | ||||||
| 2 | SEI Institutional Managed Trust / Semi-Annual Report / March 31, 2015 |
SCHEDULE OF INVESTMENTS (Unaudited)
Mid-Cap Fund
March 31, 2015
| Description | Shares /Face Amount ($ Thousands) | Market Value ($ Thousands) | ||||||
PPL | 22,200 | $ | 747 | |||||
Public Service Enterprise Group | 16,300 | 683 | ||||||
Questar | 17,600 | 420 | ||||||
SCANA | 1,500 | 83 | ||||||
UGI | 15,400 | 502 | ||||||
Vectren | 10,200 | 450 | ||||||
|
| |||||||
| 5,690 | ||||||||
|
| |||||||
Total Common Stock | 83,501 | |||||||
|
| |||||||
CASH EQUIVALENT — 0.9% |
| |||||||
SEI Daily Income Trust, Prime Obligation Fund, Cl A | 782,954 | 783 | ||||||
|
| |||||||
Total Cash Equivalent | 783 | |||||||
|
| |||||||
AFFILIATED PARTNERSHIP — 0.8% |
| |||||||
SEI Liquidity Fund, L.P. | 694,257 | 694 | ||||||
|
| |||||||
Total Affiliated Partnership | 694 | |||||||
|
| |||||||
U.S. TREASURY OBLIGATIONS — 0.6% |
| |||||||
U.S. Treasury Bills |
| |||||||
0.017%, 05/28/15 (A) (D) | $ | 494 | 494 | |||||
|
| |||||||
Total U.S. Treasury Obligations | 494 | |||||||
|
| |||||||
Total Investments — 96.2% | $ | 85,472 | ||||||
|
| |||||||
The open futures contracts held by the Fund at March 31, 2015, are as follows:
| Type of Contract | Number of Contracts Long | Expiration Date | Unrealized ($ Thousands) | |||||||||
S&P M id 400 Index E-MINI | 16 | Jun-2015 | $ | 21 | ||||||||
|
| |||||||||||
For the period ended March 31, 2015, the total amount of all open futures contracts, as presented in the table above, are representative of the volume of activity for this derivative type during the period.
Percentages are based on Net Assets of $88,841 ($Thousands).
| * | Non-income producing security. |
| ** | Rate shown is the 7-day effective yield as of March 31, 2015. |
| † | Real Estate Investment Trust. |
| †† | Investment in Affiliated Security. |
| (A) | Security, or portion thereof, has been pledged as collateral on open futures contracts. |
| (B) | This security or a partial position of this security is on loan at March 31, 2015. The total market value of securities on loan at March 31, 2015 was $694 ($ Thousands) |
| (C) | This security was purchased with cash collateral held from securities on loan. The total value of such securities as of March 31, 2015 was $676 ($ Thousands). |
| (D) | The rate reported is the effective yield at the time of purchase. |
Cl — Class
L.P. — Limited Partnership
S&P — Standard & Poor’s
Ser — Series
The following is a summary of the inputs used as of March 31, 2015, in valuing the Fund’s investments carried at value ($ Thousands):
| Investments in Securities | Level 1 | Level 2 | Level 3 | Total | ||||||||||||
Common Stock | $ | 83,501 | $ | — | $ | — | $ | 83,501 | ||||||||
Cash Equivalent | 783 | — | — | 783 | ||||||||||||
Affiliated Partnership | — | 694 | — | 694 | ||||||||||||
U.S. Treasury Obligations | — | 494 | — | 494 | ||||||||||||
|
|
|
|
|
|
|
| |||||||||
Total Investments in Securities | $ | 84,284 | $ | 1,188 | $ | — | $ | 85,472 | ||||||||
|
|
|
|
|
|
|
| |||||||||
| Other Financial Instruments | Level 1 | Level 2 | Level 3 | Total | ||||||||||||
Futures Contracts * | ||||||||||||||||
Unrealized Appreciation * | $ | 21 | $ | — | $ | — | $ | 21 | ||||||||
|
|
|
|
|
|
|
| |||||||||
Total Other Financial Instruments | $ | 21 | $ | — | $ | — | $ | 21 | ||||||||
|
|
|
|
|
|
|
| |||||||||
| * | Futures contracts are valued at the unrealized appreciation on the instrument. |
For the period ended March 31, 2015, there were no transfers between Level 1 and Level 2 assets and liabilities.
For the period ended March 31, 2015, there were no transfers between Level 2 and Level 3 assets and liabilities.
For the period ended March 31, 2015, there were no Level 3 investments.
Amounts designated as “—” are $0 or have been rounded to $0.
| 3 | SEI Institutional Managed Trust / Semi-Annual Report / March 31, 2015 |
SCHEDULE OF INVESTMENTS (Unaudited)
U.S. Managed Volatility Fund
March 31, 2015
| Description | Shares | Market Value ($ Thousands) | ||||||
COMMON STOCK — 95.7% | ||||||||
Consumer Discretionary — 11.1% | ||||||||
Aaron’s | 32,761 | $ | 927 | |||||
American Eagle Outfitters | 241,400 | 4,123 | ||||||
Aramark | 299,386 | 9,470 | ||||||
Autozone* | 4,500 | 3,070 | ||||||
Bed Bath & Beyond* | 67,430 | 5,177 | ||||||
Big Lots | 28,000 | 1,345 | ||||||
BJ’s Restaurants* | 8,708 | 439 | ||||||
Bloomin’ Brands | 16,505 | 402 | ||||||
Brinker International | 59,410 | 3,657 | ||||||
Buckle | 9,313 | 476 | ||||||
Buffalo Wild Wings* | 1,022 | 185 | ||||||
Burlington Stores* | 71,550 | 4,251 | ||||||
Canadian Tire, Cl A | 23,100 | 2,353 | ||||||
Carriage Services | 28,055 | 670 | ||||||
Carter’s | 33,690 | 3,115 | ||||||
Cheesecake Factory | 71,384 | 3,521 | ||||||
Chico’s FAS | 107,730 | 1,906 | ||||||
Citi Trends* | 2,146 | 58 | ||||||
Coach | 57,360 | 2,377 | ||||||
Cooper-Standard Holding* | 18,092 | 1,071 | ||||||
Core-Mark Holding, Cl A | 8,584 | 552 | ||||||
Cracker Barrel Old Country Store | 4,183 | 636 | ||||||
Deckers Outdoor* | 20,230 | 1,474 | ||||||
DIRECTV* | 101,200 | 8,612 | ||||||
Dollar General | 88,799 | 6,694 | ||||||
Dollar Tree* | 60,358 | 4,898 | ||||||
Domino’s Pizza | 36,160 | 3,636 | ||||||
DSW, Cl A | 48,960 | 1,806 | ||||||
El Pollo Loco Holdings* | 22,461 | 575 | ||||||
Escalade | 4,482 | 78 | ||||||
Flexsteel Industries | 9,524 | 298 | ||||||
Foot Locker, Cl A | 55,640 | 3,505 | ||||||
GoPro, Cl A* | 11,531 | 501 | ||||||
Graham Holdings, Cl B | 2,690 | 2,823 | ||||||
HSN, Cl A | 48,750 | 3,326 | ||||||
Jack in the Box | 42,620 | 4,088 | ||||||
Kohl’s | 178,977 | 14,005 | ||||||
Liberty TripAdvisor Holdings, Cl A* | 132,158 | 4,201 | ||||||
lululemon athletica* | 59,090 | 3,783 | ||||||
Michael Kors Holdings* | 9,260 | 609 | ||||||
Nathan’s Famous | 9,549 | 517 | ||||||
Nutrisystem | 5,718 | 114 | ||||||
NVR* | 1,032 | 1,371 | ||||||
Outerwall | 2,674 | 177 | ||||||
Panera Bread, Cl A* | 62,811 | 10,050 | ||||||
Papa John’s International, Cl A | 13,056 | 807 | ||||||
PetMed Express | 42,521 | 703 | ||||||
Reading International, Cl A* | 16,505 | 222 | ||||||
Regal Entertainment Group, Cl A | 15,740 | 360 | ||||||
Staples | 253,990 | 4,136 | ||||||
Target, Cl A | 153,869 | 12,628 | ||||||
Thomson Reuters | 64,748 | 2,626 | ||||||
Time Warner Cable, Cl A | 17,700 | 2,653 | ||||||
Vail Resorts | 9,900 | 1,024 | ||||||
Viacom, Cl B | 40,400 | 2,759 | ||||||
Vista Outdoor* | 45,200 | 1,935 | ||||||
|
| |||||||
| 156,775 | ||||||||
|
| |||||||
Consumer Staples — 19.4% | ||||||||
Altria Group | 388,202 | 19,418 | ||||||
| Description | Shares | Market Value ($ Thousands) | ||||||
Archer-Daniels-Midland | 51,900 | $ | 2,460 | |||||
Bunge | 159,981 | 13,176 | ||||||
Cal-Maine Foods | 48,783 | 1,905 | ||||||
Campbell Soup | 20,660 | 962 | ||||||
Casey’s General Stores | 47,350 | 4,266 | ||||||
Church & Dwight | 30,130 | 2,574 | ||||||
Clorox | 141,248 | 15,592 | ||||||
Coca-Cola | 287,382 | 11,653 | ||||||
Coca-Cola Bottling Consolidated | 6,898 | 780 | ||||||
Coca-Cola Enterprises | 36,600 | 1,618 | ||||||
Colgate-Palmolive | 44,880 | 3,112 | ||||||
ConAgra Foods | 136,700 | 4,994 | ||||||
Constellation Brands, Cl A* | 5,454 | 634 | ||||||
Costco Wholesale | 92,621 | 14,032 | ||||||
Coty, Cl A | 181,488 | 4,405 | ||||||
CVS Health | 69,860 | 7,210 | ||||||
Dean Foods | 22,060 | 365 | ||||||
Dr Pepper Snapple Group | 125,513 | 9,850 | ||||||
Fresh Del Monte Produce | 78,780 | 3,065 | ||||||
General Mills, Cl A | 263,699 | 14,925 | ||||||
Hershey | 45,774 | 4,619 | ||||||
Hormel Foods | 74,406 | 4,230 | ||||||
Ingredion | 25,300 | 1,969 | ||||||
Inventure Foods* | 4,664 | 52 | ||||||
J&J Snack Foods | 1,654 | 177 | ||||||
John B Sanfilippo & Son | 19,429 | 837 | ||||||
Kellogg | 68,500 | 4,518 | ||||||
Kimberly-Clark | 76,573 | 8,202 | ||||||
Kroger | 284,817 | 21,834 | ||||||
Lancaster Colony | 10,674 | 1,016 | ||||||
Lorillard | 80,870 | 5,285 | ||||||
Mead Johnson Nutrition, Cl A | 11,190 | 1,125 | ||||||
Metro, Cl A | 92,100 | 2,496 | ||||||
Orchids Paper Products | 13,694 | 369 | ||||||
PepsiCo | 156,279 | 14,943 | ||||||
Philip Morris International | 47,460 | 3,575 | ||||||
Pinnacle Foods | 156,883 | 6,402 | ||||||
Procter & Gamble | 140,927 | 11,548 | ||||||
Sanderson Farms | 50,216 | 4,000 | ||||||
SUPERVALU* | 84,700 | 985 | ||||||
TreeHouse Foods* | 11,884 | 1,010 | ||||||
Tyson Foods, Cl A | 239,244 | 9,163 | ||||||
Universal | 31,000 | 1,462 | ||||||
Vector Group | 54,852 | 1,205 | ||||||
Wal-Mart Stores | 262,395 | 21,582 | ||||||
Whole Foods Market | 77,660 | 4,044 | ||||||
|
| |||||||
| 273,644 | ||||||||
|
| |||||||
Energy — 1.4% | ||||||||
Adams Resources & Energy | 1,128 | 76 | ||||||
Chevron | 65,300 | 6,855 | ||||||
ConocoPhillips | 91,500 | 5,697 | ||||||
Exxon Mobil | 81,300 | 6,910 | ||||||
|
| |||||||
| 19,538 | ||||||||
|
| |||||||
Financials — 18.3% | ||||||||
Allied World Assurance Holdings | 169,465 | 6,846 | ||||||
Allstate | 109,500 | 7,793 | ||||||
American Capital Agency, Cl A† | 55,100 | 1,175 | ||||||
American Capital Mortgage Investment† | 34,620 | 622 | ||||||
American Financial Group | 50,150 | 3,217 | ||||||
AmTrust Financial Services | 6,975 | 397 | ||||||
Annaly Capital Management† | 776,721 | 8,078 | ||||||
| 1 | SEI Institutional Managed Trust / Semi-Annual Report / March 31, 2015 |
SCHEDULE OF INVESTMENTS (Unaudited)
U.S. Managed Volatility Fund
March 31, 2015
| Description | Shares | Market Value ($ Thousands) | ||||||
Anworth Mortgage Asset† | 93,474 | $ | 476 | |||||
Apollo Commercial Real Estate Finance† | 62,567 | 1,075 | ||||||
Apollo Residential Mortgage† | 7,848 | 125 | ||||||
Arrow Financial | 2,985 | 81 | ||||||
Aspen Insurance Holdings | 74,716 | 3,529 | ||||||
Assurant | 49,510 | 3,040 | ||||||
AvalonBay Communities† | 16,660 | 2,903 | ||||||
Axis Capital Holdings | 180,840 | 9,328 | ||||||
Beneficial Bancorp* | 5,546 | 63 | ||||||
BOK Financial | 35,172 | 2,153 | ||||||
Brixmor Property Group† | 18,730 | 497 | ||||||
Capital Bank Financial, Cl A* | 30,397 | 839 | ||||||
Capitol Federal Financial | 24,993 | 312 | ||||||
Capstead Mortgage† | 41,200 | 485 | ||||||
CBL & Associates Properties† | 191,680 | 3,795 | ||||||
CBOE Holdings | 63,070 | 3,621 | ||||||
CBRE Group, Cl A* | 72,320 | 2,800 | ||||||
Charter Financial | 16,036 | 184 | ||||||
Chimera Investment† | 745,668 | 2,341 | ||||||
Chubb | 52,400 | 5,298 | ||||||
CIT Group | 73,600 | 3,321 | ||||||
Corporate Office Properties Trust† | 22,600 | 664 | ||||||
CU Bancorp* | 10,683 | 243 | ||||||
Customers Bancorp* | 20,542 | 500 | ||||||
CYS Investments† | 128,571 | 1,146 | ||||||
Digital Realty Trust, Cl A† | 39,070 | 2,577 | ||||||
Dream Office Real Estate Investment Trust† | 115,200 | 2,397 | ||||||
Dynex Capital† | 14,006 | 119 | ||||||
Employers Holdings | 10,329 | 279 | ||||||
Endurance Specialty Holdings | 53,380 | 3,264 | ||||||
Equity LifeStyle Properties† | 64,790 | 3,560 | ||||||
Essent Group* | 12,905 | 309 | ||||||
Everest Re Group | 96,343 | 16,764 | ||||||
Federated National Holding | 6,609 | 202 | ||||||
Fidelity Southern | 5,259 | 89 | ||||||
First NBC Bank Holding* | 1,936 | 64 | ||||||
FNFV Group* | 117,153 | 1,652 | ||||||
Gaming and Leisure Properties† | 70,970 | 2,617 | ||||||
Genworth MI Canada | 71,000 | 1,570 | ||||||
Greenlight Capital Re* | 7,211 | 229 | ||||||
Hatteras Financial† | 22,899 | 416 | ||||||
HCC Insurance Holdings | 43,000 | 2,437 | ||||||
HCP† | 101,600 | 4,390 | ||||||
Health Care† | 42,190 | 3,264 | ||||||
Highwoods Properties† | 82,980 | 3,799 | ||||||
Home Loan Servicing Solutions | 5,420 | 90 | ||||||
Hospitality Properties Trust | 134,320 | 4,431 | ||||||
Investors Bancorp | 43,039 | 504 | ||||||
Jones Lang LaSalle | 24,700 | 4,209 | ||||||
Ladder Capital, Cl A† | 7,379 | 137 | ||||||
LendingTree* | 4,540 | 254 | ||||||
Medical Properties Trust† | 264,860 | 3,904 | ||||||
MFA Financial† | 883,696 | 6,946 | ||||||
MidWestOne Financial Group | 2,634 | 76 | ||||||
Montpelier Re Holdings | 19,956 | 767 | ||||||
Mortgage Investment Trust† | 6,956 | 131 | ||||||
National Bank, Cl A | 11,498 | 216 | ||||||
National Bank of Canada | 96,800 | 3,534 | ||||||
New Residential Investment† | 4,499 | 68 | ||||||
New York Mortgage Trust† | 143,456 | 1,113 | ||||||
Northwest Bancshares | 26,265 | 311 | ||||||
| Description | Shares | Market Value ($ Thousands) | ||||||
Omega Healthcare Investors† | 106,760 | $ | 4,331 | |||||
OneBeacon Insurance Group, Cl A | 19,612 | 298 | ||||||
Pacific Premier Bancorp* | 11,009 | 178 | ||||||
PartnerRe | 140,344 | 16,046 | ||||||
PennyMac Financial Services, Cl A* | 24,663 | 418 | ||||||
PennyMac Mortgage Investment Trust† | 89,100 | 1,897 | ||||||
Peoples Financial Services | 3,918 | 176 | ||||||
Piedmont Office Realty Trust, Cl A† | 145,400 | 2,706 | ||||||
Post Properties† | 69,813 | 3,974 | ||||||
PRA Group* | 32,720 | 1,777 | ||||||
Reinsurance Group of America, Cl A | 38,530 | 3,591 | ||||||
RenaissanceRe Holdings | 111,395 | 11,109 | ||||||
RLJ Lodging Trust† | 69,960 | 2,190 | ||||||
Royal Bank of Canada | 58,700 | 3,534 | ||||||
Ryman Hospitality Properties | 56,720 | 3,455 | ||||||
Select Income REIT† | 7,882 | 197 | ||||||
Senior Housing Properties Trust† | 80,610 | 1,789 | ||||||
Silver Bay Realty Trust† | 27,784 | 449 | ||||||
Simon Property Group† | 7,750 | 1,516 | ||||||
State Bank Financial | 16,743 | 352 | ||||||
Stonegate Bank | 8,545 | 258 | ||||||
Travelers | 135,767 | 14,680 | ||||||
Two Harbors Investment† | 798,165 | 8,476 | ||||||
UDR† | 38,100 | 1,297 | ||||||
United Insurance Holdings | 18,597 | 418 | ||||||
Validus Holdings | 264,792 | 11,148 | ||||||
Ventas† | 48,860 | 3,568 | ||||||
Waterstone Financial | 6,571 | 84 | ||||||
Wells Fargo | 64,300 | 3,498 | ||||||
WR Berkley | 2,524 | 128 | ||||||
|
| |||||||
| 257,174 | ||||||||
|
| |||||||
Health Care — 16.2% | ||||||||
Abbott Laboratories | 18,093 | 838 | ||||||
Acceleron Pharma* | 1,202 | 46 | ||||||
Addus HomeCare* | 19,229 | 443 | ||||||
Aetna, Cl A | 57,900 | 6,168 | ||||||
Air Methods* | 5,919 | 276 | ||||||
AmerisourceBergen | 110,067 | 12,511 | ||||||
Amgen, Cl A | 22,600 | 3,613 | ||||||
Analogic | 2,268 | 206 | ||||||
Anthem | 52,330 | 8,080 | ||||||
AstraZeneca ADR | 56,700 | 3,880 | ||||||
Atrion | 442 | 153 | ||||||
Baxter International | 118,800 | 8,138 | ||||||
Becton Dickinson | 10,682 | 1,534 | ||||||
Bio-Path Holdings* | 31,421 | 56 | ||||||
Bio-Reference Laboratories* | 11,581 | 408 | ||||||
Cardinal Health | 172,723 | 15,592 | ||||||
Chemed | 9,440 | 1,127 | ||||||
Eli Lilly | 165,489 | 12,023 | ||||||
Express Scripts Holding* | 109,703 | 9,519 | ||||||
HCA Holdings* | 21,520 | 1,619 | ||||||
Henry Schein* | 18,005 | 2,514 | ||||||
Hill-Rom Holdings | 84,160 | 4,124 | ||||||
Hologic* | 128,610 | 4,247 | ||||||
Humana | 46,261 | 8,235 | ||||||
ICON* | 37,350 | 2,634 | ||||||
ICU Medical* | 9,349 | 871 | ||||||
| 2 | SEI Institutional Managed Trust / Semi-Annual Report / March 31, 2015 |
SCHEDULE OF INVESTMENTS (Unaudited)
U.S. Managed Volatility Fund
March 31, 2015
| Description | Shares | Market Value ($ Thousands) | ||||||
Idexx Laboratories* | 27,729 | $ | 4,284 | |||||
Insys Therapeutics* | 6,858 | 399 | ||||||
Integra LifeSciences Holdings* | 3,073 | 189 | ||||||
Johnson & Johnson | 235,684 | 23,710 | ||||||
Laboratory Corp of America Holdings* | 47,217 | 5,954 | ||||||
McKesson | 31,568 | 7,141 | ||||||
Medtronic | 52,100 | 4,063 | ||||||
Merck | 254,088 | 14,605 | ||||||
MiMedx Group* | 10,219 | 106 | ||||||
Myriad Genetics* | 29,490 | 1,044 | ||||||
Omnicare | 77,253 | 5,953 | ||||||
Ophthotech* | 4,308 | 200 | ||||||
Owens & Minor | 34,526 | 1,168 | ||||||
Parexel International* | 17,198 | 1,187 | ||||||
Patterson | 74,910 | 3,655 | ||||||
Pfizer | 374,200 | 13,018 | ||||||
Phibro Animal Health, Cl A | 12,447 | 441 | ||||||
Quest Diagnostics | 167,754 | 12,892 | ||||||
Sagent Pharmaceuticals* | 10,317 | 240 | ||||||
STERIS, Cl A | 5,444 | 382 | ||||||
Team Health Holdings* | 44,130 | 2,582 | ||||||
United Therapeutics* | 8,658 | 1,493 | ||||||
UnitedHealth Group | 58,500 | 6,920 | ||||||
Varian Medical Systems* | 43,700 | 4,112 | ||||||
Zimmer Holdings | 21,400 | 2,515 | ||||||
Zoetis, Cl A | 16,811 | 778 | ||||||
|
| |||||||
| 227,886 | ||||||||
|
| |||||||
Industrials — 3.5% |
| |||||||
Boeing | 23,700 | 3,557 | ||||||
Civeo | 23,640 | 60 | ||||||
Deere | 63,600 | 5,577 | ||||||
FedEx | 15,900 | 2,631 | ||||||
General Dynamics | 11,400 | 1,547 | ||||||
Healthcare Services Group | 2,298 | 74 | ||||||
L-3 Communications Holdings | 17,800 | 2,239 | ||||||
Landstar System | 8,435 | 559 | ||||||
Lockheed Martin | 75,693 | 15,363 | ||||||
Masonite International* | 7,311 | 492 | ||||||
Northrop Grumman | 47,300 | 7,613 | ||||||
Orbital ATK | 22,600 | 1,732 | ||||||
Raytheon | 62,400 | 6,817 | ||||||
Sparton* | 19,948 | 489 | ||||||
Waste Management | 11,168 | 605 | ||||||
Wesco Aircraft Holdings* | 19,748 | 303 | ||||||
|
| |||||||
| 49,658 | ||||||||
|
| |||||||
Information Technology — 10.0% |
| |||||||
Accenture, Cl A | 37,078 | 3,474 | ||||||
Alliance Fiber Optic Products | 3,655 | 63 | ||||||
Amdocs | 329,640 | 17,932 | ||||||
Apple | 42,644 | 5,306 | ||||||
Bankrate* | 4,891 | 56 | ||||||
Barracuda Networks* | 1,784 | 69 | ||||||
Blackhawk Network Holdings, Cl A* | 10,170 | 364 | ||||||
Booz Allen Hamilton Holding, Cl A | 99,411 | 2,877 | ||||||
Broadridge Financial Solutions | 83,319 | 4,583 | ||||||
Cadence Design Systems* | 24,539 | 452 | ||||||
CDW | 56,354 | 2,099 | ||||||
Cisco Systems | 225,100 | 6,196 | ||||||
Computer Sciences | 59,543 | 3,887 | ||||||
CSG Systems International | 17,416 | 529 | ||||||
| Description | Shares | Market Value ($ Thousands) | ||||||
DST Systems | 62,492 | $ | 6,919 | |||||
Echo Global Logistics* | 8,862 | 242 | ||||||
EMC | 135,900 | 3,474 | ||||||
EVERTEC | 19,845 | 434 | ||||||
Factset Research Systems | 36,317 | 5,782 | ||||||
Forrester Research | 2,017 | 74 | ||||||
Genpact* | 19,703 | 458 | ||||||
GTT Communications* | 17,836 | 337 | ||||||
Harris | 60,700 | 4,781 | ||||||
Hewlett-Packard | 215,126 | 6,703 | ||||||
Intel | 192,100 | 6,007 | ||||||
International Business Machines | 142,637 | 22,893 | ||||||
Intuit | 8,523 | 826 | ||||||
Jack Henry & Associates | 74,099 | 5,179 | ||||||
Kofax* | 10,111 | 111 | ||||||
Lexmark International, Cl A | 13,450 | 569 | ||||||
MAXIMUS | 1,006 | 67 | ||||||
Microsoft | 116,200 | 4,724 | ||||||
NetApp | 86,200 | 3,057 | ||||||
NeuStar, Cl A* | 17,791 | 438 | ||||||
Oracle, Cl B | 69,800 | 3,012 | ||||||
Qualcomm | 43,900 | 3,044 | ||||||
Reis | 13,694 | 351 | ||||||
Science Applications International | 31,285 | 1,606 | ||||||
Synopsys* | 73,600 | 3,409 | ||||||
Tech Data* | 30,000 | 1,733 | ||||||
VeriSign* | 58,190 | 3,897 | ||||||
Western Union | 154,100 | 3,207 | ||||||
|
| |||||||
| 141,221 | ||||||||
|
| |||||||
Materials — 1.5% |
| |||||||
Ball | 42,433 | 2,997 | ||||||
Bemis | 70,600 | 3,270 | ||||||
Berry Plastics Group* | 25,496 | 923 | ||||||
Clearwater Paper* | 4,723 | 309 | ||||||
Compass Minerals International, Cl A | 22,653 | 2,111 | ||||||
Kaiser Aluminum | 3,734 | 287 | ||||||
Newmont Mining | 110,621 | 2,402 | ||||||
Royal Gold, Cl A | 78,802 | 4,973 | ||||||
Scotts Miracle-Gro, Cl A | 31,603 | 2,123 | ||||||
Sonoco Products | 42,200 | 1,918 | ||||||
|
| |||||||
| 21,313 | ||||||||
|
| |||||||
Telecommunication Services — 5.2% |
| |||||||
AT&T | 596,909 | 19,489 | ||||||
BCE | 133,430 | 5,651 | ||||||
Boingo Wireless* | 9,324 | 70 | ||||||
CenturyTel | 139,691 | 4,826 | ||||||
Hawaiian Telcom Holdco* | 14,048 | 374 | ||||||
NTT DoCoMo ADR | 260,300 | 4,537 | ||||||
RingCentral, Cl A* | 8,637 | 133 | ||||||
Rogers Communications, Cl B | 139,700 | 4,677 | ||||||
SK Telecom ADR | 191,000 | 5,197 | ||||||
TELUS | 151,714 | 5,042 | ||||||
Verizon Communications | 437,680 | 21,284 | ||||||
Windstream Holdings | 165,214 | 1,223 | ||||||
|
| |||||||
| 72,503 | ||||||||
|
| |||||||
Utilities — 9.1% |
| |||||||
ALLETE | 4,210 | 222 | ||||||
Ameren | 71,700 | 3,026 | ||||||
American Electric Power | 158,080 | 8,892 | ||||||
American Water Works | 41,459 | 2,248 | ||||||
| 3 | SEI Institutional Managed Trust / Semi-Annual Report / March 31, 2015 |
SCHEDULE OF INVESTMENTS (Unaudited)
U.S. Managed Volatility Fund
March 31, 2015
| Description | Shares/Face Amount ($ Thousands) | Market Value ($ Thousands) | ||||||
Artesian Resources, Cl A | 4,592 | $ | 98 | |||||
Atmos Energy | 31,200 | 1,725 | ||||||
Avista | 22,621 | 773 | ||||||
Cleco | 5,387 | 294 | ||||||
CMS Energy | 79,530 | 2,776 | ||||||
Consolidated Edison | 192,764 | 11,759 | ||||||
DTE Energy | 79,922 | 6,449 | ||||||
Edison International | 204,256 | 12,760 | ||||||
El Paso Electric, Cl A | 15,632 | 604 | ||||||
Empire District Electric | 7,765 | 193 | ||||||
Entergy | 218,497 | 16,931 | ||||||
Exelon | 181,900 | 6,114 | ||||||
FirstEnergy | 51,440 | 1,804 | ||||||
Hawaiian Electric Industries | 12,794 | 411 | ||||||
Idacorp, Cl A | 10,571 | 665 | ||||||
Northwest Natural Gas | 7,944 | 381 | ||||||
NorthWestern | 5,464 | 294 | ||||||
NRG Yield, Cl A | 4,956 | 251 | ||||||
PG&E | 225,940 | 11,991 | ||||||
Portland General Electric | 242,718 | 9,002 | ||||||
PPL | 76,200 | 2,565 | ||||||
Public Service Enterprise Group | 181,000 | 7,587 | ||||||
SCANA | 89,200 | 4,905 | ||||||
Southern | 282,299 | 12,500 | ||||||
Unitil | 18,964 | 659 | ||||||
WGL Holdings | 1,507 | 85 | ||||||
|
| |||||||
| 127,964 | ||||||||
|
| |||||||
Total Common Stock |
| 1,347,676 | ||||||
|
| |||||||
CASH EQUIVALENT — 4.0% |
| |||||||
SEI Daily Income Trust, | 56,094,361 | 56,094 | ||||||
|
| |||||||
Total Cash Equivalent |
| 56,094 | ||||||
|
| |||||||
U.S. TREASURY OBLIGATIONS — 0.2% |
| |||||||
U.S. Treasury Bills | $ | 2,069 | 2,069 | |||||
|
| |||||||
Total U.S. Treasury Obligations |
| 2,069 | ||||||
|
| |||||||
Total Investments — 99.8% |
| $ | 1,405,839 | |||||
|
| |||||||
The open futures contracts held by the Fund at March 31, 2015, are as follows:
| Type of Contract | Number of Contracts Long (Short) | Expiration Date | Unrealized Appreciation ($ Thousands) | |||||||||
S&P 500 Index EM INI | 385 | Jun-2015 | $ | 463 | ||||||||
|
| |||||||||||
For the period ended March 31, 2015, the total amount of all open futures contracts, as presented in the table above, are representative of the volume of activity for this derivative type during the period.
Percentages are based on Net Assets of $1,408,413 ($Thousands).
| * | Non-income producing security. |
| ** | Rate shown is the 7-day effective yield as of March 31, 2015. |
| † | Real Estate Investment Trust. |
| †† | Investment in Affiliated Security. |
| (A) | The rate reported is the effective yield at the time of purchase. |
| (B) | Security, or portion thereof, has been pledged as collateral on open futures contracts. |
ADR — American Depositary Receipt
Cl — Class
S&P — Standard & Poor’s
The following is a summary of the inputs used as of March 31, 2015, in valuing the Fund’s investments carried at value ($ Thousands):
| Investments in Securities | Level 1 | Level 2 | Level 3 | Total | ||||||||||||
Common Stock | $ | 1,347,676 | $ | — | $ | — | $ | 1,347,676 | ||||||||
U.S. Treasury Obligations | — | 2,069 | — | 2,069 | ||||||||||||
Cash Equivalent | 56,094 | — | — | 56,094 | ||||||||||||
|
|
|
|
|
|
|
| |||||||||
Total Investments in Securities | $ | 1,403,770 | $ | 2,069 | $ | — | $ | 1,405,839 | ||||||||
|
|
|
|
|
|
|
| |||||||||
| Other Financial Instruments | Level 1 | Level 2 | Level 3 | Total | ||||||||||||
Futures Contracts* | ||||||||||||||||
Unrealized Appreciation | $ | 463 | $ | — | $ | — | $ | 463 | ||||||||
|
|
|
|
|
|
|
| |||||||||
Total Other Financial Instruments | $ | 463 | $ | — | $ | — | $ | 463 | ||||||||
|
|
|
|
|
|
|
| |||||||||
| * | Futures contracts are valued at the unrealized appreciation on the instrument. |
For the period ended March 31, 2015, there were no transfers between Level 1 and Level 2 assets and liabilities.
For the period ended March 31, 2015, there were no transfers between Level 2 and Level 3 assets and liabilities.
For the period ended March 31, 2015, there were no Level 3 investments.
Amounts designated as “—” are $0 or have been rounded to $0.
| 4 | SEI Institutional Managed Trust / Semi-Annual Report / March 31, 2015 |
SCHEDULE OF INVESTMENTS (Unaudited)
Global Managed Volatility Fund
March 31, 2015
| Description | Shares | Market Value ($ Thousands) | ||||||
COMMON STOCK — 92.2% |
| |||||||
Australia — 6.3% | ||||||||
AGL Energy | 528,599 | $ | 6,138 | |||||
Amcor | 1,192,139 | 12,787 | ||||||
Asciano | 424,185 | 2,055 | ||||||
ASX | 83,350 | 2,637 | ||||||
Aurizon Holdings | 725,545 | 2,688 | ||||||
AusNet Services, Cl Miscellaneous | 3,936,921 | 4,391 | ||||||
Bank of Queensland | 139,877 | 1,474 | ||||||
Brambles | 9,727 | 86 | ||||||
Coca-Cola Amatil | 250,390 | 2,062 | ||||||
Cochlear | 6,511 | 450 | ||||||
Dexus Property Group† | 41,663 | 241 | ||||||
Federation Centres† | 1,352,780 | 3,142 | ||||||
Flight Centre Travel Group | 129,316 | 3,917 | ||||||
Goodman Group† | 699,799 | 3,395 | ||||||
GPT Group† | 309,290 | 1,080 | ||||||
Harvey Norman Holdings | 55,312 | 188 | ||||||
Insurance Australia Group | 248,264 | 1,157 | ||||||
Lend Lease Group | 509,704 | 6,479 | ||||||
Metcash, Cl A | 2,846,720 | 3,371 | ||||||
Newcrest Mining* | 22,060 | 225 | ||||||
Novion Property Group† | 693,095 | 1,329 | ||||||
Orica | 116,878 | 1,787 | ||||||
Rio Tinto | 65,781 | 2,876 | ||||||
Sonic Healthcare | 294,221 | 4,594 | ||||||
Stockland† | 115,362 | 396 | ||||||
Sydney Airport | 170,580 | 675 | ||||||
Tabcorp Holdings | 848,238 | 3,072 | ||||||
Tatts Group | 2,437,835 | 7,412 | ||||||
Telstra, Cl B | 2,241,844 | 10,807 | ||||||
Toll Holdings | 108,727 | 736 | ||||||
Transurban Group | 145,989 | 1,063 | ||||||
Wesfarmers | 446,439 | 14,993 | ||||||
Woodside Petroleum | 339,556 | 8,954 | ||||||
Woolworths | 460,886 | 10,383 | ||||||
|
| |||||||
| 127,040 | ||||||||
|
| |||||||
Austria — 0.3% | ||||||||
BUWOG | 21,725 | 446 | ||||||
CA Immobilien Anlagen | 41,532 | 779 | ||||||
Flughafen Wien | 7,239 | 629 | ||||||
Oesterreichische Post | 54,288 | 2,670 | ||||||
Telekom Austria | 32,269 | 231 | ||||||
Verbund | 36,862 | 617 | ||||||
voestalpine | 43,584 | 1,596 | ||||||
|
| |||||||
| 6,968 | ||||||||
|
| |||||||
Belgium — 0.7% | ||||||||
Anheuser-Busch InBev | 5,510 | 673 | ||||||
Befimmo† | 28,559 | 1,938 | ||||||
Belgacom | 229,091 | 8,015 | ||||||
Cofinimmo† | 2,215 | 260 | ||||||
Colruyt | 51,916 | 2,260 | ||||||
Elia System Operator | 7,877 | 332 | ||||||
|
| |||||||
| 13,478 | ||||||||
|
| |||||||
Canada — 11.7% | ||||||||
Alimentation Couche-Tard, Cl B | 105,300 | 4,196 | ||||||
Bank of Montreal | 148,000 | 8,869 | ||||||
BCE | 432,315 | 18,309 | ||||||
Calloway Real Estate Investment Trust, Cl Trust Unit† | 28,000 | 644 | ||||||
| Description | Shares | Market Value ($ Thousands) | ||||||
Canadian Apartment Properties† | 13,800 | $ | 318 | |||||
Canadian Imperial Bank of Commerce | 246,500 | 17,871 | ||||||
Canadian Tire, Cl A | 206,800 | 21,069 | ||||||
Catamaran* | 2,100 | 125 | ||||||
CGI Group, Cl A* | 32,400 | 1,374 | ||||||
CI Financial | 19,400 | 542 | ||||||
Constellation Software | 6,900 | 2,385 | ||||||
Dollarama | 196,100 | 10,962 | ||||||
Dream Office Real Estate Investment Trust† | 23,900 | 497 | ||||||
Eldorado Gold | 140,300 | 644 | ||||||
Emera | 335,300 | 10,907 | ||||||
Empire, Cl A | 104,000 | 7,252 | ||||||
Fairfax Financial Holdings | 12,700 | 7,120 | ||||||
First Capital Realty | 68,300 | 1,064 | ||||||
Fortis, Cl Common Subscription Receipt | 453,700 | 13,821 | ||||||
Franco-Nevada | 33,200 | 1,609 | ||||||
George Weston | 114,100 | 9,038 | ||||||
Great-West Lifeco, Cl Common Subscription Receipt | 24,300 | 702 | ||||||
H&R† | 243,600 | 4,487 | ||||||
IGM Financial | 35,400 | 1,258 | ||||||
Intact Financial, Cl Common Subscription Receipt | 129,600 | 9,764 | ||||||
Jean Coutu Group PJC, Cl A | 79,500 | 1,699 | ||||||
K-Bro Linen | 4,265 | 177 | ||||||
Manitoba Telecom Services | 197,100 | 3,737 | ||||||
Masonite International* | 16,337 | 1,099 | ||||||
Metro, Cl A | 542,900 | 14,712 | ||||||
Morguard† | 28,100 | 382 | ||||||
National Bank of Canada | 246,100 | 8,985 | ||||||
North West | 22,600 | 446 | ||||||
Open Text | 119,500 | 6,309 | ||||||
Power Corp of Canada | 45,900 | 1,215 | ||||||
RioCan, Cl Trust Unit† | 333,700 | 7,633 | ||||||
Rogers Communications, Cl B | 319,400 | 10,693 | ||||||
Royal Bank of Canada | 19,600 | 1,180 | ||||||
Saputo | 231,800 | 6,371 | ||||||
Shaw Communications, Cl B | 454,050 | 10,189 | ||||||
Thomson Reuters, Cl B | 54,200 | 2,197 | ||||||
Toronto-Dominion Bank | 123,400 | 5,282 | ||||||
TransAlta Renewables | 20,300 | 201 | ||||||
Valener | 33,226 | 455 | ||||||
|
| |||||||
| 237,789 | ||||||||
|
| |||||||
China — 0.1% | ||||||||
Chow Tai Fook Jewellery Group | 408,200 | 439 | ||||||
Yangzijiang Shipbuilding Holdings | 1,746,000 | 1,610 | ||||||
|
| |||||||
| 2,049 | ||||||||
|
| |||||||
Denmark — 0.9% | ||||||||
Carlsberg, Cl B | 69,749 | 5,756 | ||||||
Coloplast, Cl B | 17,533 | 1,326 | ||||||
ISS* | 10,551 | 332 | ||||||
Matas | 18,059 | 412 | ||||||
Novo Nordisk, Cl B | 1,702 | 91 | ||||||
Royal Unibrew | 9,662 | 1,619 | ||||||
Schouw | 13,187 | 631 | ||||||
TDC | 1,081,234 | 7,741 | ||||||
William Demant Holding* | 10,248 | 869 | ||||||
|
| |||||||
| 18,777 | ||||||||
|
| |||||||
| 1 | SEI Institutional Managed Trust / Semi-Annual Report / March 31, 2015 |
SCHEDULE OF INVESTMENTS (Unaudited)
Global Managed Volatility Fund
March 31, 2015
| Description | Shares | Market Value ($ Thousands) | ||||||
Finland — 0.1% | ||||||||
Fortum | 62,888 | $ | 1,321 | |||||
Orion, Cl B | 22,996 | 649 | ||||||
|
| |||||||
| 1,970 | ||||||||
|
| |||||||
France — 0.3% | ||||||||
Boiron | 6,078 | 652 | ||||||
Bonduelle S.C.A. | 6,128 | 159 | ||||||
Dassault Systemes | 47,132 | 3,196 | ||||||
Ipsen | 5,955 | 282 | ||||||
Orpea | 15,039 | 947 | ||||||
Societe d’Edition de Canal+ | 13,049 | 87 | ||||||
Tessi | 282 | 27 | ||||||
Vilmorin & Cie | 2,802 | 227 | ||||||
|
| |||||||
| 5,577 | ||||||||
|
| |||||||
Germany — 1.4% | ||||||||
alstria office† | 58,217 | 819 | ||||||
Celesio | 41,484 | 1,225 | ||||||
Fielmann | 99,528 | 6,672 | ||||||
Hamborner† | 21,972 | 242 | ||||||
Merck KGaA | 98,292 | 11,037 | ||||||
Norddeutsche Affinerie | 13,789 | 781 | ||||||
Rhoen Klinikum | 191,266 | 4,752 | ||||||
RTL Group | 6,383 | 614 | ||||||
STADA Arzneimittel | 91,920 | 3,070 | ||||||
|
| |||||||
| 29,212 | ||||||||
|
| |||||||
Guernsey — 0.6% | ||||||||
Amdocs | 238,188 | 12,957 | ||||||
|
| |||||||
Hong Kong — 3.8% | ||||||||
Bank of East Asia | 230,400 | 917 | ||||||
BOC Hong Kong Holdings | 228,500 | 815 | ||||||
Cathay Pacific Airways | 1,077,000 | 2,492 | ||||||
Cheung Kong Infrastructure Holdings | 714,000 | 6,138 | ||||||
CLP Holdings, Cl B | 2,129,000 | 18,604 | ||||||
First Pacific | 224,000 | 224 | ||||||
Hang Lung Properties | 518,000 | 1,456 | ||||||
Hang Seng Bank | 223,700 | 4,054 | ||||||
HKT Trust & HKT, Cl Miscellaneous | 1,179,000 | 1,519 | ||||||
Hutchison Whampoa | 244,000 | 3,387 | ||||||
Kerry Properties | 66,000 | 229 | ||||||
Li & Fung | 1,722,000 | 1,681 | ||||||
Link† | 1,452,000 | 8,952 | ||||||
MTR | 532,000 | 2,532 | ||||||
NWS Holdings | 119,000 | 198 | ||||||
PCCW | 2,159,000 | 1,317 | ||||||
Power Assets Holdings | 663,000 | 6,782 | ||||||
Prosperity† | 586,000 | 213 | ||||||
Shangri-La Asia | 120,000 | 165 | ||||||
Sunlight† | 590,000 | 288 | ||||||
Swire Pacific, Cl A | 554,500 | 7,560 | ||||||
Transport International Holdings, Cl B | 14,000 | 34 | ||||||
Uni-Bio Science Group* | 5,500,000 | 156 | ||||||
WH Group* (A) | 2,266,500 | 1,289 | ||||||
Wheelock | 60,000 | 307 | ||||||
Wynn Macau | 524,000 | 1,134 | ||||||
Yue Yuen Industrial Holdings | 1,113,500 | 3,935 | ||||||
|
| |||||||
| 76,378 | ||||||||
|
| |||||||
| Description | Shares | Market Value ($ Thousands) | ||||||
Ireland — 0.1% | ||||||||
Kerry Group, Cl A | 14,861 | $ | 997 | |||||
UDG Healthcare | 70,092 | 492 | ||||||
|
| |||||||
| 1,489 | ||||||||
|
| |||||||
Israel — 1.2% | ||||||||
Azrieli Group | 66,147 | 2,723 | ||||||
Bank Hapoalim | 531,361 | 2,560 | ||||||
Bank Leumi Le-Israel* | 104,829 | 389 | ||||||
Check Point Software Technologies* | 34,374 | 2,818 | ||||||
Elbit Systems | 3,204 | 231 | ||||||
Formula Systems 1985 | 3,851 | 101 | ||||||
Ituran Location and Control | 6,055 | 134 | ||||||
Osem Investments | 47,885 | 958 | ||||||
Paz Oil | 5,303 | 775 | ||||||
Plus500 | 28,051 | 284 | ||||||
Teva Pharmaceutical Industries | 222,091 | 13,940 | ||||||
|
| |||||||
| 24,913 | ||||||||
|
| |||||||
Italy — 0.2% | ||||||||
Amplifon | 164,091 | 1,117 | ||||||
CSP International Fashion Group | 1,207 | 2 | ||||||
DiaSorin | 7,120 | 313 | ||||||
Parmalat | 107,552 | 287 | ||||||
Snam Rete Gas | 271,305 | 1,317 | ||||||
|
| |||||||
| 3,036 | ||||||||
|
| |||||||
Japan — 6.9% | ||||||||
Advance Residence Investment† | 109 | 262 | ||||||
Ajis | 1,300 | 22 | ||||||
ANA Holdings | 678,000 | 1,819 | ||||||
Aozora Bank | 2,079,000 | 7,385 | ||||||
Arcs | 9,900 | 238 | ||||||
Asahi Group Holdings | 10,200 | 325 | ||||||
Bic Camera | 221,200 | 2,306 | ||||||
Can Do | 38,400 | 504 | ||||||
Canon | 352,000 | 12,469 | ||||||
Chugoku Electric Power | 84,600 | 1,105 | ||||||
Coca-Cola West | 131,600 | 2,179 | ||||||
COLOPL* | 138,700 | 2,996 | ||||||
Daiichi Sankyo | 14,000 | 222 | ||||||
Dunlop Sports | 15,300 | 155 | ||||||
Dydo Drinco | 70,400 | 2,833 | ||||||
Earth Chemiclal | 6,900 | 239 | ||||||
Fancl | 173,200 | 2,214 | ||||||
Hitachi Metals | 20,000 | 308 | ||||||
Hokuto | 11,900 | 222 | ||||||
House Foods Group | 84,700 | 1,780 | ||||||
Itochu-Shokuhin | 3,900 | 138 | ||||||
Japan Airlines | 92,000 | 2,869 | ||||||
Japan Tobacco | 48,000 | 1,521 | ||||||
JFE Holdings | 34,400 | 761 | ||||||
Kansai Electric Power | 22,900 | 219 | ||||||
Kappa Create Holdings | 23,800 | 224 | ||||||
Kewpie | 577,000 | 14,068 | ||||||
Key Coffee | 16,900 | 255 | ||||||
Kobe Steel | 1,213,000 | 2,245 | ||||||
Kohnan Shoji | 93,700 | 1,051 | ||||||
Kose | 143,600 | 7,939 | ||||||
Kura | 6,100 | 226 | ||||||
Kyushu Electric Power | 87,100 | 846 | ||||||
Lawson | 56,900 | 3,952 | ||||||
| 2 | SEI Institutional Managed Trust / Semi-Annual Report / March 31, 2015 |
SCHEDULE OF INVESTMENTS (Unaudited)
Global Managed Volatility Fund
March 31, 2015
| Description | Shares | Market Value ($ Thousands) | ||||||
Lion, Cl H | 1,470,400 | $ | 8,975 | |||||
Mandom | 9,300 | 341 | ||||||
Marudai Food | 82,000 | 279 | ||||||
Maruha Nichiro | 15,600 | 220 | ||||||
Matsuya Foods | 27,600 | 554 | ||||||
Maxvalu Tokai | 3,300 | 47 | ||||||
Megmilk Snow Brand | 73,900 | 890 | ||||||
MID, Cl A† | 335 | 812 | ||||||
Ministop | 92,000 | 1,298 | ||||||
Mitsubishi Tanabe Pharma | 120,400 | 2,070 | ||||||
Mixi | 89,500 | 3,627 | ||||||
Morinaga | 261,000 | 918 | ||||||
Morinaga Milk Industry | 486,025 | 1,848 | ||||||
MOS Food Services | 17,000 | 361 | ||||||
Nagoya Railroad | 617,000 | 2,470 | ||||||
Nihon Shokuhin Kako | 2,000 | 6 | ||||||
Nippon Flour Mills | 149,000 | 738 | ||||||
Nippon Telegraph & Telephone | 47,900 | 2,955 | ||||||
Nipro | 107,500 | 1,026 | ||||||
Nisshin Oillio Group | 400,000 | 1,488 | ||||||
Noevir Holdings | 66,200 | 1,329 | ||||||
Nomura Real Estate Master Fund, Cl REIT† | 903 | 1,123 | ||||||
NTT DOCOMO | 294,500 | 5,121 | ||||||
Ohsho Food Service | 15,100 | 540 | ||||||
Oracle Japan | 88,300 | 3,807 | ||||||
Osaka Gas | 214,000 | 897 | ||||||
Paltac | 15,700 | 221 | ||||||
Rock Field | 27,700 | 597 | ||||||
Royal Holdings | 30,000 | 563 | ||||||
Saizeriya | 19,400 | 376 | ||||||
Sakata Seed | 15,100 | 246 | ||||||
Seiko Epson | 408,400 | 7,257 | ||||||
Shimamura | 200 | 18 | ||||||
SIA Reit† | 59 | 231 | ||||||
Sogo Medical | 7,000 | 197 | ||||||
Sony Financial Holdings | 47,500 | 765 | ||||||
Starts Proceed Investment, Cl A† | 122 | 214 | ||||||
Studio Alice | 26,600 | 497 | ||||||
T&D Holdings | 35,400 | 489 | ||||||
Takeda Pharmaceutical | 36,100 | 1,806 | ||||||
Tokai | 9,200 | 313 | ||||||
Trend Micro | 119,200 | 3,936 | ||||||
Tsumura | 10,200 | 253 | ||||||
United Super Markets Holdings* | 16,300 | 145 | ||||||
Yamazaki Baking | 58,000 | 1,048 | ||||||
Yoshinoya Holdings | 38,600 | 421 | ||||||
|
| |||||||
| 139,230 | ||||||||
|
| |||||||
Jersey — 0.1% | ||||||||
Randgold Resources | 20,589 | 1,434 | ||||||
|
| |||||||
Luxembourg — 0.1% | ||||||||
SES | 70,962 | 2,509 | ||||||
|
| |||||||
Netherlands — 1.2% | ||||||||
Eurocommercial Properties† | 5,059 | 232 | ||||||
Heineken | 12,507 | 954 | ||||||
Heineken Holding | 132,105 | 9,095 | ||||||
Koninklijke Ahold | 572,160 | 11,276 | ||||||
Reed Elsevier | 37,081 | 924 | ||||||
Unilever | 44,106 | 1,843 | ||||||
Vastned Retail† | 11,336 | 555 | ||||||
|
| |||||||
| 24,879 | ||||||||
|
| |||||||
| Description | Shares | Market Value ($ Thousands) | ||||||
New Zealand — 1.4% | ||||||||
Air New Zealand | 933,402 | $ | 1,908 | |||||
Argosy Property | 669,970 | 573 | ||||||
Auckland International Airport | 1,349,322 | 4,553 | ||||||
Chorus* | 17,569 | 37 | ||||||
Contact Energy | 467,825 | 2,098 | ||||||
Fisher & Paykel Healthcare | 410,846 | 2,027 | ||||||
Fletcher Building | 480,176 | 3,032 | ||||||
Infratil | 102,751 | 245 | ||||||
Meridian Energy | 266,283 | 404 | ||||||
Mighty River Power | 166,163 | 386 | ||||||
Port of Tauranga | 37,108 | 472 | ||||||
Restaurant Brands New Zealand | 21,157 | 64 | ||||||
Ryman Healthcare | 406,372 | 2,389 | ||||||
SKY Network Television | 315,450 | 1,398 | ||||||
Spark New Zealand | 3,565,834 | 7,969 | ||||||
Summerset Group Holdings | 69,427 | 173 | ||||||
|
| |||||||
| 27,728 | ||||||||
|
| |||||||
Norway — 1.8% | ||||||||
Norsk Hydro | 1,979,511 | 10,412 | ||||||
Orkla | 1,441,242 | 10,900 | ||||||
Statoil | 214,009 | 3,792 | ||||||
Telenor | 559,444 | 11,308 | ||||||
|
| |||||||
| 36,412 | ||||||||
|
| |||||||
Portugal — 0.5% | ||||||||
EDP - Energias de Portugal | 2,298,197 | 8,602 | ||||||
Portucel | 122,445 | 548 | ||||||
REN - Redes Energeticas Nacionais SGPS | 137,066 | 402 | ||||||
Semapa-Sociedade de Investimento e Gestao | 25,343 | 339 | ||||||
Sonaecom - SGPS* | 260,450 | 611 | ||||||
|
| |||||||
| 10,502 | ||||||||
|
| |||||||
Singapore — 2.4% | ||||||||
Ascendas† | 1,102,500 | 2,082 | ||||||
CapitaCommercial Trust† | 2,023,500 | 2,603 | ||||||
CapitaMall Trust† | 2,759,100 | 4,425 | ||||||
China Yuchai International | 29,083 | 574 | ||||||
ComfortDelGro | 1,138,200 | 2,398 | ||||||
DBS Group Holdings | 49,700 | 738 | ||||||
First† | 140,000 | 143 | ||||||
Keppel | 638,000 | 4,186 | ||||||
Keppel Land | 141,000 | 457 | ||||||
Metro Holdings | 73,539 | 52 | ||||||
MobileOne | 811,300 | 2,307 | ||||||
Sabana Shari’ah Compliant Industrial† | 867,000 | 569 | ||||||
Sembcorp Industries | 124,900 | 384 | ||||||
Singapore Airlines | 467,000 | 4,069 | ||||||
Singapore Exchange | 105,000 | 623 | ||||||
Singapore Post | 163,900 | 234 | ||||||
Singapore Press Holdings | 364,700 | 1,114 | ||||||
Singapore Technologies Engineering | 26,000 | 66 | ||||||
Singapore Telecommunications | 1,847,400 | 5,899 | ||||||
StarHub | 2,724,000 | 8,638 | ||||||
Wilmar International | 3,023,800 | 7,187 | ||||||
Yanlord Land Group | 394,000 | 282 | ||||||
|
| |||||||
| 49,030 | ||||||||
|
| |||||||
| 3 | SEI Institutional Managed Trust / Semi-Annual Report / March 31, 2015 |
SCHEDULE OF INVESTMENTS (Unaudited)
Global Managed Volatility Fund
March 31, 2015
| Description | Shares | Market Value ($ Thousands) | ||||||
Spain — 1.7% | ||||||||
Acciona* | 3,813 | $ | 294 | |||||
Cia de Distribucion Integral Logista Holdings | 12,719 | 274 | ||||||
Ebro Foods | 29,004 | 541 | ||||||
Endesa | 314,427 | 6,079 | ||||||
Gas Natural SDG | 230,563 | 5,179 | ||||||
Iberdrola | 1,728,345 | 11,141 | ||||||
Lar Espana Real Estate Socimi*† | 19,361 | 223 | ||||||
Telefonica* | 770,420 | 10,972 | ||||||
|
| |||||||
| 34,703 | ||||||||
|
| |||||||
Sweden — 2.0% | ||||||||
Axfood | 128,061 | 6,764 | ||||||
Boliden | 63,526 | 1,262 | ||||||
Granges* | 28,601 | 230 | ||||||
Hennes & Mauritz, Cl B | 281,375 | 11,403 | ||||||
ICA Gruppen | 14,734 | 494 | ||||||
Industrivarden, Cl C | 86,067 | 1,616 | ||||||
KappAhl | 26,114 | 121 | ||||||
Millicom International Cellular | 31,715 | 2,295 | ||||||
Svenska Cellulosa SCA, Cl B | 226,318 | 5,214 | ||||||
Swedish Match | 230,744 | 6,785 | ||||||
Tele2, Cl B | 208,238 | 2,490 | ||||||
TeliaSonera | 183,797 | 1,168 | ||||||
|
| |||||||
| 39,842 | ||||||||
|
| |||||||
Switzerland — 2.8% | ||||||||
Allreal Holding, Cl A | 31,043 | 4,538 | ||||||
Alpiq Holding | 4,200 | 339 | ||||||
Basler Kantonalbank, Cl H | 2,216 | 171 | ||||||
Bell | 46 | 118 | ||||||
Coca-Cola HBC | 293,876 | 5,300 | ||||||
Emmi | 1,224 | 424 | ||||||
Galenica | 13,925 | 12,186 | ||||||
Intershop Holdings | 15 | 6 | ||||||
Kaba Holding | 2,684 | 1,618 | ||||||
Mobilezone Holding | 394 | 6 | ||||||
Mobimo Holding* | 5,224 | 1,234 | ||||||
Nestle | 147,490 | 11,146 | ||||||
Novartis | 6,270 | 621 | ||||||
Orior | 660 | 39 | ||||||
Siegfried Holding | 5,821 | 891 | ||||||
Swiss Prime Site, Cl H | 33,420 | 2,908 | ||||||
Swisscom | 26,047 | 15,138 | ||||||
Valora Holding | 2,706 | 604 | ||||||
|
| |||||||
| 57,287 | ||||||||
|
| |||||||
United Kingdom — 7.5% | ||||||||
Admiral Group | 318,395 | 7,232 | ||||||
British American Tobacco | 203,374 | 10,532 | ||||||
British Land (United Kingdom)† | 104,835 | 1,296 | ||||||
Centrica | 1,087,059 | 4,083 | ||||||
Cranswick | 60,855 | 1,240 | ||||||
Dairy Crest Group | 18,916 | 124 | ||||||
Direct Line Insurance Group | 245,645 | 1,163 | ||||||
GlaxoSmithKline | 514,922 | 11,817 | ||||||
Greggs | 477,871 | 7,250 | ||||||
Imperial Tobacco Group | 515,896 | 22,692 | ||||||
Inchcape | 367,883 | 4,342 | ||||||
Indivior* | 254,849 | 719 | ||||||
Intu Properties† | 408,720 | 2,111 | ||||||
Londonmetric Property† | 90,461 | 217 | ||||||
Lookers | 81,939 | 175 | ||||||
| Description | Shares | Market Value ($ Thousands) | ||||||
National Grid | 721,214 | $ | 9,258 | |||||
Next, Cl A | 201,118 | 20,974 | ||||||
Rentokil Initial | 121,840 | 247 | ||||||
Royal Mail | 33,400 | 217 | ||||||
Sage Group | 836,200 | 5,793 | ||||||
SSE | 913,694 | 20,319 | ||||||
Stock Spirits Group | 37,991 | 116 | ||||||
Synergy Health | 46,324 | 1,599 | ||||||
Tate & Lyle | 317,659 | 2,818 | ||||||
Unilever | 355,232 | 14,845 | ||||||
United Utilities Group, Cl B | 44,272 | 613 | ||||||
|
| |||||||
| 151,792 | ||||||||
|
| |||||||
United States — 36.1% | ||||||||
Altria Group | 386,421 | 19,329 | ||||||
American Realty Capital Properties† | 153,567 | 1,513 | ||||||
AmerisourceBergen | 121,295 | 13,788 | ||||||
Annaly Capital Management† | 1,129,672 | 11,749 | ||||||
Apollo Residential Mortgage† | 123,922 | 1,977 | ||||||
Archer-Daniels-Midland | 172,892 | 8,195 | ||||||
Ashford Hospitality Prime† | 28,371 | 476 | ||||||
Associated Estates Realty† | 89,649 | 2,212 | ||||||
AT&T | 805,486 | 26,299 | ||||||
Autozone* | 22,267 | 15,190 | ||||||
Avista | 94,272 | 3,222 | ||||||
Benchmark Electronics* | 12,133 | 292 | ||||||
Berkshire Hills Bancorp | 8,411 | 233 | ||||||
Best Buy | 15,804 | 597 | ||||||
Blucora* | 32,532 | 444 | ||||||
Broadridge Financial Solutions | 92,106 | 5,067 | ||||||
Brookline Bancorp, Cl A | 56,859 | 571 | ||||||
Bunge | 213,467 | 17,581 | ||||||
C.R. Bard | 23,956 | 4,009 | ||||||
Cablevision Systems, Cl A | 329,817 | 6,036 | ||||||
CACI International, Cl A* | 125,490 | 11,284 | ||||||
Campbell Soup | 23,477 | 1,093 | ||||||
Capitol Federal Financial | 743,249 | 9,291 | ||||||
Casey’s General Stores | 2,312 | 208 | ||||||
Central Garden and Pet, Cl A* | 36,326 | 386 | ||||||
Chemed | 38,252 | 4,567 | ||||||
Church & Dwight | 150,767 | 12,879 | ||||||
Cigna | 101,128 | 13,090 | ||||||
Cintas | 31,150 | 2,543 | ||||||
Clifton Bancorp | 15,852 | 224 | ||||||
Clorox | 283,763 | 31,325 | ||||||
Coca-Cola | 226,259 | 9,175 | ||||||
Coca-Cola Bottling Consolidated | 8,210 | 928 | ||||||
Colgate-Palmolive | 162,349 | 11,257 | ||||||
Columbia Property Trust† | 73,262 | 1,979 | ||||||
Computer Sciences | 129,205 | 8,434 | ||||||
Consolidated Edison | 4,875 | 298 | ||||||
Costco Wholesale | 56,044 | 8,491 | ||||||
CSG Systems International | 10,636 | 323 | ||||||
CVS Health | 90,911 | 9,383 | ||||||
CYS Investments† | 50,791 | 452 | ||||||
Dentsply International | 170,559 | 8,680 | ||||||
Dice Holdings* | 211,413 | 1,886 | ||||||
Dollar General | 176,048 | 13,270 | ||||||
Dr Pepper Snapple Group | 66,507 | 5,219 | ||||||
DST Systems | 102,790 | 11,380 | ||||||
Duke Energy | 17,052 | 1,309 | ||||||
EchoStar, Cl A* | 6,175 | 319 | ||||||
| 4 | SEI Institutional Managed Trust / Semi-Annual Report / March 31, 2015 |
SCHEDULE OF INVESTMENTS (Unaudited)
Global Managed Volatility Fund
March 31, 2015
| Description | Shares | Market Value ($ Thousands) | ||||||||
Edwards Lifesciences, Cl A* | 112,589 | $ | 16,039 | |||||||
Electronic Arts* | 67,778 | 3,986 | ||||||||
Eli Lilly | 15,011 | 1,091 | ||||||||
Ellington Residential Mortgage† | 11,821 | 194 | ||||||||
Empire District Electric | 290,858 | 7,219 | ||||||||
Energizer Holdings | 85,056 | 11,742 | ||||||||
Entergy | 201,782 | 15,636 | ||||||||
Exelon | 119,205 | 4,007 | ||||||||
Factset Research Systems | 32,802 | 5,222 | ||||||||
Fresh Del Monte Produce | 120,253 | 4,679 | ||||||||
GameStop, Cl A | 87,014 | 3,303 | ||||||||
Garmin | 10,907 | 518 | ||||||||
General Mills, Cl A | 208,668 | 11,810 | ||||||||
Greatbatch* | 4,502 | 261 | ||||||||
Halyard Health* | 1 | — | ||||||||
Harris | 157,286 | 12,388 | ||||||||
HealthSouth | 207,559 | 9,207 | ||||||||
Henry Schein* | 87,585 | 12,229 | ||||||||
Hershey | 31,999 | 3,229 | ||||||||
Hill-Rom Holdings | 240,790 | 11,799 | ||||||||
HomeTrust Bancshares* | 7,985 | 128 | ||||||||
HRG Group* | 93,831 | 1,171 | ||||||||
Ingles Markets, Cl A | 14,551 | 720 | ||||||||
Ingredion | 8,965 | 698 | ||||||||
Intel | 22,409 | 701 | ||||||||
Jack Henry & Associates | 179,197 | 12,524 | ||||||||
John B Sanfilippo & Son | 5,080 | 219 | ||||||||
Johnson & Johnson | 270,527 | 27,215 | ||||||||
Kaiser Aluminum | 88,987 | 6,842 | ||||||||
Kellogg | 47,884 | 3,158 | ||||||||
Keurig Green Mountain | 8,576 | 958 | ||||||||
Kimberly-Clark | 146,468 | 15,688 | ||||||||
Kohl’s | 28,203 | 2,207 | ||||||||
Kroger | 24,757 | 1,898 | ||||||||
LifePoint Hospitals* | 152,993 | 11,237 | ||||||||
Magellan Health* | 24,234 | 1,716 | ||||||||
Mantech International, Cl A | 32,669 | 1,109 | ||||||||
McDonald’s | 174,110 | 16,965 | ||||||||
MEDNAX* | 137,176 | 9,947 | ||||||||
Michael Kors Holdings* | 43,878 | 2,885 | ||||||||
Mortgage Investment Trust† | 63,510 | 1,196 | ||||||||
New York Community Bancorp | 100,360 | 1,679 | ||||||||
News, Cl A* | 264,500 | 4,234 | ||||||||
Northfield Bancorp | 49,679 | 736 | ||||||||
Northwest Bancshares | 159,264 | 1,887 | ||||||||
Oil-Dri Corp of America | 3,429 | 115 | ||||||||
Omnicare | 192,463 | 14,831 | ||||||||
Orchids Paper Products | 29,612 | 798 | ||||||||
Oritani Financial | 19,574 | 285 | ||||||||
Owens & Minor | 246,922 | 8,356 | ||||||||
Patterson | 228,612 | 11,154 | ||||||||
People’s United Financial | 242,110 | 3,680 | ||||||||
PepsiCo | 130,025 | 12,433 | ||||||||
PetMed Express | 14,475 | 239 | ||||||||
Philip Morris International | 122,846 | 9,254 | ||||||||
Premier, Cl A* | 11,487 | 432 | ||||||||
Procter & Gamble | 300,745 | 24,643 | ||||||||
Quest Diagnostics | 99,230 | 7,626 | ||||||||
Reading International, Cl A* | 16,183 | 218 | ||||||||
ResMed | 14,200 | 1,019 | ||||||||
Resource Capital† | 69,172 | 314 | ||||||||
Schnitzer Steel Industries, Cl A | 38,961 | 618 | ||||||||
Southern | 291,089 | 12,890 | ||||||||
| Description | Shares/Number of Amount(1) | Market Value ($ Thousands) | ||||||||||
Spectrum Brands Holdings | 106,219 | $ | 9,513 | |||||||||
STERIS, Cl A | 43,636 | 3,066 | ||||||||||
Sykes Enterprises* | 29,937 | 744 | ||||||||||
Teleflex | 8,841 | 1,068 | ||||||||||
Territorial Bancorp | 7,233 | 172 | ||||||||||
Unitil | 74,411 | 2,587 | ||||||||||
Universal | 63,957 | 3,016 | ||||||||||
VeriSign* | 161,652 | 10,826 | ||||||||||
Wal-Mart Stores | 131,785 | 10,839 | ||||||||||
Weis Markets | 28,796 | 1,433 | ||||||||||
|
| |||||||||||
| 732,899 | ||||||||||||
|
| |||||||||||
Total Common Stock | 1,869,880 | |||||||||||
|
| |||||||||||
PREFERRED STOCK — 0.6% |
| |||||||||||
Germany — 0.6% | ||||||||||||
Henkel & KGaA | 107,952 | 12,701 | ||||||||||
|
| |||||||||||
Total Preferred Stock |
| 12,701 | ||||||||||
|
| |||||||||||
RIGHTS — 0.0% | ||||||||||||
Telefonica* Expires 04/16/15 | 770,420 | 124 | ||||||||||
|
| |||||||||||
Total Rights |
| 124 | ||||||||||
|
| |||||||||||
CASH EQUIVALENT — 5.8% | ||||||||||||
SEI Daily Income Trust, Prime Obligation Fund, | 116,759,583 | 116,760 | ||||||||||
|
| |||||||||||
Total Cash Equivalent | 116,760 | |||||||||||
|
| |||||||||||
TIME DEPOSITS — 0.5% |
| |||||||||||
Brown Brothers Harriman | ||||||||||||
2.950%, 04/01/2015 | NZD | 45 | 33 | |||||||||
1.462%, 04/01/2015 | AUD | 337 | 258 | |||||||||
0.350%, 04/01/2015 | NOK | 289 | 36 | |||||||||
0.100%, 04/01/2015 | CAD | 139 | 110 | |||||||||
0.030%, 04/01/2015 | 9,030 | 9,030 | ||||||||||
0.005%, 04/01/2015 | SGD | 1,016 | 741 | |||||||||
0.005%, 04/01/2015 | JPY | 30,672 | 256 | |||||||||
0.005%, 04/01/2015 | HKD | 1,973 | 255 | |||||||||
(0.100)%, 04/01/2015 | DKK | 458 | 66 | |||||||||
|
| |||||||||||
Total Time Deposits | 10,785 | |||||||||||
|
| |||||||||||
U.S. TREASURY OBLIGATIONS (B) (C) — 0.4% |
| |||||||||||
U.S. Treasury Bills | ||||||||||||
0.067%, 05/28/15 | 7,082 | 7,082 | ||||||||||
|
| |||||||||||
Total U.S. Treasury Obligations | 7,082 | |||||||||||
|
| |||||||||||
Total Investments — 99.5% | $ | 2,017,332 | ||||||||||
|
| |||||||||||
Cl — Class
L.P. — Limited Partnership
| 5 | SEI Institutional Managed Trust / Semi-Annual Report / March 31, 2015 |
SCHEDULE OF INVESTMENTS (Unaudited)
Global Managed Volatility Fund
March 31, 2015
A list of the open futures contracts held by the Fund at March 31, 2015, is as follows:
| Type of Contract | Number of Contracts Long | Expiration Date | Unrealized Appreciation (Depreciation) ($ Thousands) | |||||||||
DJ Euro Stoxx 50 Index | 308 | Jun-2015 | $ | 152 | ||||||||
FTSE 100 Index | 91 | Jun-2015 | (191 | ) | ||||||||
Hang Seng Index | 12 | Apr-2015 | 41 | |||||||||
S&P 500 Index EMINI | 487 | Jun-2015 | 626 | |||||||||
SPI 200 Index | 35 | Jun-2015 | 37 | |||||||||
Topix Index | 59 | Jun-2015 | 64 | |||||||||
|
| |||||||||||
| $ | 729 | |||||||||||
|
| |||||||||||
For the period ended March 31, 2015, the total amount of all open futures contracts, as presented in the table above, are representative of the volume of activity for the derivative type during the period.
A list of the open forward foreign currency contracts held by the Fund at March 31, 2015, is as follows:
| Maturity Date | Currency (Thousands) | Currency (Thousands) | Unrealized Appreciation (Depreciation) ($ Thousands) | |||||||||||||||||
4/28/15 | AUD | 94,046 | USD | 73,725 | $ | 2,005 | ||||||||||||||
4/28/15 | CAD | 157,320 | USD | 125,656 | 1,461 | |||||||||||||||
4/28/15 | CHF | 26,470 | USD | 27,647 | 353 | |||||||||||||||
4/28/15 | DKK | 73,793 | USD | 10,859 | 239 | |||||||||||||||
4/28/15 | EUR | 72,515 | USD | 79,672 | 1,770 | |||||||||||||||
4/28/15 | GBP | 62,285 | USD | 92,894 | 461 | |||||||||||||||
4/28/15 | HKD | 337,228 | USD | 43,478 | (17 | ) | ||||||||||||||
4/28/15 | JPY | 8,238,656 | USD | 69,030 | 295 | |||||||||||||||
4/28/15 | NOK | 165,904 | USD | 21,153 | 577 | |||||||||||||||
4/28/15 | NZD | 21,179 | USD | 16,121 | 285 | |||||||||||||||
4/28/15 | SEK | 211,894 | USD | 25,008 | 422 | |||||||||||||||
4/28/15 | SGD | 52,206 | USD | 38,141 | 97 | |||||||||||||||
4/28/15 | USD | 625 | AUD | 799 | (16 | ) | ||||||||||||||
4/28/15 | USD | 1,709 | CAD | 2,132 | (26 | ) | ||||||||||||||
4/28/15 | USD | 257 | CHF | 247 | (3 | ) | ||||||||||||||
4/28/15 | USD | 118 | DKK | 804 | (2 | ) | ||||||||||||||
4/28/15 | USD | 915 | EUR | 836 | (17 | ) | ||||||||||||||
4/28/15 | USD | 1,324 | GBP | 891 | (1 | ) | ||||||||||||||
4/28/15 | USD | 566 | HKD | 4,386 | — | |||||||||||||||
4/28/15 | USD | 1,217 | JPY | 144,845 | (8 | ) | ||||||||||||||
4/28/15 | USD | 215 | NOK | 1,694 | (5 | ) | ||||||||||||||
4/28/15 | USD | 86 | NZD | 113 | (1 | ) | ||||||||||||||
4/28/15 | USD | 167 | SEK | 1,429 | (2 | ) | ||||||||||||||
4/28/15 | USD | 484 | SGD | 663 | (1 | ) | ||||||||||||||
|
| |||||||||||||||||||
| $ | 7,866 | |||||||||||||||||||
|
| |||||||||||||||||||
A list of the counterparties for the outstanding forward foreign currency contracts held by the Fund at March 31, 2015, is as follows:
| Counterparty | Currency to Deliver ($ Thousands) | Currency to Receive | Unrealized Appreciation ($ Thousands) | |||||||||
Brown Brothers Harriman | (623,119 | ) | 630,985 | $ | 7,866 | |||||||
|
| |||||||||||
For the period ended March 31, 2015, the total amount of all open forward currency contracts, as presented in the table above, are representative of the volume of activity for the derivative type during the period.
| Percentages | are based on Net Assets of $2,028,271 ($Thousands). |
| (1) | In U.S. Dollars unless otherwise indicated. |
| * | Non-income producing security. |
| ** | Rate shown is the 7-day effective yield as of March 31, 2015. |
| † | Real Estate Investment Trust. |
| †† | Investment in Affiliated security (see Note 6). |
| (A) | Securities sold within terms of a private placement memorandum, exempt from registration under Section 144A of the Securities Act of 1933, as amended, and may not be sold to dealers in that program or other “accredited investors.” These securities have been determined to be liquid under guidelines established by the Board of Trustees. |
| (B) | The rate reported is the effective yield at the time of purchase. |
| (C) | Security, or portion thereof, has been pledged as collateral on open futures contracts. |
| AUD | — Australia Dollar |
| CAD | — Canadian Dollar |
| CHF | — Swiss Franc |
| Cl | — Class |
| DJ | — Dow Jones |
| DKK | — Denmark Krone |
| EUR | — Euro |
| FTSE | — Financial Times and the London Stock Exchange |
| GBP | — British Pound |
| HKD | — Hong Kong Dollar |
| JPY | — Japanese Yen |
| NOK | — Norwegian Krone |
| NZD | — New Zealand Dollar |
| S&P | — Standard & Poor’s |
| SEK | — Sweden Krona |
| SGD | — Singapore Dollar |
| SPI | — Swiss Performance Index |
| USD | — United States Dollar |
The following is a summary of the inputs used as of March 31, 2015, in valuing the Fund’s investments carried at value ($ Thousands):
| Investments in Securities | Level 1 | Level 2 | Level 3 | Total | ||||||||||||
Common Stock | $ | 1,858,198 | $ | 11,682 | $ | — | $ | 1,869,880 | ||||||||
Preferred Stock | 12,701 | — | — | 12,701 | ||||||||||||
Right | 124 | — | — | 124 | ||||||||||||
Cash Equivalent | 116,760 | — | — | 116,760 | ||||||||||||
Time Deposits | — | 10,785 | — | 10,785 | ||||||||||||
U.S. Treasury Obligations | — | 7,082 | — | 7,082 | ||||||||||||
|
|
|
|
|
|
|
| |||||||||
Total Investments in Securities | $ | 1,987,783 | $ | 29,549 | $ | — | $ | 2,017,332 | ||||||||
|
|
|
|
|
|
|
| |||||||||
| Other Financial Instruments | Level 1 | Level 2 | Level 3 | Total | ||||||||||||
Futures Contracts* | ||||||||||||||||
Unrealized appreciation | $ | 920 | $ | — | $ | — | $ | 920 | ||||||||
Unrealized depreciation | (191 | ) | — | — | (191 | ) | ||||||||||
Forwards Contracts* | ||||||||||||||||
Unrealized appreciation | — | 7,965 | — | 7,965 | ||||||||||||
Unrealized depreciation | — | (99 | ) | — | (99 | ) | ||||||||||
|
|
|
|
|
|
|
| |||||||||
Total Other Financial Instruments | $ | 729 | $ | 7,866 | $ | — | $ | 8,595 | ||||||||
|
|
|
|
|
|
|
| |||||||||
| * | Futures and forwards contracts are valued at the unrealized appreciation (depreciation) on the instrument. |
For the period ended March 31, 2015, there were no transfers between Level 1 and Level 2 assets and liabilities.
For the period ended March 31, 2015, there were no transfers between Level 2 and Level 3 assets and liabilities.
For the period ended March 31, 2015, there were no Level 3 investments.
For more information on valuation inputs, see Note 2 – Significant Accounting Policies in Notes to Financial Statements.
Amounts designated as “—” are $0 or have been rounded to $0.
The accompanying notes are an integral part of the financial statements.
| 6 | SEI Institutional Managed Trust / Semi-Annual Report / March 31, 2015 |
SCHEDULE OF INVESTMENTS (Unaudited)
Tax-Managed Managed Volatility Fund
March 31, 2015
| Description | Shares | Market Value ($ Thousands) | ||||||
COMMON STOCK — 93.9% | ||||||||
Consumer Discretionary — 7.8% | ||||||||
Advance Auto Parts | 7,500 | $ | 1,123 | |||||
American Eagle Outfitters | 181,700 | 3,104 | ||||||
Autozone* | 3,400 | 2,319 | ||||||
Bed Bath & Beyond* | 32,800 | 2,518 | ||||||
Big Lots | 16,600 | 798 | ||||||
Burlington Stores* | 60,100 | 3,571 | ||||||
Canadian Tire, Cl A | 24,100 | 2,455 | ||||||
Cheesecake Factory | 11,800 | 582 | ||||||
Chico’s FAS | 22,900 | 405 | ||||||
Cogeco Cable | 10,500 | 563 | ||||||
DIRECTV* | 70,300 | 5,982 | ||||||
Dollar General | 13,022 | 982 | ||||||
Domino’s Pizza | 22,700 | 2,282 | ||||||
DSW, Cl A | 35,500 | 1,309 | ||||||
Family Dollar Stores | 21,066 | 1,669 | ||||||
Foot Locker, Cl A | 37,800 | 2,381 | ||||||
Graham Holdings, Cl B | 1,400 | 1,470 | ||||||
Jack in the Box | 8,300 | 796 | ||||||
Kohl’s | 69,100 | 5,407 | ||||||
Lear | 13,060 | 1,447 | ||||||
lululemon athletica* | 46,200 | 2,958 | ||||||
Madison Square Garden, Cl A* | 9,754 | 826 | ||||||
McDonald’s | 53,138 | 5,178 | ||||||
Morningstar, Cl A | 65,304 | 4,892 | ||||||
Scripps Networks Interactive, Cl A | 5,100 | 350 | ||||||
Staples | 181,000 | 2,948 | ||||||
Target, Cl A | 82,101 | 6,738 | ||||||
Time Warner Cable, Cl A | 13,200 | 1,978 | ||||||
Vista Outdoor* | 49,000 | 2,098 | ||||||
|
| |||||||
| 69,129 | ||||||||
|
| |||||||
Consumer Staples — 18.9% | ||||||||
Altria Group | 229,214 | 11,465 | ||||||
Archer-Daniels-Midland | 38,600 | 1,830 | ||||||
Brown-Forman, Cl B | 10,201 | 922 | ||||||
Bunge | 55,200 | 4,546 | ||||||
Cal-Maine Foods | 68,600 | 2,680 | ||||||
Campbell Soup | 14,306 | 666 | ||||||
Casey’s General Stores | 34,800 | 3,136 | ||||||
Church & Dwight | 80,204 | 6,851 | ||||||
Clorox | 58,347 | 6,441 | ||||||
Coca-Cola | 128,546 | 5,212 | ||||||
Coca-Cola Enterprises | 49,400 | 2,183 | ||||||
Colgate-Palmolive | 71,331 | 4,946 | ||||||
ConAgra Foods | 129,738 | 4,739 | ||||||
Costco Wholesale | 58,129 | 8,806 | ||||||
CVS Health | 27,100 | 2,797 | ||||||
Dr Pepper Snapple Group | 33,100 | 2,598 | ||||||
General Mills, Cl A | 67,918 | 3,844 | ||||||
Hershey | 68,589 | 6,921 | ||||||
Hormel Foods | 107,711 | 6,123 | ||||||
JM Smucker | 33,707 | 3,901 | ||||||
Kellogg | 97,347 | 6,420 | ||||||
Kimberly-Clark | 43,939 | 4,706 | ||||||
Kroger | 122,716 | 9,407 | ||||||
Lorillard | 108,303 | 7,078 | ||||||
McCormick | 58,094 | 4,480 | ||||||
Metro, Cl A | 81,000 | 2,195 | ||||||
PepsiCo | 78,237 | 7,481 | ||||||
Philip Morris International | 67,951 | 5,119 | ||||||
| Description | Shares | Market Value ($ Thousands) | ||||||
Procter & Gamble | 61,418 | $ | 5,033 | |||||
Reynolds American | 58,297 | 4,017 | ||||||
Sanderson Farms | 18,200 | 1,450 | ||||||
Tyson Foods, Cl A | 118,800 | 4,550 | ||||||
Universal | 16,000 | 755 | ||||||
Wal-Mart Stores | 159,636 | 13,130 | ||||||
|
| |||||||
| 166,428 | ||||||||
|
| |||||||
Energy — 1.9% | ||||||||
Chevron | 39,300 | 4,126 | ||||||
ConocoPhillips | 48,500 | 3,019 | ||||||
Dresser-Rand Group* | 6,606 | 531 | ||||||
Exxon Mobil | 68,500 | 5,822 | ||||||
Tesoro | 34,600 | 3,159 | ||||||
|
| |||||||
| 16,657 | ||||||||
|
| |||||||
Financials — 20.5% | ||||||||
Allied World Assurance Holdings | 101,649 | 4,107 | ||||||
Allstate | 74,100 | 5,274 | ||||||
American Capital Agency, Cl A† | 140,180 | 2,990 | ||||||
American Financial Group | 41,500 | 2,662 | ||||||
Annaly Capital Management† | 329,000 | 3,422 | ||||||
Apartment Investment & Management, Cl A† | 69,800 | 2,747 | ||||||
Arch Capital Group* | 64,338 | 3,963 | ||||||
Aspen Insurance Holdings | 58,300 | 2,753 | ||||||
Assurant | 33,650 | 2,066 | ||||||
Axis Capital Holdings | 114,210 | 5,891 | ||||||
Brixmor Property Group† | 48,400 | 1,285 | ||||||
Canadian Imperial Bank of Commerce | 31,000 | 2,248 | ||||||
CBL & Associates Properties† | 148,300 | 2,936 | ||||||
CBOE Holdings | 50,400 | 2,893 | ||||||
Chubb | 34,200 | 3,458 | ||||||
CIT Group | 47,200 | 2,130 | ||||||
Cullen/Frost Bankers | 44,259 | 3,057 | ||||||
Digital Realty Trust, Cl A† | 23,500 | 1,550 | ||||||
Endurance Specialty Holdings | 30,300 | 1,852 | ||||||
Equity Lifestyle Properties† | 51,170 | 2,812 | ||||||
Everest Re Group | 46,153 | 8,031 | ||||||
Genworth MI Canada | 23,900 | 528 | ||||||
Government Properties Income Trust, Cl A† | 55,900 | 1,277 | ||||||
Hanover Insurance Group, Cl A | 17,900 | 1,299 | ||||||
HCC Insurance Holdings | 73,400 | 4,160 | ||||||
HCP† | 74,500 | 3,219 | ||||||
Health Care† | 31,200 | 2,414 | ||||||
Healthcare Realty Trust† | 99,500 | 2,764 | ||||||
Highwoods Properties† | 64,400 | 2,948 | ||||||
Home Properties† | 66,493 | 4,607 | ||||||
Hospitality Properties Trust | 74,700 | 2,464 | ||||||
Jones Lang LaSalle | 16,900 | 2,880 | ||||||
Maiden Holdings | 62,300 | 924 | ||||||
Markel* | 3,151 | 2,423 | ||||||
Medical Properties Trust† | 140,800 | 2,075 | ||||||
MFA Financial† | 331,740 | 2,608 | ||||||
Mid-America Apartment Communities † | 29,610 | 2,288 | ||||||
National Bank of Canada | 71,400 | 2,607 | ||||||
Omega Healthcare Investors† | 78,300 | 3,177 | ||||||
PartnerRe | 77,869 | 8,903 | ||||||
PennyMac Mortgage Investment Trust† | 50,500 | 1,075 | ||||||
| 1 | SEI Institutional Managed Trust / Semi-Annual Report / March 31, 2015 |
SCHEDULE OF INVESTMENTS (Unaudited)
Tax-Managed Managed Volatility Fund
March 31, 2015
| Description | Shares | Market Value ($ Thousands) | ||||||
Piedmont Office Realty Trust, Cl A† | 114,000 | $ | 2,122 | |||||
Post Properties† | 92,395 | 5,260 | ||||||
ProAssurance | 15,000 | 689 | ||||||
Prosperity Bancshares | 13,700 | 719 | ||||||
Public Storage† | 6,217 | 1,226 | ||||||
Reinsurance Group of America, Cl A | 30,010 | 2,797 | ||||||
RenaissanceRe Holdings | 100,858 | 10,058 | ||||||
Ryman Hospitality Properties | 6,600 | 402 | ||||||
Simon Property Group† | 12,000 | 2,348 | ||||||
Sovran Self Storage† | 8,900 | 836 | ||||||
Tanger Factory Outlet Centers† | 41,039 | 1,443 | ||||||
TFS Financial | 119,488 | 1,754 | ||||||
Travelers | 68,500 | 7,407 | ||||||
Two Harbors Investment† | 413,041 | 4,387 | ||||||
Validus Holdings | 177,529 | 7,474 | ||||||
Ventas† | 37,900 | 2,767 | ||||||
Wells Fargo | 55,300 | 3,008 | ||||||
White Mountains Insurance Group | 4,079 | 2,792 | ||||||
|
| |||||||
| 180,256 | ||||||||
|
| |||||||
Health Care — 14.6% | ||||||||
AbbVie | 30,200 | 1,768 | ||||||
Actavis* | 9,739 | 2,899 | ||||||
Aetna, Cl A | 63,300 | 6,743 | ||||||
AmerisourceBergen | 75,737 | 8,609 | ||||||
Amgen, Cl A | 16,800 | 2,685 | ||||||
Anthem | 56,500 | 8,724 | ||||||
AstraZeneca ADR | 53,600 | 3,668 | ||||||
Baxter International | 59,000 | 4,041 | ||||||
Becton Dickinson | 2,900 | 416 | ||||||
C.R. Bard | 8,000 | 1,339 | ||||||
Cardinal Health | 32,400 | 2,925 | ||||||
Centene* | 11,800 | 834 | ||||||
Cigna | 7,200 | 932 | ||||||
DaVita HealthCare Partners* | 9,400 | 764 | ||||||
Edwards Lifesciences, Cl A* | 8,800 | 1,254 | ||||||
Eli Lilly | 44,380 | 3,224 | ||||||
Endo International* | 25,300 | 2,269 | ||||||
Express Scripts Holding* | 29,600 | 2,568 | ||||||
Halyard Health* | 9,696 | 477 | ||||||
Hill-Rom Holdings | 45,700 | 2,239 | ||||||
Hologic* | 86,600 | 2,860 | ||||||
Humana | 40,115 | 7,141 | ||||||
Idexx Laboratories* | 9,500 | 1,468 | ||||||
Johnson & Johnson | 135,917 | 13,673 | ||||||
Laboratory Corp of America Holdings* | 38,924 | 4,908 | ||||||
McKesson | 12,700 | 2,873 | ||||||
Medtronic | 29,000 | 2,262 | ||||||
Merck | 72,200 | 4,150 | ||||||
Omnicare | 40,300 | 3,106 | ||||||
Patterson | 52,100 | 2,542 | ||||||
PDL BioPharma | 96,900 | 682 | ||||||
Pfizer | 285,000 | 9,915 | ||||||
Quest Diagnostics | 73,671 | 5,662 | ||||||
UnitedHealth Group | 63,200 | 7,476 | ||||||
Zimmer Holdings | 15,500 | 1,822 | ||||||
|
| |||||||
| 128,918 | ||||||||
|
| |||||||
Industrials — 4.9% | ||||||||
Boeing | 19,100 | 2,867 | ||||||
| Description | Shares | Market Value ($ Thousands) | ||||||
Deere | 46,700 | $ | 4,095 | |||||
FedEx | 12,200 | 2,018 | ||||||
General Dynamics | 8,600 | 1,167 | ||||||
L-3 Communications Holdings | 24,400 | 3,069 | ||||||
Landstar System | 24,200 | 1,604 | ||||||
Lockheed Martin | 12,700 | 2,578 | ||||||
Northrop Grumman | 49,100 | 7,903 | ||||||
Old Dominion Freight Line, Cl A* | 32,000 | 2,474 | ||||||
Orbital ATK | 24,500 | 1,878 | ||||||
Raytheon | 66,100 | 7,221 | ||||||
Rollins | 40,050 | 991 | ||||||
Stericycle, Cl A* | 38,292 | 5,377 | ||||||
|
| |||||||
| 43,242 | ||||||||
|
| |||||||
Information Technology — 7.7% | ||||||||
Activision Blizzard | 23,400 | 532 | ||||||
Amdocs | 137,440 | 7,477 | ||||||
Apple | 58,849 | 7,323 | ||||||
Automatic Data Processing | 52,748 | 4,517 | ||||||
Broadridge Financial Solutions | 44,500 | 2,448 | ||||||
CA | 48,400 | 1,578 | ||||||
CDK Global | 17,582 | 822 | ||||||
Cisco Systems | 149,100 | 4,104 | ||||||
CSG Systems International | 37,600 | 1,143 | ||||||
Global Payments | 10,700 | 981 | ||||||
Harris | 36,800 | 2,899 | ||||||
Intel | 147,600 | 4,615 | ||||||
International Business Machines | 53,479 | 8,583 | ||||||
Jack Henry & Associates | 13,800 | 964 | ||||||
Microsoft | 90,100 | 3,663 | ||||||
Oracle, Cl B | 60,400 | 2,606 | ||||||
Qualcomm | 29,900 | 2,073 | ||||||
Science Applications International | 14,671 | 753 | ||||||
Skyworks Solutions | 27,600 | 2,713 | ||||||
Synopsys* | 58,000 | 2,687 | ||||||
Tech Data* | 22,200 | 1,283 | ||||||
Western Union | 163,940 | 3,412 | ||||||
Zebra Technologies, Cl A* | 7,200 | 653 | ||||||
|
| |||||||
| 67,829 | ||||||||
|
| |||||||
Materials — 1.3% | ||||||||
AptarGroup | 7,900 | 502 | ||||||
Ball | 29,500 | 2,084 | ||||||
Bemis | 44,400 | 2,056 | ||||||
CF Industries Holdings | 2,500 | 709 | ||||||
Sigma-Aldrich | 37,321 | 5,160 | ||||||
Sonoco Products | 25,800 | 1,173 | ||||||
|
| |||||||
| 11,684 | ||||||||
|
| |||||||
Telecommunication Services — 3.8% | ||||||||
AT&T | 290,000 | 9,469 | ||||||
BCE | 103,900 | 4,400 | ||||||
CenturyTel | 54,300 | 1,876 | ||||||
NTT DoCoMo ADR | 130,100 | 2,268 | ||||||
Rogers Communications, Cl B | 68,600 | 2,296 | ||||||
SBA Communications, Cl A* | 10,900 | 1,276 | ||||||
SK Telecom ADR | 129,800 | 3,532 | ||||||
TELUS | 30,123 | 1,001 | ||||||
Verizon Communications | 142,649 | 6,937 | ||||||
|
| |||||||
| 33,055 | ||||||||
|
| |||||||
| 2 | SEI Institutional Managed Trust / Semi-Annual Report / March 31, 2015 |
SCHEDULE OF INVESTMENTS (Unaudited)
Tax-Managed Managed Volatility Fund
March 31, 2015
| Description | Shares/Face Amount Number of Rights | Market Value ($ Thousands) | ||||||
Utilities — 12.6% | ||||||||
AGL Resources | 54,558 | $ | 2,709 | |||||
Alliant Energy | 6,300 | 397 | ||||||
Ameren | 60,200 | 2,540 | ||||||
American Electric Power | 81,000 | 4,556 | ||||||
Atmos Energy | 22,600 | 1,250 | ||||||
CMS Energy | 53,900 | 1,882 | ||||||
Consolidated Edison | 173,742 | 10,598 | ||||||
Dominion Resources | 13,121 | 930 | ||||||
DTE Energy | 52,642 | 4,248 | ||||||
Duke Energy | 63,057 | 4,842 | ||||||
Edison International | 109,300 | 6,828 | ||||||
Entergy | 100,000 | 7,749 | ||||||
Eversource Energy | 84,838 | 4,286 | ||||||
Exelon | 178,300 | 5,993 | ||||||
Great Plains Energy | 13,200 | 352 | ||||||
ITC Holdings | 81,099 | 3,036 | ||||||
OGE Energy | 56,484 | 1,785 | ||||||
PG&E | 121,000 | 6,421 | ||||||
Pinnacle West Capital | 30,700 | 1,957 | ||||||
Portland General Electric | 133,600 | 4,955 | ||||||
PPL | 53,000 | 1,784 | ||||||
Public Service Enterprise Group | 278,391 | 11,670 | ||||||
SCANA | 84,209 | 4,631 | ||||||
Sempra Energy | 7,090 | 773 | ||||||
Southern | 166,583 | 7,376 | ||||||
UGI | 57,750 | 1,882 | ||||||
Wisconsin Energy | 110,404 | 5,465 | ||||||
|
| |||||||
| 110,895 | ||||||||
|
| |||||||
Total Common Stock |
| 828,093 | ||||||
|
| |||||||
CASH EQUIVALENT — 5.7% |
| |||||||
SEI Daily Income Trust, Prime Obligation Fund, Cl A 0.010%**†† | 50,205,162 | 50,205 | ||||||
|
| |||||||
Total Cash Equivalent |
| 50,205 | ||||||
|
| |||||||
U.S. TREASURY OBLIGATIONS (A) — 0.3% |
| |||||||
U.S. Treasury Bills | $ | 2,256 | 2,256 | |||||
|
| |||||||
Total U.S. Treasury Obligations |
| 2,256 | ||||||
|
| |||||||
RIGHTS — 0.0% |
| |||||||
Safeway CVR - Casa Ley | 85,430 | 87 | ||||||
Safeway CVR - PDC | 85,430 | 4 | ||||||
|
| |||||||
Total Rights | 91 | |||||||
|
| |||||||
Total Investments — 99.9% |
| $ | 880,645 | |||||
|
| |||||||
A list of the open futures contracts held by the Fund at March 31, 2015, is as follows:
| Type of Contract | Number of Contracts Long | Expiration Date | Unrealized Appreciation ($ Thousands) | |||||||||
S&P 500 Index EMINI | 335 | Jun-2015 | $ | 427 | ||||||||
|
| |||||||||||
For the period ended March 31, 2015, the total amount of all open futures contracts, as presented in the table above, are representative of the volume of activity for this derivative type during the period.
Percentages are based on Net Assets of $881,533 ($Thousands).
| (A) | All or a portion of this security has been pledged as collateral for open futures contracts. |
| † | Real Estate Investment Trust. |
| †† | Investment in Affiliated Security. |
| * | Non-income producing security. |
| ** | The rate reported is the 7-day effective yield as of March 31, 2015. |
ADR — American Depositary Receipt
Cl — Class
S&P — Standard & Poor’s
The following is a summary of the inputs used as of March 31, 2015, in valuing the Fund’s investments carried at value ($ Thousands):
| Investments in Securities | Level 1 | Level 2 | Level 3 | Total | ||||||||||||
Common Stock | $ | 828,093 | $ | — | $ | — | $ | 828,093 | ||||||||
Cash Equivalent | 50,205 | — | — | 50,205 | ||||||||||||
U.S. Treasury Obligations | — | 2,256 | — | 2,256 | ||||||||||||
Rights | 91 | — | — | 91 | ||||||||||||
|
|
|
|
|
|
|
| |||||||||
Total Investments in Securities | $ | 878,389 | $ | 2,256 | $ | — | $ | 880,645 | ||||||||
|
|
|
|
|
|
|
| |||||||||
| Other Financial Instruments | Level 1 | Level 2 | Level 3 | Total | ||||||||||||
Futures Contracts * | ||||||||||||||||
Unrealized Appreciation | $ | 427 | $ | — | $ | — | $ | 427 | ||||||||
|
|
|
|
|
|
|
| |||||||||
Total Other Financial Instruments | $ | 427 | $ | — | $ | — | $ | 427 | ||||||||
|
|
|
|
|
|
|
| |||||||||
| * | Futures contracts are valued at the unrealized appreciation on the instrument. |
For the period ended March 31, 2015, there were no transfers between Level 1 and Level 2 assets and liabilities.
For the period ended March 31, 2015, there were no transfers between Level 2 and Level 3 assets and liabilities.
For the period ended March 31, 2015, there were no Level 3 investments.
Amounts designated as “—” are $0 or have been rounded to $0.
| 3 | SEI Institutional Managed Trust / Semi-Annual Report / March 31, 2015 |
| Item 7. | Disclosure of Proxy Voting Policies and Procedures for Closed-End Management Investment Companies. |
Not applicable.
| Item 8. | Portfolio Managers of Closed-End Management Investment Companies. |
Not applicable.
| Item 9. | Purchases of Equity Securities by Closed-End Management Company and Affiliated Purchasers. |
Not applicable.
| Item 10. | Submission of Matters to a Vote of Security Holders. |
The Registrant has a standing Governance Committee (the “Committee”) currently consisting of the Independent Trustees. The Committee is responsible for evaluating and recommending nominees for election to the Registrant’s Board of Trustees (the “Board”). Pursuant to the Committee’s Charter, adopted on June 18, 2004, as amended, the Committee will review all shareholder recommendations for nominations to fill vacancies on the Board if such recommendations are submitted in writing and addressed to the Committee at the Registrant’s office.
| Item 11. | Controls and Procedures. |
(a) The Registrant’s principal executive and principal financial officers, or persons performing similar functions, have concluded that the Registrant’s disclosure controls and procedures (as defined in Rule 30a-3(c) under the Act (17 CFR 270.30a-3(c)) are effective, based on the evaluation of these controls and procedures required by Rule 30a-3(b) under the Act (270.30a-3(b)) and Rules 13a-15(b) or 15d-15(b) under the Exchange Act
(17 CFR 240.13a-15(b) or 240.15d-15(b)) as of a date within 90 days of the filing date of this report.
(b) There were no changes in the Registrant’s internal control over financial reporting (as defined in Rule 30a-3(d) under the Act
(17 CFR 270.30a-3(d)) that occurred during the second fiscal quarter of the period covered by this report that have materially affected, or are reasonably likely to materially affect, the Registrants internal control over financial reporting.
| Items 12. | Exhibits. |
(a)(1) Not applicable for semi-annual report.
(a)(2) A separate certification for the principal executive officer and the principal financial officer of the Registrant as required by Rule 30a-2(a) under the Act (17 CFR 270.30a-2(a)), are filed herewith.
(b) Officer certifications as required by Rule 30a-2(b) under the Act (17 CFR 270.30a-2(b)), also accompany this filing as an exhibit.
SIGNATURES
Pursuant to the requirements of the Securities Exchange Act of 1934 and the Investment Company Act of 1940, the registrant has duly caused this report to be signed on its behalf by the undersigned, thereunto duly authorized.
| SEI Institutional Managed Trust | ||||||
| By | /s/ Robert A. Nesher | |||||
| Robert A. Nesher, President & CEO | ||||||
| Date: June 5, 2015 | ||||||
Pursuant to the requirements of the Securities Exchange Act of 1934 and the Investment Company Act of 1940, this report has been signed below by the following persons on behalf of the registrant and in the capacities and on the dates indicated.
| By | /s/ Robert A. Nesher | |||||
| Robert A. Nesher, President & CEO | ||||||
| Date: June 5, 2015 | ||||||
| By | /s/ Peter A. Rodriguez | |||||
| Peter A. Rodriguez, Controller & CFO | ||||||
| Date: June 5, 2015 | ||||||